Allelic imbalance in gene expression as a guide to cis-acting regulatory single nucleotide...
10
Published online 31 January 2007 Nucleic Acids Research, 2007, Vol. 35, No. 5 e34 doi:10.1093/nar/gkl1152 Allelic imbalance in gene expression as a guide to cis-acting regulatory single nucleotide polymorphisms in cancer cells Lili Milani 1 , Manu Gupta 1 , Malin Andersen 3 , Sumeer Dhar 2 , Ma ˚ rten Frykna ¨s 2 , Anders Isaksson 2 , Rolf Larsson 2 and Ann-Christine Syva ¨ nen 1, * 1 Molecular Medicine, 2 Clinical Pharmacology, Department of Medical Sciences, Uppsala University, Uppsala, Sweden and 3 Department of Biotechnology, AlbaNova University Center, Royal Institute of Technology (KTH), Stockholm, Sweden Received November 3, 2006; Revised and Accepted December 6, 2006 ABSTRACT Using the relative expression levels of two SNP alleles of a gene in the same sample is an effective approach for identifying cis-acting regulatory SNPs (rSNPs). In the current study, we established a process for systematic screening for cis-acting rSNPs using experimental detection of AI as an initial approach. We selected 160 expressed candi- date genes that are involved in cancer and anti- cancer drug resistance for analysis of AI in a panel of cell lines that represent different types of cancers and have been well characterized for their response patterns against anticancer drugs. Of these genes, 60 contained heterozygous SNPs in their coding regions, and 41 of the genes displayed imbalanced expression of the two cSNP alleles. Genes that displayed AI were subjected to bioinformatics- assisted identification of rSNPs that alter the strength of transcription factor binding. rSNPs in 15 genes were subjected to electrophoretic mobility shift assay, and in eight of these genes (APC, BCL2, CCND2, MLH1, PARP1, SLIT2, YES1, XRCC1) we identified differential protein binding from a nuclear extract between the SNP alleles. The screening process allowed us to zoom in from 160 candidate genes to eight genes that may contain functional rSNPs in their promoter regions. INTRODUCTION Single nucleotide polymorphisms (SNPs) in genomic regions that regulate gene expression are major causes of human diversity and may also be important suscep- tibility factors for complex diseases and traits. Several studies have used linkage or association analysis with microarray-based expression data from lymphoblastoid cell-lines from healthy individuals as the quantitative trait, and have identified putative cis- and trans-acting genetic variants that regulate the gene expression levels (1–4). So far only a few studies have addressed the relationship between SNPs in regulatory regions of multiple genes and gene expression levels in human diseases in a systematic way. A recent exception is a study, in which the association between SNPs in 200 candidate genes was analyzed against gene expression levels determined using cDNA arrays in breast cancer tumor samples (5). Using novel statistical tools, this study of 50 tumor samples identified both cis- and trans-acting putative regulatory SNPs (rSNPs). To use the relative expression levels of two SNP alleles (allelic imbalance (AI)) of a gene in the same sample, instead of the total expression level as the quantitative phenotype is an alternative approach for identifying cis- acting rSNPs or haplotypes (6–10). A major advantage of this approach is that the two SNP alleles are measured in the same environment, and serve as internal standards for each other to control other than cis-acting genetic factors and environmental factors that may cause differences in the expression levels between samples. AI in expression has proven to be a common phenomenon for human genes. One study detected AI in the expression of 326 out of 602 human genes (54%) by using Affymetrix HuSNP oligonucleotide arrays to study kidney and liver tissues from seven fetuses (11). By analyzing leukocytes from 12 individuals using allele-specific oligonucleotide hybri- dization arrays (Perlegen Sciences) another study found *To whom correspondence should be addressed. Tel: þ46 18 6112959; Fax: þ46 18 553601; Email: [email protected] Present addresses: Manu Gupta, Cancer Research UK Medical Oncology Laboratory, Barts and the Royal London School of Medicine, Queen Mary College, London, UK. Sumeer Dhar, Department of Pharmacogenomics and Experimental Therapeutics, UNC School of Pharmacy, Chapel Hill, NC, USA. ß 2007 The Author(s). This is an Open Access article distributed under the terms of the Creative Commons Attribution Non-Commercial License (http://creativecommons.org/licenses/ by-nc/2.0/uk/) which permits unrestricted non-commercial use, distribution, and reproduction in any medium, provided the original work is properly cited. by guest on November 24, 2014 http://nar.oxfordjournals.org/ Downloaded from
Transcript of Allelic imbalance in gene expression as a guide to cis-acting regulatory single nucleotide...
Published online 31 January 2007 Nucleic Acids Research 2007 Vol 35 No 5 e34doi101093nargkl1152
Allelic imbalance in gene expression as a guideto cis-acting regulatory single nucleotidepolymorphisms in cancer cellsLili Milani1 Manu Gupta1 Malin Andersen3 Sumeer Dhar2 Marten Fryknas2
Anders Isaksson2 Rolf Larsson2 and Ann-Christine Syvanen1
1Molecular Medicine 2Clinical Pharmacology Department of Medical Sciences Uppsala University UppsalaSweden and 3Department of Biotechnology AlbaNova University Center Royal Institute of Technology (KTH)Stockholm Sweden
Received November 3 2006 Revised and Accepted December 6 2006
ABSTRACT
Using the relative expression levels of two SNPalleles of a gene in the same sample is an effectiveapproach for identifying cis-acting regulatory SNPs(rSNPs) In the current study we established aprocess for systematic screening for cis-actingrSNPs using experimental detection of AI as aninitial approach We selected 160 expressed candi-date genes that are involved in cancer and anti-cancer drug resistance for analysis of AI in a panelof cell lines that represent different types of cancersand have been well characterized for their responsepatterns against anticancer drugs Of these genes60 contained heterozygous SNPs in their codingregions and 41 of the genes displayed imbalancedexpression of the two cSNP alleles Genes thatdisplayed AI were subjected to bioinformatics-assisted identification of rSNPs that alter thestrength of transcription factor binding rSNPs in15 genes were subjected to electrophoretic mobilityshift assay and in eight of these genes (APC BCL2CCND2 MLH1 PARP1 SLIT2 YES1 XRCC1) weidentified differential protein binding from a nuclearextract between the SNP alleles The screeningprocess allowed us to zoom in from 160 candidategenes to eight genes that may contain functionalrSNPs in their promoter regions
INTRODUCTION
Single nucleotide polymorphisms (SNPs) in genomicregions that regulate gene expression are major causes
of human diversity and may also be important suscep-tibility factors for complex diseases and traits Severalstudies have used linkage or association analysis withmicroarray-based expression data from lymphoblastoidcell-lines from healthy individuals as the quantitative traitand have identified putative cis- and trans-acting geneticvariants that regulate the gene expression levels (1ndash4) Sofar only a few studies have addressed the relationshipbetween SNPs in regulatory regions of multiple genes andgene expression levels in human diseases in a systematicway A recent exception is a study in which theassociation between SNPs in 200 candidate genes wasanalyzed against gene expression levels determined usingcDNA arrays in breast cancer tumor samples (5) Usingnovel statistical tools this study of 50 tumor samplesidentified both cis- and trans-acting putative regulatorySNPs (rSNPs)To use the relative expression levels of two SNP alleles
(allelic imbalance (AI)) of a gene in the same sampleinstead of the total expression level as the quantitativephenotype is an alternative approach for identifying cis-acting rSNPs or haplotypes (6ndash10) A major advantage ofthis approach is that the two SNP alleles are measured inthe same environment and serve as internal standards foreach other to control other than cis-acting genetic factorsand environmental factors that may cause differences inthe expression levels between samples AI in expressionhas proven to be a common phenomenon for humangenes One study detected AI in the expression of 326 outof 602 human genes (54) by using Affymetrix HuSNPoligonucleotide arrays to study kidney and liver tissuesfrom seven fetuses (11) By analyzing leukocytes from12 individuals using allele-specific oligonucleotide hybri-dization arrays (Perlegen Sciences) another study found
To whom correspondence should be addressed Tel thorn46 18 6112959 Fax thorn46 18 553601 Email Ann-ChristineSyvanenmedsciuusePresent addressesManu Gupta Cancer Research UK Medical Oncology Laboratory Barts and the Royal London School of Medicine Queen Mary CollegeLondon UKSumeer Dhar Department of Pharmacogenomics and Experimental Therapeutics UNC School of Pharmacy Chapel Hill NC USA
2007 The Author(s)
This is an Open Access article distributed under the terms of the Creative Commons Attribution Non-Commercial License (httpcreativecommonsorglicenses
by-nc20uk) which permits unrestricted non-commercial use distribution and reproduction in any medium provided the original work is properly cited
by guest on Novem
ber 24 2014httpnaroxfordjournalsorg
Dow
nloaded from
AI in 731 out of 1389 informative genes (53) (12)In addition to allele-specific hybridization on microarraysa variety of other genotyping methods have been appliedto detect AI (6ndash813ndash15) Due to variation in thesensitivity and specificity of the methods and the limitednumber of samples or SNPs included in these studies thefrequency estimates for AI vary largely between studiesfrom 18 to 60 of the analyzed genes Imbalancedexpression of alleles has also been detected usingbioinformatics tools comparing the allele frequencies ofSNPs in expressed sequence tags (ESTs) databases tothe allele frequencies in Centre drsquoEtude du PolymorphismeHumain (CEPH) samples from the Haplotype Mappingproject (16) This study estimated that AI occurred for36 of over 2500 analyzed genes and AI was experi-mentally verified for 40 of the genes by sequencingIn the current study we established a process for
systematic screening for cis-acting rSNPs using experi-mental detection of AI as an initial approach Anapproach with similar steps as in our study but performedin a different order than in our process was recentlydescribed for identifying rSNPs that are associated withosteoarthritis (7) Inspired by a number of studies thathave identified putative rSNPs in genes related to cancer(141718) and the response to treatment with anticancerdrugs (19ndash22) we used a panel of cell lines that representdifferent types of cancers and have been well characterizedfor their response patterns against anticancer drugs (23)as target cells in our study For detecting AI in theexpression of candidate genes for cancer and anticancerdrug response we used our lsquoin housersquo developedtag-microarray minisequencing system which we havepreviously shown to be accurate and sensitive forquantitative detection of AI (15) Genes that displayedAI were then subjected to bioinformatics-assisted identi-fication of rSNPs that alter the strength of transcriptionfactor binding in their upstream regulatory regions Theputative rSNPs were tested for their protein-bindingcapacity using electrophoretic mobility shift assays(EMSAs) This process allowed us to zoom in from the160 originally selected candidate genes to eight genes thatmight contain rSNPs that affect the transcription levels ofthe genes
MATERIALS AND METHODS
Cell lines
A panel of 13 human tumor cell-lines consisting of drug-sensitive parental cell-lines and resistant subtypes wasanalyzed Table 1 presents a summary of the cell linesincluding their origin parental cell-lines and the resistantsubtypes and the selecting agents used to create resistantsubtypes The cell-line cultures have regularly beenmonitored and found negative for mycoplasma contam-ination The cell lines have been described in detail byDhar et al (23)
Extraction of DNA RNA and cDNA synthesis
Genomic DNA was extracted from the 13 cell-linesusing the GeneluteTM Mammalian Genomic DNA kit
(Sigma St Louis MO USA) and the DNA was stored atndash208C until use Total RNA was extracted by a standardguanidine isothiocyanate method (TRIZOL ReagentGibco BRLInvitrogen) The quality of the RNA wasverified by running the samples on a 1 agarose geland the RNA was quantified by measuring theultraviolet absorbance at 260 and 280 nm (NanoDropTechnologies) Twenty micrograms of RNA was treatedwith DNase I to remove genomic DNA using the RNeasyMini Kit (Qiagen 74104) Adequate removal of thegenomic DNA after DNase I treatment was verified byabsence of PCR products from RNA samples usingprimers for genomic DNA Five micrograms of purifiedRNA was reverse transcribed to cDNA using theHigh-Capacity cDNA archive kit (Applied Biosystems4322171)
Gene expression profiling
The expression levels of 7400 genes in 13 of the parentaland drug-resistant cell-lines had been previously deter-mined using mRNA expression microarrays with cDNAprobes (24) Twelve of the cell lines were selected torepresent all cancer types in expression profiling onSentrix Genome-Wide Expression BeadChips (IlluminaInc San Diego CA USA) Biotinylated cRNA wasprepared from 500 ng of RNA using the TotalPrepTM
RNA Labeling Kit (Ambion) The in vitro transcriptionproduct was purified and labeled with Cy3-labeledstreptavidin followed by overnight hybridization of15 mg of the labeled product to the BeadChipsThe following day the slides were washed and scannedusing a Bead Station GX 500 Array Reader (Illumina IncSan Diego CA USA) The image data files were analyzedusing the BeadStudio software (Illumina Inc San DiegoCA USA) where the lsquorank invariantrsquo normalizationmodel was applied as recommended by the manufacturerThe limit of detection was set at 98 confidence
PCR
Primers for PCR and minisequencing primers with20-nucleotide tag sequences were designed using thePrimer3 (httpfrodowimiteducgi-binprimer3primer3cgi) and Autoprimer (httpwwwautoprimercom)(Beckman Coulter) softwares The primers were obtainedfrom Integrated DNA Technologies (IDT Inc Coralville
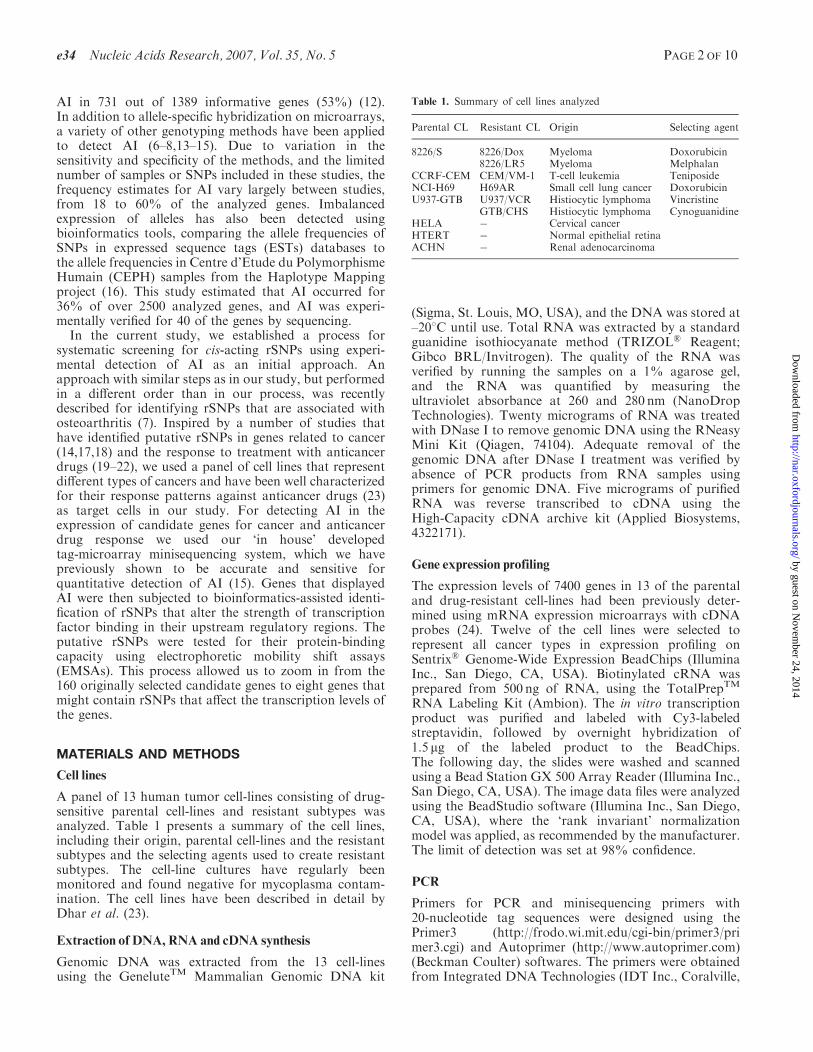
Table 1 Summary of cell lines analyzed
Parental CL Resistant CL Origin Selecting agent
8226S 8226Dox Myeloma Doxorubicin8226LR5 Myeloma Melphalan
CCRF-CEM CEMVM-1 T-cell leukemia TeniposideNCI-H69 H69AR Small cell lung cancer DoxorubicinU937-GTB U937VCR Histiocytic lymphoma Vincristine
GTBCHS Histiocytic lymphoma CynoguanidineHELA Cervical cancerHTERT Normal epithelial retinaACHN Renal adenocarcinoma
e34 Nucleic Acids Research 2007 Vol 35 No 5 PAGE 2 OF 10
by guest on Novem
ber 24 2014httpnaroxfordjournalsorg
Dow
nloaded from
IA USA) The fragments comprising the SNPs wereamplified by PCR from genomic DNA in multiplexreactions with 6ndash12 amplicons per reaction using 10 ngof DNA 01mM dNTPs 1 U Smart-Taq hot DNApolymerase (Naxo Ltd Tartu Estonia) 4mMMgCl2 and02 mM of primers in a final volume of 30 ml PCR fromcDNA was performed in individual reactions using 120 ofthe cDNA products 01mM dNTPs 05 U Smart-Taq hotDNA polymerase 15mM MgCl2 and 02 mM of primersin a final volume of 30 ml The PCR conditions were initialactivation of the enzyme at 958C for 10min followed by 40cycles of 958C for 1min 558C for 30 s and 728C for 1minin a Thermal Cycler PTC225 (MJ Research WatertownMA USA) The amplified cDNA fragments were pooledand concentrated to 40 ml using Microcon YM-30Centrifugal Filter Devices (Millipore CorporationBedford MA USA)
Preparation of microarrays
Oligonucleotides that were complementary to the tagsequences on the minisequencing primers were immobi-lized covalently on CodeLinkTM Activated Slides (GEHealthcare Uppsala Sweden) by the mediation of aNH2-group at their 30-end as described earlier (25)Each oligonucleotide was applied as duplicate spots tothe slides at a concentration of 25 mM in 150mM sodiumphosphate pH 85 using a ProSys 5510A instrument(Cartesian Technologies Inc Irvine CA USA) equippedwith four Stealth Micro Spotting pins (SMP3BTeleChem International Inc Sunnyvale CA USA) Theoligonucleotides were spotted in an lsquoarray-of-arraysrsquoconfiguration which facilitates analysis of 80 individualsamples in parallel on each microscope slide In eachlsquosubarrayrsquo a fluorophore-labeled oligonucleotide wasincluded as a control for the immobilization processAfter printing the slides were incubated in a humidchamber for at least 24 h followed by treatment withethanolamine The slides were stored desiccated in thedark until use
Tag-microarray minisequencing
Excess of PCR primers and dNTPs was removed bytreatment of the PCR mixtures with 5 U of Exonuclease Iand 1 U of shrimp alkaline phosphatase (USBCorporation Cleveland OH USA) Multiplex cyclicminisequencing primer extension reactions were per-formed in the presence of 80 tagged primers in bothDNA polarities at 10 nM concentration 01 mM TexasRed-ddATP Tamra-ddCTP R110-ddGTP and 015mMCy5-ddUTP (Perkin Elmer Life Sciences Boston MAUSA) and 0065 U of KlenThermaseTM DNA polymerase(GeneCraft Germany) as described earlier (26)Alternatively reagents from the SNPstream genotypingsystem (Beckman Coulter Fullerton California USA)were used for the cyclic minisequencing reactionA reference oligonucleotide that is complementary toa synthetic template to mimic a four-allelic SNP wasadded to the minisequencing reaction to monitor thedifference in incorporation efficiency of the four nucleo-tides by the DNA polymerase The reaction conditions
were initial activation of the enzyme at 968C for 5minfollowed by 33 cycles of 95 and 558C for 20 s eachThe extension products were allowed to anneal to theimmobilized complementary tag oligonucleotides at 428Cfor 1ndash2 h followed by washing of the slide with 2SSCand 01 SDS twice for 5min at 428C and twice with02 SSC for 1min at room temperature Five replicatesof DNA and cDNA from the same cell-line were analyzedin parallel
Signal detection and data analysis
Fluorescence was measured from the microarrays using aScanArray Express instrument (Perkin Elmer LifeSciences Boston MA USA) with the excitation lasersBlue Argon 488 nm (R110 and fluorescin) Green HeNe5438 nm (Tamra) Yellow HeNe 594 nm (Texas Red)and Red HeNe 6328 nm (Cy5) with the laser power setto 88 and the photomultiplier tube gain adjustedto obtain equal signal intensities from the reactioncontrol for all fluorophores The fluorescence signalswere quantified using the QuantArray analysis31 software (Perkin Elmer Life Sciences BostonMA USA)The SNP genotypes were assigned using the
SNPsnapper software v300191 (httpwwwbioinfohelsinkifiSNPSnapper) based on scatter plots with thelogarithm of the sum of both fluorescence signals(SAllele1thornSAllele2) on the vertical axis and the fluorescencesignal fractions [SAllele2(SAllele1thornSAllele2)] on the horizon-tal axis The genotypes together with the signal intensitiesof the incorporated nucleotides were exported toMicrosoft Excel The data was handled and interpretedusing the Microsoft Excel and Access programs AI wasdetermined by calculating the fluorescence signal ratiobetween the two alleles (SAllele1SAllele2) in cDNA andDNA for each heterozygous SNP The signal ratio fromcDNA was divided by the corresponding ratio in DNA toobtain a measure for AI In this calculation the meansignal intensity of duplicate spots in one sub-array wasconsidered as one replicate assay and five replicate assayswere performed for each SNP A two-tailed studentrsquos t-testwas used to calculate the significance of the difference inthe allelic ratios for the SNPs in genomic DNA and cDNA(Figure 1)
Analysis of regulatory regions affected by SNPs
The bioinformatics tool Regulatory Analysis of Variationin Enhancers (RAVEN) (M Andersen B Lenhard et alin preparation) was used for the identification of potentialrSNPs in the promoter regions of the genes withimbalanced expression RAVEN (httpmordorcgbkiseCONSNP) combines position weight matrices fortranscription factor binding sites (TFBSs) from themanually curated Jaspar database (2728) with phyloge-netic footprinting to increase the likelihood of identifyingfunctional variants The RAVEN interface enables auto-matic analysis of SNPs from dbSNP as well as uploadingof additional SNPs Based on the application of position-specific weight matrices RAVEN gives a score that rangesfrom 1 to 15 for binding sites of 6ndash14 nucleotides in length
PAGE 3 OF 10 Nucleic Acids Research 2007 Vol 35 No 5 e34
by guest on Novem
ber 24 2014httpnaroxfordjournalsorg
Dow
nloaded from
that contain the two SNP alleles Putative rSNPs withMAF 4005 were selected for further genotyping byapplying a minimum SNP-caused score difference over 2between the high- and low-scoring SNP alleles in theTFBS profile and a conservation cut-off above 70between human and mouse based on the phylogeneticfootprinting
Electrophoretic mobility shift assays (EMSA)
Complementary double-stranded 50 biotinylated as well asunmodified 30 bp oligonucleotides containing thepredicted TFBS were designed for each allele of putativerSNPs (Table 2) The oligonucleotides were obtained fromIntegrated DNA Technologies (IDT Inc Coralville IAUSA) The complementary oligonucleotides were allowedto anneal in 10mM TrisndashHCl pH 75 50mM NaCl1mM EDTA to generate double-stranded probes for theEMSA reaction Twenty femtomoles of the labeleddouble-stranded probes were incubated with 5 mg ofHELA or Jurkat nuclear extracts (Active Motif CarlsbadCA USA) in a freshly made binding buffer containing12mM HEPES pH 74 5mM MgCl2 60mM KCl 1glycerol 005 NP-40 50 mgml BSA 1mM DTT05mM EDTA with 50 ngml of poly(dI-dC) poly(dI-dC)(Amersham Biosciences Piscataway NJ USA) andHaltTM Protease Inhibitor Cocktail (PierceBiotechnology Rockford IL USA) in a final volume of20 ml Three reactions were prepared for each double-stranded oligonucleotide (see Figure 2) The mixtures wereincubated at room temperature for 20min and analyzedusing electrophoresis on 6 polyacrylamide gels(Bio-Rad Laboratories Hercules CA USA) The gelswere run for 15 h at 100V followed by transfer toHybond-Nthorn nylon membranes (BuckinghamshireEngland) in 05TBE for 1 h at 550mA using aCriterion Blotter (Bio-Rad Laboratories Hercules CAUSA) The LightShift Chemiluminescent EMSA kit(Pierce Biotechnology Rockford IL USA) was used tovisualize the biotinylated oligonucleotide signals onthe membranes and a ChemiDoc XRS system (Bio-RadLaboratories Hercules CA USA) The EMSAexperiments were performed twice with reproducibleresults
Figure 1 Volcano plot of the AI data from 105 heterozygous cSNPs in13 cell lines AI for each SNP was determined by calculating thefluorescence signal ratio between the two alleles (SAllele1SAllele2) inRNA (cDNA) and genomic DNA for each heterozygous SNPThe level of AI obtained by dividing the signal ratio in RNA bythe corresponding ratio in DNA is plotted on the horizontal axis TheP-value for the difference between allelic ratios in RNA and DNAbased on five replicate assays is plotted on the vertical axis Spots abovethe horizontal dashed line represent the SNPs showing AI at aP-value500001 that were selected for further analysis
Table 2 Result from validation of the transcription factor binding sites predicted by RAVEN by electrophoretic mobility shift assays
Genea SNP b EMSA probes (one strand)c Transcription factorsd Confirmed by EMSAe
APC rs2439591 GAAATCCATTACACAGAATAAGGCAGACA AGL3 E4BP4 HLF SOX17 thorn
GAAATCCATTACACAAAATAAGGCAGACA SQUABCL2 rs1944423 TTCATAAACTTGGAGAATATTTATATTGA Athb-1 HFH-1 HFH-2 HFH-3 ndash
TTCATAAACTTGGAGAACATTTATATTGA HNF-3beta MEF2 SOX17CCND2 rs3812821 ACCAGAACAACGTCCCTTGTGCCCCCCCC SOX17 ndash
ACCAGAACAACGTCCCTTCTGCCCCCCCCMLH1 rs3172297 ATTTAAGACTATATGAATCAGAATTTTAA CF2-II thorn
ATTTAAGACTACATGAATCAGAATTTTAAPARP1 rs1317170 CTCGATGGGGTGCATGACATACACAGGATA CREB bZIP910 thorn
CTCGATGGGGTGCATAACATACACAGGATASLIT2 rs564041 ACCTAAAATCTCTGCAATATTCTCATTAA SOX17 thorn
ACCTAAAATCTCTGCAATATCCTCATTAAXRCC1 rs12608635 CGGCGGCGGGGAGCAGGTGCCACGGCCAAA Chop-cEBP bZIP911 thorn
CGGCGGCGGGGAGCAGGTGCCATGGCCAAAYES1 rs7233932 GGAGCGCTCCGATTGTGCCCCTCTGCCTT SOX17 Sox-5 thorn
GGAGCGCTCCGATTCTGCCCCTCTGCCTT
aGene symbol according to the HUGO gene nomenclature committee httpwwwgeneuclacuknomenclaturebThe SNPs rs8073706 rs907187 rs8176077 rs5016499 rs7655084 rs2717701 and rs3810378 in the respective ABCC3 PARP1 BRCA1 DCTDSLIT2 TNFRSF12A and XRCC1 genes were not confirmed by EMSAcEMSA probe containing the SNP the top probe contains the SNP allele that is predicted to give stronger transcription factor bindingdTranscription factors predicted by RAVEN to bind to the probeseThe probes for the SNP alleles giving a stronger signal in EMSA that matched the predictions by RAVEN
e34 Nucleic Acids Research 2007 Vol 35 No 5 PAGE 4 OF 10
by guest on Novem
ber 24 2014httpnaroxfordjournalsorg
Dow
nloaded from
RESULTS AND DISCUSSION
Selection of candidate genes and coding SNPs
A panel of 13 human tumor cell-lines that includes drug-sensitive parental cell-lines and their correspondingresistant subtypes was analyzed to detect AI in theexpression of candidate genes involved in cancer progres-sion and response to anticancer drugs (Table 1) These celllines have previously been well characterized for theirresponse patterns against 66 different anticancer drugs(2324) Initially we selected a panel of 210 candidategenes for our study The panel included oncogenes andtumor suppressor genes selected from the literatureand genes relevant for the pathways of nine anticancerdrugs (irinotecan 5-fluorouracil platinum taxanesmethotrexate topotecan gemcitabine cyclophosphamideand doxorubicin) according to the Pharmacogeneticsand Pharmacogenomics knowledge base website
(httppharmacogeneticswustledu) Based on expressiondata for 7400 human genes using cDNA microarrays (24)and expression profiling using bead arrays with probesfor 46000 transcripts (Illumina Inc) (Milani et alunpublished results) 160 of the 210 genes appeared tobe expressed in at least one of the cell lines (seeSupplementary Table 1) By searching the dbSNP andEnsembl databases we identified 237 SNPs with minorallele frequencies above 10 in the coding region of theexpressed candidate genes
Detection of allelic imbalance
Next we genotyped the cSNPs by multiplex tag-microarray minisequencing in genomic DNA from thecell lines and found that 79 of the candidate genescontained coding SNPs (cSNPs) that were heterozygous inat least one of the cell lines These heterozygous cSNPs
Figure 2 Electrophoretic mobility shift assay images for the SNP alleles of the APC BCL2 SLIT2 CCND2 XRCC1 PARP1 MLH1 and YES1genes Three lanes are shown for each SNP allele From left to right these are a control reaction with labeled probe only a reaction containing bothlabeled probe and nuclear extract and a reaction where an unlabeled probe is added in excess as a competitor in addition to the labeled probe andnuclear extract For the MLH1 and YES1 genes the two lanes are shown a reaction with labeled probe and nuclear extract and a reaction where theunlabeled competitor probe is added The sequences of the allele-specific EMSA probes are given in Table 2
PAGE 5 OF 10 Nucleic Acids Research 2007 Vol 35 No 5 e34
by guest on Novem
ber 24 2014httpnaroxfordjournalsorg
Dow
nloaded from
were then genotyped in five replicate reactions in bothgenomic DNA and RNA (cDNA) from the relevant celllines Genotyping of the RNA samples was successful for105 cSNPs in 60 genes For 19 genes genotyping assaysthat were successful for genomic DNA failed in cDNApresumably due to the low expression level of these genesAI between the expressed alleles was initially observed byaberrant clustering of the genotype data from RNAcompared to data from DNA in scatter plots To obtain aquantitative measure for the observed AI the fluorescencesignal (S) ratio between the two alleles (SAllele1SAllele2) inRNA was divided by the corresponding signal ratio inDNA for each SNP A studentrsquos t-test was then usedto assess the significance of the difference betweenallelic ratios in DNA and RNA based on five replicatemeasurements The lsquovolcano plotrsquo in Figure 1 displaysthe AI data from all 105 cSNPs and 13 cell lines with themagnitude of AI plotted on the horizontal axis and theP-values for the differences in signal ratios for the detectedAI on the vertical axis The complete data underlyingFigure 1 is provided in Supplementary Table 2 Using aconservative P-value of 00001 as significance threshold wedetected AI in the expression of 41 of the genes (Table 3)Figure 3 summarizes the recovery of genes at the differentstages of our screening processDespite the conservative approach for defining AI the
relative number of genes that displayed AI in our study(68) was higher than that previously observed by othersbased on screening with allele-specific hybridizationmicroarrays (1112) The reason for this difference couldbe the high sensitivity of detecting minority alleles usingminisequencing primer extension which we have pre-viously shown to be 1ndash5 depending on the sequencecontext of the SNP (1529) Alternatively it is possible thatcancer-related genes in cancer cells are more frequentlyexpressed in an allele-specific manner than randomlyselected genes in lymphoblastoid cell-lines that have beenanalyzed for AI in other studiesAs can be seen in Supplementary Table 2 the level of AI
that we measured in our study varied largely from13-fold (44 of the minor allele expressed) to over40-fold (24 of the minor allele expressed) For a subsetof 15 genes we observed apparent monoallelic expressionin at least one of the cell lines based on an allelic ratio inRNA that was indistinguishable from a homozygousgenotype Extreme AI or monoallelic expression could inaddition to a strong cis-acting regulatory effect be due tolack of transcription of one allele because of methylationof the promoter region as a consequence of imprintingIn accordance with this notion we have detectedmethylation in the CpG islands in the 50 region of theERBB2 gene in the CCRF-CEM and CEM-VM1 cells thatshowed monoallelic expression in the current study butnot in HELA cells that displayed equal expression of theERBB2 alleles (Milani et al unpublished results)Eleven of the genes that displayed AI in our study
contained more than one heterozygous cSNP(Supplementary Table 2) For example SNPs rs12917and rs1803965 in exon 3 of MGMT yielded 23-fold and17-fold AI respectively in the CCRF-CEM cell line andno AI in any of the other cell lines Three SNPs in different
exons of PARP1 (rs1136410 rs1805404 rs3219061) allyielded 23ndash29 fold AI in the HTERT cell line This datasupports that our system yields reproducible results Onthe other hand SNP rs602990 in exon 20 of VAV2displayed 12-fold AI while both alleles of SNP rs509590in the 30 UTR of VAV2 were expressed at equal levelsThese apparently discordant results could be caused bydifferential expression of alternatively spliced transcriptswhere the exon containing one of the SNPs has beenremoved from one of the splice variants Hence measure-ment of AI using SNPs distributed over different exonscould be used for relative quantification of alternativelyspliced transcripts as an alternative approach to assaysbased on detection of exon-specific nucleotides only(2930) AI could thus be used as a guide to SNPs thatregulate alternative splicing analogously to the processfor identifying rSNPs that affect the expression of theentire transcript
Bioinformatics-assisted identification of SNPs that causeallelic imbalance
Next we attempted to identify SNPs in the 50-regulatoryregions of the 41 genes that displayed AI For thispurpose we used the RAVEN application RAVENreports evolutionary conserved regions based on thehuman and mouse genome sequences and scans thesequences for the presence of potential TFBSs that areaffected by SNPs We used RAVEN to scan 3ndash5 kb of the50-regulatory regions of the 41 genes that were found todisplay AI and selected about 100 putative rSNPs in thegenes based on this analysis The putative rSNPs identifiedusing RAVEN were subsequently genotyped in all the celllines (data not shown) The 15 rSNPs that were hetero-zygous in the same samples as the originally genotypedcSNPs in the corresponding genes were selected for furtheranalysis
Functional analysis of rSNPs
Fifteen of the rSNPs predicted by RAVEN and thatappeared to be in linkage disequilibrium (LD) with theinitially genotyped cSNP were analyzed for their capacityto bind transcription factors or other proteins from anuclear cell extract by EMSAs (3132) Allelic pairs ofeight of these SNPs that are located in the promoterregions of the APC BCL2 SLIT2 CCND2 XRCC1PARP1 MLH1 and YES1 genes displayed a reproduciblesignal intensity difference in a product with alteredmobility in EMSA Protein binding to only one of theSNP alleles can be seen for the APC BCL2 and XRCC1genes while for the SLIT2 CCND2 PARP1 MLH1 andYES1 genes a difference in the amount of protein bound isseen (Figure 2) For as many as six of the SNPs the allelethat showed stronger protein binding had been predictedby RAVEN to have a stronger binding affinity for atranscription factor The transcription factors predictedto bind to the binding sites containing the rSNPs arelisted in Table 2 No protein binding or allele-specificdifferences in binding were detectable using EMSA forthe remaining seven SNPs that are located in theABCC3 PARP1 BRCA1 DCTD SLIT2 TNFRSF12A
e34 Nucleic Acids Research 2007 Vol 35 No 5 PAGE 6 OF 10
by guest on Novem
ber 24 2014httpnaroxfordjournalsorg
Dow
nloaded from
Table 3 Allelic imbalance levels in 13 cell lines
Genea SNP Allelesb 8226S 8226Dox 8226LR5 CCRF-CEM CEMVM-1 NCI-H69 H69AR U937-GTB U937VCR GTBCHS HELA HTERT ACHN
ABCB1 rs3842 AG ndash ndash ndash 14 31 ndash ndash ndash 46 ndash ndash 57 ndashABCC3 rs4148416 GA ndash ndash ndash ndash ndash ndash ndash ndash ndash ndash 28 ndash ndashAPC rs2229992 TC nd nd nd nd nd 17 nd nd nd nd ndash nd ndashATF5 rs283525 GA 17 ndash nd ndash ndash 75 ndash nd nd nd nd ndash ndashATF5 rs8647 GA ndash ndash ndash nd nd 29 27 ndash ndash ndash ndash ndash ndATF5 rs8667 TC ndash ndash ndash nd 85 nd nd ndash ndash ndash ndash ndash ndBAK1 rs210135 AT nd ndash nd nd 21 nd nd nd nd nd ndash ndash ndashBCL2 rs1801018 AG ndash ndash ndash 58 34 ndash ndash ndash ndash ndash ndash ndash ndashBCL2 rs4987843 AG ndash ndash ndash 38 21 nd nd ndash ndash ndash ndash 22 ndashBDH1 rs1050119 TC ndash ndash ndash 34 48 ndash ndash nd 28 22 ndash ndash ndashBLM rs1063147 GA ndash ndash ndash ndash ndash ndash ndash nd nd 24 ndash ndash ndashCBR1 rs20572 GA ndash ndash ndash ndash 68 ndash ndash ndash ndash ndash ndash ndash ndashCBR1 rs9024 CT ndash ndash ndash ndash 466 ndash ndash ndash ndash ndash ndash ndash ndashCCND2 rs1049606 TC ndash ndash ndash 61 108 nd 35 97 nd nd ndash ndash ndashCCND2 rs3217926 GA ndash ndash nd ndash ndash ndash ndash 64 nd nd ndash 116 ndashCDH6 rs2302904 TC ndash ndash ndash ndash ndash nd ndash ndash ndash ndash ndash 26 ndashERBB2 rs1058808 CG ndash ndash ndash 408 402 ndash ndash ndash ndash ndash nd ndash ndashERBB2 rs1801200 AG ndash ndash ndash 53 76 ndash ndash ndash ndash ndash nd 33 ndashERBB2 rs2230698 AG nd nd 19 ndash ndash ndash ndash ndash ndash ndash ndash ndash ndashERBB2IP rs36303 GA ndash ndash ndash nd nd 18 nd ndash ndash ndash ndash ndash ndashERBB2IP rs706679 TC nd nd nd nd nd 55 nd ndash ndash ndash nd ndash ndashERCC2 rs13181 AC ndash ndash ndash ndash ndash ndash ndash ndash ndash ndash 30 ndash ndashFANCA rs2239359 TC ndash ndash ndash nd nd ndash ndash 1337 nd nd ndash ndash ndashFDXR rs690514 GA ndash ndash ndash ndash ndash ndash ndash ndash ndash ndash ndash 113 ndashHMGA2 rs8756 TG ndash ndash ndash ndash ndash ndash ndash ndash ndash ndash ndash 519 ndashHMGB1 rs590050 GA ndash ndash ndash 25 22 66 43 79 140 90 ndash 120 66MAP4K2 rs2071313 TC ndash ndash ndash ndash ndash nd 22 15 nd nd ndash 22 ndashMAPT rs1052594 CG ndash ndash ndash ndash ndash nd 31 nd nd nd ndash nd ndashMAPT rs9468 CT ndash ndash ndash ndash ndash nd nd nd 33 nd ndash nd ndashMCM7 rs2070215 TC ndash ndash ndash nd 19 ndash ndash nd nd nd ndash ndash ndashMGMT rs12917 GA ndash ndash ndash 23 nd ndash ndash ndash ndash ndash nd ndash ndashMGMT rs1803965 GA ndash ndash ndash 17 nd ndash ndash ndash ndash ndash nd ndash ndashMLH1 rs1799977 GA ndash ndash ndash 400 404 ndash ndash 23 nd nd ndash ndash ndashMSH6 rs1800935 TC ndash ndash ndash ndash 33 ndash ndash ndash ndash ndash ndash ndash ndNF2 rs1008515 TC 23 nd 58 ndash ndash ndash ndash nd nd 33 nd ndash ndashNME4 rs14293 GA 14 41 197 ndash ndash nd nd ndash ndash ndash 16 14 ndashPARP1 rs1136410 GA ndash ndash ndash ndash ndash ndash ndash ndash ndash ndash ndash 26 ndashPARP1 rs1805404 GA ndash ndash ndash ndash ndash ndash ndash ndash ndash ndash ndash 29 ndashPARP1 rs3219061 TC ndash ndash ndash ndash ndash ndash ndash ndash ndash ndash ndash 23 ndashPCNA rs3626 CG ndash ndash ndash ndash ndash ndash ndash ndash ndash ndash ndash 641 ndashPMS2 rs1059060 GA 28 ndash nd nd nd nd nd nd nd nd nd nd ndRET rs1800858 GA ndash ndash ndash ndash ndash ndash ndash 35 nd 51 ndash 17 ndashSLIT2 rs7655084 TG ndash ndash ndash ndash 106 ndash ndash ndash ndash ndash ndash nd ndashTERT rs2736098 GA nd ndash nd ndash ndash 124 nd ndash ndash ndash ndash 2705 ndashTK1 rs1065769 CT nd nd 35 ndash ndash nd nd ndash ndash ndash ndash nd ndashTK1 rs1071664 TC nd ndash nd ndash ndash 43 nd ndash ndash ndash ndash nd ndashTK1 rs1143696 GA 19 nd nd ndash ndash ndash ndash ndash ndash ndash ndash ndash ndashTNFRSF12A rs13209 TC nd 48 nd nd nd 17 nd ndash ndash ndash ndash ndash ndTSHZ1 rs3744908 TC 17 13 nd nd nd 68 nd ndash ndash ndash 19 nd ndashTSHZ1 rs3809997 TC nd nd nd nd nd 56 nd ndash ndash ndash nd nd ndash
(continued)
PAGE7OF10
Nucleic
Acid
sResea
rch2007V
ol3
5N
o5
e34
by guest on November 24 2014 httpnaroxfordjournalsorg Downloaded from
and XRCC1 genes RAVEN appears to be an excellenttool for enriching functional SNPs in TFBSs althoughfine-tuning of the parameters of RAVEN as well asraising the cut-off for detecting AI could increase itssuccess rate
The genes in which we identified rSNPs were mainlygenes involved in cancer progression BCL2 (the B-cellCLLlymphoma 2 gene) has been reported to be over-expressed in different leukemias and to be involved inleukemogenesis (33) and the expression of TNFRSF12A(the tumor necrosis factor receptor superfamily member12A gene) is important in cells undergoing apoptosis (34)The Yamaguchi sarcoma viral oncogene homolog 1(YES1) gene has been shown to be differentially expressedin colon cancer cells treated with histone deacetylaseinhibitors (35) ABCC3 which encodes the multi-drugresistance-associated protein 3 has been reported to beinvolved in resistance to doxorubicin (36) The identifiedrSNPs in these genes should be further validated byfunctional assays The genes and rSNPs identified in ourstudy are promising candidates for genetic associationstudies with samples from patient cohorts with relevanttypes of cancer or drug response patterns
CONCLUSION
By the screening process presented here we detected AI inthe expression levels of 41 out of 160 candidate genes thatwere expressed in cancer cells and applied AI as a guide toputative rSNPs in these genes Using bioinformatics toolsthat predict TFBSs we selected SNPs in the 50-regulatoryT
able
3Continued
Genea
SNP
Alleles
b8226S
8226D
ox
8226LR5
CCRF-C
EM
CEMV
M-1
NCI-H69
H69AR
U937-G
TB
U937V
CR
GTBC
HS
HELA
HTERT
ACHN
UMPS
rs1139538
AG
52
ndashnd
ndashndash
ndashndash
nd
nd
nd
ndashndash
ndashVAV2
rs509590
TC
nd
nd
nd
nd
26
ndashndash
nd
nd
nd
ndashndash
ndashVAV2
rs602990
GA
nd
nd
121
ndashndash
nd
nd
ndashndash
ndashndash
ndashndash
WT1
rs16754
TC
ndashndash
ndash746
545
ndashndash
ndashndash
ndashndash
1011
ndashXPC
rs2470352
TA
30
36
nd
ndashndash
ndashndash
ndash60
39
ndashndash
ndashXRCC1
rs25487
AG
nd
18
ndashndash
ndashnd
nd
nd
nd
nd
ndashnd
ndashYES1
rs1060922
TC
ndashndash
ndashnd
nd
189
nd
ndashndash
ndashndash
ndashndash
aGenesymbolaccordingto
theHUGO
genenomenclature
committeehttpw
wwgeneuclacuknomenclature
bSNP
allelesthefirstnucleotideis
referred
toasAllele1andthesecondasAllele2
ndheterozygoussample
wherenoAIwasdetected-(hyphen)
homozygous(orfailed)samples
OverexpressionofAllele1gives
positivevaluesoverexpressionofAllele2gives
negativevalues
Figure 3 Recovery of genes and SNPs at the different stages of ourprocess for screening for allelic imbalance
e34 Nucleic Acids Research 2007 Vol 35 No 5 PAGE 8 OF 10
by guest on Novem
ber 24 2014httpnaroxfordjournalsorg
Dow
nloaded from
regions of genes for which AI was detected We identifiedrSNPs that had a suggestive allele-specific effect whichwas shown experimentally by EMSA for eight genes Weconclude that a screening process such as the oneestablished in our study that combines allele-specificgene expression analysis with powerful bioinformaticstools offers a shortcut for the detection of potential cis-acting regulators of gene expression The process allows asubstantial reduction of the number of candidate rSNPs tobe subjected to labor-intensive genetic association orfunctional studies
ACKNOWLEDGEMENTS
The study was supported by grants from the SwedishCancer Foundation and the Swedish Research Councilfor Science and Technology (to ACS) Swedish ResearchCouncil for Medicine (to ACS and MG) and SelanderFoundation (to ACS) We thank Raul Figueroa forproducing the tag microarrays and Kristo Kaarmannand Mats Jonsson for assistance with data analysesFunding to pay the Open Access publication charge wasprovided by Swedish Research Council
Conflict of interest statement None declared
REFERENCES
1 CheungVG SpielmanRS EwensKG WeberTM MorleyMand BurdickJT (2005) Mapping determinants of human geneexpression by regional and genome-wide association Nature 4371365ndash1369
2 MonksSA LeonardsonA ZhuH CundiffP PietrusiakPEdwardsS PhillipsJW SachsA and SchadtEE (2004) Geneticinheritance of gene expression in human cell lines Am J HumGenet 75 1094ndash1105
3 MorleyM MolonyCM WeberTM DevlinJL EwensKGSpielmanRS and CheungVG (2004) Genetic analysis of genome-wide variation in human gene expression Nature 430 743ndash747
4 StrangerBE ForrestMS ClarkAG MinichielloMJDeutschS LyleR HuntS KahlB AntonarakisSE et al(2005) Genome-wide associations of gene expression variation inhumans PLoS Genet 1 e78
5 KristensenVN EdvardsenH TsalenkoA NordgardSHSorlieT SharanR VailayaA Ben-DorA LonningPE et al(2006) Genetic variation in putative regulatory loci controlling geneexpression in breast cancer Proc Natl Acad Sci USA 1037735ndash7740
6 BrayNJ BucklandPR OwenMJ and OrsquoDonovanMC (2003)Cis-acting variation in the expression of a high proportion of genesin human brain Hum Genet 113 149ndash153
7 MahrS BurmesterGR HilkeD GobelU GrutzkauAHauplT HauschildM KoczanD KrennV et al (2006)Cis- and trans-acting gene regulation is associated withosteoarthritis Am J Hum Genet 78 793ndash803
8 PastinenT SladekR GurdS SammakA GeB LepagePLavergneK VilleneuveA GaudinT et al (2003) A survey ofgenetic and epigenetic variation affecting human gene expressionPhysiol Genomics 16 184ndash193
9 PastinenT GeB GurdS GaudinT DoreC LemireMLepageP HarmsenE and HudsonTJ (2005) Mapping commonregulatory variants to human haplotypes Hum Mol Genet 143963ndash3971
10 TaoH CoxDR and FrazerKA (2006) Allele-specific KRT1expression is a complex trait PLoS Genet 2 e93
11 LoHS WangZ HuY YangHH GereS BuetowKH andLeeMP (2003) Allelic variation in gene expression is common inthe human genome Genome Res 13 1855ndash1862
12 PantPV TaoH BeilharzEJ BallingerDG CoxDR andFrazerKA (2006) Analysis of allelic differential expression inhuman white blood cells Genome Res 16 331ndash339
13 DingC MaierE RoscherAA BraunA and CantorCR(2004) Simultaneous quantitative and allele-specific expressionanalysis with real competitive PCR BMC Genet 5 8
14 HeighwayJ BowersNL SmithS BetticherDC andKorefMF (2005) The use of allelic expression differences toascertain functional polymorphisms acting in cis analysis ofMMP1 transcripts in normal lung tissue Ann Hum Genet 69127ndash133
15 LiljedahlU FredrikssonM DahlgrenA and SyvanenAC(2004) Detecting imbalanced expression of SNP alleles byminisequencing on microarrays BMC Biotechnol 4 24
16 GeB GurdS GaudinT DoreC LepageP HarmsenEHudsonTJ and PastinenT (2005) Survey of allelic expressionusing EST mining Genome Res 15 1584ndash1591
17 KanamoriY MatsushimaM MinaguchiT KobayashiKSagaeS KudoR TerakawaN and NakamuraY (1999)Correlation between expression of the matrix metalloproteinase-1gene in ovarian cancers and an insertiondeletion polymorphism inits promoter region Cancer Res 59 4225ndash4227
18 ZhuY SpitzMR LeiL MillsGB and WuX (2001) A singlenucleotide polymorphism in the matrix metalloproteinase-1promoter enhances lung cancer susceptibility Cancer Res 617825ndash7829
19 WangL NguyenTV McLaughlinRW SikkinkLA Ramirez-AlvaradoM and WeinshilboumRM (2005) Human thiopurineS-methyltransferase pharmacogenetics variant allozyme misfoldingand aggresome formation Proc Natl Acad Sci USA 1029394ndash9399
20 PullarkatST StoehlmacherJ GhaderiV XiongYPInglesSA SherrodA WarrenR Tsao-WeiD GroshenS andLenzHJ (2001) Thymidylate synthase gene polymorphismdetermines response and toxicity of 5-FU chemotherapyPharmacogenomics J 1 65ndash70
21 LeeW LockhartAC KimRB and RothenbergML (2005)Cancer pharmacogenomics powerful tools in cancer chemotherapyand drug development Oncologist 10 104ndash111
22 HirotaT IeiriI TakaneH MaegawaS HosokawaMKobayashiK ChibaK NanbaE OshimuraM et al (2004)Allelic expression imbalance of the human CYP3A4 gene andindividual phenotypic status Hum Mol Genet 13 2959ndash2969
23 DharS NygrenP CsokaK BotlingJ NilssonK andLarssonR (1996) Anti-cancer drug characterisation using a humancell line panel representing defined types of drug resistanceBr J Cancer 74 888ndash896
24 RickardsonL FryknasM DharS LovborgH GullboJRydakerM NygrenP GustafssonMG LarssonR andIsakssonA (2005) Identification of molecular mechanisms forcellular drug resistance by combining drug activity and geneexpression profiles Br J Cancer 93 483ndash492
25 LindroosK LiljedahlU RaitioM and SyvanenAC (2001)Minisequencing on oligonucleotide microarrays comparison ofimmobilisation chemistries Nucleic Acids Res 29 E69
26 LovmarL FredrikssonM LiljedahlU SigurdssonS andSyvanenAC (2003) Quantitative evaluation by minisequencingand microarrays reveals accurate multiplexed SNP genotyping ofwhole genome amplified DNA Nucleic Acids Res 31 e129
27 SandelinA AlkemaW EngstromP WassermanWW andLenhardB (2004) JASPAR an open-access database foreukaryotic transcription factor binding profiles Nucleic Acids Res32 D91ndashD94
28 VliegheD SandelinA De BleserPJ VleminckxKWassermanWW van RoyF and LenhardB (2006) A newgeneration of JASPAR the open-access repository for transcriptionfactor binding site profiles Nucleic Acids Res 34 D95ndashD97
29 McCulloughRM CantorCR and DingC (2005) High-throughput alternative splicing quantification by primer extensionand matrix-assisted laser desorptionionization time-of-flight massspectrometry Nucleic Acids Res 33 e99
30 MilaniL FredrikssonM and SyvanenAC (2006) Detection ofalternatively spliced transcripts in leukemia cell lines by minise-quencing on microarrays Clin Chem 52 202ndash211
PAGE 9 OF 10 Nucleic Acids Research 2007 Vol 35 No 5 e34
by guest on Novem
ber 24 2014httpnaroxfordjournalsorg
Dow
nloaded from
31 FriedMG and CrothersDM (1983) CAP and RNApolymerase interactions with the lac promoter bindingstoichiometry and long range effects Nucleic Acids Res 11141ndash158
32 FriedM and CrothersDM (1981) Equilibria and kinetics of lacrepressor-operator interactions by polyacrylamide gel electrophor-esis Nucleic Acids Res 9 6505ndash6525
33 WojcikI SzybkaM GolanskaE RieskeP BlonskiJZRobakT and BartkowiakJ (2005) Abnormalities of the P53MDM2 BCL2 and BAX genes in acute leukemias Neoplasma 52318ndash324
34 KokkinakisDM BricknerAG KirkwoodJM LiuXGoldwasserJE KastramaA SanderC BocangelD andChadaS (2006) Mitotic arrest apoptosis and sensitization tochemotherapy of melanomas by methionine deprivation stressMol Cancer Res 4 575ndash589
35 HirschCL Smith-WindsorEL and BonhamK (2006) Src familykinase members have a common response to histone deacetylaseinhibitors in human colon cancer cells Int J Cancer 118 547ndash554
36 LiuY PengH and ZhangJT (2005) Expression profiling ofABC transporters in a drug-resistant breast cancer cell line usingAmpArray Mol Pharmacol 68 430ndash438
e34 Nucleic Acids Research 2007 Vol 35 No 5 PAGE 10 OF 10
by guest on Novem
ber 24 2014httpnaroxfordjournalsorg
Dow
nloaded from
AI in 731 out of 1389 informative genes (53) (12)In addition to allele-specific hybridization on microarraysa variety of other genotyping methods have been appliedto detect AI (6ndash813ndash15) Due to variation in thesensitivity and specificity of the methods and the limitednumber of samples or SNPs included in these studies thefrequency estimates for AI vary largely between studiesfrom 18 to 60 of the analyzed genes Imbalancedexpression of alleles has also been detected usingbioinformatics tools comparing the allele frequencies ofSNPs in expressed sequence tags (ESTs) databases tothe allele frequencies in Centre drsquoEtude du PolymorphismeHumain (CEPH) samples from the Haplotype Mappingproject (16) This study estimated that AI occurred for36 of over 2500 analyzed genes and AI was experi-mentally verified for 40 of the genes by sequencingIn the current study we established a process for
systematic screening for cis-acting rSNPs using experi-mental detection of AI as an initial approach Anapproach with similar steps as in our study but performedin a different order than in our process was recentlydescribed for identifying rSNPs that are associated withosteoarthritis (7) Inspired by a number of studies thathave identified putative rSNPs in genes related to cancer(141718) and the response to treatment with anticancerdrugs (19ndash22) we used a panel of cell lines that representdifferent types of cancers and have been well characterizedfor their response patterns against anticancer drugs (23)as target cells in our study For detecting AI in theexpression of candidate genes for cancer and anticancerdrug response we used our lsquoin housersquo developedtag-microarray minisequencing system which we havepreviously shown to be accurate and sensitive forquantitative detection of AI (15) Genes that displayedAI were then subjected to bioinformatics-assisted identi-fication of rSNPs that alter the strength of transcriptionfactor binding in their upstream regulatory regions Theputative rSNPs were tested for their protein-bindingcapacity using electrophoretic mobility shift assays(EMSAs) This process allowed us to zoom in from the160 originally selected candidate genes to eight genes thatmight contain rSNPs that affect the transcription levels ofthe genes
MATERIALS AND METHODS
Cell lines
A panel of 13 human tumor cell-lines consisting of drug-sensitive parental cell-lines and resistant subtypes wasanalyzed Table 1 presents a summary of the cell linesincluding their origin parental cell-lines and the resistantsubtypes and the selecting agents used to create resistantsubtypes The cell-line cultures have regularly beenmonitored and found negative for mycoplasma contam-ination The cell lines have been described in detail byDhar et al (23)
Extraction of DNA RNA and cDNA synthesis
Genomic DNA was extracted from the 13 cell-linesusing the GeneluteTM Mammalian Genomic DNA kit
(Sigma St Louis MO USA) and the DNA was stored atndash208C until use Total RNA was extracted by a standardguanidine isothiocyanate method (TRIZOL ReagentGibco BRLInvitrogen) The quality of the RNA wasverified by running the samples on a 1 agarose geland the RNA was quantified by measuring theultraviolet absorbance at 260 and 280 nm (NanoDropTechnologies) Twenty micrograms of RNA was treatedwith DNase I to remove genomic DNA using the RNeasyMini Kit (Qiagen 74104) Adequate removal of thegenomic DNA after DNase I treatment was verified byabsence of PCR products from RNA samples usingprimers for genomic DNA Five micrograms of purifiedRNA was reverse transcribed to cDNA using theHigh-Capacity cDNA archive kit (Applied Biosystems4322171)
Gene expression profiling
The expression levels of 7400 genes in 13 of the parentaland drug-resistant cell-lines had been previously deter-mined using mRNA expression microarrays with cDNAprobes (24) Twelve of the cell lines were selected torepresent all cancer types in expression profiling onSentrix Genome-Wide Expression BeadChips (IlluminaInc San Diego CA USA) Biotinylated cRNA wasprepared from 500 ng of RNA using the TotalPrepTM
RNA Labeling Kit (Ambion) The in vitro transcriptionproduct was purified and labeled with Cy3-labeledstreptavidin followed by overnight hybridization of15 mg of the labeled product to the BeadChipsThe following day the slides were washed and scannedusing a Bead Station GX 500 Array Reader (Illumina IncSan Diego CA USA) The image data files were analyzedusing the BeadStudio software (Illumina Inc San DiegoCA USA) where the lsquorank invariantrsquo normalizationmodel was applied as recommended by the manufacturerThe limit of detection was set at 98 confidence
PCR
Primers for PCR and minisequencing primers with20-nucleotide tag sequences were designed using thePrimer3 (httpfrodowimiteducgi-binprimer3primer3cgi) and Autoprimer (httpwwwautoprimercom)(Beckman Coulter) softwares The primers were obtainedfrom Integrated DNA Technologies (IDT Inc Coralville
Table 1 Summary of cell lines analyzed
Parental CL Resistant CL Origin Selecting agent
8226S 8226Dox Myeloma Doxorubicin8226LR5 Myeloma Melphalan
CCRF-CEM CEMVM-1 T-cell leukemia TeniposideNCI-H69 H69AR Small cell lung cancer DoxorubicinU937-GTB U937VCR Histiocytic lymphoma Vincristine
GTBCHS Histiocytic lymphoma CynoguanidineHELA Cervical cancerHTERT Normal epithelial retinaACHN Renal adenocarcinoma
e34 Nucleic Acids Research 2007 Vol 35 No 5 PAGE 2 OF 10
by guest on Novem
ber 24 2014httpnaroxfordjournalsorg
Dow
nloaded from
IA USA) The fragments comprising the SNPs wereamplified by PCR from genomic DNA in multiplexreactions with 6ndash12 amplicons per reaction using 10 ngof DNA 01mM dNTPs 1 U Smart-Taq hot DNApolymerase (Naxo Ltd Tartu Estonia) 4mMMgCl2 and02 mM of primers in a final volume of 30 ml PCR fromcDNA was performed in individual reactions using 120 ofthe cDNA products 01mM dNTPs 05 U Smart-Taq hotDNA polymerase 15mM MgCl2 and 02 mM of primersin a final volume of 30 ml The PCR conditions were initialactivation of the enzyme at 958C for 10min followed by 40cycles of 958C for 1min 558C for 30 s and 728C for 1minin a Thermal Cycler PTC225 (MJ Research WatertownMA USA) The amplified cDNA fragments were pooledand concentrated to 40 ml using Microcon YM-30Centrifugal Filter Devices (Millipore CorporationBedford MA USA)
Preparation of microarrays
Oligonucleotides that were complementary to the tagsequences on the minisequencing primers were immobi-lized covalently on CodeLinkTM Activated Slides (GEHealthcare Uppsala Sweden) by the mediation of aNH2-group at their 30-end as described earlier (25)Each oligonucleotide was applied as duplicate spots tothe slides at a concentration of 25 mM in 150mM sodiumphosphate pH 85 using a ProSys 5510A instrument(Cartesian Technologies Inc Irvine CA USA) equippedwith four Stealth Micro Spotting pins (SMP3BTeleChem International Inc Sunnyvale CA USA) Theoligonucleotides were spotted in an lsquoarray-of-arraysrsquoconfiguration which facilitates analysis of 80 individualsamples in parallel on each microscope slide In eachlsquosubarrayrsquo a fluorophore-labeled oligonucleotide wasincluded as a control for the immobilization processAfter printing the slides were incubated in a humidchamber for at least 24 h followed by treatment withethanolamine The slides were stored desiccated in thedark until use
Tag-microarray minisequencing
Excess of PCR primers and dNTPs was removed bytreatment of the PCR mixtures with 5 U of Exonuclease Iand 1 U of shrimp alkaline phosphatase (USBCorporation Cleveland OH USA) Multiplex cyclicminisequencing primer extension reactions were per-formed in the presence of 80 tagged primers in bothDNA polarities at 10 nM concentration 01 mM TexasRed-ddATP Tamra-ddCTP R110-ddGTP and 015mMCy5-ddUTP (Perkin Elmer Life Sciences Boston MAUSA) and 0065 U of KlenThermaseTM DNA polymerase(GeneCraft Germany) as described earlier (26)Alternatively reagents from the SNPstream genotypingsystem (Beckman Coulter Fullerton California USA)were used for the cyclic minisequencing reactionA reference oligonucleotide that is complementary toa synthetic template to mimic a four-allelic SNP wasadded to the minisequencing reaction to monitor thedifference in incorporation efficiency of the four nucleo-tides by the DNA polymerase The reaction conditions
were initial activation of the enzyme at 968C for 5minfollowed by 33 cycles of 95 and 558C for 20 s eachThe extension products were allowed to anneal to theimmobilized complementary tag oligonucleotides at 428Cfor 1ndash2 h followed by washing of the slide with 2SSCand 01 SDS twice for 5min at 428C and twice with02 SSC for 1min at room temperature Five replicatesof DNA and cDNA from the same cell-line were analyzedin parallel
Signal detection and data analysis
Fluorescence was measured from the microarrays using aScanArray Express instrument (Perkin Elmer LifeSciences Boston MA USA) with the excitation lasersBlue Argon 488 nm (R110 and fluorescin) Green HeNe5438 nm (Tamra) Yellow HeNe 594 nm (Texas Red)and Red HeNe 6328 nm (Cy5) with the laser power setto 88 and the photomultiplier tube gain adjustedto obtain equal signal intensities from the reactioncontrol for all fluorophores The fluorescence signalswere quantified using the QuantArray analysis31 software (Perkin Elmer Life Sciences BostonMA USA)The SNP genotypes were assigned using the
SNPsnapper software v300191 (httpwwwbioinfohelsinkifiSNPSnapper) based on scatter plots with thelogarithm of the sum of both fluorescence signals(SAllele1thornSAllele2) on the vertical axis and the fluorescencesignal fractions [SAllele2(SAllele1thornSAllele2)] on the horizon-tal axis The genotypes together with the signal intensitiesof the incorporated nucleotides were exported toMicrosoft Excel The data was handled and interpretedusing the Microsoft Excel and Access programs AI wasdetermined by calculating the fluorescence signal ratiobetween the two alleles (SAllele1SAllele2) in cDNA andDNA for each heterozygous SNP The signal ratio fromcDNA was divided by the corresponding ratio in DNA toobtain a measure for AI In this calculation the meansignal intensity of duplicate spots in one sub-array wasconsidered as one replicate assay and five replicate assayswere performed for each SNP A two-tailed studentrsquos t-testwas used to calculate the significance of the difference inthe allelic ratios for the SNPs in genomic DNA and cDNA(Figure 1)
Analysis of regulatory regions affected by SNPs
The bioinformatics tool Regulatory Analysis of Variationin Enhancers (RAVEN) (M Andersen B Lenhard et alin preparation) was used for the identification of potentialrSNPs in the promoter regions of the genes withimbalanced expression RAVEN (httpmordorcgbkiseCONSNP) combines position weight matrices fortranscription factor binding sites (TFBSs) from themanually curated Jaspar database (2728) with phyloge-netic footprinting to increase the likelihood of identifyingfunctional variants The RAVEN interface enables auto-matic analysis of SNPs from dbSNP as well as uploadingof additional SNPs Based on the application of position-specific weight matrices RAVEN gives a score that rangesfrom 1 to 15 for binding sites of 6ndash14 nucleotides in length
PAGE 3 OF 10 Nucleic Acids Research 2007 Vol 35 No 5 e34
by guest on Novem
ber 24 2014httpnaroxfordjournalsorg
Dow
nloaded from
that contain the two SNP alleles Putative rSNPs withMAF 4005 were selected for further genotyping byapplying a minimum SNP-caused score difference over 2between the high- and low-scoring SNP alleles in theTFBS profile and a conservation cut-off above 70between human and mouse based on the phylogeneticfootprinting
Electrophoretic mobility shift assays (EMSA)
Complementary double-stranded 50 biotinylated as well asunmodified 30 bp oligonucleotides containing thepredicted TFBS were designed for each allele of putativerSNPs (Table 2) The oligonucleotides were obtained fromIntegrated DNA Technologies (IDT Inc Coralville IAUSA) The complementary oligonucleotides were allowedto anneal in 10mM TrisndashHCl pH 75 50mM NaCl1mM EDTA to generate double-stranded probes for theEMSA reaction Twenty femtomoles of the labeleddouble-stranded probes were incubated with 5 mg ofHELA or Jurkat nuclear extracts (Active Motif CarlsbadCA USA) in a freshly made binding buffer containing12mM HEPES pH 74 5mM MgCl2 60mM KCl 1glycerol 005 NP-40 50 mgml BSA 1mM DTT05mM EDTA with 50 ngml of poly(dI-dC) poly(dI-dC)(Amersham Biosciences Piscataway NJ USA) andHaltTM Protease Inhibitor Cocktail (PierceBiotechnology Rockford IL USA) in a final volume of20 ml Three reactions were prepared for each double-stranded oligonucleotide (see Figure 2) The mixtures wereincubated at room temperature for 20min and analyzedusing electrophoresis on 6 polyacrylamide gels(Bio-Rad Laboratories Hercules CA USA) The gelswere run for 15 h at 100V followed by transfer toHybond-Nthorn nylon membranes (BuckinghamshireEngland) in 05TBE for 1 h at 550mA using aCriterion Blotter (Bio-Rad Laboratories Hercules CAUSA) The LightShift Chemiluminescent EMSA kit(Pierce Biotechnology Rockford IL USA) was used tovisualize the biotinylated oligonucleotide signals onthe membranes and a ChemiDoc XRS system (Bio-RadLaboratories Hercules CA USA) The EMSAexperiments were performed twice with reproducibleresults
Figure 1 Volcano plot of the AI data from 105 heterozygous cSNPs in13 cell lines AI for each SNP was determined by calculating thefluorescence signal ratio between the two alleles (SAllele1SAllele2) inRNA (cDNA) and genomic DNA for each heterozygous SNPThe level of AI obtained by dividing the signal ratio in RNA bythe corresponding ratio in DNA is plotted on the horizontal axis TheP-value for the difference between allelic ratios in RNA and DNAbased on five replicate assays is plotted on the vertical axis Spots abovethe horizontal dashed line represent the SNPs showing AI at aP-value500001 that were selected for further analysis
Table 2 Result from validation of the transcription factor binding sites predicted by RAVEN by electrophoretic mobility shift assays
Genea SNP b EMSA probes (one strand)c Transcription factorsd Confirmed by EMSAe
APC rs2439591 GAAATCCATTACACAGAATAAGGCAGACA AGL3 E4BP4 HLF SOX17 thorn
GAAATCCATTACACAAAATAAGGCAGACA SQUABCL2 rs1944423 TTCATAAACTTGGAGAATATTTATATTGA Athb-1 HFH-1 HFH-2 HFH-3 ndash
TTCATAAACTTGGAGAACATTTATATTGA HNF-3beta MEF2 SOX17CCND2 rs3812821 ACCAGAACAACGTCCCTTGTGCCCCCCCC SOX17 ndash
ACCAGAACAACGTCCCTTCTGCCCCCCCCMLH1 rs3172297 ATTTAAGACTATATGAATCAGAATTTTAA CF2-II thorn
ATTTAAGACTACATGAATCAGAATTTTAAPARP1 rs1317170 CTCGATGGGGTGCATGACATACACAGGATA CREB bZIP910 thorn
CTCGATGGGGTGCATAACATACACAGGATASLIT2 rs564041 ACCTAAAATCTCTGCAATATTCTCATTAA SOX17 thorn
ACCTAAAATCTCTGCAATATCCTCATTAAXRCC1 rs12608635 CGGCGGCGGGGAGCAGGTGCCACGGCCAAA Chop-cEBP bZIP911 thorn
CGGCGGCGGGGAGCAGGTGCCATGGCCAAAYES1 rs7233932 GGAGCGCTCCGATTGTGCCCCTCTGCCTT SOX17 Sox-5 thorn
GGAGCGCTCCGATTCTGCCCCTCTGCCTT
aGene symbol according to the HUGO gene nomenclature committee httpwwwgeneuclacuknomenclaturebThe SNPs rs8073706 rs907187 rs8176077 rs5016499 rs7655084 rs2717701 and rs3810378 in the respective ABCC3 PARP1 BRCA1 DCTDSLIT2 TNFRSF12A and XRCC1 genes were not confirmed by EMSAcEMSA probe containing the SNP the top probe contains the SNP allele that is predicted to give stronger transcription factor bindingdTranscription factors predicted by RAVEN to bind to the probeseThe probes for the SNP alleles giving a stronger signal in EMSA that matched the predictions by RAVEN
e34 Nucleic Acids Research 2007 Vol 35 No 5 PAGE 4 OF 10
by guest on Novem
ber 24 2014httpnaroxfordjournalsorg
Dow
nloaded from
RESULTS AND DISCUSSION
Selection of candidate genes and coding SNPs
A panel of 13 human tumor cell-lines that includes drug-sensitive parental cell-lines and their correspondingresistant subtypes was analyzed to detect AI in theexpression of candidate genes involved in cancer progres-sion and response to anticancer drugs (Table 1) These celllines have previously been well characterized for theirresponse patterns against 66 different anticancer drugs(2324) Initially we selected a panel of 210 candidategenes for our study The panel included oncogenes andtumor suppressor genes selected from the literatureand genes relevant for the pathways of nine anticancerdrugs (irinotecan 5-fluorouracil platinum taxanesmethotrexate topotecan gemcitabine cyclophosphamideand doxorubicin) according to the Pharmacogeneticsand Pharmacogenomics knowledge base website
(httppharmacogeneticswustledu) Based on expressiondata for 7400 human genes using cDNA microarrays (24)and expression profiling using bead arrays with probesfor 46000 transcripts (Illumina Inc) (Milani et alunpublished results) 160 of the 210 genes appeared tobe expressed in at least one of the cell lines (seeSupplementary Table 1) By searching the dbSNP andEnsembl databases we identified 237 SNPs with minorallele frequencies above 10 in the coding region of theexpressed candidate genes
Detection of allelic imbalance
Next we genotyped the cSNPs by multiplex tag-microarray minisequencing in genomic DNA from thecell lines and found that 79 of the candidate genescontained coding SNPs (cSNPs) that were heterozygous inat least one of the cell lines These heterozygous cSNPs
Figure 2 Electrophoretic mobility shift assay images for the SNP alleles of the APC BCL2 SLIT2 CCND2 XRCC1 PARP1 MLH1 and YES1genes Three lanes are shown for each SNP allele From left to right these are a control reaction with labeled probe only a reaction containing bothlabeled probe and nuclear extract and a reaction where an unlabeled probe is added in excess as a competitor in addition to the labeled probe andnuclear extract For the MLH1 and YES1 genes the two lanes are shown a reaction with labeled probe and nuclear extract and a reaction where theunlabeled competitor probe is added The sequences of the allele-specific EMSA probes are given in Table 2
PAGE 5 OF 10 Nucleic Acids Research 2007 Vol 35 No 5 e34
by guest on Novem
ber 24 2014httpnaroxfordjournalsorg
Dow
nloaded from
were then genotyped in five replicate reactions in bothgenomic DNA and RNA (cDNA) from the relevant celllines Genotyping of the RNA samples was successful for105 cSNPs in 60 genes For 19 genes genotyping assaysthat were successful for genomic DNA failed in cDNApresumably due to the low expression level of these genesAI between the expressed alleles was initially observed byaberrant clustering of the genotype data from RNAcompared to data from DNA in scatter plots To obtain aquantitative measure for the observed AI the fluorescencesignal (S) ratio between the two alleles (SAllele1SAllele2) inRNA was divided by the corresponding signal ratio inDNA for each SNP A studentrsquos t-test was then usedto assess the significance of the difference betweenallelic ratios in DNA and RNA based on five replicatemeasurements The lsquovolcano plotrsquo in Figure 1 displaysthe AI data from all 105 cSNPs and 13 cell lines with themagnitude of AI plotted on the horizontal axis and theP-values for the differences in signal ratios for the detectedAI on the vertical axis The complete data underlyingFigure 1 is provided in Supplementary Table 2 Using aconservative P-value of 00001 as significance threshold wedetected AI in the expression of 41 of the genes (Table 3)Figure 3 summarizes the recovery of genes at the differentstages of our screening processDespite the conservative approach for defining AI the
relative number of genes that displayed AI in our study(68) was higher than that previously observed by othersbased on screening with allele-specific hybridizationmicroarrays (1112) The reason for this difference couldbe the high sensitivity of detecting minority alleles usingminisequencing primer extension which we have pre-viously shown to be 1ndash5 depending on the sequencecontext of the SNP (1529) Alternatively it is possible thatcancer-related genes in cancer cells are more frequentlyexpressed in an allele-specific manner than randomlyselected genes in lymphoblastoid cell-lines that have beenanalyzed for AI in other studiesAs can be seen in Supplementary Table 2 the level of AI
that we measured in our study varied largely from13-fold (44 of the minor allele expressed) to over40-fold (24 of the minor allele expressed) For a subsetof 15 genes we observed apparent monoallelic expressionin at least one of the cell lines based on an allelic ratio inRNA that was indistinguishable from a homozygousgenotype Extreme AI or monoallelic expression could inaddition to a strong cis-acting regulatory effect be due tolack of transcription of one allele because of methylationof the promoter region as a consequence of imprintingIn accordance with this notion we have detectedmethylation in the CpG islands in the 50 region of theERBB2 gene in the CCRF-CEM and CEM-VM1 cells thatshowed monoallelic expression in the current study butnot in HELA cells that displayed equal expression of theERBB2 alleles (Milani et al unpublished results)Eleven of the genes that displayed AI in our study
contained more than one heterozygous cSNP(Supplementary Table 2) For example SNPs rs12917and rs1803965 in exon 3 of MGMT yielded 23-fold and17-fold AI respectively in the CCRF-CEM cell line andno AI in any of the other cell lines Three SNPs in different
exons of PARP1 (rs1136410 rs1805404 rs3219061) allyielded 23ndash29 fold AI in the HTERT cell line This datasupports that our system yields reproducible results Onthe other hand SNP rs602990 in exon 20 of VAV2displayed 12-fold AI while both alleles of SNP rs509590in the 30 UTR of VAV2 were expressed at equal levelsThese apparently discordant results could be caused bydifferential expression of alternatively spliced transcriptswhere the exon containing one of the SNPs has beenremoved from one of the splice variants Hence measure-ment of AI using SNPs distributed over different exonscould be used for relative quantification of alternativelyspliced transcripts as an alternative approach to assaysbased on detection of exon-specific nucleotides only(2930) AI could thus be used as a guide to SNPs thatregulate alternative splicing analogously to the processfor identifying rSNPs that affect the expression of theentire transcript
Bioinformatics-assisted identification of SNPs that causeallelic imbalance
Next we attempted to identify SNPs in the 50-regulatoryregions of the 41 genes that displayed AI For thispurpose we used the RAVEN application RAVENreports evolutionary conserved regions based on thehuman and mouse genome sequences and scans thesequences for the presence of potential TFBSs that areaffected by SNPs We used RAVEN to scan 3ndash5 kb of the50-regulatory regions of the 41 genes that were found todisplay AI and selected about 100 putative rSNPs in thegenes based on this analysis The putative rSNPs identifiedusing RAVEN were subsequently genotyped in all the celllines (data not shown) The 15 rSNPs that were hetero-zygous in the same samples as the originally genotypedcSNPs in the corresponding genes were selected for furtheranalysis
Functional analysis of rSNPs
Fifteen of the rSNPs predicted by RAVEN and thatappeared to be in linkage disequilibrium (LD) with theinitially genotyped cSNP were analyzed for their capacityto bind transcription factors or other proteins from anuclear cell extract by EMSAs (3132) Allelic pairs ofeight of these SNPs that are located in the promoterregions of the APC BCL2 SLIT2 CCND2 XRCC1PARP1 MLH1 and YES1 genes displayed a reproduciblesignal intensity difference in a product with alteredmobility in EMSA Protein binding to only one of theSNP alleles can be seen for the APC BCL2 and XRCC1genes while for the SLIT2 CCND2 PARP1 MLH1 andYES1 genes a difference in the amount of protein bound isseen (Figure 2) For as many as six of the SNPs the allelethat showed stronger protein binding had been predictedby RAVEN to have a stronger binding affinity for atranscription factor The transcription factors predictedto bind to the binding sites containing the rSNPs arelisted in Table 2 No protein binding or allele-specificdifferences in binding were detectable using EMSA forthe remaining seven SNPs that are located in theABCC3 PARP1 BRCA1 DCTD SLIT2 TNFRSF12A
e34 Nucleic Acids Research 2007 Vol 35 No 5 PAGE 6 OF 10
by guest on Novem
ber 24 2014httpnaroxfordjournalsorg
Dow
nloaded from
Table 3 Allelic imbalance levels in 13 cell lines
Genea SNP Allelesb 8226S 8226Dox 8226LR5 CCRF-CEM CEMVM-1 NCI-H69 H69AR U937-GTB U937VCR GTBCHS HELA HTERT ACHN
ABCB1 rs3842 AG ndash ndash ndash 14 31 ndash ndash ndash 46 ndash ndash 57 ndashABCC3 rs4148416 GA ndash ndash ndash ndash ndash ndash ndash ndash ndash ndash 28 ndash ndashAPC rs2229992 TC nd nd nd nd nd 17 nd nd nd nd ndash nd ndashATF5 rs283525 GA 17 ndash nd ndash ndash 75 ndash nd nd nd nd ndash ndashATF5 rs8647 GA ndash ndash ndash nd nd 29 27 ndash ndash ndash ndash ndash ndATF5 rs8667 TC ndash ndash ndash nd 85 nd nd ndash ndash ndash ndash ndash ndBAK1 rs210135 AT nd ndash nd nd 21 nd nd nd nd nd ndash ndash ndashBCL2 rs1801018 AG ndash ndash ndash 58 34 ndash ndash ndash ndash ndash ndash ndash ndashBCL2 rs4987843 AG ndash ndash ndash 38 21 nd nd ndash ndash ndash ndash 22 ndashBDH1 rs1050119 TC ndash ndash ndash 34 48 ndash ndash nd 28 22 ndash ndash ndashBLM rs1063147 GA ndash ndash ndash ndash ndash ndash ndash nd nd 24 ndash ndash ndashCBR1 rs20572 GA ndash ndash ndash ndash 68 ndash ndash ndash ndash ndash ndash ndash ndashCBR1 rs9024 CT ndash ndash ndash ndash 466 ndash ndash ndash ndash ndash ndash ndash ndashCCND2 rs1049606 TC ndash ndash ndash 61 108 nd 35 97 nd nd ndash ndash ndashCCND2 rs3217926 GA ndash ndash nd ndash ndash ndash ndash 64 nd nd ndash 116 ndashCDH6 rs2302904 TC ndash ndash ndash ndash ndash nd ndash ndash ndash ndash ndash 26 ndashERBB2 rs1058808 CG ndash ndash ndash 408 402 ndash ndash ndash ndash ndash nd ndash ndashERBB2 rs1801200 AG ndash ndash ndash 53 76 ndash ndash ndash ndash ndash nd 33 ndashERBB2 rs2230698 AG nd nd 19 ndash ndash ndash ndash ndash ndash ndash ndash ndash ndashERBB2IP rs36303 GA ndash ndash ndash nd nd 18 nd ndash ndash ndash ndash ndash ndashERBB2IP rs706679 TC nd nd nd nd nd 55 nd ndash ndash ndash nd ndash ndashERCC2 rs13181 AC ndash ndash ndash ndash ndash ndash ndash ndash ndash ndash 30 ndash ndashFANCA rs2239359 TC ndash ndash ndash nd nd ndash ndash 1337 nd nd ndash ndash ndashFDXR rs690514 GA ndash ndash ndash ndash ndash ndash ndash ndash ndash ndash ndash 113 ndashHMGA2 rs8756 TG ndash ndash ndash ndash ndash ndash ndash ndash ndash ndash ndash 519 ndashHMGB1 rs590050 GA ndash ndash ndash 25 22 66 43 79 140 90 ndash 120 66MAP4K2 rs2071313 TC ndash ndash ndash ndash ndash nd 22 15 nd nd ndash 22 ndashMAPT rs1052594 CG ndash ndash ndash ndash ndash nd 31 nd nd nd ndash nd ndashMAPT rs9468 CT ndash ndash ndash ndash ndash nd nd nd 33 nd ndash nd ndashMCM7 rs2070215 TC ndash ndash ndash nd 19 ndash ndash nd nd nd ndash ndash ndashMGMT rs12917 GA ndash ndash ndash 23 nd ndash ndash ndash ndash ndash nd ndash ndashMGMT rs1803965 GA ndash ndash ndash 17 nd ndash ndash ndash ndash ndash nd ndash ndashMLH1 rs1799977 GA ndash ndash ndash 400 404 ndash ndash 23 nd nd ndash ndash ndashMSH6 rs1800935 TC ndash ndash ndash ndash 33 ndash ndash ndash ndash ndash ndash ndash ndNF2 rs1008515 TC 23 nd 58 ndash ndash ndash ndash nd nd 33 nd ndash ndashNME4 rs14293 GA 14 41 197 ndash ndash nd nd ndash ndash ndash 16 14 ndashPARP1 rs1136410 GA ndash ndash ndash ndash ndash ndash ndash ndash ndash ndash ndash 26 ndashPARP1 rs1805404 GA ndash ndash ndash ndash ndash ndash ndash ndash ndash ndash ndash 29 ndashPARP1 rs3219061 TC ndash ndash ndash ndash ndash ndash ndash ndash ndash ndash ndash 23 ndashPCNA rs3626 CG ndash ndash ndash ndash ndash ndash ndash ndash ndash ndash ndash 641 ndashPMS2 rs1059060 GA 28 ndash nd nd nd nd nd nd nd nd nd nd ndRET rs1800858 GA ndash ndash ndash ndash ndash ndash ndash 35 nd 51 ndash 17 ndashSLIT2 rs7655084 TG ndash ndash ndash ndash 106 ndash ndash ndash ndash ndash ndash nd ndashTERT rs2736098 GA nd ndash nd ndash ndash 124 nd ndash ndash ndash ndash 2705 ndashTK1 rs1065769 CT nd nd 35 ndash ndash nd nd ndash ndash ndash ndash nd ndashTK1 rs1071664 TC nd ndash nd ndash ndash 43 nd ndash ndash ndash ndash nd ndashTK1 rs1143696 GA 19 nd nd ndash ndash ndash ndash ndash ndash ndash ndash ndash ndashTNFRSF12A rs13209 TC nd 48 nd nd nd 17 nd ndash ndash ndash ndash ndash ndTSHZ1 rs3744908 TC 17 13 nd nd nd 68 nd ndash ndash ndash 19 nd ndashTSHZ1 rs3809997 TC nd nd nd nd nd 56 nd ndash ndash ndash nd nd ndash
(continued)
PAGE7OF10
Nucleic
Acid
sResea
rch2007V
ol3
5N
o5
e34
by guest on November 24 2014 httpnaroxfordjournalsorg Downloaded from
and XRCC1 genes RAVEN appears to be an excellenttool for enriching functional SNPs in TFBSs althoughfine-tuning of the parameters of RAVEN as well asraising the cut-off for detecting AI could increase itssuccess rate
The genes in which we identified rSNPs were mainlygenes involved in cancer progression BCL2 (the B-cellCLLlymphoma 2 gene) has been reported to be over-expressed in different leukemias and to be involved inleukemogenesis (33) and the expression of TNFRSF12A(the tumor necrosis factor receptor superfamily member12A gene) is important in cells undergoing apoptosis (34)The Yamaguchi sarcoma viral oncogene homolog 1(YES1) gene has been shown to be differentially expressedin colon cancer cells treated with histone deacetylaseinhibitors (35) ABCC3 which encodes the multi-drugresistance-associated protein 3 has been reported to beinvolved in resistance to doxorubicin (36) The identifiedrSNPs in these genes should be further validated byfunctional assays The genes and rSNPs identified in ourstudy are promising candidates for genetic associationstudies with samples from patient cohorts with relevanttypes of cancer or drug response patterns
CONCLUSION
By the screening process presented here we detected AI inthe expression levels of 41 out of 160 candidate genes thatwere expressed in cancer cells and applied AI as a guide toputative rSNPs in these genes Using bioinformatics toolsthat predict TFBSs we selected SNPs in the 50-regulatoryT
able
3Continued
Genea
SNP
Alleles
b8226S
8226D
ox
8226LR5
CCRF-C
EM
CEMV
M-1
NCI-H69
H69AR
U937-G
TB
U937V
CR
GTBC
HS
HELA
HTERT
ACHN
UMPS
rs1139538
AG
52
ndashnd
ndashndash
ndashndash
nd
nd
nd
ndashndash
ndashVAV2
rs509590
TC
nd
nd
nd
nd
26
ndashndash
nd
nd
nd
ndashndash
ndashVAV2
rs602990
GA
nd
nd
121
ndashndash
nd
nd
ndashndash
ndashndash
ndashndash
WT1
rs16754
TC
ndashndash
ndash746
545
ndashndash
ndashndash
ndashndash
1011
ndashXPC
rs2470352
TA
30
36
nd
ndashndash
ndashndash
ndash60
39
ndashndash
ndashXRCC1
rs25487
AG
nd
18
ndashndash
ndashnd
nd
nd
nd
nd
ndashnd
ndashYES1
rs1060922
TC
ndashndash
ndashnd
nd
189
nd
ndashndash
ndashndash
ndashndash
aGenesymbolaccordingto
theHUGO
genenomenclature
committeehttpw
wwgeneuclacuknomenclature
bSNP
allelesthefirstnucleotideis
referred
toasAllele1andthesecondasAllele2
ndheterozygoussample
wherenoAIwasdetected-(hyphen)
homozygous(orfailed)samples
OverexpressionofAllele1gives
positivevaluesoverexpressionofAllele2gives
negativevalues
Figure 3 Recovery of genes and SNPs at the different stages of ourprocess for screening for allelic imbalance
e34 Nucleic Acids Research 2007 Vol 35 No 5 PAGE 8 OF 10
by guest on Novem
ber 24 2014httpnaroxfordjournalsorg
Dow
nloaded from
regions of genes for which AI was detected We identifiedrSNPs that had a suggestive allele-specific effect whichwas shown experimentally by EMSA for eight genes Weconclude that a screening process such as the oneestablished in our study that combines allele-specificgene expression analysis with powerful bioinformaticstools offers a shortcut for the detection of potential cis-acting regulators of gene expression The process allows asubstantial reduction of the number of candidate rSNPs tobe subjected to labor-intensive genetic association orfunctional studies
ACKNOWLEDGEMENTS
The study was supported by grants from the SwedishCancer Foundation and the Swedish Research Councilfor Science and Technology (to ACS) Swedish ResearchCouncil for Medicine (to ACS and MG) and SelanderFoundation (to ACS) We thank Raul Figueroa forproducing the tag microarrays and Kristo Kaarmannand Mats Jonsson for assistance with data analysesFunding to pay the Open Access publication charge wasprovided by Swedish Research Council
Conflict of interest statement None declared
REFERENCES
1 CheungVG SpielmanRS EwensKG WeberTM MorleyMand BurdickJT (2005) Mapping determinants of human geneexpression by regional and genome-wide association Nature 4371365ndash1369
2 MonksSA LeonardsonA ZhuH CundiffP PietrusiakPEdwardsS PhillipsJW SachsA and SchadtEE (2004) Geneticinheritance of gene expression in human cell lines Am J HumGenet 75 1094ndash1105
3 MorleyM MolonyCM WeberTM DevlinJL EwensKGSpielmanRS and CheungVG (2004) Genetic analysis of genome-wide variation in human gene expression Nature 430 743ndash747
4 StrangerBE ForrestMS ClarkAG MinichielloMJDeutschS LyleR HuntS KahlB AntonarakisSE et al(2005) Genome-wide associations of gene expression variation inhumans PLoS Genet 1 e78
5 KristensenVN EdvardsenH TsalenkoA NordgardSHSorlieT SharanR VailayaA Ben-DorA LonningPE et al(2006) Genetic variation in putative regulatory loci controlling geneexpression in breast cancer Proc Natl Acad Sci USA 1037735ndash7740
6 BrayNJ BucklandPR OwenMJ and OrsquoDonovanMC (2003)Cis-acting variation in the expression of a high proportion of genesin human brain Hum Genet 113 149ndash153
7 MahrS BurmesterGR HilkeD GobelU GrutzkauAHauplT HauschildM KoczanD KrennV et al (2006)Cis- and trans-acting gene regulation is associated withosteoarthritis Am J Hum Genet 78 793ndash803
8 PastinenT SladekR GurdS SammakA GeB LepagePLavergneK VilleneuveA GaudinT et al (2003) A survey ofgenetic and epigenetic variation affecting human gene expressionPhysiol Genomics 16 184ndash193
9 PastinenT GeB GurdS GaudinT DoreC LemireMLepageP HarmsenE and HudsonTJ (2005) Mapping commonregulatory variants to human haplotypes Hum Mol Genet 143963ndash3971
10 TaoH CoxDR and FrazerKA (2006) Allele-specific KRT1expression is a complex trait PLoS Genet 2 e93
11 LoHS WangZ HuY YangHH GereS BuetowKH andLeeMP (2003) Allelic variation in gene expression is common inthe human genome Genome Res 13 1855ndash1862
12 PantPV TaoH BeilharzEJ BallingerDG CoxDR andFrazerKA (2006) Analysis of allelic differential expression inhuman white blood cells Genome Res 16 331ndash339
13 DingC MaierE RoscherAA BraunA and CantorCR(2004) Simultaneous quantitative and allele-specific expressionanalysis with real competitive PCR BMC Genet 5 8
14 HeighwayJ BowersNL SmithS BetticherDC andKorefMF (2005) The use of allelic expression differences toascertain functional polymorphisms acting in cis analysis ofMMP1 transcripts in normal lung tissue Ann Hum Genet 69127ndash133
15 LiljedahlU FredrikssonM DahlgrenA and SyvanenAC(2004) Detecting imbalanced expression of SNP alleles byminisequencing on microarrays BMC Biotechnol 4 24
16 GeB GurdS GaudinT DoreC LepageP HarmsenEHudsonTJ and PastinenT (2005) Survey of allelic expressionusing EST mining Genome Res 15 1584ndash1591
17 KanamoriY MatsushimaM MinaguchiT KobayashiKSagaeS KudoR TerakawaN and NakamuraY (1999)Correlation between expression of the matrix metalloproteinase-1gene in ovarian cancers and an insertiondeletion polymorphism inits promoter region Cancer Res 59 4225ndash4227
18 ZhuY SpitzMR LeiL MillsGB and WuX (2001) A singlenucleotide polymorphism in the matrix metalloproteinase-1promoter enhances lung cancer susceptibility Cancer Res 617825ndash7829
19 WangL NguyenTV McLaughlinRW SikkinkLA Ramirez-AlvaradoM and WeinshilboumRM (2005) Human thiopurineS-methyltransferase pharmacogenetics variant allozyme misfoldingand aggresome formation Proc Natl Acad Sci USA 1029394ndash9399
20 PullarkatST StoehlmacherJ GhaderiV XiongYPInglesSA SherrodA WarrenR Tsao-WeiD GroshenS andLenzHJ (2001) Thymidylate synthase gene polymorphismdetermines response and toxicity of 5-FU chemotherapyPharmacogenomics J 1 65ndash70
21 LeeW LockhartAC KimRB and RothenbergML (2005)Cancer pharmacogenomics powerful tools in cancer chemotherapyand drug development Oncologist 10 104ndash111
22 HirotaT IeiriI TakaneH MaegawaS HosokawaMKobayashiK ChibaK NanbaE OshimuraM et al (2004)Allelic expression imbalance of the human CYP3A4 gene andindividual phenotypic status Hum Mol Genet 13 2959ndash2969
23 DharS NygrenP CsokaK BotlingJ NilssonK andLarssonR (1996) Anti-cancer drug characterisation using a humancell line panel representing defined types of drug resistanceBr J Cancer 74 888ndash896
24 RickardsonL FryknasM DharS LovborgH GullboJRydakerM NygrenP GustafssonMG LarssonR andIsakssonA (2005) Identification of molecular mechanisms forcellular drug resistance by combining drug activity and geneexpression profiles Br J Cancer 93 483ndash492
25 LindroosK LiljedahlU RaitioM and SyvanenAC (2001)Minisequencing on oligonucleotide microarrays comparison ofimmobilisation chemistries Nucleic Acids Res 29 E69
26 LovmarL FredrikssonM LiljedahlU SigurdssonS andSyvanenAC (2003) Quantitative evaluation by minisequencingand microarrays reveals accurate multiplexed SNP genotyping ofwhole genome amplified DNA Nucleic Acids Res 31 e129
27 SandelinA AlkemaW EngstromP WassermanWW andLenhardB (2004) JASPAR an open-access database foreukaryotic transcription factor binding profiles Nucleic Acids Res32 D91ndashD94
28 VliegheD SandelinA De BleserPJ VleminckxKWassermanWW van RoyF and LenhardB (2006) A newgeneration of JASPAR the open-access repository for transcriptionfactor binding site profiles Nucleic Acids Res 34 D95ndashD97
29 McCulloughRM CantorCR and DingC (2005) High-throughput alternative splicing quantification by primer extensionand matrix-assisted laser desorptionionization time-of-flight massspectrometry Nucleic Acids Res 33 e99
30 MilaniL FredrikssonM and SyvanenAC (2006) Detection ofalternatively spliced transcripts in leukemia cell lines by minise-quencing on microarrays Clin Chem 52 202ndash211
PAGE 9 OF 10 Nucleic Acids Research 2007 Vol 35 No 5 e34
by guest on Novem
ber 24 2014httpnaroxfordjournalsorg
Dow
nloaded from
31 FriedMG and CrothersDM (1983) CAP and RNApolymerase interactions with the lac promoter bindingstoichiometry and long range effects Nucleic Acids Res 11141ndash158
32 FriedM and CrothersDM (1981) Equilibria and kinetics of lacrepressor-operator interactions by polyacrylamide gel electrophor-esis Nucleic Acids Res 9 6505ndash6525
33 WojcikI SzybkaM GolanskaE RieskeP BlonskiJZRobakT and BartkowiakJ (2005) Abnormalities of the P53MDM2 BCL2 and BAX genes in acute leukemias Neoplasma 52318ndash324
34 KokkinakisDM BricknerAG KirkwoodJM LiuXGoldwasserJE KastramaA SanderC BocangelD andChadaS (2006) Mitotic arrest apoptosis and sensitization tochemotherapy of melanomas by methionine deprivation stressMol Cancer Res 4 575ndash589
35 HirschCL Smith-WindsorEL and BonhamK (2006) Src familykinase members have a common response to histone deacetylaseinhibitors in human colon cancer cells Int J Cancer 118 547ndash554
36 LiuY PengH and ZhangJT (2005) Expression profiling ofABC transporters in a drug-resistant breast cancer cell line usingAmpArray Mol Pharmacol 68 430ndash438
e34 Nucleic Acids Research 2007 Vol 35 No 5 PAGE 10 OF 10
by guest on Novem
ber 24 2014httpnaroxfordjournalsorg
Dow
nloaded from
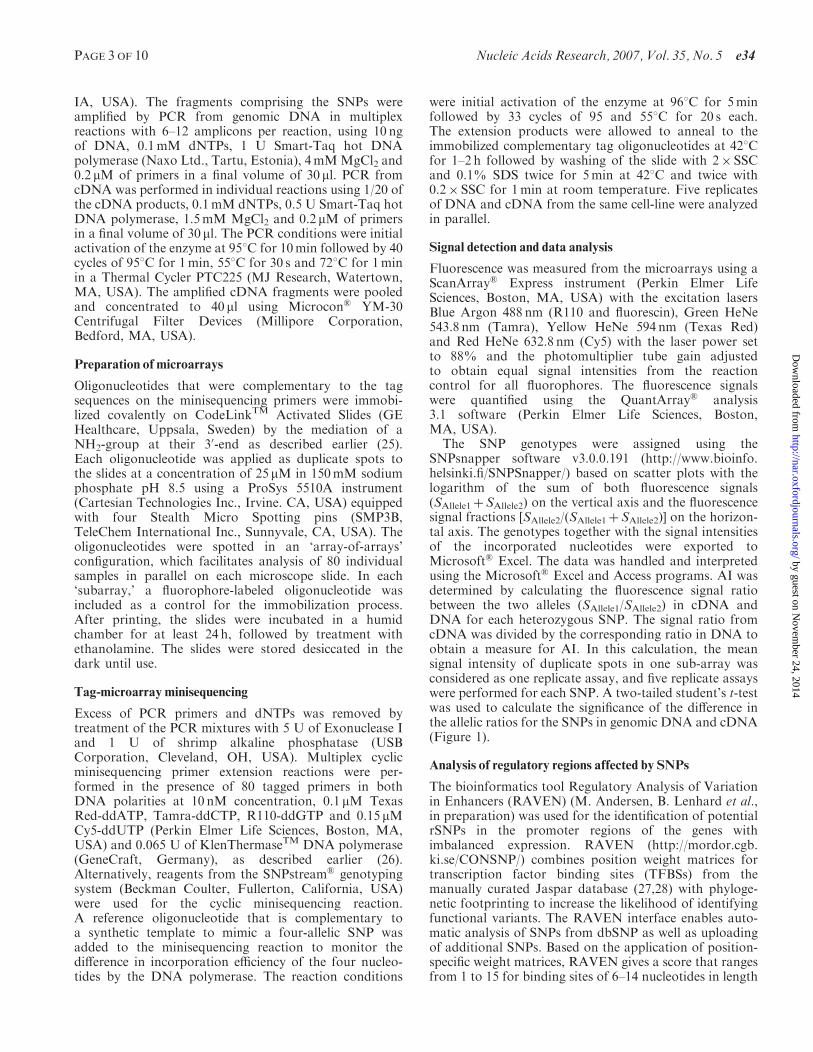
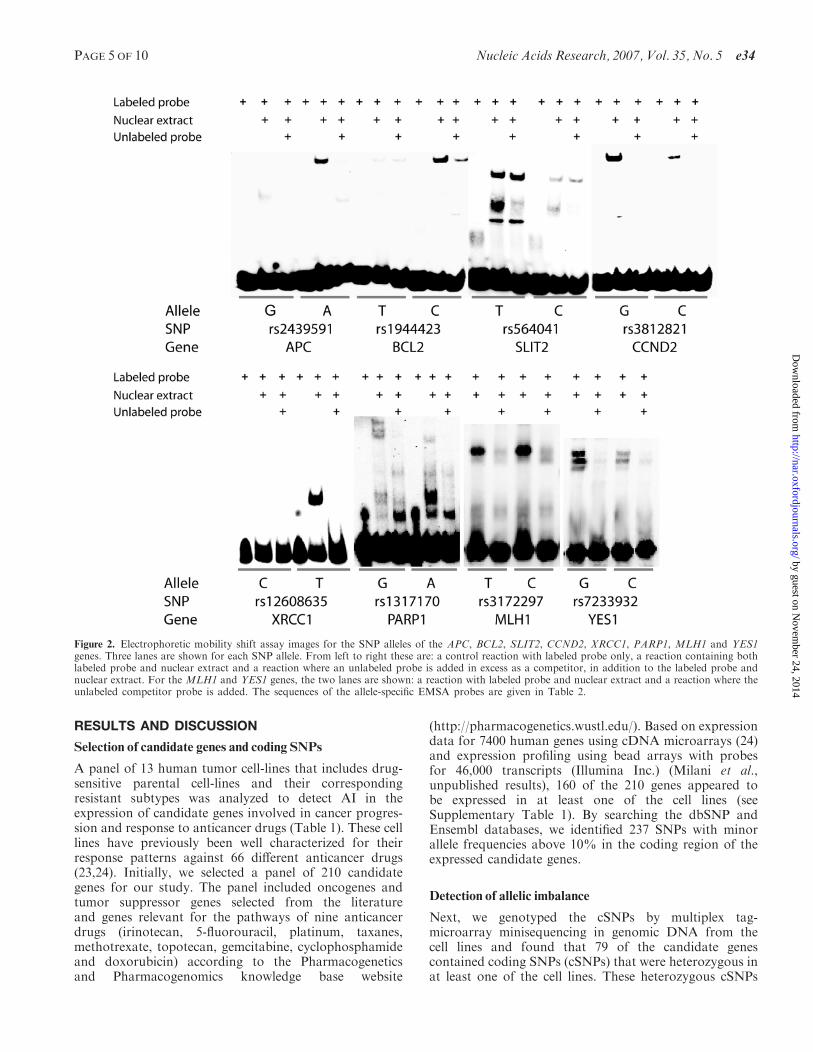
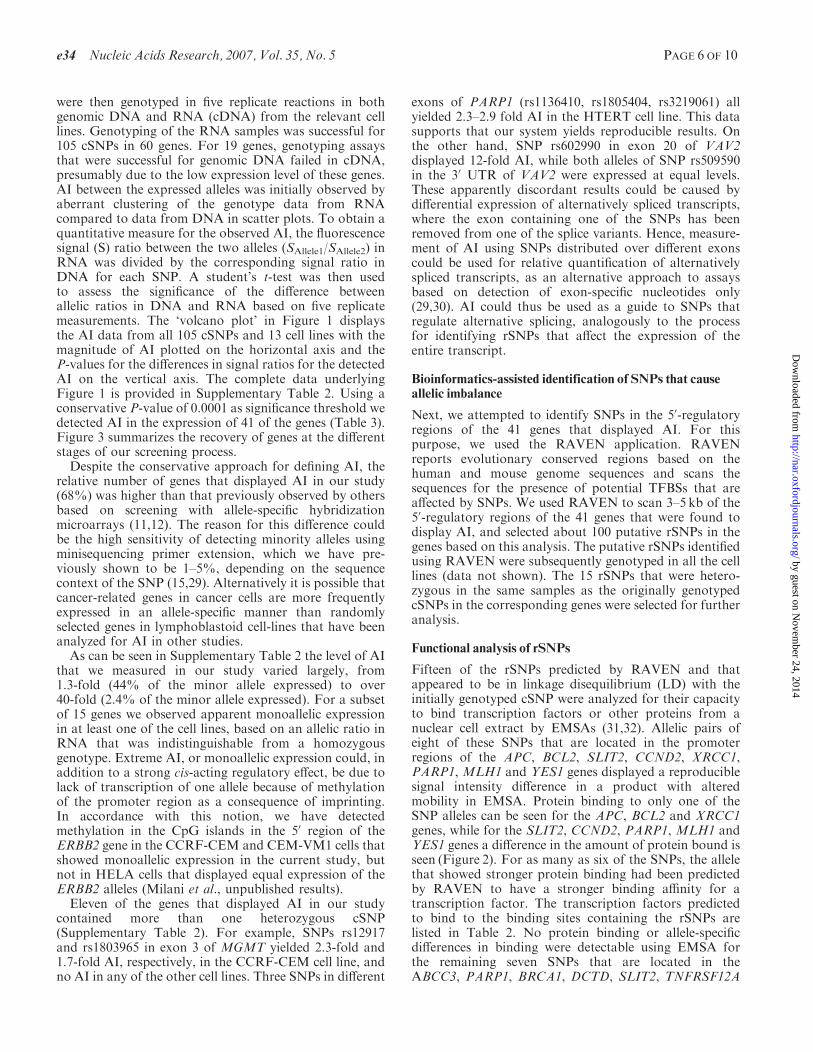
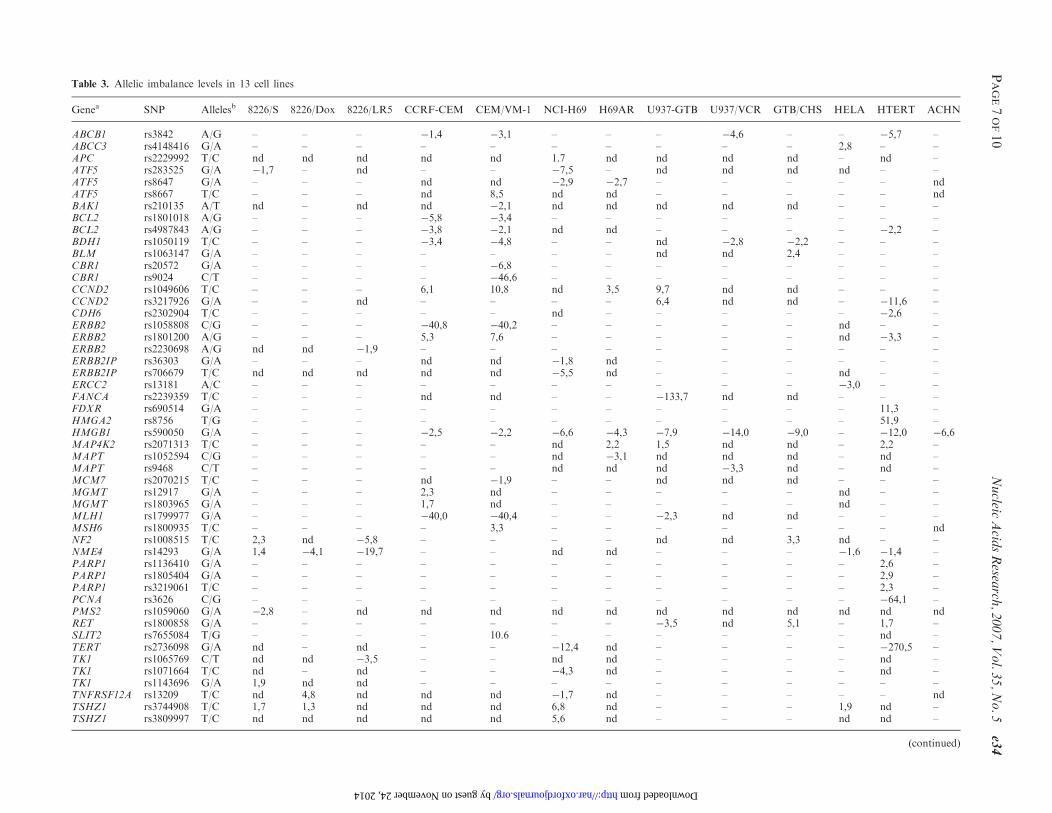
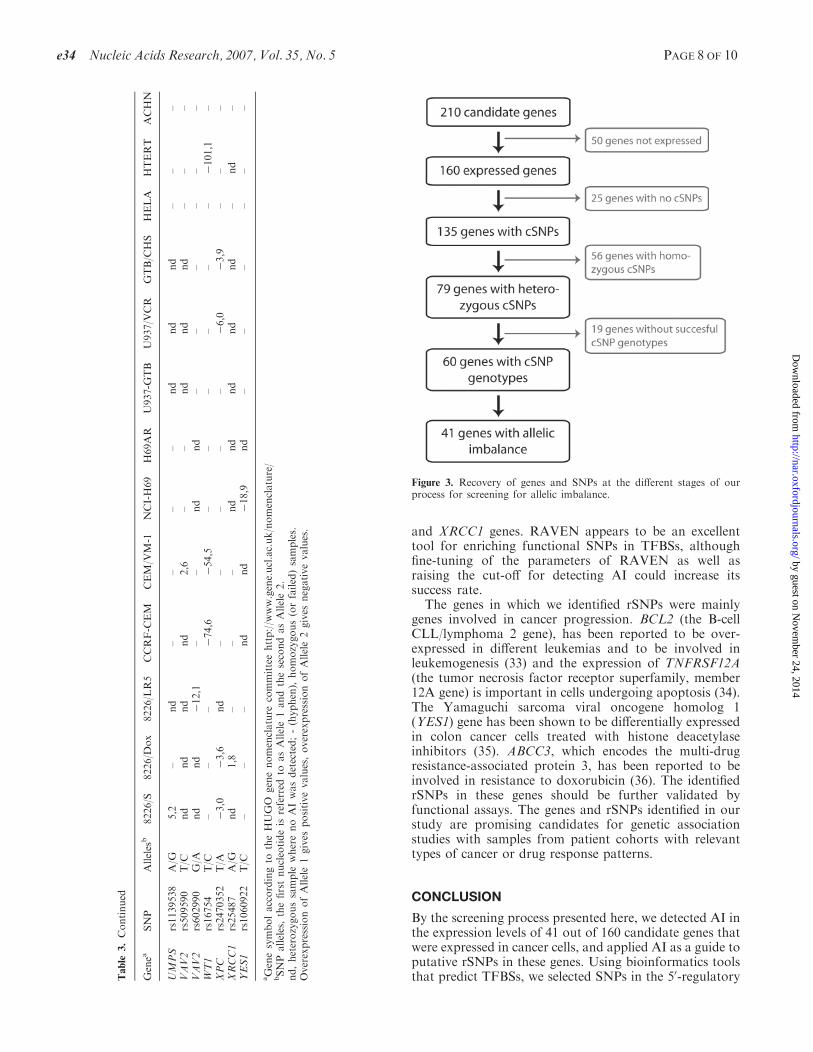