
OncoCis: annotation of cis- regulatory mutations in cancer
14
OncoCis: annotation of cis-regulatory mutations in cancer Perera et al. Perera et al. Genome Biology 2014, 15:485 http://genomebiology.com/2014/15/10/485
Transcript of OncoCis: annotation of cis- regulatory mutations in cancer
OncoCis: annotation of cis-regulatory mutations incancerPerera et al.
Perera et al. Genome Biology 2014, 15:485http://genomebiology.com/2014/15/10/485
Perera et al. Genome Biology 2014, 15:485http://genomebiology.com/2014/15/10/485
METHOD Open Access
OncoCis: annotation of cis-regulatory mutations incancerDilmi Perera1, Diego Chacon1, Julie AI Thoms1, Rebecca C Poulos1, Adam Shlien2, Dominik Beck1,Peter J Campbell2,3, John E Pimanda1,4* and Jason WH Wong1*
Abstract
Whole genome sequencing has enabled the identification of thousands of somatic mutations within non-codinggenomic regions of individual cancer samples. However, identification of mutations that potentially alter gene regulationremains a major challenge. Here we present OncoCis, a new method that enables identification of potential cis-regulatorymutations using cell type-specific genome and epigenome-wide datasets along with matching gene expression data.We demonstrate that the use of cell type-specific information and gene expression can significantly reduce the numberof candidate cis-regulatory mutations compared with existing tools designed for the annotation of cis-regulatory SNPs.The OncoCis webserver is freely accessible at https://powcs.med.unsw.edu.au/OncoCis/.
BackgroundResearch into cancer-causing mutations has focused pri-marily on protein-coding mutations owing to difficultiesassociated with identifying and interpreting causality ofnon-coding mutations. However, projects such as EN-CODE [1] and the Human Epigenome Atlas [2] have ledto the generation of genome-wide datasets that havecontributed to our understanding of the non-coding re-gions of the human genome. The integration of thesedatasets shed light on the functions of non-coding se-quences, gene regulatory modules and epistatic inter-actions underlying disease associations. Moreover, therapid advancement of sequencing technologies and therapid drop in sequencing costs have now made it feas-ible to sequence whole genomes of large numbers ofcancer samples. Nevertheless, even though cancer ge-nomes are being sequenced at an accelerated pace, an-notation of mutations and inference of their functionalsignificance remain challenging. Whilst a myriad of toolsare now available for the annotation of protein-codingmutations (for example, [3-6]), identification of cis-regulatorymutations remains a major challenge.
* Correspondence: [email protected]; [email protected] of Wales Clinical School and Lowy Cancer Research Centre, UNSWAustralia, Sydney 2052, Australia4Department of Haematology, Prince of Wales Hospital, Sydney 2031,AustraliaFull list of author information is available at the end of the article
© 2014 Perera et al.; licensee BioMed CentralCommons Attribution License (http://creativecreproduction in any medium, provided the orDedication waiver (http://creativecommons.orunless otherwise stated.
In recent years, computational approaches have beendeveloped to help identify non-coding germline sequencevariants that have the potential to modify gene regulation.HaploReg [7] was one of the first databases available forannotating variants in non-coding regions of the genome.Using linkage disequilibrium information from the 1000Genomes Project, it allows for the visualization of linkedSNPs and small indels along with their predicted chroma-tin state, their sequence conservation across mammals,and their effect on regulatory motifs. It included a libraryof SNPs (based on dbSNP 137), motif instances (based onposition-weighted matrices discovered from ENCODEexperiments), enhancer annotations (adding 90 cell typesfrom the Roadmap Epigenome Mapping Consortium),and expression quantitative loci (eQTLs from the GTexeQTL browser [8]). rSNPBase [9] is a similar databasewhich curates and annotates regulatory SNPs. It uses datafrom genome-wide experiments from the ENCODE pro-ject to predict regulatory elements which are then used toannotate the rSNPs. These rSNPs are mapped to the genethat it may regulate by considering various regulationmechanisms like proximal/distal regulation and post-transcriptional regulation. It also takes into account thelinkage disequilibrium correlations between SNPs in orderto associate the regulatory element with a SNP-set as op-posed to a single SNP. Spatio-temporal and experimentaleQTL labels are also provided in rSNPBase annotations.The main limitation of both the above databases is that
Ltd. This is an Open Access article distributed under the terms of the Creativeommons.org/licenses/by/4.0), which permits unrestricted use, distribution, andiginal work is properly credited. The Creative Commons Public Domaing/publicdomain/zero/1.0/) applies to the data made available in this article,
Perera et al. Genome Biology 2014, 15:485 Page 2 of 13http://genomebiology.com/2014/15/10/485
they are only suitable for SNPs that have already beenidentified and catalogued. As such, they are not suitablefor the study of novel somatic mutations in non-codingregions.More recently, a number of tools have been developed
that can be used to interrogate the cis-regulatory potentialof novel non-coding variants in the human genome. Theseinclude RegulomeDB [10], Funseq [11] and GAWVA [12],all of which leverage a large number of ENCODE datasetsto infer the potential impact of a variant on the cis-regula-tion of a gene. RegulomeDB provides a heuristic scoringsystem which classifies the regulatory potential of pre-dicted regions in the genome. SNPs that fall within theseregions will be associated with this score as an indicationof its likelihood of affecting gene regulation. GAWVA usesa similar approach, but implements a computationalmodel trained using known non-coding disease SNPs toprovide a classifier score which can be used to indicate thecis-regulatory potential of novel SNPs and mutations. Fi-nally, Funseq leverages an observation that genomic re-gions with a high concentration of rare SNPs indicate ahigher degree of negative selection and are thus morelikely to be functionally important such that the functionof the region is more ‘sensitive’ to sequence variation [11].Therefore, in addition to using ENCODE datasets, Funseqdetermines whether a particular variant falls within ‘sensi-tive’ regulatory regions in the human genome.While all the above-mentioned methods can be used
for the annotation of somatic mutations, they are bettersuited for the annotation of germline variants as theylack the ability to assess mutations in a tissue/cell-spe-cific context. Unlike SNPs, which have the potential toexert a phenotype across all cell types, somatic muta-tions arising in cancer are confined to altering gene ex-pression within cancer cells that harbor the mutation.
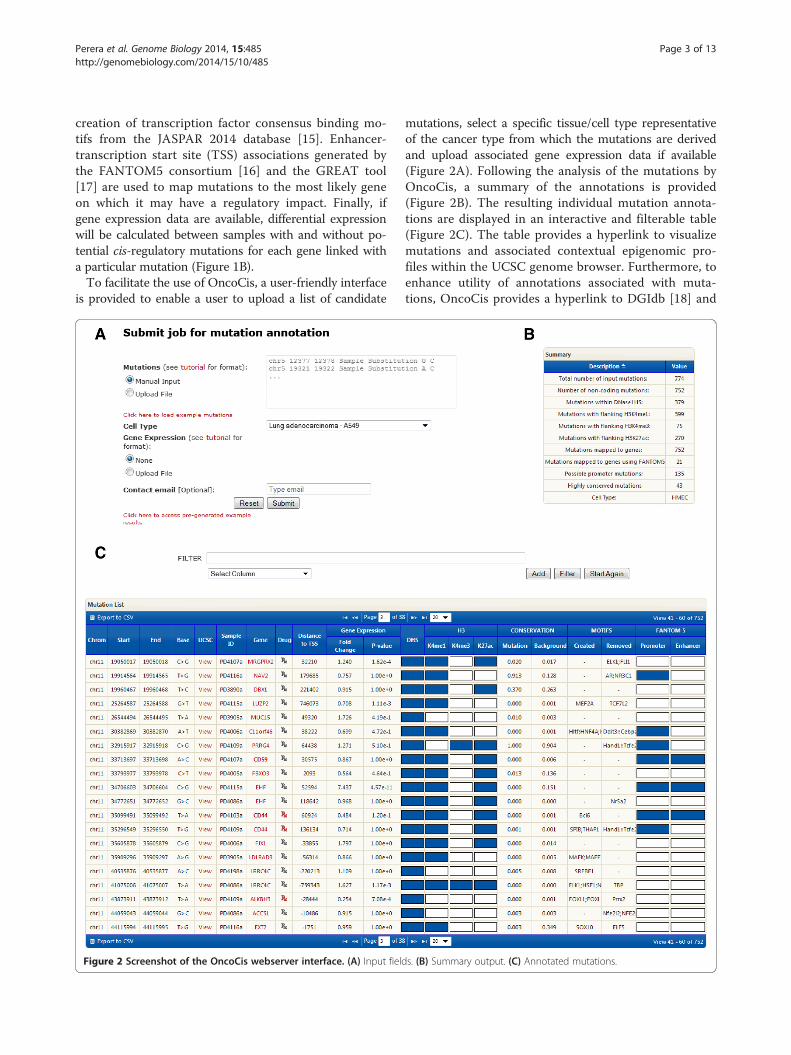
ACell/tissue type Cell line name DescriptionLung A549 Alveolar basal epithelial adenocarcinomProstate LNCaP Prostate epithelial adenocarcinomaLiver HepG2 Hepatocellular epithelial carcinomaBlood K562 Chronic myelogenous leukemiaBlood CD34 CD34+ mobilised hematopoeiticstem/proBreast HMEC Normal human mammary epithelial cellsMelanocytes Melano Normal foreskin melanocytesCervical HeLa Cervivalepithelial adenocarcinoma Colon HCT116 Colon epithelial carcinomaPancreas PANC-1 Pacreatic epithelioid carcinoma Astrocyte NHA Normal human astrocytesOsteoblast Osteo Normal human osteoblastsMesenchymal stem cell MSC Human mesenchymal stem cell, differenNeural progenitor cell NPC Human neural progenitor cells, differentiEmbryonic stem cell ESC Human embryonic stem cells, undifferen
Figure 1 Overview of OncoCis datasets and algorithms. (A) Summary o(B) Schematic diagram illustrating the mutation annotation process implemgene expression data are available. ES, embryonic stem; HS, hypersensitive;
As such, existing tools targeted at annotation of SNPsare of limited value to the end user seeking to prioritizethe impact of a mutation on the aberrant expression of agene in a particular tumor. Furthermore, other import-ant features for assessing the potential regulatory impactof mutations, including transcription factor binding motifcreation and the integration of matched gene expressiondata, are not available in existing tools.To this end, we have developed OncoCis, a user-friendly
webserver for researchers, to annotate cis-regulatorycancer mutations in a tissue/cell-specific manner. Import-antly, a set of stringent annotation methods, including lo-cation of flanking histone marks, motif matching andintegration of gene expression, have been developed to in-crease the accuracy of the mutation annotations. To valid-ate OncoCis, we first demonstrated its ability to correctlyannotate the well-studied TERT promoter mutations [13].We then compared OncoCis with RegulomeDB andFunseq in their ability to annotate non-coding mutationsderived from whole genome sequencing data from 17breast cancer samples [14]. Finally, using a specific ex-ample from the breast cancer dataset, we highlight theability to use OncoCis to identify potential cis-regulatorymutations for further analysis.
Results and discussionOverview of OncoCisOncoCis integrates publicly available datasets representinga wide range of cancer types from genome-wide chroma-tin accessibility and histone modification profiles obtainedfrom ENCODE [1] and the Human Epigenome Atlas [2]to identify mutations that occur within potential cis-regu-latory regions (see Figure 1A for a list of cell types). Thesemutations are further annotated with sequence conser-vation scores and searched for possible elimination or
List of mutations
Gene association
• FANTOM5 associations• GREAT
Cell type specificregulatory potential
• DNaseI HS• Histone marks• Alteration of TF motifs• Sequence conservation• FANTOM5 annotations
Differential gene expression*
Annotated mutations
B
a
genitor cells
tiated from ES cells ated from ES cells tiated
f representative cell/tissue types available for annotation of mutations.ented in OncoCis. *Differential gene expression is only performed ifTF, transcription factor.
Perera et al. Genome Biology 2014, 15:485 Page 3 of 13http://genomebiology.com/2014/15/10/485
creation of transcription factor consensus binding mo-tifs from the JASPAR 2014 database [15]. Enhancer-transcription start site (TSS) associations generated bythe FANTOM5 consortium [16] and the GREAT tool[17] are used to map mutations to the most likely geneon which it may have a regulatory impact. Finally, ifgene expression data are available, differential expressionwill be calculated between samples with and without po-tential cis-regulatory mutations for each gene linked witha particular mutation (Figure 1B).To facilitate the use of OncoCis, a user-friendly interface
is provided to enable a user to upload a list of candidate
Figure 2 Screenshot of the OncoCis webserver interface. (A) Input field
mutations, select a specific tissue/cell type representativeof the cancer type from which the mutations are derivedand upload associated gene expression data if available(Figure 2A). Following the analysis of the mutations byOncoCis, a summary of the annotations is provided(Figure 2B). The resulting individual mutation annota-tions are displayed in an interactive and filterable table(Figure 2C). The table provides a hyperlink to visualizemutations and associated contextual epigenomic pro-files within the UCSC genome browser. Furthermore, toenhance utility of annotations associated with muta-tions, OncoCis provides a hyperlink to DGIdb [18] and
s. (B) Summary output. (C) Annotated mutations.
Perera et al. Genome Biology 2014, 15:485 Page 4 of 13http://genomebiology.com/2014/15/10/485
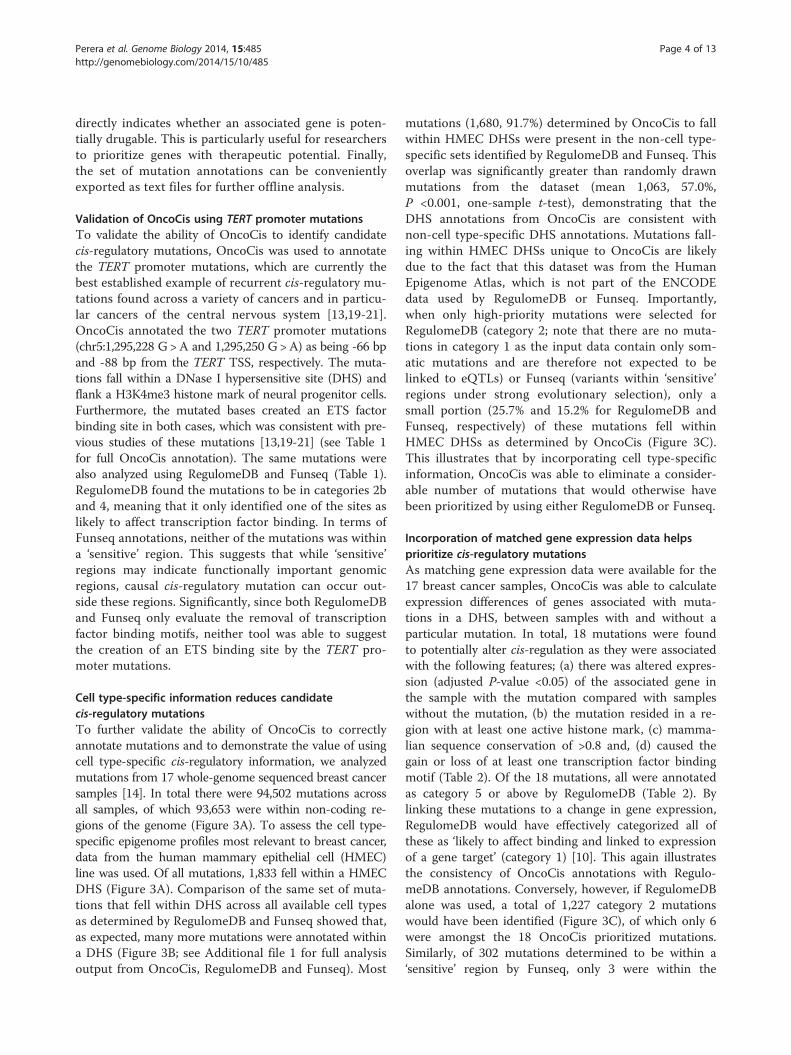
directly indicates whether an associated gene is poten-tially drugable. This is particularly useful for researchersto prioritize genes with therapeutic potential. Finally,the set of mutation annotations can be convenientlyexported as text files for further offline analysis.
Validation of OncoCis using TERT promoter mutationsTo validate the ability of OncoCis to identify candidatecis-regulatory mutations, OncoCis was used to annotatethe TERT promoter mutations, which are currently thebest established example of recurrent cis-regulatory mu-tations found across a variety of cancers and in particu-lar cancers of the central nervous system [13,19-21].OncoCis annotated the two TERT promoter mutations(chr5:1,295,228 G >A and 1,295,250 G >A) as being -66 bpand -88 bp from the TERT TSS, respectively. The muta-tions fall within a DNase I hypersensitive site (DHS) andflank a H3K4me3 histone mark of neural progenitor cells.Furthermore, the mutated bases created an ETS factorbinding site in both cases, which was consistent with pre-vious studies of these mutations [13,19-21] (see Table 1for full OncoCis annotation). The same mutations werealso analyzed using RegulomeDB and Funseq (Table 1).RegulomeDB found the mutations to be in categories 2band 4, meaning that it only identified one of the sites aslikely to affect transcription factor binding. In terms ofFunseq annotations, neither of the mutations was withina ‘sensitive’ region. This suggests that while ‘sensitive’regions may indicate functionally important genomicregions, causal cis-regulatory mutation can occur out-side these regions. Significantly, since both RegulomeDBand Funseq only evaluate the removal of transcriptionfactor binding motifs, neither tool was able to suggestthe creation of an ETS binding site by the TERT pro-moter mutations.
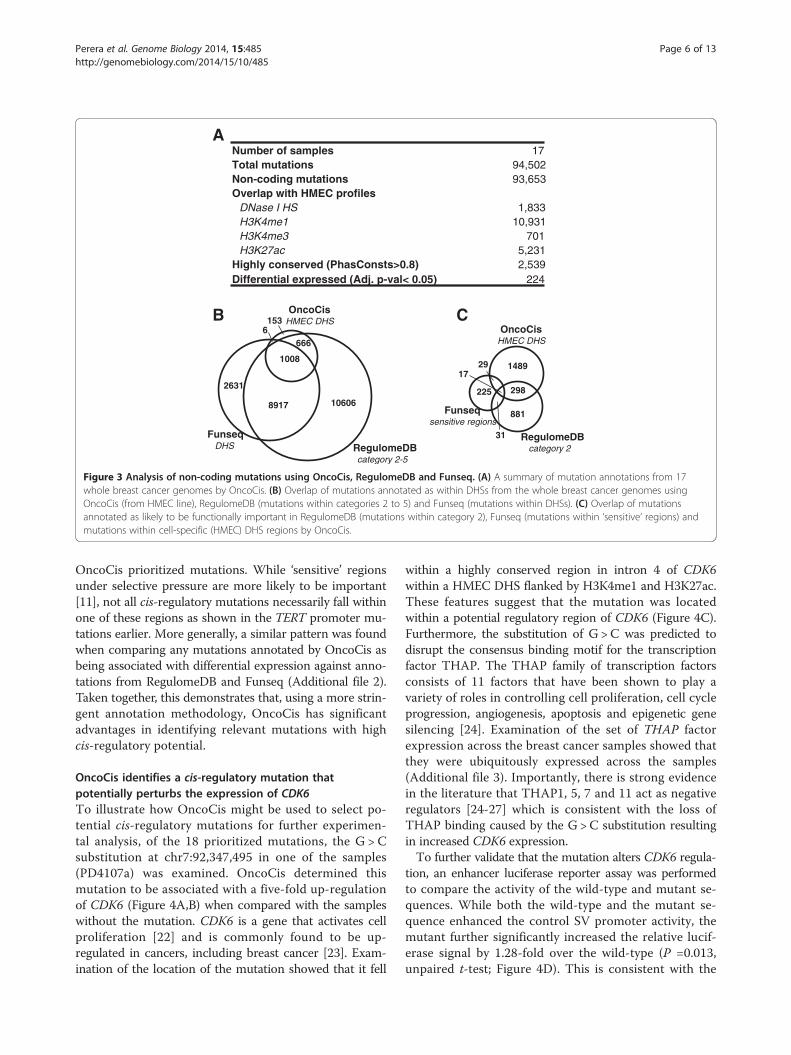
Cell type-specific information reduces candidatecis-regulatory mutationsTo further validate the ability of OncoCis to correctlyannotate mutations and to demonstrate the value of usingcell type-specific cis-regulatory information, we analyzedmutations from 17 whole-genome sequenced breast cancersamples [14]. In total there were 94,502 mutations acrossall samples, of which 93,653 were within non-coding re-gions of the genome (Figure 3A). To assess the cell type-specific epigenome profiles most relevant to breast cancer,data from the human mammary epithelial cell (HMEC)line was used. Of all mutations, 1,833 fell within a HMECDHS (Figure 3A). Comparison of the same set of muta-tions that fell within DHS across all available cell typesas determined by RegulomeDB and Funseq showed that,as expected, many more mutations were annotated withina DHS (Figure 3B; see Additional file 1 for full analysisoutput from OncoCis, RegulomeDB and Funseq). Most
mutations (1,680, 91.7%) determined by OncoCis to fallwithin HMEC DHSs were present in the non-cell type-specific sets identified by RegulomeDB and Funseq. Thisoverlap was significantly greater than randomly drawnmutations from the dataset (mean 1,063, 57.0%,P <0.001, one-sample t-test), demonstrating that theDHS annotations from OncoCis are consistent withnon-cell type-specific DHS annotations. Mutations fall-ing within HMEC DHSs unique to OncoCis are likelydue to the fact that this dataset was from the HumanEpigenome Atlas, which is not part of the ENCODEdata used by RegulomeDB or Funseq. Importantly,when only high-priority mutations were selected forRegulomeDB (category 2; note that there are no muta-tions in category 1 as the input data contain only som-atic mutations and are therefore not expected to belinked to eQTLs) or Funseq (variants within ‘sensitive’regions under strong evolutionary selection), only asmall portion (25.7% and 15.2% for RegulomeDB andFunseq, respectively) of these mutations fell withinHMEC DHSs as determined by OncoCis (Figure 3C).This illustrates that by incorporating cell type-specificinformation, OncoCis was able to eliminate a consider-able number of mutations that would otherwise havebeen prioritized by using either RegulomeDB or Funseq.
Incorporation of matched gene expression data helpsprioritize cis-regulatory mutationsAs matching gene expression data were available for the17 breast cancer samples, OncoCis was able to calculateexpression differences of genes associated with muta-tions in a DHS, between samples with and without aparticular mutation. In total, 18 mutations were foundto potentially alter cis-regulation as they were associatedwith the following features; (a) there was altered expres-sion (adjusted P-value <0.05) of the associated gene inthe sample with the mutation compared with sampleswithout the mutation, (b) the mutation resided in a re-gion with at least one active histone mark, (c) mamma-lian sequence conservation of >0.8 and, (d) caused thegain or loss of at least one transcription factor bindingmotif (Table 2). Of the 18 mutations, all were annotatedas category 5 or above by RegulomeDB (Table 2). Bylinking these mutations to a change in gene expression,RegulomeDB would have effectively categorized all ofthese as ‘likely to affect binding and linked to expressionof a gene target’ (category 1) [10]. This again illustratesthe consistency of OncoCis annotations with Regulo-meDB annotations. Conversely, however, if RegulomeDBalone was used, a total of 1,227 category 2 mutationswould have been identified (Figure 3C), of which only 6were amongst the 18 OncoCis prioritized mutations.Similarly, of 302 mutations determined to be within a‘sensitive’ region by Funseq, only 3 were within the

Table 1 OncoCis annotation of the TERT promoter mutations chr5:1,295,228 G > A and 1,295,250 G > A
Motifs Fantom5 RegulomeDB Funseq
Chromosome Position Gene Distance to TSS DHS H3K4me1 H3K4me3 H3K27ac Conservationmutated base
Created Removed Promoter Enhancer Category Sensitive?
Chr5 1,295,228 TERT -66 1 0 1 0 0.008 ELK1;ELF1;FLI1;ELK4;GABPA
TFAP2A 1 0 2b No
Chr5 1,295,250 TERT -88 1 0 1 0 0 ELK1;ELF1;FLI1;ELK4;GABPA
- 1 0 4 No
The category and whether the mutation falls within a ‘sensitive’ region as defined by RegulomeDB and Funseq, respectively, are also shown.
Pereraet
al.Genom
eBiology
2014,15:485Page
5of
13http://genom
ebiology.com/2014/15/10/485
A
B C
666
10606
153
RegulomeDBcategory 2-5
OncoCisHMEC DHS
FunseqDHS
8917
2631
6
1008
Funseqsensitive regions
1489
298
881
RegulomeDBcategory 2
OncoCisHMEC DHS
225
29
31
17
Number of samples 17Total mutations 94,502Non-coding mutations 93,653Overlap with HMEC profiles
DNase I HS 1,833H3K4me1 10,931H3K4me3 701H3K27ac 5,231
Highly conserved (PhasConsts>0.8) 2,539Differential expressed (Adj. p-val< 0.05) 224
Figure 3 Analysis of non-coding mutations using OncoCis, RegulomeDB and Funseq. (A) A summary of mutation annotations from 17whole breast cancer genomes by OncoCis. (B) Overlap of mutations annotated as within DHSs from the whole breast cancer genomes usingOncoCis (from HMEC line), RegulomeDB (mutations within categories 2 to 5) and Funseq (mutations within DHSs). (C) Overlap of mutationsannotated as likely to be functionally important in RegulomeDB (mutations within category 2), Funseq (mutations within ‘sensitive’ regions) andmutations within cell-specific (HMEC) DHS regions by OncoCis.
Perera et al. Genome Biology 2014, 15:485 Page 6 of 13http://genomebiology.com/2014/15/10/485
OncoCis prioritized mutations. While ‘sensitive’ regionsunder selective pressure are more likely to be important[11], not all cis-regulatory mutations necessarily fall withinone of these regions as shown in the TERT promoter mu-tations earlier. More generally, a similar pattern was foundwhen comparing any mutations annotated by OncoCis asbeing associated with differential expression against anno-tations from RegulomeDB and Funseq (Additional file 2).Taken together, this demonstrates that, using a more strin-gent annotation methodology, OncoCis has significantadvantages in identifying relevant mutations with highcis-regulatory potential.
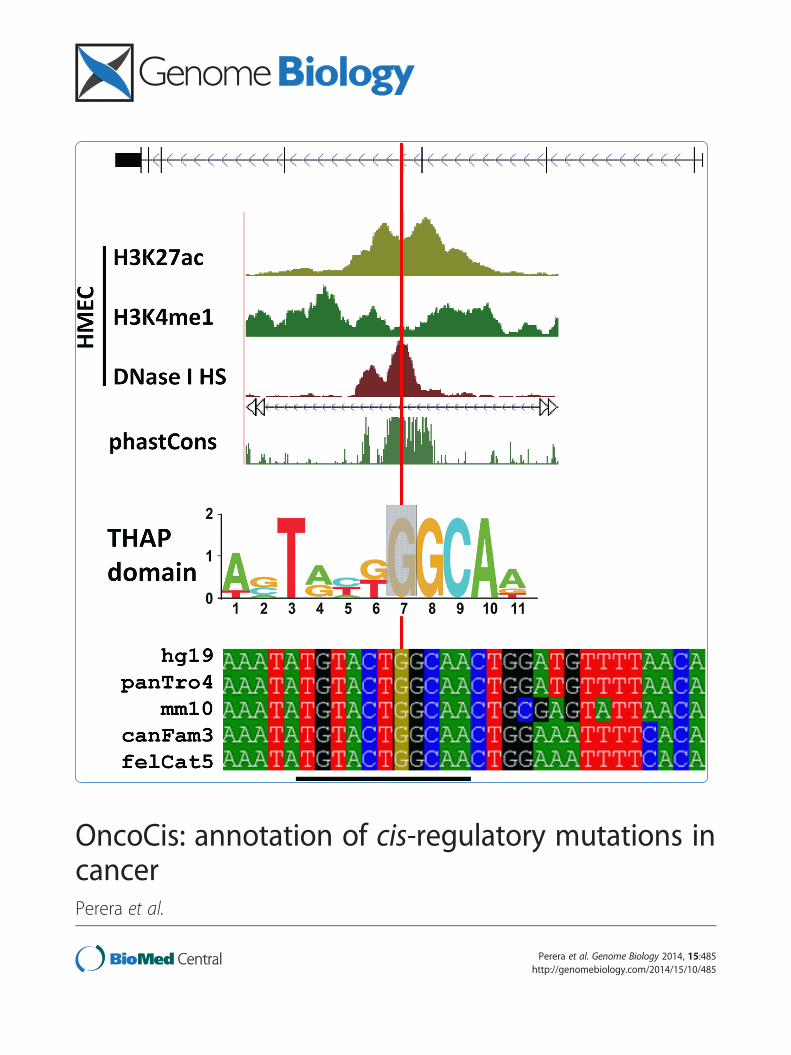
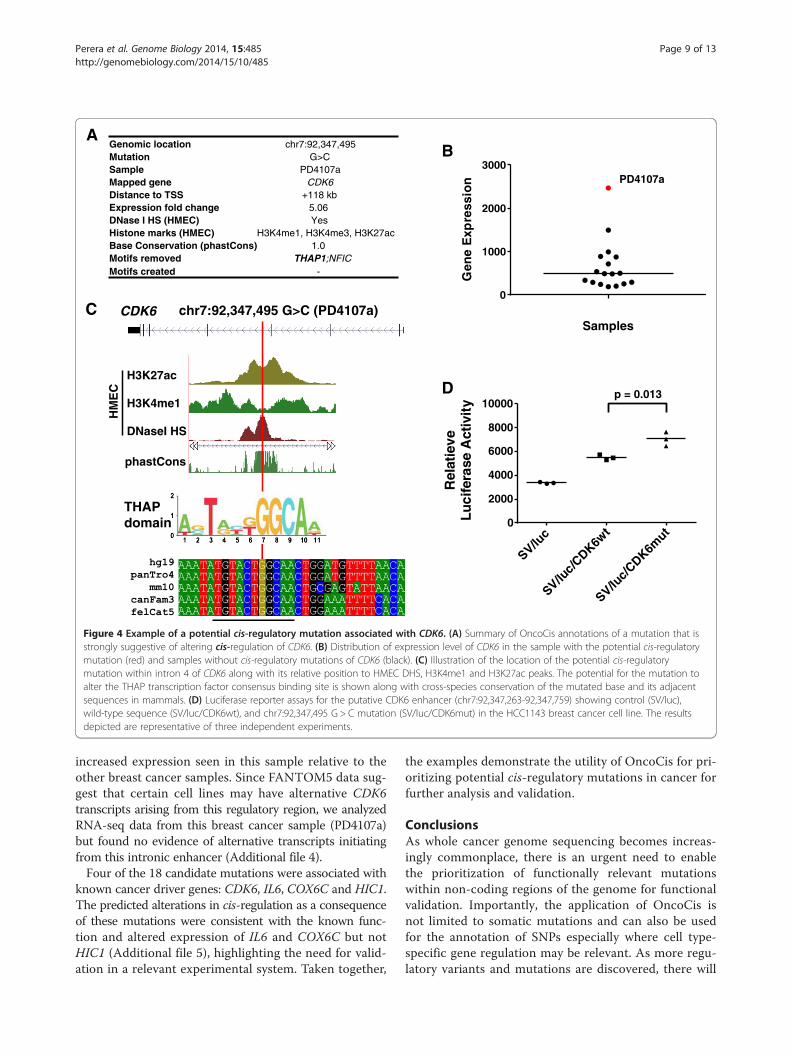
OncoCis identifies a cis-regulatory mutation thatpotentially perturbs the expression of CDK6To illustrate how OncoCis might be used to select po-tential cis-regulatory mutations for further experimen-tal analysis, of the 18 prioritized mutations, the G > Csubstitution at chr7:92,347,495 in one of the samples(PD4107a) was examined. OncoCis determined thismutation to be associated with a five-fold up-regulationof CDK6 (Figure 4A,B) when compared with the sampleswithout the mutation. CDK6 is a gene that activates cellproliferation [22] and is commonly found to be up-regulated in cancers, including breast cancer [23]. Exam-ination of the location of the mutation showed that it fell
within a highly conserved region in intron 4 of CDK6within a HMEC DHS flanked by H3K4me1 and H3K27ac.These features suggest that the mutation was locatedwithin a potential regulatory region of CDK6 (Figure 4C).Furthermore, the substitution of G > C was predicted todisrupt the consensus binding motif for the transcriptionfactor THAP. The THAP family of transcription factorsconsists of 11 factors that have been shown to play avariety of roles in controlling cell proliferation, cell cycleprogression, angiogenesis, apoptosis and epigenetic genesilencing [24]. Examination of the set of THAP factorexpression across the breast cancer samples showed thatthey were ubiquitously expressed across the samples(Additional file 3). Importantly, there is strong evidencein the literature that THAP1, 5, 7 and 11 act as negativeregulators [24-27] which is consistent with the loss ofTHAP binding caused by the G > C substitution resultingin increased CDK6 expression.To further validate that the mutation alters CDK6 regula-
tion, an enhancer luciferase reporter assay was performedto compare the activity of the wild-type and mutant se-quences. While both the wild-type and the mutant se-quence enhanced the control SV promoter activity, themutant further significantly increased the relative lucif-erase signal by 1.28-fold over the wild-type (P =0.013,unpaired t-test; Figure 4D). This is consistent with the
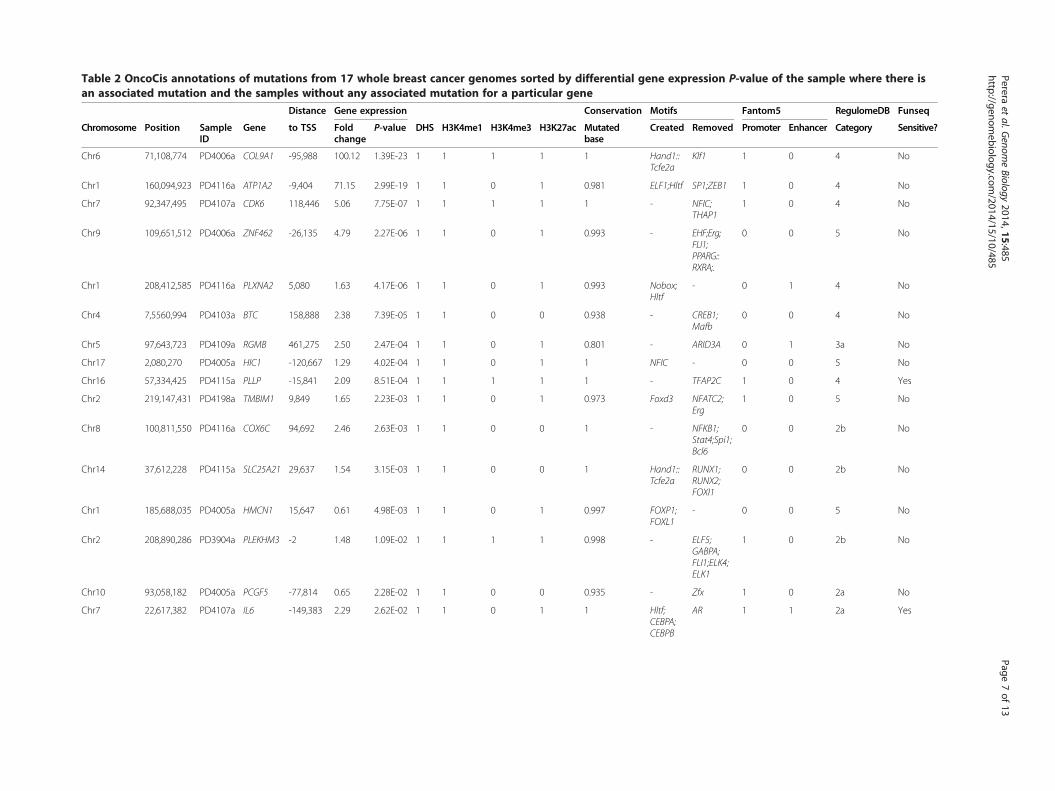
Table 2 OncoCis annotations of mutations from 17 whole breast cancer genomes sorted by differential gene expression P-value of the sample where there isan associated mutation and the samples without any associated mutation for a particular gene
Distance Gene expression Conservation Motifs Fantom5 RegulomeDB Funseq
Chromosome Position SampleID
Gene to TSS Foldchange
P-value DHS H3K4me1 H3K4me3 H3K27ac Mutatedbase
Created Removed Promoter Enhancer Category Sensitive?
Chr6 71,108,774 PD4006a COL9A1 -95,988 100.12 1.39E-23 1 1 1 1 1 Hand1::Tcfe2a
Klf1 1 0 4 No
Chr1 160,094,923 PD4116a ATP1A2 -9,404 71.15 2.99E-19 1 1 0 1 0.981 ELF1;Hltf SP1;ZEB1 1 0 4 No
Chr7 92,347,495 PD4107a CDK6 118,446 5.06 7.75E-07 1 1 1 1 1 - NFIC;THAP1
1 0 4 No
Chr9 109,651,512 PD4006a ZNF462 -26,135 4.79 2.27E-06 1 1 0 1 0.993 - EHF;Erg;FLI1;PPARG::RXRA;.
0 0 5 No
Chr1 208,412,585 PD4116a PLXNA2 5,080 1.63 4.17E-06 1 1 0 1 0.993 Nobox;Hltf
- 0 1 4 No
Chr4 7,5560,994 PD4103a BTC 158,888 2.38 7.39E-05 1 1 0 0 0.938 - CREB1;Mafb
0 0 4 No
Chr5 97,643,723 PD4109a RGMB 461,275 2.50 2.47E-04 1 1 0 1 0.801 - ARID3A 0 1 3a No
Chr17 2,080,270 PD4005a HIC1 -120,667 1.29 4.02E-04 1 1 0 1 1 NFIC - 0 0 5 No
Chr16 57,334,425 PD4115a PLLP -15,841 2.09 8.51E-04 1 1 1 1 1 - TFAP2C 1 0 4 Yes
Chr2 219,147,431 PD4198a TMBIM1 9,849 1.65 2.23E-03 1 1 0 1 0.973 Foxd3 NFATC2;Erg
1 0 5 No
Chr8 100,811,550 PD4116a COX6C 94,692 2.46 2.63E-03 1 1 0 0 1 - NFKB1;Stat4;Spi1;Bcl6
0 0 2b No
Chr14 37,612,228 PD4115a SLC25A21 29,637 1.54 3.15E-03 1 1 0 0 1 Hand1::Tcfe2a
RUNX1;RUNX2;FOXI1
0 0 2b No
Chr1 185,688,035 PD4005a HMCN1 15,647 0.61 4.98E-03 1 1 0 1 0.997 FOXP1;FOXL1
- 0 0 5 No
Chr2 208,890,286 PD3904a PLEKHM3 -2 1.48 1.09E-02 1 1 1 1 0.998 - ELF5;GABPA;FLI1;ELK4;ELK1
1 0 2b No
Chr10 93,058,182 PD4005a PCGF5 -77,814 0.65 2.28E-02 1 1 0 0 0.935 - Zfx 1 0 2a No
Chr7 22,617,382 PD4107a IL6 -149,383 2.29 2.62E-02 1 1 0 1 1 Hltf;CEBPA;CEBPB
AR 1 1 2a Yes
Pereraet
al.Genom
eBiology
2014,15:485Page
7of
13http://genom
ebiology.com/2014/15/10/485

Table 2 OncoCis annotations of mutations from 17 whole breast cancer genomes sorted by differential gene expression P-value of the sample where there isan associated mutation and the samples without any associated mutation for a particular gene (Continued)
Chr6 26,533,145 PD4192a HMGN4 5,426 0.49 2.62E-02 1 1 0 0 0.979 - Zfx 0 1 2b Yes
Chr22 31,644,327 PD4103a LIMK2 -36,078 0.79 3.43E-02 1 1 1 1 0.989 - Klf4;S ;SP1;K 5;Klf1;E 1
1 0 3a No
All mutations in the list are selected based on having a DHS, either a H3K4me1 or H3K4me3 histone mark, conservation (phastCons) >0.8 and the creation or rem val of at least one transcription factor binding motif.The category and whether the mutation falls within a ‘sensitive’ region as defined by RegulomeDB and Funseq, respectively, are also shown.
Pereraet
al.Genom
eBiology
2014,15:485Page
8of
13http://genom
ebiology.com/2014/15/10/485
P2LFLK
o
Samples
Gen
eE
xpre
ssio
n
0
1000
2000
3000PD4107a
AB
C
Genomic location chr7:92,347,495Mutation G>CSample PD4107aMapped gene CDK6Distance to TSS +118 kbExpression fold change 5.06DNase I HS (HMEC) YesHistone marks (HMEC) H3K4me1, H3K4me3, H3K27ac Base Conservation (phastCons) 1.0Motifs removed THAP1;NFICMotifs created -
H3K27ac
H3K4me1
DNaseI HS
phastCons
CDK6 chr7:92,347,495 G>C (PD4107a)
THAPdomain
HM
EC D
Rel
atie
veL
uci
fera
seA
ctiv
ity
SV/luc
SV/luc/C
DK6wt
SV/luc/
CDK6mut
0
2000
4000
6000
8000
10000p = 0.013
Figure 4 Example of a potential cis-regulatory mutation associated with CDK6. (A) Summary of OncoCis annotations of a mutation that isstrongly suggestive of altering cis-regulation of CDK6. (B) Distribution of expression level of CDK6 in the sample with the potential cis-regulatorymutation (red) and samples without cis-regulatory mutations of CDK6 (black). (C) Illustration of the location of the potential cis-regulatorymutation within intron 4 of CDK6 along with its relative position to HMEC DHS, H3K4me1 and H3K27ac peaks. The potential for the mutation toalter the THAP transcription factor consensus binding site is shown along with cross-species conservation of the mutated base and its adjacentsequences in mammals. (D) Luciferase reporter assays for the putative CDK6 enhancer (chr7:92,347,263-92,347,759) showing control (SV/luc),wild-type sequence (SV/luc/CDK6wt), and chr7:92,347,495 G > C mutation (SV/luc/CDK6mut) in the HCC1143 breast cancer cell line. The resultsdepicted are representative of three independent experiments.
Perera et al. Genome Biology 2014, 15:485 Page 9 of 13http://genomebiology.com/2014/15/10/485
increased expression seen in this sample relative to theother breast cancer samples. Since FANTOM5 data sug-gest that certain cell lines may have alternative CDK6transcripts arising from this regulatory region, we analyzedRNA-seq data from this breast cancer sample (PD4107a)but found no evidence of alternative transcripts initiatingfrom this intronic enhancer (Additional file 4).Four of the 18 candidate mutations were associated with
known cancer driver genes: CDK6, IL6, COX6C and HIC1.The predicted alterations in cis-regulation as a consequenceof these mutations were consistent with the known func-tion and altered expression of IL6 and COX6C but notHIC1 (Additional file 5), highlighting the need for valid-ation in a relevant experimental system. Taken together,
the examples demonstrate the utility of OncoCis for pri-oritizing potential cis-regulatory mutations in cancer forfurther analysis and validation.
ConclusionsAs whole cancer genome sequencing becomes increas-ingly commonplace, there is an urgent need to enablethe prioritization of functionally relevant mutationswithin non-coding regions of the genome for functionalvalidation. Importantly, the application of OncoCis isnot limited to somatic mutations and can also be usedfor the annotation of SNPs especially where cell type-specific gene regulation may be relevant. As more regu-latory variants and mutations are discovered, there will
Perera et al. Genome Biology 2014, 15:485 Page 10 of 13http://genomebiology.com/2014/15/10/485
be further potential to develop models for scoring andprioritizing cis-regulatory mutations. Taken together,OncoCis provides an avenue to uncover cis-regulatorymutations and it is hoped that in the process it will helpdiscover new non-coding cancer driver mutations.
Materials and methodsData sourcesChromatin accessibility data (DNase-seq) and histonemodification (ChIP-seq) data for each of the cell lineswere obtained from ENCODE [1] or the Human Epige-nome Atlas [2]. A summary of datasets and associatedaccessions used by OncoCis are listed in Additional file6. For datasets downloaded from ENCODE, broadpeaksof DNase-seq and histone ChIP-seq data are directlyused for annotation. For all other datasets, raw sequencesfiles in SRA format were obtained and converted to fastqformat using fastq-dump (version 2.3.2). Fastq files werealigned using BWA (version 0.7.5) [28] using default pa-rameters. For peak calling, the findPeaks tool within theHOMER suite [29] was used with the ‘style’ option setto ‘histone’.
DNase I hypersensitivity sites: DNase-seqOncoCis uses DNase-seq data to determine DHSs inorder to identify user defined mutations that fall withinchromatin accessible regions of the genome. DHS peaklists are defined as described above. OncoCis uses bed-tools intersect [30] to determine whether or not a muta-tion falls within a DHS.
Histone modifications: ChIP-seqOncoCis annotates whether user-defined mutations areadjacent to specific histone marks, specifically H3K4me1,H3K4me3 and H3K27ac, which are generally associatedwith enchancers, promoters and active cis-regulatoryregions, respectively [31]. In order to determine theoptimal region for search for histone marks flankingmutations, the distribution of histone ChIP-seq signalsadjacent to DHSs was analyzed. The analysis revealedthat the optimum region for searching for flanking his-tone marks is 150 to 500 bp on either side of the centerof a DHS (Additional file 7). As a result, mutations fall-ing within ±150 to 500 bp of a histone ChIP-seq peakare annotated as flanking the respective histone mark.For mutations that fall within a DHS, the center of theDHS peak is used to define the ±150 to 500 bp regionfor seeking the presence of a histone peak, otherwise,the ±150 to 500 bp region is defined from the locationof the mutation.
Transcription factor motif searchFor each mutation, both the wild-type and mutant DNAsequence are generated over a region of ±20 bp of the
mutation site. Each sequence is individually searched forknown consensus transcription factor binding motifsusing the Possum tool [32] against the JASPAR 2014database [15]. To increase the accuracy of the motifsearch, only mammalian transcription factors repre-sented by more than 20 sequences from the JASPARdatabase are used (171 in total). Possum predicts tran-scription factor binding sites in a DNA sequence usingposition-specific scoring matrices and calculates a log-likelihood ratio score for each transcription factor bind-ing sequence matrix model against the DNA sequencesuch that:
Score ¼ log2YW
k ¼ 1
q k; Lkð Þp Lkð Þ
� �
where W is the size of the motif, q(k,Lk) is the prob-ability of the nucleotide at Lk at position k of the matrixand p(Lk) is the background probability of base Lk. InOncoCis, a score cutoff of >5 is implemented (default ofPossum), Lk is set uniformly to ¼ and no pseudocountsare added to model matrices.In order to increase the stringency of potential motif
matches and to help users select mutations that are mostlikely to affect gene regulation, an additional filter wasused to select DNA sequences where all well conservedmotif positions (defined as those where a particular baseis present at >80% frequency) match perfectly to the queryDNA sequence. No significant correlation was found be-tween the numbers of motif matches and the number ofwell conserved positions within a motif (Additional file 8).The use of variation at well conserved motif bases as a cri-terion for identifying variants that affect cis-regulation wasused recently to discover a SNP that altered binding ofTP53, which is linked to increased cancer risk [33].Finally, the candidate transcription factors binding the
wild-type and mutant sequences are compared such thatwild-type-specific transcription factor binding motifs arereported as motifs removed and mutant specific transcrip-tion factor binding motifs are reported as motifs created.
Mapping mutations to genesThe mutations are mapped to the gene which it is mostlikely be affecting using a combination of FANTOM5enhancer-TSS interaction data [16] and predictions fromthe GREAT tool [17], which associates genomic locationswith genes based on proximity, but also incorporatesexperimental 3C chromosome conformation captureinformation where available. If a mutation falls withina FANTOM5-predicted enhancer which has an associ-ation with the TSS of a gene, the mutation will be mappedto that gene. Otherwise, the mutation will be mapped tothe closest gene within 1 Mbp using GREAT.
Perera et al. Genome Biology 2014, 15:485 Page 11 of 13http://genomebiology.com/2014/15/10/485
Conservation of mutated base(s)For all mutations, the phastCons score [34] from mam-mals is used for determining the conservation of themutated base in the case of substitutions and bases inthe case of deletions. For deletions, the reported conser-vation value is the average of the phastCons score acrossall deleted bases. For insertions, no conservation value isreported. A background mutation value is also calculatedby OncoCis using the average conservation value of allbases within ±20 bp of the mutation site.
Gene expression analysisIf gene expression data have been provided by the user,fold change and a P-value associated with that foldchange will be calculated for each gene that has been as-sociated with a mutation. For the computation of differ-ential gene expression, only mutations that have beenassociated with a gene but also falling within a DHS areevaluated. For a particular gene, all samples with a muta-tion within one DHS will be categorized as mutant sam-ples while the samples without any mutations withinthat DHS are categorized as non-mutant. The gene ex-pression level of each mutant will be compared with themedian of all non-mutant samples to calculate foldchange. A two-sided t-test is conducted between the ex-pression level of each mutant sample and non-mutantsamples to obtain a P-value for the change in gene ex-pression. A Bonferroni correction using the number ofDHS-associated mutations is finally applied to obtain afalse discovery rate-adjusted P-value. If the user has geneexpression data of additional normal (non-cancer) sam-ples, these can be also provided and will be automatic-ally categorized as additional non-mutant samples asthey will not be associated with any mutations.
FANTOM5 enhancer/promoter transcription start sitepredictionsThe mutations are further annotated with FANTOM5 en-hancer [16] and promoter TSS predictions [35] to provideadditional evidence for a mutation to affect gene cis-regu-lation. For OncoCis, global permissive promoter and en-hancer datasets were used because CAGE TSSs fromindividual cell lines/tissues only arise from active cis-regu-latory elements and cannot be used to identify promotersand enhancers that are poised or repressed [35]. Specific-ally, the enhancer dataset was obtained from [36] and thepromoter TSS dataset from [37]. All enhancer transcriptand promoter TSS predictions were extended by 500 bpin both directions, since FANTOM5 annotations providethe location of the transcript rather than the actual enhancer/promoter. Bedtools intersect [30] is used determine theoverlap.FANTOM5 enhancer and promoters have been shown
to be complementary to ENCODE regulatory datasets,
but is generally more stringent [35]. Across the breast can-cer mutation dataset, 238 out of 301 (79.1%) mutationswithin a DHS and flanking a H3K4me3 mark overlap witha FANTOM5 promoter, while 582 out of 1,490 (39.1%)mutations within a DHS and flanking a H3K4me1 markoverlap with a FANTOM5 enhancer. This is broadly inline with the finding that 30 to 40% of ENCODE TSS seg-ments overlap with FANTOM5 data [35].
Analysis of breast cancer mutations using OncoCis andcomparison with RegulomeDB and FunseqTo assess the function and annotations of OncoCis incomparison with RegulomeDB [10] and Funseq [11], mu-tations from 17 whole breast cancer genome sequencedsamples [14] with matching gene expression data wereused. RegulomeDB and Funseq were chosen as they arecurrently the only two tools which provide a webserverfor the annotation of novel mutations. For OncoCis, themutation list and gene expression datasets were uploadedto the webserver. HMECs were selected as the cell type.For RegulomeDB, the list of mutations was submitted tothe webserver in bed format (there are no further parame-ters required) and the full output of the results wasexported. For Funseq the list of mutations was also sub-mitted to the webserver in bed format with the option forminor allele frequency set to 0. The mutations annotationsfrom the three tools were compiled for further analysisand comparison (Additional file 1).To evaluate the significance of the overlap between
mutations within HMEC DHS regions from OncoCis incomparison with mutations within DHS annotations fromRegulomeDB and Funseq, a bootstrapping analysis wasperformed. To achieve this, 1,833 mutations (the totalnumber of mutations that were found to overlap withHMEC DHSs by OncoCis) were randomly selected fromthe full set of 93,459 non-coding mutations and theoverlap with the combined DHS annotations from Reg-ulomeDB and Funseq was assessed. This procedure wasrepeated 1,000 times to give an average overlap of 1,063mutations (standard deviation of 21) with RegulomeDBor Funseq, which is significantly less than the overlap of1,680 mutations (P <0.001, one sample t-test) also withDHS annotation by RegulomeDB or Funseq as shown inFigure 3B.
Luciferase report assayThe minus strand of a conserved DHS (chr7:92,347,263-92,347,759) flanking the chr7:92,347,495 G > C mutationwas synthesized as both wild-type (SV/luc/CDK6wt) andmutant (SV/luc/CDK6mut) versions using GeneArt Strings(Life Technologies, Mulgrave, VIC, Australia) and clonedinto the downstream multiple cloning site of pGL2P(Promega, Alexandria, NSW, Australia). HCC1143 breastcancer cells were cultured in RPMI1640 media supplemented

Perera et al. Genome Biology 2014, 15:485 Page 12 of 13http://genomebiology.com/2014/15/10/485
with 15% fetal bovine serum, HEPES, sodium pyruvate,glutamine, and penicillin/streptomycin. For transfec-tions, cells were seeded at 4 × 10⁵/well cells in six-wellplates and transfected the following day using Lipofecta-mine2000 (Life Technologies) with 2 μg of CDK6 re-porter construct or vector control (SV/luc) and 0.5 μgof pEFBOS LacZ. At least two separate experimentswere performed in triplicate wells. After 48 hours, cellswere lysed and luciferase and β-galactosidase activitywas assayed as described [38]. To control for transfec-tion efficiency, relative luciferase activity was calculatedas the ratio of luciferase to LacZ activity.
Webserver implementationOncoCis is implemented as a webserver at [39]. Thebackend application has been implemented using Java(1.6) with datasets stored in a MySQL database. PHPwas used to implement the front-end web interface. TheOncoCis standalone application with the source code isavailable at the server website.
Additional files
Additional file 1: Annotations of all non-coding mutations in the 17breast cancer samples using OncoCis, RegulomeDB and Funseq.
Additional file 2: Comparison of differential gene expression andtranscription factor binding site creation annotations in OncoCisand annotations from RegulomeDB and Funseq.
Additional file 3: Expression of THAP transcription factors acrossthe breast cancer samples.
Additional file 4: Analysis of RNA-seq data to identify potentialalternative TSS in CDK6.
Additional file 5: Examples of other candidate mutations from thebreast cancer dataset prioritised by OncoCis.
Additional file 6: Accession of datasets implement in OncoCis.
Additional file 7: Illustrating the distribution of histone profilesadjacent to DHSs.
Additional file 8: Analysis of the effect of number of wellconserved positions in motifs against its frequency of being foundto be created/removed.
Abbreviationsbp: base pair; DHS: DNase I hypersensitive site; eQTL: expression quantitativelocus; HMEC: human mammary epithelial cell; SNP: single-nucleotidepolymorphism; TSS: transcription start site.
Competing interestsThe authors declare no competing financial interests.
Authors’ contributionsDP developed and implemented the method, performed the analysis anddrafted the manuscript. DC implemented the webserver and contributed tothe development of the method. JAIT and RCP performed reporter assays.AS performed RNA-seq data analysis. DB contributed to the development ofthe method. PJC contributed datasets and conceptualization of the project.JEP and JWHW contributed to the development of the method, dataanalysis, manuscript writing and jointly directed the project. All authors readand approved the final manuscript.
AcknowledgementsJWHW is supported by an Australian Research Council Future Fellowship(FT130100096). DB is supported by a National Health and Medical ResearchCouncil Early Career Fellowship (APP1073768). This work was funded by theCancer Institute NSW (to JWHW), Cure Cancer Australia Foundation (toJWHW) and the National Health and Medical Research Council (to JEP),Australia.
Author details1Prince of Wales Clinical School and Lowy Cancer Research Centre, UNSWAustralia, Sydney 2052, Australia. 2Cancer Genome Project, Wellcome TrustSanger Institute, Hinxton CB10 1SA, UK. 3Department of Haematology,Addenbrooke’s Hospital, Cambridge CB2 0QQ, UK. 4Department ofHaematology, Prince of Wales Hospital, Sydney 2031, Australia.
Received: 25 June 2014 Accepted: 1 October 2014
References1. Bernstein BE, Birney E, Dunham I, Green ED, Gunter C, Snyder M: An
integrated encyclopedia of DNA elements in the human genome. Nature2012, 489:57–74.
2. Bernstein BE, Stamatoyannopoulos JA, Costello JF, Ren B, Milosavljevic A,Meissner A, Kellis M, Marra MA, Beaudet AL, Ecker JR, Farnham PJ, Hirst M,Lander ES, Mikkelsen TS, Thomson JA: The NIH Roadmap EpigenomicsMapping Consortium. Nat Biotechnol 2010, 28:1045–1048.
3. Adzhubei IA, Schmidt S, Peshkin L, Ramensky VE, Gerasimova A, Bork P,Kondrashov AS, Sunyaev SR: A method and server for predictingdamaging missense mutations. Nat Methods 2010, 7:248–249.
4. Cooper GM, Stone EA, Asimenos G, Green ED, Batzoglou S, Sidow A:Distribution and intensity of constraint in mammalian genomicsequence. Genome Res 2005, 15:901–913.
5. Kircher M, Witten DM, Jain P, O'Roak BJ, Cooper GM, Shendure J: A generalframework for estimating the relative pathogenicity of human geneticvariants. Nat Genet 2014, 46:310–315.
6. Ng PC, Henikoff S: SIFT: Predicting amino acid changes that affect proteinfunction. Nucleic Acids Res 2003, 31:3812–3814.
7. Ward LD, Kellis M: HaploReg: a resource for exploring chromatin states,conservation, and regulatory motif alterations within sets of geneticallylinked variants. Nucleic Acids Res 2012, 40:D930–D934.
8. Lonsdale J, Thomas J, Salvatore M, Phillips R, Lo E, Shad S, Hasz R, Walters G,Garcia F, Young N, Foster B, Moser M, Karasik E, Gillard B, Ramsey K, Sullivan S,Bridge J, Magazine H, Syron J, Fleming J, Siminoff L, Traino H, Mosavel M,Barker L, Jewell S, Rohrer D, Maxim D, Filkins D, Harbach P, Cortadillo E, et al:The Genotype-Tissue Expression (GTEx) project. Nat Genet 2013, 45:580–585.
9. Guo L, Du Y, Chang S, Zhang K, Wang J: rSNPBase: a database for curatedregulatory SNPs. Nucleic Acids Res 2014, 42:D1033–D1039.
10. Boyle AP, Hong EL, Hariharan M, Cheng Y, Schaub MA, Kasowski M,Karczewski KJ, Park J, Hitz BC, Weng S, Cherry JM, Snyder M: Annotation offunctional variation in personal genomes using RegulomeDB. GenomeRes 2012, 22:1790–1797.
11. Khurana E, Fu Y, Colonna V, Mu XJ, Kang HM, Lappalainen T, Sboner A,Lochovsky L, Chen J, Harmanci A, Das J, Abyzov A, Balasubramanian S,Beal K, Chakravarty D, Challis D, Chen Y, Clarke D, Clarke L, Cunningham F,Evani US, Flicek P, Fragoza R, Garrison E, Gibbs R, Gumus ZH, Herrero J,Kitabayashi N, Kong Y, Lage K, et al: Integrative annotation of variantsfrom 1092 humans: application to cancer genomics. Science 2013,342:1235587.
12. Ritchie GR, Dunham I, Zeggini E, Flicek P: Functional annotation ofnoncoding sequence variants. Nat Methods 2014,11:294–296.
13. Huang FW, Hodis E, Xu MJ, Kryukov GV, Chin L, Garraway LA: Highlyrecurrent TERT promoter mutations in human melanoma. Science 2013,339:957–959.
14. Nik-Zainal S, Alexandrov LB, Wedge DC, Van Loo P, Greenman CD, Raine K,Jones D, Hinton J, Marshall J, Stebbings LA, Menzies A, Martin S, Leung K,Chen L, Leroy C, Ramakrishna M, Rance R, Lau KW, Mudie LJ, Varela I,McBride DJ, Bignell GR, Cooke SL, Shlien A, Gamble J, Whitmore I, MaddisonM, Tarpey PS, Davies HR, Papaemmanuil E, et al: Mutational processesmolding the genomes of 21 breast cancers. Cell 2012, 149:979–993.
Perera et al. Genome Biology 2014, 15:485 Page 13 of 13http://genomebiology.com/2014/15/10/485
15. Mathelier A, Zhao X, Zhang AW, Parcy F, Worsley-Hunt R, Arenillas DJ,Buchman S, Chen CY, Chou A, Ienasescu H, Lim J, Shyr C, Tan G, Zhou M,Lenhard B, Sandelin A, Wasserman WW: JASPAR 2014: an extensivelyexpanded and updated open-access database of transcription factorbinding profiles. Nucleic Acids Res 2014, 42:D142–D147.
16. Andersson R, Gebhard C, Miguel-Escalada I, Hoof I, Bornholdt J, Boyd M,Chen Y, Zhao X, Schmidl C, Suzuki T, Ntini E, Arner E, Valen E, Li K,Schwarzfischer L, Glatz D, Raithel J, Lilje B, Rapin N, Bagger FO, Jorgensen M,Andersen PR, Bertin N, Rackham O, Burroughs AM, Baillie JK, Ishizu Y,Shimizu Y, Furuhata E, Maeda S, et al: An atlas of active enhancers acrosshuman cell types and tissues. Nature 2014, 507:455–461.
17. McLean CY, Bristor D, Hiller M, Clarke SL, Schaar BT, Lowe CB, Wenger AM,Bejerano G: GREAT improves functional interpretation of cis-regulatoryregions. Nat Biotechnol 2010, 28:495–501.
18. Griffith M, Griffith OL, Coffman AC, Weible JV, McMichael JF, Spies NC, Koval J,Das I, Callaway MB, Eldred JM, Miller CA, Subramanian J, Govindan R, Kumar RD,Bose R, Ding L, Walker JR, Larson DE, Dooling DJ, Smith SM, Ley TJ, Mardis ER,Wilson RK: DGIdb: mining the druggable genome. Nat Methods 2013,10:1209–1210.
19. Horn S, Figl A, Rachakonda PS, Fischer C, Sucker A, Gast A, Kadel S, Moll I,Nagore E, Hemminki K, Schadendorf D, Kumar R: TERT promoter mutationsin familial and sporadic melanoma. Science 2013, 339:959–961.
20. Killela PJ, Reitman ZJ, Jiao Y, Bettegowda C, Agrawal N, Diaz LA Jr, FriedmanAH, Friedman H, Gallia GL, Giovanella BC, Grollman AP, He TC, He Y, HrubanRH, Jallo GI, Mandahl N, Meeker AK, Mertens F, Netto GJ, Rasheed BA,Riggins GJ, Rosenquist TA, Schiffman M, Shih Ie M, Theodorescu D,Torbenson MS, Velculescu VE, Wang TL, Wentzensen N, Wood LD, et al:TERT promoter mutations occur frequently in gliomas and a subset oftumors derived from cells with low rates of self-renewal. Proc Natl AcadSci U S A 2013, 110:6021–6026.
21. Vinagre J, Almeida A, Populo H, Batista R, Lyra J, Pinto V, Coelho R, CelestinoR, Prazeres H, Lima L, Melo M, da Rocha AG, Preto A, Castro P, Castro L,Pardal F, Lopes JM, Santos LL, Reis RM, Cameselle-Teijeiro J, Sobrinho-Simoes M, Lima J, Maximo V, Soares P: Frequency of TERT promotermutations in human cancers. Nat Commun 2013, 4:2185.
22. Lim S, Kaldis P: Cdks, cyclins and CKIs: roles beyond cell cycle regulation.Development 2013, 140:3079–3093.
23. Santarius T, Shipley J, Brewer D, Stratton MR, Cooper CS: A census ofamplified and overexpressed human cancer genes. Nat Rev Cancer 2010,10:59–64.
24. Roussigne M, Kossida S, Lavigne AC, Clouaire T, Ecochard V, Glories A,Amalric F, Girard JP: The THAP domain: a novel protein motif withsimilarity to the DNA-binding domain of P element transposase. TrendsBiochem Sci 2003, 28:66–69.
25. Balakrishnan MP, Cilenti L, Ambivero C, Goto Y, Takata M, Turkson J, Li XS,Zervos AS: THAP5 is a DNA-binding transcriptional repressor that isregulated in melanoma cells during DNA damage-induced cell death.Biochem Biophys Res Commun 2011, 404:195–200.
26. Macfarlan T, Kutney S, Altman B, Montross R, Yu J, Chakravarti D: HumanTHAP7 is a chromatin-associated, histone tail-binding protein thatrepresses transcription via recruitment of HDAC3 and nuclear hormonereceptor corepressor. J Biol Chem 2005, 280:7346–7358.
27. Parker JB, Palchaudhuri S, Yin H, Wei J, Chakravarti D: A transcriptionalregulatory role of the THAP11-HCF-1 complex in colon cancer cellfunction. Mol Cell Biol 2012, 32:1654–1670.
28. Li H, Durbin R: Fast and accurate short read alignment with Burrows-Wheeler transform. Bioinformatics 2009, 25:1754–1760.
29. Heinz S, Benner C, Spann N, Bertolino E, Lin YC, Laslo P, Cheng JX, Murre C,Singh H, Glass CK: Simple combinations of lineage-determining transcriptionfactors prime cis-regulatory elements required for macrophage and B cellidentities. Mol Cell 2010, 38:576–589.
30. Quinlan AR, Hall IM: BEDTools: a flexible suite of utilities for comparinggenomic features. Bioinformatics 2010, 26:841–842.
31. Barski A, Cuddapah S, Cui K, Roh TY, Schones DE, Wang Z, Wei G, Chepelev I,Zhao K: High-resolution profiling of histone methylations in the humangenome. Cell 2007, 129:823–837.
32. Haverty PM, Hansen U, Weng Z: Computational inference oftranscriptional regulatory networks from expression profiling andtranscription factor binding site identification. Nucleic Acids Res 2004,32:179–188.
33. Zeron-Medina J, Wang X, Repapi E, Campbell MR, Su D, Castro-Giner F,Davies B, Peterse EF, Sacilotto N, Walker GJ, Terzian T, Tomlinson IP, Box NF,Meinshausen N, De Val S, Bell DA, Bond GL: A polymorphic p53 responseelement in KIT ligand influences cancer risk and has undergone naturalselection. Cell 2013, 155:410–422.
34. Siepel A, Bejerano G, Pedersen JS, Hinrichs AS, Hou M, Rosenbloom K,Clawson H, Spieth J, Hillier LW, Richards S, Weinstock GM, Wilson RK,Gibbs RA, Kent WJ, Miller W, Haussler D: Evolutionarily conserved elementsin vertebrate, insect, worm, and yeast genomes. Genome Res 2005,15:1034–1050.
35. Forrest AR, Consortium TF, PMI TR, (DGT) C: A promoter-level mammalianexpression atlas. Nature 2014, 507:462–470.
36. Fantom 5 enhancers [http://fantom.gsc.riken.jp/5/datafiles/latest/extra/Enhancers/hg19_enhancers.bed.gz]
37. Fantom 5 promoters [http://fantom.gsc.riken.jp/5/datafiles/latest/extra/TSS_classifier/TSS_human.bed.gz]
38. Diffner E, Beck D, Gudgin E, Thoms JA, Knezevic K, Pridans C, Foster S,Goode D, Lim WK, Boelen L, Metzeler KH, Micklem G, Bohlander SK, Buske C,Burnett A, Ottersbach K, Vassiliou GS, Olivier J, Wong JW, Gottgens B, Huntly BJ,Pimanda JE: Activity of a heptad of transcription factors is associated withstem cell programs and clinical outcome in acute myeloid leukemia.Blood 2013, 121:2289–2300.
39. OncoCis webserver [https://powcs.med.unsw.edu.au/OncoCis/]
doi:10.1186/s13059-014-0485-0Cite this article as: Perera et al.: OncoCis: annotation of cis-regulatorymutations in cancer. Genome Biology 2014 15:485.
Submit your next manuscript to BioMed Centraland take full advantage of:
• Convenient online submission
• Thorough peer review
• No space constraints or color figure charges
• Immediate publication on acceptance
• Inclusion in PubMed, CAS, Scopus and Google Scholar
• Research which is freely available for redistribution
Submit your manuscript at www.biomedcentral.com/submit