Airway segmentation in mouse models of lung disease - DADUN
17
Airway segmentation and analysis for the study of mouse models of lung disease using micro- CT This article has been downloaded from IOPscience. Please scroll down to see the full text article. 2009 Phys. Med. Biol. 54 7009 (http://iopscience.iop.org/0031-9155/54/22/017) Download details: IP Address: 159.237.12.65 The article was downloaded on 05/10/2010 at 11:27 Please note that terms and conditions apply. View the table of contents for this issue, or go to the journal homepage for more Home Search Collections Journals About Contact us My IOPscience
-
Upload
khangminh22 -
Category
Documents
-
view
0 -
download
0
Transcript of Airway segmentation in mouse models of lung disease - DADUN

Airway segmentation and analysis for the study of mouse models of lung disease using micro-
CT
This article has been downloaded from IOPscience. Please scroll down to see the full text article.
2009 Phys. Med. Biol. 54 7009
(http://iopscience.iop.org/0031-9155/54/22/017)
Download details:
IP Address: 159.237.12.65
The article was downloaded on 05/10/2010 at 11:27
Please note that terms and conditions apply.
View the table of contents for this issue, or go to the journal homepage for more
Home Search Collections Journals About Contact us My IOPscience
IOP PUBLISHING PHYSICS IN MEDICINE AND BIOLOGY
Phys. Med. Biol. 54 (2009) 7009–7024 doi:10.1088/0031-9155/54/22/017
Airway segmentation and analysis for the study ofmouse models of lung disease using micro-CT
X Artaechevarria1, D Perez-Martın1, M Ceresa1, G de Biurrun2,D Blanco2, L M Montuenga2, B van Ginneken3, C Ortiz-de-Solorzano1
and A Munoz-Barrutia1
1 Cancer Imaging Laboratory, Center for Applied Medical Research, 31008 Pamplona, Spain2 Biomarkers Laboratory, Center for Applied Medical Research, University of Navarra, 31008Pamplona, Spain3 Image Sciences Institute, 3584CX Utrecht, The Netherlands
E-mail: [email protected]
Received 13 July 2009, in final form 14 October 2009Published 4 November 2009Online at stacks.iop.org/PMB/54/7009
AbstractAnimal models of lung disease are gaining importance in understanding theunderlying mechanisms of diseases such as emphysema and lung cancer.Micro-CT allows in vivo imaging of these models, thus permitting thestudy of the progression of the disease or the effect of therapeutic drugs inlongitudinal studies. Automated analysis of micro-CT images can be helpfulto understand the physiology of diseased lungs, especially when combined withmeasurements of respiratory system input impedance. In this work, we presenta fast and robust murine airway segmentation and reconstruction algorithm.The algorithm is based on a propagating fast marching wavefront that, as itgrows, divides the tree into segments. We devised a number of specific rulesto guarantee that the front propagates only inside the airways and to avoidleaking into the parenchyma. The algorithm was tested on normal mice, amouse model of chronic inflammation and a mouse model of emphysema. Acomparison with manual segmentations of two independent observers showsthat the specificity and sensitivity values of our method are comparable to theinter-observer variability, and radius measurements of the mainstem bronchireveal significant differences between healthy and diseased mice. Combiningmeasurements of the automatically segmented airways with the parameters ofthe constant phase model provides extra information on how disease affectslung function.
1. Introduction
High-resolution micro-computed tomography (micro-CT) is an excellent tool to study rodentmodels of lung disease because of the inherent x-ray absorption contrast between tissue and air
0031-9155/09/227009+16$30.00 © 2009 Institute of Physics and Engineering in Medicine Printed in the UK 7009
7010 X Artaechevarria et al
that exists in the lungs (Ford et al 2007, Johnson 2007). This technology has been successfullyused to study different disease models such as lung cancer and emphysema (De Clerck et al2004, Postnov et al 2005, Froese et al 2007). Furthermore, its applications are likely to growwith the advent and improvement of flat-panel detectors.
Latest research on lung cancer points toward common initiation mechanisms in lungcancer, chronic obstructive pulmonary disease (COPD) and inflammatory lung disease (deTorres et al 2007, Houghton et al 2008, Cassidy et al 2007). In this scenario, the analysis ofbiologically relevant small animal models will be critical to gain knowledge on the specifics ofeach disease and the relationships existing between them. The widespread use of micro-CT inlung disease-related animal studies raises the need for precise and robust automated analysisand quantification tools for micro-CT images. Standardized automated techniques are thusrequired to allow for interlaboratory comparisons and reproducible validation of the results.
Segmenting the airways is required by most automatic lung analysis algorithms, especiallyin mice micro-CT images, due to the relatively large volume occupied by the airways. It is wellknown that the functionality of central airways and lung peripheral areas varies considerably,and the morphological effects of a great number of lung pathologies are different in theairways and the parenchyma. Separating airways from the rest of the lung is thus of theutmost importance when analyzing a disease (such as emphysema, chronic inflammation orcancer) which affects lung density differentially. Moreover, the analysis of segmented airwaysmay be interesting in itself to study airway-specific morphological changes such as stenosis,bronchiectasis, etc. Finally, the airways can be used as a reference for image registration infollow-up studies or for atlas-based segmentation of the lungs, lobes and pulmonary segments.
To the best of our knowledge, only two airway segmentation methods in micro-CT imageshave been reported that are of use in mice. Chaturvedi and Lee (2005) segmented silicon castsof excised mice lungs using an interactive region growing algorithm. More relevant to thepresent work, Shi et al (2007) reported a fully automatic algorithm to segment in vivo imagesof healthy mice, acquired with an iso-pressure breath hold protocol (Namati et al 2006). Thisalgorithm works by searching airway lumens in 2D transversal slices that are then used toreconstruct the full 3D tree. The main drawback of this method is that it is based on the searchof candidates in 2D, which may lead to problems due to the high variability of the shape ofthe airway lumens as seen in transversal slices. Moreover, reported computation times werefairly high (about 30 min for each scan).
Due to scarce previous work on mouse airway segmentation, it is worth reviewing the mostrelevant approaches that exist for segmenting the human airways in CT images. Schlathoelteret al (2002) introduced an algorithm for simultaneous segmentation and reconstruction of theairways. This algorithm was based on a propagating front that divides the tree into branchesduring segmentation. The framework was extended and generalized in a subsequent work byBulow et al (2004). More recently, van Ginneken et al (2008) also used the framework forhuman airway segmentation with a multi-threshold approach to increase robustness. Kiralyet al (2002) compared two different methods: an adaptive region growing algorithm and analgorithm that combined region growing and mathematical morphology. Their conclusionwas that the region growing method was faster than the hybrid method, but also slightly lessaccurate. Aykac et al (2003) used a two-step approach. In a first step, candidate airways wereidentified on transversal slices using grayscale morphological reconstruction. In a second step,valid candidates were connected to build a 3D airway tree. Fetita et al (2004) also employedmathematical morphology to obtain a first approximation of the airways. The morphologicaloperator worked in 3D and was specifically devised for this purpose. An energy-minimizingreconstruction algorithm was used to build the final airway tree. The work by Tschirren et al(2005) was based on fuzzy connectivity. They made use of small adaptive regions of interest
Airway segmentation in mouse models of lung disease 7011
around the already segmented airway areas. Thus, the algorithm adapted to local imagecharacteristics, leaks were detected early and the computing time was reduced. In a recentwork, Graham et al (2008) present a method that can be summarized in three main steps. In thefirst step, a conservative segmentation of the major airways is obtained via 3D region growingon heavily smoothed data. Then, possible branch segments are detected and connected toeach other by nonlinear filtering and surface interpolation. The final segmentation is obtainedusing a global graph partitioning algorithm, which connects the valid branch segments to themajor airways.
The main reason that prevents a direct translation of these algorithms to mice micro-CTdata is the low signal-to-noise ratio (SNR) of the images, caused by the required small voxelsize and the limitation on radiation dose imposed by the in vivo studies. In particular, followingthe simple model assumptions from Ford et al (2003), a reduction of one order of magnitudein voxel size (0.5 mm in CT to 50 μm in micro-CT) implies an increase of two orders ofmagnitude in the variance of the linear attenuation coefficient, if the rest of parameters remainunchanged.
Taking this into account, we decided to develop the flexible segmentation andreconstruction framework first reported by Schlathoelter et al (2002). This framework hasmultiple advantages. First, it allows for simultaneous segmentation and reconstruction of tree-like structures. Second, the topological and morphological information from the segmentedtree can be used to guide the segmentation of the remaining branches. Third, its modularconfiguration allows for easy introduction of application-specific segmentation rules. In fact,one of the major contributions of our work is the use of new features when compared to thosein the previously reported applications of the framework, to adapt to the low SNR and thespecial morphology of the mice airways.
To complete the morphological information provided by the image-based measurements,we use respiratory system input impedance measurements and the constant phase modelparameters, which have been widely used to assess respiratory mechanics in multiple animalmodels (Hantos et al 1992, Collins et al 2003, Tomioka et al 2002). The combination of micro-CT imaging and constant phase model parameters has also been used to analyze animal modelsof lung disease before. In particular, Lundblad et al (2007) qualitatively analyzed ex vivo micro-CT images in a mouse model of allergical inflammation and combined it with measurementsof tissue elastance. In this work, we propose to use quantitative airway measurements sincethis approach is likely to provide valuable information to better understand the morphologyand function of lungs affected by diseases such as emphysema and inflammation.
The rest of the article is structured as follows. In section 2, we briefly summarize theairway segmentation framework and give details about the new features we have introduced.In section 3, the image acquisition protocol, which includes the respiratory system inputimpedance measurement, and the airway segmentation validation experiments are detailed.Results are presented in section 4. A final discussion (section 5) concludes the article.
2. Methods
2.1. Prefiltering
Micro-CT images contain high levels of noise. This justifies the need for a filtering stepbefore the analysis. To this end, we used a 3D grayscale closing by reconstruction filter witha spherical structuring element of radius 1 voxel (Vincent 1993). The 2D version of this filterwas reported to yield positive results in the previous work by Shi et al (2007). This filterincreases the contrast of the darkest regions of the image while preserving the shape of the
7012 X Artaechevarria et al
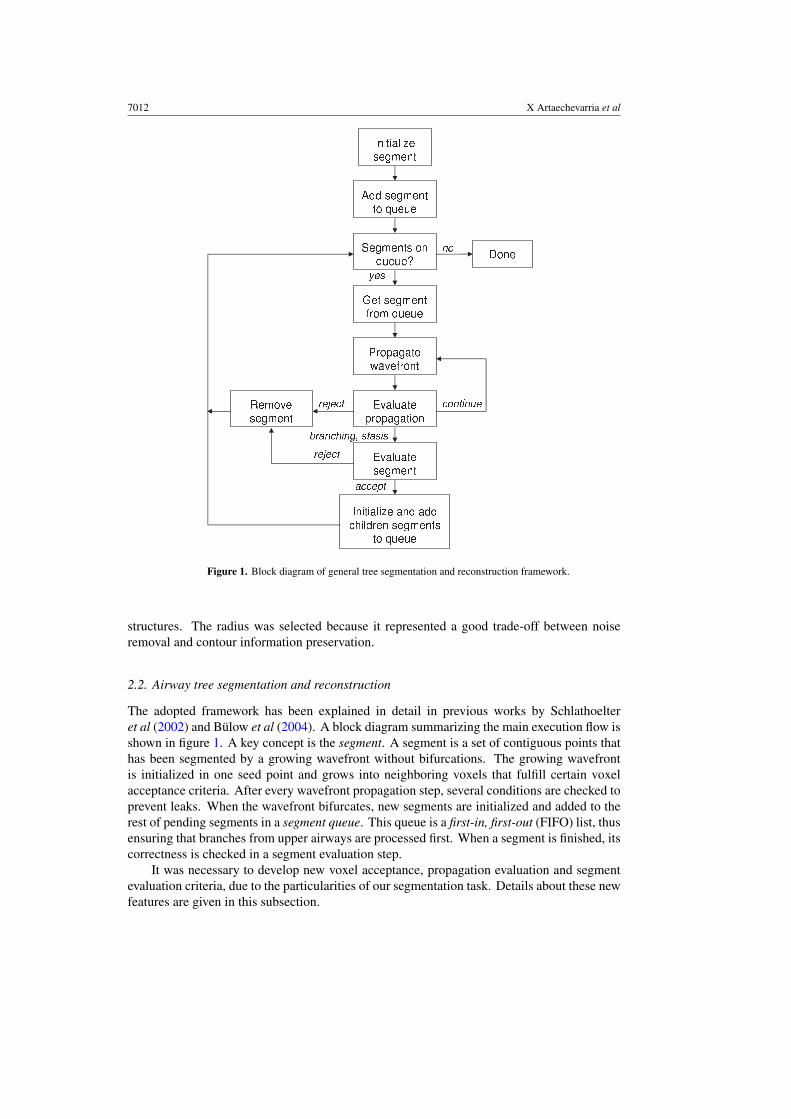
Figure 1. Block diagram of general tree segmentation and reconstruction framework.
structures. The radius was selected because it represented a good trade-off between noiseremoval and contour information preservation.
2.2. Airway tree segmentation and reconstruction
The adopted framework has been explained in detail in previous works by Schlathoelteret al (2002) and Bulow et al (2004). A block diagram summarizing the main execution flow isshown in figure 1. A key concept is the segment. A segment is a set of contiguous points thathas been segmented by a growing wavefront without bifurcations. The growing wavefrontis initialized in one seed point and grows into neighboring voxels that fulfill certain voxelacceptance criteria. After every wavefront propagation step, several conditions are checked toprevent leaks. When the wavefront bifurcates, new segments are initialized and added to therest of pending segments in a segment queue. This queue is a first-in, first-out (FIFO) list, thusensuring that branches from upper airways are processed first. When a segment is finished, itscorrectness is checked in a segment evaluation step.
It was necessary to develop new voxel acceptance, propagation evaluation and segmentevaluation criteria, due to the particularities of our segmentation task. Details about these newfeatures are given in this subsection.
Airway segmentation in mouse models of lung disease 7013
2.2.1. Initialization. The initial wavefront consists of a seed point located inside the tracheadetected on the first transversal slice. To find the trachea, the first image slice is automaticallythresholded using the method described by Hu et al (2001). This threshold value separatesair from tissue and it is iteratively computed for each image. Once this separation is done,two main objects appear in the thresholded binary image: the trachea and the backgroundaround the animal body. Other smaller objects can appear, for instance between the animalbody and the bed. To select the trachea, the following process is used. In a first step, verysmall objects—smaller than 100 pixels—are removed. Next, very large objects—larger than5000 pixels—are discarded. This step removes the background. The last step consists incomputing the center of mass of the remaining objects. The most centered object is consideredto be the trachea. The center of mass of the trachea in the first slice region is set as the initialseed for the wavefront propagation. The Insight Toolkit (Ibanez et al 2003) was used toimplement the initialization and also the rest of steps of the algorithm.
2.2.2. Wavefront propagation. To propagate the wavefront, we use a 3D fast marchinglevel set algorithm. In particular, our implementation is based on the algorithm described byDeschamps and Cohen (2001) and we refer to their work for details. An important aspect isthat, since the intensity threshold is variable—as it will be detailed in subsection 2.2.3—it is notguaranteed that the potential will be monotonically increasing as the wavefront propagates.Since the fast marching algorithm assumes this, the wavefront stops as soon as a negativegrowth of the potential is detected. An important advantage of a fast marching front comparedto region growing is the dome shape of the wavefront, which is very helpful for correctlydetecting bifurcations.
Bifurcation detection is a critical aspect of wavefront propagation. To detect a bifurcation,the connectivity of the wavefront is checked after every propagation step. If the wavefront isdivided in two or more parts, a bifurcation exists. Sensitivity to detect a bifurcation dependson the connectivity size parameter. The connectivity size defines how many voxels around agiven voxels are considered as neighbors. A neighbor connectivity of radius 1 means that onlythe 26 voxels around a given voxel are considered neighbors. If this size is increased to 2, allvoxels in the 5 × 5 × 5 cube around a given voxel will be considered neighbors. Therefore, alow connectivity is very sensitive to bifurcations and will detect them immediately, althoughit is also sensitive to noise and will probably detect non-existent bifurcations caused bynoise. To combine the advantages of high and low connectivities, we have implemented avariable connectivity scheme. Namely, a high connectivity size is used by default—cubicalneighborhood of radius 3—and when rapid growth of the wavefront in successive steps isdetected, the parameter is reduced to radius 1, in order to detect the bifurcation more rapidly.The connectivity returns to the default value of 3 once the segment stops growing.
2.2.3. Voxel acceptance criteria. The viscosity function of the fast marching algorithmdetermines whether a voxel is to be added to the current segment or not. If a certain voxelfulfills the acceptance criteria, its viscosity value is set to 1. Otherwise it is set to infinity. Thereare two criteria that a voxel must fulfill before being accepted: the similar intensity conditionand the low gradient condition. The similar intensity condition is given by a variable upperthreshold, which accounts for the large variability in image intensities observable in micro-CTimages. In other words, voxels with an intensity lower than the variable intensity threshold,Ti, fulfill the similar intensity condition, while the rest do not. In other words, the low SNRand the strong artifacts (beam hardening, circular artifacts) cause the airway branches to havedifferent intensities depending on their location. Therefore, it becomes necessary to have a
7014 X Artaechevarria et al
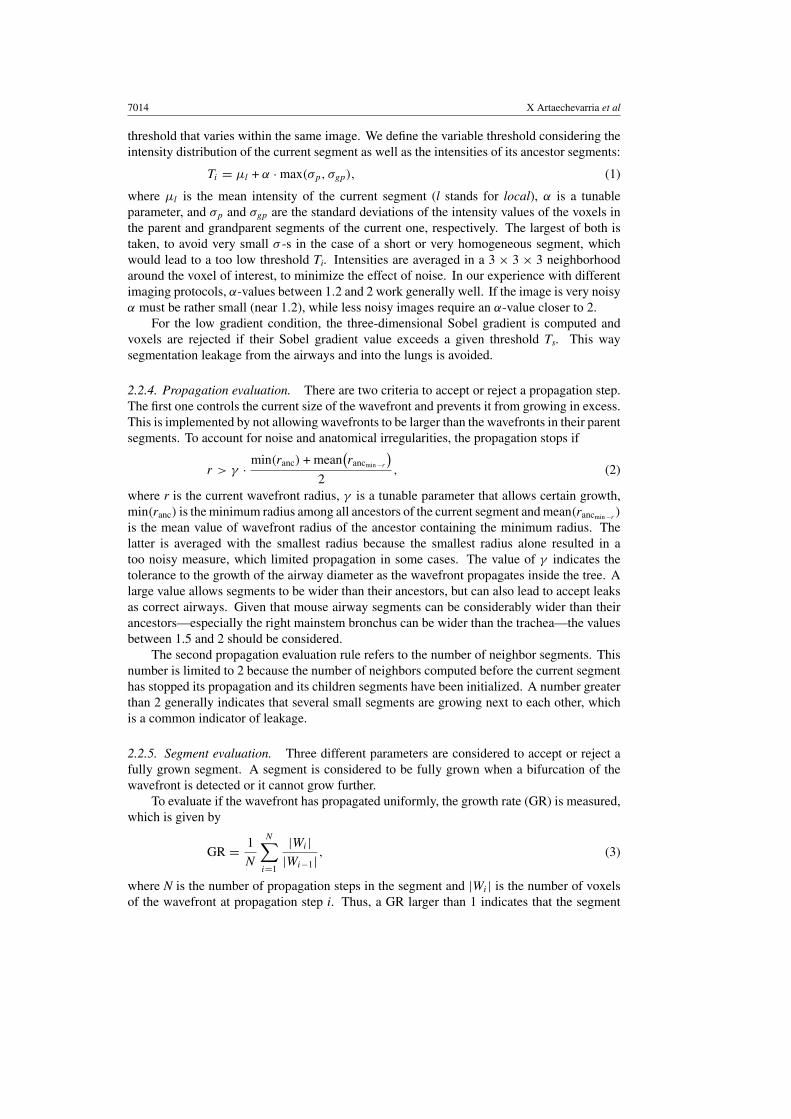
threshold that varies within the same image. We define the variable threshold considering theintensity distribution of the current segment as well as the intensities of its ancestor segments:
Ti = μl + α · max(σp, σgp), (1)
where μl is the mean intensity of the current segment (l stands for local), α is a tunableparameter, and σp and σgp are the standard deviations of the intensity values of the voxels inthe parent and grandparent segments of the current one, respectively. The largest of both istaken, to avoid very small σ -s in the case of a short or very homogeneous segment, whichwould lead to a too low threshold Ti. Intensities are averaged in a 3 × 3 × 3 neighborhoodaround the voxel of interest, to minimize the effect of noise. In our experience with differentimaging protocols, α-values between 1.2 and 2 work generally well. If the image is very noisyα must be rather small (near 1.2), while less noisy images require an α-value closer to 2.
For the low gradient condition, the three-dimensional Sobel gradient is computed andvoxels are rejected if their Sobel gradient value exceeds a given threshold Ts. This waysegmentation leakage from the airways and into the lungs is avoided.
2.2.4. Propagation evaluation. There are two criteria to accept or reject a propagation step.The first one controls the current size of the wavefront and prevents it from growing in excess.This is implemented by not allowing wavefronts to be larger than the wavefronts in their parentsegments. To account for noise and anatomical irregularities, the propagation stops if
r > γ · min(ranc) + mean(rancmin −r
)
2, (2)
where r is the current wavefront radius, γ is a tunable parameter that allows certain growth,min(ranc) is the minimum radius among all ancestors of the current segment and mean(rancmin −r
)
is the mean value of wavefront radius of the ancestor containing the minimum radius. Thelatter is averaged with the smallest radius because the smallest radius alone resulted in atoo noisy measure, which limited propagation in some cases. The value of γ indicates thetolerance to the growth of the airway diameter as the wavefront propagates inside the tree. Alarge value allows segments to be wider than their ancestors, but can also lead to accept leaksas correct airways. Given that mouse airway segments can be considerably wider than theirancestors—especially the right mainstem bronchus can be wider than the trachea—the valuesbetween 1.5 and 2 should be considered.
The second propagation evaluation rule refers to the number of neighbor segments. Thisnumber is limited to 2 because the number of neighbors computed before the current segmenthas stopped its propagation and its children segments have been initialized. A number greaterthan 2 generally indicates that several small segments are growing next to each other, whichis a common indicator of leakage.
2.2.5. Segment evaluation. Three different parameters are considered to accept or reject afully grown segment. A segment is considered to be fully grown when a bifurcation of thewavefront is detected or it cannot grow further.
To evaluate if the wavefront has propagated uniformly, the growth rate (GR) is measured,which is given by
GR = 1
N
N∑
i=1
|Wi ||Wi−1| , (3)
where N is the number of propagation steps in the segment and |Wi | is the number of voxelsof the wavefront at propagation step i. Thus, a GR larger than 1 indicates that the segment
Airway segmentation in mouse models of lung disease 7015
has grown during propagation. A threshold TGR slightly larger than 1 allows a slight growthof the segment.
Then, the discrete compactness (C) is computed, as defined by Bribiesca (2008) for asolid volume of n voxels in 3D:
C = n − A/6
n − ( 3√
n)2, (4)
where A is the area of the enclosing surface of the segment, and corresponds to the sum of theareas of the external plane polygons of the voxels which form the visible faces of the solid.Correct airways tend to be more compact than leakages. A threshold TC is defined to separatecorrect and incorrect segments.
Finally, the difference between the sizes of the last and the first wavefront is also computedand compared to a threshold TW because a large difference is a typical sign of leakage.
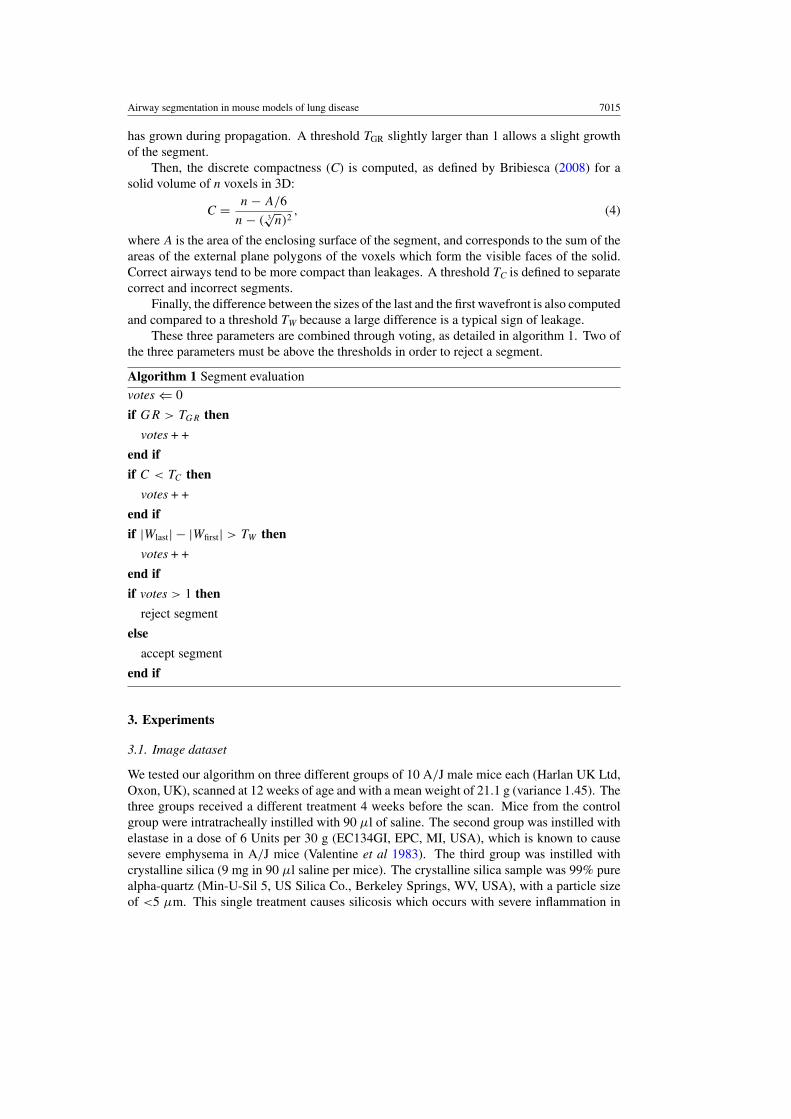
These three parameters are combined through voting, as detailed in algorithm 1. Two ofthe three parameters must be above the thresholds in order to reject a segment.
Algorithm 1 Segment evaluation
votes ⇐ 0
if GR > TGR then
votes + +
end if
if C < TC then
votes + +
end if
if |Wlast| − |Wfirst| > TW then
votes + +
end if
if votes > 1 then
reject segment
else
accept segment
end if
3. Experiments
3.1. Image dataset
We tested our algorithm on three different groups of 10 A/J male mice each (Harlan UK Ltd,Oxon, UK), scanned at 12 weeks of age and with a mean weight of 21.1 g (variance 1.45). Thethree groups received a different treatment 4 weeks before the scan. Mice from the controlgroup were intratracheally instilled with 90 μl of saline. The second group was instilled withelastase in a dose of 6 Units per 30 g (EC134GI, EPC, MI, USA), which is known to causesevere emphysema in A/J mice (Valentine et al 1983). The third group was instilled withcrystalline silica (9 mg in 90 μl saline per mice). The crystalline silica sample was 99% purealpha-quartz (Min-U-Sil 5, US Silica Co., Berkeley Springs, WV, USA), with a particle sizeof <5 μm. This single treatment causes silicosis which occurs with severe inflammation in
7016 X Artaechevarria et al
the first weeks after instillation (Saffiotti et al 1996). All procedures were approved by theUniversity of Navarra Institutional Animal Care and Use Committee, in compliance with theEuropean Union relevant guidelines for the use of laboratory animals.
3.2. Imaging protocol
To ensure high-quality thoracic images free from movement-related artifacts, our protocoluses artificial ventilation, and the micro-CT projections are acquired during ventilator-inducedbreath holds.
In particular, the data acquisition—input impedance parameters and micro-CT image—protocol is an adaptation of that by Namati et al (2006). Animals were anesthetized withan intraperitoneal injection of 90 mg kg−1 ketamine and 10 mg kg−1 xylacine. Endotrachealintubation was performed on anesthetized animals using the BioLite system (Biotex, Houston,TX, USA), to illuminate the trachea with a fiber optic stylet. After intubation, animalswere connected to a Flexivent rodent ventilator (Scireq, Montreal, Canada) at a rate of200 breaths min−1 and a tidal volume of 10 ml kg−1. Animals were kept breathing isofluraneat 2% concentration until complete relaxation was achieved. 0.5% isoflurane was maintainedduring the rest of the experiment. No paralyzer was required in order to prevent mice fromtrying to breath on their own. Once the animals were connected to the ventilator and didnot show any reflex or attempt to breath on their own, the forced oscillation technique wasemployed to compute the airway resistance (Raw), airway inertance (I), tissue damping (G)and tissue elastance (H) (Hantos et al 1992). The manoeuvre was performed three times andthe mean value for each parameter was calculated.
After obtaining the constant phase model parameters, the animals were scanned.700 micro-CT projections were acquired during iso-pressure breath holds at 12 cmH2O,which represents a physiological pressure and minimizes the probability of ventilator-inducedlung injury (VILI) (Dreyfuss and Saumon 1998). Breath hold duration was 650 ms and normalbreathing was induced for two inspiration–expiration cycles between breath holds. A totallung capacity (TLC) perturbation was performed every 20 breath holds. This inflates the lungto the maximum capacity (30 cmH2O) for 3 s and contributes to prevent atelectasis (Allenet al 2006). No projections were acquired during the TLC perturbations.
Images were acquired with a Micro-CAT II scanner (Siemens Pre-Clinical Solutions,Knoxville, TN), with a source voltage of 80 kVp and a current of 500 μA. The exposure timeper projection was 450 ms and each projection was acquired during the 650 ms iso-pressurebreath holds at peak inspiration (12 cm H2O). This resulted in images of 640 slices with 1024 ×1024 voxels per slice, and an isotropic voxel size of 46 μm. A water phantom was used tocalibrate the images to Hounsfield Units (HU). The resolution estimated by the ResolutionEstimator software (Siemens Pre-Clinical Solutions, Knoxville, TN) was 43.74 μm. Scantime was approximately 30 min and the dosage computed by the Dose Calculator software(Siemens Pre-Clinical Solutions, Knoxville, TN) was 71.6 cGy per scan. To estimate imagenoise, we scanned a cylindrical phantom filled with water and computed the standard deviationof the water region (mean 0.97 HU), which resulted in 74.55 HU.
After the scan, animals were intraperitoneally injected with warm saline (10 μl per 1 g)to aid recovery from anesthesia and artificial ventilation.
3.3. Airway segmentation evaluation measures
Automatic airway segmentations were compared to manual segmentations, which were takenas reference. Only every fifth transversal slice was considered for evaluation, due to the
Airway segmentation in mouse models of lung disease 7017
long time required for manual segmentations. The Amira software (Visage Imaging, Furth,Germany) was used to perform the manual segmentations. To this end, a seed was placed insideevery visible airway and 2D region growing was applied to segment the airway. The upperthreshold for region growing was modified to adjust to local airway characteristics in eachcase. In occasions in which this approach failed (mainly due to leakage into the parenchyma),the airways were delineated manually. The entire manual delineation process took around90 min per scan. To assess inter-rater variability, a second expert segmented five scans fromeach of the three groups.
To assess the accuracy of our segmentation method, we computed the true positive volumefraction (TPVF) and false positive volume fraction (FPVF) as defined in the work of Shi et al(2007):
TPVF = |SA ∩ SM ||SM | , FPVF = |SA − SM |
|SM | , (5)
where SA is the automatic segmentation, SM is the manual segmentation, |SA ∩ SM | representsthe cardinality of the intersection between the two segmentations and |SA − SM | representsthe number of pixels that were marked as airway by the automatic algorithm but not by themanual segmentation.
3.4. Test parameter sets
Our airway segmentation algorithm has a number of parameters that must be set. For thispurpose, we used two extra images from each group, which were excluded from the validationstudy. The tunable parameters can be divided in two different groups: wavefront propagationand segment evaluation. The wavefront propagation parameters are α (equation (1)), Ts
and γ (equation (2)). The parameter α (see subsection 2.2.2) acts on the threshold of thepropagation: a high α-value leads to a high threshold. Ts is the threshold for the Sobelgradient and, similarly, the higher the threshold the less restrictive the propagation. The lastparameter related to propagation is γ (equation (2)). A smaller value implies more restrictionsto radius growth in subsequent wavefronts. Three thresholds (TGR, TC and TW) comprise thesegment evaluation parameters. A more lenient set generally leads to more accepted segments,with the risk of more invalid segments being accepted.
We used a simple methodology to set the tunable parameters. The wavefront propagationparameters were selected first, by visually observing the results in two images of each group.These parameters were set so that all the main bronchi and most of the small bronchi weresegmented, without excessive leakage into the parenchyma. To select TGR, TC and TW, thegrowth rate, compactness and difference between last and first wavefront parameters of a fewcorrect and incorrect segments were observed, and thresholds that best separated those twogroups were chosen.
Due to the very different image characteristics of the three groups, two different parametersets resulted from the tuning process. The first set, aimed at control and silica-treated mice,has more lenient rules for both propagation and segment evaluation than the second set. Thereason is that airway walls tend to be worse defined in elastase-treated animals and this resultsin a much higher leakage probability. Precise values for parameters are given in table 1.
3.5. Robustness to image noise
To test how the algorithm behaves on images of different characteristics, we scanned threeA/J mice with three different x-ray doses. Two mice were 11 months old and the third one was
7018 X Artaechevarria et al
(a) Control (b) Emphysema (c) Inflammation
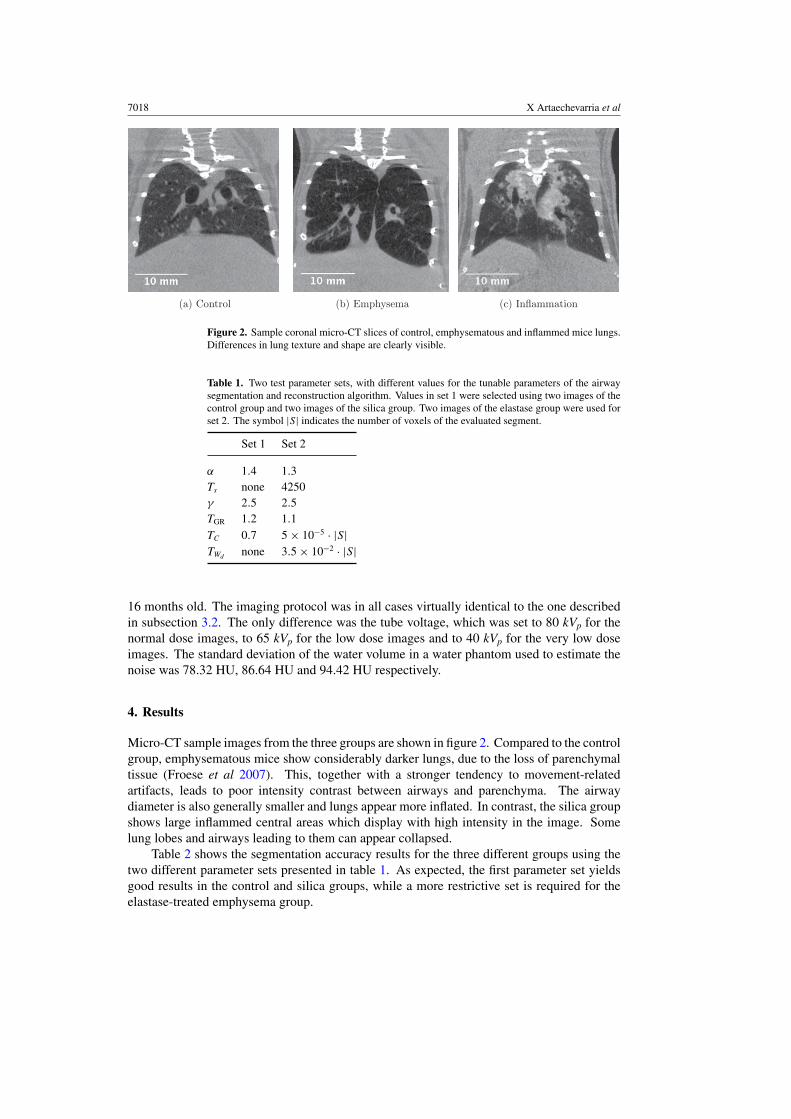
Figure 2. Sample coronal micro-CT slices of control, emphysematous and inflammed mice lungs.Differences in lung texture and shape are clearly visible.
Table 1. Two test parameter sets, with different values for the tunable parameters of the airwaysegmentation and reconstruction algorithm. Values in set 1 were selected using two images of thecontrol group and two images of the silica group. Two images of the elastase group were used forset 2. The symbol |S| indicates the number of voxels of the evaluated segment.
Set 1 Set 2
α 1.4 1.3Ts none 4250γ 2.5 2.5TGR 1.2 1.1TC 0.7 5 × 10⁻⁵ · |S|TWd
none 3.5 × 10⁻² · |S|
16 months old. The imaging protocol was in all cases virtually identical to the one describedin subsection 3.2. The only difference was the tube voltage, which was set to 80 kVp for thenormal dose images, to 65 kVp for the low dose images and to 40 kVp for the very low doseimages. The standard deviation of the water volume in a water phantom used to estimate thenoise was 78.32 HU, 86.64 HU and 94.42 HU respectively.
4. Results
Micro-CT sample images from the three groups are shown in figure 2. Compared to the controlgroup, emphysematous mice show considerably darker lungs, due to the loss of parenchymaltissue (Froese et al 2007). This, together with a stronger tendency to movement-relatedartifacts, leads to poor intensity contrast between airways and parenchyma. The airwaydiameter is also generally smaller and lungs appear more inflated. In contrast, the silica groupshows large inflammed central areas which display with high intensity in the image. Somelung lobes and airways leading to them can appear collapsed.
Table 2 shows the segmentation accuracy results for the three different groups using thetwo different parameter sets presented in table 1. As expected, the first parameter set yieldsgood results in the control and silica groups, while a more restrictive set is required for theelastase-treated emphysema group.
Airway segmentation in mouse models of lung disease 7019
Table 2. Results of the automatic segmentation on the three different image datasets. Mean TPVFand FPVF are indicated, together with the standard deviation in parentheses. The parameter setfor each group is marked in bold.
Dataset Parameter set TPVF (%) FPVF (%)
Control 1 89.44(3.26) 7.97(5.53)
2 73.14 (22.88) 2.82 (2.18)Elastase 1 53.28 (11.41) 53.76 (31.69)
2 81.20(3.58) 12.99(8.17)
Silica 1 87.86(3.84) 6.52(3.01)
2 72.04 (21.97) 2.98 (2.10)
Table 3. Inter-observer variability. Mean TPVF and FPVF of the second observer’s segmentationsare indicated, together with the standard deviation in parentheses.
Dataset TPVF(%) FPVF(%)
Control 96.06 (1.41) 8.81 (1.07)Elastase 95.59 (0.86) 14.3 (1.82)Silica 90.16 (4.36) 6.76 (3.51)
The result of manual segmentations depends up to a certain point on the subjectiveness ofthe manual segmenter. These effects can be partially quantified by looking at inter-observervariability. In this case, it was estimated by comparing the manual segmentations of twoindependent observers on five randomly chosen images of each group. The first observer’ssegmentations were taken as reference to compute the TPVF and FPVF of the second observer.Results are shown in table 3, where relatively high values of TPVF and FPVF can be observed.Visual comparison of the two observers’ segmentations revealed that the second observer drewlarger contours around the airway lumens, which explains the high FPVF values.
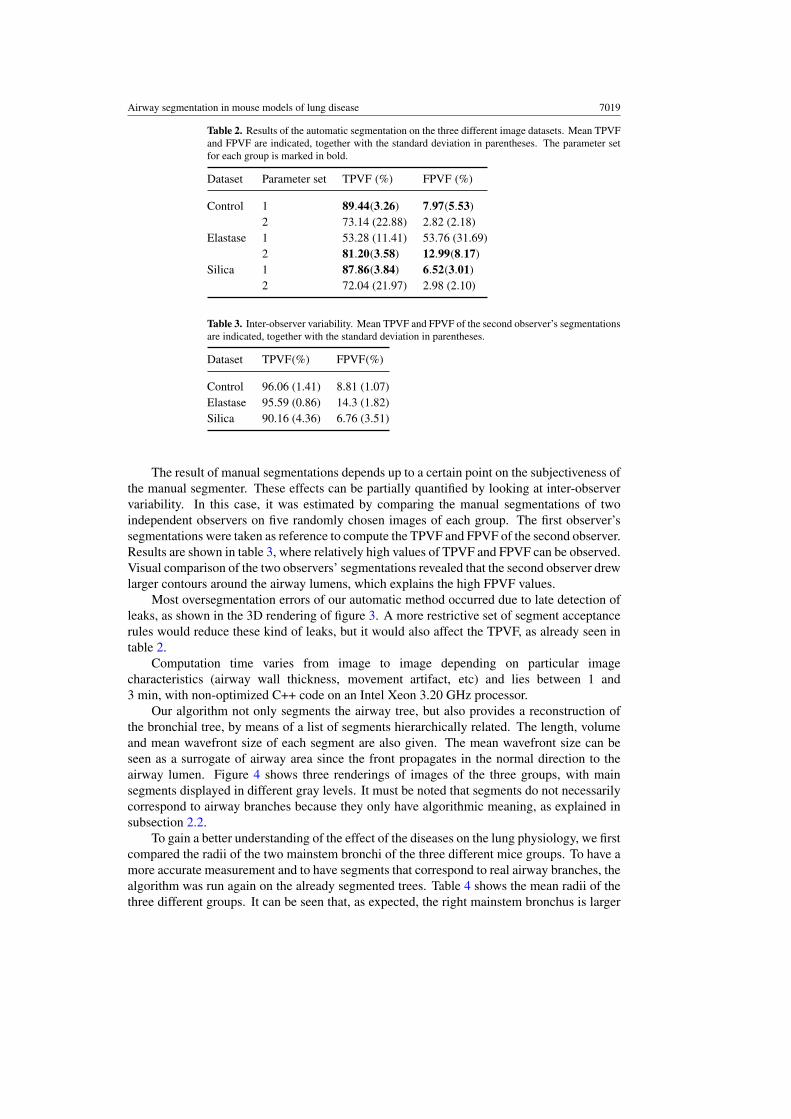
Most oversegmentation errors of our automatic method occurred due to late detection ofleaks, as shown in the 3D rendering of figure 3. A more restrictive set of segment acceptancerules would reduce these kind of leaks, but it would also affect the TPVF, as already seen intable 2.
Computation time varies from image to image depending on particular imagecharacteristics (airway wall thickness, movement artifact, etc) and lies between 1 and3 min, with non-optimized C++ code on an Intel Xeon 3.20 GHz processor.
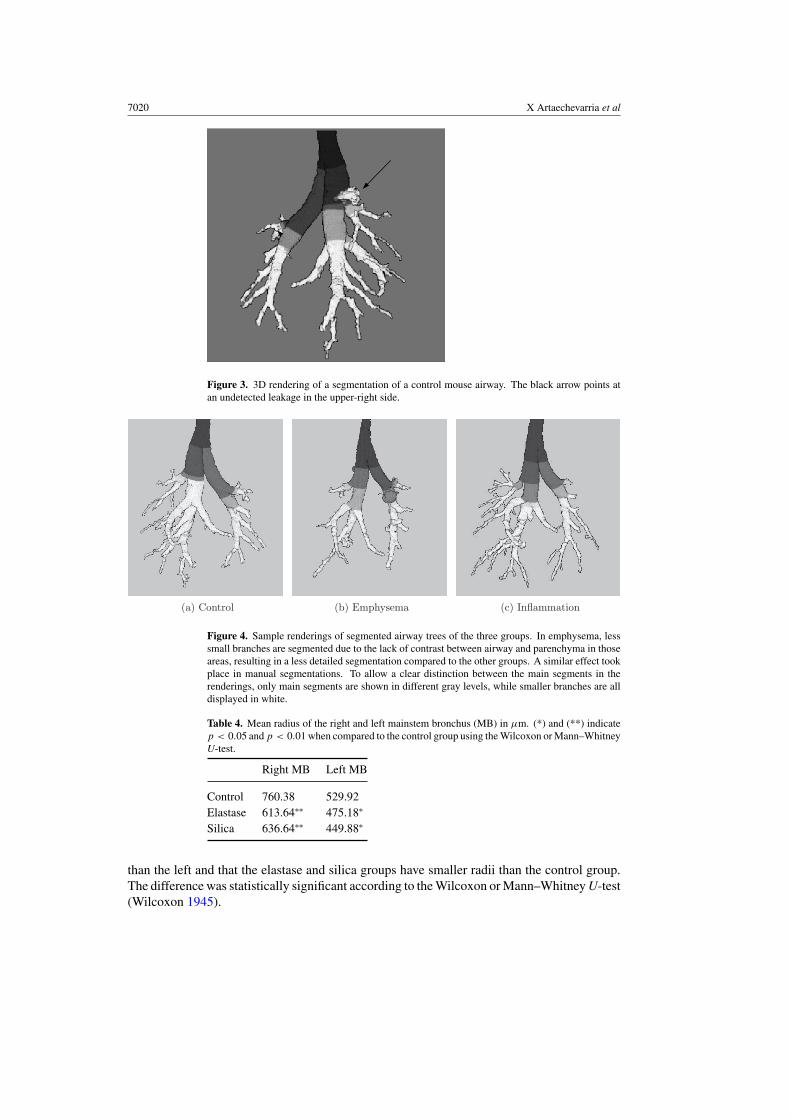
Our algorithm not only segments the airway tree, but also provides a reconstruction ofthe bronchial tree, by means of a list of segments hierarchically related. The length, volumeand mean wavefront size of each segment are also given. The mean wavefront size can beseen as a surrogate of airway area since the front propagates in the normal direction to theairway lumen. Figure 4 shows three renderings of images of the three groups, with mainsegments displayed in different gray levels. It must be noted that segments do not necessarilycorrespond to airway branches because they only have algorithmic meaning, as explained insubsection 2.2.
To gain a better understanding of the effect of the diseases on the lung physiology, we firstcompared the radii of the two mainstem bronchi of the three different mice groups. To have amore accurate measurement and to have segments that correspond to real airway branches, thealgorithm was run again on the already segmented trees. Table 4 shows the mean radii of thethree different groups. It can be seen that, as expected, the right mainstem bronchus is larger
7020 X Artaechevarria et al
Figure 3. 3D rendering of a segmentation of a control mouse airway. The black arrow points atan undetected leakage in the upper-right side.
(a) Control (b) Emphysema (c) Inflammation
Figure 4. Sample renderings of segmented airway trees of the three groups. In emphysema, lesssmall branches are segmented due to the lack of contrast between airway and parenchyma in thoseareas, resulting in a less detailed segmentation compared to the other groups. A similar effect tookplace in manual segmentations. To allow a clear distinction between the main segments in therenderings, only main segments are shown in different gray levels, while smaller branches are alldisplayed in white.
Table 4. Mean radius of the right and left mainstem bronchus (MB) in μm. (*) and (**) indicatep < 0.05 and p < 0.01 when compared to the control group using the Wilcoxon or Mann–WhitneyU-test.
Right MB Left MB
Control 760.38 529.92Elastase 613.64∗∗ 475.18∗
Silica 636.64∗∗ 449.88∗
than the left and that the elastase and silica groups have smaller radii than the control group.The difference was statistically significant according to the Wilcoxon or Mann–Whitney U-test(Wilcoxon 1945).
Airway segmentation in mouse models of lung disease 7021
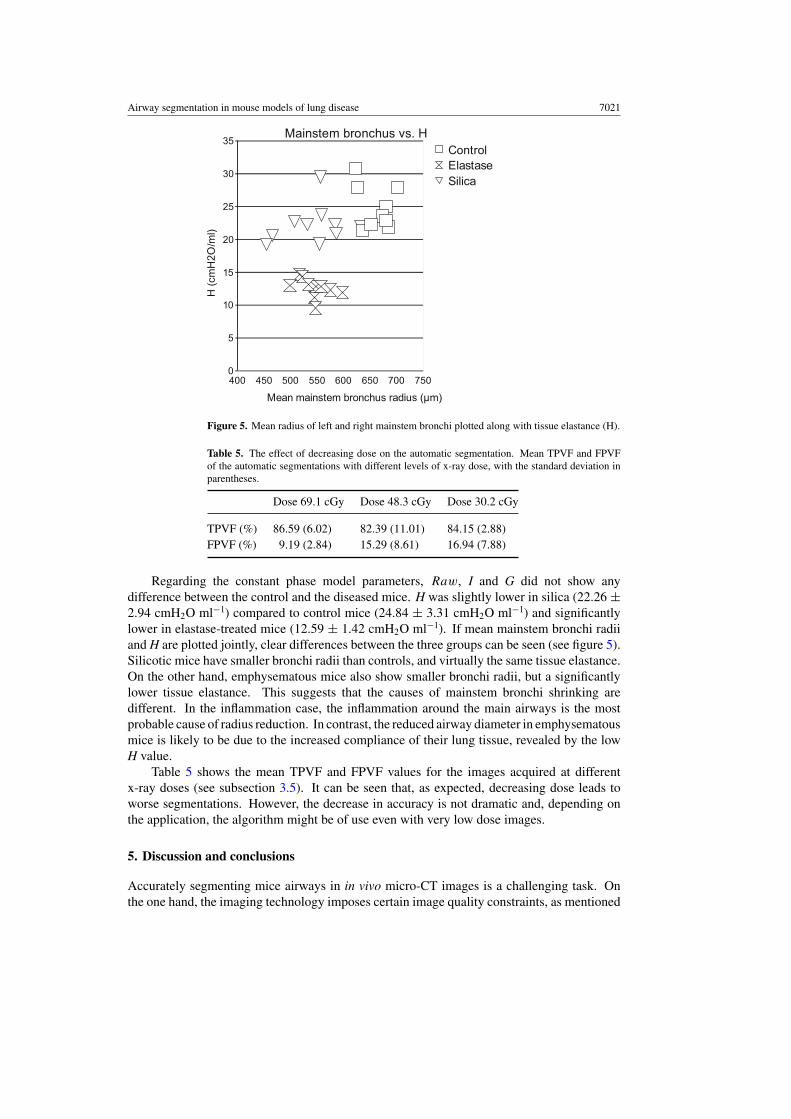
Figure 5. Mean radius of left and right mainstem bronchi plotted along with tissue elastance (H).
Table 5. The effect of decreasing dose on the automatic segmentation. Mean TPVF and FPVFof the automatic segmentations with different levels of x-ray dose, with the standard deviation inparentheses.
Dose 69.1 cGy Dose 48.3 cGy Dose 30.2 cGy
TPVF (%) 86.59 (6.02) 82.39 (11.01) 84.15 (2.88)FPVF (%) 9.19 (2.84) 15.29 (8.61) 16.94 (7.88)
Regarding the constant phase model parameters, Raw, I and G did not show anydifference between the control and the diseased mice. H was slightly lower in silica (22.26 ±2.94 cmH2O ml−1) compared to control mice (24.84 ± 3.31 cmH2O ml−1) and significantlylower in elastase-treated mice (12.59 ± 1.42 cmH2O ml−1). If mean mainstem bronchi radiiand H are plotted jointly, clear differences between the three groups can be seen (see figure 5).Silicotic mice have smaller bronchi radii than controls, and virtually the same tissue elastance.On the other hand, emphysematous mice also show smaller bronchi radii, but a significantlylower tissue elastance. This suggests that the causes of mainstem bronchi shrinking aredifferent. In the inflammation case, the inflammation around the main airways is the mostprobable cause of radius reduction. In contrast, the reduced airway diameter in emphysematousmice is likely to be due to the increased compliance of their lung tissue, revealed by the lowH value.
Table 5 shows the mean TPVF and FPVF values for the images acquired at differentx-ray doses (see subsection 3.5). It can be seen that, as expected, decreasing dose leads toworse segmentations. However, the decrease in accuracy is not dramatic and, depending onthe application, the algorithm might be of use even with very low dose images.
5. Discussion and conclusions
Accurately segmenting mice airways in in vivo micro-CT images is a challenging task. Onthe one hand, the imaging technology imposes certain image quality constraints, as mentioned
7022 X Artaechevarria et al
above (see section 1). On the other hand, the position of lung structures can vary duringthe scanning process, which takes several minutes. Despite artificial ventilation, iso-pressureapneae and deep anesthesia, the way in which lungs respond to repeated mechanical ventilationdoes not remain constant during the acquisition process. We observed that this was especiallysignificant in emphysematous specimens, which lead to a generally low image quality due tomovement artifacts.
To overcome the difficulty imposed by the low SNR and movement artifacts, a robustsegmentation algorithm is required. We built on a previously published framework for tubularstructure segmentation and reconstruction. Previous works have centered on the frameworkitself and its applications (Schlathoelter et al 2002, Bulow et al 2004, van Ginneken et al 2008).The framework provides with generic concepts for the segmentation and reconstruction of tree-like structures, such as the propagating wavefront and the segment definition. Here, we haveused these basic concepts of the framework and we have devised new features in its differentcomponents, such as the variable threshold and the voting segment evaluation, to adapt to theparticularities of thoracic micro-CT images. These extra components have certain tunableparameters that must be fixed. In our experience, it is useful to divide these parameters inwavefront propagation and segment evaluation parameters to better understand their globaleffect. To fine tune the parameters, a few images of the dataset should be used as a guide, untilan acceptable trade-off between sensitivity and specificity is achieved.
We tested our algorithm on normal mice and on two mouse models of lung disease. Thethree groups showed very different image characteristics. Particularly, the elastase groupdisplayed very low voxel intensity in the lungs, which made both manual and automaticsegmentations more difficult. Moreover, movement artifacts were stronger in this group.Therefore, we used a different parameter set for this image dataset. The main characteristic ofthis parameter set was that it was more restrictive in both wavefront propagation and segmentacceptance.
The validation was performed by comparing automatic segmentations with manual ones.In an attempt to quantify the existing human observer errors, a second expert segmented 50%of the evaluated images. Results show that a considerable variability exists between the twoobservers, suggesting the difficulty of precisely delineating the airways.
The automated image analysis tool that we have developed may be of use for a varietyof studies related to lung physiology and pathology. A number of potential applications ofmurine airway segmentation have been outlined in the introductory section. We plan to use thisairway segmentation method to quantify both emphysema and inflammation, in the context ofchronic-inflammation-related lung carcinogenesis. An interesting topic for future work wouldbe the measurement of airways walls since they are also affected in COPD.
We showed that differences in the airway diameter among different groups can be detectedwith this segmentation method. However, the question of how early in a disease processchanges can be quantified has not been addressed. A different dataset showing diseaseprogression would be required. The factors that will affect the technique’s sensitivity includeimage resolution, signal-to-noise ratio and the presence of motion artifacts in the images.
We observed that, despite the segment evaluation rules, some leaks remained undetected.Depending on the application, an interactive tool for incorrect segment removal might be ofuse. The relatively large standard deviations in the TPVF and FPVF values reveal that thealgorithm performs better in some images than in others. This could be improved by modifyingthe tunable parameters separately for each image, which should be done automatically if afully automatic algorithm is desired. Variables such as the number of segmented branchesor the intensity values within and outside the already segmented airways could be used foran iterative tuning process. Another limitation of the algorithm is due to the fact that it is
Airway segmentation in mouse models of lung disease 7023
based on a propagating wavefront. Any interruption in an airway branch caused by noise ordisease stops the propagation. Additional features would be required to detect and avoid theseinterruptions.
Segment hierarchical information is given together with the segmentation. Thus, thetopology of the tree can be easily traced because the parent and children of each branch areidentified. We believe that this is a major advantage of the technique when compared to otheralgorithms that simply segment the tree, for two reasons. First, topological information canbe used to help the segmentation, for instance by comparing the current segment with itsancestors’ radius or by checking the number of neighbor segments. Second, it eliminates theneed for an extra skeletonization step. Moreover, our algorithm provides with measurementsof the length, volume and mean wavefront size of each airway (which is a surrogate of thearea). We showed an application of this by comparing the mean radius of the left and rightmainstem bronchi among the control, emphysema and inflammation groups. Combining datafrom the constant phase model parameters and the airway measurements, we were able todetect different patterns in the different groups. These differences could not be clearly seenwhen only input impedance parameters or mainstem bronchi measurements were analyzed.
In conclusion, we have presented a fast and robust algorithm for murine airwaysegmentation and reconstruction. By adjusting the algorithm parameters to the particularcharacteristics of different models of lung disease, the algorithm is able to segment the airwayswith high sensitivity and specificity values. We have shown that measurements derived fromthese segmentations can be combined with pulmonary input impedance measurements to gainmore insight into the changes in normal lung physiology caused by different diseases.
Acknowledgments
This research project was funded by the Spanish Ministry of Health (project FIS-PI070751),the Government of Navarra, the Spanish Ministry of Science and Innovation (ProjectMICCIN PSS-010000-2008-2) and the ‘UTE Project CIMA’. X Artaechevarria is fundedby a predoctoral grant of the Basque Government. A Munoz-Barrutia holds a Ramon yCajal Fellowship of the Spanish Ministry of Science and Innovation. C Ortiz-de-Solorzanowas supported in part by the Spanish Ministry of Science and Innovation (MICCIN PSS-010000-2008-2), the EU Marie Curie Program (MIRG-CT-2005-028342), and a Ramon yCajal Fellowship.
References
Allen G B, Suratt B T, Rinaldi L, Petty J M and Bates J H T 2006 Choosing the frequency of deep inflation in mice:balancing recruitment against ventilator-induced lung injury Am. J. Physiol. Lung Cell. Mol. Physiol. 291 710–7
Aykac D, Hoffman E, McLennan G and Reinhardt J 2003 Segmentation and analysis of the human airway tree fromthree-dimensional X-ray CT images IEEE Trans. Med. Imaging 22 940–50
Bribiesca E 2008 An easy measure of compactness for 2D and 3D shapes Pattern Recognit. 41 543–54Bulow T, Lorenz C and Renisch S 2004 A general framework for tree segmentation and reconstruction from
medical volume data Medical Image Computing and Computer-Assisted Intervention ‘MICCAI 2004’ vol 3216pp 533–40
Cassidy A, Duffy S W, Myles J P, Liloglou T and Field J K 2007 Lung cancer risk prediction: a tool for earlydetection Int. J. Cancer 120 1–6
Chaturvedi A and Lee Z 2005 Three-dimensional segmentation and skeletonization to build an airway tree datastructure for small animals Phys. Med. Biol. 50 1405–19
Collins R A, Ikegami M, Korfhagen T R, Whitsett J A and Sly P D 2003 In vivo measurements of changes inrespiratory mechanics with age in mice deficient in surfactant protein D Pediatr. Res. 53 463–7
7024 X Artaechevarria et al
De Clerck N, Meurrens K, Weiler H, Dyck D V, Greet G V, Terpstra P and Postnov A 2004 High-resolution x-raymicrotomography for the detection of lung tumors in living mice Neoplasia 6 374–9
de Torres J P et al 2007 Assessing the relationship between lung cancer risk and emphysema detected on low-doseCT of the chest Chest 132 1932–8
Deschamps T and Cohen L D 2001 Fast extraction of minimal paths in 3D images and applications to virtual endoscopyMed. Image Anal. 5 281–99
Dreyfuss D and Saumon G 1998 Ventilator-induced lung injury. Lessons from experimental studies Am. J. Respir.Crit. Care Med. 157 294–323
Fetita C I, Preteux F, Beigleman-Aubry C and Grenier P 2004 Pulmonary airways: 3-D reconstruction from multisliceCT and clinical investigation IEEE Trans. Med. Imaging 23 1353–64
Ford N L, Martin E L, Lewis J F, Veldhuizen R A W, Drangova M and Holdsworth D W 2007 In vivo characterizationof lung morphology and function in anesthesized free-breathing mice using micro-computed tomographyJ. Appl. Physiol. 102 2046–55
Ford N L, Thornton M M and Holdsworth D W 2003 Fundamental image quality limits for microcomputed tomographyin small animals Med. Phys. 30 2869–77
Froese A R, Ask K, Labiris R, Farncombe T, Warburton D, Inman M D, Gauldie J and Kolb M 2007 Three-dimensionalcomputed tomography imaging in an animal model of emphysema Eur. Respiratory J. 30 1082–9
Graham M W, Gibbs J D and Higgins W E 2008 Robust system for human airway-tree segmentation Proc. SPIE 69141–18
Hantos Z, Daroczy B, Suki B, Nagy S and Fredberg J J 1992 Input impedance and peripheral inhomogeneity of doglungs J. Appl. Physiol. 72 168–78
Houghton A M, Mouded M and Shapiro S D 2008 Common origins of lung cancer and COPD Nat. Med. 14 1023–4Hu S, Hoffman E and Reinhardt J 2001 Automatic lung segmentation for accurate quantitation of volumetric x-ray
CT images IEEE Trans. Med. Imaging 20 490–8Ibanez L, Schroeder W, Ng L and Cates J 2003 The ITK Software Guide 1st edn (Kitware, Inc.)
http://www.itk.org/ItkSoftwareGuide.pdfJohnson K A 2007 Imaging techniques for small animal imaging models of pulmonary disease: micro-CT Toxicol.
Pathol. 35 59–64Kiraly A P, Higgins W E, McLennan G, Hoffman E A and Reinhardt J M 2002 Three-dimensional human airway
segmentation methods for clinical virtual bronchoscopy Acad. Radiol. 9 1153–68Lundblad L K A, Thompson-Figueroa J, Allen G B, Rinaldi L, Norton R J, Irvin C G and Bates J H 2007
Airways hyperresponsiveness in allergically inflamed mice: the role of airway closure Am. J. Respir. Crit.Care Med. 175 768–74
Namati E, Chon D, Thiesse J, Hoffman E A, de Ryk J, Ross A and McLennan G 2006 In vivo micro-CT lung imagingvia a computer-controlled intermittent iso-pressure breath hold (IIBH) technique Phys. Med. Biol. 51 6061–75
Postnov A A, Muerrens K, Weiler H, van Dyck D, Xu H, Terpstra P and de Clerck N M 2005 In vivo assessment ofemphysema in mice by high resolution x-ray microtomography J. Microsc. 220 70–5
Saffiotti U, Williams A, Daniel L, Kaighn M, Mao Y and Shi X 1996 Carcinogenesis by crystalline silica: animal,cellular, and molecular studies Silica and Silica-Induced Lung Diseases (Boca Raton, FL: CRC Press)
Schlathoelter T, Lorenz C, Carlsen I C, Renisch S and Deschamps T 2002 Simultaneous segmentation and treereconstruction of the airways for virtual bronchoscopy Proc. SPIE 4684 103–13
Shi L, Thiesse J, McLennan G, Hoffman E A and Reinhardt J M 2007 Three-dimensional murine airway segmentationin micro-CT images Proc. SPIE 6511 651105
Tomioka S, Bates J H T and Irvin C G 2002 Airway and tissue mechanics in a murine model of asthma: alverolarcapsule vs forced oscillations J. Appl. Physiol. 93 263–70
Tschirren J, Hoffman E, McLennan G and Sonka M 2005 Intrathoracic airway trees: segmentation and airwaymorphology analysis from low-dose CT scans IEEE Trans. Med. Imaging 24 1529–39
Valentine R, Rucker R B, Chrisp C E and Fisher G L 1983 Morphological and biochemical features of elastase-inducedemphysema in strain A/J mice Toxicol. Appl. Pharmacol. 68 451–61
van Ginneken B, Baggerman W and van Rikxoort E M 2008 Robust segmentation and anatomical labeling of theairway tree from thoracic CT scans Medical Image Computing and Computer-Assisted Intervention ‘MICCAI2008’ pp 219-26
Vincent L 1993 Morphological grayscale reconstruction in image analysis: applications and efficient algorithms IEEETrans. Image Process. 2 176–201
Wilcoxon F 1945 Individual comparisons by ranking methods Biometrics 1 80–3