AIR-Intelligence SenseNET Software User's Guide
146
P/N 33-308100-006 June 2009 AIR-Intelligence ® SenseNET TM Software User’s Guide
-
Upload
khangminh22 -
Category
Documents
-
view
2 -
download
0
Transcript of AIR-Intelligence SenseNET Software User's Guide

P/N 33-308100-006June 2009
AIR-Intelligence® SenseNETTM
Software User’s Guide

FOREWORDThis Manual, P/N 33-308100-006, is to be used by qualified and factory-trained personnel, knowledgeableof NFPA standards and any other applicable standards in effect, and is intended to provide guidance toqualified technical professionals for the configuration and operation of the SenseNETTM Aspirating SmokeDetector Communication Software, referred to in this manual as “SenseNET.”
Only qualified persons experienced and trained in the installation of this equipment should design, service,maintain, install, and configure the SenseNET. They must be familiar and experienced with the wiringdiagrams and components, electrical installation, and familiar not only with NEC, relevant NFPA and localcodes, but also trained and qualified by the manufacturer and/or its associated operating companies. Themanufacturer of SenseNET is not responsible for the configuration or installation of the product.
It is the responsibility of the professional installer (described above) to properly install, configure, and testthe systems. Under no circumstances will the manufacturer be liable for improper installation,maintenance, servicing, testing, or configuration of the systems.
The technical data contained herein is provided for informational purposes only, and should not be used asa substitute for professional judgment and training. Although the manufacturer believes this informationto be true and correct, it is published and presented without any guarantee or warranty whatsoever. Themanufacturer disclaims any liability for any use of the data other than as set out in this manual, Forewordincluded.
Any questions concerning the information presented in this manual should be addressed to:
AIR-Intelligence
400 Main Street
Ashland, MA 01721 USA
Customer Service: (508) 881-2000
Technical Support: (866) 287-2531
Website: www.airsense.us
P/N 33-308100-006 i June 2009
TERMS AND ABBREVIATIONS
CAUTIONS AND WARNINGS
°C: °Centigrade LCD: Liquid Crystal Display
°F: °Fahrenheit LED: Light Emitting Diode
A: Ampere MEA: Materials and Equipment Acceptance Division of the City of New York
AC: Alternating Current NAC: Notification Appliance Circuit
ADA: Americans with Disabilities Act N.C.: Normally Closed
Ah: Ampere Hour NEC: National Electrical Code
AHJ: Authority Having Jurisdiction NFPA: National Fire Protection Association
ARC: Automatic Release Circuit N.O.: Normally Open
AWG: American Wire Gauge NYC: New York City
CSFM: California State Fire Marshal PCB: Printed Circuit Board
DACT: Digital Alarm Comm. Transmitter pF: Pico-farads
DC: Direct Current P/N: Part Number
DET: Detector PSU: Power Supply Unit
DIOM: Design, Installation, Operation and Maintenance
RAM: Random Access Memory
EOLD: End of Line Device SLC: Signaling Line Circuit
EOLR: End of Line Resistor TB: Terminal Block
FM: Factory Mutual UL/ULI: Underwriters Laboratories, Inc.
ft.: Feet V: Volts
HSSD: High Sensitivity Smoke Detector Vac: Volts AC
Hz: Hertz (Frequency) Vdc: Volts DC
in.: Inch VRMS: Volts Root Mean Square
IRI: Industrial Risk Insurers
CAUTION
A caution identifies a procedure, practice, or statement, which, if not strictlyfollowed, could result in programming errors, impairment of equipment operation,or equipment damage.
WARNING
A warning identifies an operating or maintenance procedure, practice,condition, or statement, which, if not strictly followed, could result in personalinjury or death.
June 2009 ii P/N 33-308100-006
TABLE OF CONTENTS
Foreword ....................................................................................................... iTerms and Abbreviations ................................................................................. iiCautions and Warnings .................................................................................... ii
CHAPTER 1 GENERAL INFORMATION1-1 Introduction ......................................................................................... 1-11-2 Features .............................................................................................. 1-11-3 PC Requirements .................................................................................. 1-11-4 Additional Hardware Requirements .......................................................... 1-21-5 SenseNET Architecture .......................................................................... 1-21-6 Connecting a SenseNET Communication Network Loop............................... 1-21-7 Connecting to Third-Party Systems.......................................................... 1-51-8 Monitoring Third-party Detectors Through SenseNET ................................. 1-51-9 Remote Display Units ............................................................................ 1-51-9.1 The Remote Display Unit Relay Board ...................................................... 1-61-9.2 Using a Remote Display Unit to Show Common Detector Status .................. 1-61-10 Power Supplies ..................................................................................... 1-6
CHAPTER 2 INSTALLATION AND CONFIGURATION2-1 Introduction ......................................................................................... 2-12-2 Installing SenseNET on the PC ................................................................ 2-12-3 Passwords............................................................................................ 2-32-4 Connecting the Detector or Command Module to an RS232 Serial Port ......... 2-62-5 Setting Up the Communications .............................................................. 2-72-5.1 Setting Up Local and Remote Communications Using Multiple PCs................ 2-82-5.2 Setting Up Local and Remote Communications to Monitor a VESDAnet
Network .............................................................................................. 2-82-5.3 Sample Network Configuration................................................................ 2-9
CHAPTER 3 SITE CONFIGURATION3-1 Introduction ......................................................................................... 3-13-1.1 Configuring a Basic Network ................................................................... 3-13-1.2 Remote Configuration Software............................................................... 3-33-2 Managing Your Site Configuration............................................................ 3-33-2.1 The Site Configuration Editor .................................................................. 3-43-2.2 Simplified Site Configuration Editor Functions ........................................... 3-53-2.3 Full Site Configuration Editor Functions .................................................... 3-53-2.4 Adding a New Device to an Existing Site Configuration ............................... 3-63-2.5 Critical Fault Setup................................................................................ 3-73-2.6 Alarms and Event Sound and Text Feature ............................................... 3-73-2.7 Setting Device and Zone Maps ................................................................ 3-8
CHAPTER 4 STATUS AND INFORMATIONAL DISPLAYS4-1 SenseNET Tool Bar................................................................................ 4-14-2 The File Menu....................................................................................... 4-34-3 The View Menu ..................................................................................... 4-44-3.1 Alarms ................................................................................................ 4-44-3.2 Bus Viewer........................................................................................... 4-6
P/N 33-308100-006 iii June 2009
TABLE OF CONTENTS (CONT.)
4-3.3 Diagnostics .......................................................................................... 4-74-3.3.1.1 Scan ................................................................................................... 4-94-3.3.1.2 Diagnostics .......................................................................................... 4-94-3.3.1.3 Read ................................................................................................... 4-104-3.3.1.4 Relays ................................................................................................. 4-114-3.3.1.5 Save As; Print; Close; Help .................................................................... 4-114-3.4 Chart Recording.................................................................................... 4-114-3.4.3.1 File ..................................................................................................... 4-134-3.4.3.2 Edit..................................................................................................... 4-144-3.4.3.3 View ................................................................................................... 4-144-3.4.3.4 Help.................................................................................................... 4-154-3.5 Event Log ............................................................................................ 4-154-3.6 Histograph Viewer................................................................................. 4-184-3.7 Front Panel Display ............................................................................... 4-224-4 Detector Bargraph Display ..................................................................... 4-234-4.1 Bargraph Pop-Up Menu Functions............................................................ 4-24CHAPTER 5 CONFIGURING SENSENET OPTIONS5-1 Introduction ......................................................................................... 5-15-2 Device Settings .................................................................................... 5-25-2.1 Opening Screens................................................................................... 5-25-2.2 Device Setting Functions........................................................................ 5-45-2.2.2.1 Remote Input Functions......................................................................... 5-75-2.2.2.2 Function Settings Checkboxes ................................................................ 5-75-2.2.4.1 Level................................................................................................... 5-105-2.2.4.2 Delay .................................................................................................. 5-115-2.2.4.3 Alarm Factor ........................................................................................ 5-125-2.2.4.4 ClassiFire override ................................................................................ 5-125-2.2.4.5 LDDTM enable ...................................................................................... 5-135-2.2.4.6 FastLearnTM enable .............................................................................. 5-135-2.2.4.7 Auto FastLearn enable ........................................................................... 5-135-2.2.4.8 ClassiFire 3D ........................................................................................ 5-135-2.2.4.9 Demo mode ......................................................................................... 5-145-3 PC Command Module............................................................................. 5-225-4 Site Configuration ................................................................................. 5-235-5 Communication Settings ........................................................................ 5-245-6 Email Settings ...................................................................................... 5-245-7 Pager Settings...................................................................................... 5-255-8 Passwords ........................................................................................... 5-265-9 Lock.................................................................................................... 5-265-10 Global Reset......................................................................................... 5-265-11 Log to Printer ....................................................................................... 5-275-11.1 Printer Configuration ............................................................................. 5-275-12 Map View............................................................................................. 5-285-13 Language............................................................................................. 5-305-14 Alarm and Fault Actions ......................................................................... 5-315-14.1 Alert Sounds for More than One Event ..................................................... 5-33
June 2009 iv P/N 33-308100-006
TABLE OF CONTENTS (CONT.)
APPENDIX A—SENSENET INITIALIZATION FILE............................................................... A-1A-1 SenseNET.INI....................................................................................... A-1
APPENDIX B—DEVICE ADDRESS TABLE ............................................................................ B-1B-1 Device Address Table ............................................................................ B-1
APPENDIX C—LIST OF PROGRAMMABLE FUNCTIONS........................................................ C-1C-1 Introduction ......................................................................................... C-1
APPENDIX D—THE CLASSIFIRE SYSTEM ...........................................................................D-1D-1 About ClassiFire....................................................................................D-1D-1.1 The Detector Levels...............................................................................D-1D-1.2 Sensitivity Levels ..................................................................................D-3D-1.3 ClassiFire Operation ..............................................................................D-3D-1.4 Real Time ClassiFire Viewer ....................................................................D-16
INDEX........................................................................................................... 1
P/N 33-308100-006 v June 2009

TABLE OF CONTENTS (CONT.)
June 2009 vi P/N 33-308100-006
LIST OF FIGURES
Figure Name Page Number
1-1 SenseNET Architecture ......................................................................................... 1-21-2 Sample PC Configuration Running SenseNET ........................................................... 1-31-3 Sample Fault Tolerant Configuration Running SenseNET with a Command Module......... 1-41-4 Remote Display Unit Front Panel ............................................................................ 1-52-1 WinZip Self-Extractor Program............................................................................... 2-12-2 Set Installation Details Screen ............................................................................... 2-12-3 Set Language Screen ........................................................................................... 2-22-4 Installation Complete Screen................................................................................. 2-32-5 Options Menu...................................................................................................... 2-52-6 Password Dialog Box ............................................................................................ 2-52-7 Setting a Password for Administrator Access............................................................ 2-62-8 RS232 Serial Port Connection ................................................................................ 2-62-9 Communication Settings Dialog Box ....................................................................... 2-72-10 Communication Settings Port Area Alternate Display (Network Monitor and Control) ..... 2-82-11 Communication Settings Port Area Alternate Display (VESDA HLI) .............................. 2-92-12 Sample SenseNET Network Configuration................................................................ 2-102-13 Loop 1 Communication Settings............................................................................. 2-112-14 Loop 2 Communication Settings............................................................................. 2-112-15 Loop 3 Communication Settings............................................................................. 2-122-16 Communication Settings for PC2 ............................................................................ 2-122-17 Communication Settings for PC3 ............................................................................ 2-133-1 Site Configuration Screen (Simple Mode) ................................................................ 3-23-2 Site Configuration Screen (Complex Mode).............................................................. 3-23-3 File Menu Screen ................................................................................................. 3-33-4 Site Configuration Screen (Simple Mode) ................................................................ 3-43-5 Full Site Configuration Editor Screen....................................................................... 3-63-6 Critical Faults Screen............................................................................................ 3-73-7 Alarm and Fault Speech and Text Files.................................................................... 3-83-8 Sample Site Map: Building .................................................................................... 3-93-9 Sample Site Map: First Floor.................................................................................. 3-93-10 Sample Image Map .............................................................................................. 3-103-11 Zone Setup Screen .............................................................................................. 3-114-1 SenseNET Main Screen Toolbar Icons ..................................................................... 4-14-2 View Menu Commands ......................................................................................... 4-44-3 Alarm/fault Viewer Screen .................................................................................... 4-54-4 Bus Viewer Screen ............................................................................................... 4-64-5 Diagnostics Screen............................................................................................... 4-84-6 Sample Selected Detector Device........................................................................... 4-94-7 Diagnostics Scan Dialog Box.................................................................................. 4-94-8 Running Diagnostics Screen .................................................................................. 4-104-9 Laser Chamber Output ......................................................................................... 4-104-10 Relay Test Screen ................................................................................................ 4-114-11 Chart Recording Screen ........................................................................................ 4-124-12 Chart Recording Menu Options............................................................................... 4-144-13 Edit Commands in Chart Recording Menu Options .................................................... 4-144-14 View Commands in Chart Recording Menu Options ................................................... 4-154-15 Help Commands in Chart Recording Menu Options.................................................... 4-154-16 Event Log Screen................................................................................................. 4-164-17 Filter Screen ....................................................................................................... 4-174-18 Sample Histograph Screen with Alarm Factor “0” ..................................................... 4-194-19 Sample Histograph Screen with Alarm Factor “1” ..................................................... 4-204-20 Sample Histogram Screen with Sensitivity............................................................... 4-21
P/N 33-308100-006 vii June 2009

LIST OF FIGURES (CONT.)
Figure Name Page Number4-21 Alarm Timer Display............................................................................................. 4-224-22 Typical Detector Front Panel.................................................................................. 4-224-23 Sample Bargraph Display...................................................................................... 4-244-24 Bargraph Pop-up Menu ......................................................................................... 4-244-25 Alarm Viewer Showing an Isolated Detector ............................................................ 4-254-26 Detector Front Panel ............................................................................................ 4-254-27 Diagnostics Viewer Window................................................................................... 4-264-28 Histogram for a Selected Detector.......................................................................... 4-264-29 Chart Recording for a Detector (Partial Screenshot).................................................. 4-274-30 Event Filter Screen .............................................................................................. 4-284-31 Event Log for a Detector ....................................................................................... 4-284-32 The Detector Function Programmer ........................................................................ 4-295-1 Accessing Programmable Functions Via the Options Menu ......................................... 5-15-2 Device Setting Opening Screen - Command Module.................................................. 5-25-3 Device Setting Opening Screen - ASD-640 .............................................................. 5-25-4 Device Setting Opening Screen - ASD-320 .............................................................. 5-35-5 Common Settings for Device Setting Sub-pages....................................................... 5-35-6 MatrixScan Screen ............................................................................................... 5-55-7 Number of Possible Virtual Detectors for All Available Real Detectors. ......................... 5-65-8 Alarm Actions Function Settings Screen .................................................................. 5-75-9 Time and Date Function Settings Screen ................................................................. 5-95-10 Alarm Levels and Delays Function Settings Screen ................................................... 5-105-11 Bargraph Display from an ASD-640 Detector ........................................................... 5-115-12 ASD-640 and ASD-160H/320 Flow Monitoring Function Settings Screen ...................... 5-145-13 Power Monitoring Function Settings Screen ............................................................. 5-155-14 Front Panel Function Settings Screen...................................................................... 5-175-15 Day/Night Switching Function Settings Screen ......................................................... 5-185-16 Referencing Function Settings Screen ..................................................................... 5-195-17 Miscellaneous Function Settings Screen .................................................................. 5-215-18 Command Module Settings Screen ......................................................................... 5-225-19 Site Configuration Editor....................................................................................... 5-245-20 Configuring E-mail Settings................................................................................... 5-245-21 Configuring Pager Settings.................................................................................... 5-255-22 Detector Display (Partial Screenshot) ..................................................................... 5-295-23 Site Map (Partial Screenshot) ................................................................................ 5-305-24 Language Settings Dialog Box ............................................................................... 5-315-25 Selecting the Actions Button from the Site Configuration Editor.................................. 5-315-26 Alarm and Fault Actions Dialog Box ........................................................................ 5-32B-1 Sample DIP Switch Settings .................................................................................. B-1C-1 Accessing Programmable Functions ........................................................................ C-1D-1 ClassiFire Alarm Indicator .....................................................................................D-1D-2 AUX Alarm Level..................................................................................................D-2D-3 Fire Alarm Activation............................................................................................D-3D-4 A Normal Distribution of Men’s Heights ...................................................................D-4D-5 A Normal Distribution Curve ..................................................................................D-5D-6 Building a ClassiFire Smoke Density Distribution Curve (Histogram)............................D-5D-7 Fully Populated Distribution Curve..........................................................................D-6D-8 Mean Changes/Variance Remains Constant .............................................................D-6D-9 Distribution Curve Moving Along Its Axis as Smoke Level Increases ............................D-7D-10 Low Variance/Mean Constant.................................................................................D-7D-11 Moderate Variance ...............................................................................................D-8D-12 High Variance......................................................................................................D-8D-13 One Standard Deviation........................................................................................D-9
June 2009 viii P/N 33-308100-006
LIST OF FIGURES (CONT.)
Figure Name Page NumberD-14 Two Standard Deviations ......................................................................................D-9D-15 Three Standard Deviations ....................................................................................D-10D-16 Initial Alarm Level Position ....................................................................................D-11D-17 The Alarm Flag After 24 Hours...............................................................................D-11D-18 The Fast Histogram..............................................................................................D-12D-19 Dropping Smoke Level After Work Stops in the Protected Area...................................D-13D-20 Histogram Reaches 2/3 of the Distance from the Previous Night’s Mean ......................D-13D-21 Inactive Histogram Takes Over and Alarm Flag Repositioned .....................................D-14D-22 Selecting Device Settings from the Option Menu ......................................................D-15D-23 Real-time ClassiFire Viewer Screen.........................................................................D-16
P/N 33-308100-006 ix June 2009

THIS PAGE INTENTIONALLY LEFT BLANK.
June 2009 x P/N 33-308100-006
LIST OF TABLES
Table Name Page Number2-1 Access Levels and Privileges.................................................................................. 2-43-1 File Commands.................................................................................................... 3-43-2 Site Configuration Editor Functions......................................................................... 3-53-3 Full Site Configuration Editor Functions ................................................................... 3-64-1 Main Screen Tool Bar Icons ................................................................................... 4-14-2 File Types from Main Menu.................................................................................... 4-44-3 Alarm/fault Viewer Screen Buttons ......................................................................... 4-54-4 Bus viewer Screen Data........................................................................................ 4-74-5 Bus viewer Screen Items ...................................................................................... 4-74-6 Diagnostics Screen Items...................................................................................... 4-84-7 File Commands in Chart Recording Menu Options ..................................................... 4-144-8 Help Commands in Chart Recording Menu Options.................................................... 4-154-9 Event Log Screen Buttons ..................................................................................... 4-174-10 Event Filters........................................................................................................ 4-184-11 Event Log Screen Buttons ..................................................................................... 4-184-12 Histograph Screen Elements.................................................................................. 4-204-13 Relatively and Absolutely Scaled Definitions ............................................................ 4-234-14 Relatively-Scaled Alarm Levels .............................................................................. 4-234-15 Front Panel Button Functions................................................................................. 4-235-1 Device Information Screen Options ........................................................................ 5-35-2 Common Device Settings for Device Setting Sub-Pages............................................. 5-45-3 MatrixScan Screen Checkboxes.............................................................................. 5-55-4 Maximum Number of Virtual Detectors Per Real Detectors ......................................... 5-65-5 Alarm Actions Function Settings Screen Checkboxes ................................................. 5-85-6 Suggested Settings for ClassiFire Alarm Factor......................................................... 5-125-7 Flow Monitoring Function Settings .......................................................................... 5-155-8 Power Monitoring Function Settings ........................................................................ 5-165-9 Front Panel Function Settings ................................................................................ 5-175-10 Day/Night Switching Function Settings.................................................................... 5-195-11 Referencing Function Settings Screen ..................................................................... 5-205-12 Miscellaneous Function Settings ............................................................................. 5-215-13 Command Module Settings Functions...................................................................... 5-235-14 Email Function Settings ........................................................................................ 5-255-15 Email Settings Dialog Box Buttons.......................................................................... 5-255-16 Pager Function Settings ........................................................................................ 5-265-17 Pager Settings Dialog Box Buttons ......................................................................... 5-265-18 Alarm and Fault Actions Dialog Box Elements .......................................................... 5-32B-1 Device Address Table ........................................................................................... B-2C-1 Device Information .............................................................................................. C-1C-3 MatrixScan.......................................................................................................... C-2C-4 Alarm actions ...................................................................................................... C-2C-2 Pager ................................................................................................................. C-2C-5 Time and Date..................................................................................................... C-3C-6 Alarm levels and delays ........................................................................................ C-3C-7 Flow monitoring................................................................................................... C-4C-8 Power Monitoring................................................................................................. C-4C-9 Front panel ......................................................................................................... C-5C-10 Day/night switching ............................................................................................. C-5C-11 Referencing ........................................................................................................ C-5C-12 Miscellaneous ...................................................................................................... C-5
P/N 33-308100-006 xi June 2009

THIS PAGE INTENTIONALLY LEFT BLANK.
June 2009 xii P/N 33-308100-006
General Information
CHAPTER 1GENERAL INFORMATION
1-1 INTRODUCTION
SenseNETTM is a Windows®-based program that provides central management and monitoringof up to 127 AIR-Intelligence detectors on a fault-tolerant communications loop with extensiveerror checking and correction.
SenseNET is scalable, allowing expansion for larger sites using multiple loops (with up to 127detectors on each loop).
Maps and warning sounds, including spoken messages, may be set for each detector. Detectorsmay be grouped together in zones with an associated zone map, allowing Alarms or Faults tobe quickly and easily located.
SenseNET seamlessly integrates with AIR-Intelligence detectors and allows for futuredevelopments in detection technology.
1-2 FEATURES
SenseNET features include:
• ClassiFire® artificial intelligence (which dynamically adjusts detector sensitivity to matchchanges in the normal environmental smoke density)
• Ability to configure and manage a large detector network centrally with a simple,streamlined interactive graphical user interface
• Device mapping to a graphical user interface
• Real-time alarms with spoken instructions and definable sound files
• Event logging of events to disk in real time
• Automatic detection of all attached devices for rapid site configuration
• Extensive error checking and correction
• Real-time pager or email alerts to compatible GSM mobile phones
• Real-time displays and printing of system status and historical information
• Real-time diagnostics of all networked devices
• Contact Monitors that interface to other manufacturers’ equipment
• Four password-protected levels of security access to system settings
1-3 PC REQUIREMENTS
Minimum computer requirements for the SenseNET are listed below. System requirementsvary between operating systems. Refer to the section below which applies to your computeroperating system.
For computers with Microsoft® Windows XP installed:
• PC with 300 MHz or higher processor clock speed recommended; 233 MHz minimumrequired (single or dual processor system)
• 128 MB of memory (RAM) or higher recommended (64 MB minimum supported; may limitperformance and some features)
For computers with Microsoft® Windows 2000 installed:
P/N 33-308100-006 1-1 June 2009
General Information
• 133 MHz or higher Pentium-compatible CPU
• A minimum of 64 MB of RAM
1-4 ADDITIONAL HARDWARE REQUIREMENTS
• The PC running the SenseNET software needs to be connected to the Command Module onthe detector loop or through a PC Interface (as shown in Figure 1-1 and Figure 1-2).
• A Hayes-compatible modem and dedicated line is required for sending messages to apager. Refer to Section 5-7 for setup information.
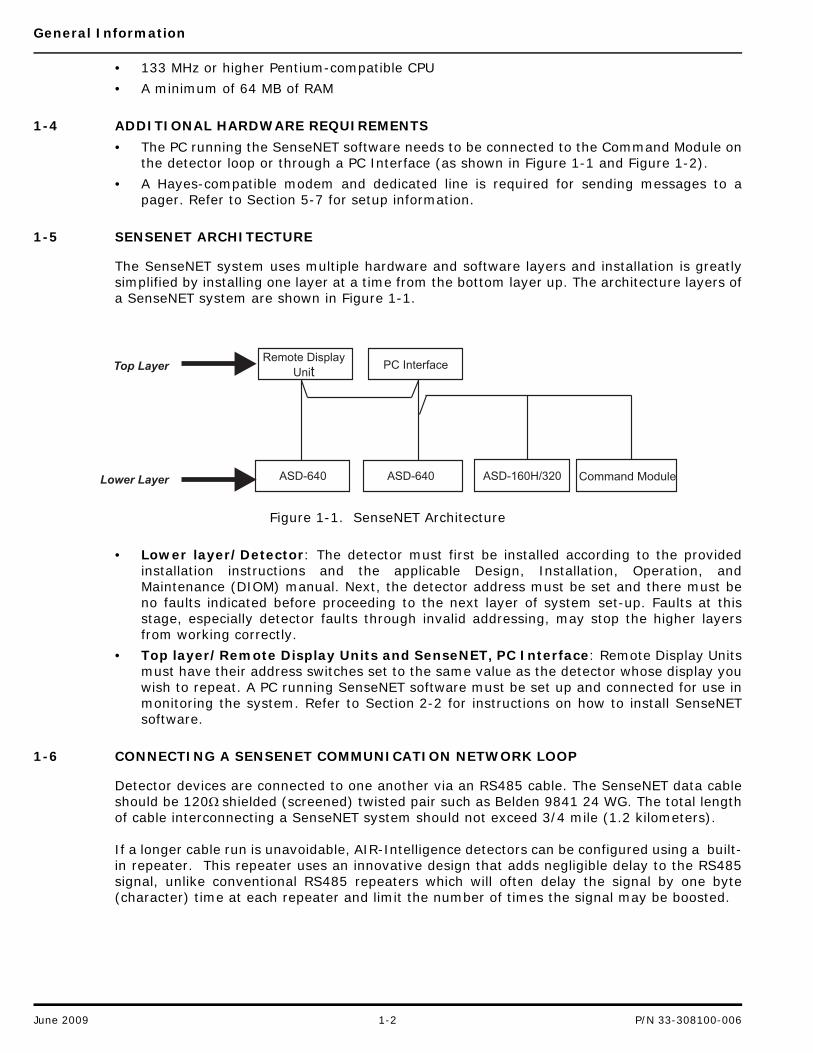
1-5 SENSENET ARCHITECTURE
The SenseNET system uses multiple hardware and software layers and installation is greatlysimplified by installing one layer at a time from the bottom layer up. The architecture layers ofa SenseNET system are shown in Figure 1-1.
Figure 1-1. SenseNET Architecture
• Lower layer/Detector: The detector must first be installed according to the providedinstallation instructions and the applicable Design, Installation, Operation, andMaintenance (DIOM) manual. Next, the detector address must be set and there must beno faults indicated before proceeding to the next layer of system set-up. Faults at thisstage, especially detector faults through invalid addressing, may stop the higher layersfrom working correctly.
• Top layer/Remote Display Units and SenseNET‚ PC Interface: Remote Display Unitsmust have their address switches set to the same value as the detector whose display youwish to repeat. A PC running SenseNET software must be set up and connected for use inmonitoring the system. Refer to Section 2-2 for instructions on how to install SenseNETsoftware.
1-6 CONNECTING A SENSENET COMMUNICATION NETWORK LOOP
Detector devices are connected to one another via an RS485 cable. The SenseNET data cableshould be 120Ω shielded (screened) twisted pair such as Belden 9841 24 WG. The total lengthof cable interconnecting a SenseNET system should not exceed 3/4 mile (1.2 kilometers).
If a longer cable run is unavoidable, AIR-Intelligence detectors can be configured using a built-in repeater. This repeater uses an innovative design that adds negligible delay to the RS485signal, unlike conventional RS485 repeaters which will often delay the signal by one byte(character) time at each repeater and limit the number of times the signal may be boosted.
PC InterfaceRemote Display
Unit
ASD-640 ASD-160H/320Lower Layer
Top Layer
ASD-640 Command Module
June 2009 1-2 P/N 33-308100-006
General Information
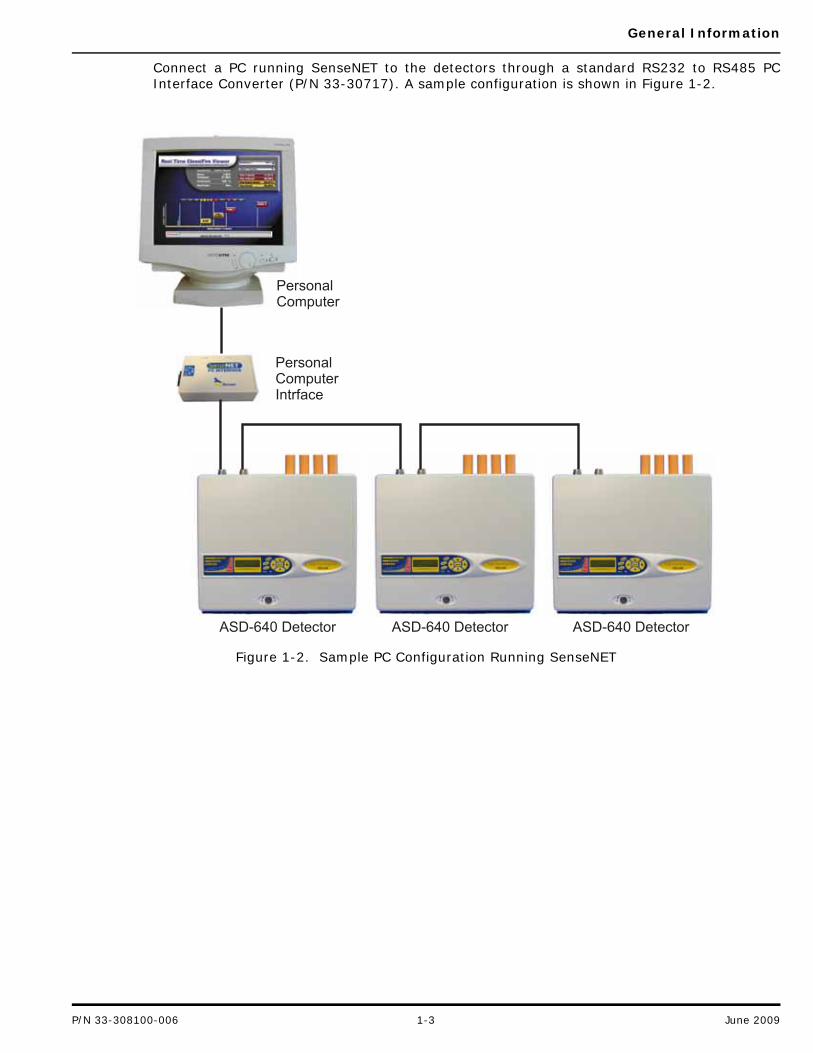
Connect a PC running SenseNET to the detectors through a standard RS232 to RS485 PCInterface Converter (P/N 33-30717). A sample configuration is shown in Figure 1-2.
Figure 1-2. Sample PC Configuration Running SenseNET
PersonalComputer
PersonalComputerIntrface
ASD-640 Detector ASD-640 Detector ASD-640 Detector
P/N 33-308100-006 1-3 June 2009
General Information
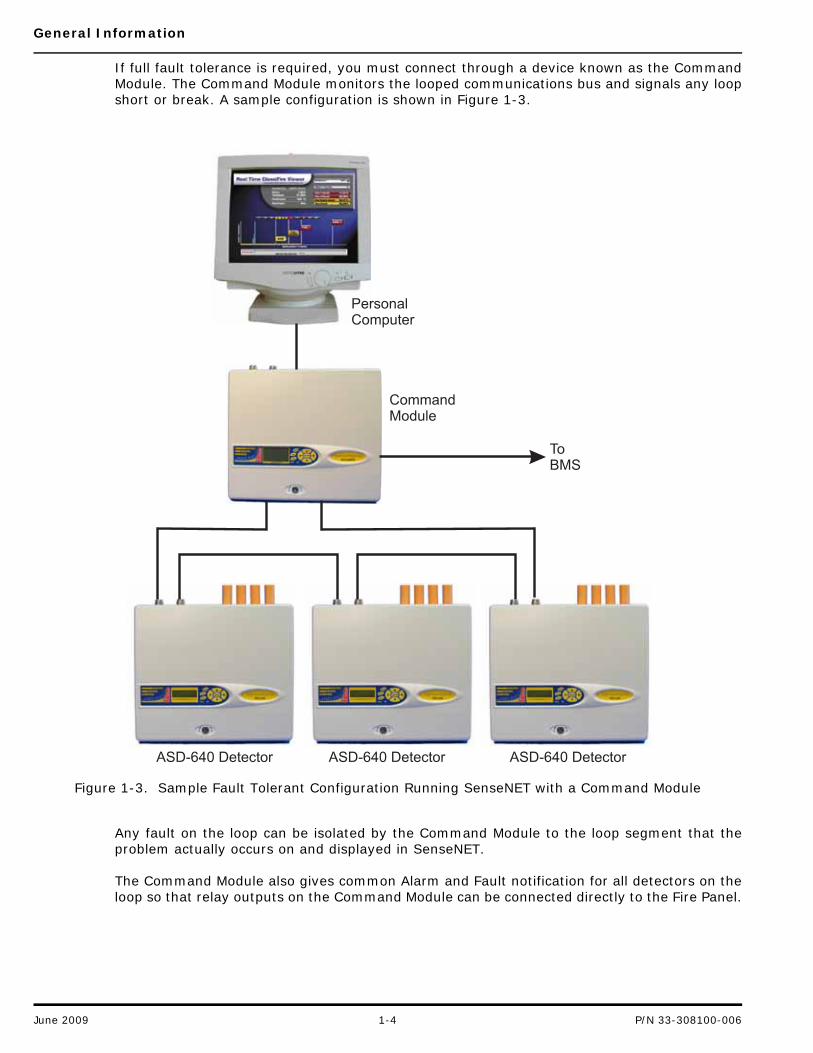
If full fault tolerance is required, you must connect through a device known as the CommandModule. The Command Module monitors the looped communications bus and signals any loopshort or break. A sample configuration is shown in Figure 1-3.
Figure 1-3. Sample Fault Tolerant Configuration Running SenseNET with a Command Module
Any fault on the loop can be isolated by the Command Module to the loop segment that theproblem actually occurs on and displayed in SenseNET.
The Command Module also gives common Alarm and Fault notification for all detectors on theloop so that relay outputs on the Command Module can be connected directly to the Fire Panel.
PersonalComputer
ASD-640 Detector ASD-640 Detector ASD-640 Detector
CommandModule
ToBMS
June 2009 1-4 P/N 33-308100-006
General Information
1-7 CONNECTING TO THIRD-PARTY SYSTEMS
Other monitoring devices, such as a Building Management System (BMS), connect to a secondRS232 port on the Command Module. Current BMS protocols supported are BACnet ptp andASCII output (as shown in Figure 1-3).
1-8 MONITORING THIRD-PARTY DETECTORS THROUGH SENSENET
You can monitor third-party detectors through SenseNET using the Contact Monitor. TheContact Monitor interface allows four Alarm levels, Fault, and two additional inputs.
This feature is used to monitor older or noncompatible aspirating detectors when adding AIR-Intelligence detectors to an existing system.
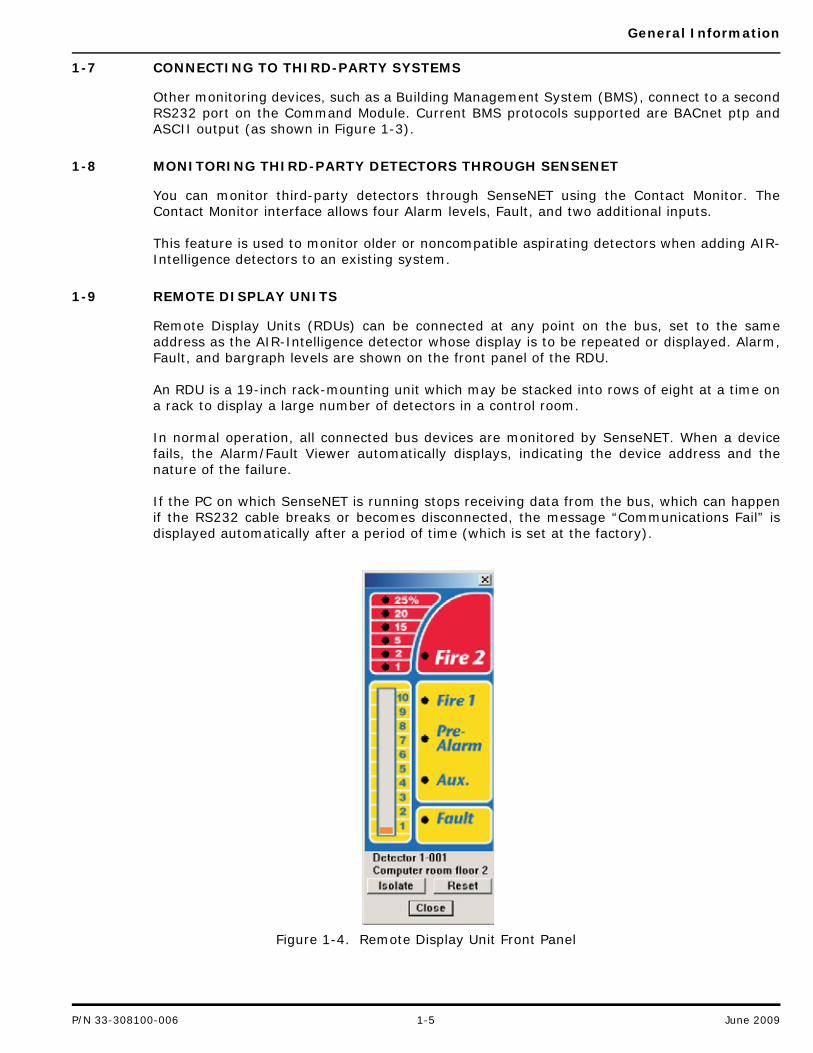
1-9 REMOTE DISPLAY UNITS
Remote Display Units (RDUs) can be connected at any point on the bus, set to the sameaddress as the AIR-Intelligence detector whose display is to be repeated or displayed. Alarm,Fault, and bargraph levels are shown on the front panel of the RDU.
An RDU is a 19-inch rack-mounting unit which may be stacked into rows of eight at a time ona rack to display a large number of detectors in a control room.
In normal operation, all connected bus devices are monitored by SenseNET. When a devicefails, the Alarm/Fault Viewer automatically displays, indicating the device address and thenature of the failure.
If the PC on which SenseNET is running stops receiving data from the bus, which can happenif the RS232 cable breaks or becomes disconnected, the message “Communications Fail” isdisplayed automatically after a period of time (which is set at the factory).
Figure 1-4. Remote Display Unit Front Panel
P/N 33-308100-006 1-5 June 2009

General Information
The address switch on the RDU Card should be set to the same address as the AIR-Intelligencedetector whose display is to be repeated. (See Appendix B for a list of valid addresses.)
If no bus master or PC is to be used on the system, then set switch 8 to the ON position to getthe RDU to poll the detector. If multiple RDUs are used, only one RDU must be set to poll.
The RDU requires a 24 VDC power supply and is designed to be fitted into a 19-inch rack frame.
1-9.1 The Remote Display Unit Relay Board
The optional relay board provides separate relay outputs for all alarm levels from eachAIR-Intelligence detector driving a particular RDU.
Once the relay board is connected to the RDU (which must be powered off first), operation iscompletely automatic.
Relay contacts are provided for each alarm level, plus a normally energized common faultrelay.
1-9.2 Using a Remote Display Unit to Show Common Detector Status
Setting an RDU to address 0 will configure it to display the common alarm and fault status forall detectors when a Command Module is used in the network. No bargraph indication will beshown when the RDU is set to the common address.
If a relay board is fitted to an RDU set to address 0, then the relays will indicate common alarmand fault relays for all detectors.
This signal is sent from the Command Module, and is only available when a hardware commandmodule is used.
1-10 POWER SUPPLIES
The PC interface has its own internal power supply, which provides 24 Volts DC for the unit. Ifcomplete uninterruptable operation is required, the PC and SenseNET PC Interface should bepowered from an Uninterruptable Power Supply (UPS).
The power requirement for the RDU is 40mA max at 24 Volts.
June 2009 1-6 P/N 33-308100-006
Installation and Configuration
CHAPTER 2INSTALLATION AND CONFIGURATION
2-1 INTRODUCTION
This chapter provides instructions on how to install SenseNETTM software onto a PC and howto set up local and remote communication.
2-2 INSTALLING SENSENET ON THE PC
To install SenseNET on a PC:
1. From the Windows® desktop, close all programs that are currently running.
2. Attach the HASP® security device to the PC's USB port.
3. Insert the SenseNET CD.
4. If AutoRun is enabled on the computer, the AIR-Intelligence Introduction screenopens automatically in the explorer window.
5. If the program does not automatically start to load, locate the file titled “sensenet.exe,”using Windows Explorer.
6. Select “sensenet.exe” with the mouse pointer and double-click to launch the installation.
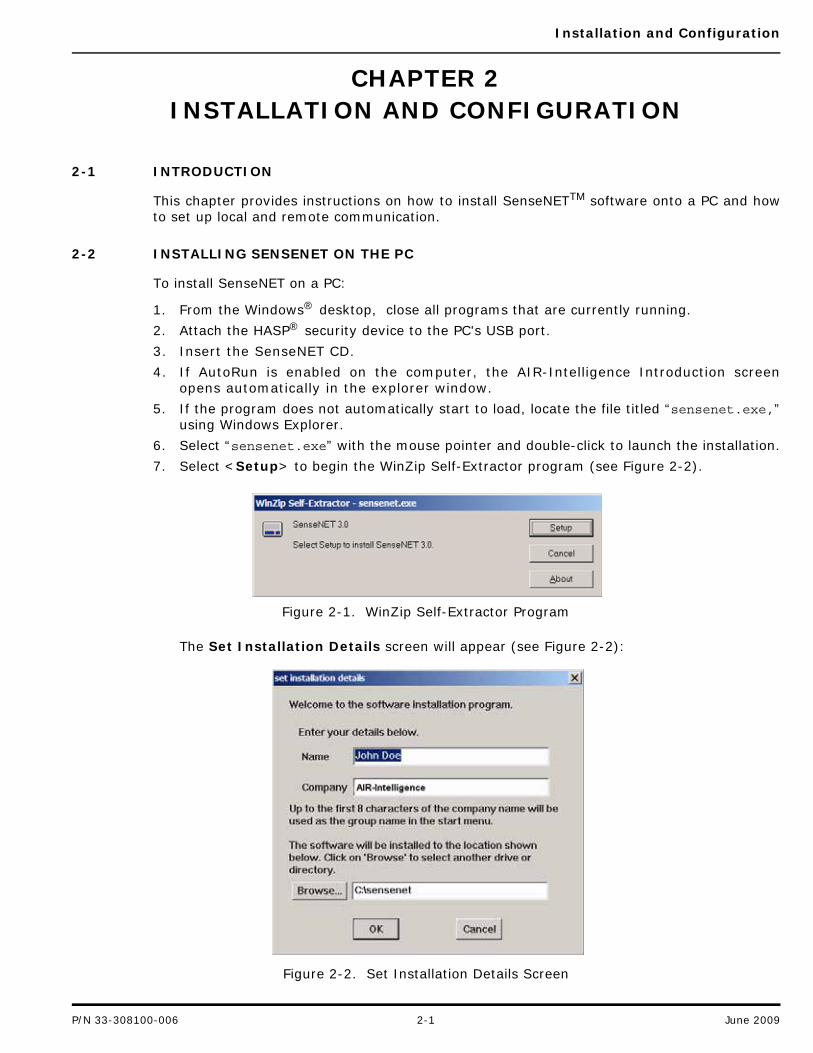
7. Select <Setup> to begin the WinZip Self-Extractor program (see Figure 2-2).
Figure 2-1. WinZip Self-Extractor Program
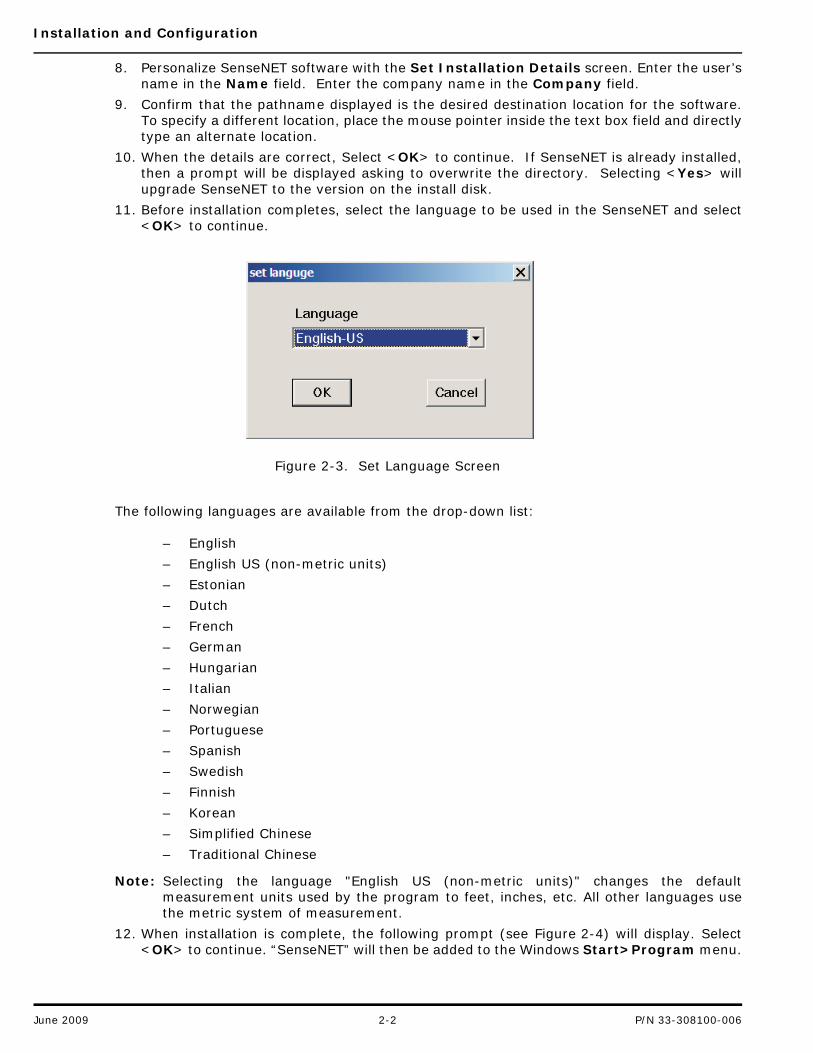
The Set Installation Details screen will appear (see Figure 2-2):
Figure 2-2. Set Installation Details Screen
P/N 33-308100-006 2-1 June 2009
Installation and Configuration
8. Personalize SenseNET software with the Set Installation Details screen. Enter the user’sname in the Name field. Enter the company name in the Company field.
9. Confirm that the pathname displayed is the desired destination location for the software.To specify a different location, place the mouse pointer inside the text box field and directlytype an alternate location.
10. When the details are correct, Select <OK> to continue. If SenseNET is already installed,then a prompt will be displayed asking to overwrite the directory. Selecting <Yes> willupgrade SenseNET to the version on the install disk.
11. Before installation completes, select the language to be used in the SenseNET and select<OK> to continue.
Figure 2-3. Set Language Screen
The following languages are available from the drop-down list:
– English
– English US (non-metric units)
– Estonian
– Dutch
– French
– German
– Hungarian
– Italian
– Norwegian
– Portuguese
– Spanish
– Swedish
– Finnish
– Korean
– Simplified Chinese
– Traditional Chinese
Note: Selecting the language "English US (non-metric units)" changes the defaultmeasurement units used by the program to feet, inches, etc. All other languages usethe metric system of measurement.
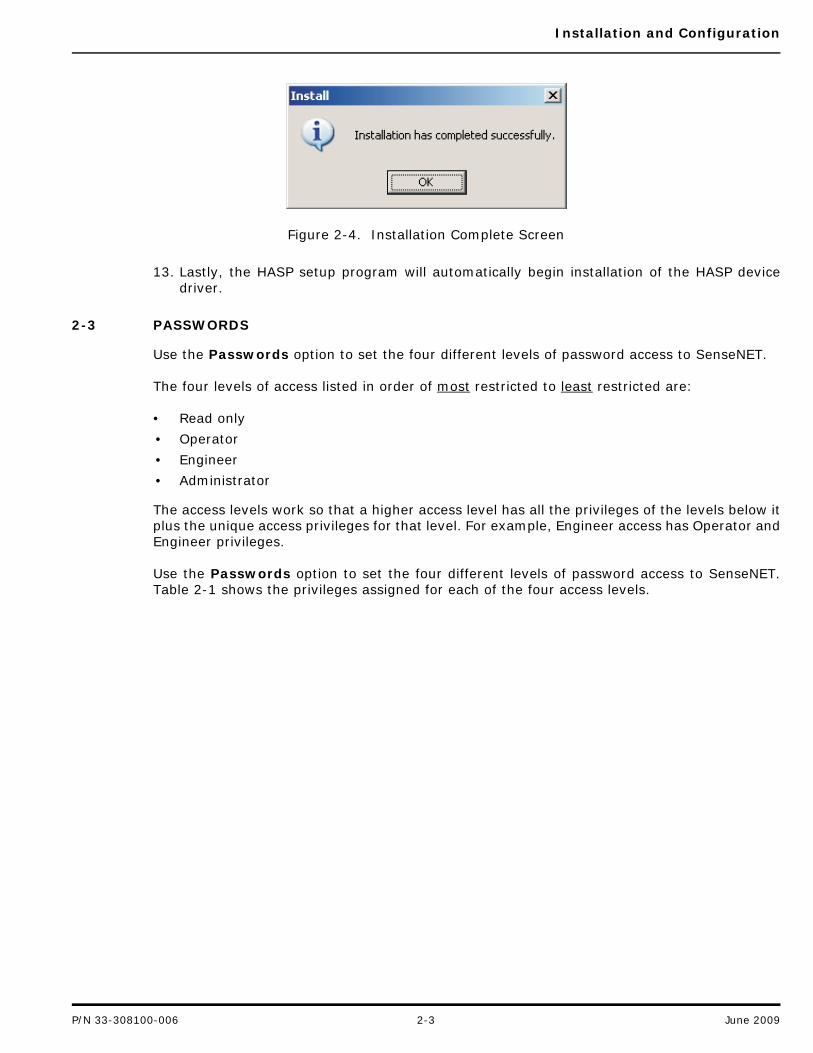
12. When installation is complete, the following prompt (see Figure 2-4) will display. Select<OK> to continue. “SenseNET” will then be added to the Windows Start>Program menu.
June 2009 2-2 P/N 33-308100-006
Installation and Configuration
Figure 2-4. Installation Complete Screen
13. Lastly, the HASP setup program will automatically begin installation of the HASP devicedriver.
2-3 PASSWORDS
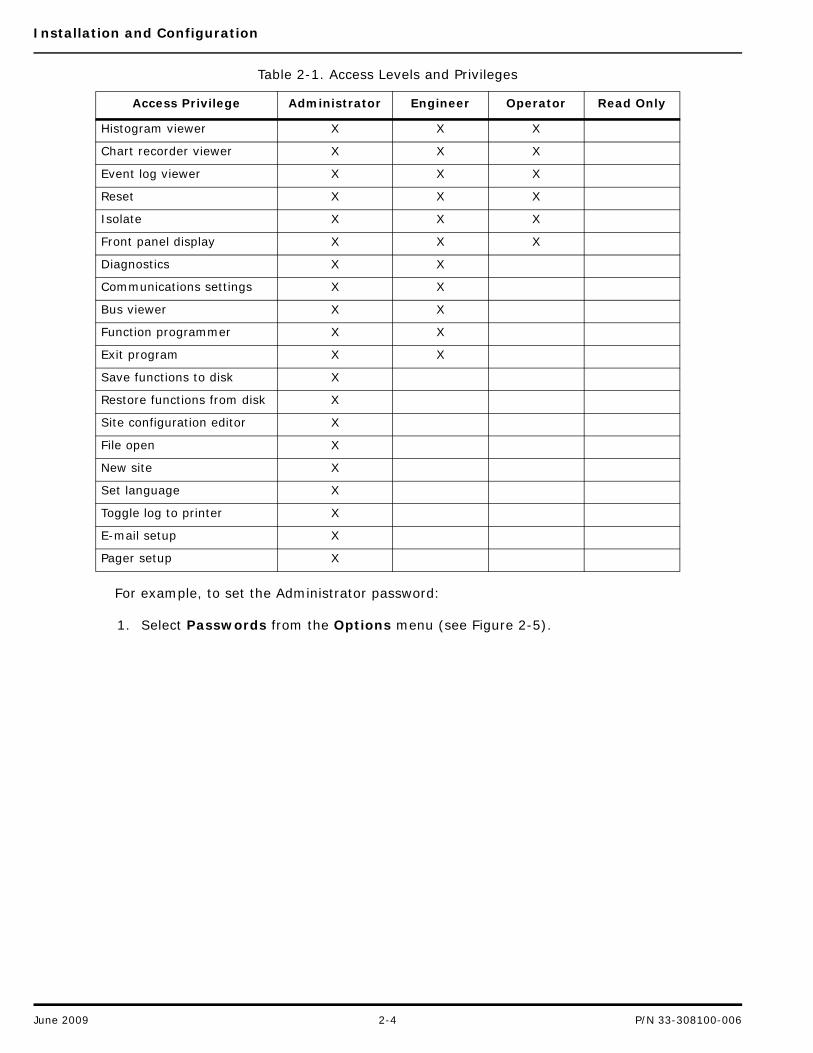
Use the Passwords option to set the four different levels of password access to SenseNET.
The four levels of access listed in order of most restricted to least restricted are:
• Read only
• Operator
• Engineer
• Administrator
The access levels work so that a higher access level has all the privileges of the levels below itplus the unique access privileges for that level. For example, Engineer access has Operator andEngineer privileges.
Use the Passwords option to set the four different levels of password access to SenseNET.Table 2-1 shows the privileges assigned for each of the four access levels.
P/N 33-308100-006 2-3 June 2009
Installation and Configuration
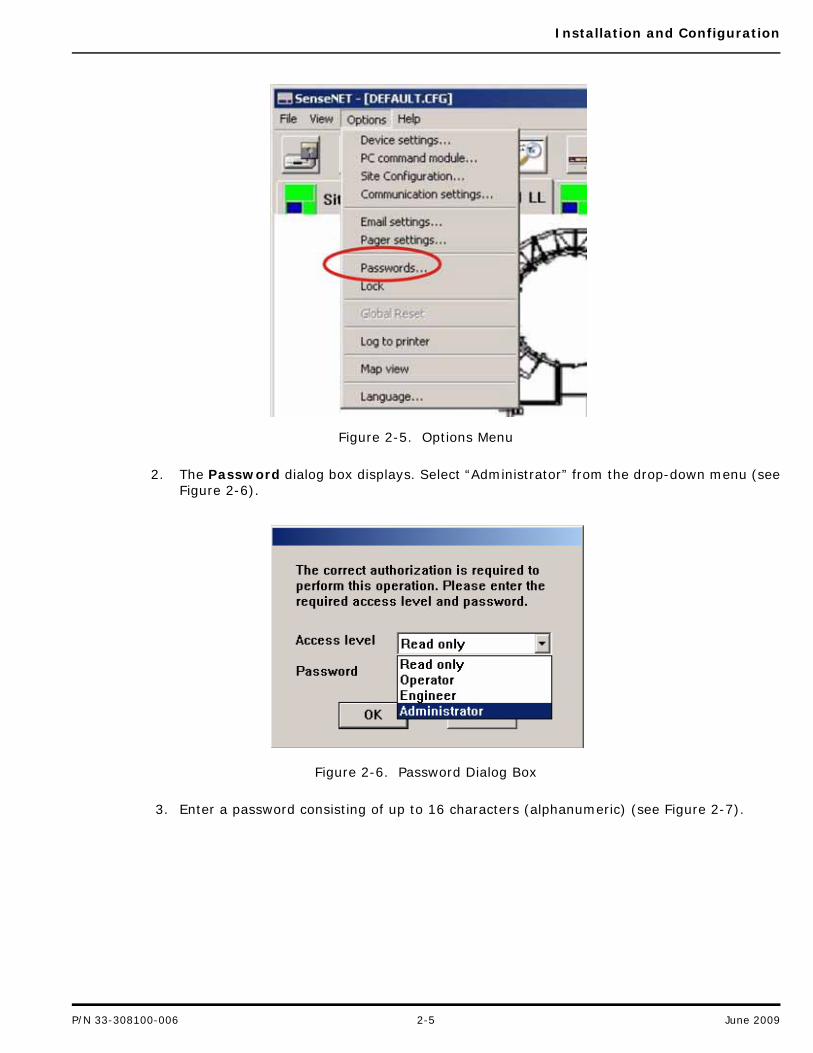
For example, to set the Administrator password:
1. Select Passwords from the Options menu (see Figure 2-5).
Table 2-1. Access Levels and Privileges
Access Privilege Administrator Engineer Operator Read Only
Histogram viewer X X X
Chart recorder viewer X X X
Event log viewer X X X
Reset X X X
Isolate X X X
Front panel display X X X
Diagnostics X X
Communications settings X X
Bus viewer X X
Function programmer X X
Exit program X X
Save functions to disk X
Restore functions from disk X
Site configuration editor X
File open X
New site X
Set language X
Toggle log to printer X
E-mail setup X
Pager setup X
June 2009 2-4 P/N 33-308100-006
Installation and Configuration
Figure 2-5. Options Menu
2. The Password dialog box displays. Select “Administrator” from the drop-down menu (seeFigure 2-6).
Figure 2-6. Password Dialog Box
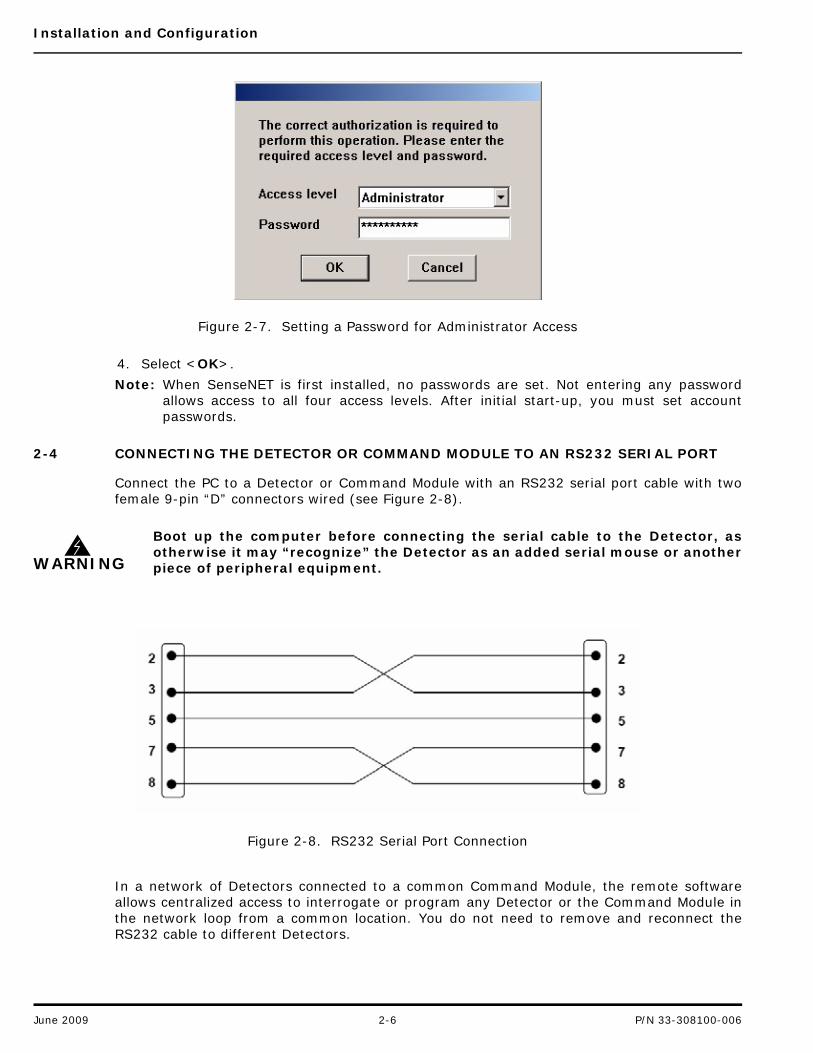
3. Enter a password consisting of up to 16 characters (alphanumeric) (see Figure 2-7).
P/N 33-308100-006 2-5 June 2009
Installation and Configuration
Figure 2-7. Setting a Password for Administrator Access
4. Select <OK>.
Note: When SenseNET is first installed, no passwords are set. Not entering any passwordallows access to all four access levels. After initial start-up, you must set accountpasswords.
2-4 CONNECTING THE DETECTOR OR COMMAND MODULE TO AN RS232 SERIAL PORT
Connect the PC to a Detector or Command Module with an RS232 serial port cable with twofemale 9-pin “D” connectors wired (see Figure 2-8).
Figure 2-8. RS232 Serial Port Connection
In a network of Detectors connected to a common Command Module, the remote softwareallows centralized access to interrogate or program any Detector or the Command Module inthe network loop from a common location. You do not need to remove and reconnect theRS232 cable to different Detectors.
WARNING
Boot up the computer before connecting the serial cable to the Detector, asotherwise it may “recognize” the Detector as an added serial mouse or anotherpiece of peripheral equipment.
June 2009 2-6 P/N 33-308100-006
Installation and Configuration
When connecting to an individual Detector in a network loop rather than to the CommandModule, SenseNET generates a “Comms fault” at the Command Module. This is normal,because the Detector’s RS485 communications are overridden by the RS232 communications.
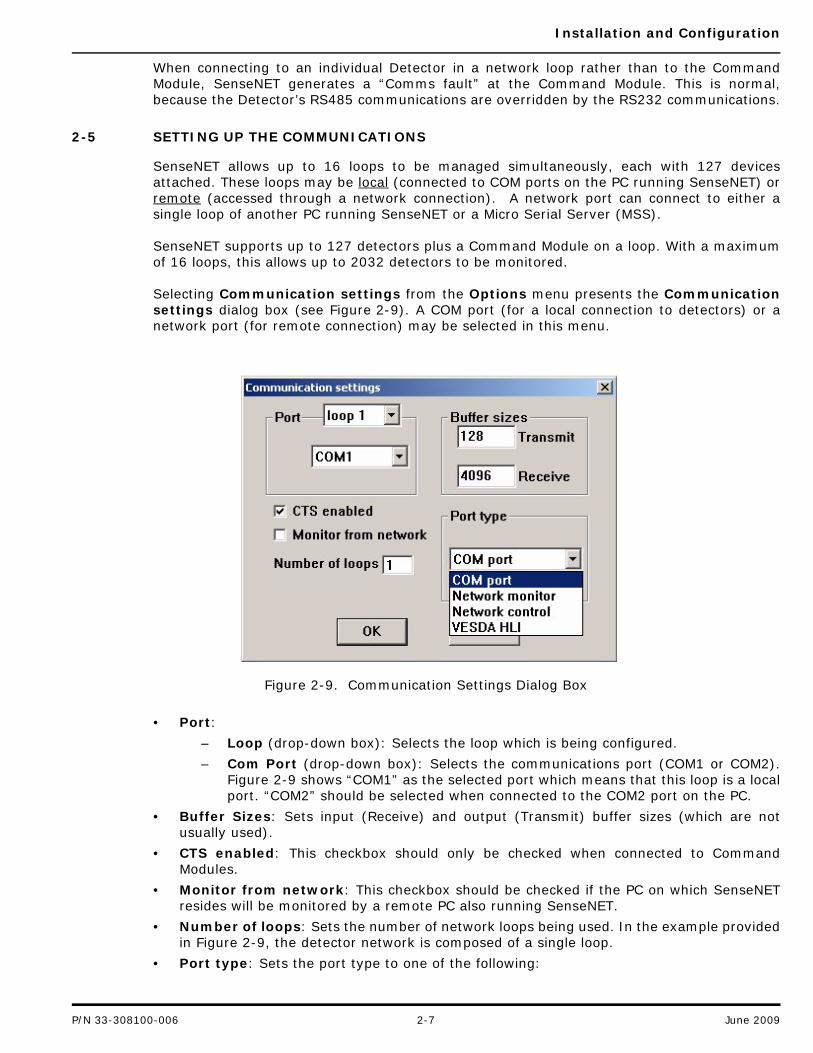
2-5 SETTING UP THE COMMUNICATIONS
SenseNET allows up to 16 loops to be managed simultaneously, each with 127 devicesattached. These loops may be local (connected to COM ports on the PC running SenseNET) orremote (accessed through a network connection). A network port can connect to either asingle loop of another PC running SenseNET or a Micro Serial Server (MSS).
SenseNET supports up to 127 detectors plus a Command Module on a loop. With a maximumof 16 loops, this allows up to 2032 detectors to be monitored.
Selecting Communication settings from the Options menu presents the Communicationsettings dialog box (see Figure 2-9). A COM port (for a local connection to detectors) or anetwork port (for remote connection) may be selected in this menu.
Figure 2-9. Communication Settings Dialog Box
• Port:
– Loop (drop-down box): Selects the loop which is being configured.
– Com Port (drop-down box): Selects the communications port (COM1 or COM2).Figure 2-9 shows “COM1” as the selected port which means that this loop is a localport. “COM2” should be selected when connected to the COM2 port on the PC.
• Buffer Sizes: Sets input (Receive) and output (Transmit) buffer sizes (which are notusually used).
• CTS enabled: This checkbox should only be checked when connected to CommandModules.
• Monitor from network: This checkbox should be checked if the PC on which SenseNETresides will be monitored by a remote PC also running SenseNET.
• Number of loops: Sets the number of network loops being used. In the example providedin Figure 2-9, the detector network is composed of a single loop.
• Port type: Sets the port type to one of the following:
P/N 33-308100-006 2-7 June 2009

Installation and Configuration
– COM port: local port
– Network monitor: allows you to set up local and remote communications usingmultiple PCs (See Section 2-5.1 for details).
– Network control: allows you to set up local and remote communications usingmultiple PCs (See Section 2-5.1 for details).
– VESDA HLI: Allows the PC on which SenseNET software resides to monitor orcontrol a VESDA®netTM network using the Vesda Open Protocol HLITM (model VHX-0300). (See Section 2-5.2 for details.)
2-5.1 Setting Up Local and Remote Communications Using Multiple PCs
If you want to configure your site setup for local or remote communications using multiple PCs(either a remote PC or MSS server), set the Port type drop-down menu to either of thefollowing:
• Network monitor
• Network control
When you select a remote port of either of these types, the Port value changes (as shown inFigure 2-10).
Figure 2-10. Communication Settings Port Area Alternate Display (Network Monitor and Control)
• Computer/address: Set to either the computer name or IP address of the remote PC orMSS. In the example shown in Figure 2-10, the address is set to IP address 200.20.1.90.
• Loop: Set to the loop to be monitored on the remote PC. In the example shown inFigure 2-10, the loop value is set to “loop 1.” If the loop to be monitored is an MSS unit,set the Loop value to 1.
2-5.2 Setting Up Local and Remote Communications to Monitor a VESDAnet Network
If you want to configure your site setup for local or remote communications using VESDA OpenProtocol HLI to monitor a VESDAnet network, set the Port drop-down menu to “VESDA HLI.”
When you select VESDA HLI as the port type, “Network ID” replaces “Loop” as the valuedisplayed for the item Port (see Figure 2-11). Network ID is set to 0.
June 2009 2-8 P/N 33-308100-006

Installation and Configuration
Figure 2-11. Communication Settings Port Area Alternate Display (VESDA HLI)
2-5.3 Sample Network Configuration
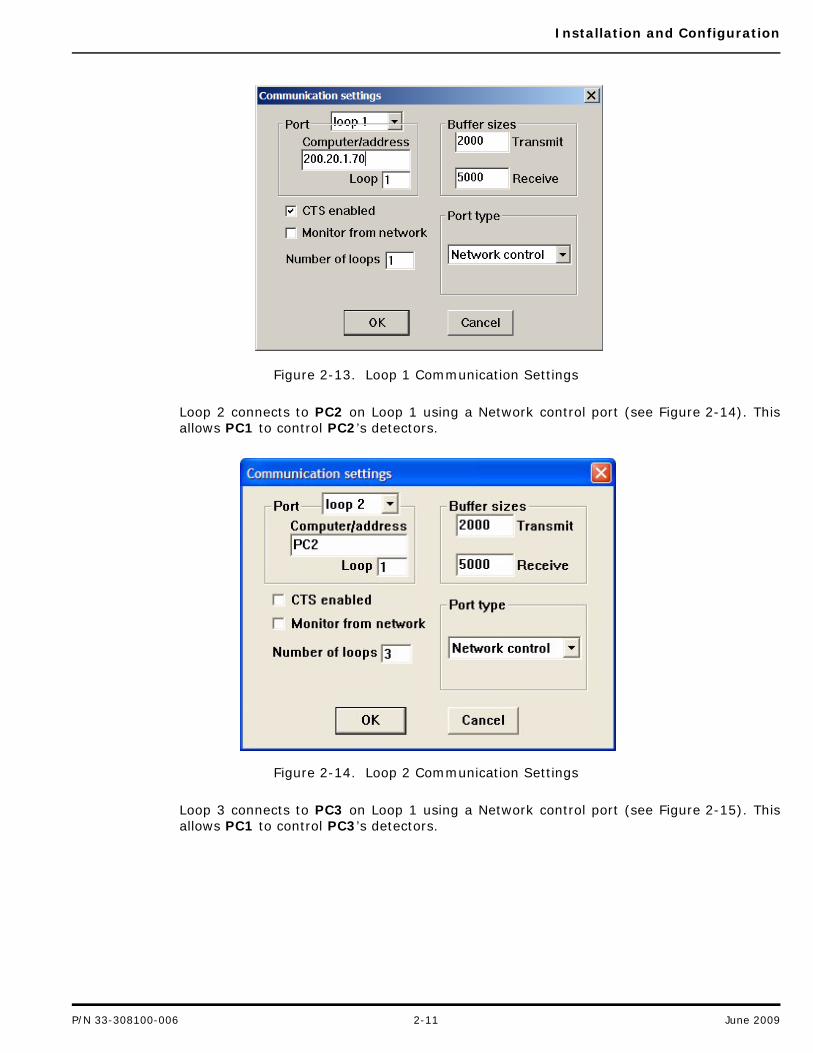
The sample SenseNET network configuration shown in Figure 2-12 shows how SenseNET canuse a network connection instead of a COM port for monitoring or controlling a loop.
The sample network configuration shown in Figure 2-12 contains three PCs running SenseNET:
• Computer “PC1” is monitoring a Micro Serial Server (MSS) which is connected via RS485to a Command Module monitoring up to 127 AIR-Intelligence detectors. This type ofconnection allows monitoring only (Port Type is set to “Network monitor”). Loop is set tothe loop which will be monitored by the remote PC. In this case, it is set to “1” (as shownin Figure 2-13). When monitoring a MSS unit, the Loop must be set to “1.” The TCP/IPaddress of this MSS is fixed at 200.20.1.70 (so this is used as the computer/address.)
P/N 33-308100-006 2-9 June 2009

Installation and Configuration
Figure 2-12. Sample SenseNET Network Configuration
Computer: PC1
MSS
Command Module
ASD-160H ASD-160H
Detector 1 Detector 2
...up to 127Detectors
Computer: PC2
PCInterface
ASD-160H ASD-160H
Detector 1 Detector 2
...up to 127Detectors
COM1
Computer: PC3
COM1
RS-232
RS-485
RS-232
Command Module
101 102 103 104 105
110 109 108 107 106
RS-485
RS-485
ASD-640 Detectors
June 2009 2-10 P/N 33-308100-006
Installation and Configuration
Figure 2-13. Loop 1 Communication Settings
Loop 2 connects to PC2 on Loop 1 using a Network control port (see Figure 2-14). Thisallows PC1 to control PC2’s detectors.
Figure 2-14. Loop 2 Communication Settings
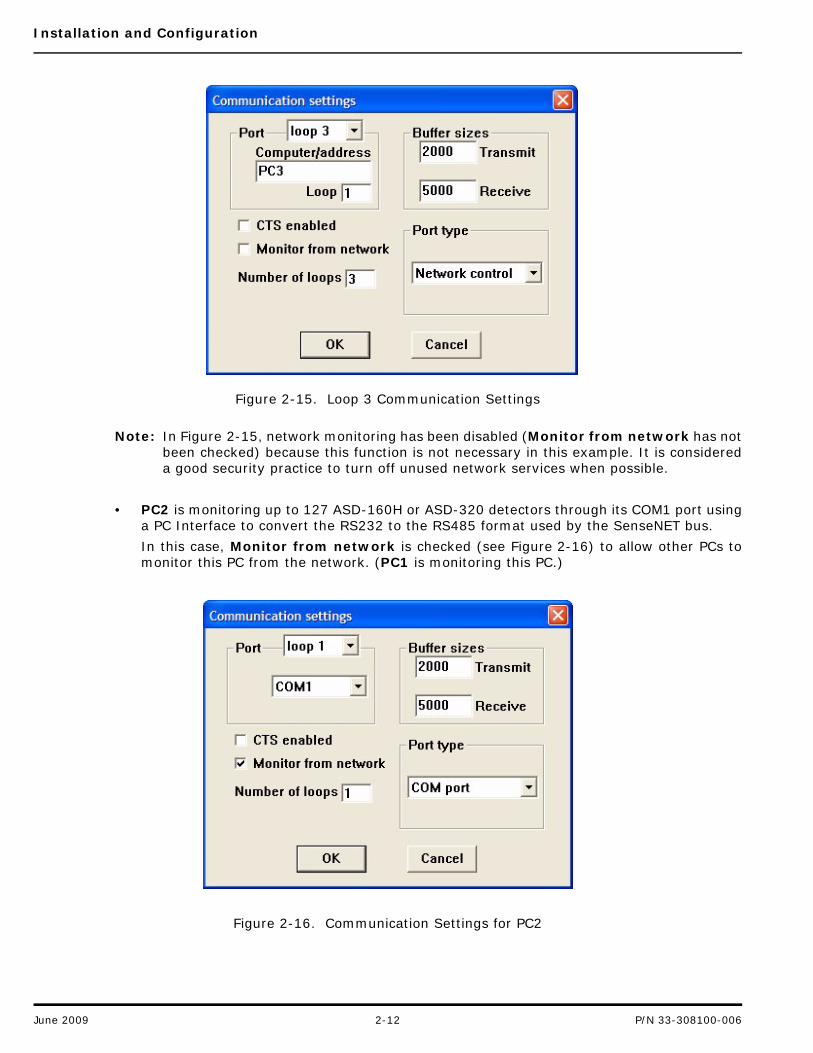
Loop 3 connects to PC3 on Loop 1 using a Network control port (see Figure 2-15). Thisallows PC1 to control PC3’s detectors.
P/N 33-308100-006 2-11 June 2009
Installation and Configuration
Figure 2-15. Loop 3 Communication Settings
Note: In Figure 2-15, network monitoring has been disabled (Monitor from network has notbeen checked) because this function is not necessary in this example. It is considereda good security practice to turn off unused network services when possible.
• PC2 is monitoring up to 127 ASD-160H or ASD-320 detectors through its COM1 port usinga PC Interface to convert the RS232 to the RS485 format used by the SenseNET bus.
In this case, Monitor from network is checked (see Figure 2-16) to allow other PCs tomonitor this PC from the network. (PC1 is monitoring this PC.)
Figure 2-16. Communication Settings for PC2
June 2009 2-12 P/N 33-308100-006
Installation and Configuration
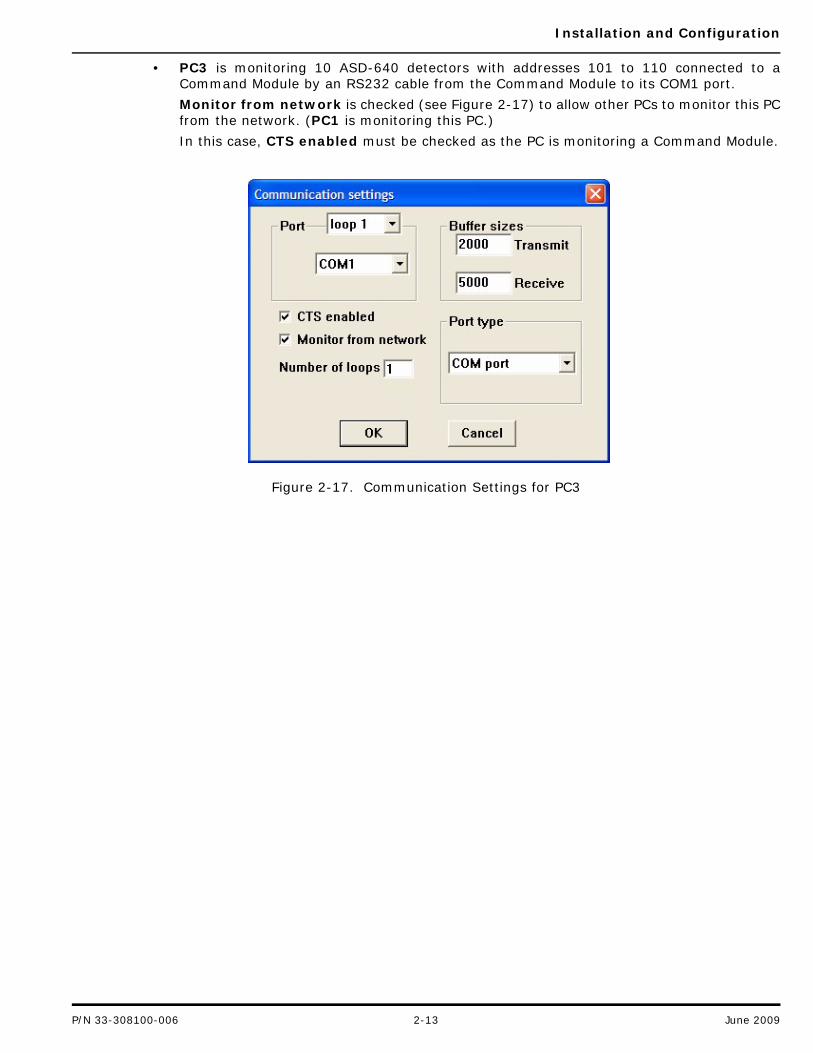
• PC3 is monitoring 10 ASD-640 detectors with addresses 101 to 110 connected to aCommand Module by an RS232 cable from the Command Module to its COM1 port.
Monitor from network is checked (see Figure 2-17) to allow other PCs to monitor this PCfrom the network. (PC1 is monitoring this PC.)
In this case, CTS enabled must be checked as the PC is monitoring a Command Module.
Figure 2-17. Communication Settings for PC3
P/N 33-308100-006 2-13 June 2009

Installation and Configuration
THIS PAGE INTENTIONALLY LEFT BLANK.
June 2009 2-14 P/N 33-308100-006
Site Configuration
CHAPTER 3SITE CONFIGURATION
3-1 INTRODUCTION
SenseNETTM has been designed to simplify configuration, monitoring, and management of anysite with two or more detectors. SenseNET is capable of managing up to 16 loops of 127detectors for one PC graphic system. SenseNET uses an auto-discover mode called SiteScan™.to locate all connected bus devices and reads their configuration settings (which includes thedevice information), making the process quick and less prone to error.
The following steps will create a new site that reflects the hardware setup:
1. To set up SenseNET for a site, all detectors must be attached to the bus and each detectormust have a unique address (as explained in the pertinent detector manual).
2. From the main menu, select File>New site to create a new site and provide a descriptivefile name for the site when prompted.
3. SenseNET prompts you to ensure all detectors are powered up. Select <Yes> to continuewhen ready.
4. The bus is scanned for all detectors and their current function settings are saved to disk.This process may take several minutes but only has to be done once.
Note: Detector addresses do not need to be contiguous—which means that there can be gapsin the address range.
5. The Site Configuration Editor is displayed. If no site maps or actions are required, thenthe set-up is complete. Proceed to step 7.
6. Use the Site Configuration Editor to set up detector maps, alarm/fault actions, andzones (see Section 3-2.1 for details).
7. Close the Site Configuration Editor. The bargraph displays are updated to show the newsite configuration.
The new site will now automatically be loaded each time SenseNET is started.
3-1.1 Configuring a Basic Network
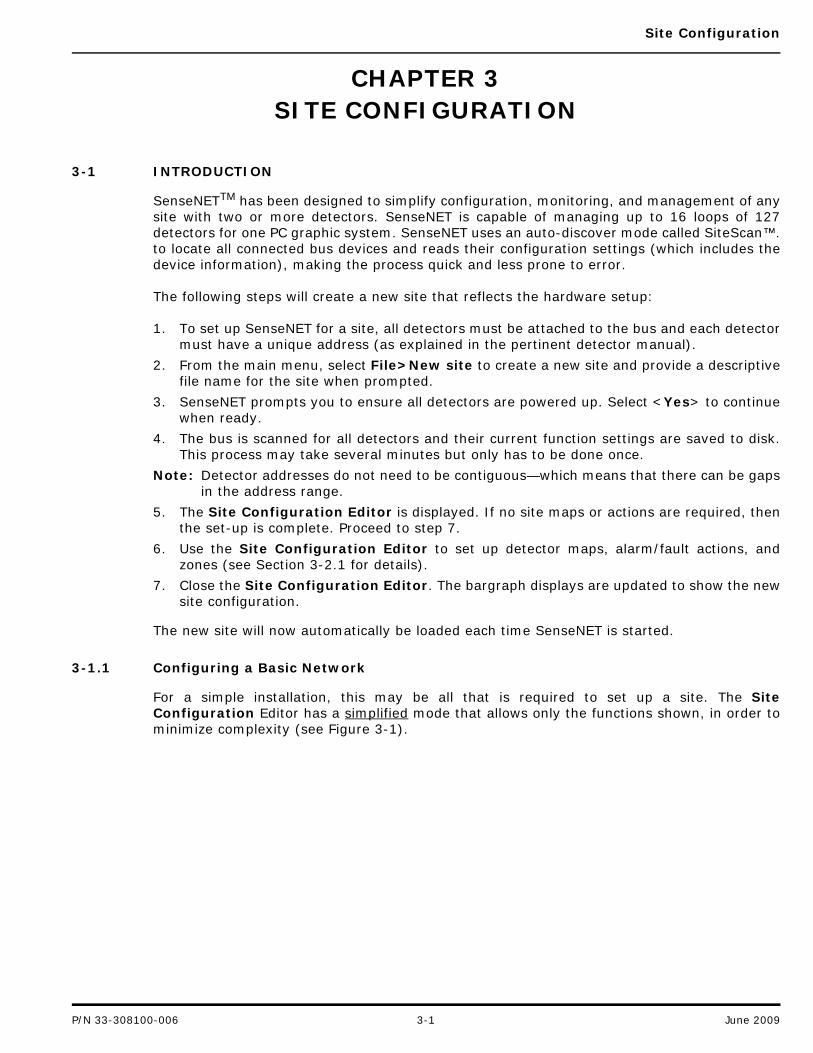
For a simple installation, this may be all that is required to set up a site. The SiteConfiguration Editor has a simplified mode that allows only the functions shown, in order tominimize complexity (see Figure 3-1).
P/N 33-308100-006 3-1 June 2009
Site Configuration
Figure 3-1. Site Configuration Screen (Simple Mode)
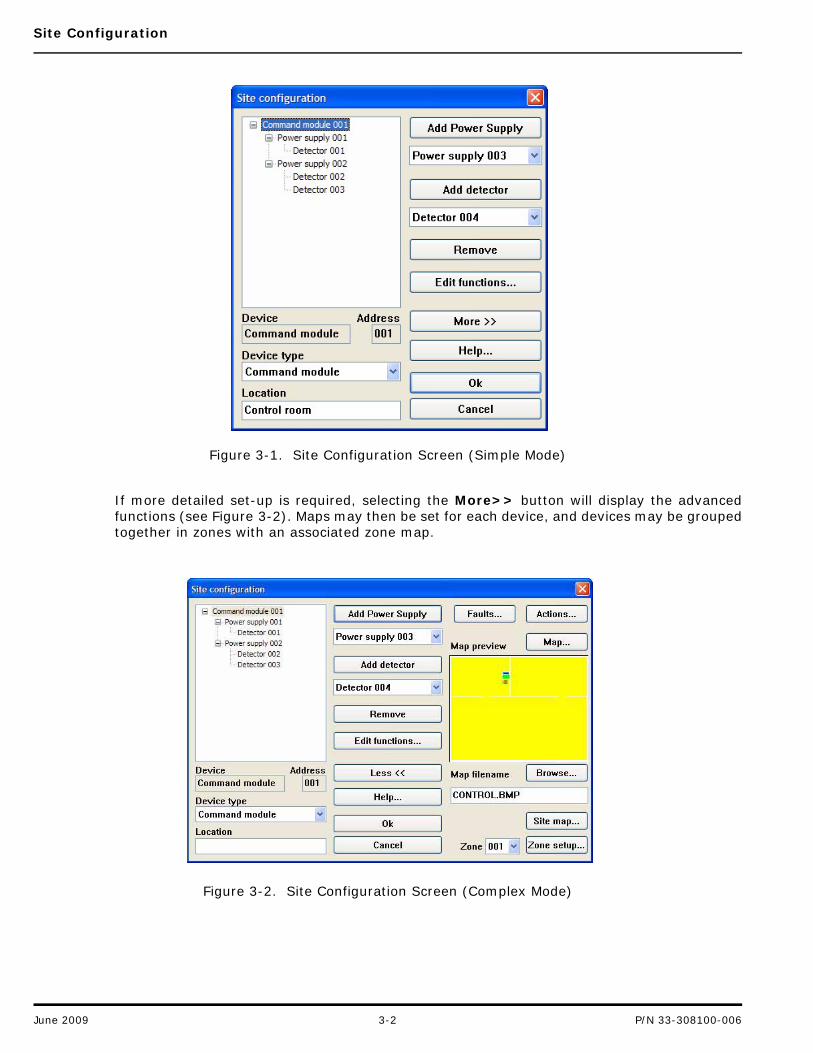
If more detailed set-up is required, selecting the More>> button will display the advancedfunctions (see Figure 3-2). Maps may then be set for each device, and devices may be groupedtogether in zones with an associated zone map.
Figure 3-2. Site Configuration Screen (Complex Mode)
June 2009 3-2 P/N 33-308100-006
Site Configuration
3-1.2 Remote Configuration Software
SenseNET also includes features from the Remote Configuration Software program (suppliedwith every AIR-Intelligence detector) that augment commissioning and maintenance. TheRemote Configuration Software program allows you to configure and monitor programmablefunctions for the detectors and the Command Module from a desktop computer or PC.
Using the Remote Configuration Software program, a detector can be programmed directlyfrom within SenseNET. Typical programming settings set the time and date, change alarmlevels, and control how the detector responds to an alarm threshold being reached.
Groups of detectors can also be simultaneously set using the Remote Configuration Softwareprogram. A typical example would be synchronizing the time and date held in all detectors.
The Remote Configuration Software program enables the user to configure the followingaspects of detectors and Command Modules:
• Device settings
• Communications settings
• Global Reset of devices
• Status displays
The Remote Configuration Software program also allows you to display the following types ofstatus information for the networked detectors and Command Module:
• Communications bus
• Diagnostics
• Chart recordings
• Event logs
• ClassiFire histogram
Refer to the AIR-Intelligence Remote Configuration Software User’s Guide (P/N 33-308100-004) for details.
3-2 MANAGING YOUR SITE CONFIGURATION
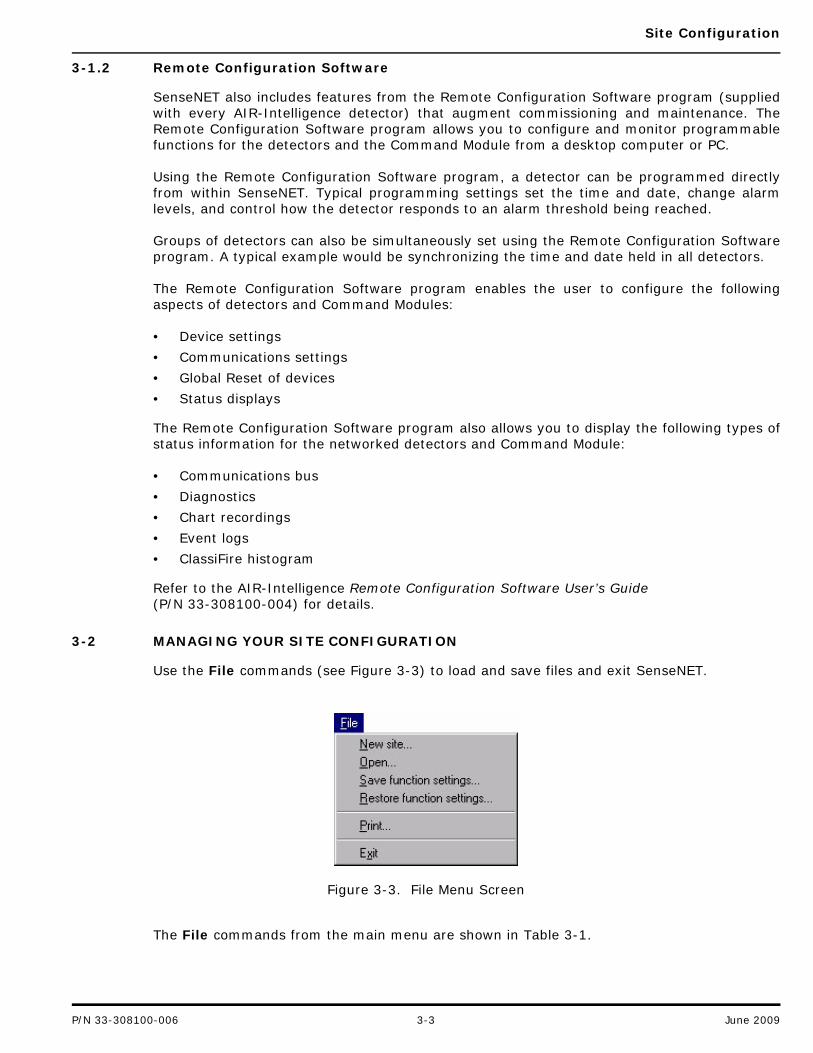
Use the File commands (see Figure 3-3) to load and save files and exit SenseNET.
Figure 3-3. File Menu Screen
The File commands from the main menu are shown in Table 3-1.
P/N 33-308100-006 3-3 June 2009
Site Configuration
3-2.1 The Site Configuration Editor
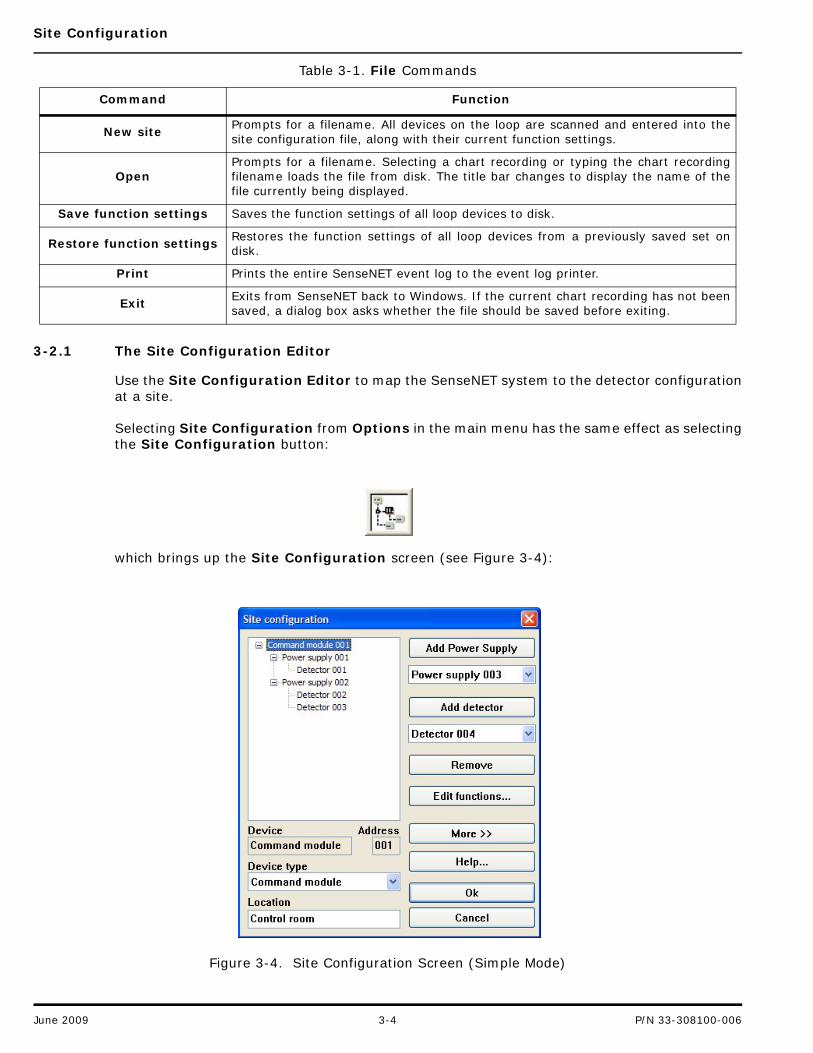
Use the Site Configuration Editor to map the SenseNET system to the detector configurationat a site.
Selecting Site Configuration from Options in the main menu has the same effect as selectingthe Site Configuration button:
which brings up the Site Configuration screen (see Figure 3-4):
Figure 3-4. Site Configuration Screen (Simple Mode)
Table 3-1. File Commands
Command Function
New sitePrompts for a filename. All devices on the loop are scanned and entered into thesite configuration file, along with their current function settings.
OpenPrompts for a filename. Selecting a chart recording or typing the chart recordingfilename loads the file from disk. The title bar changes to display the name of thefile currently being displayed.
Save function settings Saves the function settings of all loop devices to disk.
Restore function settingsRestores the function settings of all loop devices from a previously saved set ondisk.
Print Prints the entire SenseNET event log to the event log printer.
ExitExits from SenseNET back to Windows. If the current chart recording has not beensaved, a dialog box asks whether the file should be saved before exiting.
June 2009 3-4 P/N 33-308100-006
Site Configuration
Note: Normal alarm operation is suspended when the Site Configuration Editor is active.
The Site Configuration Editor has two modes of operation:
• Simplified (Less<<): Used by an administrator to set up the basic configuration neededfor SenseNET. This allows setting detector type and function programming (if the detectorsupports it).
• Full (More>>): Allows access to the advanced features such as setting alarm and faultactions:
You must add all detectors in the system to the site configuration list:
1. Specify Device type using its drop-down list. After you close the site editor, the bargraphdisplay updates to show bargraphs for all defined detectors.
2. In the Location text box, enter the detector’s location.
3-2.2 Simplified Site Configuration Editor Functions
The Simplified Site Configuration Editor screen (see Figure 3-4) displays the functionsshown in Table 3-2:
3-2.3 Full Site Configuration Editor Functions
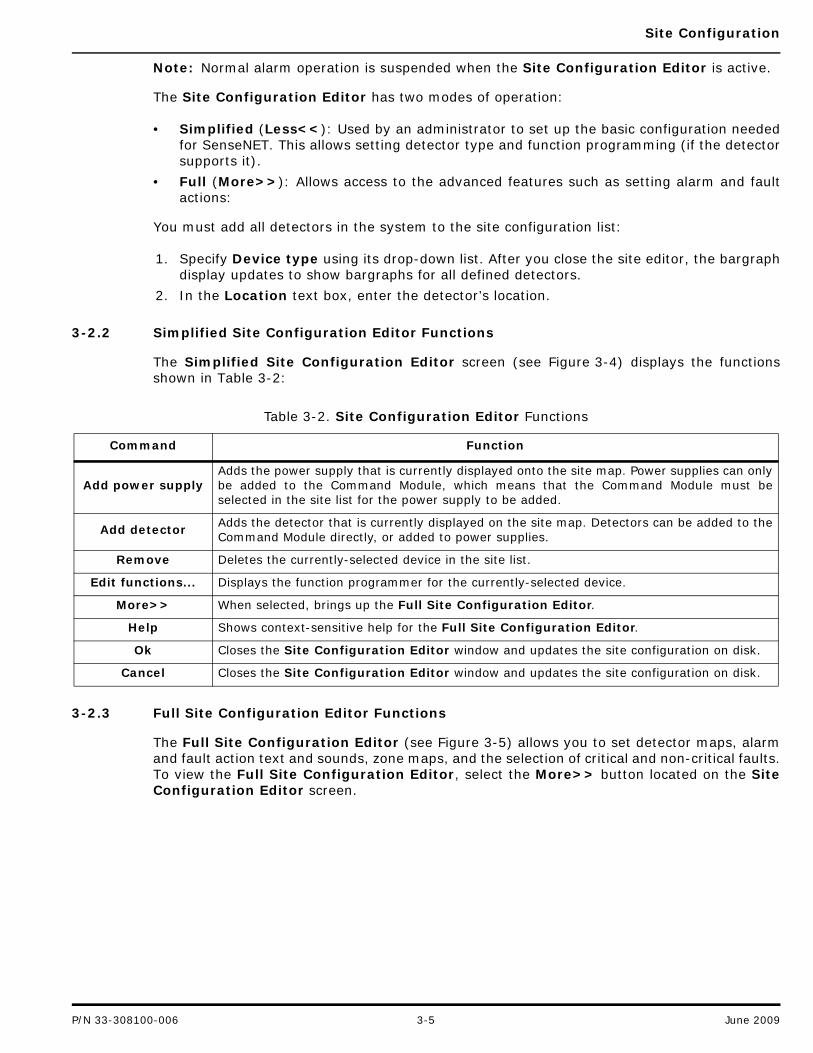
The Full Site Configuration Editor (see Figure 3-5) allows you to set detector maps, alarmand fault action text and sounds, zone maps, and the selection of critical and non-critical faults.To view the Full Site Configuration Editor, select the More>> button located on the SiteConfiguration Editor screen.
Table 3-2. Site Configuration Editor Functions
Command Function
Add power supplyAdds the power supply that is currently displayed onto the site map. Power supplies can onlybe added to the Command Module, which means that the Command Module must beselected in the site list for the power supply to be added.
Add detectorAdds the detector that is currently displayed on the site map. Detectors can be added to theCommand Module directly, or added to power supplies.
Remove Deletes the currently-selected device in the site list.
Edit functions... Displays the function programmer for the currently-selected device.
More>> When selected, brings up the Full Site Configuration Editor.
Help Shows context-sensitive help for the Full Site Configuration Editor.
Ok Closes the Site Configuration Editor window and updates the site configuration on disk.
Cancel Closes the Site Configuration Editor window and updates the site configuration on disk.
P/N 33-308100-006 3-5 June 2009
Site Configuration
Figure 3-5. Full Site Configuration Editor Screen
The Full Site Configuration Editor screen contains the following functions shown inTable 3-3:
3-2.4 Adding a New Device to an Existing Site Configuration
There are two methods to add a new device (e.g., a detector or power supply), to theSenseNET site configuration:
1. If no site details, such as maps, have been set up, then the quickest way to add the newdevice is to select File>New site from the main menu to scan all detectors and theirsettings into the site configuration.
Note: Selecting File>New site will delete any existing detector and zone bitmapdefinitions and alarm and fault actions.
2. If an existing site has been configured, in order to preserve existing bitmaps and actions:
Table 3-3. Full Site Configuration Editor Functions
Command Function
Map previewClicking the appropriate position on the Map preview can set the detector position on the display.If no map is selected, then a text message is displayed on a white background.
Less<< Brings up the Simplified Site Configuration Editor.
FaultsDisplays the critical/non-critical fault set-up dialog. (See Section 3-2.5 for information on thecritical fault dialog.)
ActionsSets up action text messages and sound files for faults and alarm levels. (See Section 5-14 formore information on how to set alarm and fault actions.)
Browse Allows selection of the map for the currently-selected detector.
Site map Allows selection of the site map for the loop that the currently-selected detector is connected to.
Zone set-upAllows selection of the map for the zone that this detector is in. (See Section 3-2.7.2 forinformation on how to set zone information.)
June 2009 3-6 P/N 33-308100-006
Site Configuration
a. Enter the Site Configuration Editor.
b. Add the appropriate device.
c. Select File>Save function settings from the main menu to transfer the currentfunction settings of the new detector to the site configuration file.
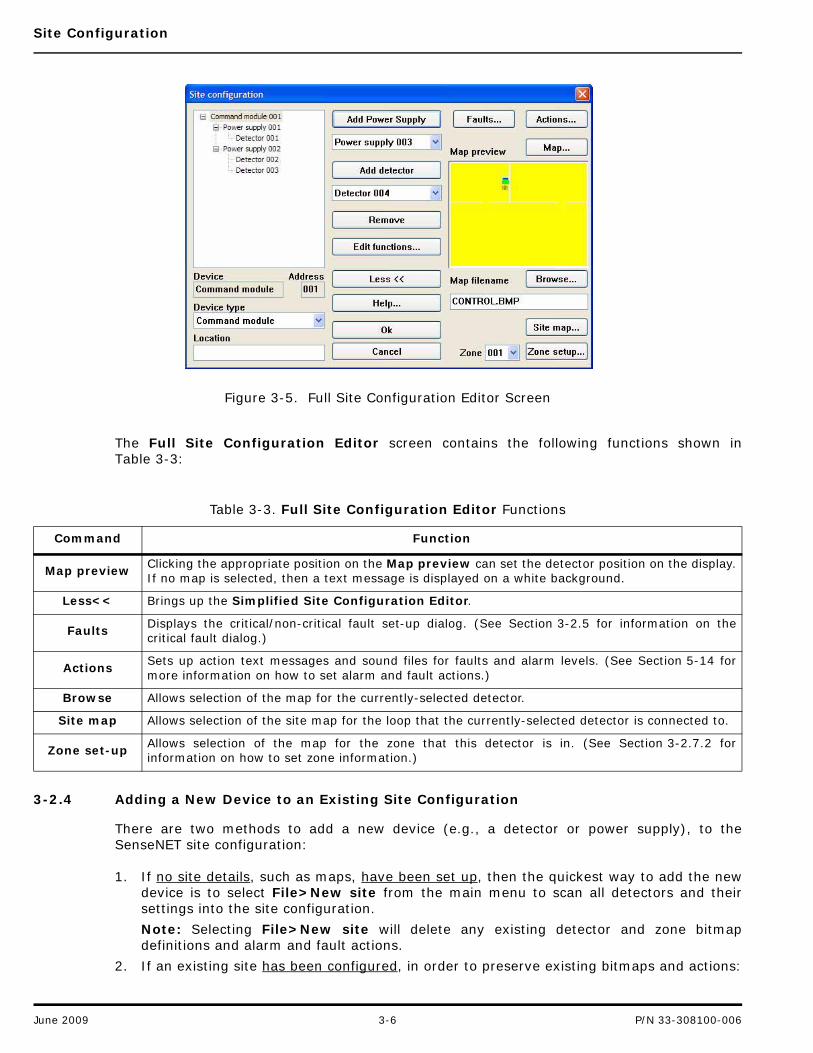
3-2.5 Critical Fault Setup
The SenseNET system allows faults to be allocated either “critical” or “non-critical” status. Thecritical fault selection dialog (see Figure 3-6) is displayed by selecting the <Faults> button inthe Site Configuration Editor. It determines whether individual faults on the currently-selected detector are critical or non-critical.
• Selecting a box means that this fault is a critical fault, and when it occurs, the critical faultaction text and sound is used in the alarm viewer.
• Clearing a box means that the noncritical fault actions are used in the alarm viewer. Whena detector is first defined, all of its faults are set to be critical faults by default.
Figure 3-6. Critical Faults Screen
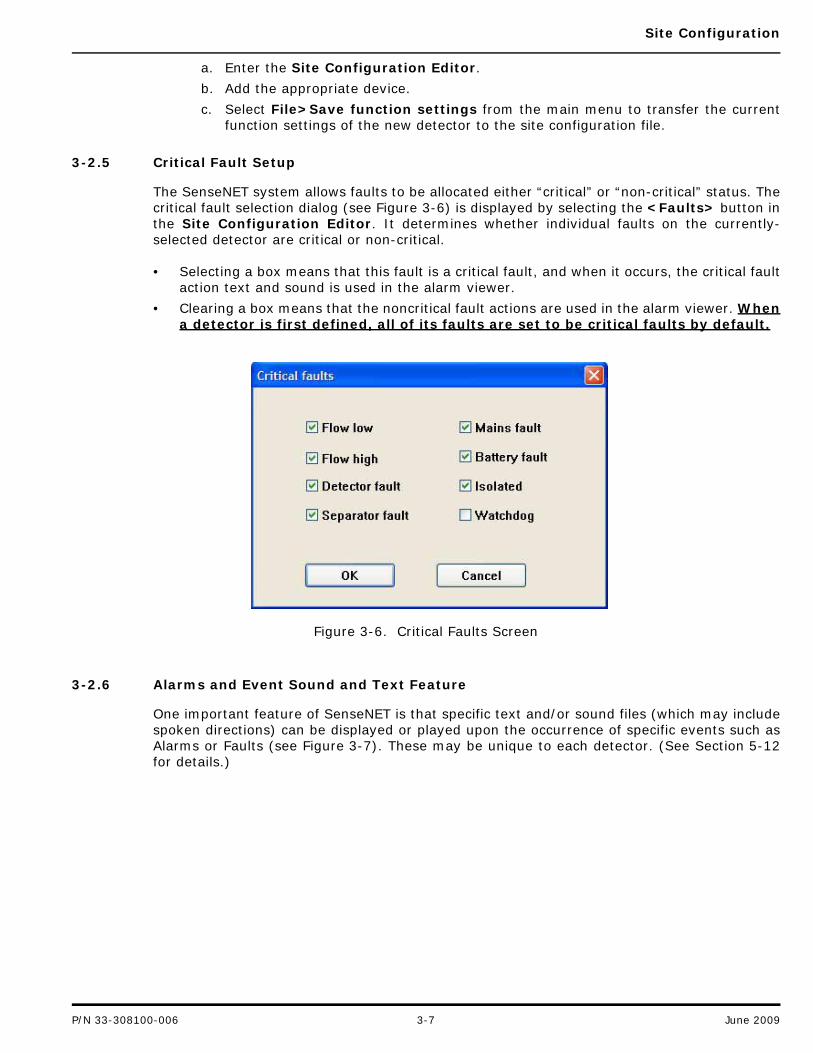
3-2.6 Alarms and Event Sound and Text Feature
One important feature of SenseNET is that specific text and/or sound files (which may includespoken directions) can be displayed or played upon the occurrence of specific events such asAlarms or Faults (see Figure 3-7). These may be unique to each detector. (See Section 5-12for details.)
P/N 33-308100-006 3-7 June 2009
Site Configuration
Figure 3-7. Alarm and Fault Speech and Text Files
The text shown when events occur can also be sent to a pager (or compatible GSM phone usinga modem) or via E-mail if the PC running SenseNET is connected to a network. This allows sitepersonnel to react quickly to service requests (such as failing standby batteries).
3-2.7 Setting Device and Zone Maps
The SenseNET system can store site maps of protected areas in which one or more devices arebeing used. When an alarm occurs, these maps may be viewed to show all detectors in a zone,helping to pinpoint the area of danger.
SenseNET site maps are standard Windows bitmap (.bmp) files that are created in an imageeditor program capable of creating .bmp files. Maps are scaled to fit the display window.Display of 24-bit bitmaps is not supported. Individual site maps can be set for any device inthe site list (command Modules, detectors, and power supplies).
Figure 3-8 and Figure 3-9 show sample site maps.
June 2009 3-8 P/N 33-308100-006
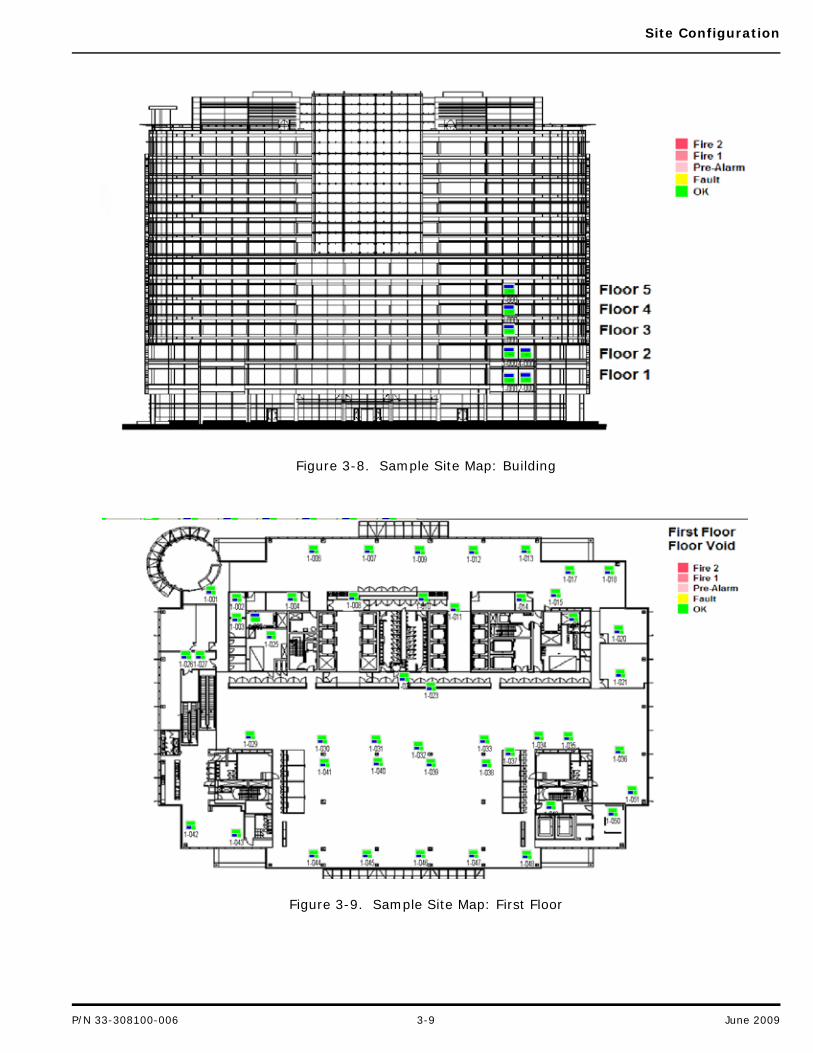
Site Configuration
Figure 3-8. Sample Site Map: Building
Figure 3-9. Sample Site Map: First Floor
P/N 33-308100-006 3-9 June 2009
Site Configuration
3-2.7.1 SETTING A DEVICE MAP
To set a site map for a detector (for example, Detector 24):
1. Create a map in an image editor program capable of editing bitmap files (such asMicrosoft® Paint).
2. Start SenseNET if it has not already been started.
3. Enter the Site Configuration Editor and select More>> to display the Full SiteConfiguration Editor.
Note: The SenseNET access level must be set to “Administrator” to enter the SiteConfiguration Editor.
4. From the Device Type drop-down list, select Detector. In the Site ConfigurationEditor, scroll to display the correct detector, depending on the number of devices in thesite configuration.
5. Click <Browse> and select the map file. Click <Open> to return to the SiteConfiguration Editor screen. The map filename and path will now be displayed in theMap filename box.
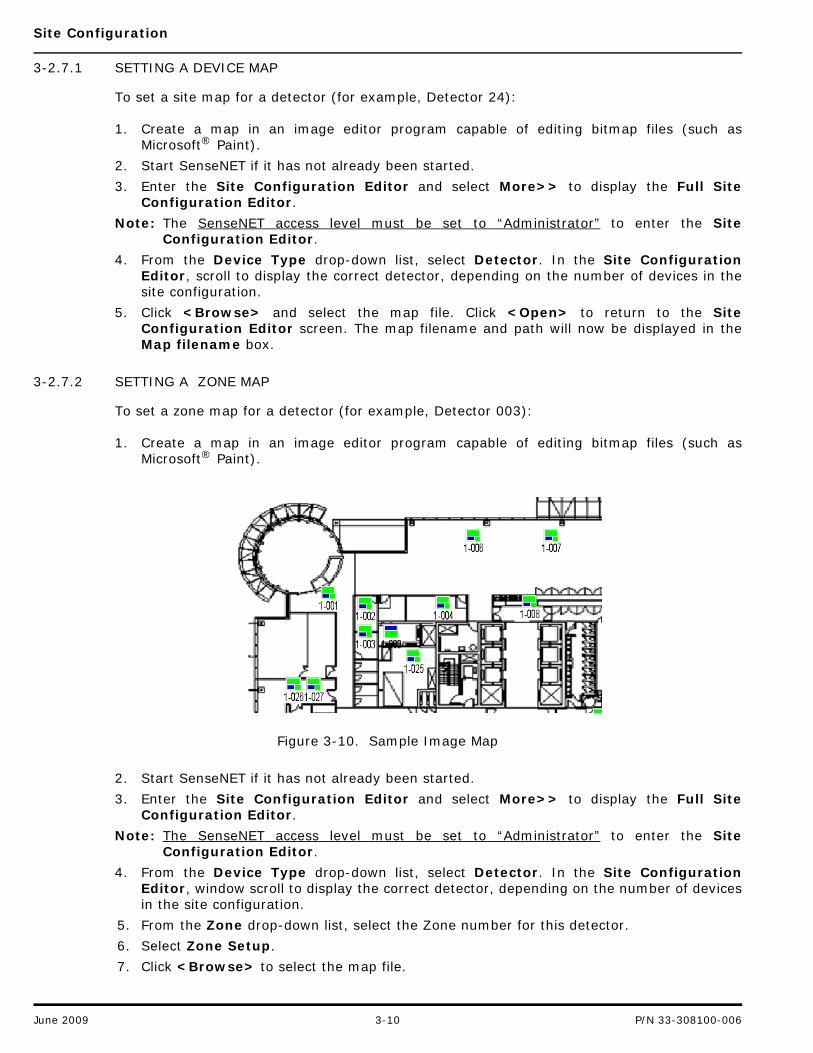
3-2.7.2 SETTING A ZONE MAP
To set a zone map for a detector (for example, Detector 003):
1. Create a map in an image editor program capable of editing bitmap files (such asMicrosoft® Paint).
Figure 3-10. Sample Image Map
2. Start SenseNET if it has not already been started.
3. Enter the Site Configuration Editor and select More>> to display the Full SiteConfiguration Editor.
Note: The SenseNET access level must be set to “Administrator” to enter the SiteConfiguration Editor.
4. From the Device Type drop-down list, select Detector. In the Site ConfigurationEditor, window scroll to display the correct detector, depending on the number of devicesin the site configuration.
5. From the Zone drop-down list, select the Zone number for this detector.
6. Select Zone Setup.
7. Click <Browse> to select the map file.
June 2009 3-10 P/N 33-308100-006
Site Configuration
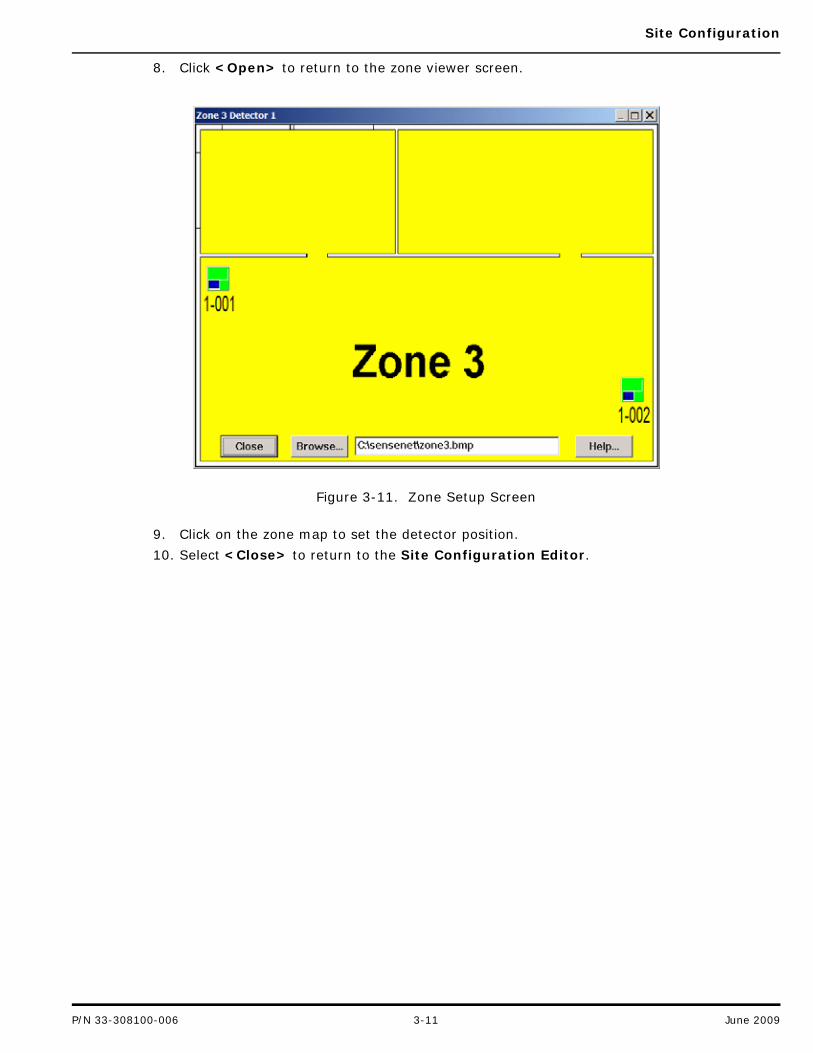
8. Click <Open> to return to the zone viewer screen.
Figure 3-11. Zone Setup Screen
9. Click on the zone map to set the detector position.
10. Select <Close> to return to the Site Configuration Editor.
P/N 33-308100-006 3-11 June 2009

Site Configuration
THIS PAGE INTENTIONALLY LEFT BLANK.
June 2009 3-12 P/N 33-308100-006
Status and Informational Displays
CHAPTER 4STATUS AND INFORMATIONAL DISPLAYS
4-1 SENSENET TOOL BAR
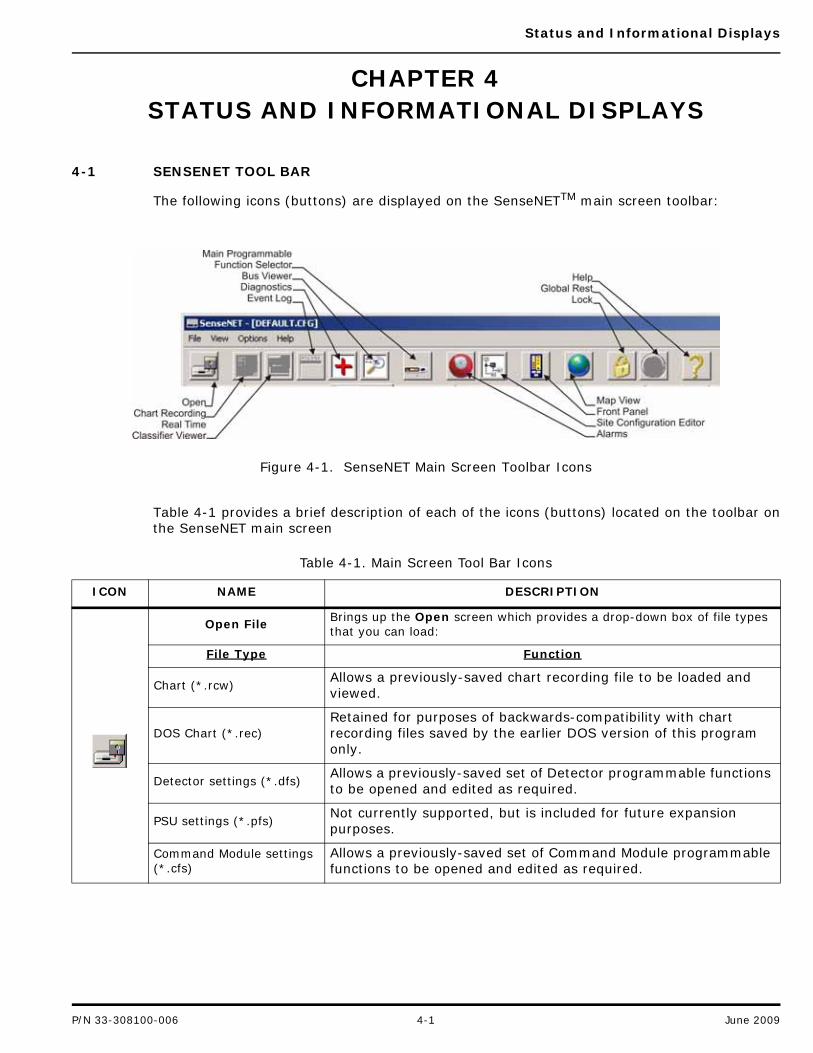
The following icons (buttons) are displayed on the SenseNETTM main screen toolbar:
Figure 4-1. SenseNET Main Screen Toolbar Icons
Table 4-1 provides a brief description of each of the icons (buttons) located on the toolbar onthe SenseNET main screen
Table 4-1. Main Screen Tool Bar Icons
ICON NAME DESCRIPTION
Open FileBrings up the Open screen which provides a drop-down box of file types that you can load:
File Type Function
Chart (*.rcw)Allows a previously-saved chart recording file to be loaded and viewed.
DOS Chart (*.rec)Retained for purposes of backwards-compatibility with chart recording files saved by the earlier DOS version of this program only.
Detector settings (*.dfs)Allows a previously-saved set of Detector programmable functions to be opened and edited as required.
PSU settings (*.pfs)Not currently supported, but is included for future expansion purposes.
Command Module settings (*.cfs)
Allows a previously-saved set of Command Module programmable functions to be opened and edited as required.
P/N 33-308100-006 4-1 June 2009
Status and Informational Displays
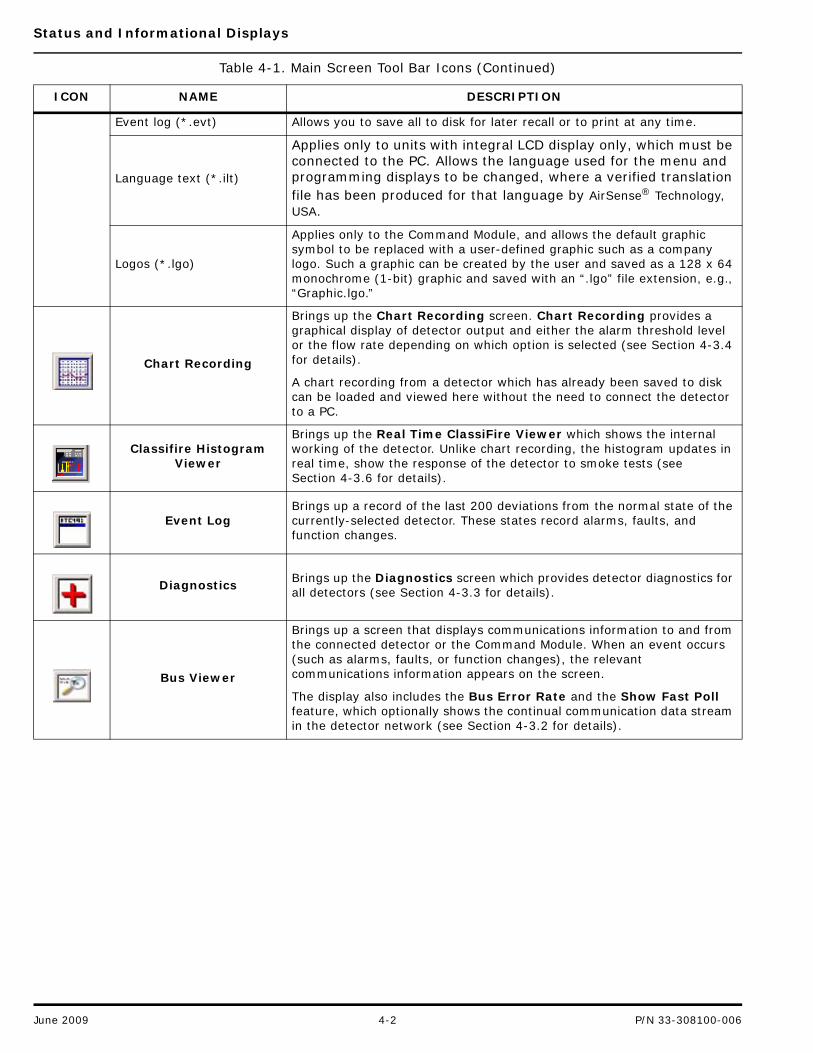
Event log (*.evt) Allows you to save all to disk for later recall or to print at any time.
Language text (*.ilt)
Applies only to units with integral LCD display only, which must be connected to the PC. Allows the language used for the menu and programming displays to be changed, where a verified translation file has been produced for that language by AirSense® Technology, USA.
Logos (*.lgo)
Applies only to the Command Module, and allows the default graphic symbol to be replaced with a user-defined graphic such as a company logo. Such a graphic can be created by the user and saved as a 128 x 64 monochrome (1-bit) graphic and saved with an “.lgo” file extension, e.g., “Graphic.lgo.”
Chart Recording
Brings up the Chart Recording screen. Chart Recording provides a graphical display of detector output and either the alarm threshold level or the flow rate depending on which option is selected (see Section 4-3.4 for details).
A chart recording from a detector which has already been saved to disk can be loaded and viewed here without the need to connect the detector to a PC.
Classifire Histogram Viewer
Brings up the Real Time ClassiFire Viewer which shows the internal working of the detector. Unlike chart recording, the histogram updates in real time, show the response of the detector to smoke tests (see Section 4-3.6 for details).
Event LogBrings up a record of the last 200 deviations from the normal state of the currently-selected detector. These states record alarms, faults, and function changes.
DiagnosticsBrings up the Diagnostics screen which provides detector diagnostics for all detectors (see Section 4-3.3 for details).
Bus Viewer
Brings up a screen that displays communications information to and from the connected detector or the Command Module. When an event occurs (such as alarms, faults, or function changes), the relevant communications information appears on the screen.
The display also includes the Bus Error Rate and the Show Fast Poll feature, which optionally shows the continual communication data stream in the detector network (see Section 4-3.2 for details).
Table 4-1. Main Screen Tool Bar Icons (Continued)
ICON NAME DESCRIPTION
June 2009 4-2 P/N 33-308100-006
Status and Informational Displays
4-2 THE FILE MENU
Selecting File from the main menu shows the following commands:
• New site: Prompts you for a file name. After you supply the filename, all of the deviceson the loop are then scanned and entered into the site configuration file, along with theircurrent function settings.
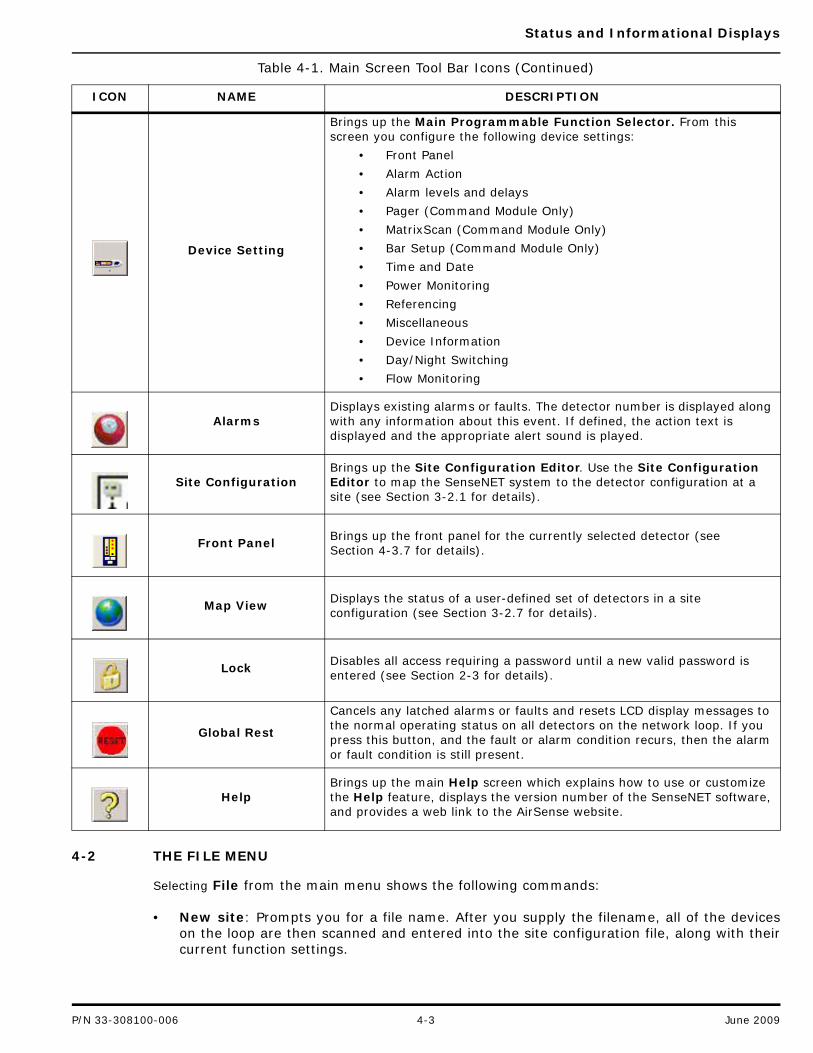
Device Setting
Brings up the Main Programmable Function Selector. From this screen you configure the following device settings:
• Front Panel
• Alarm Action
• Alarm levels and delays
• Pager (Command Module Only)
• MatrixScan (Command Module Only)
• Bar Setup (Command Module Only)
• Time and Date
• Power Monitoring
• Referencing
• Miscellaneous
• Device Information
• Day/Night Switching
• Flow Monitoring
AlarmsDisplays existing alarms or faults. The detector number is displayed along with any information about this event. If defined, the action text is displayed and the appropriate alert sound is played.
Site ConfigurationBrings up the Site Configuration Editor. Use the Site Configuration Editor to map the SenseNET system to the detector configuration at a site (see Section 3-2.1 for details).
Front PanelBrings up the front panel for the currently selected detector (see Section 4-3.7 for details).
Map ViewDisplays the status of a user-defined set of detectors in a site configuration (see Section 3-2.7 for details).
LockDisables all access requiring a password until a new valid password is entered (see Section 2-3 for details).
Global Rest
Cancels any latched alarms or faults and resets LCD display messages to the normal operating status on all detectors on the network loop. If you press this button, and the fault or alarm condition recurs, then the alarm or fault condition is still present.
HelpBrings up the main Help screen which explains how to use or customize the Help feature, displays the version number of the SenseNET software, and provides a web link to the AirSense website.
Table 4-1. Main Screen Tool Bar Icons (Continued)
ICON NAME DESCRIPTION
P/N 33-308100-006 4-3 June 2009
Status and Informational Displays
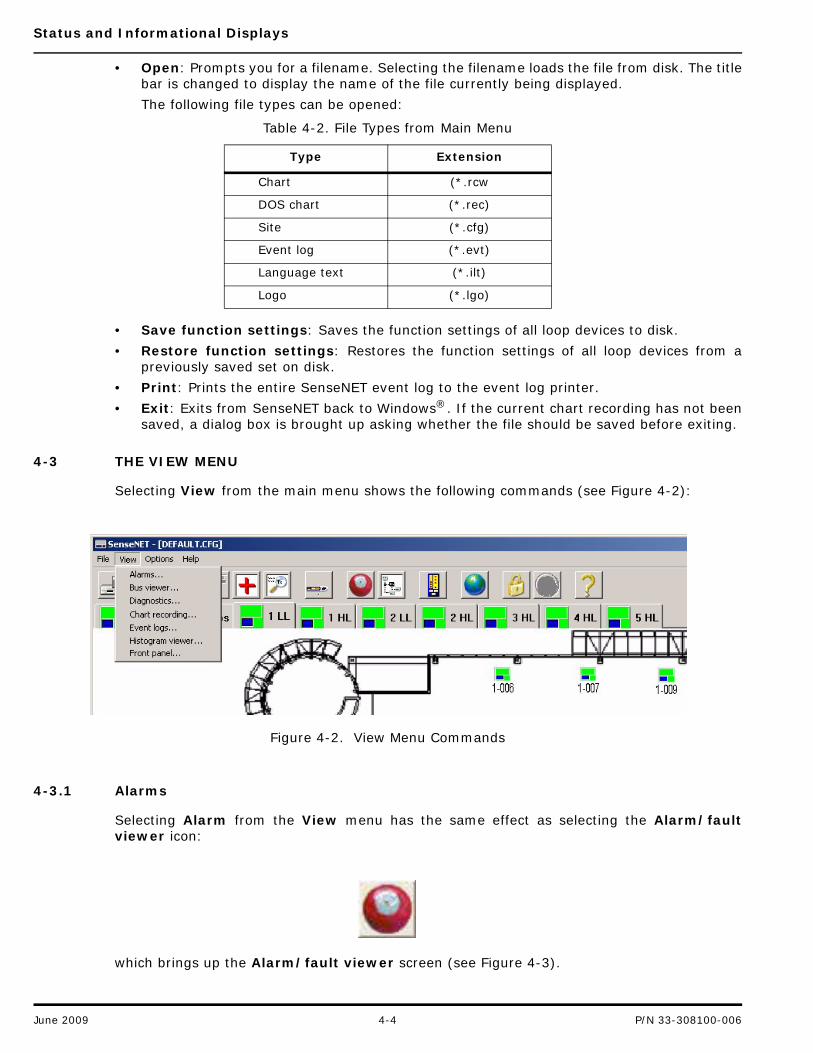
• Open: Prompts you for a filename. Selecting the filename loads the file from disk. The titlebar is changed to display the name of the file currently being displayed.
The following file types can be opened:
• Save function settings: Saves the function settings of all loop devices to disk.
• Restore function settings: Restores the function settings of all loop devices from apreviously saved set on disk.
• Print: Prints the entire SenseNET event log to the event log printer.
• Exit: Exits from SenseNET back to Windows®. If the current chart recording has not beensaved, a dialog box is brought up asking whether the file should be saved before exiting.
4-3 THE VIEW MENU
Selecting View from the main menu shows the following commands (see Figure 4-2):
Figure 4-2. View Menu Commands
4-3.1 Alarms
Selecting Alarm from the View menu has the same effect as selecting the Alarm/faultviewer icon:
which brings up the Alarm/fault viewer screen (see Figure 4-3).
Table 4-2. File Types from Main Menu
Type Extension
Chart (*.rcw
DOS chart (*.rec)
Site (*.cfg)
Event log (*.evt)
Language text (*.ilt)
Logo (*.lgo)
June 2009 4-4 P/N 33-308100-006
Status and Informational Displays
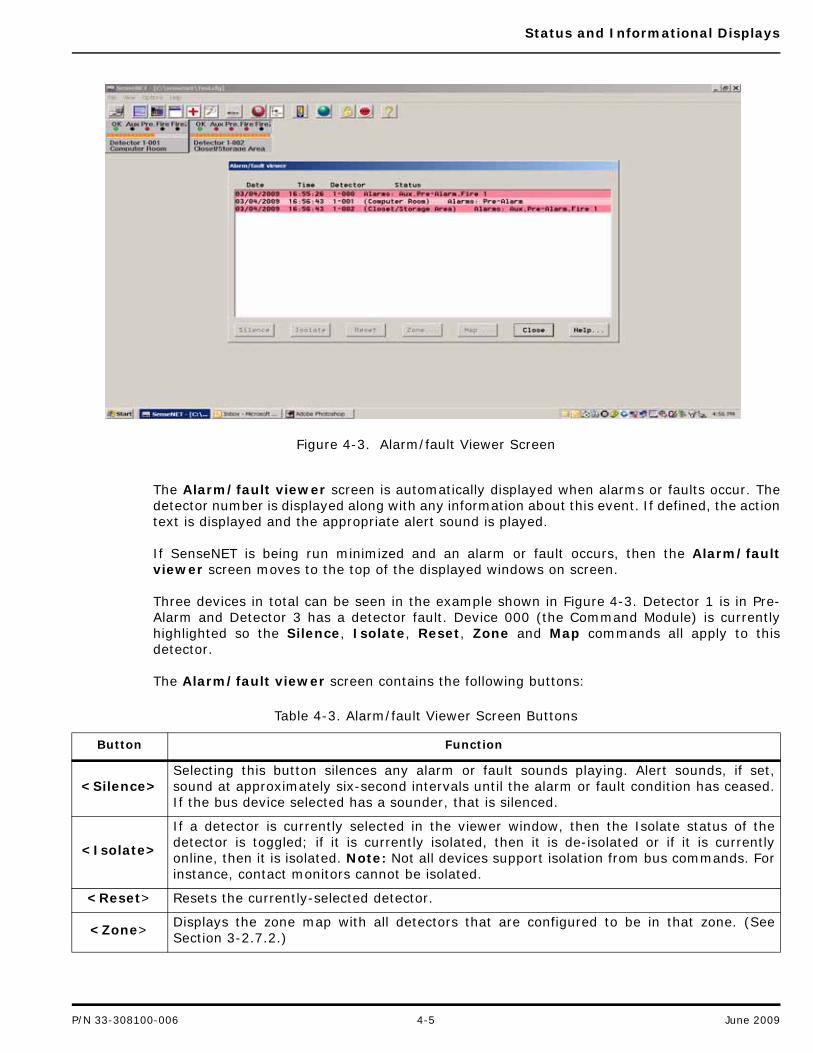
Figure 4-3. Alarm/fault Viewer Screen
The Alarm/fault viewer screen is automatically displayed when alarms or faults occur. Thedetector number is displayed along with any information about this event. If defined, the actiontext is displayed and the appropriate alert sound is played.
If SenseNET is being run minimized and an alarm or fault occurs, then the Alarm/faultviewer screen moves to the top of the displayed windows on screen.
Three devices in total can be seen in the example shown in Figure 4-3. Detector 1 is in Pre-Alarm and Detector 3 has a detector fault. Device 000 (the Command Module) is currentlyhighlighted so the Silence, Isolate, Reset, Zone and Map commands all apply to thisdetector.
The Alarm/fault viewer screen contains the following buttons:
Table 4-3. Alarm/fault Viewer Screen Buttons
Button Function
<Silence>Selecting this button silences any alarm or fault sounds playing. Alert sounds, if set,sound at approximately six-second intervals until the alarm or fault condition has ceased.If the bus device selected has a sounder, that is silenced.
<Isolate>
If a detector is currently selected in the viewer window, then the Isolate status of thedetector is toggled; if it is currently isolated, then it is de-isolated or if it is currentlyonline, then it is isolated. Note: Not all devices support isolation from bus commands. Forinstance, contact monitors cannot be isolated.
<Reset> Resets the currently-selected detector.
<Zone> Displays the zone map with all detectors that are configured to be in that zone. (SeeSection 3-2.7.2.)
P/N 33-308100-006 4-5 June 2009
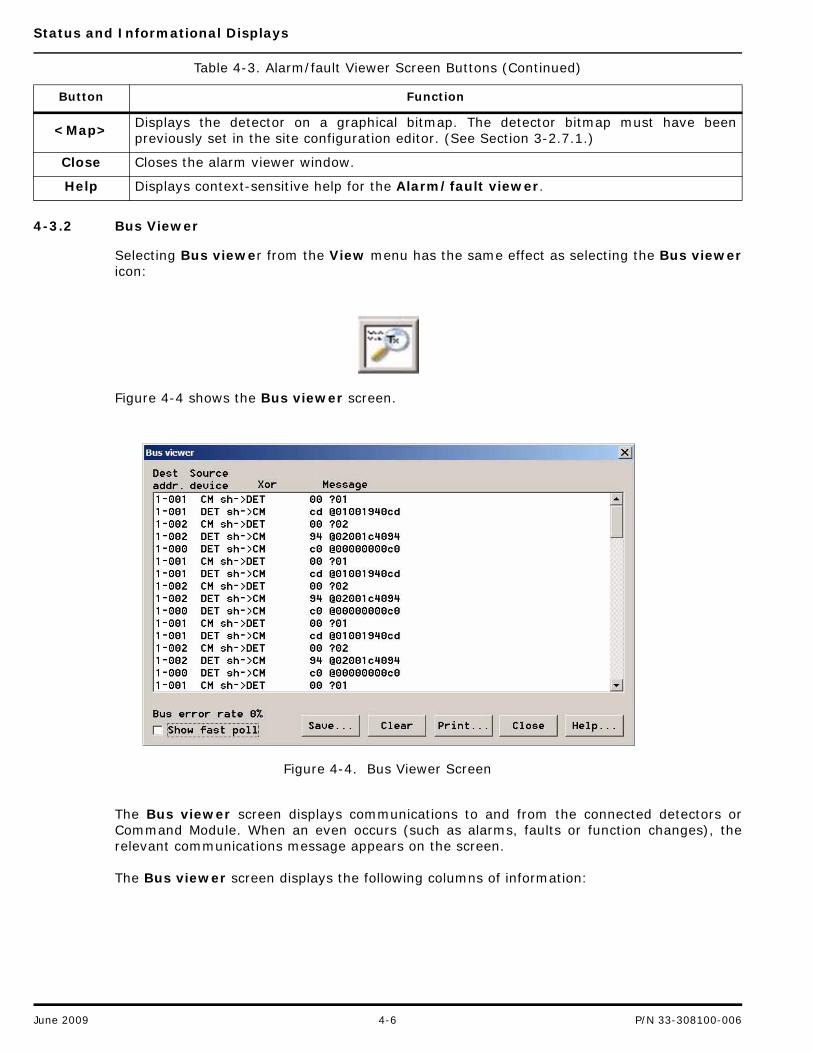
Status and Informational Displays
4-3.2 Bus Viewer
Selecting Bus viewer from the View menu has the same effect as selecting the Bus viewericon:
Figure 4-4 shows the Bus viewer screen.
Figure 4-4. Bus Viewer Screen
The Bus viewer screen displays communications to and from the connected detectors orCommand Module. When an even occurs (such as alarms, faults or function changes), therelevant communications message appears on the screen.
The Bus viewer screen displays the following columns of information:
<Map> Displays the detector on a graphical bitmap. The detector bitmap must have beenpreviously set in the site configuration editor. (See Section 3-2.7.1.)
Close Closes the alarm viewer window.
Help Displays context-sensitive help for the Alarm/fault viewer.
Table 4-3. Alarm/fault Viewer Screen Buttons (Continued)
Button Function
June 2009 4-6 P/N 33-308100-006
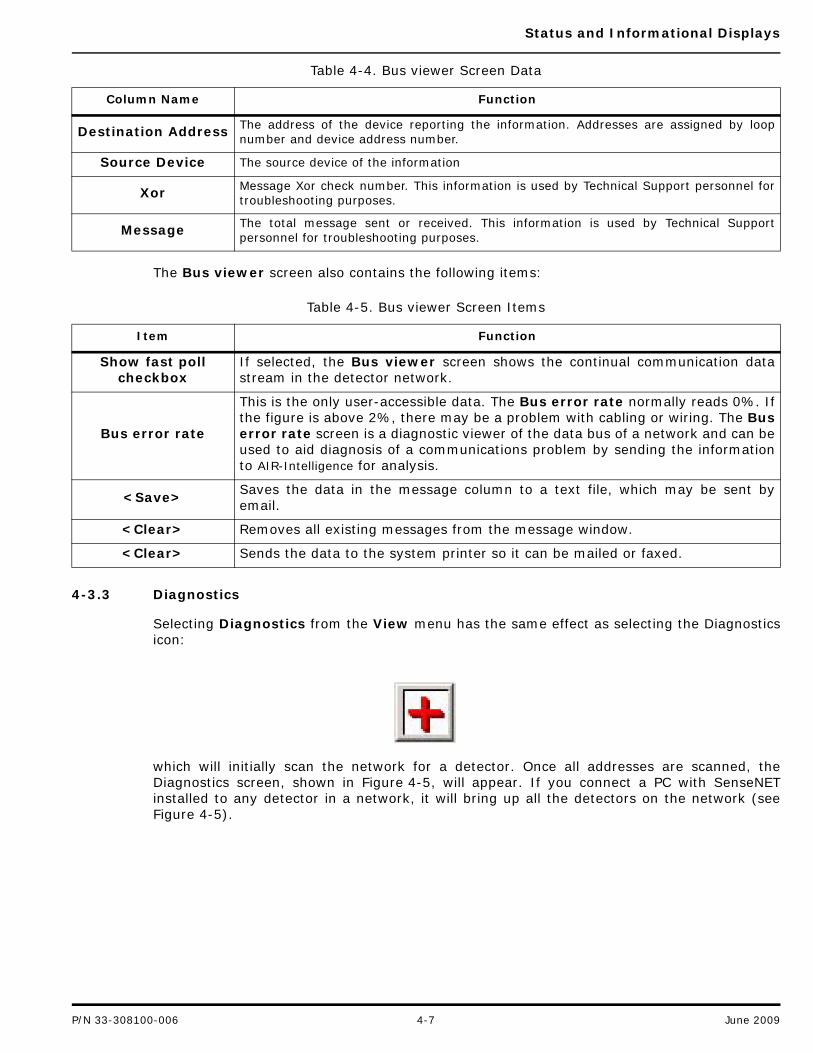
Status and Informational Displays
The Bus viewer screen also contains the following items:
4-3.3 Diagnostics
Selecting Diagnostics from the View menu has the same effect as selecting the Diagnosticsicon:
which will initially scan the network for a detector. Once all addresses are scanned, theDiagnostics screen, shown in Figure 4-5, will appear. If you connect a PC with SenseNETinstalled to any detector in a network, it will bring up all the detectors on the network (seeFigure 4-5).
Table 4-4. Bus viewer Screen Data
Column Name Function
Destination Address The address of the device reporting the information. Addresses are assigned by loopnumber and device address number.
Source Device The source device of the information
Xor Message Xor check number. This information is used by Technical Support personnel fortroubleshooting purposes.
Message The total message sent or received. This information is used by Technical Supportpersonnel for troubleshooting purposes.
Table 4-5. Bus viewer Screen Items
Item Function
Show fast poll checkbox
If selected, the Bus viewer screen shows the continual communication datastream in the detector network.
Bus error rate
This is the only user-accessible data. The Bus error rate normally reads 0%. Ifthe figure is above 2%, there may be a problem with cabling or wiring. The Buserror rate screen is a diagnostic viewer of the data bus of a network and can beused to aid diagnosis of a communications problem by sending the informationto AIR-Intelligence for analysis.
<Save> Saves the data in the message column to a text file, which may be sent byemail.
<Clear> Removes all existing messages from the message window.
<Clear> Sends the data to the system printer so it can be mailed or faxed.
P/N 33-308100-006 4-7 June 2009
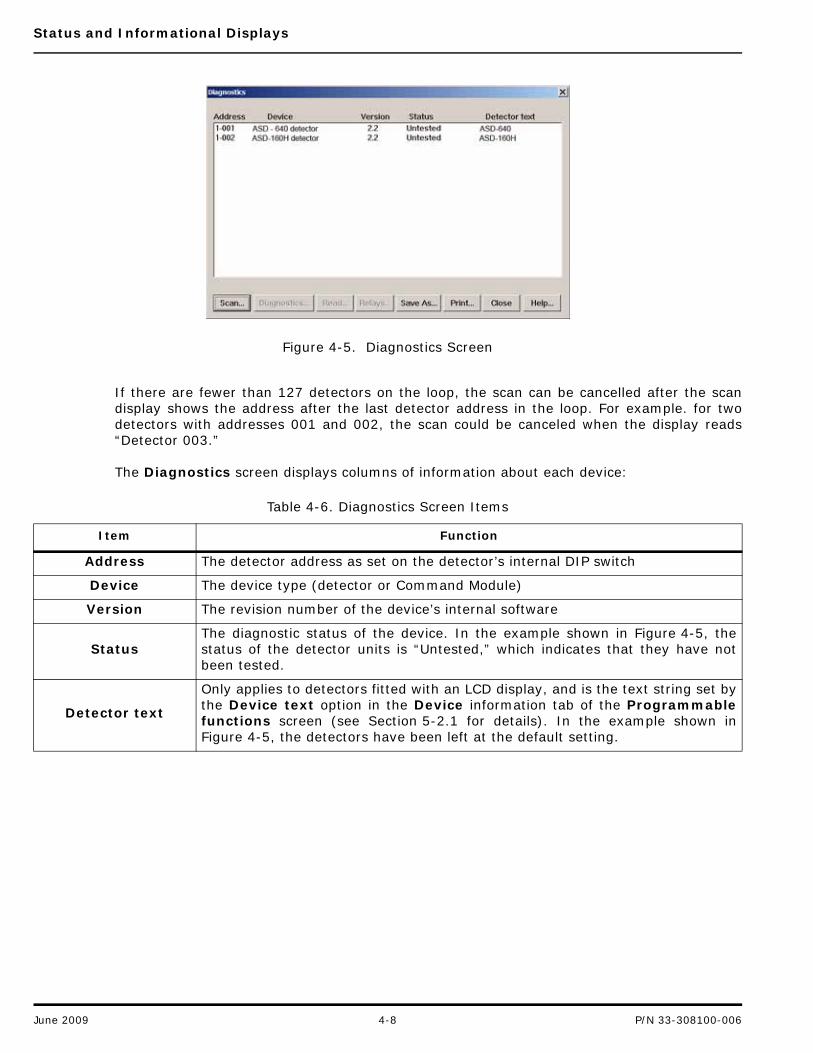
Status and Informational Displays
Figure 4-5. Diagnostics Screen
If there are fewer than 127 detectors on the loop, the scan can be cancelled after the scandisplay shows the address after the last detector address in the loop. For example. for twodetectors with addresses 001 and 002, the scan could be canceled when the display reads“Detector 003.”
The Diagnostics screen displays columns of information about each device:
Table 4-6. Diagnostics Screen Items
Item Function
Address The detector address as set on the detector’s internal DIP switch
Device The device type (detector or Command Module)
Version The revision number of the device’s internal software
StatusThe diagnostic status of the device. In the example shown in Figure 4-5, thestatus of the detector units is “Untested,” which indicates that they have notbeen tested.
Detector text
Only applies to detectors fitted with an LCD display, and is the text string set bythe Device text option in the Device information tab of the Programmablefunctions screen (see Section 5-2.1 for details). In the example shown inFigure 4-5, the detectors have been left at the default setting.
June 2009 4-8 P/N 33-308100-006
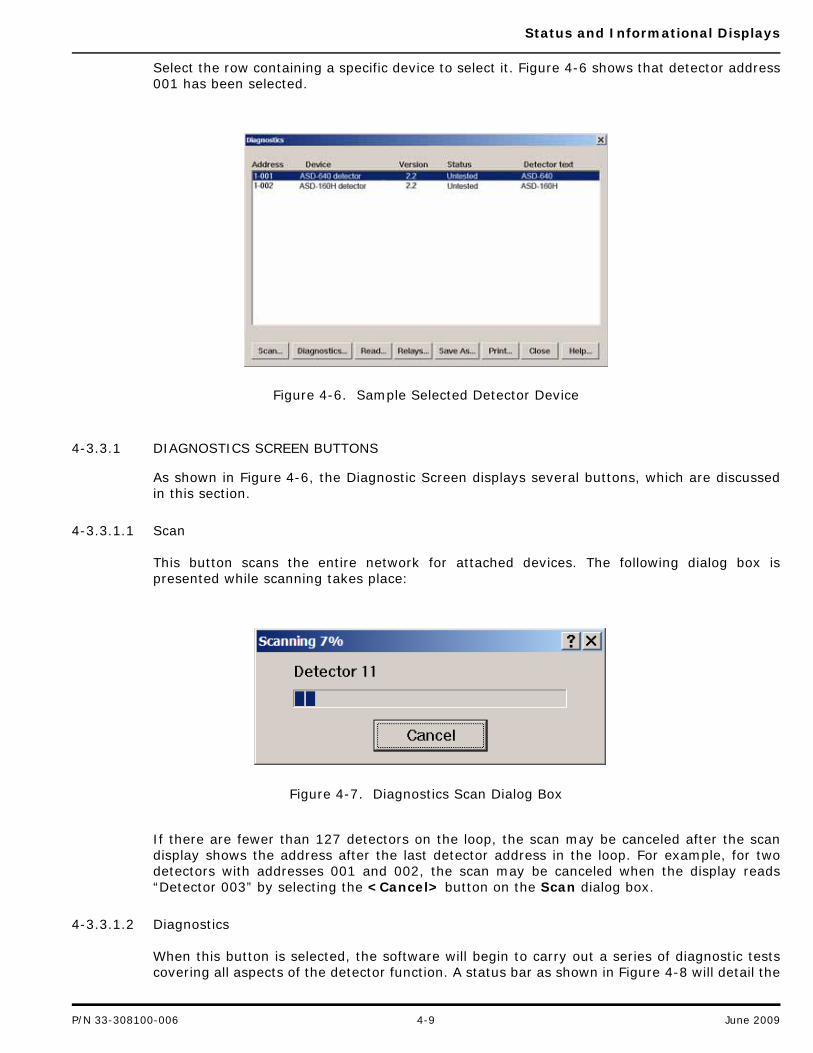
Status and Informational Displays
Select the row containing a specific device to select it. Figure 4-6 shows that detector address001 has been selected.
Figure 4-6. Sample Selected Detector Device
4-3.3.1 DIAGNOSTICS SCREEN BUTTONS
As shown in Figure 4-6, the Diagnostic Screen displays several buttons, which are discussedin this section.
4-3.3.1.1 Scan
This button scans the entire network for attached devices. The following dialog box ispresented while scanning takes place:
Figure 4-7. Diagnostics Scan Dialog Box
If there are fewer than 127 detectors on the loop, the scan may be canceled after the scandisplay shows the address after the last detector address in the loop. For example, for twodetectors with addresses 001 and 002, the scan may be canceled when the display reads“Detector 003” by selecting the <Cancel> button on the Scan dialog box.
4-3.3.1.2 Diagnostics
When this button is selected, the software will begin to carry out a series of diagnostic testscovering all aspects of the detector function. A status bar as shown in Figure 4-8 will detail the
P/N 33-308100-006 4-9 June 2009
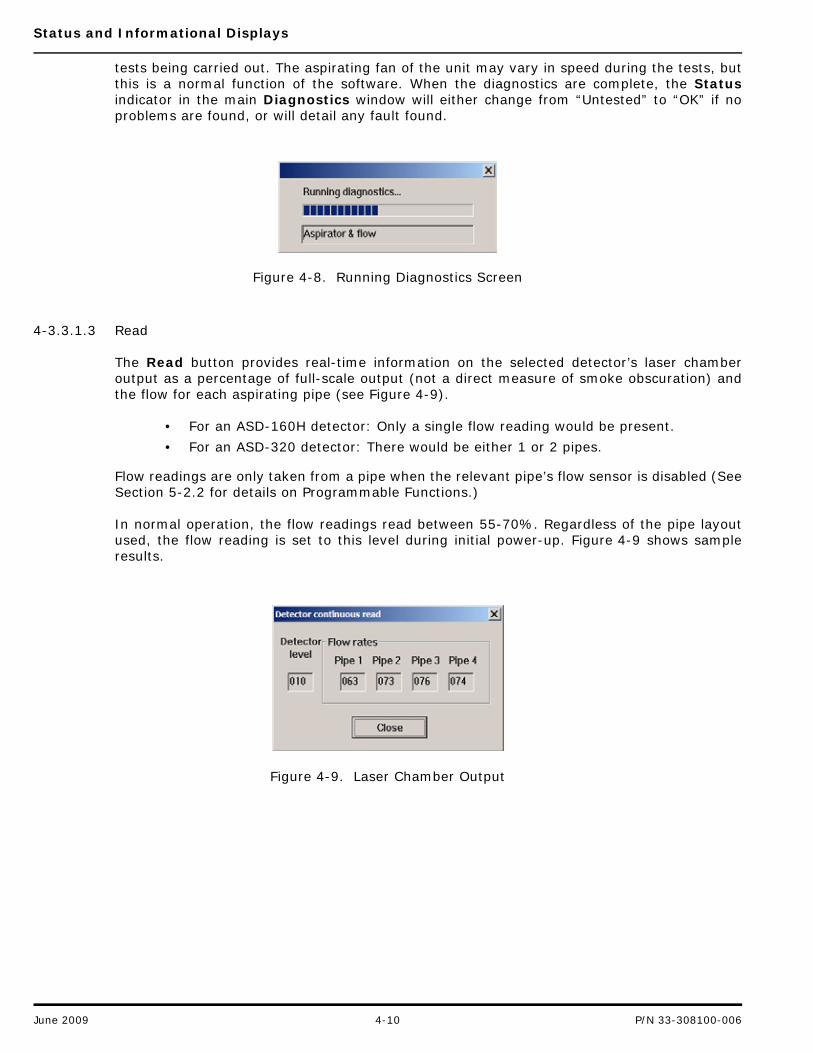
Status and Informational Displays
tests being carried out. The aspirating fan of the unit may vary in speed during the tests, butthis is a normal function of the software. When the diagnostics are complete, the Statusindicator in the main Diagnostics window will either change from “Untested” to “OK” if noproblems are found, or will detail any fault found.
Figure 4-8. Running Diagnostics Screen
4-3.3.1.3 Read
The Read button provides real-time information on the selected detector’s laser chamberoutput as a percentage of full-scale output (not a direct measure of smoke obscuration) andthe flow for each aspirating pipe (see Figure 4-9).
• For an ASD-160H detector: Only a single flow reading would be present.
• For an ASD-320 detector: There would be either 1 or 2 pipes.
Flow readings are only taken from a pipe when the relevant pipe’s flow sensor is disabled (SeeSection 5-2.2 for details on Programmable Functions.)
In normal operation, the flow readings read between 55-70%. Regardless of the pipe layoutused, the flow reading is set to this level during initial power-up. Figure 4-9 shows sampleresults.
Figure 4-9. Laser Chamber Output
June 2009 4-10 P/N 33-308100-006
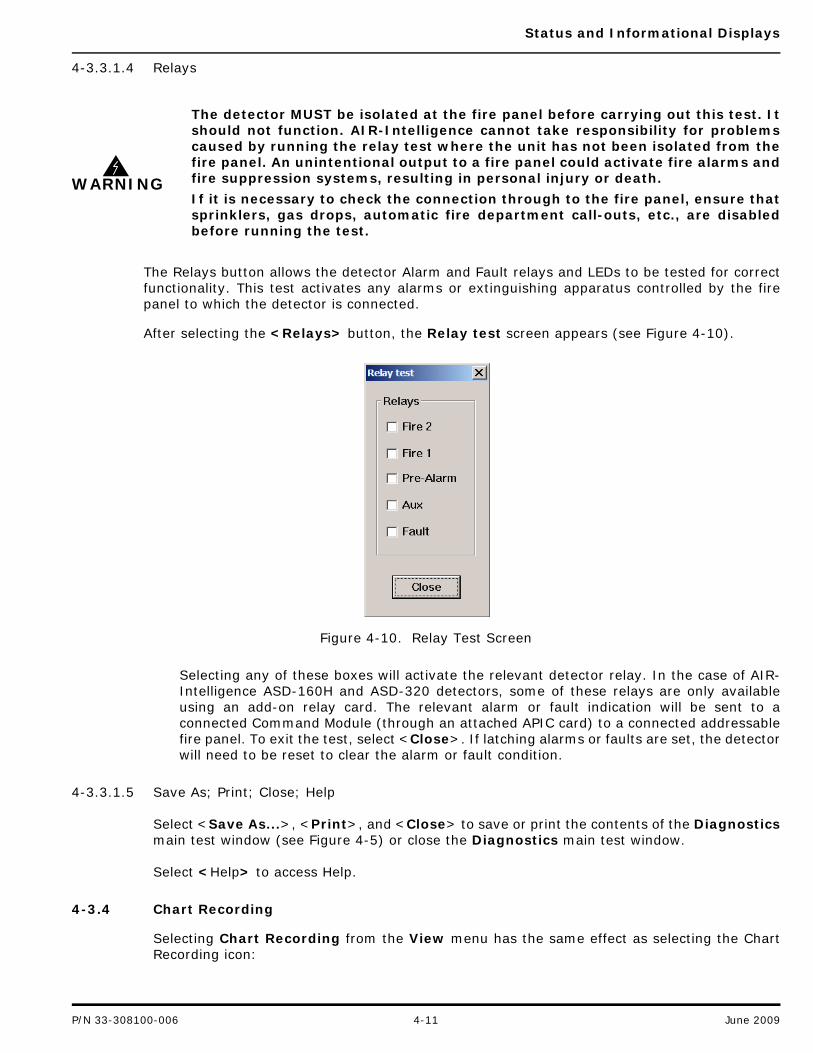
Status and Informational Displays
4-3.3.1.4 Relays
The Relays button allows the detector Alarm and Fault relays and LEDs to be tested for correctfunctionality. This test activates any alarms or extinguishing apparatus controlled by the firepanel to which the detector is connected.
After selecting the <Relays> button, the Relay test screen appears (see Figure 4-10).
Figure 4-10. Relay Test Screen
Selecting any of these boxes will activate the relevant detector relay. In the case of AIR-Intelligence ASD-160H and ASD-320 detectors, some of these relays are only availableusing an add-on relay card. The relevant alarm or fault indication will be sent to aconnected Command Module (through an attached APIC card) to a connected addressablefire panel. To exit the test, select <Close>. If latching alarms or faults are set, the detectorwill need to be reset to clear the alarm or fault condition.
4-3.3.1.5 Save As; Print; Close; Help
Select <Save As...>, <Print>, and <Close> to save or print the contents of the Diagnosticsmain test window (see Figure 4-5) or close the Diagnostics main test window.
Select <Help> to access Help.
4-3.4 Chart Recording
Selecting Chart Recording from the View menu has the same effect as selecting the ChartRecording icon:
WARNING
The detector MUST be isolated at the fire panel before carrying out this test. Itshould not function. AIR-Intelligence cannot take responsibility for problemscaused by running the relay test where the unit has not been isolated from thefire panel. An unintentional output to a fire panel could activate fire alarms andfire suppression systems, resulting in personal injury or death.
If it is necessary to check the connection through to the fire panel, ensure thatsprinklers, gas drops, automatic fire department call-outs, etc., are disabledbefore running the test.
P/N 33-308100-006 4-11 June 2009
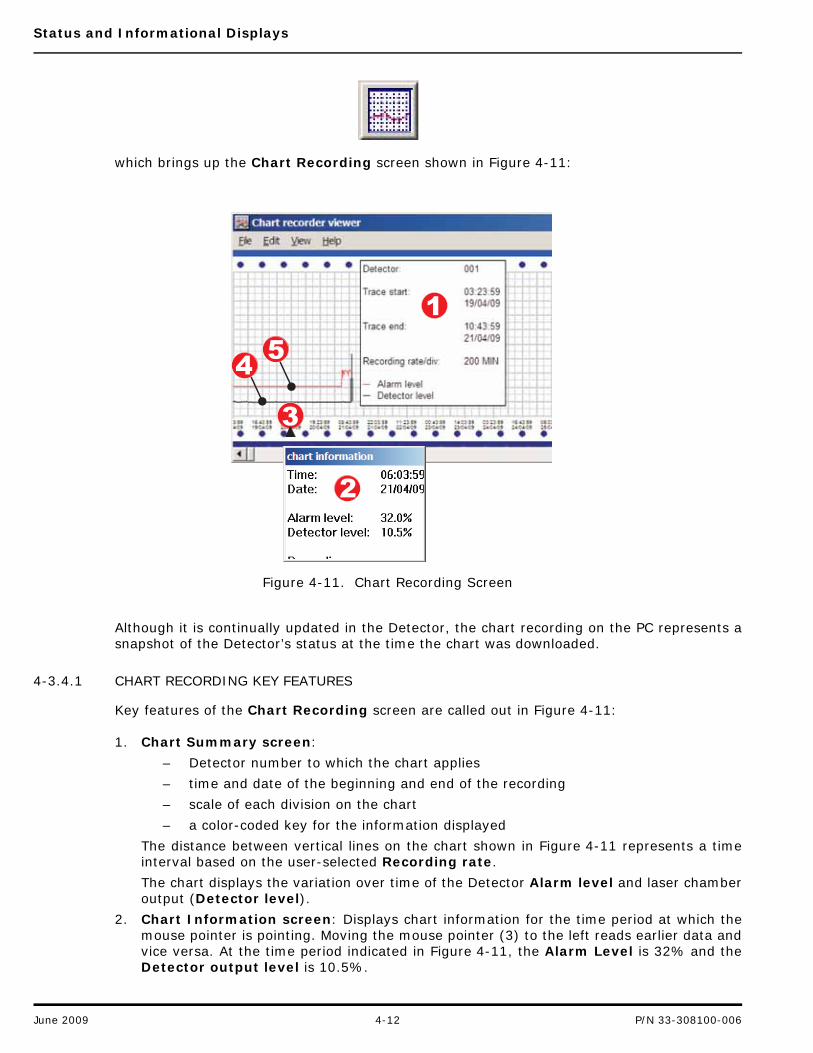
Status and Informational Displays
which brings up the Chart Recording screen shown in Figure 4-11:
Figure 4-11. Chart Recording Screen
Although it is continually updated in the Detector, the chart recording on the PC represents asnapshot of the Detector’s status at the time the chart was downloaded.
4-3.4.1 CHART RECORDING KEY FEATURES
Key features of the Chart Recording screen are called out in Figure 4-11:
1. Chart Summary screen:
– Detector number to which the chart applies
– time and date of the beginning and end of the recording
– scale of each division on the chart
– a color-coded key for the information displayed
The distance between vertical lines on the chart shown in Figure 4-11 represents a timeinterval based on the user-selected Recording rate.
The chart displays the variation over time of the Detector Alarm level and laser chamberoutput (Detector level).
2. Chart Information screen: Displays chart information for the time period at which themouse pointer is pointing. Moving the mouse pointer (3) to the left reads earlier data andvice versa. At the time period indicated in Figure 4-11, the Alarm Level is 32% and theDetector output level is 10.5%.
2
1
3
54
June 2009 4-12 P/N 33-308100-006
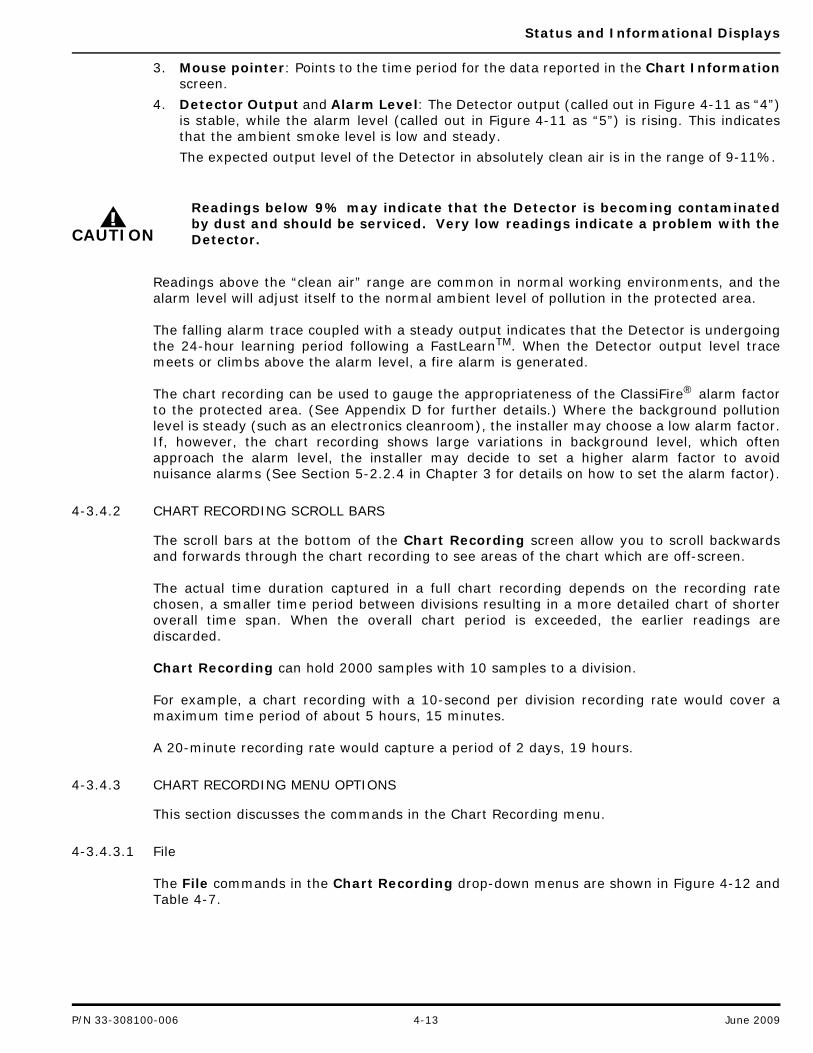
Status and Informational Displays
3. Mouse pointer: Points to the time period for the data reported in the Chart Informationscreen.
4. Detector Output and Alarm Level: The Detector output (called out in Figure 4-11 as “4”)is stable, while the alarm level (called out in Figure 4-11 as “5”) is rising. This indicatesthat the ambient smoke level is low and steady.
The expected output level of the Detector in absolutely clean air is in the range of 9-11%.
Readings above the “clean air” range are common in normal working environments, and thealarm level will adjust itself to the normal ambient level of pollution in the protected area.
The falling alarm trace coupled with a steady output indicates that the Detector is undergoingthe 24-hour learning period following a FastLearnTM. When the Detector output level tracemeets or climbs above the alarm level, a fire alarm is generated.
The chart recording can be used to gauge the appropriateness of the ClassiFire® alarm factorto the protected area. (See Appendix D for further details.) Where the background pollutionlevel is steady (such as an electronics cleanroom), the installer may choose a low alarm factor.If, however, the chart recording shows large variations in background level, which oftenapproach the alarm level, the installer may decide to set a higher alarm factor to avoidnuisance alarms (See Section 5-2.2.4 in Chapter 3 for details on how to set the alarm factor).
4-3.4.2 CHART RECORDING SCROLL BARS
The scroll bars at the bottom of the Chart Recording screen allow you to scroll backwardsand forwards through the chart recording to see areas of the chart which are off-screen.
The actual time duration captured in a full chart recording depends on the recording ratechosen, a smaller time period between divisions resulting in a more detailed chart of shorteroverall time span. When the overall chart period is exceeded, the earlier readings arediscarded.
Chart Recording can hold 2000 samples with 10 samples to a division.
For example, a chart recording with a 10-second per division recording rate would cover amaximum time period of about 5 hours, 15 minutes.
A 20-minute recording rate would capture a period of 2 days, 19 hours.
4-3.4.3 CHART RECORDING MENU OPTIONS
This section discusses the commands in the Chart Recording menu.
4-3.4.3.1 File
The File commands in the Chart Recording drop-down menus are shown in Figure 4-12 andTable 4-7.
CAUTION
Readings below 9% may indicate that the Detector is becoming contaminatedby dust and should be serviced. Very low readings indicate a problem with theDetector.
P/N 33-308100-006 4-13 June 2009
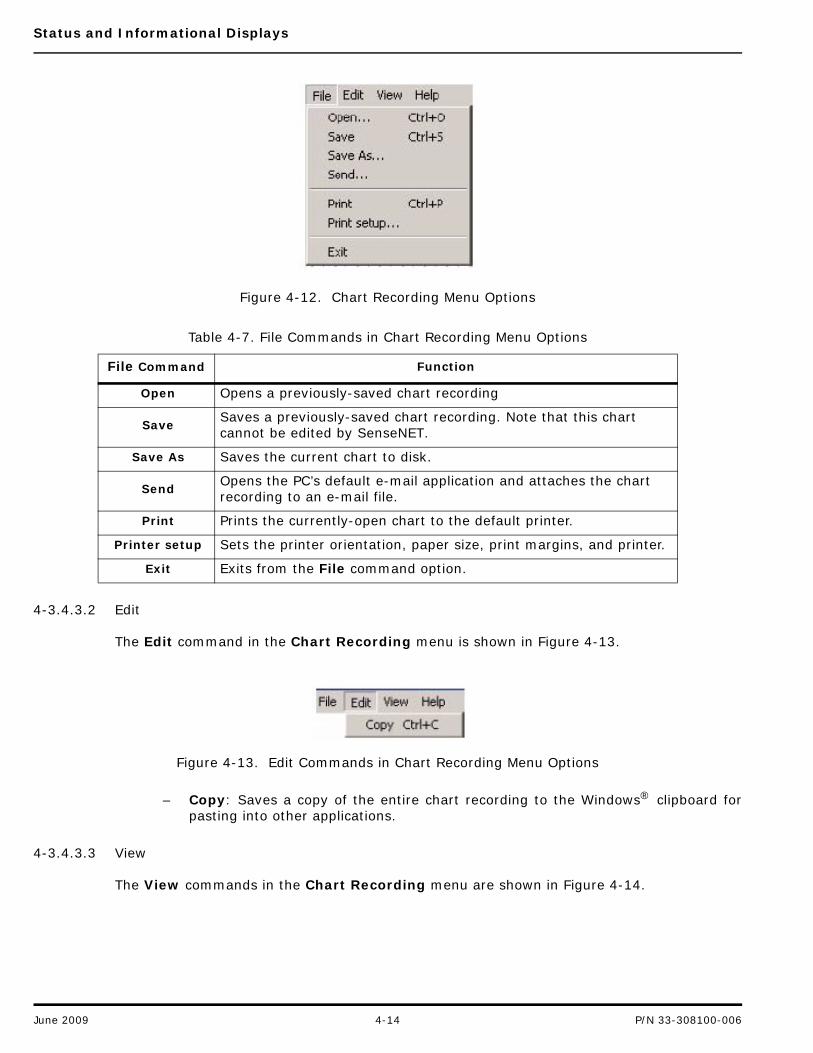
Status and Informational Displays
Figure 4-12. Chart Recording Menu Options
4-3.4.3.2 Edit
The Edit command in the Chart Recording menu is shown in Figure 4-13.
Figure 4-13. Edit Commands in Chart Recording Menu Options
– Copy: Saves a copy of the entire chart recording to the Windows® clipboard forpasting into other applications.
4-3.4.3.3 View
The View commands in the Chart Recording menu are shown in Figure 4-14.
Table 4-7. File Commands in Chart Recording Menu Options
File Command Function
Open Opens a previously-saved chart recording
SaveSaves a previously-saved chart recording. Note that this chart cannot be edited by SenseNET.
Save As Saves the current chart to disk.
SendOpens the PC’s default e-mail application and attaches the chart recording to an e-mail file.
Print Prints the currently-open chart to the default printer.
Printer setup Sets the printer orientation, paper size, print margins, and printer.
Exit Exits from the File command option.
June 2009 4-14 P/N 33-308100-006
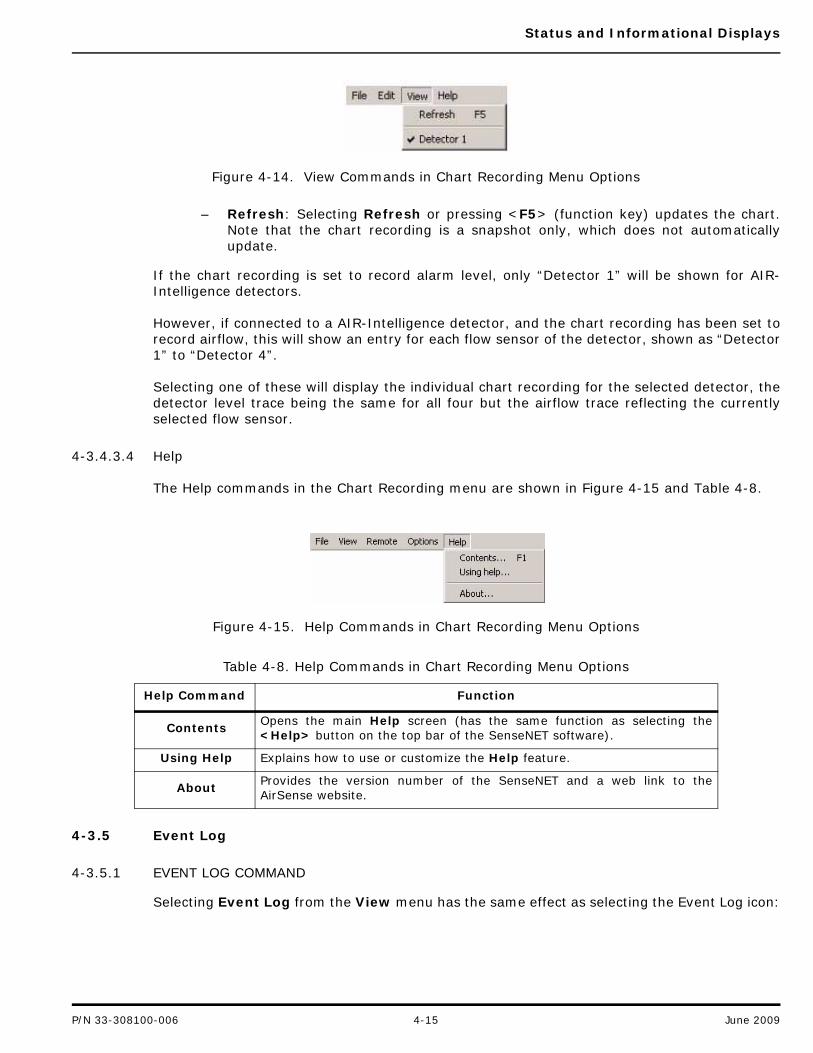
Status and Informational Displays
Figure 4-14. View Commands in Chart Recording Menu Options
– Refresh: Selecting Refresh or pressing <F5> (function key) updates the chart.Note that the chart recording is a snapshot only, which does not automaticallyupdate.
If the chart recording is set to record alarm level, only “Detector 1” will be shown for AIR-Intelligence detectors.
However, if connected to a AIR-Intelligence detector, and the chart recording has been set torecord airflow, this will show an entry for each flow sensor of the detector, shown as “Detector1” to “Detector 4”.
Selecting one of these will display the individual chart recording for the selected detector, thedetector level trace being the same for all four but the airflow trace reflecting the currentlyselected flow sensor.
4-3.4.3.4 Help
The Help commands in the Chart Recording menu are shown in Figure 4-15 and Table 4-8.
Figure 4-15. Help Commands in Chart Recording Menu Options
4-3.5 Event Log
4-3.5.1 EVENT LOG COMMAND
Selecting Event Log from the View menu has the same effect as selecting the Event Log icon:
Table 4-8. Help Commands in Chart Recording Menu Options
Help Command Function
ContentsOpens the main Help screen (has the same function as selecting the<Help> button on the top bar of the SenseNET software).
Using Help Explains how to use or customize the Help feature.
AboutProvides the version number of the SenseNET and a web link to theAirSense website.
P/N 33-308100-006 4-15 June 2009
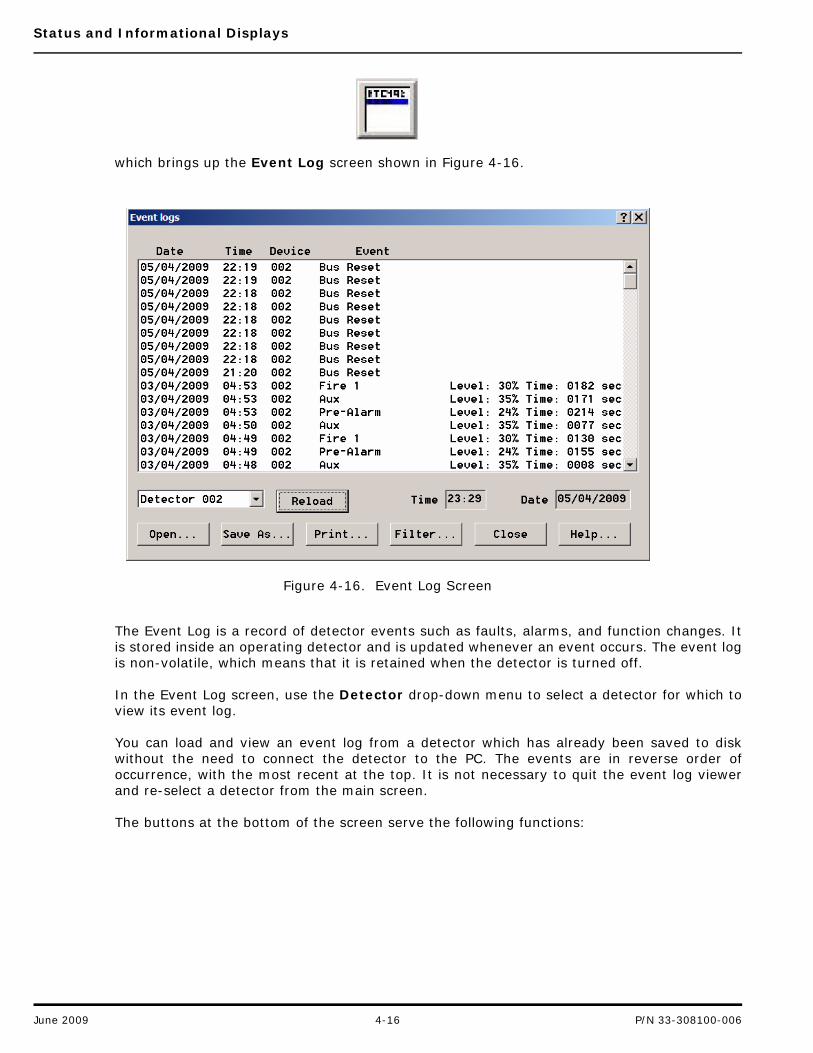
Status and Informational Displays
which brings up the Event Log screen shown in Figure 4-16.
Figure 4-16. Event Log Screen
The Event Log is a record of detector events such as faults, alarms, and function changes. Itis stored inside an operating detector and is updated whenever an event occurs. The event logis non-volatile, which means that it is retained when the detector is turned off.
In the Event Log screen, use the Detector drop-down menu to select a detector for which toview its event log.
You can load and view an event log from a detector which has already been saved to diskwithout the need to connect the detector to the PC. The events are in reverse order ofoccurrence, with the most recent at the top. It is not necessary to quit the event log viewerand re-select a detector from the main screen.
The buttons at the bottom of the screen serve the following functions:
June 2009 4-16 P/N 33-308100-006
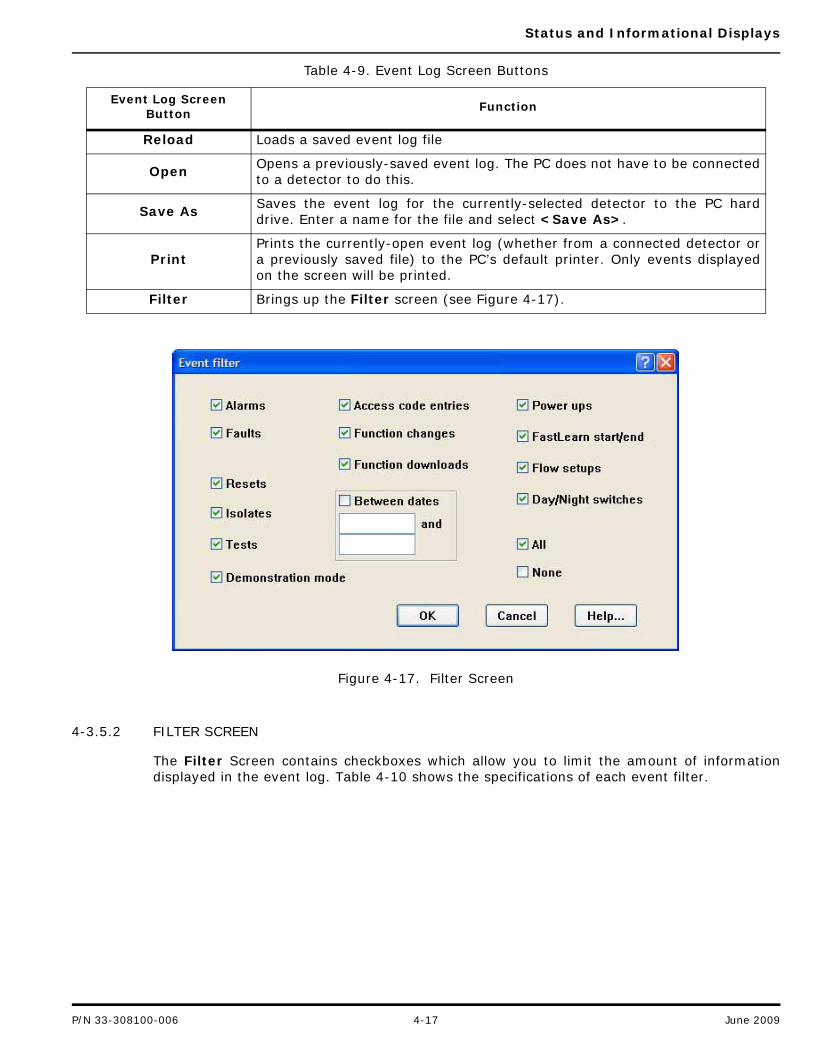
Status and Informational Displays
Figure 4-17. Filter Screen
4-3.5.2 FILTER SCREEN
The Filter Screen contains checkboxes which allow you to limit the amount of informationdisplayed in the event log. Table 4-10 shows the specifications of each event filter.
Table 4-9. Event Log Screen Buttons
Event Log Screen Button
Function
Reload Loads a saved event log file
Open Opens a previously-saved event log. The PC does not have to be connectedto a detector to do this.
Save As Saves the event log for the currently-selected detector to the PC harddrive. Enter a name for the file and select <Save As>.
PrintPrints the currently-open event log (whether from a connected detector ora previously saved file) to the PC’s default printer. Only events displayedon the screen will be printed.
Filter Brings up the Filter screen (see Figure 4-17).
P/N 33-308100-006 4-17 June 2009

Status and Informational Displays
The following buttons are located at the bottom of the Event Log screen:
Note: The Filter function only applies to the information displayed on the screen or sent to aprinter. It does not affect a saved file, which will contain all the information in the log.
4-3.6 Histograph Viewer
Selecting the Histograph viewer menu option from the View menu has the same effect asselecting the Histograph viewer icon:
Table 4-10. Event Filters
Filter Function
Alarms Alarms triggered at the detector
Faults Faults triggered at the detector
Resets Global resets made at the detector
IsolatesOccurrences of a detector being isolated during the testing process sothat alarms are not generated during the test.
Tests Tests administered at the detector.
Demonstration Mode
The detector is in Demonstration Mode.
Access Code Entries Access code entries entered by a user for a detector
Function Changes Function changes made to the detector’s software configuration
Function Downloads Function downloads that have occurred
Between Dates A time period during which filters are enabled
Power ups A detector has been powered up.
FastLearn start/end FastLearnTM periods have started or ended for a detector.
Flow setupsFlow limit and thresholds have been reset (such as when a detector ispowered up with Auto FastLearn enabled).
Day/Night switches A day or night switch period has started or ended.
AllFilter all categories. Choose All if only a few categories need to bedisabled.
None
Do not filter any categories. A check in the None checkbox clears allcategories. Instead of enabling and disabling individual categories ofevent, choose None and then select the categories you want to beenabled.
Table 4-11. Event Log Screen Buttons
Event Log Screen Button
Function
OK Confirms your selections.
Cancel Exits without applying the filter.
Help Provides context-sensitive help for the Event Log function.
June 2009 4-18 P/N 33-308100-006
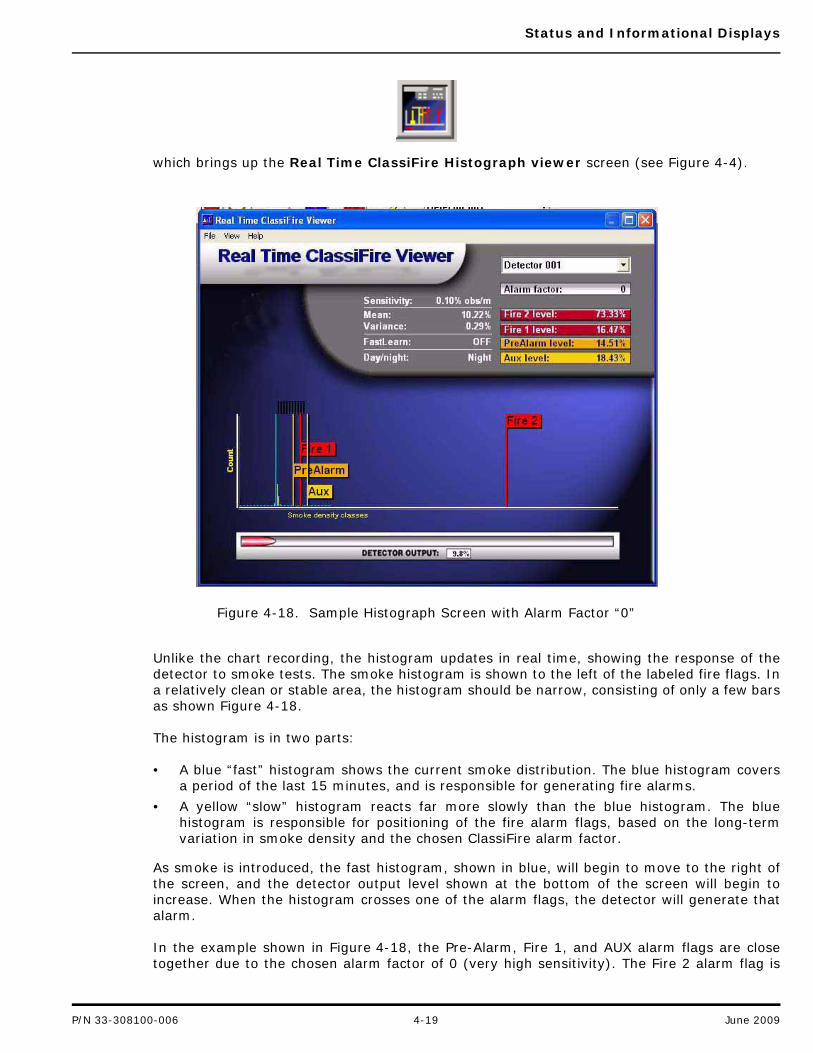
Status and Informational Displays
which brings up the Real Time ClassiFire Histograph viewer screen (see Figure 4-4).
Figure 4-18. Sample Histograph Screen with Alarm Factor “0”
Unlike the chart recording, the histogram updates in real time, showing the response of thedetector to smoke tests. The smoke histogram is shown to the left of the labeled fire flags. Ina relatively clean or stable area, the histogram should be narrow, consisting of only a few barsas shown Figure 4-18.
The histogram is in two parts:
• A blue “fast” histogram shows the current smoke distribution. The blue histogram coversa period of the last 15 minutes, and is responsible for generating fire alarms.
• A yellow “slow” histogram reacts far more slowly than the blue histogram. The bluehistogram is responsible for positioning of the fire alarm flags, based on the long-termvariation in smoke density and the chosen ClassiFire alarm factor.
As smoke is introduced, the fast histogram, shown in blue, will begin to move to the right ofthe screen, and the detector output level shown at the bottom of the screen will begin toincrease. When the histogram crosses one of the alarm flags, the detector will generate thatalarm.
In the example shown in Figure 4-18, the Pre-Alarm, Fire 1, and AUX alarm flags are closetogether due to the chosen alarm factor of 0 (very high sensitivity). The Fire 2 alarm flag is
P/N 33-308100-006 4-19 June 2009
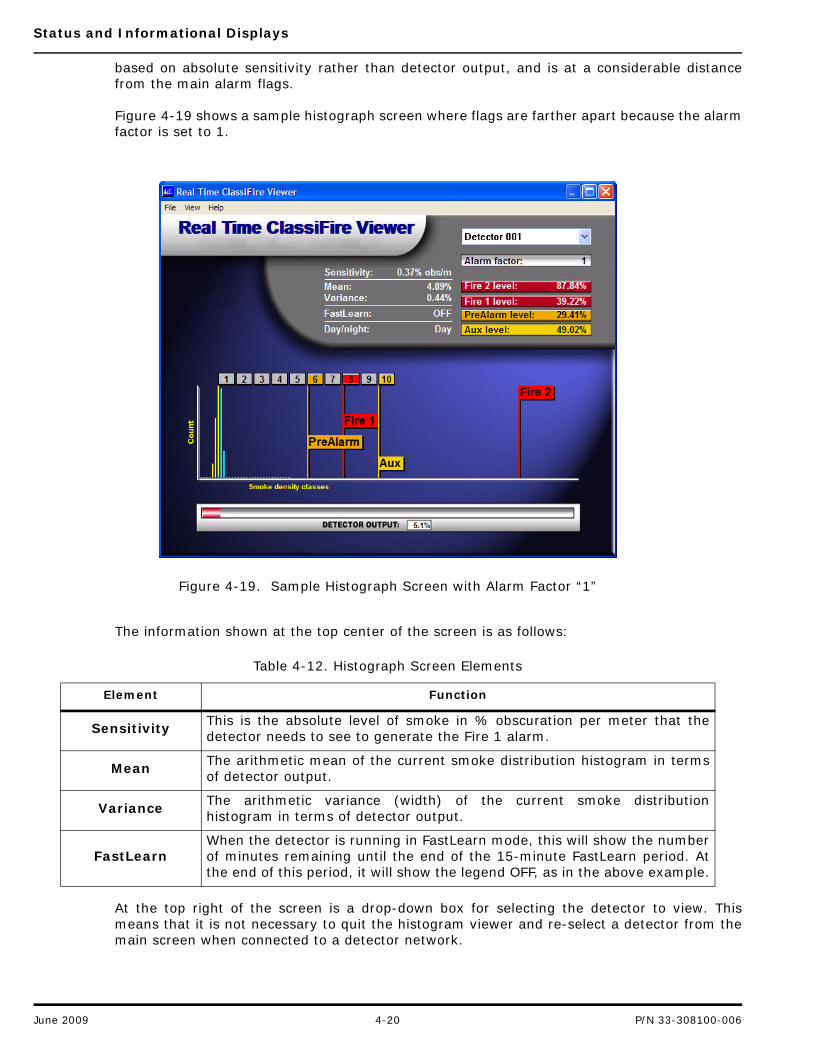
Status and Informational Displays
based on absolute sensitivity rather than detector output, and is at a considerable distancefrom the main alarm flags.
Figure 4-19 shows a sample histograph screen where flags are farther apart because the alarmfactor is set to 1.
Figure 4-19. Sample Histograph Screen with Alarm Factor “1”
The information shown at the top center of the screen is as follows:
At the top right of the screen is a drop-down box for selecting the detector to view. Thismeans that it is not necessary to quit the histogram viewer and re-select a detector from themain screen when connected to a detector network.
Table 4-12. Histograph Screen Elements
Element Function
Sensitivity This is the absolute level of smoke in % obscuration per meter that thedetector needs to see to generate the Fire 1 alarm.
Mean The arithmetic mean of the current smoke distribution histogram in termsof detector output.
Variance The arithmetic variance (width) of the current smoke distributionhistogram in terms of detector output.
FastLearnWhen the detector is running in FastLearn mode, this will show the numberof minutes remaining until the end of the 15-minute FastLearn period. Atthe end of this period, it will show the legend OFF, as in the above example.
June 2009 4-20 P/N 33-308100-006
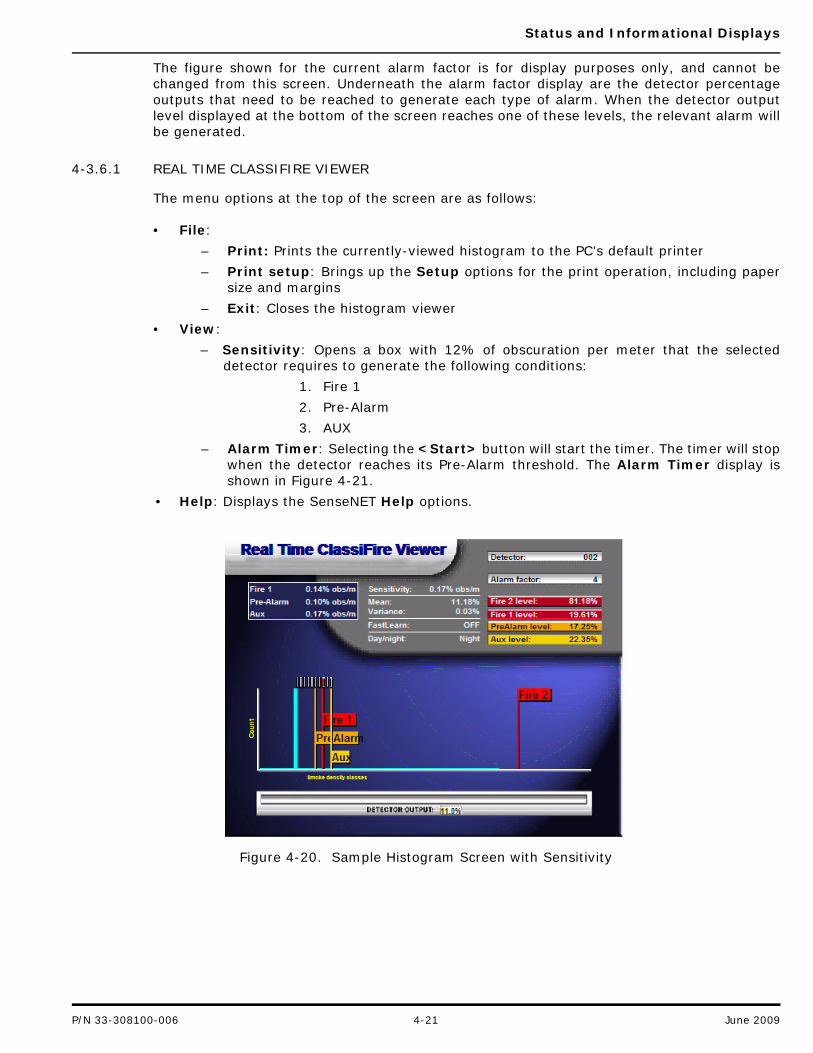
Status and Informational Displays
The figure shown for the current alarm factor is for display purposes only, and cannot bechanged from this screen. Underneath the alarm factor display are the detector percentageoutputs that need to be reached to generate each type of alarm. When the detector outputlevel displayed at the bottom of the screen reaches one of these levels, the relevant alarm willbe generated.
4-3.6.1 REAL TIME CLASSIFIRE VIEWER
The menu options at the top of the screen are as follows:
• File:
– Print: Prints the currently-viewed histogram to the PC’s default printer
– Print setup: Brings up the Setup options for the print operation, including papersize and margins
– Exit: Closes the histogram viewer
• View:
– Sensitivity: Opens a box with 12% of obscuration per meter that the selecteddetector requires to generate the following conditions:
1. Fire 1
2. Pre-Alarm
3. AUX
– Alarm Timer: Selecting the <Start> button will start the timer. The timer will stopwhen the detector reaches its Pre-Alarm threshold. The Alarm Timer display isshown in Figure 4-21.
• Help: Displays the SenseNET Help options.
Figure 4-20. Sample Histogram Screen with Sensitivity
P/N 33-308100-006 4-21 June 2009
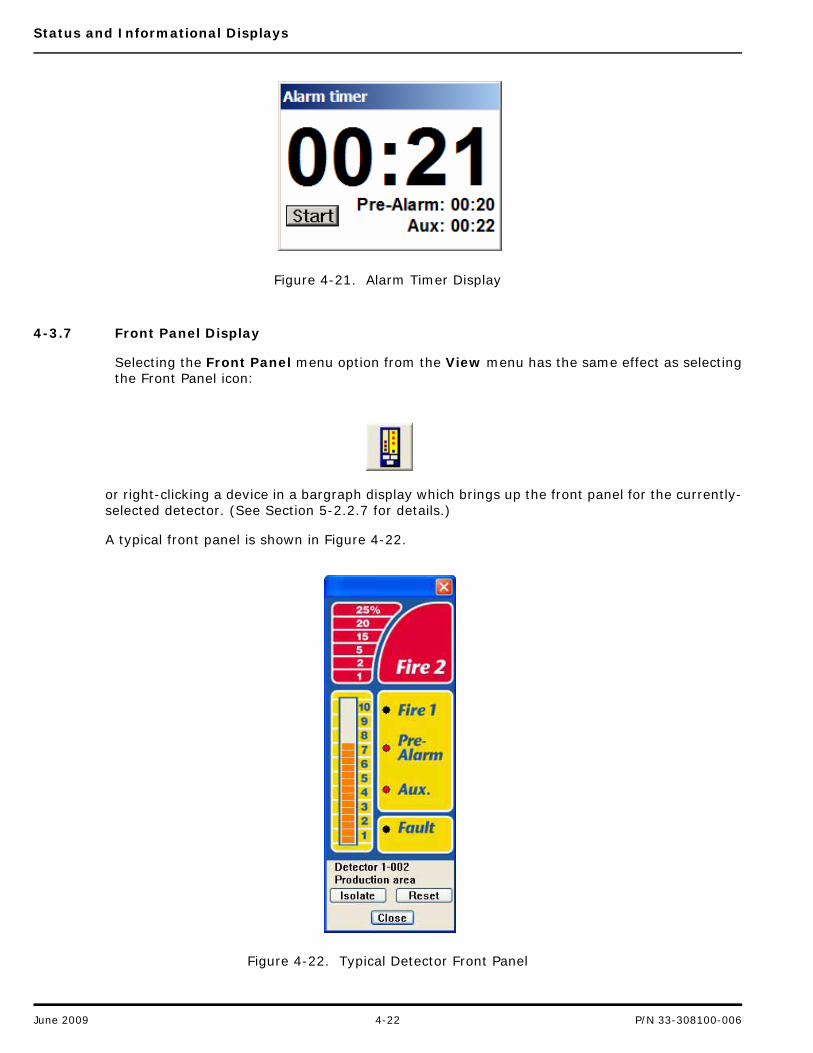
Status and Informational Displays
Figure 4-21. Alarm Timer Display
4-3.7 Front Panel Display
Selecting the Front Panel menu option from the View menu has the same effect as selectingthe Front Panel icon:
or right-clicking a device in a bargraph display which brings up the front panel for the currently-selected detector. (See Section 5-2.2.7 for details.)
A typical front panel is shown in Figure 4-22.
Figure 4-22. Typical Detector Front Panel
June 2009 4-22 P/N 33-308100-006
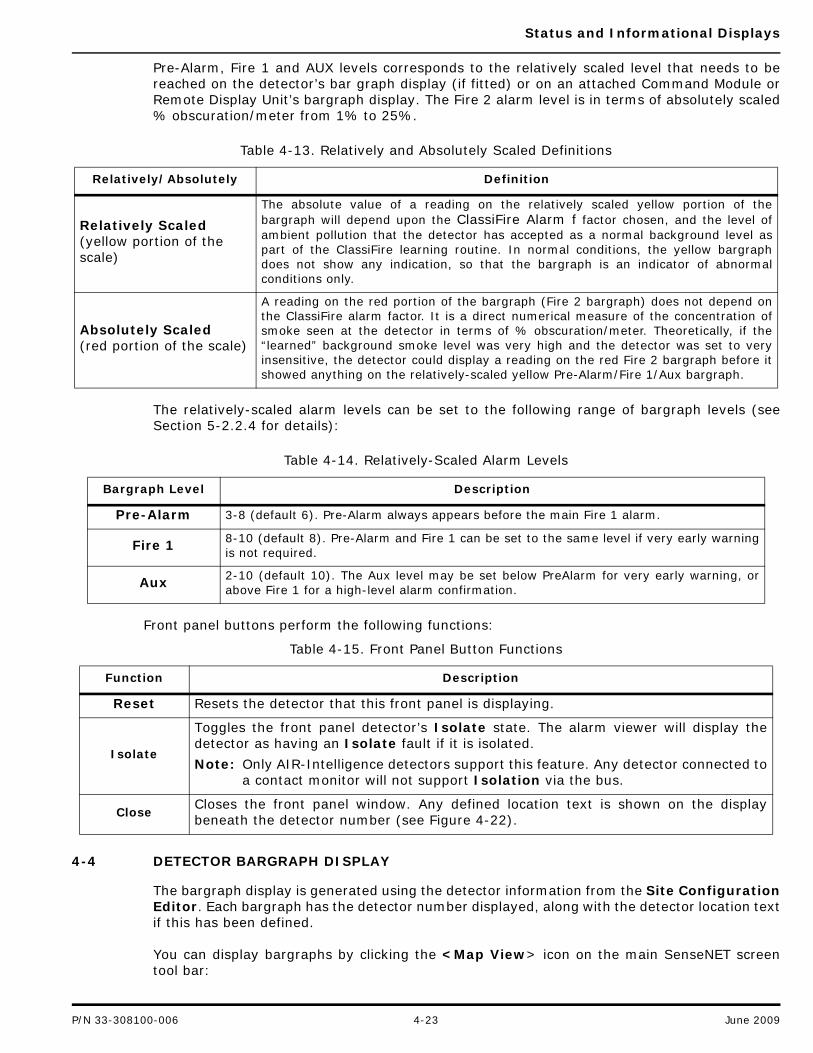
Status and Informational Displays
Pre-Alarm, Fire 1 and AUX levels corresponds to the relatively scaled level that needs to bereached on the detector’s bar graph display (if fitted) or on an attached Command Module orRemote Display Unit’s bargraph display. The Fire 2 alarm level is in terms of absolutely scaled% obscuration/meter from 1% to 25%.
The relatively-scaled alarm levels can be set to the following range of bargraph levels (seeSection 5-2.2.4 for details):
Front panel buttons perform the following functions:
4-4 DETECTOR BARGRAPH DISPLAY
The bargraph display is generated using the detector information from the Site ConfigurationEditor. Each bargraph has the detector number displayed, along with the detector location textif this has been defined.
You can display bargraphs by clicking the <Map View> icon on the main SenseNET screentool bar:
Table 4-13. Relatively and Absolutely Scaled Definitions
Relatively/Absolutely Definition
Relatively Scaled(yellow portion of the scale)
The absolute value of a reading on the relatively scaled yellow portion of thebargraph will depend upon the ClassiFire Alarm f factor chosen, and the level ofambient pollution that the detector has accepted as a normal background level aspart of the ClassiFire learning routine. In normal conditions, the yellow bargraphdoes not show any indication, so that the bargraph is an indicator of abnormalconditions only.
Absolutely Scaled(red portion of the scale)
A reading on the red portion of the bargraph (Fire 2 bargraph) does not depend onthe ClassiFire alarm factor. It is a direct numerical measure of the concentration ofsmoke seen at the detector in terms of % obscuration/meter. Theoretically, if the“learned” background smoke level was very high and the detector was set to veryinsensitive, the detector could display a reading on the red Fire 2 bargraph before itshowed anything on the relatively-scaled yellow Pre-Alarm/Fire 1/Aux bargraph.
Table 4-14. Relatively-Scaled Alarm Levels
Bargraph Level Description
Pre-Alarm 3-8 (default 6). Pre-Alarm always appears before the main Fire 1 alarm.
Fire 1 8-10 (default 8). Pre-Alarm and Fire 1 can be set to the same level if very early warningis not required.
Aux 2-10 (default 10). The Aux level may be set below PreAlarm for very early warning, orabove Fire 1 for a high-level alarm confirmation.
Table 4-15. Front Panel Button Functions
Function Description
Reset Resets the detector that this front panel is displaying.
Isolate
Toggles the front panel detector’s Isolate state. The alarm viewer will display thedetector as having an Isolate fault if it is isolated.
Note: Only AIR-Intelligence detectors support this feature. Any detector connected toa contact monitor will not support Isolation via the bus.
CloseCloses the front panel window. Any defined location text is shown on the displaybeneath the detector number (see Figure 4-22).
P/N 33-308100-006 4-23 June 2009

Status and Informational Displays
The Map View icon toggles between site maps and device maps.
An example bargraph display is shown in Figure 4-23:
Figure 4-23. Sample Bargraph Display
4-4.1 Bargraph Pop-Up Menu Functions
Right-clicking on any bargraph displays the pop-up menu (see Figure 4-24). Functions such asevent log or histogram viewer will be displayed for the currently-selected detector.
Figure 4-24. Bargraph Pop-up Menu
Select the functions displayed in the Bargraph Pop-Up menu for the currently-selected detector:
• Reset: Resets the detector. A thick border shows the currently-selected detector.
• Bus Isolate: Isolates the detector. The alarm viewer displays the detector as having anisolate fault (see Figure 4-25).
June 2009 4-24 P/N 33-308100-006
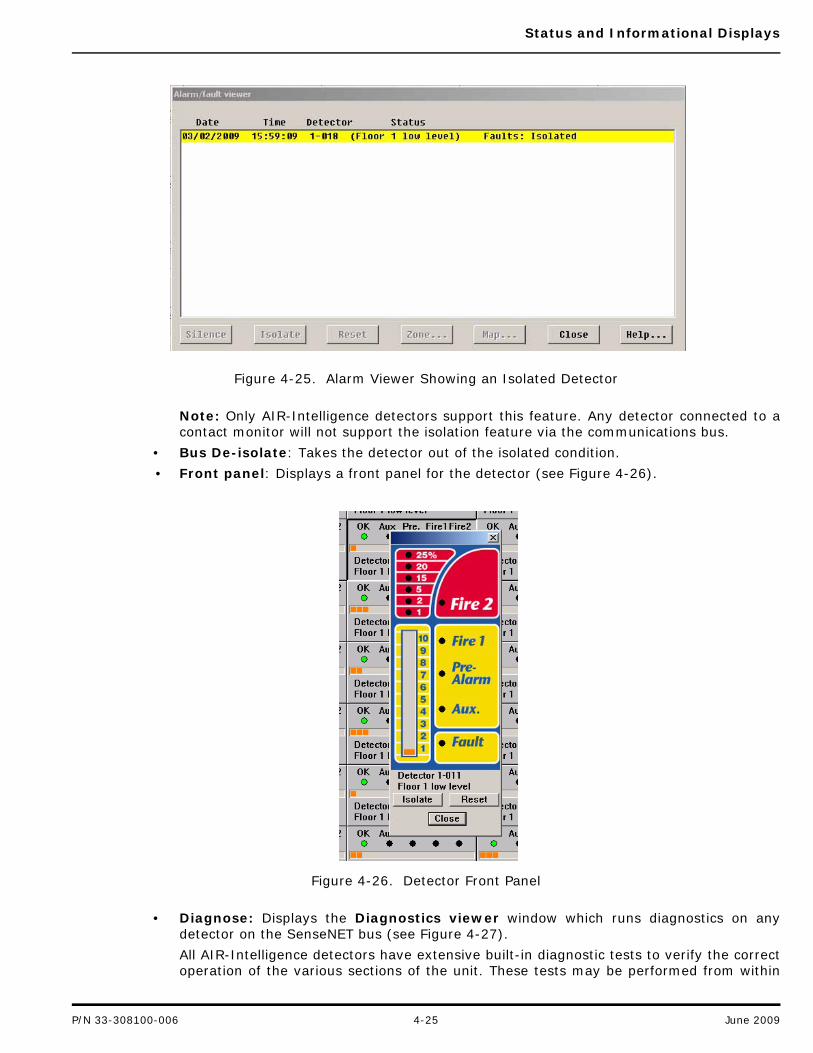
Status and Informational Displays
Figure 4-25. Alarm Viewer Showing an Isolated Detector
Note: Only AIR-Intelligence detectors support this feature. Any detector connected to acontact monitor will not support the isolation feature via the communications bus.
• Bus De-isolate: Takes the detector out of the isolated condition.
• Front panel: Displays a front panel for the detector (see Figure 4-26).
Figure 4-26. Detector Front Panel
• Diagnose: Displays the Diagnostics viewer window which runs diagnostics on anydetector on the SenseNET bus (see Figure 4-27).
All AIR-Intelligence detectors have extensive built-in diagnostic tests to verify the correctoperation of the various sections of the unit. These tests may be performed from within
P/N 33-308100-006 4-25 June 2009
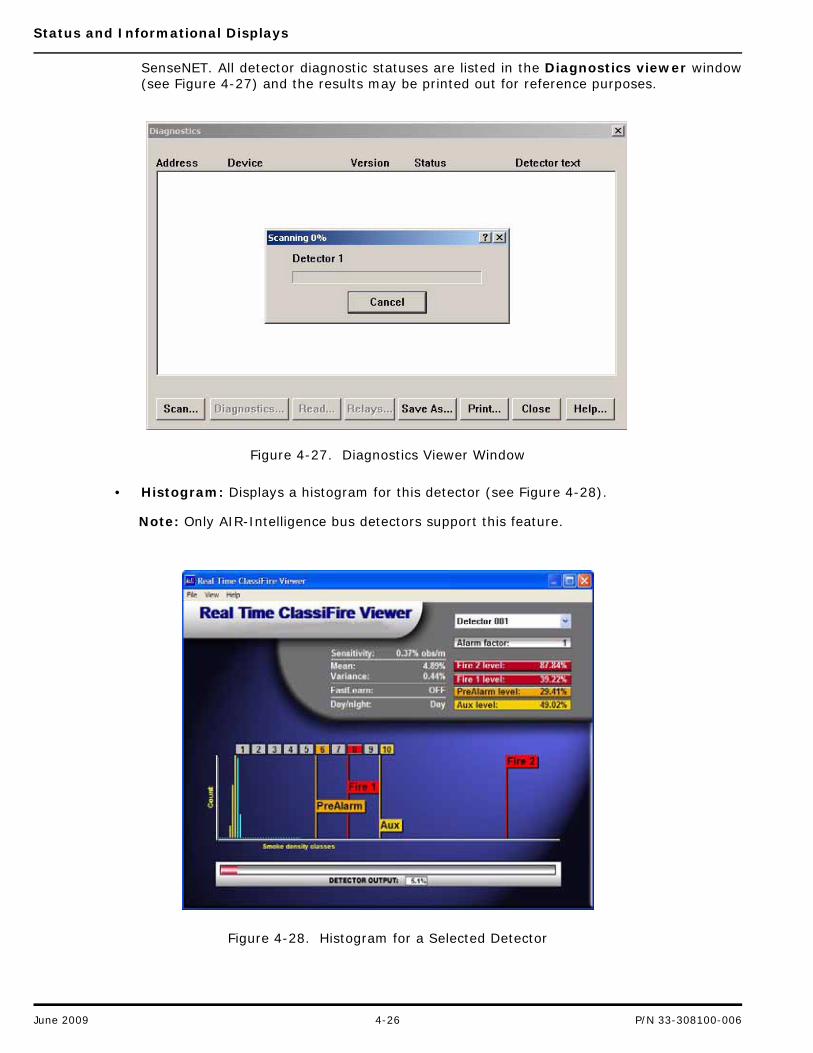
Status and Informational Displays
SenseNET. All detector diagnostic statuses are listed in the Diagnostics viewer window(see Figure 4-27) and the results may be printed out for reference purposes.
Figure 4-27. Diagnostics Viewer Window
• Histogram: Displays a histogram for this detector (see Figure 4-28).
Note: Only AIR-Intelligence bus detectors support this feature.
Figure 4-28. Histogram for a Selected Detector
June 2009 4-26 P/N 33-308100-006
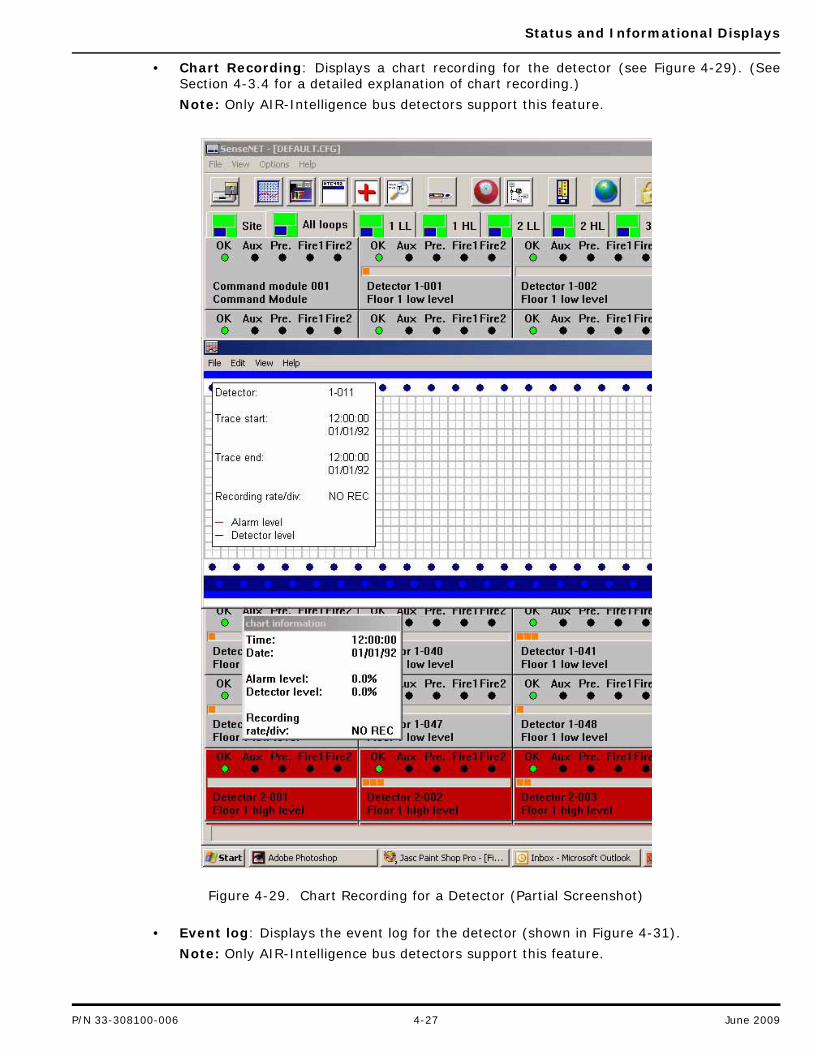
Status and Informational Displays
• Chart Recording: Displays a chart recording for the detector (see Figure 4-29). (SeeSection 4-3.4 for a detailed explanation of chart recording.)
Note: Only AIR-Intelligence bus detectors support this feature.
Figure 4-29. Chart Recording for a Detector (Partial Screenshot)
• Event log: Displays the event log for the detector (shown in Figure 4-31).
Note: Only AIR-Intelligence bus detectors support this feature.
P/N 33-308100-006 4-27 June 2009
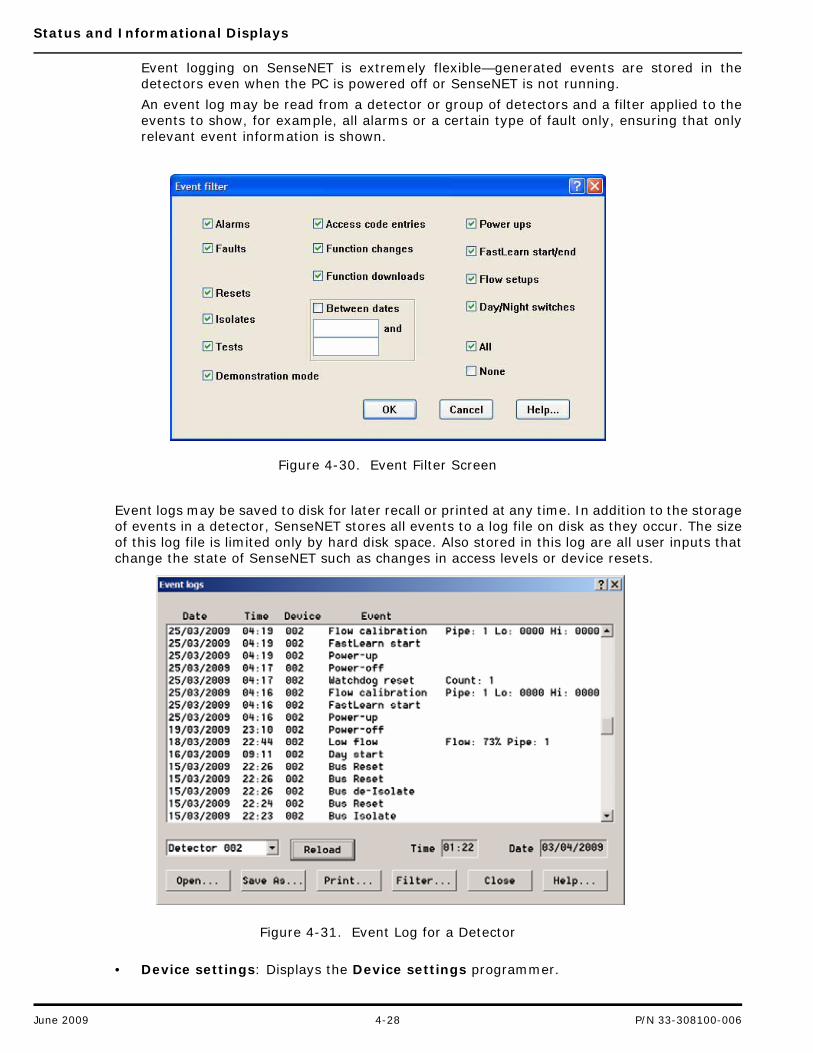
Status and Informational Displays
Event logging on SenseNET is extremely flexible—generated events are stored in thedetectors even when the PC is powered off or SenseNET is not running.
An event log may be read from a detector or group of detectors and a filter applied to theevents to show, for example, all alarms or a certain type of fault only, ensuring that onlyrelevant event information is shown.
Figure 4-30. Event Filter Screen
Event logs may be saved to disk for later recall or printed at any time. In addition to the storageof events in a detector, SenseNET stores all events to a log file on disk as they occur. The sizeof this log file is limited only by hard disk space. Also stored in this log are all user inputs thatchange the state of SenseNET such as changes in access levels or device resets.
Figure 4-31. Event Log for a Detector
• Device settings: Displays the Device settings programmer.
June 2009 4-28 P/N 33-308100-006
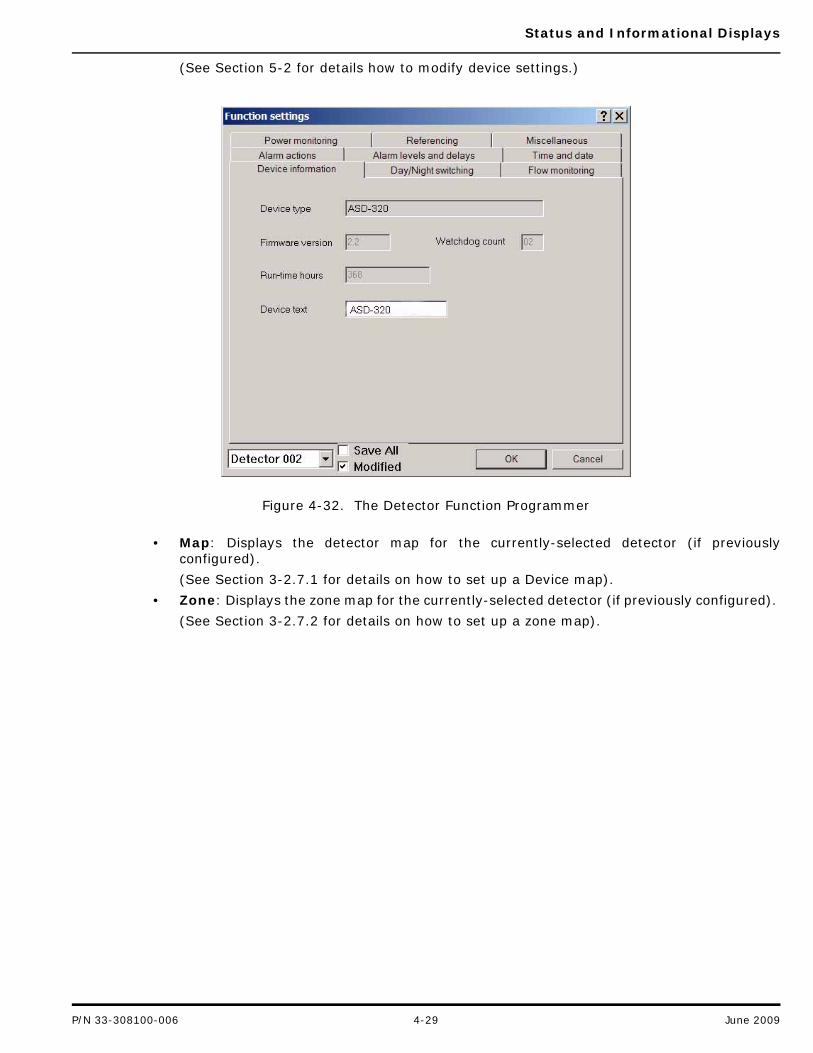
Status and Informational Displays
(See Section 5-2 for details how to modify device settings.)
Figure 4-32. The Detector Function Programmer
• Map: Displays the detector map for the currently-selected detector (if previouslyconfigured).
(See Section 3-2.7.1 for details on how to set up a Device map).
• Zone: Displays the zone map for the currently-selected detector (if previously configured).
(See Section 3-2.7.2 for details on how to set up a zone map).
P/N 33-308100-006 4-29 June 2009

Status and Informational Displays
THIS PAGE INTENTIONALLY LEFT BLANK.
June 2009 4-30 P/N 33-308100-006

Configuring SenseNET Options
CHAPTER 5CONFIGURING SENSENET OPTIONS
5-1 INTRODUCTION
This chapter describes how to configure the following categories of functions on detectors andthe Command Module using menu options from the SenseNETTM Options menu:
• Device settings
• PC command module
• Site Configuration
• Communications settings
• Email settings
• Pager settings
• Passwords
• Lock
• Global Reset
• Log to printer
• Map view
• Language
• Actions
You can access these functions via the Options menu (as shown in Figure 5-1).
Figure 5-1. Accessing Programmable Functions Via the Options Menu
P/N 33-308100-006 5-1 June 2009
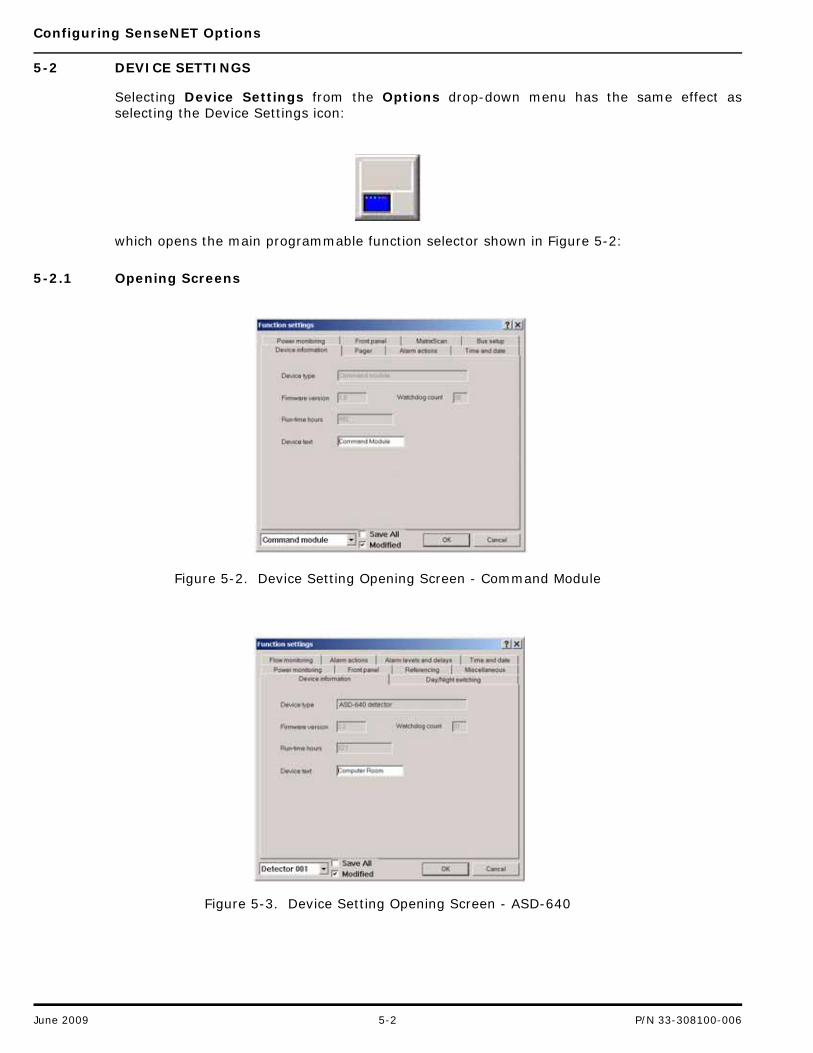
Configuring SenseNET Options
5-2 DEVICE SETTINGS
Selecting Device Settings from the Options drop-down menu has the same effect asselecting the Device Settings icon:
which opens the main programmable function selector shown in Figure 5-2:
5-2.1 Opening Screens
Figure 5-2. Device Setting Opening Screen - Command Module
Figure 5-3. Device Setting Opening Screen - ASD-640
June 2009 5-2 P/N 33-308100-006
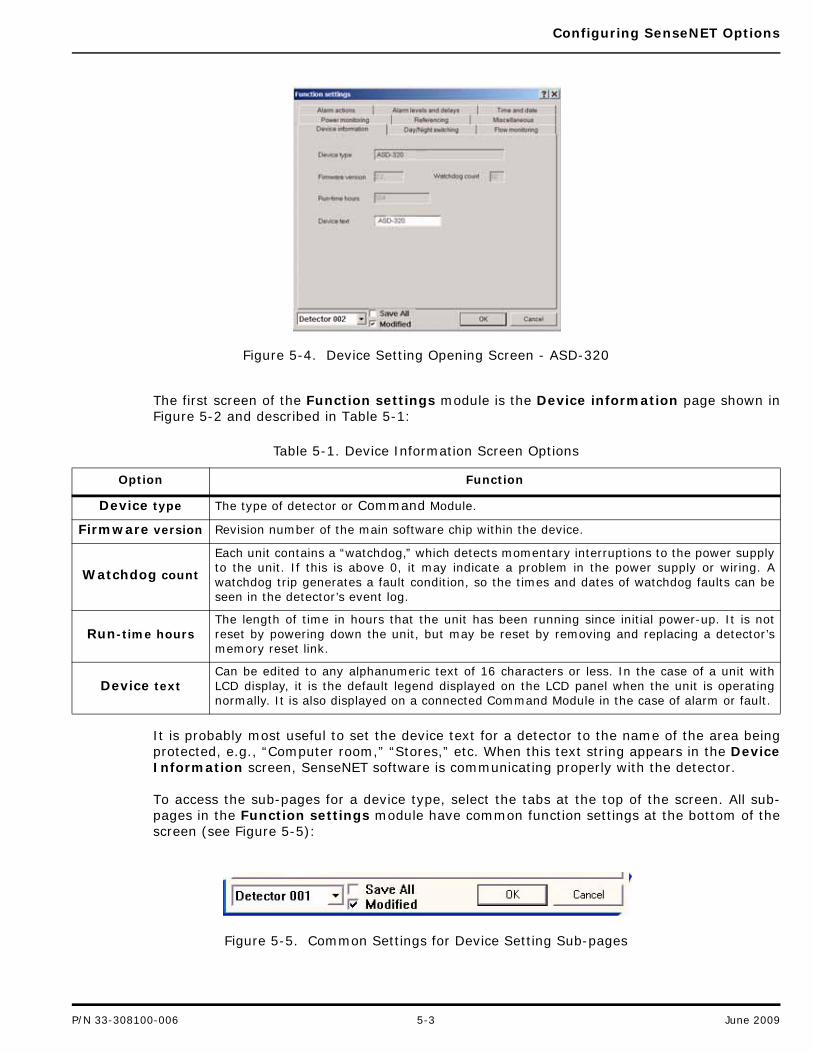
Configuring SenseNET Options
Figure 5-4. Device Setting Opening Screen - ASD-320
The first screen of the Function settings module is the Device information page shown inFigure 5-2 and described in Table 5-1:
It is probably most useful to set the device text for a detector to the name of the area beingprotected, e.g., “Computer room,” “Stores,” etc. When this text string appears in the DeviceInformation screen, SenseNET software is communicating properly with the detector.
To access the sub-pages for a device type, select the tabs at the top of the screen. All sub-pages in the Function settings module have common function settings at the bottom of thescreen (see Figure 5-5):
Figure 5-5. Common Settings for Device Setting Sub-pages
Table 5-1. Device Information Screen Options
Option Function
Device type The type of detector or Command Module.
Firmware version Revision number of the main software chip within the device.
Watchdog count
Each unit contains a “watchdog,” which detects momentary interruptions to the power supplyto the unit. If this is above 0, it may indicate a problem in the power supply or wiring. Awatchdog trip generates a fault condition, so the times and dates of watchdog faults can beseen in the detector’s event log.
Run-time hoursThe length of time in hours that the unit has been running since initial power-up. It is notreset by powering down the unit, but may be reset by removing and replacing a detector’smemory reset link.
Device textCan be edited to any alphanumeric text of 16 characters or less. In the case of a unit withLCD display, it is the default legend displayed on the LCD panel when the unit is operatingnormally. It is also displayed on a connected Command Module in the case of alarm or fault.
P/N 33-308100-006 5-3 June 2009
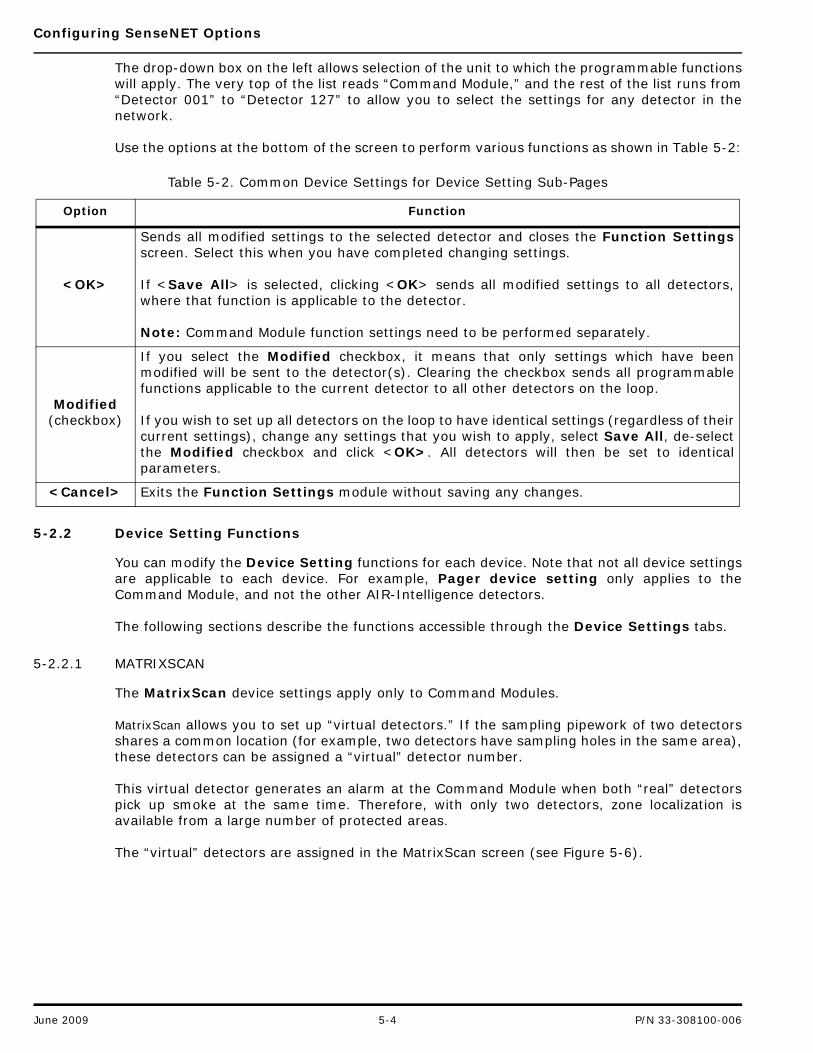
Configuring SenseNET Options
The drop-down box on the left allows selection of the unit to which the programmable functionswill apply. The very top of the list reads “Command Module,” and the rest of the list runs from“Detector 001” to “Detector 127” to allow you to select the settings for any detector in thenetwork.
Use the options at the bottom of the screen to perform various functions as shown in Table 5-2:
5-2.2 Device Setting Functions
You can modify the Device Setting functions for each device. Note that not all device settingsare applicable to each device. For example, Pager device setting only applies to theCommand Module, and not the other AIR-Intelligence detectors.
The following sections describe the functions accessible through the Device Settings tabs.
5-2.2.1 MATRIXSCAN
The MatrixScan device settings apply only to Command Modules.
MatrixScan allows you to set up “virtual detectors.” If the sampling pipework of two detectorsshares a common location (for example, two detectors have sampling holes in the same area),these detectors can be assigned a “virtual” detector number.
This virtual detector generates an alarm at the Command Module when both “real” detectorspick up smoke at the same time. Therefore, with only two detectors, zone localization isavailable from a large number of protected areas.
The “virtual” detectors are assigned in the MatrixScan screen (see Figure 5-6).
Table 5-2. Common Device Settings for Device Setting Sub-Pages
Option Function
<OK>
Sends all modified settings to the selected detector and closes the Function Settingsscreen. Select this when you have completed changing settings.
If <Save All> is selected, clicking <OK> sends all modified settings to all detectors,where that function is applicable to the detector.
Note: Command Module function settings need to be performed separately.
Modified(checkbox)
If you select the Modified checkbox, it means that only settings which have beenmodified will be sent to the detector(s). Clearing the checkbox sends all programmablefunctions applicable to the current detector to all other detectors on the loop.
If you wish to set up all detectors on the loop to have identical settings (regardless of theircurrent settings), change any settings that you wish to apply, select Save All, de-selectthe Modified checkbox and click <OK>. All detectors will then be set to identicalparameters.
<Cancel> Exits the Function Settings module without saving any changes.
June 2009 5-4 P/N 33-308100-006
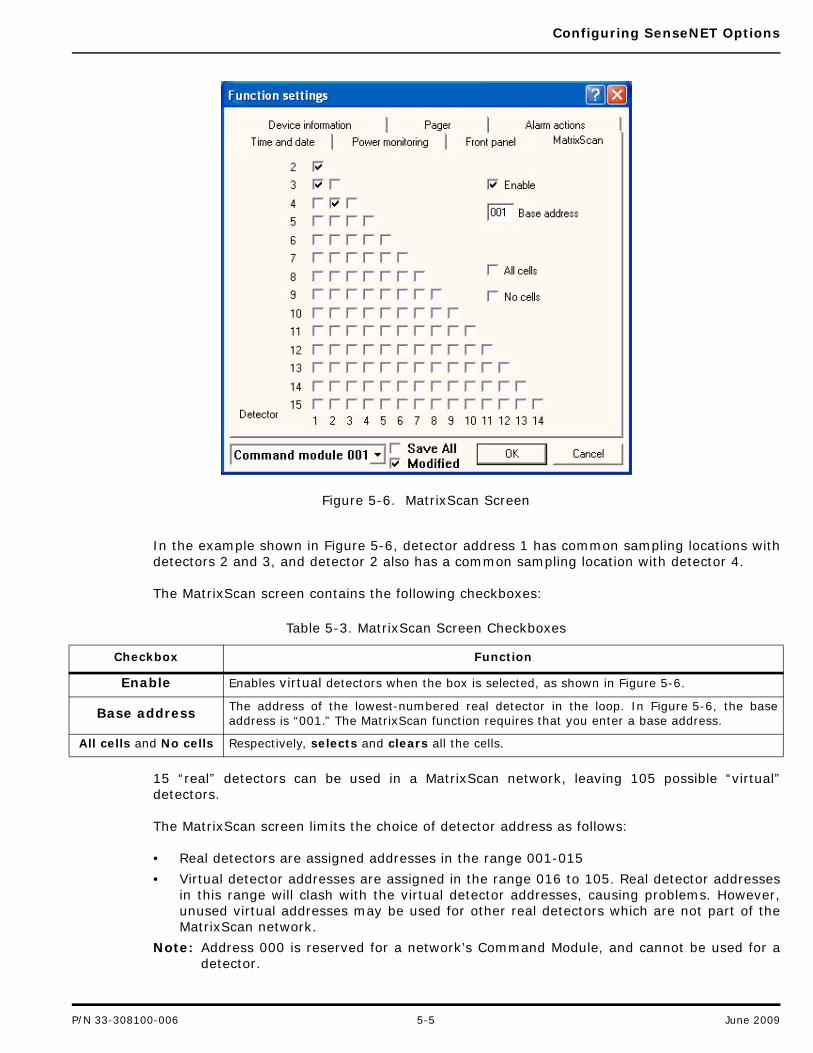
Configuring SenseNET Options
Figure 5-6. MatrixScan Screen
In the example shown in Figure 5-6, detector address 1 has common sampling locations withdetectors 2 and 3, and detector 2 also has a common sampling location with detector 4.
The MatrixScan screen contains the following checkboxes:
15 “real” detectors can be used in a MatrixScan network, leaving 105 possible “virtual”detectors.
The MatrixScan screen limits the choice of detector address as follows:
• Real detectors are assigned addresses in the range 001-015
• Virtual detector addresses are assigned in the range 016 to 105. Real detector addressesin this range will clash with the virtual detector addresses, causing problems. However,unused virtual addresses may be used for other real detectors which are not part of theMatrixScan network.
Note: Address 000 is reserved for a network’s Command Module, and cannot be used for adetector.
Table 5-3. MatrixScan Screen Checkboxes
Checkbox Function
Enable Enables virtual detectors when the box is selected, as shown in Figure 5-6.
Base address The address of the lowest-numbered real detector in the loop. In Figure 5-6, the baseaddress is “001.” The MatrixScan function requires that you enter a base address.
All cells and No cells Respectively, selects and clears all the cells.
P/N 33-308100-006 5-5 June 2009
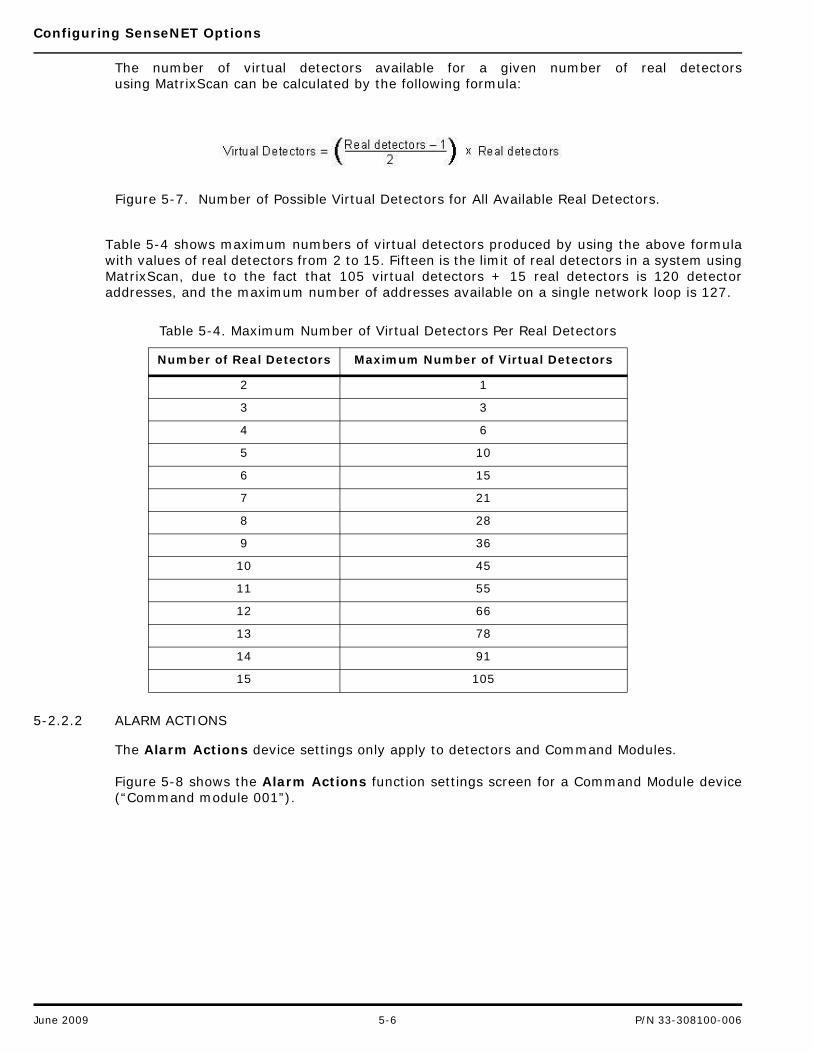
Configuring SenseNET Options
The number of virtual detectors available for a given number of real detectorsusing MatrixScan can be calculated by the following formula:
Figure 5-7. Number of Possible Virtual Detectors for All Available Real Detectors.
Table 5-4 shows maximum numbers of virtual detectors produced by using the above formulawith values of real detectors from 2 to 15. Fifteen is the limit of real detectors in a system usingMatrixScan, due to the fact that 105 virtual detectors + 15 real detectors is 120 detectoraddresses, and the maximum number of addresses available on a single network loop is 127.
5-2.2.2 ALARM ACTIONS
The Alarm Actions device settings only apply to detectors and Command Modules.
Figure 5-8 shows the Alarm Actions function settings screen for a Command Module device(“Command module 001”).
Table 5-4. Maximum Number of Virtual Detectors Per Real Detectors
Number of Real Detectors Maximum Number of Virtual Detectors
2 1
3 3
4 6
5 10
6 15
7 21
8 28
9 36
10 45
11 55
12 66
13 78
14 91
15 105
June 2009 5-6 P/N 33-308100-006
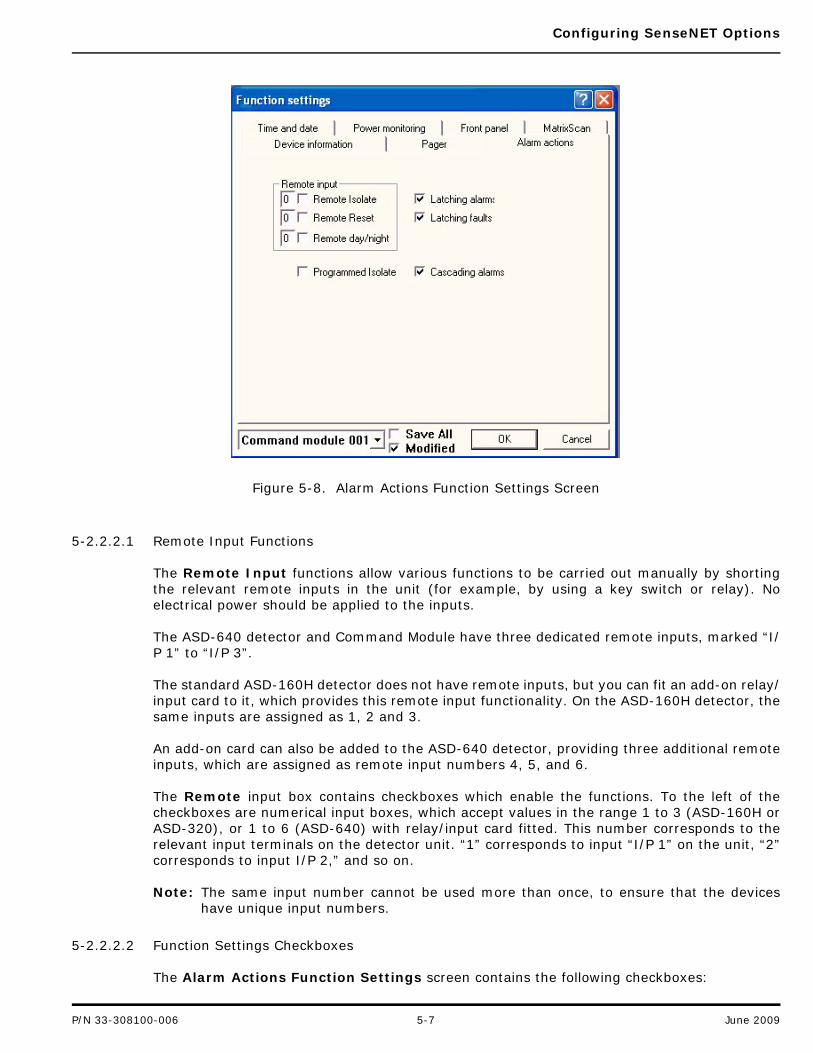
Configuring SenseNET Options
Figure 5-8. Alarm Actions Function Settings Screen
5-2.2.2.1 Remote Input Functions
The Remote Input functions allow various functions to be carried out manually by shortingthe relevant remote inputs in the unit (for example, by using a key switch or relay). Noelectrical power should be applied to the inputs.
The ASD-640 detector and Command Module have three dedicated remote inputs, marked “I/P 1” to “I/P 3”.
The standard ASD-160H detector does not have remote inputs, but you can fit an add-on relay/input card to it, which provides this remote input functionality. On the ASD-160H detector, thesame inputs are assigned as 1, 2 and 3.
An add-on card can also be added to the ASD-640 detector, providing three additional remoteinputs, which are assigned as remote input numbers 4, 5, and 6.
The Remote input box contains checkboxes which enable the functions. To the left of thecheckboxes are numerical input boxes, which accept values in the range 1 to 3 (ASD-160H orASD-320), or 1 to 6 (ASD-640) with relay/input card fitted. This number corresponds to therelevant input terminals on the detector unit. “1” corresponds to input “I/P 1” on the unit, “2”corresponds to input I/P 2,” and so on.
Note: The same input number cannot be used more than once, to ensure that the deviceshave unique input numbers.
5-2.2.2.2 Function Settings Checkboxes
The Alarm Actions Function Settings screen contains the following checkboxes:
P/N 33-308100-006 5-7 June 2009
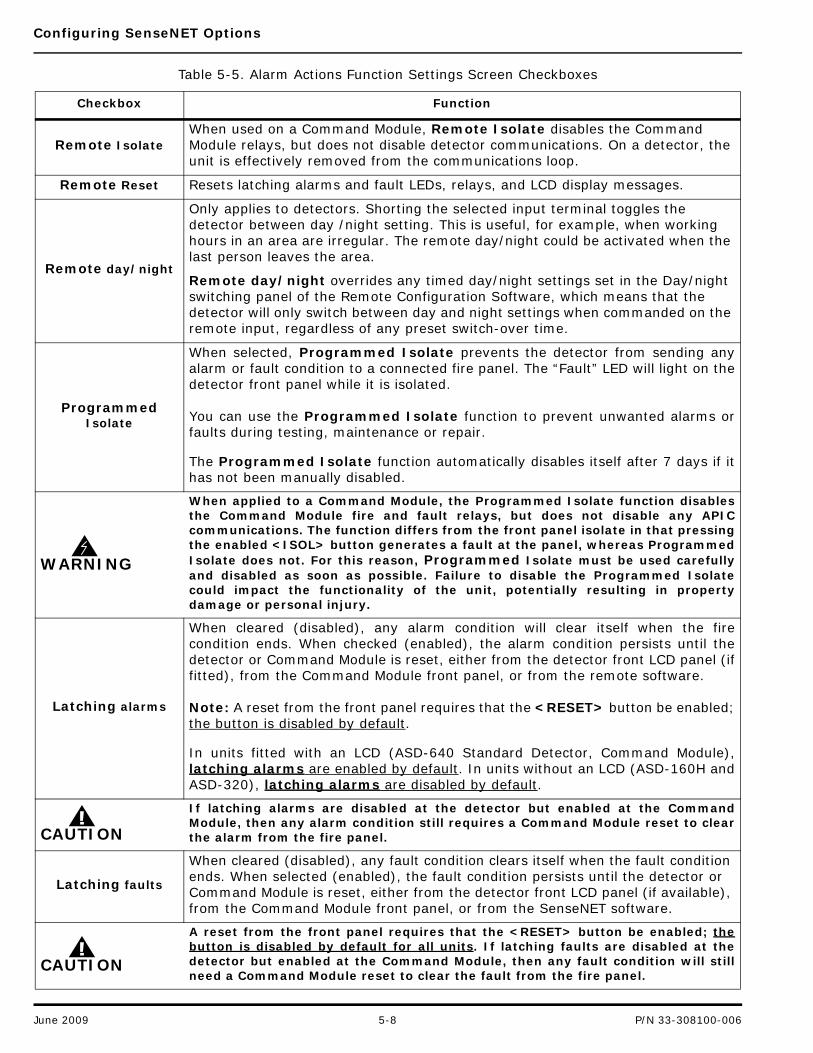
Configuring SenseNET Options
Table 5-5. Alarm Actions Function Settings Screen Checkboxes
Checkbox Function
Remote IsolateWhen used on a Command Module, Remote Isolate disables the Command Module relays, but does not disable detector communications. On a detector, the unit is effectively removed from the communications loop.
Remote Reset Resets latching alarms and fault LEDs, relays, and LCD display messages.
Remote day/night
Only applies to detectors. Shorting the selected input terminal toggles the detector between day /night setting. This is useful, for example, when working hours in an area are irregular. The remote day/night could be activated when the last person leaves the area.
Remote day/night overrides any timed day/night settings set in the Day/night switching panel of the Remote Configuration Software, which means that the detector will only switch between day and night settings when commanded on the remote input, regardless of any preset switch-over time.
Programmed Isolate
When selected, Programmed Isolate prevents the detector from sending anyalarm or fault condition to a connected fire panel. The “Fault” LED will light on thedetector front panel while it is isolated.
You can use the Programmed Isolate function to prevent unwanted alarms orfaults during testing, maintenance or repair.
The Programmed Isolate function automatically disables itself after 7 days if ithas not been manually disabled.
WARNING
When applied to a Command Module, the Programmed Isolate function disablesthe Command Module fire and fault relays, but does not disable any APICcommunications. The function differs from the front panel isolate in that pressingthe enabled <ISOL> button generates a fault at the panel, whereas ProgrammedIsolate does not. For this reason, Programmed Isolate must be used carefullyand disabled as soon as possible. Failure to disable the Programmed Isolatecould impact the functionality of the unit, potentially resulting in propertydamage or personal injury.
Latching alarms
When cleared (disabled), any alarm condition will clear itself when the firecondition ends. When checked (enabled), the alarm condition persists until thedetector or Command Module is reset, either from the detector front LCD panel (iffitted), from the Command Module front panel, or from the remote software.
Note: A reset from the front panel requires that the <RESET> button be enabled;the button is disabled by default.
In units fitted with an LCD (ASD-640 Standard Detector, Command Module),latching alarms are enabled by default. In units without an LCD (ASD-160H andASD-320), latching alarms are disabled by default.
CAUTION
If latching alarms are disabled at the detector but enabled at the CommandModule, then any alarm condition still requires a Command Module reset to clearthe alarm from the fire panel.
Latching faults
When cleared (disabled), any fault condition clears itself when the fault condition ends. When selected (enabled), the fault condition persists until the detector or Command Module is reset, either from the detector front LCD panel (if available), from the Command Module front panel, or from the SenseNET software.
CAUTION
A reset from the front panel requires that the <RESET> button be enabled; thebutton is disabled by default for all units. If latching faults are disabled at thedetector but enabled at the Command Module, then any fault condition will stillneed a Command Module reset to clear the fault from the fire panel.
June 2009 5-8 P/N 33-308100-006

Configuring SenseNET Options
5-2.2.3 TIME AND DATE
The Time and Date device settings apply to detectors and Command Modules.
Figure 5-9 shows the Time and Date function settings screen for a Detector device (“Detector001”).
Figure 5-9. Time and Date Function Settings Screen
This is the time and date to be used for the unit’s internal Real Time Clock, and is used in eventlogs and chart recordings.
The Time and Date function does not automatically update for Daylight Savings Time or otherchanges of local time. You must update the Real Time Clock settings periodically, or you mustmake allowances for the time difference when reviewing data.
Note: When installing a detector, the clock may need to be set to correct local time.
The date and time can be set by one of the following methods:
• Incrementing or decrementing each value (hours, minutes, day, month, or year) byclicking the up or down arrows to the right of each display box
• Select one of the boxes to highlight it and type in the relevant value
• Select the <Set from PC> button to synchronize the detector’s clock with the current timeand date set on the controlling PC.
Cascading alarmsWhen cleared (disabled), the detector starts to count down the Fire 1 alarm delay once it has generated a Pre-Alarm and Fire 1 alarm delays are cumulative. The Cascading alarms function is enabled by default.
Table 5-5. Alarm Actions Function Settings Screen Checkboxes (Continued)
Checkbox Function
P/N 33-308100-006 5-9 June 2009
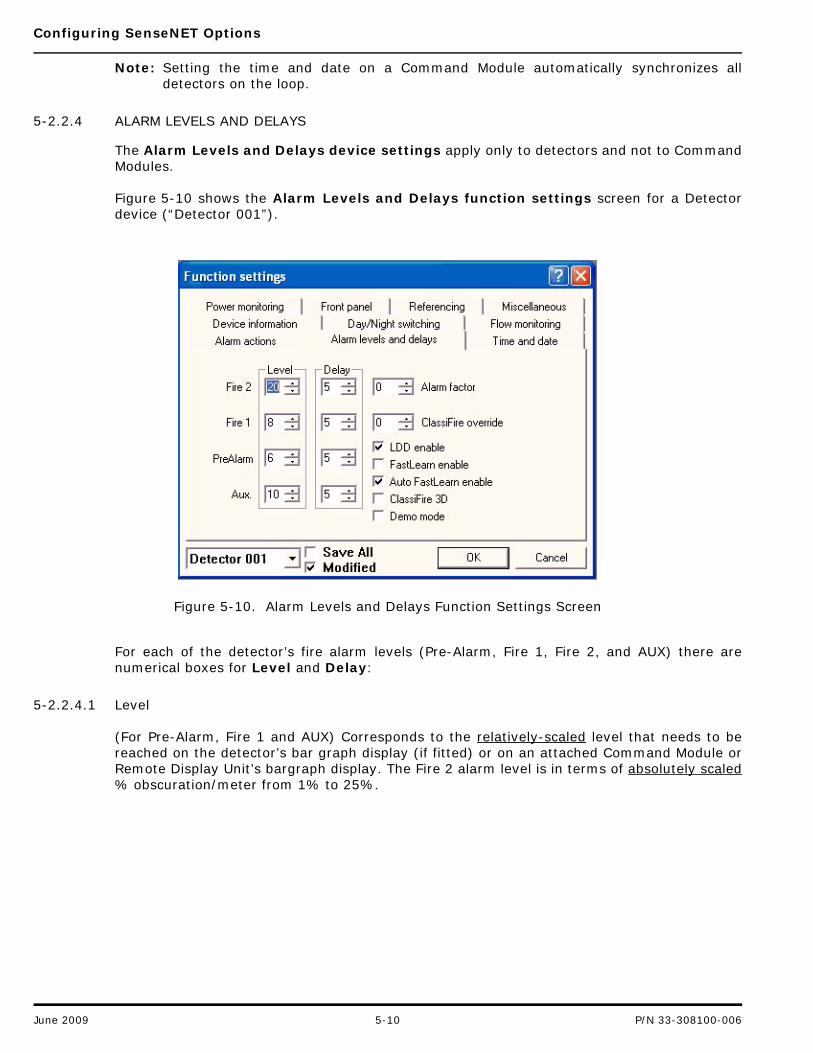
Configuring SenseNET Options
Note: Setting the time and date on a Command Module automatically synchronizes alldetectors on the loop.
5-2.2.4 ALARM LEVELS AND DELAYS
The Alarm Levels and Delays device settings apply only to detectors and not to CommandModules.
Figure 5-10 shows the Alarm Levels and Delays function settings screen for a Detectordevice (“Detector 001”).
Figure 5-10. Alarm Levels and Delays Function Settings Screen
For each of the detector’s fire alarm levels (Pre-Alarm, Fire 1, Fire 2, and AUX) there arenumerical boxes for Level and Delay:
5-2.2.4.1 Level
(For Pre-Alarm, Fire 1 and AUX) Corresponds to the relatively-scaled level that needs to bereached on the detector’s bar graph display (if fitted) or on an attached Command Module orRemote Display Unit’s bargraph display. The Fire 2 alarm level is in terms of absolutely scaled% obscuration/meter from 1% to 25%.
June 2009 5-10 P/N 33-308100-006
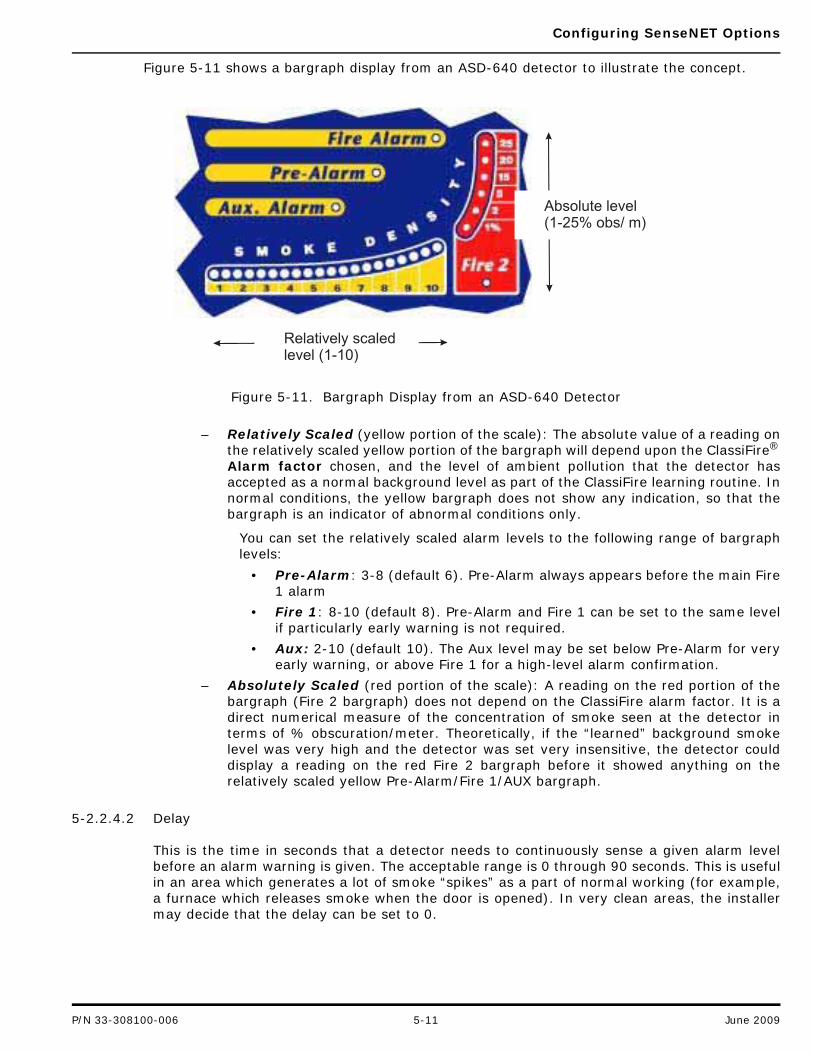
Configuring SenseNET Options
Figure 5-11 shows a bargraph display from an ASD-640 detector to illustrate the concept.
Figure 5-11. Bargraph Display from an ASD-640 Detector
– Relatively Scaled (yellow portion of the scale): The absolute value of a reading onthe relatively scaled yellow portion of the bargraph will depend upon the ClassiFire®
Alarm factor chosen, and the level of ambient pollution that the detector hasaccepted as a normal background level as part of the ClassiFire learning routine. Innormal conditions, the yellow bargraph does not show any indication, so that thebargraph is an indicator of abnormal conditions only.
You can set the relatively scaled alarm levels to the following range of bargraphlevels:
• Pre-Alarm: 3-8 (default 6). Pre-Alarm always appears before the main Fire1 alarm
• Fire 1: 8-10 (default 8). Pre-Alarm and Fire 1 can be set to the same levelif particularly early warning is not required.
• Aux: 2-10 (default 10). The Aux level may be set below Pre-Alarm for veryearly warning, or above Fire 1 for a high-level alarm confirmation.
– Absolutely Scaled (red portion of the scale): A reading on the red portion of thebargraph (Fire 2 bargraph) does not depend on the ClassiFire alarm factor. It is adirect numerical measure of the concentration of smoke seen at the detector interms of % obscuration/meter. Theoretically, if the “learned” background smokelevel was very high and the detector was set very insensitive, the detector coulddisplay a reading on the red Fire 2 bargraph before it showed anything on therelatively scaled yellow Pre-Alarm/Fire 1/AUX bargraph.
5-2.2.4.2 Delay
This is the time in seconds that a detector needs to continuously sense a given alarm levelbefore an alarm warning is given. The acceptable range is 0 through 90 seconds. This is usefulin an area which generates a lot of smoke “spikes” as a part of normal working (for example,a furnace which releases smoke when the door is opened). In very clean areas, the installermay decide that the delay can be set to 0.
Relatively scaledlevel (1-10)
Absolute level(1-25% obs/ m)
P/N 33-308100-006 5-11 June 2009
Configuring SenseNET Options
5-2.2.4.3 Alarm Factor
The ClassiFire system statistically analyzes the background smoke level and sets detectorsensitivity to a level giving a statistical probability of nuisance alarm. The software assessesthe arithmetic mean and variance (standard deviation) of the “normal” ambient smoke leveland places the alarm flags at a certain number of standard deviations from the mean of thedistribution.
The number of standard deviations at which the alarm flag is set away from the mean isdirectly proportional to the ClassiFire Alarm factor chosen.
The probability of nuisance alarm and the maximum detector sensitivity are higher whena low level of alarm factor is chosen and lower as the alarm factor is increased. A low alarmfactor, equating to very high sensitivity, may be desirable in the case of, for example, ahigh-value computer center, or other application where the cost of down-time and call-outcosts may be offset by the high value of the protected installation.
On the other hand, this will not be desirable in an environment with very variable levels ofbackground smoke. In this case, it may be more important to ensure that an elevated levelof smoke really does indicate an incipient fire before alarms are raised.
In summary, a low alarm factor equates to high sensitivity and higher probability ofnuisance alarm, and a high alarm factor gives a lower maximum sensitivity andcorrespondingly reduced probability of nuisance alarm.
The probability of nuisance alarm for a given environment also depends on the “stability”of the background smoke level. For example, a semiconductor clean room may have astrictly-controlled environment so that it is unlikely that smoke level will vary by chance.Under these circumstances, a low alarm factor may not imply a radically increasedprobability of nuisance alarm.
The detector sensitivity is set by entering a value of 0 through 18 into the Alarm factornumerical box. The default is set to 4. Refer to Table 5-6 for suggested settings.
5-2.2.4.4 ClassiFire override
There may be occasions on which a sudden increase in smoke does not necessarily indicate afire condition. Examples are the release of incense during a church mass and the opening of afurnace door in a factory. Under these kinds of circumstance it is not desirable for the detectorto generate a fire alarm.
Table 5-6. Suggested Settings for ClassiFire Alarm Factor
Alarm Factor
SensitivityProbability of
Nuisance AlarmSuggested Protected Area
0 Extremely High Once per year Semiconductor manufacturing clean room
1 High Once per 5 years Computer room
2 High Once per 10 years Non-smoking office
3 High Once per 50 years Clean factory
4 Medium Once per 1,000 years Warehouse
5 Medium Once per 5,000 years Warehouse with diesel trucks operating
6 Medium Once per 10,000 years Warehouse with diesel trucks operating
7 Low Once per 20,000 years Warehouse with diesel trucks operating
8 Low Once per 100,000 years Warehouse with diesel trucks operating
June 2009 5-12 P/N 33-308100-006
Configuring SenseNET Options
ClassiFire Override will desensitize the detector by a specified amount when a pair of remotecontacts are shorted. In the case of a furnace door being opened, this could be performedautomatically by an interlock switch on the door, or it could be achieved with a simple on/offswitch. Where the smoke-generating event has a definite length and time of occurrence, theevent could be on a time switch. All that is required is that the relevant input terminals on thedetector are shorted together.
The figure entered into the ClassiFire Override box is the percentage of full-scale detectoroutput by which the alarm flags will be shifted when the contacts are shorted. For example, ifset to a value of 35%, a detector with an alarm level of 20% would have this changed to 55%when the function was activated.
On the ASD-160H or ASD-320 detector, ClassiFire Override may only be used when thedetector is fitted with an optional relay/input card, and the function is reserved for Input 3 onthe card.
On the ASD-640 detector, the default ClassiFire Override contacts are the “I/P 3” terminalsinside the detector.
As a special case, however, when the ASD-640 detector is fitted with an APIC card whichincludes remote input terminals, ClassiFire Override can be set to use one of the remoteterminals on the APIC card by entering a value into the ClassiFire Override box of over100%. ClassiFire Override values of 001 – 099% act on the default input terminal 3, but avalue of 120% would give an override percentage of 20% on APIC card input 1 (if resent),227% would give an override percentage of 27% on APIC card input 2, and so on.
5-2.2.4.5 LDDTM enable
LDD stands for “Laser Dust Discrimination.” This function is enabled by default and it causesthe detector to ignore brief, isolated increases in detector output such as spurious readingsfrom ambient dust particles. In very clean areas, such as semiconductor clean rooms, it maybe disabled to gain a small improvement in response time.
5-2.2.4.6 FastLearnTM enable
If the detector is in FastLearn mode when the screen is opened, this function will be selected(enabled). If cleared (disabled), then selecting this box will start a FastLearn. In a similarmanner, clearing the box stops a FastLearn that is currently in progress.
Note: Stopping a FastLearn operation will prevent the detector from reaching its optimumsensitivity. The detector must be put through another FastLearn cycle and left for 24 hoursto regain full sensitivity.
5-2.2.4.7 Auto FastLearn enable
When selected (enabled), this function starts a new FastLearn sequence each time the detectoris powered down and re-started. This is the default setting, and it ensures that the detector isset to the optimum sensitivity if it is moved to another location. However, if the detector is leftin the same location and powered down, (for example, for maintenance purposes) the functioncan be cleared so that the detector sensitivity is unchanged when the detector is powered upagain.
5-2.2.4.8 ClassiFire 3D
When selected, this feature assesses the rate of increase of smoke in the protected area. Whenthe level of smoke rises too quickly, ClassiFire will ignore any time delays before generating
P/N 33-308100-006 5-13 June 2009
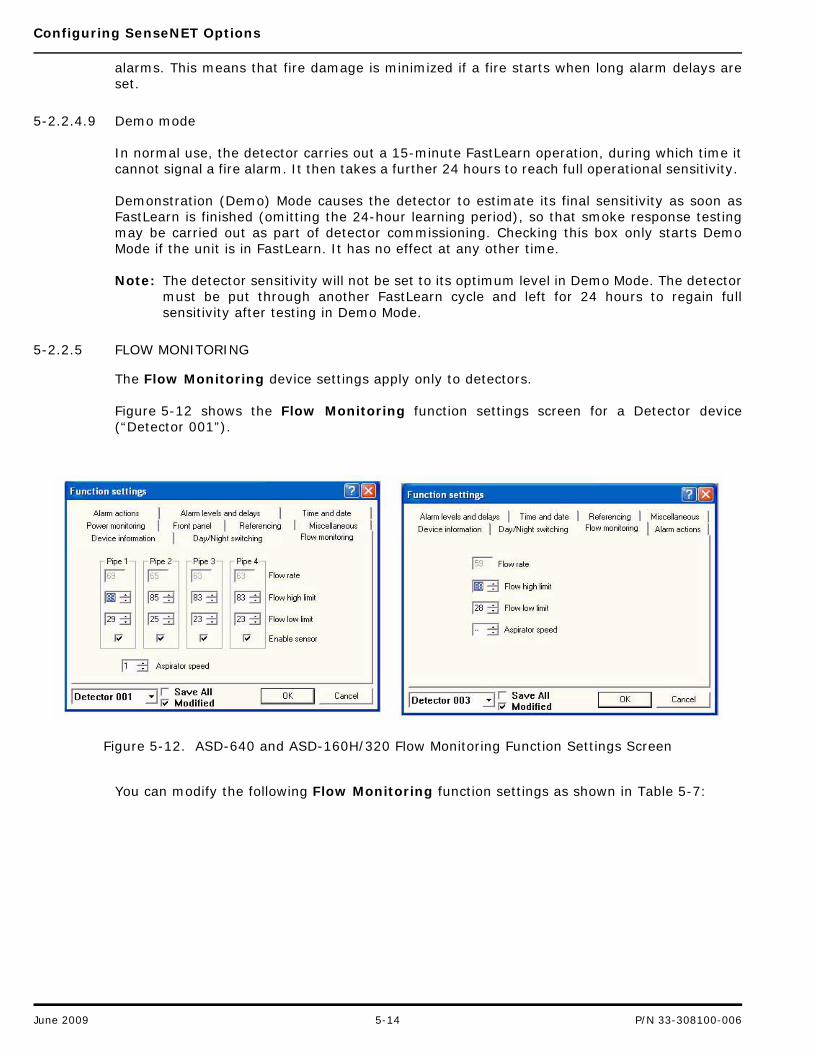
Configuring SenseNET Options
alarms. This means that fire damage is minimized if a fire starts when long alarm delays areset.
5-2.2.4.9 Demo mode
In normal use, the detector carries out a 15-minute FastLearn operation, during which time itcannot signal a fire alarm. It then takes a further 24 hours to reach full operational sensitivity.
Demonstration (Demo) Mode causes the detector to estimate its final sensitivity as soon asFastLearn is finished (omitting the 24-hour learning period), so that smoke response testingmay be carried out as part of detector commissioning. Checking this box only starts DemoMode if the unit is in FastLearn. It has no effect at any other time.
Note: The detector sensitivity will not be set to its optimum level in Demo Mode. The detectormust be put through another FastLearn cycle and left for 24 hours to regain fullsensitivity after testing in Demo Mode.
5-2.2.5 FLOW MONITORING
The Flow Monitoring device settings apply only to detectors.
Figure 5-12 shows the Flow Monitoring function settings screen for a Detector device(“Detector 001”).
Figure 5-12. ASD-640 and ASD-160H/320 Flow Monitoring Function Settings Screen
You can modify the following Flow Monitoring function settings as shown in Table 5-7:
June 2009 5-14 P/N 33-308100-006
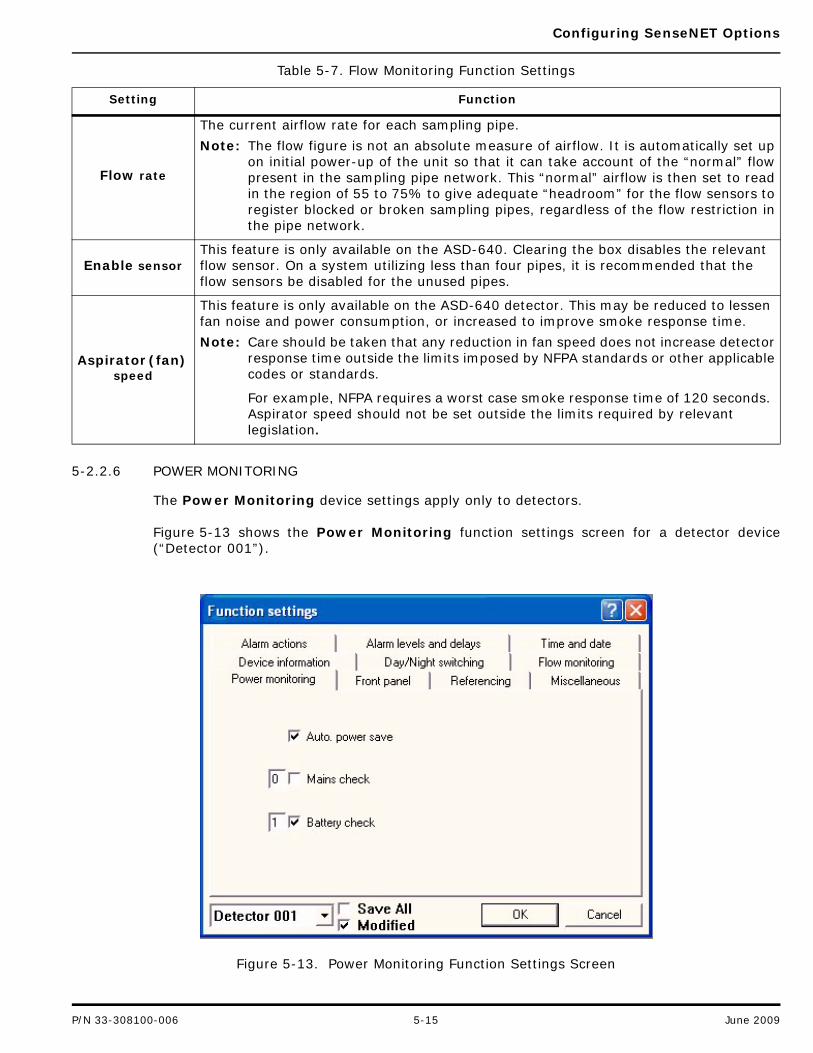
Configuring SenseNET Options
5-2.2.6 POWER MONITORING
The Power Monitoring device settings apply only to detectors.
Figure 5-13 shows the Power Monitoring function settings screen for a detector device(“Detector 001”).
Figure 5-13. Power Monitoring Function Settings Screen
Table 5-7. Flow Monitoring Function Settings
Setting Function
Flow rate
The current airflow rate for each sampling pipe.
Note: The flow figure is not an absolute measure of airflow. It is automatically set upon initial power-up of the unit so that it can take account of the “normal” flowpresent in the sampling pipe network. This “normal” airflow is then set to readin the region of 55 to 75% to give adequate “headroom” for the flow sensors toregister blocked or broken sampling pipes, regardless of the flow restriction inthe pipe network.
Enable sensorThis feature is only available on the ASD-640. Clearing the box disables the relevant flow sensor. On a system utilizing less than four pipes, it is recommended that the flow sensors be disabled for the unused pipes.
Aspirator (fan) speed
This feature is only available on the ASD-640 detector. This may be reduced to lessen fan noise and power consumption, or increased to improve smoke response time.
Note: Care should be taken that any reduction in fan speed does not increase detectorresponse time outside the limits imposed by NFPA standards or other applicablecodes or standards.
For example, NFPA requires a worst case smoke response time of 120 seconds. Aspirator speed should not be set outside the limits required by relevant legislation.
P/N 33-308100-006 5-15 June 2009
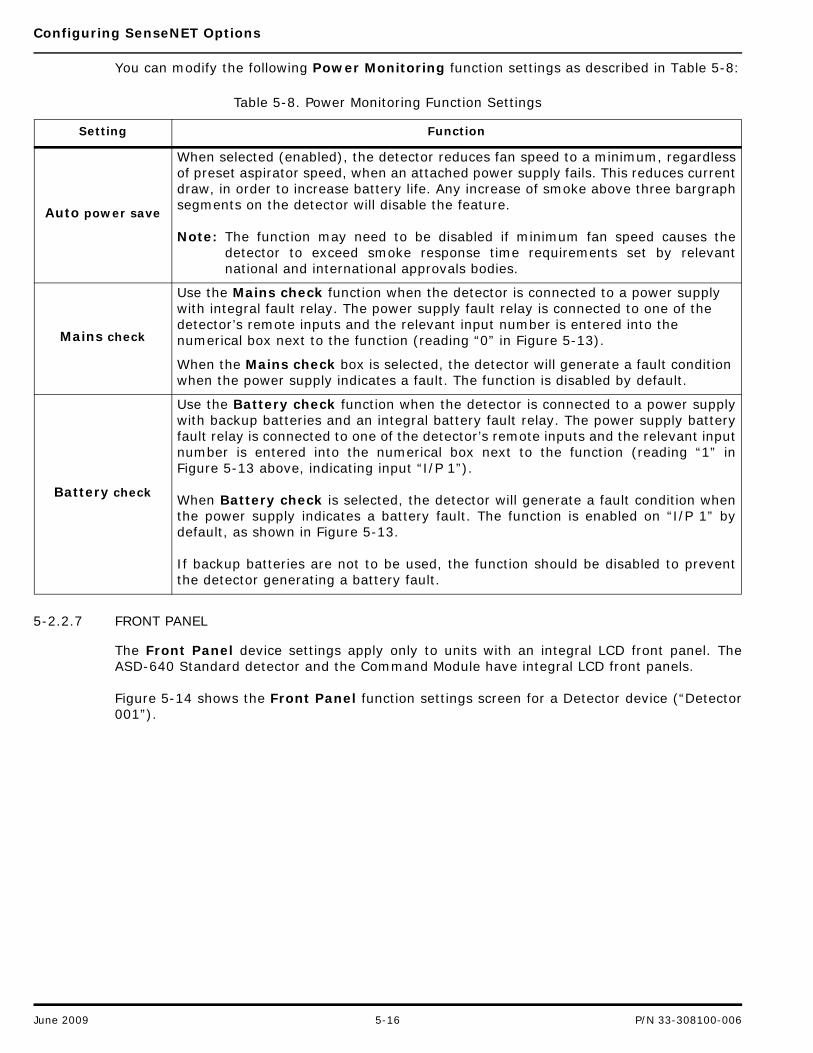
Configuring SenseNET Options
You can modify the following Power Monitoring function settings as described in Table 5-8:
5-2.2.7 FRONT PANEL
The Front Panel device settings apply only to units with an integral LCD front panel. TheASD-640 Standard detector and the Command Module have integral LCD front panels.
Figure 5-14 shows the Front Panel function settings screen for a Detector device (“Detector001”).
Table 5-8. Power Monitoring Function Settings
Setting Function
Auto power save
When selected (enabled), the detector reduces fan speed to a minimum, regardlessof preset aspirator speed, when an attached power supply fails. This reduces currentdraw, in order to increase battery life. Any increase of smoke above three bargraphsegments on the detector will disable the feature.
Note: The function may need to be disabled if minimum fan speed causes thedetector to exceed smoke response time requirements set by relevantnational and international approvals bodies.
Mains check
Use the Mains check function when the detector is connected to a power supply with integral fault relay. The power supply fault relay is connected to one of the detector’s remote inputs and the relevant input number is entered into the numerical box next to the function (reading “0” in Figure 5-13).
When the Mains check box is selected, the detector will generate a fault condition when the power supply indicates a fault. The function is disabled by default.
Battery check
Use the Battery check function when the detector is connected to a power supplywith backup batteries and an integral battery fault relay. The power supply batteryfault relay is connected to one of the detector’s remote inputs and the relevant inputnumber is entered into the numerical box next to the function (reading “1” inFigure 5-13 above, indicating input “I/P 1”).
When Battery check is selected, the detector will generate a fault condition whenthe power supply indicates a battery fault. The function is enabled on “I/P 1” bydefault, as shown in Figure 5-13.
If backup batteries are not to be used, the function should be disabled to preventthe detector generating a battery fault.
June 2009 5-16 P/N 33-308100-006
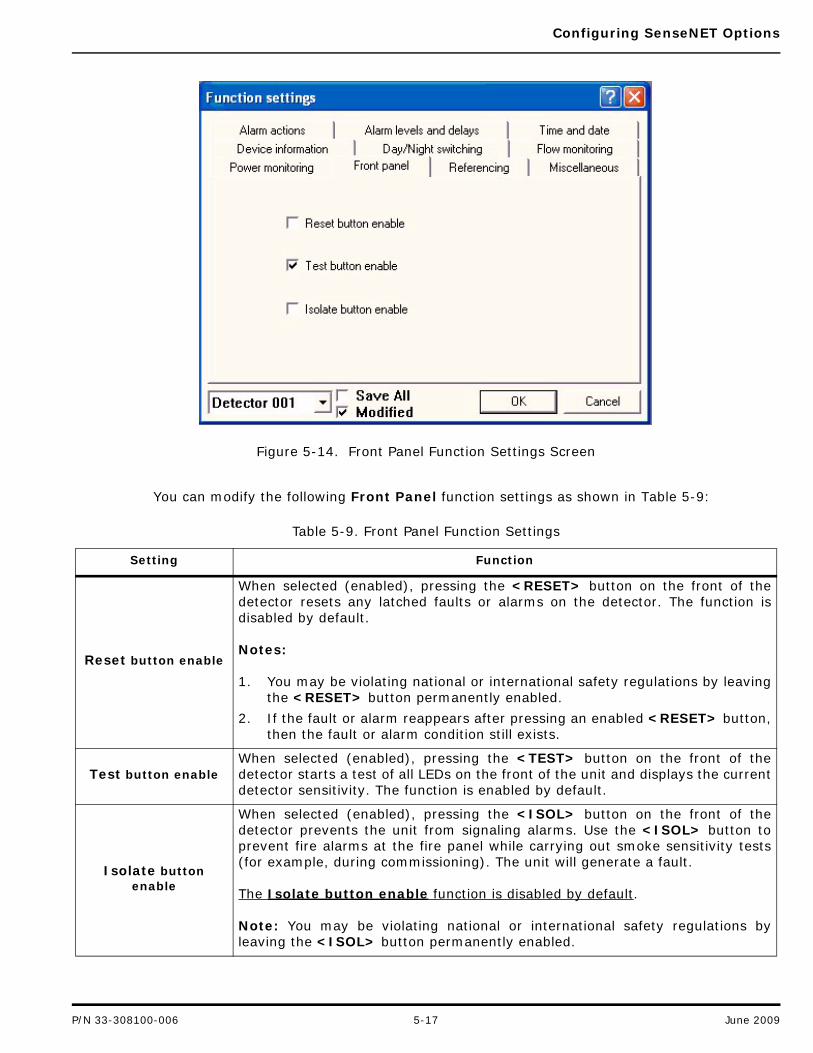
Configuring SenseNET Options
Figure 5-14. Front Panel Function Settings Screen
You can modify the following Front Panel function settings as shown in Table 5-9:
Table 5-9. Front Panel Function Settings
Setting Function
Reset button enable
When selected (enabled), pressing the <RESET> button on the front of thedetector resets any latched faults or alarms on the detector. The function isdisabled by default.
Notes:
1. You may be violating national or international safety regulations by leavingthe <RESET> button permanently enabled.
2. If the fault or alarm reappears after pressing an enabled <RESET> button,then the fault or alarm condition still exists.
Test button enableWhen selected (enabled), pressing the <TEST> button on the front of thedetector starts a test of all LEDs on the front of the unit and displays the currentdetector sensitivity. The function is enabled by default.
Isolate button enable
When selected (enabled), pressing the <ISOL> button on the front of thedetector prevents the unit from signaling alarms. Use the <ISOL> button toprevent fire alarms at the fire panel while carrying out smoke sensitivity tests(for example, during commissioning). The unit will generate a fault.
The Isolate button enable function is disabled by default.
Note: You may be violating national or international safety regulations byleaving the <ISOL> button permanently enabled.
P/N 33-308100-006 5-17 June 2009
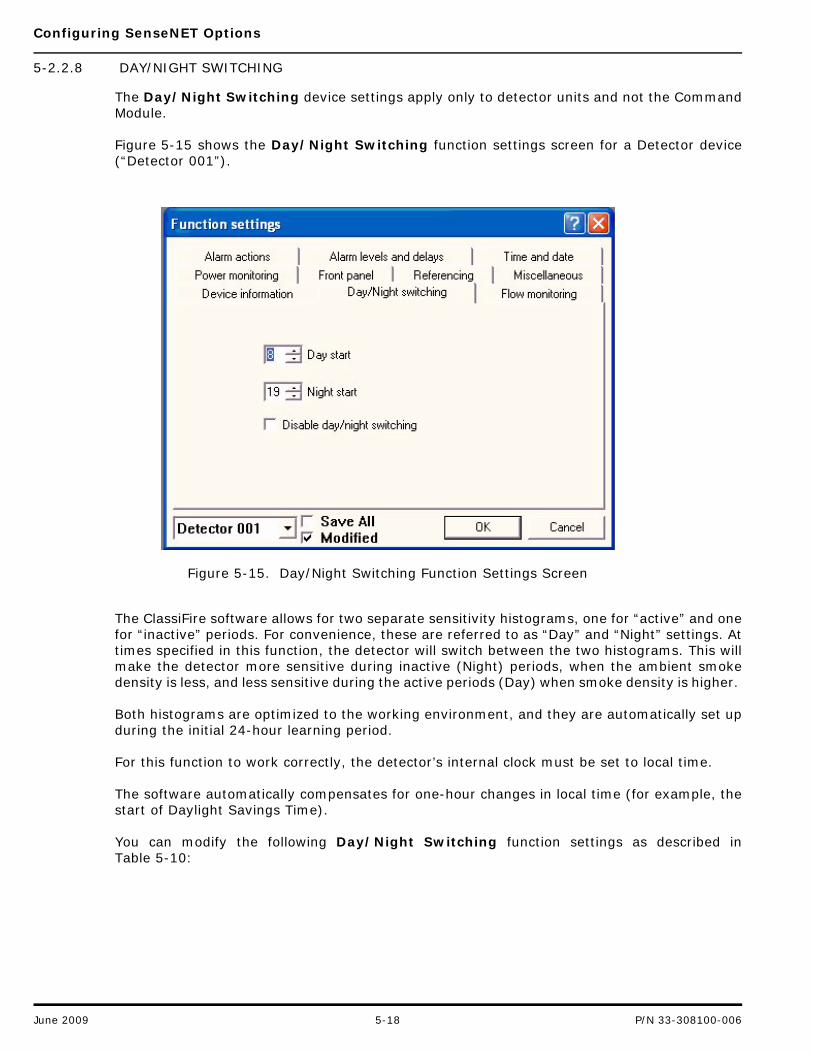
Configuring SenseNET Options
5-2.2.8 DAY/NIGHT SWITCHING
The Day/Night Switching device settings apply only to detector units and not the CommandModule.
Figure 5-15 shows the Day/Night Switching function settings screen for a Detector device(“Detector 001”).
Figure 5-15. Day/Night Switching Function Settings Screen
The ClassiFire software allows for two separate sensitivity histograms, one for “active” and onefor “inactive” periods. For convenience, these are referred to as “Day” and “Night” settings. Attimes specified in this function, the detector will switch between the two histograms. This willmake the detector more sensitive during inactive (Night) periods, when the ambient smokedensity is less, and less sensitive during the active periods (Day) when smoke density is higher.
Both histograms are optimized to the working environment, and they are automatically set upduring the initial 24-hour learning period.
For this function to work correctly, the detector’s internal clock must be set to local time.
The software automatically compensates for one-hour changes in local time (for example, thestart of Daylight Savings Time).
You can modify the following Day/Night Switching function settings as described inTable 5-10:
June 2009 5-18 P/N 33-308100-006
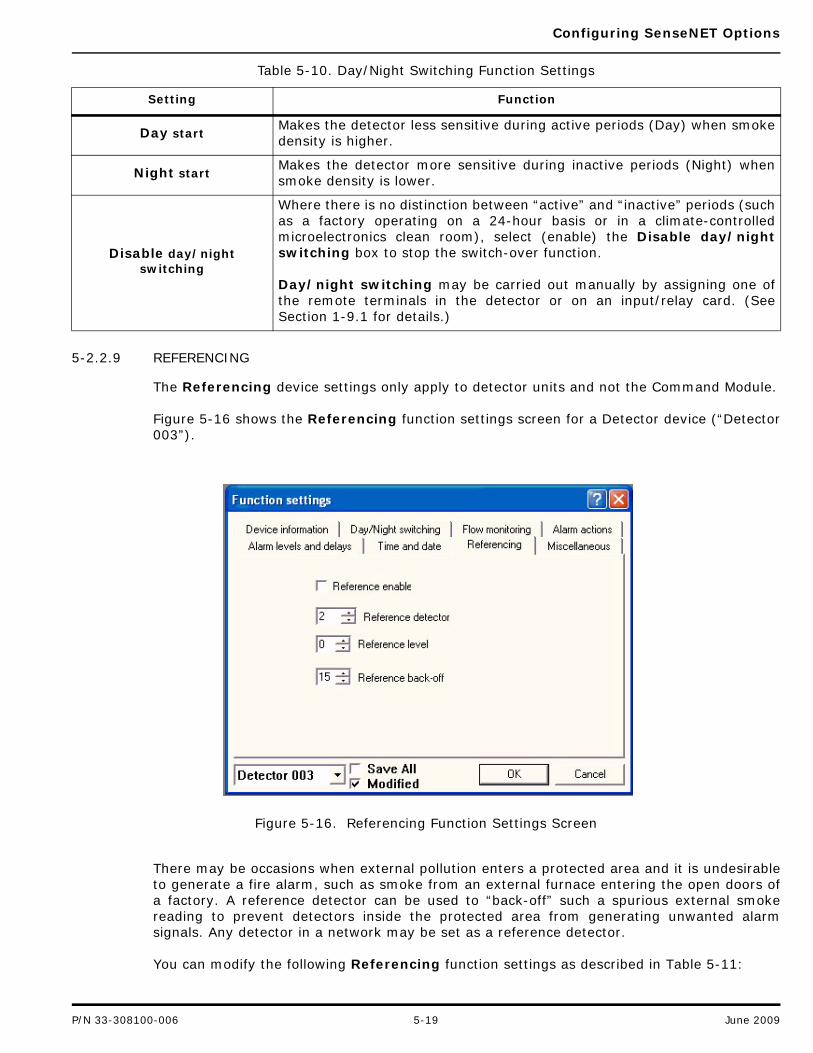
Configuring SenseNET Options
5-2.2.9 REFERENCING
The Referencing device settings only apply to detector units and not the Command Module.
Figure 5-16 shows the Referencing function settings screen for a Detector device (“Detector003”).
Figure 5-16. Referencing Function Settings Screen
There may be occasions when external pollution enters a protected area and it is undesirableto generate a fire alarm, such as smoke from an external furnace entering the open doors ofa factory. A reference detector can be used to “back-off” such a spurious external smokereading to prevent detectors inside the protected area from generating unwanted alarmsignals. Any detector in a network may be set as a reference detector.
You can modify the following Referencing function settings as described in Table 5-11:
Table 5-10. Day/Night Switching Function Settings
Setting Function
Day startMakes the detector less sensitive during active periods (Day) when smokedensity is higher.
Night startMakes the detector more sensitive during inactive periods (Night) whensmoke density is lower.
Disable day/night switching
Where there is no distinction between “active” and “inactive” periods (suchas a factory operating on a 24-hour basis or in a climate-controlledmicroelectronics clean room), select (enable) the Disable day/nightswitching box to stop the switch-over function.
Day/night switching may be carried out manually by assigning one ofthe remote terminals in the detector or on an input/relay card. (SeeSection 1-9.1 for details.)
P/N 33-308100-006 5-19 June 2009
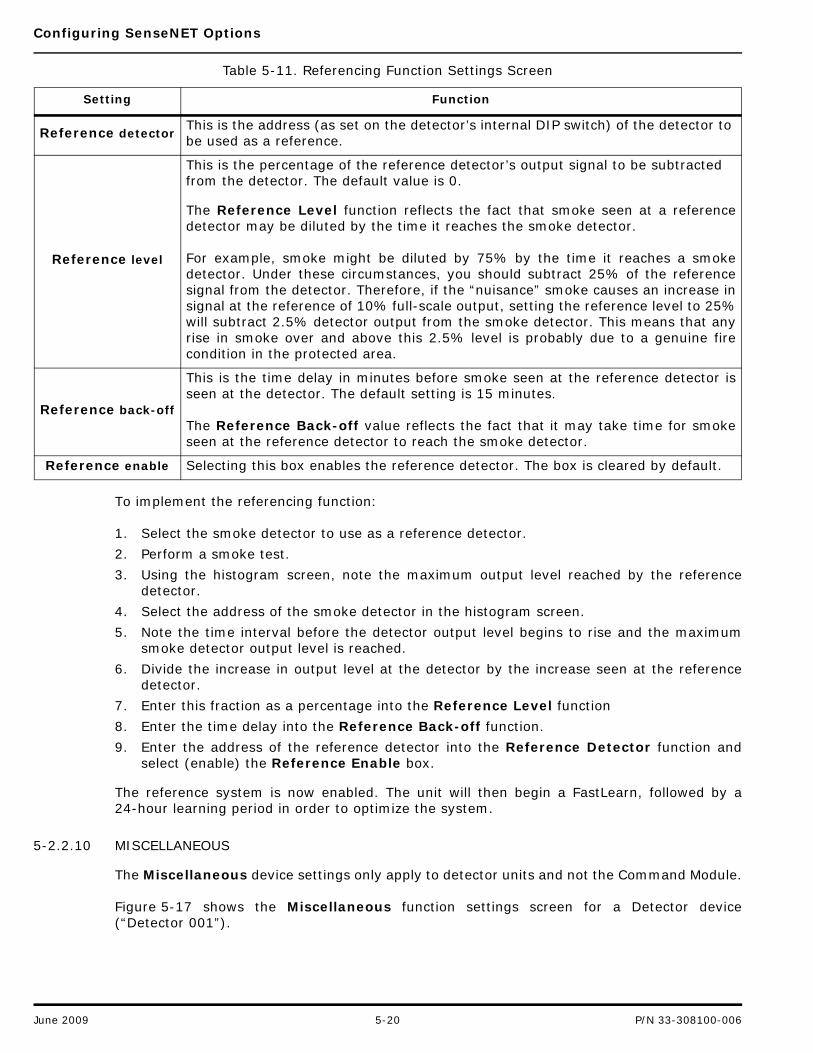
Configuring SenseNET Options
To implement the referencing function:
1. Select the smoke detector to use as a reference detector.
2. Perform a smoke test.
3. Using the histogram screen, note the maximum output level reached by the referencedetector.
4. Select the address of the smoke detector in the histogram screen.
5. Note the time interval before the detector output level begins to rise and the maximumsmoke detector output level is reached.
6. Divide the increase in output level at the detector by the increase seen at the referencedetector.
7. Enter this fraction as a percentage into the Reference Level function
8. Enter the time delay into the Reference Back-off function.
9. Enter the address of the reference detector into the Reference Detector function andselect (enable) the Reference Enable box.
The reference system is now enabled. The unit will then begin a FastLearn, followed by a24-hour learning period in order to optimize the system.
5-2.2.10 MISCELLANEOUS
The Miscellaneous device settings only apply to detector units and not the Command Module.
Figure 5-17 shows the Miscellaneous function settings screen for a Detector device(“Detector 001”).
Table 5-11. Referencing Function Settings Screen
Setting Function
Reference detectorThis is the address (as set on the detector’s internal DIP switch) of the detector to be used as a reference.
Reference level
This is the percentage of the reference detector’s output signal to be subtracted from the detector. The default value is 0.
The Reference Level function reflects the fact that smoke seen at a referencedetector may be diluted by the time it reaches the smoke detector.
For example, smoke might be diluted by 75% by the time it reaches a smokedetector. Under these circumstances, you should subtract 25% of the referencesignal from the detector. Therefore, if the “nuisance” smoke causes an increase insignal at the reference of 10% full-scale output, setting the reference level to 25%will subtract 2.5% detector output from the smoke detector. This means that anyrise in smoke over and above this 2.5% level is probably due to a genuine firecondition in the protected area.
Reference back-off
This is the time delay in minutes before smoke seen at the reference detector isseen at the detector. The default setting is 15 minutes.
The Reference Back-off value reflects the fact that it may take time for smokeseen at the reference detector to reach the smoke detector.
Reference enable Selecting this box enables the reference detector. The box is cleared by default.
June 2009 5-20 P/N 33-308100-006
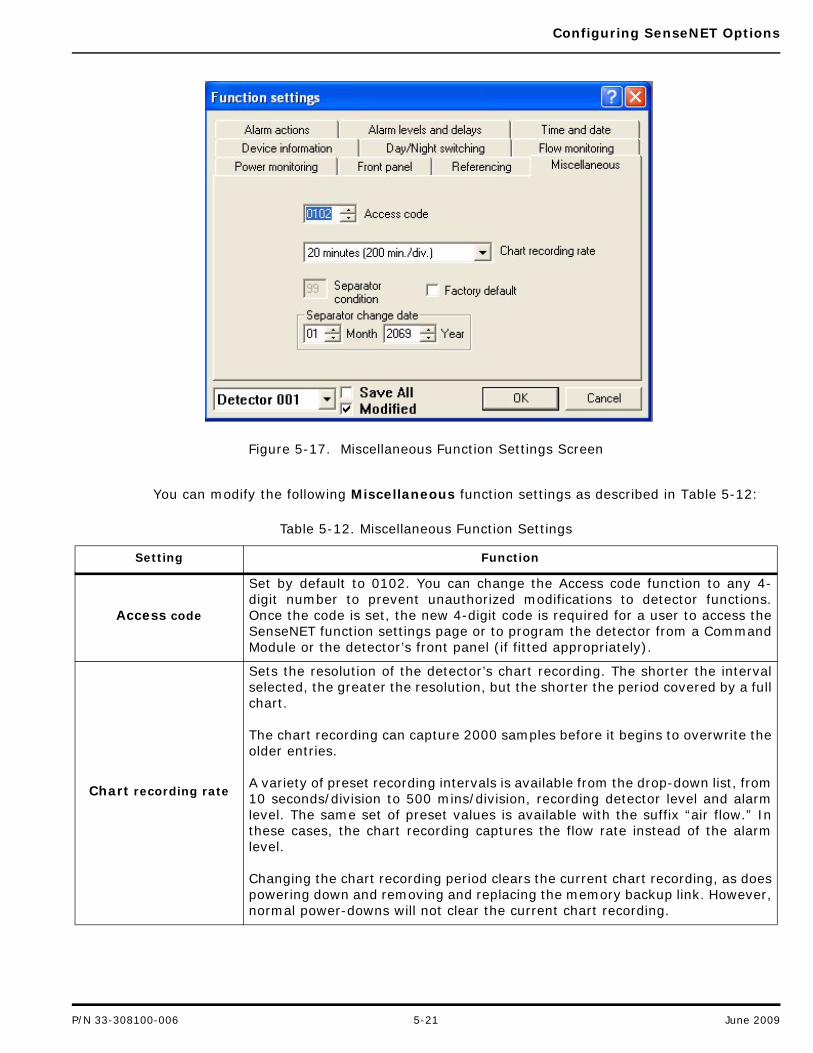
Configuring SenseNET Options
Figure 5-17. Miscellaneous Function Settings Screen
You can modify the following Miscellaneous function settings as described in Table 5-12:
Table 5-12. Miscellaneous Function Settings
Setting Function
Access code
Set by default to 0102. You can change the Access code function to any 4-digit number to prevent unauthorized modifications to detector functions.Once the code is set, the new 4-digit code is required for a user to access theSenseNET function settings page or to program the detector from a CommandModule or the detector’s front panel (if fitted appropriately).
Chart recording rate
Sets the resolution of the detector’s chart recording. The shorter the intervalselected, the greater the resolution, but the shorter the period covered by a fullchart.
The chart recording can capture 2000 samples before it begins to overwrite theolder entries.
A variety of preset recording intervals is available from the drop-down list, from10 seconds/division to 500 mins/division, recording detector level and alarmlevel. The same set of preset values is available with the suffix “air flow.” Inthese cases, the chart recording captures the flow rate instead of the alarmlevel.
Changing the chart recording period clears the current chart recording, as doespowering down and removing and replacing the memory backup link. However,normal power-downs will not clear the current chart recording.
P/N 33-308100-006 5-21 June 2009
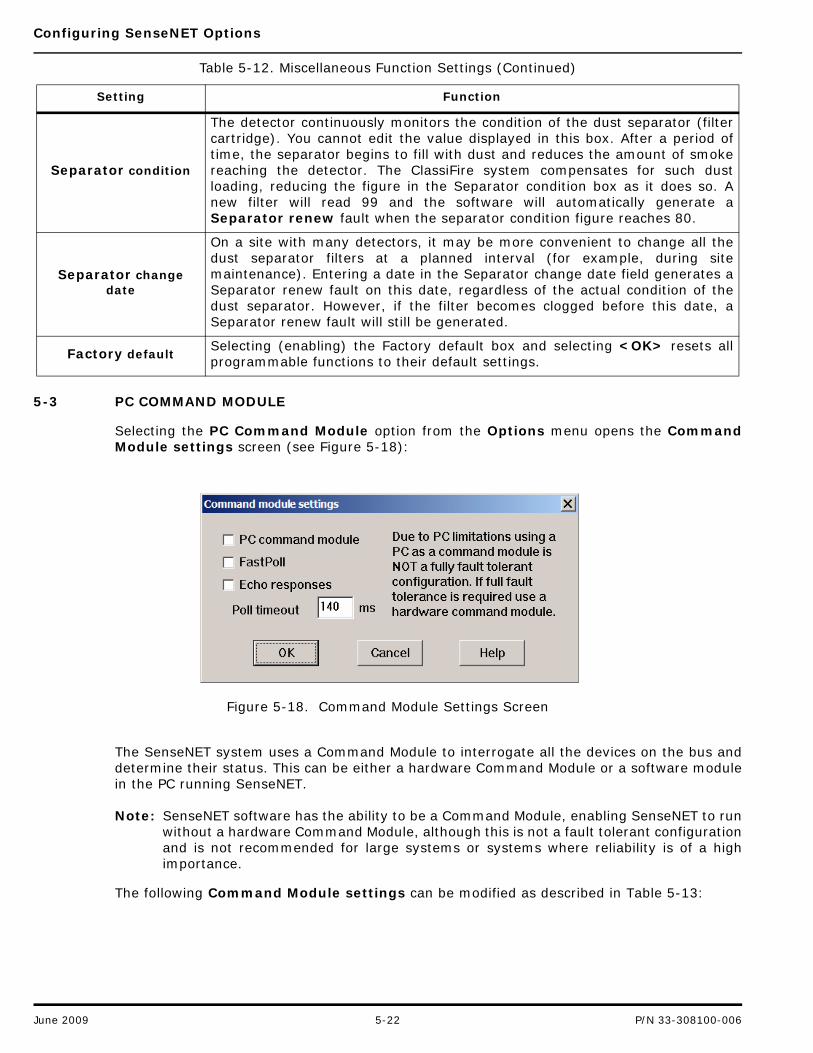
Configuring SenseNET Options
5-3 PC COMMAND MODULE
Selecting the PC Command Module option from the Options menu opens the CommandModule settings screen (see Figure 5-18):
Figure 5-18. Command Module Settings Screen
The SenseNET system uses a Command Module to interrogate all the devices on the bus anddetermine their status. This can be either a hardware Command Module or a software modulein the PC running SenseNET.
Note: SenseNET software has the ability to be a Command Module, enabling SenseNET to runwithout a hardware Command Module, although this is not a fault tolerant configurationand is not recommended for large systems or systems where reliability is of a highimportance.
The following Command Module settings can be modified as described in Table 5-13:
Separator condition
The detector continuously monitors the condition of the dust separator (filtercartridge). You cannot edit the value displayed in this box. After a period oftime, the separator begins to fill with dust and reduces the amount of smokereaching the detector. The ClassiFire system compensates for such dustloading, reducing the figure in the Separator condition box as it does so. Anew filter will read 99 and the software will automatically generate aSeparator renew fault when the separator condition figure reaches 80.
Separator change date
On a site with many detectors, it may be more convenient to change all thedust separator filters at a planned interval (for example, during sitemaintenance). Entering a date in the Separator change date field generates aSeparator renew fault on this date, regardless of the actual condition of thedust separator. However, if the filter becomes clogged before this date, aSeparator renew fault will still be generated.
Factory defaultSelecting (enabling) the Factory default box and selecting <OK> resets allprogrammable functions to their default settings.
Table 5-12. Miscellaneous Function Settings (Continued)
Setting Function
June 2009 5-22 P/N 33-308100-006

Configuring SenseNET Options
5-4 SITE CONFIGURATION
Selecting the Site Configuration option from the Options menu has the same effect asselecting the Site Configuration icon:
After supplying a password, the Site Configuration Editor opens:
Table 5-13. Command Module Settings Functions
Setting Function
PC command moduleSelecting this box means that the PC is the master device on the bus. This must only bechecked if there is no hardware Command Module, otherwise intermittentcommunication errors may occur.
FastPoll
This item has no effect unless the PC is the Command Module. FastPoll may need to beunchecked if running on older, slower PC systems. If the SenseNET software is displayingintermittent communications failures or is not updating the screen properly, thenuncheck FastPoll.
Echo responses
When using Micro Serial Server (MSS) units to transmit RS485 data over CAT5 wiring,this box will need to be selected if a remote MSS unit (one not connected to the PC)needs to receive data from another remote MSS, e.g., if an RDU on remote MSS 1 needsto receive data from a detector on remote MSS 2.
Poll timeoutThe time, in milliseconds, which a device has to respond to a poll from the CommandModule. If no response is received for this time then a “Comms Failure” message isshown for this device on the Alarm/Fault viewer.
Help Displays context-sensitive help for the Command Module.
P/N 33-308100-006 5-23 June 2009
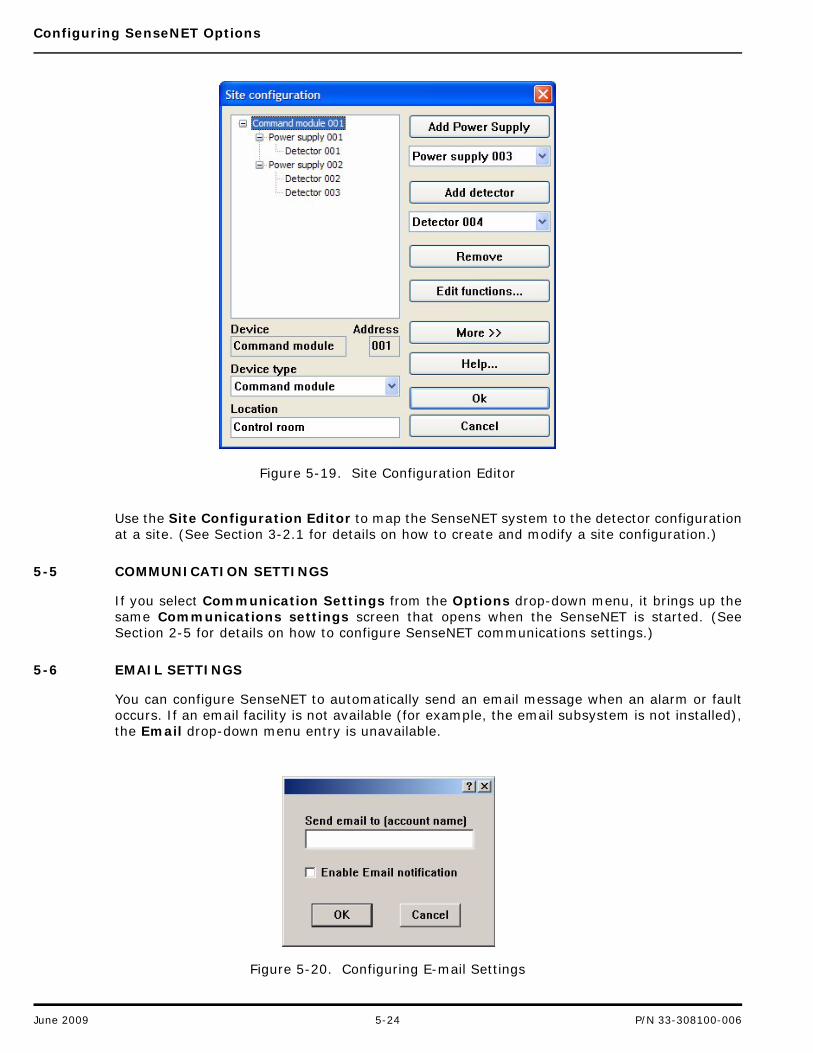
Configuring SenseNET Options
Figure 5-19. Site Configuration Editor
Use the Site Configuration Editor to map the SenseNET system to the detector configurationat a site. (See Section 3-2.1 for details on how to create and modify a site configuration.)
5-5 COMMUNICATION SETTINGS
If you select Communication Settings from the Options drop-down menu, it brings up thesame Communications settings screen that opens when the SenseNET is started. (SeeSection 2-5 for details on how to configure SenseNET communications settings.)
5-6 EMAIL SETTINGS
You can configure SenseNET to automatically send an email message when an alarm or faultoccurs. If an email facility is not available (for example, the email subsystem is not installed),the Email drop-down menu entry is unavailable.
Figure 5-20. Configuring E-mail Settings
June 2009 5-24 P/N 33-308100-006
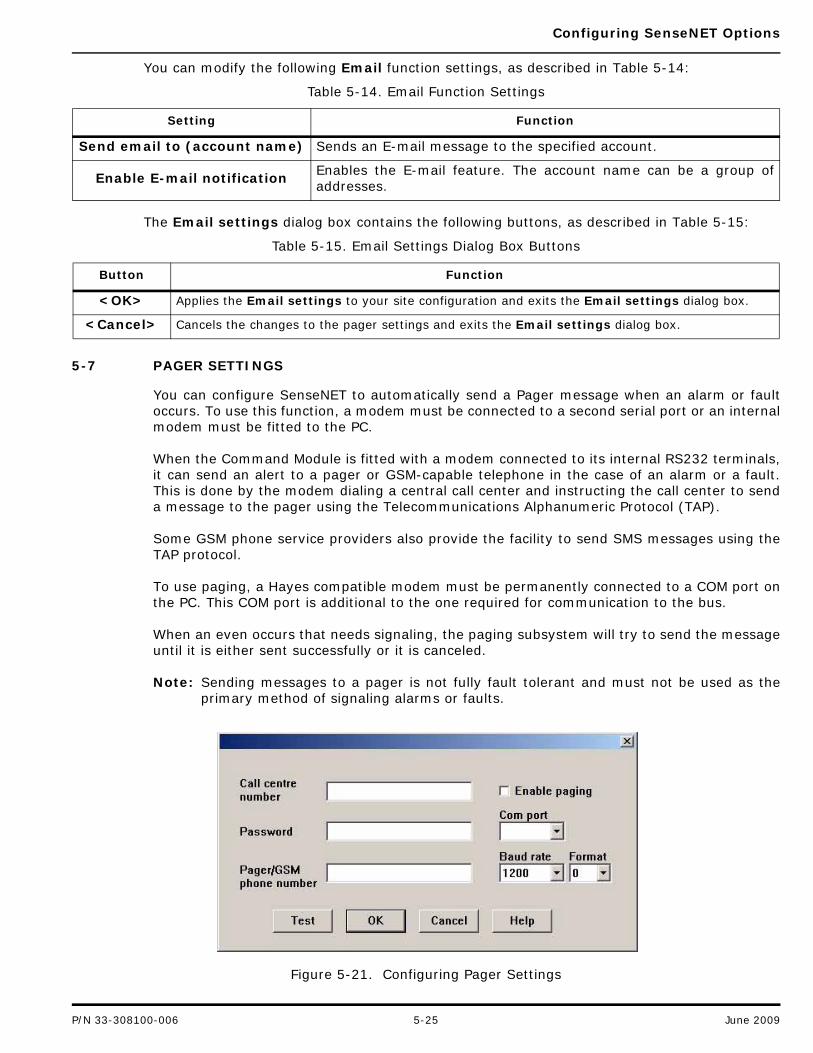
Configuring SenseNET Options
You can modify the following Email function settings, as described in Table 5-14:
The Email settings dialog box contains the following buttons, as described in Table 5-15:
5-7 PAGER SETTINGS
You can configure SenseNET to automatically send a Pager message when an alarm or faultoccurs. To use this function, a modem must be connected to a second serial port or an internalmodem must be fitted to the PC.
When the Command Module is fitted with a modem connected to its internal RS232 terminals,it can send an alert to a pager or GSM-capable telephone in the case of an alarm or a fault.This is done by the modem dialing a central call center and instructing the call center to senda message to the pager using the Telecommunications Alphanumeric Protocol (TAP).
Some GSM phone service providers also provide the facility to send SMS messages using theTAP protocol.
To use paging, a Hayes compatible modem must be permanently connected to a COM port onthe PC. This COM port is additional to the one required for communication to the bus.
When an even occurs that needs signaling, the paging subsystem will try to send the messageuntil it is either sent successfully or it is canceled.
Note: Sending messages to a pager is not fully fault tolerant and must not be used as theprimary method of signaling alarms or faults.
Figure 5-21. Configuring Pager Settings
Table 5-14. Email Function Settings
Setting Function
Send email to (account name) Sends an E-mail message to the specified account.
Enable E-mail notification Enables the E-mail feature. The account name can be a group ofaddresses.
Table 5-15. Email Settings Dialog Box Buttons
Button Function
<OK> Applies the Email settings to your site configuration and exits the Email settings dialog box.
<Cancel> Cancels the changes to the pager settings and exits the Email settings dialog box.
P/N 33-308100-006 5-25 June 2009
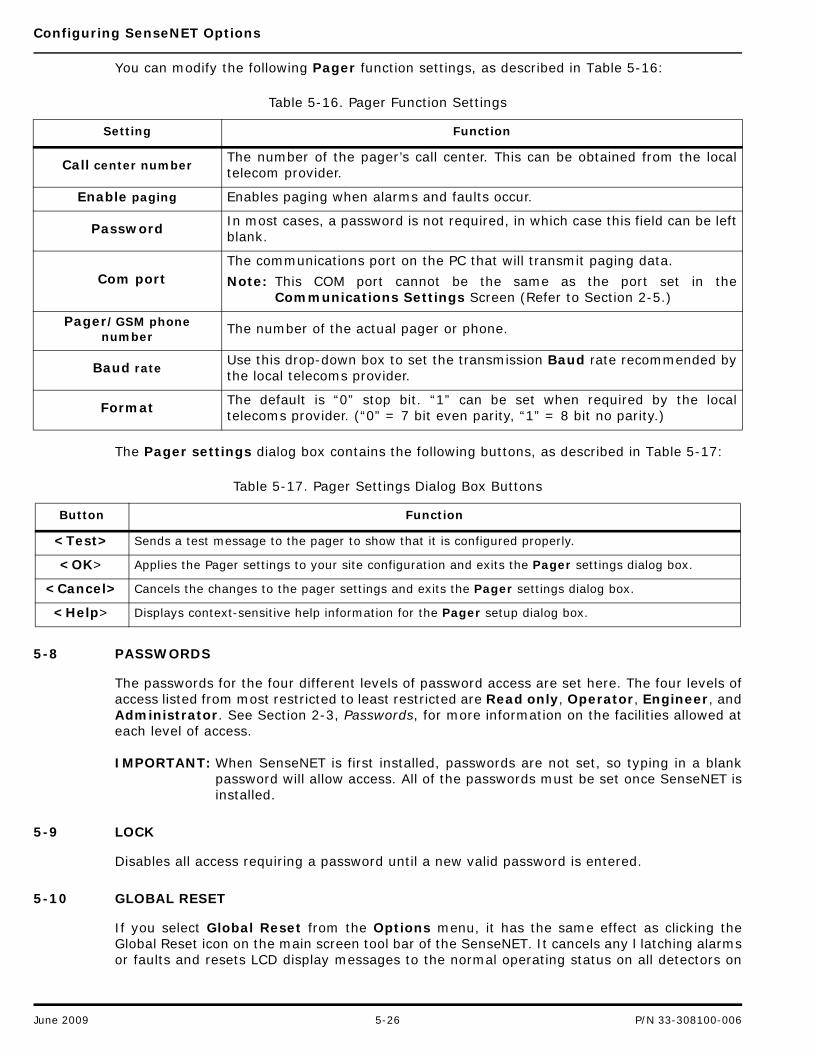
Configuring SenseNET Options
You can modify the following Pager function settings, as described in Table 5-16:
The Pager settings dialog box contains the following buttons, as described in Table 5-17:
5-8 PASSWORDS
The passwords for the four different levels of password access are set here. The four levels ofaccess listed from most restricted to least restricted are Read only, Operator, Engineer, andAdministrator. See Section 2-3, Passwords, for more information on the facilities allowed ateach level of access.
IMPORTANT: When SenseNET is first installed, passwords are not set, so typing in a blankpassword will allow access. All of the passwords must be set once SenseNET isinstalled.
5-9 LOCK
Disables all access requiring a password until a new valid password is entered.
5-10 GLOBAL RESET
If you select Global Reset from the Options menu, it has the same effect as clicking theGlobal Reset icon on the main screen tool bar of the SenseNET. It cancels any l latching alarmsor faults and resets LCD display messages to the normal operating status on all detectors on
Table 5-16. Pager Function Settings
Setting Function
Call center numberThe number of the pager’s call center. This can be obtained from the localtelecom provider.
Enable paging Enables paging when alarms and faults occur.
Password In most cases, a password is not required, in which case this field can be leftblank.
Com portThe communications port on the PC that will transmit paging data.
Note: This COM port cannot be the same as the port set in theCommunications Settings Screen (Refer to Section 2-5.)
Pager/GSM phone number
The number of the actual pager or phone.
Baud rateUse this drop-down box to set the transmission Baud rate recommended bythe local telecoms provider.
Format The default is “0” stop bit. “1” can be set when required by the localtelecoms provider. (“0” = 7 bit even parity, “1” = 8 bit no parity.)
Table 5-17. Pager Settings Dialog Box Buttons
Button Function
<Test> Sends a test message to the pager to show that it is configured properly.
<OK> Applies the Pager settings to your site configuration and exits the Pager settings dialog box.
<Cancel> Cancels the changes to the pager settings and exits the Pager settings dialog box.
<Help> Displays context-sensitive help information for the Pager setup dialog box.
June 2009 5-26 P/N 33-308100-006
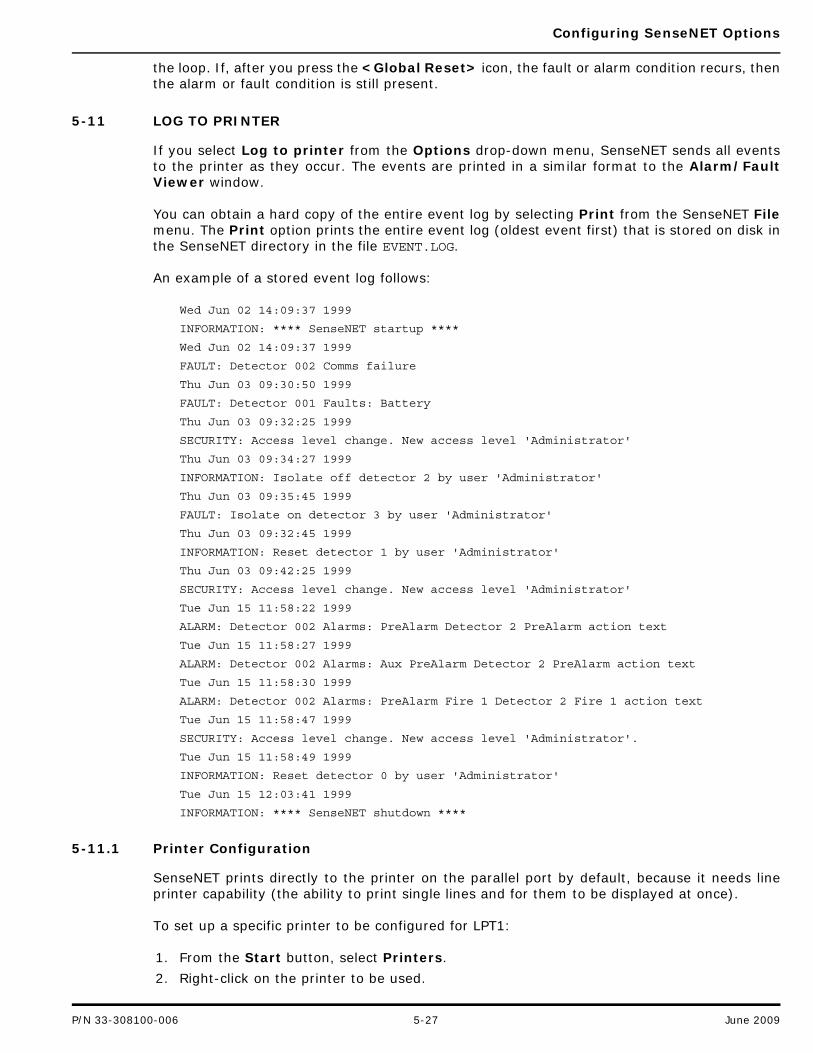
Configuring SenseNET Options
the loop. If, after you press the <Global Reset> icon, the fault or alarm condition recurs, thenthe alarm or fault condition is still present.
5-11 LOG TO PRINTER
If you select Log to printer from the Options drop-down menu, SenseNET sends all eventsto the printer as they occur. The events are printed in a similar format to the Alarm/FaultViewer window.
You can obtain a hard copy of the entire event log by selecting Print from the SenseNET Filemenu. The Print option prints the entire event log (oldest event first) that is stored on disk inthe SenseNET directory in the file EVENT.LOG.
An example of a stored event log follows:
Wed Jun 02 14:09:37 1999
INFORMATION: **** SenseNET startup ****
Wed Jun 02 14:09:37 1999
FAULT: Detector 002 Comms failure
Thu Jun 03 09:30:50 1999
FAULT: Detector 001 Faults: Battery
Thu Jun 03 09:32:25 1999
SECURITY: Access level change. New access level 'Administrator'
Thu Jun 03 09:34:27 1999
INFORMATION: Isolate off detector 2 by user 'Administrator'
Thu Jun 03 09:35:45 1999
FAULT: Isolate on detector 3 by user 'Administrator'
Thu Jun 03 09:32:45 1999
INFORMATION: Reset detector 1 by user 'Administrator'
Thu Jun 03 09:42:25 1999
SECURITY: Access level change. New access level 'Administrator'
Tue Jun 15 11:58:22 1999
ALARM: Detector 002 Alarms: PreAlarm Detector 2 PreAlarm action text
Tue Jun 15 11:58:27 1999
ALARM: Detector 002 Alarms: Aux PreAlarm Detector 2 PreAlarm action text
Tue Jun 15 11:58:30 1999
ALARM: Detector 002 Alarms: PreAlarm Fire 1 Detector 2 Fire 1 action text
Tue Jun 15 11:58:47 1999
SECURITY: Access level change. New access level 'Administrator'.
Tue Jun 15 11:58:49 1999
INFORMATION: Reset detector 0 by user 'Administrator'
Tue Jun 15 12:03:41 1999
INFORMATION: **** SenseNET shutdown ****
5-11.1 Printer Configuration
SenseNET prints directly to the printer on the parallel port by default, because it needs lineprinter capability (the ability to print single lines and for them to be displayed at once).
To set up a specific printer to be configured for LPT1:
1. From the Start button, select Printers.
2. Right-click on the printer to be used.
P/N 33-308100-006 5-27 June 2009
Configuring SenseNET Options
3. Select Properties.
4. When the Properties dialog box is displayed, select the Details tab
5. Select Capture Printer Port.
6. Select LPT1.
Note: The printer set to LPT1 can be a printer on the network and does not need to beconnected directly to the PC running the SenseNET application.
5-12 MAP VIEW
The Map View option toggles between the detector display (shown in Figure 5-22) and thesite map view (shown in Figure 5-23).
The Map View option works the same as the <Map View> on the SenseNET main screen:
The Detector Display shows that status of a user-defined set of detectors in a siteconfiguration. (See Section 3-2.7 for details on how to create device and zone maps.)
The Site Map view shows the map for the loop that the currently-selected detector isconnected to. (See Section 3-2.7.1 for details on how to create a device map.)
June 2009 5-28 P/N 33-308100-006
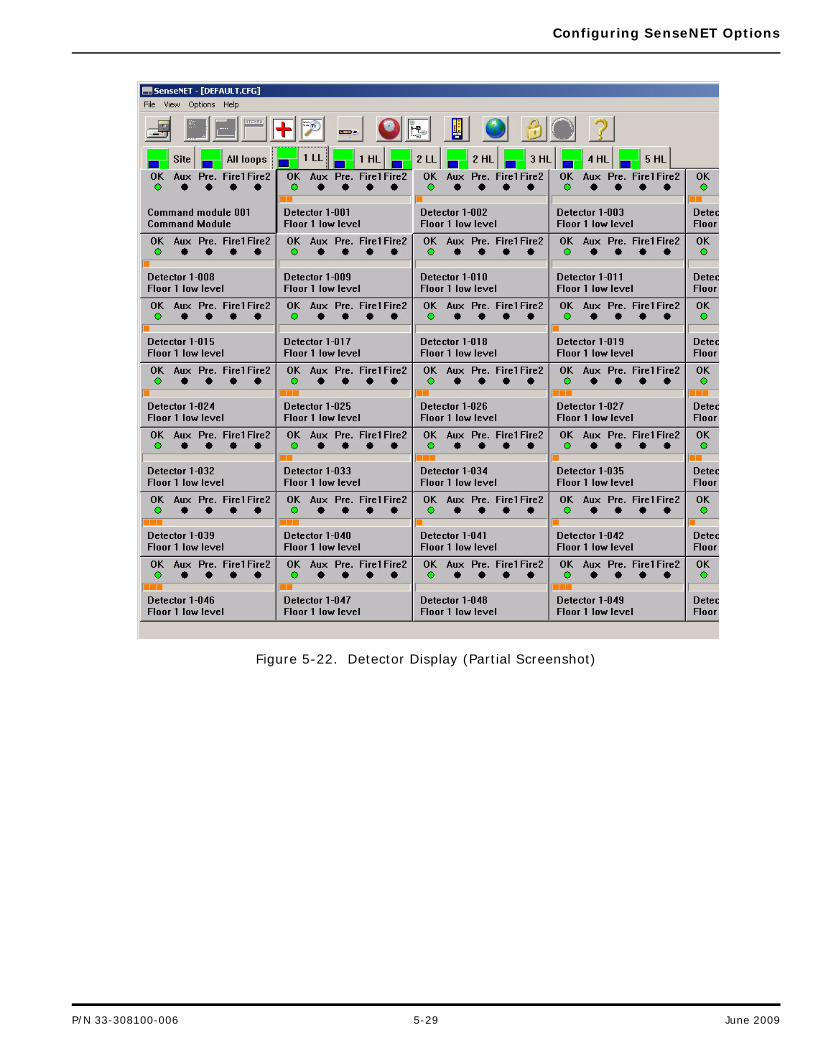
Configuring SenseNET Options
Figure 5-22. Detector Display (Partial Screenshot)
P/N 33-308100-006 5-29 June 2009

Configuring SenseNET Options
Figure 5-23. Site Map (Partial Screenshot)
5-13 LANGUAGE
You can change the language used in the SenseNET menus and titles by selecting theLanguage command in the Options menu when a translation in that language has beenprepared.
June 2009 5-30 P/N 33-308100-006
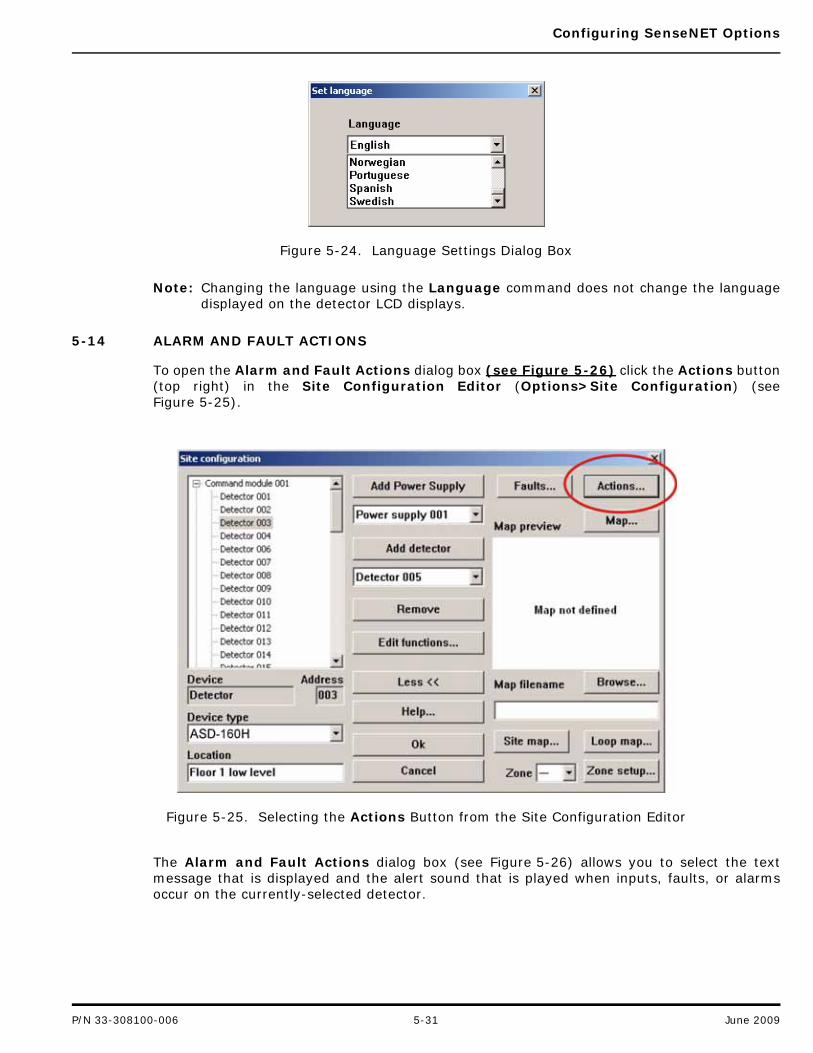
Configuring SenseNET Options
Figure 5-24. Language Settings Dialog Box
Note: Changing the language using the Language command does not change the languagedisplayed on the detector LCD displays.
5-14 ALARM AND FAULT ACTIONS
To open the Alarm and Fault Actions dialog box (see Figure 5-26) click the Actions button(top right) in the Site Configuration Editor (Options>Site Configuration) (seeFigure 5-25).
Figure 5-25. Selecting the Actions Button from the Site Configuration Editor
The Alarm and Fault Actions dialog box (see Figure 5-26) allows you to select the textmessage that is displayed and the alert sound that is played when inputs, faults, or alarmsoccur on the currently-selected detector.
P/N 33-308100-006 5-31 June 2009
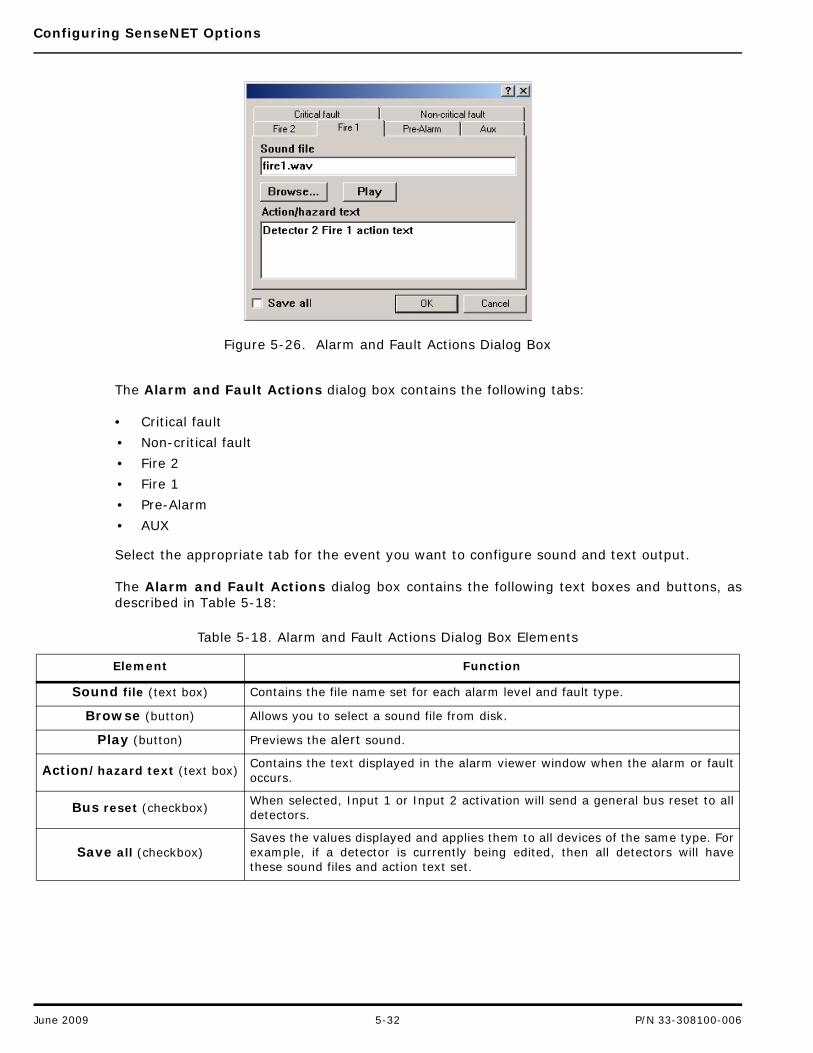
Configuring SenseNET Options
Figure 5-26. Alarm and Fault Actions Dialog Box
The Alarm and Fault Actions dialog box contains the following tabs:
• Critical fault
• Non-critical fault
• Fire 2
• Fire 1
• Pre-Alarm
• AUX
Select the appropriate tab for the event you want to configure sound and text output.
The Alarm and Fault Actions dialog box contains the following text boxes and buttons, asdescribed in Table 5-18:
Table 5-18. Alarm and Fault Actions Dialog Box Elements
Element Function
Sound file (text box) Contains the file name set for each alarm level and fault type.
Browse (button) Allows you to select a sound file from disk.
Play (button) Previews the alert sound.
Action/hazard text (text box)Contains the text displayed in the alarm viewer window when the alarm or faultoccurs.
Bus reset (checkbox)When selected, Input 1 or Input 2 activation will send a general bus reset to alldetectors.
Save all (checkbox)Saves the values displayed and applies them to all devices of the same type. Forexample, if a detector is currently being edited, then all detectors will havethese sound files and action text set.
June 2009 5-32 P/N 33-308100-006
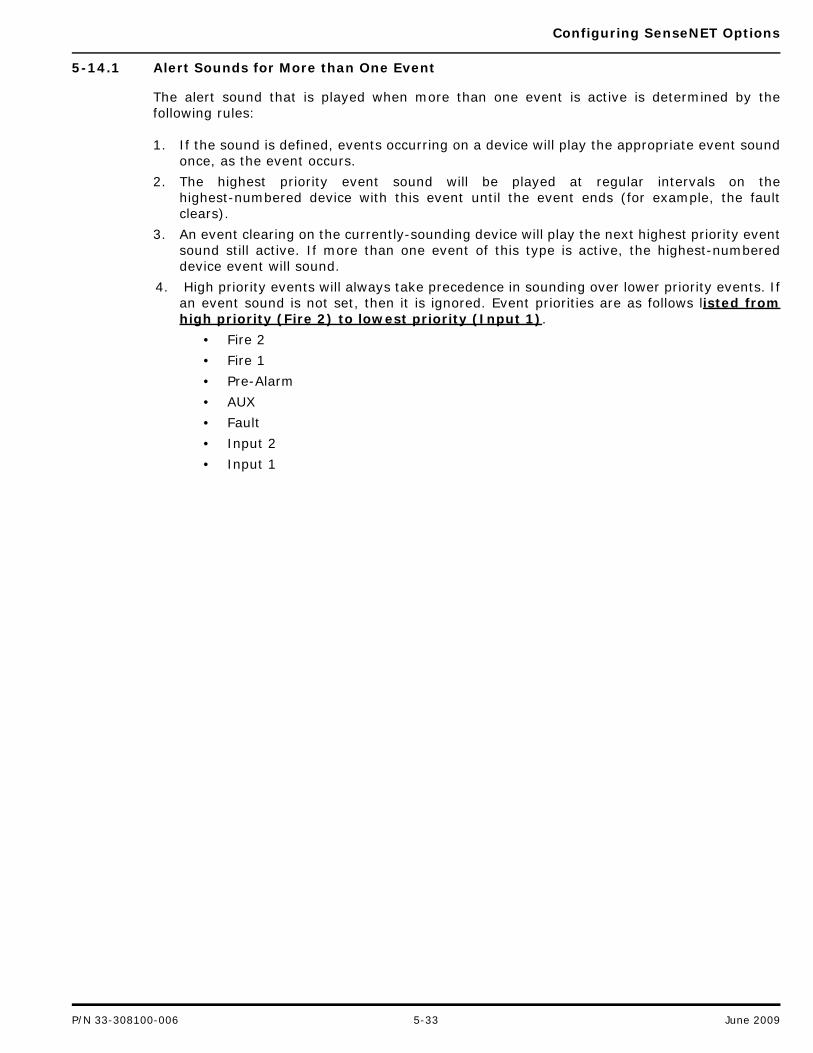
Configuring SenseNET Options
5-14.1 Alert Sounds for More than One Event
The alert sound that is played when more than one event is active is determined by thefollowing rules:
1. If the sound is defined, events occurring on a device will play the appropriate event soundonce, as the event occurs.
2. The highest priority event sound will be played at regular intervals on thehighest-numbered device with this event until the event ends (for example, the faultclears).
3. An event clearing on the currently-sounding device will play the next highest priority eventsound still active. If more than one event of this type is active, the highest-numbereddevice event will sound.
4. High priority events will always take precedence in sounding over lower priority events. Ifan event sound is not set, then it is ignored. Event priorities are as follows listed fromhigh priority (Fire 2) to lowest priority (Input 1).
• Fire 2
• Fire 1
• Pre-Alarm
• AUX
• Fault
• Input 2
• Input 1
P/N 33-308100-006 5-33 June 2009

Configuring SenseNET Options
THIS PAGE INTENTIONALLY LEFT BLANK.
June 2009 5-34 P/N 33-308100-006
SenseNET Initialization File
APPENDIX ASENSENET INITIALIZATION FILE
A-1 SENSENET.INI
The following text describes the initialization file for SenseNET named SENSENET.INI. This fileis stored in your Windows directory (usually C:\WINDOWS) and contains all of the informationstored by the SenseNET software between sessions. The following text describes each of theentries in this file, along with its purpose.
This information provided is for reference only, entries in SENSENET.INI should not be editeddirectly, as this may cause incorrect operation of SenseNET.
Any entries in SENSENET.INI not shown here are unsupported and may change or be removedin future versions.
All entries are shown here with their default settings.
[Comm]
Port=1: Communications port to use. In this case COM1.
RxBuff=2000: Size of receive buffer in bytes.
TxBuff=5000: Size of transmit buffer in bytes.
CTSflow=1: Setting this entry to zero disables CTS flow control. CTS flow control must beused with a hardware command module.
[Log]
DiskLogging=1: This entry is set to 0 if disk logging has been disabled or 1 if logging hasbeen enabled.
File=EVENT.LOG: Specifies the file name of the event log file.
PrinterLogging=0: This entry is set to 0 if event logging to the system printer has beendisabled or 1 if logging has been enabled.
[Product]
Language=0: This is where the selected language is stored.
[Security]
Timeout=30000: The security inactivity timeout in milliseconds.
[Site]
Site=DEFAULT.CFG: The filename of the site configuration file currently being used. Thedetector settings are stored in the .dfs file, the power supply settings in the .pfs file and thecommand module settings in the .cfs file of the same name as the site configuration file.
P/N 33-308100-006 A-1 June 2009
SenseNET Initialization File
[BusMaster]
BusMaster=0: Setting this entry to 1 sets SenseNET into command module emulation mode.No command module is needed.
Note: This setting is NOT fault tolerant as if the PC stops transmitting to the devices on theloop for any reason (for instance due to power outage), this will stop all bus communication.For fault tolerance, a standalone Command Module must be used.
FastPoll=0: When this setting is set to 1, the next device poll is immediately sent on receptionof the response from the preceding poll. This results in the fastest possible scanning, but maycause communications timeouts on slower PC's.
Timeout=140: The time, in milliseconds, that the PC will wait for a response to a Fast Poll.
P/N 33-308100-006 A-2 June 2009
Device Address Table
APPENDIX BDEVICE ADDRESS TABLE
B-1 DEVICE ADDRESS TABLE
In order to identify itself to the Command Module or fire panel, each detector needs to have aunique address ranging from 1 to 127. The detector address is simply set on the DIP switchSW1 at the bottom left of the opened detector on the main circuit board. The switch settingsare UP position for “1” and DOWN position for “0”. The detector address is set as a 7-bit binarycode (switch 8 equates to a value of 128 and so is outside the usable address range).
Figure B-1 shows some sample DIP switch settings.
The address equates to 01100011 in binary, or:
(1 x 1) + (1 x 2) + (0 x 4) + (0 x 8) + (0 x 16) + (1 x 32) + (1 x 64) + (0 x 128) = 99
Figure B-1. Sample DIP Switch Settings
Table B-1 contains a list of valid SenseNETTM device addresses. Addresses chosen for detectorsdo not have to be consecutive or in any special order as long as they are different.
1
ON
2 3 4 5 6 7 8
P/N 33-308100-006 B-1 June 2009

Device Address Table
Table B-1. Device Address Table
Address 1 2 3 4 5 6 7 8
1 1 0 0 0 0 0 0 0
2 0 1 0 0 0 0 0 0
3 1 1 0 0 0 0 0 0
4 0 0 1 0 0 0 0 0
5 1 0 1 0 0 0 0 0
6 0 1 1 0 0 0 0 0
7 1 1 1 0 0 0 0 0
8 0 0 0 1 0 0 0 0
9 1 0 0 1 0 0 0 0
10 0 1 0 1 0 0 0 0
11 1 1 0 1 0 0 0 0
12 0 0 1 1 0 0 0 0
13 1 0 1 1 0 0 0 0
14 0 1 1 1 0 0 0 0
15 1 1 1 1 0 0 0 0
16 0 0 0 0 1 0 0 0
17 1 0 0 0 1 0 0 0
18 0 1 0 0 1 0 0 0
19 1 1 0 0 1 0 0 0
20 0 0 1 0 1 0 0 0
21 1 0 1 0 1 0 0 0
22 0 1 1 0 1 0 0 0
23 1 1 1 0 1 0 0 0
24 0 0 0 1 1 0 0 0
25 1 0 0 1 1 0 0 0
26 0 1 0 1 1 0 0 0
27 1 1 0 1 1 0 0 0
28 0 0 1 1 1 0 0 0
29 1 0 1 1 1 0 0 0
30 0 1 1 1 1 0 0 0
31 1 1 1 1 1 0 0 0
32 0 0 0 0 0 1 0 0
33 1 0 0 0 0 1 0 0
34 0 1 0 0 0 1 0 0
35 1 1 0 0 0 1 0 0
36 0 0 1 0 0 1 0 0
37 1 0 1 0 0 1 0 0
38 0 1 1 0 0 1 0 0
39 1 1 1 0 0 1 0 0
40 0 0 0 1 0 1 0 0
41 1 0 0 1 0 1 0 0
42 0 1 0 1 0 1 0 0
43 1 1 0 1 0 1 0 0
44 0 0 1 1 0 1 0 0
P/N 33-308100-006 B-2 June 2009

Device Address Table
45 1 0 1 1 0 1 0 0
46 0 1 1 1 0 1 0 0
47 1 1 1 1 0 1 0 0
48 0 0 0 0 1 1 0 0
49 1 0 0 0 1 1 0 0
50 0 1 0 0 1 1 0 0
51 1 1 0 0 1 1 0 0
52 0 0 1 0 1 1 0 0
53 1 0 1 0 1 1 0 0
54 0 1 1 0 1 1 0 0
55 1 1 1 0 1 1 0 0
56 0 0 0 1 1 1 0 0
57 1 0 0 1 1 1 0 0
58 0 1 0 1 1 1 0 0
59 1 1 0 1 1 1 0 0
60 0 0 1 1 1 1 0 0
61 1 0 1 1 1 1 0 0
62 0 1 1 1 1 1 0 0
63 1 1 1 1 1 1 0 0
64 0 0 0 0 0 0 1 0
65 1 0 0 0 0 0 1 0
66 0 1 0 0 0 0 1 0
67 1 1 0 0 0 0 1 0
68 0 0 1 0 0 0 1 0
69 1 0 1 0 0 0 1 0
70 0 1 1 0 0 0 1 0
71 1 1 1 0 0 0 1 0
72 0 0 0 1 0 0 1 0
73 1 0 0 1 0 0 1 0
74 0 1 0 1 0 0 1 0
75 1 1 0 1 0 0 1 0
76 0 0 1 1 0 0 1 0
77 1 0 1 1 0 0 1 0
78 0 1 1 1 0 0 1 0
79 1 1 1 1 0 0 1 0
80 0 0 0 0 1 0 1 0
81 1 0 0 0 1 0 1 0
82 0 1 0 0 1 0 1 0
83 1 1 0 0 1 0 1 0
84 0 0 1 0 1 0 1 0
85 1 0 1 0 1 0 1 0
86 0 1 1 0 1 0 1 0
87 1 1 1 0 1 0 1 0
88 0 0 0 1 1 0 1 0
89 1 0 0 1 1 0 1 0
Table B-1. Device Address Table
Address 1 2 3 4 5 6 7 8
P/N 33-308100-006 B-3 June 2009

Device Address Table
90 0 1 0 1 1 0 1 0
91 1 1 0 1 1 0 1 0
92 0 0 1 1 1 0 1 0
93 1 0 1 1 1 0 1 0
94 0 1 1 1 1 0 1 0
95 1 1 1 1 1 0 1 0
96 0 0 0 0 0 1 1 0
97 1 0 0 0 0 1 1 0
98 0 1 0 0 0 1 1 0
99 1 1 0 0 0 1 1 0
100 0 0 1 0 0 1 1 0
101 1 0 1 0 0 1 1 0
102 0 1 1 0 0 1 1 0
103 1 1 1 0 0 1 1 0
104 0 0 0 1 0 1 1 0
105 1 0 0 1 0 1 1 0
106 0 1 0 1 0 1 1 0
107 1 1 0 1 0 1 1 0
108 0 0 1 1 0 1 1 0
109 1 0 1 1 0 1 1 0
110 0 1 1 1 0 1 1 0
111 1 1 1 1 0 1 1 0
112 0 0 0 0 1 1 1 0
113 1 0 0 0 1 1 1 0
114 0 1 0 0 1 1 1 0
115 1 1 0 0 1 1 1 0
116 0 0 1 0 1 1 1 0
117 1 0 1 0 1 1 1 0
118 0 1 1 0 1 1 1 0
119 1 1 1 0 1 1 1 0
120 0 0 0 1 1 1 1 0
121 1 0 0 1 1 1 1 0
122 0 1 0 1 1 1 1 0
123 1 1 0 1 1 1 1 0
124 0 0 1 1 1 1 1 0
125 1 0 1 1 1 1 1 0
126 0 1 1 1 1 1 1 0
127 1 1 1 1 1 1 1 0
Table B-1. Device Address Table
Address 1 2 3 4 5 6 7 8
June 2009 B-4 P/N 33-308100-006
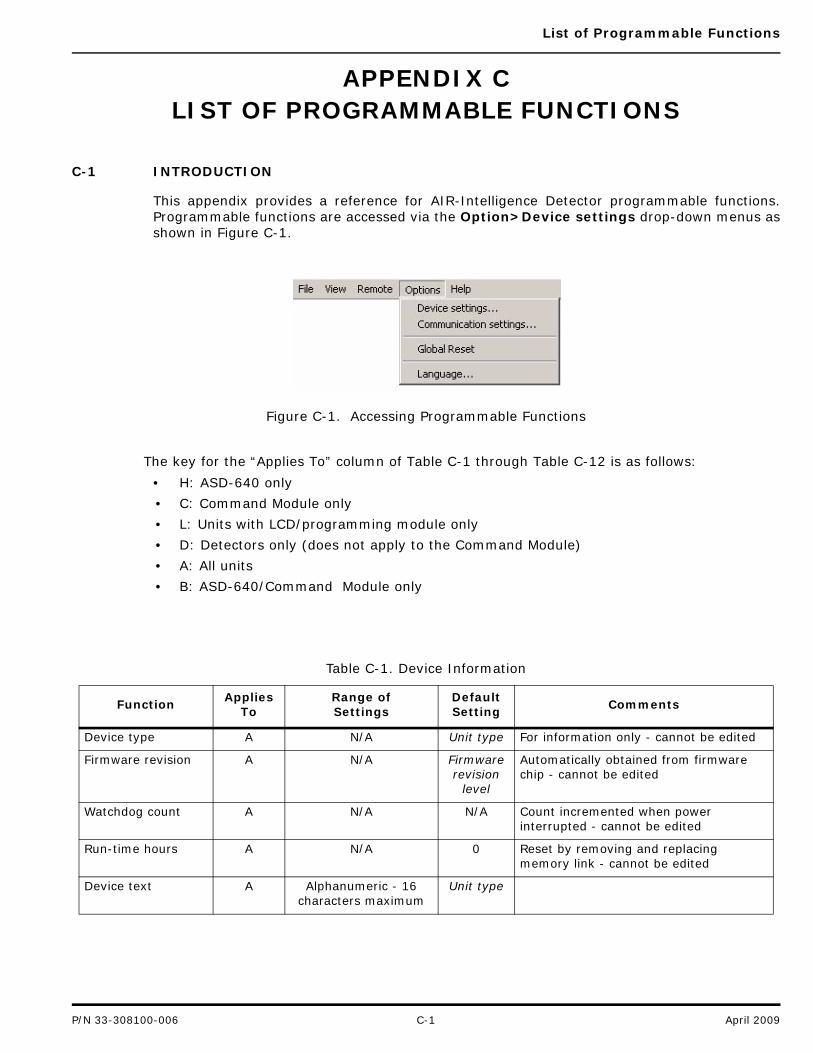
List of Programmable Functions
APPENDIX CLIST OF PROGRAMMABLE FUNCTIONS
C-1 INTRODUCTION
This appendix provides a reference for AIR-Intelligence Detector programmable functions.Programmable functions are accessed via the Option>Device settings drop-down menus asshown in Figure C-1.
Figure C-1. Accessing Programmable Functions
The key for the “Applies To” column of Table C-1 through Table C-12 is as follows:
• H: ASD-640 only
• C: Command Module only
• L: Units with LCD/programming module only
• D: Detectors only (does not apply to the Command Module)
• A: All units
• B: ASD-640/Command Module only
Table C-1. Device Information
FunctionApplies
ToRange of Settings
Default Setting
Comments
Device type A N/A Unit type For information only - cannot be edited
Firmware revision A N/A Firmware revision
level
Automatically obtained from firmware chip - cannot be edited
Watchdog count A N/A N/A Count incremented when power interrupted - cannot be edited
Run-time hours A N/A 0 Reset by removing and replacing memory link - cannot be edited
Device text A Alphanumeric - 16 characters maximum
Unit type
P/N 33-308100-006 C-1 April 2009
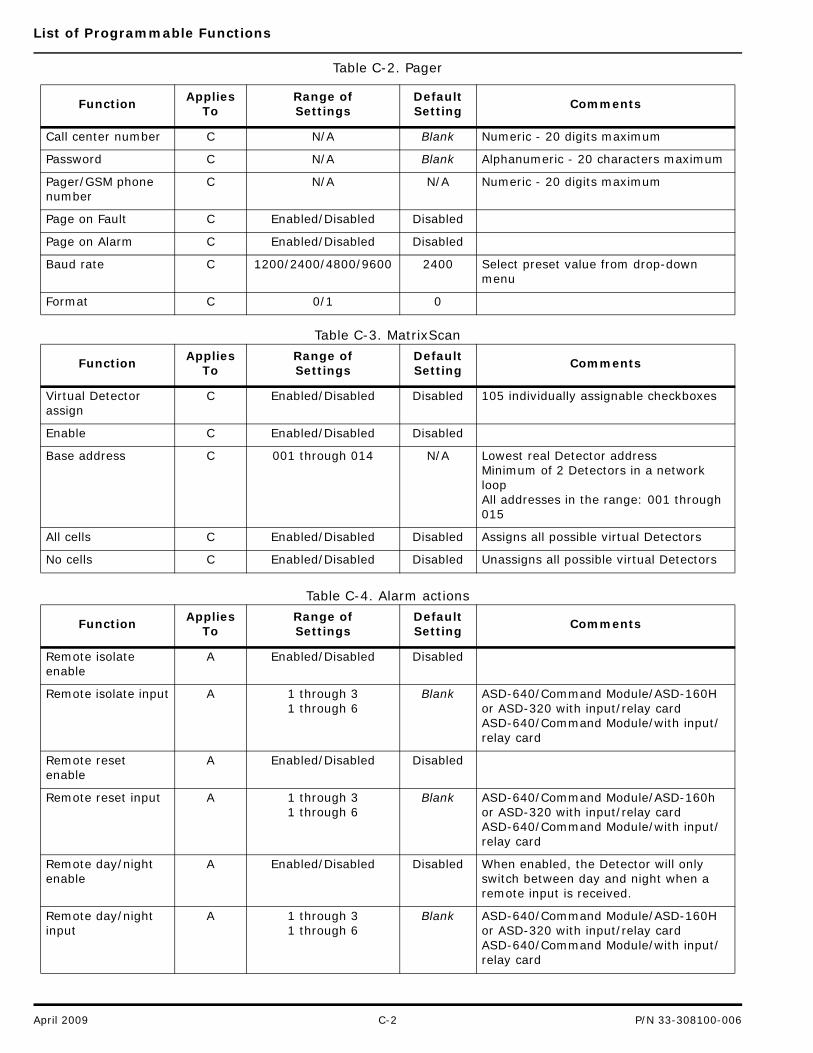
List of Programmable Functions
Table C-3. MatrixScan
Table C-4. Alarm actions
Table C-2. Pager
FunctionApplies
ToRange of Settings
Default Setting
Comments
Call center number C N/A Blank Numeric - 20 digits maximum
Password C N/A Blank Alphanumeric - 20 characters maximum
Pager/GSM phone number
C N/A N/A Numeric - 20 digits maximum
Page on Fault C Enabled/Disabled Disabled
Page on Alarm C Enabled/Disabled Disabled
Baud rate C 1200/2400/4800/9600 2400 Select preset value from drop-down menu
Format C 0/1 0
FunctionApplies
ToRange of Settings
Default Setting
Comments
Virtual Detector assign
C Enabled/Disabled Disabled 105 individually assignable checkboxes
Enable C Enabled/Disabled Disabled
Base address C 001 through 014 N/A Lowest real Detector addressMinimum of 2 Detectors in a network loopAll addresses in the range: 001 through 015
All cells C Enabled/Disabled Disabled Assigns all possible virtual Detectors
No cells C Enabled/Disabled Disabled Unassigns all possible virtual Detectors
FunctionApplies
ToRange of Settings
Default Setting
Comments
Remote isolate enable
A Enabled/Disabled Disabled
Remote isolate input A 1 through 31 through 6
Blank ASD-640/Command Module/ASD-160H or ASD-320 with input/relay cardASD-640/Command Module/with input/relay card
Remote reset enable
A Enabled/Disabled Disabled
Remote reset input A 1 through 31 through 6
Blank ASD-640/Command Module/ASD-160h or ASD-320 with input/relay cardASD-640/Command Module/with input/relay card
Remote day/night enable
A Enabled/Disabled Disabled When enabled, the Detector will only switch between day and night when a remote input is received.
Remote day/night input
A 1 through 31 through 6
Blank ASD-640/Command Module/ASD-160H or ASD-320 with input/relay cardASD-640/Command Module/with input/relay card
April 2009 C-2 P/N 33-308100-006
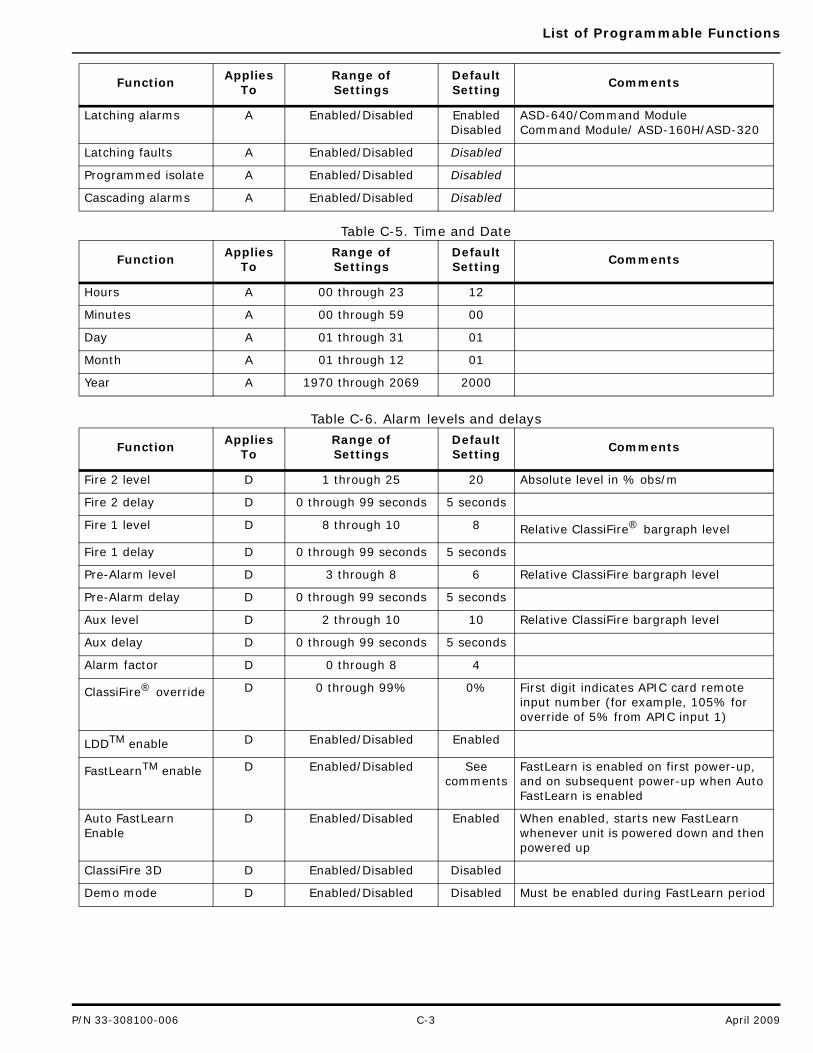
List of Programmable Functions
Table C-5. Time and Date
Table C-6. Alarm levels and delays
Latching alarms A Enabled/Disabled EnabledDisabled
ASD-640/Command ModuleCommand Module/ ASD-160H/ASD-320
Latching faults A Enabled/Disabled Disabled
Programmed isolate A Enabled/Disabled Disabled
Cascading alarms A Enabled/Disabled Disabled
FunctionApplies
ToRange of Settings
Default Setting
Comments
Hours A 00 through 23 12
Minutes A 00 through 59 00
Day A 01 through 31 01
Month A 01 through 12 01
Year A 1970 through 2069 2000
FunctionApplies
ToRange of Settings
Default Setting
Comments
Fire 2 level D 1 through 25 20 Absolute level in % obs/m
Fire 2 delay D 0 through 99 seconds 5 seconds
Fire 1 level D 8 through 10 8 Relative ClassiFire® bargraph level
Fire 1 delay D 0 through 99 seconds 5 seconds
Pre-Alarm level D 3 through 8 6 Relative ClassiFire bargraph level
Pre-Alarm delay D 0 through 99 seconds 5 seconds
Aux level D 2 through 10 10 Relative ClassiFire bargraph level
Aux delay D 0 through 99 seconds 5 seconds
Alarm factor D 0 through 8 4
ClassiFire® override D 0 through 99% 0% First digit indicates APIC card remote input number (for example, 105% for override of 5% from APIC input 1)
LDDTM enable D Enabled/Disabled Enabled
FastLearnTM enable D Enabled/Disabled See comments
FastLearn is enabled on first power-up, and on subsequent power-up when Auto FastLearn is enabled
Auto FastLearn Enable
D Enabled/Disabled Enabled When enabled, starts new FastLearn whenever unit is powered down and then powered up
ClassiFire 3D D Enabled/Disabled Disabled
Demo mode D Enabled/Disabled Disabled Must be enabled during FastLearn period
FunctionApplies
ToRange of Settings
Default Setting
Comments
P/N 33-308100-006 C-3 April 2009
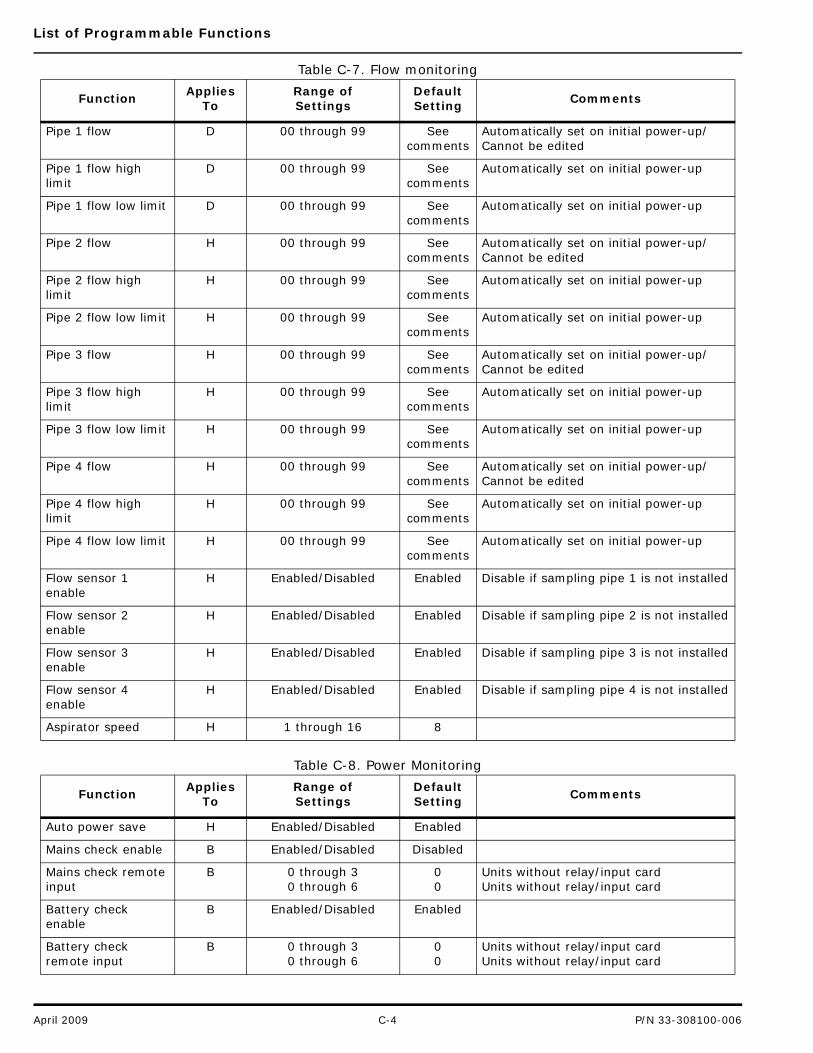
List of Programmable Functions
Table C-7. Flow monitoring
Table C-8. Power Monitoring
FunctionApplies
ToRange of Settings
Default Setting
Comments
Pipe 1 flow D 00 through 99 See comments
Automatically set on initial power-up/Cannot be edited
Pipe 1 flow high limit
D 00 through 99 See comments
Automatically set on initial power-up
Pipe 1 flow low limit D 00 through 99 See comments
Automatically set on initial power-up
Pipe 2 flow H 00 through 99 See comments
Automatically set on initial power-up/Cannot be edited
Pipe 2 flow high limit
H 00 through 99 See comments
Automatically set on initial power-up
Pipe 2 flow low limit H 00 through 99 See comments
Automatically set on initial power-up
Pipe 3 flow H 00 through 99 See comments
Automatically set on initial power-up/Cannot be edited
Pipe 3 flow high limit
H 00 through 99 See comments
Automatically set on initial power-up
Pipe 3 flow low limit H 00 through 99 See comments
Automatically set on initial power-up
Pipe 4 flow H 00 through 99 See comments
Automatically set on initial power-up/Cannot be edited
Pipe 4 flow high limit
H 00 through 99 See comments
Automatically set on initial power-up
Pipe 4 flow low limit H 00 through 99 See comments
Automatically set on initial power-up
Flow sensor 1 enable
H Enabled/Disabled Enabled Disable if sampling pipe 1 is not installed
Flow sensor 2 enable
H Enabled/Disabled Enabled Disable if sampling pipe 2 is not installed
Flow sensor 3 enable
H Enabled/Disabled Enabled Disable if sampling pipe 3 is not installed
Flow sensor 4 enable
H Enabled/Disabled Enabled Disable if sampling pipe 4 is not installed
Aspirator speed H 1 through 16 8
FunctionApplies
ToRange of Settings
Default Setting
Comments
Auto power save H Enabled/Disabled Enabled
Mains check enable B Enabled/Disabled Disabled
Mains check remote input
B 0 through 30 through 6
00
Units without relay/input cardUnits without relay/input card
Battery check enable
B Enabled/Disabled Enabled
Battery check remote input
B 0 through 30 through 6
00
Units without relay/input cardUnits without relay/input card
April 2009 C-4 P/N 33-308100-006
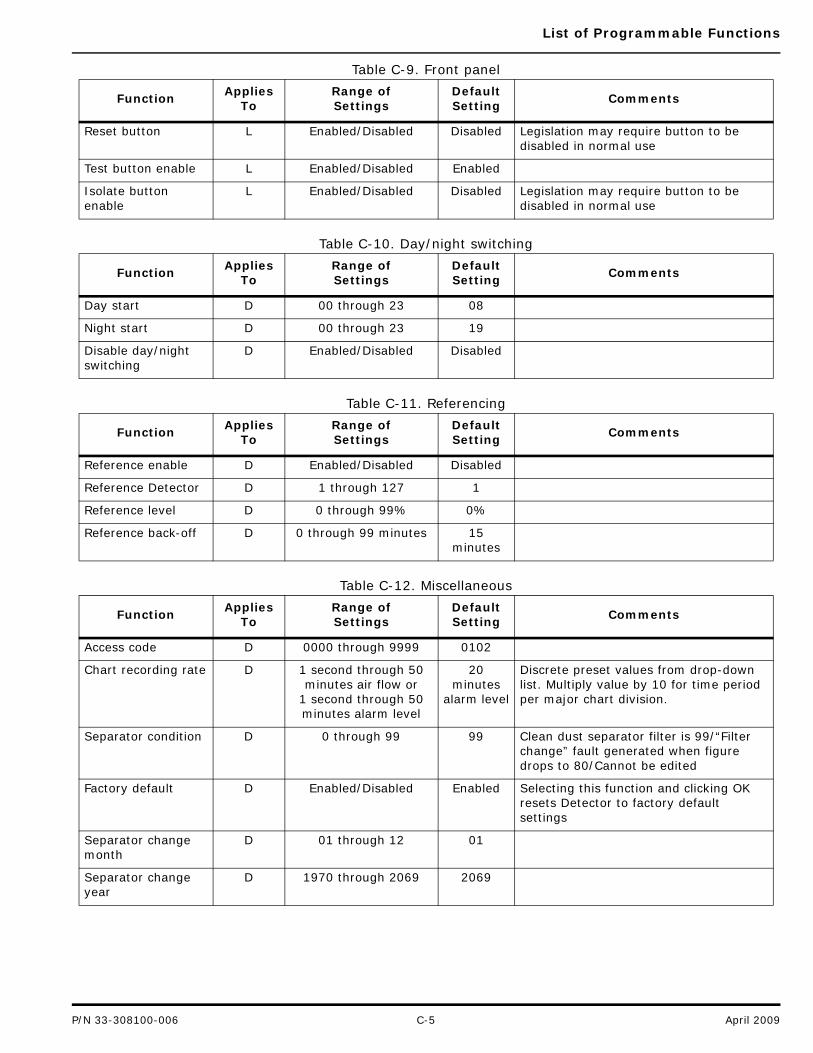
List of Programmable Functions
Table C-9. Front panel
Table C-10. Day/night switching
Table C-11. Referencing
Table C-12. Miscellaneous
FunctionApplies
ToRange of Settings
Default Setting
Comments
Reset button L Enabled/Disabled Disabled Legislation may require button to be disabled in normal use
Test button enable L Enabled/Disabled Enabled
Isolate button enable
L Enabled/Disabled Disabled Legislation may require button to be disabled in normal use
FunctionApplies
ToRange of Settings
Default Setting
Comments
Day start D 00 through 23 08
Night start D 00 through 23 19
Disable day/night switching
D Enabled/Disabled Disabled
FunctionApplies
ToRange of Settings
Default Setting
Comments
Reference enable D Enabled/Disabled Disabled
Reference Detector D 1 through 127 1
Reference level D 0 through 99% 0%
Reference back-off D 0 through 99 minutes 15 minutes
FunctionApplies
ToRange of Settings
Default Setting
Comments
Access code D 0000 through 9999 0102
Chart recording rate D 1 second through 50 minutes air flow or
1 second through 50 minutes alarm level
20 minutes
alarm level
Discrete preset values from drop-down list. Multiply value by 10 for time period per major chart division.
Separator condition D 0 through 99 99 Clean dust separator filter is 99/“Filter change” fault generated when figure drops to 80/Cannot be edited
Factory default D Enabled/Disabled Enabled Selecting this function and clicking OK resets Detector to factory default settings
Separator change month
D 01 through 12 01
Separator change year
D 1970 through 2069 2069
P/N 33-308100-006 C-5 April 2009

List of Programmable Functions
THIS PAGE INTENTIONALLY LEFT BLANK.
April 2009 C-6 P/N 33-308100-006

The ClassiFire System
APPENDIX DTHE CLASSIFIRE SYSTEM
D-1 ABOUT CLASSIFIRE
ClassiFire® is the patented artificial intelligence system for the AIR-Intelligence line ofAspirating Smoke Detectors that continually monitors the environment and internalcontamination and automatically adjusts sensitivity to the optimum level.
ClassiFire automatically adjusts sensitivity to suit day/night or operational/non-operationallevels with no need for external input.
ClassiFire automatically sets up the detector to the normal working environment so thedetector sensitivity is optimized for its surroundings.
AIR-Intelligence detectors are fully automatic and do not need manual adjustment.
D-1.1 The Detector Levels
The FIRE level always appears at level 8 on the display bargraph, as shown below inFigure D-1:
Figure D-1. ClassiFire Alarm Indicator
P/N 33-308100-006 D-1 June 2009
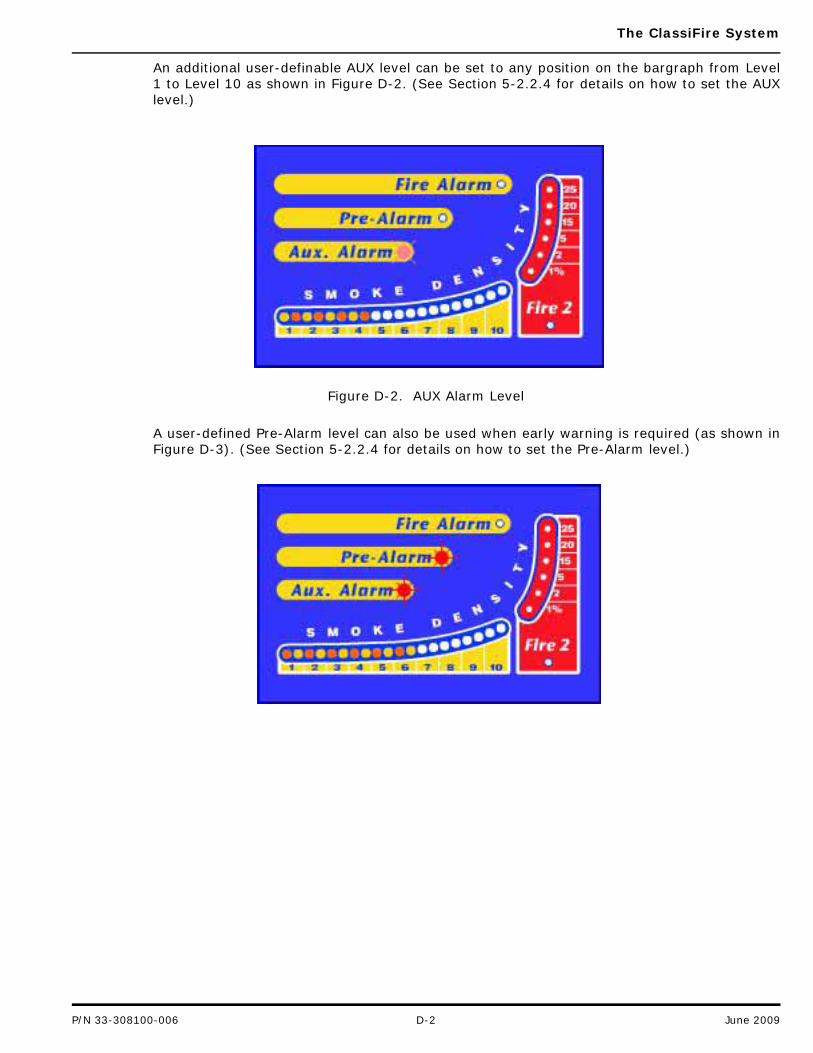
The ClassiFire System
An additional user-definable AUX level can be set to any position on the bargraph from Level1 to Level 10 as shown in Figure D-2. (See Section 5-2.2.4 for details on how to set the AUXlevel.)
Figure D-2. AUX Alarm Level
A user-defined Pre-Alarm level can also be used when early warning is required (as shown inFigure D-3). (See Section 5-2.2.4 for details on how to set the Pre-Alarm level.)
P/N 33-308100-006 D-2 June 2009
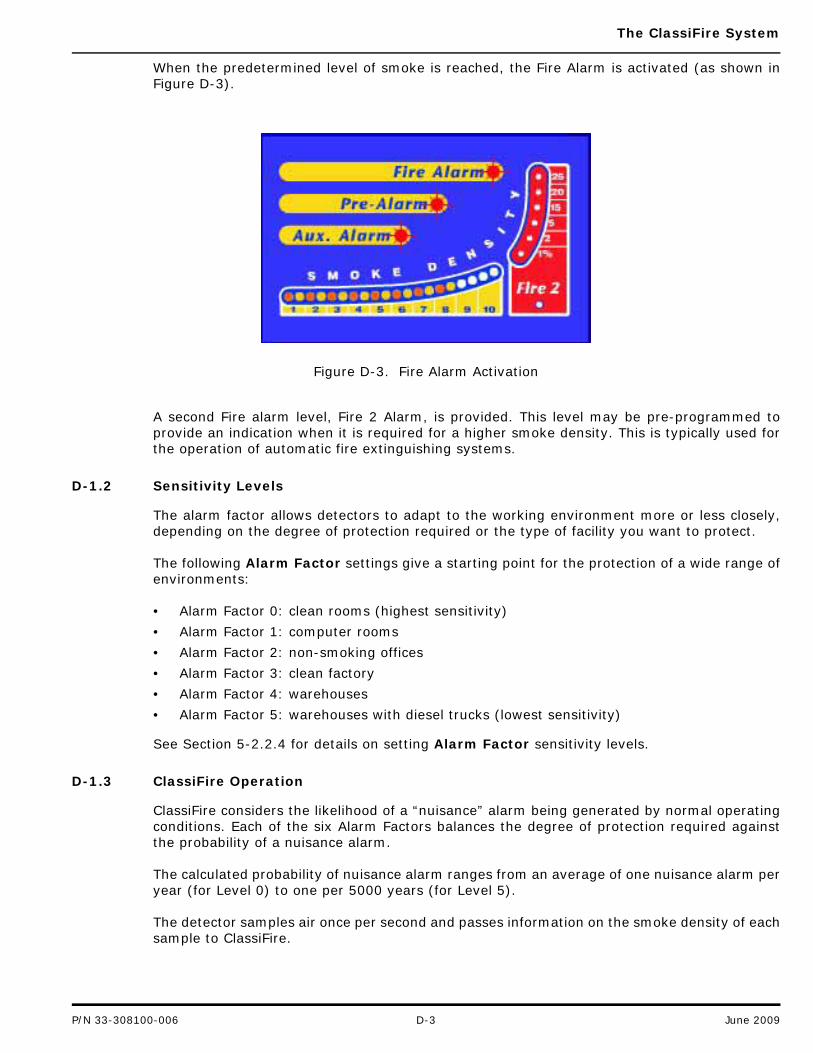
The ClassiFire System
When the predetermined level of smoke is reached, the Fire Alarm is activated (as shown inFigure D-3).
Figure D-3. Fire Alarm Activation
A second Fire alarm level, Fire 2 Alarm, is provided. This level may be pre-programmed toprovide an indication when it is required for a higher smoke density. This is typically used forthe operation of automatic fire extinguishing systems.
D-1.2 Sensitivity Levels
The alarm factor allows detectors to adapt to the working environment more or less closely,depending on the degree of protection required or the type of facility you want to protect.
The following Alarm Factor settings give a starting point for the protection of a wide range ofenvironments:
• Alarm Factor 0: clean rooms (highest sensitivity)
• Alarm Factor 1: computer rooms
• Alarm Factor 2: non-smoking offices
• Alarm Factor 3: clean factory
• Alarm Factor 4: warehouses
• Alarm Factor 5: warehouses with diesel trucks (lowest sensitivity)
See Section 5-2.2.4 for details on setting Alarm Factor sensitivity levels.
D-1.3 ClassiFire Operation
ClassiFire considers the likelihood of a “nuisance” alarm being generated by normal operatingconditions. Each of the six Alarm Factors balances the degree of protection required againstthe probability of a nuisance alarm.
The calculated probability of nuisance alarm ranges from an average of one nuisance alarm peryear (for Level 0) to one per 5000 years (for Level 5).
The detector samples air once per second and passes information on the smoke density of eachsample to ClassiFire.
P/N 33-308100-006 D-3 June 2009
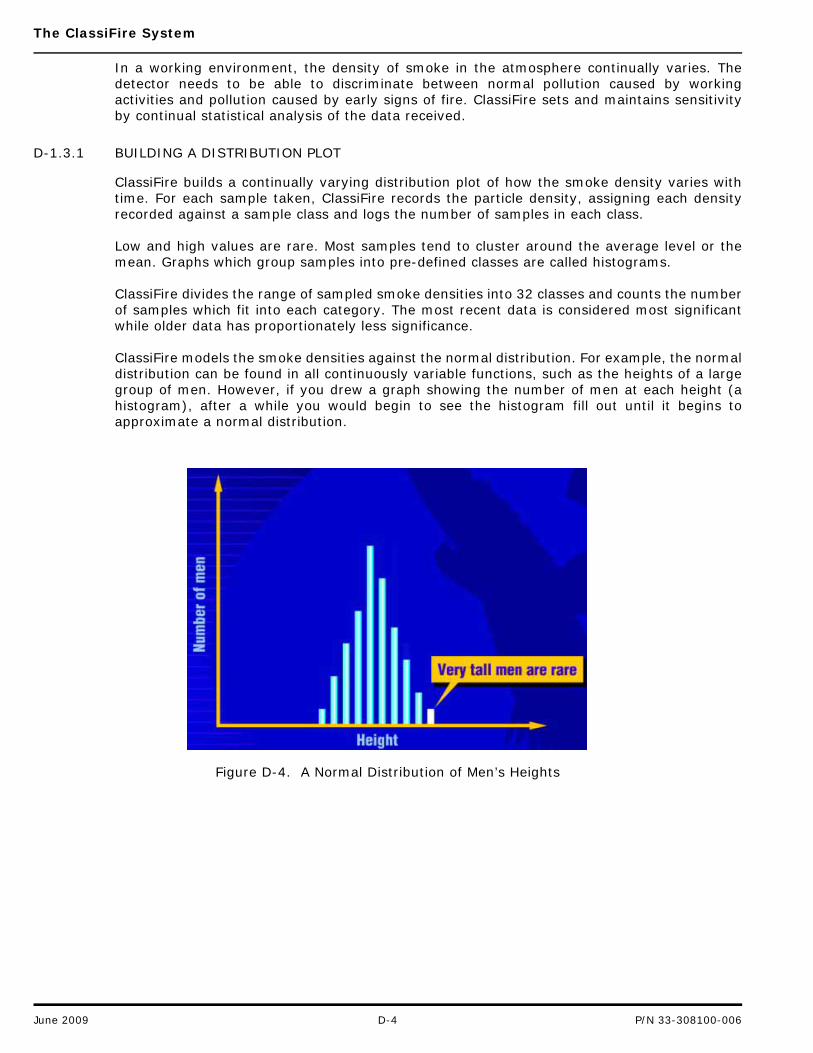
The ClassiFire System
In a working environment, the density of smoke in the atmosphere continually varies. Thedetector needs to be able to discriminate between normal pollution caused by workingactivities and pollution caused by early signs of fire. ClassiFire sets and maintains sensitivityby continual statistical analysis of the data received.
D-1.3.1 BUILDING A DISTRIBUTION PLOT
ClassiFire builds a continually varying distribution plot of how the smoke density varies withtime. For each sample taken, ClassiFire records the particle density, assigning each densityrecorded against a sample class and logs the number of samples in each class.
Low and high values are rare. Most samples tend to cluster around the average level or themean. Graphs which group samples into pre-defined classes are called histograms.
ClassiFire divides the range of sampled smoke densities into 32 classes and counts the numberof samples which fit into each category. The most recent data is considered most significantwhile older data has proportionately less significance.
ClassiFire models the smoke densities against the normal distribution. For example, the normaldistribution can be found in all continuously variable functions, such as the heights of a largegroup of men. However, if you drew a graph showing the number of men at each height (ahistogram), after a while you would begin to see the histogram fill out until it begins toapproximate a normal distribution.
Figure D-4. A Normal Distribution of Men’s Heights
June 2009 D-4 P/N 33-308100-006

The ClassiFire System
Figure D-5 shows the normal distribution curve of men’s height.
Figure D-5. A Normal Distribution Curve
D-1.3.2 BUILDING A CLASSIFIRE HISTOGRAM DISTRIBUTION CURVE OF SMOKE DENSITY
Figure D-6 demonstrates how ClassiFire builds a smoke density distribution curve by collectingdata on smoke density.
Figure D-6. Building a ClassiFire Smoke Density Distribution Curve (Histogram)
P/N 33-308100-006 D-5 June 2009
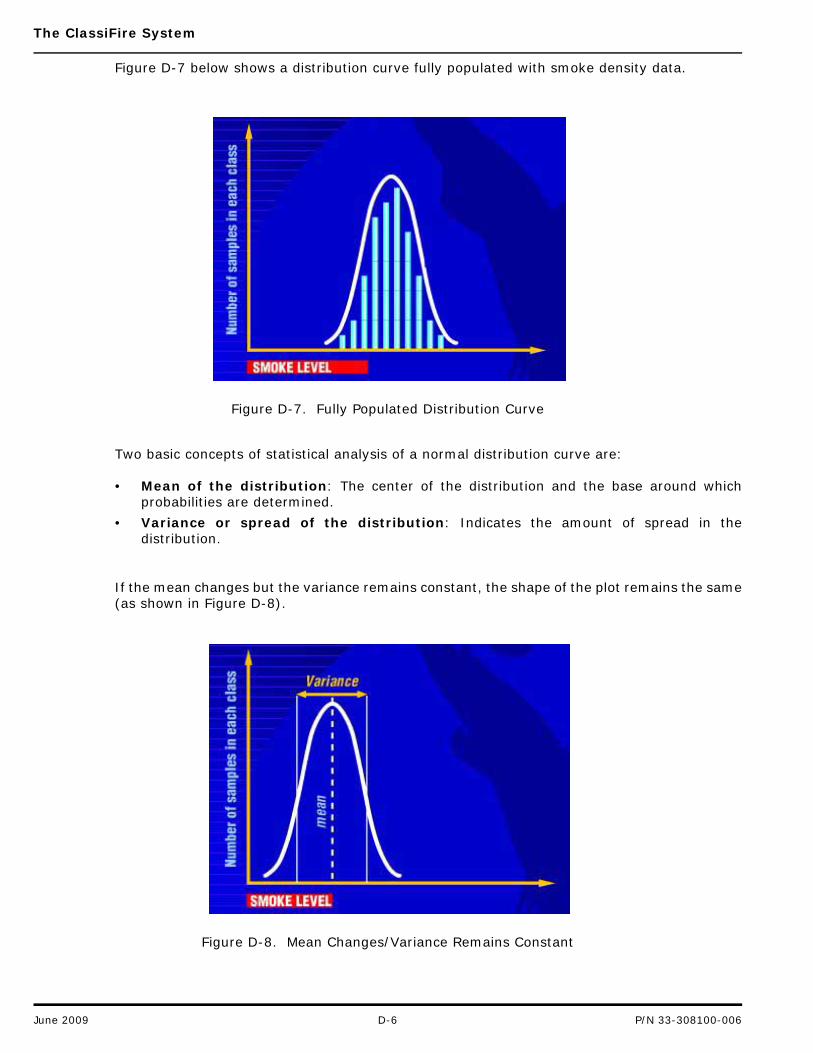
The ClassiFire System
Figure D-7 below shows a distribution curve fully populated with smoke density data.
Figure D-7. Fully Populated Distribution Curve
Two basic concepts of statistical analysis of a normal distribution curve are:
• Mean of the distribution: The center of the distribution and the base around whichprobabilities are determined.
• Variance or spread of the distribution: Indicates the amount of spread in thedistribution.
If the mean changes but the variance remains constant, the shape of the plot remains the same(as shown in Figure D-8).
Figure D-8. Mean Changes/Variance Remains Constant
June 2009 D-6 P/N 33-308100-006
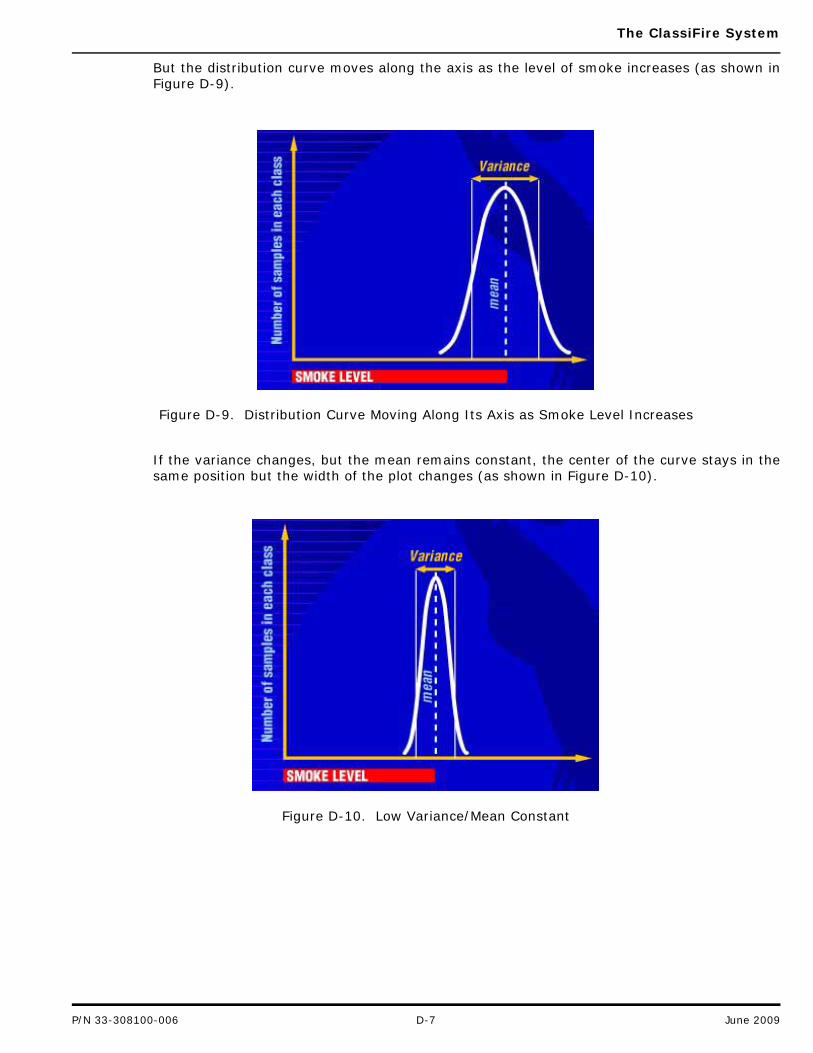
The ClassiFire System
But the distribution curve moves along the axis as the level of smoke increases (as shown inFigure D-9).
Figure D-9. Distribution Curve Moving Along Its Axis as Smoke Level Increases
If the variance changes, but the mean remains constant, the center of the curve stays in thesame position but the width of the plot changes (as shown in Figure D-10).
Figure D-10. Low Variance/Mean Constant
P/N 33-308100-006 D-7 June 2009
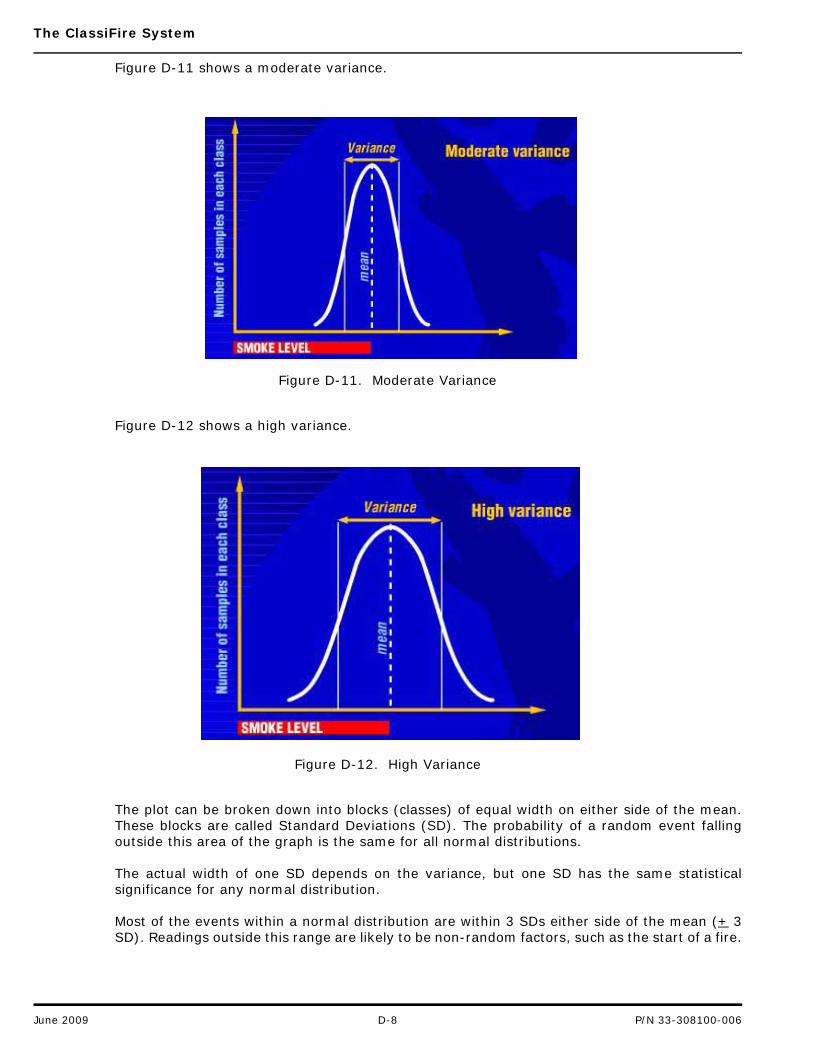
The ClassiFire System
Figure D-11 shows a moderate variance.
Figure D-11. Moderate Variance
Figure D-12 shows a high variance.
Figure D-12. High Variance
The plot can be broken down into blocks (classes) of equal width on either side of the mean.These blocks are called Standard Deviations (SD). The probability of a random event fallingoutside this area of the graph is the same for all normal distributions.
The actual width of one SD depends on the variance, but one SD has the same statisticalsignificance for any normal distribution.
Most of the events within a normal distribution are within 3 SDs either side of the mean (+ 3SD). Readings outside this range are likely to be non-random factors, such as the start of a fire.
June 2009 D-8 P/N 33-308100-006
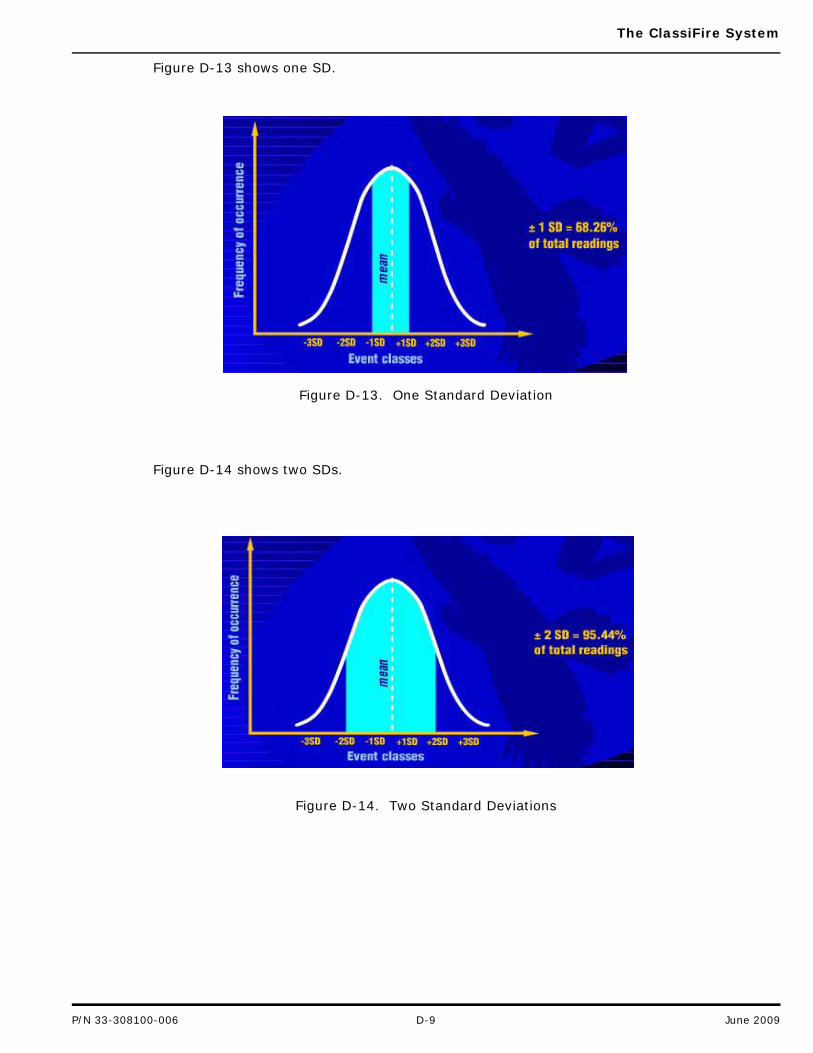
The ClassiFire System
Figure D-13 shows one SD.
Figure D-13. One Standard Deviation
Figure D-14 shows two SDs.
Figure D-14. Two Standard Deviations
P/N 33-308100-006 D-9 June 2009
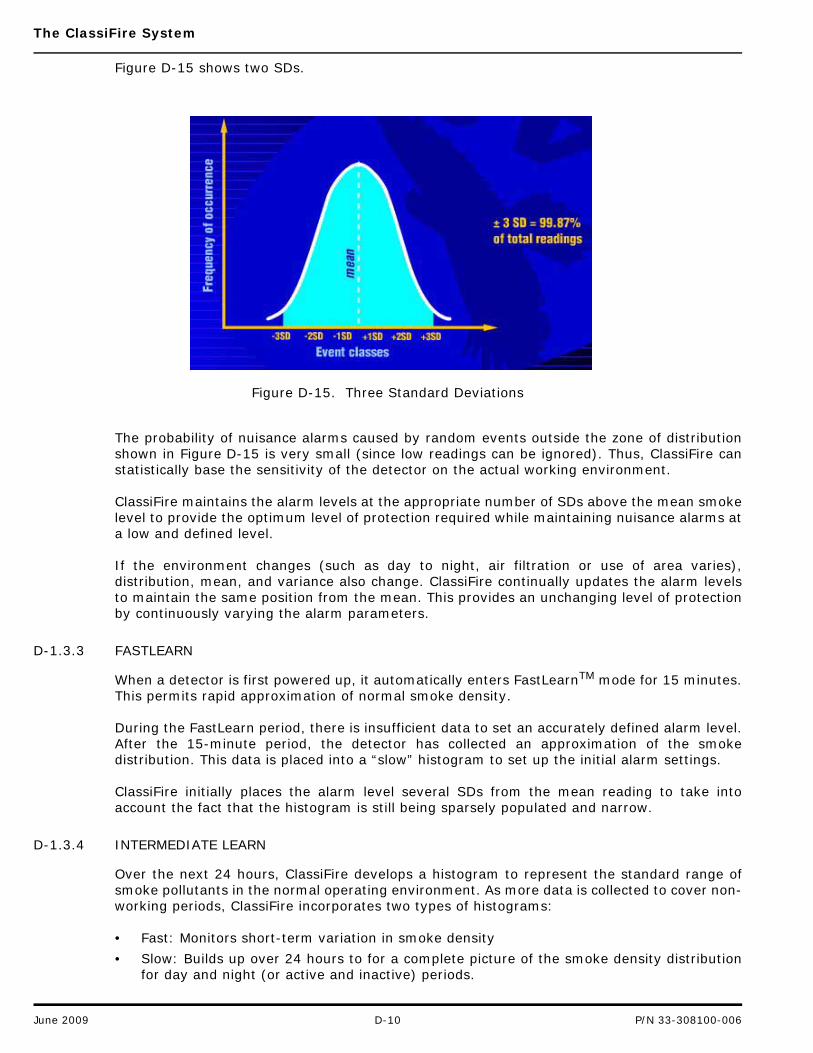
The ClassiFire System
Figure D-15 shows two SDs.
Figure D-15. Three Standard Deviations
The probability of nuisance alarms caused by random events outside the zone of distributionshown in Figure D-15 is very small (since low readings can be ignored). Thus, ClassiFire canstatistically base the sensitivity of the detector on the actual working environment.
ClassiFire maintains the alarm levels at the appropriate number of SDs above the mean smokelevel to provide the optimum level of protection required while maintaining nuisance alarms ata low and defined level.
If the environment changes (such as day to night, air filtration or use of area varies),distribution, mean, and variance also change. ClassiFire continually updates the alarm levelsto maintain the same position from the mean. This provides an unchanging level of protectionby continuously varying the alarm parameters.
D-1.3.3 FASTLEARN
When a detector is first powered up, it automatically enters FastLearnTM mode for 15 minutes.This permits rapid approximation of normal smoke density.
During the FastLearn period, there is insufficient data to set an accurately defined alarm level.After the 15-minute period, the detector has collected an approximation of the smokedistribution. This data is placed into a “slow” histogram to set up the initial alarm settings.
ClassiFire initially places the alarm level several SDs from the mean reading to take intoaccount the fact that the histogram is still being sparsely populated and narrow.
D-1.3.4 INTERMEDIATE LEARN
Over the next 24 hours, ClassiFire develops a histogram to represent the standard range ofsmoke pollutants in the normal operating environment. As more data is collected to cover non-working periods, ClassiFire incorporates two types of histograms:
• Fast: Monitors short-term variation in smoke density
• Slow: Builds up over 24 hours to for a complete picture of the smoke density distributionfor day and night (or active and inactive) periods.
June 2009 D-10 P/N 33-308100-006
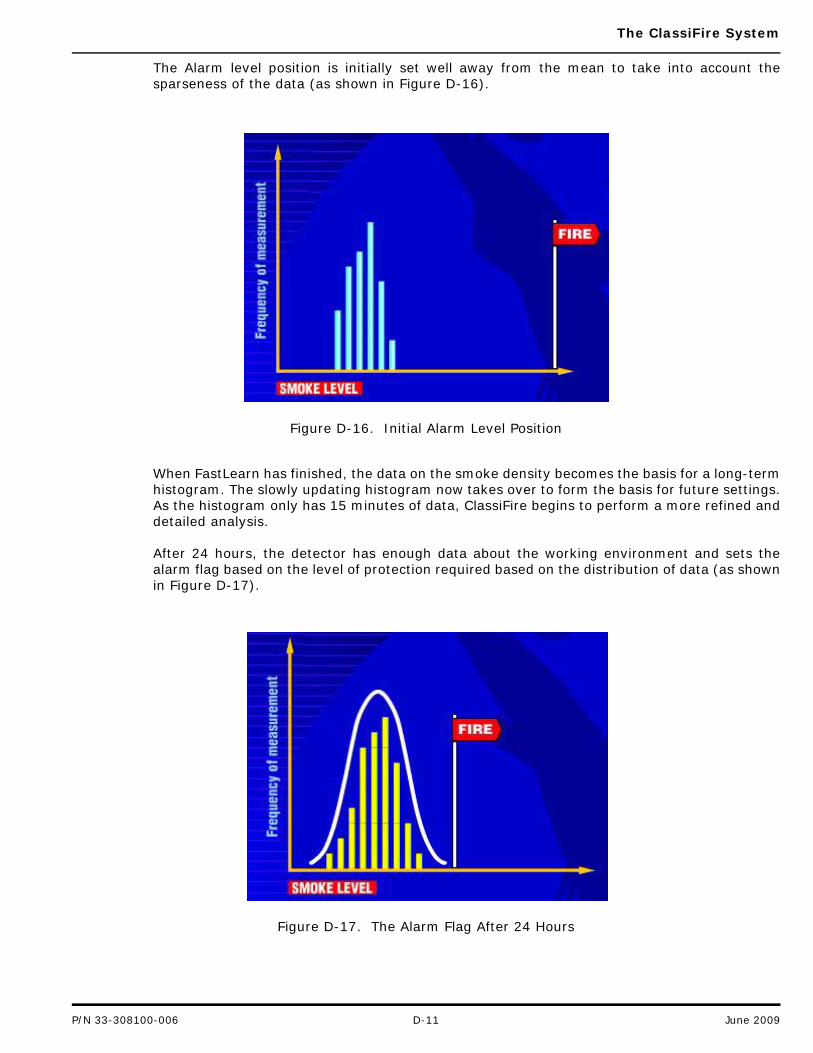
The ClassiFire System
The Alarm level position is initially set well away from the mean to take into account thesparseness of the data (as shown in Figure D-16).
Figure D-16. Initial Alarm Level Position
When FastLearn has finished, the data on the smoke density becomes the basis for a long-termhistogram. The slowly updating histogram now takes over to form the basis for future settings.As the histogram only has 15 minutes of data, ClassiFire begins to perform a more refined anddetailed analysis.
After 24 hours, the detector has enough data about the working environment and sets thealarm flag based on the level of protection required based on the distribution of data (as shownin Figure D-17).
Figure D-17. The Alarm Flag After 24 Hours
P/N 33-308100-006 D-11 June 2009
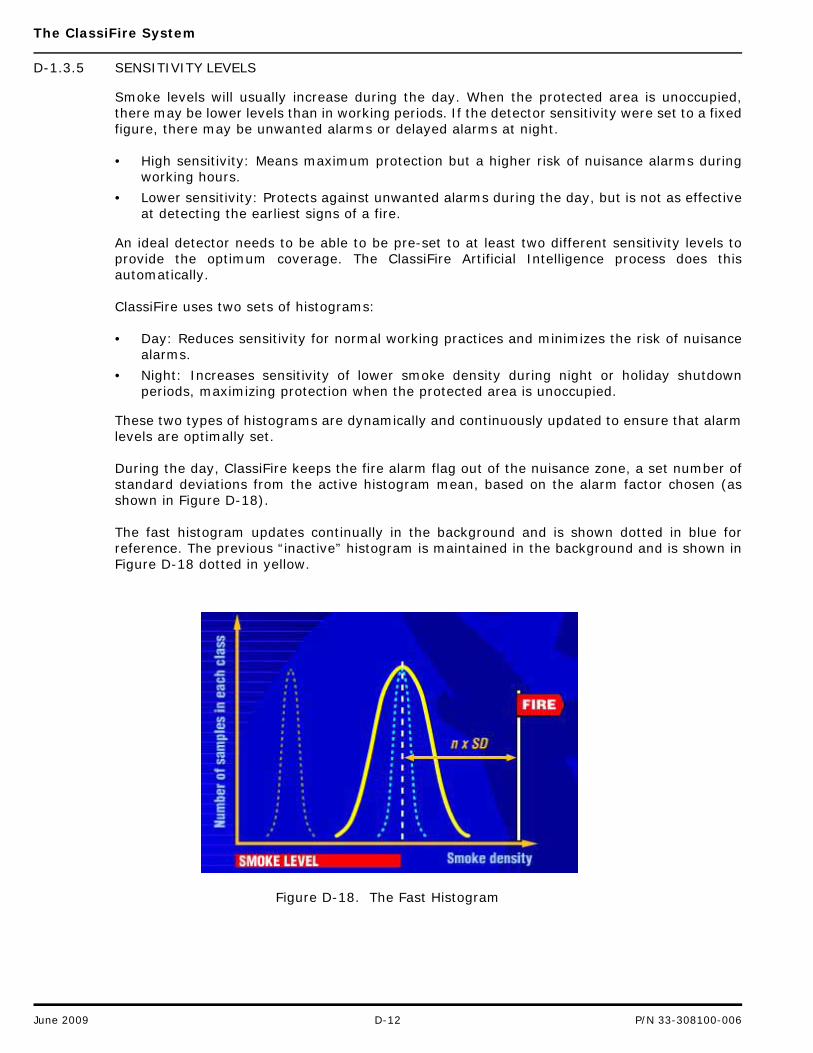
The ClassiFire System
D-1.3.5 SENSITIVITY LEVELS
Smoke levels will usually increase during the day. When the protected area is unoccupied,there may be lower levels than in working periods. If the detector sensitivity were set to a fixedfigure, there may be unwanted alarms or delayed alarms at night.
• High sensitivity: Means maximum protection but a higher risk of nuisance alarms duringworking hours.
• Lower sensitivity: Protects against unwanted alarms during the day, but is not as effectiveat detecting the earliest signs of a fire.
An ideal detector needs to be able to be pre-set to at least two different sensitivity levels toprovide the optimum coverage. The ClassiFire Artificial Intelligence process does thisautomatically.
ClassiFire uses two sets of histograms:
• Day: Reduces sensitivity for normal working practices and minimizes the risk of nuisancealarms.
• Night: Increases sensitivity of lower smoke density during night or holiday shutdownperiods, maximizing protection when the protected area is unoccupied.
These two types of histograms are dynamically and continuously updated to ensure that alarmlevels are optimally set.
During the day, ClassiFire keeps the fire alarm flag out of the nuisance zone, a set number ofstandard deviations from the active histogram mean, based on the alarm factor chosen (asshown in Figure D-18).
The fast histogram updates continually in the background and is shown dotted in blue forreference. The previous “inactive” histogram is maintained in the background and is shown inFigure D-18 dotted in yellow.
Figure D-18. The Fast Histogram
June 2009 D-12 P/N 33-308100-006
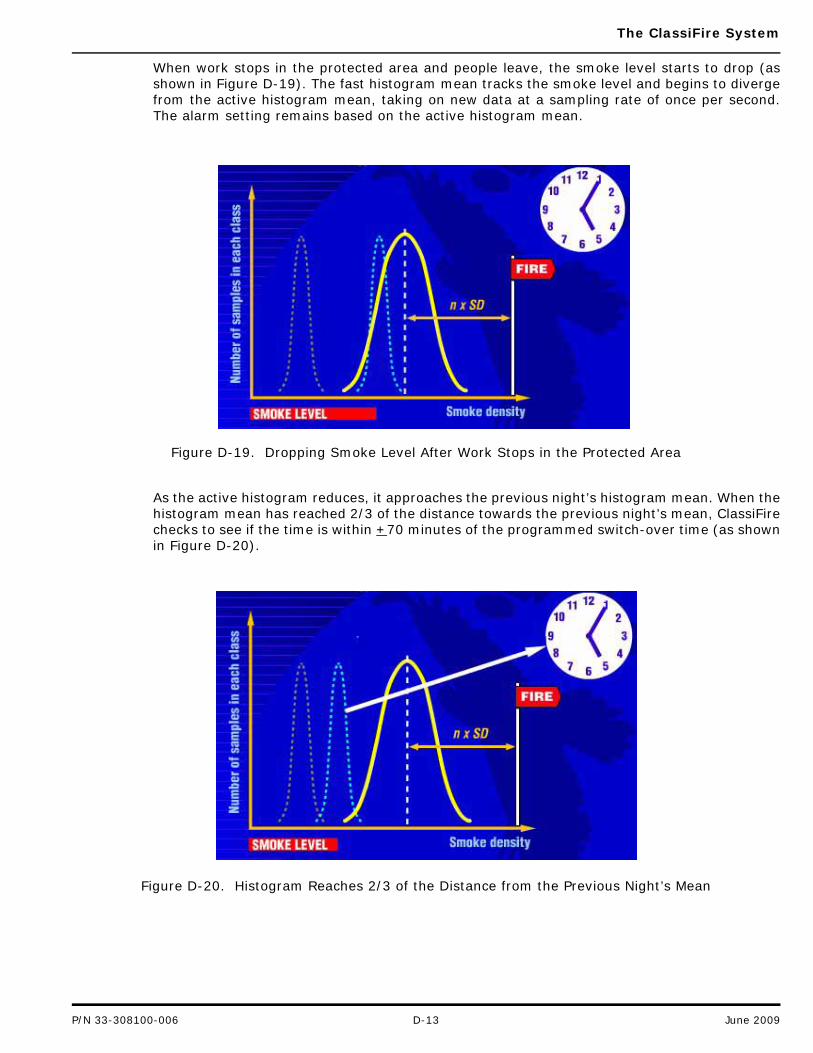
The ClassiFire System
When work stops in the protected area and people leave, the smoke level starts to drop (asshown in Figure D-19). The fast histogram mean tracks the smoke level and begins to divergefrom the active histogram mean, taking on new data at a sampling rate of once per second.The alarm setting remains based on the active histogram mean.
Figure D-19. Dropping Smoke Level After Work Stops in the Protected Area
As the active histogram reduces, it approaches the previous night’s histogram mean. When thehistogram mean has reached 2/3 of the distance towards the previous night’s mean, ClassiFirechecks to see if the time is within +70 minutes of the programmed switch-over time (as shownin Figure D-20).
Figure D-20. Histogram Reaches 2/3 of the Distance from the Previous Night’s Mean
P/N 33-308100-006 D-13 June 2009
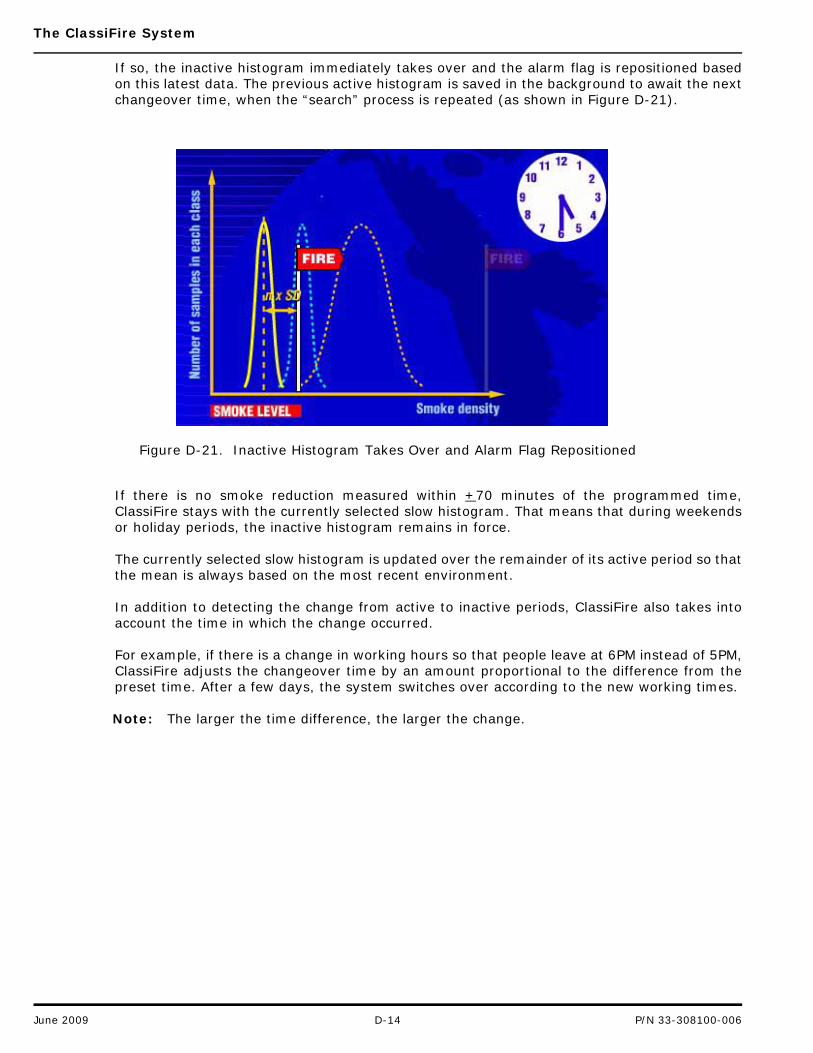
The ClassiFire System
If so, the inactive histogram immediately takes over and the alarm flag is repositioned basedon this latest data. The previous active histogram is saved in the background to await the nextchangeover time, when the “search” process is repeated (as shown in Figure D-21).
Figure D-21. Inactive Histogram Takes Over and Alarm Flag Repositioned
If there is no smoke reduction measured within +70 minutes of the programmed time,ClassiFire stays with the currently selected slow histogram. That means that during weekendsor holiday periods, the inactive histogram remains in force.
The currently selected slow histogram is updated over the remainder of its active period so thatthe mean is always based on the most recent environment.
In addition to detecting the change from active to inactive periods, ClassiFire also takes intoaccount the time in which the change occurred.
For example, if there is a change in working hours so that people leave at 6PM instead of 5PM,ClassiFire adjusts the changeover time by an amount proportional to the difference from thepreset time. After a few days, the system switches over according to the new working times.
Note: The larger the time difference, the larger the change.
June 2009 D-14 P/N 33-308100-006
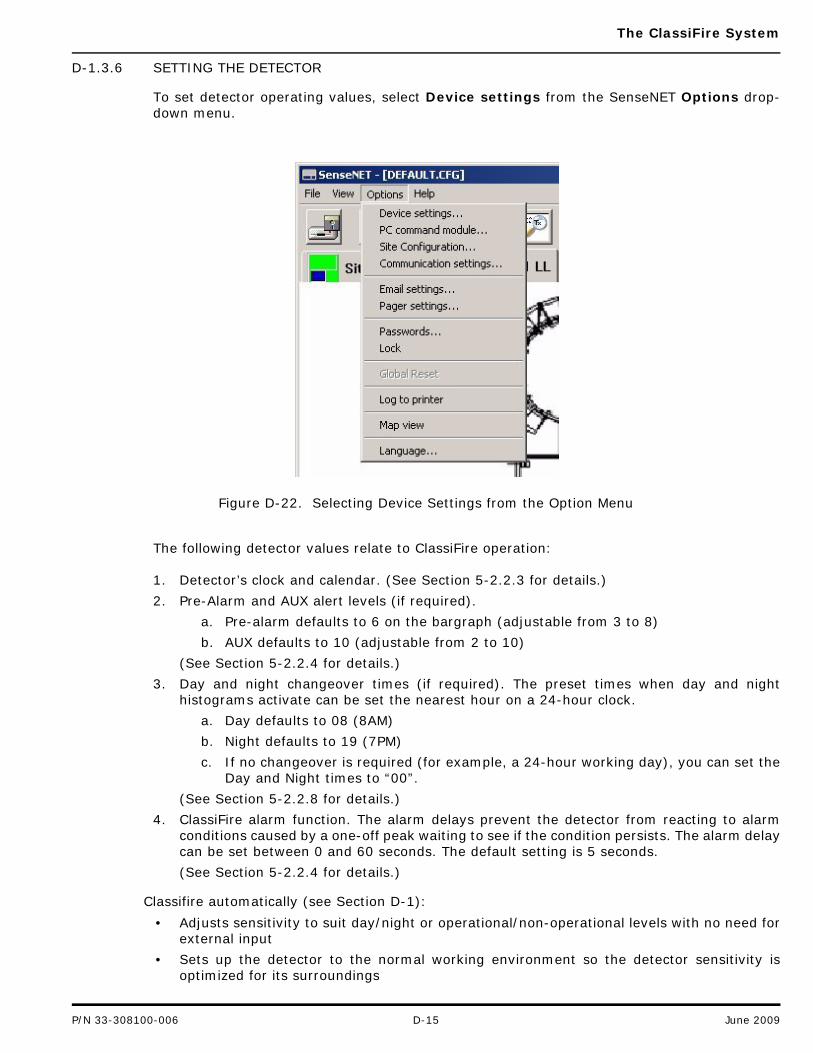
The ClassiFire System
D-1.3.6 SETTING THE DETECTOR
To set detector operating values, select Device settings from the SenseNET Options drop-down menu.
Figure D-22. Selecting Device Settings from the Option Menu
The following detector values relate to ClassiFire operation:
1. Detector’s clock and calendar. (See Section 5-2.2.3 for details.)
2. Pre-Alarm and AUX alert levels (if required).
a. Pre-alarm defaults to 6 on the bargraph (adjustable from 3 to 8)
b. AUX defaults to 10 (adjustable from 2 to 10)
(See Section 5-2.2.4 for details.)
3. Day and night changeover times (if required). The preset times when day and nighthistograms activate can be set the nearest hour on a 24-hour clock.
a. Day defaults to 08 (8AM)
b. Night defaults to 19 (7PM)
c. If no changeover is required (for example, a 24-hour working day), you can set theDay and Night times to “00”.
(See Section 5-2.2.8 for details.)
4. ClassiFire alarm function. The alarm delays prevent the detector from reacting to alarmconditions caused by a one-off peak waiting to see if the condition persists. The alarm delaycan be set between 0 and 60 seconds. The default setting is 5 seconds.
(See Section 5-2.2.4 for details.)
Classifire automatically (see Section D-1):
• Adjusts sensitivity to suit day/night or operational/non-operational levels with no need forexternal input
• Sets up the detector to the normal working environment so the detector sensitivity isoptimized for its surroundings
P/N 33-308100-006 D-15 June 2009
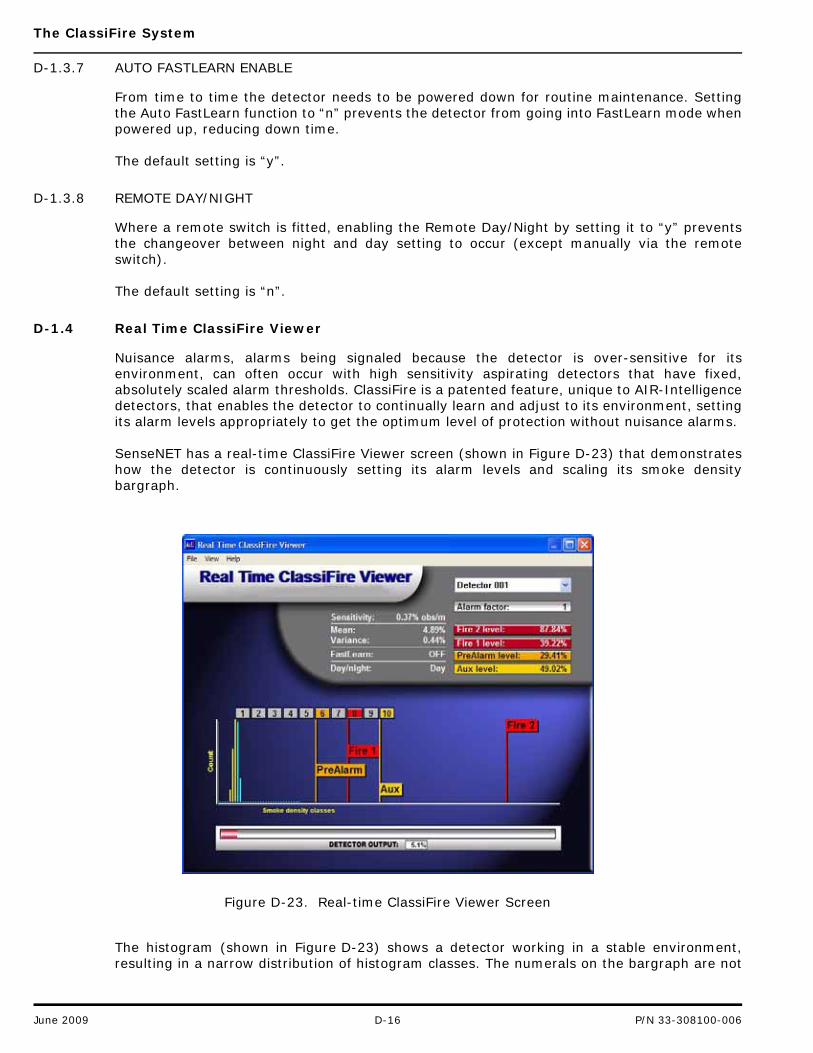
The ClassiFire System
D-1.3.7 AUTO FASTLEARN ENABLE
From time to time the detector needs to be powered down for routine maintenance. Settingthe Auto FastLearn function to “n” prevents the detector from going into FastLearn mode whenpowered up, reducing down time.
The default setting is “y”.
D-1.3.8 REMOTE DAY/NIGHT
Where a remote switch is fitted, enabling the Remote Day/Night by setting it to “y” preventsthe changeover between night and day setting to occur (except manually via the remoteswitch).
The default setting is “n”.
D-1.4 Real Time ClassiFire Viewer
Nuisance alarms, alarms being signaled because the detector is over-sensitive for itsenvironment, can often occur with high sensitivity aspirating detectors that have fixed,absolutely scaled alarm thresholds. ClassiFire is a patented feature, unique to AIR-Intelligencedetectors, that enables the detector to continually learn and adjust to its environment, settingits alarm levels appropriately to get the optimum level of protection without nuisance alarms.
SenseNET has a real-time ClassiFire Viewer screen (shown in Figure D-23) that demonstrateshow the detector is continuously setting its alarm levels and scaling its smoke densitybargraph.
Figure D-23. Real-time ClassiFire Viewer Screen
The histogram (shown in Figure D-23) shows a detector working in a stable environment,resulting in a narrow distribution of histogram classes. The numerals on the bargraph are not
June 2009 D-16 P/N 33-308100-006

The ClassiFire System
displayed on the viewer due to the small size of the bargraph segments (shown above thevertical histogram bars).
P/N 33-308100-006 D-17 June 2009

The ClassiFire System
THIS PAGE INTENTIONALLY LEFT BLANK.
June 2009 D-18 P/N 33-308100-006
INDEX
Aaccess code
default value, 5-21adding a new device to an existing site configura-tion, 3-6address ranges, "real" detectors, 5-5, B-1address ranges, "virtual" detectors, 5-5address reserved for Command Module, 5-5alarm factor, 4-21alarm thresholds, 3-3, 4-2, D-16alert sounds, 4-3, 4-5, 5-31 to 5-32
for more than one event at a time, 5-33ambient smoke density, 5-18APIC card, 4-11, 5-13ASD-160H detector, 2-12, 4-10 to 4-11, 5-7 to 5-8,5-13 to 5-14
use with relay/input card, 5-7ASD-320 detector, 2-12, 4-10 to 4-11, 5-8, 5-13 to5-14ASD-640 detector, 2-13, 5-7 to 5-8, 5-11, 5-13,5-16aspirator (fan), 5-15AUX alarm, 4-19, 4-21, 4-23, 5-10 to 5-11, 5-27,5-32 to 5-33, D-15
BBuilding Management System (BMS), 1-5
supported protocols, 1-5
Ccascading alarms, 5-9ClassiFire, 4-13, 4-19, 4-23, 5-11 to 5-13, 5-18,5-22, D-1, D-13 to D-16ClassiFire alarm factor, 4-13, 4-19 to 4-20, 4-23,5-11 to 5-12
suggested settings, 5-12ClassiFire Histograph Viewer Screen, 4-19
blue (fast) histogram, 4-19real-time updating of, 4-19yellow (slow) histogram, 4-19
Command Module, 1-2, 1-4 to 1-6, 2-6 to 2-7, 2-9,2-13, 3-3, 3-5, 3-8, 4-1 to 4-2, 4-5 to 4-6, 4-8,4-11, 4-23, 5-1, 5-3 to 5-4, 5-22, B-1
reserved address, 5-5Comms fault message, 2-7communicating to a network of detectors, 1-2, 2-6communicating to an individual detector, 2-7Communications Fail message, 1-5configuring communication settings, 2-7configuring device settings, 5-1 to 5-2, 5-4, 5-6connecting a network using a Command Module,1-4connecting a network using an RS232 to RS485 PC
Interface Converter, 1-2connecting a SenseNET communication network,1-2connecting to third party systems (see also BuildingManagment System), 1-5Contact Monitor interface, 1-1, 1-5, 4-23critical faults, 3-7cross-zoning, use of a virtual detector, 5-4
DDaylight Savings Time, 5-9, 5-18Demonstration Mode, 4-18, 5-14dialing a central call center, 5-25DIP switch settings, B-1
EEvent Log Viewer, 2-4event log, non-volatile memory, 4-16event logging, 1-1, 4-28event logs, 3-3 to 3-4, 4-2, 4-4, 4-24, 4-27 to 4-28
FFastLearn, 4-13, 4-18, 4-20, 5-13, 5-20, D-10 toD-11, D-16
starting and stopping, 5-13FastPoll, 5-23Fire 1 Alarm, 4-19 to 4-21, 4-23, 5-9 to 5-11, 5-27,5-32 to 5-33Fire 2 Alarm, 4-19, 4-23, 5-10 to 5-11, 5-32 to 5-33
defined, D-3flow readings, 4-10
GGlobal Reset, 3-3, 4-18, 5-1, 5-26
HHASP security device, 2-1HASP security device driver, 2-3
automatic installation of, 2-3
Iinitialization file, configuring, A-1Intermediate Learn, D-10
Llaser chamber output, 4-10Laser Dust Discrimination (LDD), 5-13latching alarms, 4-11, 5-8, 5-26latching faults, 5-8, 5-26
P/N 33-308100-006 Index-1 June 2009
MMap View
displaying bargraphs, 4-23MatrixScan (see also virtual detectors), 5-4Micro Serial Server (MSS), 2-7, 2-9, 5-23modem, use of with SenseNET, 5-25monitoring third party detectors, 1-5
Nnon-critical faults, 3-7nuisance alarms, 4-13, D-10, D-12, D-16
Ppager, sending messages to, 1-1 to 1-2, 3-8, 5-25passwords, 1-1, 2-3 to 2-6, 5-1, 5-23, 5-26PC Interface (RS232 to RS485 converter), 1-2 to1-3, 2-12Pre-Alarm, 4-5, 4-19, 4-21, 4-23, 5-9 to 5-11,5-27, 5-32, D-2, D-15printer configuration, 5-27programmable function selector, 4-3, 5-2Programmed Isolate, 5-8programming and configuration
Communications Settings Screen, 2-7Buffer Sizes, 2-7Clear to Send (CTS) enabled, 2-7Monitor from network, 2-7Number of loops, 2-7Port, 2-7Port type, 2-7
Global Reset, 5-27Log to printer, 5-27Map View, 5-28
Detector Display, 5-28Site Map, 5-28
Remote Input functions, 5-7Set Language Screen, 5-30The Alarm Actions Screen, 5-6
Cascading alarms, 5-9Latching Alarms, 5-8Latching Faults, 5-8Programmed Isolate, 5-8Remote day/night, 5-8Remote Isolate, 5-8Remote Reset, 5-8Time and Date, 5-9
The Alarm Levels and Delays Screen, 5-10Auto FastLearn enable, 5-13ClassiFire 3D, 5-13ClassiFire Alarm factor, 5-12ClassiFire Override, 5-12Delay, 5-11Demo mode, 5-14FastLearn enable, 5-13LDD enable, 5-13
Level, 5-10The Command Module Settings Screen, 5-22
Echo responses, 5-23FastPoll, 5-23Help, 5-23PC command module, 5-23Poll timeout, 5-23using a PC as a Command Module, 5-22
The Communications Settings Screen, 5-24The Day/Night Switching Screen, 5-18
Day start, 5-19Disable day/night switching, 5-19Night start, 5-19
The Device Information Screen, 5-3Device text, 5-3Device type, 5-3Firmware version, 5-3Run-time hours, 5-3Watchdog count, 5-3
The Email Settings Screen, 5-24Cancel, 5-25Enable Email notification, 5-25OK, 5-25Send email to (account name), 5-25
The File menu, 3-3Exit, 3-4New site, 3-4Open, 3-4Print, 3-4Restore function settings, 3-4Save function settings, 3-4Site Configuration Editor, 3-10
The Flow Monitoring Screen, 5-14Aspirator speed, 5-15Enable sensor, 5-15Flow rate, 5-15
The Front Panel Screen, 5-16Isolate button enable, 5-17Reset button enable, 5-17Test button enable, 5-17
The Function settings module, 5-3Cancel, 5-4Modified, 5-4OK, 5-4Save All, 5-4
The MatrixScan Screen, 5-4Base address, 5-5Enable, 5-5
The Miscellaneous Screen, 5-20Access code, 5-21Chart recording rate, 5-21Factory default, 5-22Separator change date, 5-22Separator condition, 5-22
The Options Menu, 2-7, 3-4, 5-1 to 5-2, 5-22 to5-24, 5-26 to 5-27, 5-30
The Pager Settings Screen, 5-26Baud rate, 5-26
June 2009 Index-2 P/N 33-308100-006
Call center number, 5-26Cancel, 5-26Com port, 5-26Enable paging, 5-26Format, 5-26Help, 5-26OK, 5-26Pager-GSM phone number, 5-26Password, 5-26Test, 5-26
The Power Monitoring Screen, 5-15Auto power save, 5-16Battery check, 5-16Mains check, 5-16
The Referencing Screen, 5-19Reference back-off, 5-20Reference detector, 5-20Reference enable, 5-20Reference level, 5-20setting up a reference detector, 5-19 to 5-20
The Site Configuration Editor, 3-1, 3-5, 3-7,3-10, 4-23, 5-23
Alarm and Fault Actions, 5-31Action/hazard, 5-32Browse, 5-32Bus reset, 5-32Play, 5-32Save all, 5-32Sound file, 5-32
Complex Mode, 3-2, 3-5Diagnostics Screen, 4-26Simple Mode, 3-2, 3-4 to 3-5
RReal Time Clock, internal, 5-9relay card, optional, 4-11Remote Configuration Software, 3-3
status information, types displayed, 3-3Remote Display Unit (RDU)
address switch, 1-5defined, 1-5displaying common detector status, 1-6optional Relay Board, 1-5setting address, 1-6
resetting the detector remotely (see also Global Re-set), 5-26RS232, 1-3, 1-5, 2-7, 2-12, 5-25RS232 port
connecting a PC to, 2-6connecting to third party systems, 1-5
RS485, 1-2, 2-7, 2-9, 2-12, 5-23RS485 cable, maximum recommended length, 1-2RS485 repeater, use of, 1-2
SSenseNET
architecture, 1-2initialization file, A-1installation, 2-1languages supported, 2-2launching from Windows, 2-2loops, local, 2-7loops, remote, 2-7main screen toolbar, 4-1
Alarms icon, 4-3Bus Viewer icon, 4-2Chart Recording icon, 4-2ClassiFire Histogram Viewer icon, 4-2Device Setting icon, 4-3Diagnostic icon, 4-2Event Log icon, 4-2Front Panel icon, 4-3Global Reset icon, 4-3Help icon, 4-3Lock icon, 4-3Map View icon, 4-3Open File icon, 4-1Site Configuration icon, 4-3
minimum computer requirementsWindows 2000, 1-1Windows XP, 1-1
overview of setup procedure, 1-2password access levels & privileges, 2-3, 2-5setting passwords, 2-3, 2-5when to boot up the computer, 2-6
SenseNET network configurations, examples of, 2-9to 2-13SENSENET.INI, A-1sensitivity, 1-ii, 1-1, 4-19, 4-21, 5-12 to 5-13, 5-17to 5-18, D-1, D-3 to D-4, D-10, D-12, D-15 to D-16sensitivity, defined, 4-20setting detector addresses, B-1setting up a printer on LPT1, 5-27setting up local and remote communications tomonitor a VESDAnet network, 2-8setting up local and remote communications usingmultiple PCs, 2-8setting up the communications, 2-7site map
setting for a detector, 3-10smoke distribution histogram, 4-19
arithmetic mean, 4-20arithmetic variance, 4-20
smoke response time, NFPA requirement, 5-15SMS messages with GSM-capable telephone, 5-25sound files, use of, 1-1, 3-5, 3-7, 5-32status and informational displays
main screen toolbar, 4-1The Alarm/fault viewer Screen, 4-4
Close, 4-6
P/N 33-308100-006 Index-3 June 2009
Help, 4-6Isolate, 4-5Map, 4-6Reset, 4-5Silence, 4-5Zone, 4-5
The Bus viewer Screen, 4-6Bus error rate, 4-7Clear, 4-7Destination Address, 4-7Message, 4-7Save, 4-7Show fast poll checkbox, 4-7Source Device, 4-7Xor, 4-7
The Chart Recording Screen, 4-11Alarm Level, 4-13Chart Information screen, 4-12Chart Summary screen, 4-12Detector Output, 4-13drop-down menus, 4-13Edit Menu, 4-14File Menu, 4-14Help Menu, 4-15Mouse pointer, 4-13View Menu, 4-14
The Diagnostics Screen, 4-7Address, 4-8Detector text, 4-8Device, 4-8Diagnostics, 4-9Help, 4-11Print, 4-11Read, 4-10Relays, 4-11Save, 4-11Status, 4-8Version, 4-8
The Event Log Screen, 4-15Cancel, 4-18Filter, 4-17Help, 4-18OK, 4-18Open, 4-17Print, 4-17Reload, 4-17Save As, 4-17
The File Menu, 4-3Exit, 4-4New site, 4-3Open, 4-4Print, 4-4Restore function settings, 4-4Save function settings, 4-4
The Front Panel Screen, 4-22The Histograph Viewer Screen, 4-19
Alarm Timer, 4-21FastLearn, 4-20
File, 4-21Help, 4-21Mean, 4-20Sensitivity, 4-20Variance, 4-20View, 4-21
The View Menu, 4-4
TTelecommunications Alphanumeric Protocol (TAP),5-25
UUninterruptable Power Supply (UPS), suggesteduse of, 1-6
VVESDAnet network, monitoring with SenseNET, 2-8virtual detectors (see also MatrixScan), 5-4 to 5-5
addresses available, 5-6calculating maximum number of allowable, 5-6maximum per real detector, 5-6use with real detectors, 5-6
Zzone, 3-1 to 3-2, 3-6, 3-10, 4-29, 5-4, 5-28, D-10,D-12zone map, 1-1, 3-2, 3-5 to 3-6, 3-8, 3-10 to 3-11,4-5, 4-29, 5-28
setting for a detector, 3-10
June 2009 Index-4 P/N 33-308100-006


These instructions do not purport to cover all the details or variations in the equipmentdescribed, nor do they provide for every possible contingency to be met in connection withinstallation, operation and maintenance. All specifications subject to change without no-tice. Should further information be desired or should particular problems arise which arenot covered sufficiently for the purchaser’s purposes, the matter should be referred toKidde-Fenwal, Inc., Ashland, Massachusetts
AIR-Intelligence is a trademark of Kidde-Fenwal, Inc.
FastLearn, LDD, PipeCAD, SenseNET, and SiteScan are trademarks of AirSense Technology, USA.ClassiFire is a registered trademark of AirSense Technology, USA.
Microsoft and Windows are registered trademarks of Microsoft Corporation in the United States and/or other countries.HASP is a registered trademark of Aladdin Knowledge Systems, Ltd. in the United States and/or other countries.VESDAnet is a registered trademark of Xtralis AG in the United States and/or other countries VESDA Open Protocol HLI is a trademark of Xtralis AG in the United States and/or other countries.
All other trademarks are property of their respective owners.
AIR-Intelligence400 Main StreetAshland, MA 01721 USACustomer Service: (508) 881-2000Technical Support: (866) 287-2531Website: www.air-intelligence.com
P/N 33-308100-006 Rev. AA © 2009 Kidde-Fenwal, Inc. All Rights Reserved.