Agriculture and Food Industry in Russia, Ukraine, Belarus and ...
47
Agriculture and Food Industry in Russia, Ukraine, Belarus and Kazakhstan Market Research Department, SCHNEIDER GROUP May 2018
-
Upload
khangminh22 -
Category
Documents
-
view
3 -
download
0
Transcript of Agriculture and Food Industry in Russia, Ukraine, Belarus and ...

Agriculture and Food Industry in Russia,
Ukraine, Belarus and Kazakhstan
Market Research Department, SCHNEIDER GROUP
May 2018

Contents
Executive Summary
Chances and Opportunities
General Socio-Economic Indicators
General Socio-Economic Statistics: Food Baskets and Subsistence Minimum
Role in the National Economies
Main Agricultural Regions
Agriculture and Food Foreign Trade
Key Regulations
Appendix: Milk and Cheese Industry
accounting | ERP | import | legal | tax 2
This report is the extended version of the our analysis of the agricultural sector in Russia, Ukraine, Belarus and Kazakhstan. It
offers a special insight on the Milk and Cheese industry of the countries, detailed information on the production and
consumption, average price, imports and exports of milk products and cheese, and shares of key market players in four
countries.
We would be happy to provide you with analysis on any specific subject you are interested in.
To learn more, please contact us

Executive Summary (1)
accounting | ERP | import | legal | tax 3
Market size
Combined size of the food markets of Russia,
Ukraine, Belarus and Kazakhstan totaled
USD 294bn* in 2017.
The Russian market, with sales at
c. USD 247,6bn in 2017 or 84% of the combined
market size, is the largest.
This proportion is broadly repeated in the
allocation of population among these countries.
Imports vs. local production
Local production dominates all the markets in
value terms.
Imports are between 17% and 28% in value
terms, with a similarity of import shares in Russia
and Ukraine (17-18%) and in Belarus and
Kazakhstan (25-28%).
Fruit and meat remain the most imported
categories among agricultural goods both in value
and volume terms.
Main export shares in Russia are taken by cereals
and fish products (36,2% and 17,1%). *Devaluation of local currencies has significantly affected sales in foreign
currency terms
Relative market size by country from a total
of USD 294bn based on sales in 2017, %
Sources: National Statistical Agencies, BMI
84%
9%
4% 3%
Russia
Ukraine
Belarus
Kazakhstan
18%
17%
28%
25%
82%
83%
72%
75%
Russia
Ukraine
Belarus
Kazakhstan
Imports
Local production
Food imports vs. local production
in USD terms in 2016, %
Sources: National Statistical Agencies, Customs Services

4 accounting | ERP | import | legal | tax
Role of agriculture in the national economies
Agricultural production accounts for a significant
role in the national economies of Ukraine and
Belarus (20,6% and 22,1% of GDP). These
numbers are smaller for Russia (7,5%) and
especially Kazakhstan (3,6%). However,
Kazakhstan’s agricultural sector is among the most
promising in the world
This allocation can be partially explained by the
favorable climatic and geostrategic conditions.
Agricultural sectors in most of the countries suffer
from the lack of farming efficiency and remain
below their potential.
All agricultural markets grew over the last years
despite the difficult economic environment. The
Belarussian market has grown the most by 18,2%
on average (compared to the Russian – 7,8%).
High level of regional concentration of
agricultural output is typical for Russia.
There’s been a permanent increase in production
and consumption of fresh vegetables and low-fat
meat, which reflects the preferences and
purchasing power of the population.
Food production, % of GDP
Sources: National Statistical Agencies, IMF
Development of food sales in local currencies, %
Sources: National Statistical Agencies, BMI
7,5
20,6 22,1
3,6
Russia Ukraine Belarus Kazakhstan
11
6
31 29
9 8
22
3 5
35
12
7 5
15 15
12
9
14 11
10
Russia Ukraine Belarus Kazakhstan
2013 2014 2015 2016 2017
Executive Summary (2)

5 accounting | ERP | import | legal | tax
Average subsistence minimum, 2017
Sources: National Statistical Agencies
Executive Summary (3)
$172,2
$61,1
$158,3
$75,0
Russia Ukraine Belarus Kazakhstan
Food basket and subsistence minimum
Based on changes in economic environment
the value of consumer baskets (subsistence
minimum) and therefore food baskets is
reviewed at different time periods by the
governments and a number of regional
authorities.
Subsistence minimum is established for various
population groups. It is the highest in Russia
with more than $172 and the lowest is in
Ukraine – $61.
Russian Food Embargo
In August 2014, Russia imposed an embargo on
the import of products from the EU, the U.S. and
a number of other countries in response to the
restrictive measures applied against Russia.
Since then a significant restructuring of the
agricultural sector, including the foreign trade, in
four countries has been observed.
The agricultural legislation in all the countries is
moving towards establishment of the
comprehensible Agricultural Law. It is currently
the most complex in Ukraine (on average, 1000
regulations for the agro-industrial sector).
Milk and Cheese industry
Belarus is leading in milk and cheese production,
import and export among all four countries.
The highest prices for milk and cheese through
the years remain in Russia.
The highest per capita milk and cheese
consuming countries are Belarus and Russia.
The markets are quite concentrated. Usually,
there are 5-7 leaders controlling more than 50%
of the market.

Chances and Opportunities (1)
Russia
Russia is a major market with 146,8mn inhabitants, of which 74%
live in cities and towns and 26% live in rural areas.
77mn people are working-age (aged 15-72).
Average life expectancy at birth: 70,1 years.
According to OECD, 54% of those aged 25-64 have attained a
university degree.
12th largest economy in the world in 2017 measured by GDP in
real terms: USD 1 530bn.
6th largest economy in the world in 2017 measured by GDP based
on PPP valuation: USD 4 010bn.
GDP per capita in 2017 at current prices: USD 10 610 (and USD
27 830 based on PPP).
Annual progress in World Bank’s Ease of Doing Business 2018
ranking: 35th place in 2017 (2016: 40th).
Corruption Perceptions Index score (Transparency International):
29 in 2017 (2016: 29).
accounting | ERP | import | legal | tax 6
Significant opportunities
offered by the large
market
Sources: Russian Ministry of Finance, National Statistical
Agencies, Central Bank, UNDP, The World Bank, IMF,
Tradingeconomics.com, own estimates
Average exchange rates were used.
Indicators 2017
General govt gross debt, USD bn 266,2
General govt gross debt to GDP, % 17,4%
Consumer credit, USD bn 194
Consumer credit to GDP, % 12,7%
Human Development Index (HDI) 0,804
Unemployment, % 5,2%
2032 2170 2231
2031
1326 1283
1530
2011 2012 2013 2014 2015 2016 2017f
GDP, USD bn

Chances and Opportunities (2)
Ukraine
Ukraine is a big market with 42,5mn inhabitants, of which 70% live in
cities and towns and another 30% live in rural areas.
24mn people are working-age (aged 15-70).
Average life expectancy at birth: 72 years.
According to the Ukrainian Institute of Demographics and Sociological
Research, 76% of those aged 25-64 have attained a university
degree.
62nd largest economy in the world in 2017 measured by GDP in real
terms: USD 109,3bn.
50th largest economy in the world in 2017 measured by GDP based
on PPP valuation: USD 368,8bn.
GDP per capita in 2017 at current prices: USD 2 580 (and USD 8 710
based on PPP).
Annual progress in World Bank’s Ease of Doing Business 2018
ranking: 76th place in 2017 (2016: 80th).
Corruption Perceptions Index score (Transparency International): 30
in 2017 (2016: 29).
accounting | ERP | import | legal | tax 7
A large market with great
potential
Indicators 2017
General govt gross debt, USD bn 82,4
General govt gross debt to GDP, % 75,6%
Consumer credit, USD bn 4,3
Consumer credit to GDP, % 3,9%
Human Development Index (HDI) 0,743
Unemployment, % 9,4%
Sources: IMF, UNDP, The World Bank,
Tradingeconomics.com, own estimates
Average exchange rates were used.
163 176 181
132
91 93 109
2011 2012 2013 2014 2015 2016 2017f
GDP, USD bn

Chances and Opportunities (3)
Belarus
Belarus is a major market with 9,5mn inhabitants, of which 77% live
in cities and towns and 23% live in rural areas.
7,2mn people are working-age (aged 15-72).
Average life expectancy at birth: 74,1 years.
According to OECD, 19% of those aged 25-64 have attained a
university degree.
82nd largest economy in the world in 2017 measured by GDP in
real terms: USD 54,4bn.
74th largest economy in the world in 2017 measured by GDP
based on PPP valuation: USD 178,9bn.
GDP per capita in 2017 at current prices: USD 5 760 (and
USD 18 930 based on PPP).
Annual progress in World Bank’s Ease of Doing Business 2018
ranking: 38th place in 2017 (2016: 37th).
Corruption Perceptions Index score (Transparency International):
44 in 2017 (2016: 40).
accounting | ERP | import | legal | tax 8
Indicators 2017
General govt gross debt, USD bn 27,7
General govt gross debt to GDP, % 51%
Consumer credit, USD bn 1,3
Consumer credit to GDP, % 2,4%
Human Development Index (HDI) 0,796
Unemployment, % 1%
A bridge between the EU
and the EEU
Sources: IMF, UNDP, The World Bank,
Tradingeconomics.com, own estimates
Average exchange rates were used.
59,7 63,6
73,1 76,1
54,6 47
54,4
2011 2012 2013 2014 2015 2016 2017f
GDP, USD bn

Chances and Opportunities (4)
Kazakhstan
Kazakhstan is a major market with 18mn inhabitants, of which 53%
live in cities and towns and 47% live in rural areas.
12,8mn people are working-age (aged 15-64).
Average life expectancy at birth: 72 years.
According to the CIS Interstate Statistics Committee, 34% of those
aged 25-64 have attained a university degree.
59th largest economy in the world in 2017 measured by GDP in
real terms: USD 160,8bn.
45th largest economy in the world in 2017 measured by GDP
based on PPP valuation: USD 477,6bn.
GDP per capita in 2017 at current prices: USD 8 840 (and
USD 26 250 based on PPP).
Annual progress in World Bank’s Ease of Doing Business 2018
ranking: 36th place in 2017 (2016: 35th).
Corruption Perceptions Index score (Transparency International):
31 in 2017 (2016: 29).
accounting | ERP | import | legal | tax 9
The Central Asian tiger
Indicators 2017
General govt gross debt, USD bn 34,1
General govt gross debt to GDP, % 21,2%
Consumer credit, USD bn 13,2
Consumer credit to GDP, % 8,2%
Human Development Index (HDI) 0,794
Unemployment, % 5%
Sources: Tradingeconomics.com, IMF, UNDP,
The World Bank, own estimates
Average exchange rates were used.
200 216
244 227
184
137
161
2011 2012 2013 2014 2015 2016 2017f
GDP, USD bn

General Socio-Economic Statistics (1)
Population by Age Group
10 accounting | ERP | import | legal | tax
Russia’s population age groups, % of population Ukraine’s population age groups, % of population
Belarus’s population age groups, % of population
Sources: World Bank, UN, BMI
Sources: World Bank, UN, BMI
Sources: World Bank, UN, BMI
Kazakhstan’s population age groups, % of population
Sources: World Bank, UN, BMI
16,9% 18,4%
9,7% 10,7%
45,2% 41,6%
14,3% 12,2%
13,9% 17,2%
2016 2026
>65 years
55-64 years
25-54 years
15-24 years
0-14 years
146,6m 147m
15,5% 16,3%
10,3% 9,3%
44,5% 42,4%
13,7% 13,1%
16,1% 19,0%
2016 2026
>65 years
55-64 years
25-54 years
15-24 years
0-14 years
42,5m 42,4m
15,7% 17,7%
10,7% 10,2%
45,0% 41,4%
14,0% 13,3%
14,7% 17,4%
2016 2026
>65 years
55-64 years
25-54 years
15-24 years
0-14 years
9,6m 9,2m
25,7% 27,6%
14,7% 14,1%
42,5% 40,0%
9,8% 9,7%
7,4% 8,6%
2016 2026
>65 years
55-64 years
25-54 years
15-24 years
0-14 years
17,7m 19,4m

General Socio-Economic Statistics (2)
Russia: Food Basket and Subsistence Minimum
11 accounting | ERP | import | legal | tax
Product
Average expected consumption
per capita annually, kg
Workers Retirees Children
Bread products (bread and pasta
goods in terms of flour; flour, grains,
beans)
126,5 98,2 77,6
Potatoes 100,4 80 88,1
Vegetables and melons 114,6 98 112,5
Sugar and confectionery (in
terms of sugar) 23,8 21,2 21,8
Meat products 58,6 54 44
Fish products 18,5 16 18,6
Milk and dairy products (in
terms of milk) 290 257,8 360,7
Eggs, number 210 200 201
Vegetable oil, margarine and
other fats 11 10 5
Other products (salt, tea,
spices) 4,9 4,2 3,5
Russia’s food basket establishes the thresholds
of consumption of specific products by different
population categories. They differ from one
region to another.
It is reviewed every five years and is approved
as a Federal Law.
Russia’s food basket – federal average
Source: Federal Law 227-FZ dated 03.12.2012
The food basket is part of the consumer basket,
which also includes non-food products, utilities
and services (156 lines in total).
Based on changes in prices and the economic
environment in general, the value of the
consumer basket ("subsistence minimum") is
reviewed quarterly by the federal government
and regional authorities. It is established for the
three population groups as above. This level for
Moscow was 55% higher than for the rest of the
country in 2017.
4 000
6 000
8 000
10 000
12 000
2013 2014 2015 2016 2017
Per capita
Working age
Pensioners
Children
Russia's subsistence minimum by population
group, RUB per month
Source: National Statistical Agencies

General Socio-Economic Statistics (3)
Ukraine: Food Basket and Subsistence Minimum
12 accounting | ERP | import | legal | tax
Similarly, Ukraine’s food basket establishes the
minimum expected levels of consumption of
specific products by different population
categories.
It was last reviewed in October 2016; changes
are approved as a Government Decree.
Ukraine’s food basket – average
Source: Government Decree No. 780 dated 11.10.2016
The food basket is part of the consumer
basket, which also includes non-food products,
utilities and services (296 lines in total).
The government reviews the value of the
consumer basket ("subsistence minimum") at
least once a year. It is established for the four
population groups as above.
Until 2017, the minimum wage level was very
close to that of the subsistence level. Effective
from 1 January 2017, minimum wage was
doubled.
Ukraine's subsistence minimum by population
group, UAH per month
Source: minfin.com.ua
Product
Average expected consumption
per capita annually, kg
Able to work Non-working
population
Bread and bakery 114,4 113,2
Cereals 9 10,7
Potatoes 95 108
Vegetables (including salted
and pickled) 94 83,5
Fruit and berries 80 47,3
Sugar and confectionery 37 22,5
Vegetable oil and margarine 9,1 8,2
Meat and meat products 53 38
Fish and seafood 13 11,5
Milk and dairy products 143,5 122,3
Eggs, number 220 187,5
Tea and other hot drinks 0,9 0,83
Salt and spices 3,3 2,77
800
1 000
1 200
1 400
1 600
1 800
2013 2014 2015 2016 2017
Overall
Children under 6
Children aged 6-18
Able to work
Unable to work

250
300
350
400
Jul-16 Aug/Oct-16
Nov-16/Jan-17
Feb/Apr-17
Family of 4
Young family of 3
Working population
Retired population
Students
General Socio-Economic Statistics (4)
Belarus: Food Basket and Subsistence Minimum
13 accounting | ERP | import | legal | tax
The food basket in Belarus establishes average
expected levels of consumption of specific
products by different population categories: a
family of four, a young family of three, a
working age person, a pensioner, a student, a
child under 3, a child aged 3-6 and a child aged
6-18.
Food basket in Belarus – average
Sources: Decrees of the Ministry of Labor and Social Welfare No 107 dated 29.12.2014
and No 146 dated 14.12.2009
It is reviewed every five years, previous
revision was in 2014; changes are approved as
a Decree of the Ministry of Labor and Social
Welfare.
The food basket includes more than 100 lines.
Considering price changes, the value of the
consumer basket ("minimum consumer
budget") is reviewed by the government at least
every four months. The price level of the
previous quarter is used as a basis for
calculation.
Minimum consumer budget by select population
category in Belarus, BYR per month
Source: Ministry of Labor and Social Welfare, myfin.by
Product
Average expected consumption
per capita annually, kg
Working
population Retired population
Bread and bakery 130,3 100,4
Cereals 16,1 9,5
Potatoes 124,1 91,3
Vegetables 142,5 95,1
Fruit and fruit juices 73,8 54,8
Sugar and confectionery 43,9 28,1
Vegetable oil and margarine 8,8 6,9
Meat and meat products 60,7 43,4
Fish and seafood 15,4 9,5
Milk and dairy products 152,7 151,1
Eggs, number 270,1 160,6
Tea 0,8 0,6
Salt 3,7 2,9

General Socio-Economic Statistics (5)
Kazakhstan: Food Basket and Subsistence Minimum
14 accounting | ERP | import | legal | tax
The food basket in Kazakhstan establishes the
thresholds of consumption of specific products
by different population categories: population in
general, children aged 0-13, adolescents 14-17
(boys and girls), population able to work >18
(men and women) and pensioners.
The food basket includes more than 40 lines.
Food basket in Kazakhstan – average
Source: Joint Decree of the acting Minister of Health and Social Development No. 623
dated 27.07.2015 and acting Minister of National Economy No. 585 dated 31.07.2015
The basket was last revised in 2005. A new
revision process was launched in
December 2016. The Ministry of Labor and
Social Welfare has been responsible for the
process.
Based on changes in prices and the economic
environment in general, the value of the
consumer basket ("minimum consumer
budget") is reviewed by the government at least
every year; changes are approved in the Law
on Kazakhstan’s National Budget.
Minimum consumer budget in Kazakhstan, KZT per
month
Source: Law on Kazakhstan’s National Budget for 2017-2019 No. 26-VI dated 29.11.2016
20 000
21 000
22 000
23 000
24 000
25 000
2015 2016 2017
Product
Average expected
consumption per capita
annually, kg
Working
population
Retired
population
Bread and bakery 156,37 116,65
Cereals 19,8 15,1
Potatoes 94,1 85,3
Vegetables 99,2 76,9
Fruit and fruit juices 30,1 22,8
Sugar and confectionery 22 16,6
Vegetable oil and margarine 11,32 9,26
Meat and meat products 50,5 40,6
Fish and seafood 9 7,6
Milk and dairy products 117,3 95,2
Eggs, number 147 113
Tea 0,87 0,67
Salt and spices 2,91 2,23

Role in the National Economies (1)
Key Sector Statistics 2017
accounting | ERP | import | legal | tax 15
Russia Ukraine Belarus Kazakhstan
Agricultural employment, % of
total working population 9,2% 17,6% 9,6% 16,2%
Food production employment, %
of working population 2,6% 3,6% 3,9% 3,5%
Average salary in agriculture,
USD 322 215 249 278
Average salary in food production,
USD 426 254 380 279
Food sales, USD bn 247,6 26,3 11,1 8,9
Arable land, % of land area 7,5% 56,2% 30% 10,9%
Cattle stock, thou. heads 18 644 3 628 4 188 6 745
Annual milk output, thou. tons 31 120 10 329 7 141 5 459
Sources: National Statistical Agencies, World Bank, U.S. Department of Agriculture, UN Food and Agriculture Organization,
CLAL (Italy)

Role in the National Economies (2)
Agriculture and Food Production
16 accounting | ERP | import | legal | tax
Global perspective: GVA contribution of
agriculture in certain countries in 2016, %
Sources: World Bank
In terms of the agriculture sector’s contribution
to GVA, Russia is in the group of 15 countries
(where the share is between about 4% to 5% of
GVA).
Other major emerging economies (like China,
India and Indonesia) each display a share of
more than 8% of GVA.
Food production in Ukraine and Belarus makes
about 25% of total industrial production, which
considerably exceeds these numbers for
Russia and Kazakhstan.
The highest per capita value of produced
agricultural goods is in Belarus (1 095 USD).
4,7%
13,7%
7,9%
4,8% 5,5%
17,4%
8,6%
2,4% 3,8%
14,0%
7,0%
1,6% 1,6% 1,0%
4,2% 12%
25% 25%
9%
Russia Ukraine Belarus Kazakhstan
Food production in 2016, % of total industrial
production
Sources: National Statistical Agencies
655
450
1 095
273
Russia Ukraine Belarus Kazakhstan
Food production in 2016, USD per capita
Sources: National Statistical Agencies

Role in the National Economies (3)
Agriculture: Key Facts
High level of regional concentration of
agricultural output is typical for Russia. Central,
Southern and Volga Federal Districts account
for about 70% of agricultural production.
A large number of people in Kazakhstan and
Ukraine live in rural areas, including potential
agricultural labor force (47% and 30%
respectively).
Until now, Kazakhstan’s agricultural industry
has suffered from lack of efficiency due to poor
soil quality on one hand and lack of
mechanized farming and overuse of harmful
chemicals on the other hand. At the same time
Kazakhstan’s agricultural sector is among the
world’s most promising.
Due to lack of investment, Belarussian and
Ukrainian agricultural sectors perform far
below their potential. In Belarus it is mostly
represented by state-run collective farms and a
small number of privately run farms. In Ukraine
the government is beginning to aim at
attracting foreign investment.
17 accounting | ERP | import | legal | tax
Land category, % of total land area
Ukraine is rich in black soil which is very fertile
due to humus (special organic substance).
Along with favorable climatic conditions this
makes the country very competitive in the
world of agriculture.
The level of bureaucracy in the agricultural
sector in all four countries is still very high.
An increase can be noted in the production of a
number of agricultural segments in Russia,
Belarus and Kazakhstan since 2012, as seen
below.
Sources: World Bank, UN Data
7,5
56,2
30
10,9 13,3
71,2
42,5
80,4
Russia Ukraine Belarus Kazakhstan
Arable land Agricultural land

Role in the National Economies (4)
Production of Key Agricultural Goods
Average change in production of main crops in
2012-2017, %
Average change in production of main animal goods
in 2012-2017, %
18 accounting | ERP | import | legal | tax
-110 -80 -50 -20 10 40 70 100 130
Apples
Barley
Buckwheat
Carrots
Cereals
Corn
Oats
Potatoes
Rye
Sugar beet
Tomatoes
Fresh vegetables
Wheat
Ukraine Russia Kazakhstan Belarus
-40 -20 0 20 40 60
Eggs
Beef and Veal
Poultry
Pork
Lamb
Milk
Ukraine Russia Kazakhstan Belarus
Sources: National Statistical Agencies, UN Data, FAO Sources: National Statistical Agencies, UN Data, FAO

Role in the National Economies (5)
Food Production and Consumption
Average change in consumption of some of the
products in 2013-2017, %
Average production of sugar beet, oats and
barley in Kazakhstan rose by more than 100%.
A considerable growth in wheat (94%) and corn
(86%) production has taken place in Russia. An
average decrease of up to 70% in production of
crops is seen in Belarus and Ukraine.
Most of the animal products in all the countries
showed a growth in production. There was a
considerable increase in lamb and chicken
production in Belarus (50% and 30%
respectively) and pork in Russia (30%).
Meat consumption indicated an average drop
for pork and raise for poultry in all the countries.
A considerable increase in beef and veal
consumption (76%) is seen in Belarus.
A high rise in soybean meal production has
been observed in Russia and Ukraine and in
consumption in Kazakhstan (86%, 78% and
61% respectively).
There’s been a permanent increase in
production and consumption of fresh
vegetables in all four countries starting from
1990th, which reflects the preferences and
purchasing power of the population.
19 accounting | ERP | import | legal | tax
-70 -20 30 80
Barley
Corn
Oats
Rye
Soybean Meal
Sunflowerseed Oil
Wheat
Beef and Veal
Poultry
Pork
Ukraine Russia Kazakhstan Belarus
Sources: National Statistical Agencies, UN Data, FAO

Role in the National Economies (6)
Other Foods and Drinks
The growth in production of fish (including
canned fish) since 2012 has been seen in all
four countries. The highest growth can be
noted in Kazakhstan (15%).
Total per capita consumption of alcohol
showed a considerable growth in Belarus
(28%) and a slight increase in Russia. There
was a decrease in alcohol consumption in
Kazakhstan and Ukraine.
The highest per capita consumption of
alcohol remains in Russia (107 litres).
There was a general decrease in wine
consumption in the countries. However, in
Kazakhstan it has recently shown a constant
growth (27%) despite religious views of its
population.
A considerable growth in per capita beer
consumption is seen in Belarus in 2014-2016.
There has been a general increase in non-
alcoholic drinks consumption in all the
countries.
Hot drinks such as tea and coffee account up to
76% of all non-alcoholic drinks sales in Ukraine. 20 accounting | ERP | import | legal | tax
Beer consumption per capita, litres
Non-alcohol drinks y-o-y sales growth in
national currencies, %
52,2 50,8
58,3
73,0
70,1
29,7 27,6 27,3 26,9 26,5
54,6 52,6
51,1 49,4 49,1
68,8 70,0 68,5
68,3
67,9
2013 2014 2015 2016 2017f
Belarus Kazakhstan Ukraine Russia
22,5
12,2 15
11,4
3,5
8 12,8
10,8 8
33,8
14,4 13,6
9,3
5 5,3 8,7
2014 2015 2016 2017f
Belarus Kazakhstan Ukraine Russia
Sources: National Statistical Agencies, BMI

Main Agricultural Regions (1)
Russia, 2017
21 accounting | ERP | import | legal | tax
Region name Output,
USD bn
% of
total Poultry Meat Milk
Cereals &
Leguminous Sunflower Sugar beet Vegetables Potatoes Tomatoes
Fruit &
Berries
1 Krasnodar 7,1 7,3%
2 Rostov 5 5,1%
3 Tatarstan 4,4 4,5%
4 Belgorod 3,9 4,1%
5 Stavropol 3,5 3,6%
6 Voronezh 3,4 3,5%
7 Saratov 3 3,1%
8 Bashkortostan 2,9 3%
9 Altai 2,6 2,7%
10 Volgograd 2,5 2,6%
1 2 3 4
5
6 7 8
9
10
Region name
% of total fixed
investment in
agriculture
% of region’s
total fixed
investment
Krasnodar 4,4% 8,3%
Rostov 1,9% 5,5%
Tatarstan 2,9% 5,2%
Belgorod 2,6% 17,8%
Stavropol 3,3% 25,5%
Voronezh 5,3% 17,6%
Saratov 0,7% 4,3%
Bashkortostan 1,7% 4,5%
Altai 0,8% 11,8%
Volgograd 0,7% 3,3%
Fixed investment in agriculture
Source: National Statistical Agencies, regional websites
Icons made by Smashicons, Freepik from www.flaticon.com
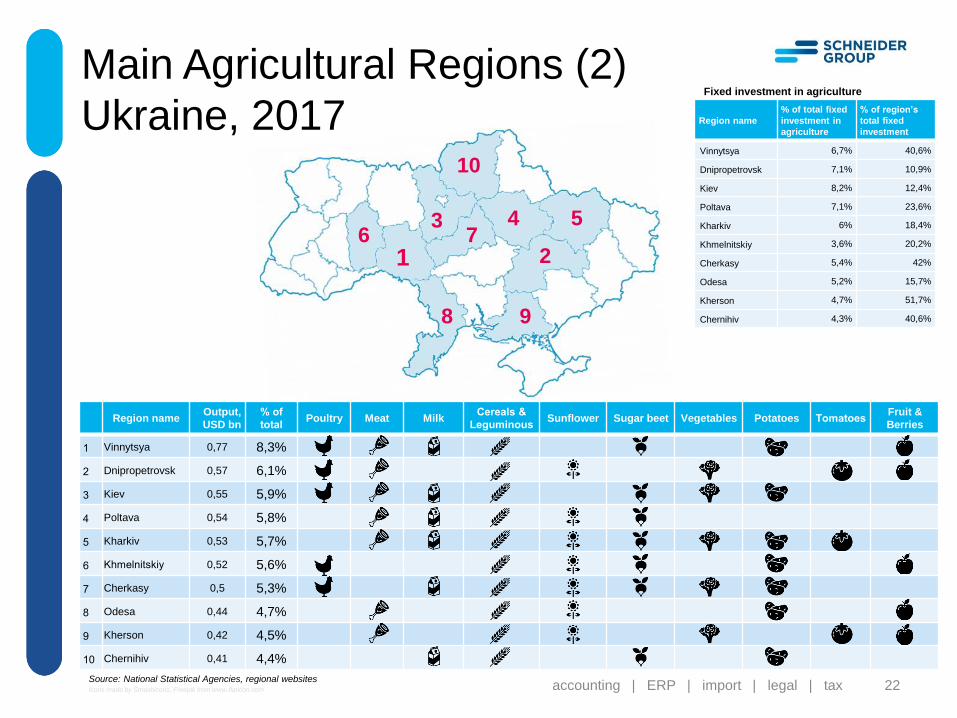
Main Agricultural Regions (2)
Ukraine, 2017
22 accounting | ERP | import | legal | tax
Region name Output,
USD bn
% of
total Poultry Meat Milk
Cereals &
Leguminous Sunflower Sugar beet Vegetables Potatoes Tomatoes
Fruit &
Berries
1 Vinnytsya 0,77 8,3%
2 Dnipropetrovsk 0,57 6,1%
3 Kiev 0,55 5,9%
4 Poltava 0,54 5,8%
5 Kharkiv 0,53 5,7%
6 Khmelnitskiy 0,52 5,6%
7 Cherkasy 0,5 5,3%
8 Odesa 0,44 4,7%
9 Kherson 0,42 4,5%
10 Chernihiv 0,41 4,4%
1 2
3 4 5 6 7
8 9
10
Region name
% of total fixed
investment in
agriculture
% of region’s
total fixed
investment
Vinnytsya 6,7% 40,6%
Dnipropetrovsk 7,1% 10,9%
Kiev 8,2% 12,4%
Poltava 7,1% 23,6%
Kharkiv 6% 18,4%
Khmelnitskiy 3,6% 20,2%
Cherkasy 5,4% 42%
Odesa 5,2% 15,7%
Kherson 4,7% 51,7%
Chernihiv 4,3% 40,6%
Fixed investment in agriculture
Source: National Statistical Agencies, regional websites Icons made by Smashicons, Freepik from www.flaticon.com

Main Agricultural Regions (3)
Belarus, 2017
23 accounting | ERP | import | legal | tax
Region name Output,
USD bn
% of
total Poultry Meat Milk
Cereals &
Leguminous Flax Rape Sugar beet Vegetables Potatoes
Fruit &
Berries
1 Minsk 2,02 24,2%
2 Brest 1,58 18,9%
3 Gomel 1,35 16,2%
4 Grodno 1,34 16,0%
5 Vitebsk 1,03 12,3%
6 Mogilev 1,02 12,2%
1
2 3
4
5
6
Region name
% of total fixed
investment in
agriculture
% of region’s
total fixed
investment
Minsk 31,1% 13,2%
Brest 17,5% 18,2%
Gomel 15,2% 11,3%
Grodno 13,9% 9,1%
Vitebsk 12,7% 14,3%
Mogilev 9,7% 13,7%
Fixed investment in agriculture
Source: National Statistical Agencies, regional websites Icons made by Smashicons, Freepik from www.flaticon.com

Main Agricultural Regions (4)
Kazakhstan, 2017
24 accounting | ERP | import | legal | tax
Region name Output,
USD bn
% of
total Poultry Meat Milk
Cereals &
Leguminous Sunflower Sugar beet Vegetables Potatoes Tomatoes
Fruit &
Berries
1 Almaty 1,99 15,8%
2 South
Kazakhstan 1,6 12,7%
3 North
Kazakhstan 1,57 12,5%
4 East Kazakhstan 1,41 11,2%
5 Akmolinsk 1,17 9,3%
6 Kostanai 1,11 8,8%
7 Zhambyl 0,78 6,2%
8 Karaganda 0,76 6%
9 Aktobe 0,62 4,9%
10 Pavlodar 0,6 4,8%
1
2
3
4 5 6
7
8 9
10
Region name
% of total fixed
investment in
agriculture
% of region’s
total fixed
investment
Almaty 12,1% 8,1%
South Kazakhstan 10,8% 7,9%
North Kazakhstan 20,5% 38,2%
East Kazakhstan 5,3% 4,2%
Akmolinsk 10,1% 13,8%
Kostanai 10,8% 19%
Zhambyl 5,5% 8,2%
Karaganda 2,7% 2,7%
Aktobe 2,9% 2,3%
Pavlodar 15,7% 11,2%
Fixed investment in agriculture
Source: National Statistical Agencies, regional websites Icons made by Smashicons, Freepik from www.flaticon.com

Agriculture and Food Foreign Trade (1)
Russia
25 accounting | ERP | import | legal | tax
Russia’s agricultural and food imports and
exports, USD bn
Sources: National Statistical Agencies ,FAO, Customs Services
22,9 21,1
24,9
16,3 17,1
20,8
2015 2016 2017
Imports
Exports
34,7% 32,8% 36,2%
17,4% 17,9%
17,1%
10,5% 11,8% 11,9%
4,8% 4,0% 3,0%
2,6% 2,6% 2,4%
2,5% 2,8% 2,4%
1,3% 1,8% 2,1% 1,4% 1,3% 1,2%
24,9% 25,0% 23,8%
2015 2016 2017
Other categories
Milk and milkproducts
Meat and meatproducts
Vegetables
Soft and alchoholdrinks
Tobacco andtobacco products
Vegetable oil
Fish and fishproducts
Cereals, incl. wheat
Russia’s agricultural and food exports,
% of total revenue
16,3bn 17,1bn 20,8bn
Main export shares in Russia are taken by
cereals and fish products (36,2% and 17,1%).
Vegetable oil share in export amounts 11,9%.
Fruit and meat remain the most imported
categories among agricultural goods both in
value and volume terms. Considerable amount
of vegetables, fish, dairy products and
drinks are also imported.
Except for animal fat, cow meat and salt, a rise
in import of main products in volume terms has
been observed compared to 2016. The highest
growth is seen in the import of prepared food
(36,6%), vegetables (36,3%) and fish (3,2
times).
Sources: National Statistical Agencies ,FAO, Customs Services

Agriculture and Food Foreign Trade (2)
Russia
26 accounting | ERP | import | legal | tax
Main food imports, thou. tons
16% 17% 18% 19%
16% 14% 10% 10%
9% 8% 9% 10%
11% 9%
9% 10%
5% 7% 8%
7%
8% 8% 6%
7%
7% 6%
6% 6%
4% 5%
5% 5%
4% 5% 5%
5%
5% 5% 5% 5%
3% 5% 5% 4%
13% 12% 12% 12%
2014 2015 2016 2017
Other categories
Tobacco and tobaccoproducts
Processed vegetables, fruit,nut products
Vegetable oils
Tea & Coffee
Fish, crustaceans andmollusks
Vegetables
Oilseeds, other seeds andgrain, straw and fodder
Milk and dairy products
Soft and alcoholic drinks
Meat and meat products
Fruit
35 063 22 888 21 098
Main food and beverage imports, USD mn
13% 15% 16% 16%
10% 12%
14% 15% 6%
9%
10% 10% 12%
10%
9% 9% 7%
7%
10% 7% 8%
8%
7% 7% 5%
5%
3% 6% 7%
5% 5%
5% 5% 5%
5% 5% 7%
6% 5% 5%
19% 16% 16% 14%
2014 2015 2016 2017
Other categories
Tomato
Milk and dairyproducts
Fish and fish products
Potato
Apples
Cereals
Meat and meatproducts
Vegetable Oils
Banana
Citrus Fruit
24 863 12 683 10 590 9 520 9 985
Source: National Statistical Agencies ,FAO, Customs Services Source: National Statistical Agencies ,FAO, Customs Services

19% 16% 17% 17%
34% 33% 33% 32%
5% 5% 6% 6%
43% 46% 44% 45%
2014 2015 2016 2017
Finished food industryproducts
Animal or plant fats andoils
Plant products
Live animals andlivestock products
6% 6% 5% 6%
52% 55% 53% 52%
23% 23% 26% 26%
19% 17% 16% 16%
2014 2015 2016 2017
Finished food industryproducts
Animal or plant fats andoils
Plant products
Live animals andlivestock products
Agriculture and Food Foreign Trade (3)
Ukraine
27 accounting | ERP | import | legal | tax
Agricultural and food exports, % of total amount
Agricultural and food imports, % of total amount
16,6bn 14,6bn 15,3bn
6,1bn 3,5bn 3,9bn
There has been a slight growth both in Ukraine’s
import and export in value terms since 2014.
The main share in Ukraine’s export through the
years has been taken by plant products.
About 26% of the country’s exported products are
animal products.
Ukrainian consumers show higher preference for
domestically produced goods.
Tea and coffee industries present major
opportunities for importers.
Ukraine tends to introduce protectionist
measures towards the local meat industry.
Ukraine’s agricultural and food imports and
exports, USD bn
16,7
14,6 15,3
17,8
6,1
3,5 3,9 4,3
2014 2015 2016 2017
Exports
Imports
17,8bn
4,3bn
Source: National Statistical Agencies ,FAO, Customs Services Source: National Statistical Agencies ,FAO, Customs Services
Source: National Statistical Agencies ,FAO, Customs Services

61% 59% 64% 63%
11% 14% 13%
11% 3% 2%
1% 2%
26% 24% 21% 24%
2014 2015 2016 2017
Prepared foodstuffs,beverages and tobaccogoods
Animal or vegetable fatsand oils
Vegetable products
Live animals and animalproducts
Agriculture and Food Foreign Trade (4)
Belarus
28 accounting | ERP | import | legal | tax
Agricultural and food exports, % of total amount
Agricultural and food imports, % of total amount
Source: National Statistical Agencies
Source: National Statistical Agencies
4,2bn 5,5bn 4,4bn
19% 11% 13% 12%
34% 50% 48% 47%
4%
3% 4% 4%
44% 36% 35% 37%
2014 2015 2016 2017
Prepared foodstuffs,beverages and tobaccogoods
Animal or vegetable fatsand oils
Vegetable products
Live animals and animalproducts
4bn 4,8bn 4,4bn
An increase has recently been observed in both
import and export of Belarus in value terms.
The main share in Belarussian import and export
through the years has been taken by vegetable
products (about 50% and 60% respectively).
More than 35% of food imported to Belarus is
prepared food.
Belarus has a strong domestic agricultural
sector that continues to grow, along with
investment in industry technologies.
Belarus’ food export sector benefits from the
restrictions concerning Russian foreign trade.
4,8bn
4,8bn
Belorussian agricultural and food imports and
exports, USD bn
4,8 4,4
4,0 4,5
5,5
4,4 4,2
4,8
2014 2015 2016 2017
Imports
Exports
Source: National Statistical Agencies , FAO

Agriculture and Food Foreign Trade (5)
Kazakhstan
29 accounting | ERP | import | legal | tax
4% 4% 4% 4%
84% 85% 87% 85%
3% 3% 3% 5% 10% 9% 6% 6%
2014 2015 2016 2017
Finished food industryproducts
Animal or plant fats andoils
Plant products
Live animals andlivestock products
Agricultural and food exports, % of total amount
Agricultural and food imports, % of total amount
Source: National Statistical Agencies
1,6bn 2,2bn 1,7bn
18% 15% 15% 17%
42% 44% 44% 45%
2% 2% 2% 2%
38% 38% 38% 37%
2014 2015 2016 2017
Finished food industryproducts
Animal or plant fats andoils
Plant products
Live animals andlivestock products
1,6bn 2,5bn 1,9bn
1,9bn
1,8bn
Source: National Statistical Agencies
A growth both in import and export has been
observed in Kazakhstan in value terms since
2016.
A large share in the country’s export through
the years has been taken by plant products
(about 85%).
Prepared food products play a considerable
role in Kazakhstan’s import sector (37%).
Food preferences of Kazakhs move towards
processed and packaged food. However, the
authorities tend to support local food
processing industry by keeping higher taxes
on imports.
Kazakhstan’s agricultural and food imports and
exports, USD bn
Source: National Statistical Agencies , FAO
2,2
1,7 1,6
1,9
2,5
1,9
1,6 1,8
2014 2015 2016 2017
Exports
Imports

Agriculture and Food Foreign Trade (6)
European Union and the USA
In August 2014, Russia imposed an embargo
on the import of products from the EU, the U.S.
and a number of other countries* in response to
the restrictive measures applied against
Russia.
Since then the recession in the Russian
economy including the agriculture and food
industry has been observed. It started to
recover slightly at the end of 2016.
There has been a significant restructuring of
the import-export sector in Russia, which has
also influenced the trade relations within the
CIS.
30 accounting | ERP | import | legal | tax
European Union Trade with Russia, Imports
in USD mn
European Union Trade with Russia, Exports
in USD mn
Sources: European Commission, National Statistical Agencies
0
200
400
600
800
1 000
1 200
2013 2014 2015 2016
Live animals; animalproducts
Vegetable products
Animal or vegetablefats and oils
Foodstuffs,beverages, tobacco
0
2 000
4 000
6 000
8 000
2013 2014 2015 2016
Live animals;animal products
Vegetableproducts
Animal orvegetable fats andoilsFoodstuffs,beverages,tobacco
U.S. Trade with Russia (Jan.-Oct.), in USD mn
Source: Ministry of Economic Development of the Russian Federation
0,00
2 000,00
4 000,00
6 000,00
8 000,00
10 000,00
12 000,00
14 000,00
2016 2017
Export
Import
*Canada, Australia, Norway, Ukraine, Albania, Montenegro, Iceland, Lichtenstein

Agriculture and Food Foreign Trade (7)
Geography of Imports, Russia
Food products with the highest share of
import to Russia from outside the CIS, 2017
Food products with the highest share of import
to Russia from the CIS, 2017
31 accounting | ERP | import | legal | tax
Belarus; 98,6%
Belarus; 54,6%
Belarus; 70,2%
Belarus; 92,0%
Belarus; 70,7%
Belarus; 83,3%
Azerbajan; 30,4%
Kazakhstan; 38,7%
98,7%
56,6%
73,6%
99,7%
75,0%
87,7%
54%
62,4%
Fresh meat
Poultry
Fish dried orsalted
Milk
Butter
Cheese
Tomatoes
Melons
Brazil; 51,3%
Brazil; 90,5%
Argentina; 40,8%
Faroe Islands; 63,9%
Faroe Islands.; 39,3%
Vietnam; 30,6%
Egypt; 58,2%
China; 30,8%
Ecuador; 96,2%
Turkey; 38,1%
Israel; 45,9%
Iran; 37,5%
China; 37,9%
Turkey; 40,3%
85,7%
97,8%
93,4%
90,5%
96,1%
99,1%
79,4%
86,4%
100%
98,9%
74,3%
65,7%
65,4%
67,8%
Frozenmeat
Pork
Meatproducts
Fresh fish
Frozen fish
Fish fillet
Potatoes
Onion
Bananas
Citrus fruit
Roots
Cucumbers
Cabbage
Grapes
Sources: National Statistical Agencies, Customs Services
Sources: National Statistical Agencies, Customs Services

Agriculture and Food Foreign Trade (8)
Geography of Imports, Belarus
32 accounting | ERP | import | legal | tax
Imports to Belarus in 2012, thou. tons Belarus Exports to Russia, thou. tons
Lithuania; 68%
Poland; 22%
Norway; 92%
Russia; 87%
Poland; 59%
Poland; 55%
Netherlands; 20%
Ukraine; 28%
0 20 40 60
Beef freshor frozen
Poultry
Fresh fish
Cheese
Cabbage
Roots
Potatoes
Tomatoes
Main countries
Total
Imports to Belarus in 2017, thou. tons
Ukraine; 98,5%
Lithuania; 24%
Norway; 88%
Russia; 80%
Poland; 52%
Netherlands; 30%
Ukraine; 56%
Turkey; 57%
0 40 80 120 160 200
Beef freshor frozen
Poultry
Fresh fish
Cheese
Cabbage
Roots
Potatoes
Tomatoes
Main countries
Total
131,9
128,0
21,1
182,0
80,6
355,1
78,6
166,1
100,6
103,9
2,4
141,9
39,0
33,6
12,5
16,2
Beef freshor frozen
Poultry
Fish driedor salted
Cheese
Tomatoes
Potatoes
Cabbage
Roots
2012
2017
Charts show the restructuring in the import-
export sector since 2012. During this period,
the total food export from Belarus to Russia has
increased by 1,7 times in volume terms.
A growth in the export of banned products
from Belarus to Russia is seen (e.g. export of
dried and salted fish, potatoes and roots has
increased by 8,8; 10,3 and 10,6 times
respectively).
Ingredients, packaging and labeling define the
market status of most of the imported products,
including those re-exported within the EEAU.
Sources: National Statistical Agencies, Customs Services
Sources: National Statistical Agencies, Customs Services Sources: National Statistical Agencies, Customs Services

Agriculture and Food Foreign Trade (9)
Sanctions Brief Overview
33 accounting | ERP | import | legal | tax
On 6 August 2014 Russian president signed a Decree № 560 "On the application of certain
special economic measures to ensure the security of the Russian Federation". The Decree
prohibits import of certain agricultural products, raw materials and foodstuffs originating from
certain countries into the territory of the Russian Federation for one year.
On 7 August 2014, Russian government issued Decision № 778 defining the list of products
banned and the countries concerned.
The list of banned products was first modified by the Russian government Decision from
20/08/2014 № 830.
The embargo was extended until 5/08/2016 by the Russian government Decision from
25/06/2015 № 625 which also modified the list of banned products.
The Decision № 625 was further modified on 27/05/2016 by means of Decision № 472 to
provide for possibility to import certain products if destined for the production of baby food.
A further prolongation of the embargo until 31/12/2017 was introduced by the Presidential
Decree № 305 from 29/06/2016.
On 30 June 2017 the validity of the embargo was again prolonged until 31/12/2018 by the
Presidential Decree № 293.
On 25 October 2017 the Russian Government with its Decree № 1292 extended the scope of
the embargo.
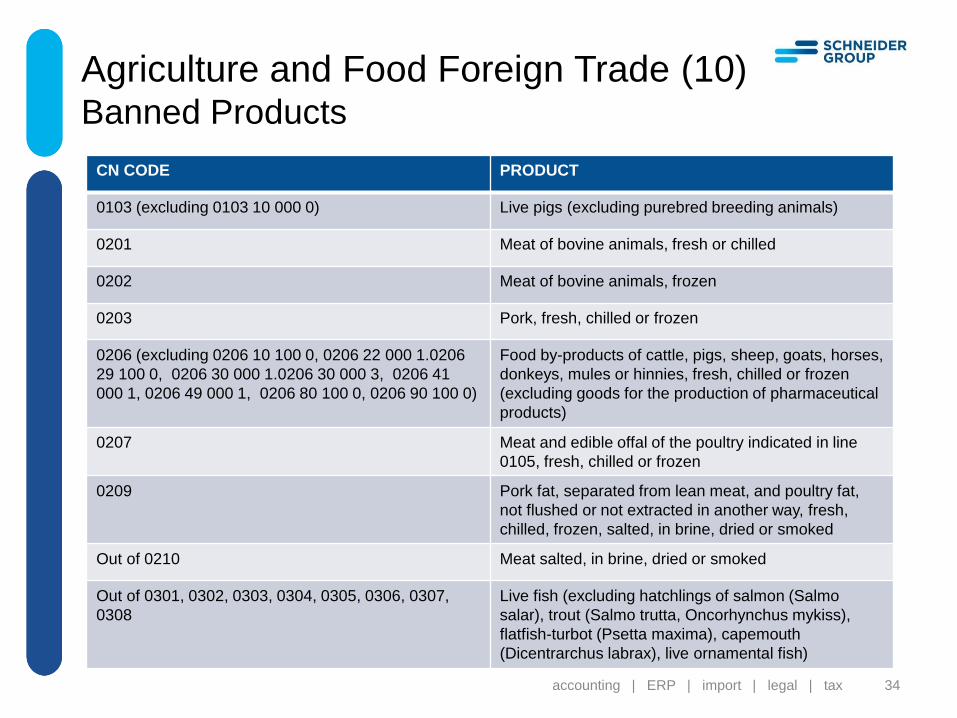
Agriculture and Food Foreign Trade (10) Banned Products
34 accounting | ERP | import | legal | tax
CN CODE PRODUCT
0103 (excluding 0103 10 000 0) Live pigs (excluding purebred breeding animals)
0201 Meat of bovine animals, fresh or chilled
0202 Meat of bovine animals, frozen
0203 Pork, fresh, chilled or frozen
0206 (excluding 0206 10 100 0, 0206 22 000 1.0206
29 100 0, 0206 30 000 1.0206 30 000 3, 0206 41
000 1, 0206 49 000 1, 0206 80 100 0, 0206 90 100 0)
Food by-products of cattle, pigs, sheep, goats, horses,
donkeys, mules or hinnies, fresh, chilled or frozen
(excluding goods for the production of pharmaceutical
products)
0207 Meat and edible offal of the poultry indicated in line
0105, fresh, chilled or frozen
0209 Pork fat, separated from lean meat, and poultry fat,
not flushed or not extracted in another way, fresh,
chilled, frozen, salted, in brine, dried or smoked
Out of 0210 Meat salted, in brine, dried or smoked
Out of 0301, 0302, 0303, 0304, 0305, 0306, 0307,
0308
Live fish (excluding hatchlings of salmon (Salmo
salar), trout (Salmo trutta, Oncorhynchus mykiss),
flatfish-turbot (Psetta maxima), capemouth
(Dicentrarchus labrax), live ornamental fish)

35 accounting | ERP | import | legal | tax
CN CODE PRODUCT
0302, 0303, 0304, 0305, out of 0306, out of 0307,
0308
Fish and crustaceans, molluscs and other aquatic
invertebrates
0401, 0402, 0403, 0404, 0405, 0406 Milk and dairy products (excluding specialised lactose
free milk and specialised lactose free dairy products
for dietary health food and dietary protective nutrition)
0701 (excluding 0701 10 000 0), 0702 00 000, 0703
(excluding 0703 10 110 0), 0704, 0705, 0706, 0707
00, 0708, 0709, 0710, 0711, 0712 (excluding 0712
90 110 0), 0713 (excluding 0713 10 100 0), 0714
Vegetables, edible roots and tubers (excluding seed
potatoes, seed onions, hybrid sweet corn seeds, pea
seeds)
0801, 0802, 0803, 0804, 0805, 0806, 0807, 0808,
0809, 0810, 0811, 0813
Fruit and nuts
1501 Pork fat (including lard) and fat Poultry, other than the
fat of heading 0209 or 1503
1502 Fat of cattle, sheep or goats, other than the fat of
heading 1503
1503 00 Lard stearin, lard-oyl, oleostearin, oleooyl and animal
oil, not emulsified or unmixed, or not prepared in any
other way
1601 00 Sausages and similar products of meat, meat offal or
blood; final food products based thereon
Agriculture and Food Foreign Trade (11)
Banned Products

36 accounting | ERP | import | legal | tax
CN CODE PRODUCT
From 1901 90 110 0, From 1901 90 910 0, From
2106 90 920 0, From 2106 90 980 4, From 2106 90
980 5, From 2106 90 980 9
Food stuff and finished products (excluding BADs);
vitamin-mineral complexes, flavor additives; protein
concentrates (of animal and plant origin) and their
mixtures; food fibre; food additives (including complex
additives)
From 1901 90 990 0 Food stuffs and finished products manufactured on
the basis of the cheese production technologies and
containing 1.5 % or more of milk fat
From 2501 00 Salt
Agriculture and Food Foreign Trade (11)
Banned Products

Key Regulations in Agriculture (1)
Ukraine The agrarian sector is one of the main budget-forming sectors of the national economy. Its special role is mostly defined by the favorable natural and climatic conditions and its geographical location. In general, the agrarian legislation in Ukraine is characterized by:
an excessive number of normative legal acts, different in their legal force;
unsystematic inclusion of agrarian and legal norms in laws;
the large proportion of regulations that often contradict or duplicate the previously adopted normative acts, which gives ground for their double interpretation and application.
On average there are more than 1000 regulations for the agro-industrial complex in Ukraine. The Constitution of Ukraine forms a framework for the development of agrarian law. It recognized the land, its subsoil, water and other natural resources as objects of the property right of the Ukrainian people.
Ukrainian legislation stipulated legal restrictions on operations for the sale and purchase of agricultural lands. State registration is required even if it concerns agricultural tenancy.
The established in the Art. 13, 14 of the Constitution land competences are specified in the Land Code of Ukraine (25 October, 2001).
Important laws in the regulation of agrarian relations:
"On the state agrarian policy framework for the period until 2015" from October 18, 2005 (on 21 March, 2018 the Verkhovna Rada of Ukraine registered a draft Law "On the framework of the state agrarian policy and state policy of rural development", №8171);
"On the priority of the social development of the village and agro-Industrial complex in the National Economy" from October 17, 1991;
"On the farm" from June 19, 2003
"On the privatization of property in the agro-industrial complex" from July 10, 1996
"On Fixed Agricultural Tax" from December 17, 1998
"On seeds and garden material", from December 26, 2002;
"On the livestock breeding" from December 21, 1999;
"On the agricultural output wholesale markets" from June 25, 2009; etc.
37 accounting | ERP | import | legal | tax

Key Regulations in Agriculture (2)
Belarus The main direction of the agrarian legislation
development is defined in the "Concept for the
Improvement of the Legislation of the Republic of
Belarus, approved by the Decree of the President
of the Republic of Belarus" on 10 April 2002
№205, as well as the "State Program for
Development of Agricultural Business in the
Republic of Belarus for 2016-2020", approved by
the government Resolution №196 from 11 March,
2016.
Basic normative acts regulating relations in the
sphere of agriculture:
The Law of the Republic of Belarus from
February 18, 1991 "On the Farm Economy";
The Law of the Republic of Belarus from
December 2, 1994 "On the veterinary";
The Law of the Republic of Belarus from
September 28, 1994 "On breeding in animal
husbandry";
The Law of the Republic of Belarus from
February 14, 1997 "On Seeds";
The Law of the Republic of Belarus from
December 25, 2005 "On Plant Protection";
The Law of the Republic of Belarus from
August 5, 2009 "On Land Reclamation";
The Decree of the President of the Republic of
Belarus from July 13, 1999 №27 "On the
introduction of a single tax for producers of
agricultural products";
The Decree of the President of the Republic of
Belarus from January 27, 2003 №40 "On the
management improvement of the
organizations of agro-industrial complex";
The Land Code of the Republic of Belarus,
2008;
The Water Code of the Republic of Belarus,
1998;
The Forest Code of the Republic of Belarus,
2000; etc.
It is worth noting that land purchase and leasing
procedure is strictly governed by a number of
legal acts, including Decrees of the President.
According to the rules, land plots are provided to
foreign entities under the results of the auction
and only via leasing, unless the investment
agreement provides for otherwise.
38 accounting | ERP | import | legal | tax

Key Regulations in Agriculture (3)
Kazakhstan Over the past years, the Parliament of
Kazakhstan has adopted more than 30 laws,
including the Farm Law, regulating relations in
the agrarian sector. Private ownership of
agricultural land has been introduced. The
agrarian legislation of Kazakhstan is based on
the Constitution of the Republic of Kazakhstan,
international norms and standards. The land is
state owned. Kazakh non-state companies may
privately own land plots granted for agricultural
commodity production. However, the right of
permanent land use cannot belong to foreign
land users.
Among the main legislative acts can be identified:
The Law of the Republic of Kazakhstan "On
state regulation of the development of the
agro-industrial complex and rural areas" (July
8, 2005);
The Law of the Republic of Kazakhstan "On
the farm economy" (March 31, 1998);
The Law of the Republic of Kazakhstan "On
agricultural partnerships and their associations
(unions)" (December 25, 2000);
Kazakhstan 2050" Strategy;
"The Law of the Republic of Kazakhstan "On Grain" (January 19, 2001);
The Law of the Republic of Kazakhstan "On Seed Production" (February 8, 2003);
The Law of the Republic of Kazakhstan "On the Protection of Selection Achievements" (June 13, 1999);
The Law of the Republic of Kazakhstan "On the Development of the Cotton Industry" (July 21, 2007);
The Law of the Republic of Kazakhstan "On livestock breeding" (9 July 1998);
The Law of the Republic of Kazakhstan "On Veterinary Medicine" (July 10, 2002);
Regulations on the procedure and conditions for the organization of leasing in agriculture, approved by the Government of the Republic of Kazakhstan (1998);
"The cotton market monitoring rules", approved by the order of the Minister of Agriculture of the Republic of Kazakhstan (October 3, 2007);
The Development Program "Agribusiness 2020";
The Law of the Republic of Kazakhstan from 29 October, 2015 "On Agricultural Cooperatives", etc.
39 accounting | ERP | import | legal | tax

Special Focus:
Milk and Cheese Industry

300
500
700
900
1100
1300
1500
2013 2014 2015 2016 2017
Russia Ukraine Belarus Kazakhstan
Milk and Cheese Industry: Key Indices (1)
41 accounting | ERP | import | legal | tax
Average price of milk, USD per ton
Milk and milk products consumption, kg per capita
Source: United States Department of Agriculture, BMI, National Statistical Agencies
150
180
210
240
270
300
2012 2013 2014 2015 2016
Russia Ukraine Belarus Kazakhstan
Milk production, kg per capita
150
250
350
450
550
650
750
2013 2014 2015 2016 2017
Russia Ukraine Belarus Kazakhstan
Charts show changes in Milk and Cheese
industry over a five-year period.
In general, there has been an increase in price
of milk and milk products, as well as all
categories of cheese in recent years.
Milk and cheese production in Belarus
considerably exceeds its consumption in the
country.
There has been a general decrease in milk and
cheese import in all four countries.
A growth in cheese production, consumption
and export has been observed in Belarus.
Source: Euromonitor, National Statistical Agencies

4,00
6,00
8,00
10,00
12,00
14,00
16,00
2013 2014 2015 2016 2017
Russia, Processed Cheese Russia, Hard Cheese
Russia, Soft Cheese Ukraine, Processed Cheese
Ukraine, Hard Cheese Ukraine, Soft Cheese
Belarus, Processed Cheese Belarus, Hard Cheese
Belarus, Soft Cheese Kazakhstan, Processed Cheese
Kazakhstan, Hard Cheese Kazakhstan, Soft Cheese
Milk and Cheese Industry: Key Indices (2)
42 accounting | ERP | import | legal | tax
Average price of cheese, USD per kilo
Source: Euromonitor, National Statistical Agencies
1
2
3
4
5
6
7
8
9
2013 2014 2015 2016 2017
Russia Ukraine Belarus Kazakhstan
Cheese consumption, kg per capita
Source: United States Department of Agriculture, BMI, National Statistical Agencies
Cheese production, kg per capita
0
5
10
15
20
25
2013 2014 2015 2016 2017
Russia Ukraine Belarus Kazakhstan

0
100
200
300
400
500
2013 2014 2015 2016 2017
Russia Ukraine Belarus Kazakhstan
0
50
100
150
200
250
300
350
2013 2014 2015 2016 2017
Russia Ukraine Belarus Kazakhstan
Milk and Cheese Industry
Imports and Exports
43 accounting | ERP | import | legal | tax
Milk import, thou. tons
43
Milk export, thou. tons
Source: UNdata, National Statistical Agencies
0
100
200
300
400
500
2013 2014 2015 2016 2017
Russia, Import Russia, Export
Belarus, Import Belarus, Export
Cheese import and export, Russia and Belarus,
thou. tons
Cheese import and export, Ukraine and
Kazakhstan, thou. tons
0
10
20
30
40
50
60
70
2013 2014 2015 2016 2017
Ukraine, Import Ukraine, Export
Kazakhstan, Import Kazakhstan, Export
Source: UNdata, National Statistical Agencies

28
23 4 4 3
38
Danone RussiaGroup of Cos
Wimm-Bill-DannProdukty Pitania OJSC
Molvest CJSC
Magnit PJSC
Pyaterochka OJSC
Other compamies
Milk Industry: Top 5 Players
Market Share in 2017, %
44 accounting | ERP | import | legal | tax
Russia
Source: Euromonitor, National Statistical Agencies
Kazakhstan Ukraine
Belarus
13,1
10,2
7,7
6,7 5,3
57
Savushkin ProduktOJSC
Minskiy MolochniyZavod N 1 OJSC
Unimilk PruzhanyJLLC(Danone)Babushkina KrynkaOJSC
Molochny GostinetsSOE
Other companies
17,8
11,8
10,6
9,4 9,2
41,2
Agroprodukt Asia LLP
Food Master JSC
Raimbek Agro LLP
Wimm-Bill-Dann ProduktyPitania OJSC
RG Brands JSC
Other companies
23,3
16,2
8,4 5,7 4,7
41,7
Lustdorf TOV
Molochny Alliance ZAT
Danone TOV
Wimm-Bill-Dann UkrainePAT
Bilotserkivskiy MolochniyKombinat TOV
Other companies
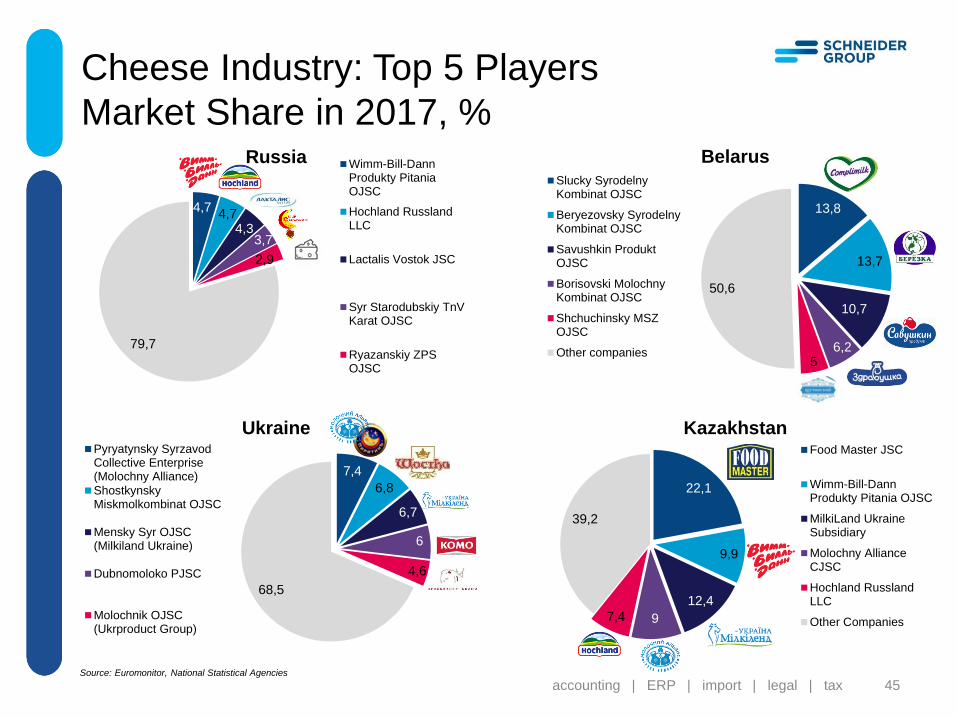
Belarus
13,8
13,7
10,7
6,2 5
50,6
Slucky SyrodelnyKombinat OJSC
Beryezovsky SyrodelnyKombinat OJSC
Savushkin ProduktOJSC
Borisovski MolochnyKombinat OJSC
Shchuchinsky MSZOJSC
Other companies
4,7 4,7
4,3 3,7
2,9
79,7
Wimm-Bill-DannProdukty PitaniaOJSC
Hochland RusslandLLC
Lactalis Vostok JSC
Syr Starodubskiy TnVKarat OJSC
Ryazanskiy ZPSOJSC
45 accounting | ERP | import | legal | tax
Cheese Industry: Top 5 Players
Market Share in 2017, % Russia
Ukraine
22,1
9,9
12,4
9 7,4
39,2
Food Master JSC
Wimm-Bill-DannProdukty Pitania OJSC
MilkiLand UkraineSubsidiary
Molochny AllianceCJSC
Hochland RusslandLLC
Other Companies
Kazakhstan
7,4
6,8
6,7
6
4,6
68,5
Pyryatynsky SyrzavodCollective Enterprise(Molochny Alliance)
ShostkynskyMiskmolkombinat OJSC
Mensky Syr OJSC(Milkiland Ukraine)
Dubnomoloko PJSC
Molochnik OJSC(Ukrproduct Group)
Source: Euromonitor, National Statistical Agencies

46 accounting | ERP | import | legal | tax
The exclusive right to the content of this presentation including the rights of translation, reproduction, transmittal,
distribution and usage of the presentation and parts of it, in any way, as well as the rights to the company’s logo and
name SCHNEIDER GROUP, in existing and future publications in printed or electronic form, and the ability to confer
rights to a third party belong to SCHNEIDER GROUP.
The reproduction, alteration, transmittal or any distribution or usage of this presentation or parts of it, as well as of
the company’s logo or name SCHNEIDER GROUP in any way, need the written permission of SCHNEIDER
GROUP in advance and shall be accompanied with the link to the SCHNEIDER GROUP website and reference to
the copyright permission. © SCHNEIDER GROUP www.schneider-group.com
Market Research Department
Christoph Spank
Market Research Team Leader
Tatiana Bibikova
Market Research Analyst
Taisiya Filina
Junior Project Manager
Maria Samundjan
Senior Project Manager
Arianna Manili
Trainee
Nikita Kolomiez
Trainee

www.schneider-group.com
accounting | ERP | import | legal | tax
russia
ukraine
belarus
kazakhstan
germany
poland
47 accounting | ERP | import | legal | tax