Life-Satisfaction in Post-Soviet Russia and Ukraine
37
PAMELA ABBOTT and ROGER SAPSFORD LIFE-SATISFACTION IN POST-SOVIET RUSSIA AND UKRAINE ABSTRACT. This paper fills a gap in the literature by looking at influences on the well-being of the citizens of Russia and Ukraine in the context of the triple shock – economic, political and social – that they experienced after 1991. The paper argues that lived experience – how people evaluate their living conditions – is as significant an influence on the welfare of citizens as are the actual conditions in which they live. The majority of the populations perceive the post-1991 economic and political changes negatively, and levels of general satisfaction and happiness are comparatively low. The findings suggest that objective economic factors, geographical/social location, health status and social context influence well-being, but also personal control and satisfaction with material circumstances, with health having a greater influence on happi- ness, while material circumstances and the evaluation of them have a greater influence on general satisfaction. The paper concludes by arguing for a model of reciprocal causation in which material factors provide the partially determining context for actions and are themselves influenced by happiness and satisfaction. INTRODUCTION There is incontrovertible evidence that the social, political and economic changes in Russia and the Commonwealth of Inde- pendent States (CIS) after the fall of communism in 1991 have had a dramatically negative impact on the welfare of the popu- lations (Alexander, 1997; Yanitsky, 2000). Most dramatically this has been evidenced by the decline in life expectancy – especially of men in mid-life (e.g. Abbott, unpublished report; Cockerham, 1999; Rose, 2003). There is also evidence of a neg- ative impact of the transition on the daily lives of those who have survived, although much of this evidence relates to Russia (e.g. Abbott and Wallace, 2004; Burawoy, 1997; Burawoy et al., ND; Fehey and Smyth, 2004; Veenhoven, 2001). Journal of Happiness Studies (2006) 7:251–287 Ó Springer 2006 DOI 10.1007/s10902-005-5563-2
-
Upload
independent -
Category
Documents
-
view
2 -
download
0
Transcript of Life-Satisfaction in Post-Soviet Russia and Ukraine
PAMELA ABBOTT and ROGER SAPSFORD
LIFE-SATISFACTION IN POST-SOVIET RUSSIA
AND UKRAINE
ABSTRACT. This paper fills a gap in the literature by looking at influences onthe well-being of the citizens of Russia and Ukraine in the context of the tripleshock – economic, political and social – that they experienced after 1991.The paper argues that lived experience – how people evaluate their livingconditions – is as significant an influence on the welfare of citizens as are theactual conditions in which they live. The majority of the populations perceivethe post-1991 economic and political changes negatively, and levels of generalsatisfaction and happiness are comparatively low. The findings suggest thatobjective economic factors, geographical/social location, health status andsocial context influence well-being, but also personal control and satisfactionwith material circumstances, with health having a greater influence on happi-ness, while material circumstances and the evaluation of them have a greaterinfluence on general satisfaction. The paper concludes by arguing for a model ofreciprocal causation in which material factors provide the partially determiningcontext for actions and are themselves influenced by happiness and satisfaction.
INTRODUCTION
There is incontrovertible evidence that the social, political andeconomic changes in Russia and the Commonwealth of Inde-pendent States (CIS) after the fall of communism in 1991 havehad a dramatically negative impact on the welfare of the popu-lations (Alexander, 1997; Yanitsky, 2000). Most dramaticallythis has been evidenced by the decline in life expectancy –especially of men in mid-life (e.g. Abbott, unpublished report;Cockerham, 1999; Rose, 2003). There is also evidence of a neg-ative impact of the transition on the daily lives of those whohave survived, although much of this evidence relates to Russia(e.g. Abbott and Wallace, 2004; Burawoy, 1997; Burawoy et al.,ND; Fehey and Smyth, 2004; Veenhoven, 2001).
Journal of Happiness Studies (2006) 7:251–287 � Springer 2006DOI 10.1007/s10902-005-5563-2
Much less is known about the impact of the transition on thewell-being of those who have survived in other CIS countries,including the Ukraine. This paper considers the influences ofthese changes in Ukraine and Russia, recognising that we can-not assume that the change is experienced in the same ways indifferent places (Popay et al., 2003).
The context of the lives of the peoples of Ukraine and Russiahas undergone a triple transformation since the breakup of theformer Soviet Union, the formation of nation states, the col-lapse of the non-market command economy and introduction ofelements of a market economy (including employment insecurityand market prices) and the collapse of a social structure. Thesechanges have been accompanied by a deep economic depressionresulting in a decline in GDP, hyperinflation, an increase in eco-nomic inequalities, an increase in poverty and unemploymentand a decline in state spending with a resultant reduction in orloss of many welfare benefits. These have resulted in whatSztompka (2002) has referred to as cultural trauma – a societywhere there has been a breakdown of social trust and a loss ofa sense of agency. Insecurity and uncertainty have become anormal experience of daily life for many citizens, providing aclassic example of an anomic society (Durkheim, 1952). Thedislocation in the social structure has resulted in a breakdownin the normative patterns that define the expectation of actors,in the patters of social relationships between actors, and in theembodied perceptions, habits and skills by which people pro-duce and reproduce institutional and related structures. It is notonly that structural change means that people’s life chanceshave been transformed (and, for many, for the worse), but sohave their understandings of how to make life choices and theirability actually to do so; culturally shared templates are nolonger appropriate for guiding behaviours in the changed socio-economic and cultural contexts (Sztompka, 2002).
Thus a fuller understanding of the impact of the triple shocksafter 1991 requires an analysis of the ways in which the changehas been interpreted and its impact on the agency of citizens. Thismeans going beyond the impact of the economic changes; theability to cope in the new situation, to maintain an acceptable
PAMELA ABBOTT AND ROGER SAPSFORD252
standard of living and secure a sense of well-being is influenced bymany factors beyond measurable financial security (Orlova andRonnes, 1999). It also means going beyond a description of objec-tive living conditions and taking account of the subjective under-standing by citizens of their life situation and the extent to whichthey feel able to make the necessary choices in order to act tosecure their well-being – to choose a style of life they value. Inother words, we need to understand the lived experience of citi-zens. Welfare is about functioning – about the actual socio-eco-nomic circumstances of individuals, about entitlement,opportunities and rights and the ability of citizens to make posi-tive choices to achieve collectively valued goals in their society(Abbott and Wallace, 2004; Allart, 1993; Beck et al., 2001; Del-hey, 2004; Donovan and Halpern, 2002; Fehey and Smyth, 2004;Sen, 1993; Veenhoven, 2002).
There is a long history of mainly social psychologicalresearch on life satisfaction or subjective quality of life:
Subjective quality of life is the sum of people’s experiences of opportuni-ties open to them and the actual choices they make and the life resultsthey achieve within their social context (Sen, 1993).
The research has been concerned with analysing people’sreports of ‘‘happiness’’ (which is generally seen as an indicatorof emotion or mood) and ‘‘general satisfaction with life’’ (whichis generally taken as an indicator of people’s cognitive evalua-tion of their circumstances) – see Delhey (2004: 2). Much of theresearch has been experimental, and all of it involves question-naire (self-report) measures of subjective well-being. There isalways a worry with such research that the key construct issomething literally ‘‘constructed’’ rather than being of substan-tive significance to the informants themselves, but the previousresearch suggests that this is not the case here. Happiness is nota researchers’ construct, but something about which peoplethemselves think often and to considerable purpose (Veenhoven,1991). Subjective well-being is also an internally consistent andrelatively stable construct – not just the reflection of immediateaffect – but not so stable as to suggest that the scales measurepurely an invariant trait of persons (Veenhoven, 1991; Freedmanand Shaver, 1975) – and there is evidence that it does reflect
LIFE-SATISFACTION IN POST-SOVIET RUSSIA AND UKRAINE 253
surrounding circumstances in that it tends to be lower in de-prived third-world countries than in the more affluent West(Larson et al., 1985; Veenhoven, 1984).
However, to relate agency interpretably to social and mate-rial structures we need to take a more sociological approachand go beyond considering people’s happiness or satisfactionwith their life as a whole, and beyond particular domains ofsatisfaction, to consider the relationship between objective con-ditions, the subjective evaluation of them (Schutz, 2000), andthe impact this has on peoples’ ability to take control of theirlives. The developing Social Quality approach (Beck et al.,2001; van der Maesen et al., 2002) provides such a framework.Social Quality defines the space within which, citizens
are able to participate in the social and economic life of their communitiesunder conditions which enhance their well-being and individual potential(Beck, 2001).
The Social Quality model identifies four domains or areas –economic security, social cohesion, social inclusion and culturalempowerment. To understand the extent to which people areable to, and do, exercise agency to achieve social well-being, weneed to consider the articulation between the objective socialstructures they inhabit and the agency they can and do exercise.Life choices are related to life chances; the structures we inhabitconstrain and control the extent to which and the ways inwhich we can exercise agency.
The available research on general satisfaction in Eastern andCentral Europe indicates not only that there has been a declinein general happiness and satisfaction since 1991, but also thatthere is good reason for this decline to have taken place(Delhey, 2004; Veenhoven, 2001). In these countries the mainindicators influencing individuals’ evaluation of their generalsatisfaction in life is their satisfaction with their materialcircumstances and their actual material situation (with employ-ment status, work satisfaction, general trust, governance, per-sonal control, age, family life, health and social life variouslyreported as having some influence – see Delhey, 2004; Donovanand Halpern, 2002; Fehey and Smyth, 2004). In other words, inevaluating their satisfaction with their material circumstances
PAMELA ABBOTT AND ROGER SAPSFORD254

people are strongly influenced by their actual material situation.This challenges the view that general satisfaction (and domainsatisfaction measures) measure a psychological trait – that is,that the measure differentiates people who are generally satisfiedwith life from those who are not, rather than being a proxy forpeople’s actual life situation. There is evidence, however, thatwhile actual economic circumstances influencing general satis-faction, satisfaction with economic circumstances also has aninfluence even after controlling for actual circumstances (Saris,2001; Schyns, 2001). It appears almost self-evident, after all,that people’s lived experience of their situation will influence theextent to which they are able to exercise agency to secure theirwelfare over and above the influence of their objective situation.Social change impacts differentially not just on individuals buton social groups who are not all equally sensitive to the nega-tive impact of the dramatic changes that have taken place inpost-Soviet societies. Some groups will welcome them and expe-rience them as a positive opportunity to improve their welfare;for others they will be largely irrelevant; but for the majoritythey will be experienced negatively and will reduce their abilityto act to maintain their welfare. Differential ability to cope willbe influenced by the social, economic and cultural resources onwhich citizens are able to draw in the changed and changing sit-uation – for example, material resources, social support,cultural capital and health – but also by their evaluation ofwhat is available to them.
This paper builds on insights from existing research and con-siders which of a range of factors have an influence on well-being in Ukraine and Russia, in order to cast further light onthe differential impact of the transition on post-Soviet citizens.We will consider separately the influences on happiness andgeneral satisfaction to determine the extent to which the samefactors influence them. We will then combine happiness andgeneral satisfaction to provide a Well-Being Index and considerwhat the main influences are on this combined measure. Toavoid the possibility that the main influence on the generic mea-sures is domain satisfactions, objective as well as subjectivemeasures will be used. However, it should be noted that, with
LIFE-SATISFACTION IN POST-SOVIET RUSSIA AND UKRAINE 255

the exception of country-level measures such as GDP, Qualityof Life Years Adjusted, average life expectancy and so on, mostof the so-called objective indicators are based on self-reports ofincome, health, membership of organisations, support fromfamily and friends and so on. We are therefore talking about arange of indicators that go from more or less objective indica-tors to generic subjective ones. The indicators included arethose that have been shown to have an influence in previous –research or are derived from theory – age, gender, education,material circumstances, social context (social cohesion andsocial inclusion), personal control, health (taken as a resource)and satisfaction with the material, security and health domains.
METHODS
The Living Conditions, Lifestyles and Health Project is amult-level study of how the health of the populations in Armenia,Russia, Belarus, Georgia, Moldova, Kyrgyzstan, Kazakhstan andUkraine has been affected by a number of factors, includingsocio-economic conditions, cultural and ethnic factors, psychoso-cial factors and lifestyle generally. The survey was carried out inthe Autumn of 2001 using face-to-face interviews by organisa-tions with experience in survey research and covered a representa-tive sample of the adult population aged 18 and over. Sampleswere selected using multi-stage sampling with stratification byregion and area (see Pomerleau et al., 2002). The sample size was4000 in Russia and 2500 in Ukraine. The response rate was 76%in Ukraine and 73% in Russia.
To determine the influences on general satisfaction, happinessand life satisfaction a series of linear regressions were carriedout. Three dependent variables were used in the regression anal-yses:
1. General satisfaction – the responses to the question howsatisfied are you all things considered with your life as awhole these days – (1) definitely satisfied, (2) quite satisfied,(3) rather dissatisfied or (4) definitely dissatisfied?
2. Happiness – the responses to the question Taking all thingstogether, how would you say things are these days – would
PAMELA ABBOTT AND ROGER SAPSFORD256

you say you are (1) very happy, (2) pretty happy, (3) nottoo happy, (4) very unhappy?
3. An index computed from the happiness and general satis-faction variables (see Appendix 1).
Seven blocks of independent variables were used (see Tables 6–11below) –
• ‘‘biological’’ (age and gender),• human capital (education and employment),• material circumstances (economic situation, inability to
afford basic food and lack of basic amenities),• social context (variables measuring personal support, social
engagement and trust),• social control and choice,• health (self-reported health, limiting long-term illness and
psychosocial health) and• domain satisfactions (with own income, household finances,
health, political situation and neighbourhood security).
Nine of the independent variables were scales/indexes computedto summarise a number of related questions (social resource,personal support, trust in government, trust in institutions, free-dom, personal control, psychosocial health, basic amenities – seeAppendix 1). Given the need to consider the multiple influenceson the dependent variable and to consider the influence ofdomain satisfactions separately from the more objective indica-tors, a series of linear block regressions was carried out for eachset of indicators. We also tested theoretical models of influence:Model 1 included the biological, human capital, material circum-stances, social context and social control variables, Model 2added the health variables, and Model 3 included all the inde-pendent variables.
Well-being is not a well-defined concept, and it is possiblethat measures of happiness, general satisfaction and health aretapping into the same underlying construct. Given this possibil-ity, it is important to be certain that the questions on heath andgeneral satisfaction/happiness are not measuring the sameunderlying construct, and indeed that none of them is justproxy measure for another. There is a positive correlation
LIFE-SATISFACTION IN POST-SOVIET RUSSIA AND UKRAINE 257

between happiness and general satisfaction for both men andwomen in both countries – 0.42 for men and 0.51 for women inRussia, and 0.46 and 0.48 respectively in Ukraine. General sat-isfaction and self-rated health are positively correlated but thecorrelations are relatively low – in Ukraine, 0.31 for men and0.38 for women, and in Russia 0.24 for men and 0.35 forwomen. The correlations between happiness on the one handand self-reported health and satisfaction with health on theother were higher than with general satisfaction. The highestcorrelation, at 0.47, is between self-rated health and happinessfor women in Ukraine, and the lowest (0.33) is between satisfac-tion with health and happiness for men in Russia. The domainsof satisfaction (excluding happiness and general satisfactionfrom the analysis) fall into five distinct factors in Ukraine andsix in Russia: political satisfaction (as two factors in Russia andone in Ukraine), satisfaction with work and education, satisfac-tion with the environment, satisfaction with economic circum-stances, satisfaction with health, and satisfaction with services.When general satisfaction and happiness are included in theanalysis, happiness loads with health to form a new separatefactor while ‘‘self-reported financial circumstances’’ tends toload with both the new factor (0.5 for Russia and 0.48 forUkraine) and financial satisfaction (0.51 for Russia and 0.52 forUkraine). When general satisfaction, happiness, satisfactionwith health, satisfaction with household financial circumstances,self-reported health and self-reported financial circumstances areentered they form two factors; self-reported financial circum-stances, satisfaction with household financial circumstances andgeneral satisfaction load together, and satisfaction with healthand self-reported health load together. Happiness does not loadclearly on either factor. Thus health, happiness and generalsatisfaction are related, but the questions are not measuring anidentical underlying construct.
SURVIVING THE TRANSITION
There is clear evidence of the impact of the transition on theliving conditions of the citizens of Ukraine and Russia. The
PAMELA ABBOTT AND ROGER SAPSFORD258

Human Development Index is one frequently used objectivemeasure of quality of life. On this index there has been adecline in quality of life in both Russia and Ukraine. In 1991(based on 1985–1990 data) the USSR was in 31st place on theindex and was amongst the most developed nations (WorldBank, 1991); by 2003, based on 2001 data, Russia was in 63rdand Ukraine in 75th place, and both were placed among themedium-developed nations (World Bank, 2003). There has beena significant decline in GDP; taking 1989 as 100, GDP in 2001was 0.63 in Ukraine and 0.71 in Russia. Just under a quarter ofUkrainians (23.7%) and a quarter of Russians live below the$2-a-day poverty line, and 63% and 50.3% respectively belowthe $4-a-day line. There was a decline in life expectancy in bothcountries for men and women in the 1990s; while this down-ward trend had been reversed by the mid-1990s, average lifeexpectancy by 2001 was still below that of 1991, most notablyfor men (Abbott, unpublished report; Redmond, 2002).
A majority of respondents to our survey interpreted the post-1991 changes as having had a negative impact on their societyand their own lives. For example, 83% of respondents inUkraine and 78% in Russia thought that the disintegration ofthe USSR had had a negative impact on the economy of theircountry. While a majority rated the economy in the time of theUSSR highly or fairly highly (73.4% in Ukraine, 61.3% in Rus-sia) and also the government of that time (62.5% and 54.7%respectively), few do so today (3.1% and 3.9% respectively inUkraine and 10.9% and 17.2% in Russia). Well over threequarters think the transition has had a negative impact onhealth (81.6% and 85.2%). Perhaps most tellingly of all, onlyjust over a third of Ukrainians (38.5%) and Russians (37.1%)are definitely opposed to a return to communism.
The reported current material circumstances of our respon-dents suggest high levels of poverty, with only a small minority(4.6% in Ukraine, 8.5% in Russia) reporting the economic cir-cumstances of their household as good. Less than a third saidthey could afford to buy major consumer items such as a car(20.6% in Ukraine, 29.6% in Russia) and two thirds ofUkrainians (67.3%) and over 40% of Russians (43.4%) said
LIFE-SATISFACTION IN POST-SOVIET RUSSIA AND UKRAINE 259

that they could never afford to go to the cinema or theatre.Two thirds of the respondents in Ukraine (67%) and just undera half of the Russians (47.5%) reported having to do withoutbasic food (bread, sugar, milk) at least some of the time, andnearly two thirds of Russians (63.8%) and three quarters ofUkrainians said they could not always afford to buy essentialclothing. Over half of Russians (51.7%) and two thirds ofUkrainians (69.6%) could not always afford to buy essentialmedicine, and nearly half the Russians (43.4%) and two thirdsof the Ukrainians could not always afford the payments fornecessary medical treatment. In terms of social context there isevidence of high levels of personal support from family andfriends but generally low levels of trust and integration into thewider society (Table I). This supports other research in post-Communist societies in suggesting a reliance on kin and friend-ship networks, a lack of integration into the wider society and alack of social cohesion (Burawoy, 1997; Burawoy et al., ND;Rose, 1995).
Levels of perceived personal control are also low. Over halfthe respondents (65.8% in Ukraine and 53.9% in Russia)reported feeling that life is too complicated, around half saythat they are unable to enjoy normal everyday activities (52.9%in Ukraine and 47.1% in Russia), while less than half the
TABLE IPerceptions of economic and political changes since 1991
Russia % Ukraine %
Economic situation has got worse 49.4 72.3Disintegration of USSR had negative
impact on economy78.4 82.7
Highly rate state of economy in USSR times* 61.3 73.4Highly rate state of economy today* 10.7 23.0Highly rate government in USSR times* 54.7 62.5Highly rate government today* 17.2 23.1Definitely against return to communism 37.1 38.5Transition has had some negative impact on health 85.6 85.2
Measured on a five-point scale. Percentages are of informants using codes 1 or2, except for asterisked items, where respondents used codes 4 or 5.
PAMELA ABBOTT AND ROGER SAPSFORD260
respondents in Ukraine (42.7%) and Russia (49.9%) reporthaving a high level of freedom and control. Few think that theycan influence the national (8.4% and 9.5%) or regional (10.9%and 13.6%) governments and nearly half the Ukrainians(45.2%) and over a third of Russians are afraid of illegal arrest.However, well over three quarters of respondents think thatthey have freedom of speech (85.2%, 86.2%), association(84.8%, 83.8%), religion (87.8% and 83.8%) and travel (70.1%,77.5%). The levels of perceived freedom are quite high, but thelevel of perceived control over life is lower.
Health is a resource that enables people to participate insocially valued activities, and lack of good health can be a bar-rier to participation. Levels of self-reported poor health are com-paratively high, although lower in Russia than Ukraine andnoticeably lower for men in both countries. The proportionreporting a long-term limiting illness follows much the same pat-tern. Psychosocial health is also poor, with women experiencingon average more symptoms than men and the Ukrainiansreporting slightly more symptoms than the Russians. Notsurprisingly, levels of satisfaction with health are also compara-tively low, the more so for women than men, with Ukrainianson average being less satisfied with their health than theRussians; 43% of Russian and 56.5% of Ukraine women aredissatisfied with their health, and 29% of Russian and 40% ofUkraine men. (In the EU15, 19.5 percent of women and 15.4percent of men are dissatisfied with their health, and in the newmember states and candidate countries the proportions are 35.4for women and 25.6 for men – see Alber and Kohler, 2004.)
We can conclude that Ukraine and Russia are societies thathave undergone significant change that has had a negative im-pact on the welfare of the population. A majority of citizens inboth countries view the social, political and economic situationas having deteriorated, a majority experience material hardship,there is a lack of social cohesion and integration into the widersociety (although strong personal support structures exist), thereare low levels of perceived control over life, and the physicaland psychosocial health status of the populations are poor. TheUkrainians view the economic and political changes more
LIFE-SATISFACTION IN POST-SOVIET RUSSIA AND UKRAINE 261
negatively than the Russians and report their material situationas poorer. Overall they also report lower levels of personal sup-port, lower levels of trust, less perceived control and freedomand poorer health than the Russians.
HAPPINESS, GENERAL SATISFACTION AND WELL-BEING
In the West most people are happy, judging by the response toquestionnaire scales (Diener and Diener, 1996; Diener et al.,1999), though this is not the case in third-world countries. It isalso not the case in the former Soviet Union. Citizens of bothof the two countries considered here are relatively dissatisfiedand unhappy, with a higher mean and a larger standard devia-tion on both variables than is found in Western EuropeanCountries (suggesting also more variation than in the West).The average level of general satisfaction varies between 80%and 90% in the EU15 and lies at 62% in the new membercountries of the EU (Delhey, 2004), compared with 41.9% inUkraine and 57.2% in Russia. (In the LLH data the averagewas 47.2%, ranging from a low of 12.3% in Georgia to a highof 61.1% in Kyrgyzstan.) While 59.7% of Ukrainians say theyare happy, the figure for Russia is 71.9%; the LLH average was72.1%, ranging from a low of 57.5% in Ukraine to a high of85.5% in Kyrgyzstan. Women are slightly less likely to be satis-fied and happy than men, the reverse of the situation in Wes-tern Europe, where women are on average happier and moresatisfied than men.
It is also important to consider the relationship between do-main satisfactions and general satisfaction and happiness. Thepattern of satisfaction for the various domains is comparable forboth countries: the highest levels of satisfaction are with utilitiesand the environment and the lowest with income, the way theeconomy is developing, the way the government is performing itsduties and the social security system. The Ukrainians are signifi-cantly less satisfied than the Russians with the way the govern-ment is performing its duties and the way public services aredeveloping (although a large majority of respondents in bothcountries are dissatisfied here). In Ukraine, for example, over
PAMELA ABBOTT AND ROGER SAPSFORD262

seven times as many respondents reported being satisfied withtheir electricity supply as were satisfied with the social securitysystem. Similarly, in Russia around four times as many respon-dents reported being satisfied with their electricity supply as withthe way the economy is developing. General satisfaction isaround the average for all the satisfaction domains, 41.9% ofrespondents being generally satisfied in Ukraine and 57.4% inRussia. The proportion of respondents who reported that theywere generally happy is significantly higher than those reportingthat they are generally satisfied – 18 percentage points inUkraine and 15 in Russia. Gender differences on the domainsare generally small and for the most part not statistically signifi-cant, with the exception of satisfaction with health, where, notsurprisingly given the gender differences in self-reported health,women are significantly more likely to say they are dissatisfiedwith their health than men. Women in both countries are signifi-cantly more likely to say they are generally dissatisfied andunhappy – in Ukraine the male/female difference is 5.3 percen-tage points for general satisfaction and 10.9 for happiness, andthe differences in Russia are 7.3 percentage points for satisfac-tion and 9.1 for happiness. Overall the Russians are slightlymore satisfied and happy than the Ukrainians.
In order to explore the factors influencing happiness, generalsatisfaction and well-being a series of linear regressions was car-ried out. To test which of the sets of factors (material, socialcontext, personal control, health and selected domain satisfac-tions) influence them, separate regressions were run initiallywith an appropriate block of indicators; then regressions wererun combing blocks of indicators.
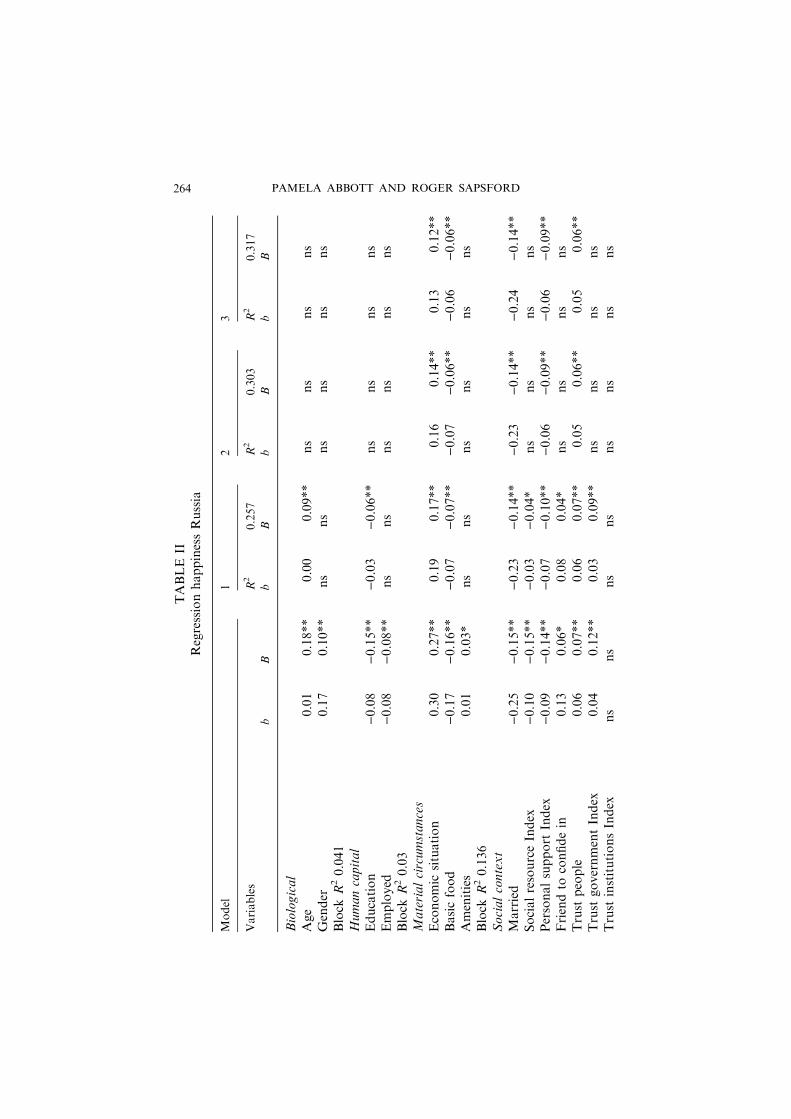
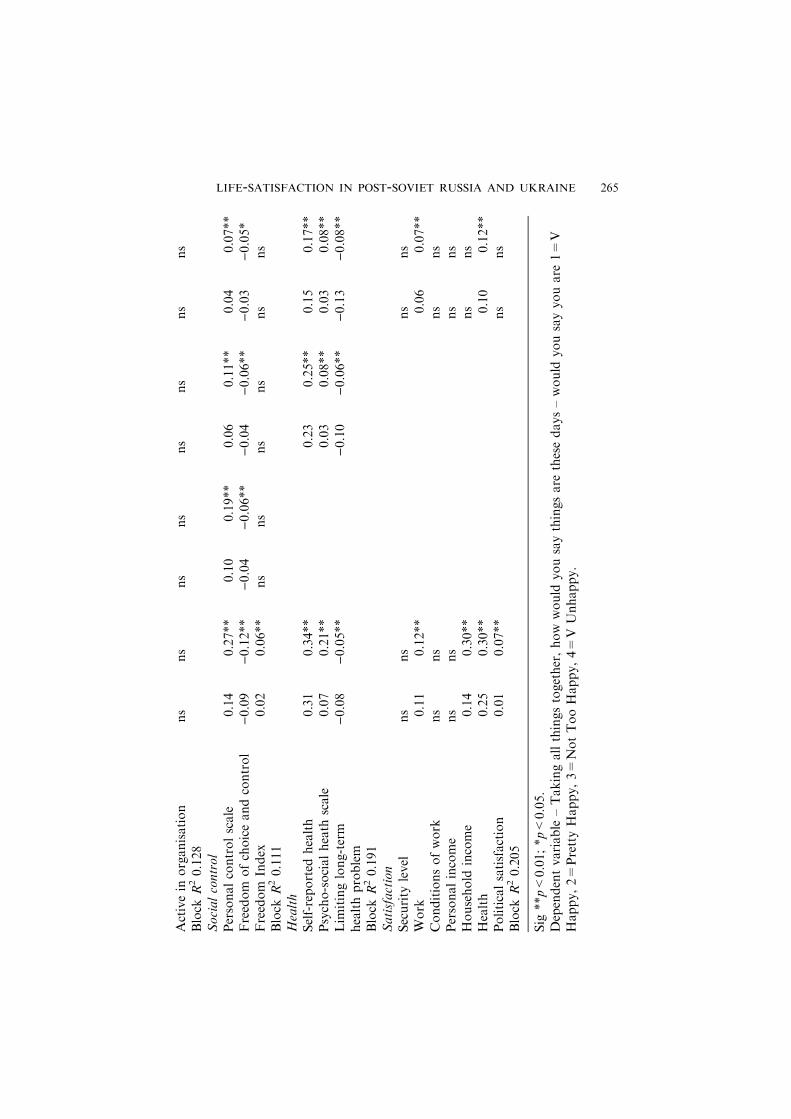
Tables II and III show the results of the regression analysiswith happiness as the dependent variable. For both countries,age, gender, employment and education make a significant con-tribution to explaining the variance, but the amount of varianceexplained is trivial. However, material circumstances, socialcontext, health and domain satisfactions all independentlyexplain a non-negligible amount of the variance in both coun-tries.
LIFE-SATISFACTION IN POST-SOVIET RUSSIA AND UKRAINE 263
TABLE
IIRegressionhappinessRussia
Model
12
3
Variables
R2
0.257
R2
0.303
R2
0.317
bB
bB
bB
bB
Biological
Age
0.01
0.18**
0.00
0.09**
ns
ns
ns
ns
Gender
0.17
0.10**
ns
ns
ns
ns
ns
ns
Block
R20.041
Humancapital
Education
)0.08
)0.15**
)0.03
)0.06**
ns
ns
ns
ns
Employed
)0.08
)0.08**
ns
ns
ns
ns
ns
ns
Block
R20.03
Materialcircumstances
Economic
situation
0.30
0.27**
0.19
0.17**
0.16
0.14**
0.13
0.12**
Basicfood
)0.17
)0.16**
)0.07
)0.07**
)0.07
)0.06**
)0.06
)0.06**
Amenities
0.01
0.03*
ns
ns
ns
ns
ns
ns
Block
R20.136
Socialcontext
Married
)0.25
)0.15**
)0.23
)0.14**
)0.23
)0.14**
)0.24
)0.14**
SocialresourceIndex
)0.10
)0.15**
)0.03
)0.04*
ns
ns
ns
ns
Personalsupport
Index
)0.09
)0.14**
)0.07
)0.10**
)0.06
)0.09**
)0.06
)0.09**
Friendto
confidein
0.13
0.06*
0.08
0.04*
ns
ns
ns
ns
Trust
people
0.06
0.07**
0.06
0.07**
0.05
0.06**
0.05
0.06**
Trust
governmentIndex
0.04
0.12**
0.03
0.09**
ns
ns
ns
ns
Trust
institutionsIndex
ns
ns
ns
ns
ns
ns
ns
ns
PAMELA ABBOTT AND ROGER SAPSFORD264
Activein
organisation
ns
ns
ns
ns
ns
ns
ns
ns
Block
R20.128
Socialcontrol
Personalcontrolscale
0.14
0.27**
0.10
0.19**
0.06
0.11**
0.04
0.07**
Freedom
ofchoiceandcontrol
)0.09
)0.12**
)0.04
)0.06**
)0.04
)0.06**
)0.03
)0.05*
Freedom
Index
0.02
0.06**
ns
ns
ns
ns
ns
ns
Block
R20.111
Health
Self-reported
health
0.31
0.34**
0.23
0.25**
0.15
0.17**
Psycho-socialheath
scale
0.07
0.21**
0.03
0.08**
0.03
0.08**
Lim
itinglong-term
healthproblem
)0.08
)0.05**
)0.10
)0.06**
)0.13
)0.08**
Block
R20.191
Satisfaction
Security
level
ns
ns
ns
ns
Work
0.11
0.12**
0.06
0.07**
Conditionsofwork
ns
ns
ns
ns
Personalincome
ns
ns
ns
ns
Household
income
0.14
0.30**
ns
ns
Health
0.25
0.30**
0.10
0.12**
Politicalsatisfaction
0.01
0.07**
ns
ns
Block
R20.205
Sig
**p<0.01;*p<0.05.
Dependentvariable
–Takingallthingstogether,how
would
yousaythingsare
thesedays–would
yousayyouare
1=V
Happy,2=PrettyHappy,3=NotTooHappy,4=V
Unhappy.
LIFE-SATISFACTION IN POST-SOVIET RUSSIA AND UKRAINE 265

TABLE
III
RegressionhappinessUkraine
Model
12
3
Variables
R2
0.282
R2
0.334
R2
0.350
bB
bB
bB
bB
Biological
Age
0.01
0.26**
0.01
0.09**
ns
ns
ns
ns
Gender
0.16
0.09**
ns
ns
ns
ns
ns
ns
Block
R20.076
Humancapital
Education
)0.13
)0.21**
0.04
0.06*
ns
ns
ns
ns
Employed
0.16
0.09**
ns
ns
ns
ns
ns
ns
Block
R20.062
Materialcircumstances
Economic
situation
0.32
0.28**
0.18
0.16**
0.15
0.13**
0.11
0.10**
Basicfood
)0.16
)0.14**
)0.07
)0.06**
ns
ns
ns
ns
Amenities
0.04
0.11**
0.02
0.06**
0.02
0.06**
0.02
0.05*
Block
R20.169
Socialcontext
Married
)0.22
)0.12**
)0.16
)0.09**
)0.17
)0.09**
)0.18
)0.10**
SocialResourceIndex
)0.15
)0.20**
)0.05
)0.07**
)0.05
)0.07**
)0.04
)0.06*
Personalsupport
Index
)0.06
)0.08**
)0.04
)0.05*
)0.04
)0.05*
ns
ns
Friendto
confidein
ns
ns
ns
ns
ns
ns
ns
ns
Trust
people
0.08
0.08**
0.08
0.08**
0.06
0.07**
0.06
0.06**
Trust
governmen
tIndex
0.05
0.14**
0.02
0.08**
ns
ns
ns
ns
PAMELA ABBOTT AND ROGER SAPSFORD266
Trust
institutionsIndex
ns
ns
ns
ns
ns
ns
ns
ns
Activein
organisation
ns
ns
ns
ns
ns
ns
ns
ns
Block
R20.122
Socialcontrol
Personalcontrolscale
0.17
0.31**
0.12
0.21**
0.07
0.12**
0.05
0.08**
Freedom
ofchoiceand
control
)0.12
)0.15**
)0.07
)0.09**
)0.06
)0.07**
ns
ns
Freedom
Index
ns
ns
ns
ns
ns
ns
ns
ns
Block
R20.149
Health
Self-reported
health
0.37
0.39**
0.25
0.26**
0.16
0.17**
Psycho-social
heath
scale
0.09
0.23**
0.05
0.12**
0.05
0.12**
Lim
itinglong-term
healthproblem
)0.15
)0.08**
)0.14
)0.08**
)0.18
)0.10**
Block
R20.24
Satisfaction
Security
level
ns
ns
ns
ns
Work
0.13
0.16**
0.09
0.10**
Conditionsofwork
ns
ns
ns
ns
Personalincome
0.12
0.11**
0.10
0.09**
Household
income
0.11
0.10**
ns
ns
Politicalsatisfaction
ns
ns
ns
ns
Health
0.32
0.35**
0.13
0.14**
Block
R20.256
Sig
**p<0.01;*p<0.05.
DependentVariable
–Takingallthingstogether,how
would
yousaythingsare
thesedays–would
yousayyouare
1=V
Happy,2=PrettyHappy,3=NotToHappy,4=V
Unhappy.
LIFE-SATISFACTION IN POST-SOVIET RUSSIA AND UKRAINE 267
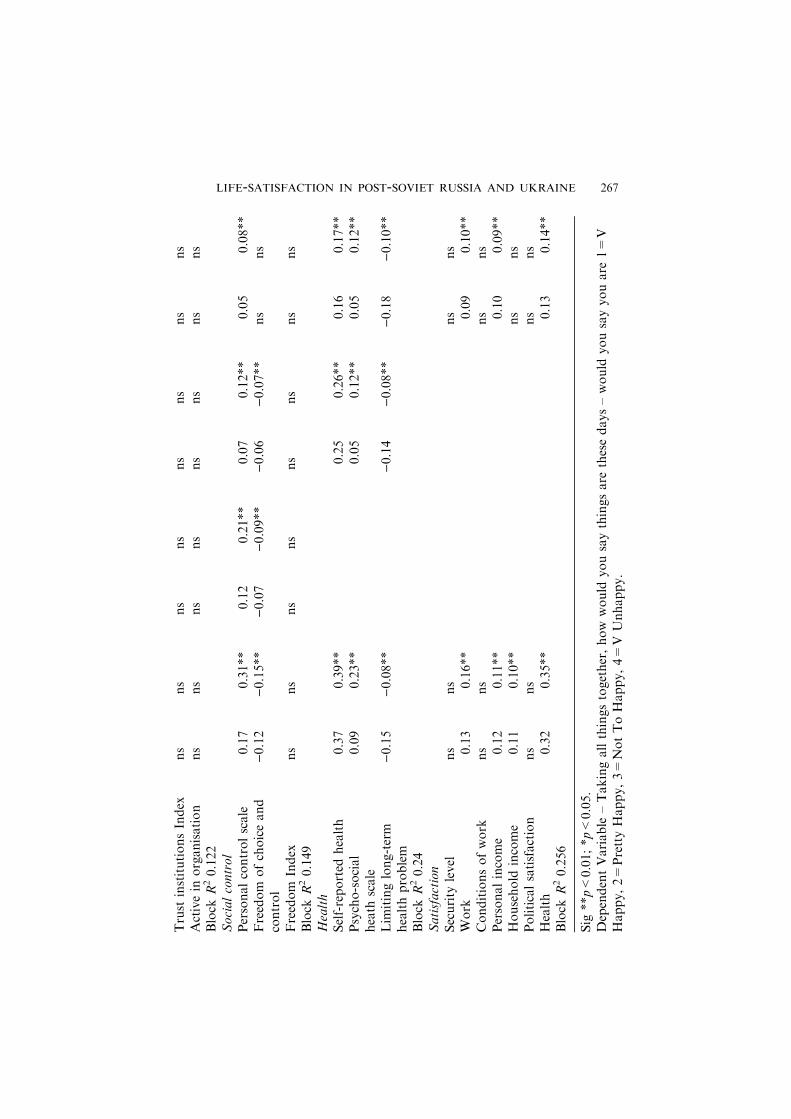
When the biological, human capital, material circumstancesand personal control variables are entered together, the total vari-ance explained is 28.2% in Ukraine and 25.7% in Russia – morethan any of these blocks explain independently for either country.The greatest contributions to the variance explained in bothcountries are material circumstance variables, social context vari-ables and personal control variables. The most important aspectof the social context is marriage, the most important aspect ofmaterial circumstances is economic situation, and the key socialcontrol indicator is personal control. When health variables areadded to the model (Model 2) the amount of variance explainedincreases to 33.4% in Ukraine and 30.3% in Russia. Self-reportedhealth makes the greatest contribution to the variance explained,with economic situation, personal control and marriage (espe-cially in Russia) continuing to make a noticeable and significantcontribution. When the domain satisfaction variables are in-cluded the amount of variance explained increases marginally to35.6% in Ukraine and 32.2% in Russia. Satisfaction with healthand with work make a significant contribution in both Ukraineand Russia. It is worth noting that in both countries the amountof variance explained by the domain satisfaction variables alone –25.6 in Ukraine and 20.5 in Russia, with satisfaction with work,health and household income (and in Ukraine personal income)being the variables contributing most to the variance explained –is only about 10% less than the total variance explained by any ofthe models, although when entered with the more objective vari-ables they add little to the variance explained. This suggests thatactual material circumstances, health, personal support and per-sonal control are important influences on happiness, and not justpeople’s satisfaction with their circumstances. We should note inparticular the important influence of health on happiness.
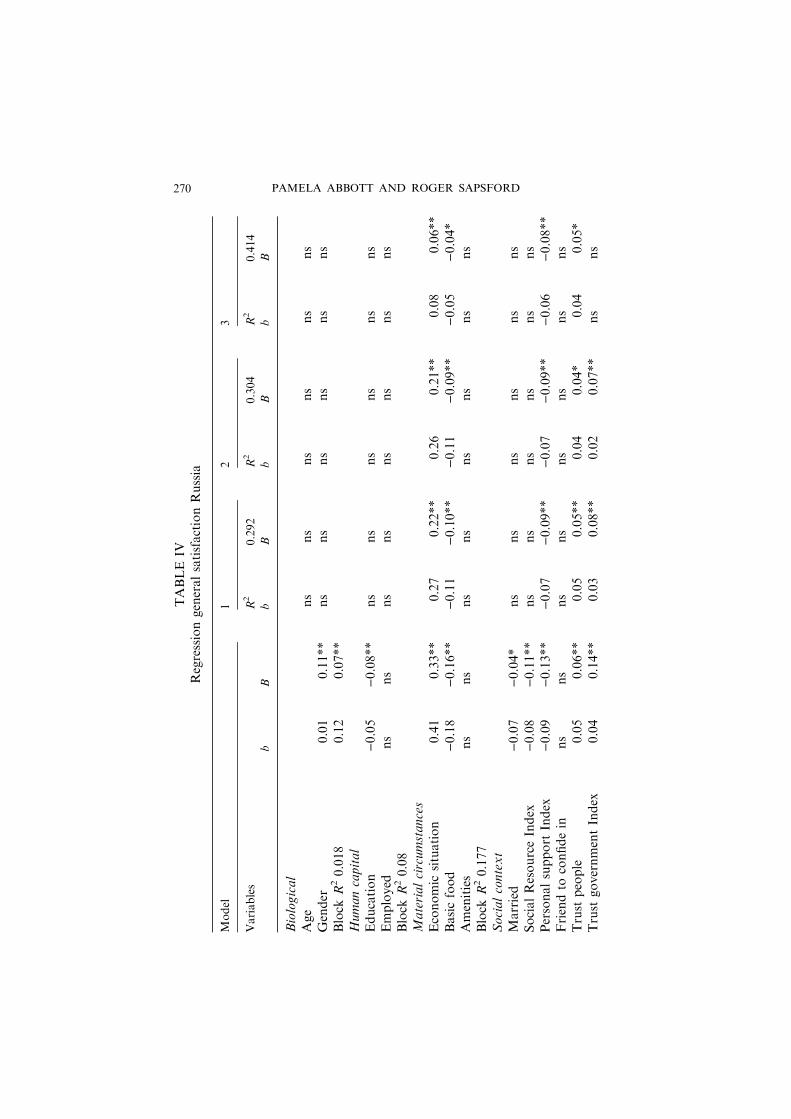
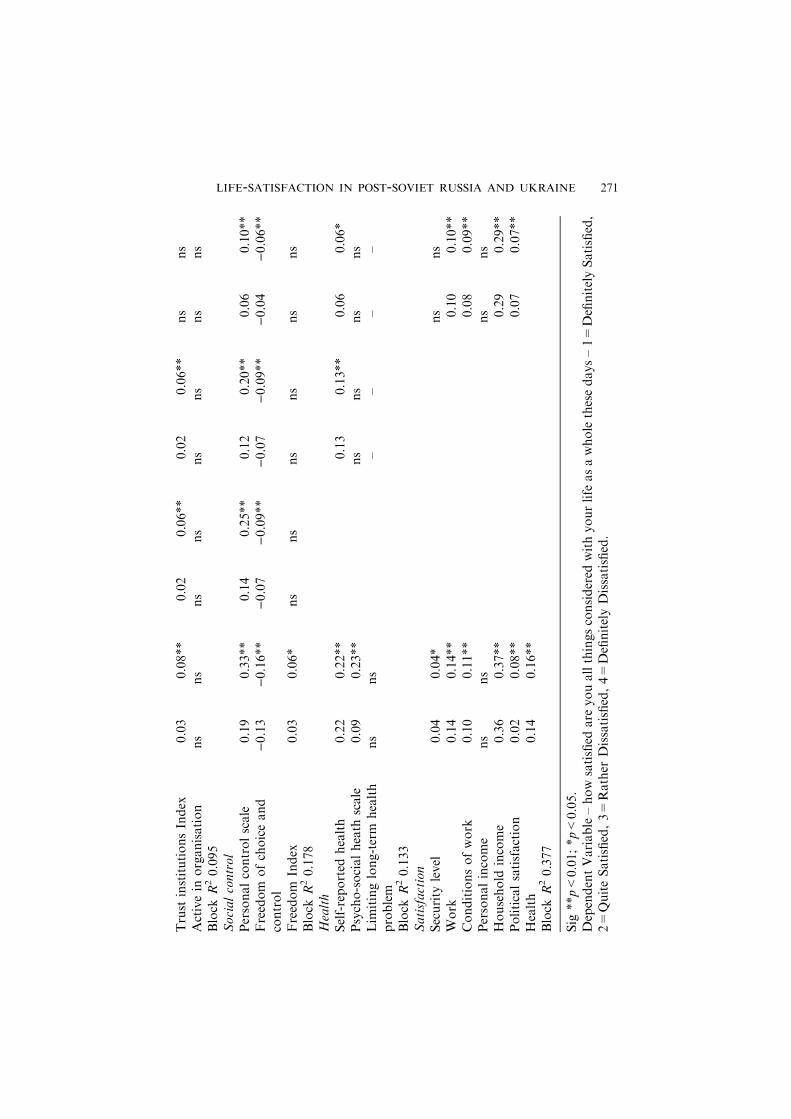
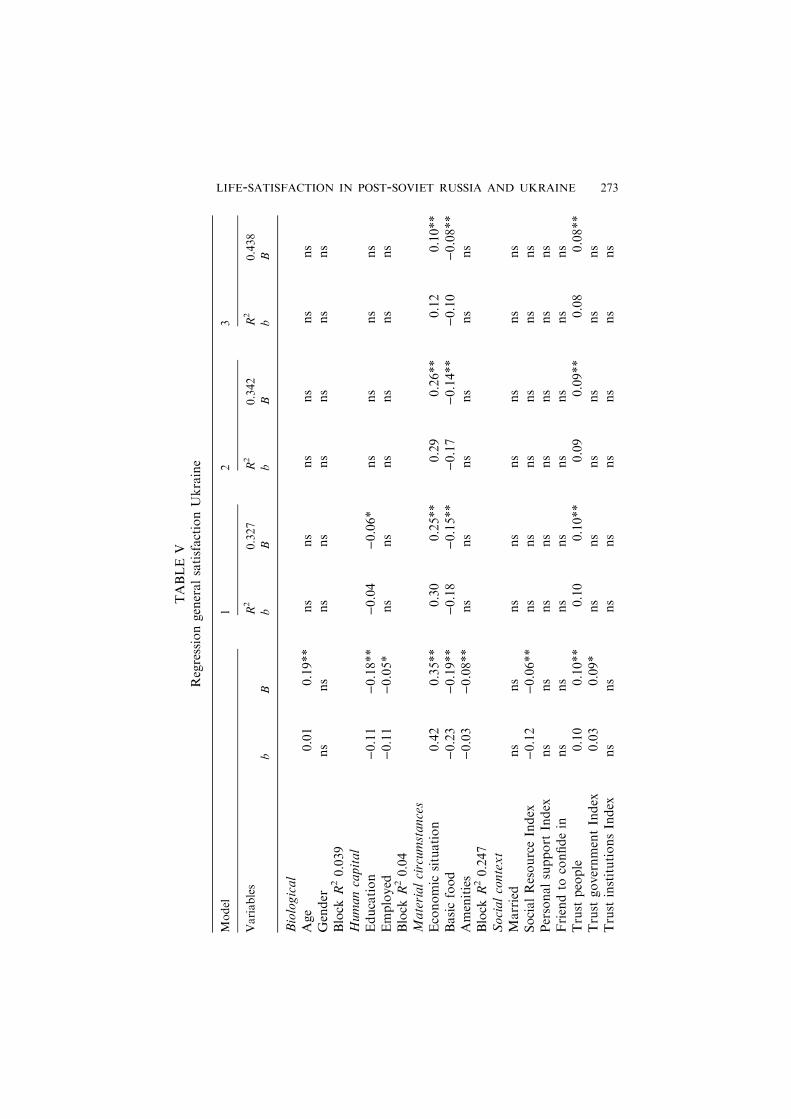
Tables IV and V show the results of the regression analysiswith general satisfaction as the dependent variable. As was thecase with happiness, gender and age explain a significant but neg-ligible amount of the variance when entered as a block, and thesame is true for education and employment in both countries(although gender does not make a significant contribution inUkraine or employment in Russia). Social context variables
PAMELA ABBOTT AND ROGER SAPSFORD268
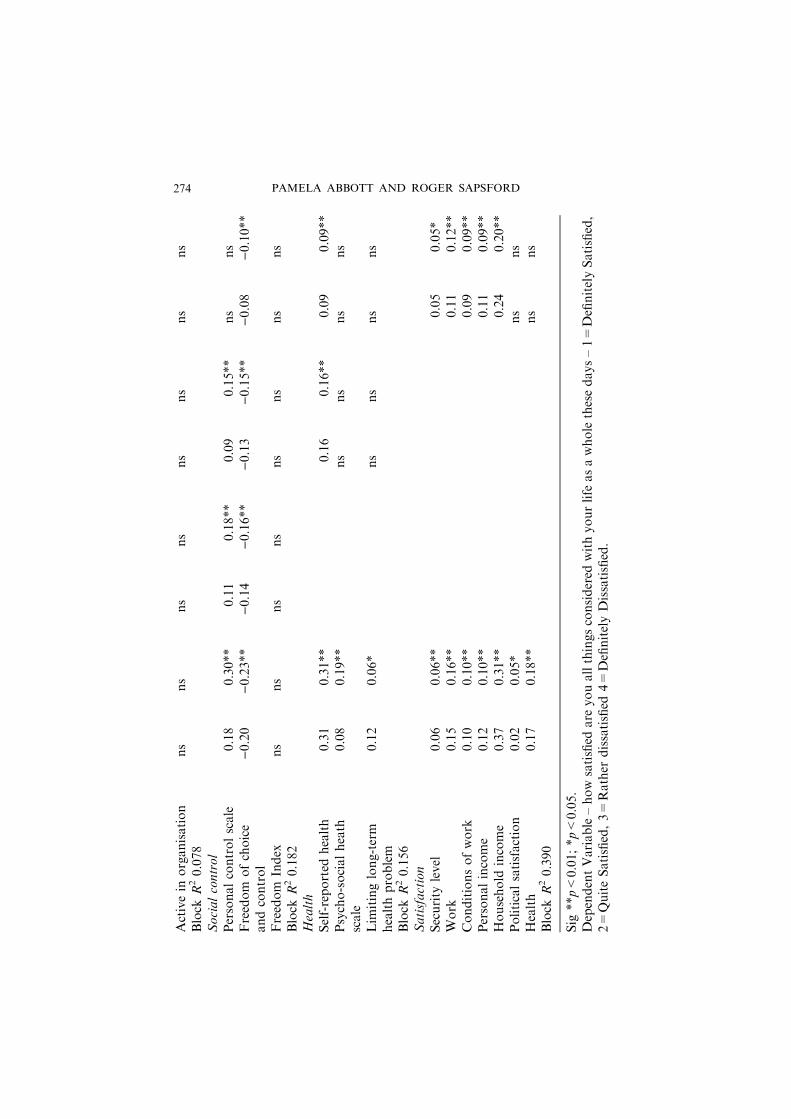
explain a significant but relatively trivial amount of the variancewhen entered as a separate block. Material circumstances, socialcontrol and health explain a noticeable amount, and satisfactiondomains alone explain over 39% of variance in Ukraine and 37%in Russia. (The predictive value of ‘‘subordinate satisfactions’’has also emerged in other research: see, e.g., Grazin and Haggerd,2000.) Models 1 and 2 clearly show that, in comparison with hap-piness, material circumstances and social control have a muchgreater influence on general satisfaction and health a smaller one.When domain satisfaction variables are added, the amount ofvariance explained increases over Model 2 by 9.6 percentagepoints in Ukraine and just over 11 percentage points in Russia.The amount of variance explained by any of the other indepen-dent variables is significantly reduced or eliminated, althoughmaterial circumstances still has a noticeable influence, especiallyin Ukraine, and social control variables have an influence inboth countries. The variable that has the single greatest influenceon general satisfaction in Model 3 is satisfaction with the house-hold’s financial situation. Satisfaction with work and conditionsof work also have a noticeable influence in both countries, withsatisfaction with health in Russia and satisfaction with own in-come and security levels in Ukraine making significant contribu-tions. While satisfaction with material circumstances clearly hasthe most influence on general satisfaction, Models 1 and 2 pro-vide evidence that people’s satisfaction with their financial situa-tion is influenced by their actual material circumstances as wellas by health, personal control and trust. The most noticeabledifferences between influences on happiness and general satisfac-tion are the greater importance of satisfaction with financial cir-cumstances on reported general satisfaction than on happiness,the greater influence of health on happiness, and the much smal-ler influence of social context (and especially of marriage) ongeneral satisfaction as compared with happiness.
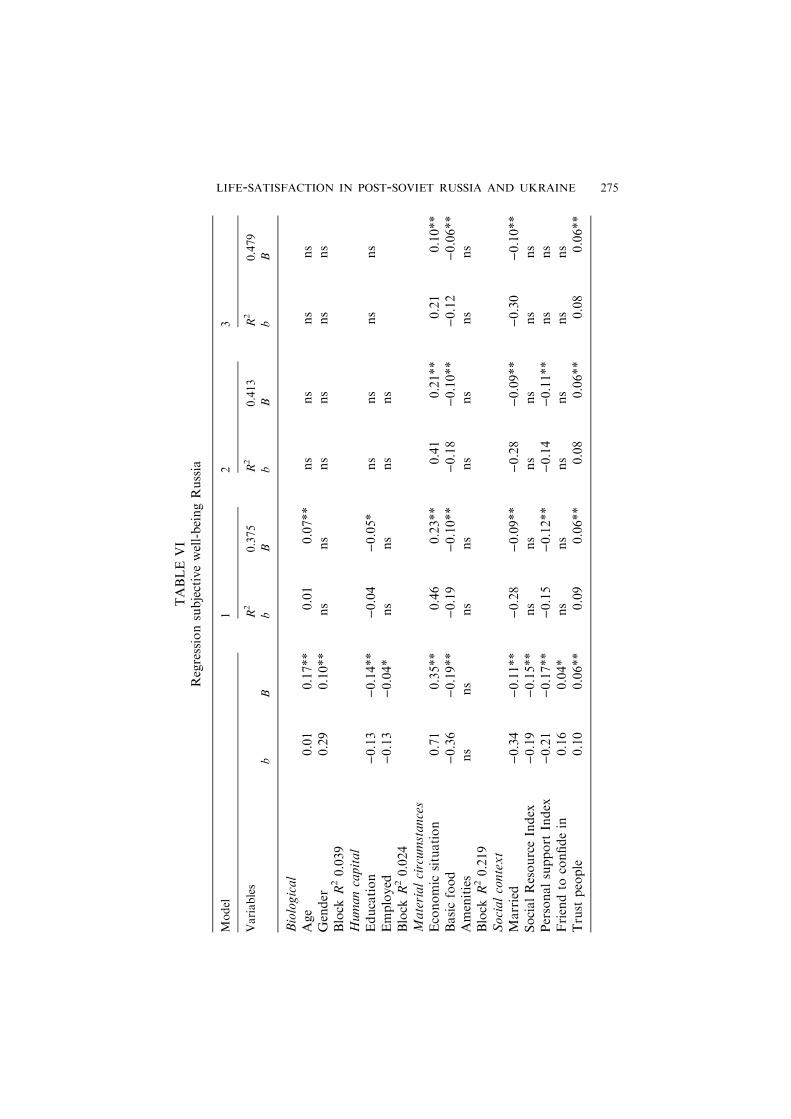
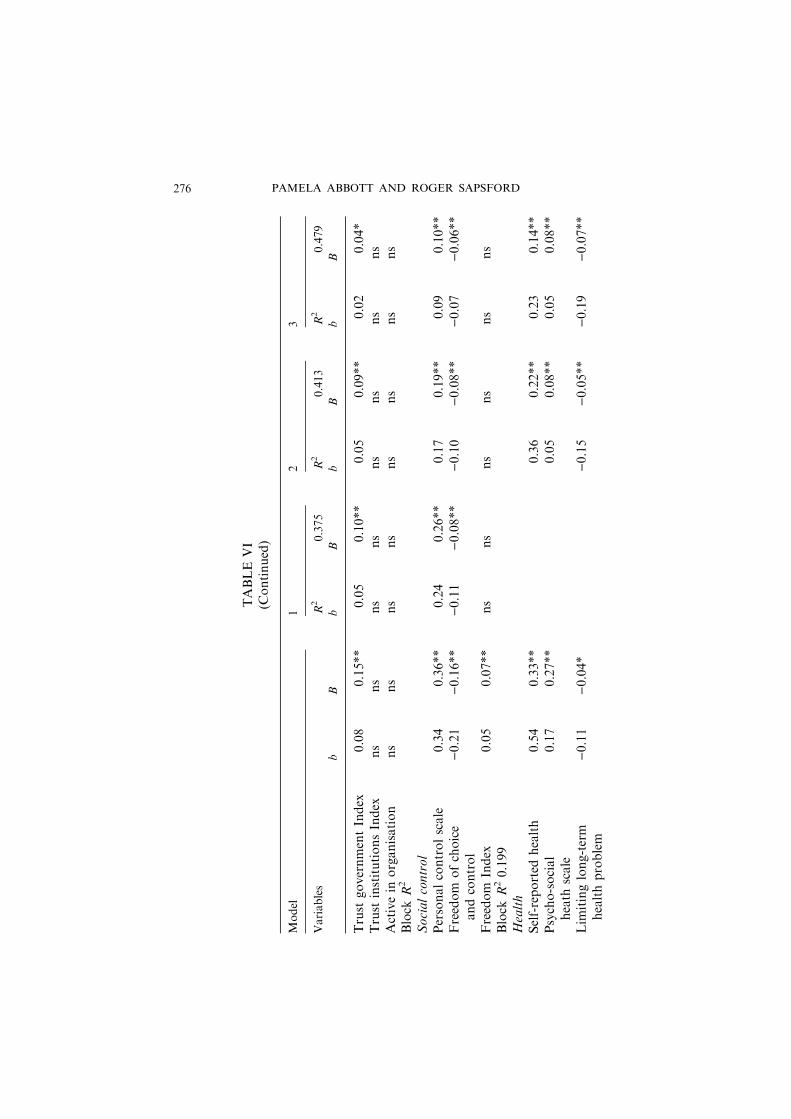
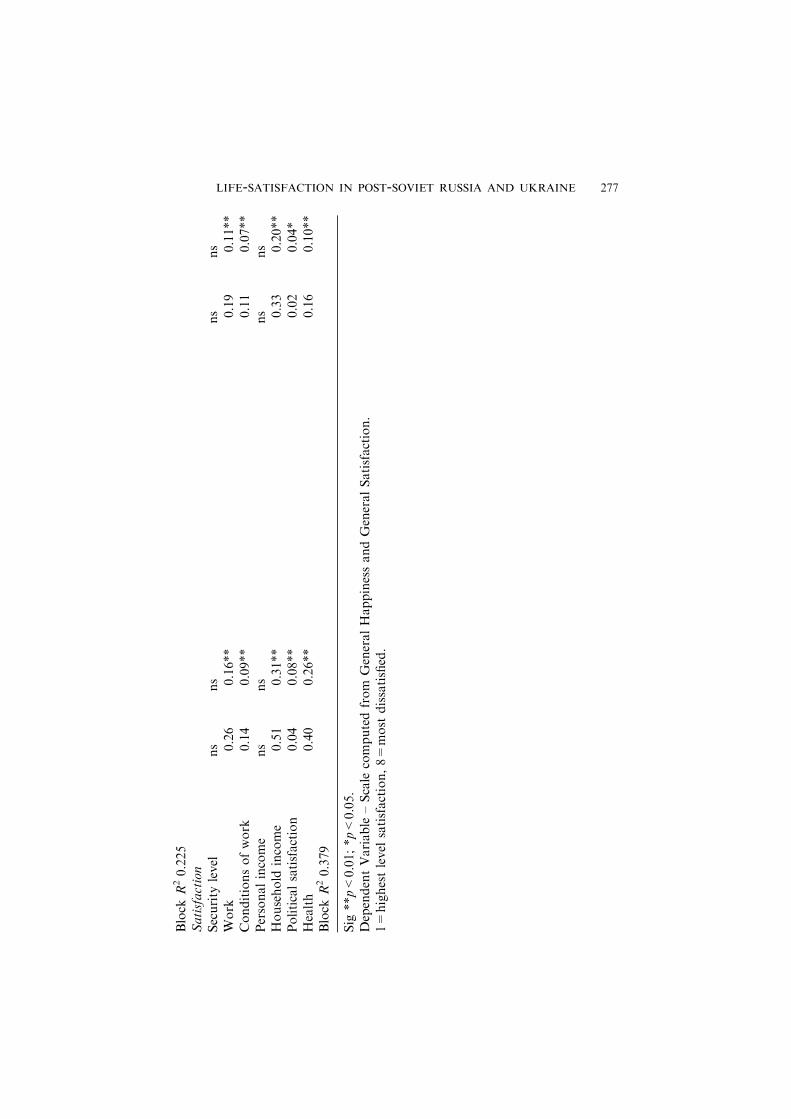
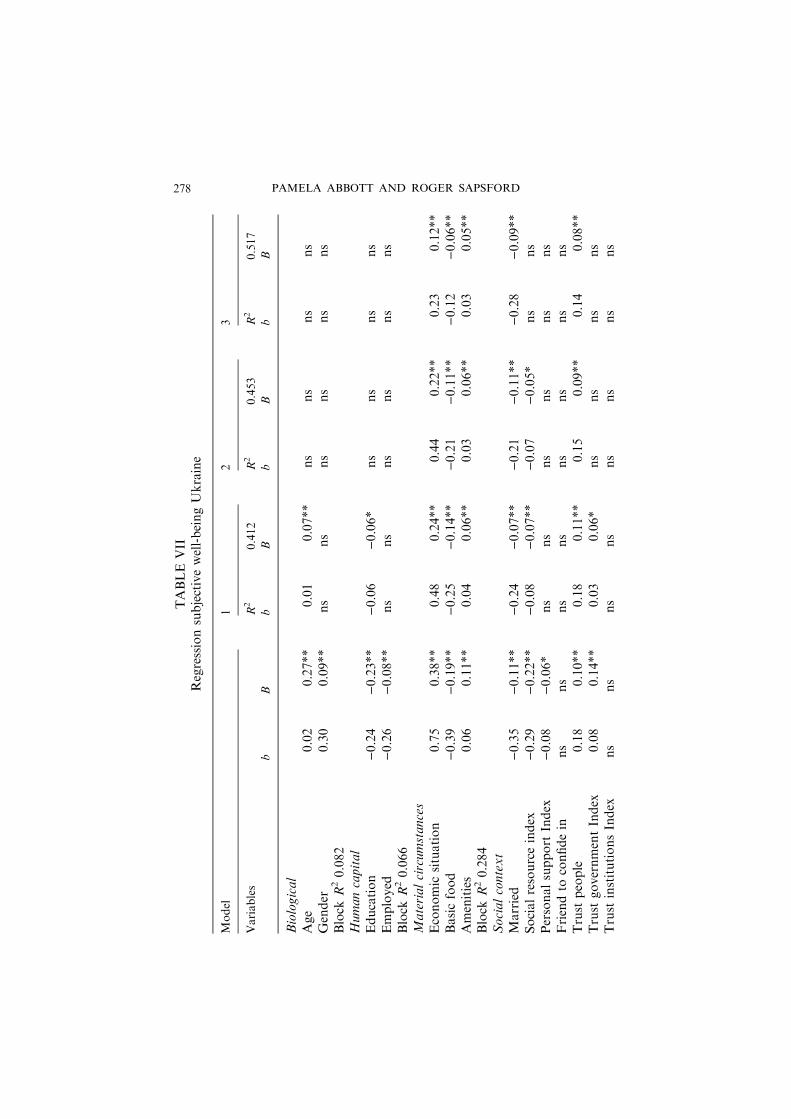
Tables VI and VII show the results of the regression analysiswith a composite index of well-being as dependent variable, com-bining self-reported happiness and general satisfaction with life.While there are some differences in the influences on well-beingbetween the two countries, the similarities are striking. The main
LIFE-SATISFACTION IN POST-SOVIET RUSSIA AND UKRAINE 269
TABLE
IVRegressiongeneralsatisfactionRussia
Model
12
3
Variables
R2
0.292
R2
0.304
R2
0.414
bB
bB
bB
bB
Biological
Age
ns
ns
ns
ns
ns
ns
Gender
0.01
0.11**
ns
ns
ns
ns
ns
ns
Block
R20.018
0.12
0.07**
Humancapital
Education
)0.05
)0.08**
ns
ns
ns
ns
ns
ns
Employed
ns
ns
ns
ns
ns
ns
ns
ns
Block
R20.08
Materialcircumstances
Economic
situation
0.41
0.33**
0.27
0.22**
0.26
0.21**
0.08
0.06**
Basicfood
)0.18
)0.16**
)0.11
)0.10**
)0.11
)0.09**
)0.05
)0.04*
Amenities
ns
ns
ns
ns
ns
ns
ns
ns
Block
R20.177
Socialcontext
Married
)0.07
)0.04*
ns
ns
ns
ns
ns
ns
SocialResourceIndex
)0.08
)0.11**
ns
ns
ns
ns
ns
ns
Personalsupport
Index
)0.09
)0.13**
)0.07
)0.09**
)0.07
)0.09**
)0.06
)0.08**
Friendto
confidein
ns
ns
ns
ns
ns
ns
ns
ns
Trust
people
0.05
0.06**
0.05
0.05**
0.04
0.04*
0.04
0.05*
Trust
governmentIndex
0.04
0.14**
0.03
0.08**
0.02
0.07**
ns
ns
PAMELA ABBOTT AND ROGER SAPSFORD270
Trust
institutionsIndex
0.03
0.08**
0.02
0.06**
0.02
0.06**
ns
ns
Activein
organisation
ns
ns
ns
ns
ns
ns
ns
ns
Block
R20.095
Socialcontrol
Personalcontrolscale
0.19
0.33**
0.14
0.25**
0.12
0.20**
0.06
0.10**
Freedom
ofchoiceand
control
)0.13
)0.16**
)0.07
)0.09**
)0.07
)0.09**
)0.04
)0.06**
Freedom
Index
0.03
0.06*
ns
ns
ns
ns
ns
ns
Block
R20.178
Health
Self-reported
health
0.22
0.22**
0.13
0.13**
0.06
0.06*
Psycho-socialheath
scale
0.09
0.23**
ns
ns
ns
ns
Lim
itinglong-term
health
problem
ns
ns
––
––
Block
R20.133
Satisfaction
Security
level
0.04
0.04*
ns
ns
Work
0.14
0.14**
0.10
0.10**
Conditionsofwork
0.10
0.11**
0.08
0.09**
Personalincome
ns
ns
ns
ns
Household
income
0.36
0.37**
0.29
0.29**
Politicalsatisfaction
0.02
0.08**
0.07
0.07**
Health
0.14
0.16**
Block
R20.377
Sig
**p<0.01;*p<0.05.
DependentVariable–how
satisfied
are
youallthingsconsidered
withyourlife
asawholethesedays–1=DefinitelySatisfied,
2=QuiteSatisfied,3=Rather
Dissatisfied,4=DefinitelyDissatisfied.
LIFE-SATISFACTION IN POST-SOVIET RUSSIA AND UKRAINE 271
variables influencing well-being are material circumstances,self-reported health, marriage, control and satisfaction withfinancial circumstances. There is clear evidence that the resourcesover which people have command and the personal support theyhave in their daily lives are major factors influencing their well-being. Being healthy, wealthy and married are key determinantsof subjective well-being.
We should note that the amount of variance explained by‘‘objective’’ factors in this analysis is against the trend of similaranalyses in the West. Analyses within the United States and be-tween Western countries have suggested at best a low correlationof happiness, satisfaction and/or subjective well-being with in-come, housing and living conditions (Andreys and Withey, 1976;Campbell et al., 1976; Diener et al., 1985; Diener and Suh, 1997;Frey and Stutzer, 2002; Oswald, 1997) – with some exceptions,such as Glatzer’s analysis in West Germany (1991) – or with gen-der (Lewinsohn et al., 1991). The same low level of relationship isfound even in one analysis in India (Dasgupta, 2002).
The main conclusion to be drawn from this analysis is thestrength of multivariate models in enabling us to detect underly-ing patterns and so understand the main influences on happi-ness and satisfaction. The analysis demonstrates that whilst themain influences on happiness are health, financial circumstancesand personal support, the main influences on general satisfac-tion are evaluation of material circumstances and actual mate-rial circumstances. The added value of combining the twovariables is that we can get a more complete understanding ofwhat affects people’s overall well-being – how they feel in them-selves and how they evaluate their situation. (See also Kozmaand Stones, 1983.) We can see from the combined models theimportance of material circumstances, health and social controlin both countries, together with people’s evaluation of theirfinancial situation and personal support, including marriage.
DISCUSSION AND CONCLUSIONS
It is worthy of note, to begin with, that influences on happinessand general satisfaction are not identical. In particular, satisfaction
PAMELA ABBOTT AND ROGER SAPSFORD272
TABLE
VRegressiongeneralsatisfactionUkraine
Model
12
3
Variables
R2
0.327
R2
0.342
R2
0.438
bB
bB
bB
bB
Biological
Age
0.01
0.19**
ns
ns
ns
ns
ns
ns
Gender
ns
ns
ns
ns
ns
ns
ns
ns
Block
R20.039
Humancapital
Education
)0.11
)0.18**
)0.04
)0.06*
ns
ns
ns
ns
Employed
)0.11
)0.05*
ns
ns
ns
ns
ns
ns
Block
R20.04
Materialcircumstances
Economic
situation
0.42
0.35**
0.30
0.25**
0.29
0.26**
0.12
0.10**
Basicfood
)0.23
)0.19**
)0.18
)0.15**
)0.17
)0.14**
)0.10
)0.08**
Amenities
)0.03
)0.08**
ns
ns
ns
ns
ns
ns
Block
R20.247
Socialcontext
Married
ns
ns
ns
ns
ns
ns
ns
ns
SocialResourceIndex
)0.12
)0.06**
ns
ns
ns
ns
ns
ns
Personalsupport
Index
ns
ns
ns
ns
ns
ns
ns
ns
Friendto
confidein
ns
ns
ns
ns
ns
ns
ns
ns
Trust
people
0.10
0.10**
0.10
0.10**
0.09
0.09**
0.08
0.08**
Trust
governmentIndex
0.03
0.09*
ns
ns
ns
ns
ns
ns
Trust
institutionsIndex
ns
ns
ns
ns
ns
ns
ns
ns
LIFE-SATISFACTION IN POST-SOVIET RUSSIA AND UKRAINE 273
Activein
organisation
ns
ns
ns
ns
ns
ns
ns
ns
Block
R20.078
Socialcontrol
Personalcontrolscale
0.18
0.30**
0.11
0.18**
0.09
0.15**
ns
ns
Freedom
ofchoice
andcontrol
)0.20
)0.23**
)0.14
)0.16**
)0.13
)0.15**
)0.08
)0.10**
Freedom
Index
ns
ns
ns
ns
ns
ns
ns
ns
Block
R20.182
Health
Self-reported
health
0.31
0.31**
0.16
0.16**
0.09
0.09**
Psycho-socialheath
scale
0.08
0.19**
ns
ns
ns
ns
Lim
itinglong-term
healthproblem
0.12
0.06*
ns
ns
ns
ns
Block
R20.156
Satisfaction
Security
level
0.06
0.06**
0.05
0.05*
Work
0.15
0.16**
0.11
0.12**
Conditionsofwork
0.10
0.10**
0.09
0.09**
Personalincome
0.12
0.10**
0.11
0.09**
Household
income
0.37
0.31**
0.24
0.20**
Politicalsatisfaction
0.02
0.05*
ns
ns
Health
0.17
0.18**
ns
ns
Block
R20.390
Sig
**p<0.01;*p<0.05.
DependentVariable–how
satisfied
are
youallthingsconsidered
withyourlife
asawholethesedays–1=DefinitelySatisfied,
2=QuiteSatisfied,3=Rather
dissatisfied
4=DefinitelyDissatisfied.
PAMELA ABBOTT AND ROGER SAPSFORD274
TABLE
VI
Regressionsubjectivewell-beingRussia
Model
12
3
Variables
R2
0.375
R2
0.413
R2
0.479
bB
bB
bB
bB
Biological
Age
0.01
0.17**
0.01
0.07**
ns
ns
ns
ns
Gender
0.29
0.10**
ns
ns
ns
ns
ns
ns
Block
R20.039
Humancapital
Education
)0.13
)0.14**
)0.04
)0.05*
ns
ns
ns
ns
Employed
)0.13
)0.04*
ns
ns
ns
ns
Block
R20.024
Materialcircumstances
Economic
situation
0.71
0.35**
0.46
0.23**
0.41
0.21**
0.21
0.10**
Basicfood
)0.36
)0.19**
)0.19
)0.10**
)0.18
)0.10**
)0.12
)0.06**
Amenities
ns
ns
ns
ns
ns
ns
ns
ns
Block
R20.219
Socialcontext
Married
)0.34
)0.11**
)0.28
)0.09**
)0.28
)0.09**
)0.30
)0.10**
SocialResourceIndex
)0.19
)0.15**
ns
ns
ns
ns
ns
ns
Personalsupport
Index
)0.21
)0.17**
)0.15
)0.12**
)0.14
)0.11**
ns
ns
Friendto
confidein
0.16
0.04*
ns
ns
ns
ns
ns
ns
Trust
people
0.10
0.06**
0.09
0.06**
0.08
0.06**
0.08
0.06**
LIFE-SATISFACTION IN POST-SOVIET RUSSIA AND UKRAINE 275
TABLE
VI
(Continued)
Model
12
3
Variables
R2
0.375
R2
0.413
R2
0.479
bB
bB
bB
bB
Trust
governmentIndex
0.08
0.15**
0.05
0.10**
0.05
0.09**
0.02
0.04*
Trust
institutionsIndex
ns
ns
ns
ns
ns
ns
ns
ns
Activein
organisation
ns
ns
ns
ns
ns
ns
ns
ns
Block
R2
Socialcontrol
Personalcontrolscale
0.34
0.36**
0.24
0.26**
0.17
0.19**
0.09
0.10**
Freedom
ofchoice
andcontrol
)0.21
)0.16**
)0.11
)0.08**
)0.10
)0.08**
)0.07
)0.06**
Freedom
Index
0.05
0.07**
ns
ns
ns
ns
ns
ns
Block
R20.199
Health
Self-reported
health
0.54
0.33**
0.36
0.22**
0.23
0.14**
Psycho-social
heath
scale
0.17
0.27**
0.05
0.08**
0.05
0.08**
Lim
itinglong-term
healthproblem
)0.11
)0.04*
)0.15
)0.05**
)0.19
)0.07**
PAMELA ABBOTT AND ROGER SAPSFORD276
Block
R20.225
Satisfaction
Security
level
ns
ns
ns
ns
Work
0.26
0.16**
0.19
0.11**
Conditionsofwork
0.14
0.09**
0.11
0.07**
Personalincome
ns
ns
ns
ns
Household
income
0.51
0.31**
0.33
0.20**
Politicalsatisfaction
0.04
0.08**
0.02
0.04*
Health
0.40
0.26**
0.16
0.10**
Block
R20.379
Sig
**p<0.01;*p<0.05.
DependentVariable
–Scale
computedfrom
GeneralHappinessandGeneralSatisfaction.
1=highestlevel
satisfaction,8=most
dissatisfied.
LIFE-SATISFACTION IN POST-SOVIET RUSSIA AND UKRAINE 277
TABLE
VII
Regressionsubjectivewell-beingUkraine
Model
12
3
Variables
R2
0.412
R2
0.453
R2
0.517
bB
bB
bB
bB
Biological
Age
0.02
0.27**
0.01
0.07**
ns
ns
ns
ns
Gender
0.30
0.09**
ns
ns
ns
ns
ns
ns
Block
R20.082
Humancapital
Education
)0.24
)0.23**
)0.06
)0.06*
ns
ns
ns
ns
Employed
)0.26
)0.08**
ns
ns
ns
ns
ns
ns
Block
R20.066
Materialcircumstances
Economic
situation
0.75
0.38**
0.48
0.24**
0.44
0.22**
0.23
0.12**
Basicfood
)0.39
)0.19**
)0.25
)0.14**
)0.21
)0.11**
)0.12
)0.06**
Amenities
0.06
0.11**
0.04
0.06**
0.03
0.06**
0.03
0.05**
Block
R20.284
Socialcontext
Married
)0.35
)0.11**
)0.24
)0.07**
)0.21
)0.11**
)0.28
)0.09**
Socialresourceindex
)0.29
)0.22**
)0.08
)0.07**
)0.07
)0.05*
ns
ns
Personalsupport
Index
)0.08
)0.06*
ns
ns
ns
ns
ns
ns
Friendto
confidein
ns
ns
ns
ns
ns
ns
ns
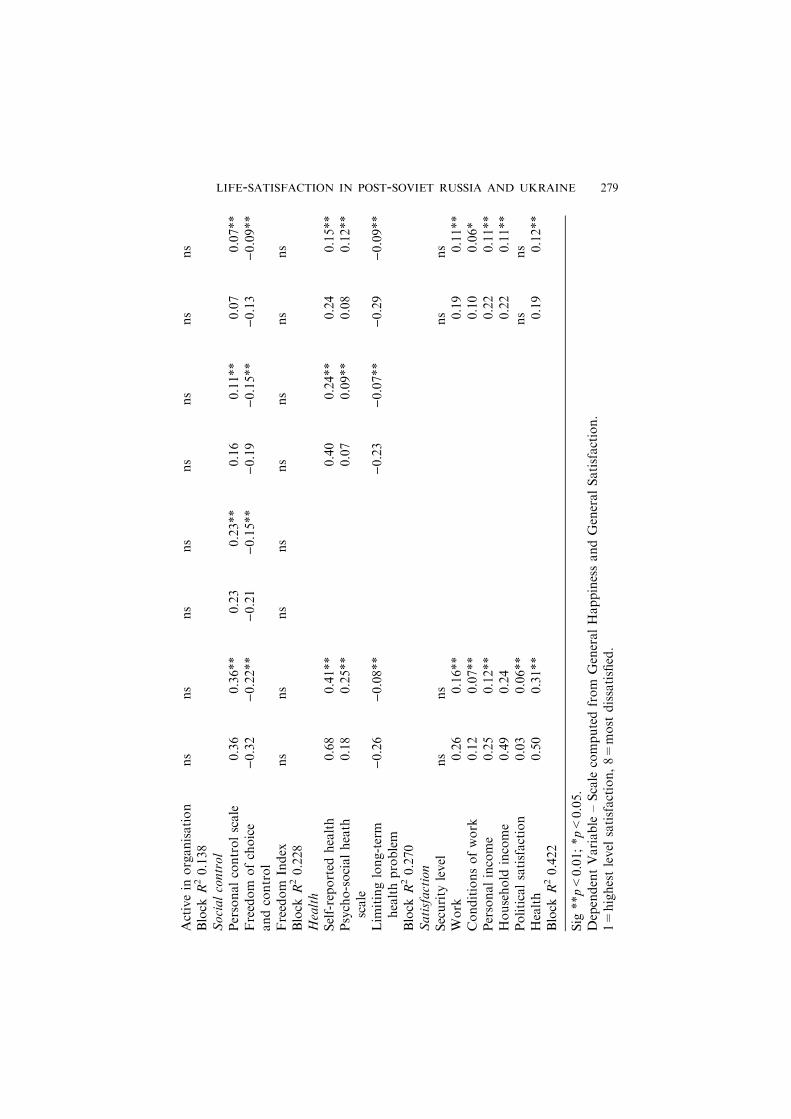
ns
Trust
people
0.18
0.10**
0.18
0.11**
0.15
0.09**
0.14
0.08**
Trust
governmen
tIndex
0.08
0.14**
0.03
0.06*
ns
ns
ns
ns
Trust
institutionsIndex
ns
ns
ns
ns
ns
ns
ns
ns
PAMELA ABBOTT AND ROGER SAPSFORD278
Activein
organisation
ns
ns
ns
ns
ns
ns
ns
ns
Block
R20.138
Socialcontrol
Personalcontrolscale
0.36
0.36**
0.23
0.23**
0.16
0.11**
0.07
0.07**
Freedom
ofchoice
andcontrol
)0.32
)0.22**
)0.21
)0.15**
)0.19
)0.15**
)0.13
)0.09**
Freedom
Index
ns
ns
ns
ns
ns
ns
ns
ns
Block
R20.228
Health
Self-reported
health
0.68
0.41**
0.40
0.24**
0.24
0.15**
Psycho-socialheath
scale
0.18
0.25**
0.07
0.09**
0.08
0.12**
Lim
itinglong-term
healthproblem
)0.26
)0.08**
)0.23
)0.07**
)0.29
)0.09**
Block
R20.270
Satisfaction
Security
level
ns
ns
ns
ns
Work
0.26
0.16**
0.19
0.11**
Conditionsofwork
0.12
0.07**
0.10
0.06*
Personalincome
0.25
0.12**
0.22
0.11**
Household
income
0.49
0.24
0.22
0.11**
Politicalsatisfaction
0.03
0.06**
ns
ns
Health
0.50
0.31**
0.19
0.12**
Block
R20.422
Sig
**p<0.01;*p<0.05.
DependentVariable
–Scale
computedfrom
GeneralHappinessandGeneralSatisfaction.
1=highestlevel
satisfaction,8=most
dissatisfied.
LIFE-SATISFACTION IN POST-SOVIET RUSSIA AND UKRAINE 279
with one’s financial circumstances has much less impact on happi-ness than on general satisfaction, and health status a greater influ-ence on happiness than on general satisfaction, thus confirmingthe added value of constructing a well-being scale and tappinginto non-identical domains.
The analysis has shown that even in these societies whereeconomic security is a major concern, economic factors are byno means the only influences on happiness and satisfaction withlife. Other important influences are being in good health, feelingin control of one’s life, having strong personal support andtrusting people. It also shows that subjective perception of eventhe economic environment has predictive value over and aboveobjective material circumstances: satisfaction with financial cir-cumstances also influences well-being independently of objectivecircumstances. In general, the analysis supports the need to con-sider both objective and subjective domain variables in order tocome to an understanding of the influences on the welfare ofcitizens and their ability to act to secure socially valued goals.Lived experience – how people evaluate their circumstances –significantly influences well-being.
However, material circumstances do exert a substantial influ-ence on both happiness and satisfaction in these two formerSoviet countries, though their influence on satisfaction (themore cognitive of the two concepts) is substantially larger. Thisruns against the trend of analyses in the West, but the clue to itmay be provided by Di Tella’s analysis, in which the effect ofincome was not linear: effects of income were concentrated inthe lower income bands (Di Tella et al., 1999, cited in Frey andStutzer, 2002). It may well be that objective economic positionhas little effect among the relatively affluent but assumes muchmore importance in conditions of objective and severe depriva-tion. We might argue that in societies that have undergone sud-den and dramatic, negatively perceived economic and politicalchange, their perceived and actual financial security are themajor influences on well-being. Other variables that influencewell-being are not only themselves influenced by material cir-cumstances but at best are probably acting as buffers that pro-vide some support in a society where a majority of the
PAMELA ABBOTT AND ROGER SAPSFORD280
population has been negatively affected by social change andwhere this has resulted in widespread economic hardship. Wemay acknowledge ‘‘the central role played by people’s goals,coping efforts and dispositions’’ (Diener et al., 1999, p. 276; seealso Brunstein, 1993, Diener and Fujita, 1995), but it is likelythat a majority of citizens are in fact not able to act to securetheir welfare and achieve their goals.
Thus the figures would suggest that in this kind of materiallydeprived and anomic environment ‘‘top–down’’ models(explaining variance in terms of the personality or propensity ofindividuals to be happy or to feel satisfaction – see Kozmaet al., 2002) are unlikely to form a sufficient explanation; sucheffects have more space to occur where basic material needs aresatisfied. What is in common between these two countries (andthe others in the former Soviet Union) is their economic cir-cumstances, and these circumstances are sufficiently grave toexercise a common effect on virtually all their citizens. There isevidence that the post-1991 economic and political changes areperceived negatively by a majority of the people of both coun-tries. Economic hardship is the norm, levels of trust in politicaland other institutions are low and there is the feeling of a lackof control over life in general. This is reflected in the compara-tively high levels of dissatisfaction.
What is perhaps surprising is the number of people whoremain apparently satisfied and happy with the way things are,and this suggests that there may be a need to do qualitativework in order to get below people’s accounts to the ‘‘real’’ sto-ries (Cornwell, 1986). Qualitative work carried out in Russia aswell as in other post-Soviet societies would support this (Abbottand Wallace, 2004). That such diversity persists even in rela-tively extreme social circumstances strongly suggests that a‘‘bottom up’’ model of material circumstances deterministicallyproducing subjective understanding may also be inadequate byitself. The most likely model is one of social causes mediated bysubjective understanding and of reciprocal influence, mediatedby personal and collective action within the context of socialand material resources, between the material circumstances andthe experience of well-being. (For accounts of the social and
LIFE-SATISFACTION IN POST-SOVIET RUSSIA AND UKRAINE 281
material environment as a context within which action is taken,see: Diener et al., 1999; Grazin and Haggerd, 2000; McFarlandand Miller, 1994). While those who have least also tend to feelleast satisfaction, it would also appear to be the case that thosewho feel happiness and satisfaction may consequently be able toinfluence their material circumstances. One has only to com-pare, for example, Moldova in the former Soviet Union withthe at least equally deprived Rwanda in Africa, which alsoexperienced a brutal social transition in the early 1990s, to seethe effect of hope and trust on a society’s economic perfor-mance.
Two final points are worthy of note. The first is that theRussians report greater general satisfaction and happiness thanthe Ukrainians. This points to the importance of incorporatingplace, both social and geographical, in social research (see alsoPopay et al., 2003; Siegrist, 2000), and in the case of post-Sovietsocieties it suggests that the post-1991 changes have not had thesame impact on the populations of the different countries thathave emerged from them. Explanations for the differences re-quire further analysis but do not appear to be related to theseverity of the economic changes. Secondly, it must be recogni-sed that it is difficult to measure the economic circumstances ofhouseholds in post-Soviet societies, given both the range ofsources of income and the reliance of many household mainlyor in part of the produce of their plots of land. In this situationit should be recognised that the combination of the influence ofsubjective and more objective material influences on happinessand, especially, general satisfaction might be a strong indicatorof the ‘‘real’’ influence of material circumstances.
ACKNOWLEDGEMENT
This paper is based on work produced as part of the LivingConditions, Lifestyles and Health Project (LLH) funded by theEU under INCO-Copernicus. The authors alone remain respon-sible for the content of this paper.
PAMELA ABBOTT AND ROGER SAPSFORD282
APPENDIX
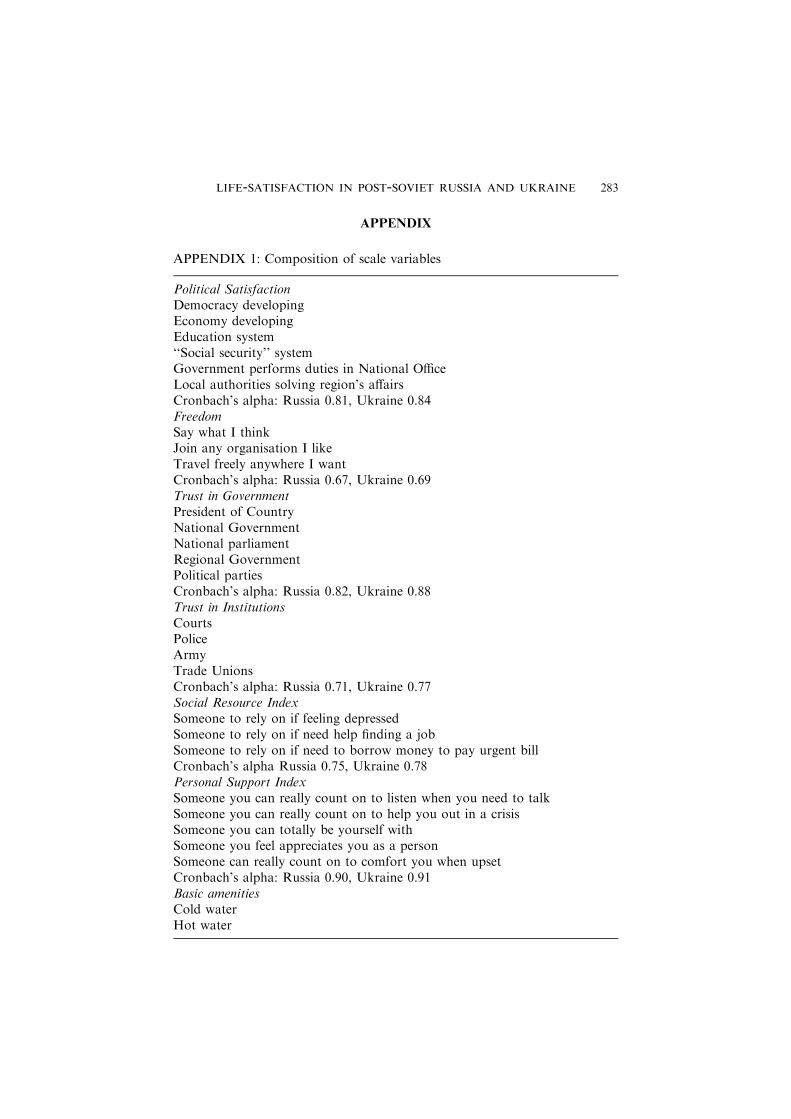
APPENDIX 1: Composition of scale variables
Political SatisfactionDemocracy developingEconomy developingEducation system‘‘Social security’’ systemGovernment performs duties in National OfficeLocal authorities solving region’s affairsCronbach’s alpha: Russia 0.81, Ukraine 0.84FreedomSay what I thinkJoin any organisation I likeTravel freely anywhere I wantCronbach’s alpha: Russia 0.67, Ukraine 0.69Trust in GovernmentPresident of CountryNational GovernmentNational parliamentRegional GovernmentPolitical partiesCronbach’s alpha: Russia 0.82, Ukraine 0.88Trust in InstitutionsCourtsPoliceArmyTrade UnionsCronbach’s alpha: Russia 0.71, Ukraine 0.77Social Resource IndexSomeone to rely on if feeling depressedSomeone to rely on if need help finding a jobSomeone to rely on if need to borrow money to pay urgent billCronbach’s alpha Russia 0.75, Ukraine 0.78Personal Support IndexSomeone you can really count on to listen when you need to talkSomeone you can really count on to help you out in a crisisSomeone you can totally be yourself withSomeone you feel appreciates you as a personSomeone can really count on to comfort you when upsetCronbach’s alpha: Russia 0.90, Ukraine 0.91Basic amenitiesCold waterHot water
LIFE-SATISFACTION IN POST-SOVIET RUSSIA AND UKRAINE 283

REFERENCES
Abbott, P. and C. Wallace: 2004, Explaining economic and social transition inpost-Soviet Russia, Ukraine and Russia: the Social Quality approach. Paperpresented at the annual conference of the Sociological Association, York,April.
Alber, J. and U. Kohler: 2004, Health and Care in an Enlarged Europe.Dublin, European Foundation for the Improvement of Living and WorkingConditions.
Alexander, J.: 1997, ‘Surveying attitudes in Russia: A representation offormlessness’, Communist and Post-Communist Studies pp. 107–127.
Allart, E.: 1993, Having, loving, being: An alternative to the Swedish model ofWelfare Research, in M. Nussbaum and A.K. Sen (eds.), The Quality of Life(Clarendon Press, Oxford).
APPENDIX 1: Continued
WCBathroomKitchenCronbach’s alpha Russia 0.86, Ukraine 0.84Psychosocial HealthUnable to concentrateInsomniaFeel under constant strainLoosing confidence in selfOften shaking and tremblingFrightening thoughtsSpells of exhaustion/fatigueFeeling of stressCronbach’s alpha Russia 0.77, Ukraine 0.77Personal ControlCan’t overcome difficultiesUnable to enjoy normal day-to-day activitiesDissatisfied with workLife is too complicatedImpossible to influence things activitiesFeeling lonelyCronbach’s alpha Russia 0.68, Ukraine 0.68Well-being IndexGeneral SatisfactionHappinessCronbach’s alpha: Russia 0.64, Ukraine 0.65
The authors will supply on request details of the factor analysis for the scales.
PAMELA ABBOTT AND ROGER SAPSFORD284
Andreys, F.M. and S.B. Withey: 1976, Social Indicators of Well-Being(Plenum Press, New York).
Beck, W., M. Keizer, L.J.G. van der Maeson and D. Phillips: 2001, GeneralPaper on behalf of the first plenary of the Network Indicators of SocialQuality (European Foundation on Social Quality, Amsterdam).
Brunstein, J.C.: 1993, �Personal goals and subjective well-being: a longitudinalstudy�, Journal of Personality and Social Psychology 65, pp. 1061–1070.
Burawoy, M.: 1997, �The Soviet descent into capitalism�, American Journal ofSociology 2, pp. 1430–1444.
Burawoy, M., P. Krotov and T. Lytkina: (ND) Involution and Destitution:Russia’s Gendered Transition to Capitalism. University of California Press,Berkeley, CA.
Campbell, A., D.E. Converse and W.L. Rogers: 1976, The Quality ofAmerican Life (Russell Sage Foundation, New York).
Cockerham, W.C.: 1999, Health and Social Change in Russia and EasternEurope (Routledge, London).
Cornwell, J.: 1986, Hard-Earned Lives: Accounts of Health and Illness in EastEnd London (Tavistock, London).
Dasgupta, S.K.: 2002, Sense of well-being and perceived quality of life inCalcutta, in E.D. Diener and D.R. Rahtz (eds.), Advances in Quality of LifeTheory and Research (Kluwer, Dordrecht).
Delhey, J.: 2004, Life Satisfaction in an Enlarged Europe. European Foundationfor the Improvement of Living and Working Conditions, Berlin.
Diener, E. and C. Diener: 1996, �Most people are happy�, Psychological Science7, pp. 181–185.
Diener, E. and F. Fujita: 1995, �Resources, personal strivings and subjectivewell being: A nomothetic and ideographic approach�, Journal of Personalityand Social Psychology 68, pp. 126–135.
Diener, E., J. Horwitz and R.A. Emmons: 1985, �Happiness of the verywealthy�, Social Indicators Research 16, pp. 263–274.
Diener, E. and E. Suh: 1997, �Measuring quality of life: Economic, social andsubjective indicators�, Social Indicators Research 40, pp. 189–216.
Diener, E., E. Suh, R.E. Lucas and H.L. Smith: 1999, �Subjective well-being:Three decades of progress�, Psychological Bulletin 125, pp. 276–302.
Donovan, N. and D. Halpern: 2002, Life Satisfaction: The State of Knowledgeand Implications for Government (Strategy Unit, London).
Durkheim, E.: 1952, Suicide: A Study in Sociology (Routledge, London).Fehey, T. and E. Smyth: 2004, �Do subjective indicators measure welfare?�,European Societies 6, pp. 5–27.
Freedman, J. and P. Shaver: 1975, ‘What makes you happy questionnaire’,Psychology Today, 70.
Frey, B.S. and A. Stutzer: 2002, �What can economists learn from happinessresearch?�, Journal of Economic Literature 40, pp. 402–435.
LIFE-SATISFACTION IN POST-SOVIET RUSSIA AND UKRAINE 285
Glatzer, W.: 1991, Quality of life in advanced industrial countries: the case ofWest Germany, in F. StrackM. Argyle and N. Schwarz (eds.), SubjectiveWell-Being (Pergamon, Oxford).
Grazin, K.L. and L.M. Haggerd: 2000, An integrative explanation for qualityof life: development and test of a structural model, in E.D. Diener and D.R.Rahtz (eds.), Advances in Quality of Life Theory and Research (Kluwer,Dordrecht).
Kozma, A. and M.J. Stones: 1983, �Predictors of happiness�, Journal of Ger-ontology 38, pp. 626–628.
Kozma, E.S., S. Stone and M.J. Stones: 2002, Stability in components andpredictors of subjective well-being: Implications for SWB structure, in E.D.Diener and D.R. Rahtz (eds.), Advances in Quality of Life Theory andResearch (Kluwer, Dordrecht).
Larson, K.J., E. Diener and R.A. Emmons: 1985, �An evaluation of subjectivewell-being measures�, Social Indicators Research 17, pp. 1–18.
Lewinsohn, M., J.E. Redner and J.R. Seeley: 1991, The relationship betweenlife satisfaction and psychosocial variables: New perspectives, in F.StrackM. Argyle and N. Schwarz (eds.), Subjective Well-Being (Pergamon,Oxford).
McFarland, C. and R.J. Miller: 1994, �The framing of relative performancefeedback: Seeing the glass half empty or half full�, Journal of Personality andSocial Psychology 66, pp. 1061–1073.
Orlova, N. and P. Ronnes: 1999, �The crippling cost of an incomplete trans-formation: The case of Ukraine�, Post-Communist Economies 11, pp.373–397.
Oswald, A.J.: 1997, �Happiness and economic performance�, Economic Journal107, pp. 1815–1831.
Pomerleau, J., M. McKee, R. Rose, D. Balabanova and A. Gilmore: 2002‘Comparative Health Report: Health Conditions and Health Behaviours’, inC. Haerpfer (ed.), Living Conditions, Lifestyles and Health: Periodic Pro-gress Report No 2, Nov 2001–Oct 2002. Institute for Advanced Studies,Vienna.
Popay, J., C. Thomas, G. Williams, A. Gattrell and L. Bostock: 2003, �Aproper place to live: Health inequalities, agency and the normative dimen-sions of space�, Social Science and Medicine 57, pp. 55–69.
Redmond, G.: 2002, Social Monitor: the MONEE Project, CEE/CIS/Baltics.UNICEF Innocenti Research Centre, Florence.
Rose, R.: 1995, ‘Russia as an Hour-Glass society’, East European Constitu-tional Review 4, pp. 34–42.
Rose, R.: 2003, Health, Money and Well-Being: Subjective Responses to Post-soviet Transformations. Paper presented at the European Science Founda-tion, Paris, September.
Saris, W.: 2001, �What influences subjective well-being in Russia?�, Journal ofHappiness Studies 2, pp. 137–146.
PAMELA ABBOTT AND ROGER SAPSFORD286
Schutz, W.: 2000, Explaining Quality of Life: The Controversy betweenObjective and Subjective Variable. EU Reporting, Working Paper, Vienna.
Schyns, P.: 2001, �Income and satisfaction in Russia�, Journal of HappinessStudies 2, pp. 173–204.
Sen, A.K.: 1993, Capability and Well-Being, in M. Nussbaum and A.K. Sen(eds.), The Quality of Life (Clarendon Press, Oxford).
Siegrist, J.: 2000, �Place, social exchange and health: Proposed sociologicalframework�, Social Science and Medicine 51, pp. 1283–1293.
Sztompka, P.: 2002, �Cultural Trauma: The other face of social change�,European Journal of Social Theory 3, pp. 441–465.
van der Maesen, L. and M. Keizer: 2002, From Theory to Practice. EuropeanFoundation on Social Quality, Working Paper of the European Network onIndicators for Social Quality, Amsterdam.
Veenhoven, R.: 1984, Conditions of Happiness (Reidel, Dordrecht).Veenhoven, R.: 1991, Questions on happiness: Classical topics, modern an-swers, blind spots, in F. Strack, M. Argyle and N. Schwarz (eds.), SubjectiveWell-Being (Pergamon, Oxford).
Veenhoven, R.: 2001, �Are the Russians as unhappy as they say they are?�,Journal of Happiness Studies 1, pp. 33–46.
Veenhoven, R.: 2002, �Why social policy needs subjective indicators�, SocialIndicators Research 58, pp. 33–46.
World Bank, 1991, Human Development Report 199. World Bank, Wash-ington, DC.
World Bank, 2003, Human Development Report 200. World Bank Washing-ton, DC.
Yanitsky, O.N.: 2000, �Sustainability and risk: The case of Russia�, Innovations13, pp. 265–277.
Address for correspondence:PAMELA ABBOTTCaledonian Centre for Equality and DiversityGlasgow Caledonian UniversityG3 0BAGlasgowUK
E-mail: [email protected]
LIFE-SATISFACTION IN POST-SOVIET RUSSIA AND UKRAINE 287