Strategic Marketing Approach in B2B on example of Belarus ...
71
ASSOCIAÇÃO DE POLITÉCNICOS DO NORTE (APNOR) INSTITUTO POLITÉCNICO DE BRAGANÇA Strategic Marketing Approach in B2B on example of Belarus and Portugal Pavel Panarad Final Dissertation submitted to Instituto Politécnico de Bragança To obtain the Master Degree in Management, Specialisation in Business Management Supervisors: Paula Odete Fernandes Svetlana Razumova Bragança, July, 2017.
-
Upload
khangminh22 -
Category
Documents
-
view
1 -
download
0
Transcript of Strategic Marketing Approach in B2B on example of Belarus ...

ASSOCIAÇÃO DE POLITÉCNICOS DO NORTE (APNOR)
INSTITUTO POLITÉCNICO DE BRAGANÇA
Strategic Marketing Approach in B2B on example of Belarus and
Portugal
Pavel Panarad
Final Dissertation submitted to Instituto Politécnico de Bragança
To obtain the Master Degree in Management, Specialisation in Business
Management
Supervisors:
Paula Odete Fernandes
Svetlana Razumova
Bragança, July, 2017.

iii
Abstract
The aim of the research is to study practical application of the strategic marketing system by the
companies of the machinery-producing industry and to develop recommendations on its enhancement,
to study specifics and effectiveness of strategic marketing on the example of companies in Belarus and
Portugal and to determine their differences.
All in all, the researchers agree that the elements playing critical role in managing marketing performance
are data, analytics and metrics (Patterson, 2015).
Required data has been obtained via the questionnaire; 13 Belarusian and 23 Portuguese companies
were interviewed. The survey determined that companies in the industry apply marketing only on a basic
level, missing benefits from elements such as performance metrics, customer orientation, benchmarking,
etc.
As a result of this work, the following research hypotheses were confirmed: There is a positive
association between return on sales and marketing strategy; return on sales and degree of flexibility of
marketing strategy; return on sales and degree of business collaboration in marketing. In addition, it was
determined that number of monitored metrics has a statistically significant impact on return on sales, and
there is a statistically significant difference in marketing system depth between the countries. This data
provides ground to help the management in creating marketing strategies, which will help establish a
definitive vision of what should be done to save current market share, to find new markets for
development, to plan more effective internal work.
Keywords: B2B; Strategic marketing; Performance metrics; Competition; Marketing automation;
Collaboration; Benchmarking.

iv
Resumo
O objetivo do presente trabalho assenta em estudar a aplicação prática do sistema de marketing
estratégico pelas empresas do setor de produção de máquinas e desenvolver recomendações sobre o
seu aperfeiçoamento, estudar especificidades e a eficácia do marketing estratégico tendo por base
algumas empresas na Bielorrússia e de Portugal e determinar as suas diferenças.
Em suma, os investigadores concordam que os elementos que desempenham um papel crítico na
gestão do desempenho de marketing são dados, análises e métricas (Patterson, 2015).
Os dados necessários foram obtidos através da aplicação de um inquérito por
questionário; nomeadamente a 13 empresas bielorrussas e 23 portuguesas. A investigação determinou
que as empresas da indústria aplicam técnicas de marketing apenas num nível básico, perdendo
benefícios de elementos como métricas de desempenho, orientação para o cliente, benchmarking, etc.
Como resultado deste trabalho, as seguintes hipóteses de pesquisa foram confirmadas: existe uma
associação positiva entre retorno de vendas e estratégia de marketing; Retorno sobre as vendas e grau
de flexibilidade da estratégia de marketing; Retorno sobre vendas e grau de colaboração comercial em
marketing. Além disso, foi determinado que o número de métricas monitorizadas tem um impacto
estatisticamente significativo no retorno sobre as vendas, e há uma diferença estatisticamente
significativa na profundidade do sistema de marketing entre os países. Os resultados obtidos fornecem
condições para ajudar a direção de uma empresa na criação de estratégias de marketing que permitem
ajudar a estabelecer uma visão definitiva do que deve ser feito para economizar a participação no
mercado atual, para encontrar novos mercados para o desenvolvimento, para planear um trabalho
interno mais efetivo.
Palavras-Chave: B2B; Estratégia; Marketing; Desempenho métrico; Competição; Sistematização de
Marketing; Colaboração; Benchmarking.

v
Реферат
Целью настоящего исследования является изучение практического применения системы
стратегического маркетинга компаниями машиностроения и разработка рекомендаций для её
совершенствования, изучение специфики и эффективности стратегического маркетинга на
примере предприятий Беларуси и Португалии и определение их различий.
В целом, исследователи соглашаются с тем, что элементами, играющими критическую роль в
управлении маркетинговой эффективностью, являются данные, аналитика и метрики (Patterson,
2015).
Необходимые для настоящего исследования данные были получены с помощью анкетирования;
были опрошены 13 белорусских и 23 португальские компании. Опрос позволил определить, что
предприятия отрасли применяют маркетинг только на базовом уровне, упуская преимущества
таких элементов, как показатели эффективности, клиентоориентированность, бенчмаркинг и т.д.
В результате работы, следующие исследовательские гипотезы были подтверждены: Существует
положительная связь между рентабельностью продаж и маркетинговой стратегией;
рентабельностью продаж и степенью гибкости маркетинговой стратегии; рентабельностью
продаж и степенью коллаборации в маркетинге. Также было определено, что количество
отслеживаемых показателей имеет статистически значимое влияние на глубину маркетинговой
системы по странам. Эти данные дают возможность менеджменту предприятий создавать
маркетинговые стратегии, которые позволят определить, что необходимо сделать для
сохранения доли рынка, поиска новых рынков и планирования более эффективной внутренней
работы.
Ключевые слова: B2B; Стратегический маркетинг; Показатели эффективности; Конкуренция;
Автоматизация маркетинга; Коллаборация; Бенчмаркинг.

vi
Acknowledgements
I would like to thank professors Paula Odete Fernandes and Svetlana Razumova for providing all
guidance necessary for creation of this work. Also I express my gratitude to Polytechnic Institute of
Bragança and International Credit Mobility programme for giving me the opportunity to be here.

vii
Table of Contents
List of Figures ......................................................................................................................................... viii
List of Tables ............................................................................................................................................ ix
Introduction ............................................................................................................................................... 1
1. The concept of marketing strategy and the process of strategic marketing planning in B2B sector ... 2
1.1. B2B marketing: what makes it special .............................................................................................. 2
1.2. Marketing models and frameworks ................................................................................................. 10
1.3. Marketing performance measurement and management ............................................................... 21
2. Strategic marketing implementation in machine construction industry .............................................. 25
2.1. Economic state of the industry ........................................................................................................ 25
2.2. Competitiveness analysis of the industry ........................................................................................ 28
2.3. Prospects for the development of the target markets and segments ............................................. 30
3. Research Methodology ...................................................................................................................... 33
3.1. Objective of the study and Research Hypothesis ........................................................................... 33
3.2. Description of Data Collection ......................................................................................................... 34
3.3. Description of Data Analysis ........................................................................................................... 34
4. Marketing strategy implementation for market penetration ................................................................ 36
4.1. Machinery-producing industry: Belarus vs. Portugal ....................................................................... 36
4.2. Research hypothesis confirmation .................................................................................................. 49
4.3. Recommendations for implementing and enhancing marketing strategies .................................... 51
Conclusions, Limitations and Future Research Lines ............................................................................ 53
References ............................................................................................................................................. 56
Appendix ................................................................................................................................................. 59

viii
List of Figures
Figure 1. Levels of marketing channels for consumer markets. ............................................................ 14
Figure 2. Industrial Production Index in constant prices, % to previous year. ....................................... 27
Figure 3. Investments in machine construction industry, million € and % of all investments................. 27
Figure 4. Export and import of machine construction products. ............................................................. 28
Figure 5. Usage of industrial capacities by several types of machinery production. ............................. 29
Figure 6. Employee age. ........................................................................................................................ 36
Figure 7. Number of employees. ............................................................................................................ 37
Figure 8. Employee gender. ................................................................................................................... 37
Figure 9. Years in the market. ................................................................................................................ 38
Figure 10. Return on Sales. ................................................................................................................... 38
Figure 11. Marketing strategy application. ............................................................................................. 39
Figure 12. Marketing strategy flexibility. ................................................................................................. 40
Figure 13. Marketing mix models. .......................................................................................................... 40
Figure 14. Marketing automation application. ........................................................................................ 43
Figure 15. Collaboration. ........................................................................................................................ 44
Figure 16. Marketing budget. ................................................................................................................. 46
Figure 17. Marketing budget changes. ................................................................................................... 46

ix
List of Tables
Table 1. Main characteristics of the buy classes. ..................................................................................... 8
Table 2. Comparative characteristics of consumer and B2B markets. .................................................. 10
Table 3. Types of B2B market goods. .................................................................................................... 11
Table 4. Marketing practice differences. ................................................................................................ 16
Table 5. SAVE model elements. ............................................................................................................ 21
Table 6. Economic state of machine construction industry. ................................................................... 26
Table 7. Development program of the industrial complex plans. ........................................................... 31
Table 8. Research hypotheses and statistical test used. ....................................................................... 35
Table 9. Performance metrics application – Belarus.............................................................................. 41
Table 10. Performance metrics application – Portugal. ......................................................................... 42
Table 11. Performance metrics application – average. .......................................................................... 43
Table 12. Benchmarking – Belarus. ....................................................................................................... 44
Table 13. Benchmarking – Portugal. ...................................................................................................... 45
Table 14. Benchmarking – average. ...................................................................................................... 45
Table 15. Marketing involvement – Belarus. .......................................................................................... 47
Table 16. Marketing involvement – Portugal. ......................................................................................... 48
Table 17. Marketing involvement – average. ......................................................................................... 48
Table 18. Research hypothesis confirmation. ........................................................................................ 49

1
Introduction
Working under ineffective and outdated economic model that includes strict production and sales plans
as well as vast state support, Belarusian machinery-producing companies don’t have a well-developed
practice of setting and analysing strategic marketing indicators, which has a negative influence on
businesses’ long-term effectiveness. In 2015, the production of machinery and equipment occupied 7,6%
of the total industrial production, average return on sales was 10,2%, while 33,8% of the companies
reported a net loss (Belstat, 2016). Portuguese companies, however, working in a highly competitive
environment of European Union, have a far better experience in applying different strategies.
Marketing performance management has been one of the most prominent streams in recent marketing
research and practice. In fact, the Marketing Science Institute has ranked marketing accountability,
return on marketing investments and marketing performance management systems among the top 10
research priorities (Mone, Pop & Racolṭa-Paina, 2013). Furthermore, as stated by Grønholdt, Martensen,
Jørgensen, and Jensen (2014), investors’ requirements of measuring marketing performance tend to
increase, which makes the task of determining precise marketing indicators more important.
In this sense, the aim of the research is to study practical application of the strategic marketing system
by the companies of the machinery-producing industry and to develop recommendations on its
enhancement; to study specifics and effectiveness of strategic marketing on the example of companies
in Belarus and Portugal and to determine their differences.
Research objectives include determining the current situation regarding strategic marketing
implementation by the companies of the machine construction industry, checking if various marketing
elements impact financial performance and establishing differences in practical marketing development
between the two countries.
Research questions will be answering with the help of descriptive analysis and non-parametric statistical
tests.
The first chapter of the thesis contains review of the relevant literature; the second chapter describes the
economic state of Belarusian machine construction industry; the third chapter explains the nature of
conducted survey; and the results of the survey are reviewed in the final chapter.

2
1. The concept of marketing strategy and the process of strategic
marketing planning in B2B sector
1.1. B2B marketing: what makes it special
The market for goods and services bought and sold between businesses is huge. Far larger than the
consumer market, the business market comprises many types and sizes of organizations that interact
selectively and form relationships of varying significance and duration with one another. Although these
organizations are often structurally and legally independent entities, a key characteristic is that they are
also interdependent. That is, they have to work with other organizations to varying degrees in order to
achieve their goals.
B2B marketing (Business to Business) is fundamentally different from consumer goods or services
marketing because buyers do not consume the products or services themselves. Unlike consumer
markets, where goods and services are consumed personally by the people who buy them, the essence
of business markets is that individual organizations undertake the act of consumption.
It is important to note that, although there are several vital differences to consumer marketing,
organizations, which have a market orientation, regardless of the sector in which they operate, share at
least two key similarities:
1. Both have a customer orientation and work backwards from an understanding of customer needs.
2. Both need the ability to gather process and use information about customers and competitors in order
to achieve their objectives.
This market orientation is an essential foundation upon which to begin exploring the exciting and dynamic
world of business markets and the contribution of B2B marketing.
Business markets are characterized by a number of factors, the main ones being the nature of demand,
the buying processes, international dimensions and, perhaps most importantly, the relationships that
develop between organizations in the process of buying and selling (Fill & McKee, 2012).

3
One of the key factors is the nature of demand in business markets. Three aspects of demand are
considered: derivation, variance and elasticity.
Derived demand. It is the convention in marketing to treat demand by consumers as direct and demand
from businesses as derived. This idea originated with the economist Alfred Marshall. At its simplest, it is
supposed that consumers only buy goods and services to satisfy their wants, whereas businesses only
buy things to facilitate the production of goods and services. In this case, consumer demand is wholly
direct while business demand is wholly derived. So there is a chain derived demand: for example, final
consumer demand (direct demand) for cars and diesel fuel creates a derived demand for steel (to
manufacture cars), ships (to transport crude oil), and many other goods and services besides. The whole
chain of derived demand is driven by the direct demand of consumers (Fill & McKee, 2012).
The accelerator effect. The most straightforward implication of derived demand in business markets is
that marketers must be aware of developments, both upstream and downstream, that may affect their
marketing strategy. In particular, it is downstream demand that “drives” the level of derived demand in a
specific business market. This is obvious – if the demand for new housing increases then clearly after a
time lag, the derived demand for housing materials such as steel and wood will also increase. In due
course, the derived demand for capital equipment used in the construction industry, such as backhoe
leaders and cement mixers, may well also rise (Fill & McKee, 2012).
However, what is less obvious is that the percentage change of original demand. This phenomenon can
occur in capital equipment industries, and is known as the accelerator effect. Despite various objections,
there is a considerable evidence that the acceleration principle plays a substantial role in explaining the
demand for capital equipment.
Concentration ratio. Business-to-business markets in general are characterized by a higher
concentration of demand than consumer markets. The standard measure that is used is the
concentration ratio. A concentration ratio is defined as the combined market shares of the few largest
firms in the market – what is known as the “oligopoly group” in the market. For purposes of economic
analysis and economic policy, concentration ratios are important, because it is supposed that the higher
the concentration ratio, the more likely it is that firms in an industry will collude to raise prices above
those that would be found in a truly competitive market. Economists also theorize that where
concentration ratios are relatively high, industry will be less innovative and production volumes less
stable (Fill & McKee, 2012).
The perspective taken by economists, when studying concentration ratios, is generally that of the
customer of the industry in question and the economic efficiency of the structural conditions of the
industry. To the business marketer it is the perspective of the industry supplier that is generally most
relevant, along with the implications of the industry structure for sales and marketing strategy. While
economists are generally most concerned about the monopoly power that businesses have over their
customers because of the concentration of market share, business marketers are usually more

4
interested in the monopsony power that businesses have with respect to their suppliers because of the
concentration of buying power. The degree of monopsony power in the supply market is symmetrical
with the degree of monopoly power in the customer market; those firms that control large shares of the
customer market are also the largest customers for suppliers to the industry. Therefore, the researchers
use the concentration ratio (concentration of market share) as a proxy for the concentration of buying
power within an industry.
An understanding of derived demand, the accelerator effect and concentration ratios provides a basis
for analyzing many of the structural differences between typical consumer and business markets.
However, there are other systematic differences between consumer and business markets. Demand
elasticity is one of these dimensions: first, it is argued that businesses have less freedom simply to stop
buying things than consumers, so that business demand is likely to be less price elastic (that is, less
responsive to price changes) than consumer market demand. Second, it has been suggested that there
will be more instances of reverse price elasticity of demand in business markets, that in consumer
markets. Both of these hypotheses about demand elasticity arise from the nature of derived demand and
assumptions about the availability of substitutes for the inputs to critical business processes. Businesses
need critical inputs if they are to continue trading (Brennan, Canning, & McDowell, 2017).
International aspects. Increasingly B2B organizations are engaging in international markets. Advances
in technology, most notably the Internet, have enabled organizations to do business more or less
anywhere. In comparison to consumer markets, international business is easier. In B2C markets, there
are a wide range of issues concerning the culture and values that consumers hold, and how products
and promotional activities need to be adapted to accommodate color, ingredient, style, buying processes,
packaging and language requirements to ensure success. By contrast, B2B organizations benefit from
a lower diversity in product functionality and performance. This is partly because of the inherent nature
of the products and materials but also due to various trading associations across the world agreeing
standards relating to content and performance. For example, the steel, plastic, chemicals and paper
industries all have common agreed standards, which facilitate the interorganisational exchange process.
Thus, B2B organizations are able to work together to help shape their trading environment.
Relationships. A fundamentally key characteristic of business marketing concerns the significance of
relationships. In B2C markets relationships between manufacturer and consumer, or reseller and
consumer have been regarded, at least in the past, as relatively weak and unimportant. Although many
organizations have now recognized the importance of developing these relationships, the nature of the
products, their perceived value to consumers, and competitive factors, particularly in the fast-moving
consumer goods (FMCG) markets, suggests that such relationships will remain difficult and costly to
establish and maintain. In B2B markets, by contrast, the development and maintenance of positive
relationships between buying and selling organizations is pivotal to success. Collaboration and
partnership over the development, supply and support of products and services is considered a core

5
element of B2B marketing. Unlike consumer markets, where relationships are often considered to
revolve around an active seller and a passive buyer, understanding of relationships in B2B markets now
encompasses networks of relationships in which participants are regarded as interactive. This means
that both buyers and sellers are actively involved in initiating and maintaining relationships. All parties to
a network have the capability to influence a wide range of relationships, either directly or indirectly.
The importance of this aspect of B2B marketing cannot be underestimated nor should it be understated.
This book adopts a relationship-based marketing perspective and seeks to explore and establish ways
in which technology is used by organizations to enhance their relationships with key stakeholders (Fill &
McKee, 2012).
Business market customers can be broadly classified into three categories:
1. commercial customers (manufactures, construction companies, service firms, wholesalers, retailers);
2. Institutional customers (schools, colleges, universities, health-care organizations, foundations);
3. governmental customers (state government: defense, non-defense, local government (Hutt & Speh,
2012).
Commercial organizations. There are three main sectors in commercial B2B, all characterized by the
different ways in which they use products and services, some researchers add retailers as forth sector.
They share common buyer behavior characteristics and associated communication needs. These four
commercial organizational types are:
1. Distributors - include commercial enterprises that purchase industrial goods for resale (in basically
the same form) to users and OEM (Original Equipment Manufacturer). The distributor accumulates,
stores, and sells a large assortment of goods to industrial users, assuming title to the goods it purchases.
2. Original equipment manufacturers - purchases industrial goods to incorporate into other products it
sells in the business or ultimate consumer market. For example, Intel Corporation produces the
microprocessors that constitute the heart of Dell’s personal computer. In purchasing these micro-
processors, Dell is an OEM.
3. Users - purchase industrial products or services to produce other goods or services that are, in turn,
sold in the business or consumer markets.
4. Retailers - a retailer’s customer is an end-user, the consumer. Retailers need to purchase goods in
order to offer them to consumers but the buying processes, although similar, are not always as complex
or as intricate as those in the DMU (Decision Making Unit).
Government. Governments, and related institutions, are responsible for a huge volume and enormous
value of business purchases. Health, environmental protection, education, policing, transport, national
defense and security are just some of the areas that attract funding and sellers. The procedures and
guidelines relating to buying behavior in a government context are in many ways radically different from
those encountered in commercial organizations. However, despite many of the differences outlined

6
below, the principle remains that a continual focus on customer needs is paramount. Suppliers that fail
on a regular basis to win government business might well be too product-orientated. Many of the larger
projects that concern governments and associated ministries are massive, complex and involve a huge
number of stakeholders.
Of the many differences between government and private commercial purchasing, there are the more
prominent: political objectives, budget policies, accountability and directives.
Institutions. There are a range of other organizations, which are neither entirely governmental nor
private and commercial in nature. For example, there are not-for-profit organizations such as churches
and charities, there are government-related organizations such as hospitals, schools, museums, libraries
and universities and there are community-based organizations such as housing associations. All these
organizations need to buy a range of goods, materials and services as part of their drive to satisfy their
customers` needs.
In many respects, these organizations adopt some of the characteristics associated with both
commercial and government markets. Purchasing in some institutional markets can be significantly
constrained by political influences (for example, schools under the direct control of local education
authorities) while in others the drive for corporate efficiency is an over-riding influence. One of the main
characteristics of this market is the willingness of organizations to unite to form large buying groups (Fill
& McKee, 2012).
Behavior. One of the main characteristics is that there are far fewer buyers in organizational markets
than in consumer markets. Even though there may be several people associated with a buying decision
in an organization, the overall number of people involved in buying, say, packaging products or road
construction equipment is very small com- pared with the millions of people who might potentially buy a
chocolate bar. The financial value of organizational purchase orders is invariably larger and the
frequency with which they are placed is much lower. It is quite common for agreements to be made
between organizations for the supply of materials over a number of years. Similarly, depending upon the
complexity of the product (for example, photocopying paper or a one-off satellite), the negotiation
process may also take a long time. Although there are differences, many of the characteristics associated
with consumer decision making processes can still be observed in the organizational context. However,
organizational buyers make decisions which ultimately contribute to the achievement of corporate
objectives. To make the necessary decisions, a high volume of pertinent information is often required.
This information needs to be relatively detailed and is normally presented in a rational and logical style.
The needs of the buyers are many and complex and some may be personal. Goals, such as promotion
and career advancement within the organization, coupled with ego and employee satisfaction combine
to make organizational buying an important task, one that requires professional training and the
development of expertise if the role is to be performed optimally (Fill & McKee, 2012).

7
Decision making units. Reference has been made on a number of occasions to organizational buyers,
as if such people are the only representatives of an organization to be involved with the purchase
decision process. This is not the case, as very often a large number of people are involved in a purchase
decision. This group is referred to as either the decision making unit (DMU) or the buying center. DMUs
vary in size and composition in accordance with the nature of each individual task.
1. Initiators request the purchase of an item and propel the purchase decision process. They may be
other members of the DMU or others in the organization. Users may not only initiate the purchase
process but are sometimes involved in the specification process. They will use the product once it has
been acquired and subsequently evaluate its performance. Their role is continuous, although it may vary
from the peripheral to highly involved.
2. Influencers very often help set the technical specifications for the proposed purchase and assist the
evaluation of alternative offerings by potential suppliers. These may be consultants hired to complete a
particular project. This is quite common in high- technology purchases where the customer has little
relevant expertise.
3. Deciders are those who make purchasing decisions and they are the most difficult to identify. This is
because they may not have formal authority to make a purchase decision yet are sufficiently influential
internally that their decision carries most weight. In repeat buying activities the buyer may well also be
the decider. However, it is normal practice to require that expenditure decisions involving sums over a
certain financial limit be authorized by other, often senior, managers.
4. Buyers (purchasing managers) select suppliers and manage the process whereby the required
products are procured. As suggested previously, buyers may not decide which product is to be
purchased but they influence the framework within which the decision is made.
5. Gatekeepers have the potential to control the type and flow of information to the organization and the
members of the DMU. These gatekeepers may be assistants, technical personnel, secretaries or
telephone switchboard operators.
The size and form of the buying center is not static. It can vary according to the complexity of the product
being considered and the degree of risk each decision is perceived to carry for the organization. Different
roles are required and adopted as the nature of the buying task changes with each new purchase
situation. All of these roles might be subsumed within one individual for certain decisions. It is vital for
seller organizations to identify members of the buying center and to target and refine their messages to
meet the needs of each member of the center.
The effect of risk on buying teams. The use of purchasing teams and the effort that is put in to the
process by these teams is primarily linked to the risk attached to the purchasing decision. Normally
perceived risk will be heightened in new task buying or more complex modified re-buy situations. As the
level of risk increases:

8
- the buying center composition changes, both in terms of the number of members and the authority of
those members;
- the buying team actively searches for information and uses a wide range of sources, including personal
contacts, to guide the decision process;
- members of the buying team invest effort in the process and consider each stage of it more deliberately;
and
- suppliers with a proven track record tend to be preferred by the buying team (Brennan, Canning, &
McDowell, 2017).
The decision-making process. Organizational buying decisions vary in terms of the nature of the
product or service, the frequency and the relative value of purchases, their strategic impact (if any) and
the type of relationship with suppliers. These, and many other factors, are potentially significant to
individual buying organizations. However, there are some broad criteria that can be characterized within
three main types of buying situations: new task, modified rebuy and straight rebuy (see Table 1) (Fill &
McKee, 2012).
Table 1. Main characteristics of the buy classes.
Buyclass Degree of familiarity
with the problem
Information
requirements Alternative solutions
New buy The problem is fresh to
the decision makers
A great deal of
information is required
Alternative solutions are
unknown, all are
considered new
Modified rebuy
The requirement is not
new, but is different from
previous situations
More information is
required, but past
experience is of use
Buying decision needs
new solutions
Rebuy The problem is identical
to previous experience
Little or no information is
required
Alternative solutions not
sought or required
Source: Adapted from Fill and McKee (2012, p. 68).
Purchasing consists out of a number of linked activities:
1. Need/problem recognition; purchases are triggered by the need to solve problems or the drive to
improve its operational performance/pursue new market opportunities.
2. Determining product specification; based on the satisfaction of supply need, the company draws up
specifications. For vendors, this stage in the buying process can be critical. If they manage to get involved
in this stage, they might be able to lock out competing suppliers.
3. Supplier and product search; here the buyer will look for organizations that can satisfy the company’s
supply requirements.

9
4. Evaluation will normally consider the compatibility of a supplier’s proposal against the buying
company’s product specification and an assessment of the supplier organization itself.
5. Selection of order routine; once a supplier has been chosen, the purchasing officer will be responsible
for negotiating and agreeing processes for order delivery and payment.
6. Performance feedback and evaluation (Brennan, Canning, & McDowell, 2017).
Business marketers have to be aware that purchasing decisions are made by people, not by the
organizations they represent. Therefore, it’s needed to consider personal factors. In other words,
understanding of what makes managers tick to try to influence the behavior of key players in the buying
company: risk taking/aversion, rewards (for good performance, e.g. good purchase decisions) and
backgrounds (education, experience etc.) is required.
The purchasing professional. The scope of the purchasing manager’s responsibilities will vary, but
generally they have to be familiar with a firm’s specific needs and must be able to use negotiating
techniques and pricing methods so that purchase costs can be minimized. There is a set of generic tasks
that purchasers have to perform and skills they need to enable them to do this:
- consulting with colleagues in other departments;
- determining the necessary parts, materials, services and supplies;
- calculating needed volume;
- searching for suppliers and requesting quotations;
- negotiating contracts; and monitoring the performance of the organization’s various suppliers.
The effect of information technology on purchase behavior. Next to the costs incurred in the actual
purchase of an item, buying companies incur many costs in the actual process. IT has significantly
reduced these costs through making it easier to communicate to the external market, but also improve
communication within the organization.
Communicating with external markets. In recent years, the growth of electronic markets was highly
boosted. These are essentially online markets, where companies are able to exchange information, do
business and collaborate with each other. Many are run by independent third parties and can be
accessed by buyers and sellers in a particular industry or region. Others operate as industry consortiums,
in which a limited number of companies either combine their supply capabilities in order to deal with a
large customer base, or combine their product requirements in order to deal with known suppliers and
so improve the efficiency of the purchasing process.
There are horizontal marketplaces, which are used by buyers for items that do not contribute directly to
the company’s own product; and there are vertical marketplaces in order to buy and sell items that
contribute directly to a product chain.

10
Internal coordination of buying activities. The range of products bought the different departments
that have some purchasing authority and the geographical dispersion of many decision-makers present
many large organizations with a major challenge in trying to operate a more efficient purchasing process.
However, IT implementation has so far been very helpful in coordinating a more centralized and
structured approached to procurement.
Inter- and intra-firm coordination. For companies whose purchasing orientation centers around supply
management, the ability to minimize waste and costs along its supply chain is critical. To do this,
companies will align their administrative and operational activities and the flow of materials between the
various parties in the supply chain. IT is essential to the firm’s capacity to do this (Brennan, Canning, &
McDowell, 2017).
So, in conclusion we can summarize all significant differences of consumers and B2B markets in the
Table 2.
Table 2. Comparative characteristics of consumer and B2B markets.
Consumer markets B2B markets
Purchase orientation to satisfy Individual or family needs Organizational needs
Number of decision makers Small Large
Length of decision time Short and simple Long and complex
Size of purchase Small quantities Large in value and volume
Consequence of poor purchase Limited Potentially critical
Nature of product/service Standard range of products Customized packages
Channel configuration Complex and long Simple and short
Promotion focus Psychological benefits Economic/utilitarian benefits
Primary promotional tool Advertising Personal selling
Supplier switching costs Limited Large
Source: Adapted from Fill and McKee (2012, p. 18).
Conclusions. The key distinguishing feature of a b2b market is that the customer is an organization
rather than an individual consumer. Both tend to buy similar products and therefore one cannot
distinguish unambiguously between a business market and a consumer market on the basis of the nature
of the product. The differences of B2B markets can be broadly categorized into three major sections:
market structure differences, buying behavior differences, and marketing in practice differences.
1.2. Marketing models and frameworks
Marketing as we know is the activity, set of institutions, and processes for creating, communicating,
delivering, and exchanging offerings that have value for customers, clients, partners, and society at large.
Since the inception of marketing as a separate function of management, it has grown from being an
operational function to a strategic one. Many of the authors today view marketing as a dominating

11
function, which holds way over the rest of the functions of a business activity. Since the day concept of
marketing has evolved, much has been written, proposed and discussed about its nature, scope,
activities it encompasses and so on. A constant effort has been underway to make marketing relevant in
each period. Theories and principles have changed over a period of time to accommodate fresh ones
that are in line with the demands of the current times. Therefore, one model has remained there for a
very long period, the 4Ps model of marketing mix.
Marketing mix is the set of controllable tactical marketing tools that the firm blends to produce the
response it wants in the target market. The concept of marketing mix was then popularized by E. Jerome
McCarthy with the help of 4Ps model in 1960. The parts in original marketing mix included product,
planning, pricing, branding, distribution channels, personal selling, advertising, promotions, packaging,
display, servicing, physical handling, fact finding and analysis. E. Jerome McCarthy later grouped these
ingredients into the four categories (product, place, pricing, promotion) that today are known as the 4Ps
of marketing (Wani, 2013).
Products. In consumer markets products are traditionally made available with limited opportunities for
adaption or customization. Increasingly, manufacturers are seeking ways in which customers feel they
can customize the product. For example, some cars can be ordered via a dealer showroom directly from
the production unit. This enables customers to specify the interior and exterior finishes, grade of in-car
entertainment and perhaps a range of other cosmetic touches. However, the norm is to provide relatively
little flexibility within different product ranges. In the B2B market the entire offering (product and service
components) can often be reconfigured to meet a customer’s particular requirements. It is quite usual
for more technical products to be developed and specified through joint negotiations and partnership
arrangements. The result is an offering that is unique to the buying organization.
Following the examination of market characteristics and customers in the B2B sector, this section
highlights the variety and complexity of the goods and services that are bought and sold. It is possible to
discern three main categories of goods. These are input goods, equipment goods and supply goods (see
Table 3).
Table 3. Types of B2B market goods.
Type of goods Explanation
Input goods Raw materials and semi-manufactured parts, which
become part of the finished item.
Equipment goods
Capital items that are not part of the finished item but
necessary to enable production process to take place
(e.g. land and buildings).
Supply goods Materials necessary to keep the production process
running (e.g. electricity and oil).
Source: Adapted from Fill and McKee (2012, p. 16).

12
Hutt and Speh (2012) add business services as facilitating goods. Business services include
maintenance and repair support (for example, machine repair) and advisory support (for example,
management consulting or information management). Like supplies, services are considered expense
items.
Pricing. Price is a measure of the value that both parties assign to their contribution to an exchange. In
consumer markets, list prices are usually the norm and limited discounts applied to them, especially for
more expensive items. Hire purchase and credit-based schemes are designed to spread the financial
risk, make purchase more accessible for a greater number of consumers and so increase the perceived
value to a consumer. Negotiation is not usually a feature of pricing in consumer markets, the exceptions
being cars and houses. In business markets the designated value is likely to increase as a relationship
becomes more collaborative and partnership-orientated. Therefore, prices associated with transaction
exchanges will be based largely on list prices, quantity discounts and competitive bidding. As exchanges
become more relational, so price becomes an integral part of the design, specification, development,
trial and finishing processes. Discounts and allowances become more varied and complicated and reflect
the risks and opportunities faced by the two parties. Negotiation becomes an important aspect of pricing
in B2B markets. Large projects and intricate technical offerings often require complex financing
arrangements, while pricing for international markets introduces new risks and financial uncertainties
(Fill & McKee, 2012). There are 3 important “C” affecting the price:
1. Costs. The relevant costs associated with making a product or delivering a service determine the
price floor, the benefits that the customer perceives the product or service to deliver determine the price
ceiling, while the intensity of competition and the strategies of competitors affect the feasible pricing
region that lies between the costs floor and the customer benefits ceiling.
2. Customers: In making pricing decisions managers are forced to make assumptions about demand
responsiveness, which is most conveniently measured using the elasticity of demand with respect to
price (demand elasticity). If demand is normal, quantity demanded declines continuously as the price
rises, if perverse - above a certain price the demand curve is “normal” and demand declines as price
increases, but below that price demand declines as the price decreases. In case of elastic demand
increase of price reduces revenue, cut of price increases revenue; in case of inelastic demand increase
of price increases revenue, cut of price decreases revenue.
3. Competitors. In practice, virtually all markets lie nowhere the extremes of perfect competition or a
monopoly. Instead, most markets are dominated by a few dominant players. Each with a substantial
market share. These are the conditions of an oligopoly. The key feature of an oligopoly, is that the
decision of a company directly affects its competitor (interdependence), which means that in terms of
economic theory there is no determinate solution to the strategic problems of oligopoly, and oligopoly
can be conveniently analyzed as a formal game (hence, game theory). If one firms cut its prices and
increases its market share, then that market must have been lost by one or more rivals. Under an
oligopoly there is always the danger of price wars, which reduced profit for all firms.

13
Pricing is an aspect of the marketing mix within which ethical issues often arise. The principal ethical
issues that arise concerning B2B pricing decisions are anti-competitive pricing, price fixing, price
discrimination, and predatory pricing or dumping. Anti-competitive pricing occurs where a group of
producers collude to raise prices above the level that would apply in a freely operating market.
Companies may also feel tempted to enter into explicit price-fixing arrangements to reduce risks of price
wars. Unethical pricing practices arise particularly in industries where competitive tendering is in common
use. Collusive tendering occurs where there is an exclusive agreement between competitors, either to
tender or to tender in such a manner as not to be competitive with one of the other tenderers. One of the
organs, controlling the procurement process is the World Bank. It works to ensure that procurement in
Bank-financed projects and programs is conducted in accordance with its Articles of Agreement, which
require increasing the efficiency, fairness, and transparency of procurement. Similar rules and document
regarding procurement process are developed by Organization for Economic Co-operation and
Development (Brennan, Canning, & McDowell, 2017).
Place. In consumer markets intermediaries provide utility in terms of reducing the complexity of the range
of goods consumers are offered, by providing a level of specialization and support (advice) and enabling
consumer expectations to be met. Consumer preferences in terms of location, the quantity of items that
need to be purchased and the ease with which they can be acquired are deemed to be of value to
consumers and so effort is concentrated in satisfying consumer needs in these areas and enhancing the
level of perceived value. However, these services still need to be aggregated and pro-vided on a group
basis. In B2B markets the utility principles are similar but the main difference lies in the length of the
channels and the number of intermediaries deemed necessary to deliver the level of functionality
required. Individual attention and customization of product offerings, plus the need to deliver in the
quantities and at the time required by the buyer, result in a shortening of the marketing channel. This
leads to direct relation-ships and new dimensions in terms of the way in which offerings are made
available.
There are some specific uncertainties associated with buying and selling. For example, the risks
associated with producing too much or too little for the target market, those to do with customers’ buying
behaviors and motivations, and those of storage, the incumbent finance and working capital costs.
Marketing channels exist because they provide a means by which uncertain-ties can be reduced or
shared. By combining with other organizations who have different specialized skills (for example
customer access, finance, transportation, storage) these uncertainties can be diminished. The added
value provided by each of these organizations contributes to the superior value perceived by end users
and con-tributes to competitive advantage. To achieve this level of competitive advantage, organizations
need to enter interorganizational exchanges to share their specialized services and the uncertainties.
Producers are faced with a basic decision: direct channel (sell direct to consumers) or the indirect
channel (sell products to another organization). The structure of distribution channels varies according

14
to whether end users are consumers or business customers. Within each channel configuration there
are several levels, each representing a different number or types of intermediaries, each of whom is
involved in bringing products closer to end users. The length of a channel, therefore, is a function of the
number of intermediaries involved in moving products from producers to end users (see Figure 1) (Fill &
McKee, 2012).
Figure 1. Levels of marketing channels for consumer markets.
Source: Fill and McKee (2012, p.163).
The distribution of products involves two main elements. The first is the management of the tangible or
physical aspects of moving a product from the producer to the end user. This must be undertaken in
such a way that the customer can freely access an offering and that the final act of the buying process
is as easy as possible. This is part of supply chain management and entails the logistics associated with
moving products closer to end users. The second element concerns the management of the intangible
aspects or issues of ownership, control and flows of communication between the parties responsible for
making the offering accessible to the customer.
There are three levels of distribution intensity:
1. Intense distribution. Consumers expect some products to be available from a variety of different
outlets. These products often carry little perceived risk, are capable of easy and quick substitution and
require little thought or time to purchase.
2. Selective distribution. By placing the offering in a limited number of outlets a more favorable image
can be generated and the producer can determine which intermediaries would be best suited to deliver
the required service outputs. Customers are more involved with the purchase, and the level of perceived
risk is correspondingly higher.
3. Exclusive distribution. Some customers may perceive a product to be of such high prestige or to be
positioned so far away from the competition that just a single outlet in a particular trading area would be
sufficient to meet the needs of the channel. There is little need to make these products available from a

15
number of different stores. Products such as cars are bought infrequently and are expected to be the
subject of considerable search and consideration (Fill & McKee, 2012).
Critical to the success of an organization is its ability to maximize customer value whilst minimizing costs
in doing this. Supply chain management is a technique for linking a manufacturer’s operations with those
of all of its strategic suppliers and its key intermediaries and customers to enhance efficiency and
effectiveness. The Internet allows members of the supply chain all over the world to share timely
information, exchange engineering drawings during new product development, and synchronize
production and delivery schedules. The goal of supply chain strategy is to improve the speed, precision,
and efficiency of manufacturing through strong supplier relationships. This goal is achieved through
information sharing, joint planning, shared technology, and shared benefits (Hutt & Speh, 2012). An
important contributor to meeting these objectives is ERP (enterprise resource planning), which integrate
different processes such as sales, forecasting, procurement, operations and customer service (Brennan,
Canning, & McDowell, 2017).
Promotion. In consumer markets advertising has long been regarded as the focal point of the marketing
communications mix. Some of the reasons for this concern the need to reach large, widely dispersed
audiences, with relatively simple messages relating to aware-ness, interest and beliefs. Feedback is
minimal and relationships between reseller and consumer are more commonly temporary and not very
close. In recent years, increased use of the other tools in the mix has reduced the high reliance on
advertising, but it remains the focal part of a consumer organization’s promotional strategy. Advertising
is a relatively impotent marketing communications tool in B2B markets because of the need to provide
more detailed, often technical information. Audiences are small in number and can be more closely
defined and easily targeted with less wastage. Messages need to provide means of differentiation,
reinforcement and persuasion. Feedback is important in B2B and so the emphasis is traditionally placed
on personal selling. This helps the development of both a dialogue and also a relationship. Relationships
between organizations in business markets are expected to be close and their duration much longer than
in consumer markets. Direct marketing is also important in B2B markets and, in some situations, can be
used effectively to support the personal selling effort (see Table 4) (Brennan, Canning, & McDowell,
2017).

16
Table 4. Marketing practice differences.
Dimension Business marketing Consumer marketing
Selling process Systems selling Product selling
Personal selling Used extensively Limited
Use of relationships Used extensively Limited
Promotional strategies Limited, customer-specific Mass market
Web integration Greater Limited
Branding Limited Extensive, sophisticated
Market research Limited Extensive
Segmentation Unsophisticated Sophisticated
Competitor awareness Lower Higher
Product complexity Greater Lesser
Source: Brennan, Canning and McDowell (2017, p. 11).
As Table 4 shows, marketing promotion in business markets differs from consumer market because of
the underlying differences in market structure and because of the differences in buying behavior. The
extensive use of personal selling in business markets can be traced to the market structure and buying
behavior characteristics commonly found in business markets, which are usually not found in consumers’
markets. Specifically, in many business markets, demand is concentrated in the hands of a few power
buyers (market structure), who employ teams of purchasing professionals to do their buying (buying
behavior). In most consumer markets demand is dispersed widely throughout the buying public and no
single consumer has any real buying power (market structure), and buyers are not trained professionals
(buying behavior). Personal selling makes sense in the first set of circumstances (concentrated demand,
powerful buyers, and trained professionals), while advertising makes sense in the second set of
circumstances (dispersed demand, no powerful buyers).
Advertising. Advertising is a non-personal form of mass communication and offers a high degree of
control for those responsible for the design and delivery of advertising messages. However, the ability
of advertising to persuade target audiences to think or behave in a particular way is suspect.
Furthermore, the effect on sales is extremely hard to measure. In consumer markets, advertising is used
a great deal because of its ability to reach a national or mass audience and its flexibility in communicating
with a specialized segment. However, in the B2B market this capacity is not important and, as the
associated costs can be extremely large, advertising is not the most effective means of communication
and is therefore not the primary tool of the communications mix. The most important roles of advertising
in the B2B context are to inform and remind, whereas differentiation and persuasion are delivered
through other tools of the promotional mix, namely public relations, direct marketing and personal selling.
The use of online advertising is predominantly geared to driving website traffic and providing product
and corporate information. In an environment where the prime objective of customers is to seek
information, the use of banner advertisements, pop-ups, microsites and superstitial or interstitial

17
advertising, has a supportive rather than a lead communication role. B2B advertisers prefer to emphasize
the informational aspect rather than the emotional, particularly when purchase decisions evoke high
involvement and central route processing. At present, the prime objective of organizational customers
appears to be to seek information and, until this changes in the B2B context, the emotional and
entertainment aspect of advertising messages will continue to have a low significance and online
advertising a low profile in the communication mix (Fill & McKee, 2012).
Sales promotion. Sales promotion seeks to offer buyers additional value, as an inducement to generate
action, often to make an immediate sale. In B2B marketing these inducements, normally referred to as
trade promotions are targeted at three main audiences, intermediaries, end-user customers and the
sales force. Sales promotion is used for one of two main reasons: as a means to accelerate sales or to
generate a change in attitude. Indeed, B2B promotions are often aimed at moving buyers along the
buying process rather than making a complete transaction.
Therefore, gifts, free merchandise or premiums are used in the hope of generating a reciprocal action.
For example, they are used at exhibitions to attract buyers to stand, they are left at the end of sales visits
as a way of triggering name recall and as a form of residual value, and they are used as an insert in a
piece of direct mail to stimulate interest and to provoke further action, such as an appointment (Fill &
McKee, 2012).
The main types of B2B sales promotion and allowances:
- buying allowance (reward for specific orders between certain dates – some percent off the regular
case or carton price);
- count and recount allowance (reward for each case shifted into the reseller’s store from storage,
during a specified period of time);
- buy-back allowance (reward for purchases made after the termination of a count and recount
scheme);
- merchandising allowance (reward of extra free units delivered to a reseller once their order reaches
a specific size);
- promotional allowance (reward against product purchases or a contribution to the cost of an
advertisement or campaign in return for promoting a manufacturer’s products);
- gifts and premiums (used to provoke reciprocal actions and to provide a longer lasting internal
advertisement for the organization or as an incentive to take further action) (Fill & McKee, 2012).
Public relations (PR). Public relation sis used to manage a company’s image with its stakeholders and
to close the gap between companies’ desired image and the way it is actually perceived by its various
publics.
The main purposes of public relations are:
- attract and keep good employees

18
- handle issues and overcome misconceptions relating to an organization
- build goodwill amongst publics such as governments, local communities, suppliers, distributors and
customers
- build an organization’s prestige and reputation;
- to promote products (Brennan, Canning, & McDowell, 2017).
The main types of public relations include press releases, press conferences, interviews, events,
lobbying, corporate advertising, sponsorship, crisis management, investor relations. A relatively new
development is the use of blogs and social media. These offer the opportunity of community involvement
and feedback, although a code-of-conduct needs to be set for employees who participate in these PR-
activities.
Direct marketing. Direct marketing can represent a strategic approach to the market although some
organizations use it as a tactical tool. Use of this tool signifies an attempt to actively remove channel
intermediaries, reduce costs and improve the quality and speed of service for individual customers. The
significance of B2B direct marketing is that it can be used to complement personal selling activities and
in doing so reduce costs and improve overall performance. Direct marketing is generally regarded as the
second most important tool of the communication mix for most B2B organizations. Direct marketing
seeks to target individual customers with the intention of delivering personalized messages and building
a relationship with them based on their responses.
Main types of direct marketing are:
- direct mail (used to support personal selling by building awareness, enhancing image, taking orders
and establishing credibility, and it can provide levels of customer management);
- telemarketing (used to facilitate customer enquiries, establish leads, make appointments, collect low
value orders and even provide a direct sale channel) (Fill & McKee, 2012).
Exhibitions or trade shows. Trade shows bring buyers and sellers together in one physical location.
Sellers showcase and demonstrate their products/services to a fairly well-qualified (international)
audience. The main aims, therefore, are to develop partnerships with customers, to build upon or develop
the corporate identity and to gather up-to-date market intelligence. This implies that trade shows should
not be used as isolated events, but that they should be integrated into a series of promotional activities
(Brennan, Canning, & McDowell, 2017).
As a form of marketing communications, exhibitions enable products to be promoted, and brands built.
They can be an effective means of demonstrating products and developing industry-wide credibility in a
relatively short period of time. Attendance at exhibitions may also be regarded from a political dimension.
If used effectively they can be part of a coordinated communications campaign. Advertising prior, during
and after a trade show can be dovetailed with public relations, sponsorship and personal selling. Sales

19
promotions can also be incorporated through competitions among customers prior to the show to raise
awareness, generate interest and to suggest customer involvement.
One of the main drawbacks associated with exhibitions is the vast and disproportionate amount of
management time that can be tied up with their planning and implementation. Another disadvantage is
high costs, as calculating is problematic and will vary according to the nature of the business and which
direct and indirect costs are determined.
Crucial to the success of involvement in a trade show are the tactics:
1. Promotional activities to support participation.
2. The design and location of a firms’ stand (an eye-catching stand is recommended and of course a
trade-off has to be made regarding the site, for instance; a place close to high-traffic areas will be more
expensive but on the other hand raise more attention to company).
3. The selection and behavior of staff on the stand
4. Post-exhibition follow-up: after a show it is important that potential customers are contacted before
their interest starts to decline. This is usually done by the sales department.
5. Post-show evaluation: assessment of the effectiveness of the tradeshow is important. The objectives
should be measurable, attainable and realistic for this to be possible (Brennan, Canning, & McDowell,
2017).
Personal selling. Personal selling involves a supplier’s employees communicating directly with
managers from a customer company. This direct exchange allows;
- The customer to communicate and the business marketer to determine precise supply requirements
- The negotiation of adjustments to the suppliers’ products offer or the formulation of a bespoke offering
to match the customers need; and
- Interaction between representatives from both organizations, which underpins the initiation,
development and ongoing handling of supplier-customer relationships (Brennan, Canning, & McDowell,
2017).
Among the main goal of actually selling, sales managers have more tasks as: maintaining customer files
and feeding back information (resulting from exchanges with customers) back into the company. Next to
that they represent the company and they sometimes have to handle sales-related complaints.
The sales function can take a variety of forms:
1) Missionary sales people (no direct selling, more influencing / lobbying instead).
2) Frontline salespeople (winning orders from new or existing customers).
3) Internal salespeople (administering the order process).
There are 5 main stages involved in sales process:

20
1. Lead generation;
2. Prospecting;
3. Call preparation;
4. Selling;
5. Order fulfillment (Brennan, Canning, & McDowell, 2017).
One of the major disadvantages of personal selling is the cost. As reach is limited, costs per personal
contact are normally high. Costs include salaries, commission, employment costs, and expenses
including travel, accommodation and subsistence. Reach and frequency through personal selling is
always going to be low, regardless of the level of funds available. The amount of control that can be
exercised over the delivery of messages through the sales force can be low. This is because each
salesperson has the freedom to adapt messages to meet changing circumstances as negotiations
proceed. In practice, however, the professionalism and training that members of the sales force often
receive and the increasing accent on measuring levels of customer satisfaction, mean that the degree
of control over the message can be regarded, in most circumstances, as very good, although it can
never, for example, be as high as that of advertising (Fill & McKee, 2012).
Alternate models. As time lapsed, many management practitioners and thinkers suggested new models
as a fit for their respective times. As a result, many new models became known. Worth mentioning among
them are the 7P (Product, Price, Place, Promotion, People, Process and Physical evidence), 4C
(Consumer, Cost, Communication, Convenience), 4E (Experience, Everyplace, Exchange, Evangelism)
models (Wani, 2013).
The recent addition to the marketing models is the SAVE Model. Researchers offer to remodel the 4P
and shift the emphasis from products to solutions, place to access, price to value, and promotion to
education (Ettenson, Conrado, & Knowles, 2013) (see Table 5).

21
Table 5. SAVE model elements.
4P SAVE model Definition
Product Solution
Defining offerings by the needs they
meet, not by their features, functions,
or technological superiority
Place Access
Develop an integrated cross-channel
presence that considers customers`
entire purchase journey instead of
emphasizing individual purchase
locations and channels
Price Value
Articulate the benefits relative to price,
rather than stressing how price relates
to products costs, profit margins, or
competitor`s prices
Promotion Education
Provide information relevant to
customers` specific needs at each
point in the purchase cycle, rather
than relying on advertising, PR and
personal selling, that covers the
waterfront
Source: Author’s own elaboration based on Ettenson, Conrado and Knowles (2013).
In this new framework the 4Ps aren’t thrown away, but their emphasis shifts to one that emphasizes the
superior value of solutions. For the marketing organization this requires some new management
guidelines, and perhaps the most important is to encourage collaboration between marketing and sales,
as well as development teams. Putting customer-focused requirements in the forefront helps
development teams understand the solutions approach and focus on delivering customer-centric results.
1.3. Marketing performance measurement and management
Marketing performance management has been one of the most prominent streams in recent marketing
research and practice. In fact, the Marketing Science Institute has ranked marketing accountability,
return on marketing investments and marketing performance management systems among the top 10
research priorities (Mone, Pop, & Racolța-Paina, 2013).
Metrics. Measurable performance standards are called metrics, which are the cornerstone of
accountability. Some researchers define marketing metrics encompass activity, output, operational, and
outcome categories:
- "Activity metrics" relate to the number of things done in a process, such as the number of new blog
posts or the number of events.

22
- "Output metrics" relate to the result of a process, such as website traffic, media mentions, or event
participants.
- "Operational metrics" relate to the efficiency and effectiveness of a process, such as cost per lead,
revenue per customer, revenue per sales representative, cost per customer, or leads per sales
representative.
- "Outcome metrics" relate to the consequences of a process’ outcomes, such as revenue, profit, win
rate, pipeline contribution, share of preference, share of wallet, or share of market (Patterson, 2015).
Measurement and metrics enable marketing professionals to justify budgets based on returns and to
drive organizational growth and innovation. As a result, marketers use these metrics and performance
measurement as way to prove value and demonstrate the contribution of marketing to the organization.
Popular metrics used in analysis include activity-based metrics that involves numerical counting and
reporting. For example, tracking downloads, web site visitors, attendees at various events are types of
activity-based metrics. However, they seldom link marketing to business outcomes. Instead, business
outcomes such as market share, customer value, and new product adoption offer a better correlation.
MPM (Marketing performance measurement) focuses on measuring the aggregated effectiveness and
efficiency of the marketing organization. Some common categories of these specific metrics include
marketing's impact on share of preference, rate of customer acquisition, average order value, rate of
new product and service adoptions, growth in customer buying frequency, volume and share of business,
net advocacy and loyalty, rate of growth compared to competition and the market, margin, and customer
engagement.
By using a top-down approach, marketers develop metrics and specific performance targets known as
key performance indicators (KPI). First business decisions are made to define the scope. To create
metrics and KPIs, marketers involved in marketing performance management (MPM) try to first
brainstorm on the business outcome that they are trying to impact. This is followed by asking the opposite
questions that need to be answered to determine if the questions have an impact on this outcome, and
the necessary supporting data required to answer these questions. After determining what data is
needed, marketers need to search for this data, and determine the decisions and actions that must to be
enforced as a result of this data mining.
The most commonly used marketing measures, according to Grønholdt, Martensen, Jørgensen, and
Jensen (2014), are:
1. Mental consumer results (brand awareness, relevance to consumer perceived differentiation,
perceived quality/esteem).
2. Market results (Sales, volume and value; market share, volume and value; number of customers,
conversion (leads to sales), penetration, price).
3. Behavioral customer results (customer loyalty, churn rate, number of customer complaints).

23
4. Financial results (profit/profitability, gross margin, customer profitability, cash flow, shareholder
value/Economic value added/Return on investments, customer lifetime value).
Indicators. Marketing performance can be reported in a wide variety of formats (verbal, pictorial, graphic,
tabular, text, dashboard), which are used for accountability and decision-making. Ideally, reports revisit
past commitments or forecasts, to enable learning and refinements for future performance.
Dashboards are particularly important in marketing performance management, visually displaying
multiple metrics on a single screen or page. This allows managers to monitor performance at a glance,
and to be alerted when performance varies significantly above or below expected levels. Ideally,
dashboards show the relationships between leading and lagging indicators. This can empower people
at every managerial level (Krush, Agnihotri, Trainor, & Nowlin, 2013).
Stakeholders for MPM implementation include the Chief Marketing Officer (CMO), Chief Financial
Officer (CFO), and marketing operations professionals. Marketing accountability of an organization lies
with the CMO. CMOs are deeply involved with the MPM professionals to define marketing objectives,
determine investments and prove the value of marketing in the organization. Marketing operations and
analysis professionals are responsible for the creation of new metrics and processes to measure and
improve operations performance. They are expected to evaluate and implement systems to improve
marketing efficiency and effectiveness. In addition, they are faced with the challenges of collecting data
and analytics essential to the development, and the deployment of marketing dashboards and creating
the marketing operations road map. The chief financial officer of a company or public agency is the
corporate officer primarily responsible for managing the financial risks of the business or agency. This
officer is also responsible for financial planning and record-keeping, as well as financial reporting to
higher management. As marketing is a crucial vertical of any organization, the CFO is an important
stakeholder for any marketing and other finance-related tasks (Patterson, 2015).
Analytics. Analytics seeks to identify patterns in data by organizing it and applying mathematics,
statistics, or algorithms to it. Analytics foster fact-based, data-driven customer, product, market and
performance decisions and develop models to support scenario analysis and predict potential outcomes.
Marketing analytics can be used to create models to help understand, monitor, and predict customer
behavior, such as likelihood to defect or predisposition to purchase. It can help managers quantify
performance, make and optimize channel and mix decisions, understand the impact of a campaign on a
sales list, and create many other types of insights. Data availability is accelerating at an unprecedented
pace, and analytics technologies can help marketers quickly synthesize data from various sources.
Analytics can harness the power of data by converting it to actionable information and models that guide
strategic investments and decisions that drive marketing performance (Monier, Gordon, & Ogren, 2013).
Automation. Automation of marketing processes reduces manual labor, errors, and inconsistency. It
enables timely, personalized messaging to customers, prospects, and other stakeholders. Automation
provides infrastructure for marketing performance management. It spans marketing resource

24
management, campaign automation, business intelligence, data management, reporting platforms, and
scenario analysis tools (Järvinen & Taiminen, 2016).
Alliances. Alliances are arrangements between companies to create additional value together.
Distributors, resellers, marketing agencies, and other companies may co-develop, co-promote, and/or
co-deliver various parts of the marketing mix (product, price, promotion, and placement). Marketing
performance management requires information transparency, clear roles, and smooth handoffs between
alliance members, both externally and internally. A spirit of alliance among the work groups across the
marketing organization, and with other support functions and business units shapes the ecosystem that
nurtures or hinders marketing performance. Collaboration cross-functionally is essential to marketing
efficiency and effectiveness (Chen Kuang-Jung, Chen Mei-Liang, Liu Chu-Mei, & Huang Chien-Jung,
2015).
Assessment. Assessment is the evaluation of strengths, weaknesses, and opportunities in marketing
performance management. Assessment is typically conducted by benchmarking other organizations or
comparing performance to a standard. Ideally, assessment is supported by a culture of genuine concern,
dedication, and willingness among management and employees to continually improve performance
(Shamma & Hassan, 2013).
Conclusions: Marketing performance measurement and management is a term used by marketing
professionals to describe the analysis and improvement of the efficiency and effectiveness of marketing.
This is accomplished by focus on the alignment of marketing activities, strategies, and metrics with
business goals. It involves the creation of a metrics framework to monitor marketing performance, and
then develop and utilize marketing dashboards to manage marketing performance.
MPM focuses on measuring, managing, and analyzing marketing performance to maximize effectiveness
and optimize the return of investment of marketing. Marketing performance management is based on six
success factors: alignment, accountability, analytics, automation, alliances, and assessment. Three
elements play a critical role in managing marketing performance - data, analytics, and metrics.

25
2. Strategic marketing implementation in machine construction
industry
2.1. Economic state of the industry
Machine construction industry remains a substantial part of Belarusian GDP, rooted in Belarus’s past as
a part of USSR. The most well-known national brands are dump trucks BelAZ, tractors Belarus, special
equipment Amkador and agricultural equipment Gomselmash. For instance, BelAZ produces every third
dump truck on the world market; Minsk Tractor Works has a share of more than 7% in its segment on
the world market.
Table 6 shows the current economic state of the industry – the latest published information is dated
2015.
In 2015, machine construction industry consisted of 1122 companies, which is 234 units more than in
2010 and only 1 unit more comparing with 2014. Consequently, extensive industry growth due to new
manufacturing plant openings is slowing.
Machine construction industry continues to reduce its share in the total industrial production volume with
a 6.7% in 2015, having decreased by 0.9 pp. compared to 2014 and by 2.4 pp. - to 2010. Therefore, in
2015 the value of production as a percentage of the previous year in constant prices has decreased by
3.57% compared to 2014 with a price index of 116.8%.
Nevertheless, the industry ended 2015 with the return of sales of 10.2%, which is the best result since
2012 and a considerable increase after the recession of 2014.
After 2013, the number of innovation companies continues to reduce with the 35.1% in 2015.

26
Table 6. Economic state of machine construction industry.
2010 2011 2012 2013 2014 2015
Deviation
2015/2014 2015/2010
Total number of companies, pcs
888 962 1013 1073 1121 1122 1 234
Value of production in current prices, billion rub
15 253 27 398 57 585 58 804 50 956 49 138 -1 818 33 885
In percentages to previous year (As a percentage of the previous year in constant prices), %
116,7 112,3 101,3 97,3 80,4 74,7 -5,7 -42
The percentage of the type of economic activity in the total volume of industrial production, percent
9,1 7,9 9,4 9,7 7,6 6,7 -0,9 -2,4
Price index 113,6 171,4 176 113,6 112,8 116,8
The percentage of employees in the average number of industry employees
13,5 13,4 14,2 14 13,4 13,4 0 -0,1
Return on sales 9,6 17,2 14,4 10,1 5,9 10,2 4,3 0,6
The percentage of innovation companies in the total volume
- 41,3 40,3 41,9 35,5 35,1 -0,4 -
The percentage of unprofitable organizations
- 14,6 17,5 21,3 27,1 33,8 6,7 -
Source: Adapted from Belstat (2016, p. 31).
As a result, companies in the industry are under severe hardships, which results in the increased number
of unprofitable organizations – 33.8% companies – that is the worst indicator for the last 5 years.
Furthermore, at the same time companies of this industry struggle with applying modern business
models, penetrating new markets and increasing sales. For instance, 27.8% of companies name low
price as the primary competitiveness factor, and for 22.6% this factor is postponement of payment offered
to their customers (Pawlowskaja, 2015).
Because of such approach, machine construction is one of the least effective industries in Belarus,
compared by using industrial production index in constant prices between economy average and the
machine construction in Figure 2 below.

27
Figure 2. Industrial Production Index in constant prices, % to previous year.
Source: Adapted from Belstat (2016, p. 47).
Poor economic performance is reflected in investments – in 2015, they reached an all-time minimum of
2.9% of investments in industries, as shown on the Figure 3.
Figure 3. Investments in machine construction industry, million € and % of all investments.
Source: Adapted from Belstat (2016, p. 76).
In 2015 “Machinery, equipment and transport vehicles” commodity group was 13.8% of the whole export
amount. Geographically, CIS countries account for 82% of machine construction export (Belstat, 2016).
113,10%
101,80%
100,30%
78,60%
75,10%
109,10%
105,90%
95,10%
101,90%
93,40%
70%
75%
80%
85%
90%
95%
100%
105%
110%
115%
120%
2011 2012 2013 2014 2015
%
Year
Machine construction Economy total
4,55%
3,99%
3,34%3,19% 2,86%
167,90
186,98 193,27
181,08
111,59
100
110
120
130
140
150
160
170
180
190
200
2%
3%
4%
5%
2011 2012 2013 2014 2015
mill
ion €
%
Year
% of investments in industries Million €

28
Thus wise, origins of the machine construction industry ineffectiveness lay in the primary export
orientation on the market of Russian Federation, which is now pursues imports phase-out. Traditionally,
Republic of Belarus has reputation of being the USSR’s assembly line. Therefore, the main and almost
singular competitive ability of industry products was the relatively low price, the importance of which has
decreased by now. To sum it up machine construction industry faces hardships based on limited market
orientation and low competitive advantages.
2.2. Competitiveness analysis of the industry
For the analysis of the competitiveness of machine-building products, let us cite some statistical
indicators. The Figure 4 below shows the exports and imports dynamics of the industry.
Figure 4. Export and import of machine construction products.
Source: Adapted from Belstat (2016, p. 173).
It can be seen that the export of these products reached its peak in 2012, after which it steadily declined.
In 2015, exports of machine construction industry products reduced by 31% compared to 2010, imports
fell by 53%.
Figure 5 shows the utilization rates of production capacities for the machine-building industry products.
2683,10
3870,40
3342,00
2728,10
1841,601785,702233,60 2024,40
1327,60838,50
44%
-14% -18%
-32%-40%
-30%
-20%
-10%
0%
10%
20%
30%
40%
50%
0
500
1000
1500
2000
2500
3000
3500
4000
4500
2011 2012 2013 2014 2015
%
$m
ln
Year
Export, $mln Import, $mln Export dynamics,%

29
Figure 5. Usage of industrial capacities by several types of machinery production.
Source: Adapted from Belstat (2016, p. 86).
It can be noted that starting from 2013, the percentage of the production capacities use has significantly
decreased for all 4 groups of goods. For example, the average percentage of capacity utilization has
decreased by 1.7-2.4 times in six years. This is a clear indicator of the decline in demand for products,
primarily from foreign customers, which results from the industry high export orientation.
First, such a demand reduction may be due to the fact that the main consumer of Belarusian machine-
building products – Russia – joined the WTO (World Trade Organization) in 2013, which resulted in
increased competition in connection with the borders opening.
Based on the information above, it can be concluded that the products of the Belarusian machine-building
industry have low competitiveness, which only continues to decrease. Possible reasons are:
1) Price-positioning competition. In 2015, the Research Economic Institute of the Ministry of
Economics conducted a survey of companies in the machine construction industry, which indicates that
many Belarusian manufacturers are trying to compete in foreign markets with only price factor in mind.
Of the 84 engineering enterprises that took part in the survey, half indicated a price as the most crucial
factor of their competitiveness in foreign markets. 27.8% of respondents said they offer medium-quality
products at a low price, another 22.6% of respondents said that they promote their products to foreign
markets only through buyer-beneficial payment grace period.
Meanwhile, experts believe that the time when Belarusian producers could afford to win in foreign
markets solely via price factor, ends, since this niche is occupied by Chinese producers.
70,7 75,4
41
98,5 96,9 100 96,7
63,9
48,8
43,3
73,4
58,3
39,5
18,4
0
20
40
60
80
100
120
2010 2011 2012 2013 2014 2015
%
Year
Tractors for agriculture and forestry Machine tools for metal working
Electrical transformers Trucks

30
Also, experts add that the purchase price is often not important for consumers of machine-building
products, since these are durable goods. Therefore, for buyers in many cases, the maintenance and
high-quality service are in primary importance (Pawlowskaja, 2015).
2) Absence of breakthrough innovations and technologies. Belarusian plants were run by people
oriented toward short-term goals. The tasks that were put to them primarily concerned plans for the
coming year, rather than the strategic development. For majority of machine-building enterprises, the
material and technical base is mainly represented by achievements of the 3rd and the 4th technological
paradigms, which piqued during 1960s. This is the reason for the high coefficient of depreciation of fixed
assets at 74.2% (Belstat, 2016).
3) Financing problems. According to the research of Primshyts (2009), for 69.5% of industrial
companies, the main motive for investment activity is "maintenance of worn-out production capacities",
and 80.4% of enterprises indicate a lack of their own means of financing as a basic constraint on
investment activity, while for the innovation development the volume of investments should increase
fivefold.
2.3. Prospects for the development of the target markets and segments
While machine construction industry is often marked as an economic outsider with weak export
diversification and industry stagnation, politicians initiate measures. The main document regulating
industry prospects is Development program of the industrial complex of the Republic of Belarus for until
2020, issued by the Council of Ministers.
According to the Program, market positions will be strengthened by improving the quality level of
products and achieving its compliance with international standards.
Table 6 shows the main growth options by industry agricultural segments.
Geographical diversification of export will focus on a flexible combination of the three main directions:
- the development of cooperation and specialization within the CES based on deepening economic
relations, primarily with Russia, in order to preserve and expand its niche in traditional markets;
- ensuring partnership relations with EU countries, taking into account the possible accession to the
WTO, which will allow to obtain such advantages as more stringent requirements to the quality of
products, higher prices and market capacity, greater value added per unit of sold products;
- domestic producers’ presence expansion in the markets of Asia, Latin America, Arab states, as well
as in the markets of the fastest growing EU countries: Slovakia, Poland, Bulgaria, Romania.

31
Table 7. Development program of the industrial complex plans.
Segment Segment`s prospects Solutions Expected result
Agricultural machinery construction
Developing and mastering the production of agricultural machinery and equipment of high technical level by building unified models of machines of different productivity classes. It is planned to create a new range of grain and forage harvesters with improved functional characteristics, high-energy efficiency, more economical and ergonomically adapted to the user, with wide application of electrified working bodies. The self-propelled machinery will be equipped with GPS-navigation devices, GSM-communication, which will allow using it in precision farming systems and as much as possible adapt to the requirements of the target markets.
The development of a series of high-performance, highly efficient combine harvesters of a more advanced design with a throughput of 13 to 16 kg /s, a forage harvester with an engine power of 240-250 hp, a grain harvester with a throughput of 4-5 kg/s, equipped with a swathing harvester and a header for grass mowing
The production of highly effective grain harvesters with a capacity of at least 20 tons of grain per hour Increase in the share of sales in the world combine harvesters market from 10 to 15 percent
The production of soil cultivating units, seeders, machines for applying organic and mineral fertilizers with the carrying capacity of 20 and 25 tons, production of self-propelled mowers equipped with a wide range of hinged units
The production of new energy-saving machines and equipment intended for cleaning, drying, grinding and storage of dry and wet grain, preparation of mixed fodder and seeds
Equipment of self-propelled machinery with GPS-navigation devices, GSM-communication with the service center, digital on-board information system
The introduction of high-speed technological equipment with the use of modern cutting tools and the concentration of operations
Tractor building and municipal engineering
Higher power tractors production of with engines not lower than Tier 3B level, progressive energy-saving power transmissions. The expansion of small-sized tractors model range, adopting the production of their new modifications with improved design and performance characteristics. The release of a new generation of tractor equipment with electromechanical transmission and modern on-board electronics.
Modernization of tractors of 2-3 draft class with a capacity of 130, 150, 210 hp. By installing environmentally friendly engines (Tier 3B), semi-automatic transmissions and electronic control systems
Export supply of more than 90% of the volume of tractor production
The production of power-hungry tractors with a capacity of 300 - 355 hp of traction class 5 - 6 with engines not lower than the Tier 3V level with progressive energy-saving power transmissions
Development of a general-purpose wheeled tractor with a capacity of 305 hp with an electromechanical transmission
Modernization of the produced tractor models by installing modern units, units and systems (stepless transmission, electrohydraulic attachment control system) with the possibility of control automation, diagnostics and maintenance processes
The production of a new tractor equipment generation with an electromechanical transmission and modern on-board electronics, which provides the machine diagnosis and allows the use of precision farming system elements.
Source: Adapted from Council of Ministers of Republic of Belarus (2012, pp. 57-60).

32
The Program has clear vision on tractor export diversification with the orientation on:
1) An increase in the tractors supply to existing markets (Russia, Ukraine, Kazakhstan, Lithuania,
Pakistan, Serbia, Venezuela, Egypt);
2) Search for new markets (Latin America, South-East Asia and Africa);
3) Expansion of tractors volumes and the nomenclature assembled in the established assembly plants
(increase in the tractor sets supply for assembly plants in Algeria, China, Ethiopia and other countries);
4) Tractors assembly production establishment in Venezuela, Myanmar and Indonesia (Council of
Ministers of Republic of Belarus, 2012).
To increase the export potential of agricultural machinery in 2012-2020, it is planned to increase the
sales share in the combine harvesters’ world market of from 10 to 15 percent. These is supposed to be
made possible by updating their range and improving the price-quality ratio, as well as creating a
modification of powerful forage harvesters that take into account the requirements of developing foreign
markets (from 24 to 28 percent of the world market).
For positioning, the instruments of social and ethical marketing will be actively used: the creation of
assembly plants in the CIS countries and in promising sales markets (positioning of its brand as a local
producer), the emphasis in marketing strategies for the environmental production friendliness and
environmental products safety, as well as economic benefits.
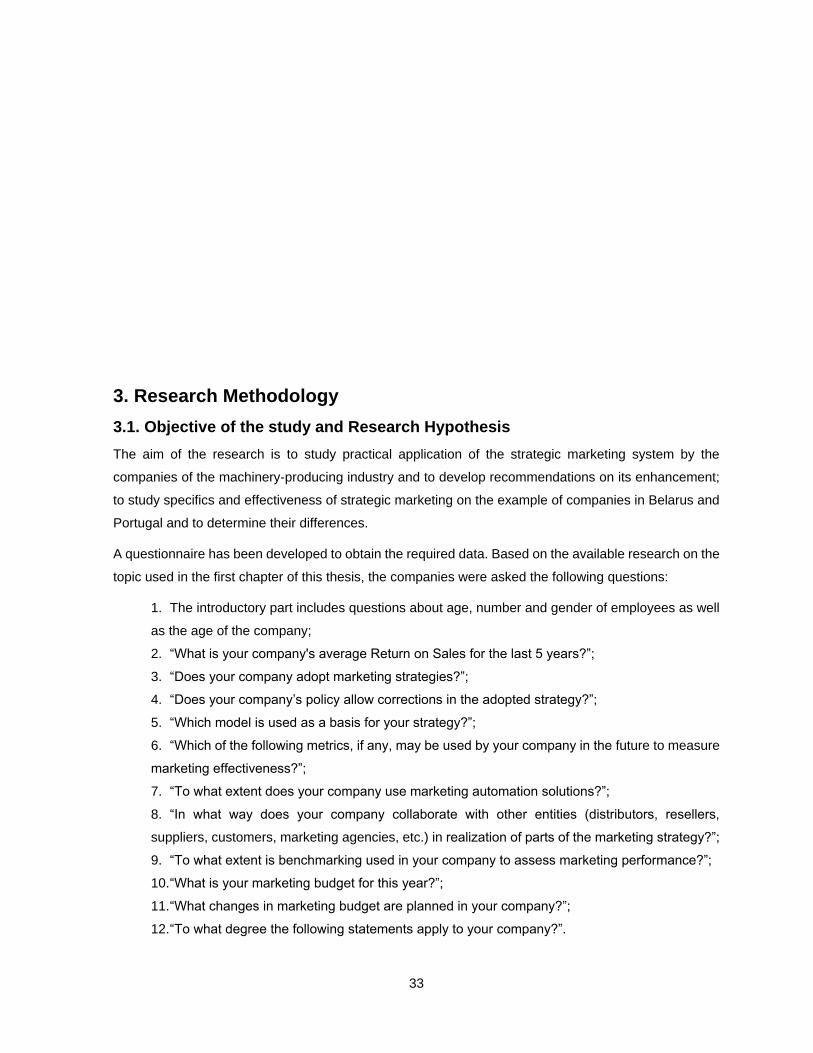
33
3. Research Methodology
3.1. Objective of the study and Research Hypothesis
The aim of the research is to study practical application of the strategic marketing system by the
companies of the machinery-producing industry and to develop recommendations on its enhancement;
to study specifics and effectiveness of strategic marketing on the example of companies in Belarus and
Portugal and to determine their differences.
A questionnaire has been developed to obtain the required data. Based on the available research on the
topic used in the first chapter of this thesis, the companies were asked the following questions:
1. The introductory part includes questions about age, number and gender of employees as well
as the age of the company;
2. “What is your company's average Return on Sales for the last 5 years?”;
3. “Does your company adopt marketing strategies?”;
4. “Does your company’s policy allow corrections in the adopted strategy?”;
5. “Which model is used as a basis for your strategy?”;
6. “Which of the following metrics, if any, may be used by your company in the future to measure
marketing effectiveness?”;
7. “To what extent does your company use marketing automation solutions?”;
8. “In what way does your company collaborate with other entities (distributors, resellers,
suppliers, customers, marketing agencies, etc.) in realization of parts of the marketing strategy?”;
9. “To what extent is benchmarking used in your company to assess marketing performance?”;
10. “What is your marketing budget for this year?”;
11. “What changes in marketing budget are planned in your company?”;
12. “To what degree the following statements apply to your company?”.

34
On the basis of goals, 9 researches hypothesis (H) were formulated:
H1: There is a positive association between return on sales and marketing strategy
H2: There is a positive association between return on sales and degree of flexibility of marketing
strategy
H3: Number of monitored metrics has a statistically significant impact on return on sales
H4: There is a positive association between return on sales and usage of marketing automation
H5: There is a positive association between return on sales and degree of business collaboration
in marketing
H6: There is a positive association between return on sales and degree of involvement in
benchmarking
H7: There is a positive association between return on sales and marketing expenses
H8: There is a positive association between return on sales and company’s marketing involvement
H9: There is a statistically significant difference in marketing system depth between the countries
3.2. Description of Data Collection
To determine the population for this research, official statistical data was used; the latest published data
for both countries is of year 2015. Thus, the number of Portuguese companies engaged in economic
activity “Manufacture of machinery and equipment n.e.c.” is 1 523 (INE, 2016). For Belarus, the number
of organizations in the category “Manufacture of machinery and equipment” is 1 122 (Belstat, 2016). The
sample size for this population with 95% confidence level and 5% margin of error equals 307 for Portugal
and 287 for Belarus. For this particular study, 13 Belarusian and 23 Portuguese companies were
interviewed, which is 1.16% and 1.51% of respective populations.
The list of organizations has been compiled using web search and online business catalogues. The
questionnaire was distributed via e-mail; Google Forms has been chosen as a survey platform to
automate the data collection.
3.3. Description of Data Analysis
Data obtained via the survey was compiled and treated using IBM SPSS Statistics software. Distribution
of responses was described using means and standard deviation when are on basis quantitative
variables. In order to analyse demographic profile of respondents will be used descriptive analysis, which
will show absolute and relative frequencies. Research hypotheses were tested with non-parametric
statistical tests, as the sample size does not allow application of parametric tests.

35
To reach the aim of the research, several hypotheses have been developed in accord with the survey,
presented in Table 8.
Table 8. Research hypotheses and statistical test used.
Hypothesis Statistical test
H1: There is a positive association between return on sales and marketing strategy Cramer’s V
H2: There is a positive association between return on sales and degree of flexibility of marketing strategy
Cramer’s V
H3: Number of monitored metrics has a statistically significant impact on return on sales Kruskal-Wallis H
H4: There is a positive association between return on sales and usage of marketing automation
Cramer’s V
H5: There is a positive association between return on sales and degree of business collaboration in marketing
Cramer’s V
H6: There is a positive association between return on sales and degree of involvement in benchmarking
Kruskal-Wallis H
H7: There is a positive association between return on sales and marketing expenses Cramer’s V
H8: There is a positive association between return on sales and company’s marketing involvement
Kruskal-Wallis H
H9: There is a statistically significant difference in marketing system depth between the countries
Mann-Whitney U
Source: Author’s own elaboration.
All aforementioned hypotheses were tested with confidence level of 95%.

36
4. Marketing strategy implementation for market penetration
4.1. Machinery-producing industry: Belarus vs. Portugal
The first group of questions concerns business and employee demographics. While not directly related
to the research objective, this information provides insight into market specifics. The following charts
describe the characteristics of the sample. First, average employee age is presented in Figure 6.
Figure 6. Employee age.
Source: Author’s own elaboration.
Among the respondents, majority of the companies has an average employee age between 35 and 44
years, counting 9 (69.2%) companies based in Belarus and 15 (65.2%) – in Portugal. 3 and 7 (23.1%
and 30.4%) companies, respectively, have an average between 22 and 34 years, while 1 company (7.7%
for Belarus and 4.3% for Portugal) in each country reported a 45 to 54 years’ employee age. The next
question concerns the total number of employees, which represents business size. Figure 7 illustrates
this information.
23,130,4
69,265,2
7,74,3
0
10
20
30
40
50
60
70
80
Belarus Portugal
%
22 to 34 35 to 44 45 to 54

37
Figure 7. Number of employees.
Source: Author’s own elaboration.
Majority of the sample is represented by the companies ranging between 50 and 999 employees, which,
for the machinery production, are relatively small businesses. In total, 8 (61.5%) Belarusian and 17
(73.9%) Portuguese respondents have an employee number in this range. A 1000 to 4999 range, or
medium size, is reported by 2 (15.4%) companies from Belarus and 3 (13%) from Portugal; 3 (23.1%)
respondents form Belarus and 1 (4.3%) from Portugal are large businesses, having 5000 and more
employees. Additionally, 2 (8.7%) of the Portuguese respondents have less than 50 permanent
employees.
The following Figure 8 illustrates the average gender ratio.
Figure 8. Employee gender.
Source: Author’s own elaboration.
The gender distribution in both reviewed countries is similar, resulting in 66.49% to 33.51% in Belarus
and 65.44% to 34.56% in Portugal. These results reflect the typical structure of a heavy industry company
0
8,7
61,5
73,9
15,4 1323,1
4,3
0
10
20
30
40
50
60
70
80
Belarus Portugal
%
Less than 50 50-999 1000-4999 5000 or more
33,51 34,56
66,4965,44
0
10
20
30
40
50
60
70
Belarus Portugal
%
Female Male

38
where production and engineering employees are predominantly male, while women are mostly
employed in departments not related to the primary manufacturing, such as accounting, marketing, etc.
Age of companies participated in the study is presented in Figure 9.
Figure 9. Years in the market.
Source: Author’s own elaboration.
Two (15.4%) of Belarusian respondents entered the market 15 to 19 years ago, 11 (84.6%) companies
are older than 19 years. This distribution is explained by the fact that many of companies in machinery
manufacturing are a Soviet Union legacy, working for more than 50 years and continuing their work
nowadays as completely or partially state-owned enterprises. Distribution of Portuguese companies is
more diverse: 11 (47.8%) respondents have been present for 10 to 14 years, 3 (13%) – for 15 to 19
years, 1 (4.3%) – for more than 19 years and 4 (17.4%) for each 5 to 9 and less than 5 years.
The Return on Sales indicator has been used to check how effective the companies are in business.
Response statistics for this question are illustrated in Figure 10.
Figure 10. Return on Sales.
0
17,4
0
17,4
0
47,8
15,4 13
84,6
4,3
0
20
40
60
80
100
Belarus Portugal
%
Less than 5 5 to 9 10 to 14 15 to 19 20 or more
23,1
4,3
38,5
0
7,7
43,5
15,4
43,5
7,7 8,77,7
00
5
10
15
20
25
30
35
40
45
50
Belarus Portugal
%
Negative 0% to 4% 5% to 9%
10% to 14% 15% to 19% 20% or more

39
Source: Author’s own elaboration.
Out of 13 respondents from Belarus, 5 (38.5%) have RoS within the 0% to 4% interval, 2 (7.7%) –
between 10% and 14%, 1 (7.7%) company reported RoS within each of 5%-9%, 15%-19% and 20% or
more ranges. Also, 3 (23.1%) of the interviewed companies have had losses for the past five years.
Among the Portuguese respondents, majority is evenly split between answers “5% - 9%” and “10% -
14%” with 10 (43.5%) responses each. 2 (8.7%) companies have Return on Sales within 15% to 19%
margin, and 1 (4.3%) business reported this indicator as negative.
The next question of the survey is aimed to find out the number of organizations using a marketing
strategy in their activities. The results obtained with the survey are presented in Figure 11.
Figure 11. Marketing strategy application.
Source: Author’s own elaboration.
4 (30.8) of Belarusian participants use strategies developed by themselves, 2 (15.4%) companies had
their marketing strategies developed by specialized organizations and 7 (53.8%) do not use a strategy
at all. Meanwhile 15 (65.2%) of the respondents from Portugal develop their own strategies, 3 (13.0%)
use outsourced ones and 5 (21.7%) do not use marketing strategies, although 4 of these companies
responded that they may use one in future. In total, 46.2% of respondents from Belarus and 78.3% of
respondents from Belarus, resulting in 66.7% of all respondents, have a marketing strategy in some
form.
The following part of the survey is aimed at determining the depth and complexity of implemented
marketing strategies and marketing activities in general.
The next question classifies strategies by their flexibility, which reflects the ability of companies’
marketing to adapt to internal or external changes. The question implies the existence of a marketing
strategy, so the results include only answers by the respondents that confirmed the usage of it. The
survey results are presented in Figure 12.
30,8
65,2
15,4 13
0
17,4
53,8
4,3
0
10
20
30
40
50
60
70
Belarus Portugal
%
Own strategy Outsourced strategy
May be developed Is not planned for development

40
Figure 12. Marketing strategy flexibility.
Source: Author’s own elaboration.
5 out of 6 (83.3%) respondents from Belarus described their marketing strategy as rigid and hard to alter;
at a remaining company it is revised periodically and may be altered a few times during its period. At 2
(11.1%) companies from Portugal marketing strategy is flexible and may be modified when needed; 12
(66.7%) respondents revise their strategy from time to time and 4 (22.2%) companies have strict
unchangeable strategies.
Responses to the next question show which marketing models the enterprises use to as a basis for their
strategies. As it is possible to take elements of more than 1 model, multiple responses were allowed;
additionally, respondents without current marketing strategy were removed. The obtained results are
shown in Figure 13.
Figure 13. Marketing mix models.
Source: Author’s own elaboration.
Among Belarusian businesses, 3 (50%) uses of 4P model and 1 (16.7%) use of 4C model were noticed;
also 3 (50%) companies base their strategy on models not listed in the questionnaire. Majority – 15
0
11,116,7
66,7
83,3
22,2
0
10
20
30
40
50
60
70
80
90
Belarus Portugal
%
Flexible strategy Strategy periodically revised Rigid strategy
50
83,3
05,6
16,7 16,7
05,6
50
11,1
0
20
40
60
80
100
Belarus Portugal
%
4P 7P 4С 4E Other

41
(83.3%) – of the Portuguese companies follow the 4P concept, 3 (16.7%) have chosen 4C model, 1
(5.6%) responded for each 7P and 4E and 2 (11.1%) companies use models not mentioned in the
questionnaire.
The survey also helped to gather data about the respondents’ implementation of various marketing
performance metrics, as well as their thoughts on chances of including these metrics into marketing
system in the future. Results obtained from Belarusian companies are presented in Table 8.
Table 9 show a rather low degree of implementation of data-driven marketing, with only 3 of proposed
metrics used by few interviewed companies. Particularly, 5 (38.5%) companies use sales revenue as a
marketing effectiveness indicator, 4 (30.8%) practice calculation and analysis of market share, and 3
(23.1%) respondents monitor conversion rates. These three metrics also have highest mean values,
meaning they are considered more important by the survey participants. By codifying proposed answers
in the questionnaire from 1 to 6, the average figure may be obtained, which shows the depth of applied
data-driven marketing by sample in average. For companies from Belarus this indicator is equal to 3.16
out of 6 with standard deviation of 0.224. This result allows to speak that there is no tendency to improve
marketing system by adding measurable indicators within the sample.
Table 9. Performance metrics application – Belarus.
Metric Definitely will not use, %
Probably will not use, %
Unsure, %
Probably will use,
%
Definitely will use,
%
Already using,
% Mean
Standard deviation
Brand awareness
15.4 15.4 46.2 15.4 7.7 0.0 2,85 1,144
Perceived differentiation
23.1 76.9 0.0 0.0 0.0 0.0 1,77 0,439
Perceived quality
0.0 46.2 38.5 7.7 7.7 0.0 2,77 0,927
Market share 15.4 0.0 7.7 38.5 7.7 30.8 4,15 1,725
Conversion 0.0 30.8 0.0 23.1 23.1 23.1 4,08 1,605
Market penetration
30.8 23.1 7.7 38.5 0.0 0.0 2,54 1,330
Customer loyalty
0.0 23.1 46.2 15.4 15.4 0.0 3,23 1,013
Customer satisfaction
0.0 23.1 15.4 38.5 23.1 0.0 3,62 1,121
Customer attrition
7.7 46.2 0.0 38.5 7.7 0.0 2,92 1,256
Customer complaints
0.0 23.1 0.0 76.9 0.0 0.0 3,54 0,877
Customer lifetime value
0.0 76.9 15.4 0.0 7.7 0.0 2,38 0,870
Return on marketing investments
7.7 38.5 0.0 30.8 23.1 0.0 3,23 1,423
Customer profitability
15.4 15.4 46.2 7.7 15.4 0.0 2,92 1,256
Sales revenue 0.0 15.4 23.1 23.1 0.0 38.5 4,23 1,589
Source: Author’s own elaboration.

42
Responses from Portuguese companies regarding this matter are presented in Table 10.
According to collected responses, all proposed metrics except perceived quality/esteem are used by at
least one survey participant, however the percentage is low for most metrics. The most widely used
metrics are sales revenue (22 companies out of 23), customer complaints (14 out of 23) and customer
satisfaction (12 out of 23); highest mean values belong to sales revenue, customer complaints and
customer satisfaction. The average sample score for this question is 3.70 with standard deviation 0.539.
This result is slightly higher compared to Belarusian part of the sample, though with higher deviation.
Table 10. Performance metrics application – Portugal.
Metric Definitely will not use, %
Probably will not use, %
Unsure, %
Probably will use,
%
Definitely will use,
%
Already using,
% Mean
Standard Deviation
Brand awareness
8.7 39.1 30.4 17.4 0.0 4.3 2,74 1,137
Perceived differentiation
13.0 65.2 13.0 4.3 0.0 4.3 2,26 1,054
Perceived quality
60.9 30.4 8.7 0.0 0.0 0.0 1,48 0,665
Market share 4.3 4.3 8.7 17.4 26.1 39.1 4,74 1,421
Conversion 21.7 17.4 0.0 26.1 13.0 21.7 3,57 1,903
Market penetration
8.7 13.0 30.4 26.1 8.7 13.0 3,52 1,442
Customer loyalty
0.0 21.7 0.0 26.1 27.7 30.4 4,39 1,500
Customer satisfaction
4.3 8.7 0.0 13.0 21.7 52.2 4,96 1,492
Customer attrition
8.7 4.3 17.4 30.4 17.4 21.7 4,09 1,505
Customer complaints
0.0 8.7 0.0 8.7 21.7 60.9 5,26 1,214
Customer lifetime value
8.7 56.5 4.3 17.4 4.3 8.7 2,78 1,445
Return on marketing investments
17.4 21.7 17.4 26.1 4.3 13.0 3,17 1,614
Customer profitability
30.4 8.7 26.1 21.7 8.7 4.3 2,83 1,527
Sales revenue
0.0 0.0 0.0 0.0 4.3 95.7 5,96 0,209
Source: Author’s own elaboration.
Although the responses of several organizations allow to rate the usage of metrics higher in Portugal,
the average numbers do not differ much. The description of average score for this question is presented
in Table 11.

43
Table 11. Performance metrics application – average.
Minimum score Maximum score Mean Std. deviation
Belarus 2.57 3.43 3.159 0.224
Portugal 2.36 4.50 3.696 0.539
All sample 2.36 4.50 3.502 0.518
Source: Author’s own elaboration.
The respondents’ practice of marketing automation is reflected in Figure 14.
Figure 14. Marketing automation application.
Source: Author’s own elaboration.
None of the respondents from Belarus use any marketing automation software, and only 2 (15.4%) plan
to start using it in the future. 7 (30.4%) Portuguese companies from the sample have applied such
instruments, and 2 of them have automated most of their marketing processes. Altogether, 80.6% of the
sample do not use marketing automation systems.
Figure 15 illustrates statistics of responses on the question “In what way does your company collaborate
with other entities (distributors, resellers, suppliers, customers, marketing agencies, etc.) in realization
of parts of the marketing strategy?” (respondents not having a marketing strategy were removed).
0
8,7
0
21,715,4
52,2
84,6
17,4
0
10
20
30
40
50
60
70
80
90
Belarus Portugal
%
Extensive use in most processes Limited use in some processes
Planning to use Not planning to use

44
Figure 15. Collaboration.
Source: Author’s own elaboration.
All respondents from Belarus practice collaboration in marketing; 5 (83.3%) organizations do it in a way
of periodic information exchanges and 1 (16.7%) – occasionally, according to the company’s needs. 15
(83.3%) Portuguese businesses characterize their marketing collaboration as rare or occasional, 1
(5.6%) company collaborates in periodic manner, while 2 (11.1%) respondents do not collaborate with
external entities. None of the interviewed companies practice collaboration in form of a constant
partnership, and 91.7% of the sample practice collaboration in some way.
The next series of questions provides information on benchmarking in 3 dimensions: how often
companies evaluate their position, how many indicators they consider and how many business entities
they tend to observe. Data from Belarusian and Portuguese respondents is presented in Tables 12 and
13, respectively.
Table 12. Benchmarking – Belarus.
Never, % Occasionally, % Periodically, % Constantly, %
Benchmarking frequency
76.9 15.4 7.7 0.0
None, % Single metric, % Several metrics, % Majority of metrics, %
Benchmarking depth
76.9 15.4 7.7 0.0
None, % One company, % Several companies, %
Majority or all companies on the market, %
Benchmarking width
76.9 23.1 0.0 0.0
Source: Author’s own elaboration.
3 Belarusian enterprises out of 13 (23.1%) interviewed work with benchmarking. They only compare their
performance with one organization, and only 1 company does that on a periodic basis and analyzes
several metrics.
83,3
5,6
16,7
83,3
0
11,1
0
10
20
30
40
50
60
70
80
90
Belarus Portugal
%
Periodically Rare Never

45
Table 13. Benchmarking – Portugal.
Never, % Occasionally, % Periodically, % Constantly, %
Benchmarking frequency
56.5 4.3 17.4 21.7
None, % Single metric, % Several metrics, % Majority of metrics, %
Benchmarking depth
56.5 34.8 4.3 4.3
None, % One company, % Several companies, %
Majority or all companies on the market, %
Benchmarking width
56.5 21.7 13.0 8.7
Source: Author’s own elaboration.
Among 23 respondents from Portugal, 10 (43.5%) practice benchmarking and half of them implemented
benchmarking as a constant process. Majority of these companies – 8 out of 10 (34.8%) – considers
only one metric. The width of benchmarking varies – 5 (21.7%) companies observe one entity, 3 (13.0%)
work with several entities and 2 (8.7%) respondents claim to benchmark majority of their market.
By codifying responses to the benchmarking-related questions with numbers from 1 to 4, it is possible to
calculate the average benchmarking score of the sample. The results of calculations are shown in Table
14.
Table 14. Benchmarking – average.
Minimum score Maximum score Mean Std. deviation
Belarus 1.00 2.67 1.28 0.559
Portugal 1.00 3.67 1.78 0.962
All sample 1.00 3.67 1.60 0.865
Source: Author’s own elaboration.
With 63.9% of the sample not using benchmarking (in this case score equals 1.0), the average score is
1.60 out of 4, slightly differing between the countries. It is safe to say that benchmarking is not a common
practice in the industry, which may lead to losses of business opportunities.
The next two questions review the situation with marketing budgets. The survey helped to obtain the
data about the current amounts of money spent on marketing activities as well as about the shifts in the
budget sizes. Marketing budget amounts as reported by the respondents are presented in Figure 16.
46
Figure 16. Marketing budget.
Source: Author’s own elaboration.
11 out of 13 (84.6%) Belarusian companies have low budgets of less than €50 000, 1 (7.7%) participant
has a marketing budget in between €50 000 and €300 000, and 1 more is either uninformed about the
amount or has no dedicated marketing money. 11 out of 23 (47.8%) Portuguese respondents answered
“not sure/no marketing budget”, for 8 (34.8%) companies the budget is less than €50 000, 3 (13.0%)
businesses spend on marketing between €50 000 and €300 000 and 1 (4.3%) respondent has a budget
of more than €300 000. There are no companies within the sample with marketing budget of more than
€1 000 000. The results tell about predominantly low marketing budgets, which limit the potential depth
of a strategy.
Information about planned changes in budgets is presented in Figure 17.
Figure 17. Marketing budget changes.
Source: Author’s own elaboration.
84,6
34,8
7,713
0 4,37,7
47,8
0
20
40
60
80
100
Belarus Portugal
%
Less than €50.000 €50.000 to €299.999
€300.000 to €999.999 Not sure/No marketing budget
23,1
4,3
69,2
43,5
04,3
7,7
47,8
0
10
20
30
40
50
60
70
80
Belarus Portugal
%
Slight cut Minor or no changes
Significant increase No marketing budget

47
Majority of the sample – 9 (69.2%) respondents from Belarus and 10 (43.5%) from Portugal – expect to
have minor or no changes in their budgets. Additionally, 1 (4.3%) Portuguese and 3 (23.1%) Belarusian
companies plan to slightly cut marketing expenses, and 1 (4.3%) Portuguese company expects a
significant increase of expenditures on marketing. None of the respondents expect significant cuts and
slight increases. Stability in available funds over the years allows a more careful and precise planning of
a strategy and is deemed to be a preferred approach, even considering mostly low budgets.
At the end of the survey the respondents were provided with six statements characterizing the marketing-
oriented company. The Likert scale allows checking to what degree these statements relate to the
respondents, contributing to “Marketing involvement” evaluation. The results for 13 Belarusian
companies are presented in Table 15.
Table 15. Marketing involvement – Belarus.
Strongly
disagree, % Disagree, %
Neither agree nor
disagree, %
Agree, %
Strongly agree, %
Mean Standard deviation
We constantly perform analysis of competitors
15.4 46.2 15.4 15.4 7.7 2.54 1.198
We measure the effectiveness of marketing activities
15.4 53.8 15.4 15.4 0.0 2.31 0.947
We take into consideration results of market research
0.0 61.5 7.7 30.8 0.0 2.69 0.947
Results of marketing activities influence production and R&D
7.7 7.7 76.9 7.7 0.0 2.85 0.689
Marketing strategy has a positive impact on financial indicators
0.0 7.7 53.8 30.8 7.7 3.38 0.768
Marketing makes decisions on market entrance and development
15.4 38.5 0.0 38.5 7.7 2.85 1.345
Source: Author’s own elaboration.
According to the table, the results highly vary: responses are mostly negative for the first three questions,
neutral regarding influence on production and research, mostly positive considering strategy’s impact on
financial result and almost evenly split for the last statement. Judging by mean values, the more

48
corresponding statements for the sample is “Marketing strategy has a positive impact on financial
indicators”. The answers of the Portuguese part of the sample are presented below in Table 16.
Table 16. Marketing involvement – Portugal.
Strongly disagree,
%
Disagree, %
Neither agree nor
disagree, %
Agree, %
Strongly agree, %
Mean Standard deviation
We constantly perform analysis of competitors
4.3 21.7 21.7 43.5 8.7 3.30 1.063
We measure the effectiveness of marketing activities
17.4 43.5 21.7 13.0 4.3 2.43 1.080
We take into consideration results of market research
21.7 21.7 17.4 13.0 26.1 3.00 1.537
Results of marketing activities influence production and R&D
4.3 26.1 39.1 13.0 17.4 3.13 1.140
Marketing strategy has a positive impact on financial indicators
8.7 26.1 21.7 34.8 8.7 3.09 1.164
Marketing makes decisions on market entrance and development
8.7 8.7 0.0 69.6 13.0 3.70 1.105
Source: Author’s own elaboration.
In case of Portuguese respondents, the results lean in the positive way for the first and last statements,
in the negative way for the second statement and are almost evenly split for others. The most
corresponding statement with the highest mean is “Marketing makes decisions on market entrance and
development”. The next table shows the average rating for this group of questions by country and in
total.
Table 17. Marketing involvement – average.
Minimum score Maximum score Mean Std. deviation
Belarus 2.33 3.50 2.77 0.323
Portugal 2.17 4.00 3.11 0.531
All sample 2.17 4.00 2.99 0.490
Source: Author’s own elaboration.
The group mean is considerably higher among Portuguese respondents, characterizing a higher
marketing involvement in company’s activities. However, the mean is still too low and implies that
marketing departments do not reach their full effectiveness in interviewed companies.
With the results of descriptive analysis, it is possible to make the following conclusions:

49
1) Majority of the sample has a marketing strategy implemented;
2) Strategies are mostly simple, elements like performance metrics, benchmarking, automation systems
are not common;
3) Marketing involvement is rather low, meaning weak decision-making power;
4) The distribution of responses varies between the countries for most of the questions.
4.2. Research hypotheses confirmation
Results of hypotheses testing according to Table 8 are presented in Table 18.
Table 18. Research hypotheses confirmation.
Hypothesis Test Value P-value Conclusion
There is a positive association between return on
sales and marketing strategy Phi 0.544 0.001 Confirmed
There is a positive association between return on
sales and degree of flexibility of marketing strategy Cramer’s V 0,508 0,022 Confirmed
Number of monitored metrics has a statistically
significant impact on return on sales Kruskal-Wallis H 20,855 0.001 Confirmed
There is a positive association between return on
sales and usage of marketing automation Phi 0.284 0.089 Rejected
There is a positive association between return on
sales and degree of business collaboration in
marketing
Cramer’s V 0.535 0.009 Confirmed
There is a significant connection between return on
sales and degree of involvement in benchmarking Kruskal-Wallis H 6.974 0.223 Rejected
There is a positive association between return on
sales and marketing expenses Cramer’s V 0.543 0.060 Rejected
There is a significant connection between return on
sales and company’s marketing involvement Kruskal-Wallis H 0.878 0.645 Rejected
There is a statistically significant difference in
marketing system depth between the countries Mann-Whitney U -4.596 <0.001 Confirmed
Source: Author’s own elaboration.
According with the results presented in the previous table is possible to conclude that:
1) The results of Phi-test show that there is a positive moderate (54.4%) association between
return on sales and presence of marketing strategy, which means that respondents with a
marketing strategy generally perform better;

50
2) Cramer’s V-test conducted for return on sales and strategy flexibility has proven that there is a
moderate (50.8%) positive association between these two variables. Among the interviewed
companies, ones with more flexible marketing strategies achieve better sales;
3) To determine if there is a connection between a number of performance metrics used by the
companies and their return on sales, Kruskal-Wallis H-test has been conducted. The results show
that connection exists, meaning companies with better financial results tend to implement a larger
number of metrics;
4) According to the results of Phi-test between return on sales and marketing automation
application variables, there is a weak (28.4%) positive association, however it is not statistically
significant. A probable reason for it is a low number (19.4%) of marketing automation software
users in the sample, and a survey of bigger number of companies may yield different results;
5) The connection between involvement in collaboration in parts of marketing strategy and return
on sales is confirmed with Kramer’s V-test. There is a moderate (53.5%) positive association,
meaning that companies reaching their strategic goals with outside help tend to have better
financial result;
6) Results of Kruskal-Wallis H-test do not confirm existence of any statistically significant
connection between return on sales and involvement in benchmarking; the distribution of return
on sales values does not differ for any degree of benchmarking efforts for this sample;
7) According to Cramer’s V-test, the existing moderate (54.3%) connection between marketing
budget and return on sales is not statistically significant. A probable reason for this result is the
small number of companies – 13.9% of the sample – with marketing budget over €50 000;
8) The hypothesis about a connection between return on sales and mean of the group of
marketing involvement variables is rejected, meaning that companies with better financial results
do not tend to stronger agree with proposed statements regarding involvement of marketing into
companies’ activities;
9) The gap in levels of implementation such instruments as performance metrics and
benchmarking, as well as in means of marketing involvement responses between the analyzed
countries is confirmed by Mann-Whitney U-test. The marketing strategies of Portuguese
respondents are more complex.
Thus, five research hypotheses were confirmed. Such factors as application of a marketing strategy,
higher degree of flexibility of a strategy, monitoring more performance metrics and better involvement
into collaboration with other entities in realization of parts of the strategy are attributes of better
performing companies. Further researches in the matter with bigger sample may achieve results with
stronger association as well as confirm some of currently rejected hypotheses.

51
4.3. Recommendations for implementing and enhancing marketing strategies
According to the results of the survey, 33.3% of the sample does not develop and apply a marketing
strategy. Marketing activities of such companies are limited either to spontaneous short-lived ideas or to
a small number of routines which rarely change and do not follow any market requirements. This
approach may be caused by several reasons, such as:
- more complex involvement is not deemed necessary – a company has its own stable niche with
regular customers, and owners are satisfied with financial results;
- the executives are unable to create an effective marketing system due to lack of knowledge;
- marketing has a reputation of expense-only department, as positive effect is often hard to evaluate.
These and other possible reasons derive from the lack of high-quality education in the field of marketing.
As a mean of solving this problem, executive educational courses may be introduced. Suggestions for
such courses are as follows:
- Schedule – evening hours, 2-3 hour long classes;
- Duration – short (1-2 weeks) courses for covering a short range of topics and long (1-2 months)
courses for a more thorough approach;
- Providers – universities and faculties specializing in marketing;
- Result – development of a strategy project.
Because of raising awareness of marketing benefits for the company and providing necessary
knowledge, it is expected that share of companies not implementing strategies will decrease by 2-5%
country-wide after the first year of the programs’ operation, and will continue decreasing with lower rate
later.
The survey also showed an unsatisfactory level of performance measurement by the interviewed
companies, so improving their strategies by implementing a KPI system is advised. Although the
indicator choice depends on the needs, possibilities and market position of a company, the nature of
machine construction industry allows to develop a sample list:
- Return on marketing investments – for managing amount and effectiveness of marketing budget;
- Customer loyalty and churn rate – as companies in the industry rely on major regular customers, and
cost of customer acquisition is generally higher compared to B2C, companies must target low churn rate
and high customer loyalty;
- Market penetration and market share – monitoring positions on target markets with these metrics is
crucial for export-orienting companies, allowing them to make decisions on penetrating or exiting the
market;
- Website traffic and conversion rate – for evaluating the effectiveness of company’s website. To
correctly calculate conversion rate, due to absence of online sales in the industry, unique contacts should
be used on the website.

52
These 7 metrics provide company with information about the effectiveness of expenses, customer
satisfaction, market performance and website contribution to sales, and do not require any additional
software for tracking – table processor such as MS Excel allows manual work with them.
Marketing automation software reduces the amount of time required to perform various tasks, increasing
the effectiveness of marketing department. This is one of the key issues for the industry, since none of
the Belarusian respondents use these systems, according to the survey results. Some of the solutions
suitable to B2B companies are Salesfusion, Sales Engine International, Demandbase, Eloqua, Marketo.
Implementation of such a system provides company with marketing database, process automation and
analytics. Machine industry companies using marketing automation are expected to increase stuff
productivity by 2-7%.
Situation with collaboration within the sample is noticeably better, with majority of respondents including
it in their strategies. Nevertheless, there is room for improvement. For instance, by observing or even
participating in daily activities of partner company’s respective departments, managers may come up
with potentially useful ideas for both the partner and their own company. Although such rotations require
managers to spend time away from their positions, they provide an opportunity to eliminate partner’s
weaknesses or borrow his strengths. Another recommendation is working with partners to develop a
synergetic marketing strategy, dividing marketing efforts to achieve better efficiency in delivering
products to customers.
Lastly, the benchmarking, though unused by majority of the sample, is a powerful tool for understanding
and gaining competitive advantage. Taking into consideration specifics of the industry, following
directions for benchmarking may be proposed:
- New products or services – provides opportunity to counter a threat to existing market position or to
expand to a new niche;
- Pricing – helps in adapting own prices to any market changes;
- Distribution channels – provides information for improving own channels by altering channels or by
uncovering potential dealers.
The aforementioned recommendations will enable the producers of machines and equipment to deepen
their marketing involvement, to complement their marketing strategies with potentially effective elements
and, in time, to make marketing a stronger point of the industry.

53
Conclusions, Limitations and Future Research Lines
To complete the aim of this research following activities have been conducted:
- review of literature relevant to the topic;
- industry analysis, including economic state, competitiveness and perspectives;
- the survey that allowed to collect the required data;
- descriptive and inferential analysis of collected data;
- development of recommendations according to the results of analysis.
The study clarified weak points of respondents’ marketing systems and established relations between
various marketing elements and financial result, marking points for prioritized improvement. The results
of the work implicate that impact of marketing on a company’s overall performance is significant, thus
time and resources spent to develop or improve marketing strategy are justified.
Based on the results obtained it is possible to present recommendations for implementing and enhancing
marketing strategies which are described in the following paragraphs.
According to the results of the survey, 33.3% of the sample does not develop and apply a marketing
strategy. Marketing activities of such companies are limited either to spontaneous short-lived ideas or to
a small number of routines which rarely change and do not follow any market requirements. This
approach may be caused by several reasons, such as:
- more complex involvement is not deemed necessary – a company has its own stable niche
with regular customers, and owners are satisfied with financial results;
- the executives are unable to create an effective marketing system due to lack of knowledge;
- marketing has a reputation of expense-only department, as positive effect is often hard to
evaluate.
These and other possible reasons derive from the lack of high-quality education in the field of marketing.
As a mean of solving this problem, executive educational courses may be introduced. Suggestions for
such courses are as follows:
- Schedule – evening hours, 2-3 hour long classes;
- Duration – short (1-2 weeks) courses for covering a short range of topics and long (1-2 months)
courses for a more thorough approach;
- Providers – universities and faculties specializing in marketing;
- Result – development of a strategy project.
Because of raising awareness of marketing benefits for the company and providing necessary
knowledge, it is expected that share of companies not implementing strategies will decrease by 2-5%

54
country-wide after the first year of the programs’ operation, and will continue decreasing with lower rate
later.
The survey also showed an unsatisfactory level of performance measurement by the interviewed
companies, so improving their strategies by implementing a KPI system is advised. Although the
indicator choice depends on the needs, possibilities and market position of a company, the nature of
machine construction industry allows to develop a sample list:
- Return on marketing investments – for managing amount and effectiveness of marketing
budget;
- Customer loyalty and churn rate – as companies in the industry rely on major regular
customers, and cost of customer acquisition is generally higher compared to B2C, companies
must target low churn rate and high customer loyalty;
- Market penetration and market share – monitoring positions on target markets with these
metrics is crucial for export-orienting companies, allowing them to make decisions on penetrating
or exiting the market;
- Website traffic and conversion rate – for evaluating the effectiveness of company’s website.
To correctly calculate conversion rate, due to absence of online sales in the industry, unique
contacts should be used on the website.
These 7 metrics provide company with information about the effectiveness of expenses, customer
satisfaction, market performance and website contribution to sales, and do not require any additional
software for tracking – table processor such as MS Excel allows manual work with them.
Marketing automation software reduces the amount of time required to perform various tasks, increasing
the effectiveness of marketing department. This is one of the key issues for the industry, since none of
the Belarusian respondents use these systems, according to the survey results. Some of the solutions
suitable to B2B companies are Salesfusion, Sales Engine International, Demandbase, Eloqua, Marketo.
Implementation of such a system provides company with marketing database, process automation and
analytics. Machine industry companies using marketing automation are expected to increase stuff
productivity by 2-7%.
Situation with collaboration within the sample is noticeably better, with majority of respondents including
it in their strategies. Nevertheless, there is room for improvement. For instance, by observing or even
participating in daily activities of partner company’s respective departments, managers may come up
with potentially useful ideas for both the partner and their own company. Although such rotations require
managers to spend time away from their positions, they provide an opportunity to eliminate partner’s
weaknesses or borrow his strengths. Another recommendation is working with partners to develop a
synergetic marketing strategy, dividing marketing efforts to achieve better efficiency in delivering
products to customers.

55
Lastly, the benchmarking, though unused by majority of the sample, is a powerful tool for understanding
and gaining competitive advantage. Taking into consideration specifics of the industry, following
directions for benchmarking may be proposed:
- New products or services – provides opportunity to counter a threat to existing market position
or to expand to a new niche;
- Pricing – helps in adapting own prices to any market changes;
- Distribution channels – provides information for improving own channels by altering channels
or by uncovering potential dealers.
The aforementioned recommendations will enable the producers of machines and equipment to deepen
their marketing involvement, to complement their marketing strategies with potentially effective elements
and, in time, to make marketing a stronger point of the industry.
Limitations of conducted work lie in low sample size, which limits the chances of finding significant
connections within the sample and does not allow to spread the results of the research on the population.
Future research lines include similar surveys for other industries and other countries, which would
determine various strengths, weaknesses and dependencies, thus creating possibilities to develop
industry- and region-specific recommendations. Another research line lies in experimental application of
proposed recommendation to several chosen companies, thus giving opportunity to gather data on
speed and strength of impact.
56
References
Agic, E., Cinjarevic, M., Kurtovic, E., & Cicic, M. (2016). Strategic marketing patterns and performance
implications. European Journal of Marketing, Vol. 50, Issue 12, 2216-2248.
Alosani, M. S., Al-Dhaafri, H. S., & Bin Yusoff, R. Z. (2016). Mechanism of Benchmarking and Its Impact
on Organizational Performance. International Journal of Business and Management; Vol. 11, No. 10,
172-183.
Belstat. (2016). Industry of the Republic of Belarus. Statistical book. Minsk: National Statistical
Committee of the Republic of Belarus.
Belstat. (2016). Foreign trade. Statistical Book. Minsk: National Statistical Committee of the Republic of
Belarus.
Brennan, R., Canning, L., & McDowell, R. (2017). Business-to-business Marketing. London: SAGE
Publications Ltd.
Chang, J. (2017). The effects of buyer-supplier's collaboration on knowledge and product innovation.
Industrial Marketing Management, May.
Chen Kuang-Jung, Chen Mei-Liang, Liu Chu-Mei, & Huang Chien-Jung. (2015). Integrated marketing
communication, collaborative marketing, and global brand building in Taiwan. The International Journal
of Organizational Innovation Vol.7 Num.4, 99-107.
Council of Ministers of Republic of Belarus. (2012, July 5). Development program of the industrial
complex of the Republic of Belarus for until 2020. Minsk.
Davcik, N., & Sharma, P. (2016). Marketing resources, performance, and competitive advantage: A
review and future research directions. Journal of Business Research.
David, M., David, F., & David, F. (2016). The quantitative strategic planning matrix: a new marketing tool.
Jouornal of strategic marketing, 1-11.
Ettenson, R., Conrado, E., & Knowles, J. (2013). Rethinking the 4P's. Harvard Business Review,
January-February.
Fill, C., & McKee, S. (2012). Business Marketing Face to Face. The Theory and Practice of B2B
Marketing. Oxford: Goodfellow Publishers Ltd.
Frösén, J., & Tikkanen, H. (2016). Development and impact of strategic marketing – a longitudinal study
in a Nordic country from 2008 to 2014. European Journal of Marketing, Vol. 50 Issue: 12, 2269-2294.
Grewal, D., Iyer, G., Kamakura, W., Mehrotra, A., & Sharma, A. (2009). Evaluation of subsidiary
marketing performance: combining process and outcome performance metrics. ournal of the Academy
of Marketing Science, 37 (2), 117-129.
Grønholdt, L., Martensen, A., Jørgensen, S., & Jensen, P. (2014). Customer experience management
and business performance. 17th QMOD International Conference on Quality and Service Sciences.
Prague.
Hansen, J., McDonald, R., & Mitchell, R. (2017). Marketing Benchmarking, Triangulated Isomorphism,
and Firm Strategy. Developments in Marketing Science: Proceedings of the Academy of Marketing
Science. Cham: Springer.

57
Hollebeek, L., Conduit, J., & Brodie, R. (2016). Strategic drivers, anticipated and unanticipated outcomes
of customer engagement. Journal of marketing management, Vol. 32, Num. 5, 393-398.
Hsin-Pin Fu, & Tsung-Sheng Chang. (2015). An Analysis of the Factors affecting the Adoption of Cloud
Consumer Relationship Management in the Machinery Industry in Taiwan. Information Development, 1-
16.
Hutt, M., & Speh, T. (2012). Business Marketing Management. Mason: South-Western.
INE. (2016). Statistics of Industrial Production 2015. Lisbon: National Institute of Statistics.
Järvinen, J., & Taiminen, H. (2016). Harnessing marketing automation for B2B content marketing.
Industrial Marketing Management 54, 164-175.
Krush, M., Agnihotri, R., Trainor, K., & Nowlin, E. (2013). Enhancing organizational sensemaking: An
examination of the interactive effects of sales capabilities and marketing dashboards. Industrial
Marketing Management 42, 824-835.
Kumar, V., Sharma, A., & Gupta, S. (2017). Accessing the influence of strategic marketing research on
generating impact: moderating roles of models, journals, and estimation approaches. Journal of the
Academy of Marketing Science, Volume 45, Issue 2, 164-185.
Lima, D. (2016). Effects of marketing in different stages of development. Academic Journal of Business,
Administration, Law and Social Sciences, Vol. 2 No. 2, 343-348.
Litvinova, T., Khmeleva, G., Ermolina, L., Alferova, T., & Cheryomushkina, I. (2016). Scenarios of
Business Development in the Agricultural Machinery Market Under Conditions of International Trade
Integration. Contemporary Economics, Vol. 10, Num. 4, 323-332.
Mintz, O., Gilbride, T., Currim, I., & Lenk, P. (2016). Metric Effectiveness and Use in Marketing-Mix
Decisions: Correcting for Endogenous Selection Effects and Ex-Ante Expectations. Baton Rouge:
Louisiana State University.
Mone, S.-D., Pop, M., & Racolța-Paina, N.-D. (2013). The "what" and "how" of marketing performance
management. Management and Marketing Challenges for the Knowledge Society Vol.8, No.1, 129-146.
Monier, J.-H., Gordon, J., & Ogren, P. (2013). How CMOs Can Get CFOs on Their Side. Harvard
Business Review.
Natsubidse, A., Litvinova, T., Bezrukova, T., & Bezrukov, B. (2016). Development of Business Activities
in the Agricultural Machinery Market through Implementation of Cluster Initiatives. Mediterranean Journal
of Social Sciences, Vol 7 No 1, 401-405.
Osuagwu, L. (2016). A Model of Strategic Marketing Decision Premises. International Journal of
Marketing Studies; Vol. 8, No. 3.
Patterson, L. (2015). How best-in-class marketers use alignment and accountability for value creation.
Applied Marketing Analytics, Vol.1, Number 2, 168-174.
Pawlowskaja, J. (2015). Key factors of competitiveness increase of machine construction enterprises.
Economic Bulletin of Economic Research Institute of Ministry of Economy, Num.6, 4-15.
Pemartín, M., Rodríguez-Escudero, A. I., & Munuera-Alemán, J. L. (2017). Effects of Collaborative
Communication on NPD Collaboration Results: Two Routes of Influence. Journal of Product Innovation
Management.

58
Po-Chien Li, & Yen-Chun Chen. (2016). Exploring interaction-based antecedents of marketing-R&D
collaboration: evidence from the Taiwan’s semiconductor industry. Innovation: Organization &
Management, Vol. 18, Iss. 3.
Primshyts, D. (2009). Evaluation of production potential of machine construction industry as a strategic
factor for industry's competitiveness. Competitiveness of enterprises and regions in global economy, pp.
289-295.
Rudd, J. M., Jaakkola, M., & Marshall, G. W. (2016). Strategic marketing: New horizons in theory and
research. European Journal of Marketing, Vol. 50 Issue: 12, 2070-2076.
Shamma, H., & Hassan, S. (2013). Customer-driven benchmarking. A strategic approach toward a
sustainable marketing performance. Benchmarking: An International Journal Vol.20 Num.3, 377-395.
Trinh, G., Romaniuk, J., & Tanusondjaja, A. (2016). Benchmarking buyer behavior towards new brands.
Marketing Letters, Vol. 27, Issue 4, 743-752.
Wani, T. (2013). From 4Ps to SAVE. A theoretical analysis of various marketing mix models. Business
Sciences. International Research Journal, Vol.1, Issue 1.

59
Appendix
Strategic marketing implementation survey
Dear respondent! Thank you for participating in this survey. It is completely anonymous; no information
about the identity of your organization is being gathered and all published data will be generalized.
Please answer the following questions, choosing answers from the list, typing your answer in the text
field or filling out the table.
1. What is the average employee age in your company?
o 21 or under
o 22 to 34
o 35 to 44
o 45 to 54
o 55 or more
2. What is the approximate number of permanent employees in your company?
o Less than 50
o 50-999
o 1000-4999
o 5000 or more
3. How many male employees are there in your company?
4. How many female employees are there in your company?
5. How many years has your company been present on the market?
o Less than 5
o 5-9
o 10-14
o 15-19
o 20 or more
6. What is your company’s average Return on Sales for the last 5 years?
o Negative value/Net loss
o 0% - 4%
o 5% - 9%
o 10% - 14%
o 15% - 19%
o 20% or more
o Not sure

60
7. Does your company adopt marketing strategies?
o Strategy is used, and is developed by own employees
o Strategy is used, and is developed by an outside company
o Marketing strategy is currently not adopted, but may be adopted in the future
o Marketing strategy is currently not adopted and is not planned for development
8. Does your company’s policy allow corrections in the adopted strategy?
o Marketing strategy is flexible and may be modified whenever it is required
o Marketing strategy is revised on a periodic basis but can’t be altered at another time
o Marketing strategy is rigid and can’t be altered
o Not applicable/Marketing strategy is not implemented
9. Which model is used as a basis for your strategy?
Tick all that apply
□ 4P
□ 7P or any other extension of a 4P model
□ 4C
□ 4E
□ SAVE
□ Not applicable/No current marketing strategy
□ Other
10. Which of the following metrics, if any, may be used by your company in the future to measure
marketing effectiveness?
Definitely will not
Probably will not
Unsure Probably
will Definitely
will Already using
Brand awareness
Perceived differentiation
Perceived quality/esteem
Market share
Conversion rate
Market penetration
Customer loyalty
Customer satisfaction
Customer attrition
Customer complaints
Customer lifetime value
Return on marketing investment
Customer profitability
Sales revenue

61
11. To what extent does your company use marketing automation solutions?
o Extensive use in most of the marketing processes
o Limited use in some of the marketing processes
o Not currently using but planning to use in the future
o Not currently using and not planning to use
12. In what way does your company collaborate with other entities (distributors, resellers,
suppliers, customers, marketing agencies, etc.) in realization of parts of the marketing strategy?
o Constant (daily or weekly) partnership
o Periodic (monthly, quarterly or yearly) exchanges
o Rare or occasional collaboration
o The company never collaborates with external entities
o Not applicable/No marketing strategy
13. To what extent is benchmarking used in your company to assess marketing performance?
Never/None Occasionally/ Single metric/
Single company
Periodically/ Several metrics/
Several companies
Constantly/ Majority or all
metrics/Majority or all companies
on the market
Regarding frequency
Regarding assessed metrics
Regarding target companies
14. What is your marketing budget for this year?
o Less than €50 000
o €50 001 - €299 999
o €300 000 - €999 999
o €1 mil - €4.9 mil
o €5 mil - €9.9 mil
o €10 mil or more
o Not sure/No marketing budget

62
15. What changes in marketing budget are planned in your company_
o Significant cut
o Slight cut
o Minor or no changes
o Slight increase
o Significant increase
o Not applicable/No defined marketing budget
16. To what degree the following statements apply to your company?
Strongly disagree
Disagree Neither agree nor disagree
Agree Strongly
agree
We constantly perform analysis of competitors
We periodically measure the effectiveness of marketing activities
When developing company’s strategy, we take into consideration results of market research
Results of marketing activities influence the work of production and R&D departments
Our marketing strategy has a positive impact on financial indicators
Marketing is responsible for making decisions on market entrance and development
Thank you for your collaboration!