Agricultural Land Use and Best Management Practices to Control Nonpoint Water Pollution
14
Agricultural Land Use and Best Management Practices to Control Nonpoint Water Pollution MARIA NICOLETTA RIPA ANTONIO LEONE Department of Environment and Forests Engineering Group Tuscia University, DAF via S.Camillo de Lellis 01100 Viterbo, Italy MONICA GARNIER* ANTONIO LO PORTO Water Research Institute National Research Council via De Blasio 5 70125 Bari, Italy ABSTRACT / In recent years, improvements in point-source depuration technologies have highlighted the problems regarding agricultural nonpoint (diffuse) sources, and this is- sue has become highly relevant from the environmental point of view. The considerable extension of the areas responsible for this kind of pollution, together with the scarcity of funds available to local managers, make minimizing the impacts of nonpoint sources on a whole basin a virtually impossible task. This article presents the results of a study intended to pinpoint those agricultural areas, within a basin, that contribute most to water pollution, so that operations aimed at preventing and/or reducing this kind of pollution can be focused on them. With this aim, an innovative approach is presented that integrates a field-scale management model, a simple regression model, and a geographic information system (GIS).The Lake Vico basin, where recent studies highlighted a considerable in- crease in the trophic state, mainly caused by phosphorus (P) compounds deriving principally from the intensive cultivation of hazelnut trees in the lake basin, was chosen as the study site. Using the management model Groundwater Loading Effects of Agricultural Management Systems (GLEAMS), the consequences, in terms of sediment yield and phosphorus export, of hazelnut tree cultivation were estimated on different areas of the basin with and without the application of a best management practice (BMP) that consists of growing mea- dow under the trees. The GLEAMS results were successively extended to basin scale thanks to the application of a pur- posely designed regression model and of a GIS. The main conclusions can be summarized as follows: The effectiveness of the above-mentioned BMP is always greater for erosion reduction than for particulate P reduction, whatever the slope value considered; moreover, the effectiveness with reference to both particulate P and sediment yield production decreases as the slope increases. The proposed approach, being completely distributed, represents a considerable step ahead compared to the semidistributed or lumped ap- proaches, which are traditionally employed in research into tools to support the decision-making process for land-use planning aimed at water pollution control. During the last few decades, a significant decrease of water quality has been observed in different parts of the world. Because it has occurred in spite of a con- siderable increase in depuration of point pollution sources, it has been attributed to an increased contri- bution of nonpoint pollution sources (NPSs), which is, in turn, strongly dependent on land use. The interna- tional literature reports many cases with reference to such problems (see, e.g., Arheimer and others 2004; Haycock and Muscutt 1995; Sims and others 1999). There is general agreement on considering agri- culture as the main nonpoint source of nutrients to water (Rekolainen and others 1999; Sharpley and others 1999; Sims and others 1999), due to the high percentage of land covered by crops in most water- sheds and the heavy use of fertilizers in modern intensive agriculture (Garnier and others 1999). In particular, eutrophication, caused mainly by excessive input of nutrients [especially phosphorus (P)] from farming activities, has been identified as the most critical problem impairing the quality of surface water in both developed and developing countries (Novotny 2003; Sharpley and others 1999). Due to the diffuse nature of these environmental problems, structural and system solutions used to ad- KEY WORDS: Nonpoint water pollution; Phosphorus; Land management; Best management practices; Meta- models; GIS Published online May 4, 2006 *Author to whom correspondence should be addressed; email: [email protected] Environmental Management Vol. 38, No. 2, pp. 253–266 ª 2006 Springer Science+Business Media, Inc. DOI: 10.1007/s00267-004-0344-y
Transcript of Agricultural Land Use and Best Management Practices to Control Nonpoint Water Pollution
Agricultural Land Use and Best ManagementPractices to Control Nonpoint Water Pollution
MARIA NICOLETTA RIPA
ANTONIO LEONE
Department of Environment and ForestsEngineering GroupTuscia University, DAFvia S.Camillo de Lellis01100 Viterbo, Italy
MONICA GARNIER*
ANTONIO LO PORTO
Water Research InstituteNational Research Councilvia De Blasio 570125 Bari, Italy
ABSTRACT / In recent years, improvements in point-sourcedepuration technologies have highlighted the problemsregarding agricultural nonpoint (diffuse) sources, and this is-sue has become highly relevant from the environmental pointof view. The considerable extension of the areas responsiblefor this kind of pollution, together with the scarcity of fundsavailable to local managers, make minimizing the impacts ofnonpoint sources on a whole basin a virtually impossible task.This article presents the results of a study intended to pinpointthose agricultural areas, within a basin, that contributemost towater pollution, so that operations aimed at preventing and/orreducing this kind of pollution can be focused on them. With
this aim, an innovative approach is presented that integrates afield-scale management model, a simple regression model,and a geographic information system (GIS).The Lake Vicobasin, where recent studies highlighted a considerable in-crease in the trophic state, mainly caused by phosphorus (P)compounds deriving principally from the intensive cultivationof hazelnut trees in the lake basin, was chosen as the studysite. Using the management model Groundwater LoadingEffects of Agricultural Management Systems (GLEAMS), theconsequences, in terms of sediment yield and phosphorusexport, of hazelnut tree cultivation were estimated on differentareas of the basin with and without the application of a bestmanagement practice (BMP) that consists of growing mea-dow under the trees. The GLEAMS results were successivelyextended to basin scale thanks to the application of a pur-posely designed regression model and of a GIS.The main conclusions can be summarized as follows: Theeffectiveness of the above-mentioned BMP is always greaterfor erosion reduction than forparticulate P reduction,whateverthe slope value considered; moreover, the effectiveness withreference to both particulate P and sediment yield productiondecreases as the slope increases. The proposed approach,being completely distributed, represents a considerable stepahead compared to the semidistributed or lumped ap-proaches, which are traditionally employed in research intotools to support the decision-making process for land-useplanning aimed at water pollution control.
During the last few decades, a significant decrease ofwater quality has been observed in different parts ofthe world. Because it has occurred in spite of a con-siderable increase in depuration of point pollutionsources, it has been attributed to an increased contri-bution of nonpoint pollution sources (NPSs), which is,in turn, strongly dependent on land use. The interna-tional literature reports many cases with reference to
such problems (see, e.g., Arheimer and others 2004;Haycock and Muscutt 1995; Sims and others 1999).
There is general agreement on considering agri-culture as the main nonpoint source of nutrients towater (Rekolainen and others 1999; Sharpley andothers 1999; Sims and others 1999), due to the highpercentage of land covered by crops in most water-sheds and the heavy use of fertilizers in modernintensive agriculture (Garnier and others 1999). Inparticular, eutrophication, caused mainly by excessiveinput of nutrients [especially phosphorus (P)] fromfarming activities, has been identified as the mostcritical problem impairing the quality of surface waterin both developed and developing countries (Novotny2003; Sharpley and others 1999).
Due to the diffuse nature of these environmentalproblems, structural and system solutions used to ad-
KEY WORDS: Nonpoint water pollution; Phosphorus; Landmanagement; Best management practices; Meta-models; GIS
Published online May 4, 2006
*Author to whom correspondence should be addressed; email:
Environmental Management Vol. 38, No. 2, pp. 253–266 ª 2006 Springer Science+Business Media, Inc.
DOI: 10.1007/s00267-004-0344-y
dress them have mostly proven to be inadequate.Planning and management interventions, on the con-trary, aimed at confronting the causes of pollution ra-ther than limiting and/or correcting their effect areboth less expensive and much more effective (Myersand others 1985). Therefore much of the most recentresearch has been specifically oriented towards thedevelopment of agricultural management practicesaimed at preventing water pollution by nutrients (Simsand others 1999; Haycock and Muscutt 1995). To bereally effective, these management practices have to bebased on the best scientific information available andshould be included within laws, regulations, andguidelines to be explained to farmers by efficientextension services. It is common opinion, in fact, thatscience is so far ahead of normal farm practice that theenvironmental benefits attainable from money spenton extension work far exceeds any likely benefit fromfurther research (Frost 1999).
Agrochemicals move from agricultural land, thusrepresenting a potential water pollution risk, followingtwo main ways (Novotny and Olem 1994): Nitrogen (N),and in particular the very soluble nitrates, generallyreaches groundwater dissolved in the percolating water;phosphorus, which is less soluble, mainly moves boundto eroded soil particles, in this way reaching surface wa-ter (Sharpley and others 1994; Heathwaite and Sharpley1999). One could say that water movement representsthe engine, whereas agricultural land use is the fuel.
Unfortunately, due to the different pathways fol-lowed by diffuse pollutants, one water quality problemmight be aggravated while solving another; for example,on-farm practices applied to reduce surface runoff andP export by increasing infiltration will typically increasegroundwater recharge and NO3 leaching (Pionke andothers 2000). For this reason, an approach that takesinto account at the same time both P and N and thewhole, complex man–environment system is needed.
Although necessary, this approach has proved to beinsufficient in many cases. With this reference Novotny(2003), quoting an article by Stalnacke (2003), re-ferred to the case of eastern Europe where, in the shortrun of about 5–10 years after the dramatic reduction offertilizers consequent to the political changes of 1989,nutrient inputs into receiving waters were far less thanexpected. This requires a shift in perspective; there is,in fact, a very extensive literature on soil erosion, butalmost all of it is concentrated on the eroding soil ra-ther than on the receiving waters (Frost 1999).
Apart from the pathways followed by agrochemicalswhen moving from agricultural land, another funda-mental difference between N and P consists in thepollution-generating areas. Although, in fact, agricul-
tural N pollution mostly originates as subsurface flowentering the soil from relatively large portions of abasin, P export zones are much less extended (Pionkeand others 2000). This is why, mainly in the cases inwhich P represents the main pollutant, it is both uselessand uselessly expensive to apply pollution controlmeasures to the whole basin, as similar benefits can beobtained by applying these measures to the pollution-generating areas only. In particular, Novotny (2003),quoting an article by Heathwaite and Sharpley (1998),asserted that P loss from soil depends on the coinci-dence of source factors and transport factors.
Source factors determine catchment areas with ahigh potential to contribute P, whereas transport fac-tors determine whether this potential is translated intoP loss. The areas where source factors and transportfactors coexist have been defined as critical sourceareas (CSAs) for P loss. It is on these CSAs that man-agement efforts have to be concentrated; a number ofbest management practices (BMPs) have to be plannedand their effectiveness has to be tested (Correll 1996;Ongley 1996; Stewart and others 1975; US-NRC 1993).
The huge number of variables that condition NPSpollution, in general, and P loss from agriculture, inparticular, makes the CSA location a rather difficult task.The consequences are, first, that long monitoring peri-ods are necessary to assess mechanisms and processesand, second, that the use of simulation models is fun-damental, but they need to be focused on land use andrequire special attention in managing uncertainty. Inthis field, in fact, not only must the uncertainty intrinsicin model simulations be taken into account but also thatderiving from the variability inherent in the investigatedreality. At first sight, this might seem to increase thecomplexity of the investigations; in fact, it represents anadvantage. Long-term mean values generally attenuatethe variability typical of single events, thus reducing theeffect of uncertainty on model simulations.
The simulation models to be used in the manage-ment of NPSs of pollution can be either lumped ordistributed. Early NPS models used the lumped ap-proach, treating the whole or large portions of thecatchment as homogeneous units. This method pro-duces uniform responses to the external inputs,whereas distributed parameter models require a gridnetwork be applied to the catchment. The inputparameters are specified for each grid cell, therebyaccounting for their spatial distribution.
According to Leon and others (2002), because ofthe inherent spatial variability of all of the physical andchemical characteristics of the environment, distrib-uted models approximate reality better when dealingwith NPSs, although they require an ability to handle
254 M. N. Ripa and others
large amounts of data and thus increase the effort re-quired to collect and compile the input files. Becausethe high data requirement of complex distributedsimulation models often provides little, if any,improvement in comparison to the prediction capa-bilities of simpler models, the so-called metamodels,which are simple approximations to complex simula-tion models (Schoumans and others 2002), seem to bethe most appropriate to use for management purposes.Generally speaking, to build a metamodel, a simulationmodel is used and then a regression function is fittedto find the best relation between the model input andoutput. This regression function is called a metamodel.
In the present article, a lake of volcanic origin wastaken into consideration. Studies performed at thebeginning of the 1990s revealed a considerable in-crease in P concentration within the lake water com-pared to the previous decades. Hazelnut tree croppingis the agricultural activity that provides the greatestamount of nutrients (P in particular) to the water ofthe lake because, apart from the significant amount offertilizers needed, it requires bare soil to optimizemechanical harvesting, which considerably increaseserosion risk. The aim of the work has been, on the onehand, to locate CSAs that are the main areas respon-sible for the observed P pollution within the lake basinand, on the other hand, to assess the effectiveness, interms of sediment yield (A) and particulate P (PP)reduction, of the BMP ‘‘growing meadow under thehazelnut trees’’ currently applied in these areas. Withthis aim, the field-scale simulation model GroundwaterLoading Effects of Agricultural Management Systems(GLEAMS) was employed to evaluate sediment yieldand particulate P, corresponding to different slopeswithin the lake basin, with and without the above-mentioned BMP. A regression model was then fitted tofind the best relation between slope, on the one hand,and A and PP, on the other hand, with and without theBMP under consideration. Thanks to this regressionmodel, GLEAMS results were extended to a large area.
The issues tackled in this article are experiencedover wide areas of Italy, a country largely characterizedby modern intensive agriculture. The approach pre-sented here is suited to face a variety of diffuse pollu-tion problems and has, for this reason, considerableimportance from the point of view of agricultural land-use planning.
Materials and Methods
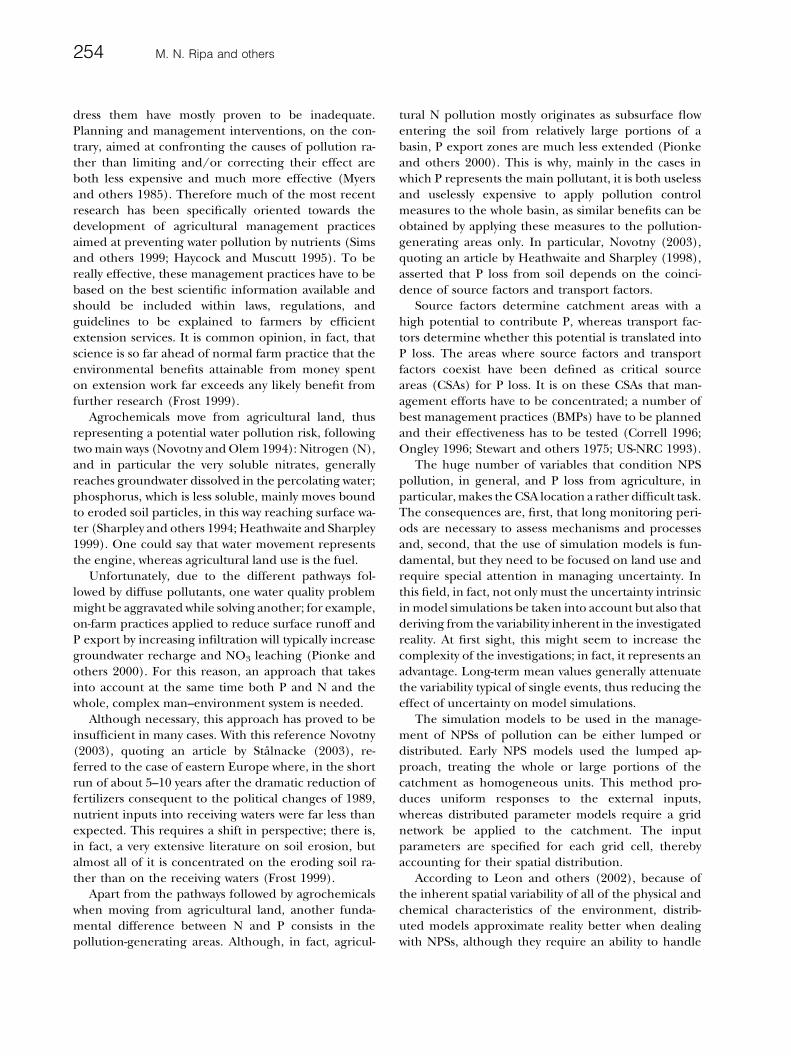
The study area chosen was the Lake Vico igneous rockbasin (40.8 km2) located in central Italy, 60 km north ofRome (Figure 1). The lake, which has a surface area of
12.1 km2, lies in the center of the basin. Elevation rangesfrom 965 m above sea level(a.s.l.) (Mount Fogliano) to510 m a.s.l. (the lake surface level) and much of the basinslopes steeply. For example, the distance from the peakof Mount Fogliano to the lake surface is only �3 km.
The climate is subhumid, the average annual pre-cipitation is 1104 mm, and the wettest season is au-tumn, during which November is the wettest month.
The lake is particularly vulnerable to pollution, inparticular, to eutrophication. The reason for this vul-nerability, as reported in a number for articles (e.g.,Barbanti and others 1971; Franzoi 1997; Leone andRipa 1998), is that the area is young from the geolog-ical point of view. In fact, volcanic activity ceased in thebasin only �900,000 years ago. Consequently, thehydrographic network is not hierarchized and, as aresult, there are higher runoff peaks, a more frequentoccurrence of surface runoff and erosion, and moredestructive water action (Leone and others 2002).Thus, the observed occurrence of an erosive landscapeevolution phase is not surprising. Moreover, becausethe lake has no tributary, it has a very long hydraulicresidence time (17 years), which increases the lake�svulnerability to eutrophication.
Another characteristic of the lake, which is commonto all lakes in temperate regions and which greatlycontributes to their vulnerability, is water stratificationaccording to temperature, which impedes efficientvertical water mixing and is responsible for a trend toanoxic conditions of the hypolimnion, which, in turn,favors the release of PP.
Figure 1. Map of Italy showing the location of the Lake Vicobasin.
Agricultural Land Use to Control Water Pollution 255
Besides the natural vulnerability of the lake, agri-cultural activities, and, above all, hazelnut tree culti-vation further increase the risk of a rise in Pconcentration. Furthermore, these activities are alwayscarried out in erosion risk zones. Because of itscharacteristics and because civil and industrial settle-ments are negligible or absent, the study area can beconsidered a perfect natural laboratory for agricul-tural NPS investigations. Indeed, this is why, since theend of the 1960s (the very beginning of studies onNPSs), the lake and its basin have been intensivelystudied.
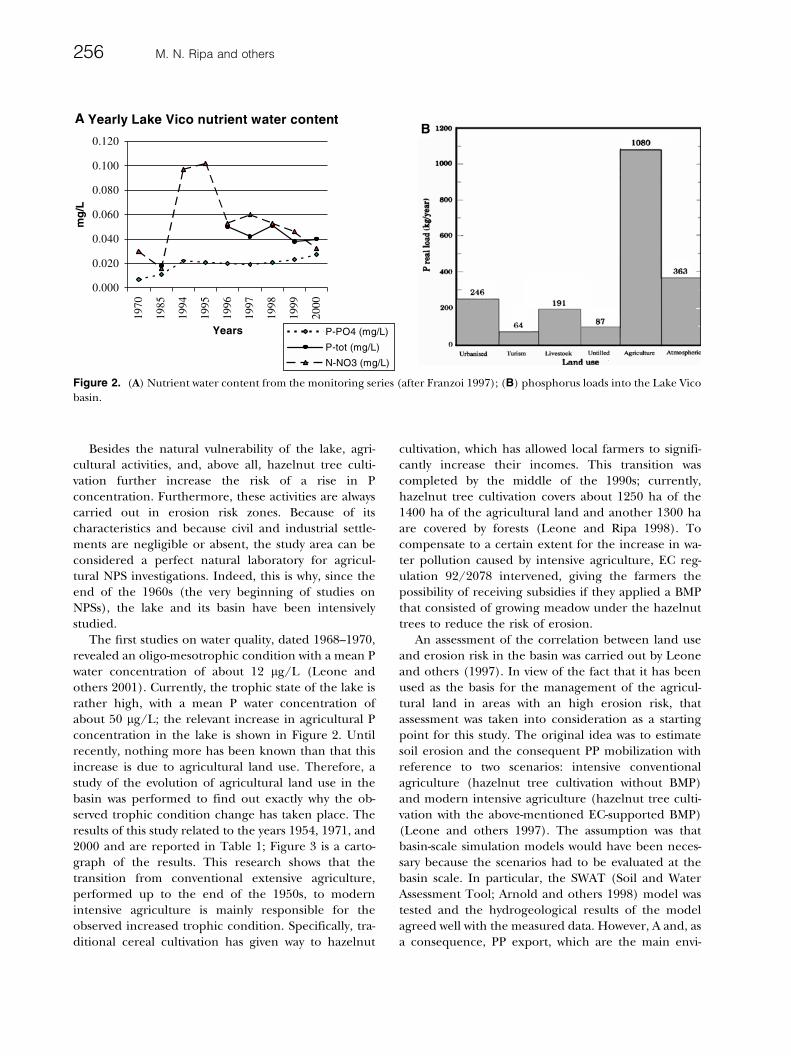
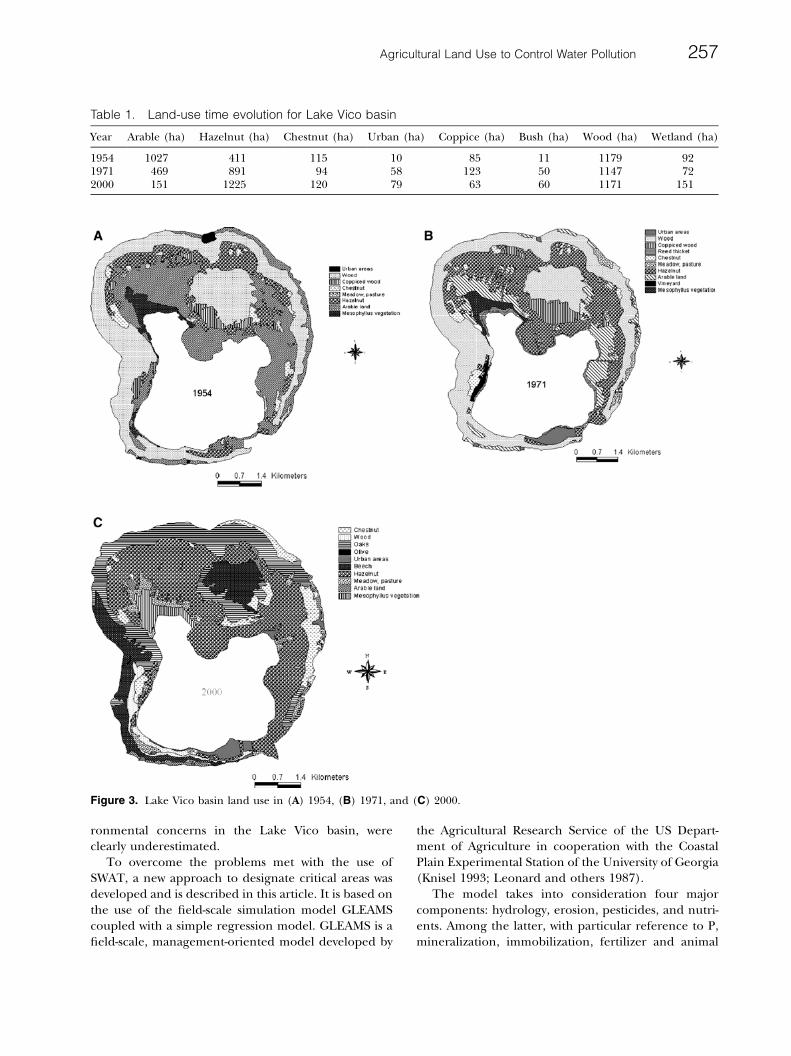
The first studies on water quality, dated 1968–1970,revealed an oligo-mesotrophic condition with a mean Pwater concentration of about 12 lg/L (Leone andothers 2001). Currently, the trophic state of the lake israther high, with a mean P water concentration ofabout 50 lg/L; the relevant increase in agricultural Pconcentration in the lake is shown in Figure 2. Untilrecently, nothing more has been known than that thisincrease is due to agricultural land use. Therefore, astudy of the evolution of agricultural land use in thebasin was performed to find out exactly why the ob-served trophic condition change has taken place. Theresults of this study related to the years 1954, 1971, and2000 and are reported in Table 1; Figure 3 is a carto-graph of the results. This research shows that thetransition from conventional extensive agriculture,performed up to the end of the 1950s, to modernintensive agriculture is mainly responsible for theobserved increased trophic condition. Specifically, tra-ditional cereal cultivation has given way to hazelnut
cultivation, which has allowed local farmers to signifi-cantly increase their incomes. This transition wascompleted by the middle of the 1990s; currently,hazelnut tree cultivation covers about 1250 ha of the1400 ha of the agricultural land and another 1300 haare covered by forests (Leone and Ripa 1998). Tocompensate to a certain extent for the increase in wa-ter pollution caused by intensive agriculture, EC reg-ulation 92/2078 intervened, giving the farmers thepossibility of receiving subsidies if they applied a BMPthat consisted of growing meadow under the hazelnuttrees to reduce the risk of erosion.
An assessment of the correlation between land useand erosion risk in the basin was carried out by Leoneand others (1997). In view of the fact that it has beenused as the basis for the management of the agricul-tural land in areas with an high erosion risk, thatassessment was taken into consideration as a startingpoint for this study. The original idea was to estimatesoil erosion and the consequent PP mobilization withreference to two scenarios: intensive conventionalagriculture (hazelnut tree cultivation without BMP)and modern intensive agriculture (hazelnut tree culti-vation with the above-mentioned EC-supported BMP)(Leone and others 1997). The assumption was thatbasin-scale simulation models would have been neces-sary because the scenarios had to be evaluated at thebasin scale. In particular, the SWAT (Soil and WaterAssessment Tool; Arnold and others 1998) model wastested and the hydrogeological results of the modelagreed well with the measured data. However, A and, asa consequence, PP export, which are the main envi-
Yearly Lake Vico nutrient water content
0.000
0.020
0.040
0.060
0.080
0.100
0.12019
70
1985
1994
1995
1996
1997
1998
1999
2000
Years
mg
/L
P-PO4 (mg/L)
P-tot (mg/L)
N-NO3 (mg/L)
AB
Figure 2. (A) Nutrient water content from the monitoring series (after Franzoi 1997); (B) phosphorus loads into the Lake Vicobasin.
256 M. N. Ripa and others
ronmental concerns in the Lake Vico basin, wereclearly underestimated.
To overcome the problems met with the use ofSWAT, a new approach to designate critical areas wasdeveloped and is described in this article. It is based onthe use of the field-scale simulation model GLEAMScoupled with a simple regression model. GLEAMS is afield-scale, management-oriented model developed by
the Agricultural Research Service of the US Depart-ment of Agriculture in cooperation with the CoastalPlain Experimental Station of the University of Georgia(Knisel 1993; Leonard and others 1987).
The model takes into consideration four majorcomponents: hydrology, erosion, pesticides, and nutri-ents. Among the latter, with particular reference to P,mineralization, immobilization, fertilizer and animal
Table 1. Land-use time evolution for Lake Vico basin
Year Arable (ha) Hazelnut (ha) Chestnut (ha) Urban (ha) Coppice (ha) Bush (ha) Wood (ha) Wetland (ha)
1954 1027 411 115 10 85 11 1179 921971 469 891 94 58 123 50 1147 722000 151 1225 120 79 63 60 1171 151
Figure 3. Lake Vico basin land use in (A) 1954, (B) 1971, and (C) 2000.
Agricultural Land Use to Control Water Pollution 257
waste application, crop uptake, together with runoff,sediment, and leaching losses are considered. GLEAMSallows the effects of agricultural management systems tobe evaluated within and through the plant root zone,considering the consequences of management andnatural inputs and their influence on hydrology, ero-sion, and chemical processes, both on the soil surfaceand within the soil profile. The model provides outputdata concerning the quantities of nitrogen, phospho-rus, sediments, and pesticides that reaches the edge ofthe field and the bottom of the root zone and are,therefore, potentially able to pollute water bodies.
The model was used to evaluate A and PP with ref-erence both to the two scenarios and to different slopes,the latter being the parameter that influences A and PPmobilization most, according to Leone and others(2001). Hazelnut tree cultivation was simulated consid-ering user-defined, crop-specific parameters, [leaf areaindex (LAI), root depth, etc.] because hazelnuts are notincluded within the GLEAMS database. In addition, asthe model does not allow more than one crop to besimulated at the same time, in the case of the BMP thesimultaneous presence of hazelnut trees and of meadowwas simulated by changing the soil-cover parameters:the C-USLE factor (Wishmeier and Smith 1978), the n-Manning factor, and crop residues on soil. In this way,two discontinuous series of coupled values (slope/A andslope/PP) were obtained. To transform these discon-tinuous series into continuous ones, a simple regressionmodel (the metamodel) was built. See the work byLeone and others (2001) for details. Thanks to the useof this metamodel, a geographic information system(GIS), and a digital tension model (DTM), GLEAMSresults were extended to basin scale; the integrated useof these three tools, in fact, allowed all of the areas of thebasin to be designated on the basis of their potentialcontribution in terms of A and PP and to be representedin cartographic form with reference to the investigatedscenarios.
To quickly compare the GLEAMS results related tothe simulated scenarios, another extremely simplerelation was used, which represents the effectivenessof the proposed BMP at reducing either A or PP. Thisrelation was also extended to basin scale, thanks tothe use of a GIS and a DTM. In this way, a map of theeffectiveness of the adopted BMP at reducing erosionand/or particulate P production was plotted. Becauseit derives from GLEAMS, the relation represents theeffectiveness of the considered BMP at reducing Aand PP at the edge of the field, not within the waterbody. To overcome this problem, the concept oftranslocation capability was taken into account. Inparticular, to assess the translocation capability of the
Lake Vico basin, the following aspects were consid-ered:
� Distance from the waterways� Distance from the lake perimeter� Topographic LS factor of the Universal soil loss
equation (USLE), calculated with the Desmet andGovers (1996) method [see Leone and Ripa (1998)for details concerning its application to Lake Vico]
Using a GIS, the translocation capability of all theareas within the basin was represented on a map. Fi-nally, the effectiveness and the translocation capabilitymaps were overlaid so as to obtain a map of the actualeffectiveness of the BMP in reducing pollution withinthe water body.
Results
GLEAMS was run with reference to a 50-year period;thus, a considerable degree of variation in the meteo-rological parameters has been included within the re-sults. In particular, A and PP were estimated withreference to the two scenarios (i.e., hazelnut tree cul-tivation without BMP and hazelnut tree cultivation withthe BMP meadow under the trees) and to differentslopes (from 1% to 50%). For each of the scenarios, themean annual value of the 50 simulation years wasconsidered with reference to both the A and PP out-puts and to all of the simulated slopes.
Using the coupled values obtained in this way, thefollowing regression model was built:
Y ¼ aX b ð1Þ
where Y is the land-use impact (soil erosion or PPrelease, with or without the application of the BMP; int/ha year and kg/ha year, respectively), X is the slope(dimensionless), and a and b are two coefficients forwhich it does not make sense to specify the dimensionsas both are part of an empirical equation derived froma statistical regression. In Table 2, the coefficients aand b for soil erosion and P export are reported, withreference to hazelnut tree cultivation with and withoutBMP application. Using the values of coefficients a andb reported in Table 2, the field-scale GLEAMS resultsreferred to each scenario were extended to basin scaleand represented on a map using a GIS and a DTM(see Figure 4).
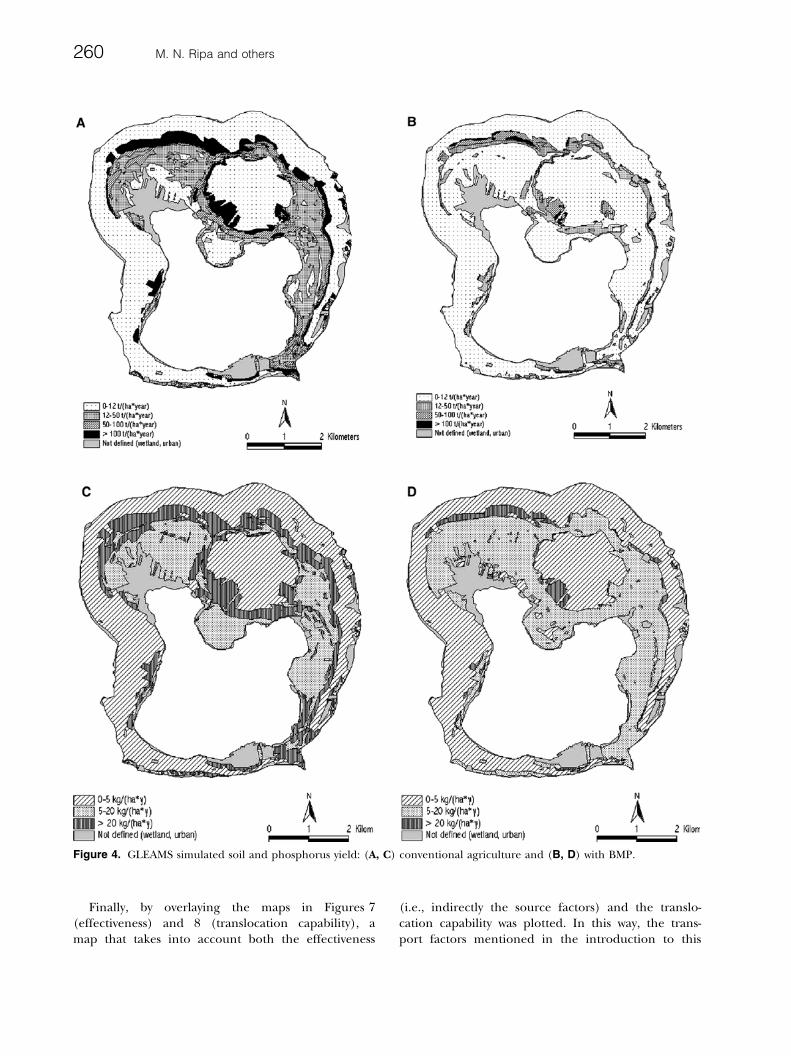
It is possible to form a reasonably precise idea of theeffects of the simulated BMP, either in terms of erosionor of PP reduction, by simply examining the areasresponsible for the production of the greatest amountsof A and PP in Figure 4. For example, comparing Fig-
258 M. N. Ripa and others
ures 4A and 4B, it can be immediately seen that most ofthose B areas without BMP would produce more than100 t/ha year of eroded soil, whereas where BMP isapplied, those areas would produce erosion amountsfrom 50 to 100 t/ha/year. Moreover, with reference toPP, most areas without BMP would produce ratesgreater than 20 kg/ha/year (see Figure 4C), whereas inareas where BMP is applied, 5–20 kg/ha/year of PPwould be released (see Figure 4D). Such observationsare only a few examples of the kind of information land-use planners can derive from these maps.
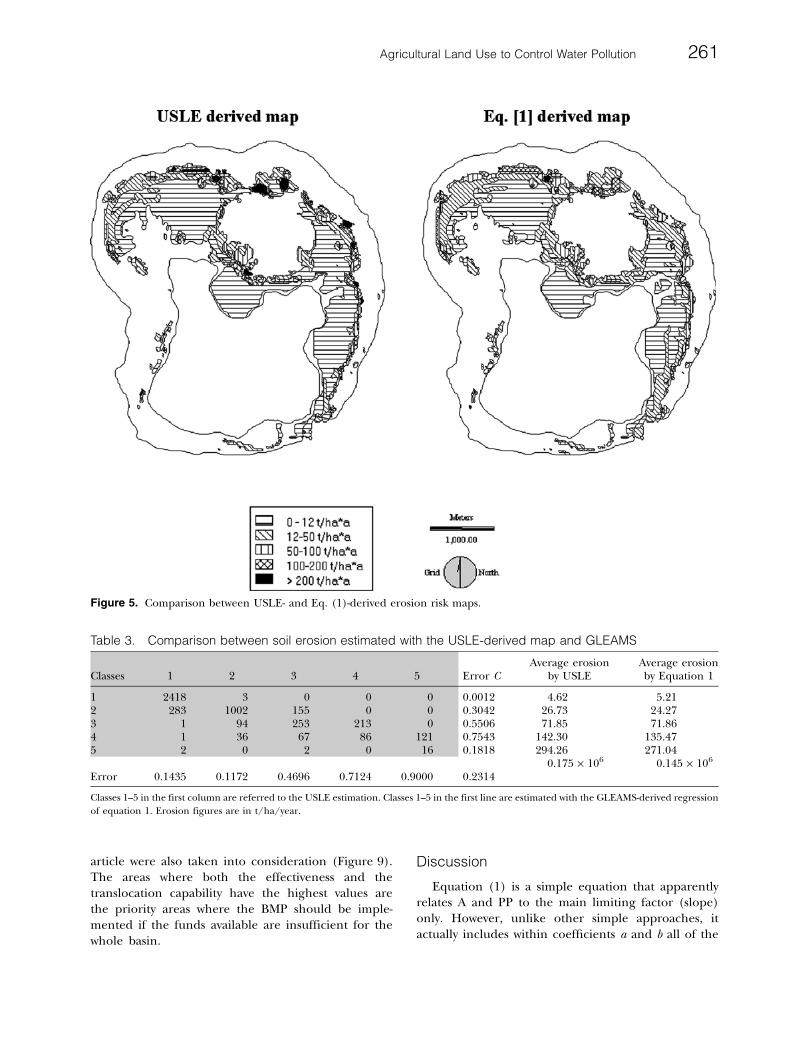
Taking into account the inherent difficulties in ver-ifying the results of these models with field measure-ments, it was decided to check the GLEAMS resultsindirectly at this point by comparing Figure 4A with theanalogous map obtained (in a less simple way) using theclassic USLE approach (Wishmeier and Smith 1978). InFigure 5, the two erosion maps are shown side by side tohighlight their similarities. It should be kept in mindthat the small differences existing between Figures 5Band 4A are due to the different erosion classificationsused (see the legends of the two figures).
The error analysis matrix produced by the GIS (Ta-ble 3) confirms the similarities between the maps ofFigure 5. The difference between the USLE total sedi-ment (0.175 t/ha/year) and the regression model(0.145 t/ha/year) is modest (about 17%, in the order ofmagnitude of model uncertainty). Furthermore, it canbe seen that similar average soil erosion amounts wereobserved for the different classes (Table 3, last two col-umns). The higher USLE values reported are probablydue to the great influence of the L-USLE factor (slopelength) in the Lake Vico topographic system, which ischaracterized by very steep and rather long slopes.
The cross-tabulation of the gray part of Table 3shows how frequently the erosion classes, calculatedwith the USLE and with the regression of Eq. 1(deriving from GLEAMS), have remained the same(frequencies along the diagonal) or have changed (off-diagonal frequencies). Considering, for example, class2 (12–50 t/ha/year), 1002 cells belong to this classaccording to both the USLE and Eq. 1, whereas 283and 155 cells assigned to class 2 by the USLE belong toclass 1 and to class 3, respectively, according to theGLEAMS-derived equation.
Once the zones with a different ‘‘criticity’’ levelwithin the study area have been designated, the nextstep of the proposed approach consists of calculatingthe effectiveness of the particular BMP from the pointof view of pollution reduction. In particular, to calcu-late the environmental effectiveness of the BMP ap-plied to the hazelnut tree cultivation of the Lake Vicobasin, in terms of both sediment and PP mobilization,the following simple relations were used:
EABMP ¼ A0 � ABMP
A0ð2Þ
EPPBMP ¼ PP0 � PPBMP
Pp0ð3Þ
where EABMP and E PP
BMP are the effectiveness of theBMP considered in terms of the reduction of soil ero-sion and of particulate P production, respectively, A0
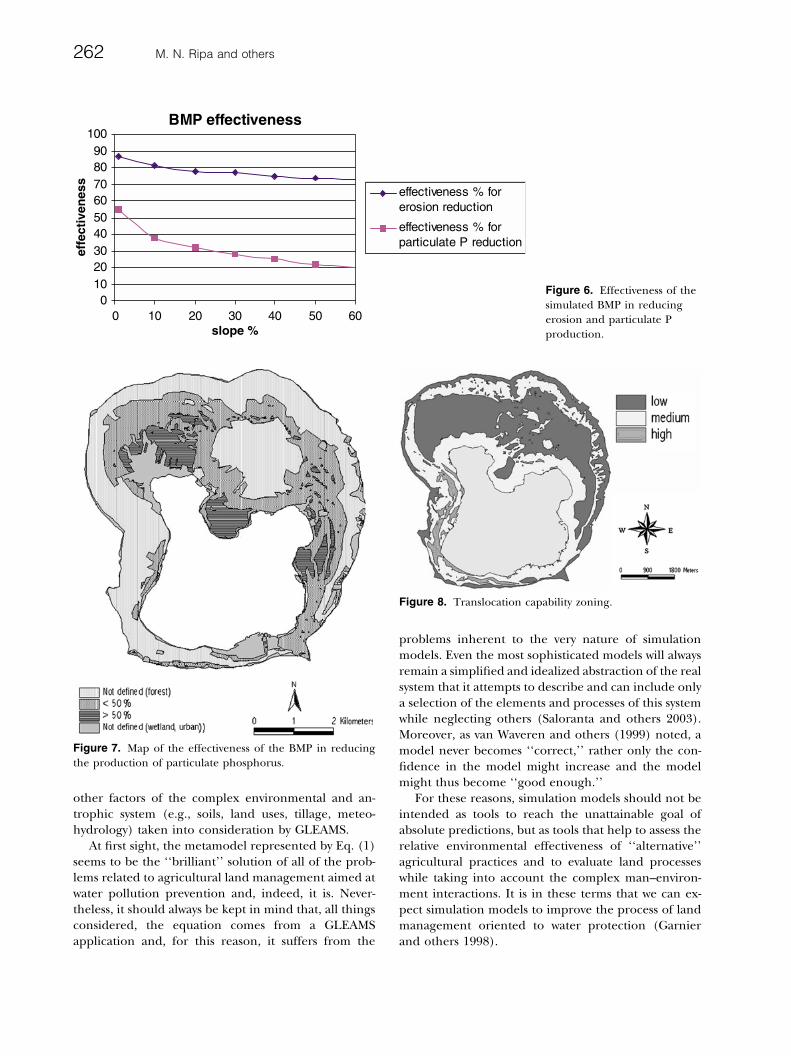
and ABMP are the quantities of eroded soil without andwith BMP implementation, respectively, and PP0 andPPBMP are the quantities of particulate P producedwithout and with BMP implementation, respectively.Using the values of coefficients a and b as in Table 2,the effectiveness of the BMP at reducing soil erosionand/or particulate P was calculated with reference todifferent slopes; the results are shown in Figure 6.
Similarly to what was done with the field-scale resultsreferred to A and PP, using a GIS and a DTM, theenvironmental effectiveness of the proposed BMP, ei-ther with reference to particulate P (Figure 7) or toerosion, was extended to basin scale and represented ona map, which is what planners need to make their deci-sions. Figure 7 shows very clearly, in cases where PP isthe most significant problem, which locations should begiven priority when implementing the BMP. For the sakeof simplicity, in Figure 7 only two effectiveness classeshave been considered; if necessary, a greater number ofcriticity classes could have easily been indicated.
As mentioned in the Materials and Methods section,considering the distances from the waterways and fromthe lake perimeter and the topographic LS factor ofthe USLE and using a GIS, the translocation capabilitywas calculated with reference to the whole basin andrepresented on a map (see Figure 8).
Table 2. Coefficients a and b in Eq. (1) (from Lake Vico GLEAMS simulations)
Y Tillage option a b
Soil erosion (Mg/ha*year) Conventional 6.55 1.12BMP (weeds under trees) 0.83 1.30
P export (kg/ha*year) Conventional 13.2 0.25BMP (weeds under trees) 5.92 0.39
Agricultural Land Use to Control Water Pollution 259
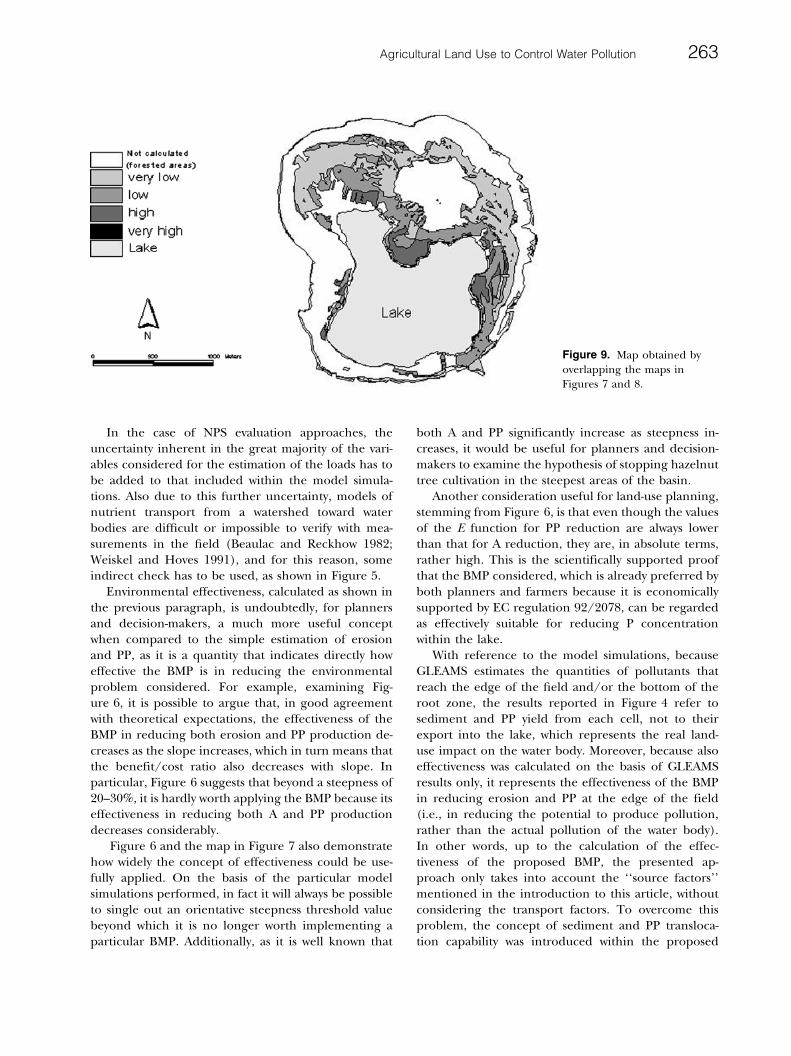
Finally, by overlaying the maps in Figures 7(effectiveness) and 8 (translocation capability), amap that takes into account both the effectiveness
(i.e., indirectly the source factors) and the translo-cation capability was plotted. In this way, the trans-port factors mentioned in the introduction to this
Figure 4. GLEAMS simulated soil and phosphorus yield: (A, C) conventional agriculture and (B, D) with BMP.
260 M. N. Ripa and others
article were also taken into consideration (Figure 9).The areas where both the effectiveness and thetranslocation capability have the highest values arethe priority areas where the BMP should be imple-mented if the funds available are insufficient for thewhole basin.
Discussion
Equation (1) is a simple equation that apparentlyrelates A and PP to the main limiting factor (slope)only. However, unlike other simple approaches, itactually includes within coefficients a and b all of the
Figure 5. Comparison between USLE- and Eq. (1)-derived erosion risk maps.
Table 3. Comparison between soil erosion estimated with the USLE-derived map and GLEAMS
Classes 1 2 3 4 5 Error CAverage erosion
by USLEAverage erosionby Equation 1
1 2418 3 0 0 0 0.0012 4.62 5.212 283 1002 155 0 0 0.3042 26.73 24.273 1 94 253 213 0 0.5506 71.85 71.864 1 36 67 86 121 0.7543 142.30 135.475 2 0 2 0 16 0.1818 294.26 271.04
0.175 · 106 0.145 · 106
Error 0.1435 0.1172 0.4696 0.7124 0.9000 0.2314
Classes 1–5 in the first column are referred to the USLE estimation. Classes 1–5 in the first line are estimated with the GLEAMS-derived regression
of equation 1. Erosion figures are in t/ha/year.
Agricultural Land Use to Control Water Pollution 261
other factors of the complex environmental and an-trophic system (e.g., soils, land uses, tillage, meteo-hydrology) taken into consideration by GLEAMS.
At first sight, the metamodel represented by Eq. (1)seems to be the ‘‘brilliant’’ solution of all of the prob-lems related to agricultural land management aimed atwater pollution prevention and, indeed, it is. Never-theless, it should always be kept in mind that, all thingsconsidered, the equation comes from a GLEAMSapplication and, for this reason, it suffers from the
problems inherent to the very nature of simulationmodels. Even the most sophisticated models will alwaysremain a simplified and idealized abstraction of the realsystem that it attempts to describe and can include onlya selection of the elements and processes of this systemwhile neglecting others (Saloranta and others 2003).Moreover, as van Waveren and others (1999) noted, amodel never becomes ‘‘correct,’’ rather only the con-fidence in the model might increase and the modelmight thus become ‘‘good enough.’’
For these reasons, simulation models should not beintended as tools to reach the unattainable goal ofabsolute predictions, but as tools that help to assess therelative environmental effectiveness of ‘‘alternative’’agricultural practices and to evaluate land processeswhile taking into account the complex man–environ-ment interactions. It is in these terms that we can ex-pect simulation models to improve the process of landmanagement oriented to water protection (Garnierand others 1998).
BMP effectiveness
0102030405060708090
100
0 10 20 30 40 50 60slope %
effe
ctiv
enes
s
effectiveness % forerosion reduction
effectiveness % forparticulate P reduction
Figure 6. Effectiveness of thesimulated BMP in reducingerosion and particulate Pproduction.
Figure 7. Map of the effectiveness of the BMP in reducingthe production of particulate phosphorus.
Figure 8. Translocation capability zoning.
262 M. N. Ripa and others
In the case of NPS evaluation approaches, theuncertainty inherent in the great majority of the vari-ables considered for the estimation of the loads has tobe added to that included within the model simula-tions. Also due to this further uncertainty, models ofnutrient transport from a watershed toward waterbodies are difficult or impossible to verify with mea-surements in the field (Beaulac and Reckhow 1982;Weiskel and Hoves 1991), and for this reason, someindirect check has to be used, as shown in Figure 5.
Environmental effectiveness, calculated as shown inthe previous paragraph, is undoubtedly, for plannersand decision-makers, a much more useful conceptwhen compared to the simple estimation of erosionand PP, as it is a quantity that indicates directly howeffective the BMP is in reducing the environmentalproblem considered. For example, examining Fig-ure 6, it is possible to argue that, in good agreementwith theoretical expectations, the effectiveness of theBMP in reducing both erosion and PP production de-creases as the slope increases, which in turn means thatthe benefit/cost ratio also decreases with slope. Inparticular, Figure 6 suggests that beyond a steepness of20–30%, it is hardly worth applying the BMP because itseffectiveness in reducing both A and PP productiondecreases considerably.
Figure 6 and the map in Figure 7 also demonstratehow widely the concept of effectiveness could be use-fully applied. On the basis of the particular modelsimulations performed, in fact it will always be possibleto single out an orientative steepness threshold valuebeyond which it is no longer worth implementing aparticular BMP. Additionally, as it is well known that
both A and PP significantly increase as steepness in-creases, it would be useful for planners and decision-makers to examine the hypothesis of stopping hazelnuttree cultivation in the steepest areas of the basin.
Another consideration useful for land-use planning,stemming from Figure 6, is that even though the valuesof the E function for PP reduction are always lowerthan that for A reduction, they are, in absolute terms,rather high. This is the scientifically supported proofthat the BMP considered, which is already preferred byboth planners and farmers because it is economicallysupported by EC regulation 92/2078, can be regardedas effectively suitable for reducing P concentrationwithin the lake.
With reference to the model simulations, becauseGLEAMS estimates the quantities of pollutants thatreach the edge of the field and/or the bottom of theroot zone, the results reported in Figure 4 refer tosediment and PP yield from each cell, not to theirexport into the lake, which represents the real land-use impact on the water body. Moreover, because alsoeffectiveness was calculated on the basis of GLEAMSresults only, it represents the effectiveness of the BMPin reducing erosion and PP at the edge of the field(i.e., in reducing the potential to produce pollution,rather than the actual pollution of the water body).In other words, up to the calculation of the effec-tiveness of the proposed BMP, the presented ap-proach only takes into account the ‘‘source factors’’mentioned in the introduction to this article, withoutconsidering the transport factors. To overcome thisproblem, the concept of sediment and PP transloca-tion capability was introduced within the proposed
Figure 9. Map obtained byoverlapping the maps inFigures 7 and 8.
Agricultural Land Use to Control Water Pollution 263
approach. In this way, the likelihood that areas with ahigh potential to contribute P to the lake will effec-tively translate this potential into P loss has also beentaken into account.
Conclusions
The aim of this work was to locate critical areas andto assess the environmental effectiveness of a particularBMP within the Lake Vico basin, where a considerableincrease in phosphorus concentration has been ob-served for some years. At the beginning, it was neces-sary to run different management models withreference to the whole Lake Vico basin, of whichGLEAMS was identified as the most effective tool tosimulate the impact of agricultural nonpoint pollution.Because GLEAMS is a field-scale model, an innovativeapproach was chosen, integrating the use of GLEAMSwith a specially adjusted metamodel and a GIS.
The results achieved, described in detail in earliersections, allow some rather interesting considerationsto be made. Some of these considerations are of aspecific, technical nature, concerning the advantagesof the proposed approach in comparison to other ap-proaches more ‘‘traditionally’’ employed to deal withthe same kind of problems. Others are of a moregeneral nature, concerning how the proposed ap-proach can be usefully applied to the orienting of land-use planning choices.
Foremost among the former considerations is theopportunity that the proposed approach offers of tak-ing advantage of the detailed level of analysis of phys-ically based field-scale models such as GLEAMS whileobtaining information at the basin scale, because of theuse of the metamodel and the GIS. Only the detailachieved using field-scale models can give the neces-sary emphasis to the complex environmental context(soil, climate, topography, etc.), which conditions theenvironmental effectiveness of a BMP. On the otherhand, the possibility of obtaining basin-scale resultsrepresents a valuable aspect for land managers for twobasic reasons: first, because it allows territory zoningaccording to classes of environmental risk, focusingconsequently on the areas where it is most urgent toapply a BMP, and, second, because it also allows boththe ‘‘hot spots’’ areas and the areas where the impactreduction would not be enough for a sustainablemanagement of land use to be located. The location ofthese areas is particularly important from the point ofview of land management because whereas the formerare zones where a BMP is really helpful, only a com-pletely natural land cover would be suggested for thelatter.
GLEAMS runs were utilized to correlate the pro-cesses that, above all others, condition surface waterquality (sediment yield and P loss) with the factor thatmainly conditions them (i.e., slope). An importantadvantage of the proposed approach is that slope(topography) maps are easily available for almost allEuropean countries, so GLEAMS results can be ex-tended almost everywhere to the basin scale.
Nonpoint pollution is characterized by an inherentspatial distribution; therefore, distributed models arerequired to interpret it better. ‘‘Traditional’’ basin-scale models are, on the contrary, lumped or, at best,semidistributed like SWAT. This is the reason why theyare less reliable compared to field-scale models ininterpreting the variability and complexity of theinvestigated systems (in cases like the one examined inthis article, where it was necessary to consider a field-scale BMP). This is particularly evident with reference,for example, to the topography and to the area sur-rounding the lake, which condition phosphorus exportinto the lake (Figures 7 and 8). In fact, lumped andsemidistributed models like SWAT divide the basininto subbasins, which, although small, do not allowthese strategic areas to be managed as satisfactorily aswhen using the proposed completely distributed ap-proach.
Although the successful use of distributed modelshas these important advantages, it also has the disad-vantage of requiring extensive datasets. The proposedapproach allows this problem to be overcome becauseof the metamodel, which includes within coefficients aand b (which are relatively easy to determine, as re-quired by a land management tool) the great numberof parameters influencing erosion and particulate Pexport taken into consideration by GLEAMS, which arenecessary to interpret the complex environmental andanthropic context.
Another drawback typical of field-scale models isthat they take into consideration only cell-by-cell sim-ulation results. In the present case, for example,GLEAMS only estimates sediment and PP produced‘‘at the edge of the field’’ and ‘‘at the bottom of theroot zone.’’ The metamodel-based procedure pro-posed in this article, because of the translocationfunction it includes, allows the distributed GLEAMSoutputs to be transformed into an actual estimation ofthe sediment and/or particulate P loads to the lake.
Although the proposed approach in the presentarticle has only been used to assess the effect of oneparticular BMP (already applied within some of thefarms of the basin because it is supported by EC reg-ulation 92/2078), it could also be employed veryprofitably to compare the relative effect of different
264 M. N. Ripa and others
BMPs, potentially applicable as alternative agriculturalmanagement tools, to solve a particular nonpoint pol-lution problem. In addition, the proposed approachand, in particular, the methods used to locate criticalareas and to assess the environmental effectiveness ofthe proposed BMPs are much simpler and less datademanding in comparison to other methods used totackle similar problems and still maintain all of thestrictness of a scientifically based procedure. In addi-tion to all of the other remarks previously made, thisevidence allows the authors to assert that the proposedapproach as a whole represents a precious tool forland-use planners and decision-makers, who generallyhave to maximize the efficiency of the BMPs that theyintend to apply to a particular area working with alimited availability of funds and thus need to optimizetheir allocation.
Finally, because the procedure presented in thisarticle shows how to increase the efficiency of the allo-cation of subsidies for sustainable agriculture, it alsoprovides an answer to the needs of the new EuropeanCommon Agricultural Policy, which has, among itsmain focuses, the respect of the eco-conditionalityprinciple in the assignment of funds to farmers.
AcknowledgmentsThe authors acknowledge financial support from
the EU through the AgriBMPWater project (5th RTDframework programme) and from the Italian Ministryof University and Scientific Research through the PRIN2004 project.
Literature Cited
Arheimer, B., L. Andersson, M. Larsson, G. Lindstrom, J.Olsson, and B. C. Pers. 2004. Modelling diffuse nutrientflow in eutrophication control scenarios. Water Science andTechnology 49(3):37–45.
Arnold, J. G., R. Srinivasin, R. S. Muttiah, and J. R. Williams.1998. Large area hydrologic modelling and assessment:Part I. Model development. Journal of American Water Re-sources Association 34(1):73–89.
Barbanti L., G. Bonomi, A. Carollo, G. Chiaudani, I. Ferrari,M.Gerletti, A. M. Nocentini, D. Ruggii, and L. Tonolli.1971. Limnologia e ecologia dei laghi di Bolsena, Bracci-ano, Trasimeno e Vico: Situazione attuale e prevedibiliconseguenze derivanti da una loro utilizzazione multipla.Memorie dell�Istituto Italiano di Idrobiologia. Ed. Istitut-Italiano di Idrobiologie, Pallonza (Novara), 263 pp.
Beaulac, M. N., and K. H. Reckhow. 1982. An examination ofland use–nutrient export relationships. Water ResourcesBulletin 18:1013–1024.
Correll, D. L. 1996. Buffer zones and water quality protection:general principles. Pages 7–20 in N. E.Haycock, T. P. Burt,
K. W. T. Goulding and G. Pinay (eds.), Buffer zones: Theirprocesses and potential in water protection. Quest Envi-ronmental, Hertfordshire, UK.
Desmet, P. J. J., and G. Govers. 1996. A GIS procedure forautomatically calculating the USLE LS factor on topo-graphically complex landscape units. Journal of Soil andWater Conservation 51(3):427–435.
Franzoi, P. 1997. Ricerche sull�ecologia dell�ittiofauna dellago di Vico. Final report for Latium County (Central Italy)Administration, Department of Environmental Sciences,Tuscia University.
Frost, A. 1999. A summary of the agricultural issues raised atthe 3rd International Conference on Diffuse Pollution heldin Edinburgh U.K. from August 31 to September 4. WaterScience and Technology 39(12):361–364.
Garnier, M., A. Leone, V. Uricchio, and R. Marini. 1999.Application of GLEAMS model to assess groundwater pol-lution risk caused by animal waste land disposal. Pages 93–99 in D. N. Lerner and N. R. G. Walton (eds.), Contami-nated land and groundwater: Future directions. Engineer-ing Geology Special Publication No. 14, British GeologicalSociety, London.
Garnier, M., A. Lo Porto, R. Marini, and A. Leone. 1998.Integrated use of GLEAMS and GIS to prevent groundwa-ter pollution caused by agricultural disposal of animalwaste. Environmental Management 22(5):747–756.
Haycock, N. E., and A. D. Muscutt. 1995. Landscape man-agement strategies for control of diffuse pollution. Land-scape and Urban Planning 31:313–321.
Heathwaite, A. L., and A. N. Sharpley. 1998. Integratingphosphorus and nitrogen management at the catchmentscale. Pages 21–22 in Proceedings of the OECD Workshopon Practical and Innovative Measures for the Control ofAgricultural Phosphorus Losses to Water, 16–19 June 1998.Antrim, Northern Ireland.
Heathwaite, A. L., and A. N. Sharpley. 1999. Evaluatingmeasures to control the impact of agricultural phosphoruson water quality. Water Science and Technology 39(12):149–155.
Knisel W. G. (ed.). 1993. GLEAMS: Groundwater LoadingEffects of Agricultural Management Systems. Version 2.10.University of Georgia, Coastal Plain Experimental Station,Tifton, GA.
Leon, L. F., E. D. Soulis, N. Kouwen, and G. J. Farquhar. 2002.Modelling diffuse pollution with a distributed approach.Water Science and Technology 45(9):149–156.
Leonard, R. A., W. G. Knisel, and D. A. Still. 1987. GLEAMS:Groundwater Loading Effects on Agricultural ManagementSystems. Transactions of the ASAE 30(5):1403–1418.
Leone, A., G. Benigni, L. Boccia, A. Lo Porto, and M. N. Ripa.2002. Phosphorus loads from basin land use: first results fora new simple evaluation method. In Bolsena InternationalConference, 1–3 October 2002.
Leone, A., F. Preti, and M. N. Ripa. 1997. Pianificazione perprocessi territoriali, monitoraggio e modellistica ambien-tale per l�agricoltura sostenibile. In Proceedings of theVIth National Congress of the Italian Agricultural Engi-neering Association (A.I.I.A.), 11–13 September, Ancona,Italy.
Agricultural Land Use to Control Water Pollution 265
Leone A., F. Preti M. N. Ripa, and G. Benigni. 2001. Evalua-tion of agricultural nutrient diffuse sources and relatedland management. Rivista di Ingegneria Agraria 32(1):20–25.
Leone, A., and M. N. Ripa. 1998. Land use time evolution forthe sustainability of agriculture in the Lake Vico basin(Central Italy). In C.I.G.R. 13th International Congress, 2–6 February 1998, Rabat, Morocco.
Myers, C. F., J. Meek, T. Stuart, and A. Weinberg. 1985.Nonpoint sources of water pollution. Journal of Soil andWater Conservation 40(1):14–18.
Novotny, V. 2003. The next step: Incorporating diffuse pol-lution abatement into watershed management. Pages 0-1–0-7 in Proceedings of the 7th International SpecializedConference on Diffuse Pollution and Basin Management,18–22 August 2003, Dublin.
Novotny, V., and H. Olem. 1994. Water quality: Prevention,identification and management of diffuse pollution. Wiley,New York.
Ongley, E. D. 1996. Control of water pollution from agricul-ture, FAO Irrigation and Drainage Paper No. 55.
Pionke, H. B., W. J. Gburek, and A. N. Sharpley. 2000. Criticalsource area controls on water quality in an agriculturalwatershed located in the Chesapeake Basin. EcologicalEngineering 14:325–335.
Rekolainen, S., J. Gronroos, I. Barlund, A. Nikander, andY. Laine. 1999. Modelling the impacts of managementpractices on agricultural phosphorus losses to surfacewaters of Finland. Water Science and Technology39(12):265–272.
Saloranta, T. M., J. Kamari, S. Rekolainen, and O. Malve.2003. Benchmark criteria: A tool for selecting appropriatemodels in the field of water management. EnvironmentalManagement 32(3):322–333.
Schoumans, O. F., J. Mol-Dijkstra, L. M. W. Akkermans, andC. W. J. Roest. 2002. SIMPLE: Assessment of non-pointphosphorus pollution from agricultural land to surfacewaters by means of a new methodology. Water Science andTechnology 45(9):177–182.
Sharpley, A. N., S. C. Chapra, R. Wedepohl, J. T. Sims, T. C.Daniel, and K. R. Reddy. 1994. Managing agriculturephosphorus for protection of surface waters: Issues andoptions. Journal of Environmental Quality 23:437–451.
Sharpley, A. N., W. J. Gburek, G. Folmar, and H. B. Pionke.1999. Sources of phosphorus exported from an agriculturalwatershed in Pennsylvania. Agricultural Water Management41:77–89.
Sims, J., T. N. Goggin, and J. McDermott. 1999. Nutrientmanagement for water quality protection: integrating re-search into environmental policy. Water Science and Tech-nology 39(12):291–298.
Stalnacke, P. 2003. Changes in nutrient levels in rivers inresponse to large-scale changes in emissions. In Europeanconference on coastal zone research: An ELOISE ap-proach. Gdansk, Poland, March 24–27. European Com-mission–DG Research, Brussels.
Stewart, B. A., D. A. Woolhiser, W. D. Wischmeier, J. H. Caro,and M. H. Frere. 1975. Control of water pollution fromcropland. Volume 1. A manual for guideline development.Report Nos. EPA-600/2-75 026a and ARS H-5-1. USEPA/USDA, Washington, DC.
US-NRC (United States National Research Council). 1993.Soil and water quality, an agenda for agriculture. Com-mittee on Long-Range Soil and Water Conservation. Na-tional Academy Press, Washington, DC.
Van Waveren, R. H., S. Groot, H. Scholten, F. C. van Geer, J.H. M. Wosten, R. D. Koeze, and J. J. Noort. 1999. Hand-book of good modelling practice. STOWA Report 99-05/RIZA Report 99.036. Institute for Inland Water Manage-ment and Waste Water Treatment (RIZA), Lelystad, TheNetherlands.
Weiskel, P. K., and B. L. Hoves. 1991. Quantifying dissolvednitrogen flux through a coastal watershed. Water ResourcesResearch 27(11):2929–2939.
Wishmeier, W. D., and D. Smith. 1978. Predicting rainfallerosion losses: A guide to conservation planning. USDAAgricultural Handbook No.278. USDA, Washington, DC.
266 M. N. Ripa and others