Aging, Physical Activity, Aerobic Fitness And Cognitive Performance: A Complex Relationship
13
Aging, Physical activity, Aerobic Aging, Physical activity, Aerobic fitness, and cognitive performance: fitness, and cognitive performance: a complex relationship a complex relationship Cédric ALBINET, Geoffroy BOUCARD, Cédric BOUQUET, & Michel AUDIFFREN Centre de Recherches sur la Cognition et l’Apprentissage University of Poitiers - CNRS, France a complex relationship a complex relationship
Transcript of Aging, Physical Activity, Aerobic Fitness And Cognitive Performance: A Complex Relationship
Aging, Physical activity, Aerobic Aging, Physical activity, Aerobic fitness, and cognitive performance: fitness, and cognitive performance:
a complex relationshipa complex relationship
Cédric ALBINET, Geoffroy BOUCARD, Cédric BOUQUET, & Michel AUDIFFREN
Centre de Recherches sur la Cognition et l’Apprentissage
University of Poitiers - CNRS, France
a complex relationshipa complex relationship

Cognitive aging and Exercise
• Aging impairs cognitive performance (Birren & Schaie,
2006; Craik & Salthouse, 2007).2006; Craik & Salthouse, 2007).
• Physical exercise may moderate or delay
cognitive aging (Angevaren et al., 2008; Spirduso et al., 2008).
• Particularly:
– On effortful attentional processes such as Executive
Functions (Colcombe & Kramer, 2003)Functions (Colcombe & Kramer, 2003)
– Aerobic exercise (Kramer et al., 1999; Etnier et al., 2006)
– More important for older than young…but… (Colcombe &
Kramer, 2003; Etnier et al., 1997)

Questions
• Executive Functions (EF) is not a unitary construct • Executive Functions (EF) is not a unitary construct (Miyake et al., 2000; Fisk & Sharp, 2004).
Inhibition Updating Shifting
Is the exercise/fitness effect the same for all EF ?
• Is physical exercise or cardiovascular fitness the • Is physical exercise or cardiovascular fitness the
most important ? (Kramer et al., 2002; Smiley-Oyen et al., 2008)
• Is this effect the same between 20 and 80 years ?
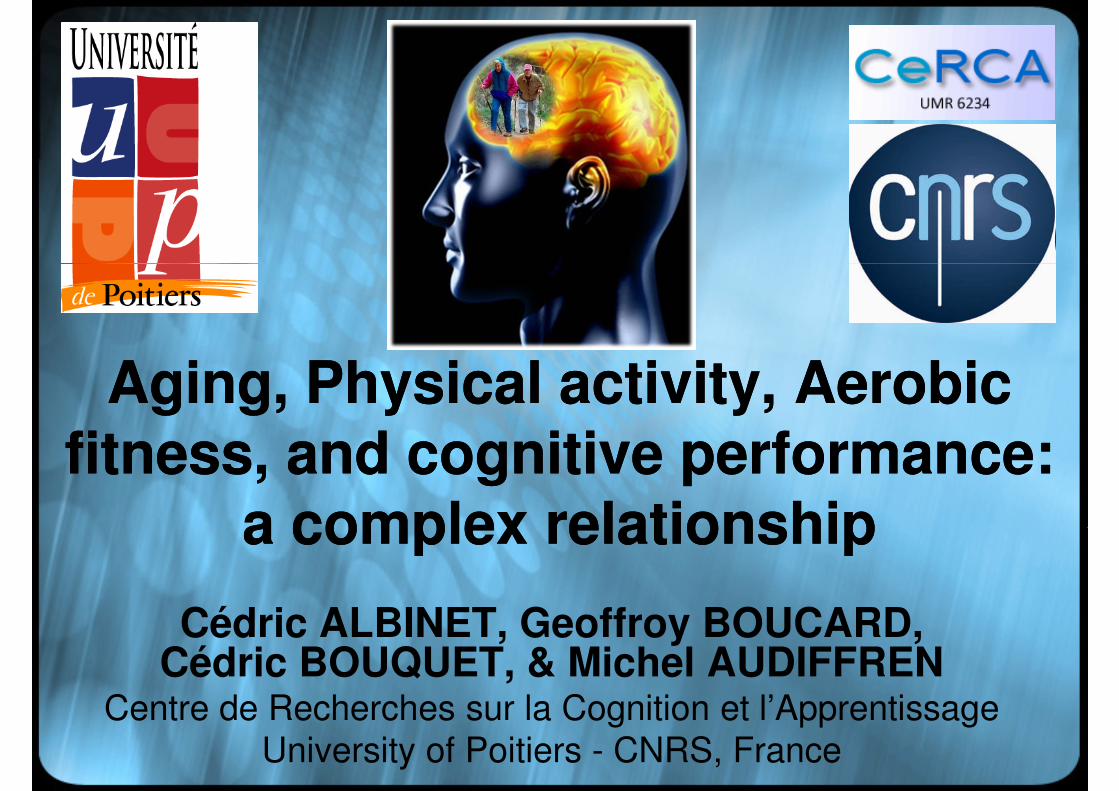
Time course of the study
Step 1: interview –
Older adults(60-82 years)
Younger adults(18-30 years)
87Step 1: interview –inclusion criteria
Step 2: medical certificate of physician
Step 3: evaluation of physical fitness and
108
107
87
87
86physical fitness and activity
Step 4: cognitive evaluation + energy
expenditure
93
6060
86
6363
Median split of DPAS + VO2max
in each Age-Gender group.
Median split of DPAS + VO2max
in each Age-Gender group.

Time course of the study
Step 1: interview –
Older adults(60-82 years)
Younger adults(18-30 years)
87
Global cognitive and demographic statusStep 1: interview –
inclusion criteria
Step 2: medical certificate of physician
Step 3: evaluation of physical fitness and
108
107
87
87
86
demographic status
�MMSE (>26)
�Vocabulary
�Education
�DSST (WAIS III)
�processing speed (XO)physical fitness and activity
Step 4: cognitive evaluation + energy
expenditure
93
6060
86
6363
Median split of DPAS + VO2max
in each Age-Gender group.
Median split of DPAS + VO2max
in each Age-Gender group.
�processing speed (XO)
�Depression (GDS and HADS)
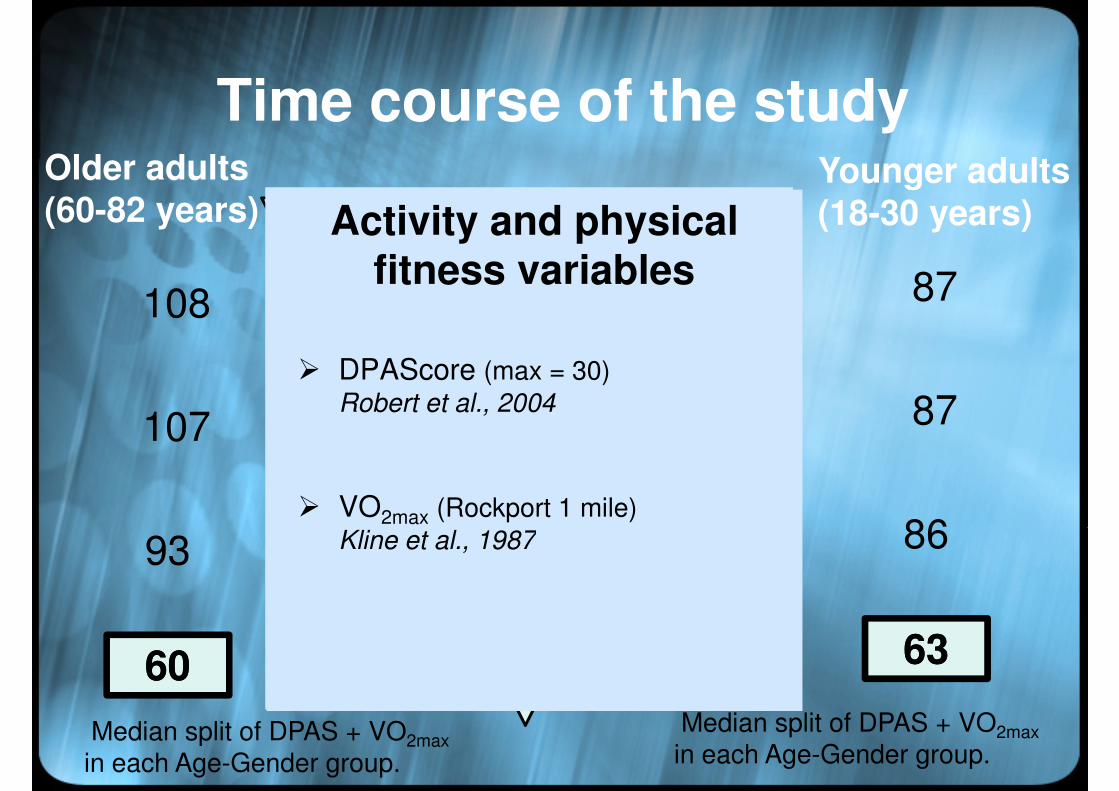
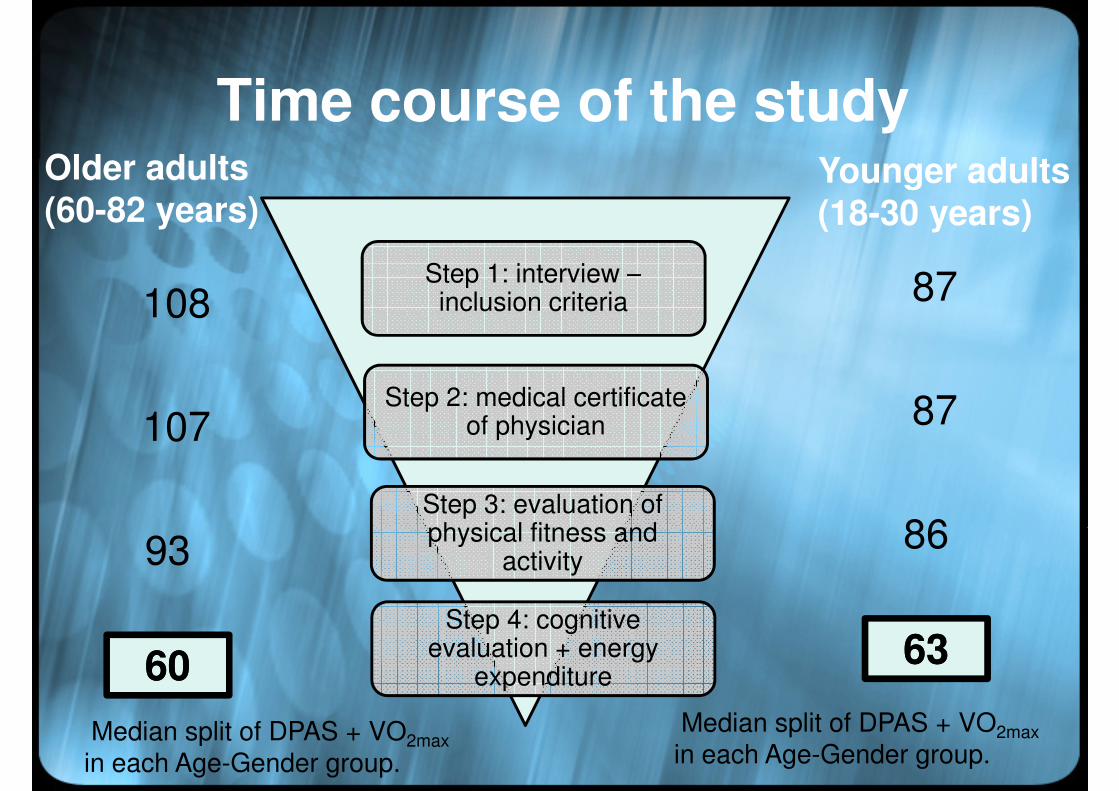
Time course of the study
Step 1: interview –
Older adults(60-82 years)
Younger adults(18-30 years)
87
Global cognitive and demographic statusActivity and physical
fitness variablesStep 1: interview –inclusion criteria
Step 2: medical certificate of physician
Step 3: evaluation of physical fitness and
108
107
87
87
86
demographic status
�MMSE (>26)
�Vocabulary
�Education
�DSST (WAIS III)
�processing speed (XO)
fitness variables
� DPAScore (max = 30)
Robert et al., 2004
� VO2max (Rockport 1 mile)
Kline et al., 1987physical fitness and activity
Step 4: cognitive evaluation + energy
expenditure
93
6060
86
6363
Median split of DPAS + VO2max
in each Age-Gender group.
Median split of DPAS + VO2max
in each Age-Gender group.
�processing speed (XO)
�Depression (GDS and HADS)
2max
Kline et al., 1987

Time course of the study
Step 1: interview –
Older adults(60-82 years)
Younger adults(18-30 years)
87
Global cognitive and demographic statusActivity and physical
fitness variables
Physical evaluation
Step 1: interview –inclusion criteria
Step 2: medical certificate of physician
Step 3: evaluation of physical fitness and
108
107
87
87
86
demographic status
�MMSE (>26)
�Vocabulary
�Education
�DSST (WAIS III)
�processing speed (XO)
fitness variables
� DPAScore (max = 30)
Robert et al., 2004
� VO2max (Rockport 1 mile)
Kline et al., 1987
� HLAQ (METS/h/wk)Kriska et al., 1990; Ainsworth, 2000
� Energy expenditure (ActiGraph
GT1M: Counts/min; – Time in MVPA)
Cognitive evaluationphysical fitness and
activity
Step 4: cognitive evaluation + energy
expenditure
93
6060
86
6363
Median split of DPAS + VO2max
in each Age-Gender group.
Median split of DPAS + VO2max
in each Age-Gender group.
�processing speed (XO)
�Depression (GDS and HADS)
2max
Kline et al., 1987Cognitive evaluation
� Evaluation of Executive Functions:9 experimental tasks
Young18-30 years
Young-Old60-70 years
Old-Old71-82 years
Fit Unfit Fit Unfit Fit Unfit
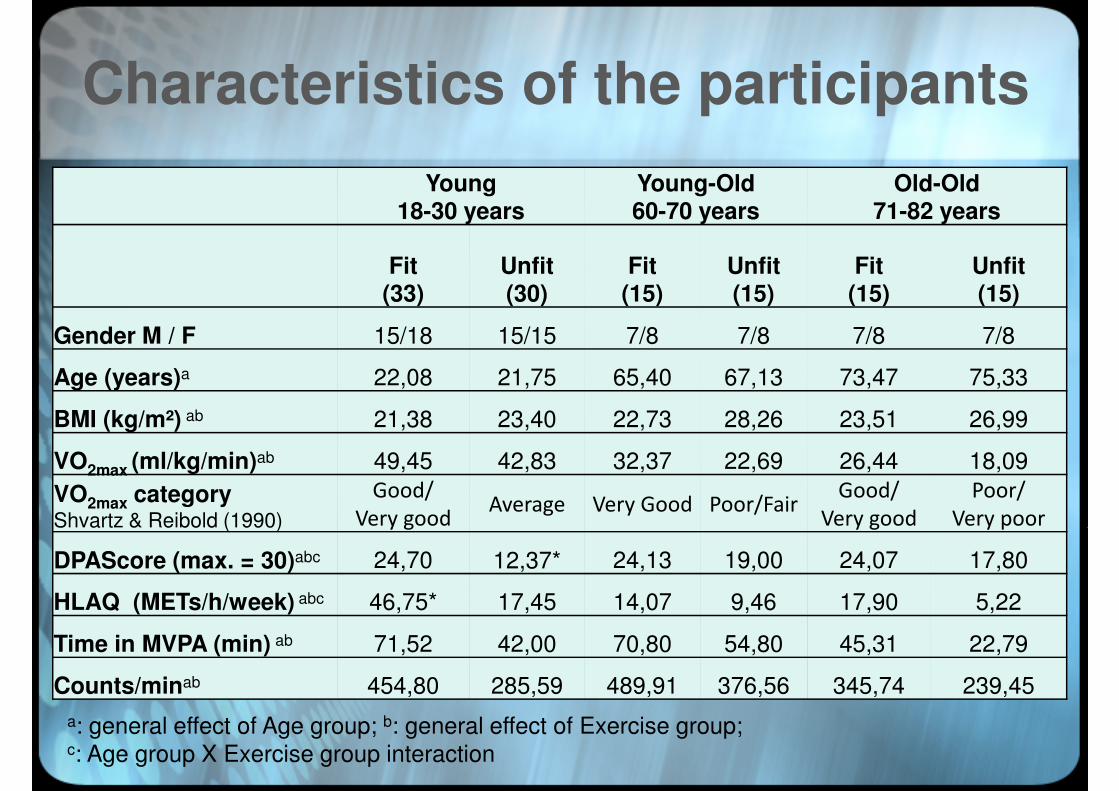
Characteristics of the participants
Fit(33)
Unfit(30)
Fit(15)
Unfit(15)
Fit(15)
Unfit(15)
Gender M / F 15/18 15/15 7/8 7/8 7/8 7/8
Age (years)a 22,08 21,75 65,40 67,13 73,47 75,33
BMI (kg/m²) ab 21,38 23,40 22,73 28,26 23,51 26,99
VO2max (ml/kg/min)ab 49,45 42,83 32,37 22,69 26,44 18,09
VO2max category Shvartz & Reibold (1990)
Good/
Very goodAverage Very Good Poor/Fair
Good/
Very good
Poor/
Very poorShvartz & Reibold (1990) Very good Very good Very poor
DPAScore (max. = 30)abc 24,70 12,37* 24,13 19,00 24,07 17,80
HLAQ (METs/h/week) abc 46,75* 17,45 14,07 9,46 17,90 5,22
Time in MVPA (min) ab 71,52 42,00 70,80 54,80 45,31 22,79
Counts/minab 454,80 285,59 489,91 376,56 345,74 239,45
a: general effect of Age group; b: general effect of Exercise group; c: Age group X Exercise group interaction
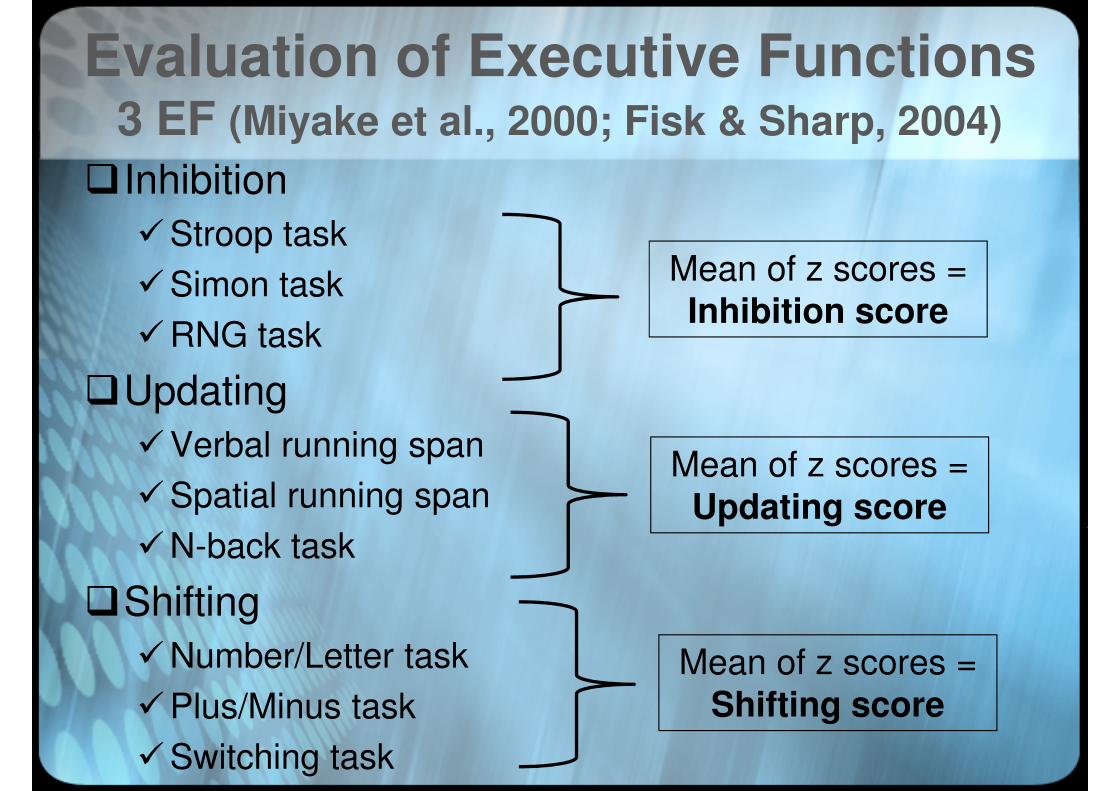
Evaluation of Executive Functions3 EF (Miyake et al., 2000; Fisk & Sharp, 2004)
�Inhibition
�Stroop taskMean of z scores =
�Simon task
�RNG task
�Updating
�Verbal running span
�Spatial running span
�N-back task
Mean of z scores =
Inhibition score
Mean of z scores =
Updating score�N-back task
�Shifting
�Number/Letter task
�Plus/Minus task
�Switching task
Mean of z scores =
Shifting score

Results for each Executive Function
-0,5
0,0
0,5
1,0
1,5
Z s
co
re
Updating
Fit
Unfit
1,5 Inhibition n.s.
Age group X Exercise group interaction, p<.005.
-1,5
-1,0
Young Young-Old Old-Old
-1,5
-1,0
-0,5
0,0
0,5
1,0
Z s
co
re
Fit
Unfit
0,5
1,0
1,5 Shifting*
Age group X Exercise group interaction, p<.005.
Main effect of Age group, p<.005.
-1,5Young Young-Old Old-Old
-1,5
-1,0
-0,5
0,0
0,5
Young Young-Old Old-Old
Z s
co
re
Fit
Unfit

Best Predictor(s) of Inhibition
• For the Old-old group: Stepwise forward regression
analysis on Inhibition score, using DPAS and VO2max as analysis on Inhibition score, using DPAS and VO2max as
predictors.
Predictor R² R² change Standardized β p
VO2max .463 .463 .516 <.0001
DPAS .501 .039 .256 .16DPAS .501 .039 .256 .16
Results were the same when we entered also all the other physical activity predictors.

Conclusion
� Specific effect of Aerobic Fitness on Inhibition�Confirms the heterogeneity of EF(Miyake et al., 2000; Fisk &
Sharp, 2004).
�Different brain regions for different EF(Colette et al., 2006).
� Aerobic fitness (VO2max) is a better predictor than regular physical activity (present and past).
� Agrees with Kramer et al. (1999;2002) – disagrees with
Etnier et al. (2006), Smiley-Oyen et al. (2008).Etnier et al. (2006), Smiley-Oyen et al. (2008).
� Different dynamical patterns between cross-sectional
and interventional studies?
�The effect is only significant for the Older-old group

Thank-you for your attentionattention