Ointments and Transdermal Nitroglycerin Patches for Stable Angina Pectoris

Aggregated and complementary: symmetric proliferation,overyielding, and mass effects explain fine-root biomass in soilpatches in a diverse temperate deciduous forest landscape
Oscar J. Valverde-Barrantes1, Kurt A. Smemo1,2, Larry M. Feinstein3, Mark W. Kershner1 and
Christopher B. Blackwood1
1Department of Biological Sciences, Kent State University, Kent, OH 44242, USA; 2The Holden Arboretum, 9500 Sperry Rd, Kirtland, OH 44094, USA; 3Department of Biology, University
of Maine, Presque Isle, ME 04769, USA
Author for correspondence:Christopher B. BlackwoodTel: +1 330 672 3895
Email: [email protected]
Received: 28 July 2014Accepted: 12 October 2014
New Phytologist (2014)doi: 10.1111/nph.13179
Key words: ecotone, fine-root biomass,morphological root traits, nichecomplementarity, overyielding, plant–soilinteractions, root community composition,root proliferation.
Summary
� Few studies describe root distributions at the species level in diverse forests, although
belowground species interactions and traits are often assumed to affect fine-root biomass
(FRB).� We used molecular barcoding to study how FRB of trees relates to soil characteristics, spe-
cies identity, root diversity, and root traits, and how these relationships are affected by prox-
imity to ecotones in a temperate forest landscape.� We found that soil patch root biomass increased in response to soil resources across all spe-
cies, and there was little belowground vertical or horizontal spatial segregation among spe-
cies. Root traits and species relative abundance did not explain significant variation in FRB
after correcting for soil fertility. A positive relationship between phylogenetic diversity and
FRB indicated significant belowground overyielding attributable to local root diversity. Finally,
variation in FRB explained by soil fertility and diversity was reduced near ecotones, but only
because of a reduction in biomass in periodically anoxic areas.� These results suggest that symmetric responses to soil properties are coupled with comple-
mentary species traits and interactions to explain variation in FRB among soil patches. In addi-
tion, landscape-level dispersal among habitats and across ecotones helps explain variation in
the strength of these relationships in complex landscapes.
Introduction
In forest ecosystems, fine roots (< 1 mm in diameter) representan important belowground carbon (C) sink (Jackson et al., 1997;Ruess et al., 2003). Root interactions also play a prominent rolein defining the relationships between plant species diversity andecosystem function (Schenk, 2006; de Kroon et al., 2012). Nev-ertheless, there is still little information about factors driving spe-cies-level root productivity in natural, diverse forest ecosystemsor how interactions among species affect the spatial variation offine-root biomass (FRB) (McNickle et al., 2009; Meinen et al.,2009). Spatial variation in FRB is often attributed to soil resourceheterogeneity (Hutchings & de Kroon, 1994; Hutchings et al.,2003). Root proliferation in nutrient hotspots is considered acommon competitive strategy, with prolific species gaining anadvantage by pre-emptively obtaining available resources (deKroon et al., 2003, 2012). Thus, competition for nutrient-richpatches is expected to be intense (Wilson, 2000; Blair, 2001),with a substantial effect on plant fitness (Hodge, 2004) and com-munity productivity (Wijesinghe et al., 2005). Modeling studiesalso suggest that species that do not proliferate in high-nutrient
patches are at a competitive disadvantage (O’Brien et al., 2007).However, some species show no selectivity in the placement oftheir roots in patchy environments (Robinson, 1994, 1996) orrespond through altered metabolic rates rather than by root pro-liferation (Jackson et al., 1990; Lambers & Poorter, 1992; Schi-mel & Bennett, 2004; Phillips & Fahey, 2005, 2006). Thus, inaddition to spatial variation in soil nutrients, variation in foragingstrategies could have important effects on belowground relativeabundance and spatial biomass variability in forest stands (Mouet al., 1997; Giardina et al., 2005; Coleman, 2007).
If some species are adapted for pre-emptive colonization ofnutrient-rich patches, they are expected to exhibit traits thatwould allow them to proliferate quickly and exclude other spe-cies, including high specific root length (SRL) and/or low roottissue density (RTD) (Campbell et al., 1991; Hutchings et al.,2003). Other species would be expected to allocate most roots toareas not exploited by the ‘pre-emptive’ species, and to exhibittraits more associated with resilience (de Kroon & Mommer,2006). Thus, under this ‘asymmetric root proliferation’ scenario,FRB should be positively associated with nutrient availability in asoil patch, as well as the abundance of roots of the pre-emptive,
� 2014 The Authors
New Phytologist� 2014 New Phytologist Trust
New Phytologist (2014) 1www.newphytologist.com
Research

aggressively proliferating species, but FRB would not becorrelated with species diversity of roots. By contrast, if all specieshave a similar capacity to detect and proliferate in nutrient hot-spots (‘symmetric root proliferation’), then both FRB and speciesdiversity (regardless of species traits) should be associated withhigh soil resource availability (Table 1).
In addition to responses to soil resource heterogeneity, FRBcould also be affected by biotic interactions among neighbors.‘Overyielding’ occurs where mixtures of species obtain greaterbiomass than would be expected from species monocultures (i.e.biomass is positively correlated with diversity; Berendse, 1983;Cardinale et al., 2007; Kesanakurti et al., 2011). Several mecha-nisms have been proposed to explain strong belowground over-yielding in herbaceous plant communities. Mixtures of speciesexploiting different belowground niches (e.g. different soildepths) may result in overall greater resource uptake (Dimitrako-poulos & Schmid, 2004). Plastic root allocation in response toheterospecific root neighbors can result in increased root biomassdue to greater soil depth exploration (Mueller et al., 2013) orcommon responses to growth-stimulating root exudates orrhizosphere microorganisms (Mommer et al., 2010). Speciesmixtures may also result in lower pathogen pressure, allowing forincreased FRB production (Maron et al., 2011; Schnitzer et al.,2011; de Kroon et al., 2012). However, evidence for below-ground overyielding in forests remains controversial, with reportsof negative (Bolte & Villanueva, 2006), neutral (Meinen et al.,2009), and positive effects of tree diversity on FRB (Brassardet al., 2011, 2013; Lei et al., 2012). Similarly, the vertical distri-butions of tree roots vary from spatial segregation by soil depth(Leuschner et al., 2001; Bennett et al., 2002; Brassard et al.,2013) to clumping of roots in the uppermost soil layers (Meinenet al., 2009; Jones et al., 2011). These contrasting findings suggestthat diversity effects on belowground biomass could be affectedby the particular species in root neighborhoods. The importanceof species-specific interactions is also consistent with identity ofroot neighbors driving morphological trait plasticity to achievean even distribution of traits, which reduces trait overlap andmay help avoid negative competitive interactions (Leuschneret al., 2001; Valverde-Barrantes et al., 2013). Thus, functional or
phylogenetic diversity may be the strongest driver of the over-yielding response of FRB, rather than total species richness (Car-dinale et al., 2007; Flombaum & Sala, 2008).
Finally, the influence of tree diversity and soil conditions onFRB may vary among ecosystems, as well as due to other featuresof natural landscapes that can have an effect on mechanisms ofcommunity assembly. In particular, transitional areas betweenecosystems, called ecotones (Cadenasso et al., 2003), have beenfound to decouple community composition from the environ-ment as a result of independent transport of propagules and abi-otic material (Blackwood et al., 2013). Dispersal of propagulesfrom an optimal environment across an ecotone can result in‘mass effects’, in which propagules establish under nonoptimalconditions, but reduced reproductive output limits further spreadin the nonoptimal environment. This weakened filtering of com-munity composition by the environment may provide an oppor-tunity for the effects of niche partitioning and overyielding onroot biomass to become more apparent. However, ecosystem-level phenomena such as biomass accumulation are mediated bytraits that are often shared by a variety of species (Grime, 2006).Thus, root biomass may be more tightly linked to environmentalconditions, and therefore more resistant to ecotone decoupling,than community composition.
Our objective was to use a natural landscape with three adja-cent, mixed-species forest ecosystems to examine soil and com-munity controls on FRB. First, we sought patterns consistentwith three hypotheses: (H1.1) asymmetric root proliferation, inwhich certain species are able to dominate root biomass in high-resource soil patches; (H1.2) symmetric root proliferation, inwhich there is no inherent advantage of a particular species in col-onizing high-resource soil patches; (H1.3) overyielding, in whichlocal root diversity explains additional variation in FRB that wasnot explained by soil fertility and symmetric or asymmetric rootproliferation. Previously at our study site, we showed that bothcommunity-aggregated and species-level root traits were associ-ated more closely with species identity of interacting roots thanwith soil conditions (Valverde-Barrantes et al., 2013), whichseems inconsistent with trait-mediated asymmetric root prolifera-tion (H1.1). Here we tested for a variety of other patterns in root
Table 1 Predicted effects of spatial soil resource heterogeneity and root species diversity on fine-root biomass (FRB) accrual and root trait distribution in soilpatches under three hypothesized mechanisms (H1.1–1.3)
Root proliferation patternAsymmetric rootproliferation (H1.1)
Symmetric rootproliferation (H1.2) Overyielding (H1.3)
Root biomass increases with soil resources Yes Yes PossiblyPatterns in species distributions
Vertical species segregation Possibly No PossiblyHorizontal species segregation1 Yes No NoParticular species associated with high root biomass Yes No No
Patterns in trait distributionsTrait association with root biomass Yes No NoDistribution of root traits within cores1 Clumped Random Even
Effects of root diversity on FRBSpecies diversity increases with root biomass No Possibly YesEffect of species diversity additive to soil resource effect No No Yes
1These tests were originally reported in Valverde-Barrantes et al. (2013). Results are used to inform our interpretation of other tests shown in this table.
New Phytologist (2014) � 2014 The Authors
New Phytologist� 2014 New Phytologist Trustwww.newphytologist.com
Research
NewPhytologist2

biomass, species composition, soil resources, root traits, and rootdiversity (Table 1) that would be consistent with the hypothesesdescribed above. Secondly, we hypothesized that landscapeposition with respect to ecotones has an effect on controls overFRB; in particular, we tested the hypothesis that (H2) areas nearecotones decrease the explanatory ability of soil conditions butincrease the influence of community composition on FRB spatialvariation. Again, at our study site we previously showed that treecommunity composition is decoupled from soil properties nearecotones (Blackwood et al., 2013), but the effects of ecotones oncontrols over biomass accumulation have not been explored.
Materials and Methods
Site description
The study was conducted in Jennings Woods, a 30-ha forest innortheast Ohio, USA. Acer saccharum Marsh., Acer rubrum L.,Fagus grandifolia Ehrh., and Quercus rubra L. encompass nearly60% of the forest tree cover, with 11 other species accounting formost of the remaining basal area (Blackwood et al., 2013). Theproperty includes three main forest ecosystems and additionalsmaller scale variation in soil characteristics and tree communities(Blackwood et al., 2013). A riparian forest with fine-loamy Incep-tisols dominates areas within 80 m of the West Branch of theMahoning River. A plateau 15–20 m above the riparian forest isdominated by upland forest with fine-loamy Alfisols. A third eco-system is represented by bottomland forest on a lower elevationplateau with Alfisol soils that are very poorly drained. The forestwas selectively logged during the early 20th Century, and hasremained undisturbed for at least 60 yr.
Vertical root biomass and species distributions
Vertical root biomass distributions were determined by collectingsoil samples with a 5-cm-diameter core from 44 locations. Coredepth was 52� 8.75 cm (mean� SD), reaching the C horizonin most cases, and this set of samples is hereafter referred to as‘deep cores’. Samples were located on a grid to ensure coverage ofthe entire area and to include each distinct ecosystem within thelandscape (i.e. upland, bottomland, and riparian forest) and tran-sition points between ecosystems. Deep cores were dissected byhorizon and gently sieved to < 2 mm. During this process, fineroots (< 1 mm diameter) were manually retrieved from each hori-zon and sorted into dead and live roots based on friability, colorand cortex conditions (Bouma et al., 2000). A subsample of FRBfrom each horizon (0.01–0.2 g depending on total horizon bio-mass) was stored at �80°C for subsequent DNA extraction.Remaining roots from each category were dried at 60°C for 24 h,and then weighed.
Tree species presence in different soil horizons was assessedusing DNA extraction from pooled (mixed-species) root samplesfrom each horizon, followed by terminal restriction fragmentlength polymorphism (T-RFLP; see details in Supporting Infor-mation Methods S1). The noncoding spacer region trnH-psbAwas PCR-amplified (Kress et al., 2005) using fluorescently tagged
primers, followed by restriction digestion and capillaryelectrophoresis (Blackwood et al., 2003; Taggart et al., 2011). Wealso created a reference library by running a similar T-RFLP pro-cedure from leaf DNA samples.
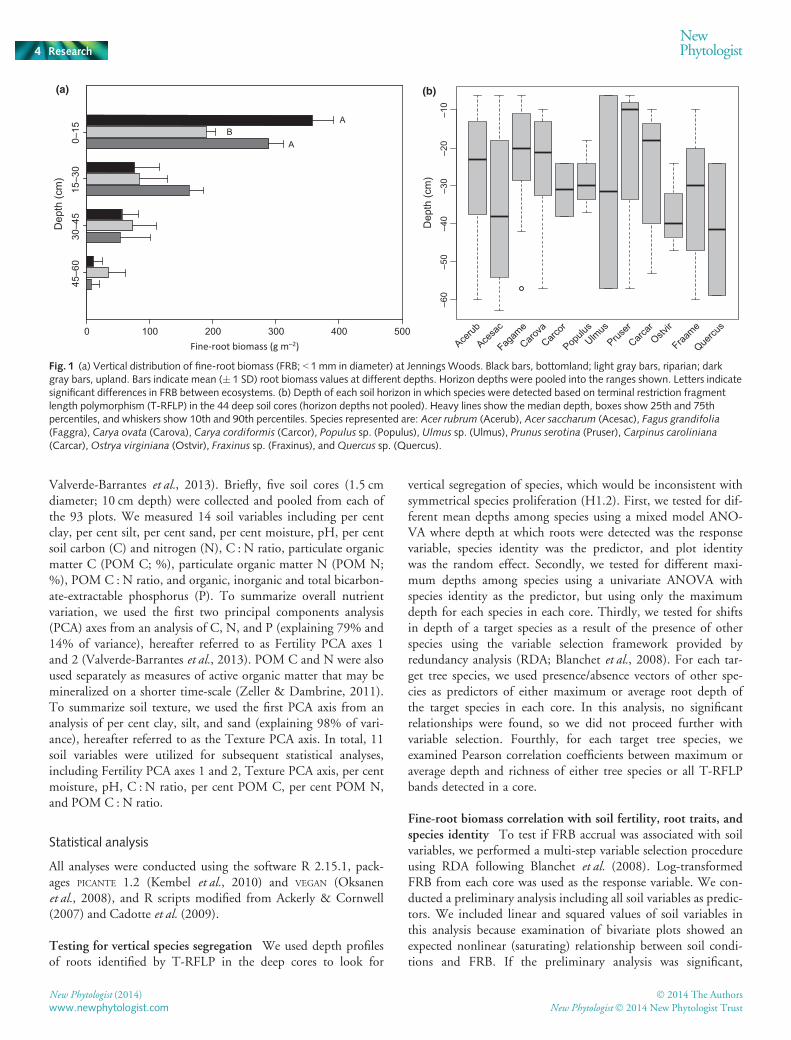
Sampling root biomass, traits, and species acrossecosystems and ecotones
Based on results from the deep cores, ≥ 50% of the total biomasswas concentrated in the first 15 cm of the soil profile, indepen-dent of ecosystem type (Fig. 1a). Consequently, we collectedadditional ‘surface cores’ from 130 plots (2.59 5 m) arranged tomaximize the detection of transitional areas between main ecosys-tems (i.e. ecotones) and ensure good spatial coverage of the dif-ferent environments. The plot arrangement is described in detailin Blackwood et al. (2013), and root sampling is described indetail in Valverde-Barrantes et al. (2013). In brief, samples wereobtained with a 10-cm-diameter9 15-cm-deep PVC corer. Eachsoil core was soaked in water for at least 12 h and all intact fine-root clusters (i.e. roots consisting of three to four root orders c.10 cm in length and < 1 mm in diameter; Xia et al., 2010) werecarefully removed and stored in deionized water. Five to 10 intactroot systems were separated from each core for trait analysis andidentification. All remaining root fragments from each soil sam-ple were collected by washing soil through a 500-lm sieve, afterwhich they were dried and weighed for calculation of total FRBin the core (see Valverde-Barrantes et al., 2013).
We identified individual root samples from the surface cores tospecies by comparing their restriction fragment length polymor-phism (RFLP) patterns to a reference library based on leafcollections from 33 tree canopy species (see Methods S1 andValverde-Barrantes et al., 2013). We generated barcodes by com-bining HinfI RFLP patterns of the plastid gene trnL and the non-coding spacer region trnH-psbA (Brunner et al., 2001). Sevenhundred and thirty-eight root systems belonging to 14 canopytree species were identified. Relative abundance of a species in acore was calculated as the sum of individual root system biomas-ses identified for that species in that core divided by the total bio-mass of all roots identified in that core. Calculation of diversityin each core is described in the Statistical Analysis section below.
Individual root samples from the surface cores were alsoscanned and the following root traits were measured on each rootcluster, as described in Valverde-Barrantes et al. (2013): specificroot length (SRL; m g�1), specific root surface area (SRA;cm2 g�1), root tissue density (RTD; g cm�3), average diameterfor first-order roots (mm), fractal dimension (D; unitless), spe-cific root tip abundance (SRTA; tips per mg) and average linklength (L; cm). These traits have all been employed in the charac-terization of root systems in previous studies (e.g. Eshel, 1998;Hertel et al., 2003; Meinen et al., 2009; Wang et al., 2009;Dupuy et al., 2010).
Soil conditions and aboveground species distribution
Measurement of aboveground species abundance and soil proper-ties are described in detail elsewhere (Blackwood et al., 2013;
� 2014 The Authors
New Phytologist� 2014 New Phytologist TrustNew Phytologist (2014)
www.newphytologist.com
NewPhytologist Research 3
Valverde-Barrantes et al., 2013). Briefly, five soil cores (1.5 cmdiameter; 10 cm depth) were collected and pooled from each ofthe 93 plots. We measured 14 soil variables including per centclay, per cent silt, per cent sand, per cent moisture, pH, per centsoil carbon (C) and nitrogen (N), C : N ratio, particulate organicmatter C (POM C; %), particulate organic matter N (POM N;%), POM C : N ratio, and organic, inorganic and total bicarbon-ate-extractable phosphorus (P). To summarize overall nutrientvariation, we used the first two principal components analysis(PCA) axes from an analysis of C, N, and P (explaining 79% and14% of variance), hereafter referred to as Fertility PCA axes 1and 2 (Valverde-Barrantes et al., 2013). POM C and N were alsoused separately as measures of active organic matter that may bemineralized on a shorter time-scale (Zeller & Dambrine, 2011).To summarize soil texture, we used the first PCA axis from ananalysis of per cent clay, silt, and sand (explaining 98% of vari-ance), hereafter referred to as the Texture PCA axis. In total, 11soil variables were utilized for subsequent statistical analyses,including Fertility PCA axes 1 and 2, Texture PCA axis, per centmoisture, pH, C : N ratio, per cent POM C, per cent POM N,and POM C : N ratio.
Statistical analysis
All analyses were conducted using the software R 2.15.1, pack-ages PICANTE 1.2 (Kembel et al., 2010) and VEGAN (Oksanenet al., 2008), and R scripts modified from Ackerly & Cornwell(2007) and Cadotte et al. (2009).
Testing for vertical species segregation We used depth profilesof roots identified by T-RFLP in the deep cores to look for
vertical segregation of species, which would be inconsistent withsymmetrical species proliferation (H1.2). First, we tested for dif-ferent mean depths among species using a mixed model ANO-VA where depth at which roots were detected was the responsevariable, species identity was the predictor, and plot identitywas the random effect. Secondly, we tested for different maxi-mum depths among species using a univariate ANOVA withspecies identity as the predictor, but using only the maximumdepth for each species in each core. Thirdly, we tested for shiftsin depth of a target species as a result of the presence of otherspecies using the variable selection framework provided byredundancy analysis (RDA; Blanchet et al., 2008). For each tar-get tree species, we used presence/absence vectors of other spe-cies as predictors of either maximum or average root depth ofthe target species in each core. In this analysis, no significantrelationships were found, so we did not proceed further withvariable selection. Fourthly, for each target tree species, weexamined Pearson correlation coefficients between maximum oraverage depth and richness of either tree species or all T-RFLPbands detected in a core.
Fine-root biomass correlation with soil fertility, root traits, andspecies identity To test if FRB accrual was associated with soilvariables, we performed a multi-step variable selection procedureusing RDA following Blanchet et al. (2008). Log-transformedFRB from each core was used as the response variable. We con-ducted a preliminary analysis including all soil variables as predic-tors. We included linear and squared values of soil variables inthis analysis because examination of bivariate plots showed anexpected nonlinear (saturating) relationship between soil condi-tions and FRB. If the preliminary analysis was significant,
Fine-root biomass (g m–2)0 100 200 300 400 500
Dep
th (c
m)
0–15
15–3
030
–45
45–6
0
A
AB
–60
–50
–40
–30
–20
–10
Dep
th (c
m)
Acerub
Acesa
c
Fagam
e
Carova
Carcor
Populu
sUlm
us
Pruser
Carcar
Ostvir
Fraame
Quercu
s
(a) (b)
Fig. 1 (a) Vertical distribution of fine-root biomass (FRB; < 1mm in diameter) at Jennings Woods. Black bars, bottomland; light gray bars, riparian; darkgray bars, upland. Bars indicate mean (� 1 SD) root biomass values at different depths. Horizon depths were pooled into the ranges shown. Letters indicatesignificant differences in FRB between ecosystems. (b) Depth of each soil horizon in which species were detected based on terminal restriction fragmentlength polymorphism (T-RFLP) in the 44 deep soil cores (horizon depths not pooled). Heavy lines show the median depth, boxes show 25th and 75thpercentiles, and whiskers show 10th and 90th percentiles. Species represented are: Acer rubrum (Acerub), Acer saccharum (Acesac), Fagus grandifolia(Faggra), Carya ovata (Carova), Carya cordiformis (Carcor), Populus sp. (Populus), Ulmus sp. (Ulmus), Prunus serotina (Pruser), Carpinus caroliniana(Carcar),Ostrya virginiana (Ostvir), Fraxinus sp. (Fraxinus), andQuercus sp. (Quercus).
New Phytologist (2014) � 2014 The Authors
New Phytologist� 2014 New Phytologist Trustwww.newphytologist.com
Research
NewPhytologist4

forward selection of predictor variables was performed to obtaina parsimonious model (Blanchet et al., 2008).
Under the asymmetric root proliferation hypothesis (H1.1,and in contrast to H1.2), we predicted an association betweenFRB accrual and the dominance of species bearing traits associ-ated with fast growth rates (i.e. long SRL and high SRTA). Totest for an affiliation between root traits and FRB accrual, werepeated the RDA variable selection procedure described aboveusing average core-level (community-aggregated) root traits aspredictors. To test for an affiliation of particular species withFRB accrual, we performed regressions between each species rela-tive abundance and FRB. However, we performed the regressionfor each species using a restricted set of samples to avoid spuriousresults related to root absences in soil conditions outside the nor-mal range of the species. For each species, we only used samplesthat fell within the ranges of soil pH, moisture, or Fertility PCA1where that species was detected. Species were selected for furtheranalysis if their relative abundance was significantly related toFRB within one or more of these sample sets.
After selecting soil properties, root traits, and species abun-dances related to FRB, variance partitioning and partial tests wereperformed to determine the significance of each factor after cor-recting for effects of other factors (Peres-Neto et al., 2006).
Overyielding effects on FRB variation Here, our goal was totest for overyielding (H1.3) by determining the amount of varia-tion in FRB that could be explained by local species diversity,after accounting for soil factors selected during RDA as describedin the previous section. Detailed descriptions of diversity indicesare given in Methods S1 and Cadotte et al. (2009). We calculateda series of diversity metrics summarizing root diversity in termsof species richness (S), phylogenetic dispersion (mean phyloge-netic distance (MPD) and mean nearest taxon distance(MNTD)), phylogenetic diversity (PD, which aggregates speciesrichness and phylogenetic dispersion), and functional traits (func-tional attribute distance (FAD), functional distance (FD), andnonmetric dimensional scaling-based functional distance(NMDS)). We then tested whether these diversity indices signifi-cantly explained variance in residual FRB variation after correct-ing for soil conditions (Cadotte et al., 2009). Diversity indiceswere evaluated using the same RDA variable selection proceduredescribed in the previous section. Only cores with at least one ofthe 14 most abundant species were included in the analysis(n = 86; Loreau & Hector, 2001; Dybzinski et al., 2008). Weincluded the normalized linear and squared values of diversityvariables. A significant positive relationship between the residualFRB values and diversity metrics was interpreted as evidence foroveryielding.
Ecotone effects on FRB distribution To test for decouplingbetween biotic and abiotic factors across ecosystem transitions(H2), we used the randomization test described in Blackwoodet al. (2013). In brief, we classified plots and soil samples aswithin the ecosystem ‘core’ area if they were located > 30 m froma topographically defined ecosystem boundary, and within an‘ecotone’ area if they were located within 30 m of the boundary.
Tests for determining controls on FRB spatial variation(described in the previous two sections) were initially performedon all plots, including core and ecotone areas. Here, the variancein FRB explained in the core plots only was also calculated. Forthis calculation, we reused the explanatory variables retained dur-ing variable selection on the entire data set, resulting in a conser-vative estimate of the amount of variance that can be explained inthe core areas only. Fits of the regression models to each data setwere compared based on adjusted-R2 values to correct for theeffect of differing numbers of samples on variance explained, andthe significance of the change in variance explained was testedusing a restricted randomization test (Fagan et al., 2003; Peres-Neto et al., 2006). To calculate a P-value, the empirical propor-tional increase in adjusted-R2 attributable to exclusion of edgeplots was compared to a null distribution of values derived fromrandomization under the null hypothesis that there was no effectof including ecotone areas on predictability of FRB.
Results
Vertical FRB segregation
All ecosystems showed a relatively shallow fine-root distribution,with 50%, 56% and 71% of total FRB in the upper 15 cm of thesoil profile for riparian, upland, and bottomland forest, respec-tively (Fig. 1a). Despite differences in root distribution and FRBbetween ecosystems, we found no evidence of species segregationby depth, in support of symmetric root proliferation (H1.2), asopposed to asymmetric proliferation (H1.1). Species showedlarge overlap in the depths at which they were detected, with nosignificant differences in their mean or maximum depths(P > 0.1; Fig. 1b).
To test for shifts in root depth of a particular target species, weonly used other species as predictors if they co-occurred in two ormore soil cores. In agreement with H1.2, there were no targetspecies where RDA indicated that average or maximum rootdepth was predicted by the presence of any other species(P > 0.1). We also did not detect any species with significant cor-relations between average or maximum root depth and terminalrestriction fragment richness of trees or all plants in soil cores(P > 0.1).
Fine-root biomass correlation with soil fertility, root traits,and species identity
Comparing FRB in surface cores, only the finest root classshowed significant differences among ecosystems, with riparianforest having 34% lower FRB than upland forest and 47% lowerFRB than bottomland forest (Table 2). The preliminary tests ofroot traits and soil fertility variables explaining FRB were bothsignificant (P < 0.05). The selected soil factors explained 39% ofthe variation in FRB and included Fertility PCA1 and its squaredterm, and C : N, POM C : N, POM C and POM N (P = 0.001).The root traits retained during variable selection included averagediameter, SRTA, and RTD, together explaining 22% of the vari-ation in FRB (P = 0.001). In contrast to our expectations for
� 2014 The Authors
New Phytologist� 2014 New Phytologist TrustNew Phytologist (2014)
www.newphytologist.com
NewPhytologist Research 5

traits based on H1.1, SRTA and SRL showed negative associa-tions with FRB, whereas RTD was positively associated withFRB (Fig. 2a–c). The species with relative abundance signifi-cantly predicting FRB included Acer saccharum, A. rubrum andPrunus serotina Ehrh. Together, these species explained 11% ofvariation in FRB (Fig. 2d–f). See Tables S1 and S2 for detailsabout relationships between FRB and other root traits andspecies.
Soil properties were still significantly related to FRB even afterpartitioning out the effect of root traits and species relative abun-dance (P = 0.005; Fig. 3). Consistent with symmetric root prolif-eration (H1.2), species relative abundance was not significantlyassociated with FRB residuals after correcting for soil conditions(P = 0.62), and the effect of root functional traits was only mar-ginally significant (P = 0.052). Although the effect of species rela-tive abundance was mostly confounded by soil properties, 67%of the variance explained by soil properties was unrelated to spe-cies relative abundance (Fig. 3).
Overyielding effect on FRB variation
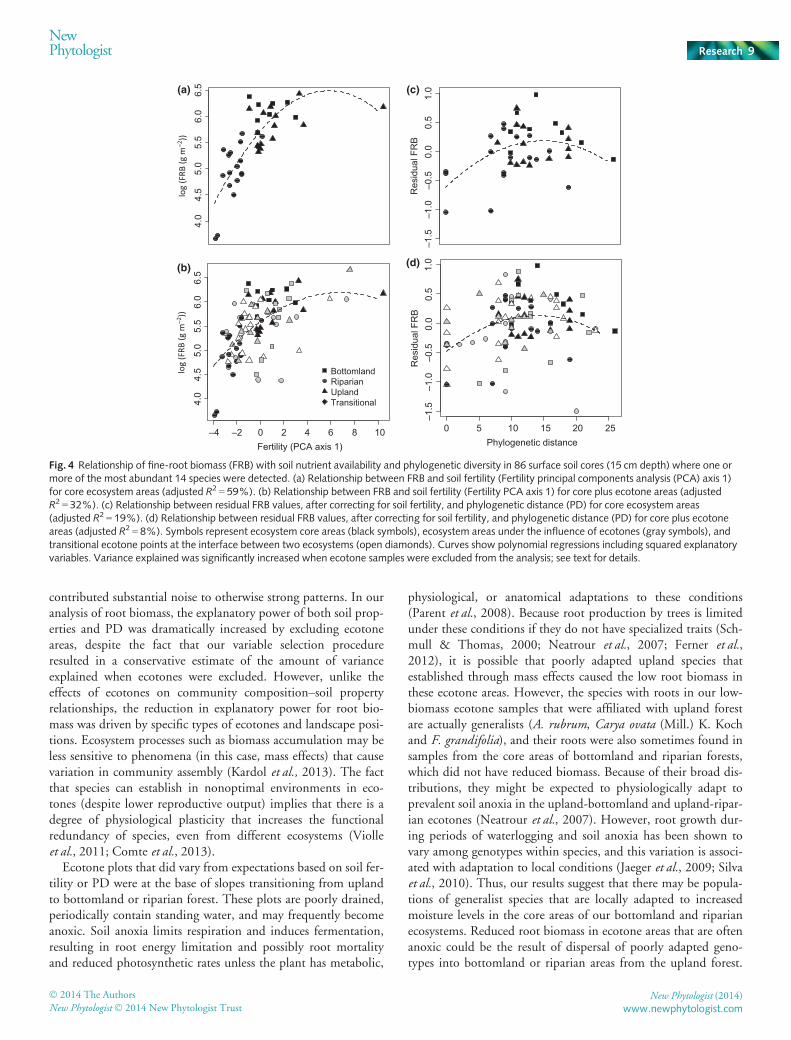
For surface cores, species richness (S) averaged approximatelythree species per core, with a maximum of seven. Phylogeneticdiversity (PD), species richness, and functional diversity indiceswere highly correlated, with Pearson correlation coefficients rang-ing from 0.72 to 0.89, whereas indices of phylogenetic dispersionwere poorly correlated with other measures of diversity (Fig. S1;Table S3). The preliminary RDA test including all diversity indi-ces indicated that residual FRB (after correcting for soil fertility)was significantly related to root diversity in soil cores with rootsof at least one of the 14 most abundant trees. Despite the closerelationship between trait diversity and phylogenetic distances,PD and PD2 were the only variables retained during variableselection (P = 0.003). Inclusion of PD2 created a unimodal rela-tionship between phylogenetic distance and residual FRB, withresidual FRB clearly increasing at low levels of PD (Fig. 4d).Residual FRB begins to decline at the highest levels of PD,although this may be an artifact of reduced sampling at the high-est levels of phylogenetic diversity.
Ecotone effects on strength of soil and diversity controls onFRB
Analyses described in the previous two sections included soilsamples from all landscape positions including ecotone and core
ecosystem areas. To test for an effect of proximity to ecotones(H2), we calculated variance explained in samples limited to coreecosystem areas only. The relationship between FRB and soilconditions was almost twice as large in ecosystem core areas(adjusted R2 = 59%) compared with when plots near ecotoneswere included (adjusted R2 = 32%) (Fig. 4a,b). Similarly, vari-ance explained by PD more than doubled in ecosystem core areas(19%), compared with when ecotone areas were included (8%)(Fig. 4c,d). The restricted randomization test showed that thisdilution of variance explained was statistically significant for bothsoil conditions (P = 0.0001) and phylogenetic diversity(P = 0.014), suggesting that the relationships between these fac-tors and FRB are decoupled at ecotones.
Examination of individual sample points in Fig. 4 indicatesthat the reduction in variance explained by inclusion of ecotoneareas was associated with particular ecotone types. Samples fromupland-bottomland and upland-riparian ecotones were farthestfrom the best fit curves describing the effects of soil fertility andPD on root biomass (Fig. 4b,d). However, the unexplained varia-tion introduced by these samples was not random; these sampleshad less root biomass than expected based on their levels of bothsoil fertility and PD. These samples came from the base of topo-graphic slopes in the bottomland or riparian forests, areas that arenormally saturated with water as a result of runoff and seepagefrom the slopes, and are probably anoxic multiple times eachyear.
Discussion
Dominance of symmetric root proliferation among speciescontrolling FRB
Vertical and horizontal root segregation resulting from asymmet-ric root proliferation by certain plant species is often mentionedas a mechanism of soil resource partitioning (Fitter et al., 1991;Caldwell et al., 1996) and is a pattern expected to be commonacross ecosystems (Tilman et al., 1997; Schenk et al., 1999).Although we found that root biomass did increase in areas ofhigh resource availability, this is consistent with both asymmetricand symmetric root proliferation responses by different species.However, comparison of the remainder of our results to predic-tions in Table 1 provides more support for the hypothesis of sym-metric species root proliferation responses for canopy tree rootsystems (H1.2). First, we found no evidence for vertical segrega-tion among canopy tree root systems, similar to other studies
Table 2 Root biomass distribution for three different ecosystems in a deciduous temperate forest in northeastern Ohio (USA)
FRB (gm�2) CRB (g m�2) WRB (gm�2)
Mean 95% CI Mean 95% CI Mean 95% CI
Bottomland 357.96 293.07–423.11 111.43 80.65–147.13 99.57 62.24–141.43Riparian 189.48 160.65–219.72 95.19 60.85–137.46 77.79 45.72–115.09Upland 289.02 245.85–335.57 120.37 94.77–147.04 88.28 59.24–121.52
Categories correspond to fine root biomass (FRB; roots < 1mm in diameter), coarse root biomass (CRB; roots 1–3mm) and woody root biomass (WRB; 3–5mm) in the uppermost 15 cm of the soil profile. CI, confidence interval.
New Phytologist (2014) � 2014 The Authors
New Phytologist� 2014 New Phytologist Trustwww.newphytologist.com
Research
NewPhytologist6

using molecular techniques for root identification (von Felten &Schmid, 2008; Frank et al., 2010; Mommer et al., 2010; Raveneket al., 2014) and in forests with similar floristic composition(Meinen et al., 2009). Moreover, the root mass depth profileindicated that species in this diverse forest tend to accumulateroots in the uppermost soil horizon, rather than distribute FRBevenly across the soil profile (Fig. 1a). Secondly, we found only aweak effect of species identity on horizontal FRB spatial distribu-tion. Out of 14 common tree species, only the relative abundanceof P. serotina and A. rubrum was strongly positively associatedwith FRB. At the scale of the entire community, this accountedfor a small portion of the overall effect of soil properties on FRB.Thirdly, we previously showed lack of horizontal species segrega-tion in tree roots at Jennings Woods (Valverde-Barrantes et al.,2013), similar to the unexpectedly high diversity and overlap inroot systems found in other systems (Lang et al., 2010; Joneset al., 2011; Hiiesalu et al., 2012). These results indicate thatthere is extensive overlap in foraging areas among neighboringtrees, in contrast to the idea of high among-species territorialityor niche differentiation based on asymmetric species responses to
soil resources (i.e. in contrast to H1.1). Instead, roots of all spe-cies tended to proliferate in nutrient-rich areas, and higher FRBwas associated with aggregation of species in nutrient-rich soils,supporting symmetric ability of species to proliferate roots inresponse to soil nutrients (H1.2). Thus, our study suggests thatall species had relatively similar opportunities to access patchilydistributed soil resources, implying that soil heterogeneity maynot substantially alter belowground competitive interactions(Schenk, 2006).
Root trait differences among species are commonly assumed tocorrespond to specialized foraging patterns and root growth rates(Campbell et al., 1991; Coleman, 2007), and thus be reflective ofasymmetric root proliferation. Species with root traits indicativeof fast growth could be adapted to proliferate in and dominateareas with higher nutrient availability (Taub & Goldberg, 1996;Aanderud et al., 2003). However, although we did find that roottraits were correlated with FRB and soil conditions, the relation-ship between community-aggregated traits and FRB was theopposite of what we expected, with high FRB associated withincreased RTD and decreased SRTA and SRL. Thus, high root
0.0 0.5 1.0 1.5 2.0 2.5
3.5
4.0
4.5
5.0
5.5
6.0
6.5
2.0 2.5 3.0 3.5 4.0 4.5 –2.5 –2.0 –1.5 –1.0
0.0 0.2 0.4 0.6 0.8 1.0
4.0
4.5
5.0
5.5
6.0
6.5
Acer saccharum proportional biomass0.0 0.2 0.4 0.6 0.8 1.0
Acer rubrum proportional biomass0.0 0.1 0.2 0.3 0.4 0.5 0.6
Prunus serotina proportional biomas
(a) (c)(b)
(d) (e) (f)
log
(FRB
(g m
–2))
log
(FRB
(g m
–2))
log (SRTA (tips per mg)) log (SRL (m g–1)) log (RTD (cm3 g–1))
Fig. 2 Relationships between fine-root biomass (FRB), representative root traits and relative species root biomass abundance in 93 surface soil cores (15 cmdeep). Upper panels: relationship between FRB and (a) average specific root tip abundance (SRTA; slope =�30.07; F = 15.99; P < 0.0001), (b) specific rootlength (SRL; slope =�2.94; F = 9.45; P < 0.002) and (c) root tissue density (RTD; slope = 527.37; F = 10.45; P < 0.002) (see Supporting Information TableS2 for other root traits). Lower panels: relationship between FRB and proportional abundance in root biomass of (d) Acer saccharum (F = 9.85; P < 0.002),(e) Acer rubrum (F = 4.45; P < 0.03) and (f) Prunus serotina (F = 7.69; P < 0.007). In each species relative abundance panel, only samples that fall within therange of soil fertility principal components analysis (PCA) axis 1 inhabited by the species are shown. The dotted line represents the linear regression fit (seeTable S3 for details about other species).
� 2014 The Authors
New Phytologist� 2014 New Phytologist TrustNew Phytologist (2014)
www.newphytologist.com
NewPhytologist Research 7

biomass in nutrient-rich areas was not the result of rapid prolifer-ation of roots with maximum potential for resource uptake, butwas instead attributable to an accumulation of roots with pre-sumably reduced uptake capacity and longer lifespan. Similarly,Ostonen et al. (2011) and Montagnoli et al. (2012) reportedincreased root density and reduced tip abundance in high-fertilityareas. These results suggest that morphological root traits oftenassociated with rapid growth and pre-emptive colonization areactually related to nutrient scarcity. The increased root tissuedensity and reduced tip abundance we found associated with highbiomass are thought to increase root lifespan and provide betterprotection from pathogens and herbivores (Poot & Lambers,2003; Tjoelker et al., 2005). Long-term occupation and survivalof roots in high-resource locations may be particularly beneficialif resource conditions persist for long periods.
Despite large trait differences among species, the variance inFRB explained by root traits did not correspond with the vari-ance in FRB explained by species composition, suggesting thatintraspecific root trait plasticity drives the variation in commu-nity-aggregated traits that helps explain FRB. This is consistentwith our previous finding that individual species traits shift toavoid trait overlap with other species in the same soil core, creat-ing a within-core trait distribution that is more even thanexpected by chance (Valverde-Barrantes et al., 2013). Avoidingtrait overlap may be particularly important to avoid competitiveinteractions, pathogens, and herbivores in higher resource soilwhere there is consistently greater root biomass and species
diversity (de Kroon et al., 2012). Interspecific interactions amongneighboring roots can limit root branching (de Kroon et al.,2003; de Kroon, 2007), suggesting strong biotic interactions thatprevent a single species from dominating nutrient hotspots(Gersani et al., 2001).
Overyielding of root biomass
We also found a relationship between diversity and FRB, evenafter correcting for soil resources, supporting the overyieldinghypothesis (H1.3). Although O’Brien et al. (2007) showed thathigher biomass in areas of root overlap (i.e. increased diversity)could arise from competitive foraging in a simple game-theoryframework, additional patterns in our data suggest that the mech-anisms behind overyielding may be more complex. The identityof neighboring species plays a role in the overall communityresponse, with higher biomass in cores occupied by distantlyrelated species (Cadotte et al., 2009). Similar relationshipsbetween phylogenetic diversity and ecosystem overyielding havebeen described previously, but only with respect to abovegroundbiomass productivity (Flombaum & Sala, 2008; Burns & Strauss,2011).
The diversity index that predicted residual FRB the best wasPD, an integrated index that represents species richness, phyloge-netic dispersion, and any trait diversity that is phylogeneticallystructured. In this study, root traits were highly structured byphylogeny (Fig. S1; Table S3). Coupled with the shift in somespecies’ root traits to achieve a more even distribution of traitsthan expected (Valverde-Barrantes et al., 2013), this indicatesthat the enhanced root productivity among distantly related spe-cies is a result of complementary tradeoffs to avoid competitionamong overlapping roots. Although all species seemed to accessthe resources in high-nutrient soil patches, overyielding indicatesthat they may not overlap completely in their access to all typesof resources within the patches. In addition, phylogenetic diver-sity may also result in root overyielding through phylogeneticconservatism in relationships with mutualistic or pathogenicmicroorganisms (Schweitzer et al., 2008; Brandt et al., 2009;Lambers et al., 2009; €Opik et al., 2010). Moreover, release fromspecies-specific soil pathogens in species mixtures has beenhypothesized to contribute to species coexistence and root over-yielding (Maron et al., 2011; de Kroon et al., 2012), as well asthe maintenance of higher patch fertility (Fornara & Tilman,2009). Further analyses are necessary to evaluate the role of plantphylogenetic diversity and the associated rhizosphere communityin ecosystem productivity, but our results suggest that thesefactors plays an important role in root distributions and produc-tivity.
Reduced explanatory power of soil fertility andphylogenetic diversity near ecotones
We had previously observed that relationships between tree com-munity composition and soil properties were decoupled near theecotones at Jennings Woods (Blackwood et al., 2013). Here, wehave again found that landscape positions near ecotones
Fig. 3 Variance in fine-root biomass (FRB) (adjusted R2) partitioned amonggroups of variables after selection of a parsimonious set of significantvariables (P < 0.05) as described in the Results section. The analysis wasperformed on 93 surface soil cores (15 cm depth). After accounting forvariation explained by other factors (i.e. subtracting the overlap amongfactors), only the amount of variance explained by soil conditionsremained significant (P < 0.05, although the effect of root traits wasmarginally significant). Functional root traits in this analysis includeaverage diameter, specific root tip abundance (SRTA), and root tissuedensity (RTD). Proportional root abundances used included the speciesAcer saccharum, Acer rubrum, and Prunus serotina. Soil conditionsincluded Fertility PCA1 and its squared term, and carbon (C) : nitrogen (N),particulate organic matter (POM) C : N, POM C, and POMN. See Fig. 2and Tables S1 and S2 for information about individual variablerelationships with FRB.
New Phytologist (2014) � 2014 The Authors
New Phytologist� 2014 New Phytologist Trustwww.newphytologist.com
Research
NewPhytologist8
contributed substantial noise to otherwise strong patterns. In ouranalysis of root biomass, the explanatory power of both soil prop-erties and PD was dramatically increased by excluding ecotoneareas, despite the fact that our variable selection procedureresulted in a conservative estimate of the amount of varianceexplained when ecotones were excluded. However, unlike theeffects of ecotones on community composition–soil propertyrelationships, the reduction in explanatory power for root bio-mass was driven by specific types of ecotones and landscape posi-tions. Ecosystem processes such as biomass accumulation may beless sensitive to phenomena (in this case, mass effects) that causevariation in community assembly (Kardol et al., 2013). The factthat species can establish in nonoptimal environments in eco-tones (despite lower reproductive output) implies that there is adegree of physiological plasticity that increases the functionalredundancy of species, even from different ecosystems (Violleet al., 2011; Comte et al., 2013).
Ecotone plots that did vary from expectations based on soil fer-tility or PD were at the base of slopes transitioning from uplandto bottomland or riparian forest. These plots are poorly drained,periodically contain standing water, and may frequently becomeanoxic. Soil anoxia limits respiration and induces fermentation,resulting in root energy limitation and possibly root mortalityand reduced photosynthetic rates unless the plant has metabolic,
physiological, or anatomical adaptations to these conditions(Parent et al., 2008). Because root production by trees is limitedunder these conditions if they do not have specialized traits (Sch-mull & Thomas, 2000; Neatrour et al., 2007; Ferner et al.,2012), it is possible that poorly adapted upland species thatestablished through mass effects caused the low root biomass inthese ecotone areas. However, the species with roots in our low-biomass ecotone samples that were affiliated with upland forestare actually generalists (A. rubrum, Carya ovata (Mill.) K. Kochand F. grandifolia), and their roots were also sometimes found insamples from the core areas of bottomland and riparian forests,which did not have reduced biomass. Because of their broad dis-tributions, they might be expected to physiologically adapt toprevalent soil anoxia in the upland-bottomland and upland-ripar-ian ecotones (Neatrour et al., 2007). However, root growth dur-ing periods of waterlogging and soil anoxia has been shown tovary among genotypes within species, and this variation is associ-ated with adaptation to local conditions (Jaeger et al., 2009; Silvaet al., 2010). Thus, our results suggest that there may be popula-tions of generalist species that are locally adapted to increasedmoisture levels in the core areas of our bottomland and riparianecosystems. Reduced root biomass in ecotone areas that are oftenanoxic could be the result of dispersal of poorly adapted geno-types into bottomland or riparian areas from the upland forest.
0 5 10 15 20 25–1
.5–1
.0–0
.50.
00.
51.
0Phylogenetic distance
–1.5
–1.0
–0.5
0.0
0.5
1.0
4.0
4.5
5.0
5.5
6.0
6.5
–4 –2 0 2 4 6 8 10
4.0
4.5
5.0
5.5
6.0
6.5
Fertility (PCA axis 1)
BottomlandRiparianUplandTransitional
log
(FRB
(g m
–2))
log
(FRB
(g m
–2))
Res
idua
l FR
BR
esid
ual F
RB
(a)
(b)
(c)
(d)
Fig. 4 Relationship of fine-root biomass (FRB) with soil nutrient availability and phylogenetic diversity in 86 surface soil cores (15 cm depth) where one ormore of the most abundant 14 species were detected. (a) Relationship between FRB and soil fertility (Fertility principal components analysis (PCA) axis 1)for core ecosystem areas (adjusted R2 = 59%). (b) Relationship between FRB and soil fertility (Fertility PCA axis 1) for core plus ecotone areas (adjustedR2 = 32%). (c) Relationship between residual FRB values, after correcting for soil fertility, and phylogenetic distance (PD) for core ecosystem areas(adjusted R2 = 19%). (d) Relationship between residual FRB values, after correcting for soil fertility, and phylogenetic distance (PD) for core plus ecotoneareas (adjusted R2 = 8%). Symbols represent ecosystem core areas (black symbols), ecosystem areas under the influence of ecotones (gray symbols), andtransitional ecotone points at the interface between two ecosystems (open diamonds). Curves show polynomial regressions including squared explanatoryvariables. Variance explained was significantly increased when ecotone samples were excluded from the analysis; see text for details.
� 2014 The Authors
New Phytologist� 2014 New Phytologist TrustNew Phytologist (2014)
www.newphytologist.com
NewPhytologist Research 9
The population-level mass effects of locally adapted genotypesprovides another potential mechanism by which ecological rela-tionships may be decoupled at ecotones, in addition to the com-munity-level mass effects described in Blackwood et al. (2013).This mechanism may be particularly important for ecosystem-level phenomena, such as biomass accrual, under harsh abioticconditions.
Conclusions
Our results highlight the important role that root interactionsmay play in forest communities, as well as landscape-level speciesdistribution and dispersal patterns. The idea of segregated forag-ing areas among coexisting individuals is possibly limited tostrongly nutrient- or water-restricted communities (Schenk,2006), with direct interactions among roots in forests being morepervasive than can be inferred simply by examining the overlapof plant canopies (Jones et al., 2011). In addition, we foundbelowground foraging behavior in trees to be influenced by nutri-ent heterogeneity in soils independently of species identity, con-tradicting the hypothesized scale-precision tradeoff mechanismcommonly mentioned as a driver of plant coexistence in naturalcommunities (Kembel & Cahill, 2005; Kembel et al., 2008).Instead, we suggest an optimality foraging framework where mostspecies preferentially forage in areas with higher resource avail-ability and the level of biomass productivity in the patch willdepend on phylogenetic relatedness among neighbors and thepersistence of nutrient patches (McNickle & Cahill, 2009).However, in contrast to the relative lack of differences amongspecies in FRB accrual in response to soil resources, reduced FRBof generalist species in particular ecotone types indicated differentwithin-species population responses to soil anoxia. Thus, undersevere abiotic constraints, mass effects and ecotone decoupling ofbiotic–abiotic relationships may be important even for ecosystemprocesses.
Acknowledgements
The authors would like to thank Eugene Ryee and Chris Dejelofor their assistance in the field and with processing samples. Wethank Andy Jones, Hans de Kroon, and one anonymous reviewerfor useful comments on the manuscript. This study was sup-ported by grants from the US National Science Foundation(DEB-0918240 and DEB-0918878) and Department of Energy(DE-SC000433), startup funds provided by Kent State Univer-sity, an Art and Margaret Herrick Research Grant, a David andSusan Jarzen Scholarship, The Holden Arboretum Trust, andThe Corning Institute for Education and Research.
References
Aanderud ZT, Bledsoe CS, Richards JH. 2003. Contribution of relative growth
rate to root foraging by annual and perennial grasses from California oak
woodlands. Oecologia 136: 424–430.Ackerly DD, Cornwell WK. 2007. A trait-based approach to community
assembly: partitioning of species trait values into within- and among-
community components. Ecology Letters 10: 135–145.
Bennett JN, Andrew B, Prescott CE. 2002. Vertical fine root distributions of
western cedar, western hemlock and salal in old-growth cedar-hemlock forest
on northern Vancouver Island. Canadian Journal of Forest Research 32: 1208–1216.
Berendse F. 1983. Interspecific competition and niche differentiation between
Plantago lanceolata and Anthoxanthum odoratum in a natural hayfield. Journal ofEcology 71: 379–390.
Blackwood CB, Marsh T, Kim S, Paul EA. 2003. Terminal restriction length
polymorphism data analysis for quantitative comparison of microbial
communities. Applied and Environmental Microbiology 69: 926–932.Blackwood CB, Smemo KA, Kershner MW, Feinstein LM, Valverde-
Barrantes OJ. 2013. Decay of ecosystem differences and decoupling of
tree community-soil environment relationships at ecotones. EcologicalMonographs 83: 403–417.
Blair B. 2001. Effect of soil nutrient heterogeneity on the symmetry of
belowground competition. Plant Ecology 156: 199–203.Blanchet FG, Legendre P, Borcard D. 2008. Forward selection of explanatory
variables. Ecology 89: 2623–2632.Bolte A, Villanueva I. 2006. Interspecific competition impacts on the
morphology and distribution of fine roots in European beech (Fagus sylvaticaL.) and Norway spruce (Picea abies (L.) Karst.). European Journal of ForestResearch 125: 15–26.
Bouma TJ, Nielsen KL, Koutstaal B. 2000. Sample preparation and scanning
protocol for computerised analysis of root length and diameter. Plant and Soil218: 185–196.
Brandt AJ, Seabloom EW, Hosseini PR. 2009. Phylogeny and provenance affect
plant-soil feedbacks in invaded California grasslands. Ecology 90: 1063–1072.Brassard BW, Chen HYH, Bergeron Y, Par�e D. 2011. Differences in fine root
productivity between mixed and single species stands. Functional Ecology 1:238–246.
Brassard BW, Chen HYH, Cavard X, Laganiere J, Reich PB, Bergeron Y, Par�e
D. 2013. Tree species diversity increases fine root productivity through
increased soil volume filling. Journal of Ecology 101: 210–219.Brunner I, Brodbeck S, Buchler U, Sperisen C. 2001.Molecular identification of
fine roots of trees from the Alps: reliable and fast DNA extraction and PCR–RFLP analyses of plastid DNA.Molecular Ecology 10: 2079–2087.
Burns JH, Strauss SY. 2011.More closely related species are more ecologically
similar in an experimental test. Proceedings of the National Academy of Sciences,USA 108: 5302–5307.
Cadenasso ML, Pickett STA, Weathers KC, Jones CG. 2003. A framework for a
theory of ecological boundaries. BioScience 53: 750–758.Cadotte MW, Cavender-Bares J, Tilman D, Oakley TH. 2009. Using
phylogenetic, functional and trait diversity to understand patterns of plant
community productivity. PLoS ONE 4: e5695.
Caldwell MM, Manwaring JH, Durham SL. 1996. Species interactions at the
level of fine roots in the field: influence of soil nutrient heterogeneity and plant
size. Oecologia 106: 440–447.Campbell BD, Grime JP, Mackey JML. 1991. A trade-off between scale and
precision in resource foraging. Oecologia 87: 532–538.Cardinale BJ, Wright JP, Cadotte MW, Carroll IT, Hector A, Srivastava DS,
Loreau M, Weis JJ. 2007. Impacts of plant diversity on biomass production
increase through time due to species complementarity. Proceedings of theNational Academy of Sciences, USA 104: 18123–18128.
Coleman MD. 2007. Spatial and temporal patterns of root distribution in
developing stands of four woody crop species grown with drip irrigation and
fertilization. Plant and Soil 299: 195–213.Comte F, Fauteux L, del Giorgio PA. 2013. Links between metabolic plasticity
and functional redundancy in freshwater bacterioplankton communities.
Frontiers in Microbiology 4: 112.Dimitrakopoulos PG, Schmid B. 2004. Biodiversity effects increase linearly with
biotope space. Ecology Letters 7: 574–583.Dupuy L, Vignes M, Mckenzie BM, White PJ. 2010. The dynamics of
root meristem distribution in the soil. Plant, Cell & Environment 33:358–369.
Dybzinski R, Fargione JE, Zak DR, Fornara D, Tilman D. 2008. Soil fertility
increases with plant species diversity in a long-term biodiversity experiment.
Oecologia 158: 85–93.
New Phytologist (2014) � 2014 The Authors
New Phytologist� 2014 New Phytologist Trustwww.newphytologist.com
Research
NewPhytologist10

Eshel A. 1998.On the fractal dimension of a root system. Plant, Cell &Environment 21: 247–251.
Fagan WF, Fortin MJ, Soykan C. 2003. Integrating edge detection and dynamic
modeling in a quantitative analysis of ecological boundaries. BioScience 53:730–738.
von Felten S, Schmid B. 2008. Complementarity among species in horizontal
versus vertical rooting space. Journal of Plant Ecology 1: 33–41.Ferner E, Rennenberg H, Kreuzwieser J. 2012. Effect of flooding on C
metabolism of flood-tolerant (Quercus robur) and non-tolerant (Fagus sylvatica)tree species. Tree Physiology 32: 135–145.
Fitter AH, Stickland TR, Harvey ML, Wilson GW. 1991. Architectural analysis
of plant root systems. I. Architectural correlates of exploitation efficiency. NewPhytologist 118: 375–382.
Flombaum P, Sala OE. 2008.Higher effect of plant species diversity on
productivity in natural than artificial ecosystems. Proceedings of the NationalAcademy of Sciences, USA 105: 6087–6090.
Fornara DA, Tilman D. 2009. Ecological mechanisms associated with the
positive diversity-productivity relationship in an N-limited grassland. Ecology90: 408–418.
Frank DA, Pontes AW, Maine EM, Caruana J, Raina R, Raina S, Fridley JD.
2010. Grassland root communities: species distributions and how they are
linked to aboveground abundance. Ecology 91: 3201–3209.Gersani M, Brown JS, O’Brien EE, Maina GM, Abramsky Z. 2001. Tragedy of
the commons as a result of root competition. Journal of Ecology 89: 660–669.Giardina CP, Coleman MD, Hancock JE, King JS, Lilleskov EA, Loya WM,
Pregitzer KS, Ryan MG, Trettin CC. 2005. The response of belowground
carbon allocation in forests to global change. In: Binkley D, Menyailo O, eds.
Tree species effects on soils: implications for global change. NATO Science Series.
Dordrecht, the Netherlands: Kluwer Academic Publishers, 119–153.Grime JP. 2006. Trait convergence and trait divergence in herbaceous plant
communities: mechanisms and consequences. Journal of Vegetation Science 17:255–260.
Hertel D, Leuschner C, H€olschner D. 2003. Size and structure of fine root
systems in old-growth and secondary tropical montane forests (Costa Rica).
Biotropica 35: 143–153.Hiiesalu I, €Opik M, Metsis M, Lilje L, Davidson J, Vasar M, Moora M, Zobel
M, Wilson SD, P€artel M. 2012. Plant species richness belowground: higher
richness and new patterns revealed by next-generation sequencing.MolecularEcology 21: 2004–2016.
Hodge A. 2004. The plastic plant: root responses to heterogeneous supplies of
nutrients. New Phytologist 162: 9–24.Hutchings MJ, de Kroon H. 1994. Foraging in plants: the role of morphological
plasticity in resource acquisition. Advances in Ecological Research 25: 159–238.Hutchings MJ, John EA, Wiljesinghe DK. 2003. Toward understanding the
consequences of soil heterogeneity for plant populations and communities.
Ecology 84: 2322–2334.Jackson RB, Manwaring JH, Caldwell MM. 1990. Rapid physiological
adjustment of roots to localized soil enrichment. Nature 344: 58–60.Jackson RB, Mooney HA, Schulze ED. 1997. A global budget for fine root
biomass, surface area, and nutrient contents. Proceedings of the NationalAcademy of Sciences, USA 94: 7362–7366.
Jaeger C, Gessler A, Biller S, Rennenberg H, Kreuzwieser J. 2009. Differences in
C metabolism of ash species and provenances as a consequence of root oxygen
deprivation by waterlogging. Journal of Experimental Botany 60: 4335–4345.Jones FA, Erickson DL, Bernal MA, Berminham E, Kress WJ, Herre EA,
Muller-Landau HC, Turner BL. 2011. The roots of diversity: belowground
species richness and rooting distributions in a tropical forest revealed by DNA
barcodes and inverse modeling. PLoS ONE 6: e24506.
Kardol P, Souza L, Classen AT. 2013. Resource availability mediates the
importance of priority effects in plant community assembly and ecosystem
function. Oikos 122: 84–94.Kembel SW, Cahill JF Jr. 2005. Plant phenotypic plasticity belowground: a
phylogenetic perspective on root foraging tradeoffs. American Naturalist 166:216–230.
Kembel SW, Cowan PD, Helmus MR, Cornwell WK, Morlon H, Ackerly DD,
Blomberg SP, Webb CO. 2010. Picante: R tools for integrating phylogenies
and ecology. Bioinformatics 26: 1463–1464.
Kembel SW, de Kroon H, Cahill JF Jr, Mommer L. 2008. Improving the scale
and precision of hypotheses to explain root foraging ability. Annals of Botany101: 1295–1301.
Kesanakurti PR, Fazekas AJ, Burgess KS, Percy DM, Newmaster SG, Graham
SW, Barrett SCH, Hajibabaei M, Husband BC. 2011. Spatial patterns of
plant diversity below-ground as revealed by DNA barcoding.Molecular Ecology20: 1289–1302.
Kress WJ, Wurdack KJ, Zimmer EA, Weigt LA, Janzen DH. 2005. Use of DNA
barcodes to identify flowering plants. Proceedings of the National Academy ofSciences, USA 102: 8369–8374.
de Kroon H. 2007.How do roots interact? Science 318: 1562–1563.de Kroon H, Hendriks M, van Ruijven J, Ravenek J, Padilla FM, Jongejans E,
Visser EJW, Mommer L. 2012. Root responses to nutrients and soil biota:
drivers of species coexistence and ecosystem productivity. Journal of EcologySpecial Centenary Feature 100: 6–15.
de Kroon H, Mommer L. 2006. Root foraging theory put to the test. Trends inEcology and Evolution 21: 113–116.
de Kroon H, Mommer L, Nishiwaki A. 2003. Root competition: towards a
mechanistic understanding. In: de Kroon H, Visser EJW, eds. Root Ecology.Ecol. Stud., Vol. 168. Berlin, Germany: Springer, 215–234.
Lambers H, Mougel C, Jaillard B, Hinsinger P. 2009. Plant–microbe–soilinteractions in the rhizosphere: an evolutionary perspective. Plant and Soil 321:83–115.
Lambers H, Poorter H. 1992. Inherent variation in growth rate between higher
plants: a search for physiological causes and ecological consequences. Advancesin Ecological Research 23: 187–261.
Lang C, Dolynska A, Finkeldey R, Polle A. 2010. Are beech (Fagus sylvatica)roots territorial? Forest Ecology and Management 260: 1212–1217.
Lei P, Scherer-Lorenzen M, Bauhus J. 2012. The effect of tree species diversity
on fine-root production in a young temperate forest. Oecologia 169: 1105–1115.
Leuschner HC, Hertel D, Coners H, B€uttner V. 2001. Root competition
between beech and oak: a hypothesis. Oecologia 126: 276–284.Loreau M, Hector A. 2001. Partitioning selection and complementarity in
biodiversity experiments. Nature 412: 72–76.Maron JL, Marler M, Klironomos JN, Cleveland CC. 2011. Soil fungal
pathogens and the relationship between plant diversity and productivity.
Ecology Letters 14: 36–41.McNickle GG, Cahill JF. 2009. Plant root growth and the marginal value
theorem. Proceedings of the National Academy of Sciences, USA 106: 4747–4751.McNickle GG, St Clair CC, Cahill JF Jr. 2009. Focusing the metaphor: plant
root foraging behaviour. Trends in Ecology and Evolution 24: 419–426.Meinen C, Hertel D, Leuschner C. 2009. Biomass and morphology of fine root
in temperate broad-leaved forest differing in tree species diversity: is there
evidence of below-ground overyielding? Oecologia 161: 99–111.Mommer L, van Ruijven J, de Caluwe H, Smit-Tiekstra AE, Wagemaker CAM,
Ouborg NJ, B€ogemann GM, van der Weerden GM, Berendse F, de Kroon H.
2010. Unveiling below-ground species abundance in a biodiversity experiment:
a test of vertical niche differentiation among grassland species. Journal ofEcology 98: 1117–1127.
Montagnoli A, Terzaghi M, Di Iorio A, Scippa GS, Chiatante D. 2012. Fine-
root morphological and growth traits in a Turkey-oak stand in relation to
seasonal changes in soil moisture in the Sourthern Apenines, Italy. EcologicalResearch 27: 1015–1025.
Mou P, Mitchell RJ, Jones RH. 1997. Root distribution of two tree species under
a heterogeneous nutrient environment. Journal of Applied Ecology 34: 645–656.Mueller KE, Tilman GD, Fornara DA, Hobbie SE. 2013. Root depth
distribution and the diversity-productivity relationship in a long-term grassland
experiment. Ecology 94: 787–793.Neatrour MA, Jones RH, Golladay SW. 2007. Response of three floodplain tree
species to spatial heterogeneity in soil oxygen and nutrients. Journal of Ecology95: 1274–1283.
O’Brien EE, Brown JS, Moll JD. 2007. Roots in space: a spatially explicit model
for below-ground competition in plants. Proceeding of the Royal Society. B 274:
929–935.Oksanen J, Kindt R, Legendre P, O’Hara B, Simpson GL, Solymos P, Henry
M, Stevens H, Wagner H. 2008. Vegan: community ecology package.
� 2014 The Authors
New Phytologist� 2014 New Phytologist TrustNew Phytologist (2014)
www.newphytologist.com
NewPhytologist Research 11

R package ver. 1.15. [WWW document] URL http://CRAN.R-project.org/
package=vegan [accessed 10 August 2009].€Opik M, Vanatoa A, Vanatoa E, Moora M, Davison J, Kalwij JM, Reier €U,Zobel M. 2010. The online database MaarjAM reveals global and ecosystemic
distribution patterns in arbuscular mycorrhizal fungi (Glomeromycota). NewPhytologist 188: 223–241.
Ostonen I, Helmisaari H, Borken W, Tedersoo L, Kukum€agi M, Bahram M,
Lindroos A, N€ojd P, Uri V, Meril€a P et al. 2011. Fine root foraging strategiesin Norway spruce forests across a European climate gradient. Global ChangeBiology 17: 3620–3632.
Parent C, Capelli N, Berger A, Cr�evecoeur M, Dat JF. 2008. An overview of
plant responses to soil waterlogging. Plant Stress 2: 20–27.Peres-Neto PR, Legendre P, Dray S, Borcard D. 2006. Variation partitioning of
species data matrices: estimation and comparison of fractions. Ecology 87:2614–2625.
Phillips RP, Fahey TJ. 2005. Patterns of rhizosphere carbon flux in sugar maple
(Acer saccharum) and yellow birch (Betula allegheniensis) saplings. GlobalChange Biology 11: 983–995.
Phillips RP, Fahey TJ. 2006. Tree species and mycorrhizal associations influence
the magnitude of rhizosphere effects. Ecology 87: 1302–1313.Poot P, Lambers H. 2003. Are trade-offs in allocation pattern and root
morphology related to species abundance? A congeneric comparison between
rare and common species in the south-western Australian flora. Journal ofEcology 91: 58–67.
Ravenek JM, Bessler H, Engels C, Scherer-Lorenzen M, Gessler A, Gockele A,
De Luca E, Temperton VM, Ebeling A, Roscher C et al. 2014. Long-termstudy of root biomass in a biodiversity experiment reveals shifts in diversity
effects over time. Oikos 123: 1528–1536.Robinson D. 1994. The responses of plants to non-uniform supplies of nutrients.
New Phytologist 127: 635–674.Robinson D. 1996. Resource capture by localised root proliferation: why do
plants bother? Annals of Botany 77: 179–185.Ruess RW, Hendrick RL, Burton AJ, Pregitzer KS, Sveinbjornss€on B, Allen
MF, Maurer GE. 2003. Coupling fine root dynamics with ecosystem carbon
cycling in a black spruce forest of interior Alaska. Ecological Monographs 73:643–662.
Schenk HJ. 2006. Root competition: beyond rsource depletion. Journal of Ecology94: 725–739.
Schenk HJ, Callaway RM, Mahall BE. 1999. Spatial root segregation: are plants
territorial? Advances in Ecological Research 28: 145–180.Schimel JP, Bennett J. 2004. Nitrogen mineralization: challenges of a changing
paradigm. Ecology 85: 591–602.Schmull M, Thomas FM. 2000.Morphological and physiological reactions of
young deciduous trees (Quercus robur L., Q. petraea [Matt.] Liebl., Fagussylvatica L.) to waterlogging. Plant and Soil 225: 227–242.
Schnitzer SA, Klironomos JN, HilleRisLambers J, Kinkel LL, Reich PB,
Xiao K, Rillig MC, Sikes BA, Callaway RM, Mangan SA et al. 2011.Soil microbes drive the classic plant diversity-productivity pattern. Ecology92: 296–302.
Schweitzer JA, Bailey JK, Fischer DG, Leroy CJ, Lonsdorf EV, Whitham
TG, Hart SC. 2008. Plant–soil–microorganism interactions: heritable
relationship between plant genotype and associated soil microorganisms.
Ecology 89: 773–781.Silva DCG, Carvalho MCCG, Ruas PM, Ruas CF, Medri ME. 2010. Evidence
of ecotypic differentiation between populations of the tree species
Parapiptadenia rigida due to flooding. Genetics and Molecular Research 9: 797–810.
Taggart JM, Cahill JF, McNickle GG, Hall JC. 2011.Molecular identification
of roots from a grassland community using size differences in fluorescently
labeled PCR amplicons of three cpDNA regions.Molecular Ecology Resources11: 185–195.
Taub DR, Goldberg D. 1996. Root system topology of plants from habitats
differing in soil resource availability. Functional Ecology 10: 258–264.Tilman D, Lehman CL, Thomson KT. 1997. Plant diversity and ecosystem
productivity: theoretical considerations. Proceedings of the National Academy ofSciences, USA 94: 1857–1861.
Tjoelker MG, Craine JM, Wedin D, Reich PB, Tilman D. 2005. Linking leaf
and root trait syndromes among 39 grassland and savannah species. NewPhytologist 167: 493–508.
Valverde-Barrantes OJ, Smemo KA, Feinstein LM, Kershner MW, Blackwood
CB. 2013. The distribution of below-ground traits is explained by intrinsic
species differences and intraspecific plasticity in response to root neighbours.
Journal of Ecology 101: 933–942.Violle C, Enquist BJ, McGill BJ, Jiang L, Albert CH, Hulshof C, Jung V,
Messier J. 2011. The return of the variance: intraspecific variability in
community ecology. Trends in Ecology and Evolution 27: 244–252.Wang H, Siopongcob J, Wadec LJ, Yamauchi A. 2009. Fractal analysis on root
systems of rice plants in response to drought stress. Environmental ExperimentalBotany 65: 338–344.
Wijesinghe DK, John EA, Hutchings MJ. 2005. Does patterns of soil resource
heterogeneity determine plant community structure? An experimental
investigation. Journal of Ecology 93: 99–112.Wilson SD. 2000.Heterogeneity, diversity and scale in plant communities. In:
Hutchings MJ, John EA, Stewart AJ, eds. The ecological consequences ofenvironmental heterogeneity. Oxford, UK: Blackwell, 53–69.
Xia MX, Guo DL, Pregitzer KS. 2010. Ephemeral root modules in Fraxinusmandshurica. New Phytologist 188: 1065–1074.
Zeller B, Dambrine E. 2011. Coarse particulate organic matter is the primary
source of mineral N in the topsoil of three beech forests. Soil Biology andBiochemistry 43: 542–550.
Supporting Information
Additional supporting information may be found in the onlineversion of this article.
Fig. S1 Clustering of dominant canopy tree species based onphylogenetic and functional traits in a deciduous temperateforest.
Table S1 Effects of root trait values on FRB
Table S2 Effects of species abundance on FRB
Table S3 Correlation matrix for diversity indices applied to rootsamples after species identification and trait measurement
Methods S1 Procedures for molecular analysis and diversity cal-culation of root samples.
Please note: Wiley Blackwell are not responsible for the contentor functionality of any supporting information supplied by theauthors. Any queries (other than missing material) should bedirected to the New Phytologist Central Office.
New Phytologist (2014) � 2014 The Authors
New Phytologist� 2014 New Phytologist Trustwww.newphytologist.com
Research
NewPhytologist12
Copyright © 2022 FDOKUMEN