Afghanistan Education Management Information System Data Analysis from Gender Perspective
37
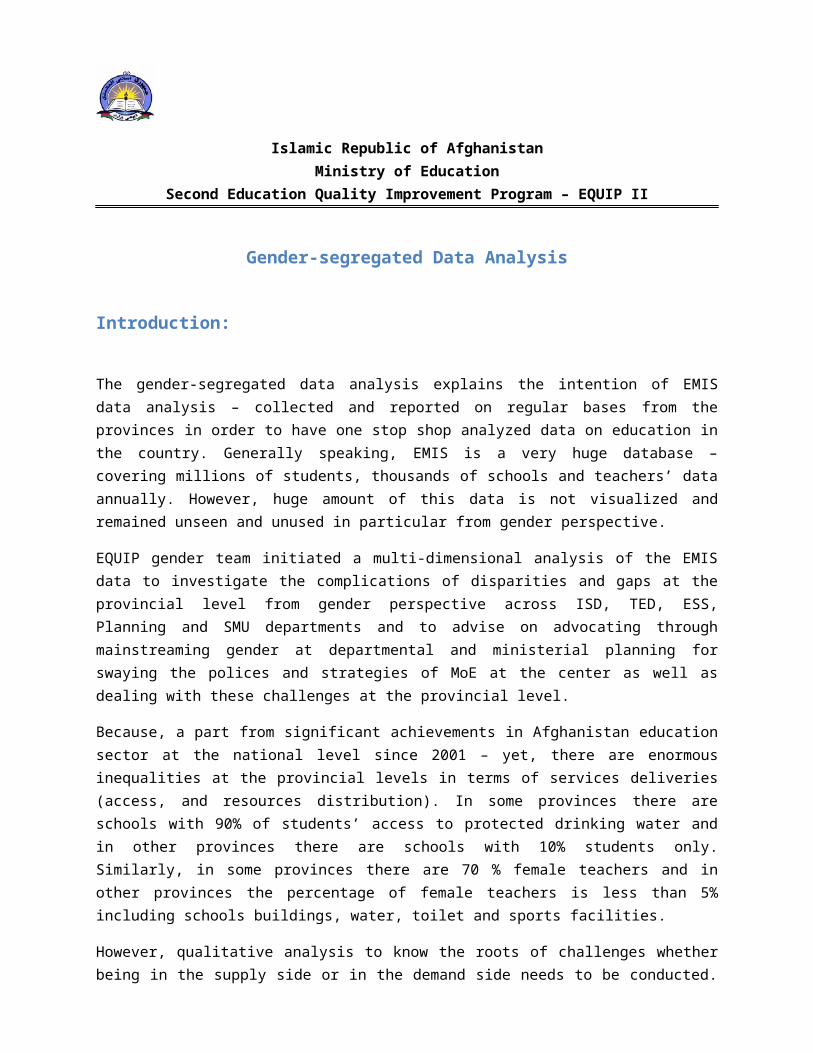
Islamic Republic of Afghanistan Ministry of Education Second Education Quality Improvement Program – EQUIP II Gender-segregated Data Analysis Introduction: The gender-segregated data analysis explains the intention of EMIS data analysis – collected and reported on regular bases from the provinces in order to have one stop shop analyzed data on education in the country. Generally speaking, EMIS is a very huge database – covering millions of students, thousands of schools and teachers’ data annually. However, huge amount of this data is not visualized and remained unseen and unused in particular from gender perspective. EQUIP gender team initiated a multi-dimensional analysis of the EMIS data to investigate the complications of disparities and gaps at the provincial level from gender perspective across ISD, TED, ESS, Planning and SMU departments and to advise on advocating through mainstreaming gender at departmental and ministerial planning for swaying the polices and strategies of MoE at the center as well as dealing with these challenges at the provincial level. Because, a part from significant achievements in Afghanistan education sector at the national level since 2001 – yet, there are enormous inequalities at the provincial levels in terms of services deliveries (access, and resources distribution). In some provinces there are schools with 90% of students’ access to protected drinking water and in other provinces there are schools with 10% students only. Similarly, in some provinces there are 70 % female teachers and in other provinces the percentage of female teachers is less than 5% including schools buildings, water, toilet and sports facilities. However, qualitative analysis to know the roots of challenges whether being in the supply side or in the demand side needs to be conducted.
Transcript of Afghanistan Education Management Information System Data Analysis from Gender Perspective
Islamic Republic of AfghanistanMinistry of Education
Second Education Quality Improvement Program – EQUIP II
Gender-segregated Data Analysis
Introduction:
The gender-segregated data analysis explains the intention of EMISdata analysis – collected and reported on regular bases from theprovinces in order to have one stop shop analyzed data on education inthe country. Generally speaking, EMIS is a very huge database –covering millions of students, thousands of schools and teachers’ dataannually. However, huge amount of this data is not visualized andremained unseen and unused in particular from gender perspective.
EQUIP gender team initiated a multi-dimensional analysis of the EMISdata to investigate the complications of disparities and gaps at theprovincial level from gender perspective across ISD, TED, ESS,Planning and SMU departments and to advise on advocating throughmainstreaming gender at departmental and ministerial planning forswaying the polices and strategies of MoE at the center as well asdealing with these challenges at the provincial level.
Because, a part from significant achievements in Afghanistan educationsector at the national level since 2001 – yet, there are enormousinequalities at the provincial levels in terms of services deliveries(access, and resources distribution). In some provinces there areschools with 90% of students’ access to protected drinking water andin other provinces there are schools with 10% students only.Similarly, in some provinces there are 70 % female teachers and inother provinces the percentage of female teachers is less than 5%including schools buildings, water, toilet and sports facilities.
However, qualitative analysis to know the roots of challenges whetherbeing in the supply side or in the demand side needs to be conducted.

Is it government failure – not providing equal services at theprovincial levels or there are other challenges from demand sidesincluding, lack of awareness and insecurity? In response to thesequestions, EQUIP Gender Team initiated the analysis of the EMIS datawhile targeting more than 35 indicators (

Dropout) and found huge disparities in terms of access and supply atthe provincial levels. However, there were some indicators that EMIScould not provide the data on, as those indicators are not added intothe formal data collection process of EMIS (see Annex B: List ofindicators not covered by EMIS).
In this regard, Gender Unit initiated to design and conduct 5qualitative and quantitative studies on 1) over-age teachers andfemale teacher’s pregnancies to understand that how many over-ageteachers will retire in upcoming 3 to 5 years and what are thefrequencies of the pregnancies among the overall female teachers inAfghanistan and how it effects their career (teaching in particular),2) School Dropout study - to understand school dropouts and assist thedevelopment of remedial – preventative measures and re-entrystrategies, 3) Gender and ESS study to look into gender and ESSmainstreaming in the planning, 4) Female participation in SchoolManagement Study1 and assisting in 5) Sub-national Governance Study2.
The purposes of all these research studies are to understand “WHY”situation within each and every indicator of quantitative dataanalysis. For example, why in Badghis there are 90 % schools with noaccess to protected drinking water? Why in Helmand, Zabul and Badghisthere are less than 5 % female teachers? Why dropout increases insenior grades for both boys and girls – In each one million students0.8 million leave schools. Etc.
The EMIS quantitative data will tell us the figures but no logicalexplanations for why? The abovementioned qualitative studies will helpus in understanding the logical explanations and would let us know thebest applicable solutions (evidence based recommendations). Inaddition, the analysis will discuss the concept of the Gender
1 The study seeks to determine the benefits of female participation in schoolmanagement shuras 1) The extent to which female participation in school shurasis meaningful, i.e., affecting decision-making of the shura as a whole; 2) Anypersonal or community gains from female participation in school shuras; and 3)Suggestions for improvement of shura processes vis-a-vis female participationas well as for broader improvement of shura processes. The findings of thisstudy will inform future EQUIP and MoE school shura planning and programming.
2 Sub-national governance study was initiated by EQUIP and funded by WorldBank. The study is assigned to Altai Consultancy firm and is in initial stageof pilot phase. EQUIP Gender team is a part of the technical Advisorycommittee.

taskforce that will help in understanding the process of gendermainstreaming. These analysis will as well deliberate the objectivesof the taskforce that how Gender department identifies gender baseddisparities at the taskforce, how each concerned departmentunderstands the challenges and mainstream the coping strategies toovercome these challenges and enhance their planning and servicesdeliveries equitably at the provincial level (Annex B: GenderTaskforce).
Recommendations:
Formation of Gender Core group and Gender Taskforce Annual statistical year book publications Advocacy for data rationalization to make sure that required
responses are placed to overcome these challenges by Ministry ofEducation in particular to Planning Department
Data Explanation:
Schools allocation at provincial levels:
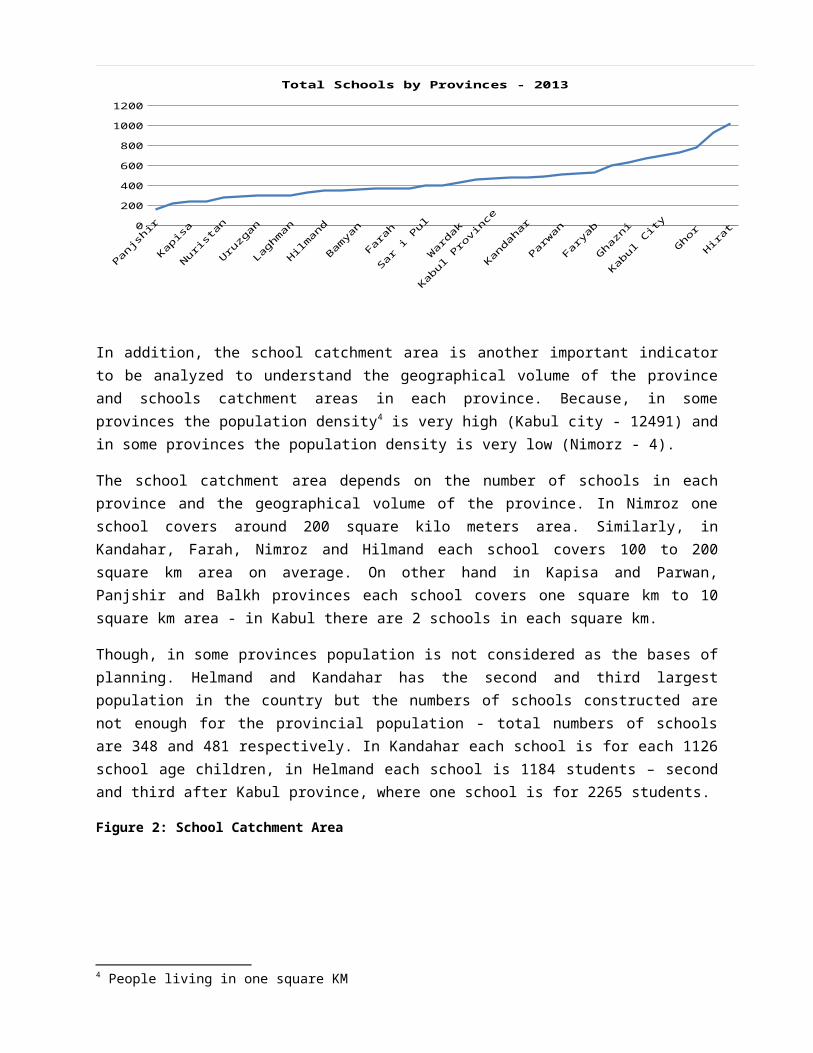
Figure 1 explains the uneven distribution of schools at provinciallevels. As per the EMIS data 2013, there are total of 16,094 schoolsin Afghanistan - Hirat, Nangarhar, Ghor, Badakhshan and Kabul cityhave average 833 schools per province and in Panjshir, Nimroz, Kapisa,Zabul and Nuristan there are on average 228 schools per province.
Number of schools for each province depends on the overall populationof the provinces. Generally speaking, the highest is the populationthe highest is the number of school per province. For example,Nuristan and Panjshir has the lowest population and Kabul city has thehighest population in the country 143,200, 148,600 and 3,435,000respectively3. However, there is no standard value available at MoEthat how one school should cover how many students at primary,secondary and upper secondary levels. This value differs at theprovincial levels.
Figure 1: Total General Education Schools by Provinces 1392
3 Central Statistic Officer (CSO) Statistical Year book 2013/14
Panjshir
Kapisa
Nuristan
Uruzgan
Laghman
Hilmand
Bamyan
Farah
Sar i Pul
Wardak
Kabul Province
Kandahar
Parwan
Faryab
Ghazni
Kabul City
Ghor
Hirat0
200
400
600
800
1000
1200
Total Schools by Provinces - 2013
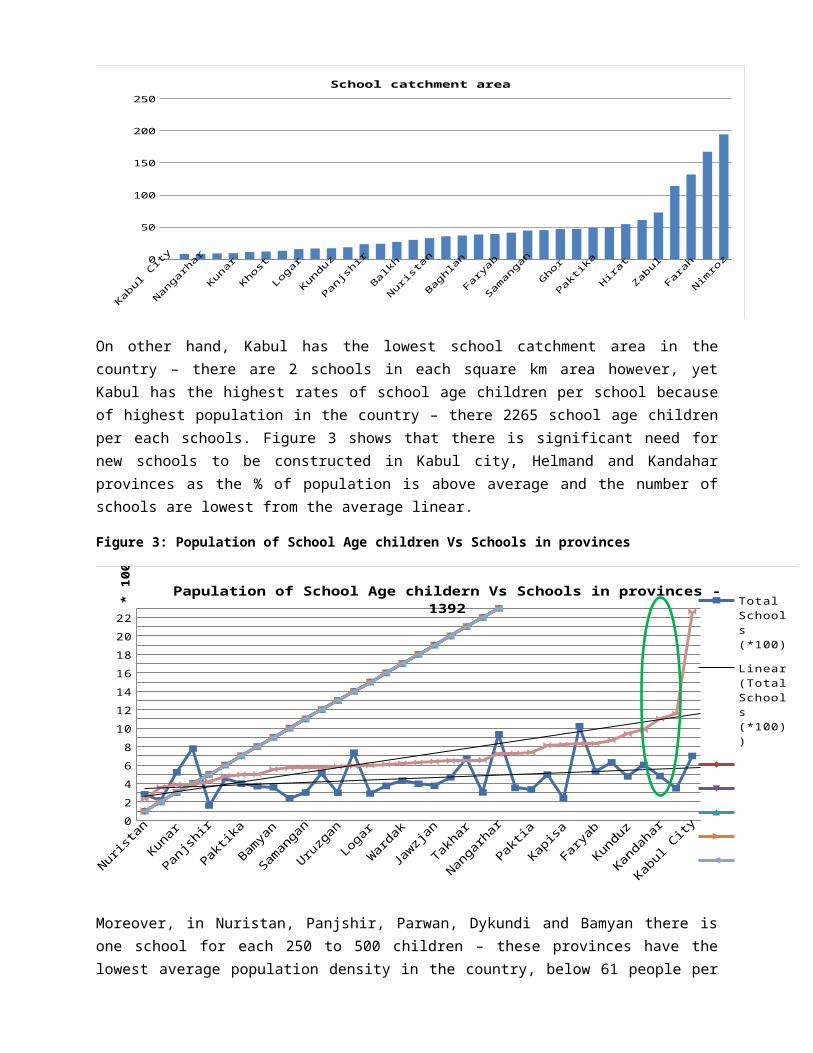
In addition, the school catchment area is another important indicatorto be analyzed to understand the geographical volume of the provinceand schools catchment areas in each province. Because, in someprovinces the population density4 is very high (Kabul city - 12491) andin some provinces the population density is very low (Nimorz - 4).
The school catchment area depends on the number of schools in eachprovince and the geographical volume of the province. In Nimroz oneschool covers around 200 square kilo meters area. Similarly, inKandahar, Farah, Nimroz and Hilmand each school covers 100 to 200square km area on average. On other hand in Kapisa and Parwan,Panjshir and Balkh provinces each school covers one square km to 10square km area - in Kabul there are 2 schools in each square km.
Though, in some provinces population is not considered as the bases ofplanning. Helmand and Kandahar has the second and third largestpopulation in the country but the numbers of schools constructed arenot enough for the provincial population - total numbers of schoolsare 348 and 481 respectively. In Kandahar each school is for each 1126school age children, in Helmand each school is 1184 students – secondand third after Kabul province, where one school is for 2265 students.
Figure 2: School Catchment Area
4 People living in one square KM
Kabul City
Nangarhar
Kunar
Khost
Logar
Kunduz
Panjshir
Balkh
Nuristan
Baghlan
Faryab
Samangan
Ghor
Paktika
Hirat
Zabul
Farah
Nimroz
0
50
100
150
200
250School catchment area
On other hand, Kabul has the lowest school catchment area in thecountry – there are 2 schools in each square km area however, yetKabul has the highest rates of school age children per school becauseof highest population in the country – there 2265 school age childrenper each schools. Figure 3 shows that there is significant need fornew schools to be constructed in Kabul city, Helmand and Kandaharprovinces as the % of population is above average and the number ofschools are lowest from the average linear.
Figure 3: Population of School Age children Vs Schools in provinces
Nuristan
Kunar
Panjshir
Paktika
Bamyan
Samangan
Uruzgan
Logar
Wardak
Jawzjan
Takhar
Nangarhar
Paktia
Kapisa
Faryab
Kunduz
Kandahar
Kabul City
02468
10121416182022
Papulation of School Age childern Vs Schools in provinces -1392 Total
Schools (*100)
Linear (Total Schools (*100))
* 100
Moreover, in Nuristan, Panjshir, Parwan, Dykundi and Bamyan there isone school for each 250 to 500 children – these provinces have thelowest average population density in the country, below 61 people per
square km (Nuristan has the second lowest population density in thecountry). In Takhar, Balkh, Logar, Kunar, Paktia, Laghman, Parwan,Kanduz, Khost, Kabul province, Kapisa and Nangarhar have secondhighest population density above the average of 61. Kabul city has thehighest 12491.
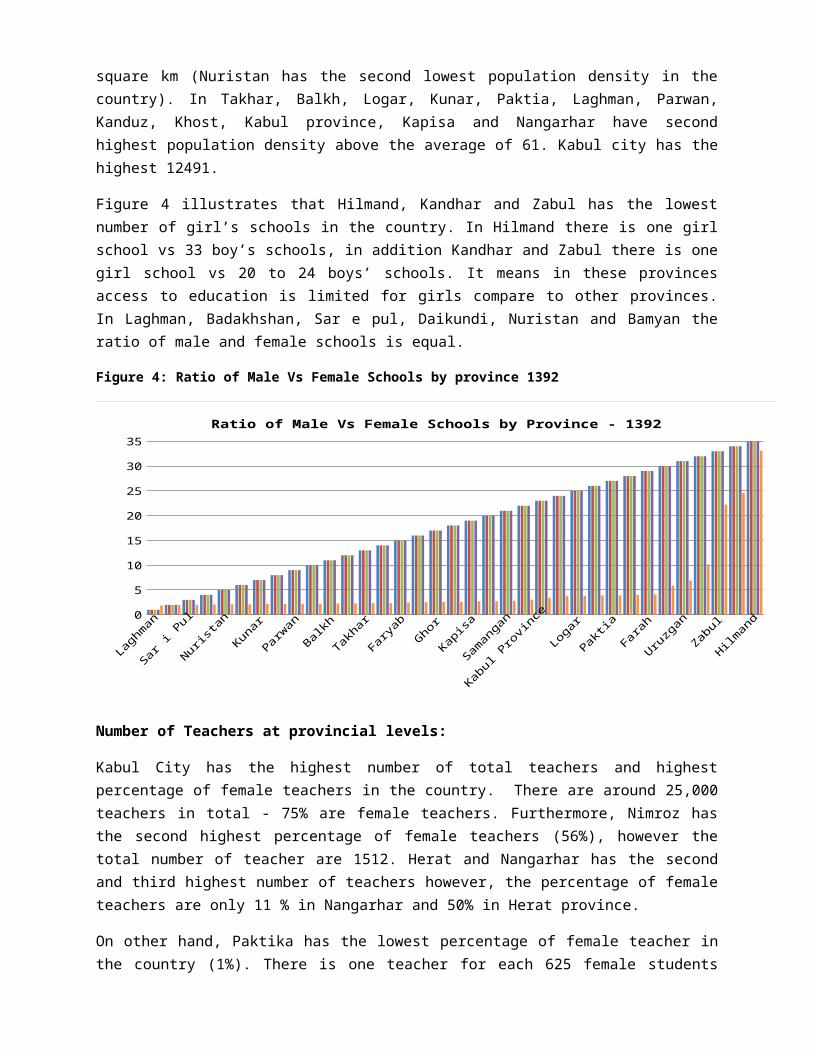
Figure 4 illustrates that Hilmand, Kandhar and Zabul has the lowestnumber of girl’s schools in the country. In Hilmand there is one girlschool vs 33 boy’s schools, in addition Kandhar and Zabul there is onegirl school vs 20 to 24 boys’ schools. It means in these provincesaccess to education is limited for girls compare to other provinces.In Laghman, Badakhshan, Sar e pul, Daikundi, Nuristan and Bamyan theratio of male and female schools is equal.
Figure 4: Ratio of Male Vs Female Schools by province 1392
Laghman
Sar i Pul
Nuristan
Kunar
Parwan
Balkh
Takhar
Faryab
Ghor
Kapisa
Samangan
Kabul Province
Logar
Paktia
Farah
Uruzgan
Zabul
Hilmand0
5
10
15
20
25
30
35Ratio of Male Vs Female Schools by Province - 1392
Number of Teachers at provincial levels:
Kabul City has the highest number of total teachers and highestpercentage of female teachers in the country. There are around 25,000teachers in total - 75% are female teachers. Furthermore, Nimroz hasthe second highest percentage of female teachers (56%), however thetotal number of teacher are 1512. Herat and Nangarhar has the secondand third highest number of teachers however, the percentage of femaleteachers are only 11 % in Nangarhar and 50% in Herat province.
On other hand, Paktika has the lowest percentage of female teacher inthe country (1%). There is one teacher for each 625 female students

(see figure 6) in addition to Khost, Paktia, Kunar, Urzgan, Wardak,Ghor, Laghman and Zabul have less than 10% female teachers. There are20 provinces where female teachers percentage is 1/3 – on average 12%,11 provinces average 33% teachers are female and only 4 provincesabove 50 % with average of 59% female teachers.
Figure 5: Number of Total General Education Teachers and % of Female Teachersper Province-1392
Zabul
Nuristan
Nimroz
Badghis
HilmandLogar
Sar i Pul
PaktikaKunar
Wardak
Jawzjan
Kandahar
Parwan
Kunduz
Takhar
Badakhshan
Nangarhar
Kabul City
-
5,000
10,000
15,000
20,000
25,000 Number of Total General Education Teachers and % of
Female Teachers per Province-1392FemaleMale
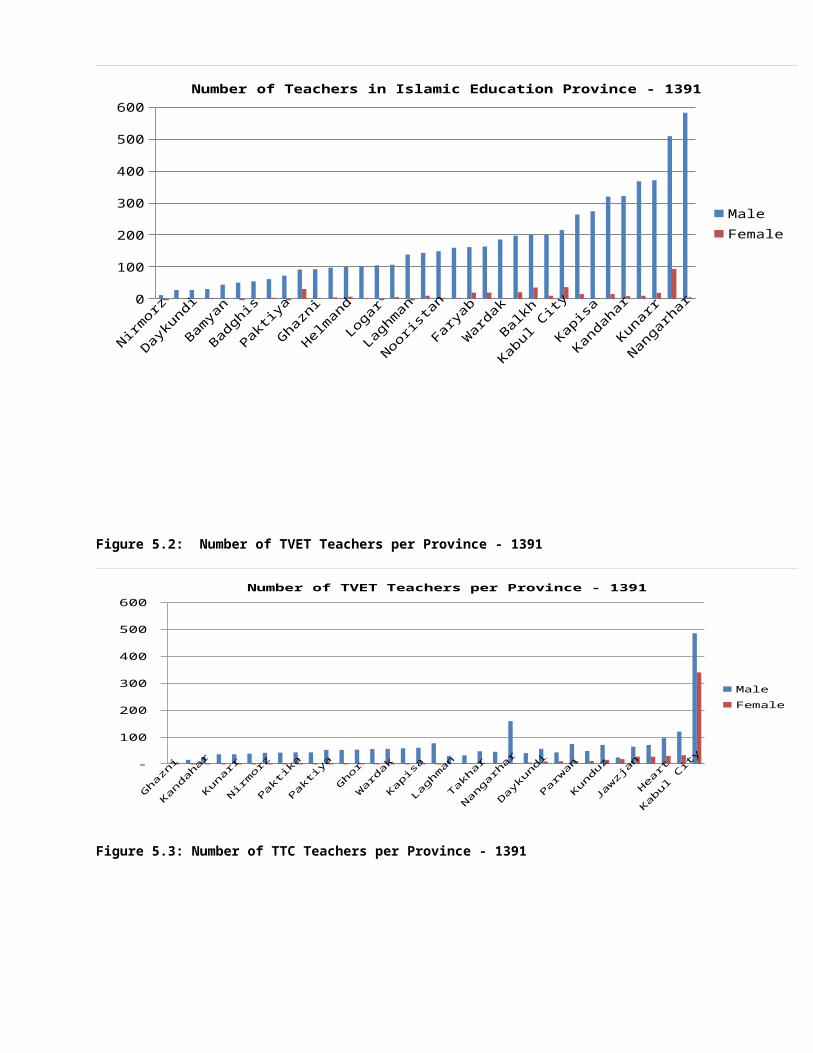
Figure 5.1: Number of Teachers in Islamic Education Province - 1391
Nirmorz
Daykundi
Bamyan
Badghis
Paktiya
Ghazni
Helmand
Logar
Laghman
Nooristan
Faryab
Wardak
Balkh
Kabul City
Kapisa
Kandahar
Kunarr
Nangarhar0
100
200
300
400
500
600Number of Teachers in Islamic Education Province - 1391
MaleFemale
Figure 5.2: Number of TVET Teachers per Province - 1391
Ghazni
Kandahar
Kunarr
Nirmorz
Paktika
Paktiya
Ghor
Wardak
Kapisa
Laghman
Takhar
Nangarhar
Daykundi
Parwan
Kunduz
Jawzjan
Heart
Kabul City -
100
200
300
400
500
600 Number of TVET Teachers per Province - 1391
MaleFemale
Figure 5.3: Number of TTC Teachers per Province - 1391

Uruzgan
Zabul
Paktika
Khost
Paktiya
Kabul Province
Logar
Kunarr
Farah
Samangan
Helmand
Sar e Pul
Baghlan
Nangarhar
Faryab
Badakhshan
Heart
Kabul City -
20
40
60
80
100
120
140 Number of TTC Teachers per Province - 1391
MaleFemale
Figure 5.4: Number of Literacy Teachers per Province - 1391
Paktiya
Khost
Laghman
Kunarr
Kunduz
Parwan
Logar
Kapisa
Faryab
Nangarhar
Samangan
Helmand
Ghazni
Kabul Province
Kandahar
Farah
Heart
Kabul City -
50
100
150
200
250
300
350 Number of Literacy Teachers per Province - 1391
MaleFemale
According to figure 6 - Kabul city has the lowest female student andfemale teacher’s ratio 25:1 and Paktika has the highest female studentand female teacher ratio 625:1, In addition Khost has second highestratio 556:1, Kunar and laghaman has the third and fourth highestration 387:1 and 306:1 respectively - which shows huge provincialdisparity in terms of female students and female teachers ratio.However, this ratio is not calculated per grade.
Female teachers and female student’s ratio at upper secondary gradesare significant to be analyzed, as in upper secondary grades thegirls’ age reach to average of 18 to 25 and in those senior gradesfemale teachers might be more preferable for rural girl’s families. Inthis regards, the school dropout study5 will further clarify the
5 By MoE through OSDR (will be published in March 2015)

perception of female students and their families – if female teachersare preferable at the upper secondary grades?
Figure 6: Female Students Vs Female Teachers Ratio at provincial levels - 1392
Kabul City
Balkh
Jawzjan
Kabul Province
Badakhshan
Kunduz
Hilmand
Sar i Pul
Kandahar
Parwan
Bamyan
Badghis
Logar
Uruzgan
Wardak
Ghor
Kunar
Paktika0
100200300400500600700
Female Students Vs Female Teachers Ratio at provincial levels - 1392
In Figure 6.1, Parwan has the lowest male students and male teachers’ratio 24:1 and Kabul has the highest male students and male teacher’sratio 96:1. As per figure 6, Kabul city had lowest female students andfemale teachers’ ratio but in terms of male students and maleteachers’ ratio – Kabul is on top. Per each teacher in Kabul city –there are 96 students and per each female teacher there are 25 girlsonly.
Figure 6.1: Male Students Vs Male Teachers Ratio at provincial levels - 1392

Parwan
Laghman
Kunar
Nuristan
Kapisa
Ghor
Faryab
Takhar
Zabul
Kunduz
Farah
Khost
Kabul Province
Jawzjan
Badghis
Samangan
Nimroz
Kabul City0
20
40
60
80
100
120M-student vs M- teachers ratio
In addition, Daikundi and Nimroz have the second and third highestmale students and male teachers’ ratio in the country. On other hand,Parwan and Laghman have the second and third lowest male students andmale teachers’ ratio. Though, in schools, female teachers teach manymale students in their classrooms and in many schools, male teachersteach female students. At the primary and secondary levels - theremight be much concerns however, at the upper secondary level – bothfemale students and female teachers’ and male students and maleteachers’ ratio must be at the average of 50:1.
Figure 6.2: Total Students Vs Total Teachers Ratio at provincial levels - 1392
Parwan
Baghlan
Wardak
Farah
Logar
Kabul City
Paktika
Nimroz
Kandahar
Nuristan
Kabul Province
Kunar
Hirat
Hilmand
Nangarhar
Uruzgan
Khost
Daikundi0
1020304050607080
Total-student vs Total teachers ratio
In above mentioned Figure (figure 6.2), Kabul city has the lowesttotal students and total teachers ratio (42:1) lower than the averageof 50:1. The lowest total students and total teachers’ ratio in the

country is at Parwan province 31:1 and the highest total students andtotal teachers’ ratio is in Daikundi province 71:1.
The maximum and minimum students and teacher Ratio is 45:1 to 55:1 inAfghanistan according to HR guidelines (Average Ratio is 50:1). At thenational level, the average ratio of total students and total teachersare 46:1. In 20 province the average total students and total teachersratio is 50:1 and in 15 provinces including Kabul city the averagetotal students and total teachers ratio is 39:1.
Figure 6.3 and 6.4 are calculated on average ratio of (50:1) for totalstudents and total teachers. This figure shoes that in some provincesthere are more teachers compare to total required teachers. Forexample, in Kabul city there are 3893 extra teachers in Badakhshan2460, Baghlan 2231, Parwan 2196, Balkh 1354, Takhar 1139, Faryab 1082and Wardak 995 total of 15350 extra teachers. In contrast, in someother provinces there are less teachers available then required numberof teachers. for example, in Dyakundi -996, Khost -512, Nangarhar -422, Samangan -316, Badghis -228, Paktia -109 and Uruzgan -104. Out oftotal 15350 teachers, there is need for 2687 teachers in provinceswith less teachers then actual number of required teachers andremaining 12663 teachers are required above the required number ofteachers.
However, this calculation is not logical to state that there are extra12663 teachers in Afghanistan. The scientific explanation is – torecruit more teachers at the national and provincial levels on theaverage of 30:1 ratio of total students and total teachers. Asprophecy, MoE requires total of 273457 teachers compare to currenttotal number of teachers 184048. Further 89409 teachers are requiredto be recruited to decrease the total students and total teachersratio to 30:1.
Figure 6.3: Extra Teachers Per Province (average Ratio of 50:1) – 1392

Zabul
Nuristan
Nimroz
Badghis
HilmandLogar
Sar i Pul
PaktikaKunar
Wardak
Jawzjan
Kandahar
Parwan
Kunduz
Takhar
Badakhshan
Nangarhar
Kabul City
-1000
0
1000
2000
3000
4000Extra teachers at Provinces (50:1) Ratio - 1392
Figure 6.4: Total Teachers Vs Total Required Teachers per Province - 1392
Zabul
Nuristan
Nimroz
Badghis
Hilmand
Logar
Sar i Pul
Paktika
Kunar
Wardak
Jawzjan
Kandahar
Parwan
Kunduz
Takhar
Badakhshan0
10002000300040005000600070008000900010000
Total Teachers Vs Total Required Teachers per Province - 1392
total teacher
required teachers
Figure 7 shows the total number of 12th grade students - Zabul has thelowest 12th grade students only 351 and Kabul city has the highestnumber of 12th grade students 59,526, Balkh and Herat has the second

and third highest numbers of 12th grade students 28,237 and 18,181respectively.
This means – there will be fewer students graduated in 1392 in Zabul,Nuristan, Uruzgan, Nimroz Paktika and Badghis provinces – total of7276 students per 8 provinces and average of 1039 students perprovince. Generally speaking, not all gradates in these provinces willpass the exams and not all students would become teachers after theirgraduation – thus it means that there are less chances of recruitinglocal teachers in these provinces to achieve the projected nationalratio of 30:1 students per teachers. If locally recruited teachers arenot found – it will be a challenge to transfer teachers from otherprovinces to these 8 provinces.
Figure 7: - Total Graduate Students by Province – 1392
Zabul
Uruzgan
Paktika
Panjshir
Farah
Logar
Kandahar
Samangan
Ghor
Khost
Bamyan
Faryab
Jawzjan
Parwan
Badakhshan
Baghlan
Hirat
Kabul City0
10000
20000
30000
40000
50000
60000
7000012 Grade Students by Province - 1392
FemaleMale
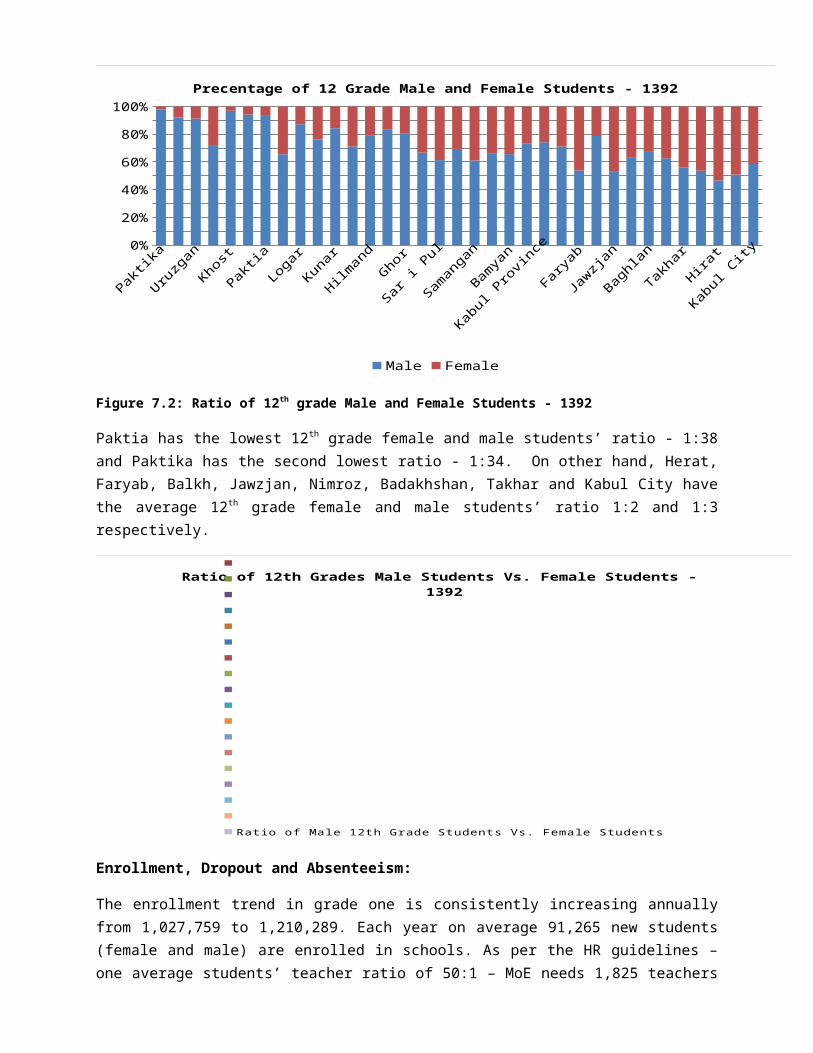
In addition, in Zabul province out of total of 351 students in grade12, only 7% are female Students. In Paktika only 2 % female studentsin grade 12 out of 1076. The highest percentage of female students ingrade 12 is in Heart 53%, Balkh 49%, Badakhshan 46%, Takhar 44% andKabul city 41%.
In Nangarhar, Kandahar and Helmand provinces, the 12th grade femalestudents’ percentage is average 19% despite being the major urbancenters and high populated provinces compare to Takhar, Ghazni, Faryaband Sar I Pul provinces.
Figure 7.1:- Total Graduate Students by Province – 1392
Paktika
Uruzgan
Khost
Paktia
Logar
Kunar
HilmandGhor
Sar i Pul
Samangan
Bamyan
Kabul Province
Faryab
Jawzjan
Baghlan
Takhar
Hirat
Kabul City0%
20%
40%
60%
80%
100%Precentage of 12 Grade Male and Female Students - 1392
Male Female
Figure 7.2: Ratio of 12th grade Male and Female Students - 1392
Paktia has the lowest 12th grade female and male students’ ratio - 1:38and Paktika has the second lowest ratio - 1:34. On other hand, Herat,Faryab, Balkh, Jawzjan, Nimroz, Badakhshan, Takhar and Kabul City havethe average 12th grade female and male students’ ratio 1:2 and 1:3respectively.
Ratio of 12th Grades Male Students Vs. Female Students - 1392
Ratio of Male 12th Grade Students Vs. Female Students
Enrollment, Dropout and Absenteeism:
The enrollment trend in grade one is consistently increasing annuallyfrom 1,027,759 to 1,210,289. Each year on average 91,265 new students(female and male) are enrolled in schools. As per the HR guidelines –one average students’ teacher ratio of 50:1 – MoE needs 1,825 teachers

for primary education each year. However, on the bases of averagestudents’ teacher ratio is 50:1 – MoE requires total of 169,164teachers in 1392 and MoE already had total of 184,042 teachers ingeneral education in 1392 – 14,878 more teachers then required.
Figure 8: Number of students in Grade 1 – 1389, 90 and 91
Total Students 1389 Total Students 1390 Total Students 1391 900,000
950,000
1,000,000
1,050,000
1,100,000
1,150,000
1,200,000
1,250,000 Total Students Grade 1 (Enrollment) by Year
Table 1: Number of students in all Grades – 1389, 90 and 91
Grade
Total Students1389
Total Students1390
Total Students1391
Teachers requiredper grade 1391
1 1,027,759 1,112,843 1,210,289 24,2062 998,739 1,058,837 1,222,974 24,4593 900,856 946,963 1,069,159 21,3834 861,749 878,658 964,261 19,2855 746,604 733,257 808,678 16,1746 661,429 655,325 696,221 13,9247 582,739 596,503 636,278 12,7268 481,573 472,465 509,101 10,1829 407,152 407,789 427,916 8,55810 252,675 360,707 373,200 7,46411 182,609 227,649 325,499 6,51012 133,772 166,557 214,626 4,293Total
7,237,656 7,617,553 8,458,202 169,164
Figure 8 and table 1 explains that there is need for more teachers inprimary and secondary levels and less teachers in upper secondarylevel. In addition, Table 1 shows the exact number of teachers for

each grade, for example 24,206 teachers are required for grade 1 and4,293 for grade 12.
Figure 9: Level of Education of Male and Female Teachers - 1392
Around 35% teachers in Afghanistan are only 12th grade pass. Inaddition, most of teachers with lowest education (primary, secondaryand 12th grade pass) are male teachers. However, as the level ofeducation increases the gap between male and fem ale teacher decrease.For example, there are more undergraduate female teachers compare tomale. But, teachers with master degree are less than 5% both femaleand male.
Primary
Secondary
12th Grade
14th Grade
undergraduate
Masters0
20
40
6080
100Level of Education of Male and Female Teachers - 1392
% of Male and Female Tachers Male % of Male and Female Tachers Female
Figure 9.1: % of Level of Education of Male and Female Teachers
% of Primary
% of Secondary
% of 12th Grade
% of 14th Grade
% of Bachelor
% of Masters
05
10152025303540
% of Male and Female Teachers/Level of Education
Male Female
Figure 10 and 10.1: Increasing Dropout from Grade 1 to 12

As the students’ enrollment increases annually – similarly, thestudents’ dropout also increases annually but in senior grades. Thedropout situation is similar from grade 3 to 6 and grade 7 to 12.Similarly, girls’ dropout also increases as girls inter into seniorgrades (See figure 19.2 and 10.3).
Grade 1 Grade 2 Grade 3 Grade 4 Grade 5 Grade 6 -
200,000 400,000 600,000 800,000
1,000,000 1,200,000 1,400,000
Increase in Students Dropout by Grade (Grade 1 to 6) - 1389 to 1391
FemaleFemale Total - 1391
In 1390 dropout decreased by some means compare to 1389, however,increased in 1391 from grade 4 to 6, though in same year the dropoutincreased considerably in grades 9 to 12 (parallel to girls’ dropout)
Grade 7 Grade 8 Grade 9 Grade 10 Grade 11 Grade 12 -
100,000 200,000 300,000 400,000 500,000 600,000 700,000
Increase in Students Dropout by Grade (Grade 7 to 12) - 1389 to 1391
FemaleFemale Total - 1391
In grade 9, 10, 11 and 12 the more dropouts observed compare tosecondary grades – however, the upcoming dropout study would furtherelaborate the qualitative aspect of the increased dropout in uppersecondary grades.
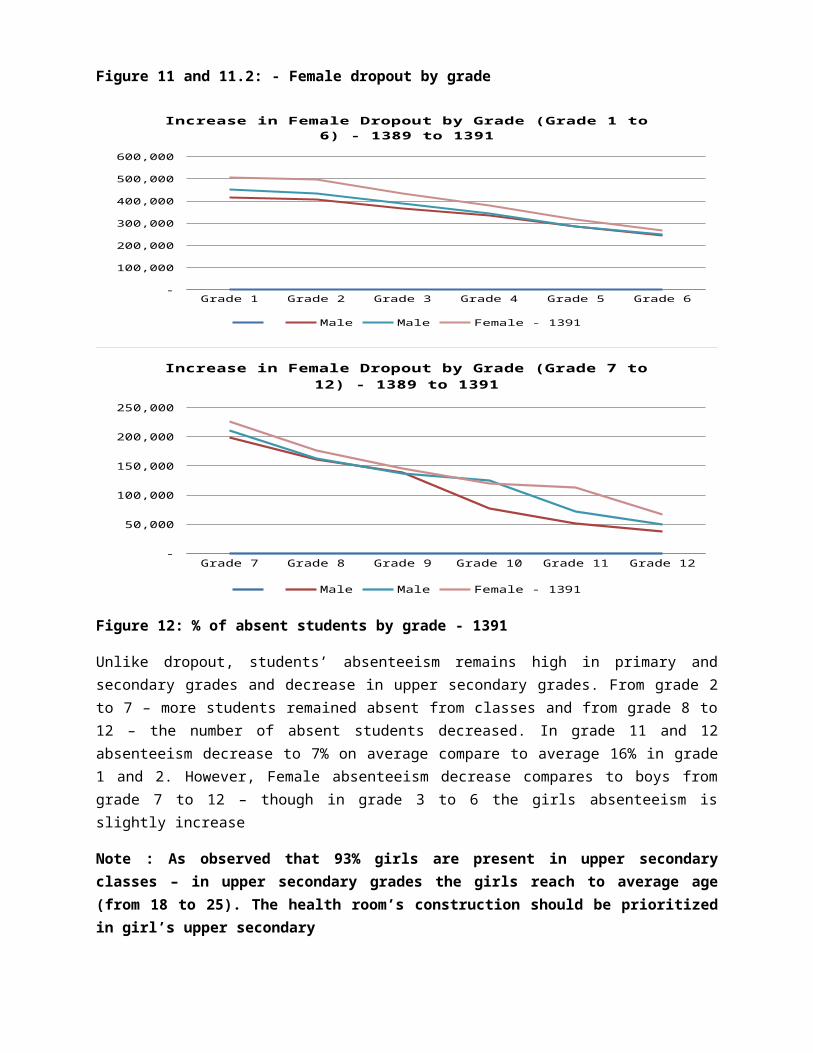
Figure 11 and 11.2: - Female dropout by grade
Grade 1 Grade 2 Grade 3 Grade 4 Grade 5 Grade 6 -
100,000
200,000
300,000
400,000
500,000
600,000
Increase in Female Dropout by Grade (Grade 1 to 6) - 1389 to 1391
Male Male Female - 1391
Grade 7 Grade 8 Grade 9 Grade 10 Grade 11 Grade 12 -
50,000
100,000
150,000
200,000
250,000
Increase in Female Dropout by Grade (Grade 7 to 12) - 1389 to 1391
Male Male Female - 1391
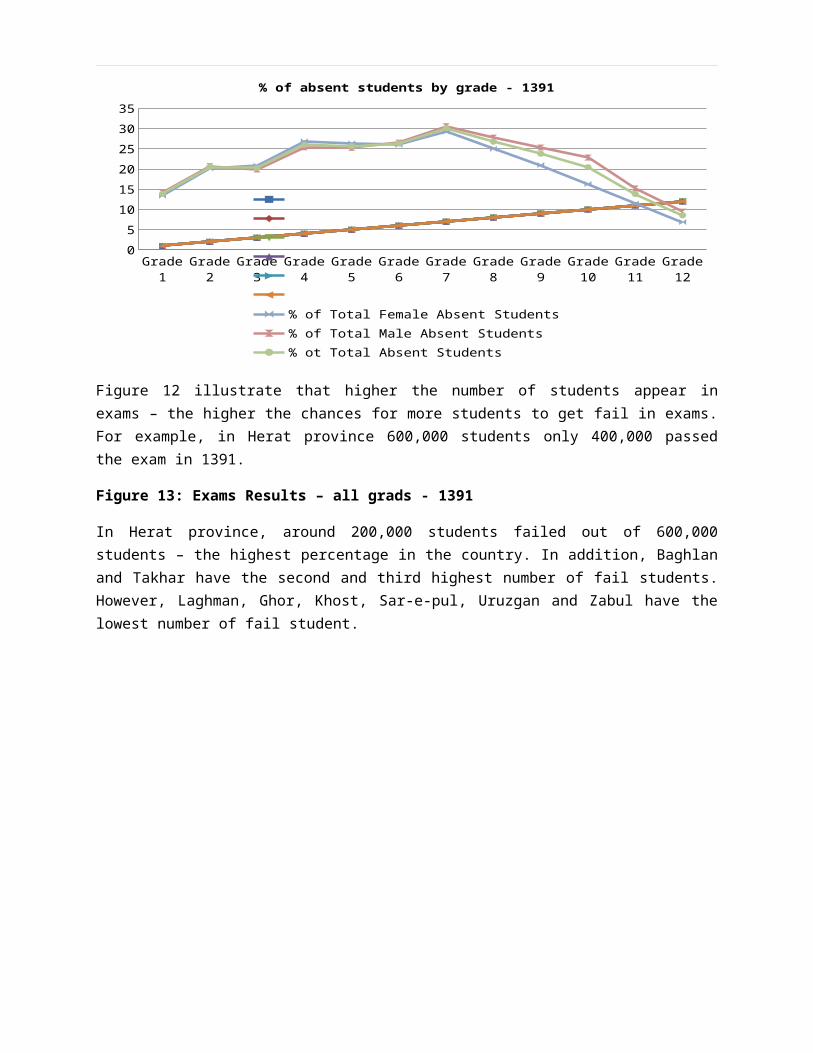
Figure 12: % of absent students by grade - 1391
Unlike dropout, students’ absenteeism remains high in primary andsecondary grades and decrease in upper secondary grades. From grade 2to 7 – more students remained absent from classes and from grade 8 to12 – the number of absent students decreased. In grade 11 and 12absenteeism decrease to 7% on average compare to average 16% in grade1 and 2. However, Female absenteeism decrease compares to boys fromgrade 7 to 12 – though in grade 3 to 6 the girls absenteeism isslightly increase
Note : As observed that 93% girls are present in upper secondaryclasses – in upper secondary grades the girls reach to average age(from 18 to 25). The health room’s construction should be prioritizedin girl’s upper secondary
Grade 1
Grade 2
Grade 3
Grade 4
Grade 5
Grade 6
Grade 7
Grade 8
Grade 9
Grade 10
Grade 11
Grade 12
05
101520253035
% of absent students by grade - 1391
% of Total Female Absent Students% of Total Male Absent Students% ot Total Absent Students
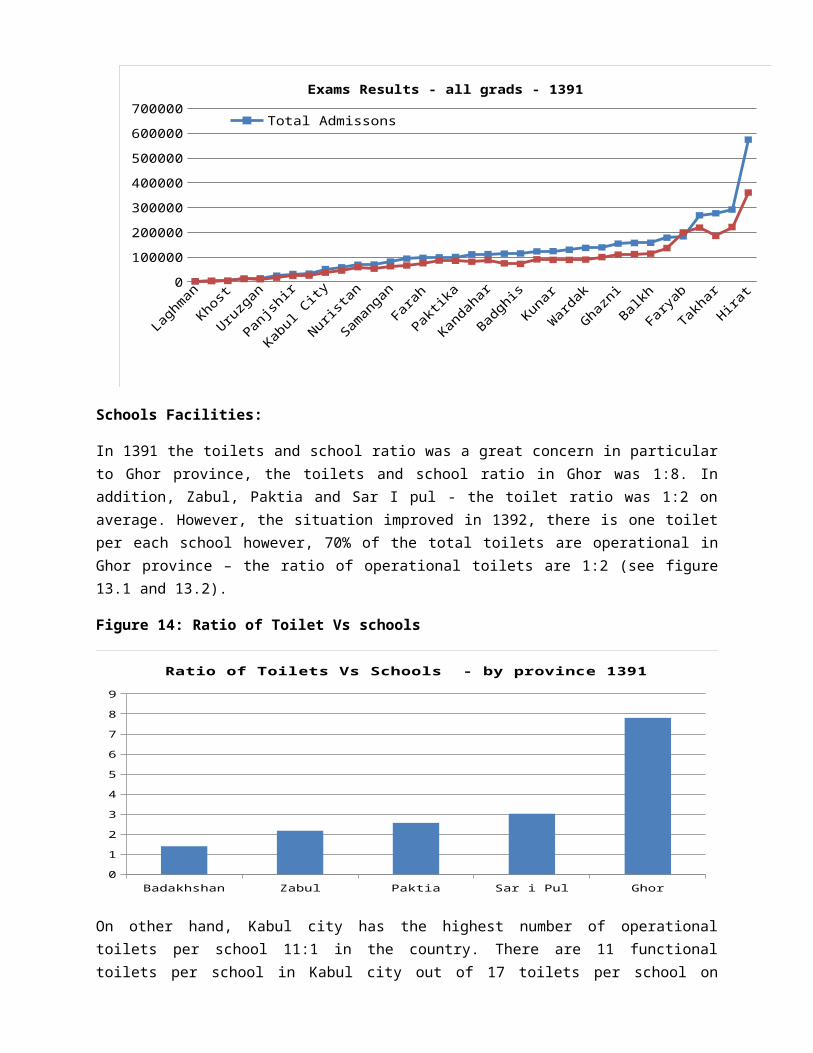
Figure 12 illustrate that higher the number of students appear inexams – the higher the chances for more students to get fail in exams.For example, in Herat province 600,000 students only 400,000 passedthe exam in 1391.
Figure 13: Exams Results – all grads - 1391
In Herat province, around 200,000 students failed out of 600,000students – the highest percentage in the country. In addition, Baghlanand Takhar have the second and third highest number of fail students.However, Laghman, Ghor, Khost, Sar-e-pul, Uruzgan and Zabul have thelowest number of fail student.
Laghman
Khost
Uruzgan
Panjshir
Kabul City
Nuristan
Samangan
Farah
Paktika
Kandahar
Badghis
Kunar
Wardak
GhazniBalkh
Faryab
TakharHirat
0100000200000300000400000500000600000700000
Exams Results - all grads - 1391
Total Admissons
Schools Facilities:
In 1391 the toilets and school ratio was a great concern in particularto Ghor province, the toilets and school ratio in Ghor was 1:8. Inaddition, Zabul, Paktia and Sar I pul - the toilet ratio was 1:2 onaverage. However, the situation improved in 1392, there is one toiletper each school however, 70% of the total toilets are operational inGhor province – the ratio of operational toilets are 1:2 (see figure13.1 and 13.2).
Figure 14: Ratio of Toilet Vs schools
Badakhshan Zabul Paktia Sar i Pul Ghor0
1
2
3
4
5
6
7
8
9
Ratio of Toilets Vs Schools - by province 1391
On other hand, Kabul city has the highest number of operationaltoilets per school 11:1 in the country. There are 11 functionaltoilets per school in Kabul city out of 17 toilets per school on

average – 6 toilets in each school in Kabul city are nonfunctional. InNooristan province there are only 76 operational toilets out of totalof 118 toilets for 225 schools. Similarly, in Ghor, Zabul and Daikundi– yet the ratio is 0:1.
Furthermore, figure 13.1 illustrates that there are 7 provinces whereeach school has 1 toilet, 9 other provinces has only 2 toilets perschool. Correspondingly, there is only toilet for each 211 students atnational level - similar for both boys and girls. Note: Identify theactual number of student in above provinces.
Figure 14.1: Operational toilets per school per province
Nooristan
Zabul
Paktika
Helmand
Badakhshan
Badghis
Nimroz
Paktiya
Takhar
Baghlan
Bamyan
Faryab
Jawzjan
Khost
Kandahar
Kapisa
Balkh
Kabul City0
20
40
60
80
100
120
140Operational toilets per school per province
Figure 14.2: % of schools with operational toilets
Figure 13.2 show that none of the 34 provinces has less than 50%nonfunctional toilets in the country. The lowest % of functionaltoilets in all provinces is 55% in Zabul, Paktika and Uruzganprovinces and highest 80% in Kapisa, Panjshir and Logar provinces.

Zabul
Uruzgan
Helmand
Bamyan
Sar e Pul
Faryab
Kandahar
Kunduz
Balkh
LaghmanGhor
Takhar
Samangan
Nangarhar
Ghazni
Nimroz
Logar
Kapisa
0102030405060708090
% of schools with operational toilets
Figure 15 and 15.1: Number of Schools – protected and non-protected wateraccess (%) – 1392
90% schools in Kabul City have access to protected drinking waterwhich is the highest percentage in the country. In addition, 80% ofschools in Kandahar, Helmand, Kabul province and Kunduz have access toprotected drinking water. However, in Ghor around 90% of the schoolsdo not have access and in Noristan, Daykundi and Saripul around 70 %schools do not have access to protected drinking water.

Ghor
DaykundiKunr
Kapisa
Panjshir
TakharKhost
Badakhshan
Zabul
Uruzgan
Paktiya
Laghmaan
Herat
Logar
Paktika
Kundoz
Helmand
Kabul City
0
20
40
60
80
100Number of Schools - protected and non-protected water
access (%) - 1392
% Protected Water% Nonprotected Water
In figure 14.1, 70% of schools in Badghis and Daykundi do not haveaccess to any sources of drinking water facilities. Around 50% ofschools in Zabul, Samangan, Kandahar, Paktika and Nimroz do not haveaccess. Furthermore, only 95 % schools in Ghor province have accessto drinking water but in 90% of schools the drinking water sources arenot protected. The crisis situation is in Badghis province, where 70 %of schools do not have access to any source of drinking waterfacilities.
Kabul City
Helmand
Faryab
Balkh
Kapisa
Kundoz
Jawzjan
Kunr
Bamyan
Takhar
Ghazni
Sar-e-pul
Fara
Paktiya
Nemroz
Kandahar
Zabul
Badghis0
1020304050607080
% of Schools with no water facilaties - 1392
Figure 16: Schools with Play Grounds – 1392

Majority of the schools in Balkh, Kabul Province and Logar have playgrounds however, majority of the schools in Daykundi, Badghis and Ghordo not have play grounds. Additionally, most of the schools atnational level do not have access to the required number of playgrounds – at least one play ground per school.
Panjshir
Zabul
Uruzgan
Kapisa
Laghman
Bamyan
Daykundi
Jawzjan
Paktika
Badghis
Kunarr
Parwan
Baghlan
Ghazni
BalkhGhor
Nangarhar
Herat0
40080012001600
Schools with Play Grounds - 1392
Total SchoolsSchools with grounds

Recommendations:
Schools
Schools allocation to provinces and districts should be decidedon the size of overall population of the province and district inparticular to the number of school age children – there is asignificant need for a standard mechanism for schools allocationto provinces and districts. For example, considering overallpopulation, population density to estimate school catchment areaand number of school age children leaving in each km and schoolcatchment area. In addition, the schools by levels (Primary,Secondary and Upper secondary) must be accessible topredetermined number of children.
In case of increase in population and the number of school agechildren in each school catchment areas – the second shift is thebest copying strategy to maintain absolute students/classroomratio and students/teachers ratio. In addition, the second shiftsin schools are applicable in the urban centers. However, in ruralareas, schools should be nearer to students’ homes in particularto girls’ students, as distance is one of the key challenges forincrease in school dropout.
Note: - In Kabul city, Helmand and Kandahar provinces, there isneed for more schools to be constructed in particular to girls’schools, because these provinces have highest population in thecountry and the number of schools are not sufficient to enrollall of the school age children within these provinces. InHelmand, Kandahar and Zabul, there is one girls’ school vs 22 to33 boys’ schools. Though, in Kabul city new schools buildingmight not be a suitable idea for long-term. If securitysituations improve in provinces – huge population mobility willtake place. For time being, second shifts in many schools inKabul will help in reducing the students/classroom and studentsand teachers ratio.
Add play grounds, Water and toilets annexes here

Teachers
If more schools are constructed as per the demands in theprovinces, the number of teachers would increase automatically atthe provincial and districts levels. Though, the allocation offemale teachers must be allocated as per the female students’numbers. For example, currently the female students and femaleteachers ratio is uneven at the provincial levels, in Kabul theratio is 25:1 and in Pakitka the ratio is 625:1. In Nangarhar,there are 11% female teachers out of total teachers however;there are 39 % female students in all grades out of totalstudents. In addition, Pakitka has the lowest number of femaleteachers only 1% where as there are 18% female students. Only in4 provinces there are above 50% female teachers, however, in 20provinces the female teachers percentage is 12% on average and in11 provinces the average female teachers’ percentage is 33 %.
Note: - MoE should take concrete steps to recruit more femaleteachers in the provinces where the female teachers percentage isbelow 50 and where female students and female teachers ratio isvery high. As in rural areas, the families concerns would bereduced, if female teachers are recruited at the upper secondarylevels for female students at the age of 18 to 25.
There are huge disparities among provinces in terms of totalstudents and total teachers ratio – in Parwan the ratio is 33:1and in Daykundi its 73:1. In some provinces, there are moreteachers then the actual required numbers of teachers and inother provinces there are less teachers then actual number ofrequired teachers. For example, in Kabul city there are 3,800extra teachers and in Daykundi there is need for 1,000, in Khost500 and in Nangarhar 400 more teachers are required.
Note: - Currently the MoE standard students and teachers ratio is45 to 55. As per this ratio, we have around 12,663 extra teachersin the country, so there is no need for more teachers’recruitment for upcoming 7 years, as the annual enrollment growthof students is around 91,000 students. However, MoE priority ison improving the quality of education, one of the basic

indicators for improving the quality of education in Afghanistanis to reduce the students and teachers ratio – if the ratio isstandard, 25 to 35 - there is need for additional 89,000teachers’ immediately in the country despite all 12,663 extrateachers. In addition, there is strong need for local teachers tobe haired in each province and districts because teachers’transfers from other provinces and districts will not besustainable approach and MoE has to pay more incentives totransferred teachers. However, there are no enough 12th gradegraduates in some provinces who could be haired as local teachersin the future. For example, in Zabul there are total of 351students in grade 12. Generally speaking, If there are fewerschools, less teachers, and fewer students in provinces, thereare challenges to find local qualified teachers as in case ofZabul.
To improve the quality of education, the teachers’ skills andcapacity development is significant. In this regards, MoE hasspent millions of dollars6 through Teachers Education Department(TED) to improve the teachers’ capacity and skills and level ofeducations.
Note: - 10 % of teachers are with primary education, 7% are withsecondary education and 35% are 12th grade pass in Afghanistan –most of them are male teachers. MoE should encourage maleteachers with lower level of education to join in-serviceTeachers Training Colleges (TTCs). In this case, MoE mustconsider Gender Equity to assist majority of the male teacherswith low level of education to get access to TTCs.
Dropout
School Dropout is a key concern – out of each one millionstudents only 20% complete full cycle of schooling and 80%students leave schools before entering in to grade 12 – why, notknown specifically. Generally speaking, there are multiplefactors behind school dropout both for boys and girls inAfghanistan both from supply and demand sides - for example onbroader intensity, poverty, unemployment, insecurity and culturalbarriers and on specific to MoE, its distance, lack of schools
6 Estimated 120 million dollars

buildings and other annexed facilities (toilets, drinking water,boundary walls etc), lack of qualified male and female teachers.
Note: - Increased in both boys and girls school dropout isobserved at secondary and upper secondary grades though with only7% absenteeism in grades 9 to 12 in particular to girls. In thisscenario – there is urgent need for more qualified femaleteachers to be recruited for upper secondary grades for girls’students in order to reduce girl students’ school dropout andabsenteeism.
In addition, in these grades, female students reach to age of 18to 25 on average. During this age, the change in physicalstructure of girls’ students requires availability of improvedfacilities in these grades such as, Health rooms in schools withqualified female teacher/mentor to educate girls in particular tomenstruation period. Furthermore, School Management Shuras toplay key role in enhancing interactions with societies to furthermotivate families to send girl students to schools in secondaryand upper secondary levels. The community mobilization approachshould be more specific in secondary and upper secondary grades.

Annex A: List of Indicators – data received from EMIS
1. Number of Male and Female Teachers as per their Level ofEducation
2. % of Male and Female Teachers by Level of Education3. % of Primary Male and Female Teachers4. % of Secondary Male and Female Teachers5. % of 12th Grade Male and Female Teachers6. % of 14th Grade Male and Female Teachers7. % of Undergraduate Male and Female Teachers8. % of Masters Male and Female Teachers9. Male 12th Grade Students vs. Female students – 139210. Number of students in Grade 1 – 1389, 90 and 9111. Male Students drop out by Grade 1 to 1212. Female students drop out by grade 1 to 1213. Ratio of Toilet Vs schools - toilets information by school
and province (last three years)14. Currently Graduate Students by Province – male and female
(last three years) 15. Total schools by province and program (three years)16. All Students by Grade (last three years)17. Drinking water information by schools and provinces (last
three years)18. Student Attendance by class and year (last three years)19. Students information by shift (Male and Female – last three
years)20. All male and female schools – joint schools21. Schools with boundary walls 22. Number of male and female teachers (proxy indicators -
Availability of female teachers at the province)23. Schools with sports grounds
List of Indicators – data did not available 1. Girls’ schools with security guards 2. Security and safety monitoring/measurements3. Schools with libraries

4. Schools with computer labs5. Schools with health room (for girls) 6. Schools with telephone connections 7. Schools with internet facilities (for emails)8. Teacher by age (male and female)
Annex B: Gender Taskforce
DRAFT TERMS OF REFERENCE EQUIP/MOE GENDER TASK FORCE (GTF)
I. INTRODUCTION
In 2004 the Government of Afghanistan (GoA) took the initiative tostrengthen its education sector by launching the Education QualityImprovement Program (EQUIP). The goal was to facilitate thedevelopment of vibrant human capital that can contribute productivelyto the reconstruction, economic growth and stability of the country.EQUIP is a National Priority Program executed by the MoE with WorldBank support, and is fully aligned with the government’s educationstrategy: NESP - 1389-1393 (2010-2014) and the Education Interim Plan– 2011-2013. After an initial start-up in four provinces, theprogram’s success led to its expansion in all 35 provinces. The SecondEducation Quality Improvement Project – EQUIP II, which began in March2008, is now in an Additional financing phase, from September 2012 toSeptember 2014, and is being implemented throughout the country.
II. OBJECTIVES OF EQUIP II:
The objective of EQUIP II is to increase equitable access to quality basiceducation, especially for girls, through school grants, teacher training andstrengthened institutional capacity, with support from communities andprivate providers.

To achieve the above objective EQUIP is committed to strengtheninggender institutionalization within the program, and related MoEdepartments. In this regard, EQUIP is taking several steps, includingestablishment of a Gender Unit with qualified staff to provide maximumsupport for gender integration in all program components and units.
III. BACKGROUND
Achieving gender equality has been identified as a one of the criticaloutcome nationally in Afghanistan. MoE has a particularly strategicrole as it is tasked with producing educated, skilled cadres of womenand men who can help achieve national targets across all sectors.Despite impressive gains in girl child enrollment, ( which is about43%) many important gender issues like equality, equity,discrimination are yet to be addressed, with wide gender disparitiesstill existing in the education sector . Hence, making gendermainstreaming and integration a priority for EQUIP/MOE. Based on an indepth Gender analysis, pertinent issues have been highlighted at theprogram implementation and institutional level.
Program implementation level:
1. Shortage of female teachers in all provinces, more so at districtand village schools;
2. Lower girls’ enrolment and retention, and higher drop-out rates;
3. Lack of girl and women-friendly environment due to absence ofinfrastructure facilities such as boundary walls, functionallatrines, water availability, and sanitation facilities etc.;
4. Limited availability of girls’ middle and high schools in ruralareas;
Institutional level:
5. Limited number of female staff at all levels, especially atsenior managerial level, as well as poor career progression forwomen employees.
6. Women’s limited participation in community structures for schoolmanagement, such as School Management Shuras (SMSs), andnegligible involvement in decision making.

7. Low gender awareness at all levels of MoE, with limited capacityfor gender mainstreaming across all departments and programs.
On the other hand, cultural and social barriers (e.g. Conflict,insecurity, early marriages, attitudes and perceptions towards girlchild, value of education among girls) act as a barrier towardsachieving gender equality.
IV. Purpose
Given the above context, a need was identified to bring together agroup of senior officials and other key officers from the MoE, whowould provide direction and support for overcoming gender relatedchallenges in the education sector. An additional need was lateridentified for a more hands-on, operational level working group withrepresentation from all EQUIPS units and related MoE departments, toaddress specific gender issues and facilitate gender integrationwithin their respective work areas. This led to the establishment of aGender Task Force.
Aim:
The Gender Task Force (GTF) is a mechanism for integrating genderconcerns into MOE/EQUIP policies, programs, projects and activitiesand into those of their counterpart organizations. As stated in theBeijing Platform for Action, the GTF "shall be the catalyst forgender-responsive planning/programming, and coordinate itsresponsibility for implementing the platform for action, as well asits expertise and working methods to promote the advancement of women"in specific to education programming under MOE.
Key Objectives:
The Gender Task Force’s objectives are to
A. Promote gender mainstreaming at the national and provincial(local and utility levels.)
B. Promote coherence and coordination of activities by all thedepartments across EQUIP and other stakeholders.
C. Task Force activities reflect a long-term strategy and ongoingprocess of gender mainstreaming and integration, which informsthe design and implementation of the programs/activities at thenational and provincial level.

Process of establishing a Gender Task Force
There had been an unmet need in the inter-departmental work onstrengthening the mainstreaming of gender concerns within EQUIP.Gender systematically and effectively needs to be mainstreamed intothe process. As a result, Gender Unit recommended the establishment ofa Task Force on Gender Mainstreaming to address the continuing needand technical advice on how to systematically and effectively addressgender issues both in the analysis and assessment of nationaldevelopment challenges and in strategic planning processes. TheTaskforce will acts as a technical working group to bring togethercritical thinking on and a common approach to mainstreaming gender inthe EQUIP and propose strategies for effectively addressing genderissues.
The Task force members will consist of team leads from each departmentpreferably the senior managers. A specific TOR with clear roles andresponsibilities (section V) will be set up to ensure that thedeliverables are met under the GTF and sustained throughout theproject period. Initially a consultation will be held with theidentified task force members, TORs will be discussed, roles andresponsibilities established. Regular meetings will be held once amonth, and will be scheduled on the same day as the EQUIP monthlymeeting to facilitate participation by members. Additional sessionscan be held as and when needed.
V. Responsibilities of the Gender Task Force:
D. Guide and support the development and implementation of a Gendermainstreaming policy for EQUIP/MoE.
E. Contribute to the development of a overall Gender Action Planfor EQUIP, which will be drawn from the work of EQUIP Units.
F. Ensure that gender is mainstreamed across all programs anddepartments of EQUIP/MoE, by making certain that allprograms/departments identify gender focused activities, withclear targets, budgets and implementation mechanisms.
G. Identify and recommend areas for further research on genderissues within components. Ensure that relevant, gender-disaggregated data is collected and analysed for the differentEQUIP/MoE units and the findings used to formulaterecommendations.
H. Review and approve gender indicators for inclusion in the M&Eplans of EQUIP/MoE Units. Also agree on process level indicators

to track implementation of gender activities and report progresstowards targets. Ensure that there is timely and focussedreporting on gender by each department.
I. Strengthen the gender institutionalization process withinEQUIP/MOE Units. This will include a review of gender-balanceamong staff, responsibilities for gender, and accountabilitythrough performance appraisals, at all levels, from field levelcadres (e.g. social mobilizers), to senior management staff.
J. Encourage each EQUIP/MoE Unit to develop and implement plans forbuilding gender capacity of staff through different trainingopportunities.
K. Facilitate coordination between EQUIP supporteddepartments/programs, promoting synergies and complementarilywhere possible on gender efforts.
VI. Composition of the Gender Task Force
The Gender Task Force (GTF) will have the following representation/composition:
A. Chair: Director and/or deputy director EQUIP.B. Secretary: EQUIP Gender Coordinator C. GTF Members: Heads of the following EQUIP/MoE
Departments/Programs:
Teacher Education Department (TED) Planning Department (EMIS and Strategic Planning) ISD Curriculum Social Mobilization HR EQUIP/MoE Procurement and Finance MoE Gender Focal Point, MoE Female Education Department, MoE EQUIP Gender Team Representative/s World Bank (advisory capacity) Other invitees to participate as and when required, including
EQUIP implementing partners selected on the basis of theirarea of competence.

VII. LIFE CYCLE OF THE GENDER TASK FORCE
It is proposed that the GTF will be operational throughout thelife of the EQUIP project. Subsequently, it can be integratedinto the MoE structure as a permanent body.
VIII. Coordinating Mechanism
The EQUIP Gender Unit will serve as the coordinating mechanismfor the Gender Task Force, and will coordinate all meetings,prepare agendas, circulate minutes, follow-up recommendations,and facilitate all other tasks related to GTF functioning.