Aerosol particle formation events and analysis of high growth rates observed above a subarctic...
12
Tellus (2008), 60B, 353–364 C 2008 The Authors Journal compilation C 2008 Blackwell Munksgaard Printed in Singapore. All rights reserved TELLUS Aerosol particle formation events and analysis of high growth rates observed above a subarctic wetland–forest mosaic By BIRGITTA SVENNINGSSON 1∗ , ALMUT ARNETH 1 , SEAN HAYWARD 1 , THOMAS HOLST 1 , ANDREAS MASSLING 2,3 , ERIK SWIETLICKI 2 , ANNE HIRSIKKO 4 , HEIKKI JUNNINEN 4 , ILONA RIIPINEN 4 , MARKO VANA 4,5 , MIIKKA DAL MASO 4 , TAREQ HUSSEIN 4 and MARKKU KULMALA 4 , 1 Department of Physical Geography and Ecosystems Analysis, Lund University, S¨ olvegatan 12, 223 62, Lund, Sweden; 2 Department of Physics, Division of Nuclear Physics, Lund University, Lund, Sweden; 3 Department of Physics, Section of Tropospheric Aerosols, Leibniz-Institute for Tropospheric Research, Leipzig, Germany; 4 Department of Physical Sciences, University of Helsinki, P.O. Box 64, FI-00014 University of Helsinki, Finland; 5 Institute of Environmental Physics, University of Tartu, ¨ Ulikooli 18, 50090 Tartu, Estonia (Manuscript received 25 October 2007; in final form 3 March 2008) ABSTRACT An analysis of particle formation (PF) events over a subarctic mire in northern Sweden was performed, based on number– size distributions of atmospheric aerosol particles (10–500 nm in diameter) and ions (0.4–40 nm in Tammet diameter). We present classification statistics for PF events from measurements covering the period July 2005–September 2006, with a break over the winter period. The PF event frequency peaked during the summer months, in contrast to other Scandinavian sites where the frequency is highest during spring and autumn. Our analysis includes calculated growth rates and estimates of concentrations and production rates of condensing vapour, deduced from the growth rates and condensational sink calculations, using AIS and SMPS data. Particle formation events with high growth rates (up to 50 nm h −1 ) occurred repeatedly. In these cases, the newly formed nucleation mode particles were often only present for periods of a few hours. On several occasions, repeated particle formation events were observed within 1 d, with differences in onset time of a few hours. These high growth rates were only observed when the condensation sink was higher than 0.001 s −1 . 1. Introduction Atmospheric aerosols have several environmental implications. Most focus is on their effects on regional and global cli- mate (IPCC, 2007) and their adverse effects on human health (Dockery and Pope III, 1994; Pope III et al., 2002; Brook et al., 2004). In addition, aerosols are also known to have implications on, for example, acid and nutrient deposition, and atmospheric transport of toxic substances. The atmospheric aerosol influences the radiation balance in the atmosphere directly through the up- ward scattering of incoming short-wave solar radiation and in- directly through their capability to act as cloud condensation ∗ Corresponding author. e-mail: [email protected] DOI: 10.1111/j.1600-0889.2008.00351.x nuclei (CCN) and thus influence cloud microphysical proper- ties. It has lately been suggested that the global warming can have been masked by aerosol cooling to an even higher extent than previously accounted for (Andreae et al., 2005). We cannot fully understand the effects of anthropogenic air pollution without knowing the properties of the natural atmo- sphere (Andreae, 2007). The natural secondary aerosol and its changes with increasing temperature and trends in emissions of biogenic aerosol precursors have been proposed to be a vital part in feedback mechanisms of the climate, via both direct and indirect aerosol effects (Kulmala et al., 2004b). In fact, for the pre-industrial atmosphere over continental regions, secondary organic aerosol (SOA) have been arguably the chief components of cloud condensation nuclei and, even today, play a major role in that respect over large forested areas like the boreal forest and of the Amazon (Kanakidou et al., 2000; Tunved et al., 2006; Tellus 60B (2008), 3 353
Transcript of Aerosol particle formation events and analysis of high growth rates observed above a subarctic...

Tellus (2008), 60B, 353–364 C© 2008 The AuthorsJournal compilation C© 2008 Blackwell Munksgaard
Printed in Singapore. All rights reservedT E L L U S
Aerosol particle formation events and analysisof high growth rates observed above a subarctic
wetland–forest mosaic
By BIRGITTA SVENNINGSSON 1∗, ALMUT ARNETH 1, SEAN HAYWARD 1,THOMAS HOLST 1, ANDREAS MASSLING 2,3, ERIK SWIETLICKI 2, ANNE HIRSIKKO 4,
HEIKKI JUNNINEN 4, ILONA RIIPINEN 4, MARKO VANA 4,5, MI IKKA DAL MASO 4,TAREQ HUSSEIN 4 and MARKKU KULMALA 4, 1Department of Physical Geography and Ecosystems
Analysis, Lund University, Solvegatan 12, 223 62, Lund, Sweden; 2Department of Physics, Division of NuclearPhysics, Lund University, Lund, Sweden; 3Department of Physics, Section of Tropospheric Aerosols, Leibniz-Institutefor Tropospheric Research, Leipzig, Germany; 4Department of Physical Sciences, University of Helsinki, P.O. Box 64,
FI-00014 University of Helsinki, Finland; 5Institute of Environmental Physics, University of Tartu, Ulikooli 18,50090 Tartu, Estonia
(Manuscript received 25 October 2007; in final form 3 March 2008)
ABSTRACTAn analysis of particle formation (PF) events over a subarctic mire in northern Sweden was performed, based on number–size distributions of atmospheric aerosol particles (10–500 nm in diameter) and ions (0.4–40 nm in Tammet diameter).We present classification statistics for PF events from measurements covering the period July 2005–September 2006,with a break over the winter period. The PF event frequency peaked during the summer months, in contrast to otherScandinavian sites where the frequency is highest during spring and autumn. Our analysis includes calculated growthrates and estimates of concentrations and production rates of condensing vapour, deduced from the growth rates andcondensational sink calculations, using AIS and SMPS data. Particle formation events with high growth rates (up to50 nm h−1) occurred repeatedly. In these cases, the newly formed nucleation mode particles were often only presentfor periods of a few hours. On several occasions, repeated particle formation events were observed within 1 d, withdifferences in onset time of a few hours. These high growth rates were only observed when the condensation sink washigher than 0.001 s−1.
1. Introduction
Atmospheric aerosols have several environmental implications.Most focus is on their effects on regional and global cli-mate (IPCC, 2007) and their adverse effects on human health(Dockery and Pope III, 1994; Pope III et al., 2002; Brook et al.,2004). In addition, aerosols are also known to have implicationson, for example, acid and nutrient deposition, and atmospherictransport of toxic substances. The atmospheric aerosol influencesthe radiation balance in the atmosphere directly through the up-ward scattering of incoming short-wave solar radiation and in-directly through their capability to act as cloud condensation
∗Corresponding author.e-mail: [email protected]: 10.1111/j.1600-0889.2008.00351.x
nuclei (CCN) and thus influence cloud microphysical proper-ties. It has lately been suggested that the global warming canhave been masked by aerosol cooling to an even higher extentthan previously accounted for (Andreae et al., 2005).
We cannot fully understand the effects of anthropogenic airpollution without knowing the properties of the natural atmo-sphere (Andreae, 2007). The natural secondary aerosol and itschanges with increasing temperature and trends in emissions ofbiogenic aerosol precursors have been proposed to be a vitalpart in feedback mechanisms of the climate, via both direct andindirect aerosol effects (Kulmala et al., 2004b). In fact, for thepre-industrial atmosphere over continental regions, secondaryorganic aerosol (SOA) have been arguably the chief componentsof cloud condensation nuclei and, even today, play a major rolein that respect over large forested areas like the boreal forestand of the Amazon (Kanakidou et al., 2000; Tunved et al., 2006;
Tellus 60B (2008), 3 353
354 B. SVENNINGSSON ET AL.
Andreae, 2007). Changes in emissions of biogenic precursorsand their interactions with aerosol particle formation and growthare important processes that needs to be understood in thatcontext.
New particle formation in the atmosphere has been observedall over the globe (Kulmala et al., 2004c), in clean backgroundair masses as well as in polluted air. It is most often observedduring daytime, indicating that photochemical reactions in theatmosphere probably are of importance as well as the mixingtaking place when the boundary layer breaks up (Nilsson et al.,2001). Only very few observations of night time events are de-scribed in the literature (Suni et al., 2007). The effect of newparticle formation in the boundary layer on the aerosol par-ticle concentrations on a global scale has been studied usinga global aerosol microphysics model (Spracklen et al., 2006).Their results suggest that particle concentrations at remote areasare dominated by secondary particles, whereas in polluted areas,the primary particles are most important for the particle numberconcentration. They also showed that the atmosphere respondsin a complicated way to changes in emissions. As an example,reductions in primary particle emissions can increase the par-ticle number concentration due to the decreased quenching ofparticle formation.
The chemical composition of the newly formed aerosol parti-cles is in general not known, even though sulphuric acid proba-bly plays a key role in the very initial stage (Weber et al., 1996;Sihto et al., 2006; Riipinen et al., 2007) and iodine compoundshave been identified in coastal particle formation (O’Dowd et al.,2002, 2004). There is also some evidence for biogenic monoter-pene emissions playing an important role in particle formationin at least eucalyptus and boreal forests (Kavouras et al., 1998;Tunved et al., 2006). Di-methyl amine in the particle phase hasalso been associated with particle formation events (Makelaet al., 2001). Nevertheless, we still do not know the chemicalsubstances that are responsible for the onset of particle forma-tion or the compounds that make the newly formed particlesgrow into detectable sizes and further to sizes where they can actas cloud condensation nuclei.
Chemistry aside, in terms of the microphysics of particle for-mation, mechanisms for the nucleation and early growth of at-mospheric aerosol particles have been discussed and one of therecent models (Kulmala et al., 2000; Kulmala, 2003; Kulmalaet al., 2004a) assumes that thermodynamically stable clusters ofabout 1 nm in diameter or less exist all the time in the atmo-sphere. It is assumed that they can become activated by super-saturated vapours of, for example, organic compounds and thenstart to grow. Charged clusters are always present, and some ex-perimental and theoretical support for the existence of neutralclusters have been presented (Kulmala et al., 2005a, 2007).
Most of the data concerning particle formation in northernlocations are from boreal forests with comparatively little directhuman pollution influence (Kulmala et al., 2004c; Dal Masoet al., 2007). There is evidence pointing at biogenic emissions
from boreal forests as important precursors for the evolutionof the natural atmospheric aerosol over northern Scandinavia(Tunved et al., 2006). However, typical northern latitude ecosys-tems like wetlands or tundra generally have been ignored as ma-jor SOA precursor areas, although it is known that these emit iso-prene as well as monoterpenes at measurable amounts (Hakolaet al., 1998; Janson and De Serves, 1998; Hellen et al., 2005).This is particularly important, since isoprene has been discoveredto contribute to SOA growth, and since global climate changemay lead to tree-line migration and a different relative contribu-tion of forest versus wetland versus tundra ecosystems in north-ern landscapes (Chapin et al., 2004; Claeys et al., 2004). Whetheror not such a change in vegetation will have effect on aerosolparticle formation or concentration is unkown.
In this work, we have analysed aerosol particle and air ionsize distributions taken at a subarctic site in northern Swedenand characterized events of new particle formation. Also, nighttime events with high growth rates are presented and analysed.The condensation sink of the submicrometre aerosol has beenestimated and growth rates calculated for the particle formationevents. Ambient concentrations and production rates of condens-able vapours are estimated. The influence of condensation sinkon particle event characteristics is investigated. However, de-tailed analysis of meteorological conditions, back trajectoriesand behaviour of cluster ions will be the subject of future studiesand is not included here.
2. Experimental
2.1. Site
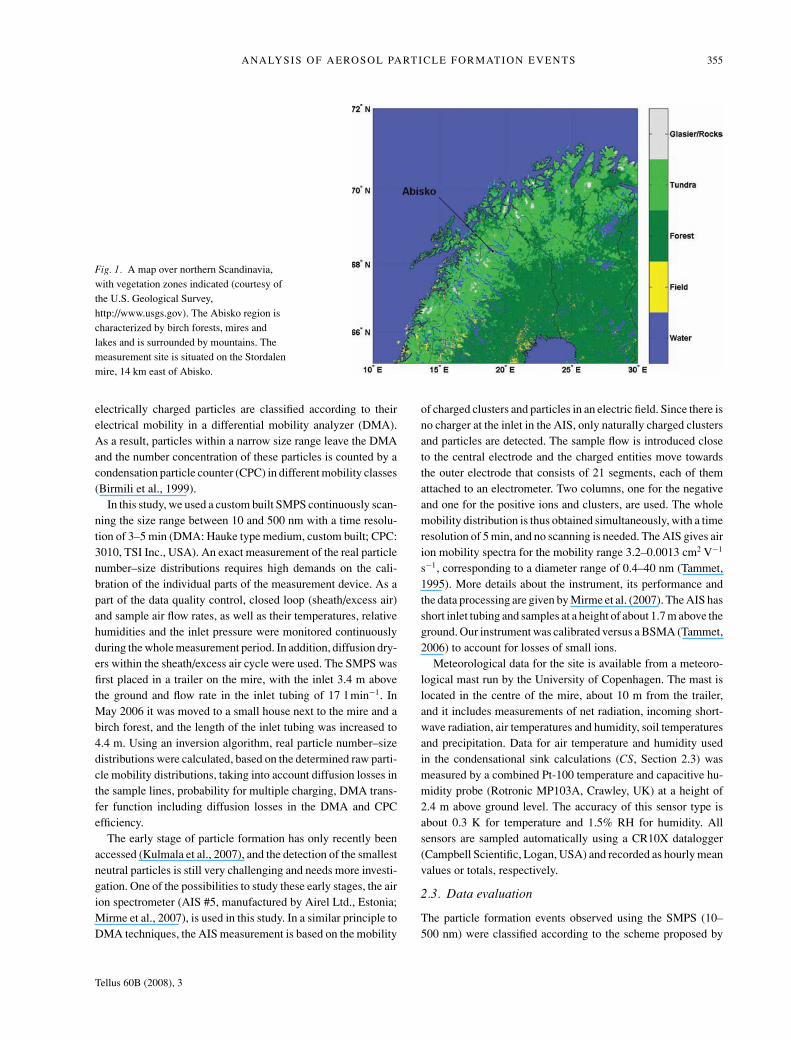
Measurements were conducted at Stordalen mire (68.35◦N,19.05◦E), approximately 14 km east of Abisko; a subarctic mireunderlained by discontinuous permafrost (Fig. 1). The largerAbisko area is characterized by subarctic birch forest (Betulapubescens) interspersed with wetlands and, above the tree line,tundra ecosystems. Long term average mean temperature at thesite (1913–2002) were −0.7◦C, with considerable fluctuationsover this period, particularly two warming periods: one in theearly half of the 20th century, the other over recent decades(Christensen et al., 2004). Monitoring of vegetation patterns onthe mire in the 1970s allowed to assess rapid changes in sur-face hydrology and vegetation patterns in response to this latterwarming (Svensson et al., 1999), which fosters expansion ofwetter parts of the mire dominated by sedges over the drier partsof the mire, formed by Sphagnum and ericaceous shrubs.
2.2. Instrumentation
Precise particle number–size distribution measurements in thesubmicrometre size range are generally based on particle mobil-ity techniques, for example, the application of scanning mo-bility particle sizers (SMPS). As a first step, the aerosol isgiven a well-defined charge distribution in a neutralizer, and the
Tellus 60B (2008), 3
ANALYSIS OF AEROSOL PARTICLE FORMATION EVENTS 355
Fig. 1. A map over northern Scandinavia,with vegetation zones indicated (courtesy ofthe U.S. Geological Survey,http://www.usgs.gov). The Abisko region ischaracterized by birch forests, mires andlakes and is surrounded by mountains. Themeasurement site is situated on the Stordalenmire, 14 km east of Abisko.
electrically charged particles are classified according to theirelectrical mobility in a differential mobility analyzer (DMA).As a result, particles within a narrow size range leave the DMAand the number concentration of these particles is counted by acondensation particle counter (CPC) in different mobility classes(Birmili et al., 1999).
In this study, we used a custom built SMPS continuously scan-ning the size range between 10 and 500 nm with a time resolu-tion of 3–5 min (DMA: Hauke type medium, custom built; CPC:3010, TSI Inc., USA). An exact measurement of the real particlenumber–size distributions requires high demands on the cali-bration of the individual parts of the measurement device. As apart of the data quality control, closed loop (sheath/excess air)and sample air flow rates, as well as their temperatures, relativehumidities and the inlet pressure were monitored continuouslyduring the whole measurement period. In addition, diffusion dry-ers within the sheath/excess air cycle were used. The SMPS wasfirst placed in a trailer on the mire, with the inlet 3.4 m abovethe ground and flow rate in the inlet tubing of 17 l min−1. InMay 2006 it was moved to a small house next to the mire and abirch forest, and the length of the inlet tubing was increased to4.4 m. Using an inversion algorithm, real particle number–sizedistributions were calculated, based on the determined raw parti-cle mobility distributions, taking into account diffusion losses inthe sample lines, probability for multiple charging, DMA trans-fer function including diffusion losses in the DMA and CPCefficiency.
The early stage of particle formation has only recently beenaccessed (Kulmala et al., 2007), and the detection of the smallestneutral particles is still very challenging and needs more investi-gation. One of the possibilities to study these early stages, the airion spectrometer (AIS #5, manufactured by Airel Ltd., Estonia;Mirme et al., 2007), is used in this study. In a similar principle toDMA techniques, the AIS measurement is based on the mobility
of charged clusters and particles in an electric field. Since there isno charger at the inlet in the AIS, only naturally charged clustersand particles are detected. The sample flow is introduced closeto the central electrode and the charged entities move towardsthe outer electrode that consists of 21 segments, each of themattached to an electrometer. Two columns, one for the negativeand one for the positive ions and clusters, are used. The wholemobility distribution is thus obtained simultaneously, with a timeresolution of 5 min, and no scanning is needed. The AIS gives airion mobility spectra for the mobility range 3.2–0.0013 cm2 V−1
s−1, corresponding to a diameter range of 0.4–40 nm (Tammet,1995). More details about the instrument, its performance andthe data processing are given by Mirme et al. (2007). The AIS hasshort inlet tubing and samples at a height of about 1.7 m above theground. Our instrument was calibrated versus a BSMA (Tammet,2006) to account for losses of small ions.
Meteorological data for the site is available from a meteoro-logical mast run by the University of Copenhagen. The mast islocated in the centre of the mire, about 10 m from the trailer,and it includes measurements of net radiation, incoming short-wave radiation, air temperatures and humidity, soil temperaturesand precipitation. Data for air temperature and humidity usedin the condensational sink calculations (CS, Section 2.3) wasmeasured by a combined Pt-100 temperature and capacitive hu-midity probe (Rotronic MP103A, Crawley, UK) at a height of2.4 m above ground level. The accuracy of this sensor type isabout 0.3 K for temperature and 1.5% RH for humidity. Allsensors are sampled automatically using a CR10X datalogger(Campbell Scientific, Logan, USA) and recorded as hourly meanvalues or totals, respectively.
2.3. Data evaluation
The particle formation events observed using the SMPS (10–500 nm) were classified according to the scheme proposed by
Tellus 60B (2008), 3

356 B. SVENNINGSSON ET AL.
Dal Maso et al. (2005). Generally, for a day to be classifiedas a particle formation day, there should be a new particle modeappearing in the diameter range below 25 nm, and this new modeshould grow in size and persist for more than 1 h. In contrast,non-event days are characterized by the absence of new modeof sub-25 nm particles that exists for more than 1 h and nogrowing Aitken mode. Days that do not follow any of these twospecifications are labelled unclassified.
The classification of the air ion size spectra is more com-plicated, and a common classification scheme is still under de-velopment. Air ion spectra (AIS) frequently show outbreaks ofintermediate ions (1.6–7 nm in diameter), caused by a variety ofprocesses, many of them unknown. The full classification underdevelopment will take all of them into account. In this work, asimplified classification was applied for the purpose of analysingparticle formation. This classification is based on the classifi-cation of SMPS data described above, with the size range forthe new mode specified as 1–10 nm and the minimum limit forgrowth set to diameters above 10 nm. Using such an approach,for a subset of the event days, the diameter growth rate of thenewly formed particles could be determined (equivalent to classI events according to Dal Maso et al., 2005). In class II events,there was too much variability in particle concentration for thegrowth to be characterized.
Traditionally, classification of aerosol particle formation ismade on a day-by-day basis. This is justified by most eventsappearing during day time, and most often, only one event perday is observed. In the data presented here, many events wereobserved during the night and there was often more than oneoutbreak of new particles/ions per day. Furthermore, in the airion size spectra, several different types of events can take placeduring 1 d. For the future, it should be considered finding aclassification method taking into account these processes. How-ever, in this paper, we follow the tradition and classify the eventsday-by-day. In the analysis of growth rates as a function of, forexample, condensation sink or time of day and year, more thanone event per day, when present, was included.
The aerosol particle number–size distribution (SMPS) datawere fitted to up to three lognormal distributions (Hussein et al.,2005). A similar approach was used to fit lognormal distributionsto the air ion size spectra. This generated two modes for both,negative and positive ions. One of the fitted lognormal modeswas forced to always fit the cluster ion mode (<1.3 nm).
The evolution of the modal diameter with time was used tofind the growth rate of the particles by fitting a line to particlediameter as a function of time, the slope of which is interpretedas the growth rate. In this methodology, it is assumed that theparticle formation takes place in a homogeneous air mass andthat the particles observed during the modal diameter growth areall formed at the same time. For the AIS data, priority was putto the growth of the newly formed particles in the size range 1–10 nm although especially the events with high growth ratesoften showed the same growth rate in the whole range up to
40 nm. For the SMPS data, the growth rate was determined asan average over the time when the new mode was observed. Forevents with long duration, only the growth until midnight of thefirst day was taken into account.
The growth rate depends on the concentration of condens-able vapours (Kulmala et al., 2005b). Assuming that the ambi-ent vapour pressure is much higher than the saturation vapourpressure over the particle surface and properties similar to thoseof sulphuric acid, the growth rate (GR in nm h−1) for particlesin the transition regime (for our purpose those larger than 5 nmin diameter) can be expressed by a linear relation to the con-centration of condensable vapours (C in cm−3) (Kulmala et al.,2001):
G R = 1.39 × 10⁷ × C (1)
The condensation sink parameter (CS) describes the timescale(1/CS) for removal of condensable vapours due to condensationon pre-existing particles. It is calculated from the aerosol parti-cle size distribution, assuming that the saturation vapour pressureover the particle surface is low compared with the vapour pres-sure far from the particle and molecular properties similar tothose of sulphuric acid:
C S = 2πD∑
i
βi dpi Ni . (2)
where D is the diffusion coefficient for the condensing vapour,dpi is the diameter of particles in class i, Ni is their numberconcentration and β i is the transitional correction factor. Thecondensation sink depends on the ambient size of the particles,including the liquid water. As we do not have information aboutthe hygroscopic growth of the particles during this experiment,we estimated the water uptake of the observed aerosol basedon measurements at the boreal forest site in Hyytiala, Finlandand applied the hygroscopicity parameterisation by Laakso et al.(2004).
The time dependence of the concentration of condensablevapours (C) can be expressed as:
dCdt
= Q − C S × C, (3)
where Q is the vapour production rate. For the purpose of order-of-magnitude estimations of vapour production rates, we assumesteady state conditions (dC/dt = 0). The vapour concentrationis then determined by the production rate and the condensationsink as
C = Q/C S (4)
On the other hand, if we know C, the vapour production ratecan be estimated as:
Q = C S × C . (5)
More details concerning these calculations are given byKulmala et al. (2001, 2005b).
Tellus 60B (2008), 3

ANALYSIS OF AEROSOL PARTICLE FORMATION EVENTS 357
3. Results and discussion
3.1. Aerosol and cluster ion characterization
The air in the Abisko region is most of the time relatively unpol-luted background air of arctic origin that has been transportedover land with low population density for time periods of hoursto days. The site can, on some days, be influenced by air frommore polluted areas in, for example, southern Scandinavia andcentral Europe. Accordingly, the number concentration of parti-cles in the size range 10–500 nm (SMPS) varied from less thana hundred to a couple of thousand particles per cubic centime-tre, with an average over the measurement period of 790 cm−3.The time-series of daily and monthly averages (Fig. 2a) showsslightly higher particle number concentrations during summercompared with spring and autumn.
Variation in aerosol particle size distribution data can be il-lustrated using many different parameters, for example, totalnumber, surface, volume or modal structure. For the purpose ofunderstanding particle formation and concentrations of clustersand condensable vapours, the condensation sink (CS, see Sec-tion 2.3 and Kulmala et al., 2005b) is a valuable measure. Atour Stordalen site, the average CS during the measurement pe-riod was 0.0025 s−1, indicating a life time of condensable gasmolecules of 5–10 min, if no other sinks are assumed. Daily av-erages of CS as low as 0.00025 s−1 were observed (Fig. 2b). Theaverage CS in Abisko is comparable to the CS at background sitesin central Finland (Dal Maso et al., 2007) and clean conditionsin Southern Sweden (Kristensson et al., 2008).
In the air ion spectra, the typical picture of an always presentmode of cluster ions with modal diameters in the range 0.5–1 nm (diameter according to Tammet, 1995) is clearly visible(Figs. 3e–h). The negative ions were in general smaller (withan average diameter of 0.65 nm) compared with the positiveones (0.82 nm), but they also show more variability in size.Cluster ion number concentration are presented in Fig. 2(c), andthe numbers of negative and positive cluster ions (based on thefitting) averaged 2380 cm−3 and 1650 cm−3, respectively. Thesecluster ion concentrations are higher than observed at many othersites (Komppula et al., 2007; Vartiainen et al., 2007; Venzacet al., 2007). However, the overall picture of an always presentcluster ion mode agrees with the previous observations.
The ion concentration in the size range 1.6–7 nm (intermediateions) is normally low, with various types of outbreaks of higherconcentration having durations of a few minutes to hours. Severalprocesses are responsible for these outbreaks, many of them notvery well known. For the analysis of the AIS data, we focus hereon particle formation events, that is, occurrence of intermediateions that showed growth leading to formation of particles largerthan 10 nm in diameter.
3.2. Particle formation events
Particle formation, according to the classification described inSection 2.3, was frequently observed. It should be noted that the
Fig. 2. Daily and monthly averages of (a) number concentration ofparticles in the size range 10–500 nm in diameter and (b) condensationsink (CS) estimated from the aerosol particle size distributions (SMPSdata). (c) Daily averages of negative and positive cluster ions accordingto the fit of a lognormal distribution with a modal diameter smaller than1.3 nm to the size distributions of the naturally charged particles in thediameter range 0.4–40 nm (AIS data). The grand average for thenegative and positive cluster ion concentrations are 2380 and1650 cm−3, respectively.
time periods covered by AIS and SMPS differed due to differentstarting dates and instrument failures. The determined growthrates and times of onset can also be different since the two setsof data cover different size ranges, and the focus in the AIS data
Tellus 60B (2008), 3
358 B. SVENNINGSSON ET AL.
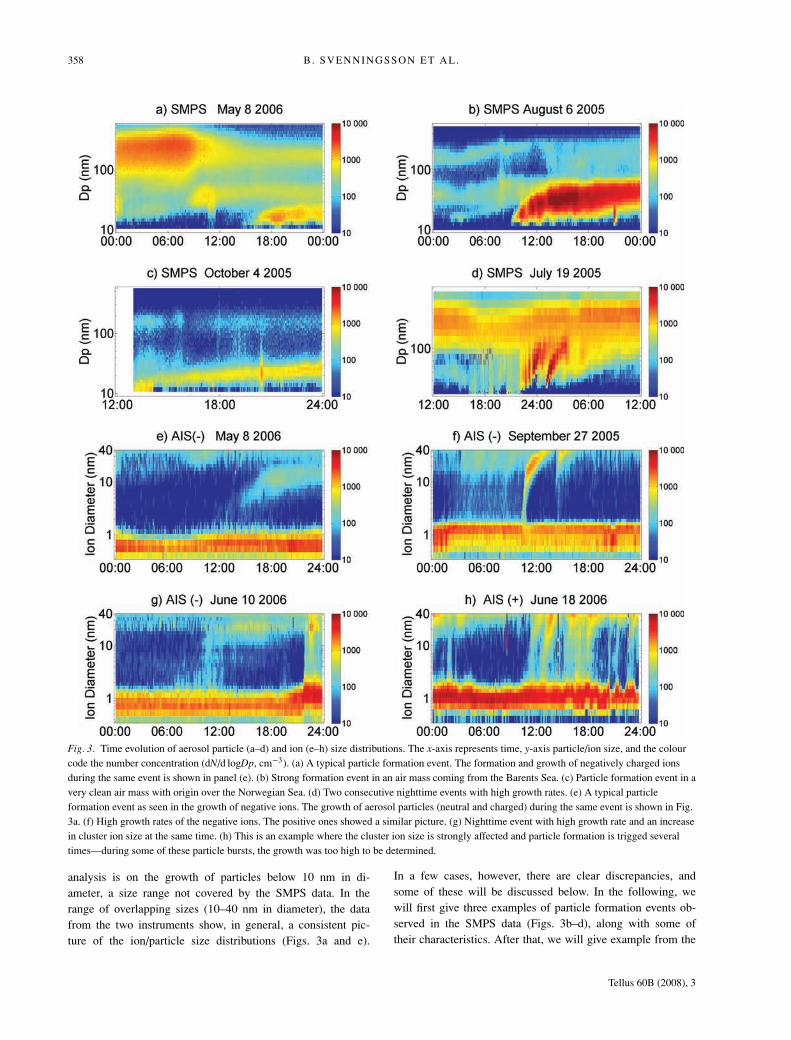
Fig. 3. Time evolution of aerosol particle (a–d) and ion (e–h) size distributions. The x-axis represents time, y-axis particle/ion size, and the colourcode the number concentration (dN/d logDp, cm−3). (a) A typical particle formation event. The formation and growth of negatively charged ionsduring the same event is shown in panel (e). (b) Strong formation event in an air mass coming from the Barents Sea. (c) Particle formation event in avery clean air mass with origin over the Norwegian Sea. (d) Two consecutive nighttime events with high growth rates. (e) A typical particleformation event as seen in the growth of negative ions. The growth of aerosol particles (neutral and charged) during the same event is shown in Fig.3a. (f) High growth rates of the negative ions. The positive ones showed a similar picture. (g) Nighttime event with high growth rate and an increasein cluster ion size at the same time. (h) This is an example where the cluster ion size is strongly affected and particle formation is trigged severaltimes—during some of these particle bursts, the growth was too high to be determined.
analysis is on the growth of particles below 10 nm in di-ameter, a size range not covered by the SMPS data. In therange of overlapping sizes (10–40 nm in diameter), the datafrom the two instruments show, in general, a consistent pic-ture of the ion/particle size distributions (Figs. 3a and e).
In a few cases, however, there are clear discrepancies, andsome of these will be discussed below. In the following, wewill first give three examples of particle formation events ob-served in the SMPS data (Figs. 3b–d), along with some oftheir characteristics. After that, we will give example from the
Tellus 60B (2008), 3

ANALYSIS OF AEROSOL PARTICLE FORMATION EVENTS 359
AIS data and make some comparison between the two sets ofdata.
According to the classification of the SMPS data, 77 out of195 d (40%) were particle formation event days. The data onwhich these numbers are based cover spring, summer and au-tumn but not winter. 60% of the particle formation events thatwere seen in the SMPS data, took place during daytime andshowed moderate growth rates (0.5–10 nm h−1, Figs. 3a–c), anobservation in agreement with observations from other continen-tal background sites (Kulmala et al., 2005b). As a typical patternobserved for summer time conditions, during the particle forma-tion event on 6 August 2005 (Fig. 3b), the air mass originatedfrom the Barents Sea and arrived from north after travelling overland for about 12 h (according to HYSPLIT back trajectories,http://www.arl.noaa.gov/ready.html; Draxler and Rolph, 2003;Rolph, 2003). On that day, the morning concentration of par-ticles in the size range 10–500 nm was just below 200 cm−3.The number of particles in the newly formed mode reached amaximum of 3500 cm−3 at 15:00, 6 h after it first could be de-tected in the SMPS data. At 20:00, there were still 2000 particlescm−3 with a modal diameter of 37 nm (Fig. 3b). The calculatedgrowth rate was 4.5 nm h−1, corresponding to a concentration ofcondensable vapours of 6 × 107 cm−3 and a vapour productionrate of 1 × 105 cm−3 s−1. The new particle mode was observedfor in total almost 2 d and after 1 d, the modal diameter was65 nm. Depending on the particle chemical composition andcloud formation dynamics, particles of this size can act as cloudcondensation nuclei. This is an example of how the aerosol parti-cle size distribution can be strongly affected by particle formationin the atmosphere during seasons with high biological activity.
A second example is taken from the autumn measurement pe-riod, when vegetation on the mire is not active anymore and leaffall at the birch forest had commenced (4 October 2005 SMPSaerosol particle size distributions in Fig. 3c). In this case, theair mass originated from the Norwegian Sea and arrived in theAbisko area from western directions after less than 6 h passageover land. During the first hour of this event, the concentration ofparticles larger than 15 nm was 70 cm−3; there is unfortunatelyno size distribution data available before the onset of this event.At midnight, the modal diameter of the new particle mode hadreached 25 nm and the number concentration was 310 cm−3
(compared with a total of 340 particles cm−3 in the particlediameter range 10–500 nm). The calculated growth rate was0.9 nm h−1 (Fig. 3c), corresponding to a concentration of con-densable vapours of 1 × 107 cm−3 and a vapour production rateof 3 × 103 cm−3 s−1. Here it is shown that for this type of cleanconditions, low production rates of condensable vapours, also,can alter the aerosol particle size distribution significantly.
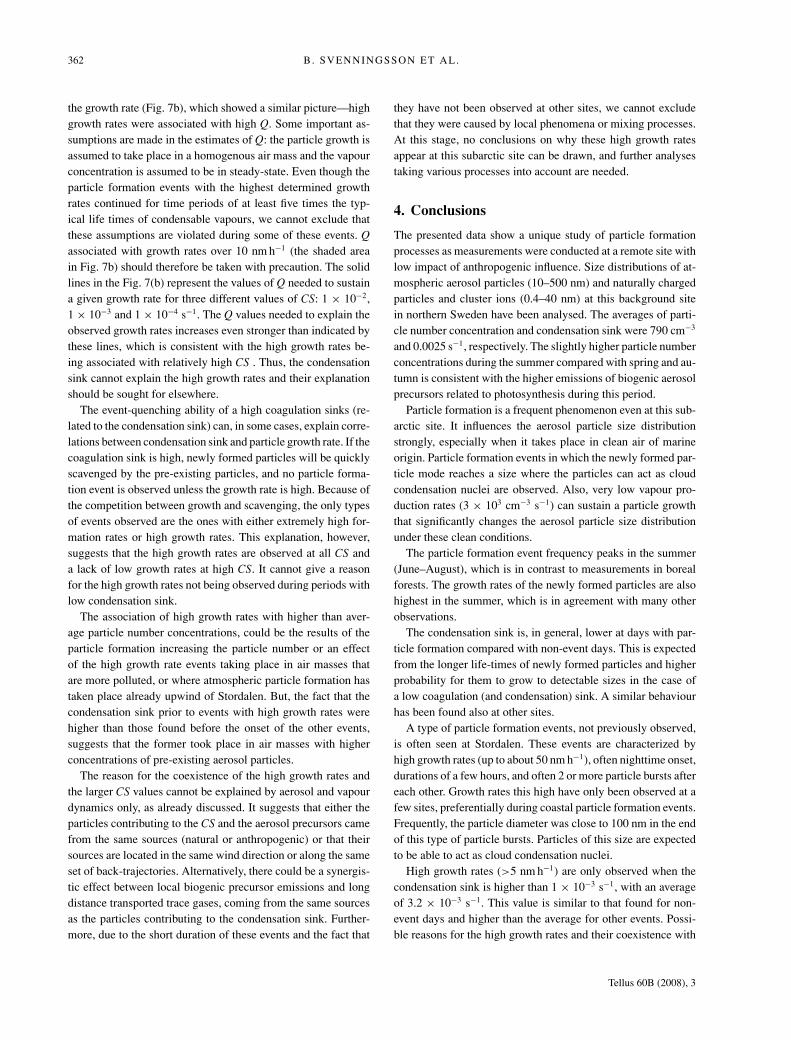
In addition to this type of often described daytime events, wefrequently observed events that did not fit into this pattern (seee.g. Fig. 3d). They were characterized by unusually high growthrates, estimated under the assumption of a homogeneous air massand were of relatively short duration (i.e. few hours). In many of
these events, the onset took place during the night (Fig. 4a) andthey were often, though not exclusively, observed in summer. Inthe Abisko area, the sun is above the horizon all night from 31May to 14 July, although the sun light is not very intense duringthe night. In many cases, repeated particle bursts were possiblewith time intervals between each burst of typically a few hours.In the SMPS data, we observed growth from 10–30 nm up to100 nm taking place within a few hours (Fig. 3d). If these par-ticles consist of soluble material with molar weights similar tothose of oxidation products of monoterpenes, they are expectedto be good cloud condensation nuclei.
According to the AIS data classification, 44 out of 175 d (26%)showed particle formation, covering both high and low growthrates (see for example Fig. 3e) and onset during the day as wellas during the night (Fig. 4b).
Particle formation events with high growth rates, and some-times nighttime onset, are observed in the AIS data as well.Events were observed with growth from cluster ion size to theupper diameter limit of the instrument (40 nm) taking place in1–2 h (Figs. 3f–h). The highest growth-rate determine from theAIS data was 57 nm h−1, which is a conservative estimate be-cause, in some cases, the instrumental time resolution limitedthe possibility to judge between growth and ions of all sizes ap-pearing simultaneously (Fig. 3h). Many of the high growth rateevents were associated with an increase in the cluster ion sizes,examples of which are presented in Figs. 3(g)–(h). In these cases,negative and positive cluster ions typically ended up at similarsizes although the change is most pronounced for the negativeones, since they started from smaller sizes.
Figure 3(f) shows an example of AIS data from one day ina week in September 2005, with 5 of 7 d showing this typeof strong particle formation. One very clear event for whichthe growth rate easily could be determined, is illustrated in thefigure. Several less clear bursts of intermediate and larger ionsare observed before and after that. During this period, a particleformation event with high growth rates and onset after the sunsetwas observed. However, the events during this week did notappear as pronounced in the SMPS data. During this period,the SMPS was placed in the trailer on the mire and the AISwas located in a house at the border of a birch forest next tothe mire. The distance between the instruments (∼300 m) andtheir different immediate environments could be a clue to thedifferences found here and is a motive for further investigations.
At this point, we cannot draw conclusions on the reason forhigh growth rates and onset of particle formation during the night.It is, however, not very likely that photochemical reactions orboundary layer break up are the driving force behind these nighttime events.
3.3. Seasonality of particle formation events
The seasonality of particle formation events is illustrated inFig. 5 (5a based on SMPS and 5b on AIS data). Data from both
Tellus 60B (2008), 3

360 B. SVENNINGSSON ET AL.
0
10
20
30
40
50
0:00 8:00 16:00 0:00
0
10
20
30
40
50
60
426180
Fig. 4. Growth rate as a function of the timeof the day when the new mode was firstobserved in (a) SMPS and (b) AIS data. Thesolid lines in (a) represent the divisionbetween the nighttime events with highgrowth rate (onset between 16:00 and 8:00and growth rates higher than 10 nm h−1) andthe rest of the events.
instruments show a maximum in the frequency of particle forma-tion events during the summer. The SMPS data gave, in general,somewhat higher particle formation frequencies, compared withthe AIS. A period of very high particle formation frequency inJune 2006 found in the SMPS data is, however, based on 12 donly. The summer maximum contrasts observations from sites insouthern Scandinavia (Dal Maso et al., 2007; Kristensson et al.,2008; Hyvarinen et al., 2008) where particle formation eventswere concentrated in the spring and autumn months. The sites innorthern Finland, at about the same latitude as Stordalen, showless pronounced spring and autumn maxima. The spring onset atthese sites is, however, earlier than in Stordalen, and they do notshow a summer peak in the particle formation event frequency(Dal Maso et al., 2007).
The particle growth rate (Fig. 6) is a function of the condens-able vapour concentration, which in itself is a function of thevapour production rate (Q) and the condensation sink. Like thegrowth rates, also the vapour production rates, estimated fromgrowth rates and the condensation sink, peaked during summer.The summer maxima in the growth rate and Q is in agreementwith previous observations (Kulmala et al., 2005b; Dal Maso et
al., 2007; Kristensson et al., 2008) and consistent with the bio-logical activity and emissions of photosynthesis related aerosolprecursors (e.g. isoprene and monoterpenes) being high in thesummer. We did, however, find high growth rates, and thus highvalues of Q also, in late September (see e.g. Fig. 3f), when thephotosynthesis and emissions of related biogenic aerosol pre-cursor vapours were low. One hypothesis is that the decay ofbiological material can result in aerosol precursors. Makela etal. (2001) has, for example, observed that the concentration ofdi-methyl amine in aerosol particles was higher during eventdays compared with non-event days. Di-methyl amine is an endproduct of microbial decomposition of organic material and theobservations could thus possibly be linked to freshly fallen birchlitter.
3.4. Particle formation event days versus non-event days
Differences in particle number (in the size range 10–500 nm)and CS for particle formation event days compared with non-event days were investigated. We divided the particle formationevents into two groups: (1) particle formation events with growth
Tellus 60B (2008), 3

ANALYSIS OF AEROSOL PARTICLE FORMATION EVENTS 361
Fig. 5. Seasonality of days with particle formation events from (a) theSMPS and (b) the AIS. N represents the number of days with valuabledata during each month. Black bars, particle formation event days;white bars, non-event days and striped bars, unclassified days.
0
5
10
15
20
25
30
35
40
45
30.9.06
Dates
Gro
wth
Ra
te (
nm
/h)
1-Jul-05 1-Oct-05 1-Jan-06 1-Apr-06 1-Jul-06 1-Oct-061-Apr-05
Fig. 6. Daily and monthly averages of growth rates as determined fromthe SMPS data.
rates over 10 nm h and onset during the night (upper left- andright-hand side areas in Fig. 4a) and (2) all other events. Wefound that the particle number was in average higher during eventdays with high growth rates and onset during nighttime (average± 1SD = 1070 ± 342 cm−3) compared with the other eventdays (782 ± 451 cm−3) and non-event days (666 ± 481 cm−3).
Comparing the average values for the condensation sink inthe same way, we found no difference between the high growth-rate events (0.0032 + 0.0014 s−1) and non-events 0.0031 +
Fig. 7. (a) The particle growth rate determined from the SMPS dataversus the condensation sink averaged over half an hour before the newmode was first observed. (b) The estimated production rate ofcondensable vapour (Q) versus the particle growth rate. The solid linesrepresent the vapour production rate that can sustain a given particlegrowth rate for three values of the condensation sink (CS): 1 ×10⁻² s−1, 1 × 10⁻³ s−1, and 1 × 10⁻⁴ s−1. The high Q values,associated with growth rates over 10 nm h−1, should be taken withprecaution as discussed in Section 3.4.
0.0024 s−1). The other events showed, in average, lower val-ues of CS (0.0017 ± 0.0015 s−1). In previous studies, it has beenobserved that the particle formation events often are associatedwith lower values of the condensation sink (and thus also lowercoagulation sink) compared with non-event days (Dal Masoet al., 2007). This can be explained by less competition forcondensable vapour when CS is low (eqs. 3 and 4) and alonger lifetime of the newly formed particles and hence a higherprobability for newly formed particles to grow to detectablesizes.
Figure 7a shows the growth rates as a function of the conden-sation sink, averaged over half an hour before the new mode wasfirst observed in the SMPS data. From eqs. (1) and (4), the growthrate is expected to correlate with the inverse of the condensationsink. But Fig. 7(a) shows the opposite—the high growth rateswere only observed when the condensation sink was above 1 ×10⁻³ s−1. We investigated this further by plotting the vapourproduction rate (Q estimated as described in Section 2.3) versus
Tellus 60B (2008), 3
362 B. SVENNINGSSON ET AL.
the growth rate (Fig. 7b), which showed a similar picture—highgrowth rates were associated with high Q. Some important as-sumptions are made in the estimates of Q: the particle growth isassumed to take place in a homogenous air mass and the vapourconcentration is assumed to be in steady-state. Even though theparticle formation events with the highest determined growthrates continued for time periods of at least five times the typ-ical life times of condensable vapours, we cannot exclude thatthese assumptions are violated during some of these events. Qassociated with growth rates over 10 nm h−1 (the shaded areain Fig. 7b) should therefore be taken with precaution. The solidlines in the Fig. 7(b) represent the values of Q needed to sustaina given growth rate for three different values of CS: 1 × 10−2,1 × 10−3 and 1 × 10⁻⁴ s−1. The Q values needed to explain theobserved growth rates increases even stronger than indicated bythese lines, which is consistent with the high growth rates be-ing associated with relatively high CS . Thus, the condensationsink cannot explain the high growth rates and their explanationshould be sought for elsewhere.
The event-quenching ability of a high coagulation sinks (re-lated to the condensation sink) can, in some cases, explain corre-lations between condensation sink and particle growth rate. If thecoagulation sink is high, newly formed particles will be quicklyscavenged by the pre-existing particles, and no particle forma-tion event is observed unless the growth rate is high. Because ofthe competition between growth and scavenging, the only typesof events observed are the ones with either extremely high for-mation rates or high growth rates. This explanation, however,suggests that the high growth rates are observed at all CS anda lack of low growth rates at high CS. It cannot give a reasonfor the high growth rates not being observed during periods withlow condensation sink.
The association of high growth rates with higher than aver-age particle number concentrations, could be the results of theparticle formation increasing the particle number or an effectof the high growth rate events taking place in air masses thatare more polluted, or where atmospheric particle formation hastaken place already upwind of Stordalen. But, the fact that thecondensation sink prior to events with high growth rates werehigher than those found before the onset of the other events,suggests that the former took place in air masses with higherconcentrations of pre-existing aerosol particles.
The reason for the coexistence of the high growth rates andthe larger CS values cannot be explained by aerosol and vapourdynamics only, as already discussed. It suggests that either theparticles contributing to the CS and the aerosol precursors camefrom the same sources (natural or anthropogenic) or that theirsources are located in the same wind direction or along the sameset of back-trajectories. Alternatively, there could be a synergis-tic effect between local biogenic precursor emissions and longdistance transported trace gases, coming from the same sourcesas the particles contributing to the condensation sink. Further-more, due to the short duration of these events and the fact that
they have not been observed at other sites, we cannot excludethat they were caused by local phenomena or mixing processes.At this stage, no conclusions on why these high growth ratesappear at this subarctic site can be drawn, and further analysestaking various processes into account are needed.
4. Conclusions
The presented data show a unique study of particle formationprocesses as measurements were conducted at a remote site withlow impact of anthropogenic influence. Size distributions of at-mospheric aerosol particles (10–500 nm) and naturally chargedparticles and cluster ions (0.4–40 nm) at this background sitein northern Sweden have been analysed. The averages of parti-cle number concentration and condensation sink were 790 cm−3
and 0.0025 s−1, respectively. The slightly higher particle numberconcentrations during the summer compared with spring and au-tumn is consistent with the higher emissions of biogenic aerosolprecursors related to photosynthesis during this period.
Particle formation is a frequent phenomenon even at this sub-arctic site. It influences the aerosol particle size distributionstrongly, especially when it takes place in clean air of marineorigin. Particle formation events in which the newly formed par-ticle mode reaches a size where the particles can act as cloudcondensation nuclei are observed. Also, very low vapour pro-duction rates (3 × 103 cm−3 s−1) can sustain a particle growththat significantly changes the aerosol particle size distributionunder these clean conditions.
The particle formation event frequency peaks in the summer(June–August), which is in contrast to measurements in borealforests. The growth rates of the newly formed particles are alsohighest in the summer, which is in agreement with many otherobservations.
The condensation sink is, in general, lower at days with par-ticle formation compared with non-event days. This is expectedfrom the longer life-times of newly formed particles and higherprobability for them to grow to detectable sizes in the case ofa low coagulation (and condensation) sink. A similar behaviourhas been found also at other sites.
A type of particle formation events, not previously observed,is often seen at Stordalen. These events are characterized byhigh growth rates (up to about 50 nm h−1), often nighttime onset,durations of a few hours, and often 2 or more particle bursts aftereach other. Growth rates this high have only been observed at afew sites, preferentially during coastal particle formation events.Frequently, the particle diameter was close to 100 nm in the endof this type of particle bursts. Particles of this size are expectedto be able to act as cloud condensation nuclei.
High growth rates (>5 nm h−1) are only observed when thecondensation sink is higher than 1 × 10⁻³ s−1, with an averageof 3.2 × 10⁻³ s−1. This value is similar to that found for non-event days and higher than the average for other events. Possi-ble reasons for the high growth rates and their coexistence with
Tellus 60B (2008), 3
ANALYSIS OF AEROSOL PARTICLE FORMATION EVENTS 363
relatively high condensation sinks are discussed—the condensa-tion sink being connected to the same source as the condensingvapour source or being found along the same trajectory, or asynergistic effect between locally emitted precursors and longrange transported compounds. However, local phenomena andmixing processes cannot be excluded as reasons for apparentlyhigh growth rates. At this stage, no conclusions on the reasonfor the high growth rates observed at this subarctic site can bedrawn, and further investigations of this phenomenon is stronglyrecommended.
5. Acknowledgments
This work is supported by the European Commission via a MarieCurie Excellence Team Grant and by the Swedish ResearchCouncil. M. Dal Maso wishes to thank the Maj and Tor Nesslingfoundation for financial support. We would also like to acknowl-edge the support from BACCI Nordic Centre of Excellence andAbisko Scientific Research Station. The authors gratefully ac-knowledge the NOAA Air Resources Laboratory (ARL) for theprovision of the HYSPLIT transport and dispersion model andREADY website (http://www.arl.noaa.gov/ready.html) used inthis publication. In addition, we want to thank Thomas Friborgfor letting us use his temperature and relative humidity data.
References
Andreae, M. O., Jones, C. D. and Cox, P. M. 2005. Strong present-day aerosol cooling implies a hot future. Nature 435, 1187–1190,doi:1110.1038/nature03671.
Andreae, M. O. 2007. Aerosols before pollution. Science 315, 51–52.Birmili, W., Stratmann, F. and Wiedensohler, A. 1999. Design of a DMA-
based size spectrometer for a large particle size range and stable op-eration. J. Aerosol Sci. 30, 549–553.
Brook, R. D., Franklin, B., Cascio, W., Hong, Y. L., Howard, G. and co-authors. 2004. Air pollution and cardiovascular disease – a statementfor healthcare professionals from the expert panel on population andprevention science of the American Heart Association. Circulation109, 2655–2671.
Chapin, F. S., III, Callaghan, T. V., Bergeron, Y., Fukuda, M., Johnstone,J. F. and co-authors. 2004. Global change and the boreal forest: thresh-olds, shifting states or gradual change? AMBIO, J. Human Environ.33, 361–365.
Christensen, T. R., Johansson, T., Åkerman, H. J. and Mas-tepanov, M. 2004. Thawing sub-arctic permafrost: effects onvegetation and methane emissions. Geophys. Res. Lett. 31,doi:10.1029/2003GJ018680.
Claeys, M., Graham, B., Vas, G., Wang, W., Vermeylen, R. and co-authors. 2004. Formation of secondary organic aerosols through pho-tooxidation of isoprene. Science 303, 1173–1176.
Dal Maso, M., Kulmala, M., Riipinen, I., Wagner, R., Hussein, T. and co-authors. 2005. Formation and growth of fresh atmospheric aerosols:eight years of aerosol size distribution data from SMEAR II, Hyytiala,Finland. Boreal Environ. Res. 10, 323–336.
Dal Maso, M., Sogacheva, L., Aalto, P., Riipinen, I., Komppula, M.and co-authors. 2007. Aerosol size distribution measurements at four
Nordic field stations: identification, analysis and trajectory analysisof new particle formation bursts. Tellus 59B, 350–361.
Dockery, D. W. and Pope, C. A. III. 1994. Acute respiratory affectsof particulate air pollution. Ann. Rev. Public Health 15, 107–132.
Draxler, R. R. and Rolph, G. D. 2003. HYSPLIT (HYbrid Single-Particle Lagrangian Integrated Trajectory) Model access via NOAAARL READY.NOAA Air Resources Laboratory, Silver Spring, MD.Available at http://www.arl.noaa.gov/ready/hysplit4.html.
Hakola, H., Rinne, J. and Laurila, T. 1998. The hydrocarbon emissionrates of tea-leafed willow (Salix phylicifolia), silver birch (Betulapendula) and European aspen (Populus tremula). Atmos. Environ. 32,1825–1833.
Hellen, H., Hakola, H., Pystynen, K.-H., Rinne, J. and Haapanala, S.2005. C2-C10 hydrocarbon emissions from a boreal wetland and forestfloor. Biogeosci. Discuss. 2, 1795–1814.
Hussein, T., Dal Maso, M., Petaja, T., Koponen, I. K., Paatero, P. andco-authors. 2005. Evaluation of an automatic algorithm for fittingthe particle number size distributions. Boreal Environ. Res. 10, 337–355.
Hyvarinen, A.-P., Komppula, M., Engler, C., Kivikas, N., Kerminen,V. M. and co-authors. 2008. Atmospheric new particle forma-tion at Uto, Baltic Sea 2003–2005. Tellus 60B, doi:10.1111/j.1600-0889.2008.00343.x.
IPCC 2007. Climate Change 2007 – The Physical Science Basi: Con-tribution of Working Group I to the Fourth Assessment Report of theIPCC. Cambridge University Press, Cambridge, UK.
Janson, R. and De Serves, C. 1998. Isoprene emissions from borealwetlands in Scandinavia. J. Geophys. Res. 103, 25 513–25 517.
Kanakidou, M., Tsigaridis, K., Dentener, F. J. and Crutzen, P. J. 2000.Human-activity-enhanced formation of organic aerosols by biogenichydrocarbon oxidation. J. Geophys. Res. 105, 9243–9254.
Kavouras, I. G., Mihalopoulos, N. and Stephanou, E. G. 1998. Forma-tion of atmospheric particles from organic acids produced by forests.Nature 395, 683–686.
Komppula, M., Vana, M., Kerminen, V. M., Lihavainen, H., Viisanen,Y. and co-authors. 2007. Size distributions of atmospheric ions in theBaltic region. Boreal Environ. Res. 12, 323–336.
Kristensson, A., Dal Maso, M., Swietlicki, E., Hussein, T., Zhou, J. andco-authors. 2008. Characterization of new particle formation eventsat a background site in southern Sweden: relation to air mass history.Tellus 60B, doi:10.1111/j.1600-0889.2008.00345.x.
Kulmala, M. 2003. How particles nucleate and grow. Science 302, 1000–1001.
Kulmala, M., Pirjola, L. and Makela, J. M. 2000. Stable sulphate clustersas a source of new atmospheric particles. Nature 404, 66–69.
Kulmala, M., Dal Maso, M., Makela, J. M., Pirjola, L., Vakeva, M.and co-authors. 2001. On the formation, growth and composition ofnucleation mode particles. Tellus B 53, 479–490.
Kulmala, M., Laakso, L., Lehtinen, K. E. J., Riipinen, I., Dal Maso, M.and co-authors. 2004a. Initial steps of aerosol growth. Atmos. Chem.Phys. 4, 2553–2560.
Kulmala, M., Suni, T., Lehtinen, K. E. J., Dal Maso, M., Boy, M. and co-authors. 2004b. A new feedback mechanism linking forests, aerosols,and climate. Atmos. Chem. Phys. 4, 557–562.
Kulmala, M., Vehkamaki, H., Petaja, T., Dal Maso, M., Lauri, A. and co-authors. 2004c. Formation and growth rates of ultrafine atmosphericparticles: a review of observations. J. Aerosol Sci. 35, 143–176.
Tellus 60B (2008), 3

364 B. SVENNINGSSON ET AL.
Kulmala, M., Lehtinen, K. E. J., Laakso, L., Mordas, G. and Hameri,K. 2005a. On the existence of neutral atmospheric clusters. BorealEnviron. Res. 10, 79–87.
Kulmala, M., Petaja, T., Monkkonen, P., Koponen, I. K., Dal Maso, M.and co-authors. 2005b. On the growh of nucleation mode particles:source rates of condensable vapor in polluted and clean environments.Atmos. Chem. Phys. 5, 409–416.
Kulmala, M., Riipinen, I., Sipila, M., Manninen, H. E., Petaja, T. andco-authors. 2007. Towards direct measurement of atmospheric nucle-ation. Science (Express Reports), doi:10.1126/science.1144124.
Laakso, L., Petaja, T., Lehtinen, K. E. J., Kulmala, M., Paatero, J. andco-authors. 2004. Ion production rate in aboreal forest based on ion,particle and radiation measurements. Atmos. Chem. Phys. 4, 1933–1943.
Makela, J. M., Yli-Koivisto, S., Hiltunen, V., Seidl, W., Swietlicki, E.and co-authors. 2001. Chemical composition of aerosol during particleformation events in boreal forest. Tellus 53B, 380–393.
Mirme, A., Tamm, E., Mordas, G., Vana, M., Uin, J. and co-authors. 2007.A wide-range multi-channel air ion spectrometer. Boreal Environ. Res.12, 247–264.
Nilsson, E. D., Rannik, U., Kulmala, M., Buzorius, G. and O’Dowd, C.D. 2001. Effects of continental boundary layer evolution, convection,turbulence and entrainment, on aerosol formation. Tellus 53B, 441–461.
O’Dowd, C., Aalto, P., Hameri, K., Kulmala, M. and Hoffmann, T. 2002.Atmospheric particles from organic vapours. Nature 416, 497–498.
O’Dowd, C. D., Facchini, M. C., Cavalli, F., Ceburnis, D., Mircea, M. andco-authors. 2004. Biogenically driven organic contribution to marineaerosol. Nature 431, 676–680.
Pope, C. A., III, Burnett, R. T., Thun, M. J., Calle, E. E., Krewski, D.and co-authors. 2002. Lung cancer, cardiopulmonary mortality, long-term exposure to fine particlate air pollution. J. Am. Med. Assoc. 287,1132–1141.
Riipinen, I., Sihto, S.-L., Kulmala, M., Arnold, F., Dal Maso, M. and co-authors. 2007. Connections between atmospheric sulphuric acid andnew particle fomration during QUEST III-IV campaigns in Heidelbergand Hyytiala. Atmos. Chem. Phys. 7, 1899–1914.
Rolph, G. D. 2003. Real-time environmental applications and displaysystem (READY). NOAA Air Resources Laboratory, Silver Spring,MD. Available at http://www.arl.noaa.gov/ready/hysplit4.html.
Sihto, S.-L., Kulmala, M., Kerminen, V. M., Dal Maso, M., Petaja, T. andco-authors. 2006. Atmospheric sulphuric acid and aerosol formation:implications from atmospheric measurements for nucleation and earlygrowth mechanisms. Atmos. Chem. Phys. 6, 4079–4091.
Spracklen, D. V., Carslaw, K. S., Kulmala, M., Kerminen, V. M., Mann,G. W. and co-authors. 2006. The contribution of boundary layer nu-cleation events to total particle concentrations on regional and globlscales. Atmos. Chem. Phys. 6, 5631–5648.
Suni, T., Kulmala, M., Hirsikko, A., Bergman, T., Laakso, L. and co-authors. 2007. Formation and characteristics of ions and chargedaerosol particles in a native Australian Eucalypt forest. Atmos. Chem.Phys. (Discussion) 7, 10 343–10 369.
Svensson, B. H., Christensen, T. R., Johansson, E. and Oquist, M. 1999.Interdecadal variations in CO2 and CH4 exchange of a subarctic mire– Stordalen revisited after 20 years. Oikos 85(1), 22–30.
Tammet, H. 1995. Size and mobility of nanometer particles, clusters, andions. J. Aerosol Sci. 26, 459–475.
Tammet, H. 2006. Continuous scanning of the mobility and size distri-bution of charged cluster and nanometer particles in atmospheric airand the balanced scanning mobility analyzer BSMA. Atmos. Res. 82,523–535.
Tunved, P., Hansson, H. C., Kerminen, V. M., Strom, J., Dal Maso, M.and co-authors. 2006. High natural aerosol loading over boreal forests.Science 312, 261–263.
Vartiainen, E., Kulmala, M., Ehn, M., Hirsikkko, A., Junninen, H. andco-authors. 2007. Ion and particle number concentrations and sizedistributions along the Trans-Siberian railroad. Boreal Environ. Res.12, 375–396.
Venzac, H., Sellegri, K. and Laj, P. 2007. Nucleation events detected atthe high altitude site of the Puy de Dome Research Station, France.Boreal Environ. Res. 12, 345–360.
Weber, R. J., Eisele, F. L., Marti, J. J., Tanner, T. and Jefferson, A. 1996.Measured atmospheric new particle formation rates: implications fornucleation mechanisms. Chem. Eng. Commun. 151, 53–64.
Tellus 60B (2008), 3