Advances in Food Rheology and Its Applications - UNISEL ...
505
Advances in Food Rheology and Its Applications
-
Upload
khangminh22 -
Category
Documents
-
view
0 -
download
0
Transcript of Advances in Food Rheology and Its Applications - UNISEL ...

Title
Advances in Food Rheology and Its Applications

Related Titles
Multisensory Flavor Perception(978-0-08-100350-3)
Modifying Food Texture, Volume 1(978-1-78242-333-1)
Modifying Food Texture, Volume 2(978-1-78242-334-8)

Woodhead Publishing Series in Food Science, Technology and Nutrition
Advances in Food Rheology and Its Applications
Editor
J. AhmedFood and Nutrition Program Environment and Life Sciences Research Center Kuwait Institute for Scientific Research Kuwait City, Kuwait
Associate Editors
P. PtaszekDepartment of Engineering and Machinery for Food Industry Faculty of Food Technology, Agricultural University in Cracow Krakow, Poland
S. BasuDr. S.S. Bhatnagar University Institute of Chemical Engineering & Technology Panjab University, Chandigarh, Panjab, India
AMSTERDAM • BOSTON • HEIDELBERG • LONDONNEW YORK • OXFORD • PARIS • SAN DIEGO
SAN FRANCISCO • SINGAPORE • SYDNEY • TOKYO
Woodhead Publishing is an imprint of Elsevier

Woodhead Publishing is an imprint of ElsevierThe Officers’ Mess Business Centre, Royston Road, Duxford, CB22 4QH, United Kingdom50 Hampshire Street, 5th Floor, Cambridge, MA 02139, United StatesThe Boulevard, Langford Lane, Kidlington, OX5 1GB, United Kingdom
Copyright © 2017 Elsevier Ltd. All rights reserved.
No part of this publication may be reproduced or transmitted in any form or by any means, electronic or mechanical, including photocopying, recording, or any information storage and retrieval system, without permission in writing from the publisher. Details on how to seek permission, further information about the Publisher’s permissions policies and our arrangements with organizations such as the Copyright Clearance Center and the Copyright Licensing Agency, can be found at our website: www.elsevier.com/permissions.
This book and the individual contributions contained in it are protected under copyright by the Publisher (other than as may be noted herein).
NoticesKnowledge and best practice in this field are constantly changing. As new research and experience broaden our understanding, changes in research methods, professional practices, or medical treatment may become necessary.
Practitioners and researchers must always rely on their own experience and knowledge in evaluat-ing and using any information, methods, compounds, or experiments described herein. In using such information or methods they should be mindful of their own safety and the safety of others, including parties for whom they have a professional responsibility.
To the fullest extent of the law, neither the Publisher nor the authors, contributors, or editors, assume any liability for any injury and/or damage to persons or property as a matter of products liability, negligence or otherwise, or from any use or operation of any methods, products, instructions, or ideas contained in the material herein.
Library of Congress Cataloging-in-Publication DataA catalog record for this book is available from the Library of Congress
British Library Cataloguing-in-Publication DataA catalogue record for this book is available from the British Library
ISBN: 978-0-08-100431-9 (print)ISBN: 978-0-08-100432-6 (online)
For information on all Woodhead publications visit our website at https://www.elsevier.com/
Copyright
Publisher: Nikki LevyAcquisitions Editor: Rob SykesEditorial Project Manager: Karen MillerProduction Project Manager: Chris WortleyDesigner: Mark Rogers
Typeset by Thomson Digital

xiii
List of Contributors
J. Ahmed, Dr. S.S. Bhatnagar University, Institute of Chemical Engineering and Tech-nology, Panjab University, Chandigarh, Panjab, India; Food and Nutrition Program, Environment and Life Sciences Research Center, Kuwait Institute for Scientific Re-search, Kuwait City, Kuwait
A. Asghar, National Institute of Food Science & Technology, University of Agriculture, Faisalabad, Pakistan
A. Aslam Maan, National Institute of Food Science & Technology, University of Agri-culture, Faisalabad, Pakistan
A. Bannikova, School of Applied Sciences, RMIT University, Melbourne, Vic, Australia
S. Basu, Dr. S.S. Bhatnagar University, Institute of Chemical Engineering & Technol-ogy, Panjab University, Chandigarh, Panjab, India
P. Chakraborty, Dr. S.S. Bhatnagar University, Institute of Chemical Engineering & Technology, Panjab University, Chandigarh, Panjab, India
V. Glicerina, Interdepartmental Centre for Agri-Food Industrial Research, Alma Mater Studiorum, University of Bologna, Cesena (FC), Italy
M.J. Hernández, Department of Earth Physics and Thermodynamics, Faculties of Physics and Pharmacy, University of Valencia, Valencia, Spain
M. Houška, Food Research Institute Prague, Prague, Czech Republic
S. Kasapis, School of Applied Sciences, RMIT University, Melbourne, Vic, Australia
K. Muthukumarappan, Department of Agriculture and Biosystems Engineering, South Dakota State University, Brookings, SD, United States
S. Naji-Tabasi, Food Hydrocolloids Research Centre, Department of Food Science and Technology, Ferdowsi University of Mashhad (FUM), Mashhad, Iran
A. Nazir, National Institute of Food Science & Technology, University of Agriculture, Faisalabad, Pakistan
S. Pérez-Quirce, Department of Agriculture and Forestry Engineering, Food Technol-ogy, College of Agricultural and Forestry Engineering, University of Valladolid, Palencia, Spain
S. Prakash, The University of Queensland, Brisbane, QLD, Australia
P. Ptaszek, Dr. S.S. Bhatnagar University, Institute of Chemical Engineering and Tech-nology, Panjab University, Chandigarh, Panjab, India; Department of Engineering and Machinery for Food Industry, Faculty of Food Technology, Agricultural Univer-sity in Cracow, Krakow, Poland

xiv List of Contributors
S.M.A. Razavi, Food Hydrocolloids Research Centre, Department of Food Science and Technology, Ferdowsi University of Mashhad (FUM), Mashhad, Iran
S. Romani, Interdepartmental Centre for Agri-Food Industrial Research, Alma Mater Studiorum, University of Bologna; Department of Agri-Food Science and Technol-ogy, Alma Mater Studiorum, University of Bologna, Cesena (FC), Italy
F. Ronda, Department of Agriculture and Forestry Engineering, Food Technology, College of Agricultural and Forestry Engineering, University of Valladolid, Palen-cia, Spain
S. Różańska, Department of Chemical Engineering and Equipment, Faculty of Chemi-cal Technology, Poznan University of Technology, Poznan, Poland
S. Sahin, Middle East Technical University, Department of Food Engineering, Ankara, Turkey
A. Salvador, Institute of Agricultural Chemistry and Food Technology (IATA-CSIC), Valencia, Spain
T. Sanz, Institute of Agricultural Chemistry and Food Technology (IATA-CSIC), Valencia, Spain
U.S. Shivhare, Dr. S.S. Bhatnagar University, Institute of Chemical Engineering & Technology, Panjab University, Chandigarh, Panjab, India
G. Sumnu, Middle East Technical University, Department of Food Engineering, Ankara, Turkey
G.J. Swamy, Department of Agriculture and Biosystems Engineering, South Dakota State University, Brookings, SD, United States
B.C. Tatar, Middle East Technical University, Department of Food Engineering, Ankara, Turkey
E. Tornberg, Department of Food Technology, Engineering and Nutrition, Lund University, Lund, Sweden
G. Tucker, Baking and Cereal Processing Department, Campden BRI, Chipping Campden, Glos, United Kingdom
M. Villanueva, Department of Agriculture and Forestry Engineering, Food Technology, College of Agricultural and Forestry Engineering, University of Valladolid, Palencia, Spain
R. Žitný, Czech Technical University in Prague, Prague, Czech Republic

xv
Woodhead Publishing Series in Food Science, Technology and Nutrition
Chilled foods: A comprehensive guideEdited by C. Dennis and M. Stringer
Yoghurt: Science and technologyA. Y. Tamime and R. K. Robinson
Food processing technology: Principles and practiceP. J. Fellows
Bender’s dictionary of nutrition and food technology Sixth editionD. A. Bender
Determination of veterinary residues in foodEdited by N. T. Crosby
Food contaminants: Sources and surveillanceEdited by C. Creaser and R. Purchase
Nitrates and nitrites in food and waterEdited by M. J. Hill
Pesticide chemistry and bioscience: The food-environment challengeEdited by G. T. Brooks and T. Roberts
Pesticides: Developments, impacts and controlsEdited by G. A. Best and A. D. Ruthven
Dietary fibre: Chemical and biological aspectsEdited by D. A. T. Southgate, K. W. Waldron, I. T. Johnson and G. R. Fenwick
Vitamins and minerals in health and nutritionM. Tolonen
Technology of biscuits, crackers and cookies Second editionD. Manley
Instrumentation and sensors for the food industryEdited by E. Kress-Rogers
Food and cancer prevention: Chemical and biological aspectsEdited by K. W. Waldron, I. T. Johnson and G. R. Fenwick
Food colloids: Proteins, lipids and polysaccharidesEdited by E. Dickinson and B. Bergenstahl
Food emulsions and foamsEdited by E. Dickinson

xvi Woodhead Publishing Series in Food Science, Technology and Nutrition
Maillard reactions in chemistry, food and healthEdited by T. P. Labuza, V. Monnier, J. Baynes and J. O’Brien
The Maillard reaction in foods and medicineEdited by J. O’Brien, H. E. Nursten, M. J. Crabbe and J. M. Ames
Encapsulation and controlled releaseEdited by D. R. Karsa and R. A. Stephenson
Flavours and fragrancesEdited by A. D. Swift
Feta and related cheesesEdited by A. Y. Tamime and R. K. Robinson
Biochemistry of milk productsEdited by A. T. Andrews and J. R. Varley
Physical properties of foods and food processing systemsM. J. Lewis
Food irradiation: A reference guideV. M. Wilkinson and G. Gould
Kent’s technology of cereals: An introduction for students of food science and agriculture Fourth editionN. L. Kent and A. D. Evers
Biosensors for food analysisEdited by A. O. Scott
Separation processes in the food and biotechnology industries: Principles and applicationsEdited by A. S. Grandison and M. J. Lewis
Handbook of indices of food quality and authenticityR. S. Singhal, P. K. Kulkarni and D. V. Rege
Principles and practices for the safe processing of foodsD. A. Shapton and N. F. Shapton
Biscuit, cookie and cracker manufacturing manuals Volume 1: IngredientsD. Manley
Biscuit, cookie and cracker manufacturing manuals Volume 2: Biscuit doughsD. Manley
Biscuit, cookie and cracker manufacturing manuals Volume 3: Biscuit dough piece formingD. Manley
Biscuit, cookie and cracker manufacturing manuals Volume 4: Baking and cooling of biscuitsD. Manley
Biscuit, cookie and cracker manufacturing manuals Volume 5: Secondary processing in biscuit manufacturingD. Manley
Biscuit, cookie and cracker manufacturing manuals Volume 6: Biscuit packaging and storageD. Manley
Practical dehydration Second editionM. Greensmith

Woodhead Publishing Series in Food Science, Technology and Nutrition xvii
Lawrie’s meat science Sixth editionR. A. Lawrie
Yoghurt: Science and technology Second editionA. Y. Tamime and R. K. Robinson
New ingredients in food processing: Biochemistry and agricultureG. Linden and D. Lorient
Benders’ dictionary of nutrition and food technology Seventh editionD. A. Bender and A. E. Bender
Technology of biscuits, crackers and cookies Third editionD. Manley
Food processing technology: Principles and practice Second editionP. J. Fellows
Managing frozen foodsEdited by C. J. Kennedy
Handbook of hydrocolloidsEdited by G. O. Phillips and P. A. Williams
Food labellingEdited by J. R. Blanchfield
Cereal biotechnologyEdited by P. C. Morris and J. H. Bryce
Food intolerance and the food industryEdited by T. Dean
The stability and shelf-life of foodEdited by D. Kilcast and P. Subramaniam
Functional foods: Concept to productEdited by G. R. Gibson and C. M. Williams
Chilled foods: A comprehensive guide Second editionEdited by M. Stringer and C. Dennis
HACCP in the meat industryEdited by M. Brown
Biscuit, cracker and cookie recipes for the food industryD. Manley
Cereals processing technologyEdited by G. Owens
Baking problems solvedS. P. Cauvain and L. S. Young
Thermal technologies in food processingEdited by P. Richardson
Frying: Improving qualityEdited by J. B. Rossell
Food chemical safety Volume 1: ContaminantsEdited by D. Watson
Making the most of HACCP: Learning from others’ experienceEdited by T. Mayes and S. Mortimore

xviii Woodhead Publishing Series in Food Science, Technology and Nutrition
Food process modellingEdited by L. M. M. Tijskens, M. L. A. T. M. Hertog and B. M. Nicolaï
EU food law: A practical guideEdited by K. Goodburn
Extrusion cooking: Technologies and applicationsEdited by R. Guy
Auditing in the food industry: From safety and quality to environmental and other auditsEdited by M. Dillon and C. Griffith
Handbook of herbs and spices Volume 1Edited by K. V. Peter
Food product development: Maximising successM. Earle, R. Earle and A. Anderson
Instrumentation and sensors for the food industry Second editionEdited by E. Kress-Rogers and C. J. B. Brimelow
Food chemical safety Volume 2: AdditivesEdited by D. Watson
Fruit and vegetable biotechnologyEdited by V. Valpuesta
Foodborne pathogens: Hazards, risk analysis and controlEdited by C. de W. Blackburn and P. J. McClure
Meat refrigerationS. J. James and C. James
Lockhart and Wiseman’s crop husbandry Eighth editionH. J. S. Finch, A. M. Samuel and G. P. F. Lane
Safety and quality issues in fish processingEdited by H. A. Bremner
Minimal processing technologies in the food industriesEdited by T. Ohlsson and N. Bengtsson
Fruit and vegetable processing: Improving qualityEdited by W. Jongen
The nutrition handbook for food processorsEdited by C. J. K. Henry and C. Chapman
Colour in food: Improving qualityEdited by D. MacDougall
Meat processing: Improving qualityEdited by J. P. Kerry, J. F. Kerry and D. A. Ledward
Microbiological risk assessment in food processingEdited by M. Brown and M. Stringer
Performance functional foodsEdited by D. Watson
Functional dairy products Volume 1Edited by T. Mattila-Sandholm and M. Saarela
Taints and off-flavours in foodsEdited by B. Baigrie

Woodhead Publishing Series in Food Science, Technology and Nutrition xix
Yeasts in foodEdited by T. Boekhout and V. Robert
Phytochemical functional foodsEdited by I. T. Johnson and G. Williamson
Novel food packaging techniquesEdited by R. Ahvenainen
Detecting pathogens in foodEdited by T. A. McMeekin
Natural antimicrobials for the minimal processing of foodsEdited by S. Roller
Texture in food Volume 1: Semi-solid foodsEdited by B. M. McKenna
Dairy processing: Improving qualityEdited by G. Smit
Hygiene in food processing: Principles and practiceEdited by H. L. M. Lelieveld, M. A. Mostert, B. White and J. Holah
Rapid and on-line instrumentation for food quality assuranceEdited by I. Tothill
Sausage manufacture: Principles and practiceE. Essien
Environmentally-friendly food processingEdited by B. Mattsson and U. Sonesson
Bread making: Improving qualityEdited by S. P. Cauvain
Food preservation techniquesEdited by P. Zeuthen and L. Bøgh-Sørensen
Food authenticity and traceabilityEdited by M. Lees
Analytical methods for food additivesR. Wood, L. Foster, A. Damant and P. Key
Handbook of herbs and spices Volume 2Edited by K. V. Peter
Texture in food Volume 2: Solid foodsEdited by D. Kilcast
Proteins in food processingEdited by R. Yada
Detecting foreign bodies in foodEdited by M. Edwards
Understanding and measuring the shelf-life of foodEdited by R. Steele
Poultry meat processing and qualityEdited by G. Mead
Functional foods, ageing and degenerative diseaseEdited by C. Remacle and B. Reusens

xx Woodhead Publishing Series in Food Science, Technology and Nutrition
Mycotoxins in food: Detection and controlEdited by N. Magan and M. Olsen
Improving the thermal processing of foodsEdited by P. Richardson
Pesticide, veterinary and other residues in foodEdited by D. Watson
Starch in food: Structure, functions and applicationsEdited by A.-C. Eliasson
Functional foods, cardiovascular disease and diabetesEdited by A. Arnoldi
Brewing: Science and practiceD. E. Briggs, P. A. Brookes, R. Stevens and C. A. Boulton
Using cereal science and technology for the benefit of consumers: Proceedings of the 12PthP International ICC Cereal and Bread Congress, 24 – 26PthP May, 2004, Harrogate, UKEdited by S. P. Cauvain, L. S. Young and S. Salmon
Improving the safety of fresh meatEdited by J. Sofos
Understanding pathogen behaviour: Virulence, stress response and resistanceEdited by M. Griffiths
The microwave processing of foodsEdited by H. Schubert and M. Regier
Food safety control in the poultry industryEdited by G. Mead
Improving the safety of fresh fruit and vegetablesEdited by W. Jongen
Food, diet and obesityEdited by D. Mela
Handbook of hygiene control in the food industryEdited by H. L. M. Lelieveld, M. A. Mostert and J. Holah
Detecting allergens in foodEdited by S. Koppelman and S. Hefle
Improving the fat content of foodsEdited by C. Williams and J. Buttriss
Improving traceability in food processing and distributionEdited by I. Smith and A. Furness
Flavour in foodEdited by A. Voilley and P. Etievant
The Chorleywood bread processS. P. Cauvain and L. S. Young
Food spoilage microorganismsEdited by C. de W. Blackburn
Emerging foodborne pathogensEdited by Y. Motarjemi and M. Adams
Benders’ dictionary of nutrition and food technology Eighth editionD. A. Bender

Woodhead Publishing Series in Food Science, Technology and Nutrition xxi
Optimising sweet taste in foodsEdited by W. J. Spillane
Brewing: New technologiesEdited by C. Bamforth
Handbook of herbs and spices Volume 3Edited by K. V. Peter
Lawrie’s meat science Seventh editionR. A. Lawrie in collaboration with D. A. Ledward
Modifying lipids for use in foodEdited by F. Gunstone
Meat products handbook: Practical science and technologyG. Feiner
Food consumption and disease risk: Consumer–pathogen interactionsEdited by M. Potter
Acrylamide and other hazardous compounds in heat-treated foodsEdited by K. Skog and J. Alexander
Managing allergens in foodEdited by C. Mills, H. Wichers and K. Hoffman-Sommergruber
Microbiological analysis of red meat, poultry and eggsEdited by G. Mead
Maximising the value of marine by-productsEdited by F. Shahidi
Chemical migration and food contact materialsEdited by K. Barnes, R. Sinclair and D. Watson
Understanding consumers of food productsEdited by L. Frewer and H. van Trijp
Reducing salt in foods: Practical strategiesEdited by D. Kilcast and F. Angus
Modelling microorganisms in foodEdited by S. Brul, S. Van Gerwen and M. Zwietering
Tamime and Robinson’s Yoghurt: Science and technology Third editionA. Y. Tamime and R. K. Robinson
Handbook of waste management and co-product recovery in food processing Volume 1Edited by K. W. Waldron
Improving the flavour of cheeseEdited by B. Weimer
Novel food ingredients for weight controlEdited by C. J. K. Henry
Consumer-led food product developmentEdited by H. MacFie
Functional dairy products Volume 2Edited by M. Saarela
Modifying flavour in foodEdited by A. J. Taylor and J. Hort

xxii Woodhead Publishing Series in Food Science, Technology and Nutrition
Cheese problems solvedEdited by P. L. H. McSweeney
Handbook of organic food safety and qualityEdited by J. Cooper, C. Leifert and U. Niggli
Understanding and controlling the microstructure of complex foodsEdited by D. J. McClements
Novel enzyme technology for food applicationsEdited by R. Rastall
Food preservation by pulsed electric fields: From research to applicationEdited by H. L. M. Lelieveld and S. W. H. de Haan
Technology of functional cereal productsEdited by B. R. Hamaker
Case studies in food product developmentEdited by M. Earle and R. Earle
Delivery and controlled release of bioactives in foods and nutraceuticalsEdited by N. Garti
Fruit and vegetable flavour: Recent advances and future prospectsEdited by B. Brückner and S. G. Wyllie
Food fortification and supplementation: Technological, safety and regulatory aspectsEdited by P. Berry Ottaway
Improving the health-promoting properties of fruit and vegetable productsEdited by F. A. Tomás-Barberán and M. I. Gil
Improving seafood products for the consumerEdited by T. Børresen
In-pack processed foods: Improving qualityEdited by P. Richardson
Handbook of water and energy management in food processingEdited by J. Klemeš, R.. Smith and J.-K. Kim
Environmentally compatible food packagingEdited by E. Chiellini
Improving farmed fish quality and safetyEdited by Ø. Lie
Carbohydrate-active enzymesEdited by K.-H. Park
Chilled foods: A comprehensive guide Third editionEdited by M. Brown
Food for the ageing populationEdited by M. M. Raats, C. P. G. M. de Groot and W. A Van Staveren
Improving the sensory and nutritional quality of fresh meatEdited by J. P. Kerry and D. A. Ledward
Shellfish safety and qualityEdited by S. E. Shumway and G. E. Rodrick
Functional and speciality beverage technologyEdited by P. Paquin

Woodhead Publishing Series in Food Science, Technology and Nutrition xxiii
Functional foods: Principles and technologyM. Guo
Endocrine-disrupting chemicals in foodEdited by I. Shaw
Meals in science and practice: Interdisciplinary research and business applicationsEdited by H. L. Meiselman
Food constituents and oral health: Current status and future prospectsEdited by M. Wilson
Handbook of hydrocolloids Second editionEdited by G. O. Phillips and P. A. Williams
Food processing technology: Principles and practice Third editionP. J. Fellows
Science and technology of enrobed and filled chocolate, confectionery and bakery productsEdited by G. Talbot
Foodborne pathogens: Hazards, risk analysis and control Second editionEdited by C. de W. Blackburn and P. J. McClure
Designing functional foods: Measuring and controlling food structure breakdown and absorptionEdited by D. J. McClements and E. A. Decker
New technologies in aquaculture: Improving production efficiency, quality and environmental managementEdited by G. Burnell and G. Allan
More baking problems solvedS. P. Cauvain and L. S. Young
Soft drink and fruit juice problems solvedP. Ashurst and R. Hargitt
Biofilms in the food and beverage industriesEdited by P. M. Fratamico, B. A. Annous and N. W. Gunther
Dairy-derived ingredients: Food and neutraceutical usesEdited by M. Corredig
Handbook of waste management and co-product recovery in food processing Volume 2Edited by K. W. Waldron
Innovations in food labellingEdited by J. Albert
Delivering performance in food supply chainsEdited by C. Mena and G. Stevens
Chemical deterioration and physical instability of food and beveragesEdited by L. H. Skibsted, J. Risbo and M. L. Andersen
Managing wine quality Volume 1: Viticulture and wine qualityEdited by A. G. Reynolds
Improving the safety and quality of milk Volume 1: Milk production and processingEdited by M. Griffiths
Improving the safety and quality of milk Volume 2: Improving quality in milk productsEdited by M. Griffiths

xxiv Woodhead Publishing Series in Food Science, Technology and Nutrition
Cereal grains: Assessing and managing qualityEdited by C. Wrigley and I. Batey
Sensory analysis for food and beverage quality control: A practical guideEdited by D. Kilcast
Managing wine quality Volume 2: Oenology and wine qualityEdited by A. G. Reynolds
Winemaking problems solvedEdited by C. E. Butzke
Environmental assessment and management in the food industryEdited by U. Sonesson, J. Berlin and F. Ziegler
Consumer-driven innovation in food and personal care productsEdited by S. R. Jaeger and H. MacFie
Tracing pathogens in the food chainEdited by S. Brul, P. M. Fratamico and T. A. McMeekin
Case studies in novel food processing technologies: Innovations in processing, packaging, and predictive modellingEdited by C. J. Doona, K. Kustin and F. E. Feeherry
Freeze-drying of pharmaceutical and food productsT.-C. Hua, B.-L. Liu and H. Zhang
Oxidation in foods and beverages and antioxidant applications Volume 1: Understanding mechanisms of oxidation and antioxidant activityEdited by E. A. Decker, R. J. Elias and D. J. McClements
Oxidation in foods and beverages and antioxidant applications Volume 2: Management in different industry sectorsEdited by E. A. Decker, R. J. Elias and D. J. McClements
Protective cultures, antimicrobial metabolites and bacteriophages for food and beverage biopreservationEdited by C. Lacroix
Separation, extraction and concentration processes in the food, beverage and nutraceutical industriesEdited by S. S. H. Rizvi
Determining mycotoxins and mycotoxigenic fungi in food and feedEdited by S. De Saeger
Developing children’s food productsEdited by D. Kilcast and F. Angus
Functional foods: Concept to product Second editionEdited by M. Saarela
Postharvest biology and technology of tropical and subtropical fruits Volume 1: Fundamental issuesEdited by E. M. Yahia
Postharvest biology and technology of tropical and subtropical fruits Volume 2: Açai to citrusEdited by E. M. Yahia
Postharvest biology and technology of tropical and subtropical fruits Volume 3: Cocona to mangoEdited by E. M. Yahia

Woodhead Publishing Series in Food Science, Technology and Nutrition xxv
Postharvest biology and technology of tropical and subtropical fruits Volume 4: Mangosteen to white sapoteEdited by E. M. Yahia
Food and beverage stability and shelf lifeEdited by D. Kilcast and P. Subramaniam
Processed Meats: Improving safety, nutrition and qualityEdited by J. P. Kerry and J. F. Kerry
Food chain integrity: A holistic approach to food traceability, safety, quality and authenticityEdited by J. Hoorfar, K. Jordan, F. Butler and R. Prugger
Improving the safety and quality of eggs and egg products Volume 1Edited by Y. Nys, M. Bain and F. Van Immerseel
Improving the safety and quality of eggs and egg products Volume 2Edited by F. Van Immerseel, Y. Nys and M. Bain
Animal feed contamination: Effects on livestock and food safetyEdited by J. Fink-Gremmels
Hygienic design of food factoriesEdited by J. Holah and H. L. M. Lelieveld
Manley’s technology of biscuits, crackers and cookies Fourth editionEdited by D. Manley
Nanotechnology in the food, beverage and nutraceutical industriesEdited by Q. Huang
Rice quality: A guide to rice properties and analysisK. R. Bhattacharya
Advances in meat, poultry and seafood packagingEdited by J. P. Kerry
Reducing saturated fats in foodsEdited by G. Talbot
Handbook of food proteinsEdited by G. O. Phillips and P. A. Williams
Lifetime nutritional influences on cognition, behaviour and psychiatric illnessEdited by D. Benton
Food machinery for the production of cereal foods, snack foods and confectioneryL.-M. Cheng
Alcoholic beverages: Sensory evaluation and consumer researchEdited by J. Piggott
Extrusion problems solved: Food, pet food and feedM. N. Riaz and G. J. Rokey
Handbook of herbs and spices Second edition Volume 1Edited by K. V. Peter
Handbook of herbs and spices Second edition Volume 2Edited by K. V. Peter
Breadmaking: Improving quality Second editionEdited by S. P. Cauvain

xxvi Woodhead Publishing Series in Food Science, Technology and Nutrition
Emerging food packaging technologies: Principles and practiceEdited by K. L. Yam and D. S. Lee
Infectious disease in aquaculture: Prevention and controlEdited by B. Austin
Diet, immunity and inflammationEdited by P. C. Calder and P. Yaqoob
Natural food additives, ingredients and flavouringsEdited by D. Baines and R. Seal
Microbial decontamination in the food industry: Novel methods and applicationsEdited by A. Demirci and M.O. Ngadi
Chemical contaminants and residues in foodsEdited by D. Schrenk
Robotics and automation in the food industry: Current and future technologiesEdited by D. G. Caldwell
Fibre-rich and wholegrain foods: Improving qualityEdited by J. A. Delcour and K. Poutanen
Computer vision technology in the food and beverage industriesEdited by D.-W. Sun
Encapsulation technologies and delivery systems for food ingredients and nutraceuticals Edited by N. Garti and D. J. McClements
Case studies in food safety and authenticityEdited by J. Hoorfar
Heat treatment for insect control: Developments and applicationsD. Hammond
Advances in aquaculture hatchery technologyEdited by G. Allan and G. Burnell
Open innovation in the food and beverage industryEdited by M. Garcia Martinez
Trends in packaging of food, beverages and other fast-moving consumer goods (FMCG)Edited by N. Farmer
New analytical approaches for verifying the origin of foodEdited by P. Brereton
Microbial production of food ingredients, enzymes and nutraceuticalsEdited by B. McNeil, D. Archer, I. Giavasis and L. Harvey
Persistent organic pollutants and toxic metals in foodsEdited by M. Rose and A. Fernandes
Cereal grains for the food and beverage industriesE. Arendt and E. Zannini
Viruses in food and water: Risks, surveillance and controlEdited by N. Cook
Improving the safety and quality of nutsEdited by L. J. Harris
Metabolomics in food and nutritionEdited by B. C. Weimer and C. Slupsky

Woodhead Publishing Series in Food Science, Technology and Nutrition xxvii
Food enrichment with omega-3 fatty acidsEdited by C. Jacobsen, N. S. Nielsen, A. F. Horn and A.-D. M. Sørensen
Instrumental assessment of food sensory quality: A practical guideEdited by D. Kilcast
Food microstructures: Microscopy, measurement and modellingEdited by V. J. Morris and K. Groves
Handbook of food powders: Processes and propertiesEdited by B. R. Bhandari, N. Bansal, M. Zhang and P. Schuck
Functional ingredients from algae for foods and nutraceuticalsEdited by H. Domínguez
Satiation, satiety and the control of food intake: Theory and practiceEdited by J. E. Blundell and F. Bellisle
Hygiene in food processing: Principles and practice Second editionEdited by H. L. M. Lelieveld, J. Holah and D. Napper
Advances in microbial food safety Volume 1Edited by J. Sofos
Global safety of fresh produce: A handbook of best practice, innovative commercial solutions and case studiesEdited by J. Hoorfar
Human milk biochemistry and infant formula manufacturing technologyEdited by M. Guo
High throughput screening for food safety assessment: Biosensor technologies, hyperspectral imaging and practical applicationsEdited by A. K. Bhunia, M. S. Kim and C. R. Taitt
Foods, nutrients and food ingredients with authorised EU health claims: Volume 1Edited by M. J. Sadler
Handbook of food allergen detection and controlEdited by S. Flanagan
Advances in fermented foods and beverages: Improving quality, technologies and health benefitsEdited by W. Holzapfel
Metabolomics as a tool in nutrition researchEdited by J.-L. Sébédio and L. Brennan
Dietary supplements: Safety, efficacy and qualityEdited by K. Berginc and S. Kreft
Grapevine breeding programs for the wine industryEdited by A. G. Reynolds
Handbook of antimicrobials for food safety and qualityEdited by T. M. Taylor
Managing and preventing obesity: Behavioural factors and dietary interventionsEdited by T. P. Gill
Electron beam pasteurization and complementary food processing technologiesEdited by S. D. Pillai and S. Shayanfar
Advances in food and beverage labelling: Information and regulationsEdited by P. Berryman

xxviii Woodhead Publishing Series in Food Science, Technology and Nutrition
Flavour development, analysis and perception in food and beveragesEdited by J. K. Parker, S. Elmore and L. Methven
Rapid sensory profiling techniques and related methods: Applications in new product development and consumer researchEdited by J. Delarue, J. B. Lawlor and M. Rogeaux
Advances in microbial food safety: Volume 2Edited by J. Sofos
Handbook of antioxidants for food preservationEdited by F. Shahidi
Lockhart and Wiseman’s crop husbandry including grassland: Ninth editionH. J. S. Finch, A. M. Samuel and G. P. F. Lane
Global legislation for food contact materialsEdited by J. S. Baughan
Colour additives for food and beveragesEdited by M. Scotter
A complete course in canning and related processes 14th Edition: Volume 1Revised by S. Featherstone
A complete course in canning and related processes 14th Edition: Volume 2Revised by S. Featherstone
A complete course in canning and related processes 14th Edition: Volume 3Revised by S. Featherstone
Modifying food texture: Volume 1: Novel ingredients and processing techniquesEdited by J. Chen and A. Rosenthal
Modifying food texture: Volume 2: Sensory analysis, consumer requirements and preferencesEdited by J. Chen and A. Rosenthal
Modeling food processing operationsEdited by S. Bakalis, K. Knoerzer and P. J. Fryer
Foods, nutrients and food ingredients with authorised EU health claims Volume 2Edited by M. J. Sadler
Feed and feeding practices in aquacultureEdited by D. Allen Davis
Foodborne parasites in the food supply web: Occurrence and controlEdited by A. Gajadhar
Brewing microbiology: design and technology applications for spoilage management, sensory quality and waste valorisationEdited by A. E. Hill
Specialty oils and fats in food and nutrition: Properties, processing and applicationsEdited by G. Talbot
Improving and tailoring enzymes for food quality and functionalityEdited by R. Yada
Emerging Technologies for Promoting Food Security: Overcoming the World Food CrisisEdited by C. Madramootoo
Innovation and Future Trends in Food Manufacturing and Supply Chain TechnologiesEdited by C. E. Leadley

Woodhead Publishing Series in Food Science, Technology and Nutrition xxix
Functional Dietary Lipids: Food Formulation, Consumer Issues and Innovation for HealthEdited by T. Sanders
Handbook on Natural Pigments in Food and Beverages: Industrial Applications for Improving ColorEdited by R. Carle and R. M. Schweiggert
Integrating the Packaging and Product Experience in Food and Beverages: A Road-Map to Consumer SatisfactionEdited by P. Burgess
The Stability and Shelf Life of Food Second editionEdited by Persis Subramaniam and Peter Wareing
Multisensory Flavor Perception: From Fundamental Neuroscience through to the MarketplaceEdited by Betina Piqueras-Fiszman and Charles Spence
Flavor: From food to behaviors, wellbeing and healthEdited by Andrée Voilley, Christian Salles, Elisabeth Guichard and Patrick Etiévant
Developing Food Products for Consumers with Specific Dietary NeedsEdited by Wayne Morley and Steve Osborn
Advances in Food Traceability Techniques and Technologies: Improving Quality Throughout the Food ChainEdited by Montserrat Espiñeira and J. Francisco Santaclara
Innovative Food Processing Technologies: Extraction, Separation, Component Modification and Process IntensificationEdited by Kai Knoerzer, Pablo Juliano, and Geoffrey Smithers
Steamed Breads: Ingredients, Process and QualitySidi Huang and Diane Miskelly
Handbook of Hygiene Control in the Food Industry, Second EditionEdited by Huub Lelieveld, Domagoj Gabric, and John Holah (Editors)
Handbook for Sensory and Consumer-Driven New Product Development: Innovative Technologies for the Food and Beverage IndustryMaurice O’Sullivan
Early Nutrition and Long-Term Health: Mechanisms, Consequences and OpportunitiesEdited by Jose M. Saavedra and Anne Dattilo
Baking Problems Solved, Second EditionS. P. Cauvain
Non-Equilibrium States and Glass Transitions in FoodEdited by Bhesh Bhandari, Yrjö Roos
New Aspects of Meat Quality: From Genes to EthicsEdited by Peter Purslow
Advances in Food Authenticity TestingEdited by Gerald Downey
Food for the Ageing Population, Second EditionEdited by Monique Raats, Lisette De Groot, Dieneke van Asselt
Microbiological Quality of FoodEdited by Antonio Bevilacqua, Maria Rosaria Corbo and Milena Sinigaglia

xxx Woodhead Publishing Series in Food Science, Technology and Nutrition
Swainson’s Handbook of Technical and Quality Management for the Food Manufacturing SectorEdited by Mark Swainson
Food Protection and SecurityEdited by Shaun Kennedy
Cereal Grains: Assessing and Managing Quality 2eEdited by Colin Wrigley, Ian Batey, Diane Miskelly
Advances in Food Rheology and Its ApplicationsEdited by Jasim Ahmed, Pawel Ptazsek, Santanu Basu

1Advances in Food Rheology and Its Applications. http://dx.doi.org/10.1016/B978-0-08-100431-9.00001-2Copyright © 2017 Elsevier Ltd. All rights reserved.
Chapter 1
Food Rheology: Scientific Development and Importance to Food Industry
J. Ahmed, P. Ptaszek, S. BasuDr. S.S. Bhatnagar University, Institute of Chemical Engineering and Technology, Panjab University, Chandigarh, Panjab, India
Food is a very complex structured material, which is made up of water, proteins, carbohydrates, fats, and significant amount of fibers. All these constituents in-fluence flow and structural behavior of foods significantly, and therefore, rheo-logical properties of food are very dissimilar from the conventional polymeric materials. There are various factors that affect the stability of structured fluids. The viscosity of the liquid phase in dispersions mostly plays a major role in the flow properties of the material. Food rheology is no longer a measurement of apparent viscosity only. With time and advancement in instrumentation, food rheology today provides more in-depth information on microstructure and flu-idity of a food. A transformation of measurement from a rotational viscometry to either controlled stress/strain rheometer or more advanced optimal Fourier transformation rheometry brought the accuracy, sophistication, and reliability on rheological data. There is a growing interest to understand the food micro-structure and its correlation with the food textural and rheological attributes in food product development in academia and food industry. This knowledge on food rheology and microstructure helps in minimizing textural defects in the processed foods and improving consumer satisfaction.
Our book “Advances in Food Rheology and Applications” is thematically divided into two broad areas: theoretical concepts and applications in the areas of food rheology. Chapters 1–10 contribute mainly in the selected theoretical aspects of food rheology, whereas Chapters 11–21 focus on practical applica-tions of rheological concepts in gums, gels, emulsion, and selected commercial food products. Fluid and semisolid food products (eg, mayonnaise, peanut but-ter, chocolate, ketch up) are regularly monitored by rheological testing for the quality maintenance. Both steady and oscillatory rheological tests are used to

2 Food Rheology: Scientific Development and Importance to Food Industry
evaluate these materials regularly. Earlier, measurement and calculation of yield stress for low viscous and slippery food materials was tedious and erroneous; however, with the advent of Vane rheometry, the measurement of yield stress has become convenient and repetitive. Measurement of yield stress of chocolate by various techniques has been discussed in one chapter (Chapter 18). Time dependence of fluid foods can be measured by thixotropy. Thixotropy is a con-tinuous decrease in viscosity with time when flow is applied to a sample that has previously been at rest and the subsequent recovery of viscosity in time when the flow is discontinued. Thixotropic behavior of food is covered in a separate chapter (Chapter 3).
Food rheology mostly focuses on steady-state flow tests, and later it shifts to oscillatory and creep measurement. Oscillatory shear tests can be divided into two regimes: (1) small amplitude oscillatory shear (SAOS) and (2) large ampli-tude oscillatory shear (LAOS) (it measures nonlinear material response). Break down of food structure is the major limitation of the steady-state measurement especially at higher shear rate. To overcome those limitations, SAOS—a nonde-structive rheological technique has been used extensively for the characterization of food materials. SAOS tests are considered the canonical method for probing the linear viscoelastic properties of foods because of its solid theoretical back-ground and the ease of implementing suitable test protocols (Hyun et al., 2011). However, the deformations can be large and rapid for most of the food processing operations, and therefore, the nonlinear material properties that control the system response should be studied. In the linear regime the strain amplitude is very small so that both viscoelastic moduli are independent of strain amplitude and the oscil-latory stress response is sinusoidal whereas at significantly large strain amplitude (LAOS), the material response becomes nonlinear and the material functions used to quantify the linear behavior in SAOS tests are no longer valid. Additionally, another reason for the growing interest in LAOS tests is their usefulness in de-scribing the elastic and viscous properties of complex fluids at large deformations (outside the linear viscoelastic domain), which are closer to real processing and application conditions (Carmona et al., 2014). Again, it has been reported that LAOS measurements are related to the sensory and textural properties of food, which is a topic of great interest (Melito et al., 2013). LAOS measurements of food have been presented in one chapter (Chapter 5).
Creep tests are used for viscoelastic food materials (eg, dough, cheese) to ascertain the texture stability. A creep test depicts the time dependence of a viscoelastic food material. It records a possible structural break down of the test material during creep and recovery phases by applying and removing an instantaneous shear stress for a defined time period. Such test measures rigid-ity/flexibility of a food product, and it plays a significant role in food product development. Creep and recovery are elaborately discussed in various chapters (Chapters 9, 11 and 15) of this book.
Rheological properties of food and biopolymers are significantly influenced by temperature and duration of the measurement. Time–temperature superpo-sition (TTS) is an eminent technique which is used to enlarge the frequency

Food Rheology: Scientific Development and Importance to Food Industry Chapter | 1 3
regime significantly at a reference temperature at which the material is tested. In TTS, isothermal data obtained by frequency sweeps at selected temperatures are shifted along the frequency axis and superimposed to obtain a single “master curve” at the reference temperature. Shift factors achieved during the trans-formation can be employed to verify whether the temperature dependence of the physical changes follows either Arrhenius or Williams Landel and Ferry (WLF) equations. Materials following the TTS principle are termed as “thermo-rheologically simple.” One chapter is devoted to TTS of food and biopolymers (Chapter 9).
Gel plays an important role in food and biopolymers with significant tech-nological interest. Mostly, proteins, starch, and polysaccharides form gel by ap-plying temperature or pressure. Gels are found in various applications ranging from foods to pharmaceuticals. By controlling the gel’s microstructure, a wide variety of physical properties can be attained ranging from hard rubbery plastics to soft hydrogels. Rheologically, gel formation is detected by a gel point. The detection of gel point involves measurements of the complex shear modulus over a range of frequencies, in oscillatory shear. At the gel point, both the elastic and viscous moduli cross each other (G′ = G″) at a particular frequency. Various gels have been described in the book including fruit gels (made from sugar-free artificial sweeteners) (Chapter 13), cheese (an important milk gel derived from enzymatic coagulation) (Chapter 10), and basil seed gum (a new source of hy-drocolloid) (Chapter 16).
Among various types of flows, extensional flow has industrial significance. Measurements of extensional viscosity of liquid foods are important in structur-al characterization, process and quality control of products, and process model-ing and design. One chapter has been devoted for measuring the extensional viscosity of fluids with low and high viscosities. Additionally, typical results of extensional flow measurements of polymer solutions, emulsions, and other fluids are also discussed (Chapter 6).
Food texture has recently been correlated with oral sensory perception. The basic assumptions of this approach are that an eating process is a destructive process involving deformation, flow, fracturing and breaking of the food, and that texture is brain interpretation of the oral sensation of material’s responses and resistances against such deformations. A new area of rheology correlating food texture and rheology has emerged known as tribology. Tribology is about the friction, wear, and lubrication of interacting surfaces which are in relative motion. A limited study has been carried out on oral tribology and oral lubri-cation in relation to food texture and oral sensation. Details are available in a complete chapter (Chapter 4).
Particle size is a decisive parameter that influences inherent food properties, and eventually the quality of the finished food product (Ahmed et al., 2016) Particle size controls the rheological behavior of food either in dispersion or in dough. It has been seen and well documented that a finest particle size slurry/dough behaved completely different from coarse particle enriched dough. Fur-thermore, the properties of the insoluble fiber network in a food matrix are

4 Food Rheology: Scientific Development and Importance to Food Industry
dependent on the amount of water insoluble solids, the area of the large particles and in the concentrated region also on the hardness of the particles. One chapter (Chapter 8) has been included in the book, which deals with the rheology of di-etary fiber (DF) suspensions and how the microstructural properties influence it.
Most of the rheology books do not deal with practical applications in food product developments. There is hardly any singular book where attempts are made to show theoretical concepts of rheology and practical applications in food systems in detail. An impressive development has been observed in the area of food rheology measurement in last two decades and some fields are coming up with huge potential. Areas like tribology, extensional rheology, LAOS measurement, nanoemulsion, gluten-free dough rheology, food gelation have created interest among professionals and food/biopolymer industries. This book provides a comprehensive overview of these most prominent areas of re-search in food rheology. All these topics are compiled in this book, and we do believe the book will be helpful to professionals and students who are interested in the advancement in food rheology.
REFERENCES
Ahmed, J., Taher, A., Mulla, M., Arfat, Y.A., Luciano, G., 2016. Effect of sieve particle size on functional, thermal, rheological and pasting properties of Indian and Turkish lentil flour. J. Food Eng. 186, 34–41.
Carmona, J.A., Ramírez, P., Calero, N., Muñoz, J., 2014. Large amplitude oscillatory shear of xanthan gum solutions. Effect of sodium chloride (NaCl) concentration. J. Food Eng. 126, 165–172.
Hyun, K., Wilhelm, M., Klein, C.O., Cho, K.S., Nam, J.G., Ahn, K.H., Lee, S.J., Ewoldt, R.H., McKinley, G.H., 2011. A review of nonlinear oscillatory shear tests: analysis and application of large amplitude oscillatory shear (LAOS). Prog. Polym. Sci. 36, 1697–1753.
Melito, H., Daubert, C., Foegeding, E., 2013. Relationships between nonlinear viscoelastic behav-ior and rheological, sensory and oral processing behavior of commercial cheese. J. Texture Stud. 44 (2013), 253–288.

7Advances in Food Rheology and Its Applications. http://dx.doi.org/10.1016/B978-0-08-100431-9.00002-4Copyright © 2017 Elsevier Ltd. All rights reserved.
Chapter 2
Rheology and Food Microstructure
S. Kasapis, A. BannikovaSchool of Applied Sciences, RMIT University, Melbourne, Vic, Australia
2.1 SOLUTION RHEOLOGY
Rheology is the study of the deformation and flow of matter. In terms of food, “rheol-ogy is the study of the deformation and flow of the raw materials, the intermediate products, and the final products of the food industry” (Bourne, 2002). Rheological properties are determined in relation to the stress applied on a material and the sub-sequent deformation as a function of time. Key parameters involved in rheological measurements are stress and strain. Stress is the force applied per unit area and the type of stress is determined by the direction of the force on the surface which normal-ly can be either an extension or compression force. Stress is expressed in units of Pa or N/m2 and conventionally denoted by σ. The extent of deformation is represented by the strain (Tabilo-Munizaga and Barbosa-Cánovas, 2005; Launay et al., 1986).
Viscosity (η) is a measure of the resistance to flow of a fluid. It is defined as the ratio of applied shearing stress (τ) to the rate of shear strain (dγ /dt) (or simply as shear rate, γ ):
η τ
γτγ
=d dt
=/
(2.1)
According to the Newton’s law, for an ideal viscous liquid, the applied stress is proportional to the rate of shear strain but is independent of the strain; in other words, the viscosity η is a constant. Such fluid obeys Eq. 2.1 and is called Newtonian fluid. Those polymer solutions or dispersions that do not obey Eq. 2.1 are called non-Newtonian fluids where the viscosity is shear-rate dependent. When the solution viscosity decreases with increasing shear rate, the solution is said to have a shear thin-ning (pseudoplastic) flow behavior (systems with polymeric ingredients/additives at 1–20% solids content); by contrast, if the solution viscosity increases with in-creasing shear rate, the solution has a shear thickening flow behavior (concentrated slurries ≈ 50% native potato starch granules in water) (Lapasin and Pricl, 1995).
γ˙
η=τdγ/dt=τγ˙

8 PART | I Advances in Food Rheology
For some non-Newtonian liquids, flow viscosity may depend on the length of flow time and flow history. It is known that soft biomaterials are character-ized by a three-dimensional structure, which can break down at some level of applied stress. Samples with a yield point have such three-dimensional struc-ture, which breaks once its yield point is reached. The force needed to break the structure is called yield stress (S0). In the case of materials with a three-dimensional structure that doesn’t break down immediately when a force is ap-plied (thixotropic materials), upon application of a constant shear rate, viscosity reaches a peak value and then gradually decreases with time until it reaches a stationary state. This time dependency is the effect of a high degree of dis-solved or dispersed materials. The high concentration of dispersed phase results in a time dependency, since the particles cannot move independently from each other. Thixotropic materials break their structure under shear and rebuild the structure, that is, the viscosity returns to its original value, after termination of the shear with a delayed period rather than instantaneously. As shown in Fig. 2.1, for a typical thixotropic liquid, plot of viscosity versus shear rate forms a hysteresis loop when the viscosity measurement is made first at increasing shear rate followed by a decrease in shear rate (Young and Smart, 1996).
A useful mathematical model for describing shear thinning behavior and thixotropic behavior is the power law model:
γ= +S S k no (2.2)
where n is called the flow behavior index or power law index and k is called the consistency index. Both n and k are concentration dependent. In general, when concentration or molecular weight increases n decreases, but k increases. When concentration approaches zero, n equals 1, the power law relationship returns to the Newton’s law (Eq. 2.1).
The Cross equation can be used to describe both high and low shear rate regions of pseudoplastic solutions, which includes both the zero shear viscosity η0 and the limiting viscosity at infinite shear rate, η∞:
η ηη η
γ−−
=∞
∞k( )m0
(2.3)
S=So+kγ˙n
η0−η∞η−η∞=(kγ˙m)
FIGURE 2.1 Hysteresis loop of shear stress and viscosity versus shear rate for a thixotropic fluid.

Rheology and Food Microstructure Chapter | 2 9
where k is a constant parameter with the dimensions of time and m is a dimen-sionless constant. They are also known as the viscosity coefficient and the index power of the curve, respectively. When η0 > η∞ and η∞ is small, the Cross equation represents a power law relationship (Eq. 2.2). The Cross equation gen-erally describes well the shear-rate dependence of aqueous solutions.
In a dilute solution, each polymer molecule and the solvent associated with it occupy a discrete hydrodynamic domain. Studies of dilute solutions provide fundamental understanding on the effect of molecular properties of biopoly-mers including conformation, molecular weight, and interaction properties. As the concentration increases to a critical point, individual molecular domains be-gin to interpenetrate or overlap with each other. This concentration is called the overlap concentration or critical concentration, c* (de Gennes, 1979). When the polymer concentration (c) exceeds the c*, polymer chains start to interact with each other and form entangled networks; the solution is said to be in the semidi-lute region (Fig. 2.2). This is due to the high total volume occupied by polymer coils, which relates to the number of individual coils present. Therefore, for a given polymer, the viscosity of a semidilute solution increases with molecular weight (Wang and Cui, 2005). The dependence of viscosity on concentration and molecular weight can be well represented by a power law relationship be-tween zero shear specific viscosity, ηsp and c[η]:
η η∞ c( [ ])nsp (2.4)
where intrinsic viscosity, [η], is proportional to molecular weight for a given polymer solvent pair. The parameter c[η] is called the coil overlap parameter,
ηsp∞(c[η])n
FIGURE 2.2 Schematic plot of zero-shear specific viscosity, ηsp versus dimensionless overlap parameter c[η] in a bilogarithmic plot for random coil polysaccharide solutions.

10 PART | I Advances in Food Rheology
which characterizes the space occupancy of polymer molecules in solution. Equation 2.4 is valid for both dilute and semidilute solutions, but with different n values, that is, the slope of the plots.
For almost all disordered coil polymers reported in the literature, the mag-nitude of n is in the range of 1.1–1.4 and 3.0–5.1 for dilute and semidilute solu-tions, respectively. Thus, there is a transition zone from dilute regime (c < c*) to semidilute regime (c > c*), and the concentration c* represents the start of the semidilute regime. The latter can also be considered as the concentration at which the two lines intersect, and then is known as the critical concentration, ccr. For a wide range of polysaccharides, (c[η])cr is found to be in the range of 2.5–4.2. It has been shown that a master curve of log (ηsp) versus log (c[η]) can be drawn for a number of disordered coil polysaccharides varying in structure and molecu-lar weight. The slope of the plot was narrowed even further for disordered coil polysaccharides to be 3.3 when c > c* and 1.4 when c < c* (Morris et al., 1981).
Another important factor that affects the viscosity and flow behavior of bio-polymer solutions is temperature. Under a given shear stress, the rate of flow is determined by polymer chain entanglement/disentanglement and slippage when these pass each other. In most cases, increase of temperature promotes disen-tanglement of the chains, hence viscosity decreases.
2.2 TEXTURE PROFILE ANALYSIS
Texture is a sensory property encompassing many attributes of commercial products, which are based on structural characteristics of various foods. Gener-ally, evaluation of texture is based on the judgement of sensory panels. How-ever, using an instrument such as texture profile analyser (TPA) provides a fast and cost effective way of measuring the texture under well-defined and control conditions (Szczesniak, 2002).
The concept of texture profile analysis was initially introduced by General Foods in the mid-1960s and later it was adapted by Instron Universal Test-ing Machine (IUTM) (Meullenet et al., 1998). TPA is a simple and popular method for determining the fracture properties of systems using uniaxial com-pression. It relates to sensory properties detected by humans, hence imitates the mastication action of the human mouth (Rosenthal, 2010). Testing proce-dure for TPA is based on the concept of large-scale deformation and is used to measure the mechanical characteristics of either solid or semisolid food (Breene, 1975). In this test, a sample of standard size and shape is placed on a base plate and compressed/decompressed twice by an upper plate attached to the drive system. The force versus deformation curve is recorded from which several textural parameters may be extracted, for example, hardness, brittleness, adhesiveness, elasticity, cohesiveness, gumminess, and chewiness (Table 2.1) (Szczesniak, 1963; Friedman et al., 1963; Bourne, 2002).
Hardness is defined as the maximum force that occurs at any time during the first cycle compression. It may occur when the gel initially breaks or later in

Rheology and Food Microstructure Chapter | 2 11
the test as the sample is flattened and deformed. In most cases, hardness is cor-related to the rupture strength or the gel strength of the network and is expressed in units of force (pounds or Newtons). The first significant drop in the force/deformation curve during the first compression cycle is defined as the brittle-ness. It is the point of first fracture or cracking of the sample. Following the
TABLE 2.1 Parameters Measured by Texture Profile Analysis
Parameter Sensorial definition Instrumental definition
Hardness Force required to compress a food between the molars
Elasticity The extent to which a compressed food returns to its original size when the load is removed
Adhesiveness The work required to pull the food away from a surface
Cohesiveness The strength of the internal bonds making up the food
Brittleness The force at which the material fractures. Brittle foods are never adhesive
Chewiness The energy required to chew a solid food until it is ready for swallowing
= Hardness × Cohesiveness × Elasticity
Gumminess The energy required to disintegrate a semisolid food so that it is ready for swallowing.
= Hardness × Cohesiveness
Source: with permission from Rosenthal, 1999
12 PART | I Advances in Food Rheology
first compression cycle, the force is removed from the sample as the machine’s crosshead moves back to its original position. If the material is at all sticky or adhesive, the force becomes negative. The area of this negative peak is taken as a measure of the adhesiveness of the sample.
As the second compression cycle is carried out, the elasticity of the sample is determined. Elasticity is a measure of how much the original structure of the sample was broken down by the initial compression, that is, the length of peak 2 divided by the length of peak 1, and if the sample returned to its original height, the elasticity would be 100%. In sensory terms, it can be thought of as how rub-bery the sample will feel in the mouth. Cohesiveness is measured by taking the total work done on the sample during the second cycle and dividing it by the work done during the first cycle. Samples that are very cohesive will have high values and will be perceived as tough and difficult to break up in the mouth. Gumminess is calculated as hardness × cohesiveness and relates to the energy required to disintegrate a semisolid sample so that it is ready for swallowing. Chewiness is the energy required to chew a solid food until it is ready for swal-lowing and is given by the relationship: hardness × cohesiveness × elasticity.
This type of thinking has been widely utilized in the analysis of processed foods, as illustrated in Fig. 2.3, which is a stress versus strain graph under compression analysis for a hydrocolloid gel, plastic dispersion, and a very
FIGURE 2.3 An idealized graph of stress as a function of strain during compression testing of hydrocolloid gels, plastic dispersions, and viscous solutions. (with permission from Gupta and Kasapis, 1997).

Rheology and Food Microstructure Chapter | 2 13
viscous solution. The following parameters have been found to highly correlate with textural characteristics that are important for the development of novel foods, for example, low-fat dairy spreads (Sanderson et al., 1988; Gupta and Kasapis, 1997; Gupta et al., 1998):
l The maximum stress (σmax), which is the point where the stress goes through a maximum value.
l The maximum strain (εmax), which is the strain at the maximum stress (σmax).l The plastic stress (σp), which is the stress at a horizontal or near-horizontal
portion of the curve at a strain slightly larger than the maximum strain.l The inflection point stress (σi), which is the stress at the inflection point of
the curve where the stress goes through a minimum value following a sharp decrease at a strain larger than the maximum strain (εmax).
l The ratio of inflection point stress to maximum stress (σi /σmax).l The ratio of plastic stress to maximum stress (σp/σmax).
The ratio of plastic stress to maximum stress (σp/σmax) of a plastic disper-sion will clearly be much greater than the ratio of inflectional stress to maximum stress (σi/σmax) of a hydrocolloid gel. The maximum strain (εm) for hydrocol-loid gels will occur over a wide range of strain values (0.1–1.0) depending on the elastic or brittle nature of the gel network. Very viscous solutions produce a smooth stress/strain profile with no apparent signs of yield points on the curve during the compression cycle. It is highly important in the field of low fat spreads to generate products of good spreading properties; these will have textural profiles closely resembling the stress—strain relationship illustrated for the idealized plastic dispersion in Fig. 2.3 (Chronakis and Kasapis, 1995b). It is generally recognized by those skilled in the art that two of the spreadable foods showing the most favored spreading properties are butter and a full fat soft cheese, such as that known by the trade name of “Philadelphia.” These products are, respectively, a fat-continuous emulsion and a water-continuous emulsion, and both show stress–strain profiles similar to the idealized plastic dispersion in Fig. 2.3 (Gupta and Kasapis, 1997).
The textural profile of a good plastic dispersion has been successively used as a guide for the development of a water-continuous spread, which comprises gelling maltodextrin and an aggregate forming proteinaceous agent (mainly dairy) with no more than 20% fat by weight. The components of the spread are selected so that the spread has a ratio of plastic stress to maximum stress (σp/σmax) in the range of 0.95–1 when measured by compression analysis at 5°C at a rate of 0.8 mm/s. It is believed that the σp/σmax ratio measured at 5°C is the most important rheological characteristic when considering spreadability being comparable to those of butter and Philadelphia full-fat soft cheese with σp/σm ratios of 1.00 and 0.98, respectively.
The technique of TPA has also been applied to Greek Feta at different stages of aging. Rheological characteristics of soft Feta at 110 days of storage were σmax ≈ 2.2 kPa, εmax ≈ 17%, σi ≈ 0.7 kPa, and σi/σmax ≈ 0.32. The high values

14 PART | I Advances in Food Rheology
of yield strain argue for a rather elastic structure, which fractures catastrophi-cally thus giving a low stress ratio. By contrast the σi/σmax ratio of a spreadable cheese (eg, full-fat Philadelphia) was between 0.95 and 1.0. Aggregation of the milk proteins with time (300 days) reinforces the strength of the network, which is now capable of achieving at fracture stress values of about 7 kPa. Fracture is particularly sharp and occurs early in the deformation cycle (εmax = 6.8%), a result which demonstrates the brittle nature of mature Feta cheese (Kasapis and Boskou, 2001).
In the case of small goods, examples of rheological profiles are shown in Fig. 2.4. These were obtained at 5°C using a similar compression rate, as for Feta cheese (0.8 mm/s). Clearly, sample deformation requires application of substantial force with the network rupturing at about 8.7 kPa (maximum stress, σmax) for salamis. This occurs late in the compression cycle thus unveiling a rubbery structure with a maximum strain (εmax) value of 40% in a contrast with the brittle nature of mature feta, as discussed earlier. Furthermore, the rubbery fracture is catastrophic and results in a low ratio of inflection to maximum stress (σi/σmax = 0.18). By contrast, sausages exhibit a rather rubbery structure of rela-tively low yields stress and lengthy breaking profile.
FIGURE 2.4 Stress-deformation profiles for Greek salami and traditional sausage taken at 5°C. Compression rate was 0.8 mm/s. (with permission from Kasapis and Boskou, 2001).

Rheology and Food Microstructure Chapter | 2 15
In traditional production situations, the quality of gel-like food products is often assessed simply by squeezing, prodding with the finger, or shaking. Adop-tion of texture profile analysis provides reliable readings for the most common characteristics of a wide range of processed foodstuffs, as presented here for date preparations, such as Khalas and Umesilla candies. Analysis of these products re-veals the firmness values being at 0.40 and 1.18 N/mm for the uncooked varieties (Al-Rawahi et al., 2006). Firmness drops to lower values once thermal treatment is applied to the formulation (cooking at 50°C for 5 min). First cycle compression of cooked date candies reveals a smooth breaking profile with a broad shoulder characterized by a point of yield stress between 15 and 20 kPa. The database of textural characteristics is further enriched with readings of brittleness and adhe-siveness, which argue for a pasty confectionery possessing intermediate elasticity and considerable “stickiness” on the plate of the measuring geometry. Values of the elasticity for the date candies show that the structures have recovered to a good extent to be thought of as moderately “rubbery” food materials. Cohesive-ness was rather low at about 0.04–0.07%, and therefore the date confectioneries can be perceived as “tender” and easy to break up in the mouth. The aforemen-tioned discussion constitutes a demonstration of the flexibility in recording the properties of a variety of food materials using texture profile analysis.
2.3 RHEOLOGY AS CAPTURED BY DYNAMIC OSCILLATION IN SHEAR
Knowledge of the desired textural properties of food is essential for formu-lation engineering since these are created by the structural characteristics of key elements (eg, gelation, melting, annealing) of the product. Moreover, it is desirable to obtain information about the viscoelastic properties of novel for-mulations and compare with the required profile of traditional products in the market (Vliet, 1999). Rheological characterization of viscoelastic properties includes small deformation dynamic oscillation (SAOS) and large deformation compression. As mentioned in the previous section, in large-scale deformation, the geometry applies a continuous unidirectional shear to the sample, which eventually will damage its structure. By contrast, SAOS moves in two direc-tions (bi-directional) and only applies small strain to the sample thus preserving the network structure of the material.
In oscillatory tests, samples are subjected to deformation or stress, which varies harmonically with time. SAOS is used to characterize the viscoelastic properties of materials as a function of time, temperature, strain, or frequency (Dobraszczyk and Morgenstern, 2003). The proportionality constants for solids and liquids are termed as modulus (G) and viscosity (η), respectively, where G = σ /γ and η = σ /(dγ /dt). However, most of the food systems exhibit combined liquid-like (viscous) and solid-like (elastic) behavior, giving rise to “viscoelas-ticity.” Principally, small amplitude oscillatory tests involve sandwiching the sample between two parallel plates, where the upper plate oscillates at small

16 PART | I Advances in Food Rheology
amplitude about the mean gap position, and a force transducer detects the force signal that arises from the sample (Taherian et al., 2008).
For pure elastic samples, stress is in phase with the strain, whereas for Newtonian liquids stress is 90 degrees out of phase with the strain. Most of the food systems with viscoelastic properties have both elastic (solid) and viscous (liquid) components where the shear stress lies between 0 and 90 degrees. In such systems, the stress component which is in-phase with shear strain is responsible for the elastic component and is defined as the storage modulus (elastic modulus, G9). The magnitude of the storage modu-lus is proportional to the number of permanent interactions and the strength of the interactions present in the sample. Thus, G9 is a measure of the struc-ture of the sample. On the other hand, the stress factor which is 90 degrees out of phase with the shear strain represents the viscous component and is defined as the loss modulus (viscous modulus, G0) that measures the flow properties of the sample (Bourne, 2002; Vliet, 1999).
Shear stress wave is a sine wave function with varying amplitude and phase, and can be modeled as
σ σ ω δ= −tsin( )0 (2.5)
where σ represents the time-dependent stress, σ0 is the maximum stress ampli-tude, w is the frequency expressed in rad/s, and δ is the phase angle between the two waves.
Viscoelastic materials have a stress wave amplitude proportional to strain amplitude, but will have contributions from both in-phase and out-of-phase components, which can be represented as
σ γ ω ω= ′ + ′′G t G t( sin cos )0 (2.6)
where γ0 is the amplitude of the strain and, as we mentioned earlier, G9 is the elastic modulus that represents the strength of the network (also known as stor-age modulus), G0 is the viscous modulus that measures flow properties of the sample in the structured state and also known as loss modulus. Interpretation of shear moduli through applied stress can be expressed as
σ γ σ γ′ ′ ′′ = ′′G G= / , / (2.7)
where σ9 is the shear stress in phase, σ 0 is the shear stress 90° out of phase, and γ is the strain.
The phase angle, δ, between the sinusoidal waves of applied stress and measured deformation can be used to summarize the viscoelastic character of materials, since tan δ = G0/ G9. A high value of tan δ indicates that the sample is more viscous or liquid-like, while a low value of tan δ means that the sample is more elastic or solid-like (Lucey et al., 2003). Total resistance of materials to
σ=σ0 sin (wt−δ)
σ=γ0 (G9sinwt+G0coswt)
G9 = σ9/γ, G0=σ0/γ

Rheology and Food Microstructure Chapter | 2 17
oscillatory shear is known as complex dynamic modulus (G*) in Pascal units: G* = (G′ 2+ G0 2)½ / w. Table 2.2 describes the standard rheological parameters.
Based on the aforementioned principles of rheology, different kinds of os-cillatory measurements can be performed as a function of time, temperature, frequency, and strain to identify changing properties of globular proteins under different conditions, as described by Rao (2007):
1. Strain sweep is used to determine the extent of linear viscoelastic range (LVR) of a network. The determination of LVR of a material can be carried out by increasing the amplitude of oscillation and observation of the magni-tude of phase lag. In this test, the material response to increasing amplitude at a constant frequency and temperature is measured. Within the region of viscoelasticity, the magnitudes of stress and strain are linear, producing con-stant values of storage and loss modulus for a range of strain.
2. Temperature ramp provides useful information about the heat set gels like globular protein aggregates by measuring rheological parameters, such as storage modulus (G9) and loss modulus (G0) as a function of temperature at fixed frequency and strain.
3. Time sweep represents the viscoelastic properties of materials as a function of time in which the strain, frequency, and temperature are kept constant. The gel networks of proteins continue to develop during a time sweep through the complete denaturation of residual protein molecules. This can be observed by increase in the value of storage modulus as a function of time.
TABLE 2.2 Standard Rheological Parameters
Parameter Definition Symbol Units (SI)
Shear stress Force per unit area σ Pa
Shear strain Relative deformation in shear γ —
Shear rate Change of shear strain per unit time
γ s−1
Viscosity Resistance to flow η Pa s
Shear storage modulus
Measure of material elasticity G’ Pa
Shear loss modulus Ability of the material to dis-sipate energy
G0 Pa
Complex viscosity Resistance to flow of the sample in the structured state, originating as viscous or elastic flow resistance to the oscillat-ing movement
η* Pa s
Phase angle Degree of viscoelasticity tan δ —
γ˙

18 PART | I Advances in Food Rheology
4. Frequency sweep illustrates the viscous and elastic changes of the mate-rial at the rate of application of strain while the amplitude of the signal is constant. Derived parameters, such as complex viscosity (η*) and tan δ pro-vide useful information about the nature of the system that being tested, determining gelling properties, such as a dilute solution, entangled solution, “weak gel,” or strong gel. Moreover, data from frequency sweeps are used in time–temperature superposition in order to gauge long-term properties or extremely high/low frequencies beyond the scope of the instrument or rea-sonable experimental time. This concept uses a direct equivalency between time (ie, frequency of measurement) and temperature.
Summarizing the aforementioned, the main purpose of rheological measure-ments is (a) to obtain a quantitative description of the materials’ mechanical properties, (b) evaluation of the food texture and to correlate with sensory anal-ysis, (c) obtain information related to the molecular structure and composition of the material, (d) measure the quality of intermediate and final products, and evaluation of the shelf life of the products (Dobraszczyk and Morgenstern, 2003; Steff, 1996).
As shown in Fig. 2.5, there are four principal categories of mechanical spec-tra in high water (low solids) food materials: dilute solution (fruit juice, clear vegetable soup), entangled solution (guar or LBG solution, thick starch soup), strong gel (table jelly), and “weak gel” (ketchup, custard). Thus, for example, the protein–fat matrix of full fat yoghurts which contain 4.8% proteins from cow milk and 3.5% sugars is capable of forming a thick body with gel-like properties. Hence, the elastic component of the network, G′, remains well above the viscous component, G0, over the experimental frequency range (from 0.1 to 100 rad/s), with the viscoelastic ratio, tan δ = G0/ G′ being about 0.24 for this particular product. Both traces of the elastic and viscous modulus show frequency dependence which is characteristic of “weak gels” with mechanical spectra similar to that in Fig. 2.5d (Kasapis and Boskou, 2001; Richardson and Kasapis, 1998). Frequency sweep performed on 1% k-carrageenan gels showed a gel-like response with G9 > G0 and no frequency dependence of both moduli, which is related to the properties of a strong gel structure in Fig. 2.5c (Ould Eleya and Turgeon, 2000).
The mechanical spectra of milk and clear apple juice are characteristic of liquid-like behavior with G0 > G′, frequency dependence in both moduli, and η* showing a flat dependence on frequency, that is, dilute solution behavior in Fig. 2.5a (Richardson and Kasapis, 1998). In the case of semidilute solutions, G0 > G′ at low frequencies with a flat frequency dependence of complex viscos-ity, but there is a crossover point where G′ > G0 and complex viscosity decreases with increasing frequency. This illustrates the “transition” from liquid-like to solid-like behavior with shorter time, that is, higher frequency, of measurement (Fig. 2.5b). Judging from the shear thinning nature of the complex viscosity and

Rheology and Food Microstructure Chapter | 2 19
the gradient of the modulus traces, laban should also be classified as a semidilute fluid at total solids content within the range of 6–11% w/w (Guizani et al., 2001).
2.4 THE CASCADE APPROACH IN GELATION THEORY
Gelation is a process that is of importance to a wide range of applications in food, pharmaceutical, and material sciences. Gelation is a general way to con-vert a fluid to a solid and has been used since antiquity to produce a variety of foods with distinctive textures. Materials such as gelatin-based desserts are some of the simpler food gels, consisting of a water–gelatin matrix with added sweetener, flavor, and color. In contrast, cheeses start as a simple gel and then undergo further processing to remove some compounds and add others.
FIGURE 2.5 The four principal categories of mechanical spectra in low solids food materials: (a) dilute solution, (b) entangled solution, (c) strong gel, and (d) “weak gel.”

20 PART | I Advances in Food Rheology
For modeling the properties of a network, the parameter of equilibrium shear modulus (Gx or Gy) can be used. This develops after a particular time, at a given frequency and strain of oscillatory measurement, and derived by the Flory–Stockmayer random polycondensation model, as follows (Flory, 1953; Stockmayer, 1943):
Φ=G Ne (2.8)
where Ne is the number of elastically effective network chains (EANCs), formed through the covalent interaction of monomers with functionality f. At a temperature T, Ne depends on the degree of crosslinking of functionalities, α. When a network is just able to form, α is given by the following critical value:
α = −f1 / ( 1)c (2.9)
Φ is a proportionality constant described by
Φ = gRT V/ mol (2.10)
where RT is the entropy gain per mole of network chains in the strained poly-mer, Vmol is the volume per mole of the repeat units, and g is a measure of the number of RT units contributed to the modulus by each mole of load-bearing chains in the network. In pure entropic networks (ideal rubbers) g takes the value of 1.
In the case of physically crosslinked biopolymer gels, elastic chains neither exhibit Gaussian (random-coil) behavior nor are linked together by point-like crosslinks. Instead, the major contribution to elasticity is attributed to the higher energy conformations of long junction zones, occupying portions of the strained macromolecular chains. Clark and Ross-Murphy (1987) accommodated the en-thalpic nature of nonpermanent crosslinks in the Flory–Stockmayer model by allowing the value of g to vary in Eq. 2.10. Consequently, values of g much greater than unity were considered as evidence for nonrubberlike behavior in gelling biopolymers (Clark and Ross-Murphy, 1987). Furthermore, they real-ized that, unlike synthetic polymers where every covalent crosslink contributes to elastic phenomena, biopolymer systems contain a number of aggregates par-tially attached to the end of a network or single molecular “dangling ends” that are not capable of supporting stress. In view of that, they recalculated Ne using the concept of extinction probability u within a biopolymer system using a tri-functional polycondensate network (f = 3) as follows:
α α= − +u u(1 )2 (2.11)
Generalizing from a trifunctional system to one where the active junction points now have f ties and in order to calculate the Ne as a function of both f and a, the following has been proposed (Dobson and Gordon, 1965):
α= − −N f u b(1 ) (1 ) / 2e2
(2.12)
G=ΦNe
αc=1/(f−1)
Φ=gRT/Vmol
u=(1−α+αu)2
Ne=fα(1−u)2(1−b)/2

Rheology and Food Microstructure Chapter | 2 21
where
αα α
= −− +
bf u
u
( 1)
(1 ) (2.13)
Substitution of Φ and Ne as determined by Eqs. 2.10 and 2.12, respectively, into Eq. 2.8 gives G as a function of α and f:
α= − −G gRT NF u b[ (1 ) (1 ) / 2]2 (2.14)
where N is the concentration of monomer species in moles per unit volume. The aforementioned equation constitutes the core of cascade formalism and it has been used to define the mechanical characteristics of elastically active net-work chains of partially unfolded BSA molecules (Richardson and Ross-Murphy, 1981; Chronakis and Kasapis, 1995a).
Biopolymer networks not only waste part of the physical crosslinks in terms of enthalpic-elasticity behavior but they also rearrange the elastically ac-tive junction zones as part of a thermodynamic equilibrium process (crosslink formation is opposed by bond breaking). Assuming that gel formation due to noncovalent interactions between macromolecules is described by a monomer–dimer equilibrium (link—two free sites) and relating the modulus to concentra-tion (Hermans, 1965), the equilibrium constant for association is
α α α= −K NF/ (1 )2 (2.15)
N is readily estimated if the concentration c and the molecular weight M of the monomer are known:
=N c M/ (2.16)
As the course of association proceeds, there will be a critical degree of reac-tion where an effectively infinite network is formed. For a given temperature, this occurs at a minimum critical gelling concentration c0 and the proportion of functional groups, which has reacted, is given by Eq. 2.9. Therefore c0 can be written in terms of f, K, and M as
= − −c M f Kf f( 1) / ( 2)02
(2.17)
From the aforementioned equation, it is clear that for large f:
=c M kf/02
(2.18)
By combining Eqs. 2.14 with Eqs. 2.16 and 2.17 and collecting all terms together, we have an expression for the shear modulus G:
α= − − −−
GK gRT c cf u b
f/ ( / )
[( 1) (1 ) (1 )]
[2( 2) ]0
2
2
(2.19)
b=(f−1)αu(1−α+αu)
G=gRT [NFα(1−u)2(1−b)/2]
K=α/NFα(1−α)2
N=c/M
c0=M(f−1)/Kf(f−2)2
c0=M/kf2
GK/gRT=(c/c0)[(f−1)α(1−u)2(1−b)][2(f−2)2]

22 PART | I Advances in Food Rheology
The aforementioned approach to biopolymer gelation takes into account the relationship between modulus development and extent of the reaction. It also predicts the commonly observed c0 in gelling polysaccharides, which was not taken into consideration in earlier theories since the individual rheological properties of rubber-like material are independent of the macroscopic amount present. Subsequently, α depends only on f and the ratio of c/c0 and thus Eq. 2.19 defines the general concentration dependence of G for a specific func-tionality, with differences in the molecular weight and equilibrium constant for junction formation in different polymer samples affecting only the scaling constants on either side of Eq. 2.19. As a result, for each value of f, a universal “master curve” of G versus c can be derived and moduli can be calculated at concentrations between or beyond those studied experimentally (Chronakis and Kasapis, 1995a).
2.5 LOW-SOLID MIXED SYSTEMS
So far, it has been assumed that single biopolymer gels are homogeneous but in industrial applications mixed systems are utilized that merit special attention (Clark and Ross-Murphy, 2009). Biopolymer mixtures are mainly composed of two (or more) constituents, for example, protein and polysaccharide. Accord-ing to Kasapis and Al-Marhoobi (2005), there are various types of biopolymer mixtures, for example, a fluid–fluid system, a solid dispersed in a fluid and vice versa, or a matrix in which both biopolymers form gels. Biopolymer mixtures can be categorized based on the network morphology, which is illustrated in Fig. 2.6:
1. Interpenetrating network where each biopolymer gels individually, forming independent networks that interpenetrate each other.
2. Coupled separated network where biopolymers form a single network char-acterized by covalent bonds, and/or ionic interactions, or cooperative junc-tion zones.
FIGURE 2.6 Three possible network topologies for binary gelling systems. (with permission from Richardson and Kasapis, 1998).

Rheology and Food Microstructure Chapter | 2 23
3. Phase separated network where the concentration of the two distinct bio-polymers is higher than the critical concentration. They phase separate as a consequence of thermodynamic incompatibility, which leads to less favor-able interactions among different types of polymers segments. Each bio-polymer largely excludes the other from its polymeric domain. In protein–polysaccharide–water systems, phase separation usually occurs when the total polymer concentration is higher than 4%.
Thermodynamic incompatibility in protein/polysaccharide mixtures is illus-trated in Fig. 2.7. System C is obtained by mixing solutions A and B in the vol-ume proportion of BC/AC. The bimodal curve that appears as a solid line shows the cosolubility of biopolymers in the system, with the area under the line (AB1) being associated with one-phase system, whereas the area around the line (AB) correlates to an extensive two-phase system. F point represents the critical condi-tion at which the two coexisting phases are of the same composition and volume. However, (G) is the minimum biopolymer concentration required for phase sepa-ration to happen. D and E are the composition of the coexisting phases, and the ED tie-line connects these two binodal points (Tolstoguzov, 1995).
Phase separation in protein–polysaccharides mixtures is an important tool to achieve the required structural properties in a range of industrial products (Whorlow, 1992; Shrinivas et al., 2009). In biopolymer solutions, phase sepa-ration can be easily noticed by observing the immediate turbidity that devel-ops during mixing as a result of the formation of a water–water emulsion, in which one phase behaves as the continuous matrix whereas the other is dis-persed through it as liquid droplets (Grinberg and Tolstoguzov, 1997; Polyacov et al., 1997). After the initial phase separation and as result of the density differ-ence between the two microscopic phases, mixtures of nongelling biopolymers
FIGURE 2.7 Typical phase diagram for protein–polysaccharide–water systems. (with per-mission from Tolstoguzov, 1995).

24 PART | I Advances in Food Rheology
exhibit a gradual resolution into two clear layers (Bansil, 1993). In the case of gelling biopolymers, the water–water emulsion structure can be trapped by network formation, which results in a biphasic co-gel with continuous and dis-persed domains. Phase separation can also occur when only one biopolymer forms a gel to develop a continuous network, with the dispersed polymer being in the solution state (Morris, 2009). Thus, binary phase separation is motivated by a diffusive process, with the start of gelation slowing down the kinetics of polymer demixing (Kasapis et al., 1993).
An approach that found considerable utility in the quantitative description of the structural properties of biopolymer co-gels relates the overall storage modu-lus in shear to those of the two phases by applying the so-called “blending laws” proposed by Takayanagi and colleagues (Takayanagi et al., 1963; Fitzsimons et al., 2008). These workers demonstrated that the viscoelastic behavior of poly-mer blends, formed by bonding together films of polybutadiene and styrene–acrylonitrile copolymer, could be calculated according to the parallel or series model depending on the direction of the force passing through the specimen (Brown et al., 1995). The composite modulus (G′c) for the parallel and series arrangements can be expressed as follows:
ϕ ϕ′ = ′ + ′G G Gc x x y y (2.20)
and
ϕ ϕ′ = ′ + ′ −G G G( / / )c x x y y1
(2.21)
where G′x and G′y are the storage moduli in shear, with ϕx and ϕy (ϕx + ϕy = 1) being the phase volumes of the two components X and Y, respectively. Equa-tion 2.20 applies to isostrain conditions, where the continuous phase is more rigid than the dispersed phase and the strain is uniform throughout the material (parallel model), whereas Eq. 2.21 refers to isostress conditions, where the sup-porting phase is weaker than the discontinuous phase and both phases are now subjected to the same stress (series model). Obviously, when the continuous phase is stronger than the dispersed phase, the composite modulus achieves a maximum value (upper bound behavior) whereas the system adopts a lower limit when the supporting phase is weaker than the discontinuous phase (lower bound behavior) (Chronakis and Kasapis, 1995b).
Direct application of this semitheoretical procedure to elucidation of the phase topology of biopolymers is frustrated by the inclusion of solvent (water) in the composite thus introducing one further complication that must be ad-dressed first, namely: variable phase volumes (ϕx and ϕy), depending on the partition (relative holding capacity) of the solvent between the two gelling components (Chiou et al., 2005). Obviously, effective concentrations follow-ing the phase separation are higher than the initial, nominal amounts of the two constituents, and have to be estimated for use in the quantitative modulus–concentration relationship of single phases in relation to the overall modulus of the final mixture (Giannouli et al., 2004).
G9c=xG9x+yG9y
G9c=(x/G9x+y/G9y)−1

Rheology and Food Microstructure Chapter | 2 25
Clark and colleagues tackled the problem of solvent distribution in rela-tively dilute aqueous systems for food applications (up to 10% solids) by introducing the “p” parameter, that is, the ratio of solvent to polymer in one phase divided by the corresponding ratio in the other phase (Clark and Ross-Murphy, 1987):
ω ω= +p x y( / ) ( / )x y (2.22)
In samples where both the weights (x and y) of two polymers and water (w = wx + wy) are known the p factor defines the phase volumes, hence the effective concentrations and real moduli of each biopolymer within its own phase. The analysis was extended to combinations of intermediate level of sol-ids (up to 45%) by calculating the concentration dependence of gel density thus incorporating this contribution to phase volume (Kasapis et al., 1993; Manoj et al., 1997). Utilization of this working protocol in aqueous three component systems (X–Y–water) was based on the following two assumptions: (1) bulk phase separation to thermodynamic equilibrium takes place first in solution with gelation then occurring subsequently and independently in each phase or (2) solutions of biopolymer X set during cooling at higher temperatures than Y, effectively forming gels across the whole system at the nominal (original) concentration, and then taken to higher concentrations (process of deswell-ing) by partial removal of water as the second slower component also gels (Morris, 1998).
A further requirement in blending law modeling stipulates that the two macromolecules should be largely confined to their respective phases (Kasapis et al., 1999). It appears that this is the case, since there is evidence that polymer-entrapping gelation is minimized and extensive phase separation is allowed to develop by slowing down the rate of cooling of a binary solution, for example, from about 30 to 1°C/min. This has been demonstrated using rheology and light microscopy to observe at 15% maltodextrin a tenfold increase in the mechani-cal strength of the slow scanned mixture at which the chain segments of the phase separated protein (gelatin) and polysaccharide networks link effectively (Alevisopoulos et al., 1996).
The discussion so far argued that modified blending laws can successfully predict the mechanical properties of composite gels provided that these are isotropic dispersions of spherical inclusions. This appears to be the case since the drive to reduce interfacial tension between two polymeric phases resolves the system into a continuous matrix dispersed with spheroidal fillers (Ding et al., 2002). As it was implied in the original Takayanagi paper, however, the basic blending laws cannot follow the change in structural properties once spheres aggregate into orientated particles or fibers are used as the filler phase. Today, microcrystalline cellulose (MCC) is widely available as a food ingredi-ent and can serve as an “organic” filler for modeling the structural properties of a blend (El-Sakhawy and Hassan, 2007; Watanabe et al., 2006).
p=(wx/x)+(wy/y)

26 PART | I Advances in Food Rheology
Fig. 2.8 reproduces the relationship between experimental storage modu-lus in shear and MCC concentration for 2% gelatin samples. In the absence of MCC, gelatin forms a gel with G′ values of about 460 Pa, whereas the network strength of the reinforced composite obtained at the maximum addition of the polysaccharide is about 3900 Pa (Kasapis et al., 1999). Attempts to quantify the only unknown parameter (modulus of the filler phase, G′2) from the isostress ar-rangement of Eq. 2.21, using the experimental phase volumes obtained by cen-trifugation of the gelatin–MCC solution and G′1 values of the continuous phase via a gelatin concentration modulus calibration curve, return negative values. This may be attributed to the inability of the blending laws to relate rigidity to the topology of a fiber-reinforced mixture.
In synthetic polymer research, a method that takes into account the shape of filler was first introduced by Kerner and then by Halpin, as follows (Wu et al., 2004):
ϕ ϕ′ ′ = + −G G AB B/ (1 ) / (1 )1 2 2 (2.23)with
= ′ ′ − ′ ′ +B G G G G A[( / ) 1] / [( / ) ]2 1 2 1 (2.24)
where A is the Einstein coefficient, which is sensitive to the topology of a system and ϕ2 is the phase volume of the discontinuous phase. A further
G9/G91=(1+AB2)/(1−B2)
B=[(G92/G91)−1]/[(G92/G91)+A]
FIGURE 2.8 Experimental modulus of a 2% gelatin composite in the presence of increas-ing MCC concentrations (j) treated with the Lewis/Nielsen (top solid line), Kerner/Halpin (dashed line), and Takayanagi (bottom solid line) fits. (with permission from Kasapis et al., 1999).

Rheology and Food Microstructure Chapter | 2 27
level of refinement was achieved by Lewis and Nielsen who considered the concept of maximum packing fraction of the filler phase, ϕm (Petersson and Oksman, 2006):
ϕ ψϕ′ ′ = + −G G AB B/ (1 ) / (1 )1 2 2 (2.25)with
ψ ϕ ϕ ϕ= + −1 [(1 ) / ]m m2
2 (2.26)
where the maximum packing fraction is related to the shape of the filler and its degree of polydispersity (Fornes and Paul, 2003).
In the illustration of Fig. 2.8, experimental moduli of the gelatin–MCC preparation and the standard of agreement obtained using the refined composite theories are also shown. In the Lewis and Nielsen fit, the value of ϕm is 0.52 which corresponds to the random orientation of fibers. It is rather difficult to estimate experimentally the maximum volumetric packing fraction, but exten-sive studies on block polymers and polyblends showed that varying the filler shape between fibers and spheres increases the ϕm value from 0.5 to 0.9 (Luo and Daniel, 2003). Light microscopy work demonstrated that the average length of MCC fibers was 40 µm with the diameter being from 4 to 4.5 µm (overall axial ratio close to 10), which corresponds to an Einstein coefficient of 4.93 (Nielsen, 1974).
Using the aforementioned, a computerized algorithm minimized the value of G′2 and good agreement with the experimental data was achieved for G′2 being approximately at 9100 Pa, in line with the series arrangement of the two com-ponents (G′2 > G′1). On the other hand, the Kerner/Halpin approach underesti-mated the rigidity of the composite at the upper range of the MCC concentration (>1% w/w in Fig. 2.8). This estimate of G′2 was also used in Eq. 2.21 to unveil the lower bound least able to follow the progress of structural properties in the system. Clearly, the topology of a co-gel (Eqs. 2.23 and 2.24) is a more impor-tant consideration than the refinement of the packing arrangement of the filler (Eqs. 2.25 and 2.26), as compared to the difficulty experienced by the original application of the blending laws (Eqs. 2.20 and 2.21) (Kasapis, 2008a).
2.6 HIGH-SOLID SYSTEMS
High-solid biomaterials or preparations with a low-moisture content find wide application in food and pharmaceutical industries. Over time, understanding the physicochemical and functional characteristics of high-solid biomaterials, espe-cially in relation to glass transition phenomena, has been of increasing interest for both fundamental and applied systems. State diagrams and mathematical models have been developed to rationalize observations in dehydrated and par-tially frozen foods, or pharmaceutical compounds (Kasapis, 2004; Peleg, 1992). Among others, vitrification phenomena of polysaccharides and gelatin in the presence of small molecule cosolute have been widely studied. One of the
G9/G91=(1+AB2)/(1−Bψ2)
ψ=1+[(1−m)/m2]2

28 PART | I Advances in Food Rheology
achievements of this work is to utilize SAOS or stress relaxation in shear in order to produce the master curve of viscoelasticity, which covers distinct re-gimes from the melt to the glassy state as a function of temperature and time of observation (Kasapis and Sablani, 2005).
As shown in Fig. 2.9, low levels of sugar up to 40% solids in systems of k-carrageenan, agarose, deacylated gellan, and gelatin create stronger networks, whereas replacing sugar with hydrogen bond disrupters such as urea reduces the network strength (Kasapis et al., 2003b). This also emphasizes the importance of hydrogen bonds in polymer interactions (Al-Amri et al., 2005). It is believed that polysaccharides at intermediate levels of cosolute transform from a highly enthalpic network to an entropic system whereas gelatin becomes phase sepa-rated from the cosolute to retain strong structural integrity. Thus, the nature of modulus development is entirely different at intermediate levels of coso-lute (40–60%). There is an abrupt drop in the values of the storage modulus in the polysaccharide preparations, whereas in the case of gelatin/sugar gels the strengthening of the network is accelerated. This produces a wide loop in the structural profile of biopolymers at intermediate levels of cosolute as the shear modulus for gelatin develops in the opposite direction to that of the gelling polysaccharides (Al-Marhoobi and Kasapis, 2005).
FIGURE 2.9 Variation of normalized shear modulus (frequency of 100 rad/s) as a function of sugar concentration for agarose/sugar, k-carrageenan/sugar, deacylated gellan/sugar, gelatin/sugar mixtures, and single sugar preparations. (with permission from Kasapis, 2008b).

Rheology and Food Microstructure Chapter | 2 29
At levels of solids above 60% in formulations, there is a sharp increase in modulus development in both sugar and sugar/hydrocolloid preparations, which is associated with the advent of vitrification phenomena (Fig. 2.9). Amorphous systems undergo a glass transition where disordered supercooled liquids switch between liquid and solid states. This transition occurs over a temperature range but more often is referred to as a definite point called the glass transition tem-perature (Tg). There occurs a complete rearrangement of the matrix during this transition process particularly in the translational mobility of molecules (Sperling, 1992; White and Cakebread, 1966). Several variables, such as enthal-py, entropy, volume changes, changes in heat capacity, and thermal expansion are used to define the glass transition (Roos, 1995; Slade and Levine, 1991). It is assumed that the Tg of a system depends on several factors like concentra-tion, molecular weight, etc. (Kasapis, 2008b; Levine and Slade, 1986; Roos and Karel, 1990).
Differential scanning calorimetry is the most preferred method to analyze vitrification phenomena, which detects changes in heat capacity of the material during the transition period. Conventionally, slope changes in the heat flow sig-nal resulting from variation in the heat capacity helps to identify this transition process (Roos, 1995). Mechanically, there is a dramatic change in the molecular relaxation period from the rubbery to the glassy state. From the thermodynamic point of view, glass transition can be defined as the point at which the configu-rational entropy of the system reaches zero. Experimentally, determination of the glass transition temperature involves a kinetic factor where the time scale of observation and heating or cooling rates influence the glass transition tempera-ture (Arridge, 1975; Kasapis, 2008b).
SAOS in shear can help to differentiate different viscoelastic states of the material including the glassy state with parameters, such as storage modulus (G′ ) describing the elastic behavior and loss modulus (G0) representing the viscous property, as shown in Fig. 2.10. Typically in a polysaccharide system at high temperature, systems tend to be in a liquid state, with the viscous modu-lus being over the elastic counterpart, but as we cool through the coil-to-helix transition, systems attain a rubbery plateau, with the elastic modulus taking over the viscous component. On further cooling, there will be a considerable increase in the values of storage and loss modulus known as the glass transi-tion region marked as the third phase in Fig. 2.10, where G0 dominates over G′. This ultimately leads to the glassy consistency (phase four). Similar trend can be observed as we go from low frequency, molecular weight or concentration to a higher order.
In order to fully identify the viscoelastic properties of a material, we need to carry out analysis over a wide range of temperature and time. In glassy materi-als, it is assumed that the viscoelastic response for a given temperature and time is interchangeable, that is, the effect of increasing frequency resembles that at low temperature (Ferry, 1980b). This principle has been used in the so-called time–temperature superposition (TTS), where inaccessible frequency ranges

30 PART | I Advances in Food Rheology
are obtained by performing frequency sweeps at different temperatures. One of the temperatures is selected as the reference temperature (To) and using the curve at this temperature as reference, remaining experimental traces are shifted along the time scale. Successful shifting of data results in the development of the master curve of viscoelasticity as a function of time or frequency shown in Fig. 2.10. Shifting of the curves yields a set of shift factors, aT, which represents the ratio of any relaxation time at temperature T, to its value at temperature To.
Rationalization of phenomena in the glass transition region commonly uses the concept of free volume. Ferry (1980a) described free volume as the vacant space between the packing irregularities of long chain segments, or as the space required for free rotation and vibration of molecules. In polymer melts, free vol-ume constitutes around 30% of the total volume and reduces to about 3% within the glassy state (Cangialosi et al., 2003). The empirical expression describing the relation between temperature and factor aT at the glass transition is given as follows (Williams et al., 1955):
α= ′ ′ = − −
+ −a G T G T
B f T T
f T Tlog log[ ( ) / ( )]
( / 2.303 )( )
( / )T O
o o
o of (2.27)
where aT is the shift factor generated from the horizontal superposition of me-chanical spectra, with C1
0 and C2
0 being the WLF constants that relate to the
free volume theory as follows:
log aT=log[G9(T)/G9(TO)]=− (B/2.303fo)(T−To)(fo/αf)+T−To
C10C20
FIGURE 2.10 Variation of G′, G0, and tan δ as a function of temperature, frequency, molecular weight, and concentration for amorphous polymers. (with permission from Kasapis et al., 2004).

Rheology and Food Microstructure Chapter | 2 31
α= =C
B
fC
f
2.303 f10
o20 o
(2.28)
where fo is the fractional free volume (the ratio of free to total volume per gram of material), αf is the thermal expansion coefficient, and B is usually taken as one for simplicity.
The phenomenon of reduced free volume as a function of lowering tempera-ture is applicable only within the glass transition region. In contrast, progress in viscoelastic functions is better described in the glassy state by the modified Arrhenius equation (Kasapis, 2004):
= −
a
E
R T Tlog
2.303
1 1T
a
(2.29)
This helps to identify the activation energy (Ea) for an elementary flow pro-cess in the glassy state, which is independent of temperature. Upon plotting the shift factors as a function of temperature, samples in the glass transition region obey the WLF equation based on the concepts of free volume and thermal ex-pansion coefficient, as opposed to the predictions of the reaction rate theory observed in the glassy state.
The pictorial manifestation of the rubber-to-glass transition has been ob-tained for several high-solid polysaccharide and gelatin preparations, and is reproduced in Fig. 2.11 for the k-carrageenan/sugar mixture (Kasapis and Mitchell, 2001). This shows a traceable fit for the factor aT, based on the WLF expression, covering the glass transition region at the upper range of experi-mental temperatures and the modified expression of Arrhenius at the glassy state (lower temperatures). Therefore, plotting the shift factors as a function of experimental temperature spans the glass transition region and the glassy state, and this alteration from one theoretical model to another reflects a discontinuity in the thermal expansion coefficient of free volume. This point of discontinuity can be taken as the mechanical Tg (−39°C in Fig. 2.11), pinpointing the trans-formation from the free volume driven effects in the glass transition region to an energy barrier for molecular rotations in the glassy state (Kasapis, 2008b).
2.7 HIGH-PRESSURE EFFECTS ON CONDENSED GLOBULAR PROTEIN SYSTEMS
Over the past two decades, high-pressure processing has been investigated as a preservation method to control the physical and functional properties of food systems (Cheftel, 1992; Cheftel, 1995; Farkas and Hoover, 2001). Its function-ality relates to enhancing protein stability, preventing fat migration, targeting gelification, and to assuring uniform microbial and enzyme inactivation to men-tion but a few (Kolakowski and Cheftel, 2001; Otero and Sanz, 2003). In par-ticular, high-pressure processing at low temperature is of interest to the food
C10=B2.303fo C20=foαf
log aT=Ea2.303R1T−1T

32 PART | I Advances in Food Rheology
industry due to higher microbial inactivation and retaining most of the original physicochemical and sensory properties in the product (Dumay et al., 2006). Observations of molecular dynamics revealed that the mechanism of pressure-induced protein denaturation is distinct from thermal unfolding (Hummer et al., 1998). Upon heat treatment, hydrophobic residues of protein molecules are transferred into water, whereas following application of high pressure wa-ter is forced into the interior of the protein matrix (Knorr et al., 2006). The loss of contact between groups in the nonpolar domains results in the pres-surized unfolding of protein (Saad-Nehme et al., 2001). Nevertheless, ap-plication of high pressure does not disrupt fully the secondary conformation of condensed globular protein systems, an outcome that can be related to the molten globular state, which is almost as compact as the native state (Meersman et al., 2006).
Moderate pressures (50–200 MPa) are able to induce dissociation of pro-teins by weakening intersubunit regions, leading to the formation of individual nondenatured subunits and small conformational changes in these individual fragments (Messens et al., 1997). Pittia et al. (1996) reported that the effect of pressure on the emulsification properties of β-lactoglobulin depends on the
FIGURE 2.11 Temperature variation of the factor aT within the glass transition region and the glassy state (•) for a mixture of 2.33% k-carrageenan with 35.34% glucose syrup and 35.33% sucrose (25 mM KCl added), with the solid lines reflecting the WLF and modified Ar-rhenius fits of the shift factors in the glass transition region and the glassy state, respectively (dashed line pinpoints the Tg prediction). (with permission from Kasapis, 2008b).

Rheology and Food Microstructure Chapter | 2 33
concentration of the protein. Pressure-treated samples at high level of solids (1.5 mg/mL) did not show a change in functional properties of the protein in the emulsion premix with the values of droplet size D(4,3) remaining the same before and after pressure treatment. Reduction in emulsifying capacity at lower protein concentrations of the pressure-treated sample (0.3 and 1 mg/mL) is accompanied by an increase in droplet size D(4,3). This behavior of β-lactoglobulin at low solids following high pressure was rationalized on the basis of limited availability of protein sites to stabilize the oil/water interface. Foam-ing properties were also enhanced following the application of high pressure. For example, egg white foams with the highest volume and density were formed at pH 8.8 after pressurization above 500 MPa, and results were rationalized on the basis of protein flexibility and solubility allowing improved protein–protein interactions via exposed SH groups (Van der Plancken et al., 2007a).
It is well known that aqueous β-lactoglobulin systems, the main component of whey protein, show reversible denaturation in the range of 100–300 MPa at ambient temperature with formation of weaker and less elastic gels, as com-pared to the heat treated materials. Further investigations focused on chang-es in the structural properties of condensed whey protein isolates following application of high pressure at 600 MPa for 15 min. DSC results of whey pro-tein preparations up to 70% (w/w) total solids reveal that atmospheric sam-ples form well-defined troughs, which reflect the main characteristics of the endothermic event. It was found that pressurized materials up to 70% (w/w) solids content did not show endothermic peaks arguing that pressurization has changed irreversibly the native structure leading to protein denaturation. That was further validated with FTIR spectroscopy on the absorbance of untreated whey protein samples, where amide I and amide II bands at ambient tempera-ture are clearly visible and intense, whereas high-pressure treatment reduced substantially their intensity suggesting WPI denaturation in agreement with the DSC findings.
In contrast, there was a dominant endothermic event in the denaturation pro-file of atmospheric and pressure treated whey protein samples at 80% (w/w) solids content reflecting the preservation of native conformation in pressurized samples at 80% (w/w) solids (Dissanayake et al., 2012). That observation was also confirmed using infrared spectroscopy where identical bands in terms of wavenumber range and intensity of absorbance were recorded arguing for the retention of native conformation and undenatured structures in condensed whey protein samples exposed to high pressure. Findings were rationalized on the basis of a critical concentration threshold where transfer of water molecules to nonpolar residues in the protein interior is minimized due to low-moisture con-tent and restricted molecular mobility (Harano and Kinoshita, 2006; Galazka et al., 2000).
Research also discussed the mechanical behavior of condensed WPI prepa-rations following application of high pressure. There is a gradual drop in the values of G’ from 25 to 65°C owing to the destabilization of hydrogen bonding

34 PART | I Advances in Food Rheology
followed by protein denaturation, the build up of thiol/disulfide interchange re-actions and hydrophobic interactions leading to a rapid move in the values of G’ from 106.4 to 107.4 Pa at the end of the heating, and isothermal runs at 85°C (Fig. 2.12). Cooling to subzero temperatures results in further acceleration of the mechanical properties, which in terms of the master curve of viscoelasticity lie well within the glass transition region (Dissanayake et al., 2012; Kasapis, 2008b). Controlled cooling of the pressurized counterparts from 25 to −30°C exhib-its a broad and monotonic rise in storage modulus resulting in the formation of a rigid matrix. Application of the combined WLF/free volume theoretical framework in conjunction with the time–temperature superposition principle yielded glass transition temperature, Tg, estimates of −10°C for the atmospheric samples and −12°C for the pressurized counterparts (Ferry, 1980a; Dissanayake et al., 2012). This type of theoretical treatment further confirms that condensed whey proteins subjected to high pressure form glassy systems at parity with the structural functionality of the thermally treated counterparts argued from empirical evidence in Fig. 2.12.
Soy proteins are valuable food ingredients for a wide range of industrial ap-plications from techno- and biofunctional ingredients to mimetics of desirable organoleptic properties in processed foods (Kasapis and Tay, 2009). Modulated DSC examination of atmospheric and pressurized soy protein systems exhibits
FIGURE 2.12 Variation of storage modulus (G′ ) of 80% (w/w) WPI samples at constant frequency of 1 rad/s and strain of 0.001%; sample at atmospheric pressure (open symbols) was heated from 25 to 85°C, held at 85°C for 20 min and cooled down to −30°C; sample pressurized at 600 MPa for 15 min (closed symbols) was cooled from 25°C to −30°C.

Rheology and Food Microstructure Chapter | 2 35
endothermic transitions upon heating, which are characterized by a decline in enthalpy with decreasing concentrations of the biopolymer (Savadkoohi et al., 2016a). Calculation of changes in enthalpy [100 – (∆Hpres / ∆Hatm)] dem-onstrate that relatively dilute soy glycinin systems (eg, 30%) denatured about 82%, semidilute preparations (eg, 50%) denatured about 53%, whereas con-densed soy glycinin systems (eg, 80%) mostly maintain secondary conforma-tion with the extent of denaturation being about 19%. It is evident that increas-ing levels of solids are able to withstand application of pressure, which is aided by the formation of a three-dimensional structure stabilized by the presence of 12 disulfide bonds. As for whey protein, the critical consideration, however, appears to be the reduction in molecular mobility at 70 and 80% solids in prepa-rations. At this level of solids, the water-molecule depleted physicochemical environment imposes a kinetic limit in their transfer into the compact interior of the glycinin molecule (Dissanayake et al., 2012; Kato et al., 2008).
Changes in the secondary structure of soy glycinin were investigated by deconvoluting the fundamental secondary elements of a specific band, in par-ticular Amide I, using FTIR spectroscopy. This indicates a partial loosening in α-helix for the pressurized soy glycinin materials at low and intermediate levels of solids (Dong et al., 1992). However, it appears that at condensed soy glycinin preparations there is considerable stability in the α-helix content, where the pressurized materials exhibit patterns similar to the atmospheric counterparts (Fig. 2.13a). Structural and molecular rearrangements of soy glycinin at high levels of solids were also investigated using mechanical measurements and uti-lizing heating and cooling regimes to subzero temperatures. Once more, the theoretical approach of combined WLF/Arrhenius equations was able to fit ex-perimental data yielding Tg values of −14°C for pressurized samples and −8°C for the atmospheric counterparts.
Ovalbumin represents a monomeric phosphoglycoprotein with a rela-tive molecular weight of 45 kDa and isoelectric point of 4.5, comprising four sulfhydryl groups and one disulfide bond buried in the protein core (Iametti et al., 1998; Mine, 1995; Van der Plancken et al., 2007b). Pressurized prepara-tions of ovalbumin did not exhibit endothermic peaks at 10 and 20% (w/w) concentrations arguing that treatment at 600 MPa for 15 min has changed ir-reversibly the secondary structure of the protein, that is, ovalbumin has been denatured following application of high pressure. However, endothermic events of pressure treated ovalbumin samples at intermediate and high solid levels, that is, greater than 30% w/w, show enthalpy values that are lower than for the atmospheric preparations. As for soy glycinin, these changes in enthalpy were utilized to estimate the amount of denaturation in pressurized samples. Prepara-tions with 10 and 20% (w/w) ovalbumin display complete denaturation follow-ing application of high pressure. However, ovalbumin systems from 30% to 60% (w/w) in formulations revealed partial denaturation with increasing amounts of preserved secondary conformation. Condensed preparations of ovalbumin at 70 and 80% solids withstand pressurization in more than 80% of the native

36 PART | I Advances in Food Rheology
morphology (Savadkoohi et al., 2016b). Deconvoluted FTIR spectra reveal that at relatively low levels of solids (10– 40% w/w), high-pressure treatment causes the ovalbumin to partially denature with an alteration in the β-sheet. At higher levels of solids (60–80%), though, the level of β-sheets remains unaltered fol-lowing pressurization, which is further evidence of retention of native molecu-lar morphology in these matrices (Fig. 2.13b).
FIGURE 2.13 Changes in α-helix content of soy glycinin (a) and β-sheets content of ovalbumin (b) at atmospheric pressure (◊), after pressurization at 600 MPa for 15 min () and heat treatment (h) at 80°C for 10 min observed for Amide I infrared spectroscopy.

Rheology and Food Microstructure Chapter | 2 37
The mechanical manifestation of the rubber-to-glass transition depends upon the period of observation (Groot and Agterof, 1995; Kasapis et al., 2003a), and was also examined for ovalbumin. Mechanical spectra of 80% (w/w) ovalbumin samples at atmospheric and pressurized conditions indicate descending storage modulus with heating, which eventually became reinforced at higher tempera-tures. Pressurized samples were cooled directly from ambient conditions to sub-zero temperatures to probe a coherent structure with a monotonic development in storage modulus values to the end of the experimental routine. To provide a means of identification of the molecular dynamics involved in glass transition phenomena, mechanistic explanations via the time–temperature superposition principle were utilized (Kasapis et al., 2004; Plazek and Ngai, 1991). Generated shift factors were modeled with the theory of free volume described in the form of WLF equation and the predictions of the reaction rate theory (modified Ar-rhenius equation). These show appropriate fits for the shift factors in the glass transition region and glassy state, respectively, to yield Tg values of −15.0°C for pressurized samples and −4.0°C for the atmospheric counterparts. Results indicate that both atmospheric and pressurized ovalbumin samples undergo glassy transformation (Fig. 2.14).
Resistance to hydrodynamic pressure in BSA is correlated to 17 disulfide bonds that stabilize its three-dimensional structure (Michnik, 2003; Hayakawa et al., 1992). In condensed systems, the extent of molecular rearrangements as a function of thermal and high-pressure treatments has been reported using micro DSC (Savadkoohi et al., 2016a). Overall, application of high-pressure processing had a partial effect on the native morphology of BSA, which under-goes further denaturation during heating congruent with the thermograms of the atmospheric counterparts. Results indicate that BSA largely retained its native conformation following pressurization, which should also maintain bioactiv-ity alongside structural functionality. Molecular properties of condensed BSA matrices were further reported using rheological measurements. The method of reduced variables was employed to construct master curves of viscoelasticity as a function of time of observation (Prolongo et al., 2002) with the reduced vari-ables of shear modulus (G′p and G0p) being plotted logarithmically as a function of reduced frequency of oscillation (waT). Data reduction yields two sets of shift factors (aT), which possess fundamental value in describing the patterns of mo-lecular relaxation in vitrification (Maltini and Anese, 1995).
There was an apparent change in the pattern of the shift factor at the lower temperature range defining the network glass transition temperature, as report-ed for ovalbumin in Fig. 2.14. Application of the combined WLF/free volume theoretical framework yielded Tg estimates of 6°C for the atmospheric samples, with the corresponding parameter for the pressurized counterpart being −53°C. It appears that the limited denaturation of the protein under high pressure sup-ports vitrification at subzero temperatures. This network type in largely unde-natured and “partially activated” BSA molecules is known as a molten globular state. The characteristics of this state, which has been reported for a number of globular proteins in the literature, include large retention of native secondary

38 PART | I Advances in Food Rheology
structure, compact volume which is 10–20% larger than the native state, and propensity toward aggregation. This type of network is, of course, distinct from the conventional “string of beads” structure obtained from thermally treated BSA molecules and is reflected in the distinct predictions of the glass transition temperature for the two systems.
In summary, pressurization has an effect on globular protein structure and extent of denaturation, which is demonstrated in Fig. 2.15a using DSC and these findings were also confirmed with FTIR (Fig. 2.15b).
It appears that disulfide bonds are involved in the pressure stability of glob-ular proteins. The high-interaction energy associated with disulfide bonds has an impact on protein characteristics during pressurized treatment, with BSA, soy glycinin, and whey protein at 17, 12, and 2 disulfide bonds (Huppertz et al., 2004; McClements et al., 1993; Turgeon et al., 1992), respectively, withstanding to a variable extent the pressure cycle in these systems. For ex-ample, whey protein with two disulfide bonds (beta-lactoglobulin molecule) is the most affected globular protein under pressure. However, ovalbumin with one disulfide linkage (Doi and Kitabatake, 1997; Iametti et al., 1998) shows DSC and FTIR data that do not follow that trend. Ovalbumin is denatured at 10 and 20% solids but retains a stable secondary conformation at intermedi-ate and high levels of solids comprising mainly beta sheets in the condensed paste, as for the native morphology of dilute aqueous preparations. Overall, the
FIGURE 2.14 Temperature variation of factor αT within the glass transition and glassy state for pressurized (j,h) and atmospheric (,∆) sample of 80% ovalbumin, with the solid lines reflecting the WLF and modified Arrhenius fits of the shift factors in the glass transition region and glassy state.

Rheology and Food Microstructure Chapter | 2 39
extent of ovalbumin’s denaturation falls between that of BSA and soy glycinin. Literature then argues that the resistance of globular proteins to high pressure is ranked as follows:
> >BSA Ovalbumin Soy Glycinin Whey Protein
This outcome raises the issue of the additional effect of surface hydrophobic-ity on the globular molecule. Surface hydrophobicity has been considered to be one of the characteristics of the protein molecule being most likely to affect its functional properties (Haskard and Li-Chan, 1998). The surface hydrophobicity values for soy glycinin and whey protein have been reported to be limited due
BSA>Ovalbumin>Soy Glycinin≫Whey Protein
FIGURE 2.15 Extent of denaturation in pressurized whey (), BSA (ο), soy glycinin (j), and ovalbumin (◊) systems observed using DSC (a) and FTIR (b) measurements.

40 PART | I Advances in Food Rheology
to their close packed globular conformation and low molecular flexibility (Moro et al., 2001; Wagner and Guéguen, 1999). In contrast, the surface hydrophobicity of ovalbumin has been stated as high, but nevertheless these values were lower than those reported for BSA (Cardamone and Puri, 1992; Scarsi et al., 1999). Thus, BSA with the highest surface hydrophobicity (S0 = 2200) (Haskard and Li-Chan, 1998; Kato and Nakai, 1980) is unable to retain water in the vicinity of the molecule, and therefore retains secondary conformation because this scarcity of a hydration layer restricts transferring of water molecules to the protein interior, which is the molecular mechanism of pressure-induced protein denaturation.
Ovalbumin has a hydrophobicity value of S0 = 100 (Mine et al., 1991; Kato and Nakai, 1980), followed by relatively comparable estimates for whey protein (S0 = 35) (Moro et al., 2001; Kato and Nakai, 1980) and soy glycinin (S0 = 2.5) (Wagner and Guéguen, 1999; Kato and Nakai, 1980). The relatively high hy-drophobicity of ovalbumin agrees well with its increased resistance to dena-turation under high pressure, as compared to whey protein and soy glycinin. Disulfide linkage and surface hydrophobicity combine to produce the observed behavior in phase morphology of globular proteins in relation to high-pressure treatment. All globular proteins retain secondary conformation at condensed preparations, that is, 80% solids, hence combining structural functionality with bioactivity following pressurization. Thus, there are opportunities for optimal utilization of high-pressure treated protein pastes in starch or dairy-based for-mulations of functional foods in an effort to initiate replacement of thermally treated dairy powders with limited biofunctionality.
REFERENCES
Al-Amri, I.S., Al-Adawi, K.M., Al-Marhoobi, I.M., Kasapis, S., 2005. Direct imaging of the chang-ing polysaccharide network at high levels of co-solute. Carbohydr. Polym. 61, 379–382.
Alevisopoulos, S., Kasapis, S., Abeysekera, R., 1996. Formation of kinetically trapped gels in the maltodextrin–gelatin system. Carbohydr. Res. 293, 79–99.
Al-Marhoobi, I.M., Kasapis, S., 2005. Further evidence of the changing nature of biopolymer net-works in the presence of sugar. Carbohydr. Res. 340, 771–774.
Al-Rawahi, A.S., Kasapis, S., Al-Maamari, S., Al-Saadi, A.M., 2006. Development of a date con-fectionery. Part 2. Relating instrumental texture to sensory evaluation. Int. J. Food Prop. 9, 365–375.
Arridge, R.G.C., 1975. The glass transition. Mechanics of Polymers. Clarendon Press, Oxford, pp. 24–50.
Bansil, R., 1993. Phase seperation in polymer solutions and gels. J. Phys. 3, 225–235. Bourne, M.C., 2002. Food Texture and Viscosity: Concept and Measurement. Academic Press,
New York, pp.182–186. Breene, W.M., 1975. Application of texture profile analysis to instrumental food texture evaluation.
J. Texture Stud. 6, 53–82. Brown, C.R.T., Foster, T.J., Norton, I.T., Underdown, J., 1995. Influence of shear on the micro-
structure of mixed biopolymer systems. In: Harding, S.E., Hill, S.E., Mitchell, J.R. (Eds.), Biopolymer Mixtures. Nottingham University Press, Nottingham, pp. 65–83.

Rheology and Food Microstructure Chapter | 2 41
Cangialosi, D., Schut, H., van Veen, A., Picken, S.J., 2003. Positron annihilation lifetime spectros-copy for measuring free volume during physical aging of polycarbonate. Macromolecules 36, 142–147.
Cardamone, M., Puri, N.K., 1992. Spectrofluorimetric assessment of the surface hydrophobicity of proteins. Biochem. J. 282 (2), 589–593.
Cheftel, J.C., 1992. Effects of high hydrostatic pressure on food constituents: an overview. In: Balny, C., Hayashi, R., Heremans, K., Masson, P. (Eds.), High Pressure, Biotechnology. Col-loque INSERM/John Libbey and Co., Ltd, London, UK, pp. 195–209.
Cheftel, J.C., 1995. High-pressure, microbial inactivation and food preservation. Food Sci. Tech-nol. Int. 1, 75–90.
Chiou, B.-S., Yee, E., Glenn, G.M., Orts, W.J., 2005. Rheology of starch-clay nanocomposites. Carbohydr. Polym. 59, 467–475.
Chronakis, I.S., Kasapis, S., 1995a. A rheological study on the application of carbohydrate–protein incompatibility to the development of low fat commercial spreads. Carbohydr. Polym. 28, 367–373.
Chronakis, I.S., Kasapis, S., 1995b. A recent advance in the application of blending laws in mixed biopolymer systems. Int. J. Polym. Anal. Ch. 1 (2), 99–118.
Clark, A.H., Ross-Murphy, S.B., 1987. Structural and mechanical properties of biopolymer gels. Adv. Polym. Sci. 83, 55–192.
Clark, A.H., Ross-Murphy, S.B., 2009. Biopolymer network assembly: measurement and theory. In: Kasapis, S., Norton, I.T., Ubbink, J.B. (Eds.), Modern Biopolymer Science: Bridging the Divide between Fundamental Treatise and Industrial Application. Elsevier, San Diego, pp. 1–27.
de Gennes, P.G., 1979. Scaling Concepts in Polymer Physics. Cornell University Press, New York.
Ding, P., Wolf, B., Frith, W.J., Clark, A.H., Norton, I.T., Pacek, A.W., 2002. Interfacial tension in phase-separated gelatin/dextran aqueous mixtures. J. Colloid Interf. Sci. 253, 367–376.
Dissanayake, M., Kasapis, S., Chaudhary, V., Adhikari, B., Palmer, M., Meurer, B., 2012. Unex-pected high pressure effects on the structural properties of condensed whey protein systems. Biopolymers 97 (12), 963–973.
Dobraszczyk, B.J., Morgenstern, M.P., 2003. Rheology and the bread making process. J. Cereal Sci. 38, 229–245.
Dobson, G.R., Gordon, M., 1965. Theory of branching processes and statistics of rubber elasticity. J. Chem. Phys. 43, 705–713.
Doi, E., Kitabatake, N., 1997. Structure and functionality of egg proteins. In: Damodaran, S., Paraf, A. (Eds.), Food Proteins and their Applications. Marcel Dekker, New York, pp. 325–340.
Dong, A., Caughey, B., Caughey, W.S., Bhat, K.S., Coe, J.E., 1992. Secondary structure of pen-traxin female protein in water determined by infrared spectroscopy: Effects of calcium and phosphorylcholine. Biochemistry 31, 9364–9370.
Dumay, E.M., Picart, L., Regnault, S., Thiebaud, M., 2006. High pressure-low temperature process-ing of food proteins. Biochim. Biophys. Acta 1764 (3), 599–618.
El-Sakhawy, M., Hassan, M.L., 2007. Physical and mechanical properties of microcrystalline cel-lulose prepared from agricultural residues. Carbohydr. Polym. 67, 1–10.
Farkas, D.F., Hoover, D.G., 2001. High pressure processing. J. Food Sci. 65, 47–64. Ferry, J.D., 1980a. Dependence of viscoelastic behaviour on temperature and pressure. Viscoelastic
Properties of Polymers. John Wiley, New York, pp. 264–320.
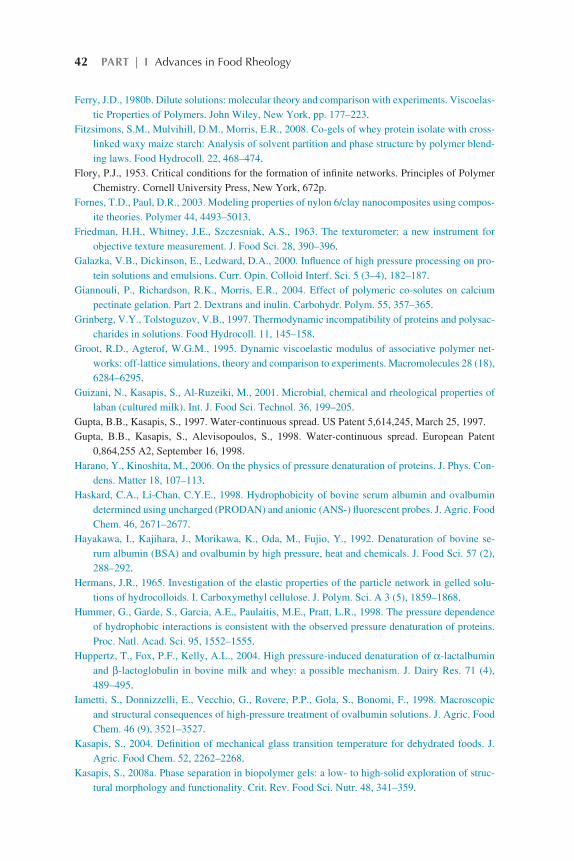
42 PART | I Advances in Food Rheology
Ferry, J.D., 1980b. Dilute solutions: molecular theory and comparison with experiments. Viscoelas-tic Properties of Polymers. John Wiley, New York, pp. 177–223.
Fitzsimons, S.M., Mulvihill, D.M., Morris, E.R., 2008. Co-gels of whey protein isolate with cross-linked waxy maize starch: Analysis of solvent partition and phase structure by polymer blend-ing laws. Food Hydrocoll. 22, 468–474.
Flory, P.J., 1953. Critical conditions for the formation of infinite networks. Principles of Polymer Chemistry. Cornell University Press, New York, 672p.
Fornes, T.D., Paul, D.R., 2003. Modeling properties of nylon 6/clay nanocomposites using compos-ite theories. Polymer 44, 4493–5013.
Friedman, H.H., Whitney, J.E., Szczesniak, A.S., 1963. The texturometer: a new instrument for objective texture measurement. J. Food Sci. 28, 390–396.
Galazka, V.B., Dickinson, E., Ledward, D.A., 2000. Influence of high pressure processing on pro-tein solutions and emulsions. Curr. Opin. Colloid Interf. Sci. 5 (3–4), 182–187.
Giannouli, P., Richardson, R.K., Morris, E.R., 2004. Effect of polymeric co-solutes on calcium pectinate gelation. Part 2. Dextrans and inulin. Carbohydr. Polym. 55, 357–365.
Grinberg, V.Y., Tolstoguzov, V.B., 1997. Thermodynamic incompatibility of proteins and polysac-charides in solutions. Food Hydrocoll. 11, 145–158.
Groot, R.D., Agterof, W.G.M., 1995. Dynamic viscoelastic modulus of associative polymer net-works: off-lattice simulations, theory and comparison to experiments. Macromolecules 28 (18), 6284–6295.
Guizani, N., Kasapis, S., Al-Ruzeiki, M., 2001. Microbial, chemical and rheological properties of laban (cultured milk). Int. J. Food Sci. Technol. 36, 199–205.
Gupta, B.B., Kasapis, S., 1997. Water-continuous spread. US Patent 5,614,245, March 25, 1997.Gupta, B.B., Kasapis, S., Alevisopoulos, S., 1998. Water-continuous spread. European Patent
0,864,255 A2, September 16, 1998.Harano, Y., Kinoshita, M., 2006. On the physics of pressure denaturation of proteins. J. Phys. Con-
dens. Matter 18, 107–113. Haskard, C.A., Li-Chan, C.Y.E., 1998. Hydrophobicity of bovine serum albumin and ovalbumin
determined using uncharged (PRODAN) and anionic (ANS-) fluorescent probes. J. Agric. Food Chem. 46, 2671–2677.
Hayakawa, I., Kajihara, J., Morikawa, K., Oda, M., Fujio, Y., 1992. Denaturation of bovine se-rum albumin (BSA) and ovalbumin by high pressure, heat and chemicals. J. Food Sci. 57 (2), 288–292.
Hermans, J.R., 1965. Investigation of the elastic properties of the particle network in gelled solu-tions of hydrocolloids. I. Carboxymethyl cellulose. J. Polym. Sci. A 3 (5), 1859–1868.
Hummer, G., Garde, S., Garcia, A.E., Paulaitis, M.E., Pratt, L.R., 1998. The pressure dependence of hydrophobic interactions is consistent with the observed pressure denaturation of proteins. Proc. Natl. Acad. Sci. 95, 1552–1555.
Huppertz, T., Fox, P.F., Kelly, A.L., 2004. High pressure-induced denaturation of α-lactalbumin and β-lactoglobulin in bovine milk and whey: a possible mechanism. J. Dairy Res. 71 (4), 489–495.
Iametti, S., Donnizzelli, E., Vecchio, G., Rovere, P.P., Gola, S., Bonomi, F., 1998. Macroscopic and structural consequences of high-pressure treatment of ovalbumin solutions. J. Agric. Food Chem. 46 (9), 3521–3527.
Kasapis, S., 2004. Definition of mechanical glass transition temperature for dehydrated foods. J. Agric. Food Chem. 52, 2262–2268.
Kasapis, S., 2008a. Phase separation in biopolymer gels: a low- to high-solid exploration of struc-tural morphology and functionality. Crit. Rev. Food Sci. Nutr. 48, 341–359.

Rheology and Food Microstructure Chapter | 2 43
Kasapis, S., 2008b. Recent advances and future challenges in the explanation and exploitation of the network glass transition of high sugar biopolymer mixtures. Crit. Rev. Food Sci. Nutr. 48, 185–203.
Kasapis, S., Al-Marhoobi, I.M., 2005. Bridging the divide between the high and low solid analyses in the Gelatin /k- Carrageenan mixtures. Biomacromolecules 6, 14–23.
Kasapis, S., Al-Marhoobi, I.M., Deszczynski, M., Mitchell, J.R., Abeysekera, R., 2003a. Gelatin vs polysaccharide in mixture with sugar. Biomacromolecules 4, 1142–1149.
Kasapis, S., Al-Marhoobi, I.M., Mitchell, J.R., 2003b. Testing the validity of comparisons be-tween the rheological and the calorimetric glass transition temperatures. Carbohydr. Res. 338, 787–794.
Kasapis, S., Boskou, D., 2001. Rheological and sensory properties of popular Greek foodstuffs: a review. Int. J. Food Prop. 4, 327–340.
Kasapis, S., Giannouli, P., Hember, M.W.N., Evageliou, V., Poulard, C., Tort-Bourgeois, B., Sworn, G., 1999. Structural aspects and phase behavior in deacylated and high acyl gellan systems. Carbohydr. Polym. 38, 145–154.
Kasapis, S., Mitchell, J., Abeysekera, R., MacNaughtan, W., 2004. Rubber-to-glass transitions in high sugar/biopolymer mixtures. Trends Food Sci. Technol. 15, 298–304.
Kasapis, S., Mitchell, J.R., 2001. Definition of the rheological glass transition temperature in as-sociation with the concept of iso-free-volume. Int. J. Biol. Macromol. 29, 315–321.
Kasapis, S., Morris, E.R., Norton, I.T., Clark, A.H., 1993. Phase equilibria gelation in gelatin/maltodextrin systems- Part IV: composition- dependence of mixed-gel moduli. Carbohydr. Polym. 21, 269–276.
Kasapis, S., Sablani, S.S., 2005. A fundamental approach for the estimation of the mechanical glass transition temperature in gelatin. Int. J. Biol. Macromol. 36, 71–78.
Kasapis, S., Tay, S.L., 2009. Morphology of molecular soy protein fractions in binary composite gels. Langmuir 25 (15), 8538–8547.
Kato, A., Nakai, S., 1980. Hydrophobicity determined by a fluorescence probe methods and its cor-relation with surface properties of proteins. Biochim. Biophys. Acta 624, 13–20.
Kato, C., Sato, T., Fumiyoshi, A., 2008. Effect of high pressure on proteins. In: Siddiqui, K.S., Thomas, T. (Eds.), Protein Adaptation to High-Pressure Environments. first ed. Nova Science Publishers, Inc, New York, USA, pp. 170–189.
Knorr, D., Heinz, V., Buckow, R., 2006. High pressure application for food biopolymers. Biochim. Biophys. Acta 1764, 619–631.
Kolakowski, P., Cheftel, J.C., 2001. Effects of high pressure and low temperature on β-lactoglobulin unfolding and aggregation. Food Hydrocoll. 15, 215–232.
Lapasin, R., Pricl, S., 1995. Rheology of Industrial Polysaccharides. Blackie Academic and Profes-sional, London, 250–494.
Launay, B., Doublier, J.L., Cuvelier, G., 1986. Flow properties of aqueous solutions and dispersions of polysaccharides. In: Mitchell, J.R., Ledward, D.A. (Eds.), Functional Properties of Food Macromolecules. Elsevier Applied Science Publishers, New York, pp. 1–78.
Levine, H., Slade, L., 1986. A polymer physico-chemical approach to the study of commercial starch hydrolysis products (SHPs). Carbohydr. Polym. 6, 213–244.
Lucey, J.A., Johnson, M.E., Horne, D.S., 2003. Perspectives on the basis of the rheology and texture properties of cheese. J. Dairy Sci. 86, 2725–2743.
Luo, J.J., Daniel, I.M., 2003. Characterization and modeling of mechanical behavior of polymer/clay nanocomposites. Compos. Sci. Technol. 63, 1607–1616.
Maltini, E., Anese, M., 1995. Evaluation of viscosities of amorphous phases in partially frozen sys-tems by WLF kinetics and glass transition temperatures. Food Res. Int. 28, 367–372.

44 PART | I Advances in Food Rheology
Manoj, P., Kasapis, S., Hember, M.W.N., 1997. Sequence-dependent kinetic trapping of biphasic structure in maltodextrin-whey protein gels. Carbohydr. Polym. 32, 141–153.
McClements, D.J., Monahan, F.J., Kinsella, J.E., 1993. Disulfide bond formation affects stability of whey protein isolate emulsions. J. Food Sci. 58 (5), 1036–1039.
Meersman, F., Dobson, C.M., Heremans, K., 2006. Protein unfolding, amyloid fibril formation and configurational energy landscapes under high pressure conditions. Chem. Soc. Rev. 35, 908–917.
Messens, W., Van Camp, J., Huyghebaert, A., 1997. The use of high pressure to modify the func-tionality of food proteins. Trends Food Sci. Technol. 8, 107–112.
Meullenet, J.F., Lyon, B.G., Carpenter, J.A., Lyon, C.E., 1998. Relationship between sensory and instrumental texture profile attributes. J. Sens. Stud. 13, 77–93.
Michnik, A., 2003. Thermal stability of bovine serum albumin: DSC study. J. Therm. Anal. Calo-rim. 71, 509–519.
Mine, Y., 1995. Recent advances in the understanding of egg-white protein functionality. Trends Food Sci. Technol. 6 (7), 225–232.
Mine, Y., Noutomi, T., Haga, N., 1991. Emulsifying and structural properties of ovalbumin. J. Agric. Food Chem. 39, 443–446.
Moro, A., Gatti, C., Delorenzi, N., 2001. Hydrophobicity of whey protein concentrates measured by fluorescence quenching and its relation with surface functional properties. J. Agric. Food Chem. 49 (10), 4784–4789.
Morris, E.R., 1998. Segregative interactions in biopolymer co-gels. In: Rao, M.A., Hartel, R.W (Eds.), Phase/Transitions in Foods: Chemical, Structural, and Rheological Changes. Marcel Dekker, New York, pp. 159–186.
Morris, E.R., 2009. Functional interactions in gelling biopolymer mixtures. In: Kasapis, S., Norton, I.T., Ubbink, J.B. (Eds.), Modern Biopolymer Science: Bridging the Divide between Funda-mental Treatise and Industrial Application. Elsevier, San Diego, pp. 167–198.
Morris, E.R., Cutler, A.N., Ross-Murphy, S.B., Rees, D.A., Price, J., 1981. Concentration and shear rate dependence of viscosity in random coil polysaccharide solutions. Carbohydr. Polym. 1, 5–21.
Nielsen, L.E., 1974. Morphology and the elastic modulus of block polymers and polyblends. Rheol. Acta 13, 86–92.
Otero, L., Sanz, P.D., 2003. Modelling heat transfer in high pressure food processing: a review. Innov. Food Sci. Emerg. Technol. 4, 121–134.
Ould Eleya, M.M., Turgeon, S.L., 2000. Rheology of k-carrageenan and β-lactoglobulin mixed gels. Food Hydrocoll. 14, 29–40.
Peleg, M., 1992. On the use of the WLF model in polymers and foods. Crit. Rev. Food Sci. Nutr. 32, 59–66.
Petersson, L., Oksman, K., 2006. Biopolymer based nanocomposites: comparing layered silicates and microcrystalline cellulose as nanoreinforcement. Compos. Sci. Technol. 66, 2187–2196.
Pittia, P., Wilde, P.J., Husband, F.A., Clark, D.C., 1996. Functional and structural properties of β-lactoglobulin as affected by high pressure treatment. J. Food Sci. 61 (6), 1123–1128.
Plazek, D.J., Ngai, K.L., 1991. Correlation of polymer segmental chain dynamics with temperature-dependent time-scale shifts. Macromolecules 24, 1222–1224.
Polyacov, V.I., Grinbereg, V.Ya, Tolstoguzov, V.B., 1997. Thermodynamic incompatibility of pro-teins. Food Hydrocoll. 11, 171–180.
Prolongo, M.G., Salom, C., Masegosa, R.M., 2002. Glass transitions and interactions in polymer blends containing poly (4-hydroxystyrene) brominated. Polymer 43, 93–102.
Rao, M.A., 2007. Rheology of Liquid and Semisolid Foods: Principles and Applications, second ed. Springer, New York.

Rheology and Food Microstructure Chapter | 2 45
Richardson, R.K., Kasapis, S., 1998. Rheological methods in the characterisation of food biopoly-mers. In: Wetzel, D.L.B., Charalambous, G. (Eds.), Instrumental Methods in Food and Bever-age Analysis. Elsevier, The Netherlands, pp. 31–44.
Richardson, R.K., Ross-Murphy, S.B., 1981. Mechanical properties of globular protein gels: incipient gelation behaviour. Int. J. Biol. Macromol. 3, 315–322.
Roos, Y.H., 1995. Phase Transitions in Foods. Academic Press, San Deigo, CA. Roos, Y., Karel, M., 1990. Differential scanning calorimetry study of phase transitions affecting the
quality of dehydrated materials. Biotechnol. Prog. 6, 159–163. Rosenthal, A.J., 1999. Relation between instrumental and sensory measures of food texture.
In: Rosenthal, A.J. (Ed.), Food Texture Measurement and Perception. Aspen Publication, Maryland, pp. 1–16.
Rosenthal, A.J., 2010. Texture profile analysis—how important are the parameters? J. Texture Stud. 41, 672–684.
Saad-Nehme, J., Silva, J.L., Meyer-Fernandes, J.R., 2001. Osmolytes protect mitochondrial F0F1–ATPase complex against pressure inactivation. Biochim. Biophys. Acta 1546, 164–170.
Sanderson, G.R., Bell, V.L., Clark, R.C., Ortega, D., 1988. The texture of gellan gum gels. In: Phillips, G.O., Wedlock, D.J., Williams, P.A. (Eds.), Gums and Stabilisers for the Food Industry 4. Oxford, IRL Press, pp. 219–229.
Savadkoohi, S., Bannikova, A., Mantri, N., Kasapis, S., 2016a. Structural modification of condensed glycinin systems following application of high pressure. Food Hydrocoll. 53, 115–124.
Savadkoohi, S., Bannikova, A., Mantri, N., Kasapis, S., 2016b. Structural properties of condensed ovalbumin systems following application of high pressure. Food Hydrocoll. 53, 104–114.
Scarsi, M., Majeux, N., Caflisch, A., 1999. Hydrophobicity at the surface of proteins. Proteins 37, 565–575.
Shrinivas, P., Kasapis, S., Tongdang, T., 2009. Morphology and mechanical properties of biocontinuous gels of agarose and gelatin and the effect of added lipid phase. Langmuir 25, 8763–8773.
Slade, L., Levine, H., 1991. Beyond water activity: recent advances based on an alternative approach to the assessment of food quality and safety. Crit. Rev. Food Sci. Nutr. 30, 115–360.
Sperling, L.H., 1992. Introduction to Physical Polymer Science. John Wiley & Sons, Inc, New York.
Steff, J.F., 1996. Introduction to rheology. In: Steff, J.F. (Ed.), Rheological Methods in Food Process Engineering. second ed. Freeman Press, USA, pp. 1–5.
Stockmayer, W.H., 1943. Theory of molecular size distribution and gel formation in branched-chain polymers. J. Chem. Phys. 11, 45–55.
Szczesniak, A., 1963. Classification of textural characteristics. J. Food Sci. 28, 385–389. Szczesniak, A.S., 2002. Texture is a sensory property. Food Qual. Prefer. 13, 215–225. Tabilo-Munizaga, G., Barbosa-Cánovas, G.V., 2005. Rheology for the food industry. J. Food Eng.
67, 147–156. Taherian, A.R., Fustier, P., Ramaswamy, H.S., 2008. Steady and dynamic shear rheological
properties, and stability of non-flocculated and flocculated beverage cloud emulsions. Int. J. Food Prop. 11 (1), 24–43.
Takayanagi, M., Harima, H., Iwata, Y., 1963. Viscoelastic behaviour of polymer and its comparison with model experiments. Mem. Fac. Eng. Kyushu Univ. 23, 1–13.
Tolstoguzov, V.B., 1995. Some physico-chemical aspects of protein processing in foods. Multicomponent gels. Food Hydrocoll. 9, 317–332.

46 PART | I Advances in Food Rheology
Turgeon, S.L., Gauthier, S.F., Molle, D., Leonil, J., 1992. Interfacial properties of tryptic peptides of β-lactoglobulin. J. Agric. Food Chem. 40, 669–675.
Van der Plancken, I., Van Loey, A., Hendrickx, M.E., 2007a. Foaming properties of egg white proteins affected by heat or high pressure treatment. J. Food Eng. 78, 1410–1426.
Van der Plancken, I., Van Loey, A., Hendrickx, M.E., 2007b. Kinetic study on the combined effect of high pressure and temperature on the physico-chemical properties of egg white proteins. J. Food Eng. 78, 206–216.
Vliet, T.V., 1999. Rheological classification of foods and instrumental techniques for their study. In: Rosenthal, A.J. (Ed.), Food Texture Measurement and Perception. Aspen Publication, Maryland, pp. 65–97.
Wagner, J.R., Guéguen, J., 1999. Surface functional properties of native, acid-treated, and reduced soy glycinin. 2. Emulsifying properties. J. Agric. Food Chem. 47, 2181–2187.
Wang, Q., Cui, S.W., 2005. Understanding the physical properties of food polysaccharides. In: Steve, W., Cui (Eds.), Food Carbohydrates: Chemistry, Physical Properties, and Applications. CRC Press, New York.
Watanabe, A., Morita, S., Kokot, S., Matsubara, M., Fukai, K., Ozaki, Y., 2006. Drying process of microcrystalline cellulose studied by attenuated total reflection IR spectroscopy with two-dimensional correlation spectroscopy and principal component analysis. J. Mol. Struct. 799, 102–110.
White, G.W., Cakebread, S.H., 1966. The glassy state in certain sugar containing food products. J. Food Technol. 1, 73–82.
Whorlow, R.W., 1992. Rheological Techniques, second ed. Ellis Howewood, New York, 418–426. Williams, M.L., Landal, R.F., Ferry, J.D., 1955. The temperature dependence of relaxation
mechanisms in amorphous polymers and other glass-forming liquids. J. Am. Chem. Soc. 77, 3701–3707.
Wu, Y.-P., Jia, Q.-X, Yu, D.-S., Zhang, L.-Q., 2004. Modeling young’s modulus of rubber-clay nanocomposites using composite theories. Polym. Test. 23, 903–909.
Young, S.A., Smart, J.D., 1996. An investigation of the rheology of methylcellulose solutions using dynamic oscillatory, flow and creep experiments. Eur. J. Pharmaceut. Sci. 4, 1–65.

47Advances in Food Rheology and Its Applications. http://dx.doi.org/10.1016/B978-0-08-100431-9.00003-6Copyright © 2017 Elsevier Ltd. All rights reserved.
Chapter 3
Dynamics of Thixotropic Liquids and Time Dependency
M. Houška*, R. Žitný***Food Research Institute Prague, Prague, Czech Republic; **Czech Technical University in Prague, Prague, Czech Republic
SYMBOLS
a Time constant of recovery when the shear rate is zero (s−1)b Part of the time constant for the structural degradation process (sm−1)c Torsional stiffness of the rotational rheometer sensor (N m)d Mixer diameter (m)D Inner diameter of the tube (m)De Deborah number (—)
dij Rate of the deformation tensor =∂∂
+∂∂
du
x
u
xij
j
i
i
j (s−1) =
∂∂
+∂
∂D
Dt tu
xi
i material
derivative (time derivative with respect to a moving particle) (s−1)H Height of the inner cylinder (m)J2 Second invariant of the tensor of shear stresses J2 = τijτji (Pa2)Jp Moment of inertia of the rheometer rotor (kg m2)K0 Consistency coefficient of a fully relaxed structure in the fluid (Pa sn)K∞ Consistency coefficient with the structure of the fluid in equilibrium (Pa sn)K Consistency coefficient of the thixotropic fluid with a fully degraded structure (Pa sn)∆K Part of the consistency coefficient that can be degraded during fluid flow (Pa sn)ks Metzner–Otto constant (—)L Total length of the tube (m)m Parameter indicating the influence of the shear rate on the time constant of the
degradation or recovery process (—)Mk Torque acting on the mixer (N m)n Power-law index (—)N Rotational speed of the inner cylinder of the rheometer or mixer (s−1)p1 Time constant of degradation or recovery of the structure during flow (s)∆p Pressure drop on the tube (Pa)Po Power number (—)Ré Modified Reynolds number (—)
dij=∂uj∂xi+∂ui∂xjDDt=∂∂t+ui∂∂xi

48 PART | I Advances in Food Rheology
Re´´ Modified Reynolds number for mixing (—)R1 Radius of the inner cylinder (m)SN Dimensionless structural number (—)t Time (s)
u Mean velocity (m s−1)
V Volumetric flowrate (m3 s−1)z Axial distance to characterize the position on the tube (m)
GREEK LETTERSγ w Shear rate at the tube wall (s−1)
γ Mean value of the shear rate in a mixed fluid (s−1)τij Shear stress tensor (Pa)τ (t) Time dependence of the shear stress during mixing (Pa)τw Shear stress on the wall of the inner tube (Pa)τy0 Yield stress of the fluid with a fully degraded structure (Pa)τy1 Part of the yield stress that can be degraded (Pa)Ω Angular velocity (rad s−1)ξ Time in deformation action (integration time) (s)ρ Density (kg m−3)µa Apparent viscosity of the mixed fluid (Pa s)λ Structural parameter (—)λ0 Initial value of a structural parameter (—)λe Equilibrium value of a structural parameter (—)λf Coefficient of shear loss in the tube (friction factor) (—)II Second invariant of the rate of deformation tensor II = dij dji (s
−2)
3.1 INTRODUCTION
3.1.1 Thixotropy
The main objective of this chapter is to report on outstanding scientific studies that have been published in journals, books, or internal reports dealing with the thixotropic behavior of various materials with a liquid, semisolid, or viscoelastic character.
3.1.2 Definitions of Thixotropy and Related Behavior, Including Antithixotropy and Rheomalaxy
The history of thixotropy is clearly presented in Barnes (1997) and in Mewis (1979). The term thixotropy was first coined by Peterfi (1927), who gave an exact description of the phenomenon. The name of the phenomenon is a combination of two Greek words, thixis (shaking or mixing) and trepo (turning or changing). Bauer and Collins (1967) defined thixotropy as follows: “When there is a reversible isothermal decrease in the rheological properties of a sys-tem (eg, elastic modulus, yield stress, and viscosity) that is clearly dependent on the effect of shear deformation or shear stress, the system can be referred to
u¯V˙
γ˙wγ˙¯

Dynamics of Thixotropic Liquids and Time Dependency Chapter | 3 49
as thixotropic.” This definition was later modified by Mewis and Wagner (2009) to the generally accepted version: “The continuous decrease in viscosity with time when flow is applied to a sample that has previously been at rest and the subsequent recovery of viscosity in time when the flow is discontinued.” This definition agrees with the IUPAC terminology. The definition draws attention to some important issues: thixotropy is based on viscosity, or on other measurable rheological parameters, and it inherently includes a time-dependent decrease in the parameters induced by flow. In addition, the effect is reversible when the flow is stopped.
The definition of rheomalaxy can also be noted here, which is considered as an extra case of thixotropy: “rheomalaxy represents the total nonrecoverable de-crease in viscosity caused by breakage of the internal structure by a shear flow.”
A phenomenon related to thixotropy is antithixotropy (negative thixotropy), which is defined as: “the time increase in viscosity due to shear deformation.”
As was mentioned by Mewis and Wagner (2009), thixotropic behavior can be understood on the basis of a microstructure that also depends on the shear history. It is most often the result of relatively weak attractive forces between particles. The forces will cause the formation of flocks, which normally evolve into a space-filling particulate network. However, the interparticle bonds are weak enough to be broken by the mechanical stresses that occur during flow. The result is that during flow the network breaks down into separate flocks, which decrease in size further when the strain rate is increased. For minerals, the term carte-house system is frequently applied.
3.2 RHEOLOGICAL MODELS OF THIXOTROPIC FLUIDS
This section will deal mainly with rheological models describing the thixotropy of inelastic fluids and shear-dominated flows. The thixotropy of elastic mate-rials has been described in various publications, for example, Choon (1975), Schoukens et al. (1976), Kunnos and Mironov (1979), Barnes (1997), and Dullaert and Mewis (2006).
Mathematical models of thixotropic inelastic fluids have been reviewed in several studies and papers, see for example, Mewis (1979), Houska (1980), Sestak et al. (1990), Barnes (1997), Dullaert and Mewis (2006), and Mewis and Wagner (2009).
3.2.1 Structural Models With a Differential Kinetic Equation
The first structural phenomenological model was presented by Hahn et al. (1957). Storey and Merrill (1958) proposed the first model with a kinetic dif-ferential equation as an inherent part of the model. The first model with struc-tural parameter λ was presented by Moore (1959). This model represents the influence of the deformation history on the immediate viscosity value. There are plenty of models based on this principle, for example, Denny and Brodkey (1962),

50 PART | I Advances in Food Rheology
Kim and Brodkey (1968), and Fredrickson (1970). An interesting generaliza-tion of this principle was provided by Cheng and Evans (1965), who presented the model (stress tensor τij proportional to the rate of deformation dij)
τ λ( )= G II d,ij ij (3.1)
λ λ( )=d
dtg II,
(3.2)
Several models were developed on the basis of this general model, for example, Mylius and Reher (1972), Petrellis and Flumerfelt (1973), Rucken-stein and Mewis (1973), Cheng (1973) (a generalized Moore model), Carleton et al., 1974, Tiu and Boger (1974), Parker (1975), Lin (1975), Regirer and Sadrina (1978), Lapasin et al. (1980a,b), Alessandrini et al. (1982), Lapasin et al. (1983), and Alessandrini and Lapasin (1984) (a multistructural model with three structural parameters). Further models of this type were developed by Kemblowski and Petera (1979), Jones and Brodkey (1968), Ritter and Govier (1970), Davenport and Somper (1971), Godfrey (1973), Mercer and Weyman (1974), Pijadin (1974), Mason et al., 1982, and Quemada et al. (1984). A brief overview of these models can be found in Sestak et al. (1990). Similar models with structural parameters were later presented by Abu-Jdayil (2003), Dullaert and Mewis (2006), Ottone et al. (2009), Ardakani et al. (2011), McArdle et al. (2012), Alvarez and Canet (2013), Ardakani et al. (2014), and Syrakos et al. (2015). The development of additional models has frequently been motivated by an attempt to provide the best possible description of the rheological behav-ior of a specific fluid.
3.2.2 Structural Models With an Integral of Deformation Rate History
The first model in this group was presented by Paslay and Slibar (1962). Har-ris (1967) then presented a model with a memory function and changing yield stress. Power-law models of thixotropic behavior were presented by Assouad (1974), Huang et al. (1976), Pelcova (1979), and Sestak and Zitny (1976). Ses-tak and Zitny’s model is flexible and has the shape
∫τ ξ ξξ( )
=
−
− −
−∞
−∞K
II K K
pII
t
p
IId d
2
2
exp2
ij
nt
n
ij0
10
11
(3.3)
Here n represents a power-law index (it is the same for a fully relaxed struc-ture and for a totally degraded structure), K0, K∞ are consistency coefficients
τij=Gλ,IIdij
dλdt=gλ,II
τij=K0II2n−1−K0−K∞p1II2∫−∞texpξ−tp1IIξ2ndξdij

Dynamics of Thixotropic Liquids and Time Dependency Chapter | 3 51
valid for the fully relaxed state and the equilibrium structure state, respectively, and p1 represents the time constant of the thixotropic changes.
3.2.3 Presentation of Specific Constitutive Model
The attention will now focus on an effectively applicable model based on the principle of structural parameters. Using already published model Cheng (1973) or Cheng and Evans (1965), Houska (1980) or Sestak et al. (1990) defined a one-dimensional model with a variable yield stress:
If τ > (τy0 + τy1λ) shear stress above a yield stress
τ τ τ λ γ λγ= + + + ∆K Ky yn n
0 1 (3.4)
λ λ γ λ( )= − −d
dta b1 m
(3.5)
If τ < (τy0 + τy1λ), then γ = 0 .This model contains eight material parameters: yield stresses τy0 and τy1,
consistency coefficients K and ∆K, power-law index n, index m, and two time constants—a and b. This model has a complicated shape, and can be simplified for a specific fluid, for example, by eliminating all yield stress parameters, or by assuming that parameter m is equal to zero (eliminating the influence of the shear rate on the time constant of the degradation process of the structure). The assumption that parameter ∆K = 0 Pa.sn can also simplify the model (thixot-ropy is usually characterized by dominated yield stress changes and not by a degraded consistency).
This model was generalized by the authors of this chapter, see for example, Houska (1980) and Sestak et al. (1990) to fulfil the objectivity requirements on the constitutive equations.
For (τy0 + τy1λ) <
J
22
, the following equations are valid:
τ λτ λ τ( )( )= + ∆
+
+
−
K KII
IId.
2
2
ij
ny y
ij
11 0
(3.6)
λ λ λ( )= − −
D
Dta b
II1
2
m
(3.7)
when (τy0 + τy1λ) >
J
22
, dij = 0
τ=τy0+τy1λ+Kγ˙n+∆Kλγ˙n
dλdt=a1−λ−bγ˙mλ
γ˙=0
J22
τij=K+∆K.λII2n−1+τy1λ+τy0II2dij
DλDt=a1−λ−bII2mλ
J22

52 PART | I Advances in Food Rheology
This form is the basis for implementation in CFD modeling (Wachs et al., 2009; Negrao Cesar et al., 2011).
3.3 IDENTIFYING THE PARAMETERS FOR A SELECTED MODEL OF THIXOTROPIC BEHAVIOR
3.3.1 Rheological Experiment Conditions
A detailed description of the procedure for predicting the material parameters of a specific thixotropic fluid was presented by Houska (1980) and by Sestak et al. (1990). The best geometry that can be used for rheological measurements is the cone and plate. In the gap, there is a practically uniform shear rate field that can help to subject the whole measured sample to the same shear rate his-tory. The rotating cone has a minimum moment of inertia, and modern rheom-eters are equipped with a rigid torque sensor. In these circumstances, there is no need to carry out time corrections of a measured shear stress. In some cases, for example, substances with hard solid particles require the geometry of con-centric cylinders to be applied. In this case, the shear rate is dependent on the radial distance in the gap between the cylinders. It is necessary to apply narrow gaps, or to apply corrections to the shear rate range in a thixotropic fluid. The applied cylinder usually has a rather high value of the moment of inertia, which can cause a problem when a stepwise rotational speed of the sensing cylinder is required. The simplest history of the deformation rates can be expressed math-ematically as
γ γ= ≥ = <t tconstant, for 0, or 0 for 0
If one selects convenient constant shear rate values and measures the stress versus time response τ = τ (t), the parameters of the model can be easily pre-dicted from the corresponding theoretical response of stresses developed from the model equations (3.4) and (3.5):
τ τ γ τ γγ
λ( )( )( ) = + + + ∆+
− +
γ γ( ) ( )− + − +t K Ka
a be e1y
ny
nm
a b t a b t0 1 0
m m
(3.8)
If one inserts into the rheometer a fresh thixotropic fluid that has been left at rest for a long time, the structural parameter initial value λ0 = 1 can be ex-pected. This generates the response for structure degradation at a given constant shear rate. If the thixotropic fluid is intensively mixed before inputting into the rheometer geometry, λ0 = 0 can be expected. In this case, the response of the model will mimic the recovery of the structure under a constant shear rate. All the data sets described previously can be fitted by regression methods, and the parameters of the model can be predicted.
γ˙=constant,fort≥0,orγ˙=0fort<0
τt=τy0+Kγ˙n+τy1+∆Kγ˙naa+bγ˙m1−e−a+bγ˙mt+λ0e−a+bγ˙mt

Dynamics of Thixotropic Liquids and Time Dependency Chapter | 3 53
3.3.2 Nonlinear Regression of Experimental Shear Stress Versus Time Data by Selected Model Equations
The procedure is very complicated for a rheometer with concentric cylinders and a soft torque sensor (Houska, 1980). Therefore only an approximate de-scription of this procedure can be made. Assuming we have available experi-mental data sets valid for various rotational speeds and for deformation histories further enables to assume the initial structural parameter values (eg, λ0 = 1, if the fully recovered fluid has been filled into the rheometer gap, or λ0 = 0, for a fully degraded structure due to the action of a very high shear rate in the rhe-ometer gap preceding the measurement). In the first step of the procedure, one can make an estimated prediction of the parameters of the model by applying Eq. 3.8 in a nonlinear regression procedure (eg, Marquart Levenberg or Nelder Mead simplex methods for searching for the minimum of the sum of squares of the differences between the experimental and predicted shear stress values). As the second step in the procedure, one can apply the parameters of a specific rheometer (inner diameter of the cup, outer diameter and height of the bob, stiff-ness of the spring, moment of inertia of the bob). Applying these parameters, the start-up regime of the rheometer, the start-up time, and the time when the thixotropic changes will reach a steady state can be predicted. For a good rhe-ometer applied to a given thixotropic fluid, the time for reaching equilibrium of the thixotropic changes has to be much longer than the start-up time of the rheometer. If this requirement is not met, two possibilities should be considered: either the fluid is not thixotropic, or the rheometer cannot be applied for sens-ing the fluid (eg, the start-up of the rheometer is so slow that all thixotropic changes took place during the start-up time). If the start-up time is much shorter than the time for the thixotropic changes to reach equilibrium, the start-up can be neglected. Especially for fluids with considerable yield stress values, it is necessary to check the shear rate value valid for the outer surface of the bob. Due to the reduced space in which the shear flow is valid, the actual shear rates must be recalculated as a func-tion of time, due to the decreasing yield stress values (an effect of thixotropy, see Eqs. 3.4 and 3.5, and also paragraph Applications of rheological models for solving selected engineering tasks in the later section).
3.4 EXAMPLES OF REAL THIXOTROPIC FLUIDS
The first overview of thixotropic clay materials was provided by Van Olphen (1977). Many examples of industrially important thixotropic fluids can be enu-merated, for example, waxy crude oils, colors, iron oxide suspensions, drilling fluids, etc. In this section, the attention is focused on food materials. First of all mayonnaise has to be mentioned, see for example, Tiu and Boger (1974) and Toker et al. (2015); tomato, broccoli, and carrot purées (Tibäck et al., 2014); yoghurt (Schmitt et al., 1998), and toothpastes (Potanin, 2010). An aloe vera suspension (Aloe barbadensis Miller) also exhibited thixotropic behavior

54 PART | I Advances in Food Rheology
(Opazo-Navarrete et al., 2012). Whole liquid egg and albumen, under high-pressure treatment, behaved as a thixotropic fluid (Ahmed et al., 2003). Pedro et al. (2012) reported on the thixotropic behavior of high-pressure treated to-mato juice. Three different commercially manufactured chocolates exhibited thixotropic behavior at temperatures above 30°C (Ardakani et al., 2014). Penna et al. (2001) tested selected lactic beverages, and identified pseudoplastic and thixotropic behavior. Mewis and Wagner (2009) provided an almost complete review of existing examples of thixotropic fluids.
3.5 APPLICATIONS OF RHEOLOGICAL MODELS OF THIXOTROPIC BEHAVIOR FOR SOLVING SELECTED ENGINEERING TASKS
3.5.1 Starting Up a Rotational Rheometer
A detailed description of the solution of starting up a rotational rheometer is given in Houska (1980) and Sestak et al. (1990). In principle, it is necessary to solve the fluid flow in the gap between the inner rotating cylinder and the cup of the rheometer, and the motion equation of the inner cylinder. If the fluid exhibits significant yield stress, the part of the fluid in the gap does not move, and flow is apparent only in a limited part of the gap near the inner cylinder. The work-ing cylinder submerged in the test fluid is mounted by a torsion spring on to the drive of the motor of the rheometer. The moment of inertia of the rotating parts is also considered. The basic equation for solving the rotational speed of the ro-tor as a function of time has the form
∫Ω π ξ ξ τ π= − Ω −
d
dtJ c Nt d R H(2 ( ) ) 2
tp 0 w 1
2
(3.9)
Initial conditions should be applied at time t = ty when the inner rotor of the rheometer is stationary, because the shear stress acting in the whole rheometer gap is lower than the initial yield stress value.
The fluid flow in the gap can be described by the momentum balance for cylindrical coordinates r, Θ, z
τ( )=∂∂ θ
r rr0
1r2
2
(3.10)
The numerical procedure and the software developed for solving Eqs. 3.9 and 3.10 for the model of the thixotropic fluid (3.4) and (3.5) was presented in Houska (1980).
Houska (1980) and Sestak et al. (1990) presented several criteria that can help in making a rough estimate of whether a specific rheometer is capable of indicating the thixotropic behavior of a given fluid. Parameters were developed, such as the start-up time of the rheometer, the character of the start-up (whether it is oscillatory or damped), and an approximate value for the shear rate at the wall of the inner cylinder.
ddtJp=c(2πNt−∫0tΩ(ξ)dξ)−τw2πR12H
0=1r2∂∂rr2τrθ

Dynamics of Thixotropic Liquids and Time Dependency Chapter | 3 55
3.5.2 Isothermal Stationary Flow of a Thixotropic Fluid in a Horizontal Circular Tube
There are many publications dealing with the isothermal stationary flow of a thixotropic fluid in a horizontal circular tube, see for example, Sestak and Zitny (1976), Kemblowski and Petera (1981), and Sestak et al. (1990). An interesting regime for starting up the flow of a thixotropic fluid in a tube corresponds to the procedure after the flow has been stopped for a long time, and the fluid has recovered its thixotropic properties. This problem was attacked by Sestak et al. (1987) for waxy crude oil flow. In recent times, there have been similar publi-cations dealing with tube flow, for example, Vinay et al. (2006, 2007). Wachs et al. (2009) dealt with weakly compressible and thixotropic flow in a tube. A similar problem was investigated by Negrao Cesar et al. (2011) for waxy crude oil. de Souza Mendes and Soares, 2012 focused on the start-up of thixotropic flow in a tube.
The problem of steady flow of a thixotropic fluid in a tube attracted Billingham and Fergusson (1993). Schmitt et al. (1998) studied the tube flow of stirred yoghurt with thixotropic behavior. The problem of steady tube flow was recently investigated by Ahmadpour and Sadeghy (2013).
The scheme of the problem is presented in Fig. 3.1. Solution was based on the method of integral balance (Zitny, 1976).
The basic simplification is the assumption that the dependence of the struc-tural parameter on radial distance can be omitted. This assumption coincides with another expectation that the existence of yield stresses in the thixotropic fluid can also be omitted. It can also be assumed that the wall shear rate is
FIGURE 3.1 Scheme of tube flow in a stationary laminar regime (the predicted dependence of shear stress and structural parameters on the position in the tube).

56 PART | I Advances in Food Rheology
constant throughout the tube, and is equal to the shear rate of a power-law fluid with power-law index n.
γπ
=+n
n
V
D
3 1
4
32w 3
(3.11)
Applying models (3.4) and (3.5) with zero yield stresses and assuming that the initial value of the structural parameter is λ0, the approximate equation for predicting the pressure drop ∆p can be presented, see for example, Sestak and Zitny (1976)
λ ( )= − − − −e
Re´
641 1 SN De 1f 1/De
(3.12)
Here, λf is the coefficient of the shear loss in a tube (friction factor)
λρ
=∆p D
u L
2f 2
(3.13)
SN is the structural number relating the fluid consistency at the entrance to the tube with the consistency of the fluid in equilibrium state
λλ
=+ ∆+ ∆
K K
K KSN
1 /
1 /0
e (3.14)
where λe is
λγ
=+
a
a b mew
(3.15)
De represents the Deborah number (a dimensionless time relating the char-acteristic time of the thixotropic changes with the mean holding time of a fluid in a tube).
γ( )=++ +
n
n
u
L a bDe
3 1
1 mw
(3.16)
Ré is the modified Reynolds number of the same form as was defined for the power-law fluid
ρ
λ( )=
+
+ ∆
−
−
u D
n
nK K
Re´3 1
48
n n
nn
2
1e
(3.17)
Eq. 3.12, together with Fig. 3.2, enables to identify the cases when the thixo-tropic behavior can be neglected, and the cases when this behavior has to be fully
γ˙w=3n+14n 32V˙πD3
λfRe´64=1−1−SNDe1−e−1/De
λf=2∆pDρu¯2L
SN=1+λ0∆KK1+λe∆KK
λe=aa+bγ˙wm
De=3n+1n+1u¯La+bγ˙wm
Re´=u¯2−nDnρ3n+14nn8n−1K+∆Kλe

Dynamics of Thixotropic Liquids and Time Dependency Chapter | 3 57
taken into account. In cases when the Deborah number De is small (De <<1—long tube, short time constant of the thixotropic changes), one can use the equilibrium flow curve for calculating the pressure drop, and omit the time dependence of the fluid properties. It also depends whether the structure of the entering fluid has been reduced to the equilibrium state (eg, by passing through a pump). If this has oc-curred, the expected thixotropic changes can also be omitted.
As soon as the yield stress cannot be omitted, Eq. 3.12 is not fully applicable and a more complicated numerical solution is necessary. Some procedures, tak-ing into account the yield stress effects upon the pressure drop in pipe, are avail-able in the literature; see for example, Sestak et al. (1990) where a semiempirical generalization of Eq. 3.12 and also finite element methods (FEM) are presented.
3.5.3 Power of the Anchor Agitator in the Creeping Flow Regime
The solution to this problem demonstrates the application of a rheological mod-el that is able to include the previous deformation history. Any model experi-ment can serve for a thixotropic fluid as a tool for predicting the power of a scaled-up mixer, since the same fluid is subjected to the same shear rate history. This method is very sensitive to the history of the shear rate applied to the fluid before it is inputted into the mixing equipment.
The anchor mixer has already been analyzed in detail, and the method has been verified experimentally (Zitny et al., 1978; Houska, 1980; Sestak et al., 1986). The problem has been solved for screw and ribbon blender mixing of a thixotropic fluid by Sestak et al. (1980).
FIGURE 3.2 Friction factor in a tube as a function of dimensionless Deborah number De and dimensionless structural number SN, calculated by equation.

58 PART | I Advances in Food Rheology
The solution is based on knowing the Metzner–Otto constant ks, see Metzner and Otto (1957). This “constant” relates mixer rotational speed N and mean value of the shear rate γ
γ = k N.s (3.18)
It has been demonstrated that this principle can also be applied for thixo-tropic fluids, for example, Mylius (1971), Edwards et al. (1976), Zitny et al. (1978), and Sestak et al. (1979).
Detailed experiments with time-independent non-Newtonian fluids were demonstrated by Sestak et al. (1986). These experiments cover a broad range of the power-law index n. An experimental data set valid for an anchor mixer in the creeping flow regime was fitted by the relation
= −k n35.sn n/(1 )
(3.19)
The value of parameter ks was predicted to be 22.8 ± 2.4, and it is valid for power-law indexes in the range from n = 0.022 up to 1. The power-law index for a thixotropic fluid without yield stresses can be predicted as the slope of the log τ γversus logw w graph of the equilibrium state of the fluid. The shape of the power characteristic valid for the given anchor agitator was
=A
PoRe´´
(3.20)
with constant A equal to 200 ± 2, and the mixing Reynolds number Re´´ is de-fined by Eq. 3.21.
More recent studies no longer use experiments with a model of the mixer, and apply a numerical modeling method for the flow in a mixer vessel, see for example, the study presented by Couerbe et al. (2008).
A procedure for predicting the time dependence of the torque for the creep-ing flow regime in a mixed vessel was presented by Sestak et al. (1990). It can be characterized by the following steps:
a. For the provisionally selected time dependence of the rotational speed of the mixer, one can use Eq. 3.18 combined with 3.19 and the time depen-dence of the mean shear rate γ t( ) , that is, a simplified deformation history of the thixotropic fluid in the mixer, can be predicted.
b. For the known initial value of structural parameter λ0 (for a long relaxation time this value to be equal to 1), one can calculate the time dependence of the structural parameter λ(t) by applying the kinetic equation (3.5) of the model. By inputting this time dependence into Eq. 3.4 the mean shear stress
τ (t) and the time dependence of the apparent viscosity µ τγ
=t
t
( )
( )a
can be predicted.
γ˙¯
γ˙¯=ks .N
ks=35.nn1−n
τwversuslogγ˙w
Po=ARe´´
γ˙¯(t)
µa=τ(t)γ˙¯(t)
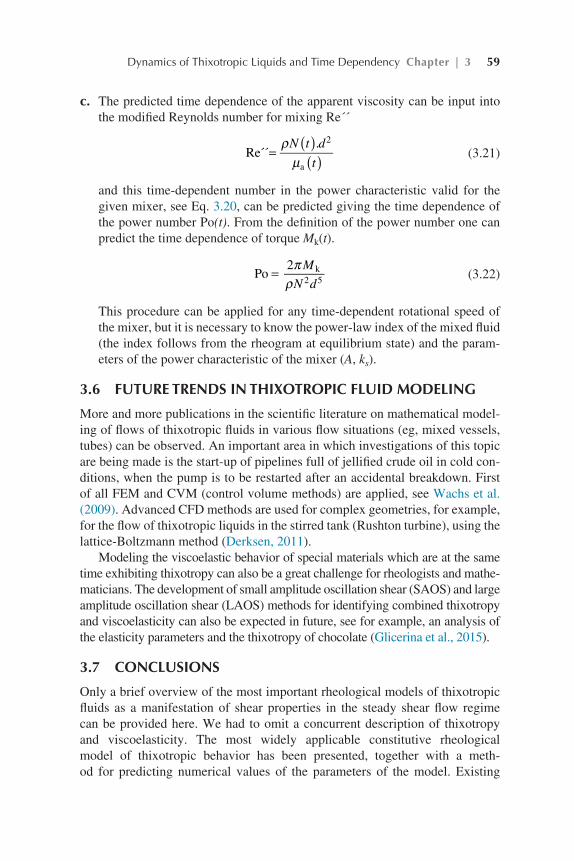
Dynamics of Thixotropic Liquids and Time Dependency Chapter | 3 59
c. The predicted time dependence of the apparent viscosity can be input into the modified Reynolds number for mixing Re´´
ρµ
( )( )=
N t d
tRe´´
. 2
a (3.21)
and this time-dependent number in the power characteristic valid for the given mixer, see Eq. 3.20, can be predicted giving the time dependence of the power number Po(t). From the definition of the power number one can predict the time dependence of torque Mk(t).
πρ
=M
N dPo
2 k2 5
(3.22)
This procedure can be applied for any time-dependent rotational speed of the mixer, but it is necessary to know the power-law index of the mixed fluid (the index follows from the rheogram at equilibrium state) and the param-eters of the power characteristic of the mixer (A, ks).
3.6 FUTURE TRENDS IN THIXOTROPIC FLUID MODELING
More and more publications in the scientific literature on mathematical model-ing of flows of thixotropic fluids in various flow situations (eg, mixed vessels, tubes) can be observed. An important area in which investigations of this topic are being made is the start-up of pipelines full of jellified crude oil in cold con-ditions, when the pump is to be restarted after an accidental breakdown. First of all FEM and CVM (control volume methods) are applied, see Wachs et al. (2009). Advanced CFD methods are used for complex geometries, for example, for the flow of thixotropic liquids in the stirred tank (Rushton turbine), using the lattice-Boltzmann method (Derksen, 2011).
Modeling the viscoelastic behavior of special materials which are at the same time exhibiting thixotropy can also be a great challenge for rheologists and mathe-maticians. The development of small amplitude oscillation shear (SAOS) and large amplitude oscillation shear (LAOS) methods for identifying combined thixotropy and viscoelasticity can also be expected in future, see for example, an analysis of the elasticity parameters and the thixotropy of chocolate (Glicerina et al., 2015).
3.7 CONCLUSIONS
Only a brief overview of the most important rheological models of thixotropic fluids as a manifestation of shear properties in the steady shear flow regime can be provided here. We had to omit a concurrent description of thixotropy and viscoelasticity. The most widely applicable constitutive rheological model of thixotropic behavior has been presented, together with a meth-od for predicting numerical values of the parameters of the model. Existing
Re´´=ρNt.d2µat
Po=2πMkρN2d5

60 PART | I Advances in Food Rheology
thixotropic fluids, mainly from the field of food science (eg, yoghurt, mayonnaise) have been mentioned. The applicability of the model of a thixo-tropic fluid presented here has been confirmed by several references to real flow situations and numerical modeling solutions. Examples were presented on how to predict the torque during the start-up of a rotational rheometer, how to predict the pressure drop for isothermal stationary flow of a thixotropic fluid in a horizontal circular tube, and how to predict the time dependence of the power of an anchor agitator in the creeping flow regime for a selected time history of the rotational speed of a mixer. This chapter has presented basic knowledge for understanding the thixotropic behavior of fluids and for solving real problems involving the flow of those fluids.
ACKNOWLEDGMENT
This chapter was prepared with financial support from the Grant Agency of the Czech Repub-lic, grant number GA14-23482S.
REFERENCES
Abu-Jdayil, B., 2003. Modelling the time-dependent rheological behavior of semisolid foodstuffs. J. Food Eng. 57, 97–102.
Ahmadpour, A., Sadeghy, K., 2013. An exact solution for laminar unidirectional flow of Houska thixotropic fluids in a circular pipe. J. Non-Newtonian Fluid Mech. 194, 23–31.
Ahmed, J., Ramaswamy, H.S., Alli, I., Ngadi, M., 2003. Effect of high pressure on rheological characteristics of liquid egg. Lebensm. Wiss. Technol. 36, 517–524.
Alessandrini A., Lapasin R., 1984. Thixotropy: An extended version of the Cheng-Evans approach. In: Kikic, A., Proceedings of the Fourth Italian-Yugoslav-Austrian Chem. Eng. Conference. II, Grado, Italy, September 1984.
Alessandrini, A., Ramaswamy, R., Sturzi, F., 1982. The kinetics of thixotropic behaviour in clay/kaolin aqueous suspensions. Chem. Eng. Commun. 17, 13–22.
Alvarez, M.D., Canet, W., 2013. Time-independent and time-dependent rheological characteriza-tion of vegetable-based infant purees. J. Food Eng. 114, 449–464.
Ardakani, H.A., Mitsoulis, E., Hatzikiriakos, S.G., 2011. Thixotropic flow of toothpaste through extrusion dies. J. Non-Newtonian Fluid Mech. 166, 1262–1271.
Ardakani, H.A., Mitsoulis, E., Hatzikiriakos, S.G., 2014. Capillary flow of milk chocolate. J. Non-Newtonian Fluid Mech. 210, 56–65.
Assouad, B. Modelling of flow of thixotropic liquids, Department of Chemical and Food Machinery Design, CTU in Prague. MSc Thesis No. 74202. 1974 (in Czech).
Barnes, H.A., 1997. Thixotropy—a review. J. Non-Newtonian Fluid Mech. 70 (1-2), 1–33. Bauer, W.A., Collins, E.A., 1967. Thixotropy and dilatancy. In: Eirich, F.R. (Ed.), Rheology: The-
ory and Applications 4. Academic Press, New York, Chapter 8. Billingham, J., Fergusson, J.W.J., 1993. Laminar unidirectional flow of a thixotropic fluid in a
circular pipe. J. Non-Newtonian Fluid Mech. 47, 21–55. Carleton, A.J., Cheng, D.C.-H., Whittaker, W., 1974. Determination of the rheological properties
and start-up pipe line flow characteristics of waxy crude and fuel oils. Technical paper No. IP 74-009, Institute of Petroleum, London.

Dynamics of Thixotropic Liquids and Time Dependency Chapter | 3 61
Cheng, D.C.-H., 1973. A differential form of constitutive relation for thixotropy. Rheol. Acta 12, 228–233.
Cheng, D.C.-H., Evans, F., 1965. Phenomenological characterization of the rheological behaviour of inelastic reversible thixotropic and antithixotropic fluids. Br. J. Appl. Phys. 16, 1599–1617.
Choon L.I., 1975. Thixotropic properties of polymer melts, Princeton University, Department of Chemical Engineering, PhD Thesis.
Couerbe, G., Fletcher, D.F., Xuereb, C., Poux, M., 2008. Impact of thixotropy on flow patterns in-duced in a stirred tank: numerical and experimental studies. Chem. Eng. Res. Des. 86, 545–553.
Davenport, T.C., Somper, R.S.H., 1971. The yield value and breakdown of crude oil gels. J. Inst. Petrol. 57, 86–90.
de Souza Mendes, P.R., Soares, F., 2012. Startup flow of gelled crudes in pipelines. J. Non-Newtonian Fluid Mech. 179–180, 23–31.
Denny, D.A., Brodkey, R.S., 1962. Kinetic interpretation of non-Newtonian flow. J. Appl. Phys. 33, 2269–2274.
Derksen, J.J., 2011. Simulations of thixotropic liquids. Appl. Math. Modell. 35, 1656–1665. Dullaert, K., Mewis, J., 2006. A structural kinetics model for thixotropy. J. Non-Newtonian Fluid
Mech. 139, 21–30. Edwards, M.F., Godfrey, J.C., Kashani, M.M., 1976. Power requirement for the mixing of thixo-
tropic liquids. J. Non-Newtonian Fluid Mech. 1, 309–322. Fredrickson, A.G., 1970. A model for the thixotropy of suspensions. AIChE J. 16, 437–441. Glicerina, V., Balestra, F., Dalla Rosa, M., Romani, S., 2015. Effect of manufacturing process on
the microstructural and rheological properties of milk chocolate. J. Food Eng. 145, 45–50. Godfrey, J.C., 1973. Steady shear measurements of thixotropic fluid properties. Rheol. Acta 12,
540–545. Hahn, S.J., Ree, T., Eyring, H., 1957. A theory of thixotropy and its alication to grease. NLGI
Spokesman, issue June, 12–16.Harris, J., 1967. A continuous theory of time-dependent inelastic flow. Rheol. Acta 6, 6–12. Houska, M., 1980. Engineering aspects of thixotropic fluids, Department of Chemical and Food
Machinery Design, CTU in Prague, PhD Thesis (in Czech).Huang, C.R., Fabisiak, W., Polston N.L., 1976. Correlation of thixotropic parameters with alica-
tion properties of latex paints. Proceedings of Seventh Congress of Rheology, Gothenburg, pp. 238–239.
Jones, L.G., Brodkey, R.S., 1968. Thixotropic behaviour of colloidal suspension. Proceedings of Fifth International Congress of Rheology, Kyoto, vol. 2, p. 267.
Kemblowski, Z., Petera, J., 1979. Rheological characterization of thixotropic fluids. Rheol. Acta 18, 702–710.
Kemblowski, Z., Petera, J., 1981. Memory effects during the flow of thixotropic fluids in pipes. Rheol. Acta 20, 311–323.
Kim, H.T., Brodkey, R.S., 1968. A kinetic approach for polymer solution data. AIChE J. 14, 61–64. Kunnos, G.Ja., Mironov, B.E., 1979. Reologiceskaja model strukturirovanoj sistemy na nenju-
tonovskom ucastke tecenija. Kolloidnyij Zhurnal. 41, 871–874. Lapasin R., Alessandrini A., Sturzi F., 1980. A procedure for the definition of thixotropic inelastic
model. Proceedings of the Eighth Rheol. Congress, Naples, 2. pp. 563–564Lapasin, R., Longo, V., Rajgelj, S., 1980. A thixotropic model for cement pastes. Proceedings of the
Eighth Rheology Congress, Naples, vol. 3, pp. 659–660.Lapasin, R., Papo, A., Rajgelj, S., 1983. The phenomenological description of the thixotropic be-
haviour of fresh cement pastes. Rheol. Acta 22, 410–416.

62 PART | I Advances in Food Rheology
Lin, O.C.C., 1975. Thixotropic behaviour of gel-like systems. J. Al. Polym. Sci. 19, 199–214. Mason, P.L., Bistany, K.L., Puoti, M.G., Kokini, J., 1982. A new empirical model to simulate tran-
sient shear stress growth in semi-solid foods. J. Food Process. Eng. 6, 219–233. McArdle, C.R., Pritchard, D., Wilson, S.K., 2012. The Stokes boundary layer for a thixotropic or
antithixotropic fluid. J. Non-Newtonian Fluid Mech. 185-186, 18–38. Mercer, H.A., Weyman, H.D., 1974. Structure of thixotropic suspensions in shear flow III: time
dependent behaviour. Trans. Soc. Rheol. 18, 199–203. Metzner, A.B., Otto, R.E., 1957. Agitation of non-Newtoniavn fluids. AIChE J. 3, 3–10. Mewis, J., 1979. Thixotropy—general review. J. Non-Newtonian Fluid Mech. 6 (1), 1–20. Mewis, J., Wagner, N.J., 2009. Thixotropy. Adv. Colloid Interface Sci. 147–148, 214–227. Moore, F., 1959. The rheology of ceramic slips and bodies. Trans. Br. Ceram. Soc. 58, 470–474. Mylius, E., 1971. Modelluntersuchungen zur Charakterisierung thixotroper Medien und ihre
Anwendung für verfahrenstechnische Prozessberechnungen, Dr.-Ing. Dissertation, Sektion Verfahrenstechnik der Technische Hochschule für Chemie „Carl Schorlemmer“, Leuna-Merseburg.
Mylius, E., Reher, E.O., 1972. Modeluntersuchungen zur Charakterisierung thixotroper Medien und ihre Anwendung fuer verfahrenstechnische Prozessberechnungen. Plaste Kautschuk 19, 420–431.
Negrao Cesar, O.R., Franco, A.T., Rocha, L.V., 2011. A weakly compressible flow model for the restart of thixotropic drilling fluids. J. Non-Newtonian Fluid Mech. 166, 1369–1391.
Opazo-Navarrete, M., Tabilo-Munizaga, G., Vega-Gálvez, A., Miranda, M., Pérez-Won, M., 2012. Effects of high hydrostatic pressure (HHP) on the rheological properties of Aloe vera suspen-sions (Aloe barbadensis Miller). Innov. Food Sci. Emerg. Technol. 16, 243–250.
Ottone, M.L., Peirotti, M.B., Deiber, J.A., 2009. Rheokinetic model to characterize the maturation process of gelatin solutions under shear flow. Food Hydrocoll. 23, 1342–1350.
Parker, B.R., 1975. Start-up flows of thixotropic fluids in pipes. Postgraduate School of Studies in Chemical Engineering, University of Bradford, PhD Thesis.
Paslay, P.R., Slibar, A., 1962. Die Stoffgleichungen thixotroper Körper. Rheol. Acta 2, 236–242. Pedro, E.D., Augusto, P.E.D., Ibarz, A., Cristianini, M., 2012. Effect of high pressure homogeni-
zation (HPH) on the rheological properties of tomato juice: time-dependent and steady-state shear. J. Food Eng. 111, 570–579.
Pelcova L. Rheological description of thixotropic liquids, Department of Chemical and Food Ma-chinery Design, CTU in Prague. MSc Thesis No. 79242. 1979 (in Czech).
Penna, A.L.B., Sivieri, K., Oliveira, M.H., 2001. Relation between quality and rheological proper-ties of lactic beverages. J. Food Eng. 49, 7–13.
Peterfi, T., 1927. Die Abhebung der Befruchtungsmembran bei Seeigeleiern—Eine kolloidche-mische Analyse des Befruchtungsvorganges. Wilhelm Roux’ Archiv für Entwicklungsmechan-ik der Organismen 112 (1), 660–695.
Petrellis, N.C., Flumerfelt, R.W., 1973. Rheological behaviour of shear degradable oils: kinetic and equilibrium properties. Can. J. Chem. Eng. 51, 293–298.
Pijadin, M.N., 1974. Tiksotropnyje svojstva Usinskoj nefti. Transport in chranenije nefti i neft-eproduktov (No. 11), 25–26.
Potanin, A., 2010. 3D simulations of the flow of thixotropic fluids, in large-gap Couette and vane-cup geometries. J. Non-Newtonian Fluid Mech. 165, 299–312.
Quemada, D., Flaud, P., Jezequel, P.H. 1984. Unsteady rheological properties of concentrated dis-perse media; elasto-thixotropic model, Proceeding of Ninth International Congress of Rheol-ogy, Mexico, pp. 481–486.
Regirer, S.A., Sadrina, N.N., 1978. O modeljach tiksotropnych zidkostej. Prikladnaya Matematika i Mekhanika 42, 856–858.

Dynamics of Thixotropic Liquids and Time Dependency Chapter | 3 63
Ritter, R.A., Govier, W.G., 1970. The development and evaluation of a theory of thixotropic behav-iour. Can. J. Chem. Eng. 48, 505–510.
Ruckenstein, E., Mewis, J., 1973. Kinetics of structural changes in thixotropic fluids. J. Colloid Interface Sci. 44, 532–537.
Schmitt, L., Ghnassia, G., Bimbenet, J.J., Cuvelier, G., 1998. Flow properties of stirred yoghurt: calculation of the pressure drop for a thixotropic fluid. J. Food Eng. 37, 367–388.
Schoukens, G., Spaull, A.J. B., Mewis, J., 1976. Time dependent viscoelastic spectra of some thixo-tropic dispersions. Proceedings of Seventh International Congress of Rheology, Gothenburg, p. 498.
Sestak, J., Charles, M., Cawkwell, M., Houska, M., 1987. Start-up of gelled crude oil pipelines. J. Pipelines 6, 15–24.
Sestak, J., Houska, M., Zitny, R., 1979. Mixing of thixotropic fluids.Society of Rheology—Golden Jubilee Meeting, Boston, MA, USA.
Sestak, J., Zitny, R., 1976. Flow of thixotropic liquids in a tube. Acta Polytechnica, CTU 4 (II), 1, 45–52 (in Czech).
Sestak, J., Zitny, R., Houska, M., 1980. Rheological characterization of thixotropic fluids and its alication to prediction of mixer equipment. Acta Polytechnica 11, 69–84.
Sestak, J., Zitny, R., Houska, M., 1986. Anchor agitated systems power input correlation for pseu-doplastic and thixotropic fluids in equilibrium. AIChE J. 32, 155–158.
Sestak, J., Zitny, R., Houska, M., 1990. Dynamics of thixotropic fluids. Rozpravy CSAV Technicke vedy 100 (1), 3–92, (in Czech).
Storey, B.T., Merrill, E.W., 1958. The rheology of aqueous solutions of amylose and amylopectin with reference to molecular configuration and intermolecular association. J. Polym. Sci. 33, 361–375.
Syrakos, A., Georgiou, G.C., Alexandrou, A.N., 2015. Thixotropic flow past a cylinder. J. Non-Newtonian Fluid Mech. 220, 44–56.
Tibäck, E., Langton, M., Oliveira, J., Ahrné, L., 2014. Mathematical modeling of the viscosity of tomato, broccoli and carrot purees under dynamic conditions. J. Food Eng. 124, 35–42.
Tiu, C., Boger, D.V., 1974. Complete rheological characterization of time dependent food products. J. Texture Stud. 5, 329–338.
Toker, O.S., Karasu, S., Yilmaz, M.T., Karaman, S., 2015. Three interval thixotropy test (3ITT) in food alications: a novel technique to determine structural regeneration of mayonnaise under different shear conditions. Food Res. Int. 70, 125–133.
Van Olphen, H., 1977. An Introduction to Clay Colloid Chemistry, second ed. John Wiley and Sons, N.Y.
Vinay, G., Wachs, A., Agassant, J.F., 2006. Numerical simulation of weakly compressible Bingham flows: the restart of pipeline flows of waxy crude oils. J. Non-Newtonian Fluid Mech. 136, 93–105.
Vinay, G., Wachs, A., Frigaard, I., 2007. Start-up transients and efficient computation of isothermal waxy crude oil flows. J. Non-Newtonian Fluid Mech. 143, 141–156.
Wachs, A., Vinay, G., Frigaard, I.A., 2009. 1.5D numerical model for the startup of weakly com-pressible flow of a viscoplastic and thixotropic fluid in pipelines. J. Non-Newtonian Fluid Mech. 159, 81–94.
Zitny, R., 1976. Influence of dissipation and thixotropy on the flow in a tube, part II Thixotropy, CTU in Prague, Faculty of Mechanical Engineering, PhD Thesis (in Czech).
Zitny, R., Rieger, F., Houska, M., Sestak, J., 1978. Rheological characterization of thixotropic fluids with respect to equipment design procedures. Sixth International CHISA Congress, Prague.

65Advances in Food Rheology and Its Applications. http://dx.doi.org/10.1016/B978-0-08-100431-9.00004-8Copyright © 2017 Elsevier Ltd. All rights reserved.
Chapter 4
From Rheology to Tribology: Applications of Tribology in Studying Food Oral Processing and Texture Perception
S. PrakashThe University of Queensland, Brisbane, QLD, Australia
4.1 INTRODUCTION
The quality of food is determined by their appearance, flavor, nutrition, and texture (Bourne, 2002). Appearance, including color, shape, size, and gloss, is the response of optimal receptor, while flavor is perceptible by taste and olfac-tory senses. Texture is an important factor in the appreciation of food products and most people have a clear idea on the expected texture of a product, based on their memory of past experiences (Mojet and Köster, 2005). Food texture generally has three perceptions based on the different senses, which are visual, auditory, and tactile texture (Lawless and Heymann, 2010). Visual texture is detected by fingers, affected by certain surface properties of a food product and includes terms like roughness, oiliness, smoothness, wilting, surface wetness, etc. (Chen, 2007). Auditory texture is perceived by auditory receptor in the form of a sound and includes terms like crunchiness, crispiness, crackliness, etc. of foods. Tactile texture is detected by oral apparatus like lips, teeth, oral mucosa, tongue, and the throat. Food texture may not be eloquent as flavor and aroma but is one of the key quality attributes in providing the overall sensory experience in the fresh and processed food industry and thus is critical to the acceptance and delight of the customers (Chen and Opara, 2013; Rosenthal, 1999).
Food oral processing is an essential daily dynamic activity that includes all muscle activities, jaw movements, and tongue movements that contribute to preparing food for swallowing (Koc et al., 2013). A number of processes occur in the mouth that includes mechanical breakdown of solid pieces into smaller fragments, enzymatic reduction of starches into sugars, molecular interaction

66 PART | I Advances in Food Rheology
with microorganisms, and mixing with saliva. It is the first step in the food in-take and metabolism process that delivers energy and essential nutrients to our body (Stieger and van de Velde, 2013). The intensity of the muscular, jaw, and tongue movements during oral processing is dependent on the type of food in the oral cavity. Four categories of food products can be defined based on their rheological and sensory properties: liquids, semisolids, soft solids, and hard solids (van Vliet et al., 2009) that are defined by Stieger and van de Velde (2013) as—Liquids flow and do not require chewing before swallowing, although liq-uids are orally processed (eg, milk, beverages, yoghurt drinks); semisolids are predominantly squeezed between tongue and palate during oral processing without the use of the molars (eg, pudding, custard); soft solids require (initial) chewing between the molars, but do not elicit “crispy” sensations (eg, cheese, processed meat); hard solids are crispy, require chewing between the molars, and generally produce an acoustic sound emission during oral processing (eg, crackers, raw vegetables, apples).
The perception of texture of the food is vital in determining its acceptance and preference by the consumers. Traditionally texture is measured using a sensory panel that is subjective and time consuming. Hence there is always a growing interest in an instrumental method that can provide objective measure of texture. Once in the mouth the food is manipulated by tongue, teeth, inside of the cheeks, and lips with different speeds and pressures (Prinz et al., 2007). Through the various stages of mastication, food is continuously chewed and mixed up with the saliva and is gradually converted into a bolus ready to be swallowed (de Wijk and Prinz, 2006). Various sensory textural attributes that human sense/perceive during different stages of mastication process include hardness, softness, adhesiveness, springiness, thickness, brittleness, crispi-ness, sponginess, smoothness, roughness, lumpiness, pastiness, creaminess, slipperiness, and many others (de Wijk and Prinz, 2006). Foster et al. (2011) have rightly described sensory perception during oral processing as a dynamic process. Over the past few decades, extensive researches in food texture stud-ies have attempted to qualify and quantify physical properties of foods using techniques such as texture analyzer (texture profile analysis) (Bourne, 2002), posthumus funnel (Kutter et al., 2011), viscometer (Christensen, 1979), and rheometer (de Wijk et al., 2003; Janssen et al., 2007; Stanley and Tay-lor, 1993). Many textural features, such as hardness, springiness, adhesiveness, fracturability, and thickness perceived during oral processing, have been well explained by some specific physical parameters measured using these tech-niques (Chen, 2009). However, these approaches are essentially based on bulk destruction and shear deformation. Therefore, these methods are feasible only to those texture properties which link directly to bulk phase deformation but are not applicable to some of the sensations that are detected by rubbing and squeezing actions (upward/downward movement along with horizontal move-ments) of the tongue against the palate such as creaminess, slipperiness, and smoothness. Such actions create both normal and shearing force in the mouth

From Rheology to Tribology Chapter | 4 67
and generate a friction/lubrication sensation between palate and tongue with the food product (or food–saliva mixture) acting as the lubricant. These oral actions are no longer associated with bulk phase deformation, but have more to do with thin layer rheology or tribology. In realization of the limitation of rhe-ometer, posthumus funnel, viscometer, and texture analyzer that tend to utilize either normal force or shear force to describe some of the oral sensation, tribol-ogy, the study of thin film and lubrication, has attracted growing interest in the past decade in food texture studies. It has been hypothesized that food tribology could explain physical fundamentals for food texture studies where rheology and texture analyzer failed to achieve. One of the most obvious implications of food tribology is the study of smoothness sensation, a very essential texture feature linked to oil/fat presence and creaminess perception. Food industry is under a growing pressure to develop tasty fat-reduced food to combat increased number of fat-related diseases worldwide and an instrument that can mimic fat-related sensory attributes such as creaminess and fattiness is urgently needed (Prakash et al., 2013).
4.2 TRIBOMETER—PRINCIPLE, OPERATION, MEASUREMENT OF LUBRICATION PROPERTIES AND DIFFERENT TYPES
4.2.1 Basic Principle of a Tribometer
Tribology is the science of interacting surfaces in relative motion. Analysis of the design, wear, lubrication, and friction between surfaces in motion is achieved by a tribometer. It is known as a surface contacting technique, as it re-quires a flat substrate or probe to come in close contact with the material surface of a sample. It has been used in studying the role of surface adhesive proper-ties and lubricity. Therefore, a tribometer was first developed for determining roughness of engineering materials (Chen, 2007). However, in food sensory application, tribology is important for determining the sensory outcomes of a food product in the oral cavity that includes the tongue, upper palate, and tooth surface (Dresselhuis, 2008). Tribology has a growing interest in oral texture and sensory research due to its ability to assess certain properties of the food during the complex oral processing that cannot be explained by its bulk texture and rhe-ology. To measure tribological behaviors of food samples a good understanding of the principle of operation of the tribometer is essential.
4.2.2 Operation of a Tribometer
As mentioned in the previous section, tribology is a field of study in fric-tion between two interacting surfaces A and B (Fig. 4.1), relating to wearing, tearing, and lubrication. Once the two surfaces A and B are in relative move-ment at a steady speed of V, the frictional force (FR) in N can be expressed as: FR = (µ) × FL where µ is the friction coefficient and is dimensionless and FL is the normal force or the surface load in N.

68 PART | I Advances in Food Rheology
4.2.3 Measurement of Lubrication Properties of Food Products
The lubrication behavior of food samples can be understood with a well-known Stribeck curve (Fig. 4.2) that is a plot of the coefficient of friction against a combined parameter of viscosity, speed, and load. On the vertical axis is the friction coefficient. The horizontal axis is a parameter that combines three other variables: the fluid viscosity, η (Pa s), the relative speed of surface movement, V (m/s), and the surface load, PL (Pa). The combination of three parameters gives a unit of length (m), resembling the thickness of the lubricant film between the two moving surfaces.
FIGURE 4.2 A typical Stribeck curve. (Adapted from Prakash et al., 2013.)
FIGURE 4.1 An illustration represents the friction between interacting surfaces. Arrows indicate directions and magnitudes of forces. FL is the normal force, V is the sliding speed, and FR is the force of friction. (Adapted from Prakash et al., 2013.)

From Rheology to Tribology Chapter | 4 69
The Stribeck curve is determined by shearing two surfaces in relative mo-tion over one another at various speeds while simultaneously measuring the friction force. Often a lubricant is present to reduce the friction. A Stribeck curve has a characteristic shape that can be typically divided into three regimes: the boundary regime, the mixed regime, and the hydrodynamic regime, repre-senting three very different friction scenarios and, in case of oral processing, different amount of food samples between the tongue and palate as shown in Fig. 4.2.
(a) Hydrodynamic regime: as explained by Cassin et al. (2001) the purpose of lubrication is to introduce a thin, low-shear-strength food film between the tongue and palate and if this film is to separate the tongue and palate surfac-es, it must be capable of sustaining the applied load. At the start when food is consumed the rate of entrainment of the food into the contact zone due to surface motion results in a sufficiently high fluid pressure to fully separate the surfaces and this process is called hydrodynamic lubrication. The fric-tion force (µ) in this regime depends on the relative speed (V) and on the viscosity (η) of the lubricant. The film thickness and friction generated in this type of lubrication depend upon the viscosity of the food. Thus sensory thickness is perceived in this regime and relates to the viscosity of the food.
(b) Boundary regime: if the hydrodynamic fluid pressure is insufficient to sepa-rate the palate and tongue, then the lubrication properties of the food depend on the ability of the food’s constituents to form boundary films. Bound-ary lubrication is characterized by the presence of an “immobile” layer on tongue and palate surfaces that does not participate in the hydrodynamic flow of the bulk food. It is the point where the two interacting surfaces come into asperity contact (Cassin et al., 2001; Dresselhuis, 2008) and this might be the regime closely related to human perception of astringency, slipperi-ness. In this regime µ is hardly affected by the sliding speed but is mainly determined by the chemical constitution of the thin film lubricant layer cov-ering the solid surfaces (Butt et al., 2004).
(c) Mixed regime: between the boundary and the hydrodynamic regime lies the mixed regime of lubrication. In this regime, the food entrainment into the tongue−palate contact zone is sufficient to partly separate the two rubbing surfaces. However, the lubricant film thickness and the height of the asperi-ties of the substrate surfaces are of similar dimensions, so the contact load is borne in part by fluid pressure and in part by asperity contact pressure (Cassin et al., 2001). The friction coefficient reaches a minimum in this re-gime and, with either increased asperity contact or increased thickness of the lubricant layer, the friction coefficient will increase (Dresselhuis, 2008; Gabriele et al., 2010).
As shown by the Stribeck curve in Fig. 4.2, rheology would be a relevant ap-proach to understand physical behaviors of sample as long as the amount of the fluid is adequate to form an high enough fluid pressure and resistance to flow,

70 PART | I Advances in Food Rheology
which would fall under the hydrodynamic regime. However, sample behaviors in the mixed and boundary regimes cannot be explained by rheology principles but would certainly require tribological interpretation.
4.2.4 Various Tribometers Used in Food Applications
Tribology of foods relates to the study and measurement of friction and lubrica-tion properties of food systems. Developing a reliable, low cost, and easy-to-use tribometer applicable to a wide variety of food products is still a big challenge to researchers. A wide range of methods have been applied to measure friction during oral processing of food including the linear friction sledge, the pin- or ball-on-disk tribometer as well as rheometers with specific friction attachments.
4.2.4.1 Friction TesterFriction tester (Fig. 4.3) is the most basic friction testing equipment developed in the last decade. It consists of a specially designed rubber band, a load cell, and a metal cylinder of an electric motor. The rubber band (6 cm length × 1 mm diameter) is attached to the metal cylinder of a rotary electric motor on one end, whereas the other end is attached to a 50 N load cell (de Wijk et al., 2006; de Wijk and Prinz, 2005, 2007).
The friction tester is simple, easy to use and the key frictional properties of a fluid product can be reliably measured. Some of the crucial drawbacks include restricted use of rubber and metal materials of the two surfaces which fails to draw resemblance to human oral palate–mouth, the surface-to-surface interac-tion, defined and well-controlled sliding speed, and lack of well-controlled tem-perature (de Wijk and Prinz, 2007).
FIGURE 4.3 A schematic diagram of friction tester. (Redrawn from de Wijk and Prinz 2005 designed by Halling 1976.)

From Rheology to Tribology Chapter | 4 71
4.2.4.2 Texture Analyzer Set-Up for Lubrication MeasurementIn this study a commercial texture analyzer (Stable Microsystems, Surrey, UK) was used as the main device with few additional simple fittings and attachments (Fig. 4.4) for tribology studies (Chen et al., 2014). Exponent software (version 3.2) preloaded on the texture analyzer was used for automatic data recording of the force, distance, and time.
The design adopts a ball-on-disk arrangement with one direction dragging movement resulting in pure sliding friction similar to what happens when the tongue moves against the static hard palate. The set-up is capable of conducting friction/lubrication measurements over a wide range of sliding speed (0.01–40 mm/s) and at any chosen surface load. Syrup solutions and evaporated milk were used as examples of near-Newtonian and non-Newtonian fluids for feasi-bility tests and results were reliably reproducible. Friction coefficients obtained for syrup solutions were comparable to those reported in the literature. Stribeck curves covering the boundary regime, mixed regime, and hydrodynamic regime can also be constructed. The set-up is cheap, convenient to operate, and easy to set controlled experimental conditions (sliding speed, surface load, and tem-perature) for lubrication studies. The major drawback with this design is the hard balls sliding against the soft substrate while in human mouth it is the op-posite, the lubrication occurs as the tongue moves against the hard palate. Also the use of stainless steel balls is nowhere close to the mechanical strength of the hard palate and a suitable material more closely representing the hard palate is needed to replace steel balls.
4.2.4.3 Optical Tribological ConfigurationOptical tribological configuration (OTC) consists of two interacting surfaces and a confocal scanning light microscopy (CLSM) (Fig. 4.5). The sample (A) is placed between an interacting upper detachable surface (B) that allows us-ers to experiment with different surface materials, including atypical materials
FIGURE 4.4 An illustration of the texture analyzer set up for lubrication measurements (Chen et al., 2014).

72 PART | I Advances in Food Rheology
such as pig’s tongue and a stationary glass platform (C). A force, Fz, is applied downward from the upper surface with the glass platform (C) oscillating, and the frictional force, Fx, is measured. The average friction coefficient is then cal-culated over the area of movement of sample at constant rate of shearing. The CLSM scans the movement and behavior of the sample from beneath the glass platform, and gives a unique advantage in revealing any microstructural change to the sample under the shear deformation (Dresselhuis et al., 2007, 2008a).
The main disadvantage of the set-up is the two interacting surfaces—the glass interacting surface, which is not an ideal material to imitate mouth-like conditions unlike polydimethylsiloxane (PDMS) and the delicateness of the other interacting surface (pig’s tongue) that restricts the load as well as the speed that can be applied. Also the natural variation in the physical surface of the tongue causes low repeatability. In their study on emulsions using OTC, Dresselhuis et al. (2008a) applied a load of 0.5 N and a sliding speed of 80 mm/s whereas a typical tribology test runs at much higher load and speed in the range of 0.01–2000 mm/s.
4.2.4.4 Tribo-RheometerNguyen et al. (2016) use a tribo-rheometer set-up to measure the lubrication properties of milk with varying fat percentage. The set-up of tribological mea-surement is schematically presented in Fig. 4.6. The tribological measurements were performed on a Discovery Hybrid Rheometer, using ring on plate tribo-rheometry (TA Instrument, USA) on a rough plastic surface of 3M Transpore Surgical Tape 1527-2 (3M Health Care, USA). The ring upper geometry is coupled to the rheometer head through coupling adapter and beam coupling to perform rotation movement. The beam coupling is self-aligning to ensure uniform solid–solid contact and axial force distribution between the surfaces.
FIGURE 4.5 A diagram showing the typical optical tribological configuration. (Redrawn from Dresselhuis et al., 2008a.)

From Rheology to Tribology Chapter | 4 73
The lower plate geometry is connected to a Peltier plate for accurate and stable temperature control. The advantage of using ring on plate rheometry is that it has a well-defined contact surface for an accurate computation of the friction and normal stress especially for soft substrates.
Pasteurized milk (fat contents from 0.1% to 4.9%) and cream cheeses (fat contents: 0.5, 5.5, 11.6%) were chosen as representative dairy products and their friction coefficients were measured as a function of entrainment speed of the tribometer. The friction coefficients of the samples at low entrainment speed generating low shear rate (similar to the shear rate in mouth) were significantly different between the samples at each fat levels (Fig. 4.7). Thus, this method is simple, easy to operate, and capable of differentiating samples with different fat contents both in liquid or semisolid forms. The only drawback is the use of plastic material as the soft substrate does not resemble the tongue surface.
4.2.4.5 Tribology CellGoh et al. (2010) developed a rather simple inexpensive and very convenient to use tribology cell (Fig. 4.8) that can be attached to a rheometer. This cell was custom designed and normal balance was achieved by the two contact points being at an opposite and equal distance from the rheometer shaft. The operation of the cell is controlled through the rheometer. The instrument is capable of performing under various loading conditions, that is, using a speed ramp, a load ramp, and even a gap ramp, allowing it to mimic the chewing, squeezing, and sliding conditions occurring in the mouth.
FIGURE 4.6 An illustration of a tribo-rheometer set-up with the ability to differentiate milk with different fat percentages. (Adapted from Nguyen et al., 2016.)

74 PART | I Advances in Food Rheology
The friction data collected on Newtonian fluids—water and different concentrations of corn syrup with different viscosities show different re-gimes of lubrication under a range of speed and normal load conditions. The Stribeck curve using the tribology cell normalized against viscosity at a constant load (3 N) and different sliding speed is shown in Fig. 4.9, where all friction curves show typical Stribeck feature with a minimal fric-tion coefficient occurring at a very similar value of combined viscosity and velocity.
The conclusions made in this study suggest that investigation of confined rubbing conditions may be possible under various loading conditions, such as with the use of a speed ramp, load ramp, or gap ramp without the need for spe-cific tribological equipment. However, validation of the capability of the instru-ment for non-Newtonian fluids is still required.
FIGURE 4.8 The tribology cell can be attached to a rheometer and performs friction and lubrication tests under various loading conditions. (Redrawn from Goh et al., 2010.)
FIGURE 4.7 Friction curves of pasteurized milk (left) and cream cheeses (right) of different fat concentrations with normal force 2 N (Nguyen et al., 2016).

From Rheology to Tribology Chapter | 4 75
4.2.4.6 Mounted Tribological DeviceA mounted tribological device (MTD) is primarily a rheometer with a unique geometry attachment designed for tribology measurements (Heyer and Lauger, 2009). The MTD is based on a ball-on-three-plates principle, consisting of a spherical geometry, an insert with three small plates, fixated onto a platform that can freely move in all directions as shown in Fig. 4.10a. The flexibility of the insert can be modified in such a way that the surface is replaced with a desired material for both ball and plates that might be more advantageous com-pared to OTC, as both of the interacting surfaces in MTD can be changed to pre-ferred materials instead of just one single surface. It utilizes the capabilities of a rheometer for a great range of measurements with sensitive oscillatory control.
FIGURE 4.9 Stribeck curve using the tribology cell normalized against the viscosity with a load of 3 N and speed ramp (0.1–1000 mm/s). (Adapted from Goh et al., 2010.)
FIGURE 4.10 A ball-on-three-plates set up within a mounted tribological device (a) with Peltier hood and elements enclosing the ball and plates, (b) after “device”. (Adapted from Heyer and Lauger, 2009.)

76 PART | I Advances in Food Rheology
Peltier hood and elements as seen in Fig. 4.10b are attached to the rheometer, enclosing the ball and plates. The Peltier elements allow defined and consistent temperature control ranging from −40 to 200°C while the hood maintains an even temperature throughout all points within. Compared to OTC and friction tester, MTD can be run at much higher loads and sliding speed.
For tribological measurements of food samples elastomers are used as the bottom plates (Baier et al., 2009). The capability of MTD has been validat-ed with a range of fluid milk with different fat percentages. Fig. 4.11 shows Stribeck curves generated from different milk samples, where differences in friction coefficient at different sliding speeds are clearly observable. Further tests using fat-in-water emulsions thickened with maltodextrin or xanthum gum showed a relationship between friction factor and human creaminess perception.
The main limitation with the MTD is the extreme sensitivity of the set-up that requires even distribution of load on all three friction contact points be-tween the ball and the plates. The ball is fixated to the stationary shaft, therefore precise positioning of the 3-plates fixture is hugely critical. Any slight uneven distribution of contact points would result in inaccuracy of friction coefficient measurement.
4.2.4.7 Tongue–Palate Tribological SystemA specific tongue–palate tribological system was used by Ranc et al. (2006) to study the effect of surface structure on the tribological performance of contacts between a relatively hard ball made from steel or polychlorotrifuorethylene (PCTFE), representing the palate and a soft silicone surface simulating rough-ness and elasticity of the human tongue. Fig. 4.12 shows a labeled image of the
FIGURE 4.11 Friction factor as a function of sliding speed for fluid milk with different fat percentages. (Adapted from Baier et al., 2009.)

From Rheology to Tribology Chapter | 4 77
tribometer, with an embedded, scanning electron microscopy (SEM) image of the silicone surface structures (1). Silicone rubber has a Young’s modulus of 1.5 MPa similar to that of a human tongue. However, as the palate is harder than the tongue, materials much harder than the rubber were used to represent the palate. Test conditions were designed to represent those encountered in the mouth when thin films of food residues coat the oral mucosa surfaces under dry and lubricated conditions. An aqueous solution and a medium chain triglycer-ides (MCT)-oil were used in this study for their dissimilar surface properties and similar bulk viscosity. To avoid any difference of viscosity, the viscosity of the aqueous solution was matched to that of the MCT-oil by dissolving the ap-propriate amount of dextran in water.
The results suggest that the frictional behavior of the investigated model tribosystem is strongly affected by the topographical structure of the contact-ing surfaces. Under dry conditions, the coefficient of friction decreases while lubricated surfaces yield higher friction coefficient. Further, it was observed that a minimal wetting of at least one contacting surface is essential for establishing effective lubrication, thereby contributing toward oral perception of the food.
The study suggests well-defined topographical, mechanical, and physico-chemical conditions corresponding as close as possible to the in-mouth situ-ation are absolutely critical for studies on oral food perception. The use of molded silicone surfaces appears to be interesting to mimic tongue properties.
4.2.4.8 Mini Traction MachineFrictional and lubricating properties of food can be measured using the mini-traction machine (MTM) that is based on a ball-on-disk principle, with sample conveniently placed on the disk surface (Malone et al., 2003), as shown in
FIGURE 4.12 A digital schematic image of the tribometer system used by Ranc et al. (2006). The configuration is as follows: 1—silicone sample (scanning electron microscopy [SEM] images of the silicone surface structures), 2—PCTFE or steel ball, 3—force strain gauge, 4— piezoelectric sensor of friction force, 5—2D PSD photodetector, 6—laser diode, 7—sensor for temperature, 8—heating resistance, 9—vessel.

78 PART | I Advances in Food Rheology
Fig. 4.13. The ball and disk are enclosed in an insulated chamber, where it is filled with samples to the level above the ball. The ball is lowered so that it almost comes in contact with disk. When the motor is switched on, the disk starts spinning, and the sample spins together on the disk. The frictional force generated from the contact between the spinning sample and ball causes the ball itself to spin. The spinning speed and force of the rotary movement are re-corded and friction coefficient is automatically tabulated (Meyer et al., 2011). The metallic ball and disk can be replaced with other surface materials desired, including PDMS.
The MTM is very sensitive and designed to give accurate frictional results over a wide range of sliding speeds from 1 to 2400 mm/s and different loads. The enclosure of the ball and disk allows complete isolation as compared to MTD with a Peltier hood attached onto the device. However, it is a very expen-sive equipment for food lubrication studies.
4.3 SENSORY PERCEPTION AND TRIBOLOGY
Food texture is the sensory and functional manifestation of the structural, me-chanical, and surface properties of foods detected through the senses of vision, hearing, touch, and kinaesthetics (Szczesniak, 2002). It is a very complex phe-nomenon, determined by the material behavior of the food responding to exter-nal deformation (Foster et al., 2011). Until very recently texture profile analysis and rheology measurements were the most widely used methods to assess tex-tural properties of solid and semisolid foods.
The rheometer has a well-defined geometry and deformation process that leads to fundamental physical parameters (such as stress, strain, strain rate, stor-age and loss moduli, etc.) for quantitative description of the mechanical nature of the food materials (Chen and Stokes, 2012) and so describes the manner in which food deforms and flows when squeezed. It has been proposed that dynamic small deformation measurements at an oscillatory frequency of 50/s had a good correlation with perceived thickness, stickiness, and sliminess for a wide range of food products including Newtonian fluids, true solutions, weak
FIGURE 4.13 Schematic diagram of mini traction machine. Both the disk and the ball rotate at a controlled speed and create a lubrication flow between the two surfaces. (Redrawn from Bongaerts et al., 2007.)

From Rheology to Tribology Chapter | 4 79
gels, and flocculated emulsions (Shama and Sherman, 1973). However, it has been observed that some aspects of the sensory mouthfeel, for example, creami-ness, smoothness, do not correlate with viscosity behavior of the food (Baier et al., 2009; Kokini, 1987). Neuronally, it has been found that the way the brain responds to fat texture is independent of viscosity (Verhagen et al., 2003).
A texture analyzer could provide more imitative measurements of textural features and results from a texture analyzer could be linked directly to the sensa-tion of a particular texture feature. However, one should be aware that the rhe-ometer and texture analyzer measurements only constitute a part of the textural perception of food during the early stage of oral processing when it deforms un-der the forces applied by the teeth or the tongue. As food continues to be chewed and masticated, it keeps changing with reduced particle size, increased moisture absorption, and softness. The perception of food texture at a late stage of oral processing is probably dominated by a combination of fluid flow and surface properties; hence rheology properties become less relevant but surface friction and lubrication turn to be dominating for texture sensation and perception. For this reason, food oral tribology is now emerging as a new experimental tech-nique alongside the food rheology in understanding the relationship between food structure, texture, and mouthfeel. Thus texture or our perception of food structure can now be described as being dependent on: (1) the composition and bulk rheological properties of the food, (2) the properties of the oral surfaces that take part in the processing of the food, and (3) the interactions between oral surface and food as cited in Chojnicka et al. (2008).
Since the advent of tribology, there has not been much progress from food perspective, due to the complicated tribological scenario inside human mouth, the typical oral physiological factors, as well as the food factors (Prakash et al., 2013). This is illustrated in Fig. 4.14, where the factors influencing food oral lubricity are broadly classified into food system and oral system.
FIGURE 4.14 Parameters influencing food oral lubrication: the physico-chemical proper-ties of the food and the oral physiological properties of human mouth. (Adapted from Prakash et al., 2013.)

80 PART | I Advances in Food Rheology
The food system comprises the physical (viscosity, temperature) and chemi-cal properties (pH) of the food. During consumption food acts as a lubricant, hence the frictional forces during the oral processing will depend on the proper-ties of the food substance. The oral system comprises the two interacting sur-faces—mainly the tongue and the palate. The roughness of the two surfaces, the speed and direction of sliding and rolling motions, and the force pressing the two surfaces all influence the food oral lubricity. Apart from the aforementioned factors, the saliva type and flow rate, oral temperature, residence time of the food in the mouth will also influence the frictional behavior of food. Saliva is an enzymatic fluid that aids in softening and providing lubrication to aid bolus formation, movement of the bolus within the oral cavity, and swallowing (Foster et al., 2011; Joyner et al., 2014). Saliva also helps in texture perception of food products, primarily thickness (van Vliet et al., 2009).
The two most critical factors taken into account in the design of a tribometer to mimic oral processing involves (1) the control of the sliding and or rotating between the two surfaces and (2) the surface properties of the substrate materi-als. Research has shown that the characteristics of surface influence the percep-tion of food (de Hoog et al., 2006). Dresselhuis et al. (2008a) investigated three surfaces: smooth glass, PDMS, a material often used as a mouth-mimicking sur-face, and pig’s tongue. The different surface characteristics appeared to lead to completely different lubrication behavior of the food emulsions between these surfaces. An ideal surface material for food oral lubrication studies would be the one that would perfectly imitate the skin and tongue within the human mouth. However, it might be practically impossible to achieve a standard for surface interaction of skin in mouth with natural variation in individuals. Therefore, a reasonable requirement for the surface material should be that it has equivalent surface roughness and chemistry of the tongue–palate system. PDMS is found to have a close resemblance to the elasticity of human tongue and is currently used as a model surface material for food tribological studies (Johnson et al., 1993).
Frictional and sensory property comparisons show that thin-film tribology may play an important role in contributing to sensory attributes, such as smooth-ness, fattiness, slipperiness, creaminess, and astringency (Chojnicka-Paszun et al., 2012; Dresselhuis et al., 2008b; Goh et al., 2010; Joyner et al., 2014; Kokini et al., 1977; Ranc et al., 2006). In 1977, Kokini et al. evaluated 16 liq-uids with different rheological properties by untrained panellists. The panel differentiated the liquids based on the three attributes—smoothness, thickness, and slipperiness that were compared with instrumental measurements (such as viscometer, friction apparatus). The results showed smoothness was inversely proportional to the frictional force caused by the contact between the tongue and the mouth whereas slipperiness was shown to be inversely proportional to the summation of viscous and frictional forces which is also reported by Chen and Engelen (2012).
Creaminess is a complex sensation related to the amount of fat present in a product and is associated with one or a combination of attributes like viscos-ity, taste, aroma, smoothness, and thickness by researchers (Akhtar et al., 2005;

From Rheology to Tribology Chapter | 4 81
Chen and Eaton, 2012; Cutler et al., 1983; Kokini, 1987; Kokini and Cussler, 1983; Richardson et al., 1993). Kokini and Cussler (1983) compared sensory percep-tion with physical measurements (coefficients of friction and viscosity) of liquid and semisolid foods The viscosity was measured using a cone and plate viscom-eter (shear rate 0.1–100 1/s) and coefficients of friction was measured with an Instron equipped with the standard friction measuring attachment which consists of a pulley allowing horizontal measurements of shearing forces on a flat plane. They suggest creaminess to be related to both smoothness and thickness (vis-cosity). Recently Chojnicka-Paszun et al. (2012) related sensory perception of homogenized milk (fat content between 0.06% and 8%) with friction coefficient and viscosity. At fat content above 1% they observed a linear correlation between perceived creaminess and friction coefficient. The increased creaminess and thus decreased friction was attributed to the coalescence of fat globules on the surface of the tongue and rubber disk. This agrees with the hypothesis proposed by Dres-selhuis et al. (2008b) that emulsions with higher efficiency toward coalescence showed lower friction and were perceived as more creamy/fatty.
In their study Malone et al. (2003) assessed the slipperiness attribute in guar gum solutions, fattiness perception (oil-in-water emulsions with 0, 1, 14, 20, 30, 55% oil), and astringency (pasteurized skim milk and UHT skim milk). The slipperiness scores obtained from guar gum solution (0.05, 0.2, 0.4, and 0.6%) were compared with the friction measurements from MTM. A signifi-cant level of correlation between fluid lubricant properties and oral slipperiness perception was observed in the mixed lubrication regime at entrainment speeds between 10 and 100 mm/s, suggesting the mixed regime is relevant to describe slippery mouthfeel. Fattiness perception was related to the lubrication of the contact zone formed between the tongue and the hard palate for entrainment speeds, 1–30 mm/s and speed >100 mm/s. The results reported are interesting but need to be treated carefully as rubber surface was used for the study and also the experimental set-up for sensory study was not very clearly stated. In their work on protein stabilized emulsions, Dresselhuis et al. (2007) highlighted the importance of protein and saliva on measured coefficient of friction fatti-ness. Interaction of saliva with an emulsion slightly lowers the friction, but still, the friction is higher than with emulsion alone. Emulsions, which are sensitive toward surface-induced coalescence, containing a minimum amount of free pro-tein, are most efficient in reducing in-mouth friction (boundary/mixed) and thus enhancing fat perception.
Malone et al. (2003) postulated that food products that adsorb to the mu-cosal mucin film are likely to lead to an astringent mouthfeel. In their study astringency was investigated by an untrained panel who detected pasteurized milk to be more astringent than UHT milk. They related this to the binding of the k-casein to the mucin glycoprotein in pasteurized milk which was not pos-sible in UHT milk, observed using evanescent wave spectroscopy. Astringency has been closely linked to the protein depletion from the mucous layer and an increased surface friction at the tongue surface (Gibbins and Carpenter, 2013). Rossetti et al. (2009) on the other hand worked on the relation of astringency

82 PART | I Advances in Food Rheology
and lubrication using a tribometer. Tribological properties of collected fresh saliva and saliva after drinking tea were compared and it was observed that fric-tion coefficient increased rapidly with increasing astringent perception. How-ever, the author also indicated that astringency is likely to be a very complex sensation recognized by the neurological system as the combination of different physical changes and perception signals occurring in the mouth, as a result, it is not enough to apply tribology only to evaluate astringency perception.
The effect of surface texture and wetting ability on frictional behavior of two Newtonian fluids was studied by Ranc et al. (2006) using the tongue and palate tribological system (Fig. 4.12) as described previously. Conditions commonly occurring in the mouth were represented in the test conditions, such as the coat-ing of the oral mucosa surface by thin films of food residues, low velocity with contact pressure, and temperature similar to in-mouth conditions. Investigation occurred under dry, wet, and lubricated (oil) conditions, with the same viscos-ity and temperature typical of the mouth. The results showed that the frictional behavior of the investigated model tribosystem was strongly affected by the topographical structure of the contacting surfaces and wettability of at least one surface. Next, Chojnicka et al. (2008) studied the lubricated surface focusing on lubrication properties of protein aggregate dispersions in a soft contact. Two different protein aggregate dispersions were compared: globular aggregates of whey protein isolate (WPI) and fibrillar aggregates of ovalbumin from egg white. Soft rubber surfaces were used, which allowed to measure friction at low contact pressures similar to those present between the tongue and palate. Clear correlations were observed between the measured friction coefficients and spe-cific properties of the lubricating fluid such as protein concentration and aggre-gate size and shape. Furthermore, surface properties like elasticity, surface–sur-face interactions, and surface roughness had a significant effect on the friction under conditions that are relevant for texture perception. They concluded that in vitro measurements at low contact pressure provide valuable information for understanding and controlling food properties that modulate oral friction.
The effect of saliva on the lubrication properties of two types of neutral polysaccharides, cross-linked starch and locust bean gum, both of which are commonly used as food thickeners was studied by Zinoviadou et al. (2008) with an MTM (Fig. 4.13). The aim was to determine the effect of mixing saliva with the polysaccharide solutions (in vitro) before the assessment of tribologi-cal properties and also to understand the role of the interaction of the starch with the rubbing surface. The study found, despite the similar bulk rheological behavior of the two polysaccharides, the starch solution exhibited a significantly lower friction coefficient. Although starch viscosity greatly decreased upon 10 s incubation with human saliva, a low friction coefficient was retained which was associated with the presence of remaining granules. Addition of starch granules to locust bean gum also resulted in a decrease in the friction coefficient, but the effect was smaller compared to starch solutions digested by saliva. Smaller contact angles were measured for (digested) starch compared to locust bean

From Rheology to Tribology Chapter | 4 83
gum solutions. This suggests the role of interaction of starch solution constitu-ents with the rubbing surfaces that assist in lubrication.
4.4 CONCLUSIONS
Oral processing is a complex dynamic processing. Rheology alone has limited extent of understanding the food texture. Particularly, in the study of texture of fluid and semifluid food, where the thin fluid rheology is dominated rather than bulk rheology, rheological measurement cannot provide the better un-derstanding of the perception of the products. Lubrication/tribological studies on food systems in the past were scarce due to the limitation of technology. However, with the recent emergence of new experimental devices there has been a surge in research and development in food tribology area. Few most representative tribology apparatuses have been discussed—from the former technology such as friction tester, to the latest technology, tribo-rheometer. Tribology systems and the relation to mastication for perceived texture and lu-brication have been discussed and portrayed in food sensory application. Data obtained from various tribology devices show that friction and lubrication properties of food samples can be measured and related to attributes like fatty feel, astringency, smoothness, roughness, and slipperiness. Besides applying an appropriate sliding speed and load for accurate tribological measurements, one another important factor that should be considered is the representative surfaces on which the measurements are conducted. It has been demonstrated that different surface characteristics lead to completely different lubricating behavior of the same food. PDMS is currently a feasible choice for food tri-bology studies due to its elastic characteristics close to that of tongue tissue. The other surface materials—3M transpore surgical tape that is capable of discriminating both dairy fluids and semisolid (Fig. 4.7) and the hydrophilic whey protein isolate gel having modulus similar to oral tissues should be fur-ther explored. Although very limited studies are available on application of tribometer in food systems, nevertheless the outcomes so far show great po-tential of the approach in establishing relationship between tribology param-eters and the perceived texture and mouthfeel attributes. A potential exists for a range of tribological systems to be produced and utilized for various food systems and further research in the area will ensure that in-mouth conditions, as well as real food systems are closely related and the resultant tribological measurements are more accurate.
REFERENCES
Akhtar, M., Stenzel, J., Murray, B.S., Dickinson, E., 2005. Factors affecting the perception of creaminess of oil-in-water emulsions. Food Hydrocoll. 19 (3), 521–526.
Baier, S., Elmore, D., Guthrie, B., Lindgren, T., Smith, S., Steinbach, A., 2009. A new tribology device for assessing mouthfeel attributes of foods. 5th International Symposium on Food Structure and Rheology, ETH Zurich, Switzerland.

84 PART | I Advances in Food Rheology
Bongaerts, J.H.H., Fourtouni, K., Stokes, J.R., 2007. Soft-tribology: lubrication in a compliant PDMS-PDMS contact. Tribol. Int. 40 (10–12), 1531–1542.
Bourne, M.C., 2002. Food Texture and Viscosity: Concept and Measurement. Academic Press, San Diego.
Butt, H.-J., Graf, K., Kappl, M., 2004. Surface forces. Physics and Chemistry of Interfaces. Wiley-VCH Verlag GmbH & Co. KGaA, Weinheim, Germany, pp.80-117.
Cassin, G., Heinrich, E., Spikes, H.A., 2001. The influence of surface roughness on the lubrication properties of adsorbing and non-adsorbing biopolymers. Tribol. Lett. 11 (2), 95–102.
Chen, J., 2007. Surface texture of foods: perception and characterization. Crit. Rev. Food Sci. Nutr. 47 (6), 583–598.
Chen, J.S., 2009. Food oral processing—a review. Food Hydrocoll. 23 (1), 1–25. Chen, J., Eaton, L., 2012. Multimodal mechanisms of food creaminess sensation. Food Funct.
3 (12), 1265–1270. Chen, J., Engelen, L., 2012. Food Oral Processing: Fundamentals of Eating and Sensory Perception.
Wiley Blackwell, Chichester. Chen, J., Liu, Z., Prakash, S., 2014. Lubrication studies of fluid food using a simple experimental
set up. Food Hydrocoll. 42 (1), 100–105. Chen, L., Opara, U.L., 2013. Texture measurement approaches in fresh and processed foods—a
review. Food Res. Int. 51 (2), 823–835. Chen, J., Stokes, J.R., 2012. Rheology and tribology: two distinctive regimes of food texture sensa-
tion. Trends Food Sci. Technol. 25 (1), 4–12. Chojnicka, A., de Jong, S., de Kruif, C.G., Visschers, R.W., 2008. Lubrication properties of protein
aggregate dispersions in a soft contact. J. Agric. Food Chem. 56 (4), 1274–1282. Chojnicka-Paszun, A., de Jongh, H.H.J., de Kruif, C.G., 2012. Sensory perception and lubrication
properties of milk: influence of fat content. Int. Dairy J. 26 (1), 15–22. Christensen, C.M., 1979. Oral perception of solution viscosity. J. Texture Stud. 10 (2), 153–164. Cutler, A.N., Morris, E.R., Taylor, L.J., 1983. Oral perception of viscosity in fluid foods and model
systems. J. Texture Stud. 14 (4), 377–395. de Hoog, E.H.A., Prinz, J.F., Huntjens, L., Dresselhuis, D.M., van Aken, G.A., 2006. Lubrication of oral
surfaces by food emulsions: the importance of surface characteristics. J. Food Sci. 71 (7), E337–E341. de Wijk, R.A., Prinz, J.F., 2005. The role of friction in perceived oral texture. Food Qual. Prefer.
16 (2), 121–129. de Wijk, R.A., Prinz, J.F., 2006. Mechanisms underlying the role of friction in oral texture. J. Tex-
ture Stud. 37 (4), 413–427. de Wijk, R.A., Prinz, J.F., 2007. Fatty versus creamy sensations for custard desserts, white sauces,
and mayonnaises. Food Qual. Prefer. 18 (4), 641–650. de Wijk, R.A., Prinz, J., Janssen, A.M., 2006. Explaining perceived oral texture of starch-based
custard desserts from standard and novel instrumental tests. Food Hydrocoll. 20 (1), 24–34. de Wijk, R.A., van Gemert, L.J., Terpstra, M.E.J., Wilkinson, C.L., 2003. Texture of semi-solids; sensory
and instrumental measurements on vanilla custard desserts. Food Qual. Prefer. 14 (4), 305–317. Dresselhuis, D.M., 2008. The Fate of Fat: Tribology, Adhesion and Fat Perception of Food Emul-
sions. Wageningen University, Wageningen, p. 152. Dresselhuis, D.M., de Hoog, E.H.A., Cohen Stuart, M.A., van Aken, G.A., 2008a. Application of
oral tissue in tribological measurements in an emulsion perception context. Food Hydrocoll. 22 (2), 323–335.
Dresselhuis, D.M., de Hoog, E.H.A., Cohen Stuart, M.A., Vingerhoeds, M.H., van Aken, G.A., 2008b. The occurrence of in-mouth coalescence of emulsion droplets in relation to perception of fat. Food Hydrocoll. 22 (6), 1170–1183.

From Rheology to Tribology Chapter | 4 85
Dresselhuis, D.M., Klok, H.J., Stuart, M.A.C., de Vries, R.J., van Aken, G.A., de Hoog, E.H.A., 2007. Tribology of o/w emulsions under mouth-like conditions: determinants of friction. Food Biophys. 2 (4), 158–171.
Foster, K.D., Grigor, J.M.V., Cheong, J.N., Yoo, M.J.Y., Bronlund, J.E., Morgenstern, M.P., 2011. The role of oral processing in dynamic sensory perception. J. Food Sci. 76 (2), R49–R61.
Gabriele, A., Spyropoulos, F., Norton, I.T., 2010. A conceptual model for fluid gel lubrication. Soft Matter 6 (17), 4205–4213.
Gibbins, H.L., Carpenter, G.H., 2013. Alternative mechanisms of astringency: what is the role of saliva? J. Texture Stud. 44 (5), 364–375.
Goh, S.M., Versluis, P., Appelqvist, I.A.M., Bialek, L., 2010. Tribological measurements of foods using a rheometer. Food Res. Int. 43 (1), 183–186.
Halling, J., 1976. Introduction to Tribology. Wykeham, London. Heyer, P., Lauger, J., 2009. Correlation between friction and flow of lubricating greases in a new
tribometer device. Lubr. Sci. 21 (7), 253–268. Janssen, A.M., Terpstra, M.E.J., De Wijk, R.A., Prinz, J.F., 2007. Relations between rheologi-
cal properties, saliva-induced structure breakdown and sensory texture attributes of custards. J. Texture Stud. 38 (1), 42–69.
Johnson, S.A., Gorman, D.M., Adams, M.J., Briscoe, B.J., 1993. The friction and lubrication of human stratum-corneum. 19th Leeds-Lyon Symposium on Tribology: Thin Films in Tribology Sep 08–11, 1992, Leeds, England.
Joyner, H.S., Pernell, C.W., Daubert, C.R., 2014. Impact of formulation and saliva on acid milk gel friction behavior. J. Food Sci. 79 (5), E867–E880.
Koc, H., Vinyard, C.J., Essick, G.K., Foegeding, E.A., 2013. Food oral processing: conversion of food structure to textural perception. Annu. Rev. Food Sci. Technol. 4, 237–266.
Kokini, J.L., 1987. The physical basis of liquid food texture and texture-taste interactions. J. Food Eng. 6 (1), 51–81.
Kokini, J.L., Cussler, E.L., 1983. Predicting the texture of liquid and melting semi-solid foods. J. Food Sci. 48 (4), 1221–1225.
Kokini, J.L., Kadane, J.B., Cussler, E.L., 1977. Liquid texture perceived in mouth. J. Texture Stud. 8 (2), 195–218.
Kutter, A., Singh, J.P., Rauh, C., Delgado, A., 2011. Improvement of the prediction of mouthfeel attributes of liquid foods by a posthumus funnel. J. Texture Stud. 42 (3), 217–227.
Lawless, H.T., Heymann, H., 2010. Sensory Evaluation of Food: Principles and Practices. Springer, New York.
Malone, M.E., Appelqvist, I.A.M., Norton, I.T., 2003. Oral behaviour of food hydrocolloids and emulsions. Part 1. Lubrication and deposition considerations. Food Hydrocoll. 17 (6), 763–773.
Meyer, D., Vermulst, J., Tromp, R.H., De Hoog, E.H.A., 2011. The effect of inulin on tribology and sensory profiles of skimmed milk. J. Texture Stud. 42 (5), 387–393.
Mojet, J., Köster, E.P., 2005. Sensory memory and food texture. Food Qual. Prefer. 16 (3), 251–266. Nguyen, P.T.M., Bhandari, B., Prakash, S., 2016. Tribological method to measure lubricating prop-
erties of dairy products. J. Food Eng. 168, 27–34. Prakash, S., Tan, D.D.Y., Chen, J.S., 2013. Applications of tribology in studying food oral process-
ing and texture perception. Food Res. Int. 54 (2), 1627–1635. Prinz, J.F., de Wijk, R.A., Huntjens, L., 2007. Load dependency of the coefficient of friction of oral
mucosa. Food Hydrocoll. 21 (3), 402–408. Ranc, H., Servais, C., Chauvy, P.F., Debaud, S., Mischler, S., 2006. Effect of surface structure on
frictional behaviour of a tongue/palate tribological system. Tribol. Int. 39 (12), 1518–1526.

86 PART | I Advances in Food Rheology
Richardson, N.J., Booth, D.A., Stanley, N.L., 1993. Effect of homogenisation and fat content on oral perception of low and high viscosity model creams. J. Sens. Stud. 8 (2), 133–143.
Rosenthal, A.J., 1999. Food Texture: Measurement and Perception. Aspen Publishers, Gaithersburg, MD.
Rossetti, D., Bongaerts, J.H.H., Wantling, E., Stokes, J.R., Williamson, A.M., 2009. Astringency of tea catechins: more than an oral lubrication tactile percept. Food Hydrocoll. 23 (7), 1984–1992.
Shama, F., Sherman, P., 1973. Identification of stimuli controlling the sensory evaluation of viscos-ity II. Oral methods. J. Texture Stud. 4 (1), 111–118.
Stanley, N.L., Taylor, L.J., 1993. Rheological basis of oral characteristics of fluid and semisolid foods—a review. Acta Psychol. 84 (1), 79–92.
Stieger, M., van de Velde, F., 2013. Microstructure, texture and oral processing: new ways to reduce sugar and salt in foods. Curr. Opin. Colloid Interface Sci. 18 (4), 334–348.
Szczesniak, A.S., 2002. Texture is a sensory property. Food Qual. Prefer. 13 (4), 215–225. van Vliet, T., van Aken, G.A., de Jongh, H.H.J., Hamer, R.J., 2009. Colloidal aspects of texture
perception. Adv. Colloid Interface Sci. 150 (1), 27–40. Verhagen, J.V., Rolls, E.T., Kadohisa, M., 2003. Neurons in the primate orbitofrontal cortex respond
to fat texture independently of viscosity. J. Neurophysiol. 90 (3), 1514–1525. Zinoviadou, K.G., Janssen, A.M., de Jongh, H.H.J., 2008. Tribological properties of neutral poly-
saccharide solutions under simulated oral conditions. J. Food Sci. 73 (2), E88–E94.

87Advances in Food Rheology and Its Applications. http://dx.doi.org/10.1016/B978-0-08-100431-9.00005-XCopyright © 2017 Elsevier Ltd. All rights reserved.
Chapter 5
Large Amplitude Oscillatory Shear (LAOS) Measurement and Fourier-Transform Rheology: Application to Food
P. PtaszekDepartment of Engineering and Machinery for Food Industry, Faculty of Food Technology, Agricultural University in Cracow, Krakow, Poland
5.1 INTRODUCTION
Large amplitude oscillatory shear (LAOS) and Fourier transform rheology (FTR) are measurement techniques that are currently often used to obtain information on nonlinear rheological properties of polymer melts, their so-lutions, and polymer blends (Hyun et al., 2006; Hyun and Wilhelm, 2009). The LAOS and FTR techniques are also used in the analysis of metastable systems—dispersed gas–liquid (foam) type, or liquid–liquid (emulsions W/O and O/W) (Reinheimer et al., 2011, 2012). Additionally, studies on utilizing the LAOS technique to assess the size of a drop or the sizes of solid particles in polymer solutions or blends are also being carried out. The LAOS and FTR techniques are particularly useful in the analysis of rheological behaviors of elastoviscoplastic systems (Fuongfuchat et al., 2012), which include soft colloidal glasses (Sollich et al., 1997).
The studies using the aforementioned methods have been made possible thanks to the development of new highly sensitive rotary rheometers.
These methods allow for a seamless transition from the linear properties (using small values of deformation amplitudes) to the nonlinear range. The understanding of rheological behaviors occurring in both linear and nonlin-ear ranges gives a full notion of the rheological properties of the studied material.

88 PART | I Advances in Food Rheology
5.2 LAOS METHODS AND DATA ANALYSIS
5.2.1 G, G0 Curves
Oscillatory techniques are quite often used in the rheological studies. They can be divided into two types: small amplitudes oscillatory shear (SAOS) and LAOS.
Oscillatory techniques involve subjecting the test material to strain, that is variable in time. As easiest to analyze, the signal used is usually sinusoidal in nature, and can be expressed as (Wilhelm et al., 1999, 2012; Hyun et al., 2011)
γ ω γ ω=t t( ) sin( )0 (5.1)
For the shear stress the response can be expressed using the following har-monic function:
∑τ ω γ γ ω γ ω ω γ ω= ⋅ ′ ⋅ + ′′ ⋅t G n t G n t( ; , ) [ ( , ) sin( ) ( , ) cos( )]n
0 0odd
n 0 n 0 (5.2)
There is only one harmonic present (Fig. 5.1) for small strains (SAOS) and, therefore, ′G1 and ′′G1 become real (G) and imaginary (G0) parts of the com-plex spring modulus (G* = G + jG0), well described in the literature on linear viscoelasticity.
The higher the values of deformation amplitudes applied, the larger the number of harmonics observed (Fig. 5.2) which is typical behavior of the non-linear response of a material.
The studies using the SAOS methods are well established in the rheology of synthetic polymers, as well as soft matter and food. These tests are used to analyze the properties of the material in the range of linear viscoelasticity. This means that the tested material is not damaged during the measurements. Based on the data obtained from these tests, it is possible to describe the basic me-chanical properties of the material.
An increase in the value of the deformation amplitude results in a transition from the range of linear behaviors into a nonlinear area. This means irreversible
γ(wt)=γ0sin (wt)
τ(t;w,γ0)=γ0⋅∑nodd[Gn'(w,γ0)⋅sin(nwt)+Gn''(w,γ0)⋅cos(nwt)]
G1'G1''
FIGURE 5.1 Linear range response.

LAOS Measurement and Fourier-Transform Rheology Chapter | 5 89
changes to the structure of the material. The analysis of test results obtained using this method is more complex, than in the case of SAOS methods, and can be performed using various calculation techniques. Currently, three main direc-tions in the LAOS-type data analysis can be observed:
1. The analysis of G and G0 in the function of deformation amplitude at a constant value of frequency.
2. The analysis of time series using the Fourier transform–FTR.3. The analysis of the Lissajous figures on the phase plane, using geometrical
decomposition and the Chebyshev transform.
5.2.2 Analysis of G and G0
The analysis of the G and G0 curves in the function of deformation amplitude, at a constant frequency level, is the primary method of determining the range of linear viscoelasticity and, until recently, has been used solely for that purpose. However, it is also possible to carry out an analysis of the nonlinear behaviors using these curves. The courses of G and G0 in the function of the deformation amplitude can be divided into several specific cases, which represent typical rheological behaviors in the nonlinear range. Typical examples of such behav-iors are shown in Fig. 5.3.
Four typical groups of G and G0 behaviors:
1. Strain thinning (Fig. 5.3a)—this behavior is typical for suspensions and bio-polymer solutions. It is a result of weak molecular interactions and is usually observed for weakly associated systems, where entanglements would occur, for example. The presence of large amplitudes causes deformations and the destruction of the created structure, and a reorientation of the aggregate par-ticles, in line with the direction of flow.
2. Strain hardening (Fig. 5.3b)—this image is obtained for complex liquids with a complex and strong microstructure. Then the presence of shear forc-es facilitates the creation of new, even more elaborate structures, such as
FIGURE 5.2 Nonlinear range response.

90 PART | I Advances in Food Rheology
shear-induced network or gel. These structures are usually oriented perpen-dicularly to the direction of flow, which causes an increase of the G and G0 values with an increase of deformation amplitude. This behavior is very rarely observed in food systems.
3. Weak strain overshoot (Fig. 5.3c)—a behavior that combines the two previ-ous cases. The system has a stable molecular structure at rest, as well as in the presence of moderate shear forces. This is manifested by the occurrence of a visible maximum on the G0 curve. The presence of the maximum indi-cates that the studied material is capable of creating a shear-induced struc-ture. However, after reaching a specific value of the amplitude, the amount of mechanical force supplied is so high that this structure dissolves and is reoriented in a direction parallel to the flow. Such behaviors are exhibited by solutions of xanthan gum, and are result of the presence of long polymer chains, which are very strongly electrically charged. This causes a creation of weak-dimensional structure, which is capable of accumulating significant amounts of energy, up to the point when the amount of supplied energy exceeds the forces of interactions and then the polymer chains undergo com-plete stretching in a direction parallel to the flow.
4. Strong strain overshoot (Fig. 5.3d)—this case is similar to that mentioned pre-viously, but the force of interactions that cause the creation of shear-induced structures is much higher. Such behaviors can occur in micellar systems.
FIGURE 5.3 Types of LAOS behavior.

LAOS Measurement and Fourier-Transform Rheology Chapter | 5 91
A further analysis of the course of G and G0 curves can be of quantitative character and lead to the determination of the value of yield stress (τ0). Fig. 5.4 presents the method of estimation of the yield stress value (τ0).
Knowing the values of G and G0 as the function of amplitude, the shear modulus (G0) can be determined according to the following dependence:
γ= ′γ →
G Glim ( )00
00
(5.3)
The yield stress (τ0) was determined as an intersection point of γ′ β−G ~ 0 with the value of G0 in the log–log coordinate system. The value τ0 was counted on the basis of the dependence (Rouyer et al., 2005; Marze et al., 2009):
τ γ= ⋅ G| |0 0* (5.4)
Another use of the G and G0 curves is the analysis of the slow dynamics type systems. This group includes metastable systems, such as foams or con-centrated emulsions. All these systems aim to achieve a thermodynamic equilib-rium, by separating into specific phases. Such systems are quite common in the food products; therefore an insight into their nonlinear rheological properties is highly important, from a practical point of view.
In the nonlinear area, the analysis of the shear exponents was carried out (Miyazaki et al., 2006), hence
γ γ′ ′′β δ− −G G~ and ~0 0 (5.5)
The analysis of the relation of the shear exponents β and δ plays an essential role in the investigation of the properties of the metastable systems. The values of β and δ are one of the criteria of the phenomenological estimation of the in-vestigated system’s metastability. The criteria were proposed by Miyazaki et al. (2006) and are as follows (Fig. 5.5):
1. The peak present on the G0 curve is located in the range of amplitudes vary-ing from 10−2 to 100.
G0=limγ0→0G'(γ0)
G∼γ0−β
τ0=γ0⋅|G*|
G∼γ0−β and G0∼γ0−δ
FIGURE 5.4 Method of yield stress estimation.

92 PART | I Advances in Food Rheology
2. The peak is visible for that frequency for which the response of the material is elastic G > G0.
3. The relation of the exponents β/δ ( γ′ β−G ~ 0 and γ′′ δ−G ~ 0 ) should equal 2 for the highest values of the deformation amplitudes.
5.2.3 Time Series Analysis and Fourier Transform Rheology (FTR)
The analysis of G and G0 in the function of deformation amplitude is the most basic approach to the data obtained from studies using LAOS methods. It doesn’t require the application of complex analysis of higher harmonics or the construction of adequate phase planes.
Another method of LAOS data analysis is FTR. The application of high values of deformation amplitudes results in a nonlinear response from the stud-ied material. It is manifested by the material contributing additional harmonic components to the obtained signal (Fig. 5.2). Direct analysis of the time series is time consuming, and doesn’t allow for a definite determination of the presence of higher harmonic components in the material’s response. This issue is par-ticularly important in the studies where the values of the deformation amplitude are in a transition range, between linear viscoelasticity range and the beginning of the nonlinear viscoelasticity. The most popular method for the analysis of higher harmonic components is the application of the integral Fourier trans-form, according to its definition (Boyd, 2001):
∫ω = ω
−∞
+∞−F f t e dt( ) ( ) j t* (5.6)
where, in the case of analysis of the material’s response, the function f(t) repre-sents the material’s response, expressed mainly in the form of time series repre-senting the stress τ(t). As a result of the transform calculation, the real F(w) and imaginary F0(w) parts are obtained. Based on that, it is possible to determine two basic values: the amplitude I(w) and phase angle φ(w) for a given frequency.
ω ω ω= ′ + ′′I F F( ) ( ( )) ( ( ))2 2 (5.7)
G∼γ0−βG0∼γ0−δ
F*(w)=∫−∞+∞f(t)e−jwtdt
I(w)=(F(w))2+(F0(w))2
FIGURE 5.5 A graphical interpretation of the Miyazaki criterion.

LAOS Measurement and Fourier-Transform Rheology Chapter | 5 93
φ ω ωω
= ′′′
F
F( ) arctan
( )
( ) (5.8)
Both, the amplitude and the phase are essential to the analysis of the LAOS-type data.
Moreover, the Fourier transform is reversible:
∫πω ω= ω
−∞
+∞
f t F e d( )1
2( ) j t* (5.9)
This means that the f(t) signal can be completely reconstructed from its F*(w) transform.
In practice, however, the signal obtained as a result of a test study is a dis-crete or sampled signal. Therefore, in the analysis, a discrete version of the Fourier transform is usually applied, which is based on the fast Fourier trans-form (FFT) algorithm (Cooley and Tukey, 1965). As a result of using FFT, an amplitude spectrum of the analyzed signal is obtained, shown schematically in Fig. 5.6. The analysis of a spectrum obtained in this manner provides informa-tion on the nature of the material’s response to the applied stress.
In order to confirm the presence of the higher harmonics, the signal acquired in the experiment is subjected to a discrete Fourier transformation and, conse-quently, the signal’s spectrum is obtained. The spectrum provides information on the presence and participation of individual harmonics in the analyzed phe-nomenon. However, the intensity of the discrete Fourier spectrum is dependent on the number of the periods of the analyzed signal. Therefore, the postulate of the signal intensity normalization against the signal intensity of the first
φ(w)=arctanF0(w)F(w)
f(t)=12π∫−∞+∞F*(w)ejwtdw
FIGURE 5.6 Idea of Fourier transform (time series—left, Fourier spectrum—right).

94 PART | I Advances in Food Rheology
harmonic (fundamental frequency) was introduced to the analysis of the har-monic components (Hyun et al., 2011):
≡II
In
n/1
1 (5.10)
The normalization condition (Eq. 5.10) enables a convenient, relative com-parison of the intensities of individual harmonics. The most frequently ap-plied method of estimation of the rheological nonlinear properties based on In/1 (n = 3) can be expressed by the following quotation:
γ≡Q
I3/1
02
(5.11)
The appearance of higher harmonics in the Fourier spectrum indicates the system’s transition from the range of linear viscoelasticity into the range of non-linear viscoelasticity. This is a result of the tested material, subjected to time-varying deformations, undergoing strong deformation and the changes taking place in its structure are manifested as additional harmonic components. In the case of the shear flow analysis and the analysis of material’s response in terms of shear stress, only the odd harmonic components are present in the Fourier spectrum. The presence of higher harmonics is a definite criterion of the occur-rence of nonlinear rheological behaviors in the studied material.
A series of Fourier spectra in the function of deformation amplitude are presented in Fig. 5.7. Initially only the first harmonic is present, which cor-responds to linear viscoelastic characteristics. Next, the third harmonic appears and this indicates a change of characteristics from linear to nonlinear. Further
In/1≡InI1
Q≡I3/1γ02
FIGURE 5.7 Fourier spectra in function of strain amplitude.

LAOS Measurement and Fourier-Transform Rheology Chapter | 5 95
occurrences of higher harmonics (fifth, seventh, etc.) show the complexity of the obtained response, which in turn indicates complex rheological properties.
With regard to the analysis of the nonlinear rheological properties, a further discussion is required on the course of the I3/1 parameter in the function of de-formation amplitude. Fig. 5.8 demonstrates a typical relation I3/1(γ0); this curve is of sigmoidal nature:
γγ
= −+
I AB
( ) 11
1 C3/1 00
(5.12)
The expression describing I3/1 dependence on strain amplitude resembles classical viscosity equations: Carreu–Yasuda or Cross types (Hyun et al., 2011). Deviations from sigmoidal behaviors are also observed, most commonly in the form of maxima in the nonlinear range. Such behaviors have been observed for dispersions, where the dispersing phase exhibits viscoelastic properties and strong interactions with the dispersed phase.
5.2.4 Simple Lissajous Figures
Another alternative for the analysis of the LAOS data is the use of the phase plane. Such plane is obtained as a result of the projection of two time series x(t) and y(t) onto the x–y plane. Where rheological studies are concerned, such plane is most commonly constructed based on a forcing function, which is the deformation sinusoidally variable in time and the material’s response, which is also a harmonic function. The concept for the development of such a plane is presented in Fig. 5.9.
As a result of such a transformation, a new geometric figure is obtained, called the Lissajous figure. In the analysis of LAOS data using the Lissajous figures, they must be closed and symmetrical. The analysis of the appropri-ate Lissajous curves allows for an easy classification of the basic rheological behaviors.
Particular shapes corresponding to borderline (ideal) rheological events are presented in Fig. 5.10. A straight line is typical for elastic behaviors and is a
I3/1(γ0)=A1−11+Bγ0C
FIGURE 5.8 Behavior of normalized third harmonic in function of strain amplitude.

96 PART | I Advances in Food Rheology
result of the material’s immediate response. It means that the phase angle is equal to zero. The second borderline event is an ellipse with the focal point in the point of origin of the coordinate system, where the coordinate axes corre-spond to the major and minor axes of the ellipse. This means that between the forcing and the response there is a delay equal to π/2 rad. Another typical figure is a rectangle, which represents purely plastic behaviors. The viscoelastic prop-erties (in the linear range) are represented by an ellipse, of which the major axis
FIGURE 5.9 Phase plane and Lissajous figure construction.
FIGURE 5.10 Ideal rheological behavior of ideal materials.

LAOS Measurement and Fourier-Transform Rheology Chapter | 5 97
corresponds with the line representing purely elastic behaviors. The positioning of that ellipse indicates the presence of delays between 0 and π/2 rad. The mate-rial’s response in the nonlinear range can be a combination of these behaviors, or completely new figures can occur, whose shape would depend on the distor-tion of the forcing signal, caused by the studied material.
A further analysis of the Lissajous figures concerns their area. The area is proportional to the quantity of energy dissipated by the material. In order to compare the quantity of energy dissipated by the material, a dissipation coef-ficient () is introduced.
The dissipation coefficient, defined by equation, constitutes another impor-tant parameter which is used in determining the amount of the dissipated energy (Ewoldt et al., 2010):
ϕ φτ ω γ ωγ τ
= = ⋅⋅ ⋅
E
E
t d t
( )
( ) ( )
4d
d pp max max (5.13)
γmax means the amplitude of the strain applied (γ0) whereas τmax is equal to the highest value of stress.
The magnitude is interpreted as a relation of the amount of energy dis-sipated by the studied material in one cycle to the amount of dissipated en-ergy which would be produced if the investigated material were a pure plastic system.
The concept of the parameter is shown in Fig. 5.10. The integral in Eq. 5.13 represents the area of the Lissajous figure, obtained by projecting the time course of γ(wt) and τ(wt) on the phase plane (γ, τ).
5.2.5 Extended Analysis of Lissajous Figure and Geometrical Decomposition
The analysis of the obtained function (Eq. 5.2) requires the use of extended har-monic analysis based on Fourier transform, as well as a description utilizing the phase plane (analysis of Lissajous figures) (Hyun et al., 2011). As a result, new rheological parameters are obtained, describing the material’s behavior within the nonlinear range of deformations or stress. These parameters can be strictly interpreted physically and allow the prediction of the rheological properties of the studied materials, hence facilitating the creation of new food products and industrial plants and pipelines. Broadly defined mechanical properties of food, within the nonlinear area, also play an important role in modeling the behavior of the product during consumption in the oral cavity.
The analysis based on 3D Lissajous figures (Ewoldt and McKinley, 2010) deserves particular attention. Such figures are built within a 3D coordinate sys-tem of strain/shear rate/stress (Fig. 5.11), where strain and share rate are de-fined, respectively:
γ γ ω= ⋅t t( ) sin( )0 (5.14)
=Ed(Ed)pp=φτ(wt)⋅dγ(wt)4⋅γmax⋅τmax
γ(t)=γ0⋅sin (wt)

98 PART | I Advances in Food Rheology
γ γ γ ω ω= = ⋅td
dtt( ) ( ) cos( )0 (5.15)
The curve in shear rate–stress plain can be obtained by differentiating the forcing function (Eq. 5.14). It means that the analysis of 3D Lissajous figures requires the recording of the forcing function (strain) and the response of the material. The obtained closed curve represents both elastic and viscous prop-erties of the studied system. This figure can be split into two figures in 2D coordinates (Fig. 5.11): deformation/stress and shear rate/stress. The first figure describes the elastic properties of the system, whereas the second figure de-scribes its viscous properties. The described procedure for division of Lissajous figures into two parts stems from the lack of possibility to easily differentiate the resulting signal into parts, that would describe either purely the elastic be-havior or the viscous behavior.
It is impossible to clearly distinguish the factors describing the storage of mechanical energy (G) and the dissipation of the energy (G0), as is the case when applying the SAOS technique. This is due to the fact that the response of the material (Eq. 5.2) contains higher harmonics responsible for the nonlinear character of the material.
A direct application of FTR methods merely allows determining the degree of nonlinearity in the material’s response; it does not allow one to consider the overall impact of elastic and viscous parts on the evaluation of the observed rheological occurrences (Klein et al., 2007; Hyun and Wilhelm, 2009). More-over, FTR methods allow the reconstruction of a time series using individual harmonics and their phases (Hyun et al., 2011). The reconstructed time series is free of noise; therefore FTR can be used as a highly effective filtration method for experiments containing high noise levels.
γ˙(t)=dγdt=(γ0w)⋅cos (wt)
FIGURE 5.11 Construction of 3D Lissajous figure.

LAOS Measurement and Fourier-Transform Rheology Chapter | 5 99
One of the possible methods, which can be applied in the analysis of the aforementioned cases, is the geometrical decomposition of the 2D Lissajous fig-ures presented by Cho et al. (2005). According to the method’s premise, stress (τ) can be subjected to decomposition as expressed by
τ τ τ τ τ τ τ= − − + − − = ′ + ′′x yx y x y x y x y
x y( , )( , ) ( , )
2
( , ) ( , )
2( ) ( ) (5.16)
where γ γ ω= =x y, / the τ (x;γ0,w) value stands for elastic stress, and the τ 0(y;γ0,w) value corresponds to viscous stress (Fig. 5.12). This procedure can be summarized as the division of the Lissajous figure into four parts: τ(x,y), τ(−x,y) and τ(−x,−y), τ(x,−y). The dividing operation is possible only when the figure is closed. The values τ and τ 0 are obtained by subtracting appropri-ate parts of the Lissajous figure, according to Eq. (5.16) (the lack of τ(−x,−y) is due to the symmetry conditions τ(−x,−y)= τ(x,y)).
This results in two curves, as presented in Fig. 5.12. The curves divide the Lissajous figure into two parts of equal area. The advantage of this approach is a decomposition of the resulting nonlinear signal into parts corresponding to the elastic and viscous properties, without the necessity to apply any constitutive equations (Cho et al., 2005).
The curves may be subjected to further decomposition. There are two meth-ods usually used for this: the first applies regression analysis and the method of least squares (Cho et al., 2005), whereas the second procedure is based on Chebyshev polynomials of the first kind (Ewoldt et al., 2008), obtained accord-ing to the recurrence rule:
==
= ⋅ −+ −
T xT x xT x x T x T x
( ) 1( )
( ) 2 ( ) ( )n n n
0
1
1 1
(5.17)
Chebyshev polynomials are orthogonal in the range x∈[−1,1], and they ensure a near-optimal polynomial interpolation.
τ(x,y)=τ(x,y)−τ(−x,y)2+τ(x,y)−τ(x,−y)2=τ(x)+τ0(y)
x=γ,y=γ˙/w
T0(x)=1T1(x)=xTn+1(x)=2x⋅Tn(x)−Tn−1(x)
FIGURE 5.12 Geometrical decomposition of 2D Lissajous figures and Chebyshev harmonics.

100 PART | I Advances in Food Rheology
Then τ and τ 0 can be expressed by the following relations:
∑τ γ ω γ′ = ⋅−
x e T x( ) ( , ) ( )n
n n0odd
0 (5.18a)
∑τ γ ω γ′′ = ⋅−
y v T y( ) ( , ) ( )n
n n0odd
0 (5.18b)
where γ γ γ γ γ γ= = = =x x y y/ / , / /0 0 0 0, the scaling is a result of the orthogo-nal conditions of the Chebyshev polynomials (Boyd, 2001).
This means that the share stresses can, in this instance, be expressed by
∑ ∑τ ω γ τ γ τ γ
γ ω γ γ ω ω γ≡ ′ + ′′
= ⋅ + ⋅− −
t t t
e T x v T y
( ; , ) ( ( )) ( ( ))
( , ) ( ) ( , ) ( )n
n nn
n n
0
0odd
0 0odd
0 (5.19)
The coefficients en and vn are called Chebyshev weighting coefficients and they represent the elastic and viscous parts in the nonlinear viscoelasticity, re-spectively. The distribution of the en and vn coefficients’ values is depicted in Fig. 5.12. It should be noted that the Fourier coefficients (Gn, G0n) in Eq. 5.2 fully characterize the response of the material in the time domain; however, the physical interpretation of the higher harmonics may only be carried out based on the en and vn Chebyshev coefficients (Ewoldt et al., 2008; Hyun et al., 2011).
The Chebyshev coefficients can exhibit both positive and negative values (Hyun et al., 2011). The e3 and v3 values are a time-independent measure of the material’s nonlinearity against its elastic and viscous properties. The higher order Chebyshev coefficients (n = 5,7,...) can also be interpreted as a measure on the material’s nonlinear response. The third coefficients, e3 and v3, are pre-dominantly analyzed as the main parameters of nonlinearity.
Typically, the interpretation of the liquid’s properties is carried out by deter-mining the values of e3 and v3:
>=<
>=<
e v
0strain stiffening0 linear elastic0strain softening
0shear thickening0 linear viscous(Newtonian)0shear thinning
3 3 (5.20)
It should be emphasized that the studies using the LAOS technique and the Chebyshev coefficients-based analysis are quite a new approach, and that only recently has started gaining popularity in the research of food systems.
A further analysis of the Chebyshev en and vn coefficients and Lissajous figures allows for the determination of values describing the nonlinear proper-ties of the material. Based on those values, it is possible to define the following material constants:
τγ
′ = = − + +γ =
Gd
de e e3 5M
01 3 5 (5.21)
τ(x¯)=γ0∑n−odden(w,γ0)⋅Tn(x¯)
τ0(y¯)=γ˙0∑n−oddvn(w,γ0)⋅Tn(y¯)
x¯=x/γ0=γ/γ0, y¯=y/γ0=γ˙/γ˙0
τ(t;w,γ0)≡τ(γ(t))+τ0(γ˙(t))=γ0∑n−odden(w,γ0)⋅Tn(x¯)+γ0w∑n−odd
vn(w,γ0)⋅Tn(y¯)
e3>0 strain stiffening=0 lin-ear elastic<0 strain softening-
v3>0 shear thickening=0 linear vis-cous (Newtonian)<0 shear thinning
GM'=dτdγγ=0=e1−3e3+5e5+⋯

LAOS Measurement and Fourier-Transform Rheology Chapter | 5 101
τγ
′ = = + + +γ γ=
G e e eL 1 3 5
0
(5.22)
where ′GM stands for small-starin (tangent) modulus and ′GL for large-strain (secant) modulus.
A geometric interpretation of the aforementioned parameters is shown in Fig. 5.13. It is then possible to define the relationship of ′GL to ′GM; the ob-tained value is called the strain-stiffening index (S):
= ′′
= + + +− + +
SG
G
e e e
e e e3 5L
M
1 3 5
1 3 5 (5.23)
GL'=τγγ=γ0=e1+e3+e5+⋯
GM'GL'
GL'GM'
S=GL'GM'=e1+e3+e5+⋯e1−3e3+5e5+⋯
FIGURE 5.13 Geometrical genesis of ′GM and ′GL. GM'GL'

102 PART | I Advances in Food Rheology
<=>
S
1strainsoftening1linear viscoelastic material1strainstiffening
(5.24)
Similar interpretation can be applied for the Lissajous figure in a shear rate to stress system of coordinates. In that case, the relevant dependences would adopt the following form:
η τγ
′ = = − + +γ =
d
dv v v3 5M
01 3 5 (5.25a)
η τγ
′ = = + + +γ γ=
v v vL 1 3 5
0
(5.25b)
where η′M is the minimum-rate dynamic viscosities and η′L is the large-rate dynamic viscosities.
The ratio of these values is called the “thickening ratio” and can be defined as following:
ηη
= ′′
= + + +− + +
Tv v v
v v v3 5L
M
1 3 5
1 3 5 (5.26)
<=>
T
1share thinning1Newtonianviscosity1share thickening
(5.27)
It follows from the presented discussion that the determination of both the modules and the dynamic viscosity in the nonlinear range, can be carried out by two methods. The first relies on a direct analysis of the obtained Lissajous figure, and the second one is a result of the geometric decomposition and the Chebyshev transform.
The described new rheological quantities possess a strict physical interpre-tation and represent the measures of nonlinearity of the material’s rheological characteristics.
The studies of nonlinear rheological properties using the LAOS methods are becoming increasingly popular, as mentioned previously. However, the execution of measurements in the nonlinear range requires a very good un-derstanding of the measuring instrument and the assessment of the signal-to-noise ratio (S/N ratio). This value is defined as the ratio of the amplitude of the highest peak present in the Fourier spectrum to the standard deviation of noise. The S/N value is key to ensure the accurate measurements with the use of LAOS methods. This is due to the fact that the higher the value of this pa-rameter, the more harmonic components it is possible to identify in the Fourier spectrum. Another important issue, observed during oscillatory measurements of nonlinear rheological properties, is the presence of the even harmonics in the
S<1 strain softening=1 linear visco-elastic material>1 strain stiffening
ηM'=dτdγ˙γ˙=0=v1−3v3+5v5+⋯
ηL'=τγ˙γ˙=γ˙0=v1+v3+v5+⋯
ηM'ηL'
T=ηL'ηM'=v1+v3+v5+⋯v1−3v3+5v5+⋯
T<1 share thinning=1 Newto-nian viscosity>1 share thickening

LAOS Measurement and Fourier-Transform Rheology Chapter | 5 103
Fourier spectrum. From a purely theoretical point of view, it would seem that the Fourier spectrum comprises only odd harmonic components. In reality, the analysis of the test data quite often reveals the presence of the even harmonics in the Fourier spectra. The appearance of these components in the experimental tests’ results is still not completely understood. The main reasons offered for their presence are as follows: measurement errors, which are due to an inac-curate generation of the forcing function (sinus function), and inaccuracy of the mechanical design of the measurement sensors themselves. Another rea-son for the occurrence of even harmonics could be the presence of slip on the sensor wall during the measurement. The tested material could also cause the presence of the even harmonics. It could possibly be a combination of certain effects: inertia, elasticity, and shear thinning. Moreover, these phenomena can be induced by the structural changes the material undergoes in the course of measurements.
Based on the aforementioned, it can be concluded that this phenomenon has not yet been fully explained, and therefore a particular attention should be paid, during the analysis of test data, to the presence of even harmonic in the Fourier spectrum, so that it could be determined whether they are artifacts only, resulting from the inaccuracy of the used measuring equipment, or whether they carry useful information about the nonlinear characteristics of the tested material.
5.3 APPLICATIONS
Because of their sensitivity, the LAOS methods can be applied in the analy-sis of very weak interactions in materials, whose structure is rather delicate. Moreover, the studies utilizing the high-amplitude methods can be successfully applied to systems demonstrating viscoelastoplastic behaviors. Raw materials, as well as ready products, both exhibit the aforementioned characteristics. Cur-rently, the LAOS methods are mostly used to analyze systems such as: dough, cheeses, gels and dispersed systems, such as emulsions and foams. Studies of such materials usually concentrate on the measurements of nonlinear rheologi-cal properties and the determination of the new material constants. The LAOS techniques are still being developed, and are not yet as fully established, as the SAOS methods in the science of food. Further development of the LAOS methods is a natural step on the way to describe the rheological and mechanical characteristics of food. The nonlinear behaviors are closely related to the be-haviors occurring during the production, as well as consumption, of the foods. For that reason, intensive studies are being carried out on the correlation of the parameters describing the nonlinear rheological behaviors, with the behav-iors occurring in the mouth during consumption. Moreover, the use of LAOS methods allows for a lower number of studies required in order to determine the full rheological characteristic of the material, than in the case of traditional methods.

104 PART | I Advances in Food Rheology
5.3.1 The Analysis of the Correlation of G and G0 in the Function of the Deformation Amplitude
The correlation of G and G0 is discussed subsequently. The test results were carried out for a number of foams based on the egg white, gum arabic (AG), and xanthan gum (XG). The presented test measurements were carried out at the oscillatory frequency equal to 1 Hz and at the temperature of 23°C, using rotational rheometer RS6000 Thermo Fisher. A set of plate-cone type sensors was used (Ptaszek, 2013).
Fig. 5.14 presents the correlation of G and G0 in the function of the defor-mation amplitude. These correlations are characterized by a parallel course in the range of linear viscoelasticity. Further, the curves intersect and the value of G0 becomes greater than that of G. This phenomenon was observed for all analyzed foams.
The analysis of the courses of the G and G0 modules against the increase of XG’s concentration exhibits the presence of a typical maximum on the G0 curve, in an area where G and G0 intersect. The values of the aforementioned maxima on the G0 curve are given in Table 5.1. This maximum presents itself in the range of amplitudes γ0 = (10−1–100). The G0 values of the observed maxima are lower than the G values. For the foams containing egg white proteins only, as well as for systems containing only the AG supplement (I column, Table 5.1), this maximum is not visible (even if it exists, its value is lower than the value of noise observed during the experiment). The shape of the G and G0 curves for systems containing both AG and XG is comparable to that of a foam containing XG only. The presence of AG in the analyzed foams results in a minor increase of G and G0 values, in comparison to the foams containing XG only. After reaching the intersection point, the G and G0 curves rapidly decline, and in the log–log coordinate system their courses are rectilinear (Fig. 5.14).
Moreover, the values of G are visibly lower than those of G0. The values of G are characterized by higher slope compared to G0. This indicates that in this range of amplitudes, the foams’ response is more viscous than elastic.
With regard to the correlation of G and G0 against the deformation ampli-tude, for high values of γ0, a course similar to the correlation of γ′ β−G ~ 0 and
γ′′ δ−G ~ 0 is observed. Fig. 5.14 presents the results of the fitting of the curves to the obtained test result data, and Table 5.1 shows the values of the β and δ coefficients. For the foam of pure egg white protein and containing AG only, the values of β and δ coefficients vary significantly from all the other analyzed sys-tems (Table 5.1). The variability of these coefficients’ values is not relevant with regard to further analysis. The key parameter is the ratio of β to δ; its numerical values are presented in Table 5.1. From the obtained data it can be concluded that for the foams obtained from pure egg white, as well as foams with addition of AG only (I column), this ratio exhibits a much higher value than for the other foams. For the remaining foams, the value of β/δ is equal to 2, which was veri-fied with a t-Student test.
G∼γ0−βG0∼γ0−δ

LAO
S Measurem
ent and Fourier-Transform R
heology Ch
apter |
5 105FIGURE 5.14 Dependences of the complex elasticity moduli (G O and G0 ∆) on the deformation amplitude γ0 for the analyzed foams (Ptaszek, 2013).

106 PART | I Advances in Food Rheology
TABLE 5.1 Overview of Rheological Parameters of the Analyzed Systems (Ptaszek, 2013)
XG
AG
0 0.3 0.6 0.9
0
β 2.61 ± 0.04 1.27 ± 0.03 1.16 ± 0.03 1.16 ± 0.05
δ 0.98 ± 0.02 0.65 ± 0.03 0.57 ± 0.01 0.59 ± 0.02
β/δ 2.68 ± 0.03a 1.94 ± 0.02 2.02 ± 0.01 2.00 ± 0.02
τ0osc, Pa 125 ± 6b 21 ± 3 27 ± 2 38 ± 4
τ0, Pa 91 ± 4 23 ± 1 26 ± 1 38 ± 3
G0max, Pa — 63 ± 7 60 ± 4 72 ± 5
G0, Pa 404 ± 12 250 ± 16 218 ± 20 265 ± 17
0.3
β 2.03 ± 0.02 1.32 ± 0.01 1.25 ± 0.02 1.17 ± 0.03
δ 0.91 ± 0.01 0.61 ± 0.02 0.61 ± 0.01 0.58 ± 0.01
β/δ 2.22 ± 0.01a 2.16 ± 0.01a 2.03 ± 0.01 2.02 ± 0.01
τ0osc, Pa 38 ± 4b 25 ± 2 32 ± 3 39 ± 2
τ0, Pa 78 ± 6 20 ± 2 30 ± 1 39 ± 3
G0max, Pa — 41 ± 5 86 ± 9 71 ± 6
G0, Pa 126 ± 10 158 ± 9 295 ± 15 267 ± 20
0.6
β 2.70 ± 0.02 1.35 ± 0.01 1.19 ± 0.02 1.14 ± 0.01
δ 0.96 ± 0.01 0.67 ± 0.01 0.61 ± 0.01 0.59 ± 0.01
β/δ 2.81 ± 0.02a 2.02 ± 0.01 1.94 ± 0.02 1.95 ± 0.03
τ0osc, Pa 130 ± 12b 29 ± 3 32 ± 2 39 ± 4
τ0, Pa 110 ± 9 28 ± 4 31 ± 3 44 ± 2
G0max, Pa — 64± 73± 73±
G0, Pa 342 ± 15 275 ± 9 299 ± 7 264 ± 9
0.9
β 2.77 ± 0.02 1.32 ± 0.03 1.16 ± 0.02 1.18 ± 0.03
δ 0.93 ± 0.01 0.66 ± 0.02 0.58 ± 0.02 0.59 ± 0.02
β/δ 2.97 ± 0.01a 1.99 ± 0.02 2.00 ± 0.02 2.00 ± 0.02
τ0osc, Pa 115 ± 3† 27 ± 2 32 ± 4 36 ± 1
τ0, Pa 123 ± 4 27 ± 1 30 ± 2 40 ± 5
G0max, Pa — 61 ± 2 72 ± 1 70 ± 2
G0, Pa 347 ± 8 259 ± 6 289 ± 3 264 ± 7
aSignificantly different (H0: β/δ = 2, H1: β/δ ≠ 2).bSignificantly different (H0: τ0osc = τ0, H1: τ0osc ≠ τ0).

LAOS Measurement and Fourier-Transform Rheology Chapter | 5 107
5.3.2 Comparison of Methods to Determine the Yield Stress
Table 5.1 presents data concerning the values of yield stress, obtained with the method described previously, as well as classically. Fig. 5.14 demonstrates the area in which the analyzed foams are in the flow state. A statistical analysis of the obtained τ0 values revealed that the foams containing AG only exhibit significant differences between the τ0 values obtained using various methods, and one foam containing 0.6% AG and 0.6% XG also exhibited such behavior. In all the other cases, the obtained τ0 values did not differ significantly. More-over, the foams containing AG only exhibited the highest values of τ0, and they significantly differed from the foams containing XG. An addition of xanthan gum notably reduced the value of τ0 in all observed cases, compared to foams containing AG only. Variance analysis and the HSD–Tukey test demonstrated that the addition of XG does not visibly influence the value of τ0.
The foam containing egg white protein only is characterized by one of the highest values of τ0, as well as the highest value of the G0 spring modulus. This phenomenon has notable effect on the further behavior of the foam, as the sys-tem requires the highest amount of mechanical energy to reach the flow. Similar behavior is displayed by systems containing an addition of AG only. The only exception is the foam with 0.3% AG, where the value of τ0 is significantly lower than for the other systems. An introduction of XG to the discussed foams results in the decrease of both τ0 and G0 values, which means that these systems require a lower amount of energy in order to start to flow.
From the aforementioned analysis it follows that it is possible to apply the analysis of the course of the G and G0 curves in the deformation amplitude, in order to determine the yield stress value. Such analysis has certain limitations and, as demonstrated, the results are not always consistent with those obtained via classical methods. The reason for those discrepancies could be the differ-ences in the duration time of the experiments: the classical tests of yield stress value and oscillatory measurements. It is also possible that the reason for these differences results from the material’s structure, which can exhibit sensitivity to the changes of the direction of flow, in the case of oscillatory flow.
5.3.3 Application of Fourier Rheology and the Basic Analysis of the Lissajous Curves
The possibilities of the data analysis using the Fourier rheology methods are presented based on the results obtained for food foams, created with egg white protein, xanthan gum (XG), and apple pectin (P). The measurements were car-ried out as described previously.
Fig. 5.15 presents the Fourier spectra for the selected foams. For the foam of egg white protein, we can observe a significant increase in the number of harmonics with an increase in the deformation amplitude. This indicates a very complex response of the material, to the applied deformations, in the nonlinear

108 PART | I Advances in Food Rheology
range. The third and fifth harmonics reach their respective maxima. A similar behavior was observed by Hyun et al. (2006) for a weak gel of synthetic poly-mers. An addition of XG results in a visible decrease of the number of observed harmonics and their intensity. There are also no maxima visible in the courses of each of the harmonics. Even stronger damping effect is observed for the respective pectin. The higher harmonics (11w–19w) disappear in the range of observed deformation amplitudes. Fig. 5.15 demonstrates the effect of the addi-tion of both XG and P on the foams’ properties. It is apparent that the addition of these hydrocolloids visibly damps the higher harmonics. A significant effect is only made by the 3w–9w harmonics. A change in the XG concentration, at a constant concentration of pectin, also causes a disappearance of the higher harmonics. This indicates that as the hydrocolloid’s concentration increases, the material’s response to the applied deformation becomes structurally simpler (in terms of the structure of the Fourier spectrum).
The shifts in the behavior of the third harmonic are also indirectly visible in Fig. 5.16. It depicts the correlation of Q(γ0). For low values of γ0, the values of the Q parameter should only be treated as indicative, as they refer to the linear range, and the value of the third harmonic is quite low there, or even equal to zero. Interpretable values are obtained for the nonlinear range. It can be assumed that interpretable values of Q for the analyzed systems begin for amplitudes positioned on the right side of the vertical lines in Fig. 5.16. For the
FIGURE 5.15 Fourier spectra in function of strain amplitudes for selected foams (Ptaszek, 2014).

LAO
S Measurem
ent and Fourier-Transform R
heology Ch
apter |
5 109FIGURE 5.16 Dependence of energy dissipation coefficient () and Q in function of strain amplitudes (Ptaszek, 2014).

110 PART | I Advances in Food Rheology
foam based on egg white protein only, we can observe a maximum in the course of Q(γ0), and afterward the curve drops down. The foams containing only XG (I line) exhibit similar behavior, although the maximum dissipates gradually with the increase of the hydrocolloid’s concentration. A contrasting situation can be observed for foams containing P (I column), the aforementioned maxi-mum increases with the rise of pectin’s concentration. Then, the Q values de-crease. For foams containing both XG and P, this correlation is characterized by a gently decreasing ridge in the range of medium amplitudes, which then decreases dramatically for the higher values of γ0. A maximum is only reached for the foams of the following concentrations: XG 0.3 wt.% and P 0.3 wt.%, XG 0.3 wt.%, and P 0.6 wt.%
The discussed behavior is particularly well visible in Fig. 5.17. At the begin-ning, the Lissajous figures are reduced to a point, due to the small deformation amplitude (this phenomenon is visible in the nonlinear range of viscoelastic-ity). Then, a visible increase of the figure’s area is observed, which indicates an increasingly higher dissipation of the mechanical energy by the system, in a single cycle. The complexity of the shape of the Lissajous curve is depen-dent on the complexity of the system’s response to the sinusoidally variable deformation. It stems from the presence of many harmonic components in the material’s response, which in turn translates into the complexity of the Fourier spectrum, described previously. The first row represents a system based on pure egg white protein and with an addition of XG only. The presented Lissajous figures undergo a visible evolution with the increase of the XG’s concentration in the foam. The figure describing the properties of foam based on egg white protein only is characterized by the most complex shape, in the range of nonlin-ear deformations. Addition of XG results in the smoothening of the shape. The presence of P only has a completely opposite effect on the discussed behaviors. The addition of pectin (first column) does not result in the smoothening of the Lissajous figure in the beginning; its elongated shape is also retained. Only for concentrations of 0.9 wt.% pectin and above, the figure of similar shape and area to the one representing the 0.3 wt.% concentration XG is obtained.
The addition of both P and XG causes the Lissajous figures to adopt a shape similar to an ellipse; moreover, the synergistic effect of pectins and xanthan gum is clearly noticeable. The change of the figures’ shapes in the function of stress amplitude (γ0) is also quite interesting. In the area of nonlinear viscoelas-ticity only a point is visible, which is due to the low value of the deformation amplitude. With the increase of γ0 the figure’s shape becomes more ellipsoidal. This ellipse is stretched along its major axis. Such shape of the figure indicates a viscoelastic behavior (Fig. 5.10).
Further analysis of the Lissajous figures concerns the changes of their sur-face area. This area is considered a hysteresis, and interpreted as the amount of energy dissipated by the system in one cycle (period). This statement is ex-pressed by the surface integral in Eq. 5.13. Fig. 5.16 presents the changes of the dissipation energy coefficient in the function of γ0. This function is sigmoidal

LAO
S Measurem
ent and Fourier-Transform R
heology Ch
apter |
5 111FIGURE 5.17 Lissajous figures (Ptaszek, 2014).

112 PART | I Advances in Food Rheology
in character, which is due to the fact that in the range of linear viscoelasticity the amount of dissipated energy in one cycle is approximately constant in the function of γ0. Next, a rapid increase of the dissipated energy is observed, which is due to the crossing of the yield stress threshold, beyond which the viscous forces dominate.
The foam, obtained from pure egg white protein, in the nonlinear range ex-hibits a maximum, and then the course of becomes parallel to the γ0 axis. An addition of XG only results in a gentle behavior and a transition toward a more flat characteristic of (γ0) in the nonlinear range. An addition of pectin only caused a more rapid increase of the characteristic after crossing the yield stress threshold, next, depending on the pectin’s concentration, a smooth course is observed, with a minor maximum further on. The only thing visible is that the presence of P causes dissipation of larger amount of energy in the first stage of flow (straight after crossing τ0). This indicates that systems containing P lose their elastic properties quicker and the viscous properties become dominant. Most of the curves reached the borderline value ≈ 0.8, and reach a maximum or form a plateau in the vicinity of this point. The value ≈ 0.8 is linked to the viscosity of the analyzed systems. Eq. 5.13 implies that the φ = 1 relates to a perfectly plastic material. All the analyzed systems exhibit behaviors typi-cal for viscoelastic–plastic materials. This means that despite dissipating huge amounts of energy during flow and dry friction, they also exhibit elastic proper-ties (for a perfectly elastic material = 0); therefore they are able to accumulate energy in their structure. Additionally, the value of the dissipation factor for a perfectly viscous liquid equals = π/4 ≈ 0.785. This means that the analyzed values are characteristic of a viscous flow. After crossing a maximum, the val-ues of decrease due to presence of elastic forces.
5.3.4 Advanced Analysis of the Lissajous Curves and Geometric Decomposition
Fig. 5.18a demonstrates the Lissajous figures in the (γ, τ, τ) coordinate system, for the pure egg white protein based foams, as well as for foams supplemented with inulin (IN) and xanthan gum.
The figures obtained for small deformation amplitudes are hardly visible within the selected scale; they adopt an ellipsoidal shape with a very short semi-minor axis and are also characterized by a very small area. This is due to the fact that the studied foams are located within the range of linear viscoelasticity. As the deformation amplitude (γ) rises, the figures begin to deviate from the ellipse and their surface area expands. The systems enter the nonlinear viscoelastic-ity range and the amount of dissipated mechanical energy increases with each cycle.
In the nonlinear ranges, the Lissajous figures obtained for the foam contain-ing egg white protein only assume a shape similar to a rectangle, which may indicate the predominance of plastic characteristics (Ewoldt et al., 2010).

LAO
S Measurem
ent and Fourier-Transform R
heology Ch
apter |
5 113
(Continued)
FIGURE 5.18 (a) Lissajous figures and geometrical decomposition—elastic part (Ptaszek et al., 2016).

114 PAR
T |
I Advances in Food R
heology
FIGURE 5.18 (cont.) (b) Lissajous figures and geometrical decomposition—viscous part (Ptaszek et al., 2016).

LAOS Measurement and Fourier-Transform Rheology Chapter | 5 115
The presence of IN does not significantly influence the shape of the obtained figures. This indicates that inulin stabilizes the structure of foam produced from egg white protein. Supplementation with XG results in a completely different response to the applied deformation. The presence of this hydrocolloid at 0.3% concentration causes the Lissajous figures to adopt a shape comparable to an ellipse, even for quite high amplitude values (γ0). As the XG concentration in-creases, the area of the obtained figures also grows. It demonstrates that the foams richer in XG dissipate more mechanical energy within one cycle, in com-parison to the foams with inulin. A comparison of the foams supplemented with IN and with XG shows that the foams containing IN are characterized by the predominance of dry friction (higher contribution of plastic behaviors) (Ewoldt et al., 2010; Klein et al., 2007), while the systems supplemented solely with XG tend to dissipate the energy associated with the viscous forces.
In the foams containing both XG and IN, XG clearly has a dominant influ-ence on the shape of the Lissajous figures (Fig. 5.18a). In the systems with 0.3 wt.% XG, the sharp edges of the figures become blurred and the whole figure assumes a smoother shape. The increase in XG concentration causes the area of the obtained figures to become larger; this is associated with greater dissipation of the mechanical energy within one cycle. The figures acquired become similar to an ellipse and adopt a flattened shape.
The Lissajous figures obtained in our study were subjected to decomposi-tion. As a result, a series of lines in the deformation function emerged; they represent elastic stress (τ), present during shear flow in the nonlinear condi-tions. The curve shapes undergo changes as the value of the deformation am-plitude γ0 increases. Initially, it forms a straight line, reflecting the area of the linear viscoelasticity (it is invisible at the applied scale). A further increase in the deformation amplitude causes the appearance of an inflexion point on the τ(γ) line, located at the center of the coordinate system. As a result of further γ0 increase, we observe the development of elastic stress τ(γ) up to the point of the occurrence of a function with two extremes; the maximum is located within the negative deformation values, whereas the minimum is situated on the positive values’ side. The change of the shape of the line (τ) from linear to nonlinear indicates a transition of individual systems to the area of nonlinear viscoelastic-ity (Cho et al., 2005).
Fig. 5.18b shows the Lissajous figures in the γ τ( , ) system, corresponding to the viscous behaviors. For low values of the shear rate amplitudes γ( )0 , the figure is an ellipse of a very small minor axis, similar to the previous case. In the course of the increase of the amplitude levels, the figures adopt increasingly complex shapes.
The foam, containing egg white protein only, produces secondary loops (SL) (Ewoldt and McKinley, 2010); this phenomenon occurs for the high values of the shear rate amplitude. Supplementation solely with IN led to the enhance-ment of this phenomenon. In contrast, supplementation with only XG resulted in the suppression of the SL in the analyzed foams. For the foams containing
(γ˙,τ)(γ˙0)

116 PART | I Advances in Food Rheology
0.3 wt.% XG, SL assume a narrow form, whereas 0.6 wt.% XG foam is char-acterized by very small SL. The phenomenon is not observed in the foams with 0.9 wt.% XG.
The behavior of foams containing both IN and XG is comparable to that of the foams with XG only. For the lowest XG concentration (0.3 wt.%), we ob-served in all cases a vastly expanded SL, which disappears as the XG concentra-tion increases; this phenomenon can be attributed to the influence of XG on the rheological properties. Supplementation with XG causes the viscous processes to prevail against plastic and elastic ones. This thesis can be confirmed by com-paring the Lissajous figures in the (γ,τ) coordinate system (Fig. 5.18a), which demonstrates that the increase in the deformation amplitude is accompanied by the growth of the figures’ areas.
We subjected the obtained figures to decomposition and a series of curves has been obtained in the area of the nonlinear viscoelasticity. The curves rep-resent stress (τ0) originating from the pure viscous properties of the examined foams.
5.3.5 Chebyshev Harmonics Analysis
By comparing the curves obtained from decomposition of the Lissajous figures, we can see clearly that the analyzed foams exhibit a dominance of the viscous properties. This is due to the fact that τ0 reaches higher absolute values, in com-parison to τ (Cho et al., 2005).
The curves obtained in the geometrical decomposition of the Lissajous fig-ures served as the basis for further analysis, using the Chebyshev transforma-tion. Fig. 5.19 shows the Chebyshev en, vn coefficients (Eq. 5.18) for the se-lected stress amplitude (γ0 = 5.5). The coefficients e1 and v1 represent a response to the forcing function (the linear term, first harmonic). The description of the behavior with the use of higher components (en, vn) refers to the nonlinear re-sponse of the material, and provides detailed information on both elastic and viscous behaviors. Consequently, the rheological properties of the foams are dominated by viscous phenomena; this is confirmed by higher values of v1 in comparison to the values of e1. This implies that flow is the main rheological phenomenon here. Moreover, the presence of higher Chebyshev harmonics in-dicates that the material also responds in an elastic manner (the nonzero values of e3). This points to the presence of residual elastic characteristics (the values of en > vn, n = 3, 5, 7,…).
According to Eq. 5.20, such systems can be classified as “stiffened by de-formation,” due to their pure elastic properties (Hyun et al., 2011). Pure vis-cous properties, however, described by v3, undergo changes dependent on the foam’s composition. For the foams containing egg white protein only, the value of v3 is lower than zero; according to Eq. 5.20 it signifies shear thin-ning (Hyun et al., 2011). Supplementation with IN diminishes this phenomenon and the response of the foams actually becomes Newtonian. A reverse situation

LAO
S Measurem
ent and Fourier-Transform R
heology Ch
apter |
5 117FIGURE 5.19 Chebyshev harmonics for typical foam (γ0 = 10) (Ptaszek et al., 2016).

118 PART | I Advances in Food Rheology
is observed for the foams supplemented with XG. Initially, the value of v3 is close to zero and then becomes positive, which is indicative of the foam being shear thickened (Hyun et al., 2011). The foams containing both IN and XG are shear thickened, with the exception of the foam supplemented with the highest amounts of IN and XG.
Fig. 5.19 illustrates that the Chebyshev coefficients disappear rapidly, and the observed process is influenced solely by the coefficients ranging up to the ninth component.
It is convenient to conduct further analysis of Chebyshev coefficients on the basis of coefficients normalized against the first one (Ewoldt et al., 2008). Fig. 5.20a shows the change of e3/e1, e5/e1, e7/e1 in the function of the deforma-tion amplitude.
The dependence e3/e1 for the pure egg white protein foam is characterized by positive values within the entire γ0 area observed. Here we can note an evi-dent maximum, located within the range of γ0 from 1 to 10. The foam is sub-jected to shear stiffening (see Eq. 5.6) to a certain boundary value, manifested
FIGURE 5.20 (a) Normalized third, fifth, seventh elastic Chebyshev harmonics in function of strain amplitude (Ptaszek et al., 2016). (b) Normalized third, fifth, seventh viscous Chebyshev har-monics in function of strain amplitude (Ptaszek et al., 2016).

LAOS Measurement and Fourier-Transform Rheology Chapter | 5 119
by a maximum, after which the e3/e1 values rapidly decrease, finally reaching zero. The remaining coefficients (e5/e1, e7/e1) within the nonlinear range initial-ly adopt negative values and subsequently their values rise to form a maximum.
The supplementation with IN only slightly modifies the courses of the ana-lyzed coefficients. In this case the e3/e1 values do not rapidly grow, as can be found in the foams with egg white protein only. A gentle increase occurs here, and as soon as the maximum is reached, the values drop in almost the same manner, as in the foams with egg white protein only. The remaining coefficients rapidly decrease upon reaching the maximum, and eventually adopt negative values. The foams containing XG only (0.3 wt.%) are characterized by higher normalized values of the Chebyshev coefficients. As the XG concentration grows, the e5/e1 values remain at constant levels, whereas the e7/e1 dependence visibly decreases.
The e3/e1 values for the foams containing a constant amount of XG (0.3 wt.%; as analyzed against columns) are negative at the beginning of the nonlinear range. This phenomenon occurs for all IN concentrations analyzed within this column. Subsequently, the values of this coefficient increase until they reach the maximum, before they gently decrease. The presented description indicates that the foams enriched with IN and 0.3 wt.% XG exhibit an initial softening manifested by negative e3 values; then they undergo an evident stiffening by deformation.
The normalized e5/e1 coefficient initially reaches positive values and a small maximum, and subsequently it adopts negative values with a visible minimum. The values continue to grow until they reach a plateau. The values of the e7/e1 coefficient also initially create a small maximum, and then assume negative values or fluctuate around zero if the values of the amplitude are higher.
Chebyshev coefficients obtained for the foams with 0.6 wt.% or 0.9 wt.% XG exhibit similar behavior. The values of the e3/e1 coefficient do not create a minimum, but rise in relation to the deformation amplitude; a maximum is ob-served solely in the case of the foams enriched with 0.6 wt.% XG and 0.6 wt.% IN. The e5/e1 values are negative; however, they rise steadily and become posi-tive for higher amplitudes. The seventh (e7/e1) Chebyshev harmonic has nega-tive values within the entire range of the analyzed concentrations of XG and IN.
Fig. 5.20b displays the normalized viscous Chebyshev coefficients, namely v3/v1, v5/v1, and v7/v1. The values of v3/v1 coefficients, obtained for the foam with egg white protein only, grow initially, until they reach a maximum and then decrease and become negative. This indicates that the foam is shear thickened, and, as soon as it crosses a certain barrier, it is subject to shear thinning. The val-ues of v5/v1 are positive in the early nonlinear area; then they become negative and a plateau is formed. The v7/v1 coefficients behave differently: they initially create a small maximum as a function of amplitude (for negative values), and, subsequently a further maximum is reached within the positive values.
In the case of the foams enriched with IN only, the v3/v1 coefficients do not adopt negative values; rather, they asymptotically approach zero, which indi-cates that the foams are shear thickened and they have a tendency toward pure

120 PART | I Advances in Food Rheology
Newtonian behaviors. The remaining coefficients exhibit behavior similar to that of the foams containing egg white protein only.
The image of Chebyshev coefficients acquired for the foams supplemented with XG only differs from the one previously discussed. The v3/v1 coefficients reach a maximum and as they decline, they adopt negative values. This behavior implies that the foam is subject to shear thickening within a certain range of the deformation amplitudes. Upon crossing a certain level, the foam is subject to shear thinning.
On the other hand, the v5/v1 coefficient adopts negative values, which de-crease steadily within all analyzed concentrations. The v7/v1 coefficient exhibits contrary behavior, as its values invariably increase.
Based on the characteristics analyzed using the Chebyshev method, the foams can be divided into two groups. The first group comprises systems con-taining only inulin and only 0.3 wt.% XG. The second group is composed of foams, whose characteristics are similar to the systems with 0.6 wt.% and 0.9 wt.% XG. Within the nonlinear range, the examined foams’ response is dominated by the viscous properties, which is confirmed by the e1 and v1 val-ues and Chebyshev coefficients, where e1 < v1. This is a direct response to the applied deformation. Further analysis of the nonlinear properties of the dis-cussed systems points to the existence of very complex rheological behaviors. The analysis of e3 and v3 showed that nonlinear viscoelastic properties of the foams depend strongly on the deformation amplitude; moreover, that the e3 and v3 values are strongly related to each other.
This correlation is based on the ability of e3 to reach a maximum for the same γ0 value for which the v3 value changes its sign. The interpretation of the Cheby-shev coefficients based on Eq. 5.6 indicates that all the studied foams exhibited stiffening, which occurred due to the applied deformation: positive values of v3 were also observed, which confirms that the foams are shear thickened. The foams, characterized by the presence of the e3 maximum as a function of the deforma-tion amplitude, exhibited behaviors comparable to those of shear-thinned foams (Fig. 5.19 and 5.20b). The mechanisms of storage and dissipation of energy dur-ing flow in the analyzed foams seem to be the reason for this phenomenon. During shear flow, the bubbles undergo strong deformation, that is, flattening (stretching toward the flow direction), and thereby they store the mechanical energy.
Moreover, the continuous phase is solution of biopolymers with various rheo-logical properties, which also influence the complex nature of the foam. Aqueous solutions of egg white protein, as well as inulin solutions, exhibit characteristics close to a Newtonian liquid, whereas XG solutions demonstrate typical non-New-tonian properties. The overlapping of these two factors leads to the formation of a complex rheological image. The viscous forces (high values of v1) dominate in the response to the applied stress; a direct elastic response to the deformation is also observed. However, its influence is definitely less intensive (e1 ≪ v1). This implies that foams retain residual elastic properties (nonzero values of e1, e3, …) and are capable of accumulating small amounts of mechanical energy.

LAOS Measurement and Fourier-Transform Rheology Chapter | 5 121
The analysis of the third component in the deformation amplitude func-tion leads to the conclusion that the mechanisms responsible for the material’s nonlinear response are characterized by the prevalence of the elastic processes, which influence its ability to accumulate energy. Both strain stiffening, ob-served in the elastic part, and shear thickening, which characterizes the viscous part, confirm the formation of forces in the foam, that are opposed to the pri-mary flow-inducing forces. It results from the accumulation of energy by the deformed air bubbles dispersed in the continuous phase, as well as from the properties of the continuous phase itself.
The presented data demonstrate that the analysis of the nonlinear behaviors of wet food foams may be successfully carried out with the use the LAOS and FCT techniques. The Chebyshev coefficients can be successfully used for the analysis of the properties of viscoelastoplastic foams. The obtained results are characterized by a very high resolution, one that cannot be achieved through conventional rheological methods.
5.4 SUMMARY
The presented test methods provide a comprehensive overview of the nonlinear rheological properties of the analyzed material. This mainly concerns the Fou-rier rheology and the analysis of the Lissajous curves. On one hand, the analysis of the Fourier amplitude spectra demonstrates the complexity of the material’s response to the applied deformation. The presence of the higher odd harmonics in the spectrum clearly determines the nonlinear rheological properties of the material. It is, however, only a qualitative criterion. The formulation of new quantities based on the normalized intensity values of each harmonics allows for their correlation with other physicochemical quantities, such as the size of drops in emulsions (Kallus et al., 2001; Carotenuto et al., 2008). On the other hand, the analysis of the Lissajous curves allows for a visual estimation of the deviation of the material’s behavior from the ideal cases (elasticity, viscosity, plasticity) (Melito et al., 2012). The assessment of the degree of the nonlinear behaviors is in this case much harder. However, the analysis of the areas of the Lissajous figures provides insight into the amount of energy dissipated during one cycle, and allows for the referencing of that energy in relation to a per-fectly plastic material. Moreover, by using the geometrical decomposition and the Chebyshev analysis, it is possible to determine the share and specification of the nonlinear properties, introduced to the rheological response of the stud-ied system. This allows for a hitherto impossible assessment of the material’s behavior in the conditions closely resembling real environment.
Both the Fourier rheology and the Lissajous curves’ analysis carry similar information about the rheological properties of the studied systems. However, by performing the synthesis resulting from the application of both methods, it is possible to obtain a full model of the rheological properties of the material in the nonlinear range.

122 PART | I Advances in Food Rheology
5.5 CONCLUSIONS
It follows from the aforementioned discussion that the LAOS methods are quite useful in the analysis of the rheological properties of the nonlinear behaviors of soft matter. This means that these techniques can successfully be applied to the analysis of the properties of foods. The discussed methods are gather-ing popularity among the researchers, due to the possibility of describing very weak interactions occurring in the test material. The opportunity of testing such behaviors is very valuable, as it allows for an explanation of behavior anomalies observed in a number of soft matter systems, during shear flow. The methods of linear viscoelasticity, and SAOS methods in particular, are very well established in the literature. A number of monographs, as well as science paper publica-tions, are dedicated to them specifically. They have become a standard tool for the description of the mechanical characteristics of soft matter, and as nonde-structive tests, are used to determine the basic material constants. Advances in the construction of rotary rheometres have allowed for a natural extension of the measurement range to the nonlinear range. This has resulted in further advance-ment of knowledge concerning the nonlinear rheological behaviors occurring in foods. The LAOS tests are slowly becoming another research tool and one might assume that the near future will bring about their further development and an extension of their application range. These techniques are still in the develop-ment stage, and we can observe their gradual introduction into studies of foods. For that reason, a relevant validation of these methods is required, and further studies on the interpretation of the obtained measurement data should be con-tinued. The interpretation must cover both the confrontation of the experiment data results with the outcomes of theoretical studies, concerning phenomeno-logical analysis, as well as the molecular scale. This approach can also be ex-tended to the pairing of the rheological methods with the methods of structural studies. This concerns mainly the methods of electromagnetic radiation diffu-sion in the range of small angles, but can also involve dielectric/electrical and spectroscopic measurements in the infrared range.
REFERENCES
Boyd, J.P., 2001. Chebyshev and Fourier Spectral Methods, second revised ed. Springer, Berlin. Carotenuto, C., Massimiliano, G., Maffetone, P.L., 2008. Fourier transform rheology of dilute im-
miscible polymer blends: a novel procedure to probe blend morphology. Macromolecules 41, 4492–4500.
Cho, K.S., Hyun, K., Ahn, K.H., Lee, S.J., 2005. A geometrical interpretation of large amplitude oscillatory shear response. J. Rheol. 49, 747–758.
Cooley, J.W., Tukey, J.W., 1965. An algorithm for the machine calculation of complex Fourier series. Math. Comput. 19, 297–301.
Ewoldt, R.H., Hosoi, A.E., McKinley, G.H., 2008. New measurements for characterizing nonlinear viscoelasticity in large amplitude oscillatory shear. J. Rheol. 52 (8), 1427–1458.
Ewoldt, R.H., McKinley, G.H., 2010. On secondary loops in LAOS via self-intersection of Lis-sajous–Bowditch curves. Rheol. Acta 49 (2), 213–219.

LAOS Measurement and Fourier-Transform Rheology Chapter | 5 123
Ewoldt, R.H., Winter, P., Maxey, J., McKinley, G.H., 2010. Large amplitude oscillatory shear of pseudoplastic and elastoviscoplastic materials. Rheol. Acta 49 (2), 191–212.
Fuongfuchat, A., Seetapan, N., Makmoon, T., Pongjaruwat, W., Methacanon, P., Gamonpilas, C., 2012. Linear and non-linear viscoelastic behaviours of crosslinked tapioca starch/polysaccha-ride systems. J. Food Eng. 109 (3), 571–578.
Hyun, K., Nam, J.G., Wilhellm, M., Ahn, K.H., Lee, S.J., 2006. Large amplitude oscillatory shear behavior of PEO-PPO-PEO triblock copolymer solutions. Rheol. Acta 45 (3), 239–249.
Hyun, K., Wilhelm, M., 2009. Establishing a new mechanical nonlinear coefficient Q from FT-rheology: first investigation of entangled linear and comb polymer model systems. Macromol-ecules 42 (1), 411–422.
Hyun, K., Wilhelm, M., Klein, Ch.O., Cho, K.S., Nam, J.G., Ahn, K.H., Lee, S.J., Ewoldt, R.H., McKinley, G.H., 2011. A review of nonlinear oscillatory shear tests: analysis and application of large amplitude oscillatory shear (LAOS). Prog. Polym. Sci. 36 (12), 1697–1753.
Kallus, S., Willenbacher, N., Kirsch, S., Distler, D., Neidhofer, T., Wilhelm, M., Spiess, H.W., 2001. Characterization of polymer dispersions by Fourier transform rheology. Rheol. Acta 40, 552–559.
Klein, C., Spiess, H.W., Calin, A., Balan, C., Wilhelm, M., 2007. Separation of the non-linear oscil-latory shear response, into a superposition of linear, strain hardening, strain softening and wall slip response. Macromolecules 40, 4250–4259.
Marze, S., Guillermic, R.M., Saint-Jalmes, A., 2009. Oscillatory rheometry of aqueous foams: sur-factant, liquid fraction, aging and protocol effects. Soft Matter 5, 1937.
Melito, H.S., Daubert, C.R., Foegeding, E.A., 2012. Validation of a large amplitude oscillatory shear protocol. J. Food Eng. 113 (1), 124–135.
Miyazaki, K., Wyss, H.M., Weitz, D.A., Reichman, D.R., 2006. Nonlinear viscoelasticity of meta-stable complex fluids. Europhys. Lett. 75, 915.
Ptaszek, P., 2013. The non-linear rheological properties of fresh wet foams based on egg white proteins and selected hydrocolloids. Food Res. Int. 54 (1), 478–486.
Ptaszek, P., 2014. Large amplitudes oscillatory shear (LAOS) behaviour of egg white foams with apple pectins and xanthan gum. Food Res. Int. 62, 299–307.
Ptaszek, P., Kabziński, M., Ptaszek, A., Kaczmarczyk, K., Kruk, J., Bieńczak, A., 2016. The analy-sis of the influence of xanthan gum and apple pectins on egg white protein foams using the large amplitude oscillatory shear. 54B, 293–301.
Reinheimer, K., Grosso, M., Hetzel, F., Kübel, J., Wilhelm, M., 2012. Fourier transform rheology as an innovative morphological characterization technique for the emulsion volume average radius and its distribution. J. Colloid Interface Sci. 380 (1), 201–212.
Reinheimer, K., Grosso, M., Wilhelm, M., 2011. Fourier transform rheology as a universal non-linear mechanical characterization of droplet size and interfacial tension of dilute monodisperse emulsions. J. Colloid Interface Sci. 360 (2), 818–825.
Rouyer, F., Cohen-Addad, S., Höhler, R., 2005. Is the yield stress of aqueous foam a well-defined quantity? Colloids Surf. A 263, 111–116.
Sollich, P., Lequeux, F., Hébraud, P., Cates, M.E., 1997. Rheology of soft glassy materials. Phys. Rev. Lett. 78, 2020–2023.
Wilhelm, M., Reinheimer, K., Kübel, J., 2012. Optimizing the sensitivity of FT-rheology to quantify and differentiate for the first time the nonlinear mechanical response of dispersed beer foams of light and dark beer. Z. Phys. Chem. 226, 547–567.
Wilhelm, M., Reinheimer, P., Ortseifer, M., 1999. High sensitivity Fourier-transform rheology.
Rheol. Acta 38, 349–356.

125Advances in Food Rheology and Its Applications. http://dx.doi.org/10.1016/B978-0-08-100431-9.00006-1Copyright © 2017 Elsevier Ltd. All rights reserved.
Chapter 6
Extensional Rheology in Food Processing
S. RózanskaDepartment of Chemical Engineering and Equipment, Faculty of Chemical Technology, Poznan University of Technology, Poznan, Poland
6.1 INTRODUCTION AND BASIC CONCEPT
There are three basic types of extensional (or elongational) flows: uniaxial, biaxial, and planar (Fig. 6.1). In the uniaxial extensional flow, a material is stretched in one direction with a simultaneous reduction of the dimensions of that material in the two remaining directions. In the biaxial extensional flow, a material is stretched in two directions, with a change in sample thickness in the third direction. Finally, in the planar extensional flow, a material is contracted or elongated in one direction, which results in a change in its thickness (the width remains unaffected) (Ferguson and Kembłowski, 1991).
In the steady-state extensional flow in Cartesian coordinates, the velocity field of the elongational flow can be generally expressed as
ε ε ε= = =v x v y v zx y z1 2 3 (6.1)
where ε1 , ε2 , and ε3 are the velocity gradients in x, y, and z directions:
ε ε ε=∂∂
=∂∂
=∂∂
v
x
v
y
v
zx y z
1 2 3
(6.2)
An extensional flow is steady if the velocity gradients ε1 , ε2 , and ε3 are constant. The rate of strain tensor D for the steady-state extensional flow field can be described as
εε
ε=
0 00 00 0
1
2
3
D
(6.3)
vx=ε˙1x vy=ε˙2y vz=ε˙3z
ε˙1ε˙2ε˙3
ε˙1=∂vx∂x ε˙2=∂vy∂y ε˙3=∂vz∂z
ε˙1ε˙2ε˙3
D=ε˙1000ε˙2000ε˙3

126 PART | I Advances in Food Rheology
Let us consider the steady-state uniaxial extensional flow. Uniaxial elonga-tion is a symmetrical flow, so vy = vz and ε ε=2 3 . Based on the continuity equa-tion for incompressible liquids (ρ = const):
+ + =dv
dx
dv
dy
dv
dz0x y z
(6.4)
we obtain the relationship:
ε ε ε ε= − = − =2 21 2 3 (6.5)
and the rate of strain tensor D assumes the form:
εε
ε= −
−
0 00 2 00 0 2
D
(6.6)
where ε is the velocity gradient in the direction of stretching (referred to as the extension—or elongation—rate).
Similar considerations can be applied to the equal biaxial extension and pla-nar extension. For the equal biaxial extension, the rate of strain tensor D can be expressed as (Barnes et al., 1993)
εε
ε=
−
0 00 00 0 2
B
B
B
D
(6.7)
ε˙2=ε˙3
dvxdx+dvydy+dvzdz=0
ε˙1=−2ε˙2=−2ε˙3=ε˙
D=ε˙000−ε˙/2000−ε˙/2
ε˙
D=ε˙B000ε˙B000−2ε˙B
FIGURE 6.1 Extensional flow types. (a) Uniaxial, (b) biaxial, (c) planar.

Extensional Rheology in Food Processing Chapter | 6 127
and for the planar extension as
ε
ε=
−
0 00 0 00 0
P
P
D
(6.8)
A formal definition of extensional viscosity of an incompressible ma-terial subjected to a set uniaxial elongation is described with the equation (Dealy, 1984):
η ε σ εε
=
→∞
t( ) lim
( , )t
EE
(6.9)
where σE is the “net tensile stress” (normal stress difference):
σ σ σ σ σ≡ − = −xx yy xx zzE (6.10)
σxx, σyy, and σzz are normal stress components of stress tensor σ:
σ σ σσ σ σσ σ σ
σσ =
xx xy xz
yx yy yz
zx zy zz
(6.11)
In the case of uniaxial tensile the shear stress components (σxy, σyx, σxz, σzx, σzy and σyz) are equal to zero (details of the tensor calculus reader may find in the positions: Ferguson and Kembłowski (1991).
The term “net tensile stress” means that the measured stress is adjusted in accordance with the equation (Petrie, 2006):
σ = −Applied force
Area
Coefficient of surface
RadiusE
(6.12)
It follows from the definition described by Eq. 6.9 that at a given relative strain rate the “true” value of extensional viscosity is an equilibrium value.
The equibiaxial extensional viscosity ηB and the planar extensional viscos-ity ηP are defined analogically (Petrie, 2006):
η ε σ σε
=−
( ) xx zzB
B
(6.13)
η ε σ σε
=−
( ) xx zzP
P
(6.14)
D=ε˙P0000000−ε˙P
ηE(ε˙)=limt→∞σE(t,ε˙)ε˙
σE≡σxx−σyy=σxx−σzz
σ=σxxσxyσxzσyxσyyσyzσzxσzyσzz
σE=Applied forceArea−Coefficient of sur-faceRadius
ηB(ε˙)=σxx−σzzε˙B
ηP(ε˙)=σxx−σzzε˙P

128 PART | I Advances in Food Rheology
It is also possible to demonstrate in simple terms the relationship between extensional viscosity and shear viscosity, starting from a generalized descrip-tion of a Newtonian fluid (Mackley, 2010):
ησσ = − +I Dp 2 (6.15)
where σ is the total stress tensor, p is the isotropic pressure, and I is the devia-toric identity matrix. For a set uniaxial extensional flow of a Newtonian fluid, Eq. 6.15 can be reduced to the relationship:
σ ηε
εε
= − ⋅
+ ⋅ −−
p1 0 00 1 00 0 1
2 0 00 00 0
(6.16)
The normal components of the stress tensor are, respectively,
σ ηε= − +p 2xx (6.17)
σ σ ηε= = − −pyy zz (6.18)
and hence
σ σ ηε− = 3xx yy (6.19)
Based on Eq. 6.9 defining extensional viscosity ηE, and Eq. 6.19, the follow-ing relationship is obtained:
η η= 3E (6.20)
Eq. 6.20 was first proposed by Trouton (1906). To commemorate the con-tribution of the researcher, extensional viscosity is sometimes referred to as the Trouton viscosity, and the ratio between the uniaxial extensional viscosity and shear viscosity as the Trouton number (or ratio).
It has also been found that for the equal biaxial flow and the planar extension flow of Newtonian fluids the relationships between extensional viscosity and shear viscosity are expressed by (Barnes, 2000)
η η= 6B (6.21)
η η= 4P (6.22)
In the case of non-Newtonian fluids, the Trouton number is also calculated as the ratio of extensional viscosity to shear viscosity, whereby ηE and η are determined at the same strain rate (ε γ= ):
η εη γ
=Tr( )
( )E
(6.23)
σ=−pI+η2D
σ=−p⋅100010001+η⋅2ε˙000−ε˙000−ε˙
σxx=−p+2ηε˙
σyy=σzz=−p−ηε˙
σxx−σyy=3ηε˙
ηE=3η
ηB=6η
ηP=4η
ε˙=γ˙
Tr=ηE(ε˙)η(γ˙)

Extensional Rheology in Food Processing Chapter | 6 129
The values of the Tr number for viscoelastic fluids can be very high; for example, for diluted solutions of flexible-chain polymers they can reach 1000.
Jones et al. (1987) proposed that the value of the TrB ratio for non-Newto-nian fluids be calculated from the relationship:
Tr( )
( 3 )B
E
η εη ε
=
(6.24)
where shear viscosity η is defined at the shear rate calculated as ε3 . Jones et al. (1987) demonstrated that the values of the Trouton number calculated from Eq. 6.24 for inelastic and isotropic non-Newtonian fluids were equal to 3 over the entire range of strain rate changes. A deviation of the TrB number from this value points to the effect of elastic properties on extensional viscosity. The analysis conducted by Jones et al. (1987) also shows that a purely viscous fluid affected by shear thinning should also be affected by extension thinning. Any deviations from the rule are associated with elastic properties of the fluid.
6.1.1 The General Outline of the Extensional Flow and Applications in Food Processing
6.1.1.1 Extensional Flow in Food IndustryExtensional viscosity of liquid foods is important in structural characterization, process design calculations, process and quality control of products, process modeling, and sensor perception (Masocko, 1994). The polymeric nature of food components such as proteins and polysaccharides extends extensional vis-cosity as a useful rheological property for the characterization of foods. The existence of an extensional component in the flows occurring during process-ing necessitates extensional viscosity data for process modeling calculations. For example, pressure-driven flows through heat exchangers and extruders involve sudden changes in the geometry resulting in an extensional compo-nent: dough sheeting, extrudate expansion due to sudden water evaporation, and fiber spinning of soy and milk proteins are all operations which possess an extensional component (Padmanabhan, 1995). Examples of the occurrence of extensional flows are shown in Fig. 6.2. In daily life we can observe exten-sional flows during such activities as spreading of butter or roll on bread a knife, mouth-feel and swallowing of beverages, sucking of a beverage through a straw (Padmanabhan, 1995) (Fig. 6.3).
Stretching of fluid also occurs during the spraying of liquids and their flow through the porous bed. The effect of extensional viscosity of fluids on the for-mation of droplets has been extensively examined in the literature (Thompson and Rothstein, 2007; Fernando et al., 2000; Dexter, 1996; Ergungor et al., 2006; Mun et al., 1999). A qualitative assessment of the results shows that the effect of adding a polymer to a solution is to retard the final break up of the jet, and the formation of satellite drops, which increases the main droplet size. For many
TrB=ηE(ε˙)η(3ε˙)S
3ε˙

130 PART | I Advances in Food Rheology
instances a qualitative assessment is available to predict the outcome. The im-plication for the atomization of such fluids is that a polymer additive is likely to increase the mean droplet size, but may retard the formation of a spray, to the point where a rope of fluid is formed (Mun et al., 1999).
In the case of the flow of liquids through porous media the coexistence of shear and extensional components has been presented. Pure shear or elonga-tional flow is the exception in practical situations. In most situations mixed flow occurs where deformation rates have components parallel and perpendicular to the principal flow direction. In such flows, the elongational components may be associated with the converging–diverging flow paths (Sochi, 2010). A gen-eral consensus has emerged recently that the flow through packed beds has a substantial extensional component and typical polymer solutions exhibit strain
FIGURE 6.2 Examples of extensional flows. (a) Sheet stretching, (b) extruder die, (c) calendaring.
FIGURE 6.3 Examples of extensional flows. (a) Sucking of a beverage through a straw, (b) spreading of roll on bread.

Extensional Rheology in Food Processing Chapter | 6 131
hardening in extension, which is one of the main factors for the reported dra-matic increases in pressure drop. Thus, in principle, the shear viscosity alone is inadequate to explain the observed excessive pressure gradients (Chhabra et al., 2001). From the aforementioned reasons, the extensional flows are impor-tant from the viewpoint of processes such as sedimentation (Arigo et al., 1995), fluidization (Chhabra et al., 2001), flow of fluids through granular beds (Chhabra et al., 2001), and liquid filtration (Dehghanpour and Kuru, 2011).
6.1.2 Measurement of Extensional Rheology
Section 6.1 specifies the definitions of the uniaxial extensional viscosity, equal biaxial extensional viscosity, and planar extensional viscosity. However, the definitions do not provide how to perform extensional viscosity measurements. In practice, measurements of the equal biaxial extensional viscosity and planar extensional viscosity are carried out very rarely and mostly for molten poly-mers. For these reasons, only the case of the uniaxial extensional flow will be discussed.
Let us consider a set uniaxial elongation of a cylindrical fluid sample with the initial length L0 and the initial radius R0 under the influence of the applied force F (Fig. 6.4) (Dziubinski et al., 2009):
The extensional rate can be expressed with the equation:
ε ε=
d
dt
(6.25)
where dε is the differential strain of the sample
ε =ddL
L (6.26)
hence
ε = ⋅ =L
dL
dt
v
L
1 2 x
(6.27)
ε˙=dεdt
dε=dLL
ε˙=1L⋅dLdt=2vxL
FIGURE 6.4 Uniaxial stretching sample.

132 PART | I Advances in Food Rheology
where vx is the rate of movement of sample ends. A transformation of the equa-tion produces the relationship:
ε= ⋅dL
Ldt
(6.28)
which—after its integration in the range from L0 to L—yields
= ε⋅L L e t0
(6.29)
It follows from Eq. 6.29 that the length of the sample rises exponentially. The logarithmic relationship between the strain ε and sample length is referred to as the Hencky strain (Dziubinski et al., 2009):
ε ε= ⋅ =tL
Lln
0
(6.30)
According to Eq. 6.27 and 6.29, if the condition of the constant value of ε is to be preserved, the velocity at which sample ends are moving must rise exponentially:
ε ε= ⋅ ⋅ ⋅ ε⋅v L L e1
2
1
2x
t0
(6.31)
In the discussed case, the net tensile stress will be defined as the normal stress difference
σ σ σ= − =F
Axx rrE
(6.32)
It should be noted that during the stretching both area A and force F change with time. Simultaneously, if the material being stretched is incompressible, the volume of the sample during elongation is constant, hence:
⋅ = ⋅A L A t L t( ) ( )0 0 (6.33)
Calculating the surface area A(t) from Eq. 6.33 and considering the fact that the length of the sample L(t) changes as a function of time in accordance with Eq. 6.29, simple transformations yield the equation describing the relationship between the net tensile stress and time:
σ =⋅ ε⋅F e
A
t
E0
(6.34)
The ratio of σE to ε is referred to as the tensile stress growth coefficient (Dealy, 1984; Steffe, 1996):
η εε
=⋅
⋅
ε+
⋅t
F e
A( , )
t
E0
(6.35)
dLL=ε˙⋅dt
L=L0eε˙⋅t
ε=ε˙⋅t=lnLL0
ε˙
vx=12ε˙⋅L=12ε˙⋅L0⋅eε⋅t
σE=σxx−σrr=FA
A0⋅L0=A(t)⋅L(t)
σE=F⋅eε˙⋅tA0
ε˙
ηE+(t,ε˙)=F⋅eε˙⋅tA0⋅ε˙

Extensional Rheology in Food Processing Chapter | 6 133
The tensile stress growth coefficient is equal to extensional viscosity if
η ε η ε=→∞
+ t( ) lim ( , )t
E E
(6.36)
From Eq. 6.36 it follows that at a given relative strain rate the true value of extensional viscosity is an equilibrium value (Dealy, 1984). Ensuring equilib-rium conditions is very difficult and possible only in approximation—in the case of liquids of very high viscosity, above 1000 Pa·s (Ferguson et al., 1997), so that a test sample does not rapidly change its shape and does not break dur-ing elongation.With low-viscosity liquids (<100 Pa·s), achieving equilibrium experimental conditions is impossible in practice. According to Ferguson and Kembłowski (1991), methods for measuring extensional viscosity can be di-vided into two categories:
a) controllable experiments—in which certain flow parameters are set and oth-ers are measured; essentially, this category of experimental methods can be used for studying liquids of high viscosity,
b) noncontrollable experiments—in which all parameters must be measured; methods from this category are applied chiefly for measurements of exten-sional viscosity of low-viscosity liquids.
In currently available rheometers, measurements of extensional viscosity are typically based on uniaxial or biaxial extensional flow or compression of a liq-uid sample. Fig. 6.5 presents the scope of applicability of measurement methods depending on zero shear viscosity values of solutions.
In the group of experiments that cannot be controlled, there are three main types of flows (Ferguson and Kembłowski, 1991):
l fiber spinning (stretching the fluid extruded from a nozzle or suction to a nozzle),
l stagnation flows (eg, four-roll mill, opposed jets),l converging flows and flow through an abrupt contraction.
Due to the lack of possibility of attaining equilibrium conditions, experi-ments of this type can only yield apparent extensional viscosity values.
ηE(ε˙)=limt→∞ηE+(t,ε˙)
FIGURE 6.5 Range of zero-shear viscosity and used method for determination of extensional viscosity.

134 PART | I Advances in Food Rheology
6.1.2.1 Filament Stretching RheometerControllable experiments can be performed, for example, using test apparatuses in which a sample is fixed at the ends of specially designed clamps which are then moved (Fig. 6.6).
By employing a control system, it is possible to deform a test sample at a constant stress or at a constant relative strain rate. The disadvantage of the solu-tion, however, is the limited scope of achievable relative strain due to the size of the device.The majority of currently produced rotational rheometers designed for normal stress measurements can be additionally fitted with appropriately de-signed clamps for measuring apparent extensional viscosity (Masocko, 1994). Such additional fittings are suitable primarily for determining rheological prop-erties of molten polymers.
Another solution is the apparatus with a pair of rotating cylinders designed by Meissner (1985). A test sample is held between two pairs of rotating cylin-ders, as shown in Fig. 6.7.
FIGURE 6.6 Stretch of samples with use of mobile clamps.
FIGURE 6.7 Apparatus for stretching molten polymers according to the Meissner. 1, Stretch-ing sample; 2, rotating cylinders; 3, engine; 4, spring; 5, measuring sensor.

Extensional Rheology in Food Processing Chapter | 6 135
The advantage of the apparatus is that it can be programmed for a con-stant elongation rate more easily than devices with fixed clamps. Since the test sample has a constant length L0, knowing the angular velocity of the rotating cylinders Ω and their radius Rc, it is possible to determine the strain rate using (Masocko, 1994)
ε =Ω + Ω ⋅ R
L
( ) c1 2
0
(6.37)
if the clamps at both ends of the sample rotate.Since the cross-sectional area of the sample decreases exponentially, tensile
stress can be determined from
σ =⋅
π ⋅
εF e
R
t
E02
0
(6.38)
The main advantage of Meissner’s rheometer is the possibility of obtaining high relative strain values of the material being elongated, as the length of the sample remains constant.
A disadvantage of the method is that it requires complex control systems if experiments are to be conducted at a set stress value, and longer test sam-ples (70÷700 mm) than in measurements performed with the method of sliding clamps (10 mm) (Masocko, 1994). Another problem related to the apparatus with rotating cylinders is slip at the clamp surface. Meissner (1969, 1985) speci-fied that the speed of test sample ends was between 8% and 10% lower than the speed resulting from the rotation speed of the cylinders. The aforementioned method has a number of variants. For example, a test sample can be wound on a rotating rod or multiple rods (Masocko, 1994).
6.1.2.2 Fiber SpinningAn example of a device based on the property of spinnability is the spin-line rheometer shown in Fig. 6.8. Liquid flowing through a thin-walled tube (Bour-don tube) is pumped from a nozzle mounted at the end of the tube. The flowing filament is wound up and elongated by a rotating drum. The force affecting the thin-walled tube is measured based on its deflection. In addition, the elongated filament is photographed along the entire length (Masocko, 1994).
The photographs are a basis for determining filament diameter, which allows the calculation of stress and extensional rate. Extensional stress can be deter-mined from (Masocko, 1994)
∫σπ
ρ ρ=⋅
−⋅
+ ⋅ −ΓF
R
g
RR dx v
R' x
x
Eo
2 22 2
0 (6.39)
particular members of the equation are, respectively, the total measured tension, gravity, inertia, and surface tension where Fo is the stretching force, R is the
ε˙=(Ω1+Ω2)⋅RcL0
σE=F⋅eε˙0tπ⋅R02
σE=Foπ⋅R2−ρ⋅gR2∫0xR2dx'+ρ⋅vx2−ΓR

136 PART | I Advances in Food Rheology
radius, Γ is the interfacial tension, ρ is the density of fluid, and g is the gravita-tional acceleration.
The terms of Eq. 6.39 represent total measured stress, and gravitational, in-ertial, and surface tension forces, respectively. Extensional rate can be calcu-lated using the relationship:
επ
= −⋅
⋅Q
R
dR
dx
23
(6.40)
The main advantage of the method is the possibility of using relatively sim-ple apparatus suitable for studying molten polymers, polymer solutions, and suspensions, whose viscosity exceeds 1 Pa·s. The elongation rates that can be achieved vary between 10 and 1000 s−1. Another important benefit is the pos-sibility of simulating the process of filament elongation.
ε˙=−2Q˙π⋅R3⋅dRdx
FIGURE 6.8 Spin-line rheometer. 1, Thin-walled tube (Bourdon tube); 2, nozzle; 3, stretching sample; 4, rotating shaft.

Extensional Rheology in Food Processing Chapter | 6 137
6.1.2.3 Tubeless SyphonAnother measurement method based on the filament-spinning ability of liquids is the tubeless siphon (Fig. 6.9) referred to as Fano flow. In this case, liquid is sucked from a tank by a nozzle (2). For the purpose of establishing extensional stress, the deflection of the thin-walled tube (1) is measured by a transducer (Masocko, 1994).
In order to estimate the elongation rate, it is necessary to determine the shape of the siphon profile on the basis of a photograph, and the liquid flow rate. The equations provided for the spin-line remain essentially valid also in this case, with the gravitational force component having a positive sign. The main advantages of the tubeless siphon over the case shown in Fig. 6.9 are higher relative strain values which can be achieved (up to around 4, which results from liquid being sucked from a large tank) and the fact that liquid is not presheared in the tube (only slow circulating motions are observed in the tank). The chief disadvantages of the system include frequent flow instability and accumulation of liquid around the inlet nozzle. The maximum relative strain rate is limited by the attainable vacuum level.
6.1.2.4 Stagnation Point Flows (Four-Roll Mill, Opposed Jets)The next group of methods for investigating extensional deformation is based on stagnation flows. The stagnation flow is induced by colliding two jets at an angle of 90o. The considerable interest in stagnation flows results mainly from
FIGURE 6.9 Tubeless syphon. 1, Thin-walled tube; 2, nozzle; 3, sucked of fluid.

138 PART | I Advances in Food Rheology
the fact that extensional strain achieves extremely high values at stagnation point (Masocko, 1994). Consequently, it is possible to attain a high orientation of molecules or macromolecules at least in this part of the flow. The stagnation flow can be obtained relatively easily in low-viscosity liquids.
There are three variants of the stagnation flow of apparent extensional vis-cosity measurements (Figs. 6.10 and 6.11). They are
l four-roll mill,l the flow in the slot nozzle,l opposed nozzles.
The four-roll mill and slot nozzle produce planar stagnation flow near the center. They are applicable particularly in investigations of rheological prop-erties in the extensional flow of molten polymers. The most commonly used
FIGURE 6.10 Examples of stagnation flows. (a) Four-roll mill, (b) slot nozzle.
FIGURE 6.11 Opposed jets. 1, Nozzles; 2, liquid outlet pipes; 3, pivot.

Extensional Rheology in Food Processing Chapter | 6 139
system has two opposed nozzles (Fig. 6.11). The solution makes it possible to measure apparent extensional viscosity of liquids with a viscosity level below 10 Pa·s (Dontula et al., 1997).
Two methods have been developed for measuring apparent extensional viscos-ity in a stagnant flow of a liquid between two opposed nozzles (Keller et al., 1987; Chow et al., 1988). One of them is based on measurements of pressure drop during liquid sucking by the nozzles. The other, developed by Fuller et al. (1987), relies on torque measurements. The solution is shown schematically in Fig. 6.11.
A tank filled with a test liquid has two nozzles placed opposite each other. A stagnation flow is induced when liquid is sucked by both nozzles. The stagna-tion area is marked with a dashed line. In order to determine stress, one arm is mounted on a joint, enabling torque measurements.
Assuming that the flow is purely extensional, the value of apparent exten-sional viscosity is calculated from
ηε π
=⋅ ⋅ ⋅
=⋅M
R L
F h
Qa,E 2
(6.41)
where M is the torque, L is the arm length, h is the half distance between the nozzles, R is the radius of nozzles, and Q is the flow rate. Naturally, strain and strain rate are not constant in stagnation flows. Therefore, calculations rely on the concept of apparent strain rate εa in a cylindrical test area which is expressed by the relationship:
επ
=⋅
⋅ ⋅Q
R d
2a 2
(6.42)
In Eq. 6.42, d is the distance between the ends of the nozzles. Fuller et al. (1987) first performed measurements of the apparent viscosity of the extension-al fluid of very low viscosity (less than 1 Pa·s). These were aqueous solutions of glycerol (Newtonian fluids), xanthan gum, and polyacrylamide with the ad-dition of glycerol. The values of the Trouton ratio for Newtonian fluids ranged from 2.25 to 3.6.
The basic drawback of the solution is the lack of a fully homogeneous flow. “Almost pure” elongation is observed only near the stagnation area, whereas the parts along the nozzle walls are dominated by shear.
6.1.2.5 Converging and Contraction FlowsOther approximate methods used for determining apparent extensional viscosity are based on the converging flows and flow through an abrupt contraction (Fig. 6.12).
In the latter case, the efflux of a liquid though a orifice from a tank is usually applied. Such flows demonstrate liquid elongation along the axis of symmetry, and shear along the wall. Convergent flows are most commonly employed for determining apparent extensional viscosity of liquids exhibiting very high vis-cosity, mostly molten polymers. To minimize the effect of shear on pressure
ηa,E=Mε˙⋅π⋅R2⋅L=F⋅hQ˙
Q˙
ε˙a
ε˙a=2⋅Q˙π⋅R2⋅d

140 PART | I Advances in Food Rheology
drop measurements, duct walls are often coated with oil. Although the method only gives approximate results, it is quite popular, particularly in plastic pro-cessing. A benefit of the method is that measurements can be conducted with a capillary rheometer or with extruders, after relatively simple adjustments.
The literature contains several models that allow the determination of appar-ent extensional viscosity by measuring pressure drop accompanying liquid flow through a orifice. The models which have found the widest practical applica-tions are those proposed by Metzner et al. (1970) (so-called sink flow), Cog-swell (1972), and Binding (1998). The model developed by Metzner et al. (1970) rests on the assumption that only pure elongation is observed during liquid flow through a orifice. As a consequence, the model is only suitable for situations in which the effect of shear stresses on pressure drop pe is negligibly small. Additionally, to calculate the elongation rate, it is necessary to experimentally determine angle θ (Fig. 6.13). The measurement of angle θ requires complex anemometric techniques, and can only be performed for transparent liquids.
The most popular method employed for assessing extensional viscosity of liquids flowing through a narrowing makes use of equations derived from the analysis performed by Cogswell (1972). In the method, tensile stress and exten-sional rate are defined with the following formulas:
σ ( )= ⋅ + ⋅n p3
81E e
(6.43)
ε η γ= ⋅
+⋅
n p
4
3 1a2
e
(6.44)
where pe is the entry pressure into the orifice and γ a is the nominal shear rate, defined by
γ =U
d
8a
(6.45)
where U is the volumetric average velocity, d is the diameter of the die, and
σE=38⋅n+1⋅pe
ε˙=43⋅ηn+1⋅γ˙a2pe
γ˙a
γ˙a=8Ud
FIGURE 6.12 Changing the wire cross-section. (a) Flow through an abrupt contraction, (b) converging flow.

Extensional Rheology in Food Processing Chapter | 6 141
n is the flow behavior index in power-law equation,
η γ= ⋅ −k n 1 (6.46)
The apparent extensional viscosity of the Cogswell method is determined by
η σε η γ
( )= = ⋅
+⋅
n p9
32
1E
E2
e
a2
(6.47)
Binding (1991) conducted an analysis of the flow dynamics of liquids in the jet contraction area on the basis of minimization of viscous dissipation of energy. An illustrative diagram explaining the designations found in Binding’s model is shown in Fig. 6.13. As opposed to Cogswell, Binding also included Weissenberg–Rabinowitsch correction in his studies (Zatloukal et al., 2002). Binding’s analysis (Binding, 1998) applies to cases in which apparent exten-sional viscosity curves of a liquid can be described by the power-law equation:
η ε= ⋅ −l jE
1 (6.48)
In such a case, the relationship between the drop of pressure into the orifice pe and shear rate as well as parameters characterizing the rheological properties of liquids (k, n, l, j) is defined by
γ α=⋅ ⋅ +
⋅ ⋅ +⋅ ⋅ + ⋅ ⋅
⋅ ⋅ −
+⋅ +
+⋅ ⋅ +
+pk j
j n
l j n n I
k
2 (1 )
3 (1 )
(3 1)1
jnt j
j n
jj n
je
2
2 2
1
1
w
( 1)
( 1)3 ( 1)
( 1)
(6.49)
η=k⋅γ˙n−1
ηE=σEε˙=932⋅n+12η⋅peγ˙a2
ηE=l⋅ε˙j−1
pe=2⋅k⋅(1+j)23⋅j2⋅(1+n)2l⋅j⋅(3n+1)⋅nj⋅Intk11+j⋅γ˙wj⋅(n+1)(j+1)⋅1−α3⋅j
⋅(n+1)(j+1)
FIGURE 6.13 Schematic diagram explaining designation in the Binding model.

142 PART | I Advances in Food Rheology
In Eq. 6.49 shear rate, α parameter and integral of Int are described by rela-tionship:
γ =+
⋅n
n
U
d
3 1
4
8w
(6.50)
α =R
R0
1 (6.51)
∫ φ φ φ= −+
⋅
⋅+
+
In
ndabs 2
3 1nt
n
j1
1
0
1 1
(6.52)
Using the correlations obtained by Binding (1991, 1998), Zatloukal et al. (2002) developed equations which are suitable for calculating elongation stress:
σ =⋅ ⋅ ⋅ ++ ⋅ +
⋅− j n
n j
p
I
2 3 (1 )
(3 1) (1 )
j
nkE
1 2
2e
(6.53)
and extensional rate:
ε η γ=+ ⋅ +
⋅ ⋅ +⋅ ⋅ ⋅
⋅ +⋅
n j
j n p
n
n
(3 1) (1 )
3 (1 )
3 1
4
n2
2 2e
w2
(6.54)
Eqs. 6.53 and 6.54 refer to the pipe axis.Based on experimental data, it was found that Eq. 6.54 does not give correct
results when applied to the extrusion of viscoelastic liquids. In later studies, Binding (1991) proposed the following relationship for calculating adjusted en-trance pressure loss:
= +− ⋅ +
⋅ ⋅ + + ⋅ + +⋅
+
+ +p pn n
n n p n pN
(3 1) (3 1)
3 2 (2 1) (3 2)
p
p pe*
e
2
1 2 1 1
(6.55)
Eq. 6.55 is valid on the assumption that the relationship between the first normal stresses difference N1 and shear rate can be described by the power-law equation:
γ= ⋅ +N m p1
1 (6.56)
To use Eq. 6.49, it is necessary to know the exponent j. Binding and Walters (1988) suggested deriving the exponent from the equation pe = f(γ a ) which for the laminar flow range can be expressed as
γ= ⋅p A he
(6.57)
γ˙w=3n+14n⋅8Ud
α=R0R1
Int=∫01abs2−3n+1n⋅φ1+1nj+1⋅φdφ
σE=2j−1⋅3⋅j⋅(1+n)2(3n+1)⋅(1+j)2⋅peInk
ε˙=(3n+1)⋅(1+j)23⋅j2⋅(1+n)2⋅ηpe⋅γ˙w2⋅3⋅n+14⋅nn
pe*=pe+(3n−1)⋅(3n+1)p+23np+1⋅22p+1⋅(2n+p+1)⋅(3n+p+2)⋅N1
N1=m⋅γ˙p+1
γ˙a
pe=A⋅γ˙h

Extensional Rheology in Food Processing Chapter | 6 143
Knowing the exponent h, rheological parameter j can be calculated from the relationship:
=+ −
jh
n h1 (6.58)
By applying Binding’s model (Binding, 1998), it is possible to calculate the length of the vortex LV in the corner of the tank also by knowing rheological parameters:
γ α α=+
⋅ + ⋅ − −⋅
+
⋅ ⋅ −
⋅+
−+
− −+L
R
j
n j n
l n jn I
k2
1
2 ( 1) (2 3 1)
(3 1)1V
jnt j
j n
jj n
j
1
1
1
w1
2 3 1
1
(6.59)
6.1.2.6 Capillary Breakup Extensional RheometerIn classic devices, values measured during filament elongation include force Fz(t) and midpoint sample diameter Dmin(t) as a function of time t. Bazilevskii et al. (1997) proposed a modification of the standard design of this type of rheometer. The modified instrument can be used for measuring rheological properties of low- and high-viscosity liquids under extensional flow conditions (ηE ∈ (10; 106) mPa·s).
In the rheometer of this type (CaBER), a sample is placed between two plates of equal diameter (Fig. 6.14a). At time t0, one or both plates are put into rapid motion, leading to sample elongation along a relatively short distance (Fig. 6.14b). Next, the plates are stopped, and the measured parameter is the change in the diameter of the formed liquid bridge (filament) Dmin at half of the
j=h1+n−h
LV2R1=1+j2⋅(n+1)⋅(2j−3n−1)⋅l(3n+1)jnjIntk11+j⋅γ˙wj−n1+j⋅1−α2j−3n−11+j
⋅α
FIGURE 6.14 The break up of liquid filament. 1, Movable plate; 2, stationary plate; 3, stretch-ing sample; 4, laser system for measuring the diameter.

144 PART | I Advances in Food Rheology
distance between the plates as a function of time (Fig. 6.14c). The measurement ends after the break up of the liquid filament (Fig. 6.14d).
The change in filament diameter over time is monitored by a laser or photo-graphs taken with a high-speed camera. Devices of this type do not perform direct measurements of elongation force, hence their design is quite simple, yet the anal-ysis of results is relatively complex. It is described in a detailed manner in a range of studies including Bazilevskii et al. (1997), Stelter et al. (2000), Liang et al. (1994), and Mckinley and Tripathi (2000). Furthermore, it is necessary to carry our measurements of viscosity under shear flow conditions and surface tension.
Advantages and disadvantages of extensional viscosity measurement meth-ods are summarized in Table 6.1.
TABLE 6.1 Comparison of the Advantages and Disadvantages of Methods for Determining Extensional Viscosity
Advantages Disadvantages
Uniaxial Stretching of the Sample
• Homogeneousdeformation• Good,repeatablemeasurementresults
• Onlyliquidsofhighviscosities• Lowstretchingrate• Complexmethodologyofmeasurement• Veryexpensivemeasuringdevices• Requiresliquidbath• Difficultiesinmountingandsample
preparation
Spin-line Rheometer
• Liquidsoflowviscosity• Simplesamplepreparation• Commercialinstrumentsavailable• Possibilitytosimulatetheprocessof
stretchingafiber
• Complexmeasurementmethodology(analysisofrecordingsmadebydigitalcamera)
• Necessityofadjustmentofthemea-surementresults
Opposed Jets
• Lessviscousfluids• Widerangeof ε
• Sensitivetorquemeasuringdevices• Vacuumgeneration
Outflow of Fluid From the Tank
• Theeasiestmethod• Widerangeofliquidviscosity
• Complexflow• Agreementwithresultsobtainedby
otherbutonlyforlargevaluesof ε
Capillary Breakup Extensional Rheometer (CaBer)
• Simpleconstructionandeasytooperate• Completelycomputercontrolled• Smallsamplevolume(<0.2mL)• Easyloadingandcleaningofsample• Userdefinedstrains• Commercialinstrumentsavailable
• Complexresearchresults• Additionalmeasurementofthesurface
tension
ε˙
ε˙

Extensional Rheology in Food Processing Chapter | 6 145
6.1.3 Typical Experimental Results of Selected Fluids
6.1.3.1 Hydrocolloid SolutionsThe basic factors affecting the rheological properties of polymer solutions in the extensional flow include molecular weight, flexibility of the polymer chain, and concentration. The most spectacular effects are observed during the exten-sional flow of diluted solutions of high-molecular-weight flexible polymers. A sample extensional viscosity curve obtained for solutions of this polymer type is shown in Fig. 6.15. The curve exhibits a range of constant extensional viscosity which is 3 times higher than the zero shear viscosity, and a range with an abrupt increase in extensional viscosity (range of extensional thickening). The mac-romolecules of flexible polymers are present in the steady-state solution in the form of coils. In the range of low strain rates, extensional stresses are too low to cause their elongation, so extensional viscosity is constant. Above a certain value of ε, polymer chains are elongated, which explains the rapid increase in extensional viscosity (Barnes, 2000).
A considerable increase in the polymer concentration causes the chains in the solution to become entangled and, concurrently, disentangled due to the Brownian motion. The dynamics of the transient network formed in this way determines the rheological properties of the solution in the extensional flow (Fig. 6.16). If the average lifetime of the polymer chain entanglements is shorter than the inverse of the elongation rate ε, the flexible segment of the macromol-ecule between two entanglements gives a transient elastic response, which is linked to the occurrence of the extensional thickening range (Barnes, 2000). Above a certain elongation rate the number of chain entanglements starts to fall, and therefore extensional viscosity begins to decrease along with an increase in the strain rate (Barnes, 2000).
ε˙
ε˙
FIGURE 6.15 The shear and extensional viscosity curves of a dilute solution of linear polymer.

146 PART | I Advances in Food Rheology
The extensional viscosity curves discussed previously are characteristics of flexible-chain polymer solutions. The chains of typical hydrocolloids used in the food industry are either semirigid [guar gum (GG), carboxymethylcellu-lose sodium salt (Na-CMC), hydroxypropyl methylcellulose (HPMC)] or rigid [xanthan gum (XG)]. In the case of rigid-chain polymer solutions, no extension-al thickening range is observed (Khagram et al., 1985). However, an increase in viscosity along with an increase in the strain rate can occur in semirigid polymers (Torres et al., 2014, Duxenneuner et al., 2008). Fig. 6.17 presents sample extensional viscosity curves obtained using the opposed nozzle device and shear viscosity determined for several selected polysaccharides. For xan-than gum and carboxymethylcellulose sodium salt with the average molecular mass weight Mw = 700,000, a decrease in apparent extensional viscosity is ob-served over the entire strain rate range. The apparent extensional viscosity of HPMC, Na-CMC (Mw = 250,000), and gum Arabic solutions do not depend on the strain rate. In contrast, guar gum shows a slight increase in viscosity within the aε range starting at ca. 130 s−1.
In the majority of polysaccharide solutions, the Tr number assumes values close to 3 only in the range of low strain rates. Then, along with an increase in
aε , a sudden increase in Tr is observed (Fig. 6.18) (Rózanska et al., 2013).For example, at the strain rate of 1000 s−1, the Tr value is ca. 42 for an
HPMC solution and ca. 100 for an XG solution. The exception here is a gum Arabic solution in which the Tr number equals ca. 3.4 over the entire strain rate range. This is associated with the constant viscosity value of a gum Arabic solu-tion both in the extensional and shear flows. The effect of the mean molecular mass on the value of the Tr number is demonstrated on the example of Na-CMC solutions. At aε = 1,000 s−1, the Tr value is ca. 64 for Mw = 700,000 and ca. 9 for Mw = 250,000 (Rózanska, 2013). In this case, the concentrations of both
ε˙a
ε˙a
ε˙a
FIGURE 6.16 Shear and extensional viscosity curves as a function of strain rate for polymer network.

Extensional Rheology in Food Processing Chapter | 6 147
Na-CMC solutions were appropriately adjusted so that their zero shear viscosi-ties have similar values.
The rheological properties of solutions of polyelectrolytes, to which XG and Na-CMC belong, change after the addition of a low molecular weight salt. Reports published to date suggest that an addition of sodium chloride to a
FIGURE 6.17 Apparent extensional viscosity as a function of deformation rate for polymer solutions. (From Rózanska et al., 2012, 2013 Data for Gum arabic and Na-CMC250 authors’ own reasearch).
FIGURE 6.18 Trouton ratio as a function of deformation rate for polymer solutions. (From Rózanska et al., 2012, 2013 Data for Gum arabic and Na-CMC250 authors’ own reasearch).

148 PART | I Advances in Food Rheology
solution of XG triggers a decrease in extensional viscosity and shear viscosity. In both cases, the phenomenon is attributed to a reduction in coil size (Padma-nabhan, 1995).
6.1.3.2 EmulsionsThe rheological properties of emulsions in the shear flow have been widely discussed in the literature. In contrast, there have only been a few publications focusing on their rheological properties in the extensional flow. Available mea-surement results indicate that the extensional viscosity of emulsions, similar to shear viscosity, depends both on the rheological properties of the continuous phase and the structure of the dispersed phase.
Anklam et al. (1994) and Rózanska (2012) (Fig. 6.19) applied the opposed nozzle device for measuring the extensional viscosity of w/o emulsions stabi-lized with low molecular weight surfactants. An increase in the volume fraction of water was shown to be accompanied by an increase in the apparent extensional viscosity of the emulsions and the Tr number (Fig. 6.20). At the same time, the Tr values were independent of the strain rate. At higher dispersed phase concentra-tions, measurements of apparent extensional viscosity using the opposed nozzle device were found to be impossible due to yield stress (Anklam et al., 1994).
Niedzwiedz et al. (2011) analyzed the effects of the volume fraction of the dispersed phase, the diameter of droplets, and the viscosity of the continuous phase on the rheological properties of concentrated w/o emulsions in the ex-tensional flow. The measurements were performed using a capillary breakup elongational rheometer. The authors of the study observed that the rheological properties of the emulsions in the elongational flow, similar to the shear flow, changed radically after exceeding a certain critical value of the volume fraction φc (φc—volume fraction of the dispersed phase above which the particles are
FIGURE 6.19 Apparent extensional viscosity curves for w/o emulsions. (From Rózanska, 2012).

Extensional Rheology in Food Processing Chapter | 6 149
densely packed). In concentrated emulsions, the ratio between the yield stress measured in the elongational flow τy,E and the shear flow τy,s was independent of the volume fraction of the dispersed phase, and equalled ca. 3.
Studies investigating the extensional flow of o/w emulsions stabilized with an addition of Tween 40 show that their apparent extensional viscosity increases along with decreasing droplet diameter (Fig. 6.21). At the same time, similar to w/o emulsions, the values of the Trouton ratio are independent of the strain rate (Fig. 6.21) (Rózanska et al., 2014).
The emulsions discussed previously were stabilized with low molecular weight surfactants. Polymer-stabilized emulsions are a more complex case. A polymer addition not only changes the rheological properties of the continuous phase, but also modifies the structure of the dispersed phase. Most polysac-charides used in the food industry (XG, GG, and Na-CMC) are not adsorbed on the oil droplet surface, and do not bind to it. As the droplets come closer to each other due to Brownian motion, the region between emulsion droplets is depleted of polymer, leaving only the solvent. This induces a concentration gra-dient of polymer between the interparticle region and the bulk solution, hence, produces osmotic pressure. The solvent between droplets tends to diffuse out to reduce the polymer concentration gradient, causing droplets to aggregate. This is known as depletion flocculation. The depletion force between two droplets increases with increasing molecular mass of the polymer and is significantly greater for polyelectrolytes (eg, Na-CMC, XG) than for nonionic polymers (eg, GG, HPMC) because of the contribution of their counterions to the osmotic pressure (Fig. 6.22) (Rózanska et al., 2013).
FIGURE 6.20 Influence of dispersed phase concentration (5–20%) on course of Trouton number in function of strain rate. (From Rózanska, 2012).

150 PART | I Advances in Food Rheology
FIGURE 6.21 Comparison of the apparent extensional viscosity and Trouton ratio of emulsions with φ = 70% with different droplets diameter. (From Rózanska et al., 2014).
FIGURE 6.22 Apparent extensional viscosity curves for emulsions with addition of HPMC (a) and GG (b). (From Rózanska et al., 2013).

Extensional Rheology in Food Processing Chapter | 6 151
Measurements performed by means of the opposed nozzle device show that in the case of weakly flocculated emulsions stabilized with nonionic polysac-charides apparent extensional viscosity increases along with an increase in the volume fraction of the dispersed phase; however the Tr values are lower than in the pure polymer solution (Fig. 6.23) (Rózanska et al., 2012, 2013).
The greatest relative increase between apparent extensional viscosity of the emulsion and apparent extensional viscosity of aqueous polymer solution was observed when the dispersed phase was strongly flocculated (emulsion with the
FIGURE 6.23 Trouton ratio for emulsions with addition of HPMC (a) and GG (b). (From Rózanska et al., 2013).

152 PART | I Advances in Food Rheology
addition of Na-CMC). In this case the values of Trouton number were higher than for aqueous solution of Na-CMC (Fig. 6.24).
A different behavior was observed for emulsions stabilized with the addition of XG (Fig. 6.25) (Rózanska et al., 2013). Even though emulsions containing this polysaccharide were highly flocculated, the values of apparent extensional viscosity for the emulsions and the aqueous solution of XG were similar.
Differences in the behavior of highly flocculated emulsions stabilized with Na-CMC and XG are attributable to dissimilar rheological properties of the continuous phase. An aqueous solution of XG had viscoelastic properties which prove the formation of weakly crosslinked gel-like network structure. In this case, the rheological properties of the continuous phase would have determined the rheological properties of emulsions.
6.1.3.3 Other FluidsComplex rheological properties in extensional flow are also characteristic for surfactants solutions. It is especially true if they form entangled wormlike mi-cellar network. Such solutions exhibit viscoelastic fluid properties which can
FIGURE 6.24 Apparent extensional viscosity curves (a) and Trouton ratio (b) for emulsion with addition of Na-CMC. (From Rózanska et al., 2013).

Extensional Rheology in Food Processing Chapter | 6 153
be described by the Maxwell model. Viscoelastic wormlike micelle solutions behave in a very similar manner to polymer solutions, but wormlike micelles are physically quite different from polymers. The entangled and reptating worm-like chains are continuously breaking and reforming in time, therefore adding another independent relaxation mechanism to that of an entangled polymer network (Larson, 1999). The extensional viscosity of surfactant solutions was determined inter alia by the use of opposed nozzles device (Prud’homme and Warr, 1994; Chen and Warr, 1997; Fischer et al., 1997; Lu et al., 1998), four-roll mill (Kato et al., 2002, 2004), and also by capillary breakup extensional rhe-ometer (CaBER) (Bhardwaj et al., 2007; Rothstein 2003; Yesilata et al., 2006; Kim et al., 2010).
The first experimental investigations of the apparent extensional rheology of linear wormlike micelle solutions using an opposed jet device were conducted by Prud’homme and Warr (1994). They showed that solutions of tetradecyltri-methylammoniumsalicylate (TTASal) at higher elongation rates exhibit “elon-gational thickening.” The elongational viscosity increases with elongation rate, accompanied by strong alignment of the micelles in the direction of the flow, up to a critical rate of strain, εmax . Beyond that elongation rate the flow begins to disrupt the steady-state micelle size distribution and micelles get shorter.
Fischer et al. (1997) also used an opposed jet device to investigate the effects of wormlike micelle branching in three different samples in an elongational flow (dodecyldimethylamineoxide and sodium laurethsulphate–sodium chloride so-lution). In the first case sample contained short micelles with no branches, the second sample contained linear, entangled micelles with slight branches, and the third sample contained only branched micelles. If the solutions contained only short micelles, unentangled micelles did not exhibit any extensional thick-ening. In the second case entangled micelles showed a very weak maximum of extensional viscosity. In third case which contained branched micelles the maximum of extensional viscosity reached roughly 10 times the shear viscosity ηE = 10η0 followed by extensional thinning with further increases in extension
ε˙max
FIGURE 6.25 Apparent extensional viscosity as a function of deformation rate for emulsion stabilized with addition of XG. (From Rózanska et al., 2013).

154 PART | I Advances in Food Rheology
rate. It follows that increase of branching in the wormlike micelle solution will result in increase of the extensional viscosity. Moreover, they had shown that the increase in extensional viscosity occurred at deformation rates of the same order of magnitude as the value for which shear-thinning behavior was seen in shear flow. The onset of extensional thickening followed by subsequent thinning in micellar networks is similar to the response of entangled molten polymer.
Wormlike micelle solutions demonstrate also a strain hardening of their ex-tensional viscosity which can result in an increased resistance to complex flows such as the flow past a sphere or the flow through porous media (Rothstein, 2009).
A lot of interest in recent years in the area of extensional viscosity mea-surements is related to so-called biofluids, for example, blood, human saliva, and hyaluronic acid (Sousa et al., 2011; Haward et al., 2011a,b). Examples of biological flows where extensional components are likely to play a key role in-clude blood circulation (Sousa et al. 2011), synovial fluid function in the joints (Backus et al., 2002), and flows of mucus in the airways, tears in the eyes, and saliva in the mouth (Stokes and Davies, 2007; Zussman et al., 2007).
Haward et al. (2011a,b) showed that human saliva in extensional flow be-haves like a flexible polymer chain structure. On extensional viscosity curves a characteristic peak ηE at a given value of εmax can be observed. The qualita-tively similar dependence was obtained for the Tr ratio. At the maximum point, it reached a value in the range of 120 and 130. The authors estimated that human saliva contains more high molecular weight molecules, to possess even higher values of Trouton ratio. This high elasticity is likely to be of great importance to saliva functionality in terms of lubrication and surface adhesion within the oral cavity. It is also an important factor to be considered in the formulation of artificial salivas for the treatment of dry mouth conditions, and is likely to have a significant impact on texture perception in the mouth during processing and consumption of food and drinks (Haward et al. 2011a,b).
REFERENCES
Anklam, M.R., Warr, G.G., Prud’homme, R.K., 1994. The use of opposed nozzles configuration in the measurements of the extensional rheological properties of emulsions. J. Rheol. 38, 797–810.
Arigo, M.T., Rajagopalan, D., Shapley, N., Mckinley, G.H., 1995. The sedimentation of a sphere through an elastic fluid. Part 1, Steady motion. J. Non-Newtonian Fluid Mech. 60, 225–257.
Backus, C., Carrington, S.P., Fisher, L.R., Odell, J.A., Rodrigues, DA, 2002. In: Aspects, J.F., Kennedy, O.G., Phillips, P.A., Williams, V.C. (Eds.), Hyaluronanvol 1, Chemical. Biochemical and Biological. Hascall Woodhead Publishing Ltd, Cambridge, pp. 209–218.
Barnes, HA, 2000. A Handbook of Elementary Rheology. Institute of Non-Newtonian Fluid Mechanics. University of Wales, Aberystwyth.
Barnes, H.A., Hutton, J.F.K., Walters, FRS, 1993. An Introduction to Rheology. Elsevier Science Publishers B.V.
Bazilevskii, A.V., Entov, V.M., Lerneé, M.M., Rozhkov, A.N., 1997. Failure of polymer solution filaments. Polym. Sci. A 39, 316–324.
ε˙max

Extensional Rheology in Food Processing Chapter | 6 155
Bhardwaj, A., Miller, E., Rothstein, J.P., 2007. Filament stretching and capillary breakup exten-sional rheometry measurements of viscoelastic wormlike micelle solutions. J. Rheol. 51 (4), 693–719.
Binding, D.M., 1991. Further considerations of axisymmetric contraction flows. J. Non-Newtonian Fluid Mech. 41, 27–42.
Binding, D.M., 1998. An approximate analysis for contraction and converging flows. J. Non-Newtonian Fluid Mech. 27, 173–189.
Binding, D.M., Walters, K., 1988. On the use of flow through contraction in estimating the extensional viscosity of mobile polymer solutions. J. Non-Newtonian Fluid Mech. 30, 233–250.
Chen, C., Warr, G.G., 1997. Light scattering from wormlike micelles in an elongational flow. Langmuir 13, 1374–1376.
Chhabra, R.P., Comiti, J., Machac, I., 2001. Flow of non-Newtonian fluids in fixed and fluidised beds. Chem. Eng. Sci. 56, 1–27.
Chow, A., Müller, A.J., Odell, JA, 1988. Entanglements in polymer solutions under elongation-al flow: a combined study of chain stretching, flow velocimetry, and elongational viscosity. Macromolecules 21, 250–256.
Cogswell, F.N., 1972. Converging flow of polymer melts in extrusion dies. Polym. Eng. Sci. 12 (1), 64–73.
Dealy, J.M., 1984. Official nomenclature for material functions describing the response of a viscoelastic fluid to various shearing and extensional deformations. J. Rheol. 28, 181–195.
Dehghanpour, H., Kuru, E., 2011. Effect of viscoelasticity on the filtration loss characteristics of aqueous polymer solutions. J. Petrol. Sci. Eng. 76, 12–20.
Dexter, RW, 1996. Measurement of extensional viscosity of polymer solutions and its effects on atomization from a spray nozzle. Atom. Sprays 6, 167–191.
Dontula, P., Pasquali, M., Scriven, L.E., Masocko, C.W., 1997. Can extensional viscosity be measured with opposed-nozzle devices? Rheol. Acta 36, 429–448.
Duxenneuner, M.R., Fischer, P., Windhab, E.J., Cooper-White, J.J., 2008. Extensional properties of hydroxypropyl ether guar gum solutions. Biomacromolecules 9, 2989–2996.
Dziubin´ski, M., Kiljan´ski, T., Se˛k, J, 2009. Podstawy reologii i reometrii płynów. Wydawnictwo Politechniki Łódzkiej.
Ergungor, Z., Smolinski, J.M., Manke, Ch, W., Gulami, E, 2006. Effect of polymer–surfactant interactions on elongational viscosity and atomization of PEO solutions. J. Non-Newtonian Fluid Mech. 138, 1–6.
Ferguson, J., Hudson, N.E., Odriozola, MA, 1997. The interpretation of transient extensional viscosity data. J. Non-Newtonian Fluid Mech. 68 (2-3), 241–257.
Ferguson, J., Kembłowski, Z., 1991. Applied Fluid Rheology. Elsevier Applied Science, New York, London.
Fernando, R.H., Xing, L.L., Glass, JE, 2000. Rheology parameters controlling spray atomization and roll misting behavior of waterborne coatings. Prog. Org. Coat. 40, 35–38.
Fischer, P., Fuller, G.G., Lin, Z, 1997. Branched viscoelastic surfactant solutions and their respons-es to elongational flow. Rheol. Acta 36, 632–638.
Fuller, G.G., Cathey, C.A., Hubbard, B., Zebrowski, BE, 1987. Extensional viscosity measurements for low-viscosity fluids. J. Rheol. 31, 235–249.
Haward, S.J., Odell, J.A., Berry, M., Hall, T, 2011a. Extensional rheology of human saliva. Rheol. Acta 50, 869–879.
Haward, S.J., Sharma, V., Odell, JA, 2011b. Extensional opto-rheometry with biofluids and ultra-dilute polymer solutions. Soft Matter 7, 9908–9921.

156 PART | I Advances in Food Rheology
Jones, D.M., Walters, K., WilliamsF PR, 1987. On the extensional viscosity of mobile polymer systems. Rheol. Acta 26, 20–30.
Kato, M., Takahashi, T., Shirakashi, M., 2002. Steady planar elongational viscosity of CTAB/Na-Sal aqueous solutions measured in a 4-roll mill flow cell. J. Soc. Rheol. Japan 30, 283–287.
Kato, M., Takahashi, T., Shirakashi, M., 2004. Flow-induced structure change and flow instability of CTAB/NaSal aqueous solution in 4-roll mill flow cell. Paper Presented in the International Congress on Rheology, Seoul, Korea.
Keller, A., Müller, A.J., Odell, JA, 1987. Entanglements in semi-dilute solutions as revealed by elongational flow studied. Polym. Colloid 75, 179–200.
Khagram, M., Gupta, R.K., Sridhar, T, 1985. Extensional flow of xanthan gum solutions. J. Rheol. 29 (21), 191–207.
Kim, N.J., Pipe, Ch J, Hyun Ahn, K., Lee, S.J., Mckinley, G.H., 2010. Capillary breakup extensional rheometry of a wormlike micellar solution. Korea-Aust. Rheol. J. 22 (1), 31–41.
Larson, RG (Ed.), 1999. The Structure and Rheology of Complex Fluids. Oxford University Press, New York.
Liang, R.F., Mackley, MR, 1994. Rheological characterization of the time and strain dependence for polyisobutylene solutions. J. Non-Newtonian Fluid Mech. 52, 387–405.
Lu, B., Li, X., Scriven, Le, Davis, Ht, Talmon, Y., Zakin, Jl, 1998. Effect of chemical structure on viscoelasticity and extensional viscosity of drag-reducing cationic surfactant solutions. Langmuir 14, 8–16.
Mackley, M, 2010. Stretching polymer chains. Rheol. Acta 49, 443–458. Masocko, C.W., 1994. Rheology. Principles Measurements and Applications. John Wiley & Sons,
New York. Mckinley, G.H., Tripathi, A., 2000. How to extract the Newtonian viscosity from capillary breakup
measurements in a filament rheometer. J. Rheol. 44 (3), 653–670. Meissner, J, 1969. Rheometer zur Untersuchung der deformations mechanischen Eigenschaften von
Kunststoffschmelzen unter definierten Zugbeanspruchung. Rheol. Acta 8, 78–88. Meissner, J, 1985. Rheometry of polymer melts. Annu. Rev. Fluid Mech. 17, 45–64. Metzner, A.B., Metzner, AP, 1970. Stress levels in rapid extensional flows of polymer fluids. Rheol.
Acta 9, 174–181. Mun, R.P., Young, B.W., Boger, D.V., 1999. Atomisation of dilute polymer solutions in agricul-
tural spray nozzles. J. Non-Newtonian Fluid Mech. 83, 163–178. Niedzwiedz, K., Buggisch, H., Willenbacher, N., 2011. Extensional rheology of concentrated
emulsions as probed by capillary breakup elongationaltheometry (CaBER). Rheol. Acta 49, 1103–1116.
Padmanabhan, M., 1995. Measurement of extensional viscosity of viscoelastic liquid foods. J. Food Eng. 25, 311–327.
Petrie, ChJS, 2006. Extensional viscosity: a critical discussion. J. Non-Newtonian Fluid Mech. 137, 15–23.
Prud’homme, R.K., Warr, G.G., 1994. Elongational flow of solutions of rodlike micelles. Langmuir 10, 3419–3426.
Rothstein, JP, 2003. Transient extensional rheology of wormlike micelle solutions. J. Rheol. 47 (5), 1227–1247.
Rothstein, J.P. 2009. Strong flows of viscoelastic wormlike micelle solutions. In: Binding, D.M., Walters, K. (Eds.), Annual Rheology Reviews. The British Society of Rheology, Aberystwyth, Wales, UK, pp. 1–46.
Rózanska, S., 2012. Extensional viscosity of w/o emulsions. Procedia Eng. 42, 808–818.

Extensional Rheology in Food Processing Chapter | 6 157
Rózanska, S., 2013. Rheological properties of aqueous solutions of carboxymethylcellulose sodium salt in the extensional flow. Chem. Eng. Equip. 6, 557–558, (in Polish).
Rózanska, S., Broniarz-Press, L., Rózansski, J., Mitkowski, P.T., Ochowiak, M., Woziwodzki, S., 2013. Extensional viscosity of o/w emulsion stabilized by polysaccharides measured on the opposed-nozzle device. Food Hydrocoll. 32, 130–142.
Rózanska, S., Broniarz-Press, L., Rózansski, J., Ochowiak, M., Woziwodzki, S., Mitkowski, PT, 2012. Extensional viscosity of o/w emulsions stabilized by hydroxypropyl methylcellulose. Chem. Eng. Equip. 51 (6), 375–376.
Rózanska, S., Rózansski, J., Ochowiak, M., Mitkowski, P.T., 2014. Extensional viscosity measurements of concentrated emulsions with the use of the opposed nozzles device. Braz. J. Chem. Eng. 31 (1), 47–55.
Sochi, T, 2010. Non-Newtonian flow in porous media. Polymer 51, 5007–5023. Sousa, P.C., Pinho, F.T., Oliveira, M.S.N., Alves, MA, 2011. Extensional flow of blood analog
solutions in microfluidic devices. Biomicrofluidics 5, 014108–14119. Steffe, J.F. (Ed.), 1996. Rheological Methods in Food Process Engineering. Freeman Press,
Michigan. Stelter, M., Brenn, G., Yerin, A., Singh, R., Durst, F., 2000. Validation and application of a novel
elongational device for polymer solutions. J. Rheol. 44, 595–616. Stokes, J.R., Davies, GA, 2007. Viscoelasticity of human whole saliva collected after acid and
mechanical stimulation. Biorheology 44, 141–160. Thompson, J.C., Rothstein, J.P., 2007. The atomization of viscoelastic fluids in flat-fan and hollow-
cone spray nozzles. J. Non-Newtonian Fluid Mech. 147, 11–22. Torres, M.D., Hallmark, D., Wilson, D.I., 2014. Effect of concentration on shear and extensional
rheology of guar gum solutions. Food Hydrocoll. 40, 85–95. Trouton, F.T., 1906. On the coefficient of viscous traction and its relation to that of viscosity,
Proceedings of the Royal Society, vol. A77, pp. 426–440.Yesilata, B., Clasen, C., Mckinley, G.H., 2006. Nonlinear shear and extensional flow dynamics of
wormlike surfactant solutions. J. Non-Newtonian Fluid Mech. 133, 73–90. Zatloukal, M., Vlcek, J., Tzoganakis, C., Sáha, P., 2002. Improvement in techniques for the
determination of extensional rheological data from entrance flows: computational and experimental analysis. J. Non-Newtonian Fluid Mech. 107, 13–37.
Zussman, E., Yarin, A.L., Nagler, R.M., 2007. Age and flow dependency of salivary viscoelasticity. J. Dent. Res. 86, 281–285.

159Advances in Food Rheology and Its Applications. http://dx.doi.org/10.1016/B978-0-08-100431-9.00007-3Copyright © 2017 Elsevier Ltd. All rights reserved.
Chapter 7
Applications of Rheological Data Into the Food Industry
G. TuckerBaking and Cereal Processing Department, Campden BRI, Chipping Campden, Glos, United Kingdom
7.1 INTRODUCTION
Without simplifying what is a complex subject, the rheological behavior of food materials can be divided into two categories; these describe the elastic and vis-cous properties of those materials. However, the rheology of few food materials is simple, with many food materials exhibiting both elastic and viscous behav-ior to some extent. This has allowed the terms viscoelastic and elastico-viscous to be used as descriptors of behavior.
A classic example of this within the food industry is bread dough. Elastic properties of dough enable the millions of gas bubbles to inflate by “stretching” and the viscous properties provide the required “flow” so the baked bread has the desired shape. Bread dough is frequently described as viscoelastic. Rheo-logical testing using oscillation methods results in the viscous (or storage modu-lus G′) and elastic (or loss modulus G0) components. The magnitude of G′ and G0 informs the user about the relative extent of viscous and elastic forces, respectively (Fig. 7.1).
Elastic behavior can be observed in numerous food materials and physical processes. Common examples include the following:
l die swell as materials are forced through a narrow openingl rod climbing during rotation of a cylindrical rod within the materiall open siphon effects that give the impression the material is moving “uphill”
against gravitational forces
Inclusion of data for elastic behavior into engineering calculations is highly complex and less advanced than for data describing the viscous properties. Much of this chapter deals with viscous data through selected examples that demonstrate a wide range of applications.

160 PART | I Advances in Food Rheology
Viscous behavior in foods allows us to differentiate between “thin” food materials such as water, beer, and milk, and “thick” food materials such as cus-tard, syrup (Fig. 7.2), and tomato paste. Foods exhibit a wide range of viscosi-ties covering many decades of measurement unit. Knowledge of the viscosity is essential in designing equipment and processes that allow these foods to be handled correctly. More mundane examples of the need to control the flow of a food include tomato ketchup and pie fillings. Good quality tomato ketchup can be made to flow from the bottle with a sharp tap on the base, but it should not flow much when on the plate. One explanation for this is due to small particles from broken tomato cells that induce a yield stress, although some rheologists
FIGURE 7.2 High viscosity liquid.
FIGURE 7.1 Example of strain sweep for a bread dough.

Applications of Rheological Data Into the Food Industry Chapter | 7 161
interpret this as a very high viscosity at low shear rate. Pie fillings generally rely on a sufficiently high viscosity to prevent them flowing out once the pie is cut. Gums and starches can be used to increase the viscosity.
Many foods are multiphase including emulsions (liquid in liquid), suspen-sions (solid in liquid), or containing gas cells (gas in liquid). In almost all cases these are inherently unstable and the phases will separate over time. The rate of separation is dependent on, among other factors, the continuous phase viscosity. For example, the quality of a cake is highly dependent on the batter viscosity. If the batter viscosity is low the gas cells will rise to the surface resulting in a loss of volume and uneven crumb structure. During the baking process the tempera-ture increases as the batter is placed in the oven, which leads to further decrease in viscosity and loss of air bubbles. Later in baking the egg proteins coagulate and this dramatically increases its viscosity and stops the gas cells expanding or rising. A well formulated cake batter will be easy to process, flows to fill the tin, and most importantly retains the gas cells in place so they can expand to an optimal volume before setting. This example of cake batter shows that viscosity makes an important contribution to product stability, quality, and the sensory acceptability of food products.
Knowledge of the rheological properties of a material becomes important for designing processes to handle those materials. This chapter describes selected examples in which measurement of food rheology is important. The chosen ex-amples cover areas that demonstrate different applications for rheological data.
7.2 PRESSURE DROP IN PIPE FLOW
The first application example is for the flow of foods in pipe lines. This includes transporting fluids, recirculation systems, depositors, and heat ex-changers. Pressure drop in a pipe is caused by the frictional forces between the flowing fluid and the internal tube wall. As viscosity increases, the frictional forces also increase resulting in increased pressure drop. A liquid food of high viscosity (eg, custard) requires tubes of increased diameter compared with a low viscosity food (eg, milk) otherwise the pressure drop will not be manageable.
In order to calculate pressure drop of a flowing liquid in a pipe, rheological data are required, together with a model that correlates the viscosity with shear rate. Often it is simplified models such as the power law that are applied over a limited range of shear rates (Eq. 7.1). These models do not describe fully the rheological properties of a liquid but provide sufficient accuracy over limited ranges. Shear stress at a pipe wall is given by Eq. 7.2 and shear rate for pipe flow by Eq. 7.4. Of practical application is the pressure drop experienced by a pumped liquid in a cylindrical pipe system, as calculated with Eq. 7.4 for a power-law fluid. More complex rheological equations describing flow behavior are difficult to apply to estimate physical parameters such as pressure drop. Hence it is usual to model the rheological properties of a flowing liquid over the shear rate conditions appropriate to the application. This allows the power law

162 PART | I Advances in Food Rheology
to be used and makes pressure drop prediction possible. It does, however, make extrapolation outside of the flow conditions unreliable.
σ γ= K n (7.1)
σ =∆D P
L
.
4 (7.2)
γπ
=
+
Q
D
n
n
32 3 1
4
n
3
(7.3)
π∆
=
+
D P
L
Q
D
n
n
.
4
32 3 1
4
n n
3 (7.4)
Data that enable the power-law coefficients to be determined are usually taken using a rotational viscometer over a range of shear rates appropriate to the application. For pipe flow this could be in the range of 1–100 s−1. An alternative system is the tube viscometer in which pressure drop and flow rate are measured over a range of conditions, with shear rate and shear stress calculated from the flow term and pressure term, respectively. When plotted as logarithms it is pos-sible to derive the consistency coefficient (K) and flow behavior index (n) as with rotational viscometry data.
For example, Table 7.1 summarizes the flow behavior indices and consis-tency coefficients for carboxymethylcellulose (CMC) solutions, at temperatures ranging from 20 to 140°C. CMC is a thickening material used in foods. Data were taken using a tube viscometer operated at pressures that allowed 140°C to be achieved (Heydon et al., 1996). These data are important for calculating
σ=Kγ˙n
σ=D.∆P4L
γ˙=32QπD3n3n+14n
D.∆P4L=32QπD3n3n+14nn
TABLE 7.1 Flow Behavior Indices (n) and Consistency Coefficients (K) for Carboxymethylcellulose (CMC) Solutions at Temperatures Ranging From 20 to 140°C
Carrier liquid 20°C 50°C 80°C 110°C 140°C
0.5 wt.% CMC n 0.39 0.43 0.53 0.73 0.93
K (Pa.sn) 2.75 1.62 0.98 0.14 0.01
1.0 wt.% CMC n 0.31 0.40 0.49 0.60 0.72
K (Pa.sn) 11.67 4.91 1.93 0.48 0.07
1.5 wt.% CMC n 0.26 0.32 0.41 0.50 0.55
K (Pa.sn) 39.38 22.47 10.42 4.54 1.12

Applications of Rheological Data Into the Food Industry Chapter | 7 163
pressure drops in UHT processing systems as well as for estimating the quantity of CMC required to achieve a specified viscosity in the food.
There are many different methods by which rheological data can be taken for liquid foods. These involve geometries such as cone and plate, parallel plate, or concentric cylinders in which a thin layer of liquid is sheared between surfaces. However, when those foods contain discrete particulates this creates problems of interference between the shearing surfaces. It is necessary to open up the shear-ing gap or to make the measurements on the liquid component. Neither method is ideal but for engineering calculations it does at least provide data for making calculations. Without these data it is not possible to design processing plant.
Comparisons were made by Tucker (1992) to compare data taken with dif-ferent rheometry methods with application to foods containing discrete par-ticulates. These materials present complications for rheological measurement because of the interference from the particulates on shearing surfaces. Three methods were compared: tube viscometry, cylinder rotating in a large sample volume, and cone and plate viscometry on the carrier liquid only. In a trial on tomato and lentil soup with 29.11 wt.% particulates (lentils, 9 mm carrots, 9 mm potatoes, and dried onions) and 3.74 wt.% thickeners (flour, Colflo 67, and pea fiber), comparisons of apparent viscosities at 50 s−1 shear rate were satisfactory between the tube viscometer and the rotating cylinder, whereas the cone & plate tests on the carrier liquid gave lower values (Table 7.2).
Breakdown of the particulates during continuous pumping affected the rheo-logical measurements due to the starch release from the potatoes and lentils. The batch was prepared at 85°C and then cooled while pressure drop and flow rate data were taken. For process design purposes, either tube viscometry or a cylinder rotating in a large sample volume was a satisfactory method for solid and liquid mixtures. The cylinder had the advantage that it required substan-tially less product than the tube viscometer.
The purpose of these rheological methods is to gather data that can be used in a practical application, in this case for design of pipe systems. Small differ-ences between K and n will not affect the design calculations to a significant
TABLE 7.2 Summary of the Rheological Data for Tomato and Lentil Soup at 40°C
Measurement system
Consistency coefficient (Pa.sn)
Flow behavior index (n)
Apparent viscosity at shear rate 50 s−1 (Pa.s)
CP 12.4 0.38 1.11
CiLV 24.0 0.37 2.06
T 17.5 0.44 1.94
CP, cone and plate on the carrier liquid; CiLV, cylinder rotating in a large volume; T, tube.

164 PART | I Advances in Food Rheology
effect. Most engineering calculations of pressure drop need to be 90% accurate and so the assumptions described here are sufficient for this application.
7.3 HEAT TRANSFER CALCULATIONS
The next example is for heating of viscous foods. Many foods are heated during the process of converting them from raw materials into a packaged and shelf stable product. This requires heat to be transferred from processing equipment to the product, usually through contact made by the food with a heated surface. The reverse happens during cooling. Equipment for heat transfer varies depend-ing on the application and includes metal cans heated in steam cookers, many forms of heat exchanger and stirred vessels, as well as direct steam injection systems. In the design and choice of a heating system the rheological behavior of the product has to be taken into consideration.
Viscous food products (eg, tomato products, soups, sauces, and desserts) present a challenge in the design of heat transfer equipment, especially if the particle content is significant. With respect to the rheological or flow behavior, the products are typically non-Newtonian showing in many cases quite extraor-dinary behavior. This arises from the use of complex thickening agents (eg, starches, gums) used to arrive at a desired consistency.
Heat exchanger design is one area in which knowledge of the rheological properties is essential. This will affect, for instance, the residence time distribu-tion within the equipment and hence the design of heat exchanger and hold-ing cell to obtain sufficient thermal treatment. There are two extremes of flow behavior: laminar and turbulent flow. The basic difference between laminar (streamline) and turbulent flow is well known (Figs. 7.3 and 7.4), as is the effect on the velocity profile from heating or cooling of the product. For example, the
FIGURE 7.3 Typical flow pattern over a protrusion in a pipe, illustrated with velocity (m s−1) contours.

Applications of Rheological Data Into the Food Industry Chapter | 7 165
maximum velocity in laminar flow is theoretically twice the mean velocity and in turbulent flow around 10% higher. For viscous products, however, the flow conditions are nearly always laminar.
For liquid foods that have complex flow behavior the velocity profiles in pipe flow depend on the flow behavior index (n). This is the index for power-law liquids that can range from 1.0 in simple materials such as water, milk, or fruit juice (these display Newtonian behavior) to 0.7 in starch-based sauces, 0.3 in tomato paste, and in theory can go to 0.0. With decreasing flow behavior index the velocity profile increases in flatness, which means in practice that the maximum velocity decreases from twice the mean velocity.
A further complication to the viscous flow behavior arises with additives that give elastic properties, for example, xanthan or gellan gum. These are sometimes used to enhance the particle carrying properties for a carrying fluid in continuous processing. The so-called “yield value,” which normally is a measure of the product’s willingness to flow by itself, for example, from a stor-age tank, is also a measure of the particle carrying abilities. A significant yield value, typical of paste-like products, also adds to the flatness of the velocity profile.
Design models for heat exchangers are normally based on empirical cor-relations of the dimensionless Nusselt, Prandtl, and Reynolds numbers. The de-rived equation is basically of the form Nu = f(Re, Pr). By using dimensionless numbers only a limited number of experiments have to be performed in which the product and heating/cooling medium flow rates and the product physical properties are varied in order to cover a large range of Reynolds and Prandtl numbers. The physical properties are changed preferably by changing the tem-peratures of the fluids involved. Decreased and increased temperatures can nor-mally vary the viscosity of the product significantly.
FIGURE 7.4 Velocity profiles for turbulent and laminar flow showing the ratio of maximum velocity to average velocity.

166 PART | I Advances in Food Rheology
The definition of the Nusselt (Nu), Prandtl (Pr), and Reynolds (Re) numbers is given in
α=
d
kNu
. h
(7.5)
µ=
kPr
.pC
(7.6)
ρµ
=d v
Re. .h
(7.7)
where α is the heat transfer coefficient (W m−2 K−1), dh is the hydraulic diam-eter (m), k is the thermal conductivity of liquid (W m−1 K−1), Cp is the specific heat of liquid (J kg−1 K−1), µ is the dynamic viscosity of liquid (Pa.s), v is the velocity (m s−1), and ρ is the density (kg m−3).
Eqs. 7.5–7.7 assume Newtonian flow behavior in the liquid being heated. If the liquid viscosity is greater than water it is usual that the flow behavior devi-ates from Newtonian, which requires adjustments to these equations. Again, power-law rheology can be used to calculate a shear-dependent viscosity using Eqs. (7.1) and (7.3). The section that follows considers some of these require-ments that relate to laminar and turbulent flow regimes.
7.3.1 Residence Time Measurement for Flowing Foods
A critical parameter for determining the time spent by a liquid within a heat exchanger or holding tube is referred to as the residence time. For food safety, the fastest moving liquid needs to be known because this will receive the lowest level of heat treatment. This will be liquid at the center of a pipe. Liquid with the minimum theoretical residence time (RTmin) can be calculated based on either Newtonian σ γ= ⋅K( ) or power-law σ γ= ⋅K( )n rheology.
The relationship between the maximum velocity at the pipe centerline (vmax) and the mean velocity (vmean) can be calculated using Eq. 7.8 for power-law flu-ids. For Newtonian fluids the flow behavior index (n) is unity (1.0), thus Eq. 7.8 results in a maximum velocity of twice the mean velocity. This is the basis for doubling the holding tube length to ensure that the fastest product spends suf-ficient time at the elevated temperature.
=++
v n
n
3 1
1max
meanv (7.8)
The velocity in the Reynolds number (Eq. 7.8) is the mean flow velocity, cal-culated from the flow rate and pipe diameter. If power-law rheology is assumed,
Nu=α.dhk
Pr=Cp.µk
Re=ρ.dh.vµ
(σ=K⋅γ˙)(σ=K⋅γ˙n)
vmaxvmean=3n+1n+1

Applications of Rheological Data Into the Food Industry Chapter | 7 167
as is often used, this equation becomes a more complex version containing the K and n terms (Eq. 7.9).
ρ=
+
− −v
K
n
nRe
. 6 2n n2 1.Dn
(7.9)
Reynolds numbers above 10,000 indicate the flow is turbulent and below 2,100 it is laminar. The region between 2,100 and 10,000 is the transitional re-gion in which the flow conditions are less stable and are difficult to predict. One modeling system used to predict flow patterns in equipment is computational fluid dynamics (CFD). This is considered in the next section.
7.4 COMPUTATIONAL FLUID DYNAMICS
In order to make predictions of flow in transport systems, CFD codes require some basic data on the flow properties of the fluid in question. The accuracy of the final simulations will depend to a large extent on the quality of these data; hence, it is important that these properties are measured correctly. The sim-plest class of fluids is those that have a constant value for viscosity at a defined temperature, independent of the shear conditions imposed. Air and water are examples of such fluids, commonly referred to as Newtonian fluids. Most CFD codes will contain a database of physical properties for air and water.
Fluids for which the shear stress and shear rate are not linearly related are generally referred to as non-Newtonian. Data for the flow properties of these materials are unlikely to be available in a database because the uniqueness of food materials gives rise to extensive variation. The power law is the most common non-Newtonian relationship used within CFD codes. Other published models relating shear rate to shear stress can be used with most CFD codes or users can input their own model if none of these appears to fit the data.
One popular application for CFD is to predict the velocity of a flowing liquid at all positions within that system. This is important not only for knowing the fastest and slowest moving parts of the liquid but also for cleaning purposes in which surfaces have to be swept clean by flowing water. Much of the processing equipment in the food industry is designed to be cleaned in-place (CIP). This in-volves flushing hot detergent solution through the system, attempting to ensure that a minimum velocity of 1.5 m s−1 (Campden BRI, 2008) is maintained to physically remove deposits from the walls of the equipment. This limiting value for velocity was derived by the requirement for turbulent flow as a preferential cleaning mechanism to laminar flow.
Not all surfaces in a complex flow system will experience turbulent flow of cleaning solution adjacent to that surface. In near-stagnant regions it is likely that food materials will not be removed from surfaces and they could subse-quently give rise to bacterial growth. CFD can be used to model the flow of the detergent solution through the processing equipment and identify parts that do
Re=ρ.Dn.v2−nK6n+2n1−n

168 PART | I Advances in Food Rheology
not achieve the figure of 1.5 m s−1. These “unhygienic” features can then be avoided at the design stage.
Fig. 7.3 shows how a detergent solution flows around a protrusion in a cylin-drical pipe (the fluid, water, is flowing from left to right), with the velocities col-or coded for ease of identification. The slowest regions are highlighted in purple and the fastest in red. The flow regime in this example was turbulent as indicated by high Reynolds numbers. A small stagnant region was identified upstream of the step as the fluid moved to avoid the obstacle. Downstream of the step there was a wake region with recirculation currents, indicating that this region may also receive insufficient cleaning. If these regions of slow flow were critical to the cleaning operation it would be possible to redesign the protrusion using the CFD model to result in a more streamlined protrusion that was cleanable.
CFD can also be used to examine more complex geometries such as pumps and valves. Fig. 7.5 shows how the turbulent detergent solution traveled through a butterfly valve to again identify the regions where the target minimum velocity of 1.5 m s−1 was not being obtained. The flow direction in this example was from right to left. As the flow domain was split into two regions, the speed increased to a maximum, once again leaving a stagnant region downstream of the obstacle. This time the stagnant region was not close to a wall and so did not influence the cleanability. However, the mean flow velocity had to be increased to 3.0 m s−1 to ensure that no regions were present with a velocity of less than 1.5 m s−1.
In these two Newtonian examples the fluid was water. CFD is equally appli-cable to gases such as air because in fluid flow terms a gas behaves in the same way as a liquid. There are many examples in the food industry of situations where knowledge of air flow is critical. One such application is for airflow in a chilled room. When hot products are placed in a chilled room, it is important
FIGURE 7.5 Fluid is split as it flows through an open butterfly valve, with speeds (m s−1) being at a maximum on either side of the obstruction.

Applications of Rheological Data Into the Food Industry Chapter | 7 169
to gauge how effectively they will be cooled by the circulating air. The product cooling rates are affected by the way in which the products are stacked as well as the positions of any fans to move the air around the room.
The first of the non-Newtonian examples given here is for a 5 wt.% waxy maize starch solution (Colflo 67, National Starch) flowing through an in-line mix-er comprising four elements. Fig. 7.6 shows the typical streamlines for the starch as it experienced a series of 180° changes to the flow direction. This application for an in-line mixer was required to enable a food manufacturer to assess whether a food product (with similar flow behavior to the starch) was well mixed before temperature readings were taken. This was critical to ensure that all of the food in a high temperature holding tube of a continuous process had received suffi-cient sterilization. The number of 180° twists to achieve full mixing was assessed by imposing a simulated temperature profile on the fluid as it entered the first mixer element, and then adding mixer elements until a uniform temperature was achieved (±0.5°C). Four elements were shown to give an exit temperature dis-tribution across the pipe of ±5°C having started with ±50°C on entry to the first.
Fig. 7.7 presents a series of cross-sectional slices for the start, center, and end of each mixer element. Twelve elements were required to achieve the ±0.5°C target, with only the first seven elements shown in Fig. 7.7 for clarity. Here, temperature is being used as a measure of the uniformity achieved after mixing.
FIGURE 7.6 CFD predicted streamlines inside a four element in-line mixer.
FIGURE 7.7 Cross-sectional slices through the in-line mixer elements showing the increas-ing uniformity of the fluid temperature.

170 PART | I Advances in Food Rheology
Two streams at 100 and 0°C were introduced to the mixer and the degree of evolved temperature equilibrium used to assess the mixing efficiency.
Liquid chocolate is an example of a non-Newtonian fluid whose flow be-havior can be modeled using the Casson equation. This is a similar model to the power law but with a yield stress term and flow behavior index (n) of 0.5. Fig. 7.8 shows the chocolate flowing through a pipe manifold with a higher velocity from the first outlet and moving relatively slowly by the fourth. This uneven distribution is typical for materials with high viscosity where the path of least resistance is chosen. The length of the outlets has been found to be critical in this type of equipment because of the pressure drops associated with foods of high viscosity. There are numerous manifold systems in the food industry similar to the example here, and almost all experience uneven flow distribution. The use of CFD at the design stage ensures that more even flow rates through each of the outlets can be achieved and thus avoid the costly reengineering of plant that would be subsequently required.
The CFD examples given in Figs. 7.3–7.8 are for applications of CFD to engineering design. They show that rheological data are critical to these calcu-lations. The next section takes a look at a different rheological parameter, which also has relevance to flowing foods but more often is an important sensory pa-rameter.
7.5 YIELD STRESS MEASUREMENT
Yield stress measurement for food products is important in the food industry as it relates to sensory quality attributes such as mouthfeel. By definition, the yield stress value (σy) is the minimum shear stress required to maintain steady shear flow (Scott Blair, 1933). Below this value the material behaves as a solid, whereas above it the material flows with a shear rate dependent on the excess
FIGURE 7.8 The relative flow rates of liquid chocolate through a manifold.

Applications of Rheological Data Into the Food Industry Chapter | 7 171
shear stress (σ–σy). This definition indicates that the σy of a material is finite, constant, and measurable. In practice the situation is much less clear because a food material can exhibit a range of σy values (Cheng, 1986) which are depen-dent on the methods used for its measurement. The magnitude of the measured σy values also depends on the time allowed to determine whether the material has either developed continuous flow or has ceased flowing. It is closely associ-ated with rheological parameters such as creep, stress growth, and thixotropic breakdown, and the characteristic times of these transient responses also play a part in σy determination. The interpretation of σy values in the process engineer-ing context is complicated, with the existence of σy values challenged by some rheologists, for example, the classic Barnes and Walters (1985) paper entitled “The Yield Stress Myth.”
Yield stress values are characteristic of materials as diverse as foams, greas-es, gels, emulsions, and pastes. For these materials, the underlying microstruc-tures are formulated to provide the appropriate properties for a particular appli-cation. For example, grease should remain in position after being applied to an engine component, but on application of a small stress in excess of the σy value it is essential for the grease to flow and to function effectively. Ideally the σy value for grease is relatively low otherwise movement of the engine parts would be restricted. In the food industry it is essential that certain foods display this behavior to satisfy sensory requirements.
From the consumer’s perspective, the magnitude of σy value is character-istic of the firmness or rigidity of a food. This attribute can be likened to a measure of the perceived quality. For quality assurance purposes it is usual to measure some mechanical property of a food that is related to the σy (eg, the gel strength). These measurements can be made using a variety of simple methods to provide a quality assurance value that satisfies a food producer, but the mea-surements do not give information on the true σy value of that food.
In addition to the textural properties of a food, a measurable σy value has engineering implications for flow, similar to the example of grease in a car en-gine. This makes the measurement of accurate σy values important in calculat-ing the extra pumping duty required to start up a process, or to predict a velocity profile across a pipe diameter for a non-Newtonian fluid. The latter example has major implications for designing continuous flow processing plant (eg, a UHT process). If an outer radial section of food material in the cylindrical pipe remains static during flow (as a result of a yield stress), the remaining material will increase in velocity as the cross-sectional area becomes reduced. This will further increase the velocity of the food flowing toward the center of the hold-ing section.
An example of a product which is said to possess a σy value is tomato ketch-up. Without a significant σy value, ketchup will flow from a bottle tipped at a small angle. In this situation, the shear stress resulting from gravitational forces is sufficient to overcome the σy and initiate flow. The absence of a σy value tends to characterize lower quality tomato ketchups with inferior formulation,

172 PART | I Advances in Food Rheology
whereas higher quality ketchups are carefully formulated to possess a chemical and physical structure that gives rise to an appreciable σy value.
Measurement of yield stress is fraught with experimental difficulty and re-quires knowledge of the application. For example, if the application is for a canned food in which the solids needed to remain in suspension for the duration of the product’s shelf life, the measurement of σy values should involve long measurement times and very low shear rates. However, if the application is for pipe flow start-up, the measurement times should be short and the shear rates appropriate to those used during flow.
The method widely used in the food industry for σy measurement is to ex-trapolate equilibrium flow curve data beyond the lowest measured shear rate to zero shear rate. The σy value is then calculated at the intercept with the shear stress axis. This method requires that the data are fitted to a simple rheological model such as the Bingham or Herschel–Bulkley models. Fig. 7.9 shows an ex-ample of an equilibrium flow curve for a gelatinized 6 wt.% Colflo 67 solution (National Starch, Manchester), that was modeled as a Herschel–Bulkley mate-rial. The σy value was of the order of 5.0 Pa, obtained using nonlinear regres-sion over the shear rate range of 0.09–2.00 s−1. However, the requisite accuracy in determining intercepts for Herschel–Bulkley fluids is difficult to estimate because of the increasing nonlinearity of the equilibrium flow curve at very low shear rates. It is debatable whether this method is valid unless the shear rates (or shear stresses) used are extremely small.
Holdsworth (1993) gave a comprehensive review of the published rheologi-cal models applied to foods, some of which contained σy data. Table 7.3 was extracted from these data to illustrate the magnitude of measured σy values for selected foods. These data were obtained by extrapolating equilibrium flow data to zero shear rate.
FIGURE 7.9 Equilibrium flow data for 6 wt.% Colflo 67 at 6.5°C between shear rates of 0.09 and 16.62 s−1, with a σy value of approximately 5 ± 2 Pa.

Applications of Rheological Data Into the Food Industry Chapter | 7 173
A number of alternative methods for σy measurement of materials have been proposed:
l Tube/capillary rheometryl Oscillatory testsl Creep testsl Cone penetrationl Squeeze film rheometryl Falling ball/needlel Rolling ball viscometryl Drag plate viscometryl Vane rheometry—controlled ratel Vane rheometry—controlled stress
Flow curve extrapolation was considered to be the most commonly used method within the food industry (Steffe, 1991) despite the inherent difficulties in judging the intercept.
TABLE 7.3 Selected σy Values for Food Products Measured From Equilibrium Flow Models
Food productFlow model for estimating σy Yield stress (Pa) References
Baby food Herschel–Bulkley 26.5–40.7 Steffe and Osorio (1987)
Molten chocolate Casson 7.3–30.0 Tung et al. (1990)
Whey concen-trate
Herschel–Bulkley 3.5–19.1 Parnell-Clunies et al. (1986)
Cream, high fat Bingham 3.0–23.1 Sadowska et al. (1990)
Soft cheese Herschel–Bulkley 71.5 Massaguer-Roig et al. (1984)
Mayonnaise Casson 12.0–27.0 Tung et al. (1990)
Fish paste Herschel–Bulkley 1,600–2,300 Nakayama et al. (1980)
Apple sauce Herschel–Bulkley 18.4–46.4 Qiu and Rao (1988)
Tomato puree Herschel–Bulkley 213 Charm (1963)
Tomato ketchup Bingham, Casson, Herschel–Bulkley
7.9–22.0 Ofoli et al. (1987)
Tomato paste Bingham, Casson 33.2 Dervisoglu and Kokini (1986)
Source: Taken from Holdsworth (1993)

174 PART | I Advances in Food Rheology
7.6 FUTURE TRENDS
CFD has advanced considerably since its early days and the recent codes are able to compute solutions for geometries with food materials of increasingly complex rheology. This makes it easier to design flow systems with greater confidence that few problems will arise when foods are first processed in the system. Hygienic design has also advanced in response to the ability to compu-tationally predict surface stresses and relate this to cleaning performance.
7.7 CONCLUSIONS
Applying good quality rheological data for computationally designing food processes is now commonplace with most equipment companies. This pro-vides a visual representation of velocities and pressure drops throughout a process. Regions of slow flow can be identified and design changes made to overcome these. The examples given in this chapter are intended to represent a range of processes and rheological challenges that illustrate what can be achieved.
Newtonian liquids are relatively easy to manage, with computational solu-tions providing high accuracy. Few flowing foods display Newtonian rheology and so rheological models such as the power law have been developed to cor-relate stress and rate data over ranges appropriate to specific flow situations. These allow the design calculations to be made but do not allow extrapolation beyond those ranges. CFD solutions require simple rheological models such as the power law and its many variants. Inclusion of a yield stress term is one vari-ant that has relevance to food materials.
Engineering calculations must be made to a high level of accuracy when designing food processing and cleaning systems. Mistakes are expensive and can be dangerous on occasion. Good quality rheological data are important as one of the inputs to these calculations.
REFERENCES
Barnes, H.A., Walters, K., 1985. The yield stress myth? Rheol. Acta 24, 323–326. Campden BRI, 2008. Cleaning-in-Place—Dairy, Food and Beverage Operations, third ed. Wiley
Blackwell, Oxford, UK. Charm, S.E., 1963. The direct determination of shear stress-shear rate behaviour in the presence of
yield stress. J. Food Sci. 28, 107–113. Cheng, D.C-H., 1986. Yield stress: a time dependent property and how to measure it. Rheol. Acta
25, 542–554. Dervisoglu, M., Kokini, J.L., 1986. Steady state rheology and fluid mechanics of four semi-solid
foods. J. Food Sci. 51 (3), 541–546, 625. Heydon, C.J., Scott, G.M., Tucker, G.S., 1996. Applications of tube viscometry for the flow char-
acterisation of gelatinised food starches under UHT conditions. Trans. Inst. Chem. Eng., Food Bioproduct. Process. 74 (Part C), 81–91.

Applications of Rheological Data Into the Food Industry Chapter | 7 175
Holdsworth, S.D., 1993. Rheological models used for the prediction of the flow properties of food products: a literature review. Trans. Inst. Chem. Eng., Food Bioproduct. Process. 71 (Part C), 139–179.
Massaguer-Roig, S., Rizvi, S.S.H., Kosikowski, F.V., 1984. Characterisation of thixotropic behav-iour of soft cheeses. J. Food Sci. 49, 668–670, 684.
Nakayama, T., Niwa, E., Hamada, I., 1980. Pipe transportation of minced fish paste. J. Food Sci. 45, 844–847.
Ofoli, R.Y., Morgan, R.G., Steffe, J.F., 1987. A generalised rheological model for inelastic fluid foods. J. Texture Stud. 18, 213–230.
Parnell-Clunies, E.M., Kakuda, Y., Deman, J.M., 1986. Influence of heat treatment of milk on the flow properties of yoghurt. J. Food Sci. 51 (6), 1459–1462.
Qiu, C.-G., Rao, M.A., 1988. Role of pulp content and particle size in yield stress in apple sauce. J. Food Sci. 53, 1165–1170.
Sadowska, J., Gryzowska, A., Wodecki, E., 1990. Rheological properties of cream with high fat content. Spiess, W.E.L., Schubert, H. (Eds.), Engineering and Foods, vol. 1, Elsevier Applied Science, London, pp. 169–175.
Scott Blair, G.W., 1933. On the nature of ‘Yield Value’. J. Appl. Phys. 4, 113. Steffe, J.F., 1991. Yield stress: phenomena and measurement. Singh, R.P., Wirakartakusumah, M.A.
(Eds.), Advances in Food Engineering, vol. 1, Elsevier Applied Science, London, pp. 363–376, (Chapter 29).
Steffe, J.F., Osorio, F.A., 1987. Back extrusion of non-Newtonian fluids. Food Technol. 41 (3), 72–77.
Tucker, G.S., 1992. The use of the tube viscometer to provide accurate rheology data for the modelling of heat transfer into food particulates during UHT processing. Food Eng. Comp. Climate 199–207.
Tung, M.A., Speers, R.A., Britt, I.J., Owen, S.R., Wilson, L.L., 1990. Yield stress characterisation of structured foods. Spiess, W.E.L., Schubert, H. (Eds.), Engineering and Foods, vol. 1, Elsevier
Applied Science, London, pp. 79–88.

177Advances in Food Rheology and Its Applications. http://dx.doi.org/10.1016/B978-0-08-100431-9.00008-5Copyright © 2017 Elsevier Ltd. All rights reserved.
Chapter 8
Influence of Fibers and Particle Size Distribution on Food Rheology
E. TornbergDepartment of Food Technology, Engineering and Nutrition, Lund University, Lund, Sweden
8.1 INTRODUCTION
In sensory evaluation of a food product, perceived consistency is one of the key properties to be evaluated together with taste, appearance, and juici-ness. Moreover, the consistency of the food in concern shall persist during storage and handling, which is sometimes not an easy task to fulfill. There-fore, it is important to be able to understand and control the rheology of the food itself.
The food products we will handle in this chapter are suspensions of dietary fibers (DFs), such as those which occur in drinks, juices, pastes, and ketchups. DFs are cell wall material of carbohydrate nature that can come from vegeta-bles, fruits, and root fruits among others. They are neither digested nor absorbed in the human small intestine, but they are good for health. There is a need to increase the intake of DF in the western diet and the recommended daily in-take in Sweden is 25–35 g (Nordic Nutrition Recommendations, 2004). This is however, rarely achieved in the populations of the Western world (Gray, 2006). Therefore, the sensory properties of DF suspensions should be improved and especially the consistency to enhance this intake.
This leads us to the aim of this chapter namely, the rheology of DF suspension and which factors are important to control and govern their rheology. A number of thesis works have been performed at the Department of Food Technology in Lund handling this subject (Bayod, 2008; Bengtsson, 2009; Castro, 2013). An overview of these investigations will be discussed in this chapter. The vegeta-ble DF investigated here has been obtained from tomato, apple, carrot, potato, parsnip, and yacon.

178 PART | I Advances in Food Rheology
8.2 ORIGIN OF THE FIBERS STUDIED AND PREPARATION OF A PASTE
8.2.1 Tomato Paste, Hot Break and Cold Break
Most of the global consumption of tomatoes is not as fresh but in the form of to-mato paste, which in turn is the main ingredient in other products such as ketch-ups, sauces, and juices. When producing the latter products the tomato paste is diluted to the desired content and is mixed with other ingredients, such as spices, salt, sugar, vinegar, and hydrocolloids. In some cases homogenization of the diluted tomato paste is performed in a valve homogenizer, followed by pasteuri-zation, aseptic cooling, and packing. Not only these production parameters influ-ence the quality of the end product but also the way the tomato paste is produced. One of the process parameters of the tomato paste that has the greatest influence on tomato products is the break temperature (Valencia et al., 2004). Break tem-perature can be carried out at high temperatures (>85°C), called hot break (HB) or at low temperatures (<70°C), called cold break (CB). In the CB tomato paste the enzymes can still be active causing a certain degree of pectin degradation leading to better preservation of the tomato flavor and color but lower viscosity.
8.2.2 Apple Sauce
Swedish, grated and frozen apples, originating from varieties such as Graven-steiner, Signe Tillisch, and Cox Orange, were used in this investigation. The apples were coarsely ground in a mincer, heat treated at 85°C for 5 min, and the peel and pips were removed from the mash by filtration. Finally, bacteriostats were added to the mash for storage stability.
8.2.3 Carrot Paste
Swedish carrots were peeled, cubed (10 × 10 × 10 mm), blanched (93–96°C, 6–6.5 min), and kept frozen (−20°C) until usage. They were then ground in a food processor to achieve a paste.
8.2.4 Potato Pulp
The potato pulp used is the residual of that obtained in starch production. In some studies the potato pulp was taken from the production line before drying and was then kept frozen, whereas in other studies the dried potato pulp was used.
8.2.5 Parsnip Paste
Like the carrots the parsnip roots were peeled, cubed (10 × 10 × 10 mm), blanched (95°C, 5 min), and kept frozen (−20°C) until usage. They were then ground twice in a food processor to achieve a paste.

Influence of Fibers and Particle Size Distribution on Food Rheology Chapter | 8 179
8.2.6 Yacon Paste
Yacon roots from Bolivia were washed, peeled under distilled water to avoid oxidation, and cubed (10 × 10 × 10 mm). The cubes were immersed in ascorbic acid solution for 1 min and then minced to obtain a paste with added preserva-tives. The yacon paste was stored at −20°C until usage.
8.3 COMPOSITION OF THE FIBERS IN SOLUBLE AND INSOLUBLE PART
In the cell wall of root fruits, fruits, and vegetables the structure is built up of a network of insoluble cellulose fibrils, hemicelluloses, and pectins, where the latter two can be partly soluble. These components make up the DF content. Yacon root fruit also contains another interesting fiber, namely fructooligosac-charides (inulin-type fructans).
The amount of soluble and insoluble DF is an important characteristic of the fiber for its physical–chemical properties. First, the dry matter (DM) content of different original pastes is determined and then the amount of DF and pec-tin (galacturonic acid) content (Theander et al., 1995) based on the DM in the soluble and insoluble part is registered. In the studies referred in this overview, a mild separation method with minimal influence on the solubility was used to separate the fibers into a soluble and insoluble part. The samples were mixed with water to form a suspension containing 2% DM of the fruit or vegetable and were stirred overnight at 7°C. The suspension was then centrifuged at 3000g for 20 min and the two fractions obtained, that is, the soluble and insoluble part, respectively, were further characterized. In Table 8.1 the DM content of the different pastes studied is given, whereas the fiber content in the soluble and insoluble fraction can be seen in Figs. 8.1–8.3 together with the pectin content in these fractions.
The DF content of apple, tomato, and carrot is about 20% of the DM, where the soluble part (mainly pectin) is 3 and 2% of DM for tomato and apple, where-as for potato pulp and carrot it is below 1%. The DF content of the dried potato pulp is high because most of the starch granules and the water-soluble saccha-rides have been washed away in the process to achieve potato pulp, but in the
TABLE 8.1 DM of Various Original Pastes
Paste AppleTomato (HB)
Potato pulp dried Carrot Parsnip Yacon
DM (%) 11.8 22.3 89.0 9.7 15.5 8.0
Source: Data taken from Bengtsson (2009) and Castro (2013)

180 PART | I Advances in Food Rheology
other pastes the original components such as the saccharides and salts are still there in the paste.
However, for parsnip the amount of DF is high about 30% of DM, where 5% is the soluble part. The highest DF content is found in yacon around 45% of DM, but in this case the fructans constitute a substantial amount (35%) of DM and out of which 25% of DM is soluble.
FIGURE 8.1 Soluble (shaded) and insoluble (unshaded) DF in four DF sources. (From Bengts-son, 2009)
FIGURE 8.2 Soluble (shaded) and insoluble (unshaded) pectin in four DF sources. (From Bengts-son, 2009)
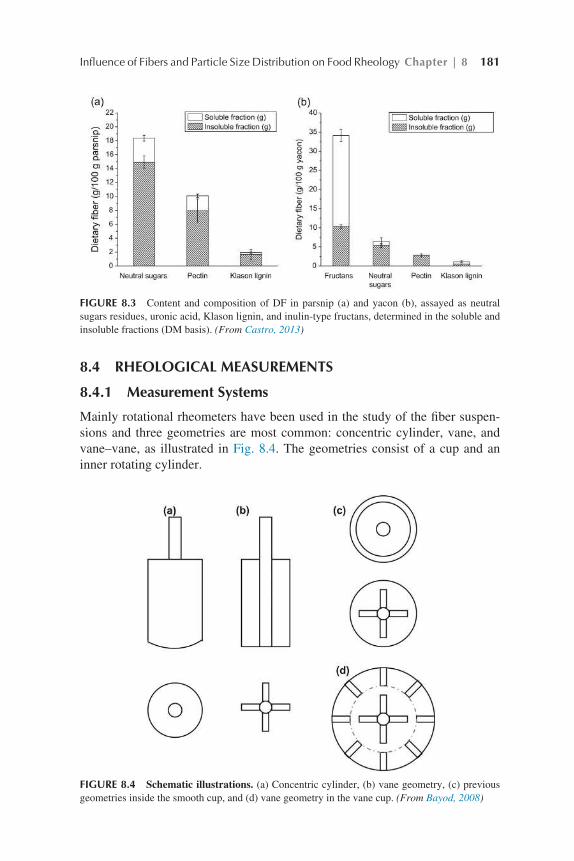
Influence of Fibers and Particle Size Distribution on Food Rheology Chapter | 8 181
8.4 RHEOLOGICAL MEASUREMENTS
8.4.1 Measurement Systems
Mainly rotational rheometers have been used in the study of the fiber suspen-sions and three geometries are most common: concentric cylinder, vane, and vane–vane, as illustrated in Fig. 8.4. The geometries consist of a cup and an inner rotating cylinder.
FIGURE 8.3 Content and composition of DF in parsnip (a) and yacon (b), assayed as neutral sugars residues, uronic acid, Klason lignin, and inulin-type fructans, determined in the soluble and insoluble fractions (DM basis). (From Castro, 2013)
FIGURE 8.4 Schematic illustrations. (a) Concentric cylinder, (b) vane geometry, (c) previous geometries inside the smooth cup, and (d) vane geometry in the vane cup. (From Bayod, 2008)

182 PART | I Advances in Food Rheology
Rheology is the study of how a material is deformed and how it flows due to an applied mechanical force. The mechanical force is the torque applied (M) on the inner cylinder, from which the shear stress (σ) can be calculated and the shear rate (γ) is obtained from the angular velocity (Ω) of the inner cylinder. In the case of the vane it is assumed that the material is entrapped between the blades of the vane forming an inner cylinder.
Fiber suspensions are considered to be difficult material to perform rheologi-cal measurements, as they contain large particles in the micrometer range. A prob-lem often encountered is slippage at the walls and one way to reduce or eliminate that is to use the vane geometry (Nguyen and Boger, 1992; Barnes, 1999). We have, for a tomato paste suspension, compared the viscosity as a function of the shear rate (Fig. 8.5) in the concentric cylinder (CC), the vane + smooth cup (V), and vane + vane cup (VV). As seen from the results in Fig. 8.5 the concentric cyl-inder gave rise to lower viscosities due to slippage at the wall, whereas the V and VV coincided over a large range of shear rates. Therefore, we have chosen to use a four-bladed vane in a smooth cup (Barnes, 1999; Barnes and Nguyen, 2001).
The gap between the inner and outer cylinder is usually 1 mm because then the shear rate can be considered to be constant, but if the larger particles of the fiber suspensions is well above 100 µm they disturb the rheological measure-ments. Therefore, by necessity larger gaps have to be used and in our case a 3-mm gap was utilized.
γ˙
FIGURE 8.5 Comparison between viscosity measurements performed in a concentric cylinder (CC), with the vane geometry and smooth cup (V), and vane geometry in a vane cup (VV) on 30% tomato paste suspension. (From Bayod, 2008)

Influence of Fibers and Particle Size Distribution on Food Rheology Chapter | 8 183
8.4.2 Dynamic Oscillatory Rheology
We have, in our investigations, mostly used small-amplitude, sinusoidal, os-cillatory shearing, where in the linear viscoelastic region the material is only deformed. This linear viscoelastic region can be determined experimentally by means of a stress/strain sweep test, while keeping the frequency of the oscilla-tion constant, usually 1 Hz (Fig. 8.6).
In the linear viscoelastic regime the elastic modulus (G′) is independent of the applied strain/stress, as viewed from Fig. 8.6 and the network has not yielded until the nonlinear part occurs at larger strains. Therefore, these types of measurements are interesting in order to obtain structural information of the intact network structure. When G′ > G0, where G0 is the viscous, loss modulus, this is a behavior of a solid-like material like a network, which seems to be the case for both the tomato paste and ketchup in Fig. 8.6.
8.5 IMPORTANT PROPERTIES OF THE FIBER FOR ITS RHEOLOGICAL BEHAVIOR IN SUSPENSIONS
8.5.1 Relative Importance of the Soluble Versus Insoluble Fiber
There has been an ongoing discussion whether the soluble pectin, giving rise to a viscous continuous phase or the insoluble fiber is the most determining factor for rheology of fiber suspensions. The content of soluble pectin in CB tomato pastes is significantly lower than in HB pastes and several authors have suggested that this fact is one of the main reasons for the higher viscosity of the HB tomato paste (Thakur et al., 1996; Chou and Kokini, 1987; Hurtado et al., 2002).
However, den Ouden (1995) and Bayod (2008) showed that there is a sub-stantial difference in viscosity of a pectin solution for example, 0.6% (Fig. 8.7), being a relevant concentration for the continuous phase of a tomato paste and the viscosity of the tomato paste itself (Fig. 8.8). For the latter the viscosity can
FIGURE 8.6 Results of typical strain–sweep measurements performed at a frequency of 1 Hz, for (a) tomato paste and (b) ketchup. The elastic modulus G′ (♦) and the loss modulus G0 (◊) are expressed in Pascal (Pa). (From Bayod, 2008)

184 PART | I Advances in Food Rheology
be as high as 106 Pas at low shear rates, whereas the viscosity of the supernatant of tomato pastes reaches as high as about 20 mPas.
The prerequisite for the insoluble part of the fibers to give rise to such high viscosity at low shear rates, as shown in Fig. 8.8, is their capacity to form networks at concentrations below the maximum packing of particles. This
FIGURE 8.8 Typical apparent shear viscosity as a function of the shear rate in tomato paste (), ketchup before homogenization ( ), and ketchup after homogenization (). (From Bayod, 2008)
FIGURE 8.7 Supernatant viscosity as a function of the degree Brix of the solution, determined at a shear range of 10 s−1 in the supernatant of three tomato pastes: HB 28–30 (j), HB 22–24 (), and CB 36–38 (), at different concentrations. Filled and empty symbols show data for supernatants before and after homogenization, respectively. For comparison, the viscosity of a sucrose solution with 0.6% pectin added is also shown. (From Bayod, 2008)

Influence of Fibers and Particle Size Distribution on Food Rheology Chapter | 8 185
concentration where a network can be formed is specific for each type of fiber suspensions and is an important parameter to describe the rheological prop-erties of the fiber suspension in concern. In the thesis work of H. Bengtsson it was found that there was a relationship between the elastic modulus of the particulate gels of fibers and the amount of soluble pectin (r = 0.87, p < 0.01) although the viscosity of the continuous phase did not give rise to this relation-ship. This observation suggests that the soluble pectin might act as a type of glue in between the insoluble particles thereby creating the network similar to the behavior of pectin in the middle lamella of cell clusters.
8.5.2 Concentration of Particles, Water-Insoluble Solids, and Volume Fraction of Particles
The particle concentration is an important property of the suspension governing its rheological behavior. There are different ways of expressing the concentra-tion, where total solids, water-insoluble solids (WIS), and volume fraction have been used. It is only the last parameter that takes into account the microstruc-ture of the suspension, but it is also difficult to determine. For tomato paste for example, den Ouden (1995) and Rao (1999) claimed that such a high ultracen-trifugation force of 110,000g was needed to separate the solid and liquid phase. However, a centrifugation force of this size will inevitably result in the deforma-tion of the particles, mainly reflecting a compressive volume fraction depending on microstructural factors such as the particle size distribution (PSD), particle shape, packing capacity, and particle deformability.
In Fig. 8.9 the volume fraction of tomato pastes are visualized, where 100% tomato paste can be compared with 50% tomato paste before and after valve homogenization. It is evident from Fig. 8.9 that homogenization increases the
FIGURE 8.9 The volume fraction of tomato paste suspensions following ultracentrifugation at ∼110,000g for 20 min at 20°C. The 100 and 50% paste before homogenization (bh) and 50% paste after homogenization (ah) are shown. (From Bayod, 2008)

186 PART | I Advances in Food Rheology
volume fraction giving another microstructure, which will be discussed later in this chapter.
The most stringent way to express the amount of the insoluble part is to determine the WIS, where the soluble solids (mostly sugars) are washed away by repeated centrifugation until the refractive index of the continuous phase is about zero (den Ouden, 1995). Using dynamic sinusoidal shearing and the vane geometry the elastic modulus has been measured as a function of WIS for the different fruit and root fruit suspensions (Fig. 8.10).
Suspensions can be classified as being dilute, in the transition region, or as concentrated (Steeneken, 1989). In the dilute regime the particles are free to move in the suspension, whereas in the transition region the particles can come in contact with each other without being compressed, but in the concentrated regime the particles can be compressed and fill the space. As seen in Fig. 8.10 the elasticity, G′, of the DF network is dependent on the concentration of in-soluble particles (WIS) for the different fiber suspensions studied. Parsnip be-haves differently compared to the other fiber suspensions, as it does not give rise to a concentrated region until a WIS of about 2.5%, whereas tomato CB and HB, apple, potato pulp, carrot, and yacon all give rise to the concentrated regions below 1% WIS. Yacon has the highest G′ at these low WIS followed by tomato HB and CB. The apple sauce then follows and can give rise to sus-pensions with a G′ of 300 Pa at a WIS of 0.9%. Potato pulp and carrot suspen-sions have the least ability to form networks not including parsnip giving an elasticity of 100–150 Pa at a WIS of about 1.3%. These different behaviors of the fiber suspensions can be assigned to the morphology, PSD, and hardness/deformability of the particles/insoluble fibers and will be discussed in follow-ing sections.
It is particularly interesting to further study the suspensions of the yacon root as they give rise to an exceptionally high elastic modulus of about 700 Pa at a WIS content of 0.87%. This is even higher than for tomato CB at the same WIS concentration. We then assumed that one of the major components of ya-con root fruits, the fructans, as revealed in Fig. 8.3, might contribute to the en-hanced G′. From the results presented in Fig. 8.3, it can be deduced that most of the fructans (70%) are soluble fibers and should then to our former reasoning do not contribute to the network formation. We have studied yacons from varying localities in Bolivia, having different contents of inulin-type fructans given as numbers along the curves in Fig. 8.11, where each curve represents one variety of yacon. According to the results presented in Fig. 8.11, G′ increases with the amount of fructans for each variety. Evidently, it seems as the fructans contrib-ute to the elasticity of the fiber network, but it does not give rise to any sub-stantial increase in the viscosity of the continuous phase, being 3.5–3.7 mPas (Castro et al., 2013), after the insoluble fiber phase had been centrifuged off at 10,000g.
It has been reported that commercial inulin powder can develop crystallin-ity and form particles in aqueous environments and that they are important for

Influence of Fibers and Particle Size Distribution on Food Rheology Chapter | 8 187
inulin gel formation (Bot et al., 2004; Glibowski and Pikus, 2011). Could it be that the fructans in yacon also can crystallize and form particles, but these par-ticles are so small, more in the nanorange, so they will not be centrifuged down but will remain in the soluble phase although they are not soluble. Therefore, the supernatants after been centrifuged at different centrifugal forces were char-acterized by laser diffraction, using a Mastersizer 2000, to see if there were any
FIGURE 8.10 Comparison between the elastic modulus (G′, Pa) of yacon and parsnip suspen-sions (a); tomato CB suspensions (b); and tomato HB, apple, potato pulp, and carrot suspensions (c) as a function of the WIS content (%). (Adapted from Bayod, 2008; Bengtsson, 2009; Castro, 2013)

188 PART | I Advances in Food Rheology
particles in the submicron range. According to the results presented in Fig. 8.12 two populations of particles were obtained, with an average diameter around 100 and 700 nm in the volume-based PSD. In Fig. 8.12 it is also shown that the volume percentage of particles with sizes about 700 nm decreased with in-creased centrifugal force, which is probably due to the progressive removal of these particles with centrifugation.
FIGURE 8.12 Volume-based PSD of supernatants after centrifugation of a yacon suspension at varying centrifugal forces. (From Castro, 2013)
FIGURE 8.11 Elastic modulus as a function of WIS for four yacon varieties with different content of inulin-type fructans given as numbers along the curves. Average values and stan-dard deviations are presented (Castro et al., 2013).

Influence of Fibers and Particle Size Distribution on Food Rheology Chapter | 8 189
These results suggest that there are particles in the nanorange in the soluble phase that can most probably be related to the fructans, as they constitute most of the content in the soluble phase (Fig. 8.3b). We also studied the supernatant and the pellet after different centrifugation forces under the light microscope (Fig. 8.13). As the fructan particles are supposed to be of crystalline nature they
FIGURE 8.13 Optical microscopy images of supernatants and pellets obtained at four dif-ferent centrifugal forces. CF, centrifugal force. Scale bar: 20 µm. (From Castro, 2013)

190 PART | I Advances in Food Rheology
ought to be brighter in the micrographs in Fig. 8.13. For the supernatant only a small number of bright particles can be observed as most of the particles are smaller than the detection limit of the light microscope of about 1 µm. For the pellet also small bright particles can be seen and they are either dispersed in the continuous phase or seem to be adhered to the cell wall material. If the latter case is relatively occurrent it might be this phenomenon that binds the cell wall material together in a network forming a gel of a yacon suspension at relatively low concentration of WIS of about 0.9%.
8.5.3 Morphology of the Insoluble Fiber
The morphology of the cells found in fruits, root fruits, and vegetables can vary depending on the origin, kind of tissue, and its function. Light microscopy is the most direct way of examining the morphology of cells as they are in the microm-eter range. The shape and arrangement can easily be observed in semidilute and dilute systems, but for concentrated suspensions they are too dense and by dilut-ing you cannot be sure you are observing the same microstructure. In Fig. 8.14a a micrograph of a tomato HB paste can be seen and it reveals that the paste micro-structure consists of mostly whole cells of a size of about 200 µm together with some broken cells and cell wall material. In contrast, in the valve homogenized version of the diluted tomato paste as in a ketchup, as visualized in Fig. 8.14b, a significant change in the microstructure can be observed. This suspension con-tains mostly small cell fragments that seem to aggregate and the large whole cells of 200 µm are no longer visible. The influence of homogenization on the rheolog-ical properties of the fiber suspensions will be further dealt with in Section 8.6.
For comparison a microscopic image of potato pulp can be seen in Fig. 8.15 at two magnifications, where a more detailed view of the cell structure can be observed at the larger magnification. The morphology of the two fiber suspen-sions of tomato HB and potato pulp is different. Each cell for the potato is smaller than for the tomato paste but they are not in the form of single cells but appear mostly as cell clusters.
FIGURE 8.14 Typical micrograph of tomato cells (a) and tomato cell fragments after homogeni-zation (b). Scale bar: 150 µm. (From Bayod et al., 2008)

Influence of Fibers and Particle Size Distribution on Food Rheology Chapter | 8 191
In Fig. 8.16 the morphology of apple, tomato HB, potato pulp, and carrot suspensions can be compared. Apple and tomato suspensions consist mainly of whole, single cells and cell fragments, as can be seen in Fig. 8.16a,b, while car-rot and potato pulp suspensions consist of smaller cells arranged in large clus-ters (Fig. 8.16c,d). It can be seen that the potato pulp, which was dried in this
FIGURE 8.15 Microscopic images of potato pulp at 20× magnification (a) and 50× magnifica-tion (b). (From Bengtsson, 2009)
FIGURE 8.16 Micrographs of (a) apple, (b) tomato, (c) potato pulp, and (d) carrot suspensions. Scale bar: 300 µm. (From Bengtsson, 2009)

192 PART | I Advances in Food Rheology
case, has a highly aggregated structure compared to the other DF sources, which were not dried. Each cell in the carrot cluster of cells is in the range of 50 µm.
The micrograph in Fig. 8.17a reveals that the parsnip cells are relatively rounded and small with a diameter about 100 µm, but they are kept together in clusters like the potato pulp and carrot suspensions. Likewise for the yacon dispersions (Fig. 8.17b), but the cells are slightly more rectangular.
Comparing the capacity of different DF suspensions to form networks with a high elastic modulus as in Fig. 8.10, it seems as those having more single cell struc-ture, like tomato and apple are more inclined to form good networks at a lower par-ticle concentration than those consisting of smaller cells firmly hold together in cell clusters, like potato pulp, carrot, and parsnip. The DF in the latter suspensions also contain higher contents of insoluble pectin as revealed in Figs. 8.2 and 8.3, prob-ably gluing the cells together in the cell cluster. The fiber that does not fit into this pattern is yacon, but the reason for that is the suggested contribution of the nano-sized crystal particles of fructans as already discussed at the end of Section 8.5.2.
8.5.4 Particle Size Distribution of the Insoluble Fiber
PSD of food suspensions is an important characteristic for their rheological behavior. In the studies laser light diffraction has been used and the diffrac-tion data were analyzed using the Fraunhofer diffraction method. This method can handle polydisperse systems and it has been used in determining the PSD of tomato products (den Ouden and Van Vliet, 1997). It also assumes that the particles are spherical, but it adequately describes the particle size of fibers (ie, cylinders) with diameters larger than 8 µm (Powers and Somerford, 1978).
The apparatus used in the earlier thesis was a Coulter LS130 particle ana-lyzer (Beckman Coulter, High Wycombe, United Kingdom) and it can mea-sure particle sizes in the range of 0.1–900 µm. Particles larger than 900 µm are therefore not included in the calculations of the mean diameter. For the fruit and vegetable suspensions studied mostly a bimodal surface area–based PSD could be seen (Fig. 8.18).
FIGURE 8.17 Microscopic images of parsnip (a) and yacon (b) suspensions. Scale bar: 600 µm. (Adapted from Castro, 2013)

Influence of Fibers and Particle Size Distribution on Food Rheology Chapter | 8 193
The PSD of all the DF suspensions studied are compared in Figs. 8.18 and 8.19. In Fig. 8.19 also the influence of different number of passes through a valve homogenizer has been given and that will be discussed further in Sec-tion 8.6. For all DF suspensions studied bimodal-based PSD can be observed. For the larger particles above 100 µm apple and tomato HB give rise to the smallest particles followed by carrot and potato pulp (Fig. 8.18). The PSD of parsnip and yacon have large particles similar in size to carrot and potato pulp, where parsnip though has a wider size distribution in that particle range. For the smaller particles below 100 µm relatively similar sizes can be observed among apple, tomato HB and carrot and potato pulp being a bit larger (Fig. 8.18). How-ever, parsnip suspensions give rise to larger particles below 100 µm and yacon suspensions to the smallest in that particle range.
Again comparing the network capacity of the DF suspensions as revealed in Fig. 8.10 with the PSD as presented in Figs. 8.18 and 8.19 it seems advantageous
FIGURE 8.18 Particle size of the surface area–weighted distribution of the 0.8 g/100 g fiber suspensions. –, Apple; – –, tomato HB; – - –, potato pulp; and – - - –, carrot. (From Bengtsson, 2009)
FIGURE 8.19 Area-based PSD of parsnip (a) and yacon (b) suspensions from 0 to 10 passes of homogenization (PH). (Adapted from Castro, 2013)

194 PART | I Advances in Food Rheology
to have decreased the size of the larger particles above 100 µm like apple and tomato compared to the larger cell clusters as observed for parsnip, carrot, and potato pulp in that particle size range.
The mean particle size can be calculated based on the volume or area oc-cupied by the particles, expressed as D43 and D32, respectively.
∑∑
=Dn D
n D
i ii
i ii
43
4
3
∑∑
=Dn D
n D
i ii
i ii
32
3
2
where ni is the percentage of particles with diameter Di. The largest particles in the suspension have the greatest influence on the volume-weighted mean diam-eter D43, while the smaller particles also come into play in the surface-weighted mean diameter D32. According to the polydispersity of the PSD of the fiber suspensions it can be convenient to treat the large and small particles separately and calculate D32 for each fraction and the percentage coarse and fine fraction, respectively. In Table 8.2 the surface-weighted mean diameter D32 is given for the larger particles above 100 µm (D32(l)) and below (D32(s)) together with the volume fraction in each fraction achieved from the volume-based PSD for all the DF dispersions studied.
It is clear from the results given in Table 8.2 that the larger particles make up volumewise the biggest part of the DF suspensions and therefore dominate in the network formation. As observed earlier the apple suspensions give rise to
D43=∑iniDi4∑iniDi3
D32=∑iniDi3∑iniDi2
TABLE 8.2 The Surface-Weighted Mean Diameter D32 for Larger Particles Above 100 µm (D32(l)) and Below (D32(s)) Together With the Volume Fraction in Each Fraction for all the DF Dispersions Studied
DF suspension D32(s) (µm) Vol.% (s) D32(l) (µm) Vol.% (l)
Apple 20.6 5.6 279.1 94.4
Tomato HB 22.1 7.1 300.0 92.9
Potato pulp 16.4 6.0 383.3 94.0
Carrot 15.2 4.3 362.3 95.7
Parsnip 26.6 14.2 332.6 85.8
Yacon 9.6 3.4 326.0 96.6
Source: Adapted from Bengtsson (2009) and Castro (2013)

Influence of Fibers and Particle Size Distribution on Food Rheology Chapter | 8 195
the smallest D32(l) and the potato pulp the largest, whereas the smallest and larg-est D32(s) can be seen for parsnip and yacon, respectively. It is interesting to note the low volume percentage of large particles for parsnip of 85.8% compared to 93–96% for the other fiber suspensions. This can be one of the reasons for the low capacity of parsnip to form networks at a low WIS as seen in Fig. 8.10.
It might be anticipated that the area the large particles (AL) can form is im-portant for the rheological behavior of the fiber suspensions in such a way that the larger the area the higher the probability for the particles to encounter each other to form junction points in the network and the higher the elastic modulus of the network. Therefore, we have calculated AL accordingly:
φ=
××A
D
6vol %L
32L
where φ is the volume fraction of the pellet in the suspension after ultracentri-fugation and volL is the volume percentage of large particle obtained from the volume-based PSD. The results are expressed in squared centimeter per millili-ter. We assume that the volume fraction of particles is equal to the volume frac-tion of the pellet after the ultracentrifugation of the suspension. Unfortunately, the volume fraction of the pellet in the suspension after ultracentrifugation was not determined in the same way for parsnip and yacon and the apple, tomato HB, potato pulp, and carrot on the other hand, where the former were centri-fuged at 10,000g and the latter at 50,000g. Therefore, they cannot be compared in their capacity to form network in relation to the area of the large particles (AL), but this has been done for the apple, tomato HB, potato pulp, and carrot in Table 8.3.
A linear regression between G′ versus AL gave a significant relationship with an R2 = 0.84, which suggests that the area of the large particles in the DF suspension can be relevant for their rheological behavior.
AL=6×φD32×volL%
TABLE 8.3 Different Parameters in Order to Calculate the Area of Large Particles, AL, for Apple, Tomato HB, Potato Pulp, and Carrot Suspensions and the Elastic Modulus (G′) of About 1% Dispersions of These Suspensions
DF suspension D32(L) (µm) Vol.% (L) φ AL (cm2/mL) G′ (Pa)
Apple 279.1 94.4 0.114 23.13 176.7
Tomato HB 300 92.9 0.100 18.58 75.4
Potato pulp 383.3 94.0 0.053 7.80 28.6
Carrot 362.3 95.7 0.068 10.78 47.9
Source: Calculated from Bengtssons (2009)

196 PART | I Advances in Food Rheology
We will now continue with the next section to describe how valve homog-enization and subsequent shearing (pumping) will influence the rheological properties of the fiber suspensions.
8.6 INFLUENCE OF VALVE HOMOGENIZATION AND SHEARING ON THE RHEOLOGICAL PROPERTIES OF FIBER SUSPENSIONS
8.6.1 Influence of Valve Homogenization
As seen in Sections 8.5.3 and 8.5.4 the particle size and form of the insoluble fiber are essential parameters for their rheological behavior and one way to influence these parameters is to use high-pressure homogenization. The high pressure is achieved by pumping a suspension through a thin valve opening. The energy of the pressure drop generated is converted into turbulent flow after the valve, which creates eddies and causes breakdown of the particles (Innings and Trägårdh, 2005). Homogenization to change the properties of fiber suspen-sions has traditionally been used mainly in the processing of tomatoes (Luh et al., 1954) and production of fruit juices (Betoret et al., 2009).
A lab-scale valve homogenizer (Tornberg and Lundh, 1978) was used throughout these studies. The homogenizer was used at a maximum of 90 bars and the number of passages were counted. Samples were homogenized batch-wise to ensure that all the particles in the suspensions had passed through the valve the same number of times.
One of our first studies (Bayod and Tornberg, 2011) on the influence of ho-mogenization on the rheological and microstructural properties of the fiber sus-pension was performed on tomato suspensions prepared from CB tomato paste of 36–38°Brix. Three concentrations of paste (10, 30, and 40% w/w) were used in the experiments. The samples were subjected to different number of passages (H1, H2, and H3) through the lab homogenizer in order to obtain different de-grees of homogenization and H0 designates nonhomogenized samples. In order to imitate what was happening to the tomato suspensions when being pumped after homogenization the different samples were afterward subjected to shear-ing using a magnetic stirrer during 1 h at room temperature. All samples were sheared under similar conditions (∼750 rpm). Dynamic rheological measure-ments and the PSD were performed as described in Sections 8.4.2 and 8.5.4, respectively. The volume fraction of particles was determined by subjecting the samples to centrifugation at ∼110,000g for 20 min.
As viewed from the results given in Table 8.4 the particles in CB tomato suspensions are very susceptible to breakage during valve homogenization as both the fine and coarse median diameter (D32) decrease substantially after only three passages through the valve homogenizer. The amount of particles in the coarse fraction decreases from 73% to 25% for the 10% dispersion but this behavior is less pronounced for the more concentrated dispersions of 30 and 40%. Consequently, the fine-to-course ratio f/c rises on degree of

Influence of Fibers and Particle Size Distribution on Food Rheology Chapter | 8 197
homogenization the more so for the 10% suspension and less for the other two concentrations. On subsequent shearing however, the particles start to aggre-gate again, which is especially seen for the 10% dispersion, where the course size fraction now has increased from 25% to 34% after being homogenized 3 times (H3) and sheared.
TABLE 8.4 The Influence of Homogenization (H0, H1, H2, and H3) and Subsequent Shearing on CB Tomato Fiber Suspensions
Shearing Concentration (%) H
Size fraction Median diameter (D32)
Coarse > 10 µm (%)
f/c (−)
Coarse (µm)
Fine (µm)
Nonsheared
10 H0 73 0.4 177 3.1
H1 47 1.1 119 1.2
H2 28 2.6 72 0.8
H3 25 3.0 54 0.7
30 H0 73 0.4 177 3.1
H1 74 0.4 141 4.0
H2 40 1.5 80 0.7
H3 38 1.6 63 0.5
40 H0 73 0.4 177 3.1
H1 75 0.3 148 4.0
H2 63 0.6 115 2.2
H3 37 1.7 59 0.7
Sheared 10 H0 72 0.4 175 3.5
H1 50 1.0 114 1.5
H2 37 1.7 72 0.8
H3 34 1.9 57 0.8
30 H0 67 0.5 179 2.4
H1 75 0.3 145 4.0
H2 36 1.8 98 0.7
H3 39 1.6 57 0.9
40 H0 68 0.5 176 2.4
H1 76 0.3 159 4.0
H2 68 0.5 126 3.0
H3 41 1.4 67 1.0
Percentage of particles with sizes larger than 10 µm (areabased PSD) and ratio between fine and coarse particles (f/c), that is, those below and above 10 µm, respectively. The median diameter for those size fractions is also given.Source: From Bayod and Tornberg (2011)

198 PART | I Advances in Food Rheology
This phenomenon is also visualized in light micrographs of the 10% tomato suspensions subjected to different degree of homogenization and subsequent shearing (Fig. 8.20). The left series of images in Fig. 8.20 reveal the successive creation of an evenly distributed network by passing the suspension through the homogenizer several times. An evident decrease of the particle size is noticed,
FIGURE 8.20 Binary images of 10% tomato paste suspensions at different degrees of ho-mogenization (H0, H1, H2, and H3), before and after subsequent shearing (SH). Scale bar: 250 µm. (From Bayod and Tornberg, 2011)

Influence of Fibers and Particle Size Distribution on Food Rheology Chapter | 8 199
which is accompanied by an increase in the surface area covered by the par-ticles. Posterior shearing of the suspensions had no visible influence at low de-gree of homogenization, but the structure of the suspensions becomes distinctly different after shearing, for the well-homogenized suspensions. In fact, in the homogenized-and-sheared suspensions (H3-SH) the individual particles tend to aggregate forming heterogeneous regions with densely packed flocs, resulting in a different type of network. It can therefore be deduced that homogenization of CB tomato suspensions creates a network that is disrupted by shearing, de-pending on the degree of homogenization.
How does this behavior of the CB tomato suspensions on homogenization and shearing show up in the rheological behavior? In Fig. 8.21 both the volume frac-tion (φ) and the linear elastic modulus (G′, w = 1Hz) is shown as a function of the fine-to-coarse ratio (f/c) for the 10, 30, and 40% tomato paste suspensions, giving the filled symbols before shearing and empty symbols after prolonged shearing. It can be observed that high elastic modulus around 1000 Pa can be formed for the 30 and 40% tomato suspensions and also a large volume fraction between 30 and 40% in this concentration range. Moreover, it is interesting to note for the 10% suspension that the G′ increases with the fine-to-course ratio, meaning that the homogenized particles contribute to the network formation, being so many more than before homogenization thereby enhancing the elastic modulus. This dependence is not observed for the higher concentrations of 30 and 40%, but the volume fraction (Fig. 8.21a) was found to be more sensitive to changes in the microstructure of the highly concentrated suspensions giving an enhanced φ with increasing f/c. For the 10% suspension it can be seen that the filled symbols, that is, those samples that had been homogenized but not sheared have higher G′ than those subjected to prolonged shearing. This is in accordance with the observations made in the micrographs, where the densely packed flocs cannot form such a good network after being well homogenized and sheared as for the well homogenized nonsheared. This observation tells us that newly homogenized tomato suspensions should be avoided to be pumped any long distance.
We then extended our investigations on the influence of valve homogenization to suspensions of apple, tomato HB, potato pulp, and carrot. The microstructure before and after homogenization is visualized in the micrographs of Fig. 8.22. Highly homogenized means, in this case, a pressure drop of about 90 bars for about 1% insoluble matter and the number of passes through the valve homog-enizer varies from about 10 to 20, so substantially larger numbers have been used compared to those used for the CB tomato suspensions described earlier.
The effects of homogenization on the fibers’ morphology from different sources were different. For apple suspensions the cellular structure can still be seen with the higher degree of homogenization (H2), whereas the cellular struc-ture in the tomato suspensions was almost completely broken down, and mainly small cell fragments can be seen, in accordance with the results presented by Bayod and Tornberg (2011) for CB tomato suspensions. Potato pulp suspen-sions were also highly affected by homogenization. The large aggregates were

200 PART | I Advances in Food Rheology
degraded into smaller clusters of cells, where each cell entity in the potato pulp was more similar in size to those of the carrot single cells (estimated from the micrographs to be around 50 µm) than the other fibers studied here, which have larger cells (100–300 µm). The carrot cell clusters were somewhat reduced by homogenization and the clusters consisted of fewer cells after homogenization.
FIGURE 8.21 (a) Volume fraction (φ) and (b) linear elastic modulus (G′, w = 1Hz) as a function of the fine-to-coarse ratio (f/c) for 10, 30, and 40% tomato paste suspensions (♦, , and , respectively). Filled symbols represent samples before shearing and empty symbols are samples that have been subjected to prolonged shearing. The lines are a guide to the eye. (From Bayod and Tornberg, 2011)

Influence of Fibers and Particle Size Distribution on Food Rheology Chapter | 8 201
Light microscopic pictures were also taken for parsnip and yacon suspen-sions before and after valve homogenization with 10 passes (Fig. 8.23). Accord-ing to these pictures the parsnip suspensions before homogenization comprise large cell clusters of about 600 µm, as well as small clusters. Yacon suspensions mainly consist of larger cell clusters of about 600 µm, and small fragments distributed in the continuous phase. Most of the large cell clusters in parsnip suspensions were reduced in size after homogenization into smaller cell clusters and the parsnip cells remained more or less intact like the carrot and potato pulp suspensions. In case of yacon suspensions, homogenization reduced the size of the large cell clusters into smaller ones, but it also seemed to lead to the forma-tion of aggregates of cell fragments. These aggregates were more evident at a high content of 100% yacon paste (Fig. 8.23).
In Table 8.5 we have summarized the characteristics of PSD of the differ-ent fiber suspensions studied where H0 is the nonhomogenized sample and H1 designates valve homogenization of the fiber suspension with 8–11 passes. For all the studied fiber suspensions homogenization means a reduction in size of the largest particle as reflected, for example, as a reduction in D43. This reduc-tion though varies substantially between the fibers, where yacon suspension has the least, whereas apple has the most followed by tomato HB and parsnip. If we further study the mean diameter of D32(L) of the particles above 100 µm a similar relationship is observed as for D43. For those particles being below 100 µm another phenomenon can occur as seen for D32(s), where an increase in particle size occurs on homogenization, that is, the smaller particles ag-gregate. This can be observed for apple, potato pulp, carrot, and yacon. The only suspension with a substantial decrease in the smallest particles is for the
FIGURE 8.22 Micrographs of nonhomogenized (H0) and highly homogenized (H2) fiber suspensions. Scale bar: 300 µm. (From Bengtsson and Tornberg, 2011)

202 PART | I Advances in Food Rheology
tomato HB suspensions, which fits into the observation made in the micro-graphs (Fig. 8.22). There it is shown that the whole tomato cells are more or less totally disintegrated to smaller cell fragments on homogenization, which does not occur for any of the other fiber suspensions. It is interesting to note that the smallest particles of 9.6 µm below 100 µm before homogenization is observed for yacon suspensions, which probably is due to the nanosized fructan crystal particles. These particles seem to be susceptible to aggregation on homogeniza-tion, which is revealed both in Fig. 8.23 and Table 8.5. The smaller particles of parsnip supensions seem to be indifferent to homogenization as D32 does not change on this type of processing.
Moreover, there is a decrease in the amount of large particles (vol.% (L)) for all the fiber dispersions on homogenization and it is at most for the tomato suspensions going down from 92.9% to 81.9% and the least for the yacon only changing about 1% on homogenization. The large lowering of about 8–10% of the large particles is observed for apple, tomato HB dispersions, and parsnip, whereas potato pulp and carrot only achieve a lowering of about 4%. Parsnip is special among the fiber suspensions having as nonhomogenized a low amount
FIGURE 8.23 Optical microscopy images of parsnip and yacon suspensions before and after homogenization (10 passes). Scale bar: 600 µm. (Adapted from Castro, 2013)

Influence of Fibers and Particle Size Distribution on Food Rheology Chapter | 8 203
of large particles of 85.8% being further reduced on homogenization to such a low value of 74.7%.
How do these changes in PSD of the fiber suspension on homogenization show up in their microstructural behavior expressed as volume fraction after centrifugation and as the elastic modulus of the fiber network? We have in Fig. 8.24 plotted the volume fraction as a function of the degree of homogeniza-tion expressed as the ratio between fine and coarse particles (f/c), that is, those below and above 100 µm in the volume-based PSD, for apple, parsnip, tomato HB, potato pulp, and carrot fiber suspensions.
First, we can observe that the volume fraction of the centrifuged pellet is lower varying from 5% to 25% for all the fiber suspension than for tomato CB as seen in Fig. 8.21a, although the latter had twice as high a centrifugal force. Tomato CB could reach such a high volume fraction of about 50% for the highest concentrations. Moreover, for parsnip and apple and especially for the former astonishingly homogenization decreases the volume fraction, whereas tomato HB, potato pulp, and carrot show the opposite behavior, that is, an in-crease in volume fraction on homogenization. It seems as the smaller particles formed on homogenization for parsnip and apple do not contribute to the net-work and therefore do not give rise to an increased elastic modulus (G′) of the network as seen from Fig. 8.25. However, for the potato pulp, tomato HB,
TABLE 8.5 The Characteristics of the PSD for Different Fiber Suspensions Nonhomogenized (H0) and Homogenized 8–11 Passages (H1)
DF suspension D43 (µm) D32(s) (µm) D32(L) (µm) Vol.% (L) f/c
Apple H0 358.6 20.6 279.1 94.4 0.059
Apple H1 196.2 33.1 190.8 86.0 0.163
Tomato HB H0 356.0 22.1 300.0 92.9 0.076
Tomato HB H1 237.7 20.5 244.5 81.9 0.221
Potato pulp H0 473.1 16.4 383.3 94.0 0.064
Potato pulp H1 289.4 25.5 264.3 90.5 0.105
Carrot H0 447.1 15.2 362.3 95.7 0.045
Carrot H1 281.1 25.0 246.3 91.2 0.096
Parsnip H0 405.9 26.6 332.6 85.8 0.166
Parsnip H1 247.6 26.2 226.8 74.7 0.339
Yacon H0 385.6 9.6 326.0 96.6 0.035
Yacon H1 310.3 15.1 275.5 95.3 0.049
Percentage of particles with sizes larger than 100 µm (Vol.% (L) on volumebased PSD) and ratio between fine and coarse particles (f/c), that is, those below and above 100 µm, respectively, is also inserted.Source: Adapted from Bengtsson, 2009 and Castro, 2013

204 PART | I Advances in Food Rheology
and carrot, homogenization enhances the G′, which is in accordance with the increase in volume fraction (Figs. 8.24 and 8.25).
Although the volume fraction as given in Fig. 8.24 is of importance in de-termining the elastic modulus of the fiber suspension the mean particle size and amount of large particles above 100 µm also come into play and by calculating AL, the area of the large particles, all these parameters are considered according
FIGURE 8.24 The volume fraction of the pellet achieved by centrifugation (%) as a function of the ratio between fine and coarse particles (f/c), that is, those below and above 100 µm for apple and parsnip suspensions (a) and tomato HB, potato pulp, and carrot fiber suspensions (b). (Adapted from Bengtsson, 2009; Castro, 2013)
FIGURE 8.25 The elastic modulus (G′) of (a) fiber suspensions of potato pulp, tomato HB, apple, and carrot on different degree of homogenization (H0, H1, and H2) and (b) for parsnip suspensions on homogenization up to 10 passes at different concentrations. (Adapted from Bengtsson and Torn-berg, 2011; Castro et al., 2012)

Influence of Fibers and Particle Size Distribution on Food Rheology Chapter | 8 205
to the equation given in Section 8.5.4. Accordingly, AL has been calculated for differently homogenized suspensions of apple, tomato HB, potato pulp, and car-rot at two concentrations of 0.8 and 1.2% of insoluble matter. The measured G′ has been plotted as a function of AL for the different suspension in Fig. 8.26. For each suspension in Fig. 8.26 there is a linear relationship between G′ and AL having an R2 varying from 0.7 to 0.9, where the slope differs between the differ-ent suspensions. The smallest slope of 3.2 is shown for carrot and it is a similar slope for the tomato HB being 3.7. Substantially larger slopes are observed for apple and potato pulp being 22.3 and 34.7, respectively. We are in the concen-trated region for all the fiber dispersions and in that region Steeneken (1989) has shown that the rigidity of the particles leads to higher elastic properties. In our calculations of AL we have not considered the rigidity of the particles and it might be the reason for the varying slopes of the linear relationships observed in Fig. 8.26. The small slope of tomato HB can probably be ascribed to the rela-tively low content of insoluble pectin and its susceptibility to homogenization indicating a relatively low rigidity of the particles.
Potato pulp on the other hand has the highest content of insoluble pectin among the fiber suspensions compared, which might explain a high rigidity of the particles, but the same cannot be seen for carrot particles in the same range of insoluble pectin. Apple suspensions seem to contain relatively rigid particles according to these results, where the relatively intact apple cells after homog-enization can be a sign of this rigidity, but a relatively low content of insoluble pectin with the apple suspensions does not fit into that picture.
In Fig. 8.27 the elastic modulus (G′) as a function of the surface area of large particles (AL) of differently homogenized parsnip suspensions at four concen-trations can be seen. Not until the concentration region of an AL of 32 cm2/mL is reached a linear relation between G′ and AL can be observed. The slope in the concentrated region is ∼50 for parsnip suggesting a relatively rigid particle.
FIGURE 8.26 Elastic modulus (G′) as a function of the surface area of large particles (AL) for differently homogenized suspensions of apple, tomato HB, potato pulp, and carrot at two concentra-tions of 0.8 and 1.2% of insoluble matter. (Calculated from Bengtsson and Tornberg, 2011)

206 PART | I Advances in Food Rheology
8.7 CONCLUDING REMARKS
This chapter has dealt with the rheology of DF suspensions and factors that are important to control and govern their rheology. A number of thesis work (Bayod, 2008; Bengtsson, 2009; Castro, 2013) performed at the Department of Food Technology in Lund have been the basis of this overview. The origin of the vegetable DF investigated was tomato CB and HB, apple, carrot, potato, parsnip, and yacon.
In the cell wall of root fruits, fruits, and vegetables the structure is built up of a network of insoluble cellulose fibrils, hemicelluloses and pectins, where the latter two can be partly soluble. These components make up the DF content. Yacon root fruit also contains another interesting fiber, namely fructooligosac-charides (inulin-type fructans).
The DF content of apple, tomato, and carrot is about 20% of the DM, where the soluble part (mainly pectin) is 3 and 2% of DM for tomato and apple, where-as for potato pulp and carrot it is below 1%. For parsnip the amount of DF is even higher ∼30% of DM, where 5% is the soluble part. The highest DF content was found in yacon around 45% of DM, but in this case the fructans constitute a substantial amount (35%) of DM and out of which 25% of DM is soluble.
For the fibers like carrot and potato pulp containing high amounts of insolu-ble pectin the morphology of the cells is cell clusters even after homogenization,
FIGURE 8.27 Elastic modulus (G′) as a function of the surface area of large particles (AL) of four parsnip suspensions with 10, 30, 40, and 50% paste, before (0 passes) and after homogenization (1, 5, and 10 passes). (From Castro et al., 2012)

Influence of Fibers and Particle Size Distribution on Food Rheology Chapter | 8 207
whereas tomato suspensions having larger, single cells originally are easily de-graded to cell fragments by homogenization. Apple cells originally also having larger, single cells are though not so easily degraded by homogenization.
Usually bimodal area–based PSDs are observed for fiber suspensions in general, where the smaller particles are between 1 and 100 µm and the larger between 100 and 1000 µm. The widest distributions are observed for carrot, parsnip, and potato pulp having the largest content of insoluble pectin. The larg-er particles always decrease on homogenization, but aggregation of the smaller particles can also occur (apple, potato pulp, carrot, and yacon). On homogeniza-tion the shift of the larger particles in the bimodal PSD to the smaller ones usu-ally gives rise to a better volume fraction (tomato HB and CB, potato pulp, and carrot), but for some DF suspensions (parsnip and apple) it is rather a lowering of it as the smaller particles generated do not seem to contribute to the network instead being placed in the voids in the network.
As most of the particles belong to the larger particles (>100 µm) they con-stitute the network and larger the area of this network the larger the elasticity, G′. This seems to hold for all the DF suspensions except for yacon.
The elasticity, G′, of the DF network is dependent on the concentration of in-soluble particles (WIS), where parsnip does not give rise to the concentrated re-gion until a WIS of about 2.5%, whereas tomato CB and HB, apple, potato pulp, carrot, and yacon all give rise to the concentrated region below 1% WIS. Yacon has the highest G′ at these low WIS, where the fructans, although belonging to the soluble fiber, seem to be able to form very small particles in the nanorange, contributing to the network of the whole yacon paste and thereby the high G′.
Conclusively, the pectin-rich vegetable fibers seem to glue the insoluble par-ticles to each other, probably through pectin adhering to the insoluble fiber and forming a gel. This network of insoluble fibers has an elastic modulus by far much higher than the gel formed by the soluble pectin in the water phase. The capacity of this network of insoluble fibers, to give rise to a high elastic modu-lus, is dependent on the amount of WIS, the area of large particles, and, in the concentrated region also, on the hardness of the particles.
REFERENCES
Barnes, H.A., 1999. The yield stress—‘panta rei’—everything flows? J. Non-Newtonian Fluid Mech. 81 (1–2), 133–178.
Barnes, H.A., Nguyen, Q.D., 2001. Rotating vane rheometry—a review. J. Non-Newtonian Fluid Mech. 98 (1), 1–14.
Bayod, E., 2008. Microstructure and rheological properties of concentrated tomato suspensions during processing. PhD Thesis, Lund University.
Bayod, E., Pilman Willers, E., Tornberg, E., 2008. Rheological and structural characterization of tomato paste and its influence on the quality of ketchup. LWT—Food Sci. Technol. 41 (7), 1289–1300.
Bayod, E., Tornberg, E., 2011. Microstructure of highly concentrated tomato suspensions on ho-mogenization and subsequent shearing. Food Res. Int. 44 (3), 755–764.

208 PART | I Advances in Food Rheology
Bengtsson, H., 2009. The physicochemical and sensory properties of fruit and vegetable fibre sus-pensions. PhD Thesis, Lund University.
Bengtsson, H., Tornberg, E., 2011. Physicochemical characterization of fruit and vegetable suspen-sions. I: Effect of homogenization. J. Text. Stud. 42, 268–280.
Betoret, E., Betoret, N., Carbonell, J.V., Fito, P., 2009. Effects of pressure homogenization on par-ticle size and the functional properties of citrus juices. J. Food Eng. 92 (1), 18–23.
Bot, A., Erle, U., Vreeker, R., Agterof, W.G.M., 2004. Influence of crystallisation conditions on the large deformation rheology of inulin gels. Food Hydrocoll. 18 (4), 547–556.
Castro, A., 2013. Physicochemical properties of root fiber suspensions. PhD Thesis, Lund Univer-sity.
Castro, A., Bergenståhl, B., Tornberg, E., 2012. Parsnip (Pastinaca sativa L.): dietary fibre com-position and physicochemical characterization of its homogenized suspensions. Food Res. Int. 48, 598–608.
Castro, A., Céspedes, G., Carballo, S., Bergenståhl, B., Tornberg, E., 2013. Dietary fiber, fructooli-gosacharides, and physicochemical properties of homogenized aqueous suspensions of yacon (Smallanthus sonchifolius). Food Res. Int. 50, 392–400.
Chou, T.D., Kokini, J.L., 1987. Rheological properties and conformation of tomato paste pectins, citrus and apple pectins. J. Food Sci. 52 (6), 1658–1664.
den Ouden, F.W.C., 1995. Physico-chemical stability of tomato products. PhD Thesis, Wageningen Agricultural University.
den Ouden, F.W.C., Van Vliet, T., 1997. Particle size distribution in tomato concentrate and effects on rheological properties. J. Food Sci. 62 (3), 565–567.
Glibowski, P., Pikus, S., 2011. Amorphous and crystal inulin behavior in a water environment. Carbohydr. Polym. 83 (2), 635–639.
Gray, J., 2006. Dietary Fibre—Definition, Analysis, Physiology and Health. ILSI Europe, Brussels.Hurtado, M.C., Greve, L.C., Labavitch, J.M., 2002. Changes in cell wall pectins accompanying
tomato (Lycopersicon esculentum Mill.) paste manufacture. J. Agric. Food Chem. 50, 273–278. Innings, F., Trägårdh, C., 2005. Visualization of the drop deformation and break-up process in a
high pressure homogenizer. Chem. Eng. Technol. 28 (8), 882–891. Luh, B.S., Dempsey, W.H., Leonard, S., 1954. Consistency of pastes and puree from pearson and
san marzano tomatoes. Food Technol. 8, 576–580. Nguyen, Q.D., Boger, D.V., 1992. Measuring the flow properties of yield stress fluids. Annu. Rev.
Fluid Mech. 24, 47–88. Powers, S.R., Somerford, D.J., 1978. Fibre sizing using Fraunhofer diffraction. Opt. Commun. 26
(3), 313–317. Rao, M.A., 1999. Rheology of Fluid and Semisolid Foods. Principles and Applications. Aspen
Publishers, Inc., Gaithersburg, MD. Steeneken, P.A.M., 1989. Rheological properties of aqueous suspensions of swollen starch gran-
ules. Carbohydr. Polym. 11 (1), 23–42. Thakur, B.R., Singh, R.K., Nelson, P.E., 1996. Quality attributes of processed tomato products: a
review. Food Rev. Int. 12 (3), 375–401. Theander, O., Åman, P., Westerlund, E., Andersson, R., Pettersson, D., 1995. Total dietary fiber
determined as neutral sugar residues, uronic acid residues, and Klason lignin (the Uppsala method): collaborative study. J. AOAC Int. 784, 1030–1044.
Tornberg, E., Lundh, G., 1978. Functional characterization of protein stabilized emulsions: stan-dardized emulsifying procedure. J. Food Sci. 43 (5), 1553–1558.
Valencia, C., Sánchez, M.C., Ciruelos, A., Gallegos, C., 2004. Influence of tomato paste processing on the linear viscoelasticity of tomato ketchup. Food Sci. Technol. Int. 10 (2), 95–100.
209Advances in Food Rheology and Its Applications. http://dx.doi.org/10.1016/B978-0-08-100431-9.00009-7Copyright © 2017 Elsevier Ltd. All rights reserved.
Chapter 9
Time–Temperature Superposition Principle and its Application to Biopolymer and Food Rheology
J. AhmedFood and Nutrition Program, Environment and Life Sciences Research Center, Kuwait Institute for Scientific Research, Kuwait City, Kuwait
9.1 INTRODUCTION
Properties of viscoelastic materials are influenced by both measurement tem-perature and time (frequency). Under a constant stress/load, the deformation or strain (compliance) shown by the material will increase over a period of time due to molecular rearrangement. Therefore, the compliance or modulus measurements carried out over a short time period could generate a data that is either overestimated or underestimated. Therefore, it is essential to obtain data over a rather wide temperature and time range to characterize such materi-als completely and to achieve satisfactory results about the actual processing behavior. In reality, it is really difficult to measure the material for such a long period of time and a broader range of frequencies. However, the rate of such deformation or strain measurement can be accelerated by a thermally activated process to obtain the failure of materials within a limited period. It is possible to obtain deformation or strain curves at different temperature levels which can be shifted along the time axis to generate a single curve known as a master curve, from which force-deformation or strain data can be obtained. This technique is known as time–temperature superposition (TTS).
Superposition is commonly used for materials which have no universally accepted mechanistic theory (Markovitz, 1975). Sometimes it is believed that if it were an established general law of nature, examination of the data clearly shows that this is not the case. The time–temperature superposition principle (TTSP) is referred to by different names including frequency–temperature superposition,

210 PART | I Advances in Food Rheology
time–temperature analogy, method of reduced variables, time-translation equiv-alence, and many more. The TTSP was first reported in the work of Aleksandrov and Lazurkin (1939); later on Leaderman (1943) drew attention to the tempera-ture shift. According to Leaderman (1943), the time is equivalent to temperature for viscoelastic materials. The concept was originally developed for polymers, and now it has been applied to virtually every mechanical property and every kind of polymer including blend. At the beginning, the technique was employed to the relaxation modulus and creep compliance. Later on, the concept has been broadened to other measurement areas of rheology including steady flow, oscil-latory rheology, nonlinear viscoelasticity properties, and tensile strength to their variation with compositional and structural parameters. At the beginning, it was believed that TTSP can only be applied to amorphous thermoplastics with lin-ear viscoelasticity in the temperature region corresponding to the rubbery state. However, the principle has been extended to crosslinked, crystalline, and even inorganic polymers (Urzhumtsev, 1972). Attempts have been made to develop a unified method of covering a broader temperature interval, including the rubbery and glassy regions. Interestingly, efforts have been made to extend the principle to materials with nonlinear viscoelasticity also.
In creep analysis, the shear creep compliance (J) measures the linear vis-coelasticity behavior of the material as a function of time (t) (Fig. 9.1). When the compliance is plotted on a logarithmic scale, it is observed empirically that the curves obtained at different temperatures have similar shapes, and there-fore, may be superposed by translating (commonly called shifting) the curve for the creep compliance at one temperature onto that at another temperature ( Markovitz, 1975).
In linear viscoelasticity, it is customary to discuss superposition on the basis of relaxation spectra and especially on the hypothesis that all the
FIGURE 9.1 Typical creep behavior of a biopolymer.

Time–Temperature Superposition Principle Chapter | 9 211
relaxation times have the same temperature dependence (Markovitz, 1975). In small amplitude oscillatory shear measurement, a series of isothermal curves that correlate rheological moduli (elastic modulus, G9; viscous modulus, G99; and complex viscosity, η*) with the range of measurement frequency (w) can be brought together on a single master curve at a reference tempera-ture by means of “TTS.” According to the TTSP, the frequency (or response time) function of rheological modulus at a particular temperature, is very similar in shape to the same functions at adjacent temperatures. The curve of modulus against logarithmic loading frequency or logarithmic response time at one temperature can be horizontally shifted along the frequency (or the reduced time) axis, thereafter, superimposed on the curves at next tem-peratures. The shift along the logarithmic frequency axis is termed as the frequency– temperature shift factor aT and the vertical temperature shift fac-tor bT that results from the changes in sample density with temperature (T0ρ0/Tρ); the magnitude of bT is usually close to unity and is often neglected. Materials that require a vertical shift factor to generate a smooth master curve are classified as thermorheologically complex materials (TCMs) ( Alwis and Burgoyne, 2006). The principle has found suitability among polymer and its blends, food, and biopolymers (Al-Ruqaie et al., 1997; Ptaszek and Grzesik, 2007; Mendieta-Taboada et al., 2008; Ptaszek et al., 2009; Kasapis et al., 2000; Ahmed et al., 2010; Ahmed, 2012, 2015). Sometimes, TTSP fails for various polymer/biopolymer blends because of different temperature- dependent relaxation mechanisms for each component of the blends. How-ever, it could be achievable by increased compatibilization which generates strong phase interactions between blend components which in turn can result in single temperature dependence.
9.2 TIME–TEMPERATURE SUPERPOSITION FOR VISCOELASTIC MATERIALS
According to Rouse theory the temperature affects the relaxation modulus by changing the relaxation times (λ) by the same factor at a reference temperature of T0 [eg, λ1(T0), λ2(T0), and so on], and also by changing the temperature to another value of T, where these times will be changed to λ1aT, λ1aT, and so on, where aT is a function of T and is equal to unity at T0. The shift factor, aT de-pends on both T and T0. Therefore,
λ λ=T a T( ) ( )i T i 0 (9.1)
The Rouse theory furthermore directs that the magnitude of the coefficients, Gi, are also influenced by the temperature as shown next.
ρρ
=G T G TT
T( ) ( )i i 0
0 0 (9.2)
λi(T)=aTλi(T0)
Gi(T)=Gi(T0)TρT0ρ0

212 PART | I Advances in Food Rheology
where ρ and ρ0 are density at a temperature T and a reference temperature T0, respectively. Using previous equations, the relaxation modulus of a generalized Maxwell fluid can be expressed as
∑ρρ λ[ ]=
−
=G t T
T
TG T
t
T a( ; ) ( )exp
( )i
N
ii T0 0 1
00
(9.3)
It can be written as
ρρ
≡G t G t TT
T( ) ( ; )r
0 0
(9.4)
where
=tt
aTr
(9.5)
Furthermore, we can write
∑ λ[ ]=−
=
G t G Tt
T( ) ( )exp
( )i
N
ii
r r1
0r
0 (9.6)
This equation infers that if Gr is plotted as a function of tr, data taken at se-lected temperatures should fall on the same curve as those taken at the reference temperature, T0.
According to Dealy and Wissbrun (1999) when the aT function cannot be predicted from Rouse principle it can be determined empirically as a “shift factor.” A plot of G (or log G) versus log t, aT can be obtained from the horizontal shift necessary to bring the data for any temperature T to the same curve as data for the temperature T0.
If Eq. 9.6 is assumed to be valid for all values of tr, it can be used, together with the Boltzmann superposition principle, to show that all linear viscoelastic properties obey a TTSP (Edwards, 1967).
9.3 TTSP FOR MATERIALS FOLLOWING LINEAR VISCOELASTIC PROPERTIES (MARKOVITZ, 1975)
When a shear relaxation modulus curve G(t;T0) for a material at temperature T0 is superposed on the curve G(t;T) for the temperature T over a time period of t by a horizontal shift in a logarithmic plot, then the results can be expressed by the following equations.
= −G t T G t a T(log ; ) (log log ; )T 0 (9.7)
=
G t T Gt
aT( ; ) ;
T0
(9.8)
G(t;T)=TρT0ρ0∑i=1NGi(T0)exp−tλi(T0)aT
Gr(t)≡G(t;T)T0ρ0Tρ
tr=taT
Gr(tr)=∑i=1NGi(T0)exp−trλi(T0)
G(logt;T)=G(logt−logaT;T0)
G(t;T)=GtaT;T0

Time–Temperature Superposition Principle Chapter | 9 213
The term G(log t;T) is employed when explicit reference to the logarithmic abscissa is required. The horizontal displacement of the two curves in the loga-rithmic plot is log aT which is known as the horizontal shift factor.
In some cases, it requires to transpose the curves of a logarithmic plot in a vertical direction by an insignificant amount, log bT, where bT is termed the vertical shift factor. This is written as
+ = −G t T b G t a Tlog (log ; ) log log (log log ; )T T 0 (9.9)
=
b G t T Gt
aT( ; ) ;T
T0
(9.10)
If the previous relation fits well, it can be inferred that the temperature super-position is valid for G(t;T) over a selected range of t and T. If Eq. 9.10 fits well for all values of t for a material, the material is considered as a thermorheologi-cally simple. The term thermorheologically simple refers to the key caveat that all relaxation times of the polymer must be affected by temperature in the same way. This assumption has been found true for a wide range of homopolymers.
Furthermore, Eq. 9.10 infers that if the relaxation modulus is plotted as bTG(t;T) against t/aT, the curves at selected temperatures will overlap over a range of values of t and will correspond to G(t;T0), the relaxation modulus func-tion at T0. Such a plot is termed as a reduced or master curve; bTG(t;T) is called the reduced shear relaxation modulus Gr(t;T), and t/aT is called the reduced time tr. Eq. 9.10 is thus written as
= =
=G t T b G t T Gt
aT G t T( ; ) ( ; ) ; ( ; )T
Tr 0 r 0
(9.11)
If G(t;T) is valid for a linear viscoelastic material, the other shear visco-elastic moduli [eg, G9(w;T), G99(w;T), J(w;T), and η*(w;T)] can be determined by similar relationships from Boltzmann’s phenomenological theory of linear viscoelasticity. Then time–temperature equivalence for one of the shear visco-elasticity properties has similar implications for the others.
9.4 ELASTIC MODULUS AND RELAXATION MODULUS SUPERPOSITION
By using Boltzmann’s equation, the G9(w;T) can be expressed in terms of the shear relaxation modulus G(t;T) through the sine Fourier transforms for all val-ues of T, t, and w:
∫ω ω ω[ ] [ ]′ = + −∞
G T G T G t T G T t dt( ; ) ( ) ( ; ) ( ) sine e
0 (9.12)
logG(logt;T)+logbT=logG(logt−logaT;T0)
bTG(t;T)=GtaT;T0
Gr(t;T)=bTG(t;T)=GtaT;T0=G(tr;T0)
G9(w;T)=Ge(T)+w∫0∞G(t;T)−Ge(T)sinwtdt

214 PART | I Advances in Food Rheology
Here, Ge(T), defined as the limiting value of G(∞;T) for the viscoelastic solid, is also seen to be the low frequency limit of G9(w;T):
= ′G T G T( ) (0; )e (9.13)
If superposition is valid for all t values over a temperature range that in-cludes T and T0, it is then seen from Eq. 9.11 that, for the viscoelastic solid
=G T b G T( ) ( )e T e0 (9.14)
By considering the limit at infinite time, substitution of Eqs. 9.11 and 9.14 into Eq. 9.12 leads to
∫ω ω ω [ ] [ ]( ) ′ = + −∞
G T G T G t a T G T t dt b( ; ) ( ) / ; ( ) sin /e T e T0
0
0 0
(9.15)
which, with the substitution t/aT = θ, becomes
∫ω ω θ ω θ θ [ ] [ ] ′ = + −∞
G T G T a G T G T a d b( ; ) ( ) ( ; ) ( ) sin /e T e T T0
0
0 0
(9.16)
Comparison with Eq. 9.12 shows that this can be rewritten as
ω ω ω ω′ = ′ = ′ = ′G T b G T G a T G T( ; ) ( ; ) ( ; ) ( ; )T Tr 0 r 0 (9.17)
which represents time–temperature equivalence as it applies to the elastic modulus. The term reduced frequency wr, is used for aTw and reduced storage modulus Gr(w;T) for bTG9(w;T). However, these notations are used differently by different authors that creates a confusion.
It is to be noted that the derivation of Eq. 9.17, in view of the limits of the integral in Eq. 9.12 requires that Eq. 9.11 be valid over the entire time scale, that is, the material be thermorheologically simple. This analysis can then be summarized as: if temperature superposition is valid for G(t;T) for all t, it is also true for G9(w;T) and indeed it is true for all w.
The relationship expressing G(t;T) in terms of G9(w;T) also involves a Fou-rier sine transformation as
∫πω
ωω ω[ ] [ ]− =
′ −∞
G t T G TG T G T
t d( ; ) ( )2 ( ; ) ( )
sinee
0 (9.18)
One can therefore show the converse, that is, if temperature superposition is valid for the storage modulus G9(w;T) for all w, it is also true for the relaxation modulus G(t;T) for all t.
Similarly, it can be shown that temperature reduction is valid for the loss modulus G99(0;T) for all 0 if it is valid for G(t;T) for all t; that is, if Eq. 9.11 is valid for all t, then
ω ω ω ω′′ = ′′ = ′′ = ′′G T b G T G a T G T( ; ) ( ; ) ( ; ) ( ; )T Tr 0 r 0 (9.19)
Ge(T)=G9(0;T)
Ge(T0)=bTGe(T)
G9(w;T)=Ge(T0)+w∫0∞Gt/aT;T0−
Ge(T0)sinwtdt/bT
G9(w;T)=Ge(T0)+waT∫0∞G(θ;T0)−Ge(T0)sinwaTθdθ/bT
G9r(w;T)=bTG9(w;T)=G9(aTw;T0)=G9(wr;T0)
G(t;T)−Ge(T)=2π∫0∞G9(w;T)−Ge(T)wsinwtdw
G0r(w;T)=bTG0(w;T)=G0(aTw;T0)=G0(wr;T0)

Time–Temperature Superposition Principle Chapter | 9 215
The previous equation is valid for all w.Similarly, for the creep compliance (J), it can be written as
= =
=J t TJ t T
bJ
t
aT J t T( ; )
( ; ); ( ; )
T Tr 0 r 0
(9.20)
9.5 SUPERPOSITION AND THE WILLIAMS–LANDEL–FERRY EQUATION
Another commonly used empirical equation for TTSP is the Williams–Landel–Ferry (WLF) equation. WLF equation is often used to construct mas-ter curve, which relates a shift in temperature with a shift in time. However, the equation has limited application to materials above the glass transition temperature. The WLF assumes that the fractional free volume of polymers increase linearly with temperature (Tschoegl et al., 2002), leading to the following form:
=− −
+ −a
C T T
C T Tln
( )
( )T
1 0
2 0
(9.21)
where C1 and C2 are the constants derived from curve fitting. The constants were assumed to be universal constants, independent of the polymer, provided that similar thermodynamic conditions exist inside the materials. In WLF equa-tion, the standard temperature was considered as Ts = Tg + 50 K as reference temperature, for which the constants C1 = −17.44 and C2 = 51.6 were used. Later on, Ferry (1980) reported C1 for rubbers ranging from −11 to −20 and C2 varied between 25 and 108. The range of temperature for the application of the WLF equation is prescribed as Tg < T < Tg + 100 K, whereas some other authors recommended the same as Tg < T < Tg + 150 K.
Arrhenius (1889) suggested a time–temperature relation based on the con-cept of activation energy. The Arrhenius equation relates the rate constant k of chemical reactions to the temperature T and the activation energy Ea,
= −
k AE
RTexp a
(9.22)
where R is the gas constant and A is a constant. Substituting the relaxation time τ for the reaction rate k, a shift factor can be derived in analogy to the WLF fac-tor according to
= −
aE
R T Tln
1 1T
a
ref
(9.23)
Jr(t;T)=J(t;T)bT=JtaT;T0=J(tr;T0)
lnaT=−C1(T−T0)C2+(T−T0)
k=Aexp−EaRT
lnaT=EaR1T−1Tref

216 PART | I Advances in Food Rheology
9.6 TIME–TEMPERATURE–STRESS SUPERPOSITION PRINCIPLE (LUO ET AL., 2012)
Since, higher temperatures and higher stress levels bring about an equal accel-eration of creep deformation and shorten the relaxation time of the materials, there exists an analogy between time and stress, similar to the analogy between time and temperature described by TTSP. Stress plays an important role in the viscoelastic properties of materials similar to that of the temperature. A higher stress reduces the relaxation time of materials because of which the free volume of the material increases, and therefore, more void space is available for seg-mental mobility in polymers. It is assumed that the stress-induced change in the free volume fraction is linearly dependent on stress change, much like the effect of temperature on the change in free volume, and derived a temperature–stress shift factor φTσ, which has the following form (Luo et al., 2001):
φ σ σσ σ
= −− + −
+ − + −
σ C
C T T C
C C C T T Clog
( ) ( )
( ) ( )T 1
3 0 2 0
2 3 3 0 2 0 (9.24)
where C1, C2, and C3 are material parameters related to the reference tempera-ture T0 and stress σ0. When σ = σ0, Eq. 9.1 reduces to the WLF equation. If the measuring temperature and the reference temperature are same (T = T0,), then the Eq. 9.1 reduced to the following form:
φ σ σσ σ
= −−
+ −
σ C
Clog
( )1
0
3 0
(9.25)
This defines the stress shift factor and provides the TSSP.Moreover, according to time–temperature–stress superposition principle,
the stress shift factor at a definite temperature φσ( )T , the temperature shift factor at a definite stress level φσ( )T , and the temperature–stress shift factor (φTσ) are interrelated in such a way that
φ φ φ φ φ= + = +σσ
σ σσ
T TT T
T0 0
(9.26)
Using these shift factors, the viscoelastic property functions, for example, the creep compliances, in different thermomechanical states will have an equal value but different time scales. This can be written as
σ σφ
σφ
σφ
=
=
=
σ
σ ΤσD T t D T
tD T
tD T
t( , , ) , , , , , ,
TT0 0 0 0
(9.27)
Previous equations illustrate that the time-dependent mechanical properties of viscoelastic materials at different temperatures and stress levels for some convenient time scales can be shifted along the time axis to construct a master curve of a wider time scale at a reference temperature, T0, and/or reference
logφTσ =−C1C3(T−T0)+C2(σ−σ0)C2C3+C3(T−T0)+C2(σ−σ0)
logφσ=−C1σ−σ0C3+(σ−σ0)
(φσT)(φTσ)
φTσ=φTσ0+φσT=φσT0+φTσ
D(T, σ,t)=DT0,σ,tφTσ=DT,σ0,tφσT=DT0,σ0,tφTσ

Time–Temperature Superposition Principle Chapter | 9 217
stress level, σ0. Furthermore, the master curve can be constructed by a single shift via the temperature–stress shift factor, φTσ, or by pair-shift via a joint ap-plication of the time–stress shifting at specified temperature, φσ
T or φσT0 , and
the time–temperature shifting at specified stress level, φσT
0 T or φσT . For more
details readers can consult to the publication of Luo et al. (2012).Similar to the TSSP, a TTSP approach which indicates that
φ=
σD T t D T
t( , ) ,
T0 is used to construct the master curve from the tests con-
ducted at selected temperatures and a specified stress level.
9.7 CONSTRUCTING TTSP MASTER CURVE FOR DYNAMIC MODULI
The superposition of the response curves, by shifting along the log-(time) axis, to construct a master curve according to the TTSP, implies, within the context of the scaling properties, that the different curves must be related by scaling with a translation path parallel to the horizontal axis (Povolo and Fontelos, 1987).
Various steps for constructing a master curve for a particular rheological modulus are described next. The loss modulus (G0) and the complex viscosity (η*) against frequency (w) data have been used for the illustration.
1. A sample is subjected to frequency sweep measurement in a linear visco-elastic region (LVR). Determination of LVR is required before beginning frequency sweep test to confirm the stability of microstructure of the sample under shear environment. Construction of a master curve is illustrated in Fig. 9.2a (η*–w) with two set of isothermal studies carried out at tempera-ture T1 and T2, respectively. Similarly, Fig. 9.3a illustrates the viscous modu-lus data of melt rheology of polylactides (PLAs) as function of frequency (G0–w) at selected temperatures (170, 180, and 190°C).
2. A reference temperature is selected arbitrarily or based on a temperature of interest (eg, melting point). A reference temperature of T1 and 180°C have been selected for constructing those master curves.
3. All the individual frequency curves at selected temperature levels are shift-ed along the frequency scale to construct a master curve. Two shift factors namely horizontal (aT) and vertical (bT) are required for the superimposition of those curves. Figs. 9.2b and 9.3b are plots of reduced η* and G0 versus aTw. Only inclusion of one shift factor aT generates the master curve as in Fig. 9.3b, whereas both factors are used to construct Fig. 9.2b. The shift fac-tors allow it to join smoothly into the master curve. For TCMs the viscoelas-tic properties do not superpose completely if only horizontal displacements are performed. Vertical shift factors are needed to account for change in ma-terial density, hygrological effects, and thermal expansion and contraction (Alwis and Burgoyne, 2008). Fig. 9.3c shows the shift factors as a function of temperature for PLA sample.
φσT
φσT0
φTσ0
φTσD(T,t)=DT0,tφTσ

218 PART | I Advances in Food Rheology
9.7.1 Some Other TTSP Approaches for Oscillatory Rheology
The analysis of TTSP applicability for different materials is also carried out by using a Cole–Cole plot [E0(w) vs E9(w) or G0(w) vs G9(w), at several tem-peratures]. When the behavior of the Cole–Cole plot is temperature indepen-dent, only horizontal shift is required and the material can be considered as thermorheologically simple. However, in many cases, it has been seen that the Cole–Cole plot is temperature dependent, that is, both horizontal and vertical shifts are required to apply the TTSP. A representative rheogram for polymer/
FIGURE 9.2 Construction of master curve from the individual isothermal studies. (a) In-dividual isothermal studies at temperature T1 and T2, (b) construction of master curve from two isothermal studies.

Time–Temperature Superposition Principle Chapter | 9 219
nanoparticle composite is presented in Fig. 9.4a, where it is clearly observed that both shift factors have to be employed to generate a master curve.
It has been pointed out that the use of TTSP is meaningful as long as the morphology of the polymer remains the same over the range of temperature studied. Therefore, TTSP is very much unique for homopolymers. However, in recent years TTSP has been employed to compatible polymer blends on the basis of a single Tg, to microphase-separated block copolymers, and also to thermotropic liquid-crystalline polymers. To enhance the applicabil-ity of TTS, Han et al. (1983, 1986), Han (1988) advocated the use of log G9 versus log G0 plots over log G9r (or log G0r) versus log waT plots in obtaining temperature-independent correlations for polymer systems since log G9 versus log G99 plots for homogeneous polymer systems are virtually independent of temperature. A typical modified Cole–Cole (MCC) plot is shown in Fig. 9.4c. The approach is in fact a modification of conventional Cole–Cole plot where the imaginary and real components of a complex modulus are plotted against each other on linear axes (Cole and Cole, 1941). Furthermore, those authors suggested that before attempting to apply TTSP to multicomponent and/or
FIGURE 9.3 (a) Isothermal curves for a biopolymer (PLA) at selected temperatures, (b) TTSP curve with horizontal shift only, and (c) shift factors versus temperature.

220 PART | I Advances in Food Rheology
multiphase polymer systems, one must first observe whether or not plots of log G9 versus log G99 show temperature independence. It has been observed that log G9 versus log G99 plots are very sensitive to a variation in the morpho-logical state of multicomponent/multiphase polymer systems (eg, immiscible blends, microphase-separated block copolymers, liquid-crystalline polymers), therefore, it has been pointed out that whereas the so-called Cole–Cole plot is strictly an empirical correlation, plots of log G9 versus log G99 have a basis of molecular viscoelasticity theory and thus the two are not related to each other. In contrast to TTS, no data manipulation is required to superpose isothermal frequency (ITF) curves (Baek and Han, 1995). As temperature changes from T1 to T2, moduli automatically shift by the amount log (T1ρ1/T2ρ2) (Han and Jhon, 1986; Han et al., 1989). Han and Kim (1993) deemed the MCC analysis as more sensitive than TTS, and readers can consult their original publication for further reading.
Another approach to obtain a TTS is the use of the vGP plot of phase angle (δ) versus complex modulus (G*) to ascertain the thermorheological simplicity of a material. The VGP plot does not require a shift in frequency to a refer-ence temperature to produce overlapping curves but only a shift in modulus with temperature (van Gurp and Palmen, 1998). The analysis of van Gurp and Palmen is a more accurate test for TTSP applicability. The measurements on LDPE/ZnO exhibit a distinct lack of overlap (Fig. 9.4b).
FIGURE 9.4 Applicability of (a) Cole–Cole plot, (b) van Gurp–Palmen (vGP) plot, and (c) modi-fied Cole-Cole plot for polymer-based nanocomposite.

Time–Temperature Superposition Principle Chapter | 9 221
9.8 TTSP FOR CREEP BEHAVIOR
Based on the TTSP, the master curve of creep behavior against reduced time at a reference temperature is constructed by shifting the measured creep compli-ance (Dc) data at elevated temperatures along the log time axis (the horizontal axis). The measured creep data at higher temperatures cannot be superimposed smoothly by only horizontal shifting as shown in Fig. 9.5a. However, the smooth master curve may be obtained by shifting measured data horizontally as well vertically as illustrated in Fig. 9.5b. This vertical shifting is well known as the thermal correction based on the entropy elasticity at the temperature above Tg.
As shown in Fig. 9.6a, the Dc versus time curves measured at temperatures T2 and T3 are superposed onto that at T1 by shifting Dc curves horizontally and vertically, to form a single master curve at a reference temperature T0 (= T1) against the reduced time t9. For more details, it is recommended to consult the publication of Nakada et al. (2011).
FIGURE 9.5 TTS for creep compliance. (a) TTSP (only horizontal shift) and (b) TTSP (horizon-tal and vertical shifts). (From Nakada et al., 2011)

222 PART | I Advances in Food Rheology
The shift factors for those superposition a T( )T0 and b T( )T0
are defined by
=′
a Tt
t( )T0
(9.28)
=′
b TD t T
D t T( )
( , )
( , )T
c
c 00
(9.29)
All the steps are similar as discussed earlier for dynamic moduli. The varia-tion of the creep of the specimen is observed against the log (time), as illustrated in Fig. 9.6.
The most important consideration for such superposition is the smoothness where two different curves merge. If the TTSP method is valid, the master curve represents the true behavior of a long-term test at the reference temperature. That curve would be expected to be smooth, so it is a necessary condition that the master curve produced should also be smooth.
aT0(T)
bT0(T)
aT0(T)=tt9
bT0(T)=Dc(t,T)Dc(t9,T0)
FIGURE 9.6 Master curves construction with creep compliance and effect of temperature on shift factors. (a) Master curve of creep compliance, (b) time–temperature shift factor, and (c) temperature shift factor. (Adapted from Nakada et al., 2011)

Time–Temperature Superposition Principle Chapter | 9 223
The accuracy of the master curve in a creep experiment depends on the fol-lowing factors as suggested by Alwis and Burgoyne (2008):
1. Variation of the shift factors with temperature.2. Retention of the same creep mechanism under studied temperatures.3. The initial strain rate applied to a sample during the creep test. Although the
creep stress, σ0 is assumed to be applied instantaneously, a finite time and a certain rate of strain are desirable to attain the required stress level.
4. Change of humidity.5. State of the material property (glassy, rubbery, or at the transition range).6. Preparation of the specimens, the type of the clamping system, and the type
of the testing machine.7. Rate of heating to achieve an isothermal condition.
9.9 CONSTRUCTING MASTER CURVE BASED ON THE WLF EQUATION
Mostly, the mean aT values are determined from both the dynamic moduli ITF data by fitting the WLF equation. Initially, the mean aT values are calculated by linear regression analysis, and determined the WLF constants, C1 and C2, respectively. The master curve is generated by plotting moduli corrected for thermal expansion versus waT on logarithmic axes by putting new aT values obtained from C1 and C2. Nickerson et al. (2004) calculated mean aT values for gellan in the presence of 80% (w/w) cosolutes by linear regression analy-sis, and determined the WLF constants, C1 and C2 to be 8.9 and 141.1 K, respectively. Using these constants, new aT values were calculated, and pre-sented in Table 9.1 which were used thereafter, to form a single master curve (Figs. 9.7 and 9.8).
9.10 FAILURE OF TTS CURVES (WOIRGARD ET AL., 1977)
In practice there are many reasons for the failure of TTSP. Important points are as follows:
l Temperature variation can cause structural changes in the specimen espe-cially at the vicinity of the glass transition temperature.
l Phase transition can occur during the temperature scans. In composite mate-rials, each constituent may have a different sensitivity to temperature.
l Viscoelastic spectra cannot be obtained by temperature scans if diffusion is active in the material.
l The theory of viscoelasticity holds under isothermal conditions and is not directly applicable if temperature is varied continuously.
TTS is not a definitive test to check linearity in material behavior, that is, a linear viscoelastic material may or may not obey TTS (Lakes, 2004).

224 PART | I Advances in Food Rheology
TABLE 9.1 TTS Shift Factors (aT) (Logarithmic) as a Function of Temperature (85–15°C) During Cooling for a 0.5% (w/w) Gellan:80% (w/w) Cosolute Sample
Temperature (°C) Log aT (G9) Log aT (G0) Mean log aT
Calculated log aT
85 −2.00 −2.00 −2.00 −1.95
75 −1.53 −1.52 −1.52 −1.55
65 −1.10 −1.10 −1.10 −1.10
55 −0.60 −0.57 −0.59 −0.59
45 0 0 0 0
35 0.65 0.70 0.68 0.69
25 1.48 1.48 1.48 1.50
15 2.40 2.40 2.40 2.46
Shift factors were obtained by shifting ITF data for G9 and G0 to allow curves to superimpose. Mean log aT values were used to determine the WLF constants, which were then fitted with the WLF equation to calculate log aT values required to form the master curves.Source: Adapted from Nickerson et al. (2004)
FIGURE 9.7 TTSP shift factors fitted with the WLF equation for a 0.5% (w/w) gellan, 80% (w/w) cosolute sample at a reference temperature of 45°C. (Adapted from Nickerson et al., 2004)

Time–Temperature Superposition Principle Chapter | 9 225
9.11 APPLICATIONS
9.11.1 Nanocomposites
TTS is frequently used for nanocomposites although there have been mixed opinions on the application of TTS to nanocomposites. Solomon et al. (2001) applied the concept to melt-compounded polypropylene filled with organo-philic nanoclay in the presence of a compatibilizer, and they found a similar temperature dependence of shift factors in the nanocomposites as in the neat polymer. The application of TTSP was successful with extruded and injection-molded polypropylene filled with organophilic layered silicates that were an-nealed (Reichert et al., 2001). They used the shifting procedure as a tool for the investigation of clay platelet network formation and observed that the annealing
FIGURE 9.8 TTSP master curves for G9 (a) and G0 (b) for a 0.5% (w/w) gellan, 80% (w/w) cosolute sample during cooling at a reference temperature of 45°C. (Adapted from Nickerson et al., 2004)

226 PART | I Advances in Food Rheology
process improves exfoliation and facilitates the formation of a thermodynami-cally stable structure. Application of TTS to some polymeric nanocompos-ites indicated that the TTSP is valid with a limited range of temperature. For poly(butylene terephthalate)/MWCNT nanocomposites the TTSP followed only in a narrow range of temperature 230–240°C, and the principle failed above 260°C (Wu et al., 2007). It is believed that the successful superposition at higher reduced frequencies is due to dominant local chain dynamics, and the failure of superposition at lower reduced frequencies is influenced by the dif-ferent temperature dependence of the percolated network. None of the reported studies attempted any application of vertical shifting.
Ahmed et al. (2010) constructed the linear viscoelastic master curves for the pure PLA melt (184–196°C) using the TTSP at a reference temperature of 190°C. Both the shift factors aT and bT were used to generate a master curve. Fig. 9.9 illustrates the reduced angular frequency dependence of the dynam-ic moduli (G9, G99, and η*) for the neat PLA specimens at selected tempera-tures (184, 187, 190, 193, and 196°C). Samples experiencing a short thermal history (corresponding to high frequencies: 1–10 Hz) produce a satisfactory
FIGURE 9.9 Reduced angular frequency dependence of mechanical spectra (a) elastic modulus (G9), (b) viscous modulus (G99), and (c) complex viscosity (η*) for neat PLA specimens at selected temperatures. (Adapted from Ahmed et al., 2010)

Time–Temperature Superposition Principle Chapter | 9 227
overlapping of the curves. However, longer thermal exposure (0.1–1 Hz) pro-duces significant deviations from the TTS (especially G0) due to ongoing chem-ical degradation (Palade et al., 1995). In addition, it was observed that the high-est temperature (196°C) showed the maximum deviation from the superposition which is very common for rapid chemical degradation at higher temperatures. The deviation of complex viscosity at 196°C is obvious in higher frequency range too (Fig. 9.9c).
TTSP was employed to obtain creep deformation of the plasticized starch/cellulose nanofibrils (5–20% wt/wt) and plasticized starch–only films in longer time frame (Meng et al., 2015). The creep for both types of films were measured at six selected temperatures (30, 35, 40, 45, 50, and 55°C) at a static stress of 8 MPa for 5 min. All the individual creep curves obtained at different tempera-tures were shifted to a reference temperature of 55°C along the logarithmic time axis to superimpose to a master curve. The temperature dependence of the shift factors showed a good linear relationship with the absolute temperature.
Yang et al. (2015) developed a master curve of creep compliance (S) as a function of temperature (20–50°C in an interval of 5°C) and time, and the activation energy of the glass transition relaxation of bamboo fiber–reinforced recycled PLA composites by DMA. In the work, the reduced time using a shift factor (αT) was calculated from TTSP, and, thereafter, the creep curves at elevated temperatures were shifted along the time axis toward the right. Arrhe-nius equation was used for calculating the activation energy from the shift factors of the NC. The Ea values were in the range of 428.5–493.2 kJ/mol. Furthermore, the creep compliance master curves of the various bamboo fiber–reinforced re-cycled PLA composites were generated using shift factors, and estimated from a constant activation energy assumption. The master curves were modeled with the Findley power law, which is presented in the following equation:
= +S t S a t( ) b0
(9.30)
where S(t) is the time-dependent compliance, S0 is the instantaneous elastic compliance, a and b are constant numbers, and t is the elapsed time.
Several researchers attempted to shift the frequency dependence of visco-elastic moduli of polymer/nanoparticles measured at selected temperatures, and observed that the data superposed unsatisfactorily. Handge and Pötschke (2007) worked on polycarbonate/MWCNTs (2 wt.%) at 190 and 210°C, and they sug-gested that the failure of TTS implied that the relaxation processes of the pure polymer and filler network had different temperature dependence, and they at-tributed the influence of interactions between the polymer and filler more to entropy elasticity of the melt than to temperature. Similarly, Wu et al. (2007) concluded that TTS was possible in poly(butylene terephthalate)/ MWCNT nanocomposites in a narrow temperature window of 230–240°C, but not at higher temperatures up to 260°C. They attributed the successful superposition at higher reduced frequencies to dominant local chain dynamics and the failure
S(t)=S0+atb

228 PART | I Advances in Food Rheology
of superposition at lower reduced frequencies to the different temperature de-pendence of the percolated network.
TTSP was applied to produce the master curves of the dynamic moduli obtained for a PLA/nanographite platelets (1–10 wt.%) nanocomposites melt (170–200°C) at a reference temperature of 180°C (Narimissa et al., 2014). The master curves of G9 and G0 showed that the change in liquid-like behavior into pseudosolid-like behavior occurred at 3 wt.% nanographite platelets content in the composites. The complex viscosity master curves indicated that a change from Newtonian to shear-thinning behavior at low frequency region occurred at 5 wt.% filler content.
Applicability of TTSP for a nanocomposite based on poly(ε-caprolactone) (PCL) and organomodified clays (Cloisite 30B and Cloisite 15A) (PLANC) were studied (Ahmed et al., 2012; Nikolic et al., 2016). The linear viscoelas-tic master curves for the PCLNC are generated at selected temperature range (90–120°C) by the TTSP and shifted to a reference temperature of 100°C em-ploying both shift factors (Ahmed et al., 2012). Samples experiencing a short thermal history (1–10 Hz) produce a satisfactory overlapping of the curves, whereas, longer thermal exposure (0.1–1 Hz) produces deviations from the TTSP (especially G9 at 10% clay). Furthermore, the deviation was obvious at higher temperature (110–120°C) because of rapid chemical degradation at higher temperatures. This observation is supported by shift factors at various clay concentrations, which are reported in Table 9.2. Han plots were employed to detect the possible structural changes with temperature. Nikolic et al. (2016) reported that no microstructural changes occur for the studied nanocomposites within the studied temperature range except for the NC loaded with 8% C15A clay. Such changes in the nanocomposite structure have been explained by the dynamic percolation structure or by the enhanced dispersion of the clay induced by temperature changes during the tests. Applied frequency shift factors are relatively small and comparable to reported values for pure PCL and its various nanocomposites in the similar temperature regime. The shift factors used to ob-tain good superposition for the nanocomposites seem to be independent of the clay loading. The independence of shift factors on the type and the amount of clay, as previously observed, indicate that the relaxation processes taking place in the nanocomposites originate from the unaltered polymer matrix.
Another approach known as van Gurp–Palmen (vGP) plot (van Gurp and Palmen, 1998) has also been used to verify the TTSP in polymer blends and nanocomposites. The vGP plot as a typical dependency of loss angle δ on com-plex modulus |G*| has been used in order to evaluate the topological structures of polymers (Kracalik et al., 2011). The novelty of this plot is that there is no need of shift factor along the frequency axis for superposition of curves. The vGP plot for PCLNC, PCL, and its nanocomposites are illustrated in Fig. 9.10.
It can be seen that the δ decreased with increasing G*, and increased fur-thermore irrespective of the processing temperature. However, rheograms are almost superimposed except at 90°C indicating insignificant change in the

Time–Tem
perature Superposition Principle Ch
apter |
9 229
TABLE 9.2 Shift Factors for Applicability of TTSP for PCL/Clay Nanocomposite at Selected Clay Concentrations
Temperature (°C)
TTSP for G9 TTSP for G0
5% NC 7.5% NC 10% NC 5% NC 7.5% NC 10% NC
aT bT aT bT aT bT aT bT aT bT aT bT
90 0.88 1.01 1.07 1.01 1.00 1.01 0.84 1.01 1.06 1.01 1.06 1.01
95 0.97 1.01 1.00 1.01 0.98 1.01 0.96 1.01 1.00 1.01 1.01 1.01
100 1.00 1.00 1.00 1.00 1.00 1.00 1.00 1.00 1.00 1.00 1.00 1.00
105 1.00 0.99 0.89 0.99 0.96 0.99 1.01 0.99 0.91 0.99 0.96 0.99
110 0.96 0.99 0.79 0.99 0.93 0.99 0.99 0.99 0.83 0.99 0.91 0.99
120 0.87 0.98 0.65 0.99 0.83 0.98 0.92 0.98 0.71 0.98 0.82 0.98
Source: Adapted from Ahmed et al. (2012)

230 PART | I Advances in Food Rheology
FIGURE 9.10 Phase angle versus absolute complex modulus (vGP plot) of (a) PCL and (b) 10% clay incorporated PCLNC as a function of processing temperature. (Adapted from Ahmed et al., 2012)

Time–Temperature Superposition Principle Chapter | 9 231
polymer structure. For the nanocomposite films, an interesting behavior of the δ versus G* curves was observed (Fig. 9.10b). The phase angle decreased significantly for all clay loading at similar temperature regime. Furthermore, there is a significant shift in the δ versus G* curves at selected temperature, especially a lower G* value. As the temperature is raised, the contribution of the polymer matrix decreases and the solid-like behavior of the nanofiller net-work dominates the rheological response of the nanocomposite film. Thus, the shift is a clear indication of the change in nanofiller dispersion with changing processing temperature. It further indicates that TTS does not fit well for clay-incorporated PCLNC.
9.11.2 Polysaccharide/Sugar Mixtures
Time–temperature studies of polysaccharide gelation allow macrostructure changes to be studied as a function of temperature and frequency as report-ed by Nickerson et al. (2007). Authors studied changes to dynamic moduli (G9 and G0) as a function of temperature and oscillatory frequency for 0.5% (w/w) gellan/80% (w/w) cosolute dispersions with added Na+ (40–160 mM). ITF (0.15–15 Hz) and thermal scans at 0.15 Hz were performed over a de-creasing and increasing temperature range of 85–5 and 5–85°C, respectively. ITF data were described using TTSP and MCC analysis.
At 40-mM Na+ level, the ITF data during cooling/heating were superposed well over the entire temperature range for both moduli, except at 5°C. Authors believed that deviations of the oscillatory frequency data at 5°C from the mas-ter curve occur from errors within the data transformation rather than the TTS failure. Furthermore, these errors reflect differences between experimental and calculated aT values used by the WLF equation, which become magnified by the logarithmic transformation during the application of the method of reduced variables. However, the MCC analysis required no data transformation to su-perpose the 5°C oscillatory frequency data within the master curve. Therefore, the MCC analysis was presumed to validate the success of TTS over this tem-perature range. Successful superposition suggests that the material behaved as a thermorheologically simple material where no changes in relaxation mecha-nisms occurred with temperature. Additionally, the viscoelastic response was dominated by the long-range relaxation of gellan chains between junction zones.
The gellan/high cosolute samples with 100-mM Na+ showed different rheo-logical behavior during heating/cooling. During cooling, the sample exhibited a thermorheologically complex behavior and the ITF data failed to superpose. However, the sample superimposed completely during heating over the com-plete temperature range, and exhibited a thermorheologically simple material. The lack of superposition of the 5°C ITF is analogous to the 40-mM Na+ sample, which was considered to be successfully superposed. The crosslinked network formed after cooling is thought to be again weakly associated since junction zones were not temperature dependent. With the addition of 160-mM Na+, TTS

232 PART | I Advances in Food Rheology
failed at all temperatures during both cooling and heating due to the formation of ion-mediated junction zones of sufficient number and size to dominate the viscoelastic response of the material over the entire temperature range.
9.11.3 Pectin
The rheological parameters obtained in the temperature range of 5–65°C for the high-methoxyl pectin and low-methoxyl pectin dispersions in water (3.5%, w/w) and in 0.1 M NaCl were reduced to a reference temperature of 25°C, using the TTSP (da Silva et al., 1994). Both the G9 and the G99 data as a function of frequency were first plotted using modulus shift factors calculated from the temperature/ density correction factor (T0ρ0/Tρ). Then, the appropriate aT was obtained empirically by graphical shift of the data obtained at different temperatures, using logarith-mic ordinates. Over the entire temperature and frequency range, the TTSP could not be applied to simultaneous superposition of G9(w) and G99(w) data. Further-more, satisfactory reduction of the data to a single master curve was not obtained, irrespective of the frequency shift factor employed, for each modulus individually or with vertical shift factors higher than those calculated by the temperature– density factor. For the steady shear data η(γ ) obtained by decreasing applied stress, after shearing the sample, satisfactory superposition could be obtained only by applying bT higher than those obtained by the temperature–density factors.
The failure of the TTSP to be applied to pectin dispersions, in the range of temperature studied, could be attributed to structural changes in the pectin aggre-gates resulting from temperature changes that in turn affected the chain mobil-ity on which the rates of all configurational rearrangements depend. The higher values of the shift factors of pectin samples, are the result of greater temperature sensitivity of the intermolecular interactions taking place in these systems.
9.11.4 Mung Bean Starch
The applicability of TTSP has been tested for legume starch dispersions. Ahmed (2012) employed TTSP for mung bean starch individually and blended with salt and sugar (5–10% w/w) in dispersions. The ITF sweep tests were conducted at selected temperatures (70–90°C), and shifted to a reference temperature of 80°C. Both the horizontal and vertical shift factors were employed for the su-perposition. The superposition of G9–w data for starch dispersion was not sat-isfactory as can be seen from Fig. 9.10a, whereas a plot of η* versus w showed a better superposition at a reference temperature (Fig. 9.10b) except for 95°C. The nonapplicability of TTSP was pronounced at two extreme temperatures namely 70 and 95°C. It has been reported that the applicability of TTS should be examined above the glass transition temperature, and that could be the reason for nonapplicability of TTSP at 70°C, which is at the vicinity of Tg. Further-more, the deviation above 85°C is believed to be associated with leaching of amylose and breakdown of amylopectin at high temperature.

Time–Temperature Superposition Principle Chapter | 9 233
TTS for 5% NaCl-incorporated starch blend fitted well and scaling has minimum effect on extending the frequency window (Fig. 9.11a). The shift factor values ranged within unity for all studied temperature range except at 85°C (aT = 0.89). A better superposition at 5% NaCl loading concentrations might be attributed to salting-out effects, which will enhance the aggregation of amylose chains and the formation of a three-dimensional network (Ahmad and Williams, 1999). However, a further increment of salt level to 10% failed the
FIGURE 9.11 Master curves of (a) dynamic modulus and (b) complex viscosity versus frequency for mung bean starch dispersion (1:3 starch to water) to a reference temperature of 80°C. (Adapted from Ahmed, 2012)

234 PART | I Advances in Food Rheology
TTSP at the reference temperature (Fig. 9.11b). Interestingly, isothermal heat-ing at and above 85°C showed a superposition for salt-incorporated starch sam-ples, and a new master curve was generated. The newly generated master curve exhibited better superposition (aT values were very close to unity for 85–95°C).
Incorporation of sugar into starch matrix behaves differently compared to salt/starch blend (Fig. 9.12). A loading of 10% sucrose to starch shows a bet-ter superposition than 5% sucrose. Extending of frequency window was small
FIGURE 9.12 Reduced frequency dependence of complex viscosity of sodium chloride-added mung starch gel at reference temperature of 80°C. (a) 5% and (b) 10%. (Adapted from Ahmed, 2012)

Time–Temperature Superposition Principle Chapter | 9 235
for 10% sucrose because values of scaling coefficient aT were close to unity except at 95°C (Fig. 9.12b). The applicability and nonapplicability of TTS to a blend system like salt and sugar indicates about internal stability of created structure in analyzed range of temperatures. These observations indicated that starch–sucrose–water matrix is very complex in nature. The difference in ad-ditives’ effectiveness can be attributed to the penetration of the solute into the granule interior. Such penetration produced disorder inside the starch granules (Fig. 9.13).
FIGURE 9.13 Reduced frequency dependence of complex viscosity of sucrose-added mung starch gel at reference temperature of 80°C. (a) 5% and (b) 10%. (Adapted from Ahmed, 2012)

236 PART | I Advances in Food Rheology
9.11.5 β-Glucan Concentrate–Enriched Wheat Flour Dough
The linear viscoelastic master curves for the β-glucan concentrate–enriched wheat flour dough samples are generated by the TTSP. Rheological measure-ments were carried out at five selected temperatures (25, 40, 55, 70, and 85°C), and shifted to a reference temperature of 55°C using both the shift factors (Ahmed, 2015). The reference temperature is selected based on the dough soft-ening temperature. A plot of the reduced angular frequency, aTw against the elastic modulus (G9) and the complex viscosity (η*) of the dough samples indi-cated that the η* produced a good superposition whereas the G9–w failed to fol-low superposition adequately, especially at the highest temperature employed (85°C). This observation clearly indicated that the mechanical rigidity gener-ated on the dough samples during isothermal heating at 85°C was completely different from those at other temperature regimes. One of the best reasons for the nonapplicability of TTS for G9–w could be the temperature range which are at extremes from the thermal transition of the dough. The shift factors also indicate that the starch/protein of the dough is strongly temperature dependent.
9.11.6 Cheese
Singh et al. (2006) studied the applicability of TTS for mozzarella cheese at se-lected temperatures (2, 10, 22, 30, 40, 50, and 60°C) and found that the amount of overlap for dynamic data at different temperatures reduced with increase in temperature. The curves at temperatures of 40 and 50°C show less over-lap, as compared to the curves at 2 and 30°C. It concludes that cheese can be classified as TCM in the tested frequency range. However, this observation is in contrast with earlier reports on low-moisture part-skim mozzarella cheese ( Subramaninan and Gunasekaran, 1997) where the dynamic data at different temperatures overlapped sufficiently to follow TTS in the frequency range of less than three decades. The heterogeneous nature of cheese, where each phase (fat, protein, and serum) can have its own temperature-dependent material prop-erties, can make it thermorheologically complex.
The application of TTS and Cole–Cole analyses, were evaluated on the rhe-ological data obtained for various types of cheeses. Various authors (Udyarajan et al., 2007; Meza et al., 2012) reported that cheeses exhibited deviation from TTS. Udyarajan et al. (2007) compared rheological behavior during heating/cooling period and noted that during the heating cycle, cheese samples (part-skim and fat-free) exhibited thermorheologically complex behavior. This com-plex behavior was probably because of the interaction of newly formed insoluble Ca++ at high temperature with caseins. During cooling cycle, cheeses appeared to obey TTS, indicating a thermorheologically simple behavior. Both part-skim mozzarella and fat-free cheese deviated from the type of behavior expected for a single Maxwell element in Cole–Cole analyses. Meza et al. (2012) employed TTSP and MCC analysis for comparison studies on cheeses (seven commercial

Time–Temperature Superposition Principle Chapter | 9 237
low-fat soft cheeses incorporated with microparticulated whey proteins as fat replacer) stored at refrigerated (6°C) and frozen (−25°C) storage. The results obtained in this work indicated that the viscoelastic properties of the studied cheeses obtained at different temperatures were influenced by freezing. Fre-quency sweeps (0.01–10 Hz) were carried out at 10–50°C with an increment of 10°C at a fixed stress amplitude (318 Pa). Values of aT as a function of tempera-ture for frozen and refrigerated cheeses are shown in Table 9.3. A satisfactory application of the TTS suggests that the material is thermorheologically simple, where relaxation times for all mechanisms change in the same way with tem-perature. In this study, superposition of ITF data gave similar aT values at low temperatures (10–30°C) for both G9 and G0 (Table 9.3). This result indicates that, in low-temperature region, both frozen and refrigerated cheeses behave like a thermorheologically simple material. However, superposition of ITF data did not give similar aT values at high temperatures (40–50°C) for both G9 and G0. The high-temperature data exhibited slight deviation from the TTS in master curves of G9 and G0 when mean values of aT were used to superimpose moduli. Muliawan and Hatzikiriakos (2007) indicated that, at temperatures higher than 40°C, mozzarella cheese started to melt undergoing structural changes. For those authors, viscoelastic data showed that cheese behaved as a physically dif-ferent material depending on temperature.
TABLE 9.3 Values of Shift Factors (aT) as a Function of Temperature for Frozen and Refrigerated Commercial Low-Fat Soft Cheeses Containing Microparticulated Whey Proteins as Fat Replacer
SamplesTemperature (°C) Log aT (G0) Log aT (G9) Mean log aT
Frozen cheeses
10 0.3 0.3 0.3
20 0 0 0
30 −1.70 −1.70 −1.70
40 −2.10 −2.70 −2.40
50 −2.70 −3.70 −3.20
Refrigerated cheeses
10 0.78 0.78 0.78
20 0 0 0
30 −1.22 −1.22 −1.22
40 −2.40 −3.40 −2.90
50 −3.22 −4.70 −3.96
Source: Adapted from Meza et al. (2012)

238 PART | I Advances in Food Rheology
MCC plots for frozen and refrigerated cheeses indicated that both elastic and viscous moduli could be superimposed at temperatures between 10 and 30°C. However, moduli failed to superpose at temperatures higher than 30°C, indicating temperature-dependent morphological changes in the cheese matrix. The MCC further supported the results obtained by the application of the TTS. Therefore, in the temperature range between 10 and 30°C, both moduli dis-played similar temperature dependence, allowing successful superposition with both TTS and MCC.
9.11.7 Juice Products
TTSP has been used to model the effect of temperatures (6–75°C) and concen-trations (20–50°Brix) on the rheological behavior of pummelo juice concen-trates (Chin et al., 2009). To obtain an overall picture of the flow behavior of pummelo juice concentrate, the master-curve technique was used to model the rheological behavior to obtain a general fluid characterization irrespective of its temperature. The master-curve was generated by determining the shift factor, aT with a reference temperature of 20 °C and a shear stress of 2.5 Pa. A plot of original shear stress in y-axis against the shifted shear rates in x-axis divided by the shift factors in logarithmic scales yielded a linear line for each concentration due to the horizontal shifting of data which caused an overlap.
Quek et al. (2013) combined a total of 35 average flow curves of soursop juice concentrates at 7 different temperatures (10–70°C) and 5 different con-centrations (10–50°B) for generating a master curve at a reference temperature of 50°C and a reference shear stress of 1 Pa. Authors used two steps of shifting: one for the temperature and the second one for concentration. The master curve was then plotted as shear stress versus shear rate divided by the dimension-less shift factor γ( )a/ T . The horizontal shifting with aT combined the seven temperatures to overlap on one master curve for each concentration. Power law equation was then fitted to the five concentration master curves to obtain the expression of rheological behavior of soursop juice concentrates in terms of consistency coefficient, K9 and flow behavior index, n9.
In the second shifting step, concentration master curves were moved to a reference concentration of 30°Brix at a shear stress of 1 Pa to construct a single master curve using the concentration shift factor of aC and the second reduced shear rate, is quantified as γ a a/ ( / )T C . The final master curve was plotted as shear stress versus shear rate divided by the dimensionless tem-perature shift factor and concentration shift factor to estimate the rheological behavior of soursop juice concentrates at concentration of 10–50°Brix and temperature of 10–70°C. The final master curve was also fitted to the Power law equation to obtain a single expression of rheological behavior of soursop juice concentrates in terms of consistency coefficient, K0 and flow behavior index, n0.
γ˙/aT
γ˙/(aT/aC)

Time–Temperature Superposition Principle Chapter | 9 239
9.12 CONCLUSIONS
TTSP can be used for food and biopolymer to elucidate the structural change/deformation at selected temperature. The novelty of the principle is associated with the fact that the frequency and time domain of the viscoelastic properties can be extended to higher range. The TTSP produces master curves under giv-en stresses and the corresponding temperature shift factor is dependent on the stress level at which the time shifting is used. TTSP plots for the biopolymers like PLA show some overlap at higher frequencies but significant dispersion at low frequencies due to longer thermal exposures. MCC plot or Han plot could also describe the TTS effect for food and biopolymers, effectively.
REFERENCES
Ahmed, J., 2012. Applicability of time–temperature superposition principle: dynamic rheology of mung bean starch blended with sodium chloride and sucrose—part 2. J. Food Eng. 109, 329–335.
Ahmed, J., 2015. Effect of barley β-glucan concentrate on oscillatory and creep behavior of com-posite wheat flour dough. J. Food Eng. 152, 85–94.
Ahmed, J., Auras, R., Kijchavengkul, T., Varshney, S.K., 2012. Rheological, thermal and structural behavior of poly(ε-caprolactone) and nanoclay blended films. J. Food Eng. 111, 580–589.
Ahmed, J., Varhney, S.K., Auras, R., Hwang, S.W., 2010. Thermal and rheological properties of l-polylactide/polyethylene glycol/silicate nanocomposites films. J. Food Sci. 75, N97–N108.
Ahmad, F.B., Williams, P.A., 1999. Effect of salts on the gelatinization and rheological properties of sago starch. J. Agric. Food Chem. 47 (8), 3359–3366.
Aleksandrov, A.P., Lazurkin, Y.S., 1939. Zh. Tekh. Fiz. 9, 1249. Al-Ruqaie, I.M., Kasapis, S., Richardson, R.K., Mitchell, G., 1997. The glass transition zone in
high solids pectin and gellan preparations. Polymer 38, 5685–5694. Alwis, K.G.N.C., Burgoyne, C.J., 2006. Time-temperature superposition to determine the stress
rupture of aramid fibres. Appl. Compos. Mater. 13, 249–264. Alwis, K.G.N.C., Burgoyne, C.J., 2008. Accelerated creep testing for aramid fibres using the
stepped isothermal method. J. Mater. Sci. 43, 4789–4800. Arrhenius, S., 1889. Translated into English in selected readings in chemical kinetics. In: Back,
M.H., Laidler, K.J. (Eds.), Oxford, NY, 1967. Z. Phys. Chem. 4, 226.Baek, D.M., Han, C.D., 1995. Rheological behavior of binary mixtures of polystyrene-block-poly-
isoprene copolymers in the disordered state. Polymer 36, 4833–4839. Chin, N.L., Chan, S.M., Yusof, Y.A., Chuah, T.G., Talib, R.A., 2009. Modelling of rheological be-
haviour of pummelo juice concentrates using master-curve. J. Food Eng. 93, 134–140. Cole, K.S., Cole, R.S., 1941. Dispersion and adsorption in dielectrics: I. Alternating current charac-
teristics. J. Chem. Phys. 9, 341–351. da Silva, J.A.L., Gonçalves, M.P., Rao, M.A., 1994. Influence of temperature on the dynamic and
steady-shear rheology of pectin dispersions. Carbohydr. Polym. 23 (77), 87. Dealy, J.M., Wissbrun, K.F., 1999. Introduction to nonlinear viscoelasticity. In: Wissbrun, K.,
Dealy, J.M. (Eds.), Melt Rheology and Its Role in Plastics Processing: Theory and Applica-tions. Kluwer Academic Publication Dordrecht, Dordrecht, pp. 103–152.
Edwards, S.F., 1967. The statistical mechanics of polymerized material. Proc. Phys. Soc. 92, 9.

240 PART | I Advances in Food Rheology
Ferry, J.D., 1980. Viscoelastic properties of polymers. John Wiley & Sons, New York, NY, p. 640. Han, C.D., Jhon, M.S., 1986. Correlations of the first normal stress difference with shear stress
and of the storage modulus with loss modulus for homopolymers. J. Appl. Polym. Sci. 32, 3809–3840.
Han, C.D., 1988. The influence of molecular weight distribution on the linear viscoelastic properties of polymer blends. J. Appl. Polym. Sci. 35, 167.
Han, C.D., Kim, J.K., 1993. On the use of time-temperature superposition in multicomponent/mul-tiphase polymer systems. Polymer 34, 2533–2539.
Han, C.D., Kim, Y.J., Chuang, H.K., Kwack, T.H., 1983. Rheological properties of branched low-density polyethylene. J. Appl. Polym. Sci. 28, 3435.
Han, C.D., Ma, Y.J., Chu, S.G., 1986. Rheological behavior of partially hydrolyzed poly(vinyl ace-tate-co-ethylene). J. Appl. Polym. Sci. 32, 5597.
Han, C.D., Kim, J., Kim, J.K., 1989. Determination of the order–disorder transition temperature of block copolymers. Macromolecules 22, 383–394.
Handge, U., Pötschke, P., 2007. Deformation and orientation during shear and elongation of a poly-carbonate/carbon nanotubes composite in the melt. Rheol. Acta 46 (6), 889–898.
Kasapis, S., Al-Marhoobi, I.M.A., Khan, A.J., 2000. Viscous solutions, networks and the glass tran-sition in high sugar galactomannan and k-carrageenan mixtures. Int. J. Biol. Macromol. 27, 13–20.
Kracalik, M., Laske, S., Witschnigg, A., Holzer, C., 2011. Elongational and shear flow in polymer-clay nanocomposites measured by on-line extensional and off-line shear rheometry. Rheol. Acta 50, 937–944.
Lakes, R.S., 2004. Viscoelastic measurement techniques. Rev. Sci. Instrum. 75, 797–810. Leaderman, H., 1943. Elastic and Creep Properties of Filamentous Materials and Other High Poly-
mers. The Textile Foundation, Washington, DC. Luo, W., Ting-Qing, Y., Qunli, A., 2001. Time-temperature-stress equivalence and its application to
nonlinear viscoelastic materials. Acta Mech. Solida Sin. 14, 195–199. Luo, W., Wang, C., Hu, X., Yang, T., 2012. Long-term creep assessment of viscoelastic polymer by
time-temperature-stress superposition. Acta Mech. Solida Sin. 25 (6), 571–578. Markovitz, H., 1975. Superposition in rheology. J. Polym. Sci. C 50, 431–456. Mendieta-Taboada, O., Sobralb, P.J.A., Carvalho, R.A., Habitante, A.M.B.Q., 2008. Thermome-
chanical properties of biodegradable films based on blends of gelatin and poly(vinyl alcohol). Food Hydrocoll. 22 (8), 1485–1492.
Meng, L., Dong, L., Wang, L., Adhikari, B., 2015. Creep behavior of starch-based nanocomposite films with cellulose nanofibrils. Carbohydr. Polym. 117, 957–963.
Meza, B.E., Verdinia, R.A., Rubiolo, A.C., 2012. Temperature dependency of linear viscoelastic properties of a commercial low-fat soft cheese after frozen storage. J. Food Eng. 109, 475–481.
Muliawan, E.B., Hatzikiriakos, S.G., 2007. Rheology of mozzarella cheese. Int. Dairy J. 17, 1063–1072.
Nakada, M., Miyano, Y., Cai, H., Kasamori, M., 2011. Prediction of long-term viscoelastic behav-ior of amorphous resin based on the time-temperature superposition principle. Mech. Time-Depend. Mater. 15, 309–316.
Narimissa, E., Gupta, R.K., Kao, N., Choi, H.J., Jollands, M., Bhattacharya, S.N., 2014. Melt rheo-logical investigation of polylactide-nanographite platelets biopolymer composites. Polym. Eng. Sci. 54 (1), 175–188.
Nickerson, M.T., Paulson, A.T., Speers, R.A., 2004. A time–temperature rheological approach for examining food polymer gelation. Trends Food Sci. Technol. 15, 569–574.

Time–Temperature Superposition Principle Chapter | 9 241
Nickerson, M.T., Paulson, A.T., Speers, R.A., 2007. Time–temperature studies of gellan polysac-charide–high sugar mixtures: effect of sodium ions on structure formation. J. Food Sci. 72 (5), E315–E319.
Nikolic, M.S., Mitric, M., Dapcevic, A., Djonlagic, J., 2016. Viscoelastic properties of poly(ε-caprolactone)/clay nanocomposites in solid and in melt state. J. Appl. Polym. Sci. 133, E315–E319.
Palade, L.I., Verney, V., Attane, P., 1995. Time–temperature superposition and linear viscoelasticity of polybutadienes. Macromolecules 28, 7051–7057.
Povolo, F., Fontelos, M., 1987. Time-temperature superposition principle and scaling behavior. J. Mater. Sci. 22, 1530–1534.
Ptaszek, A., Berski, W., Ptaszek, P., Witczak, T., Repelewicz, U., Grzesik, M., 2009. Viscoelastic properties of waxy maize starch and selected non-starch hydrocolloid gels. Carbohydr. Polym. 76, 567–577.
Ptaszek, P., Grzesik, M., 2007. Viscoelastic properties of maize starch and guar gum gels. J. Food Eng. 82 (2), 227–237.
Quek, M.C., Chin, N.L., Yusof, Y.A., 2013. Modeling of rheological behaviour of soursop juice concentrates using shear rate–temperature–concentration superposition. J. Food Eng. 118, 380–386.
Reichert, P., Hoffmann, B., Bock, T., Thomann, R., Mulhaupt, R., Friedrich, C., 2001. Morphologi-cal stability of poly(propylene) nanocomposites. Macromol. Rapid Commun. 22 (7), 519–523.
Singh, A.P., Lakes, R.S., Gunasekaran, S., 2006. Viscoelastic characterization of selected foods over an extended frequency range. Rheol. Acta 46, 131–142.
Solomon, M.J., Almusallam, A.S., Seefeldt, K.F., Somwangthanaroj, A., Varadan, P., 2001. Rheol-ogy of polypropylene/clay hybrid materials. Macromolecules 34, 1864–1872.
Subramaninan, R., Gunasekaran, S., 1997. Small amplitude oscillatory shear studies on mozarella cheese. Part II. Relaxation spectrum. J. Texture Stud. 28, 643.
Tschoegl, N.W., Knauss, W.G., Emri, I., 2002. The effect of temperature and pressure on the me-chanical properties of thermo- and/or piezorheologically simple polymeric materials in thermo-dynamic equilibrium—a critical review. Mech. Time-Depend. Mater. 6, 53–99.
Udyarajan, C.T., Horne, D.S., Lucey, J.A., 2007. Use of time-temperature superposition to study the rheological properties of cheese during heating and cooling. Int. J. Food Sci. Technol. 42, 686–698.
Urzhumtsev, Y.S., 1972. Time-temperature superposition, review. Mekhan. Polim. 3, 498. van Gurp, M., Palmen, J., 1998. Time temperature superposition for polymeric blends. Rheol. Bull.
67, 5–8. Woirgard, J., Sarrazin, Y., Chaumet, H., 1977. Apparatus for the measurement of internal friction as
a function of frequency between 1 and 10 Hz. Rev. Sci. Instrum. 48, 1322. Wu, D., Wu, L., Zhang, M., 2007. Rheology of multi-walled carbon nanotube/poly(butylene tere-
phthalate) composites. J. Polym. Sci. B 45 (16), 2239–2251. Yang, T.-C., Wu, T.-L., Hung, K.-C., Chen, Y.-L., Wu, J.-H., 2015. Mechanical properties and ex-
tended creep behavior of bamboo fiber reinforced recycled poly(lactic acid) composites using the time–temperature superposition principle. Constr. Build. Mater. 93 (15), 558–563.

245Advances in Food Rheology and Its Applications. http://dx.doi.org/10.1016/B978-0-08-100431-9.00010-3Copyright © 2017 Elsevier Ltd. All rights reserved.
Chapter 10
Rheology, Microstructure, and Functionality of Cheese
K. Muthukumarappan, G.J. SwamyDepartment of Agriculture and Biosystems Engineering, South Dakota State University, Brookings, SD, United States
10.1 INTRODUCTION
Cheese is a fermented milk-based food product, produced in a wide range of fla-vors and forms throughout the world (Fox and McSweeney, 2004). Although the primary objective of cheese-making is to conserve the principal constituents of milk, cheese has evolved to become a food of haute cuisine with epicurean qual-ities, as well as being highly nutritious. Discussions on cheese, in terms of the relationship between its rheology, microstructure, and functionality increase the complexity. This chapter makes a substantial impact to an understanding of this complexity. It highlights limitations and contemplations in assessing and direct-ing research on rheology, microstructure, and functionality. It also bridges the gaps in our understanding of the concepts and comprehensively scrutinizes the methods, theories, and applications of cheese.
10.2 RHEOLOGY OF CHEESE
10.2.1 Definition
Rheology is defined as the science of deformation and flow of matter. The term originates from the Greek word “rheos” meaning “to flow.” The name was coined in 1920 by Eugene C. Bingham, a professor at Lafayette College ( Steffe, 1996). Rheology is applicable to all types of materials, from gases to solids. In food science, rheology is used to define the consistency of different products based on the viscosity (thickness, lack of slipperiness) and elastic-ity (stickiness, structure). Therefore, in practical applications, rheology denotes viscosity measurements, characterization of flow behavior, and determination of material structure.

246 PART | II Product Specific Studies in Rheology
There are numerous areas where rheological data are needed in the cheese industry which are summarized in Table 10.1
10.2.2 Basic Concepts
Rheology deals with the relationship between strain, stress, and time (Blair et al., 1947). Strain and stress are closely related to deformation and force. Strain accounts for the size effect on material deformation due to difference in dimen-sions of sample whereas stress accounts for the size effect on applied force due to difference in cross-sectional area of samples. Using strain and stress, rheolo-gists are able to obtain true material properties independent of the sample size and geometry and compare test results for samples of different sizes and geom-etries. The concepts are described in Table 10.2 (Gunasekaran and Ak, 2002).
10.2.3 Uniaxial Testing
Uniaxial testing is a popular method for instrumental evaluation of cheese tex-ture. Uniaxial compression is the most popular test for estimating the rheo-logical properties of cheese. This test is popular probably because it is easy to execute and there is no need for sample gripping (Luyten et al., 1992). Nearly all compression tests on cheese are done using one of the versatile instru-ments commonly referred to as Universal Testing Machine (UTM). The UTM provides precise control of deformation while accurately measuring force. Mechanical properties usually calculated from uniaxial compression tests on cheese comprise modulus of deformability, fracture stress, fracture strain, and work to fracture. UTMs can be employed to carry out compression as well as tension, bending, and shear tests (Velmurugan et al., 2004).
Uniaxial tension is simply the opposite of uniaxial compression. The main difference exists in the strain rate. When a specimen is deformed at a constant speed, the strain rate decreases in tension and increases in compression test. Uniaxial tension tests are considered not suitable for routine measurements since they are more difficult to execute due to lengthy sample preparation and difficulty of gripping (Wise, 1961).
10.2.4 Stress Relaxation
Stress relaxation is a fundamental test to study viscoelasticity and it can be performed in uniaxial tension, compression, shear, bending, and torsion. At iso-thermal conditions, when a constant strain is applied to a viscoelastic material, the stress is essential to uphold that strain is not constant, however it decreases with time. This decrease in stress at constant strain is termed as stress relax-ation. Relaxation experiments are of two types: stress relaxation preceded by a sudden step strain (often applied to solids) and stress relaxation after a cessation of steady flow (applied to liquids) (Gunasekaran and Ak, 2000).

Rheology, Microstructure, and Functionality of Cheese Chapter | 10 247
TABLE 10.1 Applications of Rheology in the Cheese Industry
Important areas Application in cheese industry
Reference
Process engineering calculations involving equipments such as pipelines, pumps, extruders, mixers, coaters, heat exchangers, homogenizers, and online viscometers
Quantifying real time rheological flow properties inline based on synchronized measurements of velocity profiles using an ultrasound velocity profiling (UVP) technique with pressure difference (PD) technology
(Wiklund et al., 2007)
Determining ingredient functionality in product development
The effects of calcium on the rheology of cheese at different stages of manufacture were assessed using stress controlled rheometer and it was reported that calcium had a significant effect on the rheology.
(Solorza and Bell, 1998)
Intermediate or final product quality control
The rheological properties of mozzarella cheese were determined by different deformation tests. The results showed that rheology can be used as a quality control tool and is closely correlated with the overall texture, sensory attributes, and microstructural changes during cheese processing
(Muliawan and Hatzikiriakos, 2007)
Shelf-life testing Water is known to decrease the hardness or firmness of cheese and therefore the rheological property is an indication of spoilage
(Lee et al., 2004)
Evaluation of food texture by correlation to sensory data
Investigation of the sensory and rheological properties of young cheeses to identify perceived cheese texture. It was concluded that there was a strong correlation between the sensory and rheological properties which is useful to understand cheese texture
(Brown et al., 2003)

248 PART | II Product Specific Studies in Rheology
TABLE 10.2 Terminologies Used in Rheology
Terminology Description
Strain When a material is subjected to an external force, individual points of the body will move relative to one another causing a change in the size and shape of the material. Thus, strain (deformation) is the measure of such a change in size and shape.
Stress Stress is defined as force per unit area over which the force is applied. Thus, the unit of stress in SI system is Pa (= N/m2). Two types of stress can act on a surface: normal stress and shear stress. Normal stress acts perpendicular to the surface whereas shear stress acts parallel to the surface. Normal stress is categorized as tensile and compressive based on the directions of force and unit normal vector of the surface. In tension these two vectors are in the same direction (angle 0°) while in compression they are in opposite directions (angle 180°). In simple shear the force is applied tangentially to the surface.
Strain rate The strain rate is simply the time derivative of strain. The concept of strain rate is necessary to describe flow behavior of materials. In flow situations, since the strain will attain very large values with increasing time, it is preferred to discuss material behavior in terms of stress–strain rate rather than stress–strain.
Young’s modulus It is a measure of material’s resistance to axial deformation. It represents the stiffness of the material to an applied load. The larger the stiffness, the higher the force or stress needed to cause a given deformation or strain
Proportional limit It is the highest stress at which stress is directly proportional to strain. Hooke’s law applies up to the proportional limit. The proportional limit also marks the start of nonlinearity in the stress–strain curve
Elastic limit It is the maximum stress the material can sustain without any measurable permanent strain remaining upon the full release of load. Thus, the material will come back to its original shape/size when the stress is removed
Yield point A small increase in stress above the elastic limit results in a relatively large increase in strain. The sample is perpetually malformed even if the load is reduced to zero. This yielding is designated as the yield stress
Resilience It is the amount of energy absorbed by a material in the elastic range

Rheology, Microstructure, and Functionality of Cheese Chapter | 10 249
In nonfood applications, stress-relaxation tests can be carried out for a long time. The test duration for foods is restricted due to deterioration of sample which may take place before the test is completed. The deterioration may be a result of physical changes like moisture exchange with environment, microbial activity, and chemical and biochemical changes such as enzymatic browning in fruits/oxidation in oil-containing foods. The apparent relaxation times (ie, the time required for the stress to relax to 1/e, or ∼37%, of its initial value) of cheeses vary from 0.5 to 375 s (Heldman et al., 2006).
10.2.5 Creep and Recovery of Cheese
Application of a constant can create deformation. If the material, after some deformation, eventually resists further deformation, it is considered a solid. However, if the material flows indefinitely, it is considered a fluid. A creep test provides characteristic behavior of the viscoelastic material. A creep test may be executed in various configurations such as compression, tension, shear, and torsion (Huang et al., 2003). Generally, constant stress is administered to the material while the resultant strain is recorded as a function of time. Compres-sion is the most common creep test in cheese studies. Table 10.3 summarizes the creep test done for different types of cheese. The objective of creep tests is to calculate material properties D(t) and J(t) from the experimental strain versus time data
The time-dependent compliance for linear materials is given by
εσ
=D tt
( )( )
0
where ε(t) is the tensile or compressive strain.The shear creep compliance is given by
γτ
=J tt
( )( )
0
where γ (t) is the shear strain and τo is the applied shear stress.Most often, the creep response of cheese is described by the Kelvin–Voigt
model, Peleg model, respectively, and Maxwell model (Gunasekaran and Ak, 2002; Rao et al., 2014).
∑εσ η τ
= + + −−
=
tD
tD
t( )1 exp
i
n
ii0
01 2
where D0 is the instantaneous compliance, t is the time, η1 is the Newtonian vis-cosity, 1/η1 is the slope of the linear portion of the creep curve, Di is the delayed compliance of respective Kelvin–Voigt element, and τi is the retardation time of respective Kelvin–Voigt element.
D(t)=ε(t)σ0
J(t)=γ(t)τ0
ε(t)σ0=D0+tη1+∑i=2nDi1−exp−tτi

250 PAR
T |
II Product Specific Studies in Rheology
TABLE 10.3 Modeling of Rheological Properties of Various Cheese
Cheese type Objective Model Result Reference
Cheddar cheese
To observe the linear viscoelastic response of cheese at temperature of 40°C and stress of 1119.5 Pa
Six-element Kelvin model
It was obvious that the viscoelasticity index has the ability to differentiate the meltability of Cheddar cheeses at different ages and various fat levels
(Kuo et al., 2000)
Regular- and reduced-fat pasteurized process cheese
To analyze the linear viscoelastic properties of regular- and reduced-fat pasteurized process cheese during heating and cooling
Maxwell model
The viscosity distribution of Maxwell model elements was higher for reduced-fat cheese by a factor of 1.6–4.7 compared to the regular-fat cheese. This shows that the higher moisture content in the reduced-fat process cheese neither slackened the protein matrix nor softened the cheese even though higher moisture is suggested to cheese manufacturers to recompense for textural flaws in reduced-fat cheeses
(Subramanian et al., 2006)
Mozzarella cheese
To observe the effect of methocel as a water binder on the linear viscoelastic properties of mozzarella cheese during early stages of maturation
Six-element Voigt–Kelvin model
The skim milk Mozzarella with 0.2% Methocel was softer with higher creep and recovery compliance because of enhanced water holding capacity
(Subramanian et al., 2003)
Cheddar cheese
To investigate the stress-relaxation characteristics
Generalized Maxwell and Peleg models
Peleg model well described the stress-relaxation behavior of cheeses above 50°C and 8 element Maxwell model predicted better than 3 and 6 element Maxwell models. The stress-relaxation experiment differentiated the viscoelastic nature of different cheeses. This was due to fat content reduction, increase in moisture, melting temperature, and age of cheese
(Venugopal and Muthukumarappan, 2001)

Rheology, M
icrostructure, and Functionality of Cheese C
hap
ter | 1
0 251
Cheese type Objective Model Result Reference
Process cheese
To investigate the influence of high and low levels of calcium and phosphorous content, residual lactose, and salt-to-moisture (S/M) ratio on the viscoelastic properties of eight types of process cheeses
Six-element Kelvin–Voigt model
Process cheeses with high Ca and P content and high S/M ratio were significantly harder (P < 0.05) (higher storage and loss modulus, and lower creep and recovery compliance) compared to low Ca and P content and low S/M ratio process cheeses.
(Biswas et al., 2008)
Edam cheese To compare the influence of using two probes (a 100-mm plate and a 5-mm spherical probe) during a compression test on the trends of hardness changes during ripening of Edam cheese.
Peleg model By means of Peleg’s model, the extent of material relaxation and the initial rate at which the stress relaxes were calculated. The values of cheese hardness within the ripening period determined by the probes strongly correlated among themselves and also with the sensorially evaluated rigidity.
(Bunka et al., 2013)
Siahmazgi cheese
To assess the rheological specifications during ripening
Peleg model The elasticity nature was greater than the viscous nature of samples in terms of the domination of storage modulus over loss modulus during ripening
(Farahani et al., 2014)
Minas Frescal cheese
To study the rheological properties Peleg model Higher numerical values of ε indicate greater deformability as ε measures the deformation that occurs before the cheese ruptures. The higher numerical values obtained in this study indicate less deformable cheeses. The deformability may be related to the chemical structures of cheese components and also by small variations in the processing technology
(Magenis et al., 2014)

252 PART | II Product Specific Studies in Rheology
The term ∑ τ−
−
=D
t1 exp
i
n
ii2
is called the creep function and denoted by ψ(t)
To linearize and present the creep behavior of foods, the Peleg model can be ap-plied. Using constants k1 and k2, the Peleg model describes the creep function as
ψη
= − − =+
t D t Dt t
k k t( ) ( ) 0
1 1"
2"
A material, under a constant stress, has two strain components. The first one is an elastic component that happens instantaneously followed by immediate re-laxation on release of the stress whereas the second one is a viscous component which increases with time, as long as the stress is applied. The Maxwell model for creep/constant-stress situations claims that strain increases with time in a linear fashion. The Maxwell model creep is given by the following equation:
tt
( ) 10γ γλ
= +
10.2.6 Linear and Nonlinear Viscoelasticity
The rheological behavior of cheese is viscoelastic. The simplest type of vis-coelastic behavior is linear viscoelasticity, where the material is only slightly perturbed from its equilibrium state. Curves of frequency-dependent storage modulus, G(w) and loss modulus, G(w) are commonly used to describe linear viscoelastic behavior.
The small amplitude oscillatory shear (SAOS) measurements are commonly used to study the linear viscoelasticity of cheese (Gunasekaran and Ak, 2000). The main feature of SAOS tests is that, due to small stress/strain used, they can be categorized as objective/nondestructive tests appropriate for penetrating ma-terial configuration and structure development during different processes. There are four major experimental variables in any dynamic test: strain (or stress), frequency, temperature, and time. Thus, different types of dynamic tests can be set up changing one or more of these experimental variables. Table 10.4 shows a better understanding of these concepts.
Processing operations such as extrusion and stretching & molding operation during Mozzarella cheese manufacture involve large and rapid deformations that cannot be modeled using the theory of linear viscoelasticity. The deforma-tions involved in nonlinear viscoelasticity are neither small nor slow. Table 10.5 represents measurement of nonlinear viscoelasticity.
10.2.7 Cheese Stretchability
Stretchability is unique to Mozzarella and other pasta filata style cheeses. It is the property that allows Mozzarella cheese to form fibrous strands when heated
εtσ0=D0+tη1+∑i=2nDi1−exp−tτi
ψ(t)=D(t)−D0−tη1=tk1"+k2"t
γ(t)=γ01+tλ

Rheology, M
icrostructure, and Functionality of Cheese C
hap
ter | 1
0 253
TABLE 10.4 Dynamic Tests Used for Measurement of Nonlinear Viscoelasticity
Dynamic test Description Example Reference
Stress/Strain sweep
• Inthistest,themoduliaremeasured as a function of increasing strain while the frequency is fixed.
• Theobjectiveofastrainsweeptest is to determine the critical point beyond which the dynamic shear moduli (G*, G, G) become dependent on the input variable, strain.
• Thestrainsweeptestisthefirststep in dynamic mechanical analysis. It is carried out before a frequency sweep test to lay down the boundary levels of strain for frequency sweeps.
The cheese samples were exposed to increments of strain from 0.001% to 5% at a frequency of 1 Hz. The selected frequency relates to the order of magnitude of the typical times of the stresses that the cheeses experience during chewing. The curves typically displayed a plateau at small strains, the LVR, and then quickly decreased. The plateaus of G and G describe the LVR of the cheeses. The LVR limit strain (γlin) marks the end of the LVR, where G and G begin to decrease.
(Patarin et al., 2014)
(Continued )

254 PAR
T |
II Product Specific Studies in Rheology
TABLE 10.4 Dynamic Tests Used for Measurement of Nonlinear Viscoelasticity (cont.)
Dynamic test Description Example Reference
Frequency sweep • Itisthemostversatilerheological test to characterize the viscoelastic behavior.
• Inthistest,asinusoidalstrain(or stress) of fixed amplitude is imposed on the material and the dynamic moduli are determined over a wide range of frequencies. The resultant plot is also known as the “mechanical spectrum” of the material.
• Contemporaryrheometersarecapable of measuring dynamic properties from 0.01 to 100 Hz but with advanced rheometers one can conduct oscillatory measurements at frequencies as low as 10–5 Hz.
Elastic and loss moduli of Siahmazgi cheese as a function of shear strain (oscillating frequency 0.1 Hz, temperature 25°C)The viscoelastic parameters including storage modulus (G), loss modulus (G), and the ratio between the viscous and elastic properties of the material, phase angle tangent (tan δ) were determined under various frequency ranges (0.1–100 Hz) in a linear viscoelastic region. The lower the tan δ value (closer to 0), the less the cheese flows.
(Farahani et al., 2014)

Rheology, M
icrostructure, and Functionality of Cheese C
hap
ter | 1
0 255
Dynamic test Description Example Reference
Temperature sweep
• Thetemperature-sweeptest involves measurement of dynamic moduli over a temperature range at constant frequency and constant strain (or stress) amplitude.
• Temperaturesweepscanbe carried out in a ramp or stepwise fashion.
• Iftherampmodeisemployed,then the rate of temperature change and frequency of oscillation must be selected carefully.
• Temperaturesweepsareessential to investigate phase transitions.
• Thetemperaturesweeptest is also helpful to detect changes that would occur at rather high, and possibly inaccessible, frequencies if measurements were made at room temperature.
Cheddar and Mozzarella cheese samples were heated from 20 to 70°C at a rate of 1°C per minute and were subjected to an oscillating frequency of 1 Hz. The complex viscosity (η*) was monitored to identify how each of the cheese samples responded to heating. Based on the results of the temperature sweeps, an Arrhenius plot of the complex viscosity against the temperature was constructed. The complex viscosity for all three cheese samples was found to decrease as the temperature increased. The complex viscosities of the Cheddar samples were observed to decrease at a greater rate than the Mozzarella sample.
(Vogt et al., 2015)
(Continued )

256 PAR
T |
II Product Specific Studies in Rheology
Dynamic test Description Example Reference
Time sweep • Time-sweepmeasurementsaremade isothermally at constant strain/stress amplitude and frequency.
• Itisalsoknownasa“gelcure” test, and may be carried out with a temperature-sweep experiment to examine changes in rheological behavior due to combined effects of time and temperature.
• Generally,theoscillationfrequency is set at 1 Hz.
• Time-sweepmeasurementsare very useful in monitoring the build-up or breakdown of structure.
A dynamic time sweep (7200 s) analysis at angular frequency of 5 rad/s (0.8 Hz) and 1% strain was used to analyze the changes in storage modulus (G) as the milk coagulated. The time taken for the cheese–milk to first reach a G of 140 Pa was recorded and used as the cutting time in cheese making experiments.
(Ong et al., 2012)
TABLE 10.4 Dynamic Tests Used for Measurement of Nonlinear Viscoelasticity (cont.)

Rheology, Microstructure, and Functionality of Cheese Chapter | 10 257
TABLE 10.5 Methods Used for Stretchability Measurement
Nonlinear viscoelasticity measurement concept Description
Pipkin diagram
Pipkin proposed that material behavior at various frequency–strain amplitude (w –γ0) regimes can be depicted and Tanner plotted a dimensionless quantity, λw (Deborah number) versus a characteristic strain amplitude which is also dimensionless, A (=λ, the Weissenberg number) called “Pipkin diagram” At low frequencies, because the shear rate varies slowly with time, the deformation approaches that of simple, steady shear. As the frequency is increased, the stress will begin to lag the strain, as the material will exhibit viscoelasticity. At very high frequencies the response becomes more and more elastic. It has been suggested that at some critical strain amplitude, for molten materials the melt will slip at the wall, causing the stress signal to become erratic in oscillatory shear. Therefore, when the slip happens, it may be difficult to distinguish the effects of slip and nonlinear viscoelasticity.
Large amplitude oscillatory shear (LAOS)
The LAOS flow occurs usually when strain amplitude, γo is more than unity. The LAOS test is particularly useful for characterizing nonlinear viscoelasticity, because the Weissenberg number (proportional to the strain rate amplitude) and the Deborah number (proportional to the frequency) can be varied independently.
Spectral analysis The spectral analysis is the most direct way to evaluate LAOS data. For nonlinear viscoelasticity, σ(t) is not sinusoidal and σ(t) cannot be described in terms of two functions of frequency (modulus and loss angle or G(w) and G(w)). A few cycles after starting the test, the shear stress normally becomes a standing wave that can be represented using the Fourier series.

258 PART | II Product Specific Studies in Rheology
and stretched. Cheese stretchability is defined as “the ease and extent to which melted Mozzarella can be drawn to form strings.” Stretchability of Cheddar type hard and semihard cheeses are also occasionally reported as a way of comparing the effect of manufacturing variables among cheeses. Empirical and instrumen-tal methods can be used to measure the stretchability; however the empirical method is widely used. Table 10.6 describes the methods used for stretchability measurement (Fife et al., 2002; Apostolopoulos, 1994).
10.3 CHEESE MICROSTRUCTURE
Cheese microstructure is the three-dimensional arrangement of the casein mi-celles that link together into bands and chains. These micelles create a visco-elastic protein network in which moisture, fat globules, minerals, and bacteria are distributed (Impoco et al., 2007). One of the major influencers of texture and functional properties of cheese is the microstructure. It also has an im-pact on the physicochemical, transport, and nutritional properties of cheese ( Impoco et al., 2012).
Fluorescence spectroscopy has been efficaciously employed to assess molecular-level interactions between fat and proteins in numerous food-based emulsions. It has also been applied to observe structural changes in cheese and nonenzymatic browning in milk and other dairy products (Herbert et al., 2000). Tryptophan in the cheese casein is a naturally occurring fluorescent substance. The fluorescent properties vary in a hydrophobic and hydrophilic environment (Karoui and Dufour, 2003). Fluorescence spectroscopy is also employed by researchers to observe the spectra of tryptophan. This enables to predict the microstructure of any type of cheese. Simultaneously, it can also point out Maillard browning and oxidative stability of processing cheese while in storage period (Dufour et al., 2001).
10.4 CHEESE FUNCTIONALITY
10.4.1 Factors Affecting Functionality
The factors that affect the functionality of cheese ranges from the initial mate-rial, that is, milk to the postprocessing parameters. The factors are presented in Fig. 10.1
10.4.1.1 Milk PropertiesMilk, the primary raw material, has a direct effect on the functional properties of cheese. The standardization of milk (casein-to-fat ratio) is also responsible for cheese structure; else the cheese may be too soft or too hard. The melt-ing point of milk fat changes seasonally and is directly related to the melt-ing and stretching of cheese at high temperatures. The buffering capacity of milk is primarily due to colloidal calcium phosphate, soluble phosphate, citrate,

Rheology, Microstructure, and Functionality of Cheese Chapter | 10 259
TABLE 10.6 Disadvantages of Schrieber Test
Method Description
Empirical methods
One of the oldest methods to test stretchability is with the help of a fork. The “fork test,” as it is called, is performed by picking up a lump of melted cheese vertically with a fork until the bulk of the cheese strands breakThe length of the strands at failure is taken to indicate stretchability.Results of a fork test are only suitable for sample-to-sample comparison at the same location
Instrumental methods
The objective test accounts for the applied force or stress (the ease of stretch) and the failure deformation or strain (the extent of stretch).A prerequisite for a proper tensile test is a proper grip on the sample. For cheese, a good grip is not easily achieved as the material is soft. Therefore, they tend to deform at the grips and the stress concentration around the grip areas also leads to failure at the grips. This complicates data analysis.Additional problems are due to high test temperature and the difficulty in measuring the applied stress. Since the fibrous strands that form continuously yet randomly will thin out and break, typical stress profiles are very jagged.
Vertical elongation
Tensile tests that vertically strain a cheese sample until failure reflect how intuitively the stretch is perceived, in effect mimicking the fork test.It is the most popular tensile test configuration.Common problems associated with stretch tests are the effect of deformation rate and temperature change during the test. The cheese strands can cool rapidly because they are exposed to room temperature and, more importantly, are thinning out.Low-fat Mozzarella does not stretch well, as indicated by the poor stretch length and quality but low-fat Cheddar is better than low-fat Mozzarella
Horizontal extension
Cheese is stretched horizontally even though the test device operates as if it were a tensile test.For tensile tests, the sample is normally held vertical, but the problem of sample sagging under gravity occurs.It is overcome in this method by surrounding samples with a density-matching medium.This also serves to maintain temperature uniformity and to prevent food samples from drying out
Compression tests
Compression is a rather unconventional testing mode to investigate stretchability.Apostolopoulos suggested using a “compressive elongation test.” (Apostolopoulos, 1994)Though it is true that elongational viscosity can be related to stretchability, a uniaxial test is more suitable because the compressive-elongation test measures a biaxial property.Furthermore, the viscosity will only provide information on “resistance to flow.”The more important “extent of stretch” cannot be obtained from this type of test.

260 PART | II Product Specific Studies in Rheology
bicarbonate, and casein. Depending on pH and temperature, approximately two-thirds of the calcium is colloidal and the rest is in the form of solution. The proportion of colloidal calcium phosphate and pH influence the stretchability of cheese. Also studies have showed that calcium and phosphorus levels decrease with reduction in pH, thereby increasing meltability. Homogenization of milk reduces fat-globule size, alters the fat globule membrane, and creates a new fat–water interface predominantly containing caseins that can make fat glob-ules more stable. Additionally homogenized milk can increase cheese yield. However, the adverse effects of homogenization (at high pressures ∼6.7 MPa) include poor body, texture, reduced stretchability, and meltability. Milk proteins play a vital role in the functionality of cheese. The hydrolysis of αs1-casein and β-casein affects functional properties during maturation.
10.4.1.2 Cheese Manufacturing Procedure10.4.1.2.1 Starter Culture
The idea behind adding the culture is for acid production, proteolytic activity, and utilization of sugars such as galactose, glucose, and lactose. The rate of acid production is critical as it can affect cheese composition and meltability. The proteolytic activity of the starter culture affects rheological and textural properties of cheese through slow but progressive breakdown of caseins during storage. Some species are not capable of fermenting galactose, contributing to
FIGURE 10.1 Factors affecting functionality of cheese.

Rheology, Microstructure, and Functionality of Cheese Chapter | 10 261
Maillard browning of cheese during cooking while some cultures reduce the extent of browning.
10.4.1.2.2 Coagulants
Coagulants can be enzymes or acids. The enzymes used for coagulation can be classified into four types based on their source as: animal coagulant (rennin), microbial coagulant (enzymes from R. miehei and C. parasitica), plant coagu-lant (extracts from Cynara cardunculus and Calotropis procera), and fermenta-tion produced chymosin (pure chymosin). The major acids used as coagulants include malic acid, citric acid, acetic acid, hydrochloric acid, and phosphoric acid.
According to the literature, about 6% of the coagulant added to milk is active in the cheese curd (Gunasekaran and Ak, 2002). During the primary proteolysis, caseins break into peptides followed by the secondary proteolysis where the peptides are fragmented into smaller peptides and free amino acids by the starter culture enzymes. Direct acidification of milk influences the func-tional properties of cheese depending on the type of acid used and pH. Cheese viscosity is believed to decrease with decreasing pH.
10.4.1.2.3 Curd Handling
The coagulated mass is cooked to enhance syneresis and the temperature at which the curd is cooked in the whey affects the rheological properties. A higher cooking temperature reduces the moisture content and shrinks the curd. It also enhances the metabolic activity of bacteria in the curd, increasing lac-tic acid production and lowering pH, further contracting the curd. This action makes cheese acidic, hard, crumbly, and dry.
The curd is salted and pressed to form the cheese block and this process is also responsible for their characteristic texture. Pressing promotes matting of the curd particles into a contiguous, firm mass (Cheddar cheese) or prevents curd particles from matting so that an open texture results (cheshire cheese).
10.4.1.2.4 Cooking, Stretching, and Cooling
The cooking and stretching process is unique to cheeses such as Mozzarella cheese. The pH and temperature are critical factors that affect their characteris-tic properties. Mozzarella cheese curd is normally cooked at 40°C or higher to remove moisture and cause inactivation of starter culture. Such high temperature lowers cheese meltability, and stretchability. However, when the temperature is reduced to 35°C, it results in a softer cheese with a higher level of proteolysis after the cheese is made.
For optimal stretching, there is an optimal combination of pH and tempera-ture. The curd temperature is generally about 55–60°C. For instance, curd at pH 5.1–5.4 should be placed in hot water at 70–82°C for stretching. Higher stretch-ing temperature increases inactivation of proteolytic organisms while reducing

262 PART | II Product Specific Studies in Rheology
primary and secondary proteolysis during aging. The method of curd stretch-ing affects the cheese properties. For example, extruder stretching resulted in a cheese with lower meltability and no detectable free oil.
Stretched curd is cooled in chilled water-cooling towers to limit the growth of undesirable microorganisms which may lead to soft-body texture defect and gas holes. Soft-body defect renders cheese soft and pasty with poor shredding qualities and excessive meltability. Cooling continues to occur when Mozza-rella cheese is placed in brine for salting and eventually leads to variations in cheese meltability, stretchability, and free-oil formation at different locations within the block.
10.4.1.3 Composition of Cheese10.4.1.3.1 Moisture Content
Moisture is a major constituent and comprises more than one-third of the cheese mass. The moisture content in cheese is affected by various factors such as method of cooking, temperature, and salt content. For instance, in mozzarella cheese, slow screw increases the manufacturing time resulting in lower mois-ture content cheese. Greater the moisture content, the softer the cheese and the better its meltability; however, it has poor shredability.
10.4.1.3.2 Fat Content
Fat content varies from 20 to 33% in semihard and hard cheeses. Fat in cheese is present as globules contained within the protein matrix network and hence they are considered as “fillers” that influence the rheological, functional, textural and sensory properties of cheese. The size and distribution of fat globules have a significant effect on the properties of cheese. The average fat-globule size var-ies from about 1.5 to 4 µm and three-dimensional evaluations indicate that the higher the fat content, the higher the number of large fat globules and the higher the average fat-globule size.
Higher fat content allows cheeses to melt better, but it may be more difficult to shred. A lot of studies have focused on the reduction in fat content based on consumer interest in a low-fat diet, but fat reduction is also associated with in-crease in moisture, protein, calcium, phosphorus, and ash content and decrease in milk nonfat portion, fat in dry matter, and salt-moisture ratio. As the fat content decreases, changes in physical properties and flavor lower the cheese quality. Low-fat cheese also tends to form a dry film on the surface during heat-ing limiting cheese meltability.
Several technological changes have been proposed, including use of fat re-placements, to improve functional properties of low-fat cheeses. These chang-es have met with only limited success. Nonetheless, consumer acceptance of lower fat cheeses has only been tepid. Therefore, some hard-cheese plants are adding extra cream to make higher fat cheeses that offer improved functional properties.

Rheology, Microstructure, and Functionality of Cheese Chapter | 10 263
10.4.1.3.3 Salt Content
Salt can have a major effect on properties of cheese in spite of being a minor constituent. In addition to enhancing taste, it controls moisture content, micro-bial growth, and acidity. Saly is added directly (Cheddar cheese) or by placing the cheese in brine after the mixing and molding step (mozzarella cheese). In general, cheese with a salt content greater than 2% melts poorly and is less stringy. Insufficient proteolysis due to high salt content can cause a curdy tex-ture in certain cases. The effect of salt on the functionality of cheese is also related to the changes in water-binding capacity. A low salt level and high mois-ture content can make cheese pasty and off-flavored.
10.4.1.3.4 pH
The slightest change in pH affects the functional properties dramatically. Cheese turns brittle when pH is less than 5.0. Softness and meltability are also affected by pH. The pH is not the singular dominant factor but a combination with temperature and other ingredients affect meltability.
10.4.1.4 Postproduction Processes10.4.1.4.1 Aging
Aging is essential for the cheeses to develop their functional properties and fla-vor. The ripening period stages from few weeks to 24 months. The proteolytic hy-drolysis of intact caseins into peptides and free amino acids is one of the driving forces for changes in functional characteristics of cheeses during aging. Enzymes from several sources contribute to proteolysis. These sources are as follows: milk (plasmin), coagulant (rennet, chymosin, etc.), starter, secondary starter, and nonstarter microorganisms. Breakdown of caseins during proteolysis leads to re-organization and weakening of the protein matrix and enables the fat globules enmeshed within the matrix to be released such that they coalesce when cheese is heated, thus increasing meltability Mozzarella cheese is considered an unripened cheese. The high-temperature mixing–molding step during its manufacture partly inactivates the coagulant. Browning of mozzarella is also affected by aging.
10.4.1.4.2 Freezing
Freezing of cheese increases shelf life and preserves color, flavor, and nutritive value. Commercially, cheeses are frozen to stop ripening and prolong shelf life; however, freezing may induce undesirable physical and organoleptic changes. Cheddar and Mozzarella cheeses when exposed to different freeze–thaw condi-tions became softer and melted better after freezing and thawing.
10.4.1.4.3 Heat Processing
Temperature has a profound effect on meltability and stretchability. The heat-ing temperature (70–200°C) has a linear relationship with intensity of brown-ing but the browning is more related to heating duration. At low temperature,

264 PART | II Product Specific Studies in Rheology
prolonged heating (70°C for 20 min) does not brown the cheese, but a brief exposure to high temperature (1–3 min at 200°C) results in significant brown-ing. Increased viscosity during heating is thought to be the protein aggrega-tion by hydrophobic interactions among the caseins. As cheese is heated, the protein matrix adsorbs energy that influences the interactions that maintain the protein structure. As a result of the opposing temperature dependences, proteins unfold in the 60–80°C. During heating, accumulated protein aggregations in the casein matrix change the moisture distribution within the protein matrix. Local hardness and uneven distribution of moisture in the protein matrix decrease cheese meltability.
10.4.2 Melt and Flow Properties
Cheese is an important ingredient in pizza and it is exposed to high tempera-tures to melt and flow as consumer preference depends on the quality of melted cheese. Therefore, characterization of melt and flow properties of cheese is ex-tremely critical for successful use of cheese as an ingredient. Meltability may be defined as “the property of cheese shreds to fuse together upon heating” or “the ease and extent to which cheese will melt and spread upon heating” depending on the use of the ingredient and measurement criteria. Melt and flow properties can be measured by empirical and instrumental techniques.
10.4.2.1 Empirical Test10.4.2.1.1 Schreiber Test
Remove two thick or three thin cheese slices from the sliced production run every 10 min and stack them to give a 0.5-cm (3/16-in.) thickness. Then insert a sharp-edged copper cylinder or round cookie cutter with 41-mm (1.6-in.) inside diameter into the slices and push out a sample onto the center of a clean glass Petri dish. Set this thin-walled 15- × 100-mm dish with a cover marked with an identification number in a kitchen oven, preferably electric, at 232°C (450°F) for exactly 5 min. Using thermal safety gloves, remove the plates and set them to cool on a flat surface for about 30 min. Then center them over a concentri-cally numbered target-type graph. Look through the uncovered glass Petri dish and record numerically the outer edge of the flow line. As the cheese melts uni-formly and easily, its diameter and flow line number increase. Cheeses attaining a value of 4 or higher are acceptable. Cheeses with values below 4 are rejected and corrective action is immediately instituted. A dark brown discoloration in-dicates the presence of sugar or high pH. Table 10.7 shows the shortcomings of the Schreiber test method (Gunasekaran and Ak, 2002).
10.4.2.1.2 Modified Schreiber Test
Muthukumarappan et al. conducted the Schreiber test at different oven tem-peratures (60–232°C) and used different heating surfaces (Petri dish, aluminum

Rheology, Microstructure, and Functionality of Cheese Chapter | 10 265
plate, stainless-steel plate) (Muthukumarappan et al., 1999). They measured both the cheese flow line per and the cheese spread area. The spread area was determined by a computer vision method. Different heating surfaces were used to determine if thermal and surface tension properties would have an effect on the extent of flow. Based on this investigation, they proposed that the Schreiber test for Mozzarella should be performed at 90°C for 5 min on an aluminum plate and that the melted spread area should be measured as an indicator of cheese meltability.
Gunasekaran et al. replaced the convective oven with direct conduction heating via the metal plate on which the cheese disk is heated and allowed to flow (Gunasekaran and Ak, 2002). Removing the oven reduced the overall cost and space requirements and also the sample was more easily accessible for spread length and area measurements. The conduction-heating test is faster and allows continuous cheese melt/flow measurement. Further, this system could be adapted to make multisample measurements, enabling more consistent cheese meltability measurements to be faster and more efficient.
TABLE 10.7 Advantages of UW Meltmeter Test
Problem Description
Excessive heat treatment
During pizza baking, evaporative cooling effect due to moisture in the crust and other ingredients keeps the overall cheese temperature well below the oven temperature. Therefore, most cheeses get scorched and show brown or black discoloration especially at the edges when heated at 232°C
Uncontrolled heating The cheeses undergo nonuniform temperature distribution when heated in an oven. As the outer edges begin to flow, this thin layer then gets heated further to even higher temperature, causing both moisture loss and scorching. Moisture loss during heating may adversely affect measurements if the heat and mass transfer properties of the cheeses being tested are different. This condition is further aggravated by the excessive heating discussed previously. Cheeses may also develop a thin surface film due to exposure to air.
Measurement of flow line
This is one of the simplifying elements of the Schreiber test. However, the measurement of flow line indicated by the leading edge of the melted cheese flow is appropriate only if the melted cheese spreads evenly into a circular pattern. This occurs with some regular-fat natural cheeses. Many other natural and process cheeses, especially lower fat types, spread very unevenly when heated. In such cases, the leading edge flow line measurement gives totally misleading data

266 PART | II Product Specific Studies in Rheology
10.4.2.2 Objective Tests10.4.2.2.1 Steady Shear Viscometry
The test is carried out used a Brookfield viscometer along with a T-bar spindle. The viscometer reading in relative scale (in %) was measured as a function of cheese temperature. As the viscometer geometry and speed are arbitrary while the temperature distribution is not uniform, this test is of limited value. Steady shear viscometry is inherently unsuitable for measuring cheese viscosity due to fat separation. As cheese is heated, the fat melts and lubricates the station-ary and rotating cylinders (or plates) to such an extent that they slip past each other. The entire molten cheese mass is either left in the middle between the concentric cylinders (or plates) or rotates en masse. For fresh and soft cheeses, steady shear viscometry has been applied successfully to characterize their flow properties.
10.4.2.2.2 Capillary Rheometry
Capillary rheometry is a well-developed test and has structured data analysis procedures, making it a natural choice for cheese viscosity measurement. Slippage problems due to fat separation interfere with viscosity measurements of Cheddar and American process cheeses. The requirements for valid measure-ments using a capillary rheometer are as follows: (1) isothermal flow; (2) negli-gible radial flow; (3) negligible wall slip; (4) fluid is incompressible; (5) flow is laminar; and (6) minimal end effects. Major problems in testing cheeses using a capillary rheometer are the presence of viscoelastic effects and end effects. The fat separation further complicates the situation. Therefore, correction factors must be applied which is time-consuming and tedious, as it requires multiple tests using capillaries of different diameters. These problems along with expen-sive test instrumentation prevented exploration of cheese melt properties using the capillary rheometer.
10.4.2.2.3 Squeeze-Flow Rheometry
This test is performed by eliminating friction between the sample- compression platen interfaces. The test procedure is also simple and straightforward—compressing the sample axially between two lubricated plates in a uniaxial instrument. Under this configuration, assuming perfect slip, shear stress at sample–platen interfaces is zero. This method is suitable for cheese meltability evaluation for the following reasons. The first one is that melt is a biaxial phe-nomenon, hence, biaxial elongational viscosity determined from test adequate-ly describes the melt characteristics. The other one is that the presence of slip at sample–platen interfaces caused by fat separation is not only a prerequisite for a proper test but also is incorporated in the calculation of results. Biaxial elongational viscosity decreases with biaxial strain rate and this validates the strain-rate thinning behavior of cheeses.

Rheology, Microstructure, and Functionality of Cheese Chapter | 10 267
10.4.2.2.4 UW (University of Wisconsin) Meltmeter
The UW Meltmeter performs lubricated squeeze-flow tests (Wang et al., 1998). The device is made of aluminum and has a movable outer cylindrical annulus (75-mm outer diameter; 30-mm inner diameter). The annulus can be moved up and down by a lever around a 30-mm diameter stationary center cylinder. The stationary cylinder is equipped with an electric heater operated by a temperature controller. At the start of a test, the lever arm is raised such that the annulus is up, forming a 30-mm-diameter, 7-mm-deep sample well over the stationary cylinder. A sample of the same size as that of the sample well is placed in the well. The top of the sample should be flush with the top surface of the annulus, which serves as a platform for the melted cheese to flow and spread. The top of the cheese surface is covered with a 66-mm-diameter lubricated circular plate attached to a linear variable differential transformer (LVDT) rod. The role of the circular plate is to: (1) effectively seal the plate–cheese interface, prevent-ing any loss of moisture from the sample during heating (2) maintain constant contact with the cheese, enabling continuous monitoring of sample flow, and (3) apply the force required during a test to cause the melted cheese to flow along with the LVDT rod.
The LVDT is supported separately and connected to a computer data acqui-sition system. The sample is heated to the test temperature. A fine thermocouple inserted into the sample before the test monitors cheese temperature within 1°C and controls the heater. Once the sample attains the desired temperature (60°C), the lever arm is lowered to bring the annulus down. Simultaneously, the sample is subjected to lubricated axial compression due to the weight of the circular plate and LVDT core. This causes the cheese to flow. Additional weight may be added or a lighter plate can be used, as required, to change force causing flow. The sample height versus time of flow data is continuously recorded. The UW Meltmeter can also be operated under constant deformation rate by removing the LVDT and circular plate and bringing the test platen of a uniaxial testing machine in contact with the sample and flow platform at the beginning of a test. When the sample reaches the test temperature, the lever arm is lowered and crosshead of the uniaxial testing machine is activated simultaneously to deform the sample at a constant rate. Table 10.8 presents the advantages of the UW Meltmeter test over the Schreiber test.
The problems associated with the meltmeter are that each measurement takes too long, multiple tests cannot be performed simultaneously, and moving parts get clogged. Modifications were made to the meltmeter; however these changes are substantial and have not led to a device suitable for routine indus-trial use. The UW Meltmeter still is a suitable test device for R&D.
10.4.2.2.5 Dynamic Shear Rheometry
The dynamic shear rheometry is used for characterizing rheological properties of foods. Applying this technique for cheese meltability evaluation has the problem

268 PART | II Product Specific Studies in Rheology
of excessive slippage due to fat melting at elevated temperature. The problem has been dealt by using serrated plates or plates with a fine grade of sandpaper glued on, or by bonding samples directly onto a plate using a commercial adhe-sive such as cyanoacrylate ester. Another problem encountered is moisture loss, especially at high temperatures and during tests that take a long time but it can be rectified by applying a mineral oil or similar coating to the samples.
10.4.2.2.6 Helical Viscometry
In this method, a rotational viscometer is used. A T-bar spindle is attached to the rotating part instead of a cylindrical spindle as used in a typical rotational viscometry. The T-bar is lowered inside a ground mass of cheese held at 60°C in a glass beaker. The torque to rotate the spindle at a certain speed (1 rpm) as the T-bar spindle is raised through the melted cheese is recorded. The peak torque recorded and expressed in relative units of the full-scale response of the viscometer is used as an index of meltability. For lack of a better method and due to its apparent objectivity by using a commonly available viscometer, sev-eral researchers have since used this method for reporting meltability.
10.4.3 Fracture Properties
Fractures originate from debonding of atoms, nucleation, or growth and coales-cence of microcracks and microcavities. A fracture is a failure mechanism that encompasses stable or unstable spread of a defect within the material structure. Table 10.9 classifies the material failure due to fracture.
TABLE 10.8 Types of Material Failure Due to Fracture
Advantages Description
Controlled heating The sample is heated to a point higher than the melt temperature (60 or 65°C), which eliminates sample scorching at the edges
Uniform temperature The sample is not allowed to flow until the entire mass is at a uniform temperature. This prevents uneven temperature distribution during heating in the oven and the concomitant nonuniform flow pattern
Prevention of moisture loss
Since the sample is tightly covered during heating and a layer of oil is applied in the UW Meltmeter, there is no moisture loss, which improves the consistency and accuracy of meltability data
Continuous monitoring of flow
The LVDT and circular disk maintain continuous contact with the sample during flow, allowing calculation of flow rate. In the Schreiber test, only the end of the flow is measured

Rheology, Microstructure, and Functionality of Cheese Chapter | 10 269
Fracture-mechanics analysis is used to prevent fracture or spread of a defect. It also applies to adverse fracture in cheeses which may lower overall quality and customer expectation. Compression, tension, shear, torsion, and bending may be used to evaluate the fracture properties. Tension or bending is more appropriate for evaluating fracture properties as it is easy to witness the crack initiation and propagation. However, tension tests are challenging to execute with soft materials such as cheese. Hence, bending test is the desired test mode. Compression tests are conducted until sample failure, even when the objective of the test is not to estimate the fracture properties.
10.4.3.1 Notch TestA notch is utilized to test materials in tension and bending with known crack size. It is made by forcing a razor blade into cheese to a measured distance (the crack length). The cheese sample is prepared such that width (w) is twice the thick-ness (B), and the ratio of span (S = distance between supports) to B is 4 for large samples (Gunasekaran and Ak, 2002). The fracture toughness is calculated as
ϕ=
GA
Bwa
w
10.4.3.2 Cutting With Wire and BladeCutting cheese with wire and blade is very popular. Wire cutters range from small tabletop units to large-scale cutters at the factory level. Cutting with wire and blade comprise fracture, plastic deformation, and friction. The elastic–plas-tic fracture mechanics theory deems that the material flows only in a small area around the crack tip. Therefore the stored and flow energies are limited. During wire cutting, it can be assumed that only the material in the vicinity of the wire undergoes plastic deformation. The total energy during cutting may be consid-ered to comprise three major components: friction, flow, and fracture.
γ(t)=γ01+tλ
TABLE 10.9 Classification of Failure During Cheese Fracture
Failure Description
Brittle or quasi-brittle failure Fracture occurs without significant irreversible strain
Ductile failure Failure at large plastic strain at low temperature (∼1/4 of the melting temperature)
Creep failure Failure at large plastic strain at high temperature (>1/3 of the melting temperature)
Fatigue failure Failure due to monotonous loading either above or below yield stress. Classified as low, high, and giga cycle fatigue damage

270 PART | II Product Specific Studies in Rheology
10.4.3.3 Eye/Slit Formation and GrowthSmall and round holes in a cheese mass are a characteristic and desirable feature of Swiss, Gouda, and Edam cheeses. A nucleus is required in order for a hole to form. The eyes are formed primarily from CO2 (fermentation of propionic and citric acids) and N2 (dissolved in the cheese milk). Small air bubbles (N2 in milk) attached to curd particles may form as nuclei along with some impurities and small mechanical openings. The nuclei grow into eyes due to diffusion of CO2. The size, number, and distribution of eyes can be related to the time, quan-tity, intensity, and rate of CO2 production in cheese. Holes formed in cheeses such as Tilsit and Havarti are not called eyes and holes present in Cheddar-type cheeses is caused by spoilage organisms producing CO2, H2, or H2S indicating a quality defect. Even in cheeses where eyes or holes are customary, cracks are formed under certain conditions, pointing a quality defect.
10.4.4 Texture Properties
Texture of foods is the “eating quality” of foods encompassing many proper-ties of foods that excite our senses of sight, touch, and sound. The International Organization for Standardization defines texture of a food as “all the rheological and structural (geometric and surface) attributes of the product perceptible by means of mechanical, tactile, and, where appropriate, visual and auditory recep-tors.” Texture is the primary quality attribute of cheeses. The overall appearance and mouthfeel of cheeses are appreciated before their flavor. Cheeses offer a variety of textures, for instance, Mozzarella cheese is “stretchy” or “stringy” and Parmesan cheese is “crumbly.” The cheese wheel (Fig. 10.2) comprises five major sectors: flavor, texture, aroma, appearance, and taste. Make note of the texture sector that is further divided into classes and subclasses to list cor-responding sensory attributes.
Cheese texture is a reflection of its structure at the molecular level. The major structure-forming constituent is the casein matrix in which fat globules are entrapped and water is bound to casein and fills interstices of the matrix. This network structure is significantly influenced by the protein, fat and water content, and the biochemical activities that occur during storage. During manu-facture of cheeses, the factors that can contribute to the eventual cheese texture are moisture content, acidity, temperature, and pH. For instance, higher curd scalding temperature leaves the curd springy, and the resulting cheese. Lower pH of milk at the time of enzyme addition results in harder cheese
Texture of cheese changes continuously even after it is manufactured due to the proteolytic action of the residual enzymes. The most notable change with age is decrease in fracture strain and springiness and increase in creaminess. The factors that have an effect on cheese texture during ripening are as fol-lows: (1) pH at which whey is drained from the curd as this determines the pro-portions of chymosin and plasmin in the cheese (2) salt-in-moisture ratio that controls, along with temperature, the activity of residual rennet and plasmin in

Rheology, Microstructure, and Functionality of Cheese Chapter | 10 271
cheese, and (3) pH of cheese after salting. The textural changes in cheese dur-ing storage occur in two phases. In phase 1, the first 2 weeks after manufacture, there is a rapid change during which the casein network results in the softening of the cheese and in phase 2, the proteolytic changes are gradual and the protein matrix becomes less cohesive.
10.4.4.1 Empirical Texture Measurement10.4.4.1.1 Crumbliness
An empirical method based on uniaxial compression test to quantify the crumbliness of cheese was developed (Hwang and Gunasekaran, 2001). The crumbliness is a unique textural property of cheeses like Queso Fresco (Latin American white cheese) that are crushed and sprinkled on foods and then con-sumed. These cheeses maintain their integrity under heat, so they are used in casseroles, enchiladas, quesadillas, tacos, and other dishes that are broiled or baked before serving. The compression test is performed to 90% deformation
FIGURE 10.2 Cheese wheel.

272 PART | II Product Specific Studies in Rheology
at a speed of 1250 mm/min to crumble the cheeses. The crumbled samples are analyzed for their particle size using sieves with opening sizes ranging from 12.70 to 1.41 mm. A geometric mean diameter and total number of particles are calculated as follows:
∑∑
=
− =
=
M d
MGeometricmean diameter log
logi
ni i
i
ni
1 1
1
β ρσ= −
MdTotalnumber of particles exp(4.6 3ln )t
vln2
gm
where Mi is the mass (g) retained by ith sieve and di is the geometric mean di-ameter (mm) on ith sieve; Mt is the total mass (g); βv is the shape factor for cal-culating volume of particles (= π/6, assuming spherical shape); ρ is the particle density (g/cm3); σln is the lognormal geometric standard deviation of parent population by mass in natural logarithm; and dgm is the geometric mean particle diameter (mm) by mass.
10.4.4.1.2 Cone Penetrometer
Cone penetrometer is one of the rapid empirical methods used to evaluate the consistency of wide variety of solid, semisolid, and nonfood products. It also allows direct measurement of properties such as hardness “on the spot” which avoids textural damage due to transfer of sample from its original packaging to the measurement cup. Also, the rigidity and firmness of cheese can be deter-mined.
Three modes of operations are possible with the cone penetrometer: (1) a cone assembly of specific dimensions and weight is allowed to sink into the sample, and the depth of penetration after a fixed time is measured; (2) a cone assembly of specific dimensions and weight is released into the sample, and the depth of penetration is measured when it comes to rest due to yield stress of the test material, and (3) a cone assembly of specific dimensions and weight is driven at a constant speed into the sample, and the force required for the cone penetration is recorded. The surface of the specimen must be smooth and flat. In the constant weight test the penetration will be quick initially, but will gradually slow down and finally come to rest. The penetration depth at rest (h) is used to calculate an apparent yield stress (σapp):
Mg
h tan2
app2 2
σπ α
=
where M is the cone mass, g the acceleration due to gravity, and α the cone angle.
Geometric mean diameter=log−1∑ni=1Milogdi∑ni=1Mi
Total number of particles=Mtβvρexp(4.6σln2−3lndgm)
σapp=Mgπh2tan2α2

Rheology, Microstructure, and Functionality of Cheese Chapter | 10 273
10.4.4.1.3 Stringiness
Stringiness is the ability of the cheese to be peeled of as “cheese strands” by tearing at room or elevated temperatures. Stringiness may also be measured empirically by allowing the material to flow from a spoon or a funnel and de-termining the length of the thread formed. In certain cases, the stretchability of cheese is measured by the fork method.
10.4.4.2 Instrumental Texture Measurement10.4.4.2.1 Texture Profile Analysis (TPA)
The TPA test is a type of uniaxial compression test. The primary differences between the TPA test and uniaxial compression test are as follows: (1) unlike in compression tests, the TPA test is performed by subjecting a cylindrical speci-men to a two-step compression. The first compression step, known as the “first bite,” is followed by a second compression, the “second bite.” This is to simu-late the first two bites taken during chewing of the food. The two compression steps may be separated by an optional wait time; and (2) deformation used in the TPA test is often 70% or more. To imitate the chewing action more closely, a 90% compression is suggested. The uniaxial compression tests are terminated at or before macroscopic sample failure. The many textural parameters deter-mined from the TPA curve are as follows: hardness, cohesiveness, adhesive-ness, gumminess, springiness, and fracturability.
Since cheese is a viscoelastic material, the rate of compression and time between first and second bites will affect the test results. The fracture strain of cheeses is in the order of 25–60%. In typical TPA tests, the cheese is com-pressed 70% or more of the sample initial height. Thus, the sample is com-pressed beyond its macroscopic failure.
10.4.4.2.2 Compression Test
Uniaxial tests other than the TPA are also widely used in measuring cheese properties. The uniaxial compression test procedure is discussed in the uniaxial testing section. Among the textural attributes, firmness and springiness corre-late well with test data. Cohesion of hard cheese can be measured by uniaxial compression, tension, three-point bending, cutting tests, and stress-relaxation test. Out of these, uniaxial tension is the best to quantify cohesive properties of hard cheeses.
10.4.4.2.3 Wedge Fracture Test
In this test, a wedge is driven into a specimen until it is fractured by propaga-tion of a crack in a stable manner ahead of the tip of the wedge. It is called the f-Wedge test to emphasize the fact that the material is fractured in a con-trolled manner, and to distinguish this test from other wedge tests that simply push a wedge through the sample more like a penetration. The controlled crack

274 PART | II Product Specific Studies in Rheology
propagation is essential for accurate calculation of fracture energy. For the f-Wedge test, the fracture energy is calculated as follows:
=+
Eu H
aH
a
Fractureenergy0.75( )
[1 0.64 ]
2 3
4 4
where E is the modulus of elasticity, H the half sample width, u the distance between the split ears of the sample where the wedge is forcing them apart, and a the length of one split ear.
10.4.4.2.4 Texture Map
The texture map is a plot of fracture stress versus fracture strain of a product manu-factured or tested at varying compositions, pH, and age. The texture map can be divided into four quadrants to represent various material textures. The products that fall in Quadrant 1, lower left, are soft and “short” and materials in this quadrant are labeled “mushy.” In Quadrant 2, lower right, the materials are soft but are “long” and are known as “rubbery.” The materials that have high fracture stress and frac-ture strain are “tough.” These are located in Quadrant 3, top right. The materials that are firm but have a small fracture strain are “brittle.” These will fall in Quadrant 4, top left. A texture map for some selected cheeses is presented in Fig. 10.3.
Fracture energy=0.75(Eu2H3)a4[1+0.64Ha]4
FIGURE 10.3 Texture map of cheese.

Rheology, Microstructure, and Functionality of Cheese Chapter | 10 275
REFERENCES
Apostolopoulos, C., 1994. Simple empirical and fundamental methods to determine objectively the stretchability of Mozzarella cheese. J. Dairy Res. 61 (03), 405–413.
Biswas, A.C., Muthukumarappan, K., Metzger, L.E., 2008. Effect of Ca and P content, residual lactose, and salt-to-moisture ratio on the model parameters of process cheese linear viscoelastic properties. Int. J. Food Prop. 11 (3), 530–543.
Blair, G.W.S., Veinoglou, B.C., Caffyn, J.E., 1947. Limitations of the Newtonian time scale in rela-tion to non-equilibrium rheological states and a theory of quasi-properties. Proc. R. Soc. Lond. A 189 (1016), 69–87.
Brown, J.A., Foegeding, E.A., Daubert, C.R., Drake, M.A., Gumpertz, M., 2003. Relationships among rheological and sensorial properties of young cheeses. J. Dairy Sci. 86 (10), 3054–3067.
Bunka, F., Pachlová, V., Pernická, L., Burešová, I., Krácmar, S., Lošák, T., 2013. The dependence of Peleg’s coefficients on selected conditions of a relaxation test in model samples of Edam cheese. J. Texture Stud. 44 (3), 187–195.
Dufour, E., Devaux, M.F., Fortier, P., Herbert, S., 2001. Delineation of the structure of soft cheeses at the molecular level by fluorescence spectroscopy—relationship with texture. Int. Dairy J. 11 (4), 465–473.
Farahani, G., Ezzatpanah, H., Abbasi, S., 2014. Characterization of Siahmazgi cheese, an Iranian ewe’s milk variety: Assessment of physico-chemical, textural and rheological specifications during ripening. LWT—Food Sci. Technol. 58 (2), 335–342.
Fife, R.L., McMahon, Donald J., Oberg, C.J., 2002. Test for measuring the stretchability of melted cheese. J. Dairy Sci. 85 (12), 3539–3545.
Fox, P.F., McSweeney, P.L.H., 2004. Cheese: an overview. Cheese 1, 1–18. Gunasekaran, S., Ak, M.M., 2000. Dynamic oscillatory shear testing of foods—selected applica-
tions. Trends Food Sci. Technol. 11 (3), 115–127. Gunasekaran, S., Ak, M.M., 2002. Cheese Rheology and Texture. CRC Press. Heldman, D.R., Lund, D.B., Sabliov, C., 2006. Handbook of Food Engineering. CRC Press. Herbert, S., Riou, N.M., Devaux, M.F., Riaublanc, A., Bouchet, B., Gallant, D.J., Dufour, É., 2000.
Monitoring the identity and the structure of soft cheeses by fluorescence spectroscopy. Le Lait 80 (6), 621–634.
Huang, C-Y, Soltz, M.A., Kopacz, M., Mow, V.C., Ateshian, G.A., 2003. Experimental verifica-tion of the roles of intrinsic matrix viscoelasticity and tension-compression nonlinearity in the biphasic response of cartilage. J. Biomech. Eng. 125 (1), 84–93.
Hwang, C.H., Gunasekaran, S., 2001. Measuring crumbliness of some commercial Queso Fresco-type Latin American cheeses. Milchwissenschaft 56 (8), 446–450.
Impoco, G., Carrato, S., Caccamo, M., Tuminello, L., Licitra, G., 2007. Quantitative analysis of cheese microstructure using SEM imagery. Paper presented at the Communications to SIMAI Congress.
Impoco, G., Fucà, N., Tuminello, L., Licitra, G., 2012. Quantitative image analysis of food micro-structure. Mendez-Vilas, A. (Ed.), Current Microscopy Contributions to Advances in Science and Technology, vol. 2, Formatex Research Center, Spain, pp. 903–911.
Karoui, R., Dufour, É., 2003. Dynamic testing rheology and fluorescence spectroscopy investiga-tions of surface to centre differences in ripened soft cheeses. Int. Dairy J. 13 (12), 973–985.
Kuo, M.-I., Wang, Y.-C., Gunasekaran, S., 2000. A viscoelasticity index for cheese meltability eval-uation. J. Dairy Sci. 83 (3), 412–417.
Lee, S.K., Anema, S., Klostermeyer, H., 2004. The influence of moisture content on the rheological properties of processed cheese spreads. Int. J. Food Sci. Technol. 39 (7), 763–771.

276 PART | II Product Specific Studies in Rheology
Luyten, H., Vliet, T. van, Walstra, P., 1992. Comparison of various methods to evaluate fracture phenomena in food materials. J. Texture Stud. 23 (3), 245–266.
Magenis, R.B., Prudêncio, E.S., Fritzen-Freire, C.B., Stephan, M.P., do Egito, A.S., Daguer, H., 2014. Rheological, physicochemical and authenticity assessment of Minas Frescal cheese. Food Control 45, 22–28.
Muliawan, E.B., Hatzikiriakos, S.G., 2007. Rheology of mozzarella cheese. Int. Dairy J. 17 (9), 1063–1072.
Muthukumarappan, K., Wang, Y.-C., Gunasekaran, S., 1999. Short communication: modified Sch-reiber test for evaluation of Mozzarella cheese meltability. J. Dairy Sci. 82 (6), 1068–1071.
Ong, L., Dagastine, R.R., Kentish, S.E., Gras, S.L., 2012. The effect of pH at renneting on the microstructure, composition and texture of Cheddar cheese. Food Res. Int. 48 (1), 119–130.
Patarin, J., Galliard, H., Magnin, A., Goldschmidt, B., 2014. Vane and plate–plate rheometry of cheeses under oscillations and large strains: a comparative study and experimental conditions analysis. Int. Dairy J. 38 (1), 24–30.
Rao, M.A., Rizvi, S.S.H., Datta, A.K., Ahmed, J., 2014. Engineering properties of foods. CRC Press.
Solorza, F.J., Bell, A.E., 1998. The effect of calcium addition on the rheological properties of a soft cheese at various stages of manufacture. Int. J. Dairy Technol. 51 (1), 23–29.
Steffe, J.F., 1996. Rheological methods in food process engineering:. Freeman Press. Subramanian, R., Muthukumarappan, K., Gunasekaran, S., 2003. Effect of methocel as a water
binder on the linear viscoelastic properties of mozzarella cheese during early stages of matura-tion. J. Texture Stud. 34 (4), 361–380.
Subramanian, R., Muthukumarappan, K., Gunasekaran, S., 2006. Linear viscoelastic properties of regular-and reduced-fat pasteurized process cheese during heating and cooling. Int. J. Food Prop. 9 (3), 377–393.
Velmurugan, R., Gupta, N.K., Solaimurugan, S., Elayaperumal, A., 2004. The effect of stitching on FRP cylindrical shells under axial compression. Int. J. Impact Eng. 30 (8), 923–938.
Venugopal, V., Muthukumarappan, K., 2001. Stress relaxation characteristics of cheddar cheese. Int. J. Food Prop. 4 (3), 469–484.
Vogt, S.J., Smith, J.R., Seymour, J.D., Carr, A.J., Golding, M.D., Codd, S.L., 2015. Assessment of the changes in the structure and component mobility of Mozzarella and Cheddar cheese during heating. J. Food Eng. 150, 35–43.
Wang, Y.-C., Muthukumarappan, K., Ak, M.M., Gunasekaran, S., 1998. A device for evaluating melt/flow characteristics of cheeses. J. Texture Stud. 29 (1), 43–55.
Wiklund, J., Shahram, I., Stading, M., 2007. Methodology for in-line rheology by ultrasound Dop-pler velocity profiling and pressure difference techniques. Chem. Eng. Sci. 62 (16), 4277–4293.
Wise, J.S., 1961. The Development of a Specimen and Test Method to Provide Accurate Uniaxial Tension Mechanical Properties. Armed Services Technical Information Agency Arlington Hall Station, Arlington 12. The solid propellant information agency, Applied Physics Laboratory, The Johns Hopkins University, Virginia.

277Advances in Food Rheology and Its Applications. http://dx.doi.org/10.1016/B978-0-08-100431-9.00011-5Copyright © 2017 Elsevier Ltd. All rights reserved.
Chapter 11
Creep–Recovery and Oscillatory Rheology of Flour-Based Systems
T. Sanz*, A. Salvador*, M.J. Hernández***Institute of Agricultural Chemistry and Food Technology (IATA-CSIC), Valencia, Spain; **Department of Earth Physics and Thermodynamics, Faculties of Physics and Pharmacy, University of Valencia, Valencia, Spain
11.1 ELASTIC, VISCOUS, AND VISCOELASTIC BEHAVIOR
Rheology is a multidisciplinary science defined as the study of flow and defor-mation of matter. The two extremes of rheological behavior are the ideal elastic behavior and the ideal viscous behavior. However, most of the food products cannot be classified as purely elastic or viscous; they are viscoelastic, as they show an intermediate behavior among the two extremes.
The ideal elastic behavior is characteristic of solid substances which follow Hooke’s law, which states that the deformation is directly proportional to the force applied. In that case, the deformation is instantaneous and it is spontane-ously reversed when the force is removed (Fig. 11.1), so there is no dissipation of energy, that is, the deformation energy is stored. In shear tests this law is expressed as
σ γ= G (11.1)
where G is the shear modulus, γ is the shear strain or shear deformation, and σ is the shear stress (Barnes, 2000; Mezger, 2014).
The viscous behavior is characteristic of fluids, which flow when an external force is applied. In this case, the deformation is increasing as long as the force is maintained and it remains in the maximum value achieved when the force is removed (Fig. 11.1), so there is a dissipation of energy due to internal friction.
The ideal fluid follows the Newton’s law, which states that the force applied is directly proportional to the velocity of deformation.
σ=Gγ

278 PART | II Product Specific Studies in Rheology
σ ηγ= (11.2)
where η is the viscosity of the fluid and represents its resistance to flow and γ corresponds to the variation of strain, γ, with time ( γ γ= d dt/ ), that is, the slope of the straight line in Fig. 11.1.
Therefore, elastic modulus, G and viscosity, η, provide information about the elastic and viscous response of the material, respectively, as their values deter-mine the magnitude of the deformation or the shear rate produced when a shear stress is applied. Mechanical models representing these ideal behaviors consist of a spring for elastic solid and a dashpot for viscous liquid (Barnes, 2000; Mezger, 2014).
As indicated earlier, real materials are viscoelastic and they present simul-taneously viscous and elastic properties; therefore other rheological properties must be employed to characterize their behavior. In those cases, mechanical models with associations of springs and dashpots could serve for visualizing viscoelastic behavior. Maxwell model incorporates a spring and a dashpot in series, while the Kelvin–Voigt model considers a parallel association (Ferguson and Kemblowsky, 1991; Steffe, 1996; Mezger, 2014).
11.2 LINEAR VISCOELASTIC TESTS
11.2.1 Small Amplitude Oscillatory Shear Tests
In small amplitude oscillatory shear (SAOS) tests, samples are subjected to a strain which varies harmonically with time (Steffe, 1996; Mezger, 2014)
γ γ ω= tsin0 (11.3)
where γ0 is the amplitude (maximum strain) and w is the angular frequency.
σ=ηγ˙
γ˙γ˙=dγ/dt
γ=γ0 sin wt
FIGURE 11.1 Response (strain as a function of time), of an ideal solid and an ideal viscous fluid, when a shear stress is applied during a time t1, and then removed.

Creep–Recovery and Oscillatory Rheology of Flour-Based Systems Chapter | 11 279
If the sample was an ideal solid, following Hooke’s law (11.1), the output stress would be
σ γ γ ω σ ω= = =G G t tsin sin0 0 (11.4)
That means the measured stress is also a sinusoidal function, in phase with strain oscillation; σ0 being the amplitude of the stress oscillation (maximum shear stress).
On the other hand, in a viscous fluid obeying Newton’s law (11.2)
σ ηγ η γ ηγ ω ω σ ω π= = = = +
d
dtt tcos sin
20 0
(11.5)
which means the corresponding output stress is 90 degree out of phase with the strain (Ferguson and Kemblowsky, 1991; Mezger, 2014).
For intermediate behaviors, viscoelastic materials, the stress will present a phase lag or phase shift, δ, called loss angle, which varies between 0 and 90 degree; therefore in general oscillatory stress can be written as
σ σ ω δ= +tsin( )0 (11.6)
When developing this expression mathematically, we obtain (Steffe, 1996)
σ σ ω δ σ ω δ= +t tsin( )cos cos( )sin0 0 (11.7)
The moduli G′ and G″ are defined as
σγ
δ′ =
G cos0
0 (11.8)
σγ
δ′′ =
G sin0
0 (11.9)
The shear stress equation may be written as a combination of solid and liq-uid response (11.9 and 11.10)
σ γω
γ γ ω γ ω= ′ + ′′
= ′ + ′′G
GG t G tsin( ) cos( )0 0
(11.10)
G′ is called the storage modulus, as it is related to the solid, elastic behavior, and thus with the energy stored in the process. In an ideal solid this modulus coincides with G, the shear modulus. G″ is called the loss modulus, as it is re-lated to the liquid, viscous behavior, in which dissipation of energy is produced. For a Newtonian viscous liquid G″ is related to viscosity of the material, as it is equal to wη.
σ=Gγ=Gγ0 sin wt=σ0 sin wt
σ=η γ˙=ηdγdt=η γ0 w cos wt=σ0sinwt+π2
σ=σ0 sin(wt+δ)
σ=σ0sin(wt)cosδ+σ0cos(wt)sinδ
G′=σ0γ0 cosδ
G″=σ0γ0 sinδ
σ=G′γ+G″wγ˙=G′γ0sin(wt)+G″γ0
cos(wt)

280 PART | II Product Specific Studies in Rheology
Both moduli depend on the frequency applied to the oscillatory deformation. In Fig. 11.2, the most general overall response of viscoelastic fluids is shown (Barnes, 2000). In the range of frequencies normally available only one, or two, of the regions are visualized.
Another viscoelastic function that is widely used is the tangent of the phase shift, or loss tangent, which gives the relation between both dynamic moduli as described earlier.
δ = ′′′
G
Gtan
(11.11)
This quantity is dimensionless and varies from zero to infinity, and it is also a frequency-dependent rheological property. It provides information about the ratio of energy lost (Steffe, 1996). Low values of tan δ correspond to substanc-es with a predominance of elastic over the viscous behavior. Moreover, loss tangent is an indicator of the structure’s organization (molecular interaction) in a material as highly structured materials generally give low tan δ (Létang et al., 1999).
These tests can also be carried out in reverse, that is, by applying a sinusoi-dal stress and recording the deformation it causes, which is recommended in controlled stress rheometers.
It is important to point out that Eq. 11.11 is only correct for the linear visco-elastic region (LVR), where stress and strain are proportional. Therefore, prior to performing the frequency sweep of dynamic moduli, the LVR of the sample must be determined, so that an amplitude sweep (strain or stress) is performed keeping frequency constant. In the linear region both storage and loss moduli must be constant, and not dependent on the amplitude of the oscillation.
Within the LVR recording moduli for different frequencies at a constant stress or strain would give information about the elastic or viscous behavior of the sample and its internal structure (Song and Zheng, 2007). The stress (or strain) applied to the sample is so small that there are no irreversible chang-es in the structure; so, information about the unaltered system structure and
tanδ=G″G′
FIGURE 11.2 General curve for dynamic moduli as a function of frequency (Barnes, 2000).

Creep–Recovery and Oscillatory Rheology of Flour-Based Systems Chapter | 11 281
molecular interactions is obtained. Therefore, results can be related to micro-scopic observations of internal structure and thus the composition of the product (Létang et al., 1999). Depending on the frequency-dependence of the elastic modulus, G′ and loss modulus, G″, three types of system can be described: macromolecular solutions (G″ is greater than G′, where both parameters are highly frequency dependent), strong gels (G′ is much greater than G″, and G′ is independent of the frequency), and weak gels with an intermediate behavior (Lapasin and Pricl, 1995).
In order to reproduce the dependence of dynamic moduli with frequency, a generalized Maxwell model is employed, which is composed of a discrete or continuous superposition of Maxwell elements, with different relaxation times. Then, a relaxation spectrum, H(λ) is obtained. This modeling is used satisfac-torily in different kinds of wheat doughs (Phan-Thien and Safari-Ardi, 1998; Phan-Thien et al., 2000; Sofou et al., 2008).
However, other easier-to-obtain empirical equations are widely used to char-acterize the frequency dependence of viscoelastic moduli, obtaining parameters that allow comparison of different doughs.
Doughs’ mechanical spectra have been successfully fitted to power law models by different authors (Edwards et al., 2001; Tanner et al., 2008; Moreira et al., 2013; Khatkar et al., 2002; Hicks et al., 2011; Abebe et al., 2015):
ω′ ′′ =G G K, p (11.12)
with typical values for the exponent p about 0.2–0.3, as it was reported in most of the studies.
In some cases, G″ does not present a straight line in the usual log–log plot, so the power law do not fit well. This is the case of dough biscuits where an em-pirical exponential function has been employed (Laguna et al., 2013a; Tarancón et al., 2015):
ω′′ = ′′ + − ′′G K Z Texp(10 )n (11.13)
This kind of frequency dependence was alternatively fitted with nonlinear regressions in wheat doughs (Mís, 2011)
ω ω′ = + + + +G a b c(2 log ) (2 log )2 (11.14)
ω ω( ) ( )′′ = + + + +G a b c2 log 2 log 4 (11.15)
These authors also studied loss tangent frequency dependence by us-ing different empirical equations (Mís, 2011; Laguna et al., 2013a; Tarancón et al., 2015):
δ ω ω= + +a b ctan (log )2 (11.16)
δ ω ω= + +A B Clog(tan ) (log ) (log )2 (11.17)
G′,G″=K wp
G″=K″+Z exp(10−Twn″)
G′=a+b(2+logw)+c(2+logw)2
G″=a+b2+logw+c2+logw4
tanδ=a+bw+c(logw)2
log(tanδ)=A(logw)2+B(logw)+C

282 PART | II Product Specific Studies in Rheology
The minimum in tan δ can be calculated by derivation of the previous ex-pressions.
For stresses or strains out of LVR, that is, large amplitude oscillations, harmonics in the oscillation must be calculated, by a Fourier transform (Mezger, 2014), in order to obtain information about the viscoelastic behavior (Trevor et al., 2011).
11.2.2 Creep and Recovery Tests
In a creep test an instantaneous stress, σ0 is applied to the sample for a certain time, t1. After removal of the stress, the sample is allowed to relax (recovery test) and shear strain, γ(t) is monitored for another period of time, t2 (Fig. 11.1). The response of an ideal elastic solid and a viscous liquid is shown in Fig. 11.1. Real systems, concretely doughs, exhibit an intermediate response which im-plies not an instantaneous deformation and neither a complete recovery, as shown in Fig. 11.2.
One of the most widely used models, due to its relative simplicity and the acceptable results obtained in many cases, is the four-element Burgers model, comprising the association in series of the Maxwell model and the Kelvin–Voigt model (Fig. 11.3).
Generally, in order to compare results and make them independent of the stress applied, the strain per unit stress is considered. This property is called compliance, J.
γσ
=J tt
( )( )
0 (11.18)
In the Burgers model, the expression for the compliance as a function of time is (Steffe, 1996; Barnes, 2000; Mezger, 2014)
J(t)=γ(t)σ0
FIGURE 11.3 Burger model comprising the Maxwell and Kelvin-Voigt models in series and a plot of strain as a function of time in a creep-recovery test.
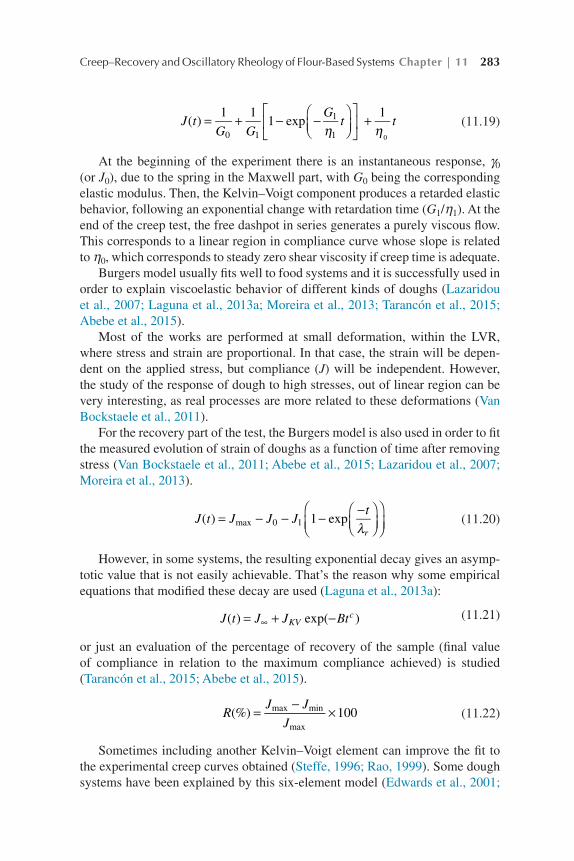
Creep–Recovery and Oscillatory Rheology of Flour-Based Systems Chapter | 11 283
η η= + − −
+J t
G G
Gt t( )
1 11 exp
1
0 1
1
1 0 (11.19)
At the beginning of the experiment there is an instantaneous response, γ0 (or J0), due to the spring in the Maxwell part, with G0 being the corresponding elastic modulus. Then, the Kelvin–Voigt component produces a retarded elastic behavior, following an exponential change with retardation time (G1/η1). At the end of the creep test, the free dashpot in series generates a purely viscous flow. This corresponds to a linear region in compliance curve whose slope is related to η0, which corresponds to steady zero shear viscosity if creep time is adequate.
Burgers model usually fits well to food systems and it is successfully used in order to explain viscoelastic behavior of different kinds of doughs (Lazaridou et al., 2007; Laguna et al., 2013a; Moreira et al., 2013; Tarancón et al., 2015; Abebe et al., 2015).
Most of the works are performed at small deformation, within the LVR, where stress and strain are proportional. In that case, the strain will be depen-dent on the applied stress, but compliance (J) will be independent. However, the study of the response of dough to high stresses, out of linear region can be very interesting, as real processes are more related to these deformations (Van Bockstaele et al., 2011).
For the recovery part of the test, the Burgers model is also used in order to fit the measured evolution of strain of doughs as a function of time after removing stress (Van Bockstaele et al., 2011; Abebe et al., 2015; Lazaridou et al., 2007; Moreira et al., 2013).
λ= − − −
−
J t J J Jt
( ) 1 expr
max 0 1
(11.20)
However, in some systems, the resulting exponential decay gives an asymp-totic value that is not easily achievable. That’s the reason why some empirical equations that modified these decay are used (Laguna et al., 2013a):
= + −∞J t J J Bt( ) exp( )KVc
(11.21)
or just an evaluation of the percentage of recovery of the sample (final value of compliance in relation to the maximum compliance achieved) is studied (Tarancón et al., 2015; Abebe et al., 2015).
=−
×RJ J
J(%) 100max min
max (11.22)
Sometimes including another Kelvin–Voigt element can improve the fit to the experimental creep curves obtained (Steffe, 1996; Rao, 1999). Some dough systems have been explained by this six-element model (Edwards et al., 2001;
J(t)=1G0+1G11−exp−G1η1t +1η t
J(t)=Jmax−J0−J11−exp−tλr
J(t)=J∞+JKVexp(−Btc)
R(%)=Jmax−JminJmax×100

284 PART | II Product Specific Studies in Rheology
Mís, 2011). Discussion of results can be complicated as it means fitting experi-mental curve to equations with six parameters in creep and five parameters in recovery region.
11.3 CREEP–RECOVERY AND OSCILLATORY RHEOLOGICAL MEASUREMENT OF FLOUR-BASED SYSTEMS
11.3.1 General Experimental Considerations
One very important point to consider before starting fundamental rheological measurements in flour-based systems is to consider their ingredient composi-tion. The sample structure should be stable during the time required to perform the experiment. For example, yeast should be removed in a bread dough formula to carry out a creep/recovery test or a stress/strain or frequency test. Otherwise it would not be possible to understand the origin of the observed response. Other tests, like a time sweep or a temperature sweep in oscillatory mode could be suitable options to evaluate the changes in the structure of these systems. An-other alternative is to measure yeasted dough once the structure becomes stable after the yeast effect.
To avoid drying of sample during the experiments a sealing system can be employed. A cover tool may be suitable for not very long (less than 30 min) measurements at room temperature. For longer experiments the application of silicone oil or liquid paraffin around the exposed area of the sample is recom-mended. The creation of a high humidity atmosphere, although less effective, may be the option in case the sealing liquid penetrates the sample.
Plate–plate geometry is the suitable geometry. The most common gap to be employed is 1 mm. Cone–plate geometry is not recommended as the required gap should be at least 3 times higher (preferably 10 times) than the maximum particle size present in the sample. The size of the plate will depend on the sample consistency. For samples that easily flow, for example, not very con-centrate flour–water system a 50–60-mm plate is usually employed. For higher strength samples, like biscuit short dough, lower geometry plates are employed (20 mm).
After placing the sample in the required measurement system an equilibra-tion time is necessary to allow the sample structure to relax and to achieve cor-rect temperature equilibration. Equilibration times employed in literature varies from 5 to 20 min.
Stress sweeps or strain sweeps must be performed at a fixed frequency and temperature. Ideally the stress/strain sweeps should be performed at different frequencies covering the extremes of the desired frequency interval. Howev-er, in practice, stress/strain sweeps are solely carried out at a frequency of 1 Hz, an approach which can be considered suitable in the majority of the situations, except for very high frequency–dependence systems. In any case, a good prac-tice is to select a stress/strain not very close to the end limit of the linear region.

Creep–Recovery and Oscillatory Rheology of Flour-Based Systems Chapter | 11 285
Selection of very low stress/strain values are also not recommended to avoid problem of very low sensibility. In systems with a strong influence of frequency in the viscoelastic behavior it may be more convenient to fix the strain, instead of the stress.
11.3.2 Wheat Flour Doughs
Wheat flour is the main ingredient used in the bakery industry, being the basis of products, such as bread, muffins, crackers, and cookies. Wheat flour dough is a heterogeneous system in which starch granules are included in a gluten net-work. The rheological properties of wheat flour doughs are largely governed by the contribution of starch, protein, and water. Starch is the most abundant com-ponent in dough (50–55%) and forms a continuous network of particles which gives rise to viscoelastic behavior. On the other hand gluten also has the ability to form a continuous macromolecular network, if enough water for hydration exists, and sufficient mechanical energy is supplied during mixing. These two different sources of viscoelastic properties converts wheat flour doughs into complex systems with a rheological behavior difficult to interpret (Amemiya and Menjivar, 1992). Linear dynamic viscoelastic measurements were found to be appropriate to measure starch–starch, starch–protein, and protein–protein interactions, but were not found suitable to understand the relative contribu-tion. On the contrary, large deformation shear measurements seem to resolve the relative contributions of long-range interactions (protein–protein) and shorter range interactions (starch–starch, starch–protein) to the viscoelastic behavior of wheat flour doughs. It is possible that longer range interaction could be de-tected by small deformation oscillatory experiments if these were conducted at frequencies below 0.01 rad/s (Amemiya and Menjivar, 1992).
Typically, the creep–recovery curves of doughs exhibited a typical visco-elastic behavior with both viscous and elastic components. The maximum creep strain (strain at the end of the creep phase) was used to describe dough rigidity (Wang and Sun, 2002).
In making dough, water is an essential ingredient necessary to form the glu-ten network and it provides the dough consistency. The consistency depends greatly on the amount of water used in making it. The majority of the water added to make up the dough is absorbed by hydrophilic groups on the protein molecules. If the water is insufficient for the hydration of all dough ingredients, the gluten does not become fully hydrated and the elastic nature of the dough is not fully developed. On the other hand, an excessive level of free water in the dough results in the domination of the dough viscous component, which a de-creased resistance to extension, increased extensibility, and the development of sticky doughs (Spies, 1997). Water is considered to play the most important role in the viscoelastic properties of dough due to its influence on the development of the gluten protein network (Skendi et al., 2010). The potential role of an aqueous liquid phase in doughs is to stabilize the surface active materials at the

286 PART | II Product Specific Studies in Rheology
gas–liquid interface, to maintain the integrity of gas bubbles and to promote gas retention. Moreover, the amount of free water is also likely to determine the type and quantity of material that may become solubilized during mixing and dough development.
It has been reported that increasing water contents reduce Farinograph Brabender Units (Létang et al., 1999) and G′ and G″ in dynamic oscillation mea-surements (Georgopoulos et al., 2004). In creep–relaxation tests, the creep com-pliance increases with increasing water contents at constant stress, whereas the elastic contribution decreases (Edwards et al., 1999; Mastromatteo et al., 2013).
Lower water content provided stronger doughs and smaller creep strain, in-dicating greater resistance to deformation. This is in agreement with the find-ings of Edwards et al. (1999) and Van Bockstaele et al. (2008), who reported an increase in maximum strain with increasing water absorption of durum wheat doughs for pasta.
In literature the effect of water on the dynamic viscoelastic properties has been interpreted in two different ways (Mastromatteo et al., 2013). In one way it is considered that water, above or below a limiting number, does not interfere with dough structure but acts as simple inner filler. Therefore, a variation in the moisture content proportionally changes dynamic properties. The other way considers that water molecules act as a plasticizer lowering the glass transition temperature (Tg) of the doughs. In this case, increasing the moisture content of the doughs changes dynamic response because the relaxation dynamics ac-celerates in a manner similar to that of amorphous synthetic polymers when the temperature rises (Masi et al., 1998).
Tan δ has been found to be independent of water content in a wide variety of dough systems.
Long mixing times act like long rest times giving an increased tan δ (up to 0.4–0.5) for the dough sample based on soft wheat flour and 50% water. These results are quite characteristic of weakening of the material structure. A mixing time between 120 and 150 s corresponds to optimally mixed doughs with a tan δ of about 0.35. The effect of overmixing depends strongly on the type of flour used.
Hardt et al. (2014) studied wheat flour rheology at low water contents (34–44.8% total basis) and the influence of xylanases. A water reduction from 43.5% to 34% increased resistance upon mixing as evidenced by higher Farinographic Unit values, increased G′ and G″ values, and decreased the maximum creep compliance. Addition of two different types of endoxylanases resulted in lower G′ and Farinograph dough consistencies and an increase in maximum creep compliance.
The impact of different arabinoxylan (AX) concentrations on the protein microstructure and on the rheological properties of wheat and rye model doughs was studied. It was expected from theory that increasing AX concentration re-duces the elasticity of the dough. However, a decrease in dough elasticity due to AX addition occurs only as long as the proteins have the ability to form a

Creep–Recovery and Oscillatory Rheology of Flour-Based Systems Chapter | 11 287
network. If the concentrations of AX are very high that the proteins cannot form a network, higher AX concentrations should not have a further effect on the dough elasticity. In both types of doughs, increasing AX concentration decreas-es the elastic properties due to a decrease in the protein microstructure. In the wheat model dough it was found that no change in the viscoelastic properties occurred for concentration of AX higher than 7.5%, which was associated with the fact that no protein network formation occurs. The same trend was found in the rye model dough. The rheological results agreed with the microstructural analysis (Döring et al., 2015).
The changes in wheat dough properties during short-term storage were successfully monitored by SAOS and large deformation creep–recovery tests (Hadnadev et al., 2015). The rheological properties of dough over the period of storage became more elastic and less extensible in comparison to freshly harvested wheat. The viscoelastic properties of weaker flour samples changed more markedly during storage than those of stronger flours, indicating that the intensity of rheological changes in dough during wheat storage might be depen-dent on gluten variety.
11.3.3 Bread Doughs
Basically bread doughs are composed of a mixture of wheat flour and water plus a small amount of salt and possibly other materials, such as preservatives or yeast. Dough rheology plays an important role in the quality of baking prod-ucts and moreover poses many intriguing questions about mechanical behavior (Tanner et al., 2008).
The individual effects of adding sucrose, NaCl, and yeast to the dynamic oscillatory properties of a wheat flour and water dough were studied. Both NaCl and sucrose decrease the values of G′ and G″ of the dough at room temperature and delay starch gelatinization temperature. The incorporation of yeast to the dough turns it into a developing system, so special attention should be taken, in the experimental conditions, to correctly measure the effect of yeast. One proto-col employed to evaluate the effect of yeast in the viscoelastic properties was to first ferment the dough for a specific time, temperature, and relative humidity, and subsequently frozen the fermented dough. The structure of the defrozen yeasted sample was stable during the required time necessary to evaluate fre-quency dependence from 10 to 0.01 Hz. Yeast addition was found to decrease the viscoelastic functions and their frequency dependence at room temperature (Salvador et al., 2006). Similarly, Wehrle and Arendt (1998) found that yeasted doughs were less elastic than unfermented dough as they showed lower recov-ery capacity. The presence of yeast did not induce a delay in the temperature of the inflection point of G′ and G″ associated with the onset or starch gelatiniza-tion in comparison to a control dough without yeast addition.
The rheological, microstructural, and sensorial properties of durum wheat bread was studied focusing on the effect of dough water content (Mastromatteo

288 PART | II Product Specific Studies in Rheology
et al., 2013). This type of bread produced using durum wheat flour (Triticum durum) is a traditional bread in southern Italy characterized by a higher crumb firmness, a lower loaf volume, and a longer shelf-life compared to wheat bread (Boyacioglu and D’Appolonia, 1994). The oscillatory results revealed a pre-dominance of the elastic modulus (G′) versus the viscous modulus (G″). Similar to other dough water systems (Létang et al., 1999) an increase in water content had softening effects, with a decrease in both G′ and G″. The parameter tan δ was independent of the water content. The maximum creep strain (strain at the end of creep phase) was used to describe dough rigidity (Wang and Sun, 2002). The stronger doughs, which are the samples with the lower water content and greater resistance to deformation, had smaller creep strain than the softer doughs with higher water content. Lazaridou et al. (2007) reported that the maximum creep strain increased with rising water content in the gluten-free doughs. Moreover, this is in agreement with the findings of Edwards et al. (1999) and Van Bocks-taele et al. (2008), who reported an increase in maximum strain with increasing water absorption of durum wheat doughs for pasta.
The recovery strain is a useful tool for determining dough springiness or resilience and can be used to describe the elastic property of dough (Wang and Sun, 2002). Creep–recovery experiments may give some insight into the micro-structure of dough. For example, a small recovery may indicate the presence of small structures in dough, whereas a large recovery may indicate the presence of larger structures (Weegels et al., 1995). The recovery also is an important factor for dough film stability.
The higher the recovery strain, the better the stability against rupture of dough films between gas cells. The elasticity or springiness should be suffi-ciently high to prevent the ascent and spreading of gas cells under the influence of gravity (Bloksma and Bushuk, 1988). A much greater recovery was found with the increase in water content. It was concluded that creep–recovery test can give an indication on the bread volume potential of the flour and on how the dough will behave during processing (Van Bockstaele et al., 2011).
Breads with whole grain, multigrains, or functional ingredients like β-glucans are becoming very popular in the bakery industry, mainly due to the health benefits associated to fiber consumption (Gamel et al., 2013). Howev-er, fiber incorporation significantly affects the dough rheological properties. The incorporation of fiber, particularly insoluble one into the dough may inter-fere with the development of the three-dimensional gluten network and disrupts the starch–gluten matrix, which is associated to an increase in the predominance of G′ and a reduction of extensibility.
11.3.4 Biscuit and Cookie Doughs
The main ingredients of biscuit dough are flour, sugar, and fat. The quality of the biscuit depend on the nature and concentration of the ingredients used in the dough. Rheological properties are among the most important of the physical

Creep–Recovery and Oscillatory Rheology of Flour-Based Systems Chapter | 11 289
properties that define dough behavior, specifically the measurement of visco-elastic behavior by dynamic methods (SAOS). The stress applied to the sample in the LVR is low enough so as not to produce an irreversible change in the structure; therefore information about the unaltered system structure is obtained so that this test may be considered a sort of fingerprint of the dough structure. The linear viscoelastic properties of biscuit doughs have been studied by a number of authors. With respect to flour, Baltsavias et al. (1997) evaluated the linear viscoelastic properties of short doughs with various compositions. They studied the effect of flour replacement by native starch and observed a quantita-tive decrease in the viscoelastic modulus. As for the role of sucrose, it increased the liquid-like properties of the dough because sucrose modifies the properties of the nonfat phase via its influence on the amount of solvent.
The effect of endogenous flour lipids on the structure of semisweet doughs and short doughs has been studied by oscillatory tests (Papantoniou et al., 2003, 2004). The employment of defatted flour produced higher visco-elasticity and the microstructure of the defatted short dough biscuits revealed that their gluten protein was more hydrated and developed. It was suggested that polar lipid fraction form bonds with the protein molecules and help to control the access of water to the proteins (Papantoniou et al., 2004).
Laguna et al. (2013a) studied the effect of partial flour substitution by a resistant starch ingredient, as fiber enrichment, on the viscoelastic properties of biscuit dough. They obtained higher values for G′ than G″ but both moduli showed weak dependency on frequency indicating a weak gel structure. Also, when resistant starch increases, an increase in both moduli was obtained. Al-though the flour substitution affected the G′ and G″ values, tan δ profiles were similar indicating that no structural changes have occurred. Similar results were found by Raymundo et al. (2014). They studied the effect of addition of psyl-lium fiber on the rheological properties in biscuit dough and they found that G′ was always higher than G″ and higher magnitude of G′ and G″ are obtained for the formulations with both higher levels of flour and psyllium. They concluded that there are two factors that may contribute to a higher degree of the dough structure: the high protein content, which favors the gluten formation and the high levels of soluble fiber, which promotes the establishment of interaction between proteins and polysaccharides.
Fat is an essential ingredient in short dough biscuits and is the largest com-ponent after flour (Sai Manohar and Haridas Rao, 1999). The major functions of fats in this baked system are imparting shortening, richness, and tenderness and improving flavor and mouthfeel (Pareyt and Delcour, 2008). Fat surrounds the proteins and the starch granules limiting the formation of a gluten network (Maache-Rezzoug et al., 1998; Ghotra et al., 2002). The produced dough has less elastic properties, which is desirable in cookie making, since it does not shrink after lamination (Baltsavias et al., 1997; Maache-Rezzoug et al., 1998). Recently, Tarancón et al. (2015) studied the viscoelastic properties of a bis-cuit dough type where 100% fat was replaced by a cellulose ether–sunflower

290 PART | II Product Specific Studies in Rheology
oil–water emulsion (Sanz et al., 2011). They found the existence of a more liq-uid-like structure, with lower values of the elastic and loss modulus in the cel-lulose emulsion doughs compared with the control dough, as the other authors.
Sucrose competes with flour for the available water, inhibiting the gluten de-velopment (Gallagher et al., 2003). Moreover, it affects the dough consistency (Olewnik and Kulp, 1984) which plays a role in the sheeting step. An increase in G* when sucrose is replaced or lowered comparing with a dough without sucrose was obtained indicating dough stiffening (Laguna et al., 2013b). This increased elasticity of the sucrose-reduced samples can be explained by more pronounced gluten development in these samples, in agreement with Pareyt et al. (2009) who stated that gluten entanglement is restricted by the pres-ence of sucrose due to a competition between the gluten and sucrose for water (Yamazaki, 1971).
Laguna et al. (2013a) employed the Burgers model to characterize success-fully the behavior of a short dough type during a creep test and to evaluate the effect of flour substitution by resistant starch. The creep and recovery tests revealed an increase in elasticity and in the resistance to flow and a decrease in deformability with incorporation of resistant starch, which was associated with a decrease in biscuit spread during baking. In another work, Pedersen et al. (2004) used oscillatory and creep–recovery tests to study the linear viscoelastic properties of semisweet biscuit doughs made with flours from eight different cultivars. They found no differences in percent recovery when comparing semi-sweet biscuit doughs from different cultivars, although the maximum strain and recovery were strongly affected by the cultivar. Pedersen et al. (2005) evalu-ated the effect of adding sodium metabisulfite and a commercial protease. They observed an increase in dough extensibility and a decrease in elasticity. Biscuit contraction and spread were mostly correlated to percent recovery of the dough and to protein and gluten content.
11.3.5 Gluten-Free Doughs
Due to the increase in the pathologies associated with gluten intake, such as al-lergy, celiac disease, and gluten sensitivity, a high demand for gluten-free prod-ucts exists. Research focuses mainly on the combination of gluten-free flours with ingredients or additives capable of simulating the viscoelastic behavior of gluten.
Rice flour is most widely employed, mainly because of its hypoallergenic properties, which is also a source of easily digestible carbohydrate (Gujral and Rosell, 2004).
Hydrocolloids are the main protagonist to simulate viscoelastic properties of gluten. Several hydrocolloids have been probed to improve dough development and gas retention through an increase in viscosity, producing gluten-free breads with higher specific volume (Haque and Morris, 1994; Lazaridou et al., 2007; Marco and Rosell, 2008; Sciarini et al., 2012).

Creep–Recovery and Oscillatory Rheology of Flour-Based Systems Chapter | 11 291
The cellulose ether hydroxypropyl methylcellulose (HPMC) can be consid-ered most popular as its thermal gelation ability simulates the viscoelastic be-havior of gluten during heating, quite effectively. At lower temperatures HPMC is characterized by its great water-holding capacity; when heating up to the specific gelling temperature strong hydrophobic bonds are formed with other HPMC chains, resulting in a stronger gel network.
The interaction between HPMC, psyllium, and water in gluten-free bread making was recently studied by Mancebo et al. (2015). The creep–recovery curves of the gluten-free doughs obtained exhibited typical viscoelastic be-havior, combining both viscous fluid and elastic components. Similar creep– recovery profiles were obtained previously in rice-flour doughs (Sivaramakrish-nan et al., 2004). Psyllium incorporation reduced the pasting temperature and compliance values, and increased elastic and viscous moduli values. HPMC addition increased G′ and G″ but had no important effects on pasting properties and compliance values. The increase in dough hydration level was associated with a decrease in influence of hydrocolloids on dough rheology and specific volume and hardness of breads. Creep–recovery tests were found to be better predictor of bread quality characteristic than oscillatory tests.
The effect of carob flour incorporation on gluten-free doughs from rice flour was studied by Tsatsaragkou et al. (2014). An increase in water content de-creased the resistance of dough to deformation and dough strength, whereas carob flour increased the elastic character and strength of the dough. The oscil-latory viscoelastic measurements revealed a solid-like viscoelastic character, with G′ predominant over G″. Increased amount of carob flour led to an increase in elastic character of bread dough since fiber addition elasticizes and strength-ens the dough structure.
Oscillatory and creep–recovery rheological properties of gluten-free doughs from blends of chestnut and rice flours were studied by Moreira et al. (2013). Rheological properties were significantly modified by flour ratio and by chest-nut particle size. Power and Burgers models were used to describe the mechani-cal spectra and creep–recovery behavior.
11.4 CONCLUSIONS
Functionality of flour-based systems is extremely dependent on their visco-elastic properties. However, the establishment of general and well-defined re-lationships among viscoelastic properties and specific functionalities is quite a difficult task, which is still in progress. The reason may be related to the dif-ficulty in establishing comparisons among the different published studies due to variations in sample composition and other experimental conditions. Despite no general rules been established, there is no doubt about the link between visco-elastic properties of flour-based systems and their functionality. Mixing, pump-ing, lamination, and baking performance, among other processes, have been found to be strongly dependent on the system’s viscoelastic properties. Also, the

292 PART | II Product Specific Studies in Rheology
organoleptic properties of the final food (bread, biscuit, muffins, etc.), specially texture, have been linked to initial viscoelastic properties and how they change during the processing steps.
This chapter focuses mainly on the study of linear viscoelastic properties by applying SAOS and creep and recovery tests. To provide information about the linear viscoelastic properties, these tests apply very small forces, which confer very valuable information about the inner structure of the system. Their disad-vantage is that these small forces do not simulate real processes. There are also a wide variety of tests that apply bigger forces to study viscoelastic properties; some are empirical tests, such as the classical amylograph or farinograph, oth-ers are fundamental tests, such as the large amplitude oscillatory shear tests, the most recent technique applied. As linear and nonlinear rheological tests inform about different structural characteristics, they should be considered comple-mentary.
REFERENCES
Abebe, W., Ronda, F., Villanueva, M., Collar, C., 2015. Effect of tef [Eragrostis tef (Zucc.) Trotter] grain flour addition on viscoelastic properties and stickiness of wheat dough matrices and bread loaf volume. Eur. Food Res. Technol. 241, 469–478.
Amemiya, J.I., Menjivar, J.A., 1992. Comparison of small and large deformation measurements to characterize the rheology of wheat flour doughs. J. Food Eng. 16, 91–108.
Baltsavias, A., Jurgens, A., van Vliet, T., 1997. Rheological properties of short doughs at small deformation. J. Cereal Sci. 26, 289–300.
Barnes, H., 2000. A Handbook of Elementary Rheology. University of Wales, Aberystwyth. Bloksma, A.H., Bushuk, W., 1988. Rheology and chemistry of dough. Pomeranz, Y. (Ed.), Wheat:
Chemistry and Technology, vol. 2, American Association of Cereal Chemists, St. Paul, MN, pp. 131–217.
Boyacioglu, M.H., D’Appolonia, B.L., 1994. Characterization and utilization of durum wheat for breadmaking. I. Comparison of chemical, rheological, and baking properties between bread wheat flours and durum wheat flours. Cereal Chem. 71, 21–28.
Döring, C., Nuber, C., Skukenborg, F., Jekle, M., Becher, T., 2015. Impact of arabinoxylan addition on protein microstructure formation in wheat and rye dough. J. Food Eng. 154, 10–16.
Edwards, N.M., Dexter, J.E., Scanlon, M.G., Cenkowski, S., 1999. Relationship of creep-recov-ery and dynamic oscillatory measurements to durum wheat physical dough properties. Cereal Chem. 76, 638–645.
Edwards, N., Peressini, D., Dexter, J.E., Mulvaney, S.J., 2001. Viscoelastic properties of durum wheat and common wheat dough of different strengths. Rheol. Acta 40, 142–153.
Ferguson, J., Kemblowsky, Z., 1991. Applied Fluid Rheology. Elsevier Science Publisher, London. Gallagher, E., O’ Brien, C.M., Scannell, A.G.M., Arendt, E.K., 2003. Evaluation of sugar replacers
in short dough biscuit production. J. Food Eng. 56, 261–263. Gamel, T.H., Badali, K., Tosh, S.M., 2013. Changes of β-glucan physicochemical characteristics in
frozen and freeze dried oat bran bread and porridge. J. Cereal Sci. 58, 104–109. Georgopoulos, T., Larsson, H., Eliasson, A.C., 2004. A comparison of the rheological proper-
ties of wheat flour dough and its gluten prepared by ultracentrifugation. Food hydrocoll. 18, 143–151.

Creep–Recovery and Oscillatory Rheology of Flour-Based Systems Chapter | 11 293
Ghotra, B.S., Dyal, S.D., Narine, S.S., 2002. Lipid shortenings: a review. Food Res. Int. 35, 1015–1048.
Gujral, H.S., Rosell, C.M., 2004. Functionality of rice flour modified with a microbial transgluta-minase. J. Cereal Sci. 39, 225–230.
Hadnadev, M., Hadnađev, T.D., Pojic, M., Torbica, A., Tomic, J., Rakita, S., Hajnal, E.J., 2015. Changes in the rheological properties of wheat dough during short-term storage of wheat. J. Sci. Food Agric. 95 (3), 569–575.
Haque, A., Morris, E.R., 1994. Combined use of ispaghula and HPMC to replace or augment gluten in breadmaking. Food Res. Int. 27, 379–393.
Hardt, N.A., Boom, R.M., van der Goot, 2014. Wheat dough rheology at low water contents and the influence of xylanases. Food Res. Int. 66, 478–484.
Hicks, C.I., See, H., Ekwebelam, C., 2011. The shear rheology of bread dough: modelling. Rheol. Acta 50, 701–710.
Khatkar, B.S., Fido, R.J., Tatham, A.S., Schofield, J.D., 2002. Functional properties of wheat gliadins. II. Effects on dynamic rheological properties of wheat gluten. J. Cereal Sci. 35, 307–313.
Laguna, L., Hernández, M.J., Salvador, A., Sanz, T., 2013a. Study on resistant functionality in short dough biscuits by oscillatory and creep and recovery tests. Food Bioprocess Technol. 6, 1312–1320.
Laguna, L., Vallons, K.J.R., Jurgens, J., Sanz, T., 2013b. Understanding the effect of sugar and sugar replacement in short dough biscuits. Food Bioprocess Technol. 6 (11), 3143–3154.
Lapasin, R., Pricl, S., 1995. Rheology of Industrial Polysaccharides: Theory and Applications. Blackie Academic & Professional, Glasgow.
Lazaridou, A., Duta, D., Papageorgiou, M., Belc, N., Biliaderis, C.G., 2007. Effects of hydrocol-loids on dough rheology and bread quality parameters in gluten-free formulations. J. Food Eng. 79 (3), 1033–1047.
Létang, C., Piau, M., Verdier, C., 1999. Characterization of wheat flour-water doughs. Part I: rheom-etry and microstructure. J. Food Eng. 41 (2), 121–132.
Maache-Rezzoug, Z., Bouvier, J.M., Allaf, K., Patras, C., 1998. Effect of principal ingredients on rheological behaviour of biscuit dough and on quality of biscuits. J. Food Eng. 35, 23–42.
Mancebo, C.M., Merino, C., Martínez, M.M., Gómez, M., 2015. Mixture design of rice flour, maize starch and wheat starch for optimization of gluten free bread quality. J. Food Sci. Technol. 52 (10), 6323–6333.
Marco, C., Rosell, C.M., 2008. Breadmaking performance of protein enriched gluten free breads. Eur. Food Res. Technol. 227, 1205–1213.
Masi, P., Cavella, S., Sepe, M., 1998. Characterization of dynamic viscoleastic behavior of wheat flour doughs at different moisture contents. Cereal Chem. 75, 428–432.
Mastromatteo, M., Guida, M., Danza, A., Laverse, J., Frisullo, P., Lampignano, V., Del Nobile, M.A., 2013. Rheological, microstructural and sensorial properties of durum wheat bread as affected by dough water content. Food Res. Int. 51 (2), 458–466.
Mezger, T.G., 2014. The Rheology Handbook, fourth ed. Vincentz Network, Hanover. Mís, A., 2011. Interpretation of mechanical spectra of carob fiber and oat wholemeal-enriched
wheat dough using non-linear regression models. J. Food Eng. 102, 369–379. Moreira, R., Chenlo, F., Torres, M.D., 2013. Rheology of gluten-free doughs from blends of chesnut
and rice flours. Food Bioprocess Technol. 6, 1476–1485. Olewnik, M.C., Kulp, K., 1984. The effect of mixing time and ingredient variation on farinograms
of cookie doughs. Cereal Chem. 61, 532–537.

294 PART | II Product Specific Studies in Rheology
Papantoniou, E., Hammond, E.W., Tsiami, A.A., Scriven, F., Fordon, M.H., Schofield, J.D., 2003. Effects of endogenous flour lipids on the quality of semisweet biscuits. J. Agric. Food Chem. 51, 1057–1063.
Papantoniou, E., Hammond, E.W., Tsiami, A.A., Scriven, F., Fordon, M.H., Schofield, J.D., 2004. Effects of endogeneous flour lipids on the quality of short-dough biscuits. J. Sci. Food Agric. 84, 1371–1380.
Pareyt, B., Brijs, K., Delcour, J.A., 2009. Sugar-snap cookie dough setting: the impact of sucrose on gluten functionality. J. Agric. Food Chem. 57, 7814–7818.
Pareyt, B., Delcour, J.A., 2008. The role of wheat flour constituents, sugar, and fat in low moisture cereal based products: a review on sugar-snap cookies. Crit. Rev. Food Sci. Nutr. 48, 824–839.
Pedersen, L., Kaack, K., Berg, M.N., Adler-Nilssen, J., 2004. Rheological properties of biscuit dough form different cultivars, and relationship to baking characteristics. J. Cereal Sci. 39, 37–46.
Pedersen, L., Kaack, K., Bergs, M.N., Adler-Nissen, J., 2005. Effects of chemical and enzymatic modification on dough rheology and biscuit characteristics. J. Food Sci. 70, 152–158.
Phan-Thien, N., Newberry, M., Tanner, R.I., 2000. Non-linear oscillatory flow of a soft solid-like viscoelastic material. J. Non-Newtonian Fluid Mech. 92, 67–80.
Phan-Thien, N., Safari-Ardi, M., 1998. Linear viscoelastic properties of flour-water doughs at dif-ferent water concentrations. J. Non-Newtonian Fluid Mech. 74, 137–150.
Rao, M.A., 1999. Rheology of Fluids and Semisolid Foods. Aspen Publishers, Gaithersburg, MD. Raymundo, A., Fradinho, P., Nunes, M.C., 2014. Effect of psyllium fibre content on the textural
and rheological characteristics of biscuit and biscuit dough. Bioactive Carbohydr. Diet. Fibre 3, 96–105.
Sai Manohar, R., Haridas Rao, P., 1999. Effect of emulsifiers, fat level and type on the rheological characteristics of biscuit dough and quality of biscuits. J. Sci. Food Agric. 79, 1223–1231.
Salvador, A., Sanz, T., Fiszman, S.M., 2006. Dynamic rheological characteristics of wheat flour–water doughs. Effect of adding NaCl, sucrose and yeast. Food Hydrocoll. 20, 780–786.
Sanz, T., Salvador, A., Fiszman, S.M., Laguna, L., 2011. Fabricación y aplicación de emulsión sustituta de grasa. Patente Española ES 2408690A1.
Sciarini, L.S., Ribotta, P.D., Leon, A.E., Perez, G.T., 2012. Incorporation of several additives into gluten free breads: effect on dough properties and bread quality. J. Food Eng. 111, 590–597.
Sivaramakrishnan, H.P., Senge, B., Chattopadhyay, P.K., 2004. Rheological properties of rice dough for making rice bread. J. Food Eng. 62, 37–45.
Skendi, A., Papageorgiou, M., Biliaderis, C.G., 2010. Influence of water and barley β-glucan addi-tion on wheat dough viscoelasticity. Food Res. Int. 43, 57–65.
Sofou, S., Muliawan, E.B., Hatzikiriakos, S.G., Mitsoulis, E., 2008. Rheological characterization and constitutive modelling of bread dough. Rheol. Acta 47, 369–381.
Song, Y., Zheng, Q., 2007. Dynamic rheological properties of wheat flour dough and proteins. Trends Food Sci. Technol. 18, 132–138.
Spies, R., 1997. Application of rheology in the bread industry. In: Faridi, H., Faubion, J.M. (Eds.), Dough Rheology and Baked Product Texture. CBS Press, Houston, TX, pp. 343–361.
Steffe, J.F., 1996. Rheological Methods in Food Process Engineering, second ed. Freeman Press, East Lansing, MI.
Tanner, R.I., Qi, F., Dat, S.-C., 2008. Bread dough rheology and recoil. I. Rheology. J. Non-Newto-nian Fluid Mech. 148, 33–40.

Creep–Recovery and Oscillatory Rheology of Flour-Based Systems Chapter | 11 295
Tarancón, P., Hernández, M.J., Salvador, A., Sanz, T., 2015. Relevance of creep and oscillatory tests for understanding how cellulose emulsions function as fat replacers in biscuits. LWT—Food Sci. Technol. 62, 640–646.
Trevor, S.K., McKinley, G.H., Ewoldt, R.H., 2011. Large amplitude oscillatory shear flow of gluten dough: a model power-law gel. J. Rheol. 55, 627–654.
Tsatsaragkou, K., Yiannopoulos, S., Kontogiorgi, A., Poulli, E., Krokida, M., Mandala, I., 2014. Ef-fect of carob flour addition on the rheological properties of gluten-free breads. Food Bioprocess Technol. 7, 868–876.
Van Bockstaele, F., De Leyn, I., Eeckhout, M., Dewettinck, K., 2008. Rheological properties of wheat flour dough and the relationship with bread volume. I. Creep-recovery measurements. Cereal Chem. 85 (6), 753–761.
Van Bockstaele, F., De Leyn, I., Eeckhout, M., Dewettinck, K., 2011. Non-linear creep-recovery measurements as a tool for evaluating the viscoelastic properties of wheat flour dough. J. Food Eng. 107 (1), 50–59.
Wang, F.C., Sun, X.S., 2002. Creep-recovery of wheat flour doughs and relationship to other physi-cal dough tests and breadmaking performance. Cereal Chem. 79 (4), 567–571.
Weegels, P.L., Orsel, R., van de Pijpekamp, A.M., Lichtendonk, W.J., Hamer, R.J., Schofield, J.D., 1995. Functional properties of low Mr wheat proteins. II. Effects on dough properties. J. Cereal Sci. 21, 117–126.
Wehrle, K., Arendt, E.K., 1998. Rheological changes in wheat sourdough during controlled and spontaneous fermentation. Cereal Chem. 75 (6), 882–886.
Yamazaki, W.T., 1971. Soft wheat products. In: Pomeranz, Y. (Ed.), Wheat Chemistry and Technol-
ogy. American Association of Cereal Chemists, St. Paul, MN.

297Advances in Food Rheology and Its Applications. http://dx.doi.org/10.1016/B978-0-08-100431-9.00012-7Copyright © 2017 Elsevier Ltd. All rights reserved.
Chapter 12
Rheological Properties of Gluten-Free Bread Doughs: Relationship With Bread Quality
F. Ronda, S. Pérez-Quirce, M. VillanuevaDepartment of Agriculture and Forestry Engineering, Food Technology, College of Agricultural and Forestry Engineering, University of Valladolid, Palencia, Spain
12.1 INTRODUCTION
Rheology, established as the science of the deformation and flow of mat-ter, studies the manner in which materials respond to applied stress or strain (Steffe, 1996). It is a science of relevant importance in the study of the properties of bread dough. These properties are related to its ease of handling during bread making and its capability of development during fermentation and baking and of leading to final products of good quality. Dough rheology is also important in determining ingredient functionality in product development. Understanding the physicochemical basis of dough rheology is also used to implement innova-tive products and processes (Menjivar, 1989). Therefore, studies on rheologi-cal properties of foods are useful and important for applications that include handling and processing, quality control, and sensory assessment of foods. The latter is an important field of study to which food scientists have made signifi-cant contributions (Rao, 2007).
Fluid foods that contain significant amounts of dissolved high molecular weight compounds (polymers) and/or suspended solids exhibit non-Newtonian behavior. Many of them also exhibit both viscous and elastic properties, that is, viscoelastic behavior. Bread doughs are highly non-Newtonian, with a high level of elasticity and are very sensitive to the temperature, the water content and, more generally, the composition (starch origin, protein type, presence of lipids) (Vergnes et al., 2003). Operations where doughs suffer stress or deforma-tions during bread making are numerous (Vergnes et al., 2003): mixing dough ingredients that leads to a macroscopic homogeneous phase, from a powder to a dough; flow and dough forming—laminating, sheeting; proofing—that leads

298 PART | II Product Specific Studies in Rheology
to a foam by bubble nucleation that grows during fermentation and heating. The deformation intensity has been classified as extreme during mixing, of an intermediate level during sheeting and shaping, and as much smaller during fer-mentation, proofing, and baking (Faubion and Hoseney, 1989). Doughs suitable for production of biologically leavened bread need to have properties which enable them to stretch in response to the expansion of leavening gas. Dough films surrounding gas bubbles must have sufficient strength to prevent collapse, but at the same time, be capable of stretching (extensibility) without rupturing (Singh and MacRitchie, 2001).
The relationships between dough rheology and dough structure and the link between the rheological properties of dough and its behavior during mechani-cal handling and baking still need to be studied in gluten-free systems. The rheological properties of wheat dough have been relatively well described, but significantly less information has been pusblished on the rheological charac-teristics of gluten-free doughs (Buresova et al., 2014), which greatly vary in consistency, going from batter to dough (Matos and Rosell, 2013).
12.2 GLUTEN FLOUR VERSUS GLUTEN-FREE FLOUR DOUGHS
Gluten-free (GF) products are a growing sector in the food industry and the related research constitutes a prioritized and challenging topic in the cereal-based goods area. The target group of GF products is currently expanding to include, in addition to celiac disease (CD) patients, people looking for nonallergenic ingre-dients, and specific vulnerable groups of the population with special nutritional needs, leading to a new market that welcomes a variety of products and is not fully covered at present by existing products (Mandala and Kapsokefalou, 2011). CD is an immune-mediated enteropathy triggered by the ingestion of gluten in genetically susceptible persons. CD is one of the most common human genetic disorders, with a worldwide prevalence of 1–3% that is apparently increasing in incidence (Cabrera-Chavez and Calderon de la Barca, 2010). Despite advances in the understanding of CD pathogenesis and the potential development of novel therapies, at present, the only safe and effective treatment for CD sufferers is a lifelong avoidance of gluten-containing foods. Particularly, gluten from wheat, rye, barley, triticale, and some varieties of oats (Comino et al., 2011) must be eliminated from the diet of individuals suffering from coeliac disease. The GF bread recipes contain mainly rice or maize flours combined with starches of dif-ferent origin (potato, maize, cassava, wheat).
Gluten in wheat flour, when hydrated, forms a viscoelastic network respon-sible for the retention of the gas produced during fermentation and proofing and for the dough development as a result of its expansion during baking. Gluten is often termed the “structural” protein for bread making. In contrast, gluten-free doughs are unable to develop a similar protein network owing to differences in their protein properties. Baking without gluten is a big challenge for all bakers

Rheological Properties of Gluten-Free Bread Doughs Chapter | 12 299
and cereal researchers and the replacement of the gluten network in the develop-ment of gluten-free bread has been largely a bottleneck to answer the require-ments of people intolerant to gluten (Matos and Rosell, 2015). The absence of gluten in dough production shows significant influence on dough rheology, the production process, and the quality of the final gluten-free products. Gluten-free doughs are less viscous, less cohesive, and elastic than wheat dough. In fact, these gluten-free doughs are often called batters instead of dough (Matos and Rosell, 2015). On the other hand, the resulting loaf crumb is hard, taste and aroma are insufficient, the bread has low specific loaf volume, poor color, crumbling texture, insufficient springiness, cohesiveness and resilience, as well as short shelf life (Anton and Artfield, 2007; Gallagher et al., 2004).
The quality of gluten-free bread is mainly influenced by the content and properties of polysaccharides, which increase dough foam stability by increas-ing viscosity, preventing flocculation and coalescence effects on the dough aqueous phase and thus on the stability of the liquid film surrounding the gas bubbles (Buresova et al., 2014). A combination of good resistance and good extensibility results in desirable dough properties (Buresova and Hrivna, 2011; Goesaert et al., 2005; Tsiami et al., 1997a,b). The GF formulations besides the flours and starches of different sources mainly involve the incorporation of other nongluten proteins such as dairy proteins, gums, and their combinations ( Mariotti et al., 2009). These ingredients can mimic the viscoelastic properties of gluten and may result in improved structure, mouthfeel, acceptability, and shelf life of these products (Gallagher et al., 2004).
The poor sensory and physical bread quality is not the only GF bread-making concern. The GF dietary pattern is often characterized by an excessive consumption of energy, and fats, and a reduced intake of protein (Matos and Rosell, 2011), complex carbohydrates, and dietary fiber (DF) (Thompson, 2001; Thompson et al., 2005). Although the development of functional and nutrition-ally enhanced foods for a healthier population is currently highly prioritized, GF products often deserve only marginal attention (Ronda et al., 2014). The enrichment of GF breads with DF and other nutrient ingredients with demon-strated physiological benefits holds a special interest for this vulnerable popu-lation which has a significant incidence of some associated diseases, such as diabetes (Cronin and Shanahan, 1997). In recent years numerous studies have focused on improving the sensory and nutritional qualities of gluten-free foods, particularly fermented and baked foods, such as bread. These ingredients affect dough rheology and consequently bread quality. The effect of some of these ingredients on dough rheology will be included in this chapter.
Wheat dough properties can be measured using well-established empirical rheological methods. The most often used instruments are the farinograph, mix-ograph, extensograph, and alveograph (Dobraszczyk and Morgenstern, 2003). The Brabender farinograph is designed to record changes of dough consistency during kneading under standard conditions while water is added to reach 500 FU (farinographic units) dough consistency. This value was obtained empirically

300 PART | II Product Specific Studies in Rheology
(Kuktaite et al., 2007) and is considered to be the optimal consistency of wheat dough used in the production of biologically leavened bread (Holas and Tipples, 1978). The Brabender extensograph records the dough resistance to stretching and the distance the dough stretches before it ruptures. The Alveo-graph supplies similar information but in this case a thin film of dough suffers a bidirectional deformation, simulating the deformation suffered as a result of bubble expansion. These methods are usually criticized because of the inter-pretation of results in relative non-SI units, large sample requirements, and the impossibility to define fundamental rheological parameters such as stress, strain, modulus, or viscosity. But they correlate well with wheat bread quality. However, there is consensus about the null/limited applicability of these tests to predict gluten-free bread quality (Hager et al., 2011b; Ronda et al., 2015). Find-ing an equivalent predictor method for gluten-free doughs is an important task that we have not been able to culminate so far. The high complexity and vari-ability of ingredients and their many properties involved in gluten-free bread making are responsible for it.
In the next section, the most commonly used rheological methods applied to gluten-free dough will be presented and briefly explained. An overview of the main factors affecting dough rheology and the effect of some common ingre-dients of gluten-free doughs are also presented. An overview of how the dough rheology may affect the quality of bread will be given in the next section.
12.3 RHEOLOGICAL TESTS ON GLUTEN-FREE DOUGHS
It is outside the scope of this chapter to explain the fundamentals of rheology and their measurements for which the reader is referred to the great manuals of general nature (Steffe, 1996) or specific contents (Faridi and Faubion, 1989) or readers could consult other chapters of this book. Rheometry uses flow and deformation configurations that make stresses, strains, and strain rates easy to calculate. Rheological properties create the link between the stresses applied and the way this material will flow or deform. Rheological measurements can be split into two categories (Vergnes et al., 2003): (1) empirical measure-ments that are widely used in the baking industry to evaluate dough additives/ conditioning agents such as oxidizing and reducing agents, enzymes, and emulsifiers as well as in evaluating flour quality and functionality. They are relatively easy and fast to perform, which make them practical. The usefulness is based on experience, and, in some cases, the instruments needed to perform them are less expensive than those needed for fundamental tests. Certainly the most common empirical tests are well established and its results well under-stood in wheat doughs. Different empirical alternative tests are being developed for gluten-free products. The main drawback of empirical/imitative methods is that it is difficult to know the strains and rates applied to the dough dur-ing the experiments. Also, it is generally not possible to calculate the applied stresses. Therefore, we cannot provide constitutive equations and the results

Rheological Properties of Gluten-Free Bread Doughs Chapter | 12 301
cannot be described in terms of fundamental rheological properties. The deliver data are expressed in arbitrary units. Consequently, the replication of empirical tests needs a detailed description of experimental conditions. (2) Fundamental measurements, in which strain and stress are usually simple but perfectly deter-mined, allow definition of intrinsic parameters of the rheological behavior and a physical description of the systems. Results from fundamental tests can be fitted to mathematical equations that respond to mechanical models. However, this usually requires working in the linear viscoelastic region (LVR) or laminar flow, in a range of stresses and strains or shear rates far from those suffered by dough or batter during its processing.
Dough samples, for rheological analysis, are usually identical to the bread formulations but without the added yeast (except for the resistant penetration tests and the rheofermentometer test). This omission is aimed at eliminating time-dependent variability on dough viscoelastic properties related to bubble formation and reducing its heterogeneous nature to achieve stable readings.
12.3.1 Fundamental Test
Parallel plate geometry is the most commonly used in dough rheology measure-ment, with a serrated surface to avoid dough slippage. The diameter of plates varies from 25 to 60 mm, depending on the consistency of the dough and the maximum stress applied; a smaller diameter should be used to measure very consistent doughs. The gaps between plates are usually maintained from 1 to 3 mm. When suspended particles are present in samples, wider gaps are advis-able. The edges must be carefully trimmed with a soft spatula and lubricated with silicon, paraffin, vaseline, or similar oil to cover the exposed sample sur-faces to avoid dough dryness. For the relaxation of the residual stresses, after dough handling, the dough is usually rested for 10–20 min before placing in the rheometer, and for 5–10 min before starting the test.
12.3.1.1 Steady/Flow TestsGluten-free dough, more similar to a batter than to a real dough, adapts well to a flow test, which allows interesting information on the system related to its flow properties. The flow experiments are conducted under steady-shear conditions with shear rate ranging from 1 to 20–50 s−1 (Juszczak et al., 2012). The maximum shear rate, also dependent on dough consistency, is sometimes increased to 200 s−1 (Sabanis et al., 2009). In these tests the goal is to get the general equation that relates stress and shear rate (or rate of deformation), which determines the rheological behavior of a fluid. To get this equation a constant stress/strain rate is applied during a time and the resulting strain rate/stress is measured. Although a range of stresses/strains are applied to complete a mea-surement, each measurement is obtained at a constant value, which explains why these tests are called steady tests. The model usually fitted successfully to flow test data from gluten-free doughs is the Ostwald de Waele or power-law

302 PART | II Product Specific Studies in Rheology
equation (Eq. 12.1) (Demirkesen et al., 2010; Korus et al., 2011; Pruska-Kedzior et al., 2008; Juszczak et al., 2012):
τ γ= ⋅K n (12.1)
where τ is the shear stress (Pa), n is the flow behavior index (adimensional), and K, that is the consistency index (Pa·sn), represents the stress required to get a shear rate of 1 s–1 and the apparent viscosity at this shear rate. The apparent viscosity, η, of fluids that fulfil the power law can be obtained from the follow-ing equation:
η γ= ⋅ −K n 1 (12.2)
The n value obtained for GF doughs of different formulations confirms a shear thinning (pseudoplastic) behavior. Values of n in the range of 0.25–0.35 were reported for GF (Korus et al., 2011; Mezaize et al., 2010; Pruska-Kedzior et al., 2008; Juszczak et al., 2012) although higher values were also reported, 0.59–0.73 (Sabanis et al., 2009), close to those found in cake batters (Ronda et al., 2011). The flow index is very dependent on the formulation and particu-larly on dough hydration.
12.3.1.2 Oscillatory TestsMeanwhile steady-flow tests only allow determining the rheological character-istics of the dough considered as fluid, oscillatory tests and creep–recovery tests allow the evaluation of both the dough viscous and elastic components and, consequently, the viscoelastic behavior. The oscillatory studies allow character-ization of different materials without damaging their structure.
12.3.1.2.1 Stress/Strain Sweeps
Stress sweeps are frequently used to determine the LVR, or maximum stress, τmax, can be applied in oscillatory or creep tests without breaking the structure of the dough (Lazaridou et al., 2007). The maximum stress, τmax, is also a value of intrinsic interest that illustrates the consistency and structure of doughs. More structured doughs, with higher G′ and G″ moduli, also have higher τmax (Ronda et al., 2014). Beyond the LVR (τ >τmax) the sample is irreversibly changed or completely destroyed. Stress sweeps are usually obtained at a frequency of 1 Hz.
In the LVR, the stress increases linearly with deformation; consequently the elastic G′ and viscous G″ moduli, which relate both magnitudes, are constants. Outside the LVR both moduli decrease (Fig. 12.1). Adopting a systematic method to calculate τmax improves the accuracy of the results. The τmax value can be established from the elastic modulus derivative with respect to the stress (in double logarithm scale). τmax could be obtained from the first stress that leads to a negative derivative above 10% (Ronda et al., 2014). τmax could be also established through the increase in the loss tangent.
τ=K⋅γ˙n
η=K⋅γ˙n−1

Rheological Properties of Gluten-Free Bread Doughs Chapter | 12 303
Rice flour-based gluten-free doughs behave as a viscoelastic solid with storage modulus (G′) higher than loss modulus (G″) (Gujral and Rosell, 2004; Marco and Rosell, 2008b; Ronda et al., 2013, 2014, 2015). Outside the LVR both moduli decrease but more markedly the elastic than the viscous one, decreasing the solid-like behavior and increasing the loss tangent (tan δ = G″/G′) as the loss of structure usually leads to an increase in the viscous behavior of the dough. The stress where G′ equals G″ (tan δ = 1) is a singular and interesting point that can be considered as a yield stress. It is a value easier to determine than τmax and also well correlated with the stability of dough structure although sometimes, in very structured doughs, is not achieved. Similar behavior was reported for wheat doughs: at low (less than 1%) strains, G′ exceeds G″ but at higher strains, the relative magnitude is reversed. Thus, increasing strain (or stress) causes the behavior of a dough to change from that of a viscoelastic solid to that of an elasto-viscous liquid (Faubion and Hoseney, 1989).
FIGURE 12.1 (a) Typical stress sweep curves obtained from rice based GF doughs enriched with albumin or pea protein (10% level); (b) frequency sweep curves obtained from dough enriched with 5% calcium caseinate that shows the effect of dough acidification; (c) and (d) creep–recovery test carried out in the LVR on GF doughs enriched with barley β-glucans (BBG) at different doses (and 90% dough hydration) and with different dough hydrations (and 2% BBG), respectively. (Part a and b: from Ronda et al., 2014; part c and d: from Ronda et al., 2013)

304 PART | II Product Specific Studies in Rheology
12.3.1.2.2 Frequency Sweeps
In order to determine the mechanical spectra of a dough a frequency sweep is usually performed, by imposing a range of frequencies between 0.1 and 100 Hz under a constant stress in the LVR. Fig. 12.1 shows an example of mechani-cal spectra corresponding to a GF dough. Frequently, the G′ and G″ moduli versus frequency, particularly in the range of 1–10 Hz, usually follow a linear evolution, in double logarithm scale. This allows fitting data to potential equa-tions (also called “power law”) (Sivaramakrishnan et al., 2004; Georgopoulos et al., 2004, Juszczak et al., 2012; Ronda et al., 2013, 2014, 2015)
ω ω′ = ′ ⋅ω1G G( ) a (12.3)
ω ω′′ = ′′ ⋅ωG G( ) b1 (12.4)
δ ω ωω
ω δ ω= ′′′
= ′′′
⋅ = ⋅
ωω
G
G
G
Gtan ( )
( )
( )(tan )c c
11
(12.5)
The coefficients ′ω1G , ′′ω1G , and (tan δ)w1, represent the elastic and viscous moduli and the loss tangent at a frequency of 1 Hz. The a, b, and c exponents quantify the dependence degree of these moduli and the loss tangent with the oscillation frequency. Doughs with low consistencies (low ′ω1G , ′′ω1G ) in general have structures more dependent on frequency (higher a and b exponents) and higher tan δ (Ronda et al., 2013, 2015). This is a general rule that is fulfilled when doughs of similar composition are compared; but many exceptions can be obtained when formulations that involve different ingredients are compared. The loss tangent values of gluten-free doughs, always <1, are usually in the range of 0.3–0.45, that indicates they behave mainly as weak gels (Lazaridou et al., 2007; Korus et al., 2009; Mezaize et al., 2010; Torbica et al., 2010; Witczak et al., 2010; Juszczak et al., 2012). However, lower val-ues (0.13–0.3) were obtained when some excess of structuring ingredients were added or formed in the dough (Ronda et al., 2013, 2014, 2015). In bread mak-ing, flours producing doughs with balanced tensile and elastic properties are required to ensure optimal baking performance. Weipert (1990) attempted to relate the elastic and tensile properties of wheat doughs determined by extensi-graph and alveograph, with the dynamic rheological parameters of dough. He demonstrated that a dough with small tan δ reflects a rigid and stiff material, and doughs characterized as moist and slack exhibited higher tan δ values. Edwards et al. (1999) found no significant correlation between tan δ values and dough strength of durum wheat as measured by empirical methods whereas the G′ values strongly correlated with the dough strength.
In gluten-free doughs correlation among rheological parameters have been frequently made. The frequency dependence of viscoelastic moduli has been significantly correlated with other dough viscoelastic properties and with some
G′(w)=G′w1⋅wa
G″(w)=G″w1⋅wb
tanδ(w)=G″(w)G′(w)=G″G′w1⋅wc=(tanδ)w1⋅wc
G′w1G″w1
G′w1G″w1

Rheological Properties of Gluten-Free Bread Doughs Chapter | 12 305
important properties of bread quality (Ronda et al., 2015). A strong correlation was found between the exponent value “a” and the tan δ (p < 0.001; r = 0.97) (Ronda et al., 2013, 2014, 2015). Such a high Pearson coefficient would allow prediction of the loss tangent from the exponent “a” and vice versa. This indi-cates that the more frequency-dependent are the doughs, the less solid-like behavior they have. The bread-specific volume was also negatively correlated with ′1G (r = 0.73) and positively with the “a” exponent (r = 0.80) and tan δ (r = 0.83) of the dough. Crumb hardness positively correlated (p < 0.001) with ′1G , ′′1G (r = 0.86 and 0.74, respectively) and negatively with the expo-nents a and b and tan δ (r = −0.69, −0.68, and −0.72, respectively) (Ronda et al., 2015). These good correlations were obtained probably because doughs and breads with same ingredients and different concentrations were compared.
12.3.1.2.3 Creep and Recovery Tests
The phenomenon of creep and recovery is associated with the reorientation of bonds in the viscoelastic material (Onyango et al., 2010). These tests have been frequently carried out on gluten-free dough with the goal of studying its vis-coelastic properties both inside and outside the LVR. Some authors claim that outside the LVR the stress applied is more similar to those experienced by the dough during bread making (Lazaridou et al., 2007; Van Bockstaele et al., 2011). In this test a constant stress is applied and the evolution of strain with time is evaluated in the creep phase. When the stress is released, how the deformation decreases is also registered in the recovery phase. In creep and recovery tests, the shear strain is usually evaluated in terms of compliance, or strain/stress ratio (Pa−1). In the LVR the evolution of compliance with time is independent of the stress applied. Outside the LVR the creep curve varies depending on the chosen stress (Van Bockstaele et al., 2011).
The data from creep tests can be modeled to the 4-parameter Burgers model (a Maxwell body in series with one Kelvin–Voigt body) (Lazaridou et al., 2007; Witczak et al., 2010; Juszczak et al., 2012; Ronda et al., 2014, 2015; Abebe et al., 2015) given by
λ µ= + −
−
+J t J Jt t
( ) 1 expc 0 11 0
(12.6)
In the equation, Jc (t) is the creep compliance, J0 is the instantaneous compli-ance, J1 is the retarded elastic compliance or viscoelastic compliance, λ1 is the retardation time (s) of the Kelvin component of the model, and µ0 (Pa s) is the steady-state viscosity. The instantaneous compliance (J0) is related to the elastic stretching energy of bonds. It appears when stress is applied and disappears immediately when the stress disappears. Retardation time is a time character-izing the response of a viscoelastic material to the instantaneous application of a constant stress. In the case of Burgers model, steady-state compliance is the sum of J0 and J1 (Steffe, 1996). For a better understanding of the physical meaning
G′1
G′1G″1
Jc(t)=J0+J11−exp−tλ1+tµ0

306 PART | II Product Specific Studies in Rheology
of these parameters, Steffe (1996) is recommended to be read. Fig. 12.1c, d shows the evolution of compliance versus time from a creep–recovery test.
Similar equations can be used for the recovery compliance Jr(t). As there is no viscous flow in the recovery phase, equations consist only of parame-ters describing the elastic response after removal of the shear stress. The vis-cous deformation of the dough in the creep phase is a permanent deformation, directly related to the nonrecoverable sample strain. The data from the recovery phase are modeled to the following equation:
λ= − − −
−
J t J J Jt
( ) 1 expr max r0 r11
(12.7)
Jmax is the maximum creep compliance obtained at the end of the creep step. The steady-state compliance in recovery step, Jsteady, can also be calculated by subtracting the compliance value at the terminal region of the curve (where dough recovery reached equilibrium) from the Jmax. If a substance obeying the Burger model is tested in the LVR the values of J0 and J1 determined from the creep curve, J0c and J1c, will be equal to the equivalent values determined from the recovery curve, J0r and J1r (Steffe, 1996).
Sometimes the 6-parameter Burgers model is used (a Maxwell body in series with two Kelvin–Voigt bodies) (Van Bockstaele et al., 2011; Ronda et al., 2013). The additional kelvin component produces an additional exponential change in compliance related to its retardation time, and the model adds two additional parameters (J2 or second retarded elastic compliance and λ2 or second retarda-tion time). The fitting quality is usually better (Van Bockstaele et al., 2011), but six parameters are more difficult to handle and compare than four.
12.3.2 Empirical Tests
Empirical measurements have been developed for approaching the quality of the raw ingredients and following the first two steps of cereal processing (mix-ing and kneading).
12.3.2.1 Stickiness TestsThis test can be conducted with a texturemeter such as a TA-XT2 or equivalent provided with a SMS/Chen-Hoseney device where the sample is placed, and a methacrylate 25 mm cylinder (P/25P) used as a compression cell (Armero and Collar, 1997; Grausgruber et al., 2003; Bollain et al., 2006; Abebe et al., 2015; Ronda et al., 2011). The stickiness of the dough can be determined at pretest and test speed of 0.5 mm/s, 40 g force and a posttest speed of 10.0 mm/s. Three magnitudes are used to define stickiness (Fig. 12.2): the positive maximum force or adhesive force (N), which is the measure of stickiness, the positive area under the curve or the adhesive energy (N s), which is the work of adhe-sion, and the distance the sample is extended on probe return (mm), which is an
Jr(t)=Jmax−Jr0−Jr11−exp−tλ1

Rheological Properties of Gluten-Free Bread Doughs Chapter | 12 307
indication of sample cohesion/dough strength. Six replicates are recommended to get more reliable averaged results. Armero and Collar (1997) recommended to maximized dough cohesiveness and minimized dough stickiness for provid-ing good bread-making performance. Stickiness should not overpass the 100 g value, to discard important dough handling problems (Chen and Hoseney, 1995; Armero and Collar, 1997).
12.3.2.2 Forward Extrusion TestForward extrusion assays of formulated gluten-free doughs can be performed in a TA-XT2 texture analyzer (Stable Micro Systems, Surrey, UK) equipped with a forward extrusion cell HPP/FE or equivalent, operating at 10 mm/s head speed (Ronda et al., 2013, 2015) or 1.0 mm/s (Moore et al., 2004; Sciarini et al., 2010a,b). The test measures the compression force required for a piston disk to extrude the dough through a standard size outlet (10 mm) in the base of the sample container. The extrusion cell and the compression plunger used are 2.55 and 2.50 cm in diameter, respectively. Samples have to be carefully scooped into acrylic cylindrical containers with help of spatula, removing air pockets. The complete sample container has to be located into a centralizing insert fitted into the Heavy Duty Platform, and the plunger attached to the load cell using a probe adapter. Compression force–time curve (Fig. 12.3) allows evaluating maximum force, determined as the force at which the slope changed. The curve plateau representing the force necessary to continue with the extru-sion process (N) and the area under the curve (N s) were both used to define the sample consistency (Fig. 12.3). All measurements should be performed at least in triplicate.
FIGURE 12.2 Characteristic stickiness curve.

308 PART | II Product Specific Studies in Rheology
12.3.2.3 Back Extrusion TestBack extrusion consists of compressing the sample contained in a cylindrical cell with a loosely fitting plunger until the sample flows through the annulus between the plunger and the cell wall (Brusewitz and Yu, 1996). Back extrusion tests have been carried out using a TA-XT+ texture analyzer equipped with a back extrusion rig (A/BE-d 35) (Stable Micro Systems, England) by Ziobro et al. (2013a). It has a standard size back extrusion container (50 mm diameter), and the back extrusion disk (35 mm) that is positioned centrally over the sample container. Juszczak et al. (2012) have used the measurement to fix the hydra-tion of gluten-free dough (400 g, at a compression rate of 0.83 mm/s). Fig. 12.4 shows the principle of this measurement and compares it with that of forward extrusion.
Rheological information was obtained from back extrusion tests applied to gels fiber blends by Angioloni and Collar (2009). The test was used for the evaluation of the viscoelastic properties of the “liquid-like” samples. During the tests the disk proceed to penetrate to a depth of 30% at 1 mm/s test speed. At this point (most likely to be the maximum force), the probe returns to its original position. The “peak” or maximum force (Fig. 12.5) is taken as a measurement of firmness in terms of that the higher the value the firmer is the sample. The area
FIGURE 12.3 Force–time curve from forward-extrusion test.

Rheological Properties of Gluten-Free Bread Doughs Chapter | 12 309
under the curve up to this point is taken as a measurement of consistency, so that the higher the value the thicker the consistency of the sample. The negative region of the graph, drawn on probe return, is the result of the weight of sam-ple which is lifted primarily on the upper surface of the disk on return, that is, due to back extrusion and hence gives an indication of the viscosity (resistance to flow off the disk). The maximum negative force is taken as an indication of the cohesiveness of the sample, so that the more negative the value the more ‘cohesive’ is the sample. The area of the negative region under the curve may be referred to as the ‘work of cohesion,’ so that the higher the value the more resistant to withdrawal the sample is which is an indication of both cohesiveness and viscosity of the sample. All measurements should be repeated enough (five times) to get reliable results.
FIGURE 12.4 Differences between forward (left) and back (right) extrusion tests.
FIGURE 12.5 Force–time curve from back extrusion test including the probe return to its original position. (From Angioloni and Collar, 2009)

310 PART | II Product Specific Studies in Rheology
12.3.2.4 Texture AnalysisTexture properties of doughs were determined with a texturemeter by using texture profile analysis (TPA) (Armero and Collar, 1997) (Fig. 12.6). These authors optimized the time elapsed between two compressions and strain so that meaningful values with wheat doughs were obtained. These authors cor-related the texture properties with bread making and found dough cohesiveness was a good predictive parameter of bread quality. Later dough machinability was also assessed by TPA determination in a TA.HDi 500 Texture Analyser by using a 5 cm diameter probe, 75 s waiting period, 60% compression (Angioloni et al., 2008). The primary textural properties were measured in the absence of dough adhesiveness by using a plastic film on the dough surface to avoid the dis-tortion induced by the negative peak of adhesiveness (Collar et al., 1999, 2000). Dough adhesiveness was measured separately by running a second TPA without the plastic film and disregarding the other parameters.
FIGURE 12.6 Texture profile analysis. Interpretation of texture parameters from a complete record: firmness: F1; cohesiveness: A2/A1; gumminess: F1 (A2/A1); chewiness: F1 (A2/A1) (t2/t1) adhesiveness: A3; springiness: t2/t1; resilience: A5/A4. (From Gómez, M., Ronda, F., Caballero, P., Blanco, C., Rosell, C.M. 2007. Functionality of different hydrocolloids on the quality and shelf-life of yellow layer cakes. Food Hydrocoll. 21 (2), 167–173)

Rheological Properties of Gluten-Free Bread Doughs Chapter | 12 311
Texture properties of noodle doughs have been recently measured by com-pressive analysis (TPA) using a TA-XT2i Texture Analyser (Stable Micro Systems, London, England) (Liu et al., 2015). The instrument settings were compression mode using a P/35 probe, trigger type auto-10 g; pretest speed, 2.0 mm/s; posttest speed, 2.0 mm/s; test speed, 0.5 mm/s; strain, 50%; interval between two compressions, 10 s. Ten pieces of circular sheeted dough of 6 cm diameter for each sample were measured.
12.3.2.5 Uniaxial Extension TestsThe gluten-free dough resistance to extension, extensibility, and other characteristics can be obtained by uniaxial dough deformation (Buresova et al., 2014). The results obtained from this test have been related to the bread-making quality of the dough prepared from gluten-free flours. The dough exhibiting stronger resistance to extension, greater extensibility, and higher stress at the moment of sample rupture had, in general, better bread-baking quality (Buresova et al., 2014). Specific loaf volume of laboratory prepared gluten-free breads was in significant positive correlation with dough resistance (r = 0.86), dough extensibility (r = 0.98), and peak stress at the moment of dough rupture (r = 0.96).
Uniaxial extension tests were performed using a texture analyser TA.XT plus (Stable Micro Systems Ltd., UK) equipped with an SMS/Kieffer Dough and Gluten Extensibility Rig (Buresova et al., 2014). The dough was made into thin rolls, put onto the lubricated surface of a Teflon mould, and compressed with the lubricated top plate. Test pieces of dough were formed into 5 cm long pieces with trapezoidal cross-section (3 mm, 5 mm, 4 mm). The doughs were left resting for 40 min at 30°C. The measurement conditions were as follows: measure force in tension, pretest speed 2.00 mm/s, test speed 3.00 mm/s, post-test speed 10.00 mm/s, distance 75 mm, trigger force 5 g. The force required to stretch the dough sample and the displacement of the hook were recorded as a function of time. Like the extensograph, the values of major importance were the peak force R (N), that is, resistance to extension, and the distance at which this peak force occurs, which is the measurement of extensibility E (mm). Extension area A (N/mm) is the area under the curve which is proportional to the energy required to stretch the test piece to its rupture. It is related to the absolute levels of elastic and viscous components of the dough (Buresova et al., 2014). The ratio number R/E (N/mm) can be calculated. The values are reported as ratios relative to the wheat dough.
The force–displacement extensographic curves are recalculated into stress–strain data as described by Dunnewind et al. (2004), taking into account changes in the sizes of the extended specimen (Angioloni et al., 2008). The fracture properties of dough are computed from the stress–strain data. The maximum stress or fracture stress (σmax) and the Hencky strain (εH) at fracture are taken as measures of the resistance to extension and extensibility, respectively.

312 PART | II Product Specific Studies in Rheology
The relative deformation in uniaxial extension of the dough test piece ( described as the Hencky strain, εH) was calculated as (Fig. 12.7) (Dunnewind et al., 2004):
ε =
=+ +
+
l
l
y y
yln ln
9 ( )
9H
t
0
2t 0
2
202
(12.8)
where l0 is the initial length of the sample and lt is the length at time t. The strain rate is not constant in the Kieffer test and can be written as
ε ν= =
⋅ + ⋅εd
dt
y y
l
4 ( )H
H t 0
t2
(12.9)
in which yt is the displacement of the hook from the point at which the actual extension starts and yo is the distance which the hook has to travel from
εH=lnltl0=ln92+(yt+y0)292+y02
ε˙H=dεHdt=4⋅(yt+y0)⋅νlt2
FIGURE 12.7 Uniaxial extension test. (a) schematic drawing of the Kieffer extensibility rig with its teflon mold, (b) schematic drawing of the forces acting on the dough piece, (c) force versus time curve from uniaxial extension test, (d) elongational stresses versus Hencky strain derived from the previous one for gluten-free doughs A: Amaranth; B: Buckwheat; C: Corn; Ch: Chickpea; Q: Quinoa; M: Millet; R: Rice; W:Wheat. (Part a and b: from Dunnewind et al., 2004; part d: from Buresova et al., 2014)

Rheological Properties of Gluten-Free Bread Doughs Chapter | 12 313
the surface of the lower plate to this point where the actual extension starts (Fig. 12.7); v is the speed of the hook.
The force acting on the dough Fd can be calculated from measured force Fm:
= ⋅⋅ +
F Fl
y y4 ( )d m
t
t 0 (12.10)
Assuming that the dough piece has the same cross-section over its whole length, the surface over which the force is acting is V/lt, V being the volume of the dough piece that is extended. The stress σ can then be calculated accord-ing to
σ =F
V l/d
t (12.11)
12.3.2.6 Resistance to PenetrationThis test has been applied to fermented rice based gluten-free doughs ( Sciarini et al., 2012) added with hydrocolloids, enzymes, or emulsifiers. The force required to penetrate the dough was determined using a TA-XT2i texturom-eter (Stable Micro Systems, United Kingdom). Samples were prepared as for bread making, and 40 g of the resultant dough were weighed into plastic flasks and proofed (60 min, 30°C, 85% relative humidity). To determine penetration force, fermented dough was compressed until the probe (35 mm diameter) disrupted the dough surface structure, penetrating into the sample, at 5 mm/s. Fig. 12.8 shows a representative penetration plot. In the first part of the curve, probe is considered to compress the dough without disrupting its structure, up to the point where a threshold force is achieved, and dough resistance to penetration is broken. To obtain this threshold value, two linear regressions are carried out in each of the two parts of the curve; these regressions repre-sent the ideal behavior of the dough. The intersection of both straight lines is considered as dough resistance to penetration under ideal conditions. Dough preparation was performed in duplicate, and three determinations were per-formed in each dough batch. Authors did not find any correlation between this large deformation test and fundamental rheological measurements although they obtained a negative significant correlation between dough resistance and specific bread volume (r = −0.80, p < 0.05). In previous works, Sciarini et al. (2010a,b) observed an opposite trend in gluten-free systems with high water amount (∼150%, flour basis). They obtained higher bread volumes from the most resistant doughs. This effect was ascribed to the higher capacity of the most consistent doughs to retain the gases formed during fermentation. In the most recent work, Sciarini et al. (2012) used a significantly lower dough hydration (65–75%, flour basis). It is natural then that systems with a higher resistance to certain values will have more difficulty to expand during proofing and baking.
Fd=Fm⋅lt4⋅(yt+y0)
σ=FdV/lt

314 PART | II Product Specific Studies in Rheology
12.3.2.7 Dough Development During ProofingDough development during proofing and gas production of doughs are con-tinuously measured in the rheofermentometer (Chopin, Villeneuve-La-Garenne, France). This procedure, extensively applied to wheat doughs, can also be used with GF formulation after adopting some modifications. In contrast to the tradi-tional method used with wheat flour, the weight of dough has to be reduced to 200 g to prevent its overflow. The four weights of 0.5 kg have to be removed due to the weakness of GF dough. Fermentation is carried out at 30–37°C for 2–4 h. The parameters registered include: Hm, height of dough at maximum develop-ment time (mm); h, height of dough at the end of the test (mm); (Hm − h)/Hm that is inversely related to dough stability; T1 time corresponding to Hm (min); T2: time of stabilization, where the dough height is above 90% Hm (min); ′Hm, maximum height of CO2 production (mm); ′T1 , time of the maximum gas for-mation (min); VT, total volume of CO2 (mL) produced during the whole period of fermentation; Vr , total volume of the CO2 (mL) retained by the dough; RC, the CO2 retention coefficient Vr/VT, which measures the amount of CO2 liber-ated and retained from the dough and therefore is related to the porosity of the dough; TX, the time (min) when the porosity of the dough develops. The dough used in the analysis is identical to that used in baking (of course, yeast included). The proofing conditions are therefore as similar as possible to those used for the doughs prepared for baking.
H′mT′1
FIGURE 12.8 Representative penetration test plot. The intersection of the two straight lines was considered as the force required for the probe to penetrate the dough. (From Sciarini et al., 2012)

Rheological Properties of Gluten-Free Bread Doughs Chapter | 12 315
12.3.2.8 Amylographic TestAn extensive literature describes the use of amylographic tests to describe rheo-logical and pasting properties of flours and batters. It is one of the most used procedures to establish the rheological behavior of flour suspensions, particu-larly gluten-free flours, usually in excess of water, under heating and cooling scans. When heated above a characteristic temperature in an excess of water, native starch granules undergo gelatinization, regarded as the disruption of the molecular order within the granule that results in the swelling of the starch granules and the leaching of amylose and leads to the formation of viscous pastes, regarded as composite materials built up from a continuous polysac-charide phase with swollen starch granules as fillers. A sharp increase of the suspension viscosity takes place at the pasting temperature and characterizes the onset of the pasting process. Granule swelling and amylose leaching, which are the processes that lead to the viscosity increase (pasting), are nonequilib-rium processes (Ronda et al., 2013). Rapid Visco Analyzer (Newport Scien-tific, Warriewood, Australia) (Collar, 2003; Kim and Yokoyama, 2011; Ronda et al., 2013, 2014) and Viscoamylograph (Brabender Instrument Inc, Duisburg, Germany) ( Sciarini et al., 2010b; Juszczak et al., 2012) are the most commonly used equipment to carry out this test. They are able to continuously record the apparent viscosity of a sample under conditions of controlled temperature and applying an appropriate degree of shear to match processing conditions which is particularly valuable in many process and research applications. The standard dry matter in the measured suspension is ∼10% w/w. Under the most com-mon working conditions, the samples are heated until 90–95°C, to achieve the complete gelatinization of starch, and after a holding time, a cooling process is applied in order to study the viscosity increase of the paste, which is due both to the temperature decrease and to amylose retrogradation. In the ICC 162 stan-dard method the samples are heated to 50°C and stirred at 160 rpm for 10 s for thorough dispersion. The slurry is held at 50°C for up to 1 min, and then heated to 95°C over 3 min 42 s and held at 95°C for 2 min 30 s, and finally cooled to 50°C over 3 min 48 s, and held at 50°C for 2 min. Fig. 12.9 shows typical pasting curves. The pasting temperature (when viscosity first increases by at least 25 cP over a 20 s period), peak time (when peak viscosity occurred), peak viscos-ity (maximum hot paste viscosity), holding strength or trough viscosity (mini-mum hot paste viscosity), breakdown (peak viscosity minus holding strength or trough viscosity), final viscosity (end of test after cooling to 50°C and holding at this temperature), and total setback (final viscosity minus holding strength) are calculated from the pasting curve (Collar, 2003). Breakdown of viscosity during the cooking cycle is caused by rupture of the swollen granules. Upon subsequent cooling, a gel is formed that consists of an amylose matrix in which amylopectin enriched granules are embedded (Miles et al., 1985). Final viscos-ity, after cooling of starch paste, is related to a formation of spatial network by amylose molecules, which leached from the granules. Consequently, setback is related to amylose retrogradation.

316 PART | II Product Specific Studies in Rheology
Mixing and pasting behaviors of gluten-free flour blends can also be stud-ied using the Mixolab (Chopin, Tripette et Renaud, Paris, France) (Marco and Rosell 2008a,b; Matos and Rosell, 2013). In this case, samples are doughs or batters, with a limited amount of water. The time required for this test is higher than the previous ones, 57 min versus 13 min. Fig. 12.9 shows the typ-ical curves obtained from this test. Mixolab allows mixing the dough under
FIGURE 12.9 (a) Rapid Visco analyzer typical curves and (b) typical Mixolab typical curves. (Part a: from Crosbie and Ross, 2007; part b: from Marco and Rosell, 2008a)

Rheological Properties of Gluten-Free Bread Doughs Chapter | 12 317
controlled temperature and also a temperature sweep until 90°C followed by a cooling step (Matos and Rosell, 2013). This equipment measures in real time the torque (expressed in N m) produced by passage of dough between two kneading arms, which is related to dough consistency. All ingredients used in dough formulation, with the exception of yeast, are introduced into the Mixolab bowl and mixed. Detailed information of this test can be found in Marco and Rosell (2008a) and Rosell et al. (2010). The settings used in this test were 8 min for initial mixing at 30°C, temperature increase at 2.3°C/min until 90°C, 7 min holding at 90°C, temperature decrease at 4°C/min until 50°C, and 5 min holding at 50°C. The mixing speed during the entire assay was 80 rpm. Three replicates were carried out for each formulation. The following parameters were obtained from the recorded curve: initial consistency (C1), stability (minutes), or elapsed time at which the torque produced is kept constant, minimum torque (N m) or the minimum value of torque produced by dough passage subjected to mechani-cal and thermal constraint (C2), peak torque (N m) or the maximum torque during the heating stage (C3), the minimum torque during the heating period (N m) (C4) and the torque obtained after cooling at 50°C (C5). Additionally, derived parameters were calculated: cooking stability range (C3–C4) and cool-ing setback or gelling (C5–C4).
Recently Matos and Rosell (2013) have correlated rheological and pasting properties of gluten-free batters/doughs from Mixolab tests with bread quality (volume, moisture content, and hardness). They concluded that high dough or batter consistencies limit the expansion during proofing, reducing the specific volume and increasing crumb firmness.
12.4 EFFECT OF DOUGH HYDRATION ON DOUGH RHEOLOGY AND BREAD QUALITY
The amount of water present in a wheat flour dough is known to significantly affect both the rheological properties of the dough and the quality of the finished baked product (Abdelrahman and Spies, 1983). Identical effects of gluten-free dough hydration were observed (Sciarini et al., 2012; Lazaridou et al., 2007; Pérez-Quirce et al., 2014; Mancebo et al., 2015; Ronda et al., 2015). Mean-while empirically contrasted methods, as farinograph, have been developed to optimize hydration of wheat doughs; water necessities of gluten-free ones are established following different strategies as farinograph results are frequently unsuitable (Hager et al., 2011b). Oscillatory test (Hager et al., 2011b), back extrusion test (Korus et al., 2009; Juszczak et al., 2012; Ziobro et al., 2013a), manual mixing methods or others based on experience (Crockett et al., 2011; Sabanis et al., 2009), or from preliminary experiments to produce breads of the best quality (Demirkesen et al., 2010) are used to establish gluten-free dough hydration. Farinograph is also still used by some authors (Lazaridou et al., 2007; Ziobro et al., 2013b). There seems to be no question that, as the water content of a dough increases, both G′ and G″ decrease both in wheat or gluten-free doughs

318 PART | II Product Specific Studies in Rheology
(Navickis et al., 1982; Dreese et al., 1988; Faubion and Hoseney, 1989; Sciarini et al., 2012; Lazaridou et al., 2007). However, in wheat systems it happens without modifying tan δ, thus concluding that water has mainly a plasticizing effect, while dough structure is unaltered (Phan-Thien and Safari-Ardi, 1998; Autio et al., 2001). In gluten-free systems a different behavior has been observed (Sciarini et al., 2012; Ronda et al., 2015). The G″/G′ ratio increased as G′ decreased faster than G″ with dough hydration. This indicates the increase in dough hydration leads to a decrease in the solid-like behavior. Fig. 12.10a shows the evolution of G′, G″, and tan δ versus dough hydration. Lazaridou et al. (2007) found that tan δ increased only slightly with increasing dough moisture. This different result is probably related to the dough hydrations used by these authors, 130–150% in flour basis, notably higher than those studied by Ronda et al. (2015) in the range 77–100%, that includes values that represent limiting water conditions. Fig. 12.10 shows the effect of dough hydration on the
FIGURE 12.10 (a) Effect of rice-based dough hydration (% flour basis) on viscoelastic moduli and loss tangent at 1Hz (b) on exponents a and b (that quantify frequency dependence of elastic and viscous moduli), (c) on elastic compliance and steady viscosity from creep test, and (d) on bread-specific volume and firmness. (Adapted from Ronda et al., 2015)

Rheological Properties of Gluten-Free Bread Doughs Chapter | 12 319
frequency dependence of G′ and G″ quantified from the values of the exponents a and b got from the power-law fitting to experimental frequency sweep data. It can be seen that the exponent b was always above the exponent a for rice-based bread doughs, meaning a permanent higher dependence on frequency of viscous moduli than the elastic one. Dough hydration increased this dependence (Fig. 12.10b) in similar way for both moduli, at least in the range studied. The specific volume of the breads obtained from these GF doughs was positively correlated with tan δ (r = +0.56; p< 0.05) and negatively with the elastic modu-lus, G′ (r = −0.63; p < 0.01) (Ronda et al., 2015). However, a deeper look at the effect of dough hydration on bread-specific volume (Fig. 12.10d) allows con-firming the existence of an optimal value for the dough hydration. This result could clarify the controversial conclusions reported previously with respect to the relationship between dough consistency and final bread volume. Matos and Rosell (2013) showed that high dough consistencies limited the expansion dur-ing proofing and led to lower bread volumes; meanwhile Sabanis et al. (2009) found a positive correlation between apparent viscosity and GF loaf volume (r = 0.83, p < 0.05). Fig. 12.10d shows a maximum in the evolution of specific bread volume versus dough hydration and indicates that both, a decrease or an increase in dough consistency with respect to the corresponding optimal value (those who led to the maximum bread volume), would have a detrimental effect on bread volume. An excessive dough consistency leads to small breads as the dough cannot expand as a result of gas production during proofing and a dough with too weak consistency cannot retain the gas that will be lost avoiding the development of the loaf. The deformation capacity of a dough under the action of stress can be evaluated from a creep test. Fig. 12.10c shows the evolution of the elastic compliance versus dough hydration. As can be seen the decrease in steady viscosity, µo, and viscoelastic moduli, G′ and G″, coincided with the increase of the elastic deformation that doughs suffered under the action of a stress.
12.5 EFFECT OF FIBER ADDITION ON GLUTEN-FREE DOUGHS RHEOLOGY
The enrichment of GF baked products with DF seems to be necessary, since a typical CD patient diet should not usually assure the recommended 25–35 g of DF intake per day (Wild et al., 2010; Hager et al., 2011a; Martin et al., 2013; Shepherd and Gibson, 2013). It has been suggested that development of fiber-enriched GF products would improve the quality of the GF diet (Kupper, 2005). The suitability of bakery products for delivering DF and other health-related compounds to consumers has prompted extensive study of the incorporation of fibers into gluten-free breads. The addition of insoluble fibers from wheat, maize, oat and barley (Sabanis et al., 2009), bamboo, potato, pea (Martinez et al., 2014), resistant starch (Korus et al., 2009) or soluble fibers, as inulin (Hager et al., 2011b; Juszczak et al., 2012; Ziobro et al., 2013a), polydextrose,

320 PART | II Product Specific Studies in Rheology
nutriose (Martinez et al., 2014) or β-glucan (Hager et al., 2011b; Pérez-Quirce et al., 2014; Ronda et al., 2013, 2015) to gluten-free matrices and its effect on dough rheology and bread quality have been recently studied. One important handicap to compare results from different authors comes from different purity and different molecular weights of the commercial ingredients added to increase fiber content and the different dough formulation, particularly, its hydration. In some works the water content in dough is maintained constant in spite of fiber presence; but, frequently, dough hydration is adapted to the presence of fibers although not always through the same procedure, as was commented in the previous section. However, dough water content affects always dramati-cally to dough rheology, and particularly in the presence of hydrocolloids and fibers with a high water binder capacity and a different behavior depending on whether or not water is limiting (Ronda et al., 2013).
The effect of DF in GF dough rheology depended on fiber nature, mainly on its molecular weight and solubility and its particle size (Juszczak et al., 2012; Martinez et al., 2014). The consistency of the doughs with soluble fibers as polydextrose, nutriose and inulins of low and medium degree of polymeriza-tion was lower than that of the control doughs (Ziobro et al., 2013a; Hager et al., 2011b; Martinez et al., 2014; Juszczak et al., 2012). In fact, authors who adapted dough hydration, had to reduce the water content in the presence of these fibers with respect to the control dough to get similar consistencies. The consistency coefficients obtained from power-law fittings to steady tests data decreased significantly in the presence of inulin and with rising share of inulin in the dough although above a certain level of inulin (8% starch basis), there was no further change in the consistency of the dough (Juszczak et al., 2012). Differences in flow indices, which were in the range of 0.28–0.33, were not statistically significant. Viscoelastic moduli decreased and the loss tangent increased with inulin content of low or medium DP (Juszczak et al., 2012) and also in the presence of other soluble fibers such as Nutriose and polydextrose (Martinez et al., 2014) denoting an increase in the viscous behavior. The fre-quency dependence of G″ (b exponent of power-law equation) increased with low and medium DP inulin content whereas the effect was not significant in the dependence of G′. The addition of these inulins resulted in a significant increase of instantaneous and retarded compliances (J0 and J1) depending on the level of inulin and the decrease of steady viscosity from creep test ( Juszczak et al., 2012). It is well known that inulin is highly hygroscopic (Peressini and Sensidoni, 2009) and reduces water availability for other dough constituents (Juszczak et al., 2012). According to Hager et al. (2011b) inulin molecules form junction zones and so enclose large amount of water. The properties of inu-lin are based on water immobilization rather than actual water binding. The replacement of starch with soluble forms of inulin and oligosaccharides leads to a decrease in water absorption and reduction of both wheat and gluten-free dough consistency (Peressini and Sensidoni, 2009; Hager et al., 2011b; Ziobro et al., 2013a), diluting hydrocolloids, and decreasing starch swelling.

Rheological Properties of Gluten-Free Bread Doughs Chapter | 12 321
Inulin of high DP, β-glucans, and other hydrocolloids of higher molecu-lar weight and lower solubility showed a different effect on dough rheology to that observed with fibers of high solubility (Lazaridou et al., 2007; Hager et al., 2011b; Ronda et al., 2013, 2015). Increase in inulin average DP (>23) and decrease in solubility restricted the change in compliance for 4% and 8% inulin-added doughs, and at the highest level of its addition (12%) caused the increase in viscoelastic moduli and steady viscosity and the decrease of instan-taneous and retarded elastic compliances and of tan δ denoting an increase in dough elasticity (Juszczak et al., 2012), even at adapted (higher) dough hydra-tion. Juszczak et al. (2012) explained this behavior by inulin–inulin interactions that could lead to a formation of an elastic network, and thus intensify dough elasticity. Inulin of low DP acts mainly as a diluting substance that loosens con-sistency and does not lead to fundamental changes in dough structure (Hager et al., 2011b); meanwhile inulin of higher molecular size (DP > 23) enhances the structure of dough and, at constant water addition, leads to the increase of dough consistency and enhances dough elasticity (Juszczak et al., 2012). All samples with inulin revealed lower retardation times than control sample. It means that regardless of the degree of polymerization, inulin dilutes the system, causing easier reorientation of structural elements of the dough, which results in the quickest viscoelastic deformation under the application of the constant stress and the faster recovery when this stress was released.
The addition of 5.6% of commercial oat β-glucan (BG) concentrate, amount estimated by authors to fulfil EFSA recommendation, increased G′ and G″ of the dough at constant hydration and decreased tan δ of dough at adapted water con-tent (in terms of equal G*) with respect to the control dough (Hager et al., 2011b). This indicates a lower ratio of the viscous to the elastic portion which was related to β-glucan high water-binding capacity. The effect of β-glucan on dough rheol-ogy and bread quality depending on dough hydration has been recently stud-ied (Pérez-Quirce et al., 2014; Ronda et al., 2013, 2015). Ronda et al. (2013) showed a significant and important interaction of dough water content on the effect of β-glucans and two types of hydroxypropyl methylcellulose (HPMC) of weak and semifirm gels strength, on dough rheology. β-glucans showed higher water requirements to create an elastic structure that decreased tan δ and resisted deformation than HPMC (Ronda et al., 2013). The effect of different hydrocol-loids (HC) (pectin, carboxymetylcellulose, xanthan, argarose, and β-glucan) on gluten-free doughs and breads was reported by Lazaridou et al. (2007). These authors adapted dough hydration to 500 UB from farinograph measurements. An additional amount of 10% water with respect to the control dough, with a dough hydration of 130%, was required for each 1% addition of the HC tested at 1 and 2% level. Similar conclusions about water necessities of commercial BG concentrates of different molecular weights and purities when added to gluten-free doughs were reported by Ronda et al. (2015). In this work, the addition oat BG of lower purity (∼30%) reduced the necessities of water to 8% water per each 1% BG (both in flour basis). The main “contaminant” component of

322 PART | II Product Specific Studies in Rheology
oat BG, maltodextrins, was responsible for the reduction of GF dough consis-tency and for the lower water content requirements of these doughs to maximize bread-specific volume (Ronda et al., 2015) which is coherent with the plasticizer action of oligosaccharides and fibers of high solubility commented on before. The addition of HC to gluten-free doughs always increased the elastic modulus, G′, with respect to the control dough with equal dough hydration ( Lazaridou et al., 2007). The incorporation of HC influenced markedly the tan δ values, the effect being dependent on type and level of hydrocolloid. Generally, the addition of xanthan (at 1 and 2%) and β-glucan (at 2%) resulted in considerable decrease of tan δ whereas only a shy effect was observed with the remaining HC except with pectin, which showed the opposite effect leading to an increase in dough tan δ. The incorporation of HC into dough formulations increased the resistance of dough to deformation as showed in the reduction of maximum creep % strain (strain at the end of creep phase). The resistance to deformation of dough when the hydrocolloids were added followed the order of xanthan > CMC > pec-tin > agarose > β-glucan (Lazaridou et al., 2007). In bread making, flours producing doughs with balanced tensile and elastic properties are required to ensure optimal baking performance ( Lazaridou et al., 2007). The volume of breads increased with the addition of hydrocolloids at 1% supplementation level with the exception of xanthan and pectin, compared with the respective con-trol samples. However, with increasing hydrocolloid concentration from 1% to 2% a reduction of bread volume was observed excluding pectin whose volume increased significantly compared to the control. Xanthan reduced bread volume at 2% level and had no effect at the 1% one. The behavior of xanthan seemed to be opposing the results of the mechanical tests that showed the highest strength and elasticity for doughs supplemented with xanthan (Lazaridou et al., 2007). These authors conclude that too high resistance, as produced by xanthan gum, can cause a limited and slow expansion of the gas cells during proofing (vanVliet et al., 1992) and confirm the existence of an optimal dough consistency in order to obtain a well-developed bread with high volume. In general, hydrocolloids improve dough development and gas retention (Rosell et al., 2001) by increas-ing the low viscosity of the control gluten-free doughs that otherwise would escape from the dough. For some modified polysaccharide derivatives such as CMC, HPMC, and MC, further to their water retention properties because of their hydrophilic nature, they also contain hydrophobic groups which induce additional properties including increased interfacial activity within the dough system during proofing, and forming gel networks on heating during the bread-making process. Such network structures serve to increase viscosity and further strengthen the boundaries of the expanding cells in the dough, thus increasing gas retention through baking, and consequently leading to a better loaf volume (Bell, 1990; Lazaridou et al., 2007; Ronda et al., 2013).
Insoluble fibers from wheat, maize, oat, barley, bamboo, potato, pea, or resistant starch had a similar effect on gluten-free dough rheology, contrary to that commented on for fibers of high solubility and low polymerization degree.

Rheological Properties of Gluten-Free Bread Doughs Chapter | 12 323
Sabanis et al. (2009) found that addition of insoluble fibers from wheat, maize, oat, and barley affected significantly the flow behavior index (n) of doughs depending on the type of fiber. Barley fiber exhibited the highest value, fol-lowed by maize and oat. However, the level of addition had no effect on n that ranged from 0.591–0.726. A positive correlation between apparent viscosities (AV) at 156/s and loaf volume (r = 0.83, p < 0.05) was also reported by Sabanis et al. (2009). The samples containing DF were characterized by improved AV compared to the control likely induced by the presence of insoluble matters and the formation of networks comprising hydrated cellulose and hemicellulose. When the AV of dough was high, as in oat and maize fiber containing bread, the bubbles in the dough remain in the bread during baking explaining why these breads exhibited the highest loaf volume and porosity values. However, in wheat fiber containing dough, with the lowest AV, the bubbles could not remain in the bread during the baking period resulting in lower specific volume. It has to be considered that consistency indexes reported by Sabanis et al. (2009) for the control dough were very low, 3.58 Pa·sn, versus that found by Juszczak et al. (2012) at the same temperature, 25°C, which was 347 Pa·sn. This could explain why insoluble fibers that increase apparent viscosity of GF doughs improve loaf volume, at the same time the inulins, which exert the opposite effect on dough consistency lead to the same effect on bread volume (Ziobro et al., 2013a). This could confirm the existence of an optimal dough consis-tency to obtain a bread of good quality. However, a complex balance of many dough properties is involved in the quality of the final product. Martinez et al. (2014), who studied both soluble and insoluble fibers, found that the increase of dough consistency related to the presence of 10% insoluble fibers depended on its particle size, being higher for the coarser fibers than for the fine ones. The loss tangent only dropped below the control dough value for insoluble fibers of large particle size, indicating a higher elastic behavior. Addition of fine fibers hardly affected tan δ while soluble fibers, Nutriose and polydextrose, increased dough loss tangent markedly denoting an increase in its viscous character as observed by Juszczak et al. (2012). A positive correlation between dough tan δ and bread-specific volume could be concluded from the results of Martinez et al. (2014). Breads with soluble fibers reached the highest specific volume, as found by Ziobro et al. (2013a), followed by those with fine oat or bam-boo fiber. The smallest breads were obtained for breads added with fibers of large particle sizes. The control bread resulting was smaller than breads with fine oat and bamboo fibers having a beneficial effect on bread volume, beyond their effect on dough consistency. The results of dough development obtained from rheofermentometer analysis correlated well with specific volume of the breads (Martinez et al., 2014). Dough development is related not only to gas producing capacity, which was similar in most of the doughs, but also to the ability to deform under the action of its pressure and to the ability to hold the gas produced during the proofing stage. The capacity to deform depends on the decrease in dough consistency or increase in compliances. The capacity

324 PART | II Product Specific Studies in Rheology
to retain gas is related to the internal structure of doughs. Soluble fibers help to create a mesh that envelops flour particles and starch, making the dough more cohesive and favoring gas retention. Insoluble fibers, on the other hand, particularly the more rounded or larger fibers, create points of rupture in the structure, thus making it easier for gas to escape (Martinez et al., 2014). The incorporation of corn- and tapioca-resistant starch (RS) preparations to gluten-free doughs led to similar effects (Korus et al., 2009). RS increased storage (G′), loss (G″) moduli, and zero shear viscosity (µo) of gluten-free doughs, and lowered the loss tangent, and creep and recovery compliances, increasing their elastic behavior (Korus et al., 2009). The highest effect was observed with tapioca-resistant starch.
Among many starch features, pasting characteristics on heating and cool-ing have a high impact on bread structure and quality (Miyazaki et al., 2006). The first plays a role in stabilization of porous crumb structure, obtained dur-ing baking; the second determines crumb aging (Goesaert et al., 2005). Pasting temperature determines when a rigid solid structure is formed during baking from a viscoelastic dough. This phase transition, together with protein dena-turation, is responsible for the formation of the bread crumb (Eliasson and Larsson, 1993) and prevents any further dough development. Some authors have established that pasting properties of gluten-free dough matrices are affected by the presence of fibers. A significant decrease of viscosity dur-ing heating and cooling in comparison to control sample was observed in the presence of inulin (Juszczak et al., 2012), tapioca- and corn-resistant starches (Korus et al., 2009), β-glucans, and HPMC (Ronda et al., 2013). Fibers, both soluble and insoluble, also delayed starch gelatinization, increasing the pasting temperature (Korus et al., 2009; Juszczak et al., 2012). The reduction in peak viscosity, in good accordance with a reduced starch concentration when fibers are present, can also indicate a reduced degree of starch granule swelling as stated before (Symons and Brennan, 2004). Added fibers compete for water with starch and showed preferential water binding which reduces water avail-ability for swelling starch granules, as well as for structure forming hydrocol-loids present in gluten-free dough mixes. Limited swelling of starch decreases their volume, and consequently friction, which is manifested by lower maxi-mum viscosity (Juszczak et al., 2012). The effect of fibers on the pasting temperature could be interpreted on the basis of the changes induced in the swelling-amylose leaching process responsible for starting the pasting process. Higher pasting temperatures would result from delayed or restricted swelling and amylose leaching as observed before for the effects of surfactants in starch suspensions (Mira et al., 2005). The incorporation of soluble DFs hinders the intermolecular association that takes place in the macromolecular starch net-work upon cooling by water competition, physical interference, and disruption of secondary forces of intertwined amylose molecules incorporating dispersed swollen and ruptured starch granules in the three-dimensional network (Ronda et al., 2013).

Rheological Properties of Gluten-Free Bread Doughs Chapter | 12 325
12.6 EFFECT OF PROTEIN ENRICHMENT
Proteins from different sources can be added to increase both nutritional and functional values of GF products. The protein content in Spanish GF breads ranged from 90 to 155 g/kg and, as a consequence, they have a very low con-tribution to the recommended daily protein intake and a high contribution to the carbohydrate dietary reference intake (Matos and Rosell, 2011). Lately, gluten-free formulations have been set up considering the nutritional quality of the final gluten-free baked products (Matos and Rosell, 2015). Milk, egg, and legume proteins, for example, soy bean and pea, have been added to gluten-free doughs with the aim of reinforcing dough structure. Protein incorporation leads to the formation of a continuous protein phase (Moore et al., 2004), and is added to GF applications (Crockett et al., 2011) to increase elastic modulus by crosslinking, to improve perceived quality by enhancing Maillard browning and flavor, to improve structure with gelation, and to aid in foaming (Moore et al., 2008). These result in bread with increased loaf volume, improved crumb regularity, and improved sensory characteristics (Moore et al., 2008). According to Stathopoulos (2008), the most used ingredients in gluten-free baked product formulations are caseinates, skim milk powder, dry milk, whey protein concen-trate, and milk protein isolate. It follows that the selection of the proteins used in a gluten-free formulation is a critical issue (Mandala and Kapsokefalou, 2011). Not all nongluten proteins exert the same effects.
With the aim of protein enrichment soy protein isolates and also legume flours or legume protein isolates have been incorporated to GF doughs ( Marco and Rosell, 2008b; Ziobro et al., 2013b; Ronda et al., 2014; Villanueva et al., 2015). Generally, the enrichment of gluten-free breads with these proteins leads to a decrease in both the specific volume and the crumb softness although the positive nutritional impact was readily evident (Matos and Rosell, 2015). Supplementation of GF doughs with soy and pea protein isolates at levels that ranged from 2% to 10% (flour-protein basis) led to more structured dough matrices (higher viscoelastic moduli and steady viscosities, and lower tan δ, instantaneous, Jo, and retarded, J1, elastic compliances), the effect being magni-fied with protein dose (Marco and Rosell, 2008b; Crockett et al., 2011; Ziobro et al., 2013b; Ronda et al., 2014). These protein effects are compatible with the creation of a robust crosslinked structure by added proteins, especially sup-ported in the case of soya protein by glicinin and a high water retention abil-ity (Crockett et al., 2011). Ziobro et al. (2013b) also found an increase in the storage modulus due to gluten-free flours replacement with 10% collagen and lupine, with collagen having the greatest strengthening effect on dough struc-ture. Incorporation of proteins from animal source resulted in different visco-elastic behaviors according to the protein type and dosage (Ronda et al., 2014). Albumin, at 5–10% level, decreased significantly viscoelastic moduli, steady viscosity and increased the viscoelastic compliances; meanwhile the phase shift tangent was only slightly affected (Ziobro et al., 2013b; Ronda et al., 2014).

326 PART | II Product Specific Studies in Rheology
Crockett et al. (2011) observed a similar effect of albumin in viscoelastic moduli, and above 15% addition (total dough weight basis), also obtained a significant increase of tan δ. Different rheological behavior was observed in casein-added doughs. Doughs enriched with calcium caseinate showed higher viscoelastic moduli than the control, but a lower predominance of G′ over G″ (higher tan δ values) compatible with a more viscous nature. At 10% casein addition to rice based gluten-free doughs, Ronda et al. (2014) observed a significant decrease of elastic creep compliance with respect to the control dough. The application of casein significantly modified rheological image of dough structure, shift-ing its properties toward values typical for strong gels, probably caused by its special arrangement, in which regularly occurring amino acid sequence favored the formation of tight polypeptide strands stabilized by covalent and hydrogen bonds (Ronda et al., 2014).
The impact of acid incorporation (acetic + lactic, 0.5%) into rice starch-based doughs enriched with different proteins (egg albumin, calcium caseinate, pea protein, and soy protein isolates) at 5 and 10% level has been recently inves-tigated on dough viscoelastic and pasting profiles (Ronda et al., 2014). Addition of acid produced weakening of the structure of doughs matrices. Acidifica-tion of 5 or 10% soya-added doughs decreased G′ and G″ (20–60% depending on the dose of protein) and the steady viscosity (60–70%) and increased the loss tangent (up to 50%) and the elastic compliances, J0c (30–120%) and J1c (30–230%). The effect of acidification on pea protein-enriched doughs was in the same direction although the changes in viscoelastic moduli and loss tangent did not result significantly. However, acidification of casein-enriched doughs decreased significantly the loss tangent (55–15%) at the same time that con-ferred lower dough deformation and notably higher steady viscosity, and elastic modulus, G′ for dough with 5 g/100 g casein.
Pasting properties of the gluten-free dough were also affected by protein addition. In general, addition of proteins decreases the peak viscosity, final vis-cosity, and setback of dough due to starch dilution (Marco and Rosell, 2008c). Ronda et al. (2014) reported the major single effects on cooking and cooling parameters for casein and vegetal proteins, especially by pea protein, while albumin hardly exerted any significant effect. These authors also observed a general increase in pasting temperature, with changes being magnified with increased dose of protein from 5% to 10%. The importance of protein in the initialization of pasting (Meadows, 2002) as well as in peak and final viscosi-ties (Fitzgerald et al., 2003) has been strongly evidenced in rice. In addition, protein–starch linkages established in the presence of proteins stabilize starch structure, and hence delayed the gelatinization process (Crockett et al., 2011). Lower values for pasting viscosities are indication of a reduction in starch avail-able for gelatinization. This reduction is likely due to a general reduction in the starch content of the pastes because of replacement with proteins that can additionally retain water from the starch granules. The well-established water

Rheological Properties of Gluten-Free Bread Doughs Chapter | 12 327
binding capacity of proteins would explain this effect (Zayas, 1997). The reduc-tion of available water in the system would reduce initial starch granule swell-ing and, hence, add to the explanation of lower peak viscosities of the pastes, as was argued in the previous section relating to the addition of fibers. Setback sharply decreased in the presence of increasing amounts of either vegetal (pea, soya) or animal protein (casein), except for albumin, predicting a decrease in amylose retrogradation. Ziobro et al. (2013b) also observed a decrease in amy-lopectin recrystallization from DSC measurements of rice based bread crumbs added with 10% proteins stored for 48 h. Ronda et al. (2014) detected that pro-tein–acid interaction favored higher pasting viscosity profiles, particularly for doughs with proteins of vegetable origin and lower dosage. Dough acidifica-tion decreased the pasting temperatures and the amylose retrogradation. It can be concluded from this study that acidification of protein-enriched rice-starch doughs allows manipulation of rheological properties of dough, which is of relevant importance in GF bread development.
How the effect of proteins on dough rheology affects the final quality of enriched breads is an important issue. Marco and Rosell (2008b) reported that soybean proteins and HPMC increased the consistency of rice based dough during mixing, heating, and cooling but no relationship can be drawn with bread quality parameters. Matos and Rosell (2013) tested six rice flour based gluten-free formulations containing different starches (potato and corn), pro-teins (skim milk powder, whole egg powder, or soy protein isolate), and hydro-colloids (xanthan gum, HPMC, or pectin). Dough Mixolab parameters showed significant correlation coefficients (r >0.70) with physical bread parameters, and moderate correlation coefficients (r <0.70) with sensory characteristics. A correlation study of rheological properties of protein-enriched dough (Ronda et al., 2014) modulated by acidification of the dough and the quality properties of the breads obtained from them (Villanueva et al., 2015) allows us to conclude that a good predictor of the volume of these enriched gluten-free breads is the rheofermentometer test. From these studies significant correlations between the maximum height of dough development, Hm, and the specific volume and crumb firmness of breads (p < 0.001; r = 0.80 and −0.70 respectively) can be concluded. Hm, as could be expected, was dependent on the volume of the gas produced, VT, and retained, Vr, by dough during proofing, and also on the capacity of expanding under the action of the gas produced. Positive correla-tions were obtained between Hm and VT and Vr (p < 0.01; r = 0.87 and 0.95, respectively). As well, Hm was negatively correlated with all dough rheological properties related to consistency: G′ and G″ modulus (p < 0.001; r = −0.72 and p < 0.05; r = −0.55, respectively), the maximum stress in the LVR, τmax (p < 0.01; r = −0.66) and the steady-state viscosity, µo, (p < 0.05; r = −0.54), and positively correlated with the properties that relate to the elastic or visco-elastic deformation under the application of a constant stress, J0 or J1 from a creep test (p < 0.05; r = +0.51 in both cases) (Ronda et al., 2014). The specific

328 PART | II Product Specific Studies in Rheology
volume was significantly correlated with G′ (p < 0.05; r = −0.51) but it did not show additional significant correlations with the remaining fundamental rheo-logical properties (Villanueva et al., 2015). As was commented previously, the decrease of an excessive consistency facilitates dough expansion and improves bread volume as happened in doughs added with vegetal proteins when an acetic/lactic acid blend was added. The dough consistency decrease associated with dough acidification led to higher bread-specific volume. However, too low dough consistency, as in those with 10% albumin, could explain the low specific volume of breads by its inability to retain the produced and expanded gas (Ronda et al., 2014). Specific volume was significantly correlated with the breakdown viscosity during heating, BD (p < 0.01; r = −0.62) as also observed by Matos and Rosell (2013). Bread crumb firmness was positively correlated with G′, µo, and breakdown, BD (p < 0.01; r = 0.72, 0.59, and 0.62, respectively).
12.7 CONCLUSIONS
Much research has been focussed on the development of gluten-free breads in an attempt to overcome the challenges of the absence of gluten and there has been some success. The relationships between dough rheology and dough struc-ture and the link between the rheological properties of dough and its behavior during mechanical handling and baking still need to be studied in gluten-free systems.
Wheat dough properties can be measured using well-established empirical rheological methods that allow predicting the baking quality of ingredients. Significantly less information on the rheological characteristics of gluten-free doughs has been published which greatly vary in consistency, going from batter to dough. Finding an equivalent predictor method for gluten-free doughs is an important task that we have not been able to culminate so far.
The design of gluten-free breads remains an empirical task but some conclu-sions must be drawn from all the rheological and quality studies. The compila-tion of results from scientific literature reveals that the best developed breads were obtained from doughs not too strong or too weak. The existence of an optimal dough consistency for each formulation can be concluded. An exces-sive dough consistency leads to small breads as the dough cannot expand as a result of gas production during proofing and gas expansion in the oven. On the contrary, a dough with too weak a consistency cannot retain the gas, which will be lost and consequently affect the development of the loaf. Nevertheless, consistency seems not to be the sole issue. Pasting properties and other physico-chemical and structural properties of GF matrices are known to affect also the physical quality of final bread. The high complexity and variability of ingredi-ents used in GF bread making, their different nature and properties, are probably responsible for the difficulty of finding a good predictor of bread quality based only in dough rheology.

Rheological Properties of Gluten-Free Bread Doughs Chapter | 12 329
ACKNOWLEDGMENTS
The authors gratefully acknowledge the financial support of the Spanish Institution Ministe-rio de Economía y Competitividad and the European Regional Development Fund (FEDER) (Projects AGL2012-35088 and AGL2015-63849-C2-2-R). Marina Villanueva thanks the Jun-ta de Castilla y León doctorate grant.
REFERENCES
Abdelrahman, A.A., Spies, R.D., 1983. Dynamic rheological studies of dough systems. In: Faridi, H., Faubion, J.M. (Eds.), Fundamentals of Dough Rheology. AACC, St. Paul, MN, pp. 87–103.
Abebe, W., Ronda, F., Villanueva, M., Collar, C., 2015. Effect of tef [Eragrostis tef (Zucc.) Trotter] grain flour addition on viscoelastic properties and stickiness of wheat dough matrices and bread loaf volume. 241, 469–478.
Angioloni, A., Balestra, F., Pinnavaia, G.G., Dalla Rosa, M., 2008. Small and large deformation tests for the evaluation of frozen dough viscoelastic behavior. J. Food Eng. 87, 527–531.
Angioloni, A., Collar, C., 2009. Small and large deformation viscoelastic behaviour of selected fibre blends with gelling properties. Food Hydrocoll. 23, 742–748.
Anton, A.A., Artfield, S.D., 2007. Hydrocolloids in gluten-free breads. A review. Int. J. Food Sci. Nutr. 59, 11–23.
Armero, E., Collar, C., 1997. Texture properties of formulated wheat doughs. Zeitschrift für Lebensmittel-Untersuchung und-Forschschung 204, 136–145.
Autio, K., Flander, L., Kinnunen, A., Heinonen, R., 2001. Bread quality relationship with rheologi-cal measurements of wheat flour dough. Cereal Chem. 78 (6), 654–657.
Bell, D.A., 1990. Methylcellulose as a structure enhancer in bread baking. Cereal Food World 35, 1001–1006.
Brusewitz, G.H., Yu, H., 1996. Back extrution method for determining properties of mustard slurry. J. Food Eng. 27, 259–265.
Buresova, I., Hrivna, L., 2011. Effect of wheat gluten proteins on bioethanol yield from grain. Appl. Energy 88, 1205–1210.
Buresova, I., Kracmar, S., Dvorakova, P., Streda, T., 2014. The relationship between rheological characteristics of gluten-free dough and the quality of biologically leavened bread. 60: 271–275.
Cabrera-Chavez, F., Calderon de la Barca, A.M., 2010. Trends in wheat technology and modifica-tion of gluten proteins for dietary treatment of coeliac disease patients. J. Cereal Sci. 52 (3), 337–341.
Chen, W.Z., Hoseney, R.C., 1995. Development of an objective method for dough stickiness. LWT-Food Sci. Technol. 28, 467–473.
Collar, C., 2003. Significance of viscosity profile of pasted and gelled formulated wheat doughs on bread staling. Eur. Food Res. Technol. 216 (6), 505–513.
Collar, C., Andreu, P., Martínez, J.C., Armero, E., 1999. Optimization of hydrocolloid addition to improve wheat bread dough functionality: a response surface methodology study. Food Hydro-coll. 13 (6), 467–475.
Collar, C., Martínez, J.C., Andreu, P., Armero, E., 2000. Effects of enzyme association on bread dough performance. A response surface analysis. Food Sci. Technol. Int. 6 (3), 217–226.
Comino, I., Real, A., de Lorenzo, L., Cornell, H., López-Casado, M.A., Barro, F., et al., 2011. Diversity in oat potential immunogenicity: basis for the selection of oat varieties with no toxic-ity in coeliac disease. Gut 60, 915–922.
330 PART | II Product Specific Studies in Rheology
Crockett, R., Ie, P., Vodovotz, Y., 2011. Effects of soy protein and egg white solids on the physico-chemical properties of gluten-free bread. Food Chem. 129, 84e91.
Cronin, C., Shanahan, F., 1997. Insulin-dependent diabetes mellitus and coeliac disease. Lancet 349 (9058), 1096–1097.
Crosbie, G.B., Ross, A.S., 2007. The Rva Handbook. AACC International. St Paul, Minesota, USA. Demirkesen, I., Mert, B., Sumnu, G., Sahin, S., 2010. Rheological properties of gluten-free bread
formulations. J. Food Eng. 96, 295–303. Dobraszczyk, B.J., Morgenstern, M.P., 2003. Rheology and the breadmaking process. J. Cereal Sci.
38, 229–245. Dreese, P.C., Faubion, J.M., Hoseney, R.C., 1988. Dynamic rheological properties of flour, gluten
and gluten-starch doughs. II. - Effect of various processing and ingredients changes. Cereal Chem. 65, 354–359.
Dunnewind, B., Sliwinski, E.L., Grolle, K., Van Vliet, T., 2004. The Kieffer dough and gluten extensibility rig—an experimental evaluation. J. Texture Stud. 34, 537–560.
Edwards, N., Dexter, J., Scanlon, M., Cenkowski, S., 1999. Relationship of creep-recovery and dynamic oscillatory measurements to durum wheat physical dough properties. Cereal Chem. 76 (5), 638–645.
Eliasson, A.C., Larsson, K., 1993. Interactions between components. Marcel Dekker, New York, 161–201.
Faridi, H., Faubion, J.M., 1989. Dough rheology and baked product texture. Nostrand Reinhold, New York.
Faubion, J.M., Hoseney, R.C., 1989. The viscoelastic properties of Wheat Flour Doughs. In: Faridi, H., Faubion, J.M. (Eds.), Dough Rheology and Baked Products Texture. Nostrand Reinhold, New York, pp. 29–66.
Fitzgerald, M.A., Martin, M., Ward, R.M., Park, W.D., Shead, H.J., 2003. Viscosity of rice flour: a rheological and biological study. J. Agric. Food Chem. 51 (8), 2295e2299.
Gallagher, E., Gonnley, T.R., Arendt, E.K., 2004. Recent advances in the formulation of gluten-free cereal-based products. Trends Food Sci. Technol. 15, 143–152.
Georgopoulos, T., Larsson, H., Eliasson, A.C., 2004. A comparison of the rheological proper-ties of wheat flour dough and its gluten prepared by ultracentrifugation. Food Hydrocoll. 18, 143–151.
Goesaert, H., Brijs, K., Veraverbeke, W.S., Courtin, C.M., Gebruers, K., Delcour, J.A., 2005. Wheat flour constituents: how they impact bread quality, and how to impact their functionality. Trends Food Sci. Technol. 16, 12–30.
Grausgruber, H., Hatzenbichler, E., Ruckenbauer, P., 2003. Analysis of repeated stickiness mea-sures of wheat dough using a texture analyzer. J. Texture Stud. 34 (1), 69–82.
Gujral, H.S., Rosell, C.M., 2004. Improvement of the breadmaking quality of rice flour by glucose oxidase. Food Res. Int. 37, 75–81.
Hager, A.S., Axel, C., Arendt, E.K., 2011a. Status of carbohydrates and dietary fiber in gluten-free diets. Cereal Foods World 56, 109–114.
Hager, A.S., Ryan, L.A.M., Schwab, C., Ganzle, M.G., O’Doherty, J.V., Arendt, E.K., 2011b. Influ-ence of the soluble fibres inulin and oat beta-glucan on quality of dough and bread. Eur. Food Res. Technol. 232 (3), 405–413.
Holas, J., Tipples, K.H., 1978. Factors affecting farinograph and baking absorption I Quality char-acteristics of flour streams. Cereal Chem. 55, 637–652.
Juszczak, L., Witczak, T., Ziobro, R., Korus, J., Cieslik, E., Witczak, M., 2012. Effect of inulin on rheological and thermal properties of gluten-free dough. Carbohydr. Polym. 90, 353–360.

Rheological Properties of Gluten-Free Bread Doughs Chapter | 12 331
Kim, Y., Yokoyama, W., 2011. Physical and sensory properties of all-barley and all-oat breads with additional hydroxypropyl methylcellulose (HPMC) and β-glucan. J. Agric. Food Chem. 59, 741–746.
Korus, J., Juszczak, L., Ziobro, R., Witczak, M., Grzelak, K., Sójka, M., 2011. Defatted straw-berry and blackcurrant seeds as functional ingredients of gluten-free bread. J. Texture Stud. 43, 29–39.
Korus, J., Witczak, M., Ziobro, R., Juszczak, L., 2009. The impact of resistant starch on character-istics of gluten-free dough and bread. Food Hydrocoll. 23, 988–995.
Kuktaite, R., Larsson, H., Johansson, E., 2007. The influence of dough mixing time on wheat pro-tein composition and gluten quality for four commercial flour mixtures. In: Buck, H.T., Nisi, J.E., Salomon, N. (Eds.), Wheat Production in Stressed Environments. Springer, New York, pp. 543–548.
Kupper, C., 2005. Dietary guidelines and implementation for celiac disease. Gastroenterology 128 (4), 121–127.
Lazaridou, A., Duta, D., Papageorgiou, M., Belc, N., Biliaderis, C.G., 2007. Effects of hydrocol-loids on dough rheology and bread quality parameters in gluten-free formulations. J. Food Eng. 79 (3), 1033–1047.
Liu, R., Xing, Y., Zhang, Y., Zhang, B., Jiang, X., Wei, Y., 2015. Effect of mixing time on the structural characteristics of noodle dough under vacuum. Food Chem. 188, 328–336.
Mancebo, C., San Miguel, M.A., Martinez, M., Gomez, M., 2015. Optimisation of rheological properties of gluten-free doughs with HPMC, psyllium and different levels of water. J. Cereal Sci. 61, 8–15.
Mandala, I., Kapsokefalou, M., 2011. Gluten-free bread: sensory, physicochemical, and nutritional aspects. In: Preedy, V.R., Watson, R.R., Patel, V.B. (Eds.), Flour and Breads and their Fortifica-tion in Health and Disease Prevention 161-169.
Marco, C., Rosell, C.M., 2008a. Breadmaking performance of protein enriched, gluten-free breads. Eur. Food Res. Technol. 227, 1205–1213.
Marco, C., Rosell, C.M., 2008b. Functional and rheological properties of protein enriched gluten-free composite flours. J. Food Eng. 88, 94–103.
Marco, C., Rosell, C.M., 2008c. Effect of different protein isolates and transglutaminase on rice flour properties. J. Food Eng. 84, 132–139.
Mariotti, M., Lucisano, M., Pagani, M.A., Ng, P.K.W., 2009. The role of corn starch, amaranth flour, pea isolate, and Psyllium flour on the rheological properties and the ultrastructure of gluten-free doughs. Food Res. Int. 42, 963–975.
Martin, J., Geisel, T., Maresch, C., Krieger, K., Stein, J., 2013. Inadequate nutrient intake in patients with celiac disease: results from a german dietary survey. Digestion 87, 240–246.
Martinez, M., Díaz, A., Gómez, M., 2014. Effect of different microstructural features of soluble and insoluble fibres on gluten-free dough rheology and bread-making. J. Food Eng. 142 (2014), 49–56.
Matos, M.E., Rosell, C.M., 2011. Chemical composition and starch digestibility of different gluten-free breads. Plant Food Hum. Nutr. 66, 224–230.
Matos, M.E., Rosell, C.M., 2013. Quality indicators of rice-based gluten-free breadlike products: relationships between dough rheology and quality characteristics. Food Bioprocess. Technol. 6, 2331–2341.
Matos, M.E., Rosell, C.M., 2015. Understanding glute-free dough for reaching breads with physical quality and nutritional balance. J. Sci. Food Agric. 95, 653–661.
Meadows, F., 2002. Pasting process in rice flour using Rapid Visco Analyser curves and first deriva-tives. Cereal Chem. 79, 559e562.

332 PART | II Product Specific Studies in Rheology
Menjivar, J.A., 1989. Fundamental aspects of dough rheology. In: Faridi, H., Faubion, J.M. (Eds.), Dough Rheology and Baked Products Texture. Nostrand Reinhold, New York, pp. 1–27.
Mezaize, S., Chevallier, S., Le-Bail, A., de Lamballerie, M., 2010. Gluten-free frozen dough: Influence of freezing on dough rheological properties and bread quality. Food Res. Int. 43, 2186–2192.
Miles, M.J., Morris, V.J., Orford, P.D., Ring, S.G., 1985. The roles of amylose and amylopectin in the gelation and retrogradation of starch. Carbohydr. Res. 135 (2), 271–281.
Mira, I., Eliasson, A., Persson, K., 2005. Effect of surfactant structure on the pasting properties of wheat flour and starch suspensions. Cereal Chem. 82 (1), 44e52.
Miyazaki, M., van Hung, P., Maeda, T., Morita, N., 2006. Recent advances in application of modi-fied starches for breadmaking. Trends Food Sci. Technol. 17, 591–599.
Moore, M., Dal Bello, F., Arendt, E.K., 2008. Sourdough fermented by lactobacillus plantarum FST 1.7 improves the quality and shelf life of gluten-free bread. Eur. Food Res. Technol. 226, 1309–1316.
Moore, M., Tilman, T.S., Dockery, P., Arendt, E.K., 2004. Textural comparisons of gluten-free and wheat-based doughs, batters, and breads. Cereal Chem. 81 (5), 567–575.
Navickis, L.L., Anderson, R.A., Bagley, E.B., Jasburg, B.K., 1982. Viscoelastic properties of wheat flour doughs: variation of dynamic moduli with water and protein content. J. Texture Stud. 13, 249–259.
Onyango, C., Mutungi, C., Unbehend, G., Lindhauer, M.G., 2010. Rheological and baking char-acteristics of batter and bread prepared from pregelatinised cassava starch and sorghum and modified using microbial transglutaminase. J. Food Eng. 97, 465–470.
Peressini, D., Sensidoni, A., 2009. Effect of soluble dietary fibre addition on rheological and bread-making properties of wheat doughs. J. Cereal Sci. 49, 190–201.
Pérez-Quirce, S., Collar, C., Ronda, F., 2014. Significance of healthy viscous dietary fibres on the performance of gluten-free rice-based formulated breads. Int. J. Food Sci. Technol. 49, 1375–1382.
Phan-Thien, N., Safari-Ardi, M., 1998. Linear viscoelastic properties of flour-water doughs at dif-ferent water concentrations. J. Non-Newtonian Fluid Mech. 74 (1), 137–150.
Pruska-Kedzior, A., Kedzior, Z., Goracy, M., Pietrowska, K., Przybylska, A., Spychalska, K., 2008. Comparison of rheological, fermentative and baking properties of gluten-free dough formula-tions. Eur. Food Res. Technol. 227, 1523–1536.
Rao, M., 2007. Introduction: Food Rheology and Structure. In: Rao, M.A. (Ed.), Rheology of Fluid and Semisolid Foods Principles and Applications. second ed. Springer, New York, pp. 4–26.
Ronda, F., Oliete, B., Gómez, M., Caballero, P.A., Pando, V., 2011. Rheological study of layer cake batters made with soybean protein isolate and different starch sources. J. Food Eng. 102, 272–277.
Ronda, F., Pérez-Quirce, S., Angioloni, A., Collar, C., 2013. Impact of viscous dietary fibres on the viscoelastic behaviour of gluten-free formulated rice doughs: a fundamental and empirical rheological approach. Food Hydrocoll. 32, 252–262.
Ronda, F., Pérez-Quirce, S., Lazaridou, A., Biliaderis, C., 2015. Effect of barley and oat β-glucan concentrates on gluten-free rice-based doughs and bread quality: a physico-chemical and nutri-tional perspective. Food Hydrocoll. 48, 198–207.
Ronda, F., Villanueva, M., Collar, C., 2014. Influence of acidification on dough viscoelasticity of gluten-free rice starch-based dough matrices enriched with exogenous protein. LWT-Food Sci. Technol. 59, 12–20.
Rosell, C.M., Rojas, J.A., Benedito de Barber, C., 2001. Influence of hydrocolloids on dough rheol-ogy and bread quality. Food Hydrocoll. 15, 75–81.

Rheological Properties of Gluten-Free Bread Doughs Chapter | 12 333
Rosell, C.M., Santos, E., Collar, C., 2010. Physical characterization of fiber-enriched bread doughs by dual mixing and temperature constraint using the Mixolab. Eur. Food Res. Technol. 231, 535–544.
Sabanis, D., Lebesi, D., Tzia, C., 2009. Effect of dietary fibre enrichment on selected properties of gluten-free bread. LWT-Food Sci. Technol. 42, 1380–1389.
Sciarini, L.S., Ribotta, P.D., León, A.E., Pérez, G.T., 2010a. Effect of hydrocolloids on gluten-free batter properties and bread quality. Int. J. Food Sci. Technol. 45 (11), 2306–2312.
Sciarini, L.S., Ribotta, P.D., León, A.E., Pérez, G.T., 2010b. Influence of gluten-free flours and their mixtures on batter properties and bread quality. Food Bioprocess. Technol. 3, 577–585.
Sciarini, L.S., Ribotta, P.D., León, A.E., Pérez, G.T., 2012. Incorporation of several additives into gluten free breads: Effect on dough properties and bread quality. J. Food Eng. 111, 590–597.
Shepherd, S.J., Gibson, P.R., 2013. Nutritional inadequacies of the gluten-free diet in both recently-diagnosed and long-term patients with coeliac disease. J. Hum. Nutr. Diet. 26, 349–358.
Singh, H., MacRitchie, F., 2001. Application of polymer science to properties of gluten. J. Cereal Sci. 33, 231–243.
Sivaramakrishnan, H., Senge, B., Chattopadhyay, P.K., 2004. Rheological properties of rice dough for making rice bread. J. Food Eng. 62, 37–45.
Stathopoulos, C.E., 2008. Dairy-based ingredients. In: Arendt, E.K., Dal Bello, F. (Eds.), Gluten-Free Cereal Products and Beverages. Elsevier, Academic Press, Burlington, MA, USA, p. 464.
Steffe, J.F., 1996. Rheological Methods in Food Process Engineering, second ed. Freeman Press, East Lansing, MI.
Symons, L., Brennan, C., 2004. The effect of barley beta-glucan fiber fractions on starch gelatiniza-tion and pasting characteristics. J. Food Sci. 69 (4), C257–C261.
Thompson, T., 2001. Wheat starch, gliadin and the gluten free diet. J. Am. Diet. Assoc. 101, 1456–1459.
Thompson, T., Dennis, M., Higgins, L.A., Lee, A.R., Sharrett, M.K., 2005. Glutenfree diet survey: are Americans with coeliac disease consuming recommended amounts of fibre, iron, calcium and grain foods? J. Hum. Nutr. Diet. 18 (3), 163–169.
Torbica, A., Hadnadev, M., Dapcevic, T., 2010. Rheological, textural and sensory properties of gluten-free bread formulations based on rice and buckwheat flour. Food Hydrocoll. 24, 626–632.
Tsiami, A.A., Bot, A., Agterof, W.G.M., 1997a. Rheology of mixtures of glutenin subfractions. J. Cereal Sci. 26, 279–287.
Tsiami, A.A., Bot, A., Agterof, W.G.M., Groot, R.D., 1997b. Rheological properties of glutenin subfractions in relation to their molecular weight. J. Cereal Sci. 26, 15–27.
Van Bockstaele, F., De Leyn, I., Eeckhout, M., Dewettinck, K., 2011. Non-linear creep-recovery measurements as a tool for evaluating the viscoelastic properties of wheat flour dough. J. Food Eng. 107 (1), 50–59.
vanVliet, T., Janssen, A.M., Bloksma, A.H., Walstra, P., 1992. Strain hardening of dough as a requirement for gas retention. J. Texture Stud. 23, 439–460.
Vergnes, B., Della Valle, G., Colonna, P., 2003. Rheological properties of biopolymers and applica-tions to cereal processing. In: Kalentuç, G., Breslaner, K.J. (Eds.), Characterization of Cereals and Flours. Properties, analysis and Applications. Marcel Dekker Inc, New York.
Villanueva, M., Mauro, R., Collar, C., Ronda, F., 2015. Influence of acidification on dough visco-elasticity of gluten-free rice starch-based dough matrices enriched with exogenous protein. Eur. Food Res. Technol. 240, 783–794.
Weipert, D., 1990. The benefits of basic rheometry in studying dough rheology. Cereal Chem. 67 (4), 311–317.

334 PART | II Product Specific Studies in Rheology
Wild, D., Robins, G.G., Burley, V.J., Howdle, P.D., 2010. Evidence of high sugar intake, and low fibre and mineral intake, in the gluten-free diet. Aliment. Pharmacol. Ther. 32, 573–581.
Witczak, M., Korus, J., Ziobro, R., Juszczak, L., 2010. The effects of maltodextrins on gluten-free dough and quality of bread. J. Food Eng. 96, 258–265.
Zayas, J.F., 1997. Functionality of Proteins in Food. Springer, Berlin, Heidelberg, pp 6–75. Ziobro, R., Korus, J., Juszczak, L., Witczak, T., 2013a. Influence of inulin on physical characteris-
tics and staling rate of gluten-free bread. J. Food Eng. 116, 21–27. Ziobro, R., Witczak, T., Juszczak, L., Korus, J., 2013b. Supplementation of gluten-free bread with
non-gluten proteins. Effect on dough rheological properties and bread characteristic. Food Hydrocoll. 32, 213–220.

335Advances in Food Rheology and Its Applications. http://dx.doi.org/10.1016/B978-0-08-100431-9.00013-9Copyright © 2017 Elsevier Ltd. All rights reserved.
Chapter 13
Food Gels: Gelling Process and New Applications
A. Nazir, A. Asghar, A. Aslam MaanNational Institute of Food Science & Technology, University of Agriculture, Faisalabad, Pakistan
13.1 INTRODUCTION
The term “gel” comes under the subject of colloidal science and has been defined in the Polymer Dictionary as “polymers and their swollen matters with three-dimensional network structures that are insoluble in any solvent.” However, it is also true that there is still no generally adopted definition of this term. A more simplified definition is “a gel is an intermediate between a solid and liquid pos-sessing both elastic (solid) and viscous (liquid) characteristics” ( Banerjee and Bhattacharya, 2011). It exhibits flexible behavior (similar to a solid) and gets distorted on applying pressure, but recovers to its actual shape after removal of the stress, as distortion has left the bonds between the particles integral. A gel also shows viscous properties as part of the deformation is not recovered after the stress is removed and the gel flows since the bonds are broken and new bonds are formed, as in a liquid when force is applied.
A number of food items exist in the form of gels, like jams, jellies, con-fectionary, desserts, yogurt, etc., which are composed of biopolymers as the main structure forming ingredient. The commonly used biopolymers are poly-saccharides and proteins that confer semisolid characteristics in a range of food products. These biopolymer-based gels are networks of different shapes such as blocks, particles, or fibers, which may behave differently under mechanical stress (Einhorn-Stoll and Drusch, 2015).
A proper understanding of the gel structure is a prerequisite in order to attain the desired sensory perception and convenience. Moreover, the physico-chemical properties of biopolymers (eg, molecular dimensions, surface activ-ity, polarity, and thermal stability) and processing or environmental conditions (eg, temperature, pressure/shear, ionic strength, pH, and water activity) result in different types of gel structures (KátiaRegina et al., 2012). Hence, gel forma-tion with the desired sensorial characteristics is not an easy task and involves a

336 PART | II Product Specific Studies in Rheology
multidisciplinary research approach. For example, physicists and chemists deal in developing molecular models for gelation, rheologists are interested in devel-oping mathematical descriptions of the deformation and failure properties of food gels, and finally, sensory scientists and nutritionists are interested in relat-ing perceived texture to measurable physical and mechanical properties, using multicomponent gels as a basis for manipulating the textural characteristics of foods (Blanshard and Mitchell, 1988).
With the advancement in research, we are now better able to understand the relation between structural and textural properties of different gels with the phys-ical terms. Therefore, the present chapter is intended to focus on current research regarding microstructural and rheological aspects of food gels. Moreover, some of the latest developments in manufacturing of gel-based novel food products with appropriate nutritional and technological properties will be addressed.
13.2 GEL TYPES AND GELATION MECHANISMS
There are different bases for classifying food gels, for example, biopolymer network, gelation mechanism, morphology, interaction, etc. Based on the type of biopolymer network, gel structures are composed of either simple networks (consisting of single component, eg, polysaccharides or proteins), binary/mixed networks (consisting of two or more components), or composite/filled network (consisting of different particulates, eg, fat globules along with biopolymer net-work) (Blanshard and Mitchell, 1988). Based on the type of gelation mecha-nism, gels can be categorized into either cold-set, heat-set, ionotropic, acid, or enzyme induced. Based on morphology, gels consist of either filaments, par-ticles, or soft particle suspensions.
There may exist different types of interactions in gels like hydrogen bonding, hydrophobic interactions, ionic bonds, and covalent chemical bonds. Depend-ing on the physical structure of the biopolymer network, polymer gels can be classified as strong, weak, or pseudo gels (Ross-Murphy, 1995). Chemically crosslinked polymer gels are considered as strong gels. In these gels, crosslinks are permanent and cannot be reformed if broken. Weak gels contain crosslinks which can be broken and reformed such as colloidal gels and some biopolymer gels (Richter, 2007; Solomon and Spicer, 2010). Entangled polymer systems are sometimes referred to as pseudo gels, because over a range of time scales, physical entanglements between polymer chains mimic chemical crosslinks giving these materials gel-like properties (Kavanagh and Ross-Murphy, 1998). However, the equilibrium response of a pseudo gel to a constant applied stress is to flow like a fluid. So there may be different bases for classifying food gels; however, to easily understand gel formation mechanism and gel microstructure, the gels are discussed in this chapter based on the type of biopolymer network.
As already stated, different types of polysaccharides and proteins have been used as gelling agents, which are usually obtained from various plants, ani-mals, or microorganisms (Einhorn-Stoll and Drusch, 2015). Frequently used

Food Gels: Gelling Process and New Applications Chapter | 13 337
polysaccharides are natural gums, agar, carrageenan, alginate, glucomannan, starches, and pectin. Among proteins, gelatin, casein, whey protein, soy protein, egg protein, and zein are most commonly used. Most of these polysaccharides and some of the proteins (eg, gelatin, casein, etc.) are also used as thickeners in many food preparations. The difference between thickening and gelling can be discussed at the viscosity and the shear modulus—the thickeners increase the viscosity whereas gelformers show (in general) first an increase of the viscosity until the gel point is approached, which becomes (theoretically) infinite at the gel point and shows a finite elastic modulus above the gel point (Vilgis, 2015). The gelling process starts with a homogeneous dispersion and a subsequent hydration of gelling agent, which is then followed by a network formation responsible for giving texture to the product.
13.2.1 Polysaccharide Gels
Only a few polysaccharides have the ability to gel at a certain concentration of the gelling agent, usually termed the critical concentration, while others are used as thickeners and stabilizers in different foods. Critical concentration of polysaccharides is relatively low compared to proteins. After complete hydra-tion of the polysaccharides, the polymer strands start interacting (crosslinking) with each other to form junction zones. At critical polymer concentration and at a certain degree of crosslinking, the polymer solution (dispersion) ultimately turns into a gel comprising a firm network structure. Various types of junction zones are possible depending upon the polysaccharide type and the gel-forming conditions, which are depicted in Fig. 13.1. Some of the polysaccharides form gel on heating and subsequent cooling (thermos or heat set gels) whereas others form gel at room temperature (cold set gels) involving specific types of cations, pH adjustment, or addition of certain cosolutes. Curdlan is a unique polysaccha-ride in the sense that it has the ability to form both the heat set and cold set gels (Nishinari and Zhang, 2004). The most commonly used polysaccharide gels are mentioned in the subsequent sections (Morris, 2007).
13.2.1.1 AgarAgar consists of fractions of agarose and agaropectin. The network formation and gelation in agar occur when heated solutions are cooled to below 40°C. In heated solution, molecules of agarose exist in the form of stiffened coils which on cooling give rise to thermos-reversible brittle and turbid gels through process of helix formation (single or double) and polymer associations.
13.2.1.2 AlginateAlginate gels are formed in the presence of divalent cations and the type of cation used determines the strength of resulting gels. Among various cations, Ca++-induced gelation is most important for food applications. Alginate gels are generally heat stable and irreversible. Cations initiate the linkage between

338 PART | II Product Specific Studies in Rheology
polyguluronic acid regions of adjacent polymers where buckled conformations in polymers provide effective binding sites giving rise to so-called egg box structures. The ability of alginates to gel at ambient temperature makes them suitable for a number of food applications.
13.2.1.3 PectinPectin is a polymer containing galacturonic acid units which may be either free or methylesterified; degree of esterification determines the gelation mechanism. Depending upon degree of esterification, pectins are classified as high methoxyl (HMP with >50% esterification) and low methoxyl pectin (LMP with < 50% esterification). In HMP, polymer chains of different sizes are linked through hydrogen bonding and hydrophobic interactions. This mechanism of gelation is further promoted by the sugars and low pH conditions. LMP resembles algi-nates and therefore the gelation is favored by the presence of Ca++ ions resulting in egg box structures.
13.2.1.4 StarchStarch granules consist of two types of polymers namely amylose (linear chain) and amylopectin (branched). It forms a composite gel in which granules are
FIGURE 13.1 Idealized junction zones in polysaccharide gels. (a) Point crosslink, (b) extended block-like junction zone, (c) egg-box model for the junction zones in alginate and pectin gels [the calcium ions (eggs) link the blocks of the polysaccharide chains (egg-boxes) together], (d) double-helical junction zone, and (e) junction zone formed by aggregation of helical segments of the poly-saccharide chains (Morris, 2007).

Food Gels: Gelling Process and New Applications Chapter | 13 339
found embedded into an amylose matrix. Gelation of starch takes place through a process known as gelatinization in which starch granules (on heating) absorb sufficient amount of liquid and swell several times their original size. The gran-ules leach out the amylose fraction which on cooling becomes ordered (as sin-gle helices) around swollen granules. The gelling mechanism varies with the source of the starch, as is the case in potato starch in which amylopectin fraction (instead of amylose) leaches out of the granules.
13.2.1.5 CarrageenanCarrageenan has the ability to form strong gels at very low concentrations (around 1% w/w). Among various types of carrageenan (k, ι, and λ) only k and ι can form gel whereas λ-carrageenan is used as a thickener. Due to anionic nature of polymer cations, especially Ca++ and K+ are required to reduce elec-trostatic repulsion between polymer chains and induce linkages. ι-carrageenan forms soft gels in the presence of Ca++ whereas k-carrageenan forms strong gels in the presence of K+. Linkage of the chains causes a twist in the molecule resulting in helical structure which are further associated into double helices.
13.2.1.6 Gellan GumTwo types of gellan gums can be distinguished based on chemical composition, that is, high and low acyl gellan gums. High acyl gellan forms soft and elastic gels whereas low acyl gellan forms strong and brittle gels. Gelation takes place due to the association of double helices which is promoted by the presence of ions.
13.2.2 Protein Gels
In order to understand the gelation mechanism of proteins, it is necessary to first understand the structure of the protein macromolecules. The proteins that are of special interest for the preparation of food gels are globular and fibrous proteins. The globular proteins are coiled-shaped structures with hydrophobic groups pointed toward interior and hydrophilic groups being exposed outside of the molecule. This molecular orientation makes globular proteins usually water soluble. Conversely, the fibrous proteins usually comprise long chain polypep-tides running parallel to each other, which are linked by disulfide (S-S) crossbridges. This molecular orientation gives stability and strength to fibrous proteins making them generally water insoluble. Some proteins (casein) exist in the form of micelles making them different from globular and fibrous proteins.
The gelation process of proteins is relatively more complex as compared to polysaccharides. The gelation requires a certain degree of unfolding (denatur-ation or destabilization) of protein structure in order to increase the intermolecu-lar interactions. This partial denaturation of proteins may be carried out through different means such as heat, pressure, enzymes, and some chemical denatur-ants (Nishinari et al., 2000). Once the protein structure is open, more reactive

340 PART | II Product Specific Studies in Rheology
groups are exposed and a range of intermolecular interactions will take place. These intermolecular interactions are specific to the protein type and the gel-forming conditions, and may be of covalent and noncovalent nature. The cova-lent interactions are irreversible and usually involve sulfhydryl (–SH)/disulfide (S–S) interchange reactions (Wijayanti et al., 2014). The kinetic models of these exchange reactions resulting in covalent disulfide linked aggregates in a manner comparable to polymerization reactions have been proposed by Verheul et al. (1998a,b). Additionally, iso-amide bonds can also be created by the action of transglutaminase enzyme (Foegeding and Davis, 2011). The noncovalent inter-actions are possibly reversible and usually involve hydrogen bonding, hydropho-bic interactions, and electrostatic interactions. These intermolecular interactions induce protein aggregation, which finally end up into a three-dimensional orga-nized network responsible for viscoelastic properties of gels. The involvement of a number of intermolecular interactions in case of proteins (that are varyingly affected by gel-forming conditions) makes the modeling of gelation quite chal-lenging. The gelation process requires a precise regulation of a number of physi-cal (ie, temperature, pressure) and chemical (ie, pH, ionic strength, enzymes, etc.) parameters to end up in a gel having required physico-chemical properties. Commonly used proteins gels are discussed in the subsequent sections.
13.2.2.1 GelatinGelatins form gel at very low concentration (0.5–1% w/w) which melts at tem-perature between 27 and 34°C. Two types of gels can be obtained from gelatin, that is, physical gels and chemical gels. Physical gel is obtained as a result of transition of coil to triple helices during cooling. Transparent, elastic, and thermos-reversible gels are obtained through this mechanism. Chemical gel is formed as a result of crosslinking between polymer chains. Crosslinking results in stiff gels with improved thermostability.
13.2.2.2 Whey ProteinWhey proteins form irreversible particle gels (upon heating) in which the net-work consists of protein aggregates of sizes between 0.5 and 2 µm associated in the form of strings or clusters. The gelation occurs as a result of a number of transitions including denaturation and unfolding of native structure followed by the strand formation and association of strands into a network.
13.2.2.3 Egg AlbuminEgg albumin can be considered as a system comprising plentiful globular pro-teins in aqueous solution. Gelation of egg albumin takes place in three steps. In first step partial unfolding of molecules takes place on heating resulting in increased intermolecular interactions. Second step involves the sulfydryl disul-fide interchange (resulting in molecular aggregation) and sulfydryl oxidation within and between the aggregates forming a network. In the last step multiple

Food Gels: Gelling Process and New Applications Chapter | 13 341
hydrogen bonding takes place during cooling. Various factors can affect the process of gel formation including pH and presence of salts/sugars and ionic strength.
13.2.2.4 MyosinHeat-induced gelation of myosin is strongly dependent on ionic strength. Low ionic strength favors the formation of filaments giving rise to rigid and translu-cent gels. High ionic strength favors the formation of monomers through depo-lymerization forming the strong and elastic gels.
13.2.2.5 CaseinCasein in milk proteins exists in the form of micelles which have a net nega-tive charge at normal pH. Gelation (irreversible) takes place when micelles are destabilized through acidification which neutralizes the charge and causes casein micelles to aggregate. The aggregated micelles form clusters and chains which associate together to form a three-dimensional network.
13.2.3 Binary, Mixed, or Composite Gels
The gels may be composed of more than one polymer and are termed as binary or mixed gels. The common combinations include polysaccharide–polysaccharide and polysaccharide–protein. A number of polysaccharides show a synergistic gelation behavior when they are used in combinations, that is, the mixture may gel under conditions where the individual components are nongelling (Sandolo et al., 2010). Hence, the presence of more than one polymer creates a more effective three-dimensional network through extended interactions. Such synergistic interactions are attractive commercially (eg, a partial replacement of an expensive polysaccharide with an inexpensive one) and may be used to generate new functionality or to manipulate texture and rheology (Cairns et al., 1987). Depending upon the nature of the components, the rate and extent of polymer demixing, and the mechanism of gelation, the binary mixture of polysaccharides yields various structures. Cairns et al. (1987) proposed four types of basic models that are schematically shown in Fig. 13.2. In its simplest form only one polysaccharide forms the main network whereas other polysaccharides form subnetworks inside the main network (Fig. 13.2a). When both of the polysaccharides jointly form the network (Fig. 13.2b–d), it may result in an interpenetrating network, a phase separated network (as a result of demixing before gelation), or a coupled network (when both polysac-charides bind to the other).
The polysaccharides mentioned in the aforementioned section are good gelling agents and can form gels independently. However, some polysaccha-rides like xanthan gum and locust bean gums (LBGs) are not gelling agents when they are used alone, but they can form good gels when used in com-binations with other polysaccharides (Pedersen, 1980). Some of the examples

342 PART | II Product Specific Studies in Rheology
of this synergistic behavior of nongelling hydrocolloids include xanthan gum with guar gum (Khouryieh et al., 2006), galactomannan (Pinheiro et al., 2011); and LBG with k-carrageenan (Arda et al., 2009), and xanthan gum (Sandolo et al., 2010; Mao and Rwei, 2006). The properties of the final gel depend on the ratio of the two polymers and on the preparation temperature. Fig. 13.2 shows SEM photographs of the two single polymers (LBG and xanthan) and of the two samples prepared at low and high temperatures with a weight ratio of 1:1 of LBG and xanthan gum (Sandolo et al., 2010). The samples consisting of either LBG or xanthan are not gels; however, the mixed samples are gels of varying strengths (as indicated by different textures) depending upon the gel-forming conditions (Fig. 13.3).
Similar to polysaccharide–polysaccharide mixtures, protein–polysaccharide mixtures also show synergistic effects and may result in improved functional properties compared to those of individual polymers. In such complex systems, a range of intermolecular interactions (eg, covalent, electrostatic, hydrogen bonding, hydrophobic, etc.) may occur depending upon the polymer type and physico-chemical properties (eg, pH, ionic strength, temperature, etc.) of the media (Dickinson, 1998). Additionally, the relative concentration of the two polymers is critical for the gelation process and ultimately will determine the
FIGURE 13.2 Types of binary polysaccharide gel-structure. (a) Single polymer network con-taining the second polymer within the gel, (b) interpenetrating networks, (c) phase-separated net-works, (d) coupled network (Cairns et al., 1987).

Food Gels: Gelling Process and New Applications Chapter | 13 343
gel morphology. The addition of polysaccharides into protein matrix enables to achieve a wide range of different microstructures with different functionalities. For example, addition of certain amount of konjac glucomannan into egg white protein increases the hardness, chewiness, and springiness of the gel samples (Hu et al., 2016). It is important to mention that, in order to obtain mixed gels, the protein and polysaccharide should be compatible to each other and are able to optimally interact with each other; otherwise, the system will segregate into two separate phases. Application of pectin in different milk based desserts is a common example of protein–polysaccharide mixed gels. In this case, the intermolecular interactions are of electrostatic nature, and therefore, pH plays a significant role in the extent of interactions and may result in either bridging or depleting flocculation above a certain critical pectin concentration (Ghosh and Bandyopadhyay, 2012). Generally, the protein–polysaccharide mixed gels also act as stabilizers for various food emulsions, for example, as is the case of
FIGURE 13.3 Scanning electron micrograph of surface morphology of freeze-dried samples of LBG, xanthan (top), and LBG/xanthan 1:1 (bottom) prepared at 75 and 25°C (magnification 800×) (Sandolo et al., 2010).

344 PART | II Product Specific Studies in Rheology
different milk based desserts. In such case, the gels may be regarded as compos-ite/filled gels. Apart from fat globules, other examples of fillers include liquid droplets, fibers, gas bubbles, crystallites, or cellular components present in food system (Blanshard and Mitchell, 1988). These filler particles may also contrib-ute to gel microstructure depending upon their type, length scale, and type of interactions with the biopolymer network. A knowledge of these factors can be used to modify properties like gel storage modulus, gelling kinetics, and frac-ture stress to get desired gel texture (Dille et al., 2015).
13.3 RHEOLOGICAL CHARACTERIZATION OF GELS
Rheological characterization of a gel is of great significance that may help to establish a relation between its constituents and structure, and the effect of processing on its structure (Fischer et al., 2009). Moreover, a gel with desired characters can be obtained by manipulating polymer microstructure and sur-rounding media. As a result of recent advances in instrumentation techniques, the modern rheometers are capable of accurately measuring the complex mate-rial’s response to applied stress or strain. The illustration of these equipment is beyond the scope of present chapter. However, knowledge of fundamental rheological concepts is essential to understand the gelling process, and will help to manipulate the gels’ microstructure with desired sensorial attributes.
The viscoelastic nature of gels is due to polymer networks that are cross-linked through different types of reactions. The nature and intensity of polymer crosslinking are related to the gel strength that is characterized by a rheological factor termed as equilibrium modulus. As the polymer crosslinking is preceded, the mean molecular weight of the polymer increases that ultimately results in transition of liquid (sol) into solid (gel). This transition point is termed as gel point that was defined by Flory (1953) as the condition at which a system mani-fests an infinite steady-shear viscosity and zero equilibrium modulus, or simply, the formation of a fine stranded structure that spans the entire volume of reac-tion mixtures (Donato et al., 2011). According to Flory’s classical theory and the percolation theory, in order to form a gel, the crosslinker must have a func-tionality of 3 or greater so it may result in branched gel microstructure.
There are different rheological approaches to identify if a polymer is a gel. In creep testing, a constant stress is applied on the material and the rate of deformation is noted (Anseth et al., 1996; Kavanagh and Ross-Murphy, 1998). In this case, a constant (or equilibrium) deformation is an indicative of a gel (equilibrium modulus) with stronger gels deforming less, and vice versa. As another approach, the swelling behavior of gels (when they are in contact with solvents) make them different from liquids that have tendency to dissolve in sol-vents. The degree of swelling of the gel is related to the gel equilibrium modulus where stiffer gels will swell less than softer gels (Patel et al., 1992). The linear oscillatory rheology provides the most sensitive measure of the critical gel point that subjects the material to a small oscillatory strain (or stress) and resulting

Food Gels: Gelling Process and New Applications Chapter | 13 345
response of the material is measured (Grillet et al., 2012). As the gels display viscoelastic character, the rheology of gels is characterized by two rheological factors: elastic or storage module (G′ ∝ sin(wt)) and viscid or loss module (G″ ∝ cos(wt)). If G′ is bigger than the G″, the elastic characters conquer, and if the G′ is less than the G″, the viscous characters conquer. The whole opposition to distortion is stated in the combined modulus
( )= ′ + ′′∗G G G2 2 1/2
The moduli tell the ratio of the force to the comparative distortion and thus have the breadth of pressure. They often powerfully are contingent on the period of distortion. The phase angle (tan(δ) = G″/G′) shows the relative importance of the liquid-like viscous modulus G″ and the solid-like elastic modulus G′. Here a convenient and widely adopted criterion is that a solution becomes a gel when the value of the storage modulus G′ exceeds that of the loss modulus G″ at some fixed frequency (Dickinson, 2011).
13.3.1 Microrheology of Gels
The rheological concepts described previously give information about bulk or macrorheology of the gel matrix, and therefore, are unable to characterize gels at the length scale of the microstructure. Recently, with an advancement in instrumentation, new techniques are available to understand complex gel struc-tures and dynamics with multiple characteristic length and timescales. This has established the concept of microrheology concerned with how materials store and dissipate mechanical energy as a function of length scale (MacKintosh and Schmidt, 1999). Such information helps the food scientists to elucidate the underlying mechanisms that affect the interactions of the food components and to relate the microstructure of food systems to their macroscopic properties and stability (Moschakis, 2013).
A number of techniques are available to characterize the microrheology, such as particle tracking rheology, diffusing wave spectroscopy, laser particle track-ing (optical tweezers), magnetic tweezers, atomic force microscopy, piezorhe-ometer, quasi-elastic light scattering, among others. The theoretical aspects of these active or passive microrheological techniques are beyond the scope of the present chapter and have been comprehensively described by Waigh (2005). Among these techniques, particle tracking microrheology (also termed as video particle tracking microrheology) is an emerging passive microrheological tech-nique that has been applied to characterize various food gel systems (Cucheval et al., 2009; Moschakis et al., 2006, 2010a, 2010b, 2012). In this case, no exter-nal driving force is applied; the Brownian motion of embedded particles (called tracers) is used to probe local dynamics of soft material (Moschakis, 2013). Three different methods are reported by Caggioni et al. (2007) to incorporate the tracers into the gel microstructure, and the samples may be designated
G∗=G′2+G″21/2

346 PART | II Product Specific Studies in Rheology
accordingly as either hot mixed and quiescently cooled (HM-QC), hot mixed and shear cooled (HM-SC), or cold mixed and shear cooled (CM-SC). The dif-fusive motions of these embedded particles can be recorded simultaneously using either fluorescence or bright field microscopy, while retaining the infor-mation of each of the individual particle trajectories (Apgar et al., 2000; Duits et al., 2009; Lee et al., 2010; Moschakis et al., 2012). This enables the measure-ment of viscoelastic responses in small sample volumes, which are inaccessible to macrorheology and to spatially map structural heterogeneities at a microlevel (Moschakis, 2013).
The calculation of linear viscoelasticity using particle tracking consists of three steps, as depicted in Fig. 13.4 (Waigh, 2005). Particle trajectories are tracked, the mean-square displacement (MSD) as a function of lag time, τ, of these fluctuations (as a result of Brownian motion) are calculated, and the data are then transformed into viscoelastic properties, that is, storage (G′) and loss (G″) moduli, and creep compliance (J). Furthermore, it can also detect the gel point with a minimal disturbance of the incipient gel structure.
The time-averaged mean-squared displacement, 〈∆r2(τ)〉, in the image plane (x,y) is then given by
τ τ τ( ) ( ) ( ) ( ) ( )∆ = + − + + − r x t x t y t y t2 2 2
The calculated 〈∆r2(τ)〉 corresponds to
τ τ πη ττ π
( ) ( )( )
∆ = =∆ = ′
r dD d k T a
r dk T aG
2 2 /6 for a viscous medium
/3 for an elastic medium
2B
2B
∆r2τ=xt+τ−xt2+yt+τ−yt2
∆r2τ=2dDτ=2dkBT/6πηaτ for a vis-cous medium-
∆r2τ=dkBT/3πaG′ for an elas-tic medium
FIGURE 13.4 Particle tracking microrheology enables the linear viscoelasticity of low mod-ulus materials to be extracted from the fluctuation spectrum. (a) Trajectory of the probe particle is measured, (b) the average fluctuation spectrum as a function of time t is calculated, and (c) the linear viscoelasticity as a function of frequency w can then be found. (From Ref. (Waigh, 2005), with permission)

Food Gels: Gelling Process and New Applications Chapter | 13 347
where D is the diffusion coefficient given by the Stokes–Einstein relation,
πη=D k T a/6B
and kB is the Boltzmann’s constant. The obtained 〈∆r2(τ)〉 can be transformed to elastic and viscous moduli as presented in Levine and Lubensky (2000) and Mason and Weitz (1995). Furthermore, the calculated 〈∆r2(τ)〉 can be related to another importance viscoelastic parameter, creep compliance, J(t). It is the time-dependent strain following an applied low stress, and is expressed as (Wirtz, 2009)
τ π( ) ( )= ∆J t r a dk T3 /2B
The creep compliance can also be directly converted to frequency-dependent elastic and viscous moduli without the need for Laplace/inverse-Laplace trans-formations of the experimental data as against the findings of Levine and Lubensky (2000) and Mason and Weitz (1995). The detailed interpretation of particle tracking data can be found in a very comprehensive review on particle tracking microrheology by Moschakis (2013).
13.3.2 Oral Processing and Texture Perception of Gels
The manipulation of food in mouth is termed as oral processing that gener-ates signals to be carried to brain resulting in texture perception and mouthfeel (Stieger and van De Velde, 2013). The texture of a food is not simply how it feels in the mouth (such as rough or smooth, heavy or light, etc.) as it can be explained in a more pronounced way by different technical attributes, such as cutting, firmness, elasticity, extensibility, effort, adhesiveness, and melting rate in the mouth. As the gels are the colloidal dispersions that are normally thick, sticky, and viscous in nature, there may be difficulties in swallowing for the consumer, especially for elderly and those having dysphagia. The latest research has witnessed the importance of perception of texture of food gels during mas-tication and very interesting work has been carried out, for example in Stieger and van De Velde (2013) and Kohyama et al. (2015).
Mastication is the process of chewing the food and involves different types of muscles, like masseter muscles, among others. Superahyoid muscles involve in the movement of the tongue against hard palate and cause the movement of the food at the beginning or the oropharyngeal swallowing of the food. When-ever soft foods like jellies are eaten, suprahyoid muscles are involved with a very less masseter activity, whereas hard viscous and sticky food items or gels cause a greater masseter activity and a very less suprahyoid activity. The activity of these muscles can be assessed by using a technique known as electromyog-raphy (EMG) that is a very useful technique for assessing the involvement of masticatory muscle used for chewing and swallowing different type of foods. Therefore, EMG studies are useful in food texture studies. In one of the studies
D=kBT/6πηa
Jt=∆r2τ3πa/dkBT

348 PART | II Product Specific Studies in Rheology
hydrocolloid gels of five different types were selected and EMG studies were performed using different variables including the number of chews, duration of the chew, number of masseter or suprahyoid action, and duration of masseter and suprahyoid action, etc. (Kohyama et al., 2015). The results showed that the gels that have a higher melting in the mouth needed little effort for chewing, whereas the gels that were firm and slippery needed more effort for chewing. However, collectively it can be explained that gels are the type of food that have high values of EMG variables and masseter activities are significant in all types of gels indicating that gels are always chewed several times before swallow-ing. In addition to EMG, research has been focused on enhancement of sensory perception (Mosca et al., 2010, 2012a,b, 2013, 2014, 2015a,b), and has been reviewed in the next section.
13.4 RHEOLOGICAL BEHAVIORS OF DIFFERENT GUMS
13.4.1 Tamarind Seed Gum in Aqueous Solutions
Tamarind seed gum which is used as seed polysaccharide from Tamarindus indica L. has been analyzed for physicochemical and rheological properties in many studies. The structural analysis shows the presence of sugars such as glucose:xylose:galactose in a molar ratio of 2.61:1.43:1. Capillary viscometry shows an intrinsic viscosity of 4.7 dL g−1 as determined by the Huggins and Kraemer plots and the viscosity average molecular mass was calculated to be 9.18 × 10⁵ g mol−1 using the Mark–Houwink relationship. The steady shear and dynamic viscoelasticity properties of tamarind seed gum in aqueous solu-tions at different concentrations are investigated to be at 20°C as determined by a Haake Rheometer RS75. It showed shear-thinning flow behavior at high shear rate as well as Newtonian region occurred at low shear rate range; how-ever pronounced shear thinning can be observed at higher concentrations. By fitting Cross and Carreau models the value of zero shear viscosity (η0) can be estimated. The specific viscosity at zero shear rate (ηsp0) as plotted against the coil overlap parameter (C[η]) and the slopes of the lines as in the dilute and semidilute regions are found to be ∼2.2 and 4.3, respectively. The value of the critical concentration (C*) is about 4.23/[η]. The mechanical spectra in the lin-ear viscoelastic region of tamarind seed gum solutions show the typical shape for macromolecular solutions. Plots of η versus γ and η*versus w are superim-posable and so obey the Cox–Merz rule (Khounvilay and Sittikijyothin, 2012).
13.4.2 Aqueous Dispersions of Cashew Gum and Gum Arabic: Effect of Concentration and Blending
Rheological properties of cashew gum (CG) and gum arabic (AR), the exudate polysaccharides from Anacardium occidentale L. and Acacia, at different solu-tions (0.4–50% w/v) as studied by different scientists show that the intrinsic

Food Gels: Gelling Process and New Applications Chapter | 13 349
viscosity, [η], of CG in water at 20°C is ≈0.1 dL g−1, whereas that of AR is approximately ≈0.6 dL g−1. However apparent viscosity of the unheated and the heated (at 80°C for 30 min) CG and AR solutions usually show an increase with increase in the concentration. The flow curves of blends with equal viscos-ity solutions of AR/CG: 25/75, 50/50, and 75/25, usually show no major interac-tion. The apparent viscosity (ηa) versus shear rate γ( ) data for both the AR and CG dispersions (4–50% w/v) exhibit shear-thinning characteristics at low shear rates (<about 10 s−1) and Newtonian plateaus at shear rates >100 s−1, and the Sisko model can be used trustfully to determine the ηa versus γ( ) data of all the dispersions.
CG and AR dispersions exhibit shear-thinning non-Newtonian flow behav-ior in concentrations from 4 to 50% w/v. Because of the shear-thinning nature of its dispersions, CG is suitable for application as a thickening agent. There is a progressive increase in the apparent viscosity dependence of concentration for both gums and there is practically no change in the viscosities of the gum solutions after mild heat treatment (80°C for 30 min). Blends of CG and AR solutions of equal viscosity show no major interaction (Mothe and Rao, 1999).
13.4.3 Xanthan Gum
As described by a power-law model, the rheological behavior of xanthan gum is determined at various temperatures (20–100°C) and concentrations (0.3–1.3%), and is found to be most adequate. The effect of temperature on the viscosity fol-lowed an Arrhenius relationship, whereas the effect of concentration followed an exponential relationship as well as in addition to temperature and concentra-tion, the viscosity of xanthan gum is affected by other factors as well. These factors include pH, suspended insoluble solids, soluble ionic substances, etc. (Xuewu et al., 1996).
13.4.4 Galactomannan Aqueous Solutions
The rheological behavior of aqueous galactomannan—tara gum (TG) and LBG—solutions has been studied at 25oC, with help of 1 steady-shear and dynamic oscillatory measurements performed with a controlled stress rheom-eter AR2000 (TA Instruments) which is fitted with cone-and-plate geometry. The intrinsic viscosity of LBG, [h]Z11.03 dL g−1, is lower than those for crude ([h]Z14.96 dL g−1) and purified ([h]Z16.46 dL g−1) TG. The plot of the specific viscosity at zero shear rate versus the coil overlap parameter, C[h], showed the same trend for both galactomannans: a master obtained with a critical concen-tration C** (the upper limit of the semidilute regime) w7.76/[h] and a slope of 4.7 in the concentrated regime. Experimental data in steady shear (flow curves) as correlated with the Cross and Carreau models, described the apparent viscos-ity shear rate data well. In general, the Cross model provided a slightly better fit. In the concentrated regime, it was possible to obtain a master flow curve for
γ˙
γ˙

350 PART | II Product Specific Studies in Rheology
both galactomannans after performing a concentration-dependent shift using the 1 wt.% LBG solution as the reference. Master curves are also obtained, in oscillatory shear, for G0(u) and G00(u) plots, by shifting along the two axes. The vertical and horizontal shift factors are the same for both G0(u) and G00(u) curves. Two mechanical models are used for fitting the experimental data (mechanical spectra): the generalized Maxwell model with four elements and the Friedrich–Braun model. Both of these models correlate the experimental data in a better way. The correlation between dynamic and steady-shear proper-ties (Cox–Merz rule) is satisfactory for the two galactomannans.
The results obtained show that both galactomannans exhibit quite similar rheological properties, in the range of concentrations and shear rates/ frequencies studied. The dependence of the specific viscosity at zero shear rate, hsp0, on the coil overlap parameter, C[h], showed evidence of similar behavior for the two polysaccharides; results supported the random coil-type behavior for both galactomannans. The dependence of the Cross parameters h0 and t on galacto-mannan concentration is described by similar scaling laws for LBG and TG sys-tems. Also, time–concentration superposition holds for their solutions, allowing master curves to be found for both the viscous and linear viscoelastic responses in shear flow. The similar profile has been seen to probably reflect the existence of nonspecific physical entanglements in TG and LBG solutions (Sittikijyothin et al., 2005).
REFERENCES
Anseth, K.S., Bowman, C.N., Brannon-Peppas, L., 1996. Mechanical properties of hydrogels and their experimental determination. Biomaterials 17, 1647–1657.
Apgar, J., Tseng, Y., Fedorov, E., Herwig, M.B., Almo, S.C., Wirtz, D., 2000. Multiple-particle tracking measurements of heterogeneities in solutions of actin filaments and actin bundles. Biophys. J. 79, 1095–1106.
Arda, E., Kara, S., Pekcan, Ö., 2009. Synergistic effect of the locust bean gum on the thermal phase transitions of k-carrageenan gels. Food Hydrocoll. 23, 451–459.
Banerjee, S., Bhattacharya, S., 2011. Food gels: gelling process and new applications. Crit. Rev. Food Sci. Nutr. 52, 334–346.
Blanshard, J.M.V., Mitchell, J.R., 1988. Food Structure: Its Creation and Evaluation. Elsevier Science, Butterworth-Heinemann, UK.
Caggioni, M., Spicer, P.T., Blair, D.L., Lindberg, S.E., Weitz, D.A., 2007. Rheology and microrhe-ology of a microstructured fluid: the gellan gum case. J. Rheol. 51, 851–865.
Cairns, P., Miles, M.J., Morris, V.J., Brownsey, G.J., 1987. X-ray fibre-diffraction studies of synergistic, binary polysaccharide gels. Carbohydr. Res. 160, 411–423.
Cucheval, A.S.B., Vincent, R.R., Hemar, Y., Otter, D., Williams, M.a.K., 2009. Multiple particle tracking investigations of acid milk gels using tracer particles with designed surface chemistries and comparison with diffusing wave spectroscopy studies. Langmuir 25, 11827–11834.
Dickinson, E., 1998. Stability and rheological implications of electrostatic milk protein–polysaccharide interactions. Trends Food Sci. Technol. 9, 347–354.
Dickinson, E., 2011. Food colloids research: historical perspective and outlook. Adv. Colloid Interface Sci. 165, 7–13.

Food Gels: Gelling Process and New Applications Chapter | 13 351
Dille, M.J., Draget, K.I., Hattrem, M.N., 2015. 9 - The effect of filler particles on the texture of food gels. In: Rosenthal, J.C. (Ed.), Modifying Food Texture. Woodhead Publishing, UK.
Donato, L., Kolodziejcyk, E., Rouvet, M., 2011. Mixtures of whey protein microgels and soluble aggregates as building blocks to control rheology and structure of acid induced cold-set gels. Food Hydrocoll. 25, 734–742.
Duits, M.H.G., Li, Y., Vanapalli, S.A., Mugele, F., 2009. Mapping of spatiotemporal heterogeneous particle dynamics in living cells. Phys. Rev. E. 79, 051910.
Einhorn-Stoll, U., Drusch, S., 2015. Methods for investigation of diffusion processes and biopolymer physics in food gels. Curr. Opin. Food Sci. 3, 118–124.
Fischer, P., Pollard, M., Erni, P., Marti, I., Padar, S., 2009. Rheological approaches to food systems. Comp. Rend. Phys. 10, 740–750.
Flory, P.J., 1953. Principles of Polymer Chemistry. Cornell University Press, USA. Foegeding, E.A., Davis, J.P., 2011. Food protein functionality: a comprehensive approach. Food
Hydrocoll. 25, 1853–1864. Ghosh, A.K., Bandyopadhyay, P., 2012. Polysaccharide–Protein Interactions and Their Relevance
in Food Colloids. INTECH Open Access Publisher, India. Grillet, A.M., Wyatt, N.B., Gloe, L.M., 2012. In: Dr. Juan De Vicente (Ed.), Polymer Gel Rheology
and Adhesion, Rheology. InTech, Available from: http://www.intechopen.com/books/rheology/rheology-and-adhesion-of-polymer-gels
Hu, Y., Liang, H., Xu, W., Wang, Y., An, Y., Yan, X., Ye, S., Huang, Q., Liu, J., Li, B., 2016. Synergistic effects of small amounts of konjac glucomannan on functional properties of egg white protein. Food Hydrocoll. 52, 213–220.
KátiaRegina, K., Carolinasiqueirafranco, P., Rosianelopes Da., C., 2012. Food Gels. Biopolymer Engineering in Food Processing. CRC Press, Boca Raton, USA.
Kavanagh, G.M., Ross-Murphy, S.B., 1998. Rheological characterisation of polymer gels. Prog. Polym. Sci. 23, 533–562.
Khounvilay, K., Sittikijyothin, W., 2012. Rheological behaviour of tamarind seed gum in aqueous solutions. Food Hydrocoll. 26, 334–338.
Khouryieh, H.A., Herald, T.J., Aramouni, F., Alavi, S., 2006. Influence of mixing temperature on xanthan conformation and interaction of xanthan–guar gum in dilute aqueous solutions. Food Res. Int. 39, 964–973.
Kohyama, K., Hayakawa, F., Kazami, Y., Ishihara, S., Nakao, S., Funami, T., Nishinari, K., 2015. Electromyographic texture characterization of hydrocolloid gels as model foods with varying mastication and swallowing difficulties. Food Hydrocoll. 43, 146–152.
Lee, M.H., Reich, D.H., Stebe, K.J., Leheny, R.L., 2010. Combined passive and active mi-crorheology study of protein-layer formation at an air−water interface. Langmuir 26, 2650–2658.
Levine, A.J., Lubensky, T.C., 2000. One- and two-particle microrheology. Phys. Rev. Lett. 85, 1774–1777.
MacKintosh, F., Schmidt, C., 1999. Microrheology. Curr. Opin. Colloid Interface Sci. 4, 300–307. Mao, C.-F., Rwei, S.-P., 2006. Cascade analysis of mixed gels of xanthan and locust bean gum.
Polymer 47, 7980–7987. Mason, T.G., Weitz, D.A., 1995. Optical measurements of frequency-dependent linear viscoelastic
moduli of complex fluids. Phys. Rev. Lett. 74, 1250–1253. Morris, V., 2007. Polysaccharides: their role in food microstructure. Understanding and controlling
the microstructure of complex foods. 3-39.Mosca, A.C., Andriot, I., Guichard, E., Salles, C., 2015a. Binding of Na+ ions to proteins: effect on
taste perception. Food Hydrocoll. 51, 33–40.

352 PART | II Product Specific Studies in Rheology
Mosca, A.C., Bult, J.H.F., Stieger, M., 2013. Effect of spatial distribution of tastants on taste inten-sity, fluctuation of taste intensity and consumer preference of (semi-)solid food products. Food Qual. Prefer. 28, 182–187.
Mosca, A.C., Bult, J.H.F., Velde, F.V.D., Van Boekel, M.a.J.S., Stieger, M., 2014. Effect of succes-sive stimuli on sweetness intensity of gels and custards. Food Qual. Prefer. 31, 10–18.
Mosca, A.C., Rocha, J.A., Sala, G., Van De Velde, F., Stieger, M., 2012a. Inhomogeneous distri-bution of fat enhances the perception of fat-related sensory attributes in gelled foods. Food Hydrocoll. 27, 448–455.
Mosca, A.C., Van De Velde, F., Bult, J.H.F., Van Boekel, M.a.J.S., Stieger, M., 2012b. Effect of gel texture and sucrose spatial distribution on sweetness perception. LWT—Food Sci. Technol. 46, 183–188.
Mosca, A.C., Van De Velde, F., Bult, J.H.F., Van Boekel, M.a.J.S., Stieger, M., 2015b. Taste enhancement in food gels: effect of fracture properties on oral breakdown, bolus formation and sweetness intensity. Food Hydrocoll. 43, 794–802.
Mosca, A.C., Velde, F.V.D., Bult, J.H.F., Van Boekel, M.a.J.S., Stieger, M., 2010. Enhancement of sweetness intensity in gels by inhomogeneous distribution of sucrose. Food Qual. Prefer. 21, 837–842.
Moschakis, T., 2013. Microrheology and particle tracking in food gels and emulsions. Curr. Opin. Coll. Interface Sci. 18, 311–323.
Moschakis, T., Lazaridou, A., Biliaderis, C.G., 2012. Using particle tracking to probe the local dy-namics of barley β-glucan solutions upon gelation. J. Colloid Interface Sci. 375, 50–59.
Moschakis, T., Murray, B.S., Biliaderis, C.G., 2010a. Modifications in stability and structure of whey protein-coated o/w emulsions by interacting chitosan and gum arabic mixed dispersions. Food Hydrocoll. 24, 8–17.
Moschakis, T., Murray, B.S., Dickinson, E., 2006. Particle tracking using confocal microscopy to probe the microrheology in a phase-separating emulsion containing nonadsorbing polysaccha-ride. Langmuir 22, 4710–4719.
Moschakis, T., Murray, B.S., Dickinson, E., 2010b. On the kinetics of acid sodium caseinate gelation using particle tracking to probe the microrheology. J. Colloid Interface Sci. 345, 278–285.
Mothe, C., Rao, M., 1999. Rheological behavior of aqueous dispersions of cashew gum and gum arabic: effect of concentration and blending. Food Hydrocoll. 13, 501–506.
Nishinari, K., Zhang, H., 2004. Recent advances in the understanding of heat set gelling polysac-charides. Trends Food Sci. Technol. 15, 305–312.
Nishinari, K., Zhang, H., Ikeda, S., 2000. Hydrocolloid gels of polysaccharides and proteins. Curr. Opin Colloid Interface Sci. 5, 195–201.
Patel, S.K., Malone, S., Cohen, C., Gillmor, J.R., Colby, R.H., 1992. Elastic modulus and equilib-rium swelling of poly (dimethylsiloxane) networks. Macromolecules 25, 5241–5251.
Pedersen, J.K., 1980. Carrageenan, pectin and xanthan/locust bean gum gels. Trends in their food use. Food Chem. 6, 77–88.
Pinheiro, A.C., Bourbon, A.I., Rocha, C., Ribeiro, C., Maia, J.M., Gonçalves, M.P., Teixeira, J.A., Vicente, A.A., 2011. Rheological characterization of k-carrageenan/galactomannan and xanthan/ galactomannan gels: Comparison of galactomannans from non-traditional sources with conventional galactomannans. Carbohydr. Polym. 83, 392–399.
Richter, S., 2007. Recent gelation studies on irreversible and reversible systems with dynamic light scattering and rheology—a concise summary. Macromol. Chem. Phys. 208, 1495–1502.
Ross-Murphy, S.B., 1995. Structure–property relationships in food biopolymer gels and solutions. J. Rheol. 39, 1451–1463.

Food Gels: Gelling Process and New Applications Chapter | 13 353
Sandolo, C., Bulone, D., Mangione, M.R., Margheritelli, S., Di Meo, C., Alhaique, F., Matricardi, P., Coviello, T., 2010. Synergistic interaction of locust bean gum and xanthan investigated by rheology and light scattering. Carbohydr. Polym. 82, 733–741.
Sittikijyothin, W., Torres, D., Gonçalves, M., 2005. Modelling the rheological behaviour of galacto-mannan aqueous solutions. Carbohydr. Polym. 59, 339–350.
Solomon, M.J., Spicer, P.T., 2010. Microstructural regimes of colloidal rod suspensions, gels, and glasses. Soft Matter 6, 1391–1400.
Stieger, M., Van De Velde, F., 2013. Microstructure, texture and oral processing: new ways to reduce sugar and salt in foods. Curr. Opin. Coll. Interface Sci. 18, 334–348.
Verheul, M., Roefs, S.P., De Kruif, K.G., 1998a. Kinetics of heat-induced aggregation of β-lactoglobulin. J. Agric. Food Chem. 46, 896–903.
Verheul, M., Roefs, S.P., Mellema, J., De Kruif, K.G., 1998b. Power law behavior of structural properties of protein gels. Langmuir 14, 2263–2268.
Vilgis, T.A., 2015. Gels: model systems for soft matter food physics. Curr. Opin Food Sci. 3, 71–84. Waigh, T.A., 2005. Microrheology of complex fluids. Rep. Prog. Phys. 68, 685. Wijayanti, H.B., Bansal, N., Deeth, H.C., 2014. Stability of whey proteins during thermal process-
ing: a review. Compr. Rev. Food Sci. Food Saf. 13, 1235–1251. Wirtz, D., 2009. Particle-tracking microrheology of living cells: principles and applications. Ann.
Rev. Biophys. 38, 301–326. Xuewu, Z., Xin, L., Dexiang, G., Wei, Z., Tong, X., Yonghong, M., 1996. Rheological models for
xanthan gum. J. Food Eng. 27, 203–209.

355Advances in Food Rheology and Its Applications. http://dx.doi.org/10.1016/B978-0-08-100431-9.00014-0Copyright © 2017 Elsevier Ltd. All rights reserved.
Chapter 14
Influence of Sugar Substitute in Rheology of Fruit Gel
S. Basu, U.S. Shivhare, P. ChakrabortyDr. S.S. Bhatnagar University, Institute of Chemical Engineering & Technology, Panjab University, Chandigarh, Panjab, India
14.1 INTRODUCTION
Rheology is the study of the deformation and flow behavior of matter (Steffe, 1996; Rao, 2007). Rheological properties are considered to be impor-tant not only in design of food processing equipment and handling systems such as piping system, pumps, evaporators, heat exchangers, sterilizers, and mixers, but also in product development and quality control of foods (Saravacos, 1970; Rao, 1977, 1987; Kokini and Plutchok, 1987). Understanding and precise con-trol of rheological behavior during the manufacturing and storage of food prod-uct has a major impact on its quality.
Fruit gels are manufactured by boiling fruit pulp in the presence of sugar, acid, and pectin. Most common fruit gels are jam, jelly, marmalade, and leathers pre-pared from various fruits. Jellies, jams, preserves, and marmalades are primarily distinguished by the form in which the fruit component is incorporated. In jellies, only strained fruit juice is used, whereas jams are made with crushed or ground fruit material. Preserves are manufactured with whole fruit (if sufficiently small) or large pieces of fruit (Ahmed, 1981). Marmalades are basically clear jellies in which slices or shreds of (usually) citrus peel are suspended. Regardless of their form, all types of fruit gels are sugar–acid–pectin gels. Their structure, appear-ance, and mouthfeel result from a complex interaction between pectin level and functionality, acidity, sugar type, and amount and setting temperature whereas cal-cium content controls the gel made from low-methoxyl pectin (Baker et al., 2005).
Rheological understanding of fruit gel–based products is gaining interest presently, due to their increasing importance in the modern day diet focusing on wellness and lower calorific intake. The dietary awareness of consumers has resulted in the reduction of the sugar content of commercially prepared foods and its replacement by alternative sweeteners. The advent of a large number

356 PART | II Product Specific Studies in Rheology
of new sweeteners over the past three decades has also led to the development of various new sugar free products focusing on people with diabetics and spe-cial needs (Sandrou and Arvanitoyannis, 2000; Nabors, 2001). Sucrose is the primary sweetener used for manufacturing fruit gel–based items (jam, jelly, marmalade, fruit leather, etc.). It is technologically feasible to manufacture low calorie fruit gel–based products by partial or full replacement of sucrose with other carbohydrate-based or noncarbohydrate-based sweeteners (fructose, high fructose syrup, xylitol, sorbitol, aspartame, acesulfame-K, cyclamate, stevio-side, sucralose, or combinations of these) (Hyvönen and Törmä, 1983). There-fore, manufacturing products with low sugar concentrations in the fruit gel is a challenge for the food technologist to make a product comparable to the sugar-based product in terms of textural and rheological profiles.
14.2 FOOD GELS
Food gels are basically assorted complex systems of multiple components hav-ing solid-like properties (Fig. 14.1). They typically contain dispersed particles and macromolecules in considerable amounts of an aqueous phase (>80%) and undergo liquid–solid transition (Dickinson, 1992; Nishinari et al., 2000; Renard et al., 2006; Hermansson, 2007). Gel-like structures are omnipresent among most high-moisture processed foods like jam, jellies, yogurt, processed meats, etc. Food gels usually consist of a large range of ingredients, including
FIGURE 14.1 Classification of gelation mechanism and relevant examples. (Adapted from Gulrez et al., 2011)

Influence of Sugar Substitute in Rheology of Fruit Gel Chapter | 14 357
solubilized material, accumulated particles, dispersed throughout the final prod-uct due to which it exhibits a great diversity of rheological characteristics. Food gels can behave like viscoelastic materials exhibiting both a viscous and an elastic nature (eg, salad dressings, cream), or plastic materials (eg, butter, mar-garine) (Dille et al., 2015). This diversity of the food gel comes from the out-come of the organization and rearrangements of the food constituents—mainly polysaccharides, proteins, and lipids during processing and storage.
Flory (1953) defined gel as a soft, solid, or solid-like material of two or more components, one of which is a liquid present in substantial quantity. It is com-posed of crosslinked polymeric molecules to form tangled interconnected net-works immersed in liquid medium. At the molecular level, gelation is the process which imparts stress resisting bulk character (solid properties) due to continuous framework of networks of polymer chains that extends throughout the gel phase. Flory (1974) later proposed a classification of gels based on structural criteria:
1. well-ordered lamellar structures, including gel mesophases;2. covalent polymeric networks; completely disordered;3. polymer networks formed through physical aggregation; predominantly dis-
ordered, but with regions of local order; and,4. particulate, disordered structures.
Most food biopolymers form physical gels, structured by weak hydrogen-, hydrophobic- and electrostatic-interactions (Clark and Ross-Murphy, 1987; Ross-Murphy, 1995a,b; Rao, 2003). Gelling of food biopolymers is divided into “cold setting” and “heat setting,” based on the gelation mechanism. In the for-mer, gelation is induced by cooling (agarose, carrageenans, pectin, whey pro-tein, etc.) whereas in the latter, gelation occurs due to heating (bovine serum albumin, myosin, etc.).
Almdal et al. (1993) further refined definition of the solid-like character-istics of gels in terms of the dynamic mechanical properties, namely a storage modulus G′(w), exhibiting a pronounced plateau extending to times at least of the order of seconds, and a loss modulus G0(w), which is considerably smaller than the storage modulus in the plateau region. Food gels in terms of mechanical viscoelastic characteristics can again be classified into two types: strong- and weak gels. Both strong- and weak gels behave as solids at small deformations. However, strong gels behave as solids, whereas the weak gels are structured fluids at large deformations.
Ross-Murphy (2005) reviewed the structure/property relationships for bio-polymer (including food biopolymer) solutions and gels. He described how small deformation oscillatory measurements enable distinction between “strong” and “weak” gels, applicable for the food thickeners, gels, and stabilizers. At small strains, both strong and weak gel systems exhibit essentially the same mechanical spectrum, with G′ > G0, and with both moduli largely independent of frequency. However, the deformation dependence of these two classes of materials is differ-ent. At large deformations, strong gels rupture and fail, whereas weak gels flow

358 PART | II Product Specific Studies in Rheology
without fracture and show recovery of solid (gel-like) character (Clark and Ross-Murphy, 1987). In a weak gel, the dynamic modulus is frequency dependent, sug-gesting the occurrence of relaxation process even at small time scales and lower difference in values between G′ and G0. Several researchers have identified weak gel–like behavior of food biopolymer gels and solutions ( Doublier et al., 1992; Ross-Murphy, 1995a,b; Mleko and Foegeding, 2000; Ikeda and Nishinari, 2001; Löfgren et al., 2002). A promising and new approach of describing foods as a weak gel is found in recent studies (Rao and Cooley, 1992; Tunick, 2000; Gabriele et al., 2001; Ng and McKinley, 2008; Basu et al., 2011).
From processing to consumption of food, food gels are exposed to a number of deformations that may cause irreversible deformation of the food or fracture failure. Traditionally “gel strength” has been measured to characterize gel systems based on rupture tests, but it cannot represent the overall mechanical behavior of gels. Therefore food gels are characterized by various rheological tests like steady state rheology, time dependence, small angle oscillatory shear (SAOS) rheology, or large angle oscillatory shear (LAOS). Several types of rheological testing pro-cedures are used to evaluate the food gels at different temperature conditions to understand food gels mechanical behavior, fracture, and deformation behavior.
14.2.1 Fruit Gels
Fruit gels are made by boiling fruit pulp or juice with sugar and pectin at suit-able concentration levels. Pectin acts as a gelling agent in the manufacture of different fruit gel type food products (jam, jelly, marmalade). Pectins are a class of complex polysaccharides. Pectin consists of chains of 300–1000 galact-uronic acid units, joined with α-1→4 linkages partially esterified with metha-nol, and interrupted by (1→2) linked α-d-rhamnopyranosyl residues (Thakur et al., 1997). The structure is stabilized by steric factors with a possible contri-bution from intramolecular hydrogen bonding (Oakenfull, 1991). Some of the galacturonic acid units in the pectin molecule are esterified and are present as the galacturonic acid methyl ester (Fig. 14.2).
FIGURE 14.2 Representation of different substituents potentially present in commercial pectins (respectively, methyl-ester, amide group, and acetyl group).

Influence of Sugar Substitute in Rheology of Fruit Gel Chapter | 14 359
Pectin is characterized on the basis of jellying power, degree of methoxyl-ation/esterification, and rate of solidification of the jellies. Based on the degree of methoxylation/esterification, it is classified as low methoxyl (LM) pectin and high methoxyl (HM) pectin. Degree of esterification (DE) of the pectin mol-ecule is defined as the ratio of esterified galacturonic acid units to total galact-uronic acid units in the molecule. The DE of HM- and LM pectins are 50% and above, and below 50%, respectively. Depending on the pectin type, coordinate bonding with Ca2+ ions or hydrogen bonding and hydrophobic interactions are varied in gel formation (Figs. 14.3 and 14.4).
In LM pectin, gelation results from ionic linkages via calcium bridges between two carboxyl groups belonging to two different chains in close contact with each other (Fig. 14.3) (Oakenfull and Scott, 1984; Cardoso et al., 2003). The affinity of pectin chains toward calcium increases with decreasing DE or ionic strength, and with increasing polymer concentration (Kohn, 1987; Garnier et al., 1994). Besides the influence of the charge density of the polygalacturo-nate chain, the distribution pattern of free and esterified carboxyl groups has also an important effect on the strength of calcium binding (Powell et al., 1982). In HM pectin, the crosslinking of pectin molecules involves a combination of hydrogen bonds and hydrophobic interactions between the molecules (Fig. 14.4) ( Morris, 1986; Lopes da Silva et al., 1992). Physical characteristics of the gel are the consequence of the formation of a continuous three-dimensional net-work of crosslinked pectin molecules.
FIGURE 14.3 Low methoxyl pectin gelation mechanism in the presence of calcium ions. (Adapted from Hoefler, 2003)

360 PART | II Product Specific Studies in Rheology
14.3 FRUIT GEL RHEOLOGY
Flow behavior of fruit gels containing high or moderate levels of sugars and/or very small amount of gelling agent have been widely studied (Saravacos, 1970; Mizrahi and Firstenberg, 1975; Carbonell et al., 1991a,b; Costell et al., 1993; Raphaelides et al., 1996; Basu et al., 2007; Basu and Shivhare, 2010). Major-ity of the studies on fruit gels (jam, jelly, marmalade, or preserve) investigated effects of formulation and temperature on steady state- and time dependent- rheological behavior. Studies on rheology of fruit jam are rather limited ( Carbonell et al., 1991a,b; Costell et al., 1993; Grigelmo-Miguel and Martin-Belloso, 2000; Gabriele et al., 2001; Álvarez et al., 2006; Basu et al., 2007). It has been established that the rheological properties of jam are mainly affected by the amount and type of sugar added, proportion and kind of gelling agent used, fruit pulp content, and process temperature (Abdullah and Cheng, 2001; Gajar and Badrie, 2001; Acosta et al., 2008). Systematic studies on rheological behav-ior during gelation and molecular level understanding of gelation mechanism in fruit jam are lacking (Basu and Shivhare, 2010, 2013; Basu et al., 2013).
For fruit gels, it is important to understand the relationships between the fruit gel texture and product structure (Renard et al., 2006). Rheological properties are useful in defining functionality of ingredients in quality con-trol, and correlation of food texture to sensory attributes (Saravacos, 1970; Kokini and Plutchok, 1987; Dervisi et al., 2001). Mechanical measurements (textural and rheological) in combination with sensory analysis could repre-sent the fruit gel quality more accurately. Rheological behavior of jam and
FIGURE 14.4 High methoxyl pectin gelation mechanism. (Adapted from Hoefler, 2003)

Influence of Sugar Substitute in Rheology of Fruit Gel Chapter | 14 361
with varying sugar contents has been widely studied (Carbonell et al., 1991a,b; Gabriele et al., 2001; Álvarez et al., 2006; Basu and Shivhare, 2010, 2013; Basu et al., 2013). However, little scientific information is available in the literature on variation of rheological and textural properties and microstructure of fruit jam with ingredients composition.
Scientific literature on textural properties of jams (Suutarinen et al., 2002; Singh et al., 2009; Basu et al., 2011), marmalade (Moghaddam et al., 2009), and jellies (Moritaka et al., 1999; Khouryieh et al., 2005; Royer et al., 2006) are available. Some researchers have also studied the flow behavior of these prod-ucts (Costell et al., 1993; Miguel et al., 1999; Yildiz and Alpaslan, 2012). The studies on these structured products lead to the possibility of establishing quality control methods for fruit-derived products, based on their viscometric proper-ties (Fugel et al., 2005). Some researchers have studied the viscoelastic proper-ties of jams (Dervisi et al., 2001; Gabriele et al., 2001; Basu et al., 2011, 2013; Basu and Shivhare, 2013).
14.3.1 Steady State Rheology
Steady state relationship between shear stress–shear rate of food materials is expressed in terms of power-law model or Herschel–Bulkey model. Herschel–Bulkley model is used for fruit gels with yield stress. Yield stress fluids behave like a solid until a minimum stress, known as yield stress, is overcome for beginning of the flow of the material.
τ γ= KPower-law model: n (14.1)
τ τ γ− = + KHerschel Bulkley model: no (14.2)
where τ is the shear stress (Pa); τo is the yield stress (Pa); γ is the shear rate (s–1); K is the consistency index (Pa.sn); and n is the flow behavior index (dimensionless) signifying the extent of deviation from Newtonian behavior.
Dependence of the flow behavior of fruit gels on temperature can be described by the Arrhenius relationship (Saravacos, 1970; Rao, 1986; Steffe, 1996):
=K A E RTexp( / )K K (14.3)
where AK is the frequency factor (Pa.sn); EK represents activation energy (kJ/mol); R is the gas law constant (R = 8.314 J/mol.K); and T is the absolute temperature (K).
Carbonell et al. (1991a) studied rheological characteristics of apricot, peach, plum, and strawberry fruit jams and found that flow behavior was adequately described by the Herschel–Bulkley model. Flow behavior of sheared jam was time dependent, and could be quantified by the Weltman model.
Costell et al. (1993) studied the effect of formulation factors on Casson yield values measured at low ( γ 01)- and medium ( γ 02)-shear rates in previously
Power-law model: τ=Kγ˙n
Herschel−Bulkley mod-el: τ=τo+Kγ˙nγ˙
K=AKexp(EK/RT)
γ˙01γ˙02

362 PART | II Product Specific Studies in Rheology
sheared strawberry and peach jams. Twenty three samples of each fruit jam were prepared according to a second-order composite rotatable design. Com-position ranges were as follows: fruit content 25–55%; soluble solids content 60–70oBrix; and pectin 0.3–0.7% in strawberry jams and 0.1–0.5% in peach jams. Variation of γ 01 in strawberry jams depended mainly on the interactions between fruit and soluble solids and between fruit and pectin, whereas in peach jams, it depended on fruit-soluble solids and soluble solids–pectin interactions. Variation of γ 02 with composition was similar to that observed for γ 01 in both strawberry and peach jams.
Álvarez et al. (2006) studied the rheological behavior of selected jams at 20–40oC in a rotational viscometer. The rheograms were fitted with power-law, Carreau, Carreau–Yasuda, Herschel–Bulkley, and Cross models and it was found that all the models explained rheological behavior of jam. It was observed that the jams exhibited pseudoplastic behavior and that the suspended solids influenced the consistency index as depicted in Fig. 14.5a,b.
14.3.2 Thixotropy/Time Dependent Behavior
Many food products are thixotropic in nature and are characterized by decreas-ing shear stress/ viscosity with shearing time (Holdsworth, 1993; Barnes, 1997). Recovery of stress occurs for some food products under rest. Thixotropy results due to structural reorganization with time of shearing and coupled with reduced resistance to flow. Commonly used method to characterize thixotropy is to apply a constant shear rate at a particular temperature and study the variation of shear stress/viscosity with time. Time-dependent rheological models for food materials have been developed by several researchers (Weltman, 1943; Hahn et al., 1959; Tiu and Boger, 1974; Figoni and Shoemaker, 1981; De Kee et al., 1983; Baravian et al., 1996).
γ˙01
γ˙02γ˙01
FIGURE 14.5 a Shear stress versus shear rate for fruits jam at all temperatures: 20°C (), 25°C (), 30°C (), 35°C (), and 40°C (); b. Shear stress versus shear rate for fruits jams at 30°C: prune (), apricot (∆), strawberry (), fruits (), peach (), and raspberry (). (Adapted from Álvarez et al., 2006)

Influence of Sugar Substitute in Rheology of Fruit Gel Chapter | 14 363
14.3.2.1 Weltman ModelWeltman model (1943) is expressed as
τ = −A B tln (14.4)
where τ is the shear stress (Pa) at any given time of shearing (t). The param-eter A represents the initial stress whereas B is the time coefficient of structure breakdown.
14.3.2.2 Hahn ModelHahn et al. (1959) evaluated the Weltman model and found plots of τ versus ln t for the mineral oil to be sigmoidal but not linear. They argued on theoreti-cal basis that stress decay of thixotropic substances follows the first-order type relationship,
τ τ− = −P atlog( )e (14.5)
where τe is the equilibrium shear stress value which is reached after a long shearing time; P represents initial shear stress; and a indicates rate of structural breakdown for the sample.
14.3.2.3 Figoni and Shoemaker ModelFigoni and Shoemaker (1983) proposed the thixotropic model based on their work on transient rheology of mayonnaise.
τ τ τ τ= + − −kt( )exp( )e max e (14.6)
where τmax is the initial shear stress; (τmax − τe) represents the quantity of break-down structure for shearing; and k is a kinetic constant of structural breakdown.
14.3.2.4 Structural Kinetic ModelTime-dependent flow behavior of the food materials is also modeled using the structural kinetic approach, which has been successfully employed by several researchers (Nguyen et al., 1998; Abu-Jdayil, 2003) This model postulates that the change in the rheological properties is associated with shear-induced breakdown of the internal fluid structure in the food. Using the analogy with chemical reactions, the structural breakdown process may be expressed as
→(Structured) (Non-Structured)
The rate of breakdown of the structure during shear depends on the kinet-ics of the aforementioned reaction. Based on the experimental results from the transient measurements at constant shear rates, and from the step change in shear rate measurements it may be assumed that the thixotropic structure in food breaks down irreversibly without significant buildup.
τ=A−Blnt
log(τ−τe)=P−at
τ=τe+(τmax−τe)exp(−kt)
(Structured)→(Non-Structured)

364 PART | II Product Specific Studies in Rheology
Let γΨ = Ψ t( , ) be a dimensionless parameter representing the structured state at any time t and under an applied shear rate γ . The rate of structural break-down may be expressed as
−Ψ
= Ψ − Ψαd
dtk( )m
(14.7)
where γ=k k( ) is the rate constant; α is the function of shear rate ( γ ); and m is the order of the breakdown “reaction.” Initially, at the fully structured state, t = 0: Ψ = Ψo; and, at steady state, t = 0: Ψ = Ψα. At a constant applied shear rate, integration of Eq. 14.7 from initial time (t = 0) to a time (t) yields
Ψ − Ψ = − + Ψ − Ψα α− −m kt( ) ( 1) ( )m m1
o1
(14.8)
To apply Eq. 14.8 to the experimental transient viscosity data, a relationship between Ψ and measurable rheological quantities needs to be specified. Ψ may be defined in terms of the apparent viscosity (η) as
γ η ηη η
Ψ =−−
α
αt( , )
o (14.9)
where ηo is the initial apparent viscosity at t = 0 (structured state); η is the apparent viscosity at time t; and ηα is the final or equilibrium apparent viscos-ity at t →α (equilibrium structured state). Both ηo and ηα are functions of the applied shear rate only.
Substituting Eq. 14.9 into Eq. 14.8 we obtain, for a fixed shear rate:
η η η η− = − + −α α− −m kt( ) ( 1) ( )m m1
o1
(14.10)
The form of Eq. 14.10 allows a simple way for testing the validity of the model and determination of the model parameters m and k. Eq. 14.10 is valid only under the constant shear rate condition (Nguyen et al., 1998).
Time-dependent rheology of fruit pulps has been investigated by several researchers (Mizrahi, 1979; Lozano and Ibarz, 1994; Ramos and Ibarz, 1998; Krokida et al., 2001). Thixotropic characteristics of mango pulp have been studied by Bhattacharya (1999), while several researchers have studied the thixotropic characteristics of fruit jam (Carbonell et al., 1991a,b; Basu et al., 2007; Basu and Shivhare, 2010, 2013). The time required to restructure a fruit gel product like jam is of the order of hours-days and cannot be tested reliably in the currently available instrument setups due to the drying effects. Therefore, restructuring is likely to occur during storage rather than during processing.
Carbonell et al. (1991b) investigated the influence of fruit content (25–55%), soluble solids content (40–70oBrix), and added pectin (0.3–0.7% in strawberry jams and 0.1–0.5% in peach jams) on time-dependent parameters in previously sheared jams. Twenty three samples of each fruit jam were prepared. Weltman
Ψ=Ψ(γ˙,t)γ˙
−dΨdt=k(Ψ−Ψα)m
k=k(γ˙)γ˙
(Ψ−Ψα)1−m=(m−1)kt+(Ψo−Ψα)1−m
Ψ(γ˙,t)=η−ηαηo−ηα
(η−ηα)1−m=(m−1)kt+(ηo−ηα)1−m

Influence of Sugar Substitute in Rheology of Fruit Gel Chapter | 14 365
A values depended mainly on fruit content and on its interaction with soluble solids and added pectin for both fruit jams. Weltman B values depended on the three variables and on fruit–pectin interaction for strawberry jam, whereas for peach jam samples B values depended also on fruit-soluble solids interaction. Predictive power of time-dependent parameters for estimation of fruit content was low, but considering them in conjunction with soluble solids content and total pectin values explained 91.7% of the variability of fruit content in straw-berry jam samples and 83.7% of same in peach jam samples.
Basu et al. (2007) studied the effect of sugar and pectin concentration, pH, shear rate, and temperature on time-dependent rheological properties of pineap-ple jam. Thixotropic behavior of pineapple jam was influenced by the shear rate employed, temperature, and composition. Hahn model described adequately the time-dependent flow properties of pineapple jam (Fig. 14.6).
14.3.3 Dynamic Rheology
Dynamic rheological studies on fruit gel are rather limited (Gabriele et al., 2001; Basu et al. 2011; Peinado et al., 2012). Many foods particularly fruit gels can be considered as viscoelastic gels, characterized by a three-dimensional network where weak interactions (hydrogen bonding or Van der Waals interactions) ensure the stability of the structure. This type of approach, called weak gel model, was found suitable for gelled food systems like fruit jam. This model provides a direct link between the microstructure of the material and its rheological properties. The most important parameter introduced is the “coordination number”, z, which is the number of flow units interacting with each other to give the observed flow response.
FIGURE 14.6 Shear stress–time relationship for pineapple jam (68.5°Brix) at particu-lar temperatures for constant shear rate = 50/s (pH-3.0, pectin-1%, and sugar concentra-tion-60%). (Adapted from Basu et al., 2007)

366 PART | II Product Specific Studies in Rheology
Above the Newtonian region, there exists a regime characterized by the following flow equation:
= ′ + ′′ =G G w G w Aw( ) ( ) z* 2 2 1/ (14.11)
where A is a constant which can be interpreted as the “interaction strength” between the flow rheological units. Material functions of food system in the lin-ear viscoelastic regime can be well described by only two parameters (A and z).
Several empirical relations have been proposed to relate the viscometric func-tions to linear viscoelastic properties. The Cox–Merz rule is one such relation:
η η γ γ= =w w( ) ( ) for* (14.12)
The Cox–Merz rule is a simple relationship that predicts that the complex viscosity η w( )* and steady shear viscosity η γ( ) are equivalent when the angu-lar frequency (w) is equal to the steady shear rate ( γ ).
Compared to synthetic polymers, rheological behavior of food materi-als may deviate from Cox–Merz relation to a larger extent. However, in many cases, it has been found that the foods follow the same general behavior when a shift factor, A, is introduced (Bistany and Kokini, 1983; Yoon et al., 2004):
η η γ= γ=w A( ) ( ) w*
(14.13)
Basu et al. (2011) demonstrated that mango jam did not follow Cox–Merz rule but followed the modified Cox–Merz rule in the low shear rate and fre-quency region.
Sagdic et al. (2015) studied viscoelastic properties of rosehip marmalade by SAOS measurements. The G′ (storage modulus) values were found to be higher than G0 (loss modulus) values in different temperatures. This behavior indicated that the rose hip marmalade had a weak gel–like structure with solid-like behavior. Storage and loss modulus, and η* (complex viscosity) values decreased with increase in temperature level. Modified Cox–Merz rule was found to be satisfactory to correlate apparent and complex viscosity values of the rose hip marmalade at all temperatures studied.
Basu et al. (2011) studied the gelation process with increasing total solu-ble solids (TSS) upon boiling pulp–pectin–sugar–acid mix during production of mango jam. The gel became more elastic solid–like material than a flow-able liquid mix with increasing TSS. Within the linear viscoelastic region, the frequency dispersions of storage (G′)- and loss (G0)-moduli of mango jam (pH = 3.4, pectin concentration = 1%) with selected sugar concentrations (60%) at different TSS at 30°C were approximately straight lines with different slopes (Fig. 14.7). The dependence of G′ and G0 on frequency (w) was adequately described by the power-law function.
The gelation process during jam manufacturing is attributed to alignment and stretching of the pectin polymer chains in sucrose and fruit pulp mix,
G*=G′(w)2+G0(w)2=Aw1/z
η*(w)=η(γ˙) for w=γ
η*(w)
η(γ˙)γ˙
η*(w)=η(Aγ˙)

Influence of Sugar Substitute in Rheology of Fruit Gel Chapter | 14 367
resulting in more sites that become available for the formation of intermolecu-lar hydrogen bonding. In this process, the polymeric pectin chains hydrogen bond to each other to form an interconnected three-dimensional gel network. Sucrose molecules are held within these three-dimensional structures of pectin gel network. As a result, a stronger elastic characteristic developed with increas-ing TSS (gelation process) in fruit jam (Fig. 14.7).
Basu et al. (2011) studied the frequency dependence of storage and loss moduli of mango jam at selected sucrose levels (Fig. 14.8). The storage and loss moduli increased with sucrose concentration up to 60%, but decreased thereaf-ter. Pectin forms a network of fibrils with water, and sucrose acts as a dehydrat-ing agent in fruit jam which disturbs the equilibrium existing between water and pectin. The barrier to self-association of pectin chains into gel junctions is inter-molecular electrostatic repulsion between charged carboxyl groups in pectin, and polymeric pectin–water interactions acting in competition with polymer–polymer interactions (Evageliou et al., 2000b). Progressive increase in sucrose concentration partially reduces the water available in pectin–sucrose–acid mix and thus reduces the chance of formation of hydrogen bonds and possible asso-ciation of water with polymeric pectin chain (Evageliou et al., 2000a,b; Bayarri et al., 2004). Sucrose provides additional hydroxyl groups to stabilize the struc-ture of junction zones and promote hydrogen bonds to immobilize free water (Nishinari et al., 1990). However, this phenomenon took place up to a certain level of sucrose concentration (up to 60%). Higher sucrose concentrations (65 and 70%), however, weakened the pectin gel network. It appears, therefore, that limited availability of water and enhanced hydrogen bonding between the polyhydric sucrose and remaining watermolecules destabilized the rigid pectin
FIGURE 14.7 Variation of storage and loss moduli of sugar jam (pH = 3.4, sugar concentra-tion = 60%, pectin concentration = 1%, temperature = 30oC) with frequency at selected TSS. (Adapted from Basu et al., 2011)

368 PART | II Product Specific Studies in Rheology
gel network above a sucrose concentration of 60%. As the amount of sugar increased above 60%, more amount of water was released in jam thereby ren-dering it softer.
14.4 EFFECT OF SUGAR SUBSTITUTES IN FRUIT GEL RHEOLOGY
Reduced calorie products are gaining importance in the food industry worldwide due to considerable awareness of the consumers for the reduced intake of fat and calorie in diet (Sandrou and Arvanitoyannis, 2000). Technological problems are being faced while replacing sugar in processed food systems, since sugar has multiple other functions apart from imparting the desired sweet taste (Sandrou and Arvanitoyannis, 2000). In fact, health conscious consumers and especially those suffering from diabetes demand reduced or no-sugar added products or substitution of high calorific sweeteners with low calorific sweeteners. Low calorie food products of good quality can be made by incorporating combina-tions of noncaloric and carbohydrate sweeteners (Nabors, 2001). Sucrose can be replaced by other sugars such as fructose and/or isomaltulose or alternative sweeteners (aspartame, acesulfame-K, sorbitol, maltitol, sucralose, stevioside, etc.). Alternative sweeteners (xylitol, sorbitol, aspartame, acesulfame-K, cycla-mate, stevioside, sucralose, or combinations of these) can be used for partial or full replacement of sucrose to prepare fruit gels with lower amounts of sucrose (Hyvönen and Törmä, 1983). Stevioside and sucralose are nonnutritive high intensity sweeteners, acid- and heat-stable, and can be used for low calorie jam preparation (partial sucrose substitution) without compromising taste (Basu et al., 2013).
FIGURE 14.8 Frequency sweep of mango jam samples (pH = 3.4, pectin concentration = 1%) at 30oC. (Adapted from Basu et al., 2011)

Influence of Sugar Substitute in Rheology of Fruit Gel Chapter | 14 369
Peinado et al. (2012) showed full replacement of sucrose with healthier sug-ars such as fructose and/or isomaltulose is possible in spreadable strawberry products. These products formulated with different types of sugars (sucrose, isomaltulose, sucrose–glucose, and fructose–isomaltulose) were rheologically analyzed. Static tests characterized them as Herschel–Bulkley fluids. The val-ues of the consistency index (K) and yield stress were influenced by the type of sugar, the elaboration method, and the pectin levels, whereas the flow behavior index (n) was not affected by sugar type, but by the elaboration method and the pectin level. The dynamic tests permitted classification of some of the products as weak gels. The strength of the network “A” increased with the pectin level, whereas the “coordination number” (z) did not show a clear trend depending on the different process variables.
Systematic studies on low calorie fruit jam development by different alter-native sweeteners are done by our group (Basu et al., 2011, 2013; Basu and Shivhare, 2013). The group systematically worked on partial and full substi-tution of sucrose to develop low calorie mango jam with selected sweeteners (sorbitol, stevioside, sucralose). The rheological and textural parameters of the fruit jam were systematically studied and related to product sensory attributes. Effect of various levels of sorbitol substitutions (0–100% sorbitol) on rheologi-cal behavior of jam (pH = 3.4, pectin concentration = 1%) is shown in Fig. 14.9 (Basu and Shivhare, 2013). Shear stress value at a given shear rate decreased when sugar was replaced with sorbitol. That is, incorporation of sorbitol, either partially or completely, resulted in softer texture of jam.
Yield stress influences the spreadability of mango jam and is an additional parameter for quality control. Spreadability is a measure of how easily and uni-formly jam can be deformed and spread at end-use temperatures. Consequently,
FIGURE 14.9 Effect of sorbitol substitution in 70% sugar jam (pH = 3.4, pectin concentra-tion = 1%) on rheological behavior at 20oC. (Adapted from Basu and Shivhare, 2013)

370 PART | II Product Specific Studies in Rheology
while low yield stress in jam sample indicates high spreadability, the ability to resist deformation at low strains can result in poor spread uniformity. Moder-ate level of yield stress is therefore required for jam to exhibit both elastic and viscous behavior, that is, an ideal soft solid–like character.
Daubert et al. (1998) suggested that spreadability should not only be related to yield stress alone but also to the yield strain. Material strain at the yield point provides information on how much deformation a sample can withstand prior to flowing. A mango jam sample might have a low yield stress but may be able to withstand large degree of deformation prior to yielding; thus, making it difficult to achieve uniform, smooth distribution upon application. The yield stress behavior of partially- or fully substituted sorbitol jam samples (pH = 3.4, pectin concentration = 1%) at 65% sucrose concentration level during gela-tion is shown in Fig. 14.10. The yield stress values decreased substantially with increasing amounts of sorbitol. This is due to enhanced hydrogen bonding effect of polyhydroxy sorbitol with water which competes with the pectin–water interactions present in the pectin–pulp–sorbitol mix. The hydrogen bonding of sorbitol with water was more pronounced than sucrose and the remaining water destabilized and weakened the pectin gel network (Bayarri et al., 2004). Sorbitol, therefore, formed a weak gel compared to sucrose and the water was present in more free form in the final product compared to normal jam prepared with sucrose under the similar processing condition. Hardness decreased with increasing sorbitol concentration because of weaker junction zones in pectin gel network.
FTIR spectra of the samples were analyzed to understand the molecu-lar level interactions in the jam. Results indicated that the nature of spec-tral bands was similar for jam manufactured with sucrose or sorbitol. The
FIGURE 14.10 Effect of TSS on yield stress of jam (pH = 3.4, pectin concentration = 1%, sugar concentration = 65%, temperature= 20oC) at different sorbitol substitution levels. (Adapted from Basu, 2009)

Influence of Sugar Substitute in Rheology of Fruit Gel Chapter | 14 371
intensity of C–C and C–O stretching vibrations (900–1150 cm−1) was similar for jams with 50, 75, and 100% sorbitol, but were higher for 0 and 25% sor-bitol jams. Similarly, the intensity (peak area) at 1632 cm−1 (for free COO−), 1200–1480 cm−1 (bending of O–C–H, C–C–H, and C–OH), and 750 cm−1 (anomeric region) decreased with increasing sorbitol substitution. These spec-tral features are indicative of strong network formation in jam manufactured with sucrose compared to jam made only with sorbitol. The C–O and C–C stretching vibrations are indicators of the gel strength because pectin poly-meric chain network formation in fruit jam is due to hydrogen bonding and hydrophobic interactions. The FTIR spectra recorded for sorbitol substitutions demonstrated that gelation is a physical phenomenon and the molecular bond-ing pattern remains similar for sucrose or sorbitol used during jam manufac-turing (Fig. 14.11).
Basu et al. (2013) studied the effect of sucralose and stevioside substitution on rheological properties in mango jam developed. The effect of sucralose sub-stitution on rheological behavior of sucralose jam under steady state is shown in Fig. 14.12. The rheological behavior of sucralose jam was well described by Herschel–Bulkley model.
Increased substitution of stevioside/sucralose resulted in reduced TSS in the final product. For a given stevioside level, K and yield stress (τ0) decreased with increasing stevioside substitution. Further, n increased with decreasing TSS values, signifying the shift toward Newtonian behavior of jam. Jam prepared
FIGURE 14.11 FTIR spectra of jam (pH = 3.4, pectin concentration = 1%).

372 PART | II Product Specific Studies in Rheology
with more than 25% stevioside and sucralose exhibited thick liquid-like charac-teristics and therefore cannot be considered as jam. This phenomenon indicated weaker network formation by pectin in these samples and the samples remained in “sol” state. For occurrence of gelation, a minimum amount of cosolute is needed for pectin to gel (Morris et al., 1980; Oakenfull and Scott, 1984). Jam prepared with 50, 75, and 100% stevioside/sucralose substitution did not meet the desired textural and rheological characteristics of mango jam due to low TSS in the final product. Manufacture of mango jam with desired soft solid characteristics was feasible only with approximately 25% stevioside or sucra-lose substitution (Basu et al., 2013).
14.5 SUMMARY
Fruit gels are popular processed intermediate moisture food products because of their low cost, all year long availability, and organoleptic properties. Commercial manufacturing of low calorie fruit gels is gaining importance due to dietary awareness of consumers throughout the world. Therefore, there is a need to develop low calorie fruit gel type products (jam, jelly, marmalade, fruit leather). Scientific understanding of the effects of composition on textural attributes, micro-structural properties, and sensory properties is needed in order to manufacture low calorie fruit gels with the desired textural and rheological attributes. This will further aid in optimi-zation of the ingredient interactions for best quality low calorie fruit gel manufacturing.
FIGURE 14.12 Effect of sucralose substitution on steady state rheological behavior of sucralose jam (pH = 3.4, pectin concentration = 1%, sucralose level = 60) at 30°C. (Adapted from Basu et al., 2013)

Influence of Sugar Substitute in Rheology of Fruit Gel Chapter | 14 373
REFERENCES
Abdullah, A., Cheng, T.C., 2001. Optimization of reduced calorie tropical mixed fruit jam. Food Qual. Prefer. 12, 63–68.
Abu-Jdayil, B., 2003. Modeling the time-dependent rheological behavior of semisolid foodstuffs. J. Food Eng. 57 (1), 97–102.
Acosta, O., Vĭquez, F., Cubero, E., 2008. Optimisation of low calorie mixed fruit jelly by response surface methodology. Food Qual. Prefer. 19, 79–85.
Ahmed, G.E., 1981. High methoxylpectins and their uses in jam manufacture—a literature survey. The British Manufacturing Industries Research Association. Sci. Tech. Surv. (127), July.
Almdal, K., Dyre, J., Hvidt, S., Kramer, O., 1993. Towards a phenomenological definition of the term “gel”. Polym. Gels Netw. 1, 5–17.
Álvarez, E., Cancela, M.A., Maceiras, R., 2006. Effect of temperature on rheological properties of different jams. Int. J. Food Prop. 9 (1), 135–146.
Baker, R.A., Berry, N., Hui, Y.H., Barrett, D.M., 2005. Food preserves and jams. In: Barrett, M., Somogyi, L., Ramaswamy, H.S. (Eds.), Processing Fruits. second ed. CRC Press, Boca Raton, FL.
Baravian, C., Quemada, D., Parker, A., 1996. Modelling thixtropy using a novel structural kinetics approach: basis and application to a solution of iota carrageenan. J. Texture Stud. 27, 371–390.
Barnes, H.A., 1997. Thixoropy: a review. J. Non-Newtonian Fluid Mech. 70, 1–33. Basu, S., 2009. Development of jam using alternative sweeteners. PhD Thesis, Panjab University,
Chandigarh, India.Basu, S., Shivhare, U.S., 2010. Rheological, textural, microstructural and sensory properties of
mango jam. J. Food Eng. 100, 357–365. Basu, S., Shivhare, U.S., 2013. Rheological, textural, microstructural and sensory properties of
sorbitol substituted mango jam. Food Bioprocess Technol. 6, 1401–1413. Basu, S., Shivhare, U.S., Raghavan, G.S.V., 2007. Time dependent rheological properties of pine-
apple jam. Int. J. Food Eng. 3 (3), 1556–3758. Basu, S., Shivhare, U.S., Singh, T.V., 2013. Effect of substitution of stevioside and sucralose on rheologi-
cal, spectral, color and microstructural characteristics of mango jam. J. Food Eng. 114 (4), 465–476. Basu, S., Shivhare, U.S., Singh, T.V., Beniwal, V.S., 2011. Rheological, textural and spectral char-
acteristics of sorbitol substituted mango jam. J. Food Eng. 105, 503–512. Bayarri, S., Duran, L., Costell, E., 2004. Influence of sweeteners on the viscoelasticity of hydrocol-
loids gelled systems. Food Hydrocoll. 18, 611–619. Bhattacharya, S., 1999. Yield stress and time-dependent rheological properties of mango pulp.
J. Food Sci. 64, 1029–1033. Bistany, K.L., Kokini, J.L., 1983. Dynamic viscoelastic properties of foods in texture control.
J. Rheol. 27, 605–620. Carbonell, E., Costell, E., Duran, L., 1991a. Rheological behavior of sheared jams: relation with
fruit content. J. Texture Stud. 22, 33–34. Carbonell, E., Costell, E., Duran, L., 1991b. Rheological indices of fruit content in jams: influence
of formulation on time-dependent flow of sheared strawberry and peach jam. J. Texture Stud. 22, 457–471.
Cardoso, S., Coimbra, M., Lopes da Silva, J.A., 2003. Temperature dependence of the formation and melting of pectin–Ca2+ networks: a rheological study. Food Hydrocoll. 17, 801–807.
Clark, A.H., Ross-Murphy, S.B., 1987. Structural and mechanical properties of biopolymer gels. Adv. Polym. Sci. 87, 57–192.
Costell, E., Carbonell, E., Duran, L., 1993. Rheological indices of fruit content in jams: effect of for-mulation on flow plasticity of sheared strawberry and peach jams. J. Texture Stud. 24, 375–390.

374 PART | II Product Specific Studies in Rheology
Daubert, C.R., Tkachuck, J., Truong, V.D., 1998. Quantitative measurement of food spreadability using the vane method. J. Texture Stud. 29, 427–435.
De Kee, D., Code, R.K., Turcotte, C., 1983. Flow properties of time-dependent foodstuffs. J. Rheol. 27, 581–604.
Dervisi, P., Lamb, J., Zabetakis, I., 2001. High pressure processing in jam manufacture: effect on textural and color properties. Food Chem. 73, 85–91.
Dickinson, E., 1992. An Introduction to Food Colloids. Oxford University Press, Oxford. Dille, M.J., Draget, K.I., Hattrem, M.N., 2015. The effect of filler particles on the texture of food
gels. Woodhead Publishing Series 9, Cambridge, UK, pp. 183–200. Doublier, J.L., Launay, B., Cuvelier, G., 1992. Viscoelastic properties of food gels. Viscoelastic
Properties of Foods, E.A.F.S. Series, Elsevier Applied Science Publishers, London.Evageliou, V., Richardson, R.K., Morris, E.R., 2000a. Effect of pH, sugar type and thermal anneal-
ing on high-methoxy pectin gels. Carbohydr. Polym. 42, 245–259. Evageliou, V., Richardson, R.K., Morris, E.R., 2000b. Effect of oxidised starch on high methoxy
pectin-sucrose gels formed by rapid quenching. Carbohydr. Polym. 42, 219–232. Figoni, P.I., Shoemaker, C.F., 1981. Characterization of structure breakdown of foods from their
flow properties. J. Texture Stud. 12, 287–305. Figoni, P.I., Shoemaker, C.F., 1983. Characterization of time dependent flow properties of mayon-
naise under steady shear. J. Texture Stud. 14, 431–442. Flory, P.J., 1953. Principles of Polymer Chemistry. Cornell University Press, Ithaca. Flory, P.J., 1974. Gels and gelling processes: introductory lecture. Faraday Discuss Chem. Soc. 57, 7. Fugel, R., Carle, R., Schieber, A., 2005. Quality and authenticity control of fruit purées, fruit prepa-
rations and jams—a review. Trends Food Sci. Technol. 16, 433–441. Gabriele, D., De Cindio, B., D’Antona, P., 2001. A weak gel model for foods. Rheol. Acta 40,
120–127. Gajar, A.M., Badrie, N., 2001. Processing and quality evaluation of a low-calorie christophene jam
(Sechiumedule(Jacq.)) swartz. J. Food Sci. 67, 341–346. Garnier, C., Axelos, M.A.V., Thibault, J.F., 1994. Selectivity and co-operativity in the binding of
calcium ions by pectins. Carbohydr. Res. 256, 71–81. Grigelmo-Miguel, N., Martin-Belloso, O., 2000. The quality of peach jams stabilized with peach
dietary fiber. Eur. Food Res. Technol. 211, 336–341. Gulrez, S.K.H., Al-Assaf, S., Phillips, G.O., 2011. Hydrogels: methods of preparation, characteri-
sation and applications. In: Prof. Carpi, A. (Ed.), Progress in Molecular and Environmental Bioengineering—From Analysis and Modeling to Technology Applications. InTech, Croatia.
Hahn, S.L., Ree, T., Eyring, H., 1959. Flow mechanism of thixotropic substances. Ind. Eng. Chem. 51, 856–857.
Hermansson, A.M., 2007. Structuring water by gelation. In: Aguilera, J.M., Lilford, P.J. (Eds.), Food Materials Science. Springer, New York, USA.
Hoefler, A.C., 2003. Effect of calcium concentration, degree of amidation, soluble solids, and car-bohydrate type on the gel strength of low ester citrus pectin. MS Thesis, University of Dela-ware, USA.
Holdsworth, S.D., 1993. Rheological models used for the prediction of the flow properties of food products: a literature review. Trans. IChemE 71C, 139–179.
Hyvönen, L., Törmä, R., 1983. Examination of sugars, sugar alcohols and artificial sweeteners as substitutes for sucrose in strawberry jams (product development). J. Food Sci. 48 (1), 183–185.
Ikeda, S., Nishinari, K., 2001. Weak gel”-type rheological properties of aqueous dispersions of non-aggregated k-carrageenan helices. J. Agric. Food Chem. 49 (9), 4436–4441.
Khouryieh, H.A., Aramouni, F.M., Herald, T.J., 2005. Physical, chemical and sensory properties of sugar-free jelly. J. Food Qual. 28, 179–190.

Influence of Sugar Substitute in Rheology of Fruit Gel Chapter | 14 375
Kohn, R., 1987. Binding of divalent cations to oligomeric fragments of pectin. Carbohydr. Res. 160, 343–353.
Kokini, J.L., Plutchok, G.J., 1987. Viscoelastic properties of semisolid foods and their biopolymers components. Food Technol. 41 (3), 89–95.
Krokida, M.K., Maroulis, Z.B., Saravacos, G.D., 2001. Rheological properties of fluid fruit and vegetable puree products: compilation of literature data. Int. J. Food Prop. 4 (2), 179–200.
Löfgren, C., Walkenström, P., Hermansson, A.M., 2002. Microstructure and rheological behavior of pure and mixed pectin gels. Biomacromolecules 3 (6), 1144–1153.
Lopes da Silva, J.A., Goncalves, M.P., Rao, M.A., 1992. Rheological properties of high-methoxyl pectin and locust bean gum solutions in steady shear. J. Food Sci. 57 (2), 443–448.
Lozano, J.E., Ibarz, A., 1994. Thixotropic behaviour of concentrated fruit pulps. LWT—Food Sci. Technol. 27 (1), 16–18.
Miguel, N.G., Ibarz-Ribas, A., Martín-Belloso, O., 1999. Flow properties of orange dietary fiber suspensions. J. Texture Stud. 30 (30), 245–257.
Mizrahi, S., 1979. A review of the physicochemical approach to the analysis of the structural viscos-ity of fluid fruit products. J. Texture Stud. 10 (1), 67–82.
Mizrahi, S., Firstenberg, R., 1975. Effect of orange juice composition on flow behaviour of six-fold concentrate. J. Texture Stud. 6, 523–532.
Mleko, S., Foegeding, E.A., 2000. pH induced aggregation and weak gel formation of whey protein polymers. J. Food Sci. 65 (1), 139–143.
Moghaddam, T.M., Razavi, S.M.A., Malekzadegan, F., Ardekani, A.S., 2009. Chemical composition and rheological characterization of pistachio green hull’s marmalade. J. Texture Stud. 40 (4), 390–405.
Moritaka, H., Naito, S., Nishinari, K., Ishihara, M., Fukuba, H., 1999. Effects of gellan gum, citric acid and sweetener on the texture of lemon jelly. J. Textural Stud. 30, 29–41.
Morris, V.J., 1986. In: Mitchell, J.R., Ledward, D.A. (Eds.), Functional Properties of Food Macro-molecules. Elsevier Applied Science Publishers, London.
Morris, E.R., Rees, D.A., Robinson, G., 1980. Cation-specific aggregation of carrageenan helices: domain model of polymer gel structure. J. Mol. Biol. 138, 349–362.
Nabors, L.O’B., 2001. Alternative sweeteners: an overview. In: Nabors, L.O’B. (Ed.), Alternative Sweeteners. Marcel Dekker, New York, pp. 1–12.
Ng, T.S.K., McKinley, G.H., 2008. Power-law gels at finite strains. J. Rheol. 52 (2), 417–449. Nguyen, Q.D., Jensen, C.T.B., Kristensen, P.G., 1998. Experimental and modelling studies of the
flow properties of maize and waxy starch pastes. Chem. Eng. J. 70, 165–171. Nishinari, K., Watase, M., Williams, P.A., Phillips, G.O., 1990. k-carrageenan gels: effect of
sucrose, glucose, urea, and guanidine hydrochloride on the rheological and thermal properties. J. Agric. Food Chem. 38 (5), 1188–1193.
Nishinari, K., Zhang, H., Ikeda, S., 2000. Hydrocolloids gels of polysaccharides and proteins. Curr. Opin. Colloid Interface Sci. 5, 195–201.
Oakenfull, D.G., 1991. The chemistry of high-methoxylpectins. In: Walter, R.H. (Ed.), The Chem-istry and Technology of Pectin. Academic Press, New York.
Oakenfull, D.G., Scott, A., 1984. Hydrophobic interaction in the gelation of high methoxylpectins. J. Food Sci. 49 (4), 1093–1098.
Peinado, I., Rosa, E., Heredia, A., Andrés, A., 2012. Rheological characteristics of healthy sugar substituted spreadable strawberry product. J. Food Eng. 113 (3), 365–373.
Powell, D.A., Morris, E.R., Gidley, M.J., Rees, D.A., 1982. Conformations and interactions of pec-tins II. Influence of residue sequence on chain association in calcium pectate gels. J. Mol. Biol. 155, 517–531.
Ramos, A.M., Ibarz, A., 1998. Thixotropy of orange concentrate and quince puree. J. Texture Stud. 29, 313–324.

376 PART | II Product Specific Studies in Rheology
Rao, M.A., 1977. Measurement of flow properties of fluid foods—developments, limitations, and interpretation of phenomena. J. Texture Stud. 8, 257–282.
Rao, M.A., 1986. Rheological properties of fluid foods. In: Rao, M.A., Rizvi, S.S.H. (Eds.), Engineering Properties of Foods. Academic Press, San Diego, U.S.A.
Rao, M.A., 1987. Predicting the flow properties of food suspensions of plant origin. Food Technol. 41 (3), 85–88.
Rao, M.A., 2003. Phase transitions, food texture and structure. In: Mckenna, B.M. (Ed.), Texture in Food: Vol 1: Semi-Solid Foods. Woodhead Publishing, Cambridge.
Rao, M.A., 2007. Rheology of liquid foods—a review. J. Texture Stud. 8 (2), 135–168. Rao, M.A., Cooley, H.J., 1992. Rheological behavior of tomato pastes in steady and dynamic shear.
J. Texture Stud. 23, 415–425. Raphaelides, S.N., Ambatizidoo, A., Petridis, D., 1996. Sugar composition effects on textural
parameters of peach jam. J. Food Sci. 61 (5), 942–946. Renard, D., van de Velde, F., Visschers, R.W., 2006. The gap between gel structure, texture and
perception. Food Hydrocoll. 20, 423–431. Ross-Murphy, S.B., 1995a. Structure–property relationships in food biopolymer gels and solutions.
J. Rheol. 39, 1451–1463. Ross-Murphy, S.B., 1995b. Rheological characterization of gels. J. Texture Stud. 26, 391–400. Ross-Murphy, S.B., 2005. Gelation kinetics-problems and prospects. J. Macromol. Sci. B 44 (6),
1007–1019. Royer, G., Madieta, E., Symoneaux, R., Jourjon, F., 2006. Preliminary study of the production of
apple pomace and quince jelly. LWT—Food Sci. Technol. 39, 1022–1025. Sagdic, O., Toker, O.S., Polat, B., Arici, M., Yilmaz, M.T., 2015. Bioactive and rheological proper-
ties of rose hip marmalade. J. Food Sci. Technol. 52 (10), 6465–6474. Sandrou, D.K., Arvanitoyannis, I.S., 2000. Low-fat/calorie foods: current state and perspectives.
Crit. Rev. Food Sci. Nutr. 40, 427–447. Saravacos, G.D., 1970. Effect of temperature on viscosity of fruit juices and purees. J. Food Sci.
35, 122–125. Singh, S., Jain, S., Singh, S.P., Singh, D., 2009. Quality changes in fruit jams from combinations of
different fruit pulps. J. Food Process. Preserv. 33, 41–57. Steffe, J.F., 1996. Rheological Methods in Foods Process Engineering, second ed. Freeman Press,
East Lansing, Michigan. Suutarinen, J., Honkapaa, K., Heinio, R.L., Mustranta, A., Liukkonen-Lilja, H., Mokkila, M., 2002.
Modeling of calcium chloride and pectin methylesterase prefreezing treatments of strawberries and jams. J. Food Sci. 67 (3), 1240–1248.
Thakur, B.R., Singh, R.K., Handa, A.K., 1997. Chemistry and uses of pectin—a preview. Crit. Rev. Food Sci. Nutr. 37 (1), 47–73.
Tiu, C., Boger, D.V., 1974. Complete rheological characterization of time dependent food products. J. Texture Stud. 5, 328–338.
Tunick, M.H., 2000. Rheology of dairy foods that gel, stretch, and fracture. J. Dairy Sci. 83 (8), 1892–1898.
Weltman, R.N., 1943. Breakdown of thixotropic structure as a function of time. J. Appl. Phys. 14, 343–350.
Yildiz, O., Alpaslan, M., 2012. Properties of rose hip marmalades. Food Technol. Biotechnol. 50 (1), 98–106.
Yoon, W.B., Gunasekaran, S., Park, J.W., 2004. Evaluating viscosity of surimi paste at different moisture contents. Appl. Rheol. 14, 133–139.

377Advances in Food Rheology and Its Applications. http://dx.doi.org/10.1016/B978-0-08-100431-9.00015-2Copyright © 2017 Elsevier Ltd. All rights reserved.
Chapter 15
Rheological Properties of Gelatin and Advances in Measurement
J. AhmedFood & Nutrition Program, Environment and Life Sciences Research Center, Kuwait Institute for Scientific Research, Kuwait
15.1 INTRODUCTION
Gelatin is the denatured form of the most abundant animal protein—collagen (Ward, 1954); as a result, most of its biological properties are inherited from collagen. Collagen exists in nature as a macromolecule of three polypeptide strands, approximately 300-nm long, contorted into a triple-helix conformation, and with a molecular weight of approximately 100 kDa (Djabourov et al., 1993; Guenet, 1992). Collagen is the basic constituent of all white fibrous connective tissues occurring in animal bodies and it has been degraded into the second-ary and higher structures with varying degrees of hydrolysis of the polypeptide backbone either by partial acid or alkaline hydrolysis or by thermal or enzymat-ic degradation. Based on degree of hydrolysis, two types of gelatin are available commercially: type A and B. Type A is obtained from porcine skin with acidic treatment prior to the extraction process, which rarely affects the amide groups of glutamine and asparagine that results in a higher isoelectric point ranged be-tween 7 and 9 (Patel et al., 2008). Type B is extracted from ossein and cut hide split from bovine by alkaline treatment, which causes hydrolyses of asparagine and glutamine to aspartate and glutamate, respectively. The isoelectric point for type B gelatin ranges between 4.5 and 6.0.
Gelatin is one of the most desired ingredients in the food industry with a wide range of applications and it is generally recognized as safe status at the US Food and Drug Administration. Gelatin is mostly used as a gelling, thicken-ing, foaming, stabilizing, and water binding agent in the food industry; further-more, gelatin is free from cholesterol, fat, and purine. It is really hard to replace gelatin since a series of ingredients are required to impart the holistic gelatin

378 PART | II Product Specific Studies in Rheology
properties. Polypeptide structure of gelatin molecule facilitates its interactions with different ionic and nonionic surfactants by hydrophobic or ionic mecha-nism forming various surfactant–gelatin complexes. Gelatin is also extensively used as an ingredient in formulations in the photographic, pharmaceutical, and cosmetic industries. In the pharmaceutical industry, hard and soft capsules, plasma expanders, and wound care are manufactured from gelatin.
Gelatin can be manufactured from mammalian and piscine sources, although the physical properties of these gelatins are completely different. It is important to understand and be familiar with the manufacturing practices as well as the physicochemical properties of gelatin source for a specific application. The ma-jor sources of gelatin production are pig skin (46%), bovine hides (29.4%), and pig and cattle bones (23.1%) (Duconseille et al., 2015). Fish gelatin represented less than 1.5% of total gelatin production in 2007 (Gomez-Estaca et al., 2009). It is generally regarded that gelatins obtained from mammalians are character-ized by having considerably higher melting and gelling points than cold-water piscine gelatins (Leuenberger, 1991); furthermore, the gels are also stronger, which is directly related to the fact that hydroxyproline content is higher in the former (Ledward, 1992).
However, recently the importance of fish gelatin has gained momentum since the demand for nonbovine and nonporcine gelatin has increased because of the bovine spongiform encephalopathy crisis and for religious and social reasons. Before extraction of gelatin, the skins are treated with acid and alkali to remove the unwanted noncollagenous material. The gelatin is extracted by heat-ing the pretreated skin at a moderate temperature water bath (>45°C). Once the collagen molecule swells up properly, next heat treatment cleaves the hydrogen and some covalent bonds and destabilizes the triple helix, resulting in a helix-to-coil transition and conversion into soluble gelatin (Gomez-Guillen et al., 2002). The isoelectric point of acid-treated pig skin gelatin is of pH 9, compared to a limed cattle hide gelatin with an isoelectric point of pH 5. The reduction in isoelectric point in limed gelatins is due to the hydrolysis of glutamine and as-paragine groups (Johnston-Banks, 1990). Thus, the manufacture of gelatin has significant role in functionality of the end product.
The rheological or mechanical properties of gelatin gel has significant role in product development, and product characterization in food, pharmaceutical, and biomedical industries. Gelatin can form a homogeneous gel for concentrations in the range of about 1–50% (Djabourov et al., 1993; Guenet, 1992). When a gela-tin solution is cooled below the sol–gel transition temperature, the coil molecules form triple-chain helices through renaturation of collagen-like spirals, and the solution transforms to a three-dimensional gel structure (Djabourov et al., 1993), which provide its strength and elasticity. The triple helices reorganize over time to form an equilibrium infinite gel network (Bohidar and Jena, 1993) in a manner consistent with percolation theory (Djabourov et al., 1993). Since the bonds that drive this transition are physical (hydrogen and van der Waals bonds), the gela-tion process is thermoreversible. The rheological properties of gelatin depends

Rheological Properties of Gelatin and Advances in Measurement Chapter | 15 379
upon many factors including source, breed, age of animal, and extent of break-down of peptide chains during thermal and chemical treatment and number of polypeptide chains depend on the position of the breaks, molecular weight, num-ber of each kind of amino acid residues, concentration, etc.
Since, the chapter focuses on rheological and structural properties of gelatin, manufacturing and other physical properties are excluded.
15.2 STRUCTURE AND AMINO ACID COMPOSITION
Collagen is a unique protein due to the presence of a large amount of glycine and proline. The relative proportions and sequences of the constituent amino acids in collagen and gelatin are largely the same, whereas both proteins differ sig-nificantly on their physical properties and functionalities. Commercial gelatins are heterogeneous protein mixtures of polypeptide chains made up of 18 specific amino acids (Akhter et al., 2011). Gelatin does not contain cysteine, whereas me-thionine is the only sulfur-containing amino acid present. Such unique amino acid profile produces a unique structure. Intramolecular hydrogen bonding is absent due to the high imino acids, which have no hydrogen atom on the peptide bond.
The chemical structure of gelatin is shown in Fig. 15.1. Gelatin molecules contain repeating sequences of glycine (Gly), proline (Pro), and alanine (Ala) amino acid triplets, which are responsible for the triple helical structure of gela-tin. The triple helical structure of gelatin is represented as (Gly-X-Pro)n, where X represents the amino acid, mostly lysine, arginine, methionine, and valine. The high stability of gelatin is due to its unique triple-helix structure consisting of three polypeptide α-chains (Flory and Weaver, 1960), and therefore, acting as junction points of a 3D network stabilized by intramolecular hydrogen bond-ing, and forming a macroscopic gel (Djabourov, 1988). During acid or alkaline hydrolysis, a mild degradative process occurs and the fibrous structure of col-lagen is broken down irreversibly due to the rupture of covalent bonds. The sol-uble collagen denatures by destroying the triple helical structure, and produces one, two or three random chain gelatin molecules which finally account for the high viscosity in water solution (Flory and Weaver, 1960). The molecular weight of these large protein structures typically ranges between 20,000 and 250,000 g/mol, with some aggregates weighing in millions (Keenan, 1994).
FIGURE 15.1 Chemical structure of gelatin.

380 PART | II Product Specific Studies in Rheology
The native structure of collagen is lost during gelatin manufacturing process due to denaturation of protein. The collagen fibers forming helices lose their conformation during heat processing. However, a partial recovery has been made during cooling. Gelatin forms a gel due to entrapment of water in the chain matrix. The structure of gelatin changes during gelation as the chains have different space arrangements and different interactions. These characteris-tics depend on the gelatin concentration, temperature, and the activation energy for the formation of the secondary structure. Guo et al. (2003) reported that one double strand structure can be formed only by two α-chains or one α-chain, which creates a loop, and similarly, a triple strand structure can be made by three different α-chains or two α-chains, one of which forms a loop, or by only one α-chain with two loops. Coppola et al. (2012) reported that a type B bovine hide gelatin film can exhibit three distinct structural states, namely, the amorphous state, which corresponds to a coil structure with primary chains; the semicrystallized state, which is composed of triple helices and a coil structure; and the crystallized state that corresponds to the packing of triple helices and a coil structure (Fig. 15.2).
Gelatins normally dissolve in warm water (>40°C) and above this tempera-ture the polypeptide exists as flexible single coils (Ross-Murphy, 1992). On
FIGURE 15.2 Schematic views of the gelatin films at different temperatures and R ratios. (a) Amorphous coils; (b) triple helices and coils; and (c) bundles of triple helices and coils. (From Coppola et al., 2012)

Rheological Properties of Gelatin and Advances in Measurement Chapter | 15 381
cooling, transparent gels are formed above the critical concentration (0.4–1.0%). The gels contain extended physical crosslinks or “junction zones” formed by a partial reversion to “ordered” triple helical collagen-like sequences, separated along the chain contour by peptide residues in the “disordered” conformation (Ross-Murphy, 1992).
15.3 GELATION MECHANISM
Mostly classical theories have been used to describe gelation and the mecha-nism of gel formation. The classical theory of gelation was developed by Flory (1941) and he advocated the concept of branching during polymerization. The branching takes place repeatedly which eventually leads to the formation of the infinite network. Later on, the model of a satisfactory interpretation of the experimental data comes from physics of phase transition which considers gela-tion as an example of critical phenomenon. Another approach used to describe the transition from sol to gel is known as the percolation model. It describes the process of gel formation by the linkage of two dots where many dots are spaced regularly. Detailed descriptions are available elsewhere.
Simply, gelation for gelatin gels is a physical process, and mostly dependent on concentration. Gelation occurs by physical crosslinking, which largely leads to the formation of “microcrystalline junction zones” and eventually a three-dimensional supramolecular level of structure. The formation of a thermally induced gel matrix or coagulum from protein molecules can be quantified using thermodynamic or kinetic considerations, which involve the following three se-quential steps: (1) denaturation→ (2) aggregation/coagulation→ (3) crosslink-ing (Baier and McClements, 2005). The functionality, f, is the possible number of crosslinking sites (junction zones) available for crosslinking per primary chain: a minimum fraction of these zones must form before a three-dimensional network can develop. In Flory and Stockmayer’s model, the critical degree of branching αc is given by the relationship αc = 1/(f − 1), a network being formed when α>αc. The mechanism of thermoreversible gelation of gelatin in water, as a crystallization process, involves side-by-side association of helical chain segments stabilized by neutral nonpolar –Gly-Pro-Hypro sequence. Gelation theory has been widely researched and published in the literature and is beyond the scope of the chapter.
15.4 RHEOLOGICAL BEHAVIOR OF GELATIN GEL
15.4.1 Rheology
The evolution of gelling systems is of great interest in gelatin rheology. During the sol–gel transition, a crosslinking polymer undergoes a phase transition from a liquid to a solid state through a critical point known as a “gel point.” A power-type behavior for the shear modulus over a wide range of shear frequencies of a

382 PART | II Product Specific Studies in Rheology
gel system has been reported by Chambon and Winter (1987). At gel point, the generalized equation for a gel is represented as
ω ω ω′ ∝ ′′ ∝ < <G G n( ) ( ) 0 1n (15.1)
The frequency independence of the loss tangent in the vicinity of the gel point has been widely examined for chemical and physical gels and has also been employed to determine the gel point.
Gel strength and gel melting point are the important properties of gelatin gels. These are influenced by concentration, molecular weight, complex forma-tion by the amino acid composition, and the ratio of α/β-chains present in the gelatin (Cho et al., 2004). The gel strength is mostly dependent on the propor-tion of fractions having a molecular weight of about 100,000 g/mol (Schrieber and Gareis, 2007). Furthermore, the α-chain content in gelatin governs the gel strength and, therefore, gelatin having more number of α-chains resulted in higher gel strength. On the other hand, a high ratio of peptides with molecular weights higher or lower than the α-chains would decrease gel strength (Liu et al., 2008).
15.4.2 Gelation Point
The “gelation point” is an important parameter in gel-forming materials. In case of gelatin, the gelation point or gel point (GP) is important because it provides the balance of soft deformation and mechanical strength. Gelation temperature represents the gelling process which involves the transition from random coil to triple helical structure of gelatins. The imino acid content stabilizes the ordered conformation when gelatin forms the gel network during gelling. The sol–gel transition can be described by the general formalism of critical phenomena in which universal exponents govern the divergence of static and dynamic proper-ties of the gelling system near the percolation threshold (Stauffer et al., 1982). Validation of the percolation models and scaling relations that are derived from them requires an experimental determination of these exponents and this is sup-posed to be an accurate determination of the gelation point.
The most common ways to determine the GP are based on chemical meth-ods and rheological measurements. In chemical method, chemical analysis or spectroscopy are used to determine the composition of the sample during the reaction and later on depends on theoretical model to correlate the chemical composition to the gelation point (Flory, 1953; Stauffer et al., 1982). On the other hand, the rheological measurements including oscillatory, steady shear, and equilibrium modulus are widely used techniques for identifying the GP more precisely. It is primarily impossible to measure the viscosity or the equi-librium modulus at the gelation point as they are respectively infinite and zero at the transition (In and Prud’homme, 1993). In steady shear measurement, the ge-lation time is obtained by extrapolation. Measurements of the oscillatory shear moduli are frequently used to monitor continuously the viscoelastic properties
G9(w)∝G0(w)∝wn 0<n<1

Rheological Properties of Gelatin and Advances in Measurement Chapter | 15 383
of crosslinking systems from the sol through the transition to the gel state (Hsu and Jamieson, 1993).
An appropriate and extensively reported technique for detection of the GP involves measurements of the complex shear modulus, G*, over a range of fre-quencies, w, in oscillatory shear. At the GP, both dynamic moduli of the complex modulus, G9 and G0, scale in oscillatory frequency, w, as G9(w) ∼ G0(w) ∼ wα where α is termed the stress relaxation exponent. GP measurements may in-clude “frequency sweeps” with repeated consecutive application of a set of small amplitude oscillatory shear. The gel point for various gels was determined based on the frequency independence phase angle (tan δ ). The method adopted a multifrequency plot of tan δ against gelation time, temperature, or concentra-tion, and it depends on which variable governs the gelation process (Tanaka, 2012). However, this criterion is not universally true at finite frequencies (Win-ter, 1987). Several researchers used some advanced techniques based on some experimental observations about the scaling of the dynamic moduli with respect to frequency to detect the gelation threshold near the gel point (Winter and Chambon, 1986; Chambon and Winter, 1987). It has been observed that a gela-tion point can be found where G9 and G0 remain parallel to each other over the experimentally accessible range of frequencies. To obtain dynamic moduli data over a range of frequencies to track the approach to the gel point, Winter also pioneered the use of multiple superimposed frequencies followed by Fourier transform analysis of the resulting stress waveforms (Holly et al., 1988). This technique has been named Fourier transform mechanical spectroscopy (FTMS). In this chapter, application of those techniques for gel point determinations have been discussed.
15.4.3 Bloom Value
The Bloom value (BV) (strength/resistance) is a measure of the hardness, con-sistency, firmness, and compressibility of a gel at a desired temperature. It is one of the most important functional properties of gelatin. It is measured by ap-plying a load (in grams) to produce compression in the gel under normal condi-tions. An increase in the Bloom index leads to a notable improvement in the me-chanical properties and a significant reduction in the water absorption capacity (Lai, 2009). The factors that affect BV are the average molecular weight, nature of the chemical treatment of raw collagen, and type and concentration of the gelatin (Kolodziejska et al., 2004). The BV for commercial gelatins ranged be-tween 50 and 300 g (Ockerman and Hansen, 1994; Schrieber and Gareis, 2007). It has been considered that the BV takes into account the sum of α and β frac-tions of the molecular structure of the gelatin (Segtnan and Isaksson, 2004). Gelatins with high BVs have higher melting or gel points, the color is lighter, and the odor more neutral (Schrieber and Gareis, 2007). The BV for gelatin from various sweet water fish ranged between 258 and 357 g, and the value was proportional to its hydroxyproline content (Chandra and Shamasundar, 2014).

384 PART | II Product Specific Studies in Rheology
15.4.4 Viscosity
Viscosity is one of the most important index to assess gel strength of a gelatin gel. Viscosity is partially influenced by molecular weight, pH, concentration, and molecular size distribution (Sperling, 1985). The viscosities for the com-mercial gelatins ranged between 2.0 and 7.0 mPa·s and even it could reach up to 13.0 mPa·s (Johnston-Banks, 1990). A lower viscosity has been reported at higher pH range (6–8), whereas at lower pH range the highest viscosity has been recorded. The viscosity of the gelatins from various fish skin varies from 3.2 to 6 mPa·s (Jamilah and Harvinder, 2002; Ninan et al., 2011).
15.5 OSCILLATORY RHEOLOGY
15.5.1 Frequency Sweeps
Typical frequency sweeps of Grouper (Hammour) fish skin gelatin gel (6.67% w/v) at selected temperatures are illustrated in Fig. 15.3 (Ahmed, 2016). It can be seen that the frequency dependency of both moduli are significantly influ-enced by the temperature. Both G9 and G0 increased with increasing frequency irrespective of temperature. The gelatin gel exhibited predominantly solid-like property below the melting temperature. The G9 values were almost 2 log cycle higher than the G0 at 0 and 10°C. Furthermore, the G9 of the gel exceeds the G0 significantly over the range of frequency studied indicating an increase in mo-lecular interactions and a strengthening of the gel structure with lowering tem-perature. A true elastic gel network has been considered when G9 is at least 1
FIGURE 15.3 Frequency sweep of Hammour fish skin gelatin sample at selected tempera-tures (Ahmed, 2016).

Rheological Properties of Gelatin and Advances in Measurement Chapter | 15 385
order of magnitude greater than G0 and either modulus is not or is only slightly dependent on frequency (Morris et al., 2012). At 20°C, the gelatin solution showed a crossover between the two dynamic moduli at the higher frequency range, which indicates a distinct gel point at 2.5 Hz. The liquid-like property advances beyond the critical frequency.
The frequency (w) dependence of gel rigidity (G9) can be described by the power-type relationship:
ω′ =G A n (15.2)
ω′ = +G A nAfter linearization, ln ln ln (15.2a)
where A is a constant and n is the frequency exponent (slope) whose value lies between 0 and 1.
The slope and intercept are calculated from the linear regression of ln w versus ln G9. It has been observed that the solid-like behavior of Hammour skin gelatin decreased marginally (slope changes from 0.07 to 0.02) when the iso-thermal frequency sweep increased from 0 to 10°C; however, the slope signifi-cantly increased to 0.20 when the temperature increased to 20°C (Ahmed, 2016). It clearly indicates that the melting temperature has a significant influence on the mechanical behavior of the gel. Similar results of slope values (0.05–0.13) have been reported for some fresh water fish at 5°C (Chandra and Shamasun-dar, 2014).
A frequency sweep test of chicken and bovine gelatin at selected concen-trations [3, 5, 7, and 10% (w/v)], respectively at constant temperature (10°C) reached their gelling point, resulting in network formation with higher G9 val-ues (Sarbon et al., 2013). A linear increase in G9 with frequency is indicative of a more stable gel network in the given frequency range. The G9 values for chicken gelatin were higher than those of bovine gelatin at all concentrations, indicating that the intermolecular interaction of bovine gelatin is weaker than that of chicken gelatin. Both chicken and bovine gelatin gels at a concentration of 3% (w/v) showed a slight frequency dependence of G9, while at concentra-tion 5, 7, and 10% (w/v) gelatin gels were nearly independent of frequency for both chicken and bovine gelatin, respectively (Sarbon et al., 2013).
15.6 NONISOTHERMAL COOLING/HEATING OF GELATIN: GELATION AND MELTING TEMPERATURE
The gelation point is generally detected during nonisothermal cooling/heating of gelation solution at a constant frequency (mostly at 1 Hz) and a constant cooling/heating ramp at a selected temperature range. The selection of tempera-ture range is based on the melting and gel point of the studied gelatin sample. It has been observed that a wide range of temperature (50–0°C, and back) and heating ramp of 0.2–5°C/min have been used to identify the gelling and melting temperature for gelatin samples. On cooling, the gelation point (Tgel) is detected
G9=Awn
After linearization, lnG9=lnA+n lnw

386 PART | II Product Specific Studies in Rheology
whereas the melting temperature (Tm) was observed during the heating cycle. A typical nonisothermal cooling/heating cycle at a heating/cooling ramp of 1°C/min for fish gelatin (6.67% w/v) is illustrated in Fig. 15.4 (Ahmed, 2016). It dis-tinctly points out the Tgel (14.7°C) during cooling cycle, and the corresponding Tm at 23.8°C. However, the concentration is a dependent factor for the gel point. The Tgel and Tm of gelatin samples (at 6.67% w/v) for Herring fish ranged from 16.2 to 16.7°C and 5.1 to 5.2°C, respectively (Norziah et al., 2009). The gelling point for freshwater fish (Cirrhinus mrigala) bone gelatin solution was detected at 8 and 17°C, respectively during the cooling and heating process (2°C/min) (Chandra et al., 2013).
A comparison of rheological properties was made between fish gelatin from cold water fish species and mammalian gelatin gels (Haug et al., 2004). The main differences observed between fish and mammalian gelatins are on the gel modulus and the gelling and melting temperature. It was observed that the Tgel for 10% bovine gelatin was significantly higher (24°C) than that of 10% fish gelatin (4.5°C). Furthermore, the mechanical rigidity of bovine gelatin was sig-nificantly stronger at 4 and 20°C compared to piscine gelatin, and even it was almost 10 times higher at 4°C.
The melting temperature of gelatin has been found to correlate with the pro-portion of the imino acids proline and hydroxyproline in the original collagen (Ledward, 1986). This is typically 24% for mammals and 16–18% for most of the fish species (Norland, 1990). Mostly, fish gelatin exhibited a lower gelling temperature when compared to a mammalian source because of a lower imino acid content (Boran et al., 2010). A list of gelation and melting temperature of gelatin obtained from various fish sources are listed in Table 15.2.
Gelling temperatures for both chicken and bovine gelatin were concentration-dependent [3, 5, 7, and 10% (w/v)] and increased with increasing concentration because of increased crosslinking by hydrogen bonding (Sarbon et al., 2013). Chicken gelatin showed higher Tgel at all concentrations compared to bovine gelatin (p < 0.05). Gelation occurred at 21.02, 23.34, 24.44, and 27.19°C for chicken gelatin and 18.47, 21.40, 22.85, and 24.60°C for bovine gelatin at 3, 5, 7, and 10% (w/v) gelatin in distilled water, respectively. The difference in the gelling ability of chicken compared with bovine gelatin may be due to the intrinsic difference in the protein structure as well as the different pretreatments used in gelatin production.
The chicken gelatin melted at a higher temperature than bovine gelatin. The Tm of chicken (32.67, 32.82, 33.53, and 36.02°C) and bovine (30.03, 30.68, 31.35, and 32.27°C) gelatin were detected at 3, 5, 7, and 10% (w/v) gelatin solutions, respectively (Sarbon et al., 2013). The difference in thermostability between chicken and bovine gelatin may be attributed to the higher proline and hydroxyproline content of chicken gelatin.
Yoshimura et al. (2000) compared gelation of shark and pig skin gelatin during cooling from 40 to 4°C. The value of G9 increased sharply at 30°C for pig gelatin and at 21°C for shark gelatin. The value of tan δ decreased at the

Rheological Properties of Gelatin and Advances in Measurement Chapter | 15 387
studied temperature, indicating decrease in the viscous contribution to visco-elastic property, and it reflected the transition from sol to gel. Additionally, the sol–gel transition temperature for shark gelatin is remarkably lower than that of pig gelatin. The rapid increase in G9 and the decrease in tan δ in the early stage of measurement for pig gelatin at 25°C demonstrated that gelation occurred. However, shark gelatin indicated no sign of the gelation even after 90 min and remained in the sol state. Considering G9 = G0, the gelling point was reached within 30 s at 4°C, very rapidly for both gelatins. The level of G9 for shark gelatin is lower than that of pig gelatin. This may suggest in turn that the intermolecular interaction of shark gelatin is weaker than that of pig gelatin (Fig. 15.4; Table 15.1).
FIGURE 15.4 Rheological (a) cooling scan (25–0°C) and (b) heating scan (0–25°C) of extracted Hammour fish gelatin (Ahmed, 2016).

388 PART | II Product Specific Studies in Rheology
15.7 GEL CHARACTERISTICS INFLUENCED BY ENZYME TREATMENT
The G9 and G0 of gelatin increased by almost 2.5 folds with addition of trans-glutaminase enzyme at concentration of 1–3 mg/g in the heating scan; how-ever, both moduli increased only by onefold with a further addition of 5.0 mg/g enzyme compared to control sample (Norziah et al. 2009). The gel strength of extracted fish gelatin (69.04 g) was significantly lower (p < 0.05) than the halal bovine gelatin (336.2 g) and the commercial fish gelatin (435.9 g). Low gel strength of extracted fish gelatin may be due to the possible low content of proline and hydroxyproline, which could result in less-organized triple helical structures. The differences among these gelatins in gel strength could be due to intrinsic characteristics, such as protein chain composition (molecular weight distribution) and amino acid content as well as the type of extraction treatments.
TABLE 15.1 Gel Point (Tgel) and Melting Temperature (Tm) of Gelatin From Various Sources
Source Tgel (°C) Tm (°C) References
Bovine 24.4 31.6 Sarbon et al. (2013)
Bovine 19.3 28.7 Norziah et al. (2009)
Chicken 24.9 33.6 Sarbon et al. (2013)
Goat skin 22.5–23.6 32.3–34.1 Mad-Ali et al. (2015)
Cod skin 8–10 Gudmundsson and Hafsteinsson (1997)
Shark skin 23 Yoshimura et al. (2000)
Pig skin 32 Yoshimura et al. (2000)
Commercial fish gelatin 17.5 25.6 Norziah et al. (2009)
Fish: Yellowfin tuna 24.3 Cho et al. (2005)
Fish: Tilapia 18.2 22.5–28.9 Jamilah and Harvinder (2002)
Fish: Tilapia (pH 5 and 8) 15–16 19 Sarabia et al. (2000)
Fish bone: Nile perch 19.5 21.4–26.5 Muyonga et al. (2004)
Swim bladders of fish: Catla
13.7 23.3 Chandra and Shamasundar (2015)
Fish: Herring species 5.1 16.7 Norziah et al. (2009)
Fish: Hammour (Grouper) 14.7 23.8 Ahmed (2016)
Rohu skin 18.5 29.3 Ninan et al. (2011)
Common carp 18.0 28.1 Ninan et al. (2011)

Rheological Properties of Gelatin and Advances in Measurement Chapter | 15 389
With an incorporation of enzyme transglutaminase (1 mg/g) to extracted fish gelatin, the gel strength improved significantly (101 g) compared to the control sample without added enzyme (69.03 g). Increasing the enzyme concentration beyond 1.0 mg/g, resulted in a decline in gel strength. This may be due to ex-cessive crosslinking that might lower the gel strength through impeding inter-molecular aggregation that reduced the gel network formation (Jongjareonrak et al., 2006). SDS-PAGE of extracted gelatin gel showed protein band intensi-ties for α1-chains (53 kDa) but these protein band intensities seemed to disap-pear when higher concentration of transglutaminase was added into gelatin.
15.8 EFFECT OF CONCENTRATION ON GELATIN GEL RHEOLOGY
The effects of gelatin concentration (1–14% w/v) on the oscillatory rheology and texture properties of type B gelatin (bovine skin gelatins BV of 100 and 200) gels were studied during cooling and heating cycles (Hsu and Jamieson, 1993; Pang et al., 2014). On cooling, from 40 to 10°C at a cooling rate of 1°C/min, the G9 of the gelatin gel (1–5%; BV of 200) increased sharply and exceeded the G0, which indicates a distinct gel formation except for a sample with a concentration of 1% (Pang et al., 2014). On the contrary, the G9 decreased sharply during the heating confirming the melting of the gel, and it was found the G0 exceeded the G9. The elasticity of gels was significantly influenced by the concentration of gelatin. Higher gelatin concentrations produce stronger gel, and higher gelling (15–22°C) and melting temperatures (29–33°C). At the gel point, a power-law frequency dependence of the viscoelastic functions G9(w), G0(w), and η*(w) was observed (Hsu and Jamieson, 1993). The power-law exponent n ranged between 0.64 and 0.72. The critical gel strength, S, increases with concentration and followed a power-type relationship: =S C0.085 1.33 in the concentration range 4–14%. A higher concentration of gelatin leads to shorter distances between gelatin coils, hence stronger and more junction zones are formed, and a higher temperature is needed to destroy the structure (Haug et al., 2004). Within experimental error, S is approximately consistent with an empirical relation suggested in the recent literature, η= ⋅−S G n n
e1
0 where Ge and η0 are the equilibrium modulus of the fully developed gel and the shear viscosity of the initial sol, respectively. It was ob-served from the texture analysis that a concentration level of 1% (w/w) was not suitable for measurement as it was too soft. The gel firmness was much higher at 5.0% concentration than at 2.5% for all gels, similar to the concentration effect on rheological results (Pang et al., 2014).
The concentration dependency gel property of shark and pig skin gelatin was examined by change in the breaking strength and dynamic viscoelasticity at 4°C (Yoshimura et al., 2000). The breaking strength of the gel increased almost linearly with the increase in the concentration for both gelatins. However, shark gelatin gel at a concentration <30 mg/mL was so weak that breaking strength could not be measured. This may suggest that the critical concentration of gel
S=0.085C1.33
S=Ge1−n⋅η0n

390 PART | II Product Specific Studies in Rheology
formation of shark gelatin is higher than that of pig gelatin. It is interesting that the 60 mg/mL concentration of shark gelatin gel is higher than that of pig gela-tin gel. The value of G9 increased with the increase in gelatin concentration and showed a parallelism to the breaking strength at <50 mg/mL concentration. It is therefore considered that the elastic term G9 can represent appropriately the physical property of gelatin gel. G9 values of shark gelatin were, at all times, similar to those of pig gelatin.
The effect of gelatin concentration on Tgel and Tm are illustrated in Fig. 15.5a. The Tm seems to be less dependent upon concentration compared to the Tgel (Haug et al., 2004). The gelling temperature increased from 4°C for 10% so-lution to 10°C for 30% solutions, while the Tm increased from approximate-ly 13–16°C. An increased concentration of fish gelatin will inevitably lead to shorter distances between the gelatin α-chains in the solution and formation of junction zones and gel network will be favored. The difference between the gell-ing and the melting temperature is most likely caused by some kinetic effects.
For type-A gelatin solution, the G9 increased with increasing concentration of the gelatin solution above 1% at a constant temperature (Zandi et al., 2007). It is well known that the plateau reflects the network structure formed by noncova-lent intermolecular bonds in gelatin solution (Bohidar et al., 2003). The absolute value of complex viscosity η* was plotted against 1/T for 1–5% (w/w) gelatin solutions (Fig. 15.6), and results show the dependence of gelation temperature on
FIGURE 15.5 Effect of gelatin concentration on gelation and melting temperature of gelatin. (From Haug et al., 2004)

Rheological Properties of Gelatin and Advances in Measurement Chapter | 15 391
gelatin concentration, which is near 10°C for the 1% solution, 20°C for the 3% solution, and 24°C for the 5% solution. During the cooling ramp, a large amount of helices are formed and the network formation is sensitive to the concentration (Duhamel et al., 2002).
The gel strength and texture profile analysis of gelatin gels (3.33 and 6.67% w/w) extracted from skins and tendons of chicken feet was measured through texture analyzer (Almeida and Lannes, 2013). It was found that the gel strength increased with increasing gelatin concentration. The hardness and chewiness increased significantly with increasing the concentration of gelatin. At a con-centration of 6.67%, the resultant gel becomes a solid, therefore, it can be used in the preparation of gelatin gums, marshmallows, and gelatin dessert among others, which require a high bloom value (Fig. 15.6).
Haug et al. (2004) used the functionality concept, f which is the number of sites available to form crosslinks for fish gelatin. It was found that the a value shows a best fit for f = 5 and 10, and a is closest to unity for f = 10. This has ear-lier been reported for mammalian gelatin (Clark and Ross-Murphy, 1985). For f = 5 and 10, c0 is approximately 2.6% (w/w) at 4°C. Previously, c0 for cod gela-tin has been found to be up to 6% (w/w) (Gilsenan and Ross-Murphy, 2000). For mammalian gelatins, c0 has been reported to be 0.4–1.2% (w/w) at room tem-perature (Clark and Ross-Murphy, 1985; Gilsenan and Ross-Murphy, 2000). This indicates that higher concentrations of fish gelatin from cold water fish species are required to form a continuous network. The gel modulus has been found to be proportional to c2 over a wide range of concentrations, and the G9 ∞ c2 when c > 20% for fish gelatin, when the exponent was greater than 2 at lower concentrations. For mammalian gelatin, it was found G9 ∞ c2 when c/c0 > 10% (Clark and Ross-Murphy, 1985).
FIGURE 15.6 Variation of the absolute value of the complex viscosity as a function of the reciprocal temperature at three concentrations 1, 3, and 5% w/w. (From Zandi et al., 2007)

392 PART | II Product Specific Studies in Rheology
15.9 EFFECT OF pH ON GELATIN GEL RHEOLOGY
Electrolytes show a significant influence on the gelation behavior of a protein solution at various ionic strengths and pH values. Some researchers believe in the possibility of direct-ion binding to the peptide backbone of collagen, while others opine that ions affect collagen folding indirectly by interacting with structurally bound water molecules (Asghar and Henrickson, 1982). Further-more, the influence of salt concentration on protein stability is very ion specific, with stabilizing or destabilizing effects typically following the Hofmeister se-ries (von Hippel and Wong, 1962). The effect of various salts on the thermal/mechanical properties of mammalian gelatins has been well documented (von Hippel and Harrington, 1959). The effects of various salts on the viscoelastic properties of a class A gelatin from megrim (Lepidorhombus boscii) skins were examined at two selected pH of 5 and 8 and two molar salt concentration at 0.5 and 0.1, and their effects were compared against commercial tilapia skin gelatin (Sarabia et al., 2000). It was observed that the Tm increased significantly by the addition of MgSO4, whereas the value lowered abruptly by addition of MgCl2.
It has been reported that the dependence of gel rigidity on pH in the region 4–10 for mammalian gelatin is more pronounced at low gelatin concentrations (Stainsby, 1987). The effects of pH (3–8) on the small deformation rheology and texture of bovine gelatin (1–5% w/v) gels were studied by Pang et al. (2014). It was observed that rheological properties of gelatin gels were independent of pH in the range pH 4.6–8.0. A similar observation has been reported for 10% (w/v) fish gelatin solution in the pH range of 5–7 (Haug et al., 2004). Furthermore, it has been observed that a change in pH and/or ionic strength has no influence on the power-law exponent or on the gel strength (Hsu and Jamieson, 1993). However, a change of pH from pH 5.5 (close to the isoelectric point) to a higher value by addition of 1 M NaCl in gelatin causes a considerable delay in gelation. On the contrary, acidification decreases the gelling rate even more drastically. At pH 3.0, the gelation was significantly hindered, possibly due to protonation of amino acids of gelatin at low pH, which prevents formation of hydrogen bonds (Pang et al., 2014). Formation of hydrogen bond is a prerequisite in form-ing the gelatin gel framework (Bello et al., 1962). The gel firmness at pH 3.0 was significantly lower compared to other pH for all gels (Fig. 15.7). The effect of pH on the firmness of gelatin gels is probably due to changes in the electro-static interactions in the system (Fiszman and Salvador, 1999). The fracturabil-ity of the gels was greatly influenced by pH. Microstructural results showed that gelatin concentration and pH had a marked influence on the gel structure.
The G9 of 10% (w/v) fish gelatin solution marginally increased between pH 7 and 10 at 4°C (Haug et al., 2004). Above pH 10, the G9 decreases, probably due to deamination of acid amides and changes in the charge density to give a high net negatively charged polymer. The increased charge density can oppose the ability of chains to make contact and form junction zones and thus decrease the gel rigidity. The two amino acids that are most likely to lose ammonia are

Rheological Properties of Gelatin and Advances in Measurement Chapter | 15 393
Gln and Asn, leading to an increase in the number of negative charges on the chain (Haug et al., 2004). The G9 at pH values below 5 also decreased markedly. This is probably due to increased net positive charge in the chains, which could inhibit junction zone formation and therefore result in declined gel rigidity.
Haug et al. (2004) found that when fish gelatin solutions of 10% were ad-justed to pH 12 and 3, and kept overnight at 4°C followed by pH adjustment to original pH value (5.2), the gel becomes too weak, and even not fit for rheo-logical measurement. The G9 lowered to a value by 1 log cycle for the sample adjusted to pH 12, whereas the sample adjusted to pH 3 formed gels with only a slightly lower storage modulus than the original FG solutions. Hence, a partial recovery of physical properties was formed. The reduction in G9 suggests that the gelatin could be degraded or chemically changed at extreme pH values.
A 10% solution has an ambient pH value of 5.2 and gels at 4.5°C and melts at 13°C (Haug et al., 2004). The change in gelling and melting temperature at varying pH values seems to have the same pH dependence as the G9, but the de-crease at high and low pH is not as pronounced as for the G9. As for the G9, the drop in Tgel and Tm is probably due to increased charge density which disfavors formation and stabilization of the gelatin network.
In addition to gel firmness, the breaking point was also recorded from the penetrometer, which is again a measure of the fracturability of the gel. At pH 5.3 and 6.6, the pure gelatin gels were not easily deformed and showed a clear breaking point during penetration (between 8 and 9 s) (Fig. 15.5b). No breaking point was detected for pure gelatin gels at pH 3.0, whereas the penetration force kept increasing until the compression completed at 10 s, indicating that the gel had no fracturability. At pH 4.6, the gelatin gel profile showed a shoulder at about 8.5 s, which indicated it had an initial resistance to penetration. At pH 8.0, no apparent breaking point was observed either. The fracturability of gels could
FIGURE 15.7 Effect of pH on texture profile of 2.5% gelatin gel. (Adapted from Pang et al., 2014)

394 PART | II Product Specific Studies in Rheology
be related to IP. However a gel at pH 4.6, which is also very close to the IP of gelatin type B, did not show apparent fracturability.
The breaking strength of the shark and pig skin gelatin gel was also influ-enced by pH (Yoshimura et al., 2000). The breaking strength of shark gelatin gel at pH 4 and 10 was remarkably lower than that at pH 6–8. The value of pig gelatin gel was almost constant in a pH range of 4–10. The results indicate that the breaking strength of shark gelatin gel is more susceptible to high or low pH than that of pig gelatin. The G9 of gelatin gel at different pH values was measured and it was found that the G9 of shark gelatin gel showed a significant decrease at pH 4 and 8, whereas that of pig gelatin gel remained constant. The pH dependency of gel property suggest that shark gelatin gel is more affected by the pH-induced electrostatic repulsion between charges and hence shows a narrower pH range to form a stable gel compared with pig gelatin.
The microstructure of gelatin gels differed significantly with pH and con-centration as illustrated in Fig. 15.8. At a concentration of 2.5% (w/w) and a pH of 6.6, it produces a dense structure with small voids and no clearly visible strands (Fig. 15.8a); however, the structure became loose and the strands could be seen clearly at lower concentration (1%) (Fig. 15.8b–f). The microstructure of pure gelatin gels was significantly influenced by pH (Fig. 15.8b–f). The mi-crostructure of 1.0% gelatin gel formed at pH 3.0 was found to be much looser with larger pores than those at higher pH (Fig. 15.8b). The microstructure be-came compact and denser at higher pH by indicating that those gels were more organized. Pure gelatin gels at pH 4.6 appeared to develop more strands than those at pH 3.0 (Fig. 15.8c). At moderate pH (5.3–6.6), the three-dimensional
FIGURE 15.8 SEM of gels: 2.5% pure gelatin gels at pH 6.6 (a); 1% pure gelatin gel at pH 3.0 (b), pH 4.6 (c), pH 5.3 (d), pH 6.6 (e) and pH 8.0 (f). (Adapted from Pang et al., 2014)

Rheological Properties of Gelatin and Advances in Measurement Chapter | 15 395
network forms, and in fact no significant differences were observed between the microstructures of pure gelatin gels studied at those pH (Fig. 15.8d,e). The mi-crostructure of the pure gelatin gel at pH 8.0 was denser with some large pores, but still individual strand could be observed (Fig. 15.8f).
15.10 EFFECT OF MOLECULAR WEIGHT
Elharfaoui et al. (2007) studied the gelation properties of bovine bone gela-tins with various molecular weights to elucidate structural properties. The helix amounts were measured by the optical rotation and enthalpy of helix formation and melting, with the same thermal protocols and for various concentrations. Comparison between the two methods allowed deriving the enthalpy of helix–coil transition and melting. Helix concentration was systematically correlated to the shear modulus of the gels at a constant frequency of 1 Hz (Fig. 15.9). Gelatin sample with high BV exhibited a single curve for G9 at selected con-centrations (4.5–22.5% w/w), while for G0 the data is a function of the gelatin concentration. The G9 curve is independent of the frequency, while G0 is much smaller and frequency dependent.
15.11 STEADY FLOW
The flow behavior of gelatin solution as a function of concentrations and tem-peratures showed non-Newtonian behavior with pseudoplastic behavior. The thixotropic area under flow curve increased with temperature at selected con-centrations (2–6.67% w/v) and it clearly indicates a structural impairment due to the temperature and shearing effect (Chandra et al., 2013). The Herschel–Bulkley and Casson models were found suitable to characterize the flow behav-ior. The steady flow behavior model parameters of gelatin including yield stress (τ0), consistency coefficient (k), and flow behavior index (n) are presented in Table 15.2. Gelatin solution at all the concentrations and temperatures exhib-ited a yield stress value and thereafter showed a shear thinning behavior. The higher magnitude of yield stress at lower temperatures indicated appearance of gel characteristics of gelatin. The consistency coefficient (k) value of gelatin obtained by Casson and Herschel–Bulkley models revealed to be dependent on concentration and temperature. It has been recognized that the shear thinning behavior represents an irreversible structural breakdown and the decrease in viscosity occurs as a result of molecular alignment that takes place within such substance (Glicksman, 1969).
15.12 CREEP
The creep behavior of gelatin gel has been reported by Hsu and Jamieson (1993). Experiments were performed on 8% gelatin using an applied stress of 1 Pa at 23°C. The results are shown in Fig. 15.10. A gradual evolution of

396 PART | II Product Specific Studies in Rheology
the creep compliance curves from Newtonian viscous behavior at gelling time 1 min to mostly elastic behavior at gelling time 74 min is observed (Fig. 15.10, shown only 1–30 and 35–40 min). Initially, the compliance curves can be fit-ted by a power-law time dependence with exponent n: γ (t) ∞ tn. It is found that, as gelation proceeds, n decreases uniformly from 1.118 to 0.563 at gelling time 43 min. During the overall transformation from sol to gel, the permanent
FIGURE 15.9 Correlation between oscillatory moduli and helical coil concentration at dif-ferent gelatin concentrations. (From Elharfaoui et al., 2007)

Rheological Properties of Gelatin and Advances in Measurement Chapter | 15 397
deformation decreases and becomes zero within experimental error at gelling time 35 min, corresponding to n = 0.70 (not shown). As in Fig. 15.10, between 35 and 40 min, the magnitude of the permanent deformation tends to vary irreg-ularly, and so does n. The nonsystematic variation in the permanent deforma-tion presumably occurs because the comparatively large strains reached during creep (∼10%) disrupt the fragile gel network clusters.
15.13 FOURIER TRANSFORM MECHANICAL SPECTROSCOPY FOR GELATIN
Recently, a powerful new experimental method termed as FTMS has explored the ways of determining the dynamic mechanical behavior of viscoelastic ma-terials. The method consists of superposing and deconvoluting discrete Fourier transforms obtained from a single stress relaxation experiment using a novel sampling scheme (Arridge and Barham, 1986). The technique shows a good agreement between the values of elastic and viscous moduli, obtained by means of the transform method, and those obtained by conventional means.
Hawkins et al. (2008) used FTMS which combines several harmonic fre-quencies in a composite test waveform to study rheological behavior of bovine gelatin gel. The particular exponent which has been used is the stress relax-ation exponent, α, which describes the inverse power-law characteristic of the stress relaxation modulus G(t), where G(t) ∼ t−α at the gel point. This is exactly similar to that detected in oscillatory shear experiments at the GP, in which the
TABLE 15.2 Casson and Herschel–Bulkley Model Parameters for Gelatin Solution at Different Concentrations and Temperatures
Concentration (mg/mL) Model
Temperature (°C) τ0 (Pa) K (Pa·sn) n (−)
20 Casson 25 0.075 3.347 × 10⁻⁴ —
Herschel–Bulkley
35 0.073 3.402 × 10⁻³ 0.76
Herschel–Bulkley
45 0.072 3.565 × 10⁻³ 0.74
45 Casson 25 0.063 4.235 × 10⁻⁴
Casson 35 0.067 3.836 × 10⁻⁴
Casson 45 0.070 3.601 × 10⁻⁴
66.7 Casson 25 0.043 5.920 × 10⁻⁴
Casson 35 0.051 4.881 × 10⁻⁴
Casson 45 0.058 4.291 × 10⁻⁴
Source: Adapted from Chandra et al. (2013)

398 PART | II Product Specific Studies in Rheology
elastic and viscous moduli [G9(w) and G0(w), respectively] scale as power laws in frequency with G9(w) ∼ G0(w) ∼ wα, a feature which enables the GP to be identified by a corresponding frequency independent of the loss tangent, tan δ (= G0/G9).
Authors studied the dynamic consequences of each frequency separately by Fourier analysis and thus time-resolved data is obtained over a range of fre-quency, in a single measurement. The lower and upper frequency limits of the FTMS waveforms employed (0.2 and 3.2 Hz, respectively) were determined by consideration of the effects of sample mutation and fluid inertia, respec-tively. FTMS tests were also carried out using a controlled stress rheometer.
FIGURE 15.10 Creep behavior of gelatin solution (8% w/w) at pH 5.5 and temperature 23°C (up-per curve measured after 1–30 min, and lower curve after 35–40 min, times are shown in descending order). (From Hsu and Jamieson, 1993)

Rheological Properties of Gelatin and Advances in Measurement Chapter | 15 399
This feature makes FTMS appropriate to measure GP based on the detection of a frequency-independent loss tangent. The adequacy of the frequency range selected for GP determination was assessed in a preliminary series of FTMS experiments by comparing the values of α obtained therefrom with those cor-responding values obtained from stress relaxation experiments.
The time-dependent shear modulus, G(t), is monitored following the sudden imposition of a predetermined level of shear strain. This is later maintained at a constant value, within the linear viscoelastic regime. The results of such tests on a sample of 10% gelatin solution at 28°C are shown in Fig. 15.11a. The post-GP regime is characterized by the development of a residual modulus, and the GP followed a power-law decay (G(t) ∼ t−α) from which the value of α is calcu-lated. The value of α so obtained (α = 0.70 ± 0.01) is in agreement with that (α = 0.69 ± 0.01) obtained from the corresponding FTMS test (Fig. 15.11b). These and other similar tests confirmed the adequacy of the FTMS frequency range for GP determination. The experiments reported involve gelatin concen-trations and temperatures which resulted in gel times in the range of 102–104 s, corresponding to the range of fast and slow gelation conditions. The values of the relaxation exponent α obtained at the gel point are found to be essentially in-dependent of temperature and concentration, with a value of α ∼ 0.69. Authors claimed that the rheometrical conditions under which rapid gelation produces anomalously low values of α and thus the appearance of low α values, can be attributed to inappropriate rheometrical procedures.
15.14 OPTIMAL FOURIER RHEOMETRY FOR GELATIN
Rheological gel point measurements may experience errors in the case of fast gelling systems due to the limitations of multiple frequency oscillatory shear techniques such as frequency sweeps and FTMS. Curtisa et al. (2015) described an alternative rapid characterization technique known as optimal Fourier rhe-ometry (OFR), which can be used to study a rapidly gelling material, namely collagen at near physiological temperatures. In contrast to FTMS, in which the perturbation signal consists of discrete frequencies, the OFR waveform undergoes a continuous frequency modulation between two predefined limits. Hence, Fourier analysis of OFR waveforms identifies a number of frequency components limited only by the sampling rate of the original perturbation and response waveforms. As a result, OFR offers two significant advantages over FTMS, namely (1) the ability to obtain very high densities of data over a finite frequency window and (2) the strain amplitude is independent of the number of component frequencies sampled.
The OFR technique is validated using a model reference gelling system (gelatin 30% w/v) whose GP characteristics have been widely reported. Two OFR waveforms were used, these being termed “low frequency” and “high frequency” (LF-OFR and HF-OFR), respectively. Gelatin gels as measured by HF-FTMS and HF-OFR showed excellent agreement between the two

400 PART | II Product Specific Studies in Rheology
FIGURE 15.11 (a) Results of stress relaxation tests on a sample of 10% gelatin solution at 28°C. The post-GP regime is characterized by the development of a residual modulus whereas the GP is characterized by a power-law decay (G(t) ∼ t−α) from which the value of α (0.7) is evaluated. (b) Results of FTMS tests on a sample of 10% gelatin solution at 28°C: the five simultaneous test fre-quencies used were 0.2, 0.4, 0.8, 1.6, and 3.2 Hz. The GP is identified by frequency independence of the loss tangent, tan δ (= G0/G9) from which the value of α (0.69) is evaluated. (From Hawkins et al., 2008)

Rheological Properties of Gelatin and Advances in Measurement Chapter | 15 401
techniques being observed and confirmed the validity of OFR for gelatin sys-tems throughout gelation. One significant argument in favor of OFR over FTMS concerns the increased number of frequency data points that can be obtained. In the context of GP measurement this allows the GP to be determined with a greater degree of precision.
15.15 CONCLUSIONS
Rheological properties of gelatin gel as influenced by concentration, pH, and source have been discussed in the chapter. Stronger and firmer gels could be formed with high gelatin concentrations, and pH affects the gel strength, signifi-cantly. The gelation and melting temperature during cooling/heating is shown clearly. Gelatin gel is a best example of reversible physical gel and the impor-tant factor for the gelatin gel is the temperature. Oscillatory rheological mea-surements to recent developments in the area of instrumentation like FTMS and OFR have been addressed. Since mammalian gelatin is well established, present focus is on the area of fish waste–based gelatin preparation, characterization, and commercial applications.
REFERENCES
Ahmed, J., 2016. Rheological properties of Hammour skin gelatin gel. Unpublished.Akhter, K.F., Zhu, J., Zhang, J., 2011. Nanoencapsulation of protein drug for controlled release. J.
Phys. Chem. Biophys. 11, 1–5. Almeida, P.F., Lannes, S.C.D., 2013. Extraction and physicochemical characterization of gelatin
from chicken by-product. J. Food Process Eng. 36, 824–833. Arridge, R., Barham, G.C., 1986. Fourier transform mechanical spectroscopy. J. Phys. D 19,
L89–L96. Asghar, A., Henrickson, R.L., 1982. Chemical, biochemical, functional, and nutritional character-
istics of collagen in food systems. In: Chichester, C.O. (Ed.), Advances in Food Research. Academic Press, London, pp. 232–372.
Baier, S.K., McClements, D.J., 2005. Influence of cosolvent systems on the gelation mechanism of globular protein: thermodynamic, kinetic, and structural aspects of globular protein gelation. Compr. Rev. Food Sci. Food Saf. 4, 43–54.
Bello, J., Vinograd, J.R., Bello, H.R., 1962. Mechanism of gelation of gelatin. The influence of pH, concentration, time and dilute electrolyte on the gelation of gelatin and modified gelatins. Biochim. Biophys. Acta 57 (2), 214–221.
Bohidar, H., Dubin, P., Osada, Y., 2003. Polymer Gels: Fundamentals and Applications. American Chemical Society, Washington, DC.
Bohidar, H., Jena, S., 1993. Kinetics of sol–gel transition in thermoreversible gelation of gelatin. J. Chem. Phys. 98, 11.
Boran, G., Mulvaney, S.J., Regenstein, J.M., 2010. Rheological properties of gelatin from silver carp skin compared to commercially available gelatins from different sources. J. Food Sci. 74, E565–E571.
Chambon, F., Winter, H.H., 1987. Linear viscoelasticity at the gel point of a crosslinking PDMS with imbalanced stoichiometry. J. Rheol. 31 (8), 683–697.

402 PART | II Product Specific Studies in Rheology
Chandra, V., Shamasundar, A., 2014. Rheological and physico-chemical properties of gelatin ex-tracted from the skin of a few species of freshwater carp. Int. J. Food Sci. Technol. 49 (7), 1758–1764.
Chandra, M.V., Shamasundar, B.A., 2015. Texture profile analysis and functional properties of gelatin from the skin of three species of fresh water fish. Int. J. Food Prop. 18 (3), 572–584.
Chandra, M.V., Shamasundar, B.A., Ramesh Kumar, P., 2013. Visco-elastic and flow properties of gelatin from the bone of freshwater fish (Cirrhinus mrigala). J. Food Sci. 78 (7), E1009–E1016.
Cho, S.M., Gu, Y.S., Cho, S.M., Gu, Y.S., Kim, S.B., 2005. Extraction optimization and physical properties of yellowfin tuna (Thunnus albacares) skin gelatin compared to mammalian gelatins. Food Hydrocoll. 19, 221–229.
Cho, S.M., Kwak, K.S., Park, D.C., Gu, Y.S., JI, C.I., Jang, D.H., Lee, Y.B., Kim, S.B., 2004. Processing optimization and functional properties of gelatin from shark (Isurus oxyrinchus) cartilage. Food Hydrocoll. 18, 573–579.
Clark, A.H., Ross-Murphy, B., 1985. The concentration dependence of biopolymer gel modulus. Br. Polym. J. 17 (2), 164–168.
Coppola, M., Djabourov, M., Ferrand, M., 2012. Unified phase diagram of gelatin films plasticized by hydrogen bonded liquids. Polymer 53 (2012), 1483–1493.
Curtisa, D.J., Holdera, A., Badieia, N., Claypolea, J., Waltersb, M., Thomasb, B., Barrowa, M., Deganelloa, D., Browna, M.R., Williamsa, P.R., Hawkins, K., 2015. Validation of Optimal Fourier Rheometry for rapidly gelling materials and its application in the study of Collagen gelation. J. Non-Newtonian Fluid Mech. 222, 253–259.
Djabourov, M., 1988. Architecture of gelatin gels. Contemp. Phys. 29 (3), 273–297. Djabourov, M., Lechaire, J.P., Gaill, F., 1993. Structure and rheology of gelatin and collagen gels.
Biorheology 30 (3–4), 191–205. Duconseille, A., Astruc, T., Quintana, N., Meersman, F., Sante-Lhoutellier, V., 2015. Gelatin
structure and composition linked to hard capsule dissolution: a review. Food Hydrocoll. 43, 360–376.
Duhamel, C.J., Hellio, D., Djabourov, M., 2002. All gelatin networks: 1. Biodiversity and physical chemistry. Langmuir 18, 7208–7217.
Elharfaoui, N., Djabourov, M., Babel, W., 2007. Molecular weight influence on gelatin gels: struc-ture, enthalpy and rheology. Macromol. Symp. 256, 149–157.
Fiszman, S.M., Salvador, A., 1999. Effect of gelatine on the texture of yoghurt and of acid-heat-induced milk gels. Z. Lebensm. Unters. Forsch. 208, 100–105.
Flory, P.J., 1941. Molecular size distribution in three dimensional polymers. I. Gelation. J. Am. Chem. Soc. 63, 3083.
Flory, P.J., 1953. Principles of Polymer Chemistry. Cornell University Press, Ithaca, NY. Flory, P.J., Weaver, E.S., 1960. Helix-coil transitions in dilute aqueous collagen solutions. J. Am.
Chem. Soc. 82, 4518–4525. Gilsenan, P.M., Ross-Murphy, S.B., 2000. Rheological characterization of gelatins from mamma-
lian and marine sources. Food Hydrocoll. 14, 191–195. Glicksman, M., 1969. Rheology, texture and gums. Gum Technology in the Food Industry. Aca-
demic Press, New York, London, pp. 56–93. Gomez-Estaca, J., Montero, P., Fernandez-Mantin, F., Gomez-Guillen, M.C., 2009. Physico-
chemical and film-forming properties of bovine-hide and tuna-skin gelatin: a comparative study. J. Food Eng. 90, 480–486.
Gomez-Guillen, M.C., Turnay, J., Fernandez-Diaz, M.D., Ulmo, N., Lizarbe, M.A., Montero, P., 2002. Structural and physical properties of gelatin extracted from different marine species: a comparative study. Food Hydrocoll. 16, 25–34.

Rheological Properties of Gelatin and Advances in Measurement Chapter | 15 403
Gudmundsson, M., Hafsteinsson, H., 1997. Gelatin from cod skins as affected by chemical treat-ments. J. Food Sci. 62, 37–47.
Guenet, J.-M., 1992. Thermoreversible Gelation of Polymers and Biopolymers. Academic Press, London.
Guo, L., Colby, R.H., Lusignan, C.P., Whitesides, T.H., 2003. Kinetics of triple helix formation in semidilute gelatin solutions. Macromolecules 36, 9999–10008.
Haug, I.J., Draget, K.I., Smidsrød, O., 2004. Physical and rheological properties of fish gelatin compared to mammalian gelatin. Food Hydrocoll. 18, 203–213.
Hawkins, K., Lawrence, M., Williams, P.R., Williams, R.L., 2008. A study of gelatin gelation by Fourier transform mechanical spectroscopy. J. Non-Newtonian Fluid Mech. 148 (1–3), 127–133.
Holly, E.E., Venkataraman, S.K., Chambon, F., Winter, H.H., 1988. Fourier transform mechanical spectroscopy of viscoelastic materials with transient nature. J. Non-Newtonian Fluid Mech. 27 (1), 17–26.
Hsu, S., Jamieson, A.M., 1993. Viscoelastic behaviour at the thermal sol–gel transition of gelatin. Polymer 34 (12), 2602–2608.
In, M., Prud’homme, R.K., 1993. Fourier transform mechanical spectroscopy of the sol–gel transi-tion in zirconium alkoxide ceramic gels. Rheol. Acta 32, 556–565.
Jamilah, B., Harvinder, K.G., 2002. Properties of gelatins from skins of fish-black tilapia (Oreo-chromis mossambicus) and red tilapia (Oreochromis nilotica). Food Chem. 77, 81–84.
Johnston-Banks, F.A., 1990. Gelatin. In: Harris, P. (Ed.), Food Gels. Elsevier Applied Sciences, New York, NY, pp. 233–289.
Jongjareonrak, A., Benjakul, S., Visessanguan, W., Tanaka, M., 2006. Skin gelatin from bigeye snapper and brownstripe red snapper: chemical compositions and effect of microbial transglu-taminase on gel properties. Food Hydrocoll. 20, 1216–1222.
Keenan, T.R., 1994. Kirk-Othmer Encyclopedia of Chemical Technologyvol. 2Wiley, New York, NY.
Kolodziejska, I., Kaczorowski, K., Piotrowska, B., Sadowska, M., 2004. Modification of the proper-ties of gelatine from skins of Baltic cod (Gadus morhua) with transglutaminase. Food Chem. 86, 203–209.
Lai, J.-Y., 2009. The role of bloom index of gelatin on the interaction with retinal pigment epithelial cells. Int. J. Mol. Sci. 10, 3442–3456.
Ledward, D.A., 1986. Gelation of gelatin. In: Mitchell, J.R., Ledward, D.A. (Eds.), Functional Prop-erties of Food Macromolecules. Elsevier Applied Science Publishers, London, pp. 171–201.
Ledward, D.A., 1992. Gelation. Food Sci. Technol. Today 6 (4), 236–241. Leuenberger, B.H., 1991. Investigation of viscosity and gelatin properties of different mammalian
and fish gelatins. Food Hydrocoll. 5 (4), 353–361. Liu, H., Li, D., Guo, S., 2008. Rheological properties of channel catfish (Ictalurus punctatus) gela-
tine from fish skins preserved by different methods. LWT—Food Sci. Technol. 41, 414–419. Mad-Ali, S., Benjakul, S., Prodpran, T., Maqsood, S., 2015. Characteristics and gel properties of
gelatin from goat skin as affected by pretreatments using sodium sulfate and hydrogen perox-ide. J. Sci. Food Agric. 96, 2193–2203.
Morris, E.R., Nishinari, K., Rinaudo, M., 2012. Gelation of gellan—A review. Food Hydrocoll. 28, 373–411.
Muyonga, J.H., Cole, C.G.B., Duodu, K.G., 2004. Extraction and physico-chemical characterisa-tion of Nile perch (Lates niloticus) skin and bone gelatin. Food Hydrocoll. 18, 581–592.
Ninan, G., Jose, J., Abubacker, Z., 2011. Preparation and characterization of gelatin extracted from the skins of rohu (Labeo rohita) and common carp (Cyprinus carpio). J. Food Process. Preserv. 35, 143–162.

404 PART | II Product Specific Studies in Rheology
Norland, R.E., 1990. Fish gelatin. In: Voight, M.N., Botta, J.K. (Eds.), Advances in Fisheries Tech-nology and Biotechnology for Increased Profitability. Technomic Publishing Co., Lancaster, PA, pp. 325–333.
Norziah, M.H., Al-Hassan, A., Khairulnizam, A.B., Mordi, M.N., Norita, M., 2009. Characteriza-tion of fish gelatin from surimi processing wastes: thermal analysis and effect of transglutamin-ase on gel properties. Food Hydrocoll. 23, 1610–1616.
Ockerman, H.W., Hansen, C.L., 1994. Industrialización de subproductos de origen animal, first ed. Acribia, Zaragoza.
Pang, Z., Deeth, H., Sopade, P., Sharma, R., Bansal, N., 2014. Rheology, texture and microstructure of gelatin gels with and without milk proteins. Food Hydrocoll. 35, 484–493.
Patel, Z.S., Yamamoto, M., Ueda, H., Tabata, Y., Mikos, A.G., 2008. Biodegradable gelatin mic-roparticles as delivery systems for the controlled release of bone morphogenetic protein-2. Acta Biomater. 4, 1126–1138.
Ross-Murphy, S.B., 1992. Structure and rheology of gelatin gels. Recent Progr. Polym. 33, 2622–2627.
Sarabia, A.I., Gomez-Guillen, M.C., Montero, P., 2000. The effect of added salts on the viscoelastic properties of fish skin gelatin. Food Chem. 70, 71–76.
Sarbon, N.M., Badii, F., Howell, N.K., 2013. Preparation and characterisation of chicken skin gela-tin as an alternative to mammalian gelatin. Food Hydrocoll. 30, 143–151.
Schrieber, R., Gareis, H., 2007. Gelatin Handbook: Theory and Industrial Practice. Wiley-VCH Verlag GmbH & Co. KGaA, Weinheim.
Segtnan, V.H., Isaksson, T., 2004. Temperature, sample and time dependent structural characteris-tics of gelatine gels studied by near infrared spectroscopy. Food Hydrocoll. 18, 1–11.
Sperling, L.H., 1985. Introduction to Physical Polymer Science. John Wiley & Sons, New York, NY, p. 440.
Stainsby, G., 1987. Gelatin gels. Pearson, A.M., Dutson, T.R., Baily, A.J. (Eds.), Collagen as Food: Advance in Meat Research, vol. 4, Van Nostrand Reinhold, New York, NY, pp. 209–222.
Stauffer, D., Coniglio, A., Adam, M., 1982. Gelation and critical phenomenon. Adv. Polym. Sci. 44, 103–158.
Tanaka, Y., 2012. Viscoelastic properties for sol–gel transition. In: De Vicente, J. (Ed.), Rheology. InTech, Rijeka, Croatia, p. 350 pp.
von Hippel, P.H., Harrington, W.F., 1959. Enzymic studies of the gelatin to collagen-fold transition. Biochim. Biophys. Acta 36, 427–447.
von Hippel, P.H., Wong, K., 1962. The effect of ions on the kinetics of formation and the stability of the collagen-fold. Biochemistry 1 (4), 664–674.
Ward, A.G., 1954. The physical properties of gelatin solutions and gels. J. Appl. Phys. 5, 85–90. Winter, H.H., 1987. Evolution of rheology during chemical gelation. Prog. Colloid Polym. Sci. 75,
104–110. Winter, H.H., Chambon, F., 1986. Analysis of linear viscoelasticity of a cross-linking polymer at
the gel point. J. Rheol. 30, 367–382. Yoshimura, K., Terashima, M., Hozan, D., Ebato, T., Nomura, Y., Ishii, Y., Shirai, K., 2000. Physi-
cal properties of shark gelatin compared with pig gelatin. J. Agric. Food Chem. 48, 2023–2027. Zandi, M., Mirzadeh, H., Mayer, C., 2007. Early stages of gelation in gelatin solution detect-
ed by dynamic oscillating rheology and nuclear magnetic spectroscopy. Eur. Polym. J. 43, 1480–1486.

405Advances in Food Rheology and Its Applications. http://dx.doi.org/10.1016/B978-0-08-100431-9.00016-4Copyright © 2017 Elsevier Ltd. All rights reserved.
Chapter 16
Rheology and Texture of Basil Seed Gum: A New Hydrocolloid Source
S.M.A. Razavi, S. Naji-TabasiFood Hydrocolloids Research Centre, Department of Food Science and Technology, Ferdowsi University of Mashhad (FUM), Mashhad, Iran
16.1 INTRODUCTION
Basil seed gum (BSG) is a novel plant-derived hydrocolloid with outstanding functional properties which is comparable with some commercial gums (Razavi et al., 2009). Basil seeds swell after soaking in water and thick mucilage cover them, which is extracted as gum. The high molecular weight (2320 kDa) of BSG imparts high viscous solution and shear thinning behavior which is stable under different conditions such as heating, freezing/thawing, ionic strength, pH, and the presence of sugar. BSG is characterized as an anionic heteropolysaccharide containing glucomannan, which is composed of two major fractions with dif-ferent molecular weights and monosaccharides units (Naji-Tabasi et al., 2016). BSG offers various application potentials in food and pharmaceutical systems and can be used as a thickener, gelling agent, emulsion and foam stabilizer, fat replacer, edible film former, and ice crystal growth inhibitor (Khazaei et al., 2014; Mohammad-Amini et al., 2015; Naji-Tabasi et al., 2016; Osano et al., 2014; Hosseini-Parvar et al., 2014; Niknia et al., 2011; BahramParvar and Goff, 2013; Razavi et al., 2012; Rafe and Razavi, 2013a). Interesting rheological properties of BSG make it a proper synergistic gel, which can be applied in real food systems such as dairy desserts (Rafe and Razavi, 2013a; Naji-Tabasi et al., 2016).
The rheological behavior of BSG is of special importance when it is used to improve functional properties of food. In this chapter, the rheological and textural characteristics of BSG as a natural hydrocolloid will be discussed in detail and its potential applications will be clarified as a novel gum in the food industry.

406 PART | II Product Specific Studies in Rheology
16.2 BASIL (OCIMUM)
The genus Ocimum L. is a member of the Labiatae family, collectively called basil (Fig. 16.1a). The name basil comes from the Greek basilikos, mean-ing royal. Basil is one of the most popular and useful culinary and the main utilization forms of different basil types are fresh basil, frozen, dried, essential oil, and medicinal uses (Putievsky and Galambosi, 1999). The genus Ocimum includes 35–150 species of annual and perennial herbs and shrubs native in Asia, Africa, South, and Central America, but widely distributed around the world (Paton et al., 1999; Truta and Zamfirache, 2013). Ocimum basilicum L. (sweet basil) is economically the most important and the most widely used (Truta and Zamfirache, 2013), which is grown in India, Iran, and in some warm regions of Africa (Osano et al., 2014).
FIGURE 16.1 (a) Basil plant, (b) basil seeds, (c) the seeds soaked in water, (d) mucilaginous mass, and (e) basil seed gum powder.

Rheology and Texture of Basil Seed Gum Chapter | 16 407
The great popularity of basil sets a continuing demand for seeds and thus for seed production (Putievsky and Galambosi, 1999). As seen in Fig. 16.1b, basil seed is black in color and oval in shape with mean dimensions of 3.22 ± 0.33 mm (length), 1.84 ± 0.24 mm (width), and 1.37 ± 0.24 mm (height) (Hosseini- Parvar et al., 2010).
The seeds of O. basilicum are high in fiber (22.6%) and in some regions of Asia like Iran and India, basil seeds are frequently included in beverages (Sharbat) and ice desserts (Faloodeh) for aesthetic purposes as well as a source of dietary fiber (Hosseini-Parvar et al., 2010; Mäkinen and Pääkkönen, 1999; Mathews et al., 1993).
16.3 BASIL SEED MUCILAGE
Mucilage is a complex carbohydrate with a great capacity to absorb water. Some seeds like basil seeds contain large amounts of mucilage. Basil seeds consist of an inner hard core and a pectinous fibrillar outer layer (Melo and D’souza, 2004). The outer pericarp (or outer epidermis) of seeds, when soaked in water, soon swells into a gelatinous mass (Fig. 16.1c,d) (Azuma and Sakamoto, 2003) and the high mucilage content of basil seeds can make it a novel source of edible gum (Razavi et al., 2010). The polysaccharides extracted from basil seeds by cold water extraction and alcohol precipitation, have two major fractions: (1) an acid-stable core glucomannan (43%) having a ratio of glucose to mannose 10:2 and (2) a (1 → 4)-linked xylan (24.29%) having acidic side chains at C-2 and C-3 of the xylosyl residues in acid-soluble portion. Also, a minor fraction of glucan (2.31%) as a degraded cellulose material with DP = 80 has been reported (Anjaneyalu and Gowda, 1979; Tharanathan and Anjaneyalu, 1975).
16.3.1 Extraction Optimization
The extraction process of BSG is spontaneous, irreversible, and endothermic as ∆H (0.26–7.87) and ∆S (8.12–33.2) are positive and ∆G (1.62–4.42) is negative (Salehi et al., 2015). Razavi et al. (2009) have reported the optimum extrac-tion conditions of BSG in terms of pH, temperature, and water/seed ratio. The extraction conditions significantly alter extraction yield, apparent viscosity, and protein content. The most important variable in this process is temperature. Nu-merical optimization determines the optimum extraction conditions as being temperature (69°C), pH (8) and water/seed ratio (66:1), resulting in the 20.49% extraction yield, 581.37 mPa·s apparent viscosity (at 0.8%, 98.9 s−1, and 25°C) and 2.17% protein content (Razavi et al., 2009). The extraction of gum from basil seeds was modified by Hosseini-Parvar et al. (2010) and collected gum dried by freeze-dried instead of vacuum oven at 50°C (Fig. 16.1e). Modifying the extraction method of BSG significantly increases apparent viscosity, total carbohydrate, and ash contents, whereas decreases amount of fat and protein (Osano et al., 2010).

408 PART | II Product Specific Studies in Rheology
In another study, the extraction condition has been optimized just according to extraction yield as a function of temperature (20, 50, and 80°C), pH (5, 7, and 9) and the ratio of water to seed (20:1 and 30:1). The maximum extraction yield from basil seed is 17.95% at 50°C, pH = 7 and water to seed 30:1. The extraction temperature and time are introduced as the most important factors that influence extraction yield. The extraction at elevated temperature resulted in faster and easier mass transfer of water-soluble polysaccharide from the cell wall into the extract. At higher temperatures, the viscosity of mucilage decreas-es and makes the slurry less sticky and the mucilage can be easily released. As a result, the mass transfer coefficient of the extraction process increases with temperature, thus affecting the diffusion and viscosity (Salehi et al., 2015).
16.3.2 Physicochemical Properties
The chemical composition of crude and purified BSG is presented in Table 16.1 (Razavi et al., 2009). It can be found that purification has a significant influence on chemical composition of BSG. BSG is a high molecular weight polysaccha-ride (2320 kDa), which contains two fractions according to molecular weight distribution: PER-BSG with higher molecular weight (5980 kDa) and yield (67%) and SUPER-BSG fraction which has lower yield (31%) and molecular weight (1045 kDa) (Naji-Tabasi et al., 2016). BSG consists of 2.2, 5.7, 4.1, 8.9, 16.1, 29.6, and 0.4% (w/w) rhamnose, arabinose, xylose, mannose, galactose, glucose, and galacturonic acid, respectively (Hosseini-Parvar, 2009).
16.3.3 Rheological Properties
16.3.3.1 Dilute Solution PropertiesThe intrinsic viscosity of dialyzed BSG in deionized water according to Huggins (Eq. 16.3) and Kraemer (Eq. 16.4) equations are 8.3962 and 8.382 dL/g, respec-tively (Hosseini-Parvar, 2009).
TABLE 16.1 Chemical Composition of Basil Seed Gum (Razavi et al., 2009)a,b
Chemical properties (%) Crude Purified
Moisture 7.39 ± 0.18 5.79 ± 0.12
Protein 2.01 ± 0.11 1.56 ± 0.08
Lipid 11.55 ± 0.29 9.71 ± 0.25
Ash 5.88 ± 0.14 3.32 ± 0.17
Carbohydrate 74.19 ± 0.61 79.62 ± 0.86
aValues are mean ± SD.bBased on dry material.

Rheology and Texture of Basil Seed Gum Chapter | 16 409
η η η( ) = /rel s (16.1)
η η η η η( )= − = −/ 1sp s s rel (16.2)
η η η[ ] [ ]= +C K C/sp H2 (16.3)
η η η[ ]( ) = + Kln / C Crel K2 (16.4)
where ηrel (Eq. 16.1) and ηsp (Eq. 16.2) are relative and specific viscosities (dimensionless); η and ηs are the viscosity of the solution and solvent, respec-tively. The KH and KK of BSG are 0.362 and –0.144, which confirms random coil conformation of BSG in dilute regime. Theoretically, the relationship KH + KK = 0.5 is proved for biopolymer with random coil conformation (Hosseini-Parvar, 2009). In some cases, deviations from the theoretical value occur which are attributed to molecular association (Mohammad-Amini et al., 2015).
In another study, the intrinsic viscosity of BSG has been studied without dialyzed treatment and higher intrinsic viscosity value (39.17 dL/g) has been obtained, as shown in Table 16.2. Berry number (C[η]) confirms the ab-sence of molecular entanglements as C[η] of semidilute regime exists in the range of 1.0–10.0. PER-BSG fraction shows the smallest intrinsic viscosity value (28.73 dL/g), whose lower intrinsic viscosity with its higher molecular weight properties shows more compact conformation in comparison with BSG and SUPER-BSG (Table 16.2) (Naji-Tabasi et al., 2016). SUPER-BSG fraction shows the highest chain flexibility as it has the lowest KH (0.11). The value
ηrel=η/ηs
ηsp=η−ηs/ηs=ηrel−1
ηsp/C=η+KHη2C
lnηrel/C=η+KKη2C
TABLE 16.2 Dilute Solution Properties of BSG and Its Fractions (Naji-Tabasi et al., 2016)a
Fractions [η] dL g−1 KH KH + KK C[η] b
BSG 39.17 ± 0.23 A
0.188 ± 0.008 B
0.455 ± 0.04 A
0.22–0.91 1.19 ± 0.012 A
PER-BSG 28.73 ± 0.97 C
0.357 ± 0.017 A
0.483 ± 0.04 A
0.25–0.89 1.22 ± 0.023 A
SUPER-BSG
32.49 ± 1.24 B
0.105 ± 0.060 C
0.417 ± 0.05 B
0.24–0.98 1.15 ± 0.023 A
[η], intrinsic viscosity; KH, Huggins constants; KK, Kraemer constants; (C[η]) Berry number; b, polysaccharides conformation indicator.aMeans in a column followed by the different letters are significantly different at P ≤ 0.05 by Duncan test.

410 PART | II Product Specific Studies in Rheology
of KH for uncharged spheres can be as high as ∼2. Lower value is expected for more extended biopolymer, such as ∼0.35 for flexible biomolecules (Qian et al., 2012). BSG flexibility is between PER-BSG and SUPER-BSG (Naji-Tabasi et al., 2016).
The power-law relation estimates exponent b from the slope of a double logarithmic plot of specific viscosity against concentration which reveals the conformation of polysaccharides (Eq. 16.5). The b value greater than unity is associated with random coil conformation in dilute regimes, and values less than unity have been reported to be related to rod-like conformation (Morris et al., 1981; Lapasin and Pricl, 1995). As seen in Table 16.2, the b value of BSG, PER-BSG, and SUPER-BSG reveals their random coil conformation (Higiro et al., 2007; Lai et al., 2000).
η = aCbsp (16.5)
16.3.3.1.1 Effect of Salt
Effect of ionic strength on hydrodynamic volume of BSG has been investigated by Hosseini-Parvar (2009). Salt solution (NaCl 0.1 M) decreases intrinsic vis-cosity value of the dialysed BSG solution. According to Huggins and Kraemer equations, the intrinsic viscosity of BSG in salt solution is 4.308 and 4.297 dL/g, respectively. Then, KH + KK value is 0.471, which shows the random coil struc-ture of BSG in this ion power. Decreasing viscosity of BSG with increasing ion power reflects that this gum in low ion power (deionized water) has highly expanded conformation because of electrostatic repulsion of negative charged side chains. Salt covers these side chains and leads to side chains gather into main chain. Therefore, the molecular structure of BSG becomes more compact and its hydrodynamic volume decreases (Hosseini-Parvar, 2009).
16.3.3.2 Steady Shear Flow Properties16.3.3.2.1 Shear Dependence
BSG solutions exhibit pseudoplastic behavior where the apparent viscosity de-creases rapidly at low shear rates (from 0.001 to 1.00 s−1) but less rapidly at higher shear rate range (1.0–1000 s−1), as shown in Fig. 16.2. No Newtonian re-gion observes at low shear rates, which suggests that BSG has a high zero-shear viscosity. The zero-shear viscosity for BSG could be even higher than xanthan gum since BSG has a steeper slope at the low shear rate range. Polysaccharide molecules with stiff conformation contribute to high zero-shear rate viscosity and possess strong shear thinning properties. Since stiff polymer molecules are quickly aligned in the direction of flow as the shear rate increases, physi-cal interactions between adjacent polymer chains decrease (Hosseini-Parvar et al., 2010). A high shear thinning property of polysaccharides allows liquid foods to be pumped easily and imparts a thinner consistency during swallowing
ηsp=aCb

Rheology and Texture of Basil Seed Gum Chapter | 16 411
(Vardhanabhuti and Ikeda, 2006). BSG has high viscosity which is equal to xanthan gum (Fig. 16.2). High viscosity of BSG is attributed to its high mo-lecular weight.
The Herschel–Bulkley model (Eq. 16.6) gives the best fit for the flow behav-ior of BSG in the shear rate range of 0.1–1000 s−1 among the time-independent rheological models at different concentrations and temperatures (Table 16.3).
τ τ γ= + k n0 (16.6)
where τ is the shear stress (Pa), is the shear rate (s−1), k is the consistency coef-ficient (Pa·sn), n is the flow behavior index (dimensionless), and τ0 (Pa) is the yield stress.
As seen in Table 16.3, the magnitudes of n, k, and τ0 are in the range of 0.276–0.547, 0.378–24.196 Pa·sn and 0.697–11.943 Pa, respectively, across different concentrations (0.5–2.0%) and temperatures (5–85°C). BSG like xan-than gum shows yield stress (Fig. 16.3). The appearance of a high yield stress implies that BSG has high suspension ability, which is a useful property when used as a stabilizer in food products such as mayonnaise and salad dressings.
As seen in Fig. 16.3, the shear stress values of BSG diminished from very low shear rates (10−3–10−1 s−1). This phenomenon can be interpreted as the result of the existence of a static and a dynamic yield stress. Hosseini-Parvar et al. (2010, 2014) have stated that this may reflect the complex nature of BSG composing more than two different polysaccharide fractions (Hosseini-Parvar et al., 2010). Fractionation of BSG by nonsolvent fractionation method (ethanol
τ=τ0+kγ˙n
FIGURE 16.2 High zero-shear viscosity of 1% BSG solution in comparison with 1% of xan-than, konjac, and guar gum (Hosseini-Parvar et al., 2010).

412 PAR
T |
II Product Specific Studies in Rheology
TABLE 16.3 Effect of Concentration and Temperature on Rheological Parameters of BSG Solutions Based on Herschel–Bulkley Model (Hosseini-Parvar et al., 2010)
Concentration (%) Temperature (°C) τ0 (Pa) n (−) k (Pa·sn) R2
5 0.808 ± 0.150 0.494 ± 0.003 1.033 ± 0.044 0.974
20 0.929 ± 0.228 0.547 ± 0.038 0.547 ± 0.181 0.992
0.5 40 0.754 ± 0.021 0.509 ± 0.028 0.580 ± 0.118 0.987
60 0.697 ± 0.105 0.514 ± 0.041 0.491 ± 0.166 0.986
85 0.995 ± 0.174 0.544 ± 0.017 0.378 ± 0.046 0.986
5 1.590 ± 0.021 0.351 ± 0.012 6.077 ± 0.067 0.978
20 3.469 ± 0.883 0.392 ± 0.080 3.883 ± 1.707 0.981
1.0 40 1.391 ± 0.057 0.341 ± 0.002 4.342 ± 0.115 0.977
60 1.170 ± 0.015 0.341 ± 0.008 3.833 ± 0.081 0.972
85 2.738 ± 0.139 0.475 ± 0.010 1.691 ± 0.036 0.951
5 1.378 ± 0.345 0.295 ± 0.003 15.304 ± 0.143 0.983
20 4.160 ± 0.695 0.336 ± 0.058 12.302 ± 0.667 0.990
1.5 40 2.447 ± 1.558 0.29 ± 0.006 10.642 ± 0.403 0.978
60 2.667 ± 0.585 0.351 ± 0.031 6.239 ± 0.641 0.970
85 4.980 ± 0.317 0.413 ± 0.005 3.507 ± 0.271 0.941
5 2.984 ± 0.785 0.276 ± 0.015 24.196 ± 2.988 0.990
20 11.943 ± 0.953 0.334 ± 0.024 15.982 ± 0.521 0.991
40 2.023 ± 1.065 0.303 ± 0.001 16.812 ± 0.679 0.992
60 2.365 ± 0.490 0.317 ± 0.018 13.786 ± 1.23 0.983
85 6.417 ± 1.329 0.391 ± 0.096 6.771 ± 1.606 0.948

Rheology and Texture of Basil Seed Gum Chapter | 16 413
precipitation) confirms this conclusion as two fractions are obtained (Naji-Tabasi et al., 2016).
16.3.3.2.1.1 Effect of Concentration Fig. 16.4 illustrates the influence of BSG concentration on its steady shear viscosity. The BSG solution has high viscosity even at low concentration (0.1% w/w) and apparent viscosity decreas-es rapidly by shear rate increment at all concentrations. These behaviors ex-ist in hydrocolloids such as xanthan, pectin, and galactomannans, which show high viscosity and shear thinning behavior at low concentrations (Towel and Christensen, 1959). The yield stress (τ0) and consistency coefficient (k) of BSG solutions increase with increasing concentration, but flow behavior index (n) decreases (Table 16.3) (Hosseini-Parvar et al., 2015).
As shown in Table 16.4, the Power model (Eq. 16.7) is the best model to describe concentration dependence of apparent viscosity in comparison with exponential model (Eq. 16.8) and polynomial model (Eq. 16.9):
η = a Cb1
1 (16.7)
η ( )= a b Cexp2 2 (16.8)
η = + +a C b C1 3 32 (16.9)
η=a1Cb1
η=a2expb2C
η=1+a3C+b3C2
FIGURE 16.3 Illustration of yield stress in 1% BSG in comparison with 1% of xanthan, konjac, and guar gum (Hosseini-Parvar et al., 2010).

414 PART | II Product Specific Studies in Rheology
where C is the concentration of BSG solution in percentage, a1; a2; a3; b1; b2; and b3 are constants.
A strong effect of gum concentration on the apparent viscosity of the BSG solutions shows 240, 513, and 980% increase in viscosity as the concentra-tion increases from 0.5% to 1%, 1.5%, and 2% w/w, respectively. As seen in Table 16.3, n decreases and k increases, with increasing BSG concentration at a fixed temperature, whereas the yield stress alterations with increment of BSG concentration do not have clear trend (Hosseini-Parvar et al., 2010).
16.3.3.2.1.2 Effect of Temperature As shown in Table 16.3, the consis-tency coefficient clearly decreases with increase in temperature from 5 to 85°C for each BSG concentration. However, the flow behavior index and the yield stress do not follow a clear trend with temperature increase. An increase in the flow behavior index with temperature indicates that the gum becomes less pseudoplastic especially at low shear rates; however, change in n values of BSG with increasing temperature is smaller than those reported for Monoi gum, guar gum, and carrageenan. Fig. 16.5 shows the apparent viscosity of BSG (1% w/w) decreases with increasing temperature from 5 to 60°C. However, the viscos-ity increases when temperature rises to 85°C. The temperature dependence of BSG solutions at temperatures of 5, 20, 40, and 60°C follows an Arrhenius-type model (Eq.16.10) (Hosseini-Parvar et al., 2010):
η η= E RTexp( / )0 a (16.10)η=η0exp(Ea/RT)
FIGURE 16.4 Shear thinning properties of different concentrations (0.1–2%) of BSG solutions (Hosseini-Parvar et al., 2010).

Rheology and Texture of B
asil Seed Gum
Ch
apter |
16
415
TABLE 16.4 Concentration Dependence of BSG Apparent Viscosity (100 s−1) at Various Temperatures Determined Using Eqs. 7–9 (Hosseini-Parvar et al., 2010)
Temperature (oC)
Power Exponential Polynomial
a1 b1 MRD (%) a2 b2 MRD (%) a3 b3 MRD (%)
5 0.297 1.585 0.20 0.057 1.445 8.47 −1.594 0.795 25.08
20 0.235 1.693 1.82 0.040 1.546 9.28 −1.671 0.803 31.77
40 0.203 1.713 0.53 0.034 1.567 8.64 −1.681 0.784 36.13
60 0.177 1.716 2.77 0.029 1.585 6.32 −1.723 0.790 47.15
85 0.211 1.515 5.52 0.046 1.350 13.40 −1.568 0.699 36.08

416 PART | II Product Specific Studies in Rheology
where η0 is the frequency factor or viscosity coefficient at infinite temperature (Pa·s), Ea is the activation energy (kJ/kmol), R is the gas constant (kJ/kmol.K), and T is the absolute temperature (K). An increase in activation energy from 7.64 to 8.04 kJ/kmol occurs with increasing BSG concentration from 0.5% to 1%. However, increasing the concentration from 1% to 2% decreases the acti-vation energy from 6.83 to 4.99 kJ/kmol (Hosseini-Parvar et al., 2010).
16.3.3.2.1.3 Effect of pH Fig. 16.6 shows changes of apparent viscosity by alteration of pH values. The rheological behavior of BSG is governed by
FIGURE 16.5 Changing the apparent viscosity (at 100 s1) of 1% BSG at different tempera-tures (Hosseini-Parvar et al., 2010).
FIGURE 16.6 Influence of pH changes on BSG apparent viscosity (1% w/w, 100 s−1 and 20oC) (Hosseini-Parvar, 2009).

Rheology and Texture of Basil Seed Gum Chapter | 16 417
acidic pHs. The acidic pH (<6) reduces greatly the apparent viscosity of BSG solution, but alkaline pH (>6) has negligible influence on viscosity (Hosseini-Parvar, 2009). Phillips and Williams (2000) have reported that the apparent viscosity of galactomannans at low and high pHs decreases. Amin et al. (2007) have also observed that durian seed gum viscosity increases with pH increment from 2 to 7 and again decreases at higher pH (7–10). Glicksman (1982) has reported this phenomenon as a usual behavior in most hydrocolloids.
16.3.3.2.1.4 Effect of Sugar The apparent viscosity of the BSG solution (1% w/w) increases at high concentrations of sucrose (30–50%), but there is no significant alteration by adding sucrose at 5–20% concentration (Fig. 16.7) (Hosseini-Parvar, 2009). Sucrose reduces polymer chain mobility; such a re-duction in mobility would favor helix nucleation and inhibit the growth process, which would here be the packing of the helices into thick bundles (Normand et al., 2003). Also, high concentration of sucrose promotes gelling behavior of BSG solution and increases storage modulus value, which is discussed more in Section 16.3.3.3.4.
16.3.3.2.1.5 Effect of Salt As mentioned before, sodium chloride (1 M) slightly reduces intrinsic viscosity of BSG. However, ionic power increment of BSG solution (1% w/w) by sodium chloride does not have significant influence on its steady shear rheological behavior and apparent viscosity value, as shown in Fig. 16.8 (Hosseini-Parvar, 2009).
16.3.3.2.1.6 Effect of Freezing/Thawing Treatment As seen in Fig. 16.9, freeze–thawing treatment of BSG at −18°C for 24 h exhibited the stability of apparent viscosity (Hosseini-Parvar et al., 2010). Zameni et al. (2014) have also reported BSG viscosity stability after freezing at −18 and −25°C for 24 h. The shear-thinning behavior of BSG preserves after freezing (Table 16.5).
FIGURE 16.7 Influence of sucrose concentration on the BSG apparent viscosity (1% w/w, 100 s−1 and 20°C) (Hosseini-Parvar, 2009).

418 PART | II Product Specific Studies in Rheology
The consistency coefficient (k) increases after freezing, but no significant dif-ference exists between freezing treatments. When the temperature declines below subzero, the unfrozen phase becomes maximally concentrated as more and more water molecules crystallize into ice; ultimately this phase will re-main unfrozen due to the high concentration of present solutes. This unfrozen phase is highly viscous. The polymer concentration increases by conversion of
FIGURE 16.8 Influence of sodium chloride on BSG apparent viscosity (1% w/w, 100 s−1 and 20°C) (Hosseini-Parvar, 2009).
FIGURE 16.9 Effect of heat and freeze-thaw treatments on the BSG apparent viscosity (1% w/w, 20°C) (Hosseini-Parvar et al., 2010).

Rheology and Texture of Basil Seed Gum Chapter | 16 419
water to ice, which results in chain aggregation and remains stable after freezing (Zameni et al., 2014).
16.3.3.2.1.7 Effect of Heating Treatment Heat stability of BSG solution has been evaluated after various heating treatments including 40°C, 30 min; 60°C, 30 min; 85°C, 30 min; 100°C, 30 min; and 121°C, 16 min. As seen in Fig. 16.9, the apparent viscosity of BSG before and after heat treatments as well as after a freeze/thaw cycle are nearly identical (Hosseini-Parvar et al., 2010). Continuous study confirmed that heat treatment (25, 50, 75, 100, and 121°C for 20 min) increases BSG viscosity and improves its rheological properties. The consistency coefficient (k) of BSG solution (0.2% w/w) increases significantly (p < 0.05) after heating (Table 16.6). Heating at 121°C for 20 min is the most effective treatment. This viscosity increment demonstrates that an irreversible intermolecular arrangement occurs in BSG by heat treatment. Flow behavior index (n) decreases with increasing temperature. However, treatments of 50, 75, and 100°C are not significantly different (p > 0.05).
TABLE 16.5 The Rheological Parameters of Power-Law Model Obtained for BSG Solution (0.2% w/w) at Different Freezing Conditions (Zameni et al., 2014)a
Treatment (oC) K (Pa·sn) n (−) R2
25 0.057b 0.56a 0.999
−18 0.12a 0.43b 0.996
−25 0.11a 0.42b 0.995
aK, consistency coefficient; n, flow behavior index.
TABLE 16.6 The Rheological Parameters of Power-Law Model Obtained for BSG Solution (0.2% w/w) at Different Heating Conditions (Zameni et al., 2014)a
Treatment (oC) K (Pa·sn) n (−) R2
25 0.057c 0.56a 0.999
50 0.068bc 0.51ab 0.995
75 0.077bc 0.50ab 0.999
100 1.000b 0.49b 0.998
121 0.180a 0.42c 0.996
aK, consistency coefficient; n, flow behavior index.

420 PART | II Product Specific Studies in Rheology
16.3.3.2.2 Time Dependence
Step changes of shear rate and its influence on BSG rheological behavior (1 and 1.5% w/w) illustrate the time dependence (thixotropy) of BSG more obviously at high shear rate, as shown in Fig. 16.10 (Hosseini-Parvar, 2009).
The time-dependent data of BSG solutions (1, 1.5, 2, and 3% w/w) fitted with the first-order stress decay with a nonzero equilibrium stress (Eq. 16.11) and Weltman (Eq.16.12) models are shown in Table 16.7.
τ τ τ τ( )− = − −e kteq 0 eq (16.11)
where τ 0,τ eq, and k are the initial shear stress (Pa), the equilibrium shear stress (Pa), and the breakdown rate constant (1/s), respectively.
τ ( )= +A B tln (16.12)
where A and B are initial shear stress (Pa) and extent of breakdown (Pa), re-spectively.
The experimental data fitted well to the first-order stress decay, with a non-zero equilibrium stress model, with higher R2 values (Table 16.7). The results indicate that higher concentration causes stronger links between BSG polymer-ic chains and increases extent of structuring; therefore the values of τ0, τeq, and A increase (Table 16.7) (Hosseini-Parvar, 2009). The negative B values confirm thixotropic behavior of BSG solution. Association between chains increases
τ−τeq=τ0−τeqe−kt
τ0τeq
τ=A+Blnt
FIGURE 16.10 Influence of step changes of shear rate on the BSG time dependence (1 and 1.5% w/w; 20°C) (Hosseini-Parvar, 2009).

Rheology and Texture of B
asil Seed Gum
Ch
apter |
16
421
TABLE 16.7 The Parameters of First-Order Stress Decay Model, With a Nonzero Equilibrium Stress and Weltman Model Obtained for Various Shear Rates and BSG Concentrations at 20oC (Hosseini-Parvar, 2009)
Concentration (%) Shear rate (s−1)
First-order stress decay model Weltman model
τ0 (Pa) τeq (Pa) k (s−1) R2 A (Pa) -B (Pa) R2
1 1 8.69 6.05 0.04443 0.97 6.84 0.12 0.36
1 10 11.21 8.06 0.00815 0.94 12.35 0.65 0.92
1 50 19.53 16.41 0.03814 0.97 17.67 0.20 0.52
1 100 24.50 21.55 0.03951 0.93 22.82 0.20 0.60
1.5 1 18.02 14.14 0.00682 0.90 20 0.88 0.94
1.5 10 18.37 10.83 0.00347 0.94 25.27 2.07 0.99
1.5 50 35.62 32.05 0.01363 0.84 35.87 0.59 0.87
1.5 100 45.69 40.02 0.03343 0.80 43.33 0.52 0.75
2 1 26.97 23.18 0.00804 0.81 26.67 0.84 0.90
2 10 42.92 29.52 0.01382 0.97 42.32 1.97 0.80
2 50 67.28 58.38 0.04564 0.91 60.54 0.33 0.22
2 100 82.01 70.27 0.06329 0.73 71.03 0.11 0.02
3 1 41.39 36.75 0.00401 0.96 45.26 1.24 0.99
3 10 51.83 40.03 0.00435 0.92 61.40 3.13 0.98
3 50 31.90 13.14 0.00295 0.96 159.88 20.46 0.93

422 PART | II Product Specific Studies in Rheology
with BSG concentration increment; therefore the structural breakdown ex-tent under shear (B value) increases, whereas the rate of breakdown (k value) decreases.
16.3.3.3 Dynamic RheologyLinear viscoelastic region of BSG (1% w/w) occurred in 0.5% strain (f = 1 Hz, T = 20°C). Mechanical spectra of BSG (1%) are similar to xanthan gum (Fig. 16.11a,b). The storage modulus is higher than the loss modulus in all frequency range with a slight dependence on frequency, which indicates the weak gel behavior of BSG solution. Clark and Ross-Murphy (1987) has chosen structural liquid term for these fluids, which represents an intertwined network in these solutions structure even at high frequencies. According to Fig. 16.11, BSG has higher elastic and viscous moduli than xanthan gum (Hosseini-Parvar, 2009).
16.3.3.3.1 Effect of Concentration
By increasing BSG concentration, storage modulus (G9), loss modulus (G0), and complex viscosity (η*) increase (Table 16.8). Increase in BSG concen-tration results in the increment of molecular interaction and promotion of
FIGURE 16.11 Frequency sweep results for BSG (a), xanthan (b) (1% w/w, 0.5% strain, 20° C) (Hosseini-Parvar, 2009).
TABLE 16.8 Effect of BSG Concentration on Linear Viscoelastic Region Parameters (Rafe and Razavi, 2013a)
Concentration (%) G’ (Pa) G” (Pa) η* (Pa·s) tan δ p q
1 15.64 ± 1.24
6.57 ± 0.51
2.70 ± 0.20 0.42 ± 0.02
0.36 0.44
2 136.67 ± 3.50
39.59 ± 2.23
22.65 ± 0.65 0.29 ± 0.01
0.10 0.27
3 289.03 ± 8.51
97.68 ± 4.50
76.48 ± 3.41 0.36 ± 0.02
0.14 0.22

Rheology and Texture of Basil Seed Gum Chapter | 16 423
self-aggregation phenomena of molecular chains; consequently higher BSG concentration improves the viscoelastic properties (Hosseini-Parvar, 2009). The storage modulus (G9) value increases moderately by increasing BSG con-centration, because the solution is thickened more at higher concentrations. The yield stress value increases by increasing BSG concentration according to stress sweep test (data not shown), which shows strength of network of gels amplified. Yield stress value of 3% BSG is equal to xanthan–guar blend yield stress, which exhibits interesting rheological behavior.
According to frequency sweep test, the storage modulus (G9) and the loss modulus (G0) have a very low frequency dependence (Fig. 16.12a), indicating BSG gel is a cross-link network, but have a higher dependence on frequency at high frequency. The dependence between G9 and G0 with frequency can be de-scribed using power-law function ( ′ ω∝G p and ″ ω∝G q; where w is the angular frequency (rad/s), p and q are power-law’s storage and loss moduli indices, re-spectively). The frequency dependence of G9 and G0 decreases when BSG con-centration increases, as indicated by decreasing the p and q values (Table 16.8).
The dynamic viscosity (η*) has no indication of leveling out to a constant “Newtonian” value at the studied frequency range; although log η* decreases linearly with increasing log f from 0.01 to 10 Hz, as shown in Fig. 16.12b (Rafe and Razavi, 2013a).
16.3.3.3.2 Effect of Temperature
Hosseini-Parvar (2009) have reported storage modulus (G9), loss modulus (G0), and complex viscosity (η*) gradually increase from 40 to 85°C (Fig. 16.13). Considering the effect of temperature on the apparent viscosity data and the frequency sweep data, the results seem to suggest the presence of hydrophobic interactions which get stronger structure with temperature. This can result in stronger interaction among BSG polysaccharides molecules (increase in com-plex viscosity at 85°C, as shown in Figs. 16.5 and 16.13).
G'∝wp
G''∝wq
FIGURE 16.12 Frequency sweep of different concentrations of BSG (20°C; 0.5% strain), storage modulus (filled) and loss modulus (blanked) (a), complex viscosity (b) (Rafe, 2012).

424 PART | II Product Specific Studies in Rheology
The gelling properties of BSG have been studied using temperature/time sweep measurements as a function of BSG concentration (Fig. 16.14). BSG gelation is carried out in two steps like k-carrageenan. BSG does not form a gel by heating, but the gel is formed during cooling of the solution (Rafe and Razavi, 2013a). The onset of aggregation, indicated by increase in the stor-age modulus (G9), occurs at about 80°C. The gelling temperature point rises by increasing BSG concentration. BSG is recognized as a weak gel that has a crosslinked network. In addition, BSG is characterized as a thermo-irreversible gel, which has great hysteresis. Thermo-irreversible gels show a thermal hys-teresis between gelation and melting due to the different energy requirements for association and disassociation of junction zones (Rafe and Razavi, 2013a; Rafe et al., 2013).
16.3.3.3.3 Effect of pH
As shown in Fig. 16.15, the complex viscosity of BSG solutions only decreases at high acidic pH (pH = 2). No changes in steady shear and complex viscosi-ties by pH alterations confirm the high stability of BSG against pH (Figs. 16.6 and 16.15).
Fig. 16.16 shows that the gelling temperature of BSG decreases from 70 to 60°C by increasing pH from 4.5 to 7.5. In fact, BSG can form a gel at pH 4.5 sooner than the other pH values, and by increasing pH to 7.5, the gel is formed in longer time. The natural pH of BSG extraction is about 8, and it can be in-ferred that this pH value is not an optimum pH for BSG to set gel. Therefore, it is suggested by applying acidic pH, with regard to the polyanionic nature of BSG, to form the gel at the shortest duration time. The maximum G9 at the end of experiment is increased by increasing pH, except pH 5.5, which is completely different from other pH values, and BSG gels have the lowest storage modulus. However, the maximum G9 of BSG at pH 4.5 is lower than pH 6.5, which may be related to slip of sample at the end of experiment. Therefore, stiffer gel is formed at higher pH value than lower one. G9 approaches a constant value (pla-teau region) during holding temperature at 20°C, and difference between G9 of
FIGURE 16.13 Effect of heating–cooling cycle (5–85°C, 1 Hz, 0.5% strain) on the storage and loss moduli (a) and complex viscosity (b) of BSG solution (1% w/w) (Hosseini-Parvar, 2009).

Rheology and Texture of Basil Seed Gum Chapter | 16 425
FIGURE 16.14 Changes of storage modulus (a) and loss modulus (b) at different BSG concentra-tions as a result of heating from 20 to 90°C at rate of 1°C/min and holding for 30 min; then cool-ing to 20°C with the same rate and keeping at 20°C for 30 min (ƒ = 1 Hz and strain 0.5%) (Rafe et al., 2013).

426 PART | II Product Specific Studies in Rheology
BSG at different pHs is completely obvious and higher value of G9 and stronger gel exists at higher pH value except 5.5 (Rafe and Razavi, 2013b).
16.3.3.3.4 Effect of Sugar
Adding sucrose (5–50%) to BSG solution (1% w/w) increases the storage mod-ulus, which shows intensification of BSG gelling behavior. However, effect
FIGURE 16.15 Effect of pH on the complex viscosity of BSG solution (1% w/w, 0.5% strain, 20°C) (Hosseini-Parvar, 2009).
FIGURE 16.16 Storage modulus for gel formation of 1% BSG solution over pH 4.5–7.5 (f = 1 Hz; strain 0.5%) (Rafe, 2012).

Rheology and Texture of Basil Seed Gum Chapter | 16 427
of sucrose at 5–20% concentration on the storage modulus is not considerable (p > 0.05), as shown in Fig. 16.17 (Hosseini-Parvar, 2009).
16.3.3.3.5 Effect of Salt
Monovalent salts like sodium chloride (1 M) do not have significant influence on complex viscosity of BSG at 1% w/w concentration (Hosseini-Parvar, 2009). However, divalent salts such as calcium chloride affect viscoelastic properties of BSG. Dynamic rheological tests have been carried out on BSG at differ-ent Ca+2 concentrations (500, 100, and 10 mM). Increasing Ca+2 concentration from 0.01 to 0.5 M (at pH 7 and 20°C) increases storage modulus, which attri-butes elasticity increment of gel. In spite of increasing G9 by increasing calcium ion, the storage modulus of BSG without adding any ion is more than BSG containing Ca+2 ion. G9 of BSG in the presence of Ca+2 approaches 100 Pa, whereas the storage modulus of BSG at different pHs without adding calcium, except pH 5.5, reaches 10 kPa. It may be inferred that calcium ion has an effect on creating bonds between BSG molecules and increasing the G9, but pH has a greater effect on its ability to form the gel and by applying acidic pH in the presence of Ca+2 ion, the elasticity of BSG weak gel may be increased (Rafe and Razavi, 2013b).
16.3.3.4 Relationship Between Steady Shear and Oscillatory RheologyAccording to Cox and Merz rule, variation of complex viscosity (η*) as a func-tion of angular frequency (w) has a relationship with the steady shear viscosity (η) as a function of shear rate ( γ ) (Cox and Merz, 1958). Fig. 16.18 shows the complex viscosity of BSG is larger than the steady shear viscosity which devi-ates from the Cox–Merz rule. In the case, η* from small deformation measure-ments is substantially higher than the steady shear viscosity (η) at equivalent rates of deformation, indicating a tenuous network, which remains intact under
γ˙
FIGURE 16.17 Influence of sucrose concentration on BSG storage modulus (1% w/w, 0.5% strain and 20°C) (Hosseini-Parvar, 2009).

428 PART | II Product Specific Studies in Rheology
low amplitude oscillation but is disrupted under continuous shear. This mani-fests the extract solution being self-structured.
As shown in Fig. 16.18a,b, there is a high difference between η* and η of BSG in comparison with xanthan gum, which is related to higher tendency of BSG to aggregation and forming more stable gel (Hosseini-Parvar, 2009).
16.3.4 Textural Properties
According to the soft texture of BSG gel, penetration test has been recom-mended to evaluate its texture (Zameni et al., 2014; Rafe, 2012). BSG has this ability to form a gel at 3% (w/w) which imparts 13.5 g hardness (Fig. 16.19). BSG gel shows stable hardness after heating treatments at 50, 75, and 100°C for 20 min; but heating at higher temperature (121°C) not only has a destructive effect on BSG, but also produces a gel network with relatively high strength and hardness (Fig. 16.19a). It may be hypothesized that higher temperature during gel formation may have more effectively opened and exposed the BSG mol-ecules favoring their interaction, formation of junction zones, and results in a
FIGURE 16.18 Cox–Merz plot of complex viscosity (η*) against steady shear viscosity (η) for BSG (a) and xanthan gum (b) (Hosseini-Parvar, 2009).
FIGURE 16.19 Effect of thermal treatments on the hardness of BSG. (a) Heating (UT: 25, T1:50, T2:75, T3:100, and T4:100°C for 20 min); (b) freezing/thawing (T1:−18 and T2: −25°C for 24 h) (Zameni et al., 2014).

Rheology and Texture of Basil Seed Gum Chapter | 16 429
stiffer network. Freezing of BSG gel improves gel hardness and this alteration is more pronounced after freezing at −25°C for 24 h (Fig. 16.19b) (Zameni et al., 2014).
Adhesiveness is ability of gel sample to become sticky. This parameter is important, because it may influence overall quality, appearance, and shelf life of food. BSG gel has 16.79 g.s adhesiveness, which increases significantly after heat treatments (Fig. 16.20a). The high levels of adhesiveness of BSG make it desirable to be used in salad dressing formulations. BSG gel adhesiveness also increases after freezing/thawing, but this increment isn’t significant (−18 and −25°C for 24 h), as seen in Fig. 16.20b (Zameni et al., 2014).
Consistency of BSG gel is ∼50 (g.s), which on heating at 121°C causes dramatic increment in consistency properties of BSG gel (Fig. 16.21a). These results approve the increase of junction zones of gel during heating because of the existence of the high amount of unsubstituted mannan regions. The preva-lence of higher molecules in BSG is likely responsible for higher consistency of BSG gels under thermal treatments. BSG gel consistency increases negligibly after freezing treatment (Fig. 16.21b) (Zameni et al., 2014).
FIGURE 16.21 Effect of thermal treatments on consistency of BSG. (a) Heating (UT: 25, T1:50, T2:75, T3:100, and T4:100°C for 20 min); (b) freezing/thawing (T1:−18 and T2: −25°C for 24 h) (Zameni et al., 2014).
FIGURE 16.20 Effect of thermal treatments on the adhesiveness of BSG. (a) Heating (UT: 25, T1:50, T2:75, T3:100, and T4:100°C for 20 min); (b) freezing/thawing (T1:−18 and T2: −25°C for 24 h) (Zameni et al., 2014).

430 PART | II Product Specific Studies in Rheology
16.3.5 Rheological Interaction
16.3.5.1 Basil Seed Gum-Selected GalactomannansMixing of BSG–guar gum (GG) and BSG–locust bean gum (LBG) with the ra-tios of 100–0, 20–80, 40–60, 60–40, 20–80, and 0–100 have been investigated. 20–80 mixture of BSG–LBG has the lowest deviation from Newtonian behav-ior, among other BSG–LBG mixtures. Increasing BSG ratio does not alter the flow behavior index (n). As BSG exhibits higher zero-shear viscosity (η0) than GG and LBG (around 200 and 1400 times of η0 of GG and LBG, respectively), mixing BSG with GG and LBG results in increasing η0 of the mixtures. The η0 shows the ability of hydrocolloids to suspend particles in food formulation. Therefore, mixtures of these galactomannans with BSG can be used efficiently in some food formulations. Increasing the ratio of BSG in the selected gum mix-tures causes structure breakdown and intensifies time-dependence (thixotropy) (Hosseini-Parvar, 2009).
16.3.5.2 Basil Seed Gum-β-LactoglobulinThe interaction between β-lactoglobulin (BLG) and BSG has been investigated by low amplitude oscillatory shear measurement. BLG–BSG mixtures at dif-ferent ratios (20:1, 10:1, 5:1, and 2:1) have been heated from 20 to 90°C at four heating rates (0.5, 1, 5, and 10°C/min). The presence of BSG decreases the gelling temperature of BLG, particularly at a ratio of 2:1, at which BSG content has significant impact on the gelling temperature. The maximum storage modu-lus (G9 at the end of heating cycle) is reduced greatly by decreasing the BLG–BSG ratio from 20:1 to 2:1 and increasing heating rates. The degree of fre-quency dependence can be expressed by the power-law relationship ( ∝G f' p). The p value is regarded as an indication of the viscoelastic nature of the gels and is zero when the gel is elastic. The frequency dependence of G9 (p value) shows that BLG–BSG blend is developed as a relatively weak gel and this characteristic is enhanced by increasing BSG concentration (20:1 mixture of LBG-BSG, p = 0.072 and 2:1 mixture, p = 0.058). Adding BSG to BLG led to form a weak and smooth gel that can be applied for creamy food products (Rafe et al., 2012).
The temperature sweep of BLG–BSG mixture, from 20 to 90°C and coming back to the original temperature, presents a biphasic profile: the first phase char-acterized by a sharp increase in the storage modulus in which gelation of BLG happens and the second phase exhibiting an increase in the storage modulus corresponded to build-up of a BSG network (Fig. 16.22). The presence of BSG in protein solution may cause delay in gel formation and therefore, thermody-namic incompatibility occurs in BLG–BSG gel mixtures. As protein concen-tration reduces in solution, this thermodynamic incompatibility becomes more noticeable. The mixture containing 2% BSG and 1% BLG is capable of forming gel, whereas the same amount of protein can’t form any gel and only forms dispersion of visible white aggregates. The presence of the BSG increases the
G'∝fp

Rheology and Texture of Basil Seed Gum Chapter | 16 431
elastic modulus of the mixed gel. Therefore, the protein network forms a con-tinuous phase, which accommodates the polysaccharide chains, acting as filler (Rafe and Razavi, 2013a).
pH and Ca+2 affect gel formation and gelling properties of BLG–BSG mixed system. Increasing pH from 4.5 to 7.5 decreases storage modulus of mixture. However, the mixture at pH 5.5 has the highest elasticity. BSG has a strong
FIGURE 16.22 Storage modulus (G9) development for different ratio of BLG–BSG mixture as a result of heating from 20 to 90°C at 1°C/min and held for 30 min at 90°C (a) and cooling from 90 to 20°C at 1°C/min and held for 30 min at 20°C (b) (frequency 1 Hz; strain 0.5%) (Rafe, 2012).

432 PART | II Product Specific Studies in Rheology
synergistic effect on G9, and its presence on mixture causes the effect of pH on gelation to be opposite of when only protein is in solution. The effect of pH on mixed system is also considerably related to gum rather than protein. Therefore, one may conclude that there is a very particular thermodynamic incompatibility between these types of polymers. When the pH value is above the isoelectric point, electrostatic repulsions occur between BLG and BSG molecules, because both molecules are charged negatively, which lead to the formation of phase-separated gels under controlled conditions (Rafe and Razavi, 2013c). The opti-mum CaCl2 ion for gel formation is 0.01 M whose gelling point temperature is less than two other concentrations (0.1 and 0.5 M). After cooling to 20°C, all the G9 values approach a constant value, and effect of Ca ion on storage modulus is not significant (Rafe and Razavi, 2013c).
16.3.5.3 Basil Seed Gum-Whey Protein IsolatePhase behavior and rheology of systems containing different concentrations of BSG (0–0.3% (w/w)) and whey protein isolate (WPI) (1–5% (w/w)) have been investigated. Polysaccharide-rich phase is located at the lower phase as a turbid layer. The single-phase systems exist only at high concentrations of BSG. In mixed systems, gelation and phase separation occur simultaneously, so that phase separation rate decreases significantly with an increase in BSG concentration due to self-association of BSG polysaccharide chains. The ap-parent viscosity at shear rates of 50 and 100 s−1 shows that incorporation of the little amount of BSG to WPI aqueous dispersions changes the behavior of systems from Newtonian to shear-thinning behavior (Fig. 16.23). According to frequency sweep test, increment of BSG concentration creates a stronger WPI-BSG gel.
FIGURE 16.23 Flow behavior of WPI (3%)-BSG (different concentrations) mixture at 25°C (Sarabi-Aghdam et al., 2013).

Rheology and Texture of Basil Seed Gum Chapter | 16 433
16.4 FUTURE TRENDS
In the new world, there is an increasing demand for new sources of hydrocol-loids for providing novel texture, rheology, and mouth-feel in the food. The growing trend of food industry for natural hydrocolloids results in introduction of new sources especially plant-derived materials since they are safe and even are beneficial for human health. BSG is a natural hydrocolloid which obtains from the seeds of basil. The extraction process of BSG is spontaneous, irrevers-ible, and endothermic. BSG is a high molecular weight polysaccharide with random coil conformation. High shear-thinning behavior of BSG with high vis-cosity provides suitable mouth-feel characteristics, and this feature provides essential potential for many food applications. According to heat and freezing stability of BSG, it also can be employed as an appropriate choice for industrial processes involving high and low temperatures such as cooking, pasteuriza-tion, sterilization, and freezing. BSG was recognized as a weak gel that has crosslinked network and it can be used toward the development of food textural features. Gelation of BSG is carried out in two steps and takes places during the cooling period from 90 to 20°C. The key property of BSG is its ability to interact with galactomannans (guar gum and locust bean gum), BLG, and WPI, which creates a unique rheology.
Various investigations have revealed that BSG offers high potential to use as thickening, gelling, emulsifying, fat replacing, and stabilizing agents in food and pharmaceutical systems. Continuing studies on the fractionation and puri-fication of BSG and identification of molecular structure and conformation of BSG fractions are needed to explore its practical applications. Further research will provide more scientific data for realization mechanisms behind the rheol-ogy, structure and functionality of BSG.
REFERENCES
Amin, A.M., Ahmad, A.S., Yin, Y.Y., Yahya, N., Ibrahim, N., 2007. Extraction, purification and characterization of durian (Durio zibethinus) seed gum. Food Hydrocoll 21, 273–279.
Anjaneyalu, Y.V., Gowda, D., 1979. Structural studies of an acidic polysaccharide from Ocimum basilicum seeds. Carbohydr. Res. 75, 251–256.
Azuma, J.-I., Sakamoto, M., 2003. Cellulosic hydrocolloid system present in seed of plants. Trends Glycosci. Glycotechnol. 15, 1–14.
BahramParvar, M., Goff, H.D., 2013. Basil seed gum as a novel stabilizer for structure formation and reduction of ice recrystallization in ice cream. Dairy Sci. Technol. 93, 273–285.
Clark, A.H., Ross-Murphy, S.B., 1987. Structural and mechanical properties of biopolymer gels. Biopolymers. Adv. Polym. Sci. 83, 57–192.
Glicksman, M., 1982. Food Hydrocolloids. CRC Press, Boca Raton, FL. Higiro, J., Herald, T., Alavi, S., Bean, S., 2007. Rheological study of xanthan and locust bean gum
interaction in dilute solution: Effect of salt. Food Res. Int. 40, 435–447. Hosseini-Parvar, S., 2009. Basil seed gum (BSG): Physico-chemical, rheological and emulsifying
characterization and its synergistic interactions in combination with locust bean gum and guar gum. PhD thesis, Ferdowsi University of Mashhad, Iran.

434 PART | II Product Specific Studies in Rheology
Hosseini-Parvar, S., Matia-Merino, L., Goh, K., Razavi, S., Mortazavi, S., 2010. Steady shear flow behavior of gum extracted from Ocimum basilicum L. seed: Effect of concentration and temperature. J. Food Eng. 101, 236–243.
Hosseini-Parvar, S.H., Matia-Merino, L., Golding, M., 2014. Effect of basil seed gum (BSG) on textural, rheological and microstructural properties of model processed cheese. Food Hydrocoll. 43, 557–567.
Hosseini-Parvar, S.H., Matia-Merino, L., Golding, M., 2015. Effect of basil seed gum (BSG) on textural, rheological and microstructural properties of model processed cheese. Food Hydro-coll. 43, 557–567.
Khazaei, N., Esmaiili, M., Djomeh, Z.E., Ghasemlou, M., Jouki, M., 2014. Characterization of new biodegradable edible film made from basil seed (Ocimum basilicum L.) gum. Carbohydr. Polym. 102, 199–206.
Lai, L., Tung, J., Lin, P., 2000. Solution properties of hsian-tsao (Mesona procumbens Hemsl) leaf gum. Food Hydrocoll. 14, 287–294.
Lapasin, R., Pricl, S., 1995. Rheology of Polysaccharide Systems. Springer. Mäkinen, S.M., Pääkkönen, K.K., 1999. Processing and Use of Basil in Foodstuffs Beverages and
in Food Preparation. Basil: the genus Ocimum. Harwood Academic Publishers. Mathews, S., Singhal, R., Kulkarni, P., 1993. Ocimum basilicum: a new non-conventional source of
fibre. Food Chem. 47, 399–401. Melo, J., D’souza, S., 2004. Removal of chromium by mucilaginous seeds of “Ocimum basilicum”.
Bioresource Technol. 92, 151–155. Mohammad-Amini, A., Razavi, S.M.A., Zahedi, Y., 2015. The influence of different plasticisers
and fatty acids on functional properties of basil seed gum edible film. Int. J. Food Sci. Technol. 50 (5), 1137–1143.
Morris, E.R., Cutler, A., Ross-Murphy, S., Rees, D., Price, J., 1981. Concentration and shear rate dependence of viscosity in random coil polysaccharide solutions. Carbohydr. Polym. 1, 5–21.
Naji-Tabasi, S., Razavi, S.M.A., Mohebbi, M., Malaekeh-Nikouei, B., 2016. New studies on basil (Ocimum bacilicum L.) seed gum: Part I-Fractionation, physicochemical and surface activity characterization. Food Hydrocoll. 52, 350–358.
Niknia, S., Razavi, S.M.A., Koocheki, A., Nayebzadeh, K., 2011. The influence of application of basil seed and sage seed gums on the sensory properties and stability of mayonnaise. Electron. J. Food Process. Preserv. 2 (2), 61–79.
Normand, V., Aymard, P., Lootens, D.L., Amici, E., Plucknett, K.P., Frith, W.J., 2003. Effect of sucrose on agarose gels mechanical behaviour. Carbohydr. Polym. 54, 83–95.
Osano, J.P., Hosseini-Parvar, S.H., Matia-Merino, L., Golding, M., 2014. Emulsifying properties of a novel polysaccharide extracted from basil seed (Ocimum bacilicum L.): Effect of polysac-charide and protein content. Food Hydrocoll. 37, 40–48.
Osano, J., Matia-Merino, L., Hosseini-Parvar, S., Golding, M., Goh, K., 2010. Adsorption proper-ties of basil (Ocimum basilicum L.) seed gum. USM R & D 18, 113–117.
Paton, A., Harley, M., Harley, M., 1999. Ocimum: an overview of classification and relationships. In: Raimo, H., Yvonne, H. (Eds.), Basil: the Genus Ocimum. Harwood Academic Publishers, Amsterdam.
Phillips, G., Williams, P., 2000. Handbook of Hydrocolloids. Woodhead Publishing Ltd, Abington, Cambridge.
Putievsky, E., Galambosi, B., 1999. Production systems of sweet basil. In: Raimo, H., Yvonne, H. (Eds.), Basil: the Genus Ocimum. Harwood Academic Publishers, Amsterdam, 2.
Qian, K., Cui, S., Wu, Y., Goff, H., 2012. Flaxseed gum from flaxseed hulls: Extraction, fractionation, and characterization. Food Hydrocoll. 28, 275–283.

Rheology and Texture of Basil Seed Gum Chapter | 16 435
Rafe, A., 2012. Rheological, thermal and structural properties of β-Lactoglubolin-Basil seed hydro-colloid mixture in a model system. PhD Dissertation, Ferdowsi University of Mashhad.
Rafe, A., Razavi, S., 2013a. Dynamic viscoelastic study on the gelation of basil seed gum. Int. J. Food Sci. Technol. 48, 556–563.
Rafe, A., Razavi, S., 2013b. The effect of pH and calcium ion on rheological behaviour of β-lactoglobulin–basil seed gum mixed gels. Int. J. Food Sci. Technol. 48, 1924–1931.
Rafe, A., Razavi, S., 2013c. The effect of pH and calcium ion on rheological behaviour of β-lactoglobulin-basil seed gum mixed gels. Int. J. Food Sci. Technol. 48, 1924–1931.
Rafe, A., Razavi, S., Farhoosh, R., 2013. Rheology and microstructure of basil seed gum and β-lactoglobulin mixed gels. Food Hydrocoll. 30, 134–142.
Rafe, A., Razavi, S., Khan, S., 2012. Rheological and structural properties of β-lactoglobulin and basil seed gum mixture: effect of heating rate. Food Res. Int. 49, 32–38.
Razavi, S., Bostan, A., Rezaie, M., 2010. Image processing and physico-mechanical properties of basil seed (Ocimum basilicum). J. Food Process. Eng. 33, 51–64.
Razavi, S., Mortazavi, S.A., Matia-Merino, L., Hosseini-Parvar, S.H., Motamedzadegan, A., Khanipour, E., 2009. Optimisation study of gum extraction from Basil seeds (Ocimum basili-cum L.). Int. J. Food Sci. Technol. 44, 1755–1762.
Razavi, S.M.A., Shamsaei, S., Salehi, E.A., Emadzadeh, B., 2012. Effect of basil seed gum and xanthan gum as fat replacers on the characteristics of reduced fat mayonnaise. J. Food Sci. Technol. 4, 110.
Salehi, F., Kashaninejad, M., Tadayyon, A., Arabameri, F., 2015. Modeling of extraction process of crude polysaccharides from Basil seeds (Ocimum basilicum L.) as affected by process vari-ables. J. Food Sci. Technol. 52, 1–8.
Sarabi-Aghdam, V., Hosseini-Parvar, S.H., Motamedzadegan, A., Matia-Merino, L., 2013. An investigation on the interactions between Basil seed gum and whey protein isolate in aqueous systems. Electron. J. Food Preserv. Process. 4 (1), 15–35.
Tharanathan, R., Anjaneyalu, Y., 1975. Structure of the acid-stable core-polysaccharide derived from the seed mucilage of Ocimum basilicum. Austral. J. Chem. 28, 1345–1350.
Towel, G., Christensen, O., 1959. Pectin. Academic Press, New York, 377. Truta, E., Zamfirache, M.M., 2013. Preliminary cytogenetical investigation in two common basil
varieties. Analele Stiintifice ale Universitatii “Alexandru Ioan Cuza” din Iasi Sec. II a. Genetica si Biologie Moleculara. 14, 29–35.
Vardhanabhuti, B., Ikeda, S., 2006. Isolation and characterization of hydrocolloids from monoi (Cissampelos pareira) leaves. Food Hydrocoll. 20, 885–891.
Zameni, A., Kashaninejad, M., Aalami, M., Salehi, F., 2014. Effect of thermal and freez-ing treatments on rheological, textural and color properties of basil seed gum. J. Food Sci. Technol., 1–8.

437Advances in Food Rheology and Its Applications. http://dx.doi.org/10.1016/B978-0-08-100431-9.00017-6Copyright © 2017 Elsevier Ltd. All rights reserved.
Chapter 17
Rheology of Emulsions
B.C. Tatar, G. Sumnu, S. SahinMiddle East Technical University, Department of Food Engineering, Ankara, Turkey
17.1 INTRODUCTION
Rheology is the science in which flow characteristics and deformation of any kind of material including gas, liquid, and solid are studied. Several factors can easily affect the rheology of emulsions and it may be considered that they are related to the properties of the phases. The issue of rheology in food emulsions is closely linked to the texture, taste, and mouth feel of foods obtained from these emulsions. Emulsions can easily be formed from food-oriented ingredi-ents by simple processing techniques; therefore, food engineers, food scientists, and producers are highly interested in emulsions. In this chapter, information about major factors influencing emulsion rheology, studies about nanoemul-sions, and future trends will be discussed with the definitions of single and multiple emulsions having micro- and nanosized droplets.
17.1.1 Emulsions and Nanoemulsions
Two immiscible liquids, usually oil and water, compose an emulsion with a con-tinuous phase and a dispersed phase. Nonsoluble small droplets are dispersed in the continuous phase. Emulsions are grouped according to the distribution of the oil and aqueous phases. An emulsion type can be oil-in-water (O/W) emulsion in which oil droplets are dispersed in an aqueous phase, for instance, mayonnaise, milk, cream, soups, and sauces. In the other type, water droplets are dispersed in an oil phase which is called water-in-oil (W/O) emulsion such as margarine, butter, and spreads.
The latest trend in food studies is to prepare multiple emulsions. Double emulsions are complex systems and can be described as being emulsions within emulsions. Multiple emulsions are multisectioned systems where the globules of the dispersed phase contain smaller dispersed droplets (Garti, 1997). The two major types of multiple emulsions are water-in-oil-in-water (W1/O/W2) and oil-in-water-in-oil (O1/W/O2) double emulsions. Even a triple emulsion

438 PART | II Product Specific Studies in Rheology
study was conducted in 2011 by using double emulsions (Hasinovica and Friberg, 2011). These emulsions have many valuable properties like the abil-ity to entrap and protect sensitive substances as well as control their release from the inner to outer phase (Bou et al., 2014), to reduce the total fat content of emulsion-based food products (Lobato-Calleros et al., 2006), and to isolate one ingredient from another. Double emulsions are more suitable than the sin-gle ones for encapsulating the valuable compounds in terms of encapsulation efficiency (Vasijevic et al., 2009).
Nanoemulsions are defined as the emulsions containing nanoscale droplets. Generally, the droplet sizes which are smaller than 500 nm are considered in the nanorange (Rao and McClements, 2011; Wulff-Pérez et al., 2013). Even the droplet sizes in the range from a few nanometers up to 20 nm in size are of spe-cial interest (Moulik et al., 2009). These sizes of the dispersed phase cannot be seen easily by the naked eye. Nanoemulsions which generally consist of oil, sur-factant, and water are thermodynamically unstable systems (Mason et al., 2006; Sonneville-Aubrun et al., 2004). Physical properties, the droplet size distribu-tion, and the composition of nanoemulsions are important factors when con-sidering the rheology of nanoscale emulsions. Nanoemulsions reveal optical transparency at high dispersed phase fractions, reinforced diffusive transport, and enhanced shelf life as compared to microemulsions (Mason et al., 2006). Therefore, it is clear that usage of nanoemulsions has a lot of advantages for the industries in which emulsions are widely used, such as foods, pharmaceuticals, paint, and cosmetics.
Rheology comprises the response of a substance to a certain deformation with the measurement and explanation of this response by using description of mathematics and science (Brummer, 2006). Deformation is created by applying a force to a material and thus causing the material to become deformed and/or to flow. The amount of this deformation and/or flow is connected with the physi-cochemical properties of the material.
The constitutional macroscopic properties of an emulsion affect the rela-tion between stress and strain and vary with the composition, interfacial inter-actions, and microscopic droplet structure and size. The type of an emulsion can be altered from a simple viscous liquid to an elastic solid by changing the droplet volume fraction, φ, as shown schematically in Fig. 17.1 (Mason, 1999). The arrangements of particles depend on the volume of the particles in relation to the total volume. There was no shear in dilute regime at low concentra-tions, so the particles are in the spherical form. The elasticity results from the work done against interfacial tension. As shear increases, the surface area of droplets which are already compressed starts increasing. At low volume frac-tions, radius of droplets is small compared to mean distance between them. Therefore, being only under the effect of Brownian forces makes droplets flow freely throughout the medium. As volume fraction increases, Brownian forces starts to lose their effect on particles because of being close to other parti-cles; thus hydrodynamic interactions and the probability of collision between

Rheology of Emulsions Chapter | 17 439
particles become important. All these effects make droplets change their shape and become ultimately compressed in the fully compact form. As volume frac-tion reaches to hard sphere glass transition volume fraction, (φg = 0.58), the droplets start to become caged by their neighbors. As volume fraction increases further, droplets take the form of face centered cubic position. Randomly close pack arrangement is observed between droplets when volume fraction is fur-ther increased into the concentrated region (φrcp = 0.64), and for larger volume fractions droplets become compressed with deformed interfaces. As volume fraction approaches 1, hexagonal close packed arrangement can be seen and biliquid foam is formed.
17.1.2 Emulsions in the Food Industry
Microemulsions, nanoemulsions, and emulsions are in the area of special inter-est of food engineers, food scientists, and manufacturers since food-oriented ingredients can easily be used to form emulsions by applying simple processing techniques such as mixing and homogenization. Moreover, these emulsions can be easily added into foods (Rao and McClements, 2011). Beverages or aqueous-based foods which are necessary to remain transparent, such as some fortified waters and soft drinks, are good locations for microemulsions and nanoemul-sions having lipophilic active ingredients (Velikov and Pelan, 2008).
There are a large number of food emulsions in the wide range from low viscous fluids to highly hard solids. The examples of low-viscosity type foods
FIGURE 17.1 A schematic 2D representation of positional structure of droplets found in monodisperse emulsions as a function of the volume fraction of the dispersed phase (φ). φg represents hard sphere glass transition volume fraction and φrcp represents randomly close pack volume fraction.

440 PART | II Product Specific Studies in Rheology
are milk and fruit juices. Hard solid examples of food emulsions are refrigerated margarine and butter. All food emulsions are complex materials with respect to their compositions and structures. Therefore, they reveal different rheologi-cal behaviors. Although emulsion-based food products are in different types, characterizations of their rheological properties are described by using simple models (Tung and Paulson 1995). Then, the measurement of rheology of foods having high complexity like soups, cake batters, mayonnaise, cream liqueurs, sauces, ice cream, and coffee whitener is possible by combining these simple models (Friberg and Larsson 1997, Dickinson 1992, Swaisgood 1996). Also, those kinds of foods obey bimodal systems (Chunga et al., 2012). Food products which are mainly made from emulsions reveal a number of different physico-chemical and sensorial characteristics, such as appearance, aroma, texture, taste, and shelf life. Food engineers and food scientists use rheological properties of foods in order to design new products, to enhance processing operations, or to increase shelf life by considering its flow properties through a pipe or when it is stirred or after it is placed into containers. Measurements of rheological proper-ties are also used as analytical tool by food engineers and scientists to get main insights into constitutional order and component interactions within an emul-sion. For instance, from the measurements of viscosity versus shear rate results, information about the strength of the colloidal interactions between droplets can be provided (McClements, 2005; Hunter, 1993; Tadros, 1994).
Many natural and processed food products are in the form of dispersions having particles. A huge majority of them are in the form of water and oil emul-sions with additives such as salt, sugar, vitamins, minerals, edible surfactants, proteins, gums, colors, flavors, etc. Therefore, emulsion rheology plays a criti-cal role not only in the processing of emulsion-based foods, but also in the acceptance of these foods by the consumer with regard to taste, texture, and mouth feel. Thus, it is not surprising to note that emulsion rheology is a very active research area in food industry.
In this chapter, major factors influencing emulsion rheology, studies about nanoemulsions, and future trends will be covered.
17.2 MAJOR FACTORS INFLUENCING EMULSION RHEOLOGY
There are numerous factors that are known to have effects on rheology of emul-sions, such as molecular interactions, colloidal interactions, emulsion ingredi-ents, interfacial properties, processes performed to obtain emulsion, as well as the storage conditions it has experienced. However, only the crucial points will be given in this part with detailed information. The theory describing the prop-erties of emulsions changes due to the concentration; therefore, we begin by considering the effect of volume fraction on rheology. Then, the other major factors will be discussed which are phase rheology, droplet size, and colloidal interactions.
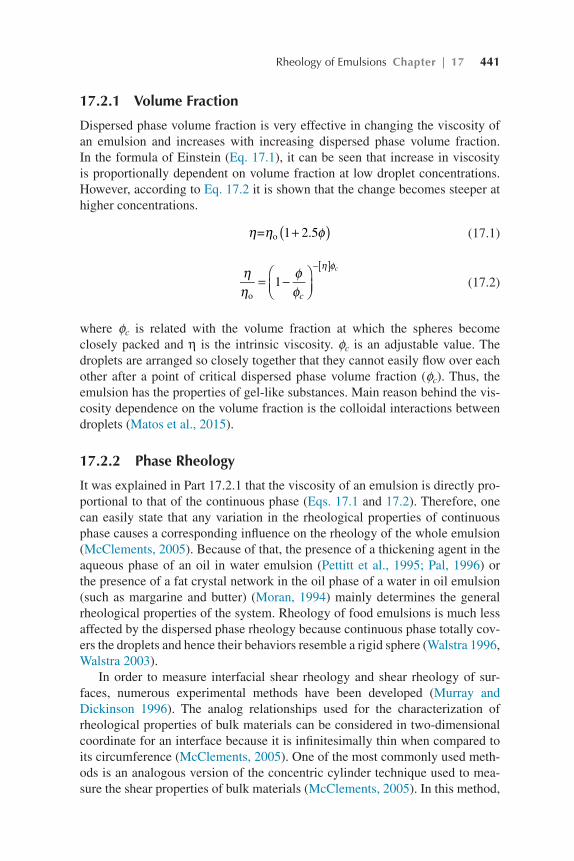
Rheology of Emulsions Chapter | 17 441
17.2.1 Volume Fraction
Dispersed phase volume fraction is very effective in changing the viscosity of an emulsion and increases with increasing dispersed phase volume fraction. In the formula of Einstein (Eq. 17.1), it can be seen that increase in viscosity is proportionally dependent on volume fraction at low droplet concentrations. However, according to Eq. 17.2 it is shown that the change becomes steeper at higher concentrations.
η η φ( )+= 1 2.5o (17.1)
ηη
φφ
= −
η φ[ ]−
1co
c
(17.2)
where φc is related with the volume fraction at which the spheres become closely packed and η is the intrinsic viscosity. φc is an adjustable value. The droplets are arranged so closely together that they cannot easily flow over each other after a point of critical dispersed phase volume fraction (φc). Thus, the emulsion has the properties of gel-like substances. Main reason behind the vis-cosity dependence on the volume fraction is the colloidal interactions between droplets (Matos et al., 2015).
17.2.2 Phase Rheology
It was explained in Part 17.2.1 that the viscosity of an emulsion is directly pro-portional to that of the continuous phase (Eqs. 17.1 and 17.2). Therefore, one can easily state that any variation in the rheological properties of continuous phase causes a corresponding influence on the rheology of the whole emulsion (McClements, 2005). Because of that, the presence of a thickening agent in the aqueous phase of an oil in water emulsion (Pettitt et al., 1995; Pal, 1996) or the presence of a fat crystal network in the oil phase of a water in oil emulsion (such as margarine and butter) (Moran, 1994) mainly determines the general rheological properties of the system. Rheology of food emulsions is much less affected by the dispersed phase rheology because continuous phase totally cov-ers the droplets and hence their behaviors resemble a rigid sphere ( Walstra 1996, Walstra 2003).
In order to measure interfacial shear rheology and shear rheology of sur-faces, numerous experimental methods have been developed (Murray and Dickinson 1996). The analog relationships used for the characterization of rheological properties of bulk materials can be considered in two-dimensional coordinate for an interface because it is infinitesimally thin when compared to its circumference (McClements, 2005). One of the most commonly used meth-ods is an analogous version of the concentric cylinder technique used to mea-sure the shear properties of bulk materials (McClements, 2005). In this method,
η=ηo1+2.5φ
ηηo=1−φφc−ηφc

442 PART | II Product Specific Studies in Rheology
the sample is placed in a thermostated vessel containing a thin disk at the inter-face that separates the two phases. Then, the vessel is rotated and the torque on the disk is measured. Measurement techniques of the torque have some differences when the analyzed sample is solid-like, liquid-like, or viscoelastic (McClements, 2005). When the vessel is rotating continuously, the torque on the disk is measured for liquid-like interfaces. The shear modulus for solid-like interfaces is determined by measuring the torque after the vessel is moved to a fixed angle. For viscoelastic interfaces, shear modulus is determined by mea-suring the torque while vessel is made to oscillate backward and forward at a specific frequency and angle.
Both adsorption kinetics of the emulsifiers and coalescence probability of the droplets have an impact on the short-term stability of emulsions. Emulsi-fiers facilitate the disruption of emulsion droplets by reducing the interfacial tension between oil and water (Turabi et al., 2008). Coalescence probability is determined by the interactions between droplets and by the contact time. The continuous phase between two droplets is displaced when they collide. When the film exceeds the critical thickness, it becomes shattered. The mag-nitude of the critical film thickness for emulsions is in the range of 1–100 nm ( Brummer, 2006). Unless there is a disruption on the continuous phase side of the film, coalescence will not occur spontaneously. Multifunctional emulsifiers can be used in emulsions in order to supply physical stability as well as increase in nutritional value.
17.2.3 Droplet Size
One of the problems faced in emulsions is that droplet aggregation often leads to a large increase in emulsion viscosity. This causes the emulsion to become creamy in a fast manner (Frank et al., 2011; van Aken et al., 2011). Altera-tion of the droplet size and the droplet size distribution affect the rheology of an emulsion by changing interactions and dispersed-phase volume fraction. However, for dilute emulsions, droplet size has no effect on the viscosity, if there are no long-distance attractive or repulsive interactions between the droplets (McClements, 2005; Pal 1996). However, if there is a comparatively long-distance repulsion between the droplets, there will be a high increase in the viscosity of the emulsion because of having high actual volume frac-tion than the effective volume fraction (Tadros 1994; Pal 1996). Droplet size also plays an important role in droplet coagulation which influences emul-sion rheology (Koroleva et al., 2015). For instance, higher droplet coagulation causes the formation of larger droplets, and therefore change in emulsion rhe-ology (McClements, 2005). Rheology of concentrated emulsions is affected by the average droplet size and polydispersity degree (Jafari et al., 2008; Monahan, 2010). Polydispersity degree, polydispersity index, or simply het-erogeneity can be defined as the broadness of molecular mass distribution in

Rheology of Emulsions Chapter | 17 443
a specific polymer. Higher degree of polydispersity indicates wide range of molecular weight in a given sample. This is a feature of synthetic (man-made) polymers (Martins and Silva Dias, 2009). Polydispersity controls the maxi-mum packing factor for the emulsions containing noncoagulate droplets. When the droplets in a concentrated emulsion are nonuniform in size, or polydisperse, they have ability to pack more efficiently. Thus, viscosity of such emulsions becomes smaller as compared to monodisperse emulsion even having the same droplet volume fraction. In small droplet sizes, formation of three-dimensional gel network at lower volume fractions becomes diffi-cult unless emulsions have flocculated droplets. Therefore, droplet size has an impact on the rheology of emulsions due to its influence on the interac-tions (Pal, 2011; Matos et al., 2015). Sato et al. (2015) showed that the addi-tion of ferulic acid (AF) and laccase (LAC) increased droplet size of particles in the emulsions (Fig. 17.2) having a narrower droplet size distribution at pH 3. As can be seen in Table 17.1, those larger droplets in the presence of AF and LAC caused viscosity, pseudoplasticity, and viscoelastic properties to increase (resembled gel-like texture) (Sato et al., 2015). Another study has shown that with the varying particle size, the rheological properties of col-loidal dispersions consisting of mixtures of negatively and positively charged lipid droplets can be adjusted (Mao and McClements, 2012).
FIGURE 17.2 Surface mean diameters d32 (µm) for emulsions at different stabilities at pH 3. Na-CN, sodium caseinate; AF, ferulic acid; LAC, laccase. *Bars with different letters (a, b, and c) indicate significant difference (p < 0.05). (Sato, A.C.K., Perrechil, F.A., Costa, A.A.S., Santana, R.C., Cunha, R.L., 2015. Cross-linking proteins by laccase: effects on the droplet size and rheol-ogy of emulsions stabilized by sodium caseinate. Food Res. Int. 75, 244–251, with permission from Elsevier.)

444 PART | II Product Specific Studies in Rheology
17.2.4 Colloidal Interactions
One of the primary challenges for determining rheological behavior of an emul-sion is the nature of interactions between droplets. Colloids or namely more complex, colloid systems are dispersion systems having mostly two compo-nents, sometimes looking as physically uniform, but in fact they are not molecu-larly dispersed. Food colloids are typically heterogeneous, and the heterogeneity degree is not constant under processing and storage conditions. Deeply inves-tigated knowledge about structural information and mechanical properties are needed in order to clearly understand the relationship between particles and colloidal interactions (McClements, 2005). The particles in emulsions can be flocculated or nonflocculated. When the concentration of an emulsion is higher, the possibility of any interaction between the floccules becomes higher. These interactions can be hydrodynamic, colloidal, or massive. There are attractive (primarily van der Waals, hydrophobic, and depletion interactions) and repul-sive (mostly electrostatic, steric, and thermal fluctuation forces) interactions between the droplets. The relative magnitude of these interactions determines the rheological properties of an emulsion. Therefore, a food engineer can control the rheological properties of food products by manipulating the colloidal inter-actions between the droplets. For instance, the viscosity of O/W emulsions can be increased considerably by increasing droplet flocculation ( Dickinson 1998). In order to lead droplet flocculation there are many methods. One of the meth-ods is to add biopolymers to increase the depletion force (Manoj et al., 1998; Tuinier and de Kruif, 1999). The second method is to adjust pH or ionic strength (Demetriades et al. 1997a,b). Finally, globular protein-stabilized emulsions can be heated to enhance hydrophobic and disulfide interactions (Kim et al., 2002).
TABLE 17.1 Rheological Behavior of Emulsions Stabilized by Sodium Caseinate (1% w/w) and Different Enzymatic Treatments at pH 3.
Treatments n k (Pa·s) η100 (mPa·s)
Control (only Na-CN) 0.28 2.95 110
10 mM AF 0.67a 1.07a 228.6a
10 mM AF + 5 mg/mL LAC 0.71ab 0.87a 223.1a
5 mM AF 0.68ab 1.07a 252.7ab
5 mM AF + 1 mg/mL LAC 0.75b 1.05a 323.5b
Different superscript letters indicate significant difference (p ≤ 0.05) in the same column at each pH.AF, ferulic acid; LAC, laccase; n, index behavior; k, consistency index; η100, apparent viscosity at 100/s.Source: Sato, A.C.K., Perrechil, F.A., Costa, A.A.S., Santana, R.C., Cunha, R.L., 2015. Crosslinking proteins by laccase: effects on the droplet size and rheology of emulsions stabilized by sodium caseinate. Food Res. Int. 75, 244–251, with permission from Elsevier.

Rheology of Emulsions Chapter | 17 445
When the interactions between the droplets are sufficiently attractive, the effective volume fraction of the dispersed phase is increased due to droplet flocculation, which results in an increase in emulsion viscosity. As noted by McClements (2005), the viscosity of monodisperse O/W emulsions is affected by droplet flocculation. The emulsion having flocculated droplets had higher viscosities than the nonflocculated droplets at low concentrations and revealed stronger shear thinning behavior (McClements, 2005). Flocculation of droplets was induced by adding a surfactant called sodium dodecyl sulfate (SDS) to the continuous phase and it was found that SDS promoted the depletion floccula-tion (McClements, 2005). In another research, pig gastric mucin (PGM) caused rapid depletion flocculation of the studied emulsions and this phenomenon had an impact on the rheological properties and texture of emulsions (Vingerhoeds et al., 2005).
If the floccules are assumed as a single particle, the viscosity of flocculated emulsions can be described by the same approach as for nonflocculated emul-sions (not considering all the individual droplets). Then, the Dougherty–Krieger equation or similar ones can be revised by changing the effective volume frac-tion of the floccules by the actual volume fraction of the individual droplets.
ηη
φφ
= −
η φ[ ]−
1co
effc
(17.3)
ηη
φφ
φφ φ
φφ
= −
= −
= −
η φ η φ η φ[ ] [ ] [ ]− − −
1 1 1c c i c1
eff
, eff
c c c
(17.4)
where φi is the volume fraction of droplets within the floccules; φc is the packing
parameter; φ φφ
=i
eff , and η is the intrinsic viscosity, as stated earlier.
At a given actual droplet volume fraction, the emulsion viscosity increases as the internal packing of the droplets within the floccules decreases (lower φi) since φeff increases. In practice, the value of φi depends on the magnitude of the applied shear stress, since shear forces can breakdown the floccules (Berli et al., 2002).
In a study, it was found that the presence of colloids blocked the lamellar ordering and decreased enthalpy change of melting and gelatin point to a lower temperature (Chen and Terentjev, 2011). This work allowed us to understand the physical properties of colloid–monoglyceride (MG) composites in oils. They found that the concentration of particles was very effective in the phase order-ing. It was found that the phase alignment was very sensitive to the colloid con-centration. At high concentration of particles the strong interaction transformed the lamellar gels to the paste phase completely and the paste phase appeared. The researchers investigated the effect of direct addition of nanoparticles to MG lamellar layers. Fig. 17.3 clearly showed that the presence of nanoparticles
ηηo=1−φeffφc−ηφc
ηη1=1−φeffφc−ηφc=1−φφcφi−ηφc=1−φφc, eff−ηφc
φeff=φφi

446 PART | II Product Specific Studies in Rheology
changed the microstructure by disturbing the lamellar stacking of MG. The hydrophobic coating on the surface of the particles, dimethyldioctadecylam-monium (DDAB), influenced the monoglyceride tails and deformation of the lamellar bilayers took place. In the study, rheological measurements confirmed that the gel-like samples were transmuted into the high viscous paste in the presence of colloids. As particle fraction increased, a decrease in gelation point was observed and finally it approached the crystallization point. The results indicated that the MG gel morphology can be modulated by altering the con-centration of particles.
Usage of hydrocolloids is the oldest way of enhancing the stability through controlling the rheology of the continuous phase. Hydrocolloids can be used as thickener in ketchup, emulsifier in soft drinks, or fat replacer in ice cream and salad dressings (Li and Nie, 2016). Dilute emulsions more conveniently obey this explanation rather than concentrated ones. A different explanation stands for concentrated emulsions because heterogeneity is high due to changing microstructure (Moschakis et al., 2005). There has been a long time from the recognition of the emulsion instability (Dickinson, 2003) and it is more related to the emulsion rheology than the hydrocolloid aqueous phase (Dickinson et al., 2007). A study has revealed usage of different gums and emulsifier blend
FIGURE 17.3 An illustration of the incorporation of a nanoparticle and monoglycerides into a matrix.

Rheology of Emulsions Chapter | 17 447
(vegetable mono/diglycerides, soy lecithin) in cake batters containing rice flour (Turabi et al., 2008). It can be easily seen that usage of different gums affected the emulsion stability of cake batters (Fig. 17.4). Hydroxy propyl methyl cel-lulose (hpmc) containing formulations and control batter showed the lowest emulsion stability. However, all other gums caused cake batters to increase in emulsion stability when it was compared with control one.
17.3 CASE STUDIES ON NANOEMULSION
There are a considerable number of studies about rheology of microemul-sions (Derkach, 2009; Mason, 1999; Robins et al., 2002; White et al., 2008). Although the number of the reviews (Daull et al., 2014; Maswal and Dar, 2014) and research studies about nanoemulsions has increased (Gutiérrez et al., 2008; Kinawy et al., 2012; Solans et al., 2005; Tabibiazar et al., 2015), there are still limited studies about rheology of nanoemulsions (Howe and Pitt, 2008; Komaiko and McClements, 2015; Wulff-Pérez et al., 2013).
The aim of the work of Wulff-Pérez et al. (2013) was to investigate the rheological properties of nanoemulsions. The researchers stated that studying
FIGURE 17.4 Emulsion stabilities of rice cake batters. x, xanthan; g, guar; x + g, xanthan + guar gum; c, carrageenan; lbg, locust bean gum; hpmc, hydroxy propyl methyl cellulose; x + c, xanthan + carrageenan. *Bars with different letters (a, b, c, d, e, and f) indicate significant differ-ence (p < 0.05). (Turabi, E., Sumnu, G., Sahin, S., 2008. Rheological properties and quality of rice cakes formulated with different gums and an emulsifier blend. Food Hydrocoll. 22, 305–312, with permission from Elsevier.)

448 PART | II Product Specific Studies in Rheology
similar droplet sizes was a critical point in order to understand the effect of different surfactants used on the final rheological properties of emulsion. In fact, the nature of core material was also a crucial factor determining the end of experiment; a microemulsion or nanoemulsion. In their experiments, Rao and McClements (2011) found that two different lemon oils had different abilities to form colloidal dispersions although they had the same surfactant and oil con-centrations. One resulted in microemulsion but the other formed a nanoemul-sion. Nanoemulsions had resistance to physical destabilization by gravitational separation, flocculation, and coalescence because of having very small droplet sizes (r < 100 nm) (Ogawa et al., 2003). All these features affected rheological properties, which were mentioned in Part 17.2.
The Brownian movement of particles suspended in liquid was enough to overcome their low gravitational separation force in nanoemulsions and it was found that they became resistant to creaming (Maswal and Dar, 2014). Also, their highly efficient steric stabilization made them resistant to flocculation (Maswal and Dar, 2014). Citral encapsulation was widely used via simple oil in water emulsions because of their being vulnerable to environmental stresses and breakdown over time. Maswal and Dar (2014) found that citral efficiency and availability was significantly increased in nanoemulsion when compared to the form of normal emulsion. Combining the nanoemulsion formulations with the natural antioxidants has been found to be advantageous in order to enhance chemical stability of citral (Maswal and Dar, 2014).
Rao and McClements (2011) prepared emulsions (r > 100 nm) by mixing and heating the lemon oil and sucrose monopalmitate (SMP) together, whereas for nanoemulsions (r < 100 nm), they had to apply high pressure homogeniza-tion (microfluidization). This study gave some useful insights into SMP prop-erties and its ability to form several kinds of colloidal dispersions with flavor oils. At the first step of study, they prepared nanoemulsions (1% SMP) and microemulsions (20% SMP) (0 mM NaCl, pH 7) (Rao and McClements, 2011). Nanoemulsions were initially prepared by mixing, heating, and high pressure homogenization at pH 7 and they contained 1% SMP, 10% lemon oil, and 89% buffer. Microemulsions were prepared only by mixing at pH 7 and they con-tained 20% SMP, 10% lemon oil, and 70% buffer. There was a steep decrease in viscosity upon heating from 5 to 20oC for microemulsions (20% SMP), which was an indicator of gel to liquid transition at 20oC. For nanoemulsions (1% SMP), there was only a smooth decrease in apparent viscosity with heating from 5 to 80oC. This can be related to the normal liquid viscosity reduction by increasing temperature. The researchers further investigated the origins of these effects and decided to conduct experiments by comparing the viscosity versus temperature profiles of the colloidal dispersions with their correspond-ing continuous phases, which were only the solutions of 1 and 20% SMP. There was a steep decrease in the viscosity of both the 1 and 20% SMP with increase in temperature up to 30oC. The surfactant (SMP) formed highly viscous or gel-like systems at low temperatures. The viscosities of the aqueous solutions were

Rheology of Emulsions Chapter | 17 449
surprisingly found to be much higher (100× and 1000×) than those of the col-loidal dispersions with similar SMP concentrations. This was due to the fact that some of the SMP could be bound to the surfaces of the oil droplets in emul-sions, and hence SMP was less available to participate in the formation of a gel phase (Rao and McClements, 2011). This reduction was less in nanoemulsions when compared to microsized emulsion (20% SMP). In previous studies about rheological properties of oil-in-water emulsions stabilized by sucrose mono-esters, a similar transition from gel to liquid phase was also reported (Sadtler et al., 2004).
Wulff-Pérez et al. (2013) have investigated how the rheological properties of submicron emulsions were affected by the structure of polymeric surfactants. They studied the viscoelastic properties of concentrated emulsions stabilized with two different families of surfactants, Pluronics and Myrjs, since these sur-factants had key differences in their structures. The emulsions were prepared with two different oils; either olive oil or coconut oil having only one kind of surfactant. Oil-in-water emulsions were prepared mixing oil and water to obtain a final volume fraction of 0.65, on the basis of a total volume of 30 mL. High pressure homogenizer at 100 MPa was used for emulsification. In order to understand only the effect of surfactant, droplet size (around 300 nm) and vol-ume fraction were kept constant. Dynamic oscillatory shear experiments were performed for characterization of viscoelasticity. The results had noteworthy quantitative differences but showed a qualitatively similar gel-like behavior for all the emulsions. The values of storage modulus (G′) and loss modulus (G″) are given in Table 17.2 and Table 17.3. Three Pluronics having different hydro-phobic and hydrophilic chain sizes were used: Pluronic F127 (PF127), Pluronic F68 (PF68), and Pluronic P105 (P105). The lengths of hydrophilic chains of these surfactants are approximately 8–9 nm for PF127 (Elisseeva et al., 2005), 6–7 nm for PF68 (Sedev et al., 2002), and 3–4 nm for P105 (Datta et al., 2011). The other family of surfactants, Myrj surfactants, had hydrophilic chains of polyethylene oxide (PEO), with Myrj 52 (M52) and Myrj 59 (M59). The only
TABLE 17.2 Values of the Storage Modulus (G′) and Loss Modulus (G″) in the Linear Viscoelastic Range Obtained From Strain Amplitude Sweep Experiments for Olive Oil Emulsions Stabilized with Different Steric Surfactants.
PF127 PF68 P105 M59 M52
G’ (Pa) 1095 68 41 36 18
G” (Pa) 92 15 10 7.2 3.7
Source: Wulff-Pérez, M., Martín-Rodríguez, A., Gálvez-Ruiz, M., de Vicente, J., 2013. The effect of polymeric surfactants on the rheological properties of nanoemulsions. Colloid Polym Sci. 291, 709–716, with permission from Elsevier.

450 PART | II Product Specific Studies in Rheology
difference between M52 and M59 is the number of subunits of the PEO chain: M52 had 40 subunits and M59 had longer hydrophilic chain containing 100 subunits. It was found that surfactants having longer hydrophilic tails produced emulsions with higher viscoelasticity. Therefore, it is possible to relate the effect of the length of the hydrophilic chain on the final viscoelastic properties of M52 and M59, when all the other properties of the emulsions were similar, such as volume fraction and droplet size. Pluronics had a hydrophobic part in the middle between two hydrophilic tails and they caused emulsions to have remarkably higher viscoelasticity and yield stress than Myrjs. The researchers explained that the reason for this phenomenon was the position of the hydro-phobic part. The hydrophobic part being at the center caused an efficient struc-tural barrier at the interface rather than affecting the interfacial rheology directly (Wulff-Pérez et al., 2013).
In another study, it was stated that emulsion rheology was very important when considering the performance of the fluids in coating and in drying. Gelatin complexes with nonadsorbed micelles increased the viscosity of the continu-ous phase. In addition, gelatin complexes adsorbed to the oil surfactant–water interface increased the volume and hence the particle size of the nanosized oil droplets (Howe and Pitt, 2008). In their research, they used cosurfactants hav-ing three types of polar head groups; simple nonionic based on (PEO), simple cationic based on a quaternary alkyltrimethyl ammonium (QATA), and com-bined nonionic–cationic based on a quaternized bis-ethoxylated primary amine (QBPA). Although the polyethoxylated-cationic surfactants induced flocculation and coalescence of the oil droplets at high concentrations, the most effective one from these three types was found as the polyethoxylated-cationic surfactants. These types of surfactants combine both nonionic (PEO) and cationic (QATA) chemistry in their polar head group for reducing the low shear viscosity and the shear thinning behavior of the oil-in-water emulsions stabilized by gelatin and anionic surfactant. The alkyl tail length of the ethoxylated-cationic surfac-tants was found to have comparably little effect on the modification of rheology.
TABLE 17.3 Values of the Storage Modulus (G′) and Loss Modulus (G″) in the Linear Viscoelastic Range Obtained From Strain Amplitude Sweep Experiments for Coconut Oil Emulsions Stabilized With Different Steric Surfactants.
PF127 PF68 P105 M59 M52
G’ (Pa) 1547 620 102 55 20
G” (Pa) 102 185 45 11 3.8
Source: Wulff-Pérez, M., Martín-Rodríguez, A., Gálvez-Ruiz, M., de Vicente, J., 2013. The effect of polymeric surfactants on the rheological properties of nanoemulsions. Colloid Polym. Sci. 291, 709–716, with permission from Elsevier.

Rheology of Emulsions Chapter | 17 451
The usage of polyethoxylated-cationic cosurfactant must be carefully controlled in order to avoid high local concentrations of cosurfactant which can lead to coalescence or flocculation problems (Howe and Pitt, 2008).
Lante and Frisco (2013) conducted a research about oxidative stability and rheological properties of nanoemulsions. They extracted catechins from green tea leaves with ultrasonication, and prepared water-in-oil (W/O) green tea nano-emulsions with soy, peanut, sunflower, and corn oils. The comparison revealed ηo (zero-shear rate viscosity) in a direct correlation with increasing homogeni-zation time for all of the oils examined in this study (Table 17.4). This could be due to a decrease in the size of particles as the energy supplied to the emulsion
TABLE 17.4 Comparison of the Parameters of the Carreau Model (Zero-Shear Rate Viscosity ηo, Critical Shear Rate γ c and Exponent N) Applied to the Different W/O GT Emulsions, Formulated With the Four Oils and Four Homogenization Times. All Emulsions Contained 23.1 wt.% of Aqueous Phase.
Homogenization time (s)
W/O emulsion
Carreau parameters
ηo (mPa·s) γ c (s) N
180 Peanut 129.6 20.1 0.1003
Corn 120.7 51.0 0.2085
Sunflower 106.8 20.0 0.1706
Soybean 121.0 6.2 0.1324
300 Peanut 130.3 13.5 0.1051
Corn 140.4 13.0 0.1354
Sunflower 137.3 15.5 0.1578
Soybean 165.4 16.3 0.1810
600 Peanut 128.0 22.4 0.1025
Corn 133.7 7.2 0.1262
Sunflower 168.5 19.9 0.2170
Soybean 170.9 34.0 0.1692
900 Peanut 136.9 28.0 0.1026
Corn 155.5 10.2 0.1523
Sunflower 166.2 13.4 0.2131
Soybean 223.4 15.3 0.1689
Source: Lante, A., Friso, D., 2013. Oxidative stability and rheological properties of nanoemulsions with ultrasonic extracted green tea infusion. Food Res. Int. 54, 269–276, with permission from Elsevier.
γ˙c
ηoγ˙c

452 PART | II Product Specific Studies in Rheology
increases along with homogenization time. All examined W/O emulsions were found to have a shear thinning behavior in a relationship with the Carreau model (r2 = 0.98 ± 0.03). Carreau fluid is known as a type of generalized Newtonian fluid. Carreau fluids act like a Newtonian fluid when n = 1 at low shear rate and act like a power-law fluid at high shear rate. The generalized model can be seen in Eq. 17.5. Parameter γ is the magnitude of the shear rate and γ c is the critical shear rate marking the onset of non-Newtonian behavior. The Carreau model parameters and particle size distributions are given in Tables 17.4 and 17.5. The specific surface areas of the nanoemulsions found to be very high (with an aver-age value of about 40 m2/mL) because of droplet sizes being in nanorange. Being the high surface area to mass ratio of the nanoemulsions indicated that they can be a favorable vehicle in the future. For example, these nanoemulsions might be used in a margarine.
η η
γγ
=
1+
No
c
2 (17.5)
These findings could help us to improve our knowledge about the final rheological properties or rheological changes during processing of the nano-emulsions. Although the effect of the chemistry of used materials, nature of encapsulated core material, and using different surfactants were studied in order
γ˙γ˙c
η=ηo1+γ˙γ˙c2N
TABLE 17.5 Comparison of Most Important Particle Size Distribution Parameters, as Mean Diameters of the Length (dL), Volume (dV), Volume/Surface (dVS, Sauter), Specific Surface As, and Number–Median Diameter D50, the 10 and 90 Percentile (D10 and D90) for Different W/O GT Emulsions, Formulated With the Four Oils and 300 s Homogenization Time.
Size parameters Peanut oil Corn oil Sunflower oil Soybean oil
dL(nm) 33.3 28.1 21.3 29.2
dV(nm) 35.2 29.6 29.3 30.4
dVS(nm) 37.6 31.3 35.1 32.0
AS (m2/mL) 34.5 41.3 36.9 40.5
D10 (nm) 22.8 18.8 19.9 20.8
D50 (nm) 28.7 25.4 26.5 26.2
D90 (nm) 41.0 34.7 35.9 31.1
Source: Lante, A., Friso, D., 2013. Oxidative stability and rheological properties of nanoemulsions with ultrasonic extracted green tea infusion. Food Res. Int. 54, 269–276, with permission from Elsevier.

Rheology of Emulsions Chapter | 17 453
to control the rheological properties of nanoemulsions, more research is needed in order to fully understand the nanosized emulsions.
17.4 FUTURE TRENDS
Current opinion considering the future of food is mainly concerned with the abil-ity of the food to provide improved health benefits and life quality. For instance, usage of milk-based ingredients in emulsions can have positive effect on human health through the presence of essential amino acids and bioactive reagents. Such milk-based ingredients can be whey proteins (Frestedt et al., 2008; Krissansen 2007), casein derive peptides (Möller et al., 2008), and milk phospho-lipids (Dewettinck et al., 2008). Also, it has been shown that protein stabilized emulsions could enhance the perception of fat in emulsions (Corredig, 2009). Emulsified fat digestion may draw considerable attention in the future because regulating fat digestion can be used to create an early sense of satiety, which can be a solution for the new-age trouble, obesity.
Moreover, there has been a growing interest in preparing multiple emulsions such as double emulsions. Even a triple emulsion study was conducted in 2011 by using double emulsions (Hasinovica and Friberg, 2011). Multiple emulsions have many advantages, such as the ability to entrap and protect sensitive sub-stances as well as control their release from the inner to the outer phase, more than single emulsions. It has been found that double emulsions are more suit-able than the single ones for encapsulating the valuable compounds in terms of encapsulation efficiency (Vasijevic et al., 2009). The future studies in rheology of these emulsions and relation with sensory perception will be very valuable for science. Double emulsions could be characterized in terms of rheological behaviors. Also for rheological characterization of micro, nano or multiple emulsions (double or triple emulsions), the nuclear magnetic resonance imag-ing (NMR) technique can be used for further investigation. The improvement of existing foods, the development of new foods, and the efficient running of food processing operations require a more systematic and rigorous approach than was used previously. These kinds of developments will enable food manufactur-ers to design foods in a new fashion, which leads to improvements in product quality and in reduction of costs.
REFERENCES
Berli, C.L., Quemada, D., Parker, A., 2002. Modelling the viscosity of depletion flocculated emul-sions. Colloids Surf. A. 203, 11–20.
Bou, R., Cofrades, S., Jiménez-Colmenero, F., 2014. Physicochemical properties and riboflavin encapsulation in double emulsions with different lipid sources. LWT—Food Sci. Technol. 59, 621–628.
Brummer, R., 2006. Rheology Essentials of Cosmetic and Food Emulsions. Springer, Berlin, Heidelberg.

454 PART | II Product Specific Studies in Rheology
Chen, C.H., Terentjev, E.M., 2011. Colloid–monoglyceride composites in hydrophobic solutions. Colloids Surf. A. 384, 536–542.
Chunga, C., Degnerb, B., McClements, D.J., 2012. Rheology and microstructure of bimodal par-ticulate dispersions: model for foods containing fat droplets and starch granules. Food Res. Int. 48 (2), 641–649.
Corredig, M. (Ed.), 2009. Dairy-Derived Ingredients: Food and Nutraceutical Uses. Woodhead Pub-lishing Limited, United States.
Datta, S.S., Gerrard, D.D., Rhodes, T.S., Mason, T.G., Weitz, D.A., 2011. Rheology of attractive emulsions. Phys. Rev. E. 84 (4), 041404.
Daull, P., Lallemand, F., Garrigue, J-S.S., 2014. Benefits of cetalkonium chloride cationic oil-in-water nanoemulsions for topical ophthalmic drug delivery. J. Pharm. Pharmacol. 66, 531–541.
Demetriades, K., Coupland, J.N., McClements, D.J., 1997a. Physical properties of whey protein stabilized emulsions as related to pH and NaCl. J. Food Sci. 62, 342.
Demetriades, K., Coupland, J.N., McClements, D.J., 1997b. Physicochemical properties of whey protein stabilized emulsions as affected by heating and ionic strength. J. Food Sci. 62, 462.
Derkach, S.R., 2009. Rheology of emulsions. Adv. Colloid Interface Sci. 151 (1–2), 1–23. Dewettinck, K., Rombaut, R., Thienpont, N., Le, T.T., Messens, K., Van Camp, J., 2008. Nutritional
and technological aspects of milk fat globule membrane material. Int. Dairy J. 18, 436–457. Dickinson, E., 1992. Introduction to Food Colloids. Oxford University Press, Oxford. Dickinson, E., 1998. Rheology of emulsions: the relationship to structure and stability. In: Binks,
B.P. (Ed.), Modern Aspects of Emulsion Science. The Royal Society of Chemistry, Cambridge. Dickinson, E., 2003. Hydrocolloids at interfaces and the influence on the properties of dispersed
systems. Food Hydrocoll. 17 (1), 25–39. Dickinson, E., Murray, B.S., Moschakis, T., 2007. Particle tracking as a probe of microrheology. In:
Dickinson, E., Lesser, M.E. (Eds.), Food Colloids: Self-Assembly and Material Science. RSC Publishing, Cambridge.
Elisseeva, O.V., Besseling, N.A.M., Koopal, L.K., Stuart, C.M.H., 2005. Influence of NaCl on the behavior of PEO−PPO−PEO triblock copolymers in solution, at interfaces, and in asymmetric liquid films. Langmuir 21, 4954–4963.
Frank, D., Appelqvist, I.A.M., Piyasiri, U., Wooster, T.J., Delahunty, C., 2011. Proton transfer reac-tion mass spectrometry and time intensity perceptual measurement of flavor release from lipid emulsions using trained human subjects. J. Agric. Food Chem. 59 (9), 4891–4903.
Frestedt, J.L., Zenk, J.L., Kuskowski, M.A., Ward, L.S., Bastian, E.D., 2008. A whey-protein sup-plement increases fat loss and spares lean muscle in obese subjects: a randomized human clini-cal study. Nutr. Metabol. 5, 8.
Friberg, S.E., Larsson, K., 1997. Food Emulsions, third ed. Marcel Dekker, New York. Garti, N., 1997. Double emulsions: scope, limitations and new achievements. Colloids Surf. A.
123-124, 233–246. Gutiérrez, J., González, C., Maestro, A., Solè, I., Pey, C., Nolla, J., 2008. Nano-emulsions: new ap-
plications and optimization of their preparation. Curr. Opin. Colloid Interface Sci. 13, 245–251. Hasinovica, H., Friberg, S.E., 2011. Destabilization mechanisms in a triple emulsion with Janus
drops. J. Colloid Interface Sci. 361 (2), 581–586. Howe, A.M., Pitt, A.R., 2008. Rheology and stability of oil-in-water nanoemulsions stabilised
by anionic surfactant and gelatin 1) addition of nonionic, cationic and ethoxylated-cationic co-surfactants. Adv. Colloid Interface Sci. 144 (1–2), 24–29.
Hunter, R.J., 1993. Introduction to Modern Colloid Science. Oxford University Press, Oxford. Jafari, S., Assadpoor, E., He, Y., Bhandari, B., 2008. Re-coalescence of emulsion droplets during
high-energy emulsification. Food Hydrocoll. 22, 1191–1202.

Rheology of Emulsions Chapter | 17 455
Kim, H.J., Decker, E.A., McClements, J., 2002. Role of postadsorption conformation changes beta-lactoglobulin on its ability to stabilize oil droplets against flocculation during heating at neutral pH. Langmuir 18, 75–77.
Kinawy, E., Petersen, S., Helmdach, L., Ulrich, J., 2012. Parameter selection of emulsifica-tion processes: conditions for nano- and macroemulsions. Chem. Eng. Technol. 35 (9), 1604–1608.
Komaiko, J., McClements, D., 2015. Food-grade nanoemulsion filled hydrogels formed by sponta-neous emulsification and gelation: optical properties, rheology, and stability. Food Hydrocoll. 46, 67–75.
Koroleva, M., Tokarev, A., Yurtov, E., 2015. Simulation of flocculation in W/O emulsions and ex-perimental study. Colloids Surf. A. 481, 237–243.
Krissansen, G.W., 2007. Emerging health properties of whey proteins and their clinical implica-tions. J. Am. Coll. Nutr. 26 (6), 713S–723S.
Lante, A., Friso, D., 2013. Oxidative stability and rheological properties of nanoemulsions with ultrasonic extracted green tea infusion. Food Res. Int. 54 (1), 269–276.
Li, J.M., Nie, S.P., 2016. The functional and nutritional aspects of hydrocolloids in foods. Food Hydrocoll 53, 46–61.
Lobato-Calleros, C., Rodríguez, E., Sandoval-Castilla, O., Vernon-Carter, E., Álvarez-Ramírez, J., 2006. Reduced-fat white fresh cheese-like products obtained from W-1/O/W-2 multiple emul-sions: viscoelastic and high-resolution image analyses. Food Res. Int. 39, 678–685.
Manoj, P., Fillery-Travis, A.J., Watson, A.D., Hibberd, D.J., Robins, M.M., 1998. Characterization of a depletion-flocculated polydisperse emulsion. Part I: creaming behavior. J. Colloid Interface Sci. 207 (2), 283–293.
Mao, Y., McClements, D., 2012. Modulation of emulsion rheology through electrostatic heteroag-gregation of oppositely charged lipid droplets: influence of particle size and emulsifier content. J. Colloid Interface Sci. 380 (1), 60–66.
Martins, J.A., Silva Dias, M.A.F., 2009. The impact of smoke from forest fires on the spectral dispersion of cloud droplet size distributions in the Amazonian region. Environ. Res. Lett. 4, 015002.
Mason, T.G., 1999. New fundamental concepts in emulsion rheology. Curr. Opin. Colloid Interface Sci. 4, 231–238.
Mason, T.G., Wilking, J.N., Meleson, K., Chang, C.B., Graves, S.M., 2006. Nanoemulsions: forma-tion, structure, and physical properties. J. Phys.-Condens. Matter 18 (41), 635–666.
Maswal, M., Dar, A., 2014. Formulation challenges in encapsulation and delivery of citral for improved food quality. Food Hydrocoll. 37, 182–195.
Matos, M., Gutiérrez, G., Iglesias, O., Coca, J., Pazos, C., 2015. Characterization, stability and rheology of highly concentrated monodisperse emulsions containing lutein. Food Hydrocoll. 49, 156–163.
McClements, D.J., 2005. Food Emulsions: Principles, Practices and Techniques. CRC Series in Contemporary Food Science, second ed. CRC Press, Boca Raton, FL.
Moller, N.P., Scholz-Ahrens, K.E., Roos, N., Schrezenmeir, J., 2008. Bioactive peptides and proteins from foods: indication for health effects. Eur. J. Nutr. 47 (4), 171–182.
Monahan, N. (2010) Structure and Rheology of Monodisperse and Bimodal Emulsions. A thesis submitted to the Victoria University of Wellington in partial fulfilment of the requirements for the degree of Master of Science with Honours in Chemistry. Wellington: Victoria University of Wellington.
Moran, D.P.J., 1994. Fats in spreadable products. In: Morgan, D.P.J., Rajah, K.K. (Eds.), Fats in Food Products. Chapman & Hall, London.

456 PART | II Product Specific Studies in Rheology
Moschakis, T., Muray, B.S., Dickinson, E., 2005. Microstructural evolution of viscoelastic emul-sions stabilized by sodium caseinate and xanthan gum. J. Colloid Interface Sci. 284 (2), 714–728.
Moulik, S.P., Rakshit, A.K., Capek, I., 2009. Microemulsions as templates for nanomaterials. In: Stubenrauch, C. (Ed.), Microemulsions: Background, New Concepts, Applications, Perspec-tives. John Wiley & Sons, Ltd, Chichester.
Murray, B.S., Dickinson, E., 1996. Interfacial rheology and the dynamic properties of adsorbed films of food proteins and surfactants. Food Sci. Technol. Res. 2 (3), 131–145.
Ogawa, S., Decker, E.A., McClements, D.J., 2003. Production and characterization of O/W emul-sions containing cationic droplets stabilized by lecithin-chitosan membranes. J. Agric. Food Chem. 51 (9), 2806–2812.
Pal, R., 1996. Rheology of emulsions containing polymeric liquids. Becher, P. (Ed.), Encyclopedia of Emulsion Technology, 4, Marcel Dekker, New York.
Pal, R., 2011. Rheology of simple and multiple emulsions. Curr. Opin. Colloid Interface Sci. 16 (1), 41–60.
Pettitt, D.J., Waybe, J.E.B., Nantz, J.R., Shoemaker, C.F., 1995. Rheological properties of solutions and emulsions stabilized with xanthan gum and propylene glycol alginate. J. Food Sci. 60 (3), 528–531.
Rao, J., McClements, D., 2011. Food-grade microemulsions, nanoemulsions and emulsions: fabri-cation from sucrose monopalmitate & lemon oil. Food Hydrocoll. 25, 1413–1423.
Robins, M.M., Watson, A.D., Wilde, P.J., 2002. Emulsions–creaming and rheology. Curr. Opin. Colloid Interface Sci. 7, 419–425.
Sadtler, V.M., Guely, M., Marchal, P., Choplin, L., 2004. Shear-induced phase transitions in sucrose ester surfactant. J. Colloid Interface Sci. 270 (2), 270–275.
Sato, A.C.K., Perrechil, F.A., Costa, A.A.S., Santana, R.C., Cunha, R.L., 2015. Cross-linking pro-teins by laccase: effects on the droplet size and rheology of emulsions stabilized by sodium caseinate. Food Res. Int. 75, 244–251.
Sedev, R., Steitz, R., Findenegg, G.H., 2002. The structure of PEO–PPO–PEO triblock copolymers at the water/air interface. Phys. B Condens. Matter 315 (4), 267–272.
Solans, C., Izquierdo, P., Nolla, J., Azemar, N., Garcia-Celma, M.J., 2005. Nano-emulsions. Curr. Opin. Colloid Interface Sci. 10 (3–4), 102–110.
Sonneville-Aubrun, O., Simonnet, J.T., L’alloret, F., 2004. Nanoemulsions: a new vehicle for skin-care products. Adv. Colloid Interface Sci. 108, 145–149.
Swaisgood, H.E., 1996. Characteristics of milk. In: Fennema, O.R. (Ed.), Food Chemistry. third ed. Marcel Dekker, New York, (Chapter 14).
Tabibiazar, M., Davaran, S., Hashemi, M., Homayonirad, A., Rasoulzadeh, F., Hamishehkar, H., Mohammadifar, M., 2015. Design and fabrication of a food-grade albumin-stabilized nano-emulsion. Food Hydrocoll. 44, 220–228.
Tadros, T.F., 1994. Fundamental principles of emulsion rheology and their applications. Colloids Surf. A. 91, 39–55.
Tuinier, R., de Kruif, C.G., 1999. Phase separation, creaming and network formation of oil-in-water emulsions induced by an exocellular polysaccharide. J. Colloid Interface Sci. 218, 201.
Tung, M.A., Paulson, A.T., 1995. Rheological concepts for probing ingredient interactions in food systems. In: Gaonkar, A. (Ed.), Ingredient Interactions: Effects on Food Quality. Marcel Dekker, New York.
Turabi, E., Sumnu, G., Sahin, S., 2008. Rheological properties and quality of rice cakes formulated with different gums and an emulsifier blend. Food Hydrocoll. 22, 305–312.

Rheology of Emulsions Chapter | 17 457
van Aken, G.A., Vingerhoeds, M.H., De Wijk, R.A., 2011. Textural perception of liquid emulsions: role of oil content, oil viscosity and emulsion viscosity. Food Hydrocoll. 25 (4), 789–796.
Vasijevic, D., Parojcic, V.J., Primorac, M., Vuleta, M.G., 2009. Rheological and droplet size anal-ysis of W/O/W multiple emulsions containing low concentrations of polymeric emulsifiers. J. Serb. Chem. Soc. 74 (7), 801–816.
Velikov, K.P., Pelan, E., 2008. Colloidal delivery systems for micronutrients and nutraceuticals. Soft Matter 4 (10), 1964–1980.
Vingerhoeds, M., Blijdenstein, T., Zoet, F., Van Aken, G., 2005. Emulsion flocculation induced by saliva and mucin. Food Hydrocoll. 19, 915–922.
Walstra, P., 1996. Emulsion stability. Becher, P. (Ed.), Encyclopedia of Emulsion Technology, 4, Marcel Dekker, New York.
Walstra, P., 2003. Physical Chemistry of Foods. Marcel Dekker, New York. White, D.A., Fisk, I.D., Mitchell, J.R., Wolf, Hill, S.E., Gray, D.A., 2008. Sunflower-seed oil body
emulsions: Rheology and stability assessment of a natural emulsion. Food Hydrocoll. 22, 1224–1232.
Wulff-Pérez, M., Martín-Rodríguez, A., Gálvez-Ruiz, M., De Vicente, J., 2013. The effect of poly-meric surfactants on the rheological properties of nanoemulsions. Colloid Polym. Sci. 291 (3), 709–716.

459Advances in Food Rheology and Its Applications. http://dx.doi.org/10.1016/B978-0-08-100431-9.00019-XCopyright © 2017 Elsevier Ltd. All rights reserved.
Chapter 18
Advances in Yield Stress Measurements for Chocolate
V. Glicerina*, S. Romani*,***Interdepartmental Centre for Agri-Food Industrial Research, Alma Mater Studiorum, University of Bologna, Cesena (FC), Italy; **Department of Agri-Food Science and Technology, Alma Mater Studiorum, University of Bologna, Cesena (FC), Italy
18.1 INTRODUCTION
A wide variety of foods are dispersions (suspensions or emulsions), containing solid or liquid particles in a continuous liquid matrix. A typical example of food dispersion is molten chocolate. Chocolate (a cocoa dispersion) can be defined as a concentrated suspension made up of solid particles, such as sugar, cocoa powder, milk powder, etc., dispersed in a Newtonian liquid, generally cocoa butter (Afoakwa et al., 2008). It is a unique food appreciated by many consum-ers that provides a sweet taste, comfort and a great number of health benefits (Beckett, 2008). Below 25°C, it is solid and holds all ingredients together, whereas at body temperature, it melts, enabling particles to flow past one an-other and to form a smooth liquid in the mouth.
The most common types of chocolate are dark, milk and white, character-ized by different particles in suspension (depending on the recipe) and the same continuous matrix (cocoa butter) (Rousseau, 2007). Molten chocolate behaves as a non-Newtonian liquid, exhibiting a nonideal plastic behavior, with a yield stress, defined as the amount of energy required by the fluid to start flow, and a plastic viscosity, that is the energy required to keep fluid in motion (Ziegler and Hogg, 2009; Afoakwa et al., 2007; Beckett, 2008). The rheological character-istics (fundamental and empirical) are the most important attributes of choco-late, affecting several properties such as viscosity, consistency, and mouth feel, and influencing in a strong way the quality and stability of the final products (Servais et al., 2004). Recent studies (Afoakwa et al., 2008, 2009; Glicerina et al., 2015a,b) showed how the macroscopic properties of chocolate, in par-ticular rheological and empirical ones, such as presence or magnitude of yield stress, are strictly related to particle size, their distribution, and the presence of

460 PART | II Product Specific Studies in Rheology
networks between them. In particular, in chocolate dispersions all the physico-chemical, rheological, and microstructural properties result from its formula-tion and manufacturing process (Schantz and Rohm, 2005). During chocolate production mixtures of sugar, cocoa and fat are heated, cooled, pressurized, and refined (Beckett, 2009). These technological operations not only affect par-ticle size reduction, but also induce breaking of agglomerates, lipid, and leci-thin-coated particles distribution through the continuous phase, considerably modifying the microstructure of final chocolate (Afoakwa et al., 2009). The interactions between the suspended particles and the continuous phase provide information about the existing network and consequently can be associated with the properties and characteristics of the dispersions (Sato and Cunha, 2009). Since the macroscopic properties of food materials, as well as the appearance attributes, are strongly determined by their microstructure, the evaluation and study of the latter can be very important for a thorough understanding of the food matrices characteristics (Aguilera and Stanley, 1999).
18.2 CHOCOLATE: INGREDIENTS AND MANUFACTURING PROCESS
18.2.1 Ingredients
The three main types of chocolate are dark, milk, and white. Dark chocolate is a suspension of sugar and nonfat cocoa solids in cocoa butter; milk chocolate con-tains milk solids and milk fat in the mix; white chocolate formulation includes milk solids and milk fat without nonfat cocoa solids. Chocolate can also include emulsifiers such as lecithin and polyglycerol polyricinoleate (PGPR) as well as salt, flavorings, and/or spices.
Cocoa liquor is the product obtained from milling deshelled and roasted co-coa beans. It is composed of cocoa butter and cocoa solid particles. Chemically, it is a mixture of mono- and di-triglycerides, proteins, cellulose, starch, water, minerals, polyphenols, phospholipids, and other organic compounds present in minor quantities. Cocoa liquor is a very complex matrix containing several compounds that can adsorb large amounts of water (Afoakwa et al., 2009).
The major components of cocoa powders are proteins (11.5% of the cocoa liquor mass), cellulose (9%), starch (6%), polyhydroxyphenols (6%), and water (5%) (Vernier, 1998; Belitz and Grosch, 1999). In order to release most of the cocoa butter (present in the inner structure of cocoa particles) and hence reduce yield stress and viscosity of products, the cocoa particles should be refined to sizes less than that of the cocoa cells (20–30 µm). The upper size limit is impor-tant because the mouth feel of chocolate containing particles bigger than 30 µm is perceived as grainy or gritty (Afoakwa et al., 2007). During processing, in order to reduce the interparticles force and so the yield stress of the final sus-pension, the cocoa particles are normally coated with cocoa butter (Dhonsi and Stapley, 2006; Beckett, 2009).

Advances in Yield Stress Measurements for Chocolate Chapter | 18 461
Cocoa butter is the fat obtained from cocoa beans or parts of them with the following characteristics: free fatty acid content (expressed as oleic acid) 1.75% maximum; unsaponifiable matter not more than 0.5% except in the case of press cocoa butter, where it has to be 0.35% maximum (Arlorio, 2004). Cocoa butter represents the continuous and Newtonian fat phase of cocoa and chocolate dispersions (Baldino et al., 2010), influencing their mouthfeel, rheological, and melting properties. Cocoa butter can exist and crystallize in six different crystalline or polymorphic structures (often denoted by roman numbers I–VI), each of which exhibits different thermodynamic stability and melting temperatures (Rousseau, 2007; Svanberg et al., 2011). Crystallization conditions in terms of crystallization rate, crystal size, and morphology can affect polymorphism, as well as network morphology, that in turn influence rheological properties, in terms of yield stress, of the final product (Awad and Marangoni, 2006).
Sugar is one of the most important components of the cocoa dispersions (Beckett, 2009); its amount in a chocolate recipe is normally around 45–50% of the whole formulation. Sugar in chocolate is mainly constituted by sucrose and lactose from milk components in white and milk types (Laughter et al., 2012). Sucrose, due to its high hygroscopicity, tends to adsorb water when stored at high environmental humidity (>65%) or during heating ( Beckett, 2009). The adsorption of water involves modification in its rheological and crystalliza-tion properties (Bennar et al., 2012). In particular, during the refining step the damaged sugar particles have surfaces with extremely high temperature. Under this condition sucrose particles absorb the humidity present in the surround-ing, modifying their crystalline structures, that become amorphous and unsta-ble; this phenomenon also happens when a sugar solution is rapidly cooled or dried and the sugar molecules do not have enough time to arrange themselves into an organized way (ie, crystalline) (Laughter et al., 2012). The presence of amorphous sugar is a very important aspect in chocolate formulation as it can affect both the flavor and the flow properties of liquid chocolate. Milk pow-der is one of the main ingredients of milk and white chocolates, being used at about 20 w/w in the formulation. Milk and white chocolate are complex products composed of the following: lactose, fats, proteins, and emulsifiers (fat membrane components) (Attaie et al., 2003). Milk powders and cream powders are obtained by the partial removal of water from milk or cream; in particular powders for chocolate industry are usually produced by spray drying or by roller drying.
Roller-dried milk powder is usually preferred because of its high free fat content, greater than 95% (Haylock and Dodds, 2009). The high free fat content results in lower energy required during blending and reduced chocolate yield stress and viscosity that make easier to process the chocolate without further addition of cocoa butter to control viscosity. When spray-dried milk powder is used, 2–2.5% more of cocoa butter is required to provide the same flow prop-erties compared to roller-dried powder (Sharma et al., 2012). However, milk

462 PART | II Product Specific Studies in Rheology
roller-dried powders are more susceptible to oxidation compared to spray-dried ones. Koc et al. (2003) studied the possibility of increasing the free fat content of spray dried milk powders, promoting the crystallization of lactose by expos-ing them to high shear and elevated temperatures in a twin screw continuous mixer. Results showed an increase in the free fat content of more than 80% that improves the functional use of milk powder during the chocolate manufacture, reducing the yield stress of the final chocolate mixture.
Milk powder that contains high free fat quantities, or fat that is easily ex-tractable and can interact directly with the cocoa butter in chocolate formu-lation, is preferred by chocolate manufacturers (Hansen and Hansen, 1990). This component, in fact, influences the chocolate sensory profile in terms of taste and texture and the processing behavior of the molten chocolate mass, for example, flow properties such as yield stress and viscosity (Franke and Heinzelmann, 2008).
Minor ingredients can also be present in a chocolate recipe; they contrib-ute to the final attribute of the product. Between them, there are emulsifiers, used in order to improve the dispersion stability throughout the product shelf life. Emulsifiers, even if present in low amount (around 1% or less), influence in strong way the microstructural and rheological properties of cocoa disper-sions. The emulsifiers’ function is mainly related to their ability to adsorb and stabilize oil/water, water/air systems, or particle surfaces between them (Johansson and Bergensthal, 1992). Emulsifiers reduce particle–particle inter-actions due to steric hindrance, modification of Van-der Waals attraction forces, and (in the case of charged emulsifiers) modification of particles surface charge (Babin et al., 2004), contributing to regulate rheological properties of cocoa dispersions.
18.2.2 Manufacturing Process
The manufacturing process of chocolate is made up of different steps. The dia-gram shown in Fig. 18.1 (data from Glicerina et al., 2014) illustrates the main steps of the chocolate manufacturing process.
The flavor and rheological properties of final chocolate products are their main distinctive characteristics and are reached during processing steps. Choco-late can be made by two different methods: the industrial and the small scale one. In the first one, the final product is obtained by pushing all the dosed in-gredients through a mixing machine linked to a three rollers refiner (in order to obtain a first reduction in particle size around 100 µm) that transport the mass until a five rollers refiner (in order to obtain a more refined product, with around 30 µm particles). The refined product is then piped to a conche and at the end toward a tempering machine. The process is fully automatic and all the machines are connected to each other by a series of pipes and heat exchang-ers (Afoakwa et al., 2007). The small scale plant is usually a noncontinuous plant, called “roller ball mill”. The inner part of the roller ball is characterized

Advances in Yield Stress Measurements for Chocolate Chapter | 18 463
by the presence of small stain ball or beads that realize, at the same time, the different steps of mixing, prerefining, refining, and conching. The ingredients passing through and between the steel beads are mixed, refined, and at the same time conched because of the crushing and mixing effect of these beads on the particles present in the fluid matrix (Martin, 1988). The tempering step is then realized in a separate machine called “tempering machine.”
From a rheological point of view the more important chocolate processing steps are the refining, the conching, and the tempering one. The refining step is an important processing stage, aimed to a further reduction of mass particles size, and to the release of a part of fat from some ingredients, that uniformly have to coat the different kinds of particles (Vernier, 1998). This processing step is important to obtain a smooth texture and microstructural characteris-tics in terms of sugar and cocoa networks, fat distribution, etc., that mainly influence the rheological and sensory properties of the cocoa mass (Afoakwa et al., 2009; Fernandes et al., 2013). In this step particles are crushed by the shearing and pressuring action of rollers.
FIGURE 18.1 Main phases of chocolate manufacturing process. (Data from Glicerina et al., 2014.)

464 PART | II Product Specific Studies in Rheology
Conching is an essential processing step that contributes to develop viscosity, texture, and flavor of the final product. As known by literature (Beckett, 2009), conching is normally carried out by shaking chocolate at more than 50°C for few hours. It allows the removal of undesirable volatile compounds, the disruption of aggregates, and the release of fat which con-tributes to further wrap particles. The viscosity of the sample gets thinner as more cocoa butter is present in the liquefied state and more water is lost dur-ing the process. In the last stage of the conching the mixing time is increased and the remaining ingredients such as cocoa butter and emulsifiers are added to the system. These ingredients bring more fluidity to the dispersed system and play an important role in determining the rheological properties of the final product.
In order to obtain the optimal type of cocoa butter crystals (in terms of sta-bility, type, and size), the chocolate needs to be tempered. This means that the chocolate should become crystallized at a temperature below 32°C. The most important effects of the tempering step on chocolate products are: to improve their rheological attributes (in terms of yield value and viscosity) according to their different applications (enrobing, molding, and coating), to guarantee lon g-term stability of the flow properties and good surface gloss and color, avoiding fat bloom phenomena during storage.
18.3 RHEOLOGICAL BEHAVIOR OF CHOCOLATE TYPE DISPERSIONS: YIELD STRESS
The rheology is the study of the deformation and flow of matter and it inves-tigates how materials deform under application of external forces. The defor-mation expresses the relative movements of the “particles” (atoms, molecules, solid particles, etc.) present in a matrix (Barnes, 1999). For this reason, rheol-ogy depends upon the structure of the material. In highly concentrated suspen-sions, as in the case of cocoa dispersions, the interactions between particles dominate over the hydrodynamic forces, especially at low shear rates, and the material exhibits a complex flow behavior. At very low shear rates, chocolate can exhibit a Newtonian plateau or a yield value; increasing shear rate it will lead to a shear thinning region which levels off to an upper Newtonian pla-teau. At some point in the upper Newtonian region there can be an increase in viscosity which is based on instability effects (Banerjee et al., 2010). In cocoa dispersions the distance between the individual particles decreases, the forces acting on the particles increase and continuous networks are formed. In this case the system exhibits a “threshold” stress (called yield stress or apparent yield stress) which must be exceeded in order to deform (shear) or flow. When the stress applied to a material is below a certain value (σ < σy), the material shows little or no deformation, whereas when the stress exceeds a certain value (σ > σy), the material begins to flow. Increasing the stress, the forces acting on the particles increase, and the structures are altered; the agglomerates break

Advances in Yield Stress Measurements for Chocolate Chapter | 18 465
up, release the entrapped liquid phase, and dilute the system, that decreases the resistance to flow and hence its viscosity (Banerjee et al., 2010). On the basis of this description it can be stated that chocolate rheology is defined by using two parameters: yield stress and viscosity. Yield stress of chocolate is related to the energy required to moving. If it is high the product will tend to stand up, this is required for chocolate morsels in baked cookies; low yield values are instead needed for chocolate that can be used as coating. As reported in Section 18.1, the viscosity of chocolate is related to the energy required to keep the product moving once it has started to flow, and it is an important rheological charac-teristic for the pumping, mixing, and transportation operations during liquid chocolate processing.
18.3.1 Testing and Determination
The way in which a material deforms under an applied stress, defines its flow behavior. The rheometers are instruments normally used to measure flow be-havior characteristics of a material. The flow behavior of materials can be de-scribed by the relationship between the shear stress (τ) and the shear rate (γ). The viscosity (η) can be expressed as a constant linking stress and shear rate as follows (18.1):
η τγ
=
(18.1)
For a Newtonian fluid such as cocoa butter, shear stress and shear rate have a linear dependence and it has the same viscosity at every shear rate. Concen-trated suspensions, such as cocoa dispersions, are instead typical examples of non-Newtonian fluids and for them viscosity is not constant with respect to shear rate, but it is strictly dependent on stress conditions and samples exhibited a yield stress (σ) as described in Section 2.1 (Steffe, 1996).
A typical flow curve for a chocolate formulation can be obtained ac-cording to the International Confectionery Association (ICA), formerly International Office of Cocoa, Chocolate and Sugar Confectionery IOCCC, (2000), by using a stress or a stress–strain rheometer through the following four steps:
1. a preshearing for 500 s at 5 s−1 to homogenize and control the temperature of the sample, without recording measuring points;
2. an increase of the shear rate from 2 to 50 s−1 with 18 points in 180 s;3. a constant shearing at 50 s−1 for a duration of 60 s;4. a decrease of the shear rate from 50 to 2 s−1 for a duration of 180 s.
One of the simplest and most common way to determine the yield stress of a cocoa dispersion is to measure them directly from a flow curves, by plotting viscosity as a function of shear stress or shear rate or shear stress as a function of shear rate.
η=τγ

466 PART | II Product Specific Studies in Rheology
As known by literature (Cheng, 2009) from a graphical point of view plot-ting the logarithm of shear stress against the shear rate logarithm of applied stress, the yield stress can be obtained as the intercept on the stress axis at zero shear rate.
Another way to evaluate the yield stress is to plot the apparent viscosity ver-sus shear rate and evaluate the yield stress at the point in which viscosity tends to infinity (Ludger and Teixteira, 2007).
A more accurate way is the use of rheological models, as recommended by ICA (1973) that, however, is a very elaborate method since it requires highly reproducible rheological parameters obtained by complex and very precise instrumentation, such as rheometers, more suited for research pur-poses. Because of that ICA (2000) and Servais et al. (2004) recommend to not use models to elaborate rheological parameters, always not reproducible when obtained by simple instruments such as viscosimeters (Aeschlimann and Beckett, 2000). In this case, they suggest measuring the shear rate at 5 s−1 to evaluate the yield stress of chocolate. The use of rheological models will be discussed in detail in Section 21.4. The yield stress of chocolate can be further determined by means of creep or creep recovery tests (Baldino et al., 2010). In a creep test chocolate samples are subjected to constant stress, over a de-fined range of time, giving rise to a constant strain. Below the yield stress, the strain value is constant, and above the yield value the strain increases. In a creep recovery test, instead, below the yield stress the applied stress is imme-diately recovered from sample after stress removing, whereas above the yield value the stress is not recovered and chocolate starts flowing. Other studies were addressed to evaluate the yield stress of chocolate by applying nuclear magnetic resonance (NMR) and magnetic resonance imaging (MRI). These methods proved to be more appropriate in order to characterize the influ-ence of emulsifiers on the structure and flow behavior of chocolate products (Wichchukit et al., 2005).
Recent studies (De Graef et al., 2011; Van Der Vaart et al., 2013) introduced the use of oscillatory rheology (strain and stress sweep tests) as an alternative to measure the yield stress of chocolate suspensions compared to standard flow experiments. Results showed that the use of oscillatory measurements involved a more deep understanding of the yielding mechanisms. Moreover, this method showed to be very sensitive to fat quantity, emulsifiers type and concentration, and in general chocolate dispersion types. This is probably be-cause oscillatory rheology takes into account viscoelastic and microstructural properties of chocolate as well, thus giving more detailed information than other methods.
Van Der Vaart et al. (2013) investigated the rheological properties of choco-late in the nonlinear regime by using large amplitude oscillatory shear (LAOS). Results showed that dark chocolate exhibits not only a shear thinning behavior, but also a strain stiffening one, that is a very important feature to study, in depth, the overall rheological behavior of this kind of suspensions.

Advances in Yield Stress Measurements for Chocolate Chapter | 18 467
18.3.2 Methods: Traditional and Advanced
There are a large number of instruments and geometries that are able to measure the yield stress of chocolate; their different principles, applications and limita-tions have been covered in a number of books (Macosko, 1994; Malkin and Isayev, 2006). Among these there are: coaxial cylinders, cone and plate systems, parallel plate viscosimeters, and helical ribbon devices. However, since 1973 the International Confectionery Association (ICA) accepted that the rheologi-cal measurements of chocolate suspension must be taken by using a rotational viscosimeter with coaxial cylinders (bob and cup geometries). This geometry consists of a cup, which contains the chocolate sample and a central bob. The viscosity is directly related to the force developed by the liquid to stop its move-ment. To the base of the cup the velocity is not uniform, being zero in the center and maximum at the edge; this makes difficult to calculate the yield stress and viscosity (Beckett, 2008). It is important that the chocolate is uniformly treated within the gap; in fact if the gap is wide and the bob turns, only the chocolate near the bob is going to be affected by the applied stress since the product near the cup wall may remain at a steady state. In order to obtain a uniform flow, the gap should not be wide and the ratio of the bob and cup diameter must be ≥0.85. Moreover, before the measurement is taken the chocolate sample must be free from fat crystals. To ensure this, the chocolate is heated to 50°C and then cooled back down to just above 40°C before pouring it into the pre-warmed cup. The bob is put in and turned slowly so that the chocolate comes to a uniform temperature. The rotation speed is then increased, and the readings of the retarding force are taken at different time intervals (Beckett, 2008). In some viscometers the cup rather than the bob rotates and the force on the bob is measured. In other types, a specific force is applied to the bob and its speed of rotation is measured. However, tests carried out by using this kind of geometry can be quite invasive and can involve modifications in chocolate microstructure during measurements.
Since some studies (Chabbra, 2007; Fernandes et al., 2013; Glicerina et al., 2015a,b) on chocolate matrices showed the presence of a strict relation-ship between microstructure and yield stress of chocolate, a true yield stress can be evaluated only taking into account its structure; for this reason modifica-tions of the concentric cylinder geometry are useful. Recently vane geometry has been extensively applied to chocolate dispersions and it has been adopted in the United States by the Chocolate Manufacturers Association (CMA), as technique to measure reological properties of these kinds of suspensions. This geometry allows us to measure the non-Newtonian fluids’ properties reducing the slip effects at walls. In fact, the introduction of a thin-bladed vane testing element into a structured liquid, such as chocolate, gives a minimum amount of disturbance to the sample (Barnes and Nguyen, 2001).
Moreover, this geometry forms a cross shape at the end of a central shaft and can be inserted into the sample with minimal disturbance of the microstructure,

468 PART | II Product Specific Studies in Rheology
representing a very innovative aspect. The fluid circumscribed by the vane moves as a solid cylindrical body such that slip is effectively eliminated; inserted into the fluid is an easy and convenient method of performing accurate rheology measurements (Stokes and Telford, 2004; Baker et al., 2006).
Some experiments were performed in order to compare yield stress and viscosity of chocolate samples by using both a cylinder geometry and a vane one (Servais et al., 2003). Results showed that the viscosity values obtained by using both geometries were similar, but only the vane one provides correct yield stresses, due to the elimination of wall slip phenomena. Many researchers (Afoakwa et al., 2008, 2009; Fernandes et al., 2013) still use the cup and bob geometries following the ICA recommendations. During the last few years, more and more often chocolate yield stress is measured coupling rheologi-cal analysis with microstructural ones, in order to have a deep understand-ing and knowledge of chocolate yield stress along with other rheological characteristics.
Actually, several researches (Attaie et al., 2003; Wright and Marangoni, 2006; Vivar-Vera et al., 2008; Afoakwa et al., 2008; Glicerina et al., 2014, 2015a,b) have been performed on the study of microstructural properties of chocolate products, in terms of particle sizes, crystal and particles network, by using scan-ning electron microscopes, light microscopes, laser light diffraction techniques; obtained results have been compared and added to those from rheological and textural measurements in order to extensively study the micro- and macro- structural characteristics of these matrices. These studies demonstrated how the yield stress of chocolate is strictly dependent on its structure, in terms of particle size, specific surface area, and the resulting interparticle interactions. In par-ticular, while largest particles’ diameters determine chocolate coarseness and its textural characteristics; the amount of smaller particles and their mechanical and chemical interactions are associated with the presence and the magnitude of the yield stress of the matrix, influencing in strong way the packing ability and the state of aggregation of the final product and hence its resistance to flow.
18.4 RHEOLOGICAL MODELS
Several rheological mathematical models have been developed in order to describe and predict the various flow behavior curves on shear stress–shear rate diagrams of chocolate products.
Pseudo-plastic and plastic fluids, such as cocoa dispersions, are assumed to have an initial viscosity η0 which decreases with increasing shear rate or shear stress. The viscosity decrease is assumed to be the consequence of the loss of structure/network in the material. When the molecular structure/network of a fluid reaches a steady state (where the intermolecular forces acting to build the structure/network and those acting to break it down by shear are in equilibrium) no further decrease of viscosity is observed. This viscosity is called equilibrium viscosity η∞ (Specht Pivoto et al., 2007).

Advances in Yield Stress Measurements for Chocolate Chapter | 18 469
In cocoa dispersions, the viscosity changes from η0 to η∞, giving rise to a sigmoid curve with increasing shear rate. For a mathematical description of these sigmoid-shaped curves, a number of model functions have been developed. In general, most of these functions require two or three parameters, depending on its complexity. These numerical values are constants in the model function and make the functions specific for a given material. Rheological models may be grouped into three categories: empirical, theoretical, and structural. The empirical models, one of them is the power law, are measured experimentally. Theoretical ones are derived from fundamental concepts and indicate the factors that influence the rhe-ological parameters. Structural models, such as the Casson and the Windhab ones, are instead derived from analysis of the structure and from its kinetics changes. All kinds of models can be used to deeply study the rheological behavior of food matrices characterized by the presence of a yield stress (Rao, 2014).
For the concentrated dispersions, different models have been elaborated and applied; the most widely used for cocoa dispersions is the Casson model. Howev-er, that model not always accurately represent the rheological behavior of choco-late. For this, some studies (Weipert et al., 1993; Afoakwa et al., 2007; Glicerina et al., 2013, 2015a,b) were addressed to evaluate the most suitable rheologi-cal models for the different chocolate formulations. The models that showed to well describe the rheological behavior of chocolate products are: the Ostwald model, commonly referred to as the power-law model (Holdsworth, 1993; Hugelshofer, 2000), the model of Casson (ICA, 1973), and the model of Wind-hab (International Office of Cocoa, Chocolate and Confectionary IOCCC, 2000).
18.4.1 Power-Law Model
The power-law model is normally represented by the following equation:
σ γ= K * n (18.2)
where σ is the shear stress (Pa), K is the consistency index (Pa sn), γ is the shear rate (s−1), and n is the dimensionless flow behavior index. Power-law model has been widely used to describe rheological behavior of fluids food because it has only two parameters (K and n) to describe shear rate–shear stress data. Moreover, being employable over the 101–104 range of shear rate, it is normally used in the case of concentrated suspensions (Bouzas and Brown, 1995), made up from higher yield and viscosity values.
This is the case for dark chocolate formulation, in which the amount of fat is generally lower than in milk and white ones, due to the absence of milk fat and less amount of cocoa butter in the former. Also if the power-law model is not so wide-ly used for chocolate dispersions, some researches (Ouriev and Windhab, 2003; Glicerina et al., 2013; Ackar et al., 2015) demonstrated that it could represent in a very accurate way the rheological behavior of these matrices. In particular it is suitable for chocolate suspension types characterized by particles with very small sizes, strong interactions between them, and thus with high yield values.
σ=K*γ˙n
γ˙

470 PART | II Product Specific Studies in Rheology
18.4.2 Casson Model
The Casson model is a structure-based model defined by the following equation:
σ γ( )= +K Kc c0.5
00.5
(18.3)
For a food matrix whose flow behavior follows the Casson model such as some types of chocolate, a straight line results when the square root of shear rate, γ( )0.5, is plotted against the square root of shear stress, σ 0.5, with slope Kc and intercept K0c. The Casson yield stress is calculated as the square of the intercept, σ ( )= Kc c0 0
2 and the Casson plastic viscosity as the square of the slope, η = Kca c
2.The model of Casson was originally introduced to characterize printing ink
suspensions; later it was also applied to a number of food dispersions (Bolenz and Tischer, 2013). In 1973 the ICA recommended the use of the Casson model for shear rates between 5 and 60 (s−1) (Ludger and Teixteira, 2007). For this reason, the Casson model is the most known and used to study the rheological behavior of cocoa dispersions; however, according to Weipert et al. (1993), this model not always reflects in accurate way the rheological properties of choco-late. For this reason some elaborations of this model have been performed. In particular, Chevalley in 1991 proposed a modification of the Casson model by substituting the exponent 0.5 with 0.6. The choice of 0.6 as exponent has proved to be good, because in this case plastic viscosity (ηca) and yield stress σ0c are not too dependent on the range of shear rates under study and this can reduce de-viations when measurements are carried out with different viscometers. Several researches (Wichchukit et al., 2005; Karnjanolarn and McCarthy, 2006) stated the usefulness of the traditional Casson model to study the rheological behavior of milk chocolate; however a more recent study (Glicerina et al., 2015a) high-lighted, according to Chevalley (1991), a better accuracy of the modified Cas-son model to describe the rheological behavior of milk chocolate suspensions or dispersions.
18.4.3 Windhab Model
As previously stated, because of the complexity of chocolate rheology new mod-els were developed, such as the Windhab one. This rheological model (18.4) has been recommended from the International Office of Cocoa products (Internation-al Office of Cocoa, Chocolate and Confectionary (IOCCC), 2000) for chocolate dispersions in which the shear rates are analyzed between 2 and 50 s−1 at 40°C:
τ τ η γ τ τ γ γ( )( )= + + − − −∞* 1 e / *0 1 0 (18.4)
where τ0 is the yield stress at zero point, τ1 is the stress at the shear structuring limit (when the final structure is attained); η∞ is the infinity viscosity, γ . is the shear rate corresponding to the infinity viscosity.
σ0.5=K0c+Kcγ˙0.5
γ˙0.5
σ0c=K0c2
ηca=Kc2
τ=τ0+η∞*γ˙+τ1−τ01−e−γ/γ*

Advances in Yield Stress Measurements for Chocolate Chapter | 18 471
This model is based on the superposition of the various effects leading to the shear-induced structure of the suspension. For this reason, the Windhab model is very complex and relating rheological properties of chocolate with its microstructure, give us a quantification of the structural changes occurring at different shear rates (Aguilera and Stanley, 1999). This model assumes that when liquid chocolate is put under shear, there is a change in the structure of the molten chocolate. This can be observed by noting a change (decrease) in viscos-ity from an initial value (structure of no shear) to a steady state value. Here, the ordering forces (“building structure”) and the disordering ones (“breaking down structure”) are in equilibrium and the chocolate shows an equilibrium viscosity. When the shear stress is increased further, an equilibrium viscosity is reached which no longer decreases any further, and a final viscosity η∞ is reached; in this region of the flow curve there is a straight line with a constant slope. This straight line can be extrapolated back to the point of zero shear rate in order to find the intercept that gives the parameter τ1 that is a hypothetical yield stress (Ludger and Teixteira, 2007). In order to find the point on the curve where the final viscosity η∞ is reached, the Windhab model uses a second parameter τ* = τ (γ *) indicating that the shear-induced loss of structure is at a maximum when γ = γ. * is reached. Despite the International Office of Cocoa, Chocolate and Confectionary (IOCCC), (2000) suggestion to use the Windhab model for chocolate dispersions, it has been used in very few researches. Recently, Glicerina et al. (2015b) demonstrated that the Windhab model was more suit-able than the Casson one, modified by Chevalley (1991), to study the rheo-logical behavior of white chocolate samples. This model was also applied by Bolenz and Tischer (2013) in order to evaluate the yield stress of milk chocolate suspensions at very low shear rates (0.05 s−1). Moreover, Fischer et al. (2009) studied, by means of the Windhab model, rheological characteristics, respec-tively, of chocolate mass with 4% of fat/emulsifiers additive and of dark choco-late formulas with sucrose substitutes.
18.5 EFFECT OF FORMULATION AND PROCESSING ON CHOCOLATE YIELD STRESS
As previously reported, the chocolate rheology is defined mainly by using two parameters: yield stress and viscosity. Yield stress of chocolate indicates how strongly the ingredients are attracted to another (Laughter et al., 2012). It is a time-dependent property, being related to the stress loading rate. Moreover the chocolate yield stress greatly influences important technological and qualitative characteristics of product, such as processability, stability, coating thickness, flow and velocity profiles through pipelines, mouth feeling, spreadability, etc. (Sun and Gunasekaran, 2009).
The yield stress of chocolate is determined by both the ingredients present in its formulation and the manufacturing process (Servais et al., 2002; Granger et al., 2005; Sato and Cunha, 2009; Baldino et al., 2010). The ingredients

472 PART | II Product Specific Studies in Rheology
used in a recipe, particularly solid fraction and fat composition, affect the rheological and textural properties of chocolate (Fang and Zhang 1997; Attaie et al., 2003; Franke and Heinzelmann, 2008), such as the relationships between the ingredients and the continuous phase influence the microstructural proper-ties of the final matrix. The type, quality, and amount of sugar, fat, cocoa, and emulsifiers may have a considerable effect on the yield stress of the dif-ferent kinds of chocolate. These products exhibit a complex rheological be-havior, strictly dependent also on the manufacturing process (Bourne, 2002; Servais et al., 2004; Afoakwa et al., 2008). During processing the ingredients are subjected to different technological operations (mixing, prerefining, refin-ing, conching, and tempering) in order to obtain desired rheological properties for a final defined product texture (Chevalley, 1991; Servais et al., 2004). The understanding of how each single process step affects these important charac-teristics could be very useful in order to manipulate and optimize the process efficaciously, and mainly to predict and improve the quality of final product (Ahmed and Ramaswamy, 2006).
18.5.1 Formulation
Dark, milk, and white chocolate types have different compositions according to the quality and quantity of the main ingredients (cocoa solids, milk fat, cocoa butter, emulsifiers, etc.) present in their formulation (Fernandes et al., 2013). Some researchers, aimed to study the influence of fat amount in dark choc-olate different recipes (Dhonsi and Stapley, 2006; Beckett, 2008; Afoakwa et al., 2009), highlighted how high amount of cocoa butter involves wide varia-tions in sugar crystalline network structure and interparticle interactions, reduc-ing the aggregation state of matrix and thus influencing its textural properties. Stroppa et al. (2011) investigated how the most used emulsifiers in chocolate production, soy lecithin and PGPR, can affect the rheology and in particular the yield stress of chocolate. The authors showed that lecithin has a negligible effect on yield stress if used at a concentration between 0.1 and 0.3%, at higher concentration between 0.3 and 0.5% it further reduces the plastic viscosity but increases the Casson yield stress. At the same concentrations, PGPR resulted to have an opposite effect reducing the yield stress of chocolate samples without appreciable influence on plastic viscosity. In other studies (Attaie et al., 2003; Franke and Heinzelmann, 2008) the influence of milk powders, different for free fat contents, on the microstructural and rheological properties of cocoa type dispersions has been reported. The free fat content of milk powders used in chocolate formulations affected in strong way the rheological properties of studied samples. In particular, the authors found that the increase of milk free fat content influenced interparticles interactions, decreasing the yield stress and viscosity of chocolate.
In more recent studies Glicerina et al. (2014, 2015a) aimed to investigate the influence of formulation on microstructural properties of dark, milk, and white

Advances in Yield Stress Measurements for Chocolate Chapter | 18 473
chocolate, subjected to the same manufacturing process; it was demonstrated how microstructure of each product was greatly influenced by their different formulations and in particular by the amount and distribution of fat. As reported in these studies and as shown in Figs. 18.2 (Glicerina et al., 2015a) and 18.3 (Glicerina et al., 2014) different amounts of cocoa butter (higher in milk chocolate
FIGURE 18.2 ESEM micrograph of a milk chocolate formulation after the prerefining step (Glicerina et al., 2015a).
FIGURE 18.3 ESEM micrograph of a dark chocolate formulation after the prerefining step (Glicerina et al., 2014).

474 PART | II Product Specific Studies in Rheology
formulation) and the presence of milk fat only in milk chocolate receipt involve different structures and final rheological characteristics (Table 18.1).
As shown in Figs. 18.2 and 18.3, obtained with an environmental scanning electron microscope (ESEM) coupled to an image analysis system, and by data reported in Table 18.1, dark chocolate sample presents a more aggregate struc-ture than milk one, with less open spaces between particles. Despite the dif-ferences in particle size (105.26 µm for dark chocolate and 67.00 µm for milk chocolate) the yield stress of milk chocolate sample is lower due to the high amount of fat in its formulation. These results mean that the amount of energy that milk chocolate sample needs to start to flow is less compared to that re-quired by dark one.
It is known (Prasad et al., 2003; Sokmen and Gunes, 2006; Afoakwa et al., 2009; Laughter et al., 2012; Glicerina et al., 2015a,b) that in general a re-duction in particle size, involving an increase in the contact points between par-ticles, can also contribute to higher yield stress values. However, the studies of Glicerina et al. (2013, 2014, 2015a,b) and the previous works of Afoakwa et al. (2009) and Beckett (2008) demonstrate that, even if particle size is a crucial point in order to modify yield stress and rheological properties of chocolate, other factors such as the quantity of fat in the formulation can mostly influ-ence this rheological characteristic. As known by literature (Vernier, 1998), the fat from chocolate compounds, because of its lubricating action, reduces the particle–particle interactions, increasing their mobility and reducing the yield stress.
18.5.2 Manufacturing Process
Limited information is available in the literature on the influence of manu-facturing process on the microstructure and resulting textural properties of chocolate matrices (Briggs and Wang, 2004; Baldino et al., 2010; Quinones-Munoz et al., 2011). In most of these researches the influence of the last man-ufacturing step, the tempering, on the final structural properties of chocolate was investigated. Briggs and Wang (2004) studied the influence of shearing
TABLE 18.1 Yield Stress and Particle Size Evaluated by the Diameter of Feret of Dark and Milk Chocolate Formulations
Samples Dark chocolate Milk chocolate
Feret diameter (µm) 105.26 ± 1.90b 67.00 ± 3.54b
Yield stress (Pa) 182.33 ± 6.50a 91.10 ± 5.95a
a,bValues in the same column followed by different letters differ significantly at P < 0.05 level.Source: Data from Glicerina et al. (2013, 2014, 2015a)

Advances in Yield Stress Measurements for Chocolate Chapter | 18 475
rate and tempering time on the yield stress of milk chocolate during the tem-pering process. They found that the yield stress of milk chocolate samples was dependent on shear and tempering times, in particular by increasing the tempering time the yield stress increased. Baldino et al. (2010) found that different tempering cooling rates differently influenced rheological char-acteristics of chocolate formulations. Other researchers (Quinones-Munoz et al., 2011) studied the influence of three different tempering temperatures on some rheological properties and in particular on the yield stress of dark chocolate coatings. Results demonstrated that chocolate tempering carried out at the highest melting, cooling, and stabilization temperatures provided a product with the lowest yield stress values. Vivar-Vera et al. (2008) studied the influence of conching step on some rheological properties of dark choco-late; they showed that higher conching temperatures reduced yield stress and viscosity of product.
More recently (Glicerina et al., 2013, 2014, 2015a,b) the changes of rheo-logical and microstructural properties of different chocolate samples, during the overall manufacturing process (mixing, prerefining, refining, conching, and tempering steps) have been investigated.
The authors found a strict relationship between rheological properties, in terms of yield stress and viscosity, and microstructural ones, in terms of particles size, network structure, and state of aggregation. The results reported in Table 18.2 (from Glicerina et al., 2013, 2014) and showed by the ESEM micrographs in Figures 18.4–18.6 (Glicerina et al., 2014) refer to dark chocolate samples taken after mixing, prerefining, and refining pro-cessing steps.
The reported results highlight that, for the same chocolate sample, the yield stress values significantly increase (P < 0.05) with the reduction of particle size, passing from the mixing to the prerefining and refining steps during the manufacturing process. At the same time more and more aggregated structures are formed in which the smallest particles fill spaces between the largest ones (Bayod et al., 2008).
TABLE 18.2 Particle Size and Yield Stress Values of Dark Chocolate Samples Taken After the Mixing, Prerefining, and Refining Processing Steps
Dark chocolate samples Particle size Feret diameter (µm) Yield stress (Pa)
After mixing step 466.85 ± 1.99a 84.50 ± 5.97c
After prerefining step 105.26 ± 1.90b 182.33 ± 6.50b
After refining step 29.34 ± 1.93c 358.67 ± 6.65a
a,b,cValues in the same column followed by different letters differ significantly at P < 0.05 level.Source: Data from Glicerina et al. (2013, 2014)

476 PART | II Product Specific Studies in Rheology
Glicerina et al. (2013, 2014) in the same researches found that during the two last manufacturing steps (conching and tempering) chocolate samples un-derwent further modifications in terms of reduction of particle size and yield stress (Table 18.3) also due to the addiction of lecithin and cocoa butter that wet the suspension and wrap particles, reducing particles–particles interaction.
FIGURE 18.5 ESEM micrograph of dark chocolate sample after the prerefining step (Glicerina et al., 2014).
FIGURE 18.4 ESEM micrograph of dark chocolate sample after the mixing step (Glicerina et al., 2014).

Advances in Yield Stress Measurements for Chocolate Chapter | 18 477
18.6 CONCLUSIONS
Yield stress is a very important rheological property of chocolate products that greatly affects their final quality and stability. Chocolate yield stress not only determines the efficiency of chocolate processing involving mixing and pump-ing, but also plays a crucial role in chocolate applications such as enrobing, coating, and molding processes. Several studies showed a strict relationship between microstructural properties and yield stress of chocolate products. In particular these two characteristics are strongly influenced by processing (mix-ing, prerefining, refining, conching, tempering) and formulation (amount and type of sugar, fat and emulsifiers). The knowledge of these relationships can be very useful in order to optimize, improve, and modify the quality of the final product, mainly in terms of yield stress characteristics, which are most
FIGURE 18.6 ESEM micrograph of dark chocolate sample after the refining step (Glicerina et al., 2014).
TABLE 18.3 Particle Size and Yield Stress Values of Dark Chocolate Samples Taken After the Conching and Tempering Processing Steps
Dark chocolate samples
Particle size Feret diameter (µm)
Yield stress (Pa)
After conching step 25.63 ± 1.32a 38.77 ± 1.35a
After tempering step 27.10 ± 1.44a 33.07 ± 0.15b
a,bValues in the same column followed by different letters differ significantly at P < 0.05 level.Source: Modified by Glicerina et al. (2013, 2014)

478 PART | II Product Specific Studies in Rheology
critical for the quality of this kind of products. Several methods and techniques have been developed in order to measure the yield stress of chocolate matrices. In particular, the use of geometries such as the vane one, that lets us reduce the amount of disturbance of the sample, preserving its structure, is one of the more important ones for the evaluation of chocolate yield stress. Recent studies showed that different chocolate formulations need different rheological mod-els, in order to obtain an accurate evaluation of their yield stress and other rheological parameters. Recently the yield stress of chocolate formulations has been successfully measured by using oscillatory conditions due to its sensitivity being higher than the traditional stationary ones. In particular, in some recent studies, the rheological properties of chocolate have been investigated in the nonlinear regime by using LAOS, thus obtaining highly detailed information about the complex behavior of this kind of dispersions.
REFERENCES
Ackar, D., Škrabal, S., Šubaric, D., Babic, J., Milicevic, B., Jozinovic, A., 2015. Rheological properties of milk chocolates as influenced by milk powder type, emulsifier, and cocoa butter equivalent additions. Int. J. Food Prop. 18, 1568–1574.
Aeschlimann, J.M., Beckett, S.T., 2000. International inter-laboratory trials to determine the factors affecting the measurement of chocolate viscosity. J. Texture Stud. 31, 541–576.
Afoakwa, E.O., Paterson, A., Fowler, M., Vieira, J., 2007. Factors influencing rheological and tex-tural qualities in chocolate—a review. Trends Food Sci. Technol. 18, 290–298.
Afoakwa, E.O., Paterson, A., Fowler, M., 2008. Effects of particle size distribution and composition on rheological properties of dark chocolate. Eur. Food Res. Technol. 226, 1259–1268.
Afoakwa, E.O., Paterson, A., Fowler, M., Vieira, J., 2009. Microstructure and mechanical properties related to particle size distribution and composition in dark chocolate. J. Food Sci. Technol. 44, 111–119.
Aguilera, J.M., Stanley, D.W., 1999. Examining food microstructure. In: Aguilera, J.M., Stanley, D.W. (Eds.), Microstructural Principles of Food Processing and Engineering. second ed. Aspen Publishers, Gaithersburg, pp. 1–43.
Ahmed, J., Ramaswamy, H.S., 2006. Viscoelastic properties of sweet potato puree infant food. J. Food Eng. 74, 376–382.
Arlorio, M., 2004. Alimenti nervini: cacao, caffè, tè. In: Cabras, P., Martelli, A. (Eds.), Chimica degli Alimenti. Piccin, Padova, pp. 291–354, 2004.
Attaie, H., Breitschuh, B., Braun, P., Windhab, E.J., 2003. The functionality of milk powder and its relationship to chocolate mass processing, in particular the effect of milk powder manufactur-ing composition on the physical properties of chocolate masses. Int. J. Food Sci. Technol. 38, 325–335.
Awad, T.S., Marangoni, A., 2006. Ingredient interactions affecting texture and microstructure of confectionery chocolate. In: McPherson, A., Gaonkar, A.G. (Eds.), Ingredient Interactions. sec-ond ed. CRC Press, Boca Raton, p. 423.
Babin, H., Dickinson, E., Chrisholm, H., Beckett, S., 2004. Interactions in dispersions of sugar particles in food oils: influence of emulsifier. Food Hydrocoll. 19, 513–520.
Baker, B.S., Brown, D., Ramaswamy, H.S., Anantheswaran, R.C., 2006. Measurements of yield stress in dark chocolate using controlled stress vane method. J. Texture Stud. 37, 655–667.

Advances in Yield Stress Measurements for Chocolate Chapter | 18 479
Baldino, N., Gabriele, D., Migliori, M., 2010. The influence of formulation and cooling rate on the rheological properties of chocolate. Eur. Food Res. Technol. 231, 821–828.
Banerjee, D., Janaki, M.S., Chakrabarti, N., Chaudhuri, M., 2010. Viscosity gradient-driven insta-bility of ’shear mode’ in a strongly coupled plasma. New J. Phys. 12, 123031.
Barnes, H.A., 1999. The yield stress—a review or ‘panta roi’—everything flows? J. Non-Newtonian Fluid Mech. 81, 133–178.
Barnes, H.A., Nguyen, Q.D., 2001. Rotating vane rheometry—a review. Non-Newtonian Fluid Mech. 98, 1–14.
Bayod, E., Pilman, E., Willars, E., Tornberg, E., 2008. Rheological and structural characterization of tomato paste and its influence on the quality of ketchup. LWT—Food Sci. Technol. 41, 1289–1300.
Beckett, S.T., 2008. The Science of Chocolate. Royal Society of Chemistry. Cambridge.Beckett, S.T., 2009. Industrial Chocolate Manufacture and Use, fourth ed. Blackwell Publisher Inc.,
Oxford. Belitz, H.D., Grosch, W., 1999. Food Chemistry, second ed. Springer-Verlag, Berlin. Bennar, M., Betoret, E., Bojnanská, T., Brno, D., Hambálková, J., Richter, A., 2012. Optimal par-
ticle size distribution of white sugar. Czech Sugar Sugar Beet J. 128, 385–389. Bolenz, S., Tischer, T., 2013. Measuring shear stress at lowest possible shear rates and improving
viscosity determination of fat suspensions, for example chocolates. Int. J. Food Sci. Technol. 48, 2408–2416.
Bourne, M., 2002. Food Texture and Viscosity: Concepts and Measurements. Academic Press, San Diego.
Bouzas J. & Brown B. D. (1995) Interactions affecting microstructure, texture, and rheology of chocolate confectionery products. Dairy Ingredients for Food Processing. Wiley-Blackwell, United Kingdom. p. 451–528.
Briggs, J.L., Wang, 2004. Influence of Shearing and time on the rheological properties of milk chocolate during tempering. J. Am. Oil Chem. Soc. 81, 117–121.
Chabbra, R.P., 2007. Non Newtonian Fluid behaviour. Bubbles, Drops, and Particles in Non New-tonian Fluids, CRC Press, Boca Raton.
Cheng, D.C.-H., 2009. Characterisation of thixotropy revisited. Rheol. Acta 42, 372–382. Chevalley, J., 1991. An adaptation of the Casson equation for the rheology of chocolate. J. Texture
Stud. 22, 219–229. De Graef, V., Depypere, F., Minnaert, M., Dewettinck, K., 2011. Chocolate yield stress as measured
by oscillatory rheology. Food Res. Int. 44, 2660–2665. Dhonsi, D., Stapley, A.G.F., 2006. The effect of shear rate, temperature sugar and emulsifier on the
tempering of cocoa butter. J. Food Eng. 77, 936–942. Fang, T., Zhang, H., 1997. Rheological behaviour of cocoa dispersions with cocoa butter replacer.
J. Texture Stud. 28, 11–26. Fernandes, V.A., Muller, A.J., Sandoval, A.J., 2013. Thermal, structural and rheological characteris-
tics of dark chocolate with different compositions. J. Food Eng. 116, 97–108. Fischer, P., Pollard, M., Erni, P., Marti, I., Padar, S., 2009. Rheological approach to food systems.
C.R. Phys. 10, 740–750. Franke, K., Heinzelmann, K., 2008. Structure improvement of milk powder for chocolate process-
ing. Int. Dairy J. 18, 928–931. Glicerina, V., Balestra, F., Dalla Rosa, M., Romani, S., 2013. Rheological, Textural and calorimetric
modifications of dark chocolate during process. J. Food Eng. 119, 173–179. Glicerina, V., Balestra, F., Dalla Rosa, M., Bjorn Bergenhstal, Eva Tornberg, Romani, S., 2014. The
influence of different processing stages on particle size, microstructure, and appearance of dark chocolate. J. Food Sci. 79, 1359–1365.

480 PART | II Product Specific Studies in Rheology
Glicerina, V., Balestra, F., Dalla Rosa, M., Romani, S., 2015a. Effect of manufacturing process on the microstructural and rheological properties of milk chocolate. J. Food Eng. 145, 45–50.
Glicerina, V., Balestra, F., Dalla Rosa, M., Romani, S., 2015b. Microstructural and rheological prop-erties of white chocolate during processing. Food Bioprocess. Technol. 8, 770–776.
Granger, C., Legerb, A., Bareyb, P., Langendorffb, V., Cansell, M., 2005. Influence of formulation on the structural networks in ice cream. Int. Dairy J. 15, 255–262.
Hansen, S.O., Hansen, P.S., 1990. Spray-dried whole milk powder for the manufacture of milk chocolate. Scand. Dairy Inf. 2, 79–82.
Haylock, S.J., Dodds, T.M., 2009. Ingredients from Milk. In: Beckett, S.T. (Ed.), Industrial Choco-late Manufacture and Use. fourth ed. Blackwell Science, Oxford, pp. 76–99.
Holdsworth, S.D., 1993. Rheological model used for the prediction of the flow properties of food products. Inst. Chem. Eng. 71, 139–179, Part C.
Hugelshofer, D., 2000. Structural and rheological properties of concentrated suspensions mixed with an emulsion. Doctoral Thesis – Swiss Federal Institute of Technology (ETH) Zürich–Switzerland.
International Confectionery Association (ICA), 1973. Viscosity of chocolate. Determination of Cas-son yield value and Casson plastic viscosity. OICC, London, p. 10.
International Confectionery Association (ICA), 2000. Viscosity of cocoa and chocolate products. Analytical Method 46. CAOBISCO, rue Defacqz 1, B-1000 Bruxelles, Belgium.
International Office of Cocoa, Chocolate and Confectionary (IOCCC), 2000. Viscosity of cocoa and chocolate products. Analytical Method 46-2000, Geneva
Johansson, D., Bergensthal, B., 1992. The influence of food emulsifiers on fat and sugar dispersions in oils. I. Adsorption, sedimentation. J. Am. Oil Chem. Soc. 69, 705–717.
Karnjanolarn, R., McCarthy, K.L., 2006. Rheology of different formulations of milk chocolate and the effect on coating thickness. J. Texture Stud. 37, 668–680.
Koc, A.B., Heinemann, P.H., Ziegler, G.R., 2003. A process for increasing the free fat content of spray-dried whole milk powder. J. Food Sci. 68, 210–216.
Laughter, J.A., Brown, B.D., Anantheswaran, R.C., 2012. Manufacturing Chocolate for Entrepre-neurial Endeavors. In: Zhao, Y. (Ed.), Production of Specialty Foods for Entrepreneurs: Pro-cessing Technology, Quality and Food Safety. CRC Press /Taylor & Francis, New York.
Ludger, O.F., Teixteira, A.A., 2007. Food Physics—Physical Properties Measurements and Applica-tions. Springer –Verlag, Berlin Heidelberg.
Macosko, C.V., 1994. Rheology: Principles, Measurements, and Applications. Wiley-Vch, Germany. Malkin, A.Y., Isayev, A., 2006. Rheology: Concept Methods & Applications. ChemTec, Canada. Martin, Jr., R.A., 1988. Chocolate. Adv. Food Res. 31, 211–342. Ouriev, B., Windhab, E., 2003. Novel ultrasound based time averaged flow mapping method for die
entry visualization in flow of highly concentrated shear-thinning and shear-thickening suspen-sions. Meas. Sci. Technol. 14, 140–147.
Prasad, V., Trappe, V., Dinsmore, A.D., Segre, P.N., Cipelletti, L., Weitz, D.A., 2003. Universal features of the fluid to solid transition for attractive colloidal particles. Rideal Lecture, Faraday Discuss. 123, 1–12.
Quinones-Munoz, T., Gallegos-Infante, J.A., Rocha-Guzman, N.E., Ochoa-Martinez, L.A., Morales- Castro, J., Gonzalez-Laredo, R.F., Medina Torres, L., 2011. Mixing and tempering effect on the rheological and particle size properties of dark chocolate. Cyta J. Food 9, 109–113.
Rao, A., 2014. Rheology of Fluid, Semisolid, and Solid Foods. Springer, New York. Rousseau, D., 2007. The microstructure of chocolate. In: McClements, D.J. (Ed.), Understand-
ing and Controlling the Microstructure of Complex Foods Physical Properties: Structural and Physical Characteristics. Woodhead Publishing, Cambridge, pp. 648–690.

Advances in Yield Stress Measurements for Chocolate Chapter | 18 481
Sato, A.C.K., Cunha, R.L., 2009. Effect of particle size on rheological properties of jaboticaba pulp. J. Food Eng. 91, 566–570.
Schantz, B., Rohm, H., 2005. Influence of lecithin—PGPR blends on the rheological properties of chocolate. Eur. J. Food Res. Technol. 38, 41–45.
Servais, C., Jones, R., Roberts, I., 2002. The influence of particle size distribution on the processing of food. J. Food Eng. 51, 201–208.
Servais, C., Ranc, H., Sansonnens S. Ravji, A. Romoscanu A. & Burbidge, A., 2003. Rheological methods for multiphase materials. In Proc. of 3rd International Symposium on Food Rheology and Structure, pp. 137–141.
Servais, C., Ranch, H., Roberts, I., 2004. Determination of chocolate viscosity. J. Texture Stud. 34, 467–497.
Sharma, A., Jana, A.H., Chavan, R.S., 2012. Functionality of milk powders and milk-based powders for end use applications—a review. Comprehens. Rev. Food Sci. Food Saf. 5, 518–528.
Sokmen, A., Gunes, G., 2006. Influence of some bulk sweeteners on rheological properties of choc-olate. Food Sci. Technol.-Leb 39, 1053–1058.
Specht Pivoto, L., Khatchatourian, O., Teixeira-Brito, L.A., Pereira Ceratti, J.A., 2007. Modeling of asphalt-rubber rotational viscosity by statistical analysis and neural networks. Mater. Res. 10, 1.
Steffe, J.F., 1996. Rheological Methods in Food Processing Engineering. Freeman Press, East Lan-sing, MI.
Stokes, J.R., Telford, J.H., 2004. Measuring the yield behaviour of structured fluids. J. Non-Newto-nian Fluid Mech. 124, 137–146.
Stroppa, Z.V. L.; Ribeiro A. P. B. Luccas, V. Grimaldi R., Kieckbusch T.G., 2011. Influence of soy lecithin and PGPR levels in chocolate crystallization behavior. 11th International Congress on Engineering and Food. In: International Congress on Engineering and Food, 2011, Athenas. ICEF11 Proceedings, 2011.
Sun, A., Gunasekaran, S., 2009. Yield stress in foods: measurements and applications. Int. J. Food Prop. 12, 70–101.
Svanberg, L., Ahrné, L., Lorén, N., Windhab, E., 2011. Effect of sugar, cocoa particles and lecithin on cocoa butter crystallisation in seeded and non-seeded chocolate model systems. J. Food Eng. 104, 70–80.
Van Der Vaart, K., Depypere, F., De Graef, V., Schall, P., Fall, A., Bonn, D., Dewettinck, K., 2013. Dark chocolate’s compositional effects revealed by oscillatory rheology. Eur. Food Res. Tech-nol. 236, 931–942.
Vernier F., 1998. Influence of emulsifiers on the rheology of chocolate and suspensions of cocoa and sugar particles in oil. PhD Thesis, Department of Chemistry, University of Reading, UK.
Vivar-Vera, G., Torrestiana Sanchez, B., Monroy Rivera, J.A., Brito de la Fuente, E., 2008. Rheo-logical and structural changes of chocolate mass. Deutsche Lebensmittel-Rundschau 104, 376–382.
Weipert, D., Tscheuschner, H.D., Windhab, E., 1993. Rheologie der lebensmittel. Behr’s, Hamburg. Wichchukit, S., Mccarthy, M.J., Mccarthy, K.L., 2005. Flow behavior of milk chocolate melt and
the application to coating flow. J. Food Sci. 70, E165–E171. Wright, A., Marangoni, A.G., 2006. Formation, structure, and rheological properties of ricinelaidic
acid–vegetable oil organogels. J. Am. Oil Chem. Soc. 83, 497–503. Ziegler, G., Hogg, R., 2009. Particle size reduction. In: Beckett, S.T. (Ed.), Industrial Chocolate
Manufacture and Use. fourth ed. Blackwell Science, Oxford, pp. 142–166.

483
Index
AAbrupt contraction, flow through, 140Acesulfame-K, 368Adhesive energy, 306Agar, 337Agglomerates, 459Alginate gels, 337Amino acid composition, structure, 379Amylose leaching, 315Anacardium occidentale, 348Analyzed foam systems, rheological
parameters overview, 106Anchor agitator, 57Antithixotropy, 48Apparent extensional viscosity vs Trouton ratio
of emulsions, 150Apparent yield stress, 51, 303, 464Applied shearing stress, 7Arrhenius equation, 31Aspartame, 368Astringency, 81Atomic force microscopy, 345Auditory texture, 65
BBack extrusion rig, force–time curve, 308Back extrusion test, force–time curve, 309Baking products quality, dough rheology role,
287Basil plant, 406Basil seed gum (BSG), 405
apparent viscosity, 416BLG–BSG gel mixture, 430chemical composition of, 408Cox–Merz plot of complex viscosity for, 428dilute solution properties of, 408, 409
salt effect, 410dynamic rheology, 422
concentration, 422effect of pH, 424salt, 427sugar, 426temperature, 423
extraction process of, 407
fractionation of, 411frequency sweep for, 422high zero-shear viscosity of, 411mechanical spectra, 422mucilage, 407physicochemical properties, 408power-law model, 419rheological properties, 408
effect of concentration and temperature on, 412
gum-β-lactoglobulin, 430gum-selected galactomannans, 430gum-whey protein isolate, 432
salt, effect of, 417shear dependence, 410
effect of concentration, 413freezing/thawing treatment, 417, 418heating treatment, 419pH values, 416salt, effect of, 417temperature, 414
shear thinning properties of, different concentrations, 414
sodium chloride, influence of, 418steady shear and oscillatory rheology, 427step changes of, shear rate on, 420storage modulus for, gel formation of, 426sucrose concentration on, 417sugar, 417textural properties of, 428thermal treatments effects on
adhesiveness, 429consistency, 429on hardness, 428
time dependence, 420yield stress in, 413
Basil seeds, 406gum powder, 406
Batters, 298Binary gels, 341
gelling agents, 341mechanism of gelation, 341synergistic interactions, 341types of, binary polysaccharide
gel-structure, 342

484 Index
Binding model, 143designation, 141
Biopolymers, 28food rheology
cole–cole plot, 220frequency–temperature shift factor, 210isothermal curves for, 219typical creep behavior of, 210van Gurp–Palmen (vGP) plot, 220
network morphology, 22coupled separated network, 22interpenetrating network, 22phase separated network, 23
nongelling, 23BLG–BSG gel mixtures, 430
storage modulus (G9) development for, 431Bloom index, 383Bloom value (BV), 383Boltzmann’s constant, 346Boltzmann’s equation, 213Boltzmann’s phenomenological theory, 213Brabender extensograph, 299Brabender farinograph, 299Breaking down structure, 471Brookfield viscometer, 266Brownian forces, 438Brownian movement, 448Building structure, 471Bulk phase deformation, 66Burgers model, 282
compliance expression, 282
CCaBER. See Capillary breakup extensional
rheometer (CaBER) Capillary breakup elongational rheometer, 148Capillary breakup extensional rheometer
(CaBER), 152Carbohydrate dietary reference intake, 325Carboxymethylcellulose sodium salt
(Na-CMC), 146Carboxymethylcellulose (CMC) solutions, 162
consistency coefficients (K) for, 162flow behavior indices (n), 162
Carrageenan, 339Carreau fluid, 451Carreu–Yasuda equation, 95Cartesian coordinates, 125Casein, 341Cashew gum (CG)
rheological properties of, 348Casson model, 469, 470
Casson yield stress, 472Cauchy rule, 127Celiac disease (CD), 290, 298CFD. See Computational fluid dynamics Chebyshev harmonics, 99
for typical foam, 117Chebyshev polynomials, 99Chebyshev transformation, 116Chebyshev weighting coefficients, 100Cheddar cheese, 261, 263Cheese
aging, proteolytic hydrolysis role, 263functionality, 258–274
β-casein, role of, 258factors affecting, 258–260, 263
cheese manufacturing procedure, 260–262
composition of cheese, 262–263milk properties, 258postproduction processes, 263
fracture properties, 268–270cutting with wire and blade, 269eye/slit formation and growth, 270notch test, 269
melt and flow properties, 264–268empirical test, 264–265objective tests, 266–268
αs1-casein, role of, 258texture properties, 258–274
empirical texture measurement, 271–273
instrumental texture measurement, 273–274
linear viscoelasticity small amplitude oscillatory shear (SAOS)
measurements, 252maillard browning, 258, 260microstructure, 258nonlinear viscoelasticity measurement
dynamic tests, 253rheological properties, modeling of, 250rheology, 245–252
basic concepts, 246creep and recovery, 249–252definition, 245–246linear and nonlinear viscoelasticity, 252stress relaxation, 246–249stretchability, 252uniaxial testing, 246
soft-body defect, 262strands, 273stretchability measurement
methods, 257

Index 485
texture factor affecting, 270
texture map, 274wheel, 271
Cheese casein, 258tryptophan, natural fluorescent substance, 258
Cheese, composition of, 262–263fat content, 262moisture content, 262pH, 263salt content, 263
Cheese industry, applications of rheology, 247Cheese manufacturing procedure, 260–262
coagulants, 261cooking, stretching, and cooling, 261–262curd handling, 261starter culture, 260
Cheshire cheese, 261Chocolate Manufacturers Association
(CMA), 467Chocolate manufacturing process, 463Chocolate, yield stress measurements
formulation and processing on, 471–474ingredients, 460manufacturing process, 462–464, 474–477overview of, 459power-law model, 469rheological behavior of, 464
testing/determination, 465–466traditional and advanced, 467–468
rheological models, 468Casson model, 470power-law model, 469Windhab model, 470
Citral encapsulation, 448CLSM. See Confocal scanning light
microscopy (CLSM) CMC Solutions. See Carboxymethylcellulose
(CMC) Solutions Coagulants
animal coagulant (rennin), 261chymosin, 261microbial coagulant, 261plant coagulant, 261
Calotropis procera extract, 261Cynara cardunculus extract, 261
Cocoa butter, 459–461crystals, 464
Cocoa dispersions, 459, 469Cocoa liquor, 460Cogswell method
apparent extensional viscosity determination, 141
Cohesiveness, 12Coil overlap parameter, 9Coil-to-helix transition, 29Cold-water piscine gelatins, 378Cole–cole plot, 220Collagen, 379
structure of, 380Colloidal interactions, 444Complex elasticity moduli of analyzed foams
dependences on deformation amplitude, 105Compliance, 282, 283, 305Computational fluid dynamics (CFD), 167
application for, 167cleaned in-place (CIP), 167cross-sectional slices, uniformity of the fluid
temperature, 169detergent solution flows, open butterfly
valve, 168for gases, 168modeling, 52non-Newtonian examples, 169relative flow rates of liquid chocolate,
manifold, 170shear rate, 167shear stress, 167streamlines inside a four element in-line
mixer, 169Conching, 464Condensed globular protein systems, 31
high-pressure effects, 31Cone penetrometer
modes of operation, 272Confocal scanning light microscopy (CLSM), 71Consistency coefficients, 50Consistency index, 302Control volume methods (CVM), 59Converging–diverging flow paths, 130Converging flow, 140Cooking stability range, 316Cooling setback, 316Cox–Merz rule, 366Creep compliance, 305Creep function, 252Creeping flow regime, 57
anchor agitator, power of, 57Creep response of cheese
Kelvin–Voigt model, 249Maxwell model, 249Peleg model, 249
Creep test, compression, 249Cross equation, 8Crude oil, 55Crumb aging, 324

486 Index
Crumb hardness, 304Crumb structure, 324Crystallization, 461Curdlan, 337CVM. See Control volume methods (CVM) Cyclamate, 368
DDark chocolate formulation
ESEM micrograph, 473, 476, 477particle size and yield stress values, 475, 477
DDAB. See Dimethyldioctadecylammonium (DDAB)
Deborah number, 56Deformation, 438Deformation amplitude, 88, 89, 92, 107, 115Deformation curve, 10Deformation energy, 277Deformation history, 49Deformation rate history, structural models, 50Depletion flocculation, 149Dietary fibers (DFs), 177
in apple, 179carrot, 179content and composition of, in parsnip, 181in dried potato pulp, 179pectin in, 180soluble/insoluble, in four DF sources, 180in tomato, 179
Differential kinetic equation, structural models, 49
Differential scanning calorimetry, 29Diffusing wave spectroscopy, 345Dimethyldioctadecylammonium (DDAB), 445Discrete Fourier spectrum, 93Dissipation coefficient, 97, 109Dissipation of the energy, 983D Lissajous figure, construction, 982D Lissajous figure, geometrical
decomposition, 99Dougherty–Krieger equation, 445Dough foam stability, 299Dough rheology, 297
and bread quality effect of dough hydration, 317
dough structure, relationships between, 298Doughs
deformation capacity, 317development
hydrocolloids role, 290film stability, recovery, 288flow behavior index, 322forming, 297
gas cells, 288glass transition temperature, 286gluten-free, creep-recovery curve, 291mechanical spectra, power law
models, 281non-Newtonian behavior, 297sheeting, 129springiness determination, recovery strain, 286stiffening, 290
Droplet formation, extensional viscosity effect, 129
Dry matter (DM) content, 179of various original pastes, 179
Dynamic moduli function of frequency
general curve, 280Dynamic modulus, master curves of, 233Dynamic oscillation, 15Dynamic oscillatory shear experiments, 449Dynamic rheology, 422
EEgg albumin, 340Egg white protein
foam structure, 115secondary loop production, 115
Elastic Chebyshev harmonics normalized third, fifth, seventh, 118
Elasticity, 12Elastic materials, 49Elastic modulus, 278, 287
vs viscous modulus, 287Elastic stress, 115Elastic, viscous, and viscoelastic behavior,
277–278Electromyography (EMG), 347Elongational thickening, 153Elongation rate, 137Empirical expression, 30Empirical test, 264–265
modified Schreiber test, 264–265Schreiber test, 264
disadvantages, 259Empirical texture measurement
cone penetrometer, 272crumbliness, 271stringiness, 273
Emulsifiers’ function, 462Emulsifying capacity, 32Emulsions, 437
with addition of guar gum extensional viscosity curves, 150Trouton ratio, 151

Index 487
with addition of HPMC extensional viscosity curves, 150Trouton ratio, 151
with addition of Na-CMC extensional viscosity curves, 152Trouton ratio, 152
double, 437factors influencing, 440
colloidal interactions, 444droplet size, 442phase rheology, 441volume fraction, 441
in food industry, 439multiple, 437o/w
extensional flow stabilization tween 40, role of, 149
rheological property, 148stabilized with XG
extensional viscosity as function of deformation rate, 153
w/o extensional viscosity curve, 148
Energy dissipation coefficient and Q, dependence of
in function of strain amplitudes, 109Environmental scanning electron microscope
(ESEM), 474dark chocolate, 476micrographs, 475
Enzymatic browning, 249Equibiaxial extensional viscosity, 127Equilibrium viscosity, 468Extensional/elongational flows, 125
beverage sucking through straw, 130calendaring, 130extruder die, 130food industry, 129–130food processing application, 129–130sheet stretching, 130spreading of roll on bread, 130type
biaxial, 125, 126planar, 125, 126uniaxial, 125, 126
Extensional rate, 131Extensional rheology
measurement methods, 131–144capillary breakup extensional rheometer,
143–144controllable experiments, 133converging and contraction flows,
139–143fiber spinning, 135–136
filament stretching rheometer, 134–135noncontrollable experiments, 133stagnation point flows (four-roll mill,
opposed jets), 137–139tubeless syphon, 137
Extensional stress, 135Extensional viscosity
determination, used method, 133measuring method, 139
advantages and disadvantages, 144pressure drop, 139torque measurements, 139
process and quality control of products, importance in, 129
process design calculation, importance in, 129process modeling, importance in, 129sensor perception, importance in, 129and shear viscosity
relationship between, 128structural characterization, importance in, 129
Extension thinning, 129Extrudate expansion, 129
FFano flow, 137Farinographic unit values, 286Fast Fourier transform (FFT) algorithm, 93Fat replacer, 237Ferulic acid, 442FFT algorithm. See Fast Fourier transform
(FFT) algorithm Fibers studied, origin of, 178
area-based PSD of parsnip, 193area of, large particles, 195characteristics of the PSD for, 203composition of, in soluble and insoluble
part, 179dietary fibers (DFs), amount of, 179dry matter (DM) content, 179original pastes, dry matter (DM) content,
179pectin in four DF sources, 180
elastic modulus of yacon and parsnip suspensions, 187
particle concentration, 185classification of suspensions, 186particle size distribution (PSD), 185volume fraction of tomato paste
suspensions, 185water-insoluble solids (WIS), 185
paste preparation, 178apple sauce, 178carrot paste, 178

488 Index
cold break, 178hot break, 178parsnip paste, 178potato pulp, 178tomato paste, 178yacon paste, 179
properties of, 183soluble vs insoluble fiber, 183
supernatant viscosity as, function of degree Brix of solution, 184
typical apparent shear viscosity, in tomato paste, 184
surface-weighted mean diameter, 194valve homogenization, influence of, 196
binary images of, 10% tomato paste suspensions, 198
effects of, 199lab-scale valve homogenizer, 196micrographs of nonhomogenized and, 201
volume fraction of pellet, 204Fibrous proteins, 339First-order stress decay model, 421Flexible-chain polymer solution
extensional viscosity curves, 146Flory–Stockmayer model, 20Flour-based systems
creep-recovery and oscillatory rheological measurement, 284–291
biscuit and cookie doughs, 288–290bread doughs, 287–288
effect of yeast, 284general experimental consideration, 284gluten-free doughs, 290–291wheat flour doughs, 285–287
rigidity, 285viscoelastic behavior, 285
Flow behavior index, 302Flowing foods, residence time
measurement, 166CFD, 167power-law rheology, 166residence time, 166Reynolds number, velocity in, 166
Flows type converging flows, 133fiber spinning, 133stagnation flows, 133
Fluidization, 130Fluorescence spectroscopy, 258Foam group
based on characteristics analyzed using Chebyshev method, 118
Foams complex nature
biopolymers, effect of, 120formation forces, 121nonlinear behavior analysis, 121
FCT technique, use of, 121LAOS, use of, 121
residual elastic properties, 120rheological properties, 116
Food emulsions, 439Food gels, 356
biopolymer-based gels, 335classification of, gelation mechanism
and, 356definition, 357dynamic mechanical properties, 357gel strength, 358
Food industry polysaccharides, use of, 149
Food oral processing, 65Food oral tribology, 79Food products, 65
categories, 65hard solids, 65liquids, 65semisolids, 65soft solids, 65
lubrication properties, measurement of, 68rheological properties, 65sensory properties, 65
Food rheology, 1Food texture, 3, 65Forward extrusion test
force–time curve, 308vs back extrusion test, 309
Fourier coefficients, 100Fourier spectra, strain amplitudes function, 94
for selected foams, 108Fourier transform
idea of, 93Fourier transformation rheometry, 1Fourier transform mechanical spectroscopy
(FTMS), 383Fourier transform rheology (FTR), 87, 92, 98Fractional free volume, 30Fracture energy, 273Fracture stress, 311Fracture toughness, 269Fraunhofer diffraction method, 192Frequency-dependent storage modulus, 252Frequency–temperature shift factor, 210Friction curves, 74Friction tester, 70
Fibers studied, origin of (cont.)

Index 489
schematic diagram, 70Friedrich–Braun model, 349Fruit gels, 358
effect of sugar substitutes in, 368galacturonic acid methyl ester, 358pectin, gelling agent, 358
degree of methoxylation/esterification, 359physical characteristics of, 359rheology, 360–361
dynamic rheology, 365–367Figoni and Shoemaker model, 363Hahn model, 363steady state rheology, 361thixotropy/time dependent behavior, 362Weltman model, 363
shear stress vs shear rate for, fruits jam, 362FTMS. See Fourier transform mechanical
spectroscopy FTR. See Fourier transform rheology (FTR) f-Wedge test, 273
GGalactomannans, 413
aqueous solutions rheological behavior of, 349
Gelatin, 28, 340absolute value of the complex viscosity, 391bloom value (BV), 383Casson and Herschel–Bulkley model
parameters for, 397chemical structure of, 379creep behavior of, 395, 398elasticity of, 389fourier transform mechanical spectroscopy
(FTMS), 397gelatin concentration, effects of, 389, 390gelation mechanism, 381gelation point, 382–383gel characteristics, enzyme treatment, 388gel point (Tgel) and melting temperature
(Tm) of, 388helical structure, 379manufacturing, 378mechanical properties of, 378melting temperature of, 386microstructure of, 394molecular weight, effect, 395optimal Fourier rheometry for, 399oscillatory moduli and helical coil
concentration, correlation, 396in pharmaceutical industry, 377pH effect, on texture profile of, 392, 393
pig skin, 386polypeptide structure of, 377rheological properties of, 378rheology, 381schematic views of films, at different
temperatures and R ratios, 380SEM of gels, 394sources of, 378steady flow, 395strength and texture profile, 391stress relaxation tests, results of, 400structure and amino acid composition, 379viscosity, 384
Gelatinization, 315Gelation, 19Gelation mechanisms, 336Gelation point, 382Gelation theory, 19
cascade approach, 19Gellan gums, 339Gelling, 316
polysaccharides, 28Gels
creep testing, 344definition, 335equilibrium modulus, 344gelation mechanisms, 336gelling agents, 336gelling process, 336interactions in, 336microrheology of, 345
linear viscoelasticity of, low modulus materials, 346
Stokes–Einstein relation, diffusion coefficient, 346
oral processing, 347point, 344pseudo gels, 336rheological characterization of, 344
factors, 344swelling behavior of, 344texture perception of, 347types, 336
GF products. See Gluten-free (GF) products GG. See Guar gum (GG) G′, G″ curves behavior
groups, 89strain hardening, 89strain thinning, 89strong strain overshoot, 90weak strain overshoot, 90
Glass transition temperature, 29Glicinin, 325

490 Index
Globular proteins, 339Gluten extensibility rig, 311Gluten flour
vs gluten-free flour doughs, 298–300Gluten-free bread, 290, 298
polysaccharides, effect of, 299Gluten-free doughs
hydrocolloids (HC), effect of, 321insoluble fibers, effect of, 322pasting properties, 326rheological tests, 300–317
effect of fiber addition, 319–324empirical tests, 306–317
amylographic tests, 315–317back extrusion test, 308baking industry, use in, 300dough development during proofing, 314forward extrusion test, 307resistance to penetration, 313stickiness tests, 306texture profile analysis (TPA), 310–311uniaxial extension tests, 311–313
fundamental test oscillatory tests, 302–306steady/flow tests, 301–302
Gluten-free flours, 290Gluten-free (GF) products, 298Gluten protein network, 285Gluten sensitivity, 290Greek Feta, 13Guar gum, 341Gum arabic (AR)
rheological properties of, 348Gumminess, 12
HHammour fish gelatin, 387Hardness, 10Heat transfer calculations, 164
equipment for, 164exchanger design, 164heating of viscous foods, 164laminar flow, 164Newtonian flow behavior, 166power-law, 166residence time measurement, flowing foods,
166–167turbulent flow, 164
Heat transfer coefficient, 166Hencky strain, 132, 311Herschel–Bulkley fluids, 172, 369Herschel–Bulkley model, 411
Heterogeneity, 442Higher harmonic component
analysis, 92High methoxyl (HM) pectin, 359
gelation mechanism, 360High-pressure processing, 31
at low temperature, 31High-solid biomaterials, 27High-solid systems, 27Homogenization time, 451Hooke’s law, 277Horizontal shift factor, 213HPMC. See Hydroxyl propylmethyl cellulose
(HPMC) Human saliva
flexible polymer chain structure, 153Human tongue, 76Hydrocolloids, 446Hydrogen bonding, 33Hydrophobic coating, 445Hydroxypropyl methylcellulose (HPMC),
291, 446thermal gelation ability, 291
IIdeal materials, ideal rheological behavior, 96Ideal solid, response (strain as a function of
time), 278Ideal viscous fluid, response (strain as a
function of time), 278Immune-mediated enteropathy, 298Incompressible material, extensional viscosity,
127Inelastic fluids, 49Inflexion point, 115Infrared spectroscopy, 33Insoluble fiber
morphology of, 190microscopic images of, potato pulp, 191typical micrograph of, tomato cells, 190
particle size distribution, 192Instron Universal Testing Machine (IUTM), 10Instrumental texture measurement
compression test, 273texture map, 274texture profile analysis (TPA), 273wedge fracture test, 273
Interfacial tension, 438International Confectionery Association (ICA),
465, 467International Organization for
Standardization, 270

Index 491
Isothermal frequency (ITF) curves, 219Isothermal stationary flow, 55IUTM. See Instron Universal Testing Machine
(IUTM) Isotropic pressure, 128
JJam
effect of sucralose substitution, 372FTIR spectra, 371Newtonian behavior of, 371rheological properties, in mango jam, 371yield stress of, effect of TSS, 370
KKelvin–Voigt model, 278Kieffer dough, 311Kneading, 299
LLaccase, 442β-Lactoglobulin, 32Laminar flow, 164
velocity profiles for, 165LAOS. See Large amplitude oscillation shear
(LAOS) Large amplitude oscillation shear (LAOS), 2,
59, 87, 92, 95, 103, 466applications, 103–121
Chebyshev harmonics analysis, 116–121correlation of G′ and G″ analysis
function of deformation amplitude, 104
Fourier rheology Lissajous curves, analysis of, 107–112
Lissajous curves, advanced analysis of geometric decomposition, 112–116
yield stress determination by comparison of methods, 107
behavior type, 90data analysis
directions, 88methods and data analysis, 88–103
geometrical decomposition, 97–103G′, G″ curves, 88G′, G″ curves, analysis of, 89–91Lissajous figures, extended analysis,
97–103simple Lissajous figures, 95–97time series analysis and FTR, 92–95
rheology, 358
Large-rate dynamic viscosities, 102Large-starin (tangent) modulus, 100
geometrical genesis, 101Laser particle tracking, 345LBGs. See Locust bean gums Linear oscillatory rheology, 344Linear polymer, dilute solution
shear and extensional viscosity curves, 145
Linear range response, 88Linear variable differential transformer
(LVDT) rod, 267Linear viscoelasticity, 88Linear viscoelastic range (LVR), 17, 217, 280,
300, 304Linear viscoelastic tests, 278–283
creep and recovery tests, 282–283small amplitude oscillatory shear (SAOS)
tests, 278–282Liquid filament, break up, 143Liquid filtration, 130Lissajous figures, 111
and geometrical decomposition elastic part, 113viscous part, 113
Loaf volume, 311Locust bean gums (LBGs), 82, 341
surface morphology of, freeze-dried samples, 343
Loss angle, 279Loss modulus, 279, 303Loss tangent, 280, 302
effect of rice-based dough hydration, 318frequency dependence, 281
Low methoxyl (LM) pectin, 359gelation mechanism, in presence of calcium
ions, 359Low-solid mixed systems, 22LVDT rod. See Linear variable differential
transformer (LVDT) rod LVR. See Linear viscoelastic range (LVR)
MMacromolecular solutions, 280Magnetic resonance imaging (MRI), 466Magnetic tweezers, 345Maillard browning, 325Maltitol, 368Maltodextrins, 13, 321Mango jam samples, frequency sweep
of, 368Mastication, 347

492 Index
Material failure due to fracture, 269types
due to fracture, 268Maximum creep compliance, 306Maximum creep strain, 287Maxwell model, 152, 278, 281MCC. See Microcrystalline
cellulose (MCC) MCT. See Medium chain
triglycerides (MCT) Mechanical energy
storage of, 98Mechanical spectra, 19
principal categories, 19dilute solution, 19entangled solution, 19strong gel, 19weak gel, 19
Medium chain triglycerides (MCT), 76Meissner’s rheometer, 134, 135Metastable system, analysis of
use of LAOS and FTR, 87Metzner–Otto constant, 58Microcrystalline cellulose (MCC), 25Microcrystalline junction zones, 381Microemulsions, 439Milk chocolate formulations, 474
ESEM micrograph of, 473Milk powder, 461
roller-dried, 461spray-dried, 461
Milk standardization casein-to-fat ratio, 258
Minimum-rate dynamic viscosities, 102Mini traction machine (MTM), 77
schematic diagram, 78Miyazaki criterion
graphical interpretation, 92Moderate pressures, 32Molecular flexibility, 39Molten polymer
rheological property, 134stretching apparatus, 134
Moment of inertia, 52Monomeric phosphoglycoprotein, 35Mounted tribological device (MTD), 75Mozzarella cheese, 252, 262MTD. See Mounted tribological
device (MTD) MTM. See Mini traction machine (MTM) Mucilage, 407Multifunctional emulsifiers, 442
Mung bean starch, 237complex viscosity vs frequency for, 233sodium chloride-added and, 234starch–sucrose–water matrix, 234
Myosin, 341Myrjs, 449
NNa-CMC. See Carboxymethylcellulose sodium
salt (Na-CMC) Nanoemulsions, 437, 452
case studies, 447composition, 438defined, 438optical transparency, 438rheological properties, 452
Native molecular morphology, 35Nelder Mead simplex methods, 53Net tensile stress, 127
and time, relation between, 132New food product creation, 97Newtonian behavior, 119Newtonian fluids, 74, 128, 451
frictional behavior, 82ocoa butter, 465
Newtonian liquid, 459Newtonian plateau, 464Newton’s law, 7, 277Nonlinear range response, 89Non-Newtonian fluids, 7, 74, 128Normalized third harmonic behavior
function of strain amplitude, 95Nuclear magnetic resonance (NMR), 466Nusselt (Nu) numbers, definition of, 166
OObjective tests
capillary rheometry, 266dynamic shear rheometry, 267helical viscometry, 268squeeze-flow rheometry, 266steady shear viscometry, 266UW (University of Wisconsin) meltmeter,
267Ocimum basilicum, 406OFR. See Optimal Fourier rheometry Oil-in-water-in-oil (O1/W/O2)
emulsions, 437Oligosaccharides
plasticizer action, 321Optical tribological configuration (OTC), 71Optimal baking performance, 304

Index 493
Optimal Fourier rheometry (OFR), 399Oral lubrication, 3Oscillatory measurements, 17
frequency sweep, 18strain sweep, 17temperature ramp, 17time sweep, 17
Oscillatory rheology, 384frequency sweeps, 384
in chicken and bovine gelatin, 385Hammour fish skin gelatin sample,
selected temperatures, 384Oscillatory shear, 3
tests, 2Oscillatory techniques, types
LAOS, 88small amplitudes oscillatory shear
(SAOS), 88Oscillatory tests
creep and recovery tests, 305–306frequency sweeps, 304stress/strain sweeps, 302–303
Ostwald de Waele equation, 301OTC. See Optical tribological configuration
(OTC) Ovalbumin, 35
hydrophobicity value, 40
PParallel plate geometry
dough measurement, use in, 301Particle tracking rheology, 345Pasting process, 324Pasting temperature, 315
dough acidification, effect of, 326PCTFE. See Polychlorotrifuorethylene (PCTFE) PDMS. See Polydimethylsiloxane (PDMS) Pearson coefficient, 304Pectin, 338, 413Peltier elements, 75Penetration test plot, 314PEO. See Polyethylene oxide (PEO) PGM. See Pig gastric mucin (PGM) Phase plane and Lissajous figure
construction, 96Phase rheology, 441Piezorheometer, 345Pig gastric mucin (PGM), 444Pineapple jam, shear stress–time
relationship, 365Planar extensional viscosity, 127Plasticizing effect, 317
Plate-cone type sensor, 104Pluronics, 449
F68, 449F127, 449P105, 449
Polychlorotrifuorethylene (PCTFE), 76Polydimethylsiloxane (PDMS), 72Polydispersity, 442Polydispersity degree, 442Polydispersity index, 442Polyelectrolyte
rheological property, 147Polyethylene oxide (PEO), 449Polyglycerol polyricinoleate (PGPR), 460Polyhydroxyphenols, 460Polymer melts
nonlinear rheological properties use of LAOS and FTR, 87
Polymer network shear and extensional viscosity curves, 146
Polymer solutions drop size determination
use of LAOS, 87extensional viscosity
function of deformation rate, 147solid particles size determination
use of LAOS, 87Trouton ratio
function of deformation rate, 147Polymer-stabilized emulsions, 149Polysaccharide gels, 337
agar, 337alginate gels, 337carrageenan, 339gellan gums, 339idealized junction zones in, 338pectin, 338starch granules, 338
Postproduction processes, 263aging, 263freezing, 263heat processing, 263
Potato pulp, elastic modulus, 204Power law, 304Power-law equation, 141, 301Power-law fluid, 56Power-law index, 50Power-law model, 8, 469
concentration dependent, 8consistency index, 8flow behavior index, 8power law index, 8
Prandtl number (Pr), definition of, 166

494 Index
Pressure drop, in pipe flow, 161coefficients for, carboxymethylcellulose
(CMC) solutions, 162power-law coefficients, 162rheological equations, 161shear rates, 161
Pressure-induced protein denaturation, 39Pressurized samples, 35Proteinaceous agent, 13Protein enrichment, effect, 325–327Protein gels, 339
casein, 341egg albumin, 340gelatin, 340myosin, 341partial denaturation of, 339whey proteins, 340
Protein–polysaccharide–water systems, 23Protein–starch linkage, 326Pseudo gels, 336Pseudoplastic behavior, 53Pseudo-plastic fluids, 468
QQATA. See Quaternary alkyltrimethyl
ammonium (QATA) QBPA. See Quaternized bis-ethoxylated
primary amine (QBPA) Quasi-elastic light scattering, 345Quaternary alkyltrimethyl ammonium
(QATA), 450Quaternized bis-ethoxylated primary amine
(QBPA), 450
RRapid visco analyzer, 315
typical curves, 316Real thixotropic fluids, 53
aloe vera suspension, 53colors, 53drilling fluids, 53iron oxide suspensions, 53mayonnaise, 53toothpastes, 53waxy crude oils, 53
Recovery compliance, 306Relaxation spectrum, 281Reynolds number (Re), 56
definition of, 166Rheofermentometer test, 301, 314Rheological data, in food industry
CFD, 167–170elastic properties of food, 159
emulsions, 161future trends, 174gas cells, 161heat transfer calculations, 164–166pressure drop in, pipe flow, 161–163residence time measurement for, flowing
foods, 166rheometry methods, 163strain sweep for, bread dough, 160for tomato and lentil soup, 163typical flow pattern, protrusion in pipe, 164viscoelastic, food, 159viscosity liquid, high, 160yield stress measurement, 170–173yield value, 165
Rheological experiment conditions, 52Rheological measurements, 181
concentric cylinder, 181dynamic oscillatory rheology, 183fiber suspensions, measurements of, 182rotational rheometers, 181typical strain-sweep measurements, results
of, 183vane cup, 181vane geometry, 181viscosity measurements and, 182
Rheology, 7, 66, 437used terminologies, 248
Rheomalaxy, 48definition, 49
Rheometer geometry, 52Ribbon blender mixing, 57Rice based doughs, acid incorporation
impact, 326Rice based GF doughs
enriched with albumin or pea protein stress sweep curves, 303
enriched with calcium caseinate frequency sweep curves, 303
Rice flour, hypoallergenic property, 290Roller ball mill, 462Rotating cylinders, 134, 135Rotational rheometer, 54, 104Rotational viscometry, 1Rouse theory, 211
SSamples stretch, with mobile clamp uses, 134SAOS. See Small amplitude oscillation shear
(SAOS) Satellite drop formation, 129Scanning electron microscopy (SEM), 76SDS. See Sodium dodecyl sulfate (SDS)

Index 495
Sedimentation, 130Selected fluids
experimental result, 145–154biopolymer solutions, 145–147
carboxymethylcellulose sodium salt, 145–147
guar gum (GG), 145–147gum arabic, 145–147hydroxypropyl methylcellulose
(HPMC), 145–147xanthan gum (XG), 145–147
emulsion, 148–152other fluids, 152–154
SEM. See Scanning electron microscopy (SEM) Semisweet doughs
effect of endogenous flour lipids, 289Sensory perception, 78Sestak and Zitny’s model, 50Shear creep compliance, 249Shear-dominated flows, 49Shear flow analysis, 94Shear modulus, 91Shear strain, 7Shear stress, 51Shear thinning, 129, 302, 464
behavior, 8Shear viscosity, 322Shift factors, 2Shifting, 210Short doughs
biscuits fat, role of, 289
effect of endogenous flour lipids, 289Signal-to-noise ratio, 102Silicone rubber, 76Sink flow, 140Small amplitude oscillation shear (SAOS), 2,
59, 88rheology, 358tests, 278–282
Small deformation dynamic oscillation (SAOS), 15
Small-starin (tangent) modulus, 100geometrical genesis, 101
SMP. See Sucrose monopalmitate (SMP) Sodium dodecyl sulfate (SDS), 444Sodium metabisulfite, 290Solution rheology, 7Sorbitol, 368Soy glycinin systems, 34Soy proteins, 34
isolates, 325Specific constitutive model, 51Spin-line rheometer, 136
Stagnation flows four-roll mill, 138opposed nozzles, 138slot nozzle, 138
Starch gelatinization temperature, 287Starch–gluten matrix, 288Starch granules, 338Stevioside, 368Stickiness curve
characteristic, 307Stiffened by deformation, 116Storage modulus, 279, 303, 449Strain hardening, 130Strain oscillation, 279Strain stiffening, 121
index, 101Strain/stress ratio, 305Strain sweeps, 284Strain tensor, 126Stress relaxation, 246
test, nonfood applications, 249Stress shift factor, 216Stress sweeps, 284Stress tensor, 127Stribeck curve, 74Strong gels, 280Sucralose, 368Sucrose monopalmitate (SMP), 448Sugar, in chocolate, 461Sugar jam, variation of storage and loss
moduli, 367Surface hydrophobicity, 39Surfactant, 448
myrjs, 449pluronics, 449
TTactile texture, 65Tamarind seed gum
rheological behavior of, in aqueous solutions, 348
capillary viscometry, 348steady shear, 348viscoelasticity properties of, 348
Tamarindus indica, 348Tapioca-resistant starch, 322TA-XT2 texture analyzer, 307Tensile stress growth coefficient, 132, 133Tetradecyltrimethylammoniumsalicylate
(TTASal), 153Texture analyzer set-up, 71Texture profile analyser (TPA), 10, 273, 310
parameters measured, 11

496 Index
Thermorheologically complex materials (TCMs), 210
Thermostated vessel, 441Thickening ratio, 102Thixotropic flow, 55Thixotropic fluid modeling, 59
future trends, 59Thixotropic fluids, rheological models, 49
deformation rate history, structural models, 50differential kinetic equation, structural
models, 49specific constitutive model, 51
Thixotropic inelastic fluids, 49mathematical models, 49
Thixotropic liquid, 8Thixotropy, 1, 48
definition, 48Time-dependent shear modulus, 399Time–temperature analogy, 209Time–temperature–stress superposition
principle, 216stress shift factor, 216
Time–temperature superposition (TTS), 2, 29applications in, 225
β-glucan concentrate-enriched wheat flour dough, 236
juice products, 238for mozzarella cheese, 236–238mung bean starch, 232nanocomposites, 225–230pectin, 232polysaccharide/sugar mixtures, 231
elastic modulus and relaxation modulus, 213–215
relaxation modulus of, generalized Maxwell fluid, 211
for viscoelastic materials, 211Williams-Landel-Ferry equation and, 215
Time–temperature superposition principle (TTSP), 209
creep behavior, 221–223failure of, curves, 223horizontal shift factor, 213master curve for dynamic moduli, 217for oscillatory rheology, 218reduced time, 213shift factors for, 224
Tomato paste, food rheology binary images of 10%, 198DF content of, 179preparation of, 178shear rate, 184shear viscosity, 184
soluble pectin in, content of, 183typical micrograph of, tomato cells, 190typical strain-sweep measurements, 183viscosity measurements, 182volume fraction of, 185
Tongue–palate tribological system, 76Total stress tensor, 128TPA. See Texture profile analyser (TPA) Transglutaminase enzyme, 339Translational mobility, 29Tribology cell, 3, 66, 73, 74Tribometer, 67
basic principle, 67digital schematic image, 77in food applications, 70
friction tester, 70mini traction machine, 77mounted tribological device, 75optical tribological configuration, 71texture analyzer set-up, 71tongue–palate tribological system, 76tribology cell, 73tribo-rheometer, 72
operation of, 67Tribo-rheometer, 72Triticum durum, 287Trouton number, 128, 129, 139
function of strain rate dispersed phase concentration
influence, 149mean molecular mass, effect of, 146
TTASal. See Tetradecyltrimethylammonium-salicylate (TTASal)
TTS. See Time–temperature superposition (TTS)
Turbulent flow, 164velocity profiles for, 165
Tween 40, 149Typical Mixolab, typical curves, 316
UUniaxial extension test, 312Uniaxial stretching sample, 131Universal testing machine (UTM), 246UTM. See Universal testing machine (UTM) UW (University of Wisconsin) meltmeter
advantages, 265
VVan der Waals attraction forces, 462van Gurp–Palmen (vGP) plot, 220Vertical shift factor, 213

Index 497
Viscoamylograph, 315Viscoelasticity, 15, 449Viscoelastic moduli, 304
effect of rice-based dough hydration, 318Viscoelastoplastic behavior, 103Viscosity, 7, 384
coefficient, 8defined, 7intrinsic, 9limiting, 8shear-rate dependent, 7zero shear, 8
schematic plot, 9Viscous Chebyshev harmonics
normalized third, fifth, seventh, 118Visual texture, 65Vitrification, 37
WWater binding capacity of protien, 326Water-holding capacity, 291Water-in-oil (W/O) emulsion, 437Water-in-oil-in-water (W1/O/W2)
emulsions, 437Weak gels, 280Weissenberg–Rabinowitsch correction, 141Wheat dough
rheological properties measurement alveograph, 299extensograph, 299farinograph, 299mixograph, 299
Whey protein isolate (WPI), 82, 432flow behavior of, 432future trends, 433
Whey proteins, 34, 237, 340extent of denaturation, 39
Williams Landel and Ferry (WLF) equations, 2, 215
constructing master curve based on, 223Windhab model, 471
for chocolate dispersions, 471
WLF equations. See Williams Landel and Ferry (WLF) equations
Work of cohesion, 308Wormlike micelle branching
elongational flow determination opposed jet device, use of, 153
Wormlike micelle solutions, 152, 153extensional viscosity, 153shear-thinning behavior, 153
WPI. See Whey protein isolate (WPI)
XXanthan, effect on bread volume, 321Xanthan, 413Xanthan gum, 341
rheological models for, 349XG. See Xanthan gum (XG) Xylitol, 368
YYacon paste, food rheology
dry matter (DM) content, 179elastic modulus of, 188
parsnip suspensions and, 187volume-based PSD of supernatants, 188
centrifugation of, 188Yield stress. See Apparent yield stress Yield stress estimation method, 91Yield stress measurement, food products, 170
definition, 170equilibrium flow curve data, 172Herschel–Bulkley fluids, 172magnitude of, 170for tomato ketchup, 171values for, food products measured from
equilibrium flow models, 173values of, 171
Yield stress, of chocolate, 471
ZZero-shear viscosity, range of, 133