Remodeling of hippocampal synapses after hippocampus-dependent associative learning
Upload
khangminh22Category
view
0download
0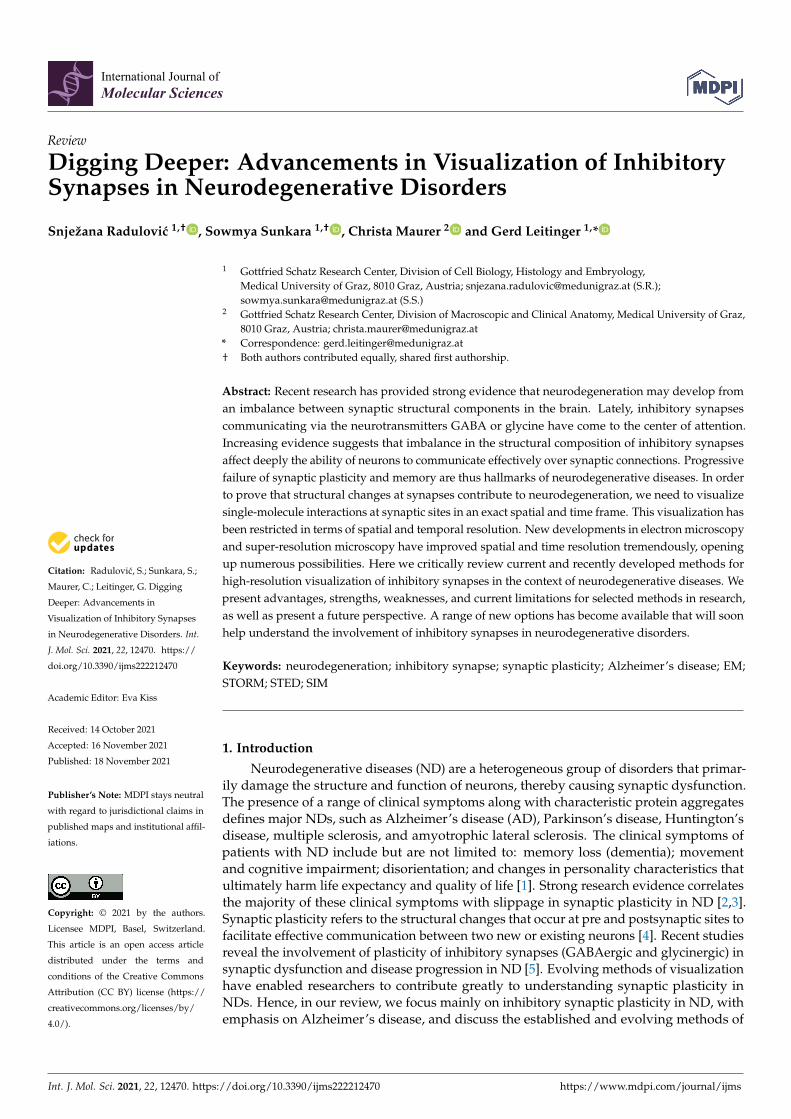
International Journal of
Molecular Sciences
Review
Digging Deeper: Advancements in Visualization of InhibitorySynapses in Neurodegenerative Disorders
Snježana Radulovic 1,† , Sowmya Sunkara 1,† , Christa Maurer 2 and Gerd Leitinger 1,*
�����������������
Citation: Radulovic, S.; Sunkara, S.;
Maurer, C.; Leitinger, G. Digging
Deeper: Advancements in
Visualization of Inhibitory Synapses
in Neurodegenerative Disorders. Int.
J. Mol. Sci. 2021, 22, 12470. https://
doi.org/10.3390/ijms222212470
Academic Editor: Eva Kiss
Received: 14 October 2021
Accepted: 16 November 2021
Published: 18 November 2021
Publisher’s Note: MDPI stays neutral
with regard to jurisdictional claims in
published maps and institutional affil-
iations.
Copyright: © 2021 by the authors.
Licensee MDPI, Basel, Switzerland.
This article is an open access article
distributed under the terms and
conditions of the Creative Commons
Attribution (CC BY) license (https://
creativecommons.org/licenses/by/
4.0/).
1 Gottfried Schatz Research Center, Division of Cell Biology, Histology and Embryology,Medical University of Graz, 8010 Graz, Austria; [email protected] (S.R.);[email protected] (S.S.)
2 Gottfried Schatz Research Center, Division of Macroscopic and Clinical Anatomy, Medical University of Graz,8010 Graz, Austria; [email protected]
* Correspondence: [email protected]† Both authors contributed equally, shared first authorship.
Abstract: Recent research has provided strong evidence that neurodegeneration may develop froman imbalance between synaptic structural components in the brain. Lately, inhibitory synapsescommunicating via the neurotransmitters GABA or glycine have come to the center of attention.Increasing evidence suggests that imbalance in the structural composition of inhibitory synapsesaffect deeply the ability of neurons to communicate effectively over synaptic connections. Progressivefailure of synaptic plasticity and memory are thus hallmarks of neurodegenerative diseases. In orderto prove that structural changes at synapses contribute to neurodegeneration, we need to visualizesingle-molecule interactions at synaptic sites in an exact spatial and time frame. This visualization hasbeen restricted in terms of spatial and temporal resolution. New developments in electron microscopyand super-resolution microscopy have improved spatial and time resolution tremendously, openingup numerous possibilities. Here we critically review current and recently developed methods forhigh-resolution visualization of inhibitory synapses in the context of neurodegenerative diseases. Wepresent advantages, strengths, weaknesses, and current limitations for selected methods in research,as well as present a future perspective. A range of new options has become available that will soonhelp understand the involvement of inhibitory synapses in neurodegenerative disorders.
Keywords: neurodegeneration; inhibitory synapse; synaptic plasticity; Alzheimer’s disease; EM;STORM; STED; SIM
1. Introduction
Neurodegenerative diseases (ND) are a heterogeneous group of disorders that primar-ily damage the structure and function of neurons, thereby causing synaptic dysfunction.The presence of a range of clinical symptoms along with characteristic protein aggregatesdefines major NDs, such as Alzheimer’s disease (AD), Parkinson’s disease, Huntington’sdisease, multiple sclerosis, and amyotrophic lateral sclerosis. The clinical symptoms ofpatients with ND include but are not limited to: memory loss (dementia); movementand cognitive impairment; disorientation; and changes in personality characteristics thatultimately harm life expectancy and quality of life [1]. Strong research evidence correlatesthe majority of these clinical symptoms with slippage in synaptic plasticity in ND [2,3].Synaptic plasticity refers to the structural changes that occur at pre and postsynaptic sites tofacilitate effective communication between two new or existing neurons [4]. Recent studiesreveal the involvement of plasticity of inhibitory synapses (GABAergic and glycinergic) insynaptic dysfunction and disease progression in ND [5]. Evolving methods of visualizationhave enabled researchers to contribute greatly to understanding synaptic plasticity inNDs. Hence, in our review, we focus mainly on inhibitory synaptic plasticity in ND, withemphasis on Alzheimer’s disease, and discuss the established and evolving methods of
Int. J. Mol. Sci. 2021, 22, 12470. https://doi.org/10.3390/ijms222212470 https://www.mdpi.com/journal/ijms

Int. J. Mol. Sci. 2021, 22, 12470 2 of 15
visualization that have contributed to our knowledge of changes in inhibitory synapseplasticity so far.
Alzheimer’s disease, similar to the majority of NDs, is either familial or sporadic, orboth combined, but there is no defined start point for the origin of the disease. AD is patho-logically defined by the presence of aggregated amyloid-beta oligomers (AβOs, peptides of36–43 amino acids), aggregated tau protein, neurodegeneration, and neuronal injury [6,7].Figure 1 shows a schematic representation of the effects of AβOs, tau phosphorylation, andneurofibrillary tangles (NFT) on synaptic plasticity. Pathomechanics of AD are shown asan example to illustrate the overview of protein aggregates and biomarkers involved inND and its direct and indirect role in inhibitory synaptic plasticity. Often, there is a longasymptomatic phase before the onset of the early stages of the disease. Inhibitory neuronsare important to maintain synaptic balance for healthy neuronal functioning in the brain.In the adult brain, GABAergic neurons are the major inhibitory neurons that are criticalto maintaining synaptic balance [5]. Any loophole in inhibitory synaptic plasticity cantrigger accidents in neuronal communication, leading to progressive neurodegenerativediseases [8,9].
Int. J. Mol. Sci. 2021, 22, 12470 2 of 15
in ND, with emphasis on Alzheimer’s disease, and discuss the established and evolving methods of visualization that have contributed to our knowledge of changes in inhibitory synapse plasticity so far.
Alzheimer’s disease, similar to the majority of NDs, is either familial or sporadic, or both combined, but there is no defined start point for the origin of the disease. AD is pathologically defined by the presence of aggregated amyloid-beta oligomers (AβOs, pep-tides of 36–43 amino acids), aggregated tau protein, neurodegeneration, and neuronal in-jury [6,7]. Figure 1 shows a schematic representation of the effects of AβOs, tau phosphor-ylation, and neurofibrillary tangles (NFT) on synaptic plasticity. Pathomechanics of AD are shown as an example to illustrate the overview of protein aggregates and biomarkers involved in ND and its direct and indirect role in inhibitory synaptic plasticity. Often, there is a long asymptomatic phase before the onset of the early stages of the disease. Inhibitory neurons are important to maintain synaptic balance for healthy neuronal func-tioning in the brain. In the adult brain, GABAergic neurons are the major inhibitory neu-rons that are critical to maintaining synaptic balance [5]. Any loophole in inhibitory syn-aptic plasticity can trigger accidents in neuronal communication, leading to progressive neurodegenerative diseases [8,9].
Figure 1. Schematic representation of the direct and indirect influence of amyloid-beta oligomers (AβO), hyperphosphorylated tau (hTau), and neurofibrillary tangles (NFT) on synaptic components in the context of Alzheimer’s disease (AD). The figure represents an example of the influence of protein aggregates and biomarkers on synaptic plasticity at functional and molecular levels in neu-rodegenerative diseases, which affects the cognitive functions of the brain. α-amino-3-hydroxy-5-methyl-4-isoxazole propionic acid receptor (AMPAR) and N-methyl D-aspartate Receptors (NMDAR) are glutamate receptors present on the postsynaptic membrane. GABAAR—γ-aminobu-tyric acid type-B receptors; APP—amyloid-beta precursor protein; Ca2+—calcium ion; ROS—reac-tive oxygen species; ATP—adenosine triphosphate; cyt c—cytochrome c; VAMP 2—Vesicle-associ-ated membrane protein 2; NT—neurotransmitter [3,10–21].
Figure 1. Schematic representation of the direct and indirect influence of amyloid-beta oligomers(AβO), hyperphosphorylated tau (hTau), and neurofibrillary tangles (NFT) on synaptic componentsin the context of Alzheimer’s disease (AD). The figure represents an example of the influence ofprotein aggregates and biomarkers on synaptic plasticity at functional and molecular levels inneurodegenerative diseases, which affects the cognitive functions of the brain. α-amino-3-hydroxy-5-methyl-4-isoxazole propionic acid receptor (AMPAR) and N-methyl D-aspartate Receptors (NMDAR)are glutamate receptors present on the postsynaptic membrane. GABAAR—γ-aminobutyric acidtype-B receptors; APP—amyloid-beta precursor protein; Ca2+—calcium ion; ROS—reactive oxygenspecies; ATP—adenosine triphosphate; cyt c—cytochrome c; VAMP 2—Vesicle-associated membraneprotein 2; NT—neurotransmitter [3,10–21].

Int. J. Mol. Sci. 2021, 22, 12470 3 of 15
AD is characterized by memory loss and cognitive impairment, which is linked tothe loss of inhibitory synapses in the brain [22]. Due to the post-mitotic character of mostneurons in the brain, the ND is irreversible. Today there is no approved cure for ND.The current treatment strategy is to implement drugs that temporarily halt the symptomsand progression of ND (see Table 1 for an overview). However, several pathways andmechanisms are emerging that may become the basis for new drugs in the future. In recentyears, accumulating evidence from various novel visualization techniques has begun toconfirm the involvement of Aβ oligomers and tau protein in the loss of inhibitory neurons’plasticity [3,5,19–21,23,24].
Table 1. The most common neurodegenerative diseases and their specific effect on inhibitory synapses (IS). The currenttreatment options and drugs mentioned here are used only to alleviate the symptoms in order to halt the progression ofthe disease.
Type Profile MajorSymptoms Impact on IS Treatment Drug Target Site Reference
Alzheimer’sdisease
MRIAβOhTauNFT
Dementiacognitive
impairment
Loss ofGABAergic
neuronsMemantine
NMDARantagonist—postsynapse
of EN
[6,7,20,22,25,26]
Parkinson’sdisease
MRIα—SynucleinLewy neuritesLewy bodies
DementiaBradykinesiaRigidity Rest
tremors
Loss ofdopaminergic
neurons
Levodopacombined with
dopamine agonists
Presynaptic nerveterminals [27–32]
MultipleSclerosis
MRIscarring of tissue
demyelinationoligoclonal bandsNeurofilaments
cognitiveimpairment
defects in visionmuscle spasms
fatigue
loss of motorneurons loss of
selectiveinhibitoryneurons
ImmunosuppressantsCytokines
Myelin sheathAxon fibers [27,33–37]
AmyotrophicLateral
SclerosisNeurofilaments
cognitiveimpairment
frontotemporaldementia muscle
spasms andatrophy
loss of inhibitorycortical
interneuronsRiluzole Baclofen
blocks NMDAR–postsynapse
inhibits glutamaterelease—pre-
synapse GABABRagonist–
postsynapse
[28–32,38–40]
Huntington’sdisease
MRImHTT proteinNeurofilament
light protein
cognitiveimpairment
dementia chorealoss of GABAAR Tetrabenazine
Antipsychoticsinhibits VMAT-2—
presynapse [41–45]
Abbreviations: EN—excitatory neurons; IN—inhibitory neurons; MRI—Magnetic Resonance Imaging; NFT—Neurofibrillary tangles,hTau—hyperphosphorylated tau; GABA—Gamma Amino Butyric Acid; NMDAR—N-methyl D-aspartate Receptors; GABAAR—γ-aminobutyric acid type-A receptors; GABABR—γ-aminobutyric acid type-B receptors; mHTT—mutant Huntington’s protein; VMAT—vesicularmonoamine transporter.
Visualization methods have evolved tremendously in recent years. What was oncethe so-called resolution limit dogma, stating that both physical parameters of the lensesand the wavelength of the light or electron beam impose a strict limit to the resolutionof any microscope [46], has been overcome several times independently by the creativ-ity of a number of inventors and scientists. Several super-resolution (SR) microscopictechniques have become available, each offering advantages and disadvantages. Electronmicroscopy, the high-resolution visualization method available since the 1930s, has alsorecently evolved tremendously, with the ability to localize molecules in a way that can bequantified, and with cryo and 3D methods, and combinations of those, readily availableto the scientific community. This review targets the researchers trying to understand themolecular interactions at nanoscale resolution with a special interest in learning the latestinformation on the visualization methods. We give a brief explanation of modern ap-proaches, discuss their advantages and disadvantages, and give an outlook into the futuresteps necessary to elucidate the mechanism of changes in inhibitory synapse plasticity dueto NDs and to facilitate future drug discovery. However, this review is methodologically

Int. J. Mol. Sci. 2021, 22, 12470 4 of 15
limited to modern visualization methods and does not include molecular biology andelectrophysiological approaches. Moreover, we focus on research on inhibitory synapses inthe period between 2016 and 2021.
2. Discovering Details of Synapses with Electron Microscopy
Although electron microscopy provides the oldest high-resolution visualization methoddescribed here, it is not outdated. Recent developments enable localizing and quantifyingproteins, visualizing structures in 3D at nanometer resolution, or even determining thestructure of proteins at near-atomic resolution. Conventional transmission electron mi-croscopy, for which tissue is fixed using aldehydes, embedded in resin, thin sectioned, andvisualized under an electron beam, is the oldest available method that achieves sufficientoptical resolution for visualizing synapses (reviewed in [47]). At least two cell processes(one presynaptic, at least one postsynaptic) are in contact at the chemical synaptic site. Thesynapses are characterized by an accumulation of vesicles that contain a neurotransmitterwithin the presynaptic terminal and a defined synaptic cleft between the pre and post-synaptic membrane, which exhibits an electron-dense area, termed postsynaptic density(Figure 2A).
Int. J. Mol. Sci. 2021, 22, 12470 4 of 15
electrophysiological approaches. Moreover, we focus on research on inhibitory synapses in the period between 2016 and 2021.
2. Discovering Details of Synapses with Electron Microscopy Although electron microscopy provides the oldest high-resolution visualization
method described here, it is not outdated. Recent developments enable localizing and quantifying proteins, visualizing structures in 3D at nanometer resolution, or even deter-mining the structure of proteins at near-atomic resolution. Conventional transmission electron microscopy, for which tissue is fixed using aldehydes, embedded in resin, thin sectioned, and visualized under an electron beam, is the oldest available method that achieves sufficient optical resolution for visualizing synapses (reviewed in [47]). At least two cell processes (one presynaptic, at least one postsynaptic) are in contact at the chemi-cal synaptic site. The synapses are characterized by an accumulation of vesicles that con-tain a neurotransmitter within the presynaptic terminal and a defined synaptic cleft be-tween the pre and postsynaptic membrane, which exhibits an electron-dense area, termed postsynaptic density (Figure 2A).
Figure 2. Conventional electron microscopy allows visualizing synapses and analytical electron microscopy allows visu-alizing iron-loaded ferritin. (A): Conventional electron micrograph of a synapse in a human cortex sample. Synaptic vesi-cles (SV), postsynaptic density (PD). (B,C): Conventional electron micrograph (B), and corresponding iron L-map (C) from a sample of the human globus pallidus. The bright spots in (C) correspond to ferritin particles within an oligodendrocyte (O). AX—axon; MS—myelin sheath.
Conventional transmission electron microscopy allows the counting of profiles of synapses on the sections, and this was recently used to show that potassium 2-(l-hydrox-ypentyl)-benzoate has a protective effect on synapse numbers in APP/PS1 mice [48]. More-over, using a dissector as a counting frame on pairs of sections [49] allows unbiased quan-tification of the numbers of structures in a certain volume without the need for 3D recon-structions (reviewed in [50]), as has been performed for synapse numbers (e.g., [51–57]), or even immunolabelled cell types [58] within the period covered by this review.
Synapses in which the postsynaptic density appears thicker on electron micrographs than the presynaptic density are called Gray Type I, and synapses with an equal thickness of pre and postsynaptic thickness, Gray Type II [59]. There are many hints that Gray Type I synapses are usually excitatory, whereas Gray Type II synapses are usually inhibitory (reviewed in [47]). However, the concept that the thickness of the postsynaptic density on thin sections in EM suffices for distinguishing between excitatory and inhibitory synapses was challenged because many exceptions have been found (reviewed in [47]). A reliable marker for inhibitory synapses is the neurotransmitter receptors that are situated along the postsynaptic membrane. Even if the morphology of a synapse does not suffice to iden-tify it as either excitatory or inhibitory, [60] there is evidence for consistent differences between GABAergic and glutamatergic synapses. Tao and co-workers [60] showed, by
Figure 2. Conventional electron microscopy allows visualizing synapses and analytical electron microscopy allowsvisualizing iron-loaded ferritin. (A): Conventional electron micrograph of a synapse in a human cortex sample. Synapticvesicles (SV), postsynaptic density (PD). (B,C): Conventional electron micrograph (B), and corresponding iron L-map(C) from a sample of the human globus pallidus. The bright spots in (C) correspond to ferritin particles within anoligodendrocyte (O). AX—axon; MS—myelin sheath.
Conventional transmission electron microscopy allows the counting of profiles of synapseson the sections, and this was recently used to show that potassium 2-(l-hydroxypentyl)-benzoate has a protective effect on synapse numbers in APP/PS1 mice [48]. Moreover,using a dissector as a counting frame on pairs of sections [49] allows unbiased quantificationof the numbers of structures in a certain volume without the need for 3D reconstructions(reviewed in [50]), as has been performed for synapse numbers (e.g., [51–57]), or evenimmunolabelled cell types [58] within the period covered by this review.
Synapses in which the postsynaptic density appears thicker on electron micrographsthan the presynaptic density are called Gray Type I, and synapses with an equal thicknessof pre and postsynaptic thickness, Gray Type II [59]. There are many hints that Gray TypeI synapses are usually excitatory, whereas Gray Type II synapses are usually inhibitory(reviewed in [47]). However, the concept that the thickness of the postsynaptic density onthin sections in EM suffices for distinguishing between excitatory and inhibitory synapseswas challenged because many exceptions have been found (reviewed in [47]). A reliablemarker for inhibitory synapses is the neurotransmitter receptors that are situated alongthe postsynaptic membrane. Even if the morphology of a synapse does not suffice toidentify it as either excitatory or inhibitory, [60] there is evidence for consistent differences

Int. J. Mol. Sci. 2021, 22, 12470 5 of 15
between GABAergic and glutamatergic synapses. Tao and co-workers [60] showed, bycorrelating fluorescence microscopy with cryo-electron tomography, that γ-aminobutyricacid type-A receptors (GABAAR) in primary cultures of the rat hippocampus are situated ata postsynaptic density consisting of thin sheets, whereas PSD-95, which is connected withexcitatory glutamatergic receptors, exists in a thicker, mesh-like structure. This confirmedthe hypothesis that different synapse types have different ultrastructural appearances.
Many neurotransmitters have either inhibitory or excitatory receptors, so if a spe-cific receptor type can be labeled at the postsynaptic membrane, then both the specificneurotransmitter released at the synaptic site and the sign of the synapse (whether it isexcitatory or inhibitory) can be made clear. Immunogold methods for transmission electronmicroscopy allow visualizing neurotransmitter receptors and at the same time identifyingsynapses. For these, either the sample or a thin section containing the sample is bathed ina specific antibody solution, and then a gold label is brought to bind close to this site byapplying a gold-coupled secondary antibody or its fragment.
If chemical fixation and dehydration at room temperature is replaced by high-pressurefreezing [61] and freeze substitution, the ultrastructure of the sample is preserved in anear-native state (e.g., [62]). Moreover, high-pressure freezing allows much more rapidfixation than chemical fixation. This has led to the development of flash-and-freezetechnology [63,64], in which optogenetics can be combined with immediate high-pressurefreezing after the tissue sample has been stimulated with light. This can give detailed 3Dinformation of synaptic vesicle trafficking in different activation states, especially whencombined with 3D methods, such as electron tomography [65–69].
SDS-digested freeze-fracture replica labeling (SDS-FRL, [70]) can be performed oneither chemically-fixed or high-pressure frozen tissue samples. It allows studying biomem-branes in combination with immunogold labeling of membrane proteins. As the antigensare exposed to the antibody, it has advantages in terms of sensitivity over pre and post-embedding immunogold techniques [71] and allows a reliable quantification [72]. Thus,this provided an elegant way of quantifying receptor numbers and was used to demon-strate that the density of metabotropic γ-aminobutyric acid type-B receptors (GABABR) arereduced in the dentate gyrus of an AD model mouse expressing mutated human amyloidprecursor protein and presenilin1 (APP/PS1) [73–75].
Immunogold methods have revealed data that are relevant to answering the question:what induces the changes in synapses during the course of AD? Using immunogoldmethods performed on thin sections, in conjunction with super-resolution microscopicmethods, Pickett et al., 2016, detected AβO accumulation at postsynaptic sites, although itwas also found in cell bodies, dendrites, and mitochondria [18].
Several recent advances in technology now allow the use of scanning electron micro-scopes for studying large volumes in 3D at an electron microscope resolution (e.g., [76];reviewed in [77]), and tilting the sections in the beam and later reconstructing the structuresfrom its projection at different tilt angles (electron tomography) enables detailed 3D infor-mation of the subcellular structures situated within a cell or tissue section (reviewed in [78]).Electron tomography of frozen, hydrated, or freeze substituted, resin-embedded sampleshas begun to allow elucidation of the molecular buildup of the cytomatrix of the activezone of the presynaptic site and of the postsynaptic site [79–82], reviewed in [83,84]. Corre-lating immunofluorescence with SEM and electron tomography with immunogold, [85]Orlando et al. showed that synaptic potentiation induces increased GABAAR clustering inprimary cultures of mouse hippocampal neurons.
Proteins can be frozen and then directly visualized in a cryo-transmission electronmicroscope, allowing their 3D structure to be determined at a rapidly improving resolution(reviewed in, [86]) from averaging the particles that share the same orientation. Thistechnique has become a major tool for structural biologists and has received a boost since itled to Jaques Dubochet, Joachim Frank, and Richard Henderson being awarded the NobelPrize in Chemistry in 2017 [87]. Cryo-EM enables the determination of the 3D structure ofproteins and has the advantages that complexes, various conformations, or interaction sites

Int. J. Mol. Sci. 2021, 22, 12470 6 of 15
with binding molecules can be determined at several nm resolutions in 3D. This will allowthe studying of the binding sites of potential drugs for neurodegenerative disorders in detail.Thus, both the GABAAR [88–91]; reviewed in [92], and the GABABR [93–96], reviewedin [97], were recently described using cryo-EM in full length in different conformations.Of note, one isoform of the GABABR is found in axons as it contains an axon-sortingsignal [98] that has recently been found to bind to secreted APP, reducing vesicle releasewhen bound [99].
3. Super-Resolution Imaging
Synapse-associated proteins essential for neuronal transmission can be revealed bymolecular and cellular neuroscience techniques. Precise roles of those proteins are depen-dent on their location, but synaptic structural components are highly compressed withinnarrow areas that cannot be resolved by conventional light microscopy due to diffractionlimits (approximately 200 nm for conventional light microscopy) [100]. New SR methodsenable the diffraction limit of light microscopy to be overcome. Here, we present recentimaging improvements due to structured illumination microscopy (SIM), stimulated emis-sion depletion microscopy (STED), and photoactivated localization microscopy (PALM) orstochastic optical reconstruction microscopy (STORM).
To achieve a super-resolved SIM image, the sample is illuminated with a series ofexcitation light patterns and the image is reconstructed out of the interference moirépatterns of the structured illumination and underlying labeled structure. This method issuitable for live-cell imaging because it uses low laser power and high frame rates. The useof typical fluorescent dyes and fluorescent proteins (up to four different colors) makes itvery convenient. However, it has a lower resolution than other SR methods [101,102].
Recently, Schürmann and colleagues [103] used SIM to study the late-onset Alzheimer’sdisease risk factor BIN1 and showed that this protein is abundant in postsynaptic com-partments, including dendritic spines. In order to image key components of the inhibitorypostsynaptic domain and presynaptic terminal, 3D SIM was used in combination withSTED. Cosby and colleagues [104] revealed that inhibitory synapses are organized intonanoscale sub-synaptic domains (SSDs) and that, in response to elevated activity, synapsegrowth is mediated by an increase in the number of postsynaptic SSDs. Notably, they foundno difference in the number of SSDs per synaptic compartment, as identified by STED andSIM, indicating that SIM provides sufficient resolution to identify inhibitory SSDs.
The STED microscope [105] works with two lasers and is basically built up as aconfocal laser scanning microscope: one regular laser is used to excite the sample andthe other one as a doughnut-shaped depletion laser. The role of the doughnut depletionlaser is to deactivate fluorophores selectively by forcing them to emit photons in a higherwavelength, thus minimizing the effective area of illumination to a smaller focal point. Themethod achieves a high resolution of <40 nm, making it the method of choice for correlativemicroscopy. Dependent on the scanning area, high frame rates can be achieved, althoughfull-frame imaging is rather slow. The method cannot be used on living cells because itslaser power is too high [106].
Yu and coauthors [107] used STED to clarify the pre and postsynaptic subcellularlocations of fragments involved in the amyloidogenic pathway in primary neurons witha focus on 42 amino acid-long amyloid-beta peptide (Aβ42) and its immediate substrateAβPP C-terminal fragment (APP-CTF).
De Rossi and colleagues [108] investigated the role of BIN1 (late-onset Alzheimer dis-ease risk factor) function in the brain using conditional knockout (cKO) models. dSTORMand immuno-EM were used to elucidate BIN1 location, predominantly at presynapticsites in glutamatergic synapses. Confocal and STED microscope analysis of presynapticmorphology in cKO mice revealed a decrease in the density of presynaptic sites and thesize of presynaptic protein clusters.
Aβ42 is a peptide, which forms neurotoxic oligomers and amyloid plaques and playsa key role in the loss of synapses in AD. STED and dSTORM in combination were used

Int. J. Mol. Sci. 2021, 22, 12470 7 of 15
to show that Aβ42 is present in small vesicles in presynaptic compartments but not inpostsynaptic compartments in the neurites of hippocampal neurons [109].
STORM exploits the photo-switchable nature of specific fluorophores for temporalseparation of fluorescent signals, which otherwise would overlap spatially. In each imagingcycle, only a fraction of fluorophores are turned on, and fluorophore positions are obtainedby fitting a PSF or Gauss distribution from a series of imaging cycles. The x/y positions areused to reconstruct a super-resolved image with a resolution <20 nm. STORM can reachmolecular-scale resolution; however, special dyes and protocols are required, and imagingtimes can exceed more than 10 min per image [110].
dSTORM was used by Nanguneri et al. [111] to obtain nanoscale images. These imageswere analyzed with especially adopted supervised learning methods to understand theheterogeneity in the organization of F-actin in dendritic spines of primary neuronal culturesfrom rodents. The results were validated using ultrastructural data obtained from platinumreplica electron microscopy [112].
Dual-color direct STORM was used to image glycine receptors (GlyRs) and GABAARsat mixed inhibitory synapses in spinal cord neurons to examine how different inhibitoryreceptors are regulated. This study revealed that SSDs are aligned in trans-synapticnanocolumns at inhibitory synapses while being differentially spatially organized at mixedinhibitory synapses [113].
A powerful combination of STORM and STED microscopy was used to show thatγ-secretase is present in both the pre and postsynaptic compartments. This enzyme isenriched very close to the synaptic cleft in the postsynaptic membrane, as well as to NMDAreceptors, demonstrating that γ-secretase is present in the postsynaptic plasma membrane.A correlation between γ-secretase activity and synapse maturation was suggested [111].
Paasila et al. [114] visualized the interactions between presynaptic terminals andmicroglia in situ, using dSTORM. The procedure they described opens the spectrumof molecular imaging using antibodies and SR microscopy to the analysis of routineformalin-fixed paraffin sections of the archival human brain. Especially interesting is theinvestigation of microglia-synapse interactions in dementia [115].
A newly developed combination of STED and STORM (MINFLUX, Abberior, companyfounded by Stefan Hell, https://abberior-instruments.com/knowledge/publications/,accessed on 17 November 2021) combines single-molecule activation with imaging usinga super-fast STED-microscope to triangulate the exact position of the fluorophore. Theseresults are in very high resolution (2 nm) and the imaging speed is faster compared withSTORM [114,116].
PALM works on a similar principle as STORM, but unlike STORM, which is usedfor fixed cells, PALM is used to image living, transfected cells. Particle tracking can beperformed on this device as well (sptPALM) [117].
SEQUIN (Synaptic Evaluation and Quantification by Imaging Nanostructure) is a newmethod that combines special tissue processing with Airyscan image scanning microscopyand special automated software. First, the tissue is immunolabeled with fluorescentantibodies for pre and postsynaptic sites, then it is cleared and finally put under themicroscope. Automated software is used for image processing and functional synapseidentification by matching closely apposed pre and postsynaptic markers. The resolutionis 140 nm, and 97% of synapses are identified. In a study of a murine model of AD bySauerbeck et al. [118], synaptopathic alterations were revealed in the vicinity of amyloidplaques. Sequin revealed a proximity-dependent loss of synapses in such regions [118].
SR methods are an option when higher resolution is needed than can be obtainedusing confocal microscopy. Although EM provides the highest resolution and immunogoldfor EM has the advantage that unlabeled structures are visible in addition to gold-labeledones, there are limitations in labeling density, as well as in the number of proteins that canbe labeled and imaged simultaneously. Immuno-gold particles are distinguished from eachother by their size, and there has to be a noticeable size difference in gold particles used tolabel different proteins of interest. Other limitations are that living cells or tissues cannot

Int. J. Mol. Sci. 2021, 22, 12470 8 of 15
be imaged with conventional EM and that 3D-EM methods are time-consuming. The highresolution provided by EM may not be necessary to answer a particular question.
How do we choose a particular super-resolution method? A compromise must bemade between resolution, speed, and the number of available color channels. For example,if living cells are imaged, a method with low laser power is required. If there is no needfor a resolution higher than 60 nm and there are more than two proteins to visualize, SIMwould be the best choice. Otherwise, if the aim is to visualize only two proteins with veryhigh resolution, and cells can be fixed, the method of choice would be STED (see Table 2and Figure 3).
Table 2. Comparison of technical performances of most commonly used super-resolution methods.
SIM STED PALM/STORM
Resolution x/y = 60–140 nmz = 120–250 nm
x/y = 2–40 nmz > 4300 nm
MINFLUX has 2 nm resolution;others have resolution of 20–80 nm;very much dependent on the device
x/y = 1–40 nmz = 20–50 nm
strongly dependent on chemicalmethod of on/off switching
Live imaging 240 fr/s Lattice SIM, Zeiss 10–20 fr/s depending on area 0.2 fr/s
Laser power 1–10 W/cm2 100 MW/cm2 1–25 kW/cm2
Colours 4 Max 2 2–4
Dyes typical fluorescent dyes Atto647N, Chromeo 494 AF647, mEos2
Int. J. Mol. Sci. 2021, 22, 12470 8 of 15
that can be labeled and imaged simultaneously. Immuno-gold particles are distinguished from each other by their size, and there has to be a noticeable size difference in gold par-ticles used to label different proteins of interest. Other limitations are that living cells or tissues cannot be imaged with conventional EM and that 3D-EM methods are time-con-suming. The high resolution provided by EM may not be necessary to answer a particular question.
How do we choose a particular super-resolution method? A compromise must be made between resolution, speed, and the number of available color channels. For exam-ple, if living cells are imaged, a method with low laser power is required. If there is no need for a resolution higher than 60 nm and there are more than two proteins to visualize, SIM would be the best choice. Otherwise, if the aim is to visualize only two proteins with very high resolution, and cells can be fixed, the method of choice would be STED (see Table 2 and Figure 3).
Table 2. Comparison of technical performances of most commonly used super-resolution methods.
SIM STED PALM/STORM
Resolution x/y = 60–140 nm z = 120–250 nm
x/y = 2–40 nm z > 4300 nm
MINFLUX has 2 nm resolu-tion; others have resolution of
20–80 nm; very much de-pendent on the device
x/y = 1–40 nm z = 20–50 nm
strongly dependent on chemical method of
on/off switching
Live imaging 240 fr/s Lattice SIM, Zeiss 10–20 fr/s depending on area 0.2 fr/s Laser power 1–10 W/cm2 100 MW/cm2 1–25 kW/cm2
Colours 4 Max 2 2–4 Dyes typical fluorescent dyes Atto647N, Chromeo 494 AF647, mEos2
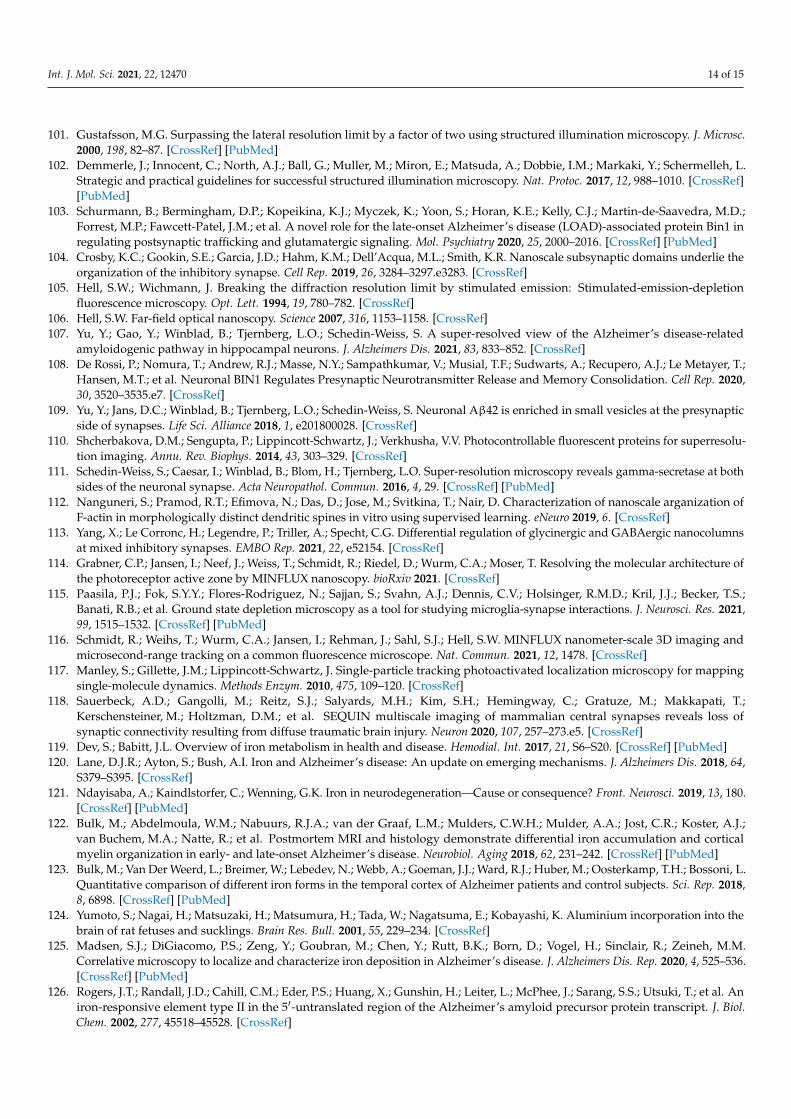
Figure 3. Guidelines for choosing appropriate visualization methods (SIM—structured illumination microscopy; PALM—photo-activated localization microscopy; STED—stimulated emission depletion microscopy; STORM—stochastic optical reconstruction microscopy; EM—electron microscopy; TEM—transmission electron microscopy).
4. How to Visualize Iron in Neurodegenerative Disorders The connection between iron and neurodegenerative diseases has been extensively
reviewed during the survey period for this review [119–121]. Iron deposits are found in the brain of people suffering from ND [122–125], overlapping with both amyloid deposits and tau neurofibrillary tangles [125]. Excessive iron load is a major contributor to AD, but
Figure 3. Guidelines for choosing appropriate visualization methods (SIM—structured illumination microscopy;PALM—photo-activated localization microscopy; STED—stimulated emission depletion microscopy; STORM—stochasticoptical reconstruction microscopy; EM—electron microscopy; TEM—transmission electron microscopy).
4. How to Visualize Iron in Neurodegenerative Disorders
The connection between iron and neurodegenerative diseases has been extensivelyreviewed during the survey period for this review [119–121]. Iron deposits are found inthe brain of people suffering from ND [122–125], overlapping with both amyloid depositsand tau neurofibrillary tangles [125]. Excessive iron load is a major contributor to AD, butit is still unclear if it is a cause [121]. The action of iron in AD is threefold. First, iron isknown to be able to upregulate APP transcription and aggregation [126,127]. Because APP

Int. J. Mol. Sci. 2021, 22, 12470 9 of 15
has been shown to increase iron export from neurons [128], there is potentially a viciouscircle of ever-increasing APP and iron accumulation. Second, the presence of Ab oligomershas been shown to reduce ferritin iron chemically [129], increasing the amount of iron in aferrous form that can cause radical production in the cell and thus damage the cell and itscompartments (e.g., [130]). Third, recent findings indicate ferroptosis—a necrotic processinvolving iron and lipid oxidation—is responsible for the neuron loss that occurs duringAlzheimer’s disease [131].
Visualization methods of iron accumulation exist both at low and high resolution. Atlow resolution, Magnetic Resonance Imaging (MRI) allows not only to visualize plaques [26]but also iron mapping [26,122,132,133]. At electron microscope resolutions, analytical electronmicroscopy allows localizing chemical elements within the samples.(Figure 2B,C; [125,134]).Similarly, X-ray spectromicroscopy can show the chemical elements and their oxidationstate within the sample [129].
5. Discussion and Conclusions
Microscopy is an extremely rapidly advancing field, and, as we have shown, several ofthe newly available techniques have already been applied for studying synaptic plasticityin Alzheimer’s disease. In the past, microscopists were limited by two perceived physicallimits in microscopy: first, the diffraction limit [46], which stated that the wavelength ofthe light or electron beam, along with physical parameters of the lenses, sets a limit tothe resolution of any microscopes. The resolution of conventional light microscopes islimited to approximately 200 nm. This physical limitation has been overcome with theinvention of super-resolution microscopes, which work around it in several different waysand offer spatial resolutions similar to that of electron microscopes [100]. The second limitis that high spatial resolution can only be achieved at a low temporal resolution and viceversa, meaning live processes can only be visualized at a low spatial resolution, and onlydead tissue or cells can be used for high-resolution studies [15]. As we have shown here,this second limit still requires some compromise in terms of spatial resolution if the hightemporal resolution is required and vice versa (Figure 3) but is also becoming resolvedwith the availability of super-resolution microscopes for live cells (Figure 3).
The visualization method of choice depends on the specific questions to answer. AsFigure 3 and Table 2 show, there are a wealth of options. If the tissue or cells are dead (fixedand embedded) and ultrastructural features of the compartments are important, EM willbe the method of choice, and if proteins need to be labeled, super-resolution methods, suchas STORM or STED, can be applied as an alternative to immunogold methods for EM.
Furthermore, iron, which plays a role in neurodegenerative disorders (reviewedin [119,121,135]), can be directly visualized using analytical microscopy (Figure 2B,C). Lastbut not least, optogenetics can be combined with modern visualization methods, such assuper-resolution microscopy or high-pressure freezing and EM [63,64]. This will enabledissecting major steps in the etiology of neurodegenerative disorders.
In summary, microscopy has recently advanced tremendously, and major improve-ments can be expected in the research of neurodegenerative disorders if new visualizationmethods are used.
6. Materials and Methods
For EM iron visualization, tissue was taken from deceased humans from a routineautopsy. After the pathologist had released the tissue, it was embedded in resin, thinsectioned, contrasted using lead citrate and platinum blue, and visualized using a TecnaiG2 transmission electron microscope operated at 200 kV. The iron L elemental map wasmade with a Gatan Quantum GIF energy filter, using the settings suggested by Gatan. Allthe figures were created with BioRender.com.

Int. J. Mol. Sci. 2021, 22, 12470 10 of 15
Author Contributions: Conceptualization, G.L. and C.M.; writing—original draft preparation,S.R., S.S. and G.L.; writing—review and editing, S.R., S.S., G.L. and C.M.; visualization, S.R., S.S.and G.L.; funding acquisition, G.L. All authors have read and agreed to the published version ofthe manuscript.
Funding: Research and Open Access Funding by the Austrian Science Fund (FWF): grant number P 29370.
Institutional Review Board Statement: The study was conducted according to the guidelines of theDeclaration of Helsinki and approved by the Ethics Committee of the Medical University of Graz:vote 28-549 ex 15_16 from 10 November 2016.
Informed Consent Statement: Not applicable.
Acknowledgments: We thank Elisabeth Bock for sample preparation and Peter Simmons (NewcastleUniversity, Newcastle, UK) for English corrections.
Conflicts of Interest: The authors declare no conflict of interest.
References1. Batool, S.; Raza, H.; Zaidi, J.; Riaz, S.; Hasan, S.; Syed, N.I. Synapse formation: From cellular and molecular mechanisms to
neurodevelopmental and neurodegenerative disorders. J. Neurophysiol. 2019, 121, 1381–1397. [CrossRef] [PubMed]2. Terry, R.D.; Masliah, E.; Salmon, D.P.; Butters, N.; DeTeresa, R.; Hill, R.; Hansen, L.A.; Katzman, R. Physical basis of cognitive
alterations in Alzheimer’s disease: Synapse loss is the major correlate of cognitive impairment. Ann. Neurol. 1991, 30, 572–580.[CrossRef] [PubMed]
3. Chakroborty, S.; Hill, E.S.; Christian, D.T.; Helfrich, R.; Riley, S.; Schneider, C.; Kapecki, N.; Mustaly-Kalimi, S.; Seiler, F.A.;Peterson, D.A.; et al. Reduced presynaptic vesicle stores mediate cellular and network plasticity defects in an early-stage mousemodel of Alzheimer’s disease. Mol. Neurodegener. 2019, 14, 7. [CrossRef] [PubMed]
4. Jackson, J.; Jambrina, E.; Li, J.; Marston, H.; Menzies, F.; Phillips, K.; Gilmour, G. Targeting the synapse in Alzheimer’s disease.Front. Neurosci. 2019, 13, 735. [CrossRef]
5. Mele, M.; Leal, G.; Duarte, C.B. Role of GABAAR trafficking in the plasticity of inhibitory synapses. J. Neurochem. 2016, 139,997–1018. [CrossRef]
6. Jack, C.R.; Bennett, D.A.; Blennow, K.; Carrillo, M.C.; Dunn, B.; Haeberlein, S.B.; Holtzman, D.M.; Jagust, W.; Jessen, F.;Karlawish, J.; et al. NIA-AA research framework: Toward a biological definition of Alzheimer’s disease. Alzheimers Dement. 2018,14, 535–562. [CrossRef]
7. Scheltens, P.; Blennow, K.; Breteler, M.M.B.; de Strooper, B.; Frisoni, G.B.; Salloway, S.; Van der Flier, W.M. Alzheimer’s disease.Lancet 2016, 388, 505–517. [CrossRef]
8. Budak, M.; Zochowski, M. Synaptic failure differentially affects pattern formation in heterogenous networks. Front. NeuralCircuits 2019, 13, 31. [CrossRef]
9. Shimojo, M.; Takuwa, H.; Takado, Y.; Tokunaga, M.; Tsukamoto, S.; Minatohara, K.; Ono, M.; Seki, C.; Maeda, J.;Urushihata, T.; et al. Selective disruption of inhibitory synapses leading to neuronal hyperexcitability at an early stageof tau pathogenesis in a mouse model. J. Neurosci. 2020, 40, 3491–3501. [CrossRef]
10. Amorim, J.A.; Canas, P.M.; Tomé, A.R.; Rolo, A.P.; Agostinho, P.; Palmeira, C.M.; Cunha, R.A. Mitochondria in excitatory andinhibitory synapses have similar susceptibility to amyloid-β peptides modeling alzheimer’s disease. J. Alzheimers Dis. 2017, 60,525–536. [CrossRef]
11. Bae, J.R.; Kim, S.H. Synapses in neurodegenerative diseases. BMB Rep. 2017, 50, 237–246. [CrossRef] [PubMed]12. Chakravorty, A.; Jetto, C.T.; Manjithaya, R. Dysfunctional mitochondria and mitophagy as drivers of Alzheimer’s disease
pathogenesis. Front. Aging Neurosci. 2019, 11, 311. [CrossRef] [PubMed]13. Groeneweg, F.L.; Trattnig, C.; Kuhse, J.; Nawrotzki, R.A.; Kirsch, J. Gephyrin: A key regulatory protein of inhibitory synapses and
beyond. Histochem. Cell Biol. 2018, 150, 489–508. [CrossRef] [PubMed]14. Kulijewicz-Nawrot, M.; Syková, E.; Chvátal, A.; Verkhratsky, A.; Rodríguez, J.J. Astrocytes and glutamate homoeostasis in
Alzheimer’s disease: A decrease in glutamine synthetase, but not in glutamate transporter-1, in the prefrontal cortex. ASN Neuro2013, 5, 273–282. [CrossRef] [PubMed]
15. Li, Y.; Zhu, K.; Li, N.; Wang, X.; Xiao, X.; Li, L.; Li, L.; He, Y.; Zhang, J.; Wo, J.; et al. Reversible GABAergic dysfunction involvedin hippocampal hyperactivity predicts early-stage Alzheimer disease in a mouse model. Alzheimers Res. Ther. 2021, 13, 114.[CrossRef]
16. Limon, A.; Reyes-Ruiz, J.M.; Miledi, R. Loss of functional GABA A receptors in the Alzheimer diseased brain. Proc. Natl. Acad.Sci. USA 2012, 109, 10071–10076. [CrossRef] [PubMed]
17. Moreno, H.; Yu, E.; Pigino, G.; Hernandez, A.I.; Kim, N.; Moreira, J.E.; Sugimori, M.; Llinás, R.R. Synaptic transmission block bypresynaptic injection of oligomeric amyloid beta. Proc. Natl. Acad. Sci. USA 2009, 106, 5901–5906. [CrossRef]
18. Pickett, E.K.; Koffie, R.M.; Wegmann, S.; Henstridge, C.M.; Herrmann, A.G.; Colom-Cadena, M.; Lleo, A.; Kay, K.R.; Vaught, M.;Soberman, R.; et al. Non-fibrillar oligomeric amyloid-β within synapses. J. Alzheimers Dis. 2016, 53, 787–800. [CrossRef]

Int. J. Mol. Sci. 2021, 22, 12470 11 of 15
19. Tönnies, E.; Trushina, E. Oxidative stress, synaptic dysfunction, and Alzheimer’s disease. J. Alzheimers Dis. 2017, 57, 1105–1121.[CrossRef]
20. Xu, Y.; Zhao, M.; Han, Y.; Zhang, H. GABAergic inhibitory interneuron deficits in Alzheimer’s disease: Implications for treatment.Front. Neurosci. 2020, 14, 660. [CrossRef]
21. Zhang, W.; Xiong, B.R.; Zhang, L.Q.; Huang, X.; Yuan, X.; Tian, Y.K.; Tian, X.B. The role of the GABAergic system in diseases ofthe central nervous system. Neuroscience 2021, 470, 88–99. [CrossRef] [PubMed]
22. Kurucu, H.; Colom-Cadena, M.; Davies, C.; Wilkins, L.; King, D.; Rose, J.; Tzioras, M.; Tulloch, J.H.; Smith, C.; Spires-Jones, T.L.Inhibitory synapse loss and accumulation of amyloid beta in inhibitory presynaptic terminals in Alzheimer’s disease. Eur. J.Neurol. 2021. [CrossRef] [PubMed]
23. Pickett, E.K.; Herrmann, A.G.; McQueen, J.; Abt, K.; Dando, O.; Tulloch, J.; Jain, P.; Dunnett, S.; Sohrabi, S.; Fjeldstad, M.P.; et al.Amyloid beta and tau cooperate to cause reversible behavioral and transcriptional deficits in a model of Alzheimer’s disease. CellRep. 2019, 29, 3592–3604.e5. [CrossRef] [PubMed]
24. Willén, K.; Sroka, A.; Takahashi, R.H.; Gouras, G.K. Heterogeneous association of Alzheimer’s disease-linked amyloid-β andamyloid-β protein precursor with synapses. J. Alzheimers Dis. 2017, 60, 511–524. [CrossRef]
25. Folch, J.; Busquets, O.; Ettcheto, M.; Sánchez-López, E.; Castro-Torres, R.D.; Verdaguer, E.; Garcia, M.L.; Olloquequi, J.;Casadesús, G.; Beas-Zarate, C.; et al. Memantine for the treatment of dementia: A review on its current and future appli-cations. J. Alzheimers Dis. 2018, 62, 1223–1240. [CrossRef]
26. Gong, N.J.; Dibb, R.; Bulk, M.; van der Weerd, L.; Liu, C. Imaging beta amyloid aggregation and iron accumulation in Alzheimer’sdisease using quantitative susceptibility mapping MRI. NeuroImage 2019, 191, 176–185. [CrossRef]
27. Zoupi, L.; Booker, S.A.; Eigel, D.; Werner, C.; Kind, P.C.; Spires-Jones, T.L.; Newland, B.; Williams, A.C. Selective vulnerability ofinhibitory networks in multiple sclerosis. Acta Neuropathol. 2021, 141, 415–429. [CrossRef]
28. Bos, M.A.J.V.d.; Higashihara, M.; Geevasinga, N.; Menon, P.; Kiernan, M.C.; Vucic, S. Imbalance of cortical facilitatory andinhibitory circuits underlies hyperexcitability in ALS. Neurology 2018, 91, e1669–e1676. [CrossRef]
29. Diana, A.; Pillai, R.; Bongioanni, P.; O’Keeffe, A.G.; Miller, R.G.; Moore, D.H. Gamma aminobutyric acid (GABA) modulators foramyotrophic lateral sclerosis/motor neuron disease. Cochrane Database Syst. Rev. 2017, 1, CD006049. [CrossRef]
30. Van Es, M.A.; Hardiman, O.; Chio, A.; Al-Chalabi, A.; Pasterkamp, R.J.; Veldink, J.H.; van den Berg, L.H. Amyotrophic lateralsclerosis. Lancet 2017, 390, 2084–2098. [CrossRef]
31. Fu, Z.; Yang, H.; Xiao, Y.; Zhao, G.; Huang, H. The gamma-aminobutyric acid type B (GABAB) receptor agonist baclofen inhibitsmorphine sensitization by decreasing the dopamine level in rat nucleus accumbens. Behav. Brain Funct. 2012, 8, 20. [CrossRef][PubMed]
32. Hardiman, O.; Al-Chalabi, A.; Chio, A.; Corr, E.M.; Logroscino, G.; Robberecht, W.; Shaw, P.J.; Simmons, Z.; van den Berg, L.H.Amyotrophic lateral sclerosis. Nat. Rev. Dis. Primers 2017, 3, 17071. [CrossRef] [PubMed]
33. Benedict, R.H.B.; Amato, M.P.; DeLuca, J.; Geurts, J.J.G. Cognitive impairment in multiple sclerosis: Clinical management, MRI,and therapeutic avenues. Lancet Neurol. 2020, 19, 860–871. [CrossRef]
34. Filippini, G.; Giovane, C.D.; Vacchi, L.; D’Amico, R.; Pietrantonj, C.D.; Beecher, D.; Salanti, G. Immunomodulators andimmunosuppressants for multiple sclerosis: A network meta-analysis. Cochrane Database Syst. Rev. 2011, 6, CD008933. [CrossRef]
35. Jasek, Ł.; Smigielski, J.; Siger, M. Late onset multiple sclerosis—Multiparametric MRI characteristics. Neurol. Neurochir. Pol. 2020,54, 265–271. [CrossRef] [PubMed]
36. Kaskow, B.J.; Baecher-Allan, C. Effector T cells in multiple sclerosis. Cold Spring Harb. Perspect. Med. 2018, 8, a029025. [CrossRef]37. Ziemssen, T.; Akgün, K.; Brück, W. Molecular biomarkers in multiple sclerosis. J. Neuroinflamm. 2019, 16, 272. [CrossRef]38. Miller, R.G.; Mitchell, J.D.; Moore, D.H. Riluzole for amyotrophic lateral sclerosis (ALS)/motor neuron disease (MND). Cochrane
Database Syst Rev. 2012, 3, CD001447. [CrossRef]39. Sugiyama, A.; Saitoh, A.; Yamada, M.; Oka, J.I.; Yamada, M. Administration of riluzole into the basolateral amygdala has an
anxiolytic-like effect and enhances recognition memory in the rat. Behav. Brain Res. 2017, 327, 98–102. [CrossRef]40. Zucchi, E.; Bonetto, V.; Sorarù, G.; Martinelli, I.; Parchi, P.; Liguori, R.; Mandrioli, J. Neurofilaments in motor neuron disorders:
Towards promising diagnostic and prognostic biomarkers. Mol. Neurodegener. 2020, 15, 58. [CrossRef]41. Garret, M.; Du, Z.; Chazalon, M.; Cho, Y.H.; Baufreton, J. Alteration of GABAergic neurotransmission in Huntington’s disease.
CNS Neurosci. Ther. 2018, 24, 292–300. [CrossRef] [PubMed]42. Hsu, Y.-T.; Chang, Y.-G.; Chern, Y. Insights into GABAAergic system alteration in Huntington’s disease. Open Biol. 2018, 8, 180165.
[CrossRef] [PubMed]43. McColgan, P.; Tabrizi, S.J. Huntington’s disease: A clinical review. Eur. J. Neurol. 2018, 25, 24–34. [CrossRef] [PubMed]44. Rosas-Arellano, A.; Tejeda-Guzmán, C.; Lorca-Ponce, E.; Palma-Tirado, L.; Mantellero, C.A.; Rojas, P.; Missirlis, F.; Castro, M.A.
Huntington’s disease leads to decrease of GABA-A tonic subunits in the D2 neostriatal pathway and their relocalization into thesynaptic cleft. Neurobiol. Dis. 2018, 110, 142–153. [CrossRef]
45. Wyant, K.J.; Ridder, A.J.; Dayalu, P. Huntington’s disease—Update on treatments. Curr. Neurol. Neurosci. Rep. 2017, 17, 33.[CrossRef]
46. Abbe, E. Beiträge zur Theorie des Mikroskops und der mikroskopischen Wahrnehmung. Arch. Für Mikrosk. Anat. 1873, 9, 413–468.[CrossRef]

Int. J. Mol. Sci. 2021, 22, 12470 12 of 15
47. Klemann, C.J.; Roubos, E.W. The gray area between synapse structure and function-Gray’s synapse types I and II revisited.Synapse 2011, 65, 1222–1230. [CrossRef]
48. Huang, L.; Zhang, Y.; Peng, Y.; Zhao, Z.; Zhou, Y.; Wang, X.; Peng, Y. Protective effect of potassium 2-(l-hydroxypentyl)-benzoateon hippocampal neurons, synapses and dystrophic axons in APP/PS1 mice. Psychopharmacology 2019, 236, 2761–2771. [CrossRef]
49. Sterio, D.C. The unbiased estimation of number and sizes of arbitrary particles using the disector. J. Microsc. 1984, 134, 127–136.[CrossRef]
50. Napper, R.M.A. Total number is important: Using the disector method in design-based stereology to understand the structure ofthe rodent brain. Front. Neuroanat. 2018, 12, 16. [CrossRef]
51. Omelchenko, N.; Roy, P.; Balcita-Pedicino, J.J.; Poloyac, S.; Sesack, S.R. Impact of prenatal nicotine on the structure of midbraindopamine regions in the rat. Brain Struct. Funct. 2016, 221, 1939–1953. [CrossRef]
52. Reichmann, F.; Painsipp, E.; Holzer, P.; Kummer, D.; Bock, E.; Leitinger, G. A novel unbiased counting method for the quantifica-tion of synapses in the mouse brain. J. Neurosci. Methods 2015, 240, 13–21. [CrossRef] [PubMed]
53. Reichmann, F.; Wegerer, V.; Jain, P.; Mayerhofer, R.; Hassan, A.M.; Frohlich, E.E.; Bock, E.; Pritz, E.; Herzog, H.; Holzer, P.; et al.Environmental enrichment induces behavioural disturbances in neuropeptide Y knockout mice. Sci. Rep. 2016, 6, 28182.[CrossRef] [PubMed]
54. Ardalan, M.; Wegener, G.; Polsinelli, B.; Madsen, T.M.; Nyengaard, J.R. Neurovascular plasticity of the hippocampus one weekafter a single dose of ketamine in genetic rat model of depression. Hippocampus 2016, 26, 1414–1423. [CrossRef] [PubMed]
55. Ardalan, M.; Wegener, G.; Rafati, A.H.; Nyengaard, J.R. S-ketamine rapidly reverses synaptic and vascular deficits of hippocampusin genetic animal model of depression. Int. J. Neuropsychopharmacol. 2017, 20, 247–256. [CrossRef]
56. Lin, J.Y.; He, Y.N.; Zhu, N.; Peng, B. Metformin attenuates increase of synaptic number in the rat spinal dorsal horn with painfuldiabetic neuropathy induced by type 2 diabetes: A stereological study. Neurochem. Res. 2018, 43, 2232–2239. [CrossRef]
57. Kim, H.W.; Oh, S.H.; Lee, S.J.; Na, J.E.; Rhyu, I.J. Differential synapse density between Purkinje cell dendritic spine and parallelfiber varicosity in the rat cerebellum among the phylogenic lobules. Appl. Microsc. 2020, 50, 6. [CrossRef]
58. Ohgomori, T.; Iinuma, K.; Yamada, J.; Jinno, S. A unique subtype of ramified microglia associated with synapses in the rathippocampus. Eur. J. Neurosci. 2021, 54, 4740–4754. [CrossRef]
59. Gray, E.G. Axo-somatic and axo-dendritic synapses of the cerebral cortex: An electron microscope study. J. Anat. 1959, 93,420–433.
60. Tao, C.L.; Liu, Y.T.; Sun, R.; Zhang, B.; Qi, L.; Shivakoti, S.; Tian, C.L.; Zhang, P.; Lau, P.M.; Zhou, Z.H.; et al. Differentiation andcharacterization of excitatory and inhibitory synapses by cryo-electron tomography and correlative microscopy. J. Neurosci. 2018,38, 1493–1510. [CrossRef]
61. Dubochet, J. High-pressure freezing for cryoelectron microscopy. Trends Cell Biol. 1995, 5, 366–368. [CrossRef]62. Sele, M.; Wernitznig, S.; Lipovsek, S.; Radulovic, S.; Haybaeck, J.; Birkl-Toeglhofer, A.M.; Wodlej, C.; Kleinegger, F.; Sygulla, S.;
Leoni, M.; et al. Optimization of ultrastructural preservation of human brain for transmission electron microscopy after longpost-mortem intervals. Acta Neuropathol. Commun. 2019, 7, 144. [CrossRef] [PubMed]
63. Watanabe, S.; Liu, Q.; Davis, M.W.; Hollopeter, G.; Thomas, N.; Jorgensen, N.B.; Jorgensen, E.M. Ultrafast endocytosis atCaenorhabditis elegans neuromuscular junctions. eLife 2013, 2, e00723. [CrossRef] [PubMed]
64. Watanabe, S.; Rost, B.R.; Camacho-Perez, M.; Davis, M.W.; Sohl-Kielczynski, B.; Rosenmund, C.; Jorgensen, E.M. Ultrafastendocytosis at mouse hippocampal synapses. Nature 2013, 504, 242–247. [CrossRef] [PubMed]
65. Borges-Merjane, C.; Kim, O.; Jonas, P. Functional electron microscopy, “flash and freeze”, of identified cortical synapses in acutebrain slices. Neuron 2020, 108, 1011. [CrossRef] [PubMed]
66. Chang, S.; Trimbuch, T.; Rosenmund, C. Synaptotagmin-1 drives synchronous Ca2+-triggered fusion by C2B-domain-mediatedsynaptic-vesicle-membrane attachment. Nat. Neurosci. 2018, 21, 33–40. [CrossRef]
67. Imig, C.; Cooper, B.H. 3D analysis of synaptic ultrastructure in arganotypic hippocampal slice culture by high-pressure freezingand electron tomography. Methods Mol. Biol. 2017, 1538, 215–231. [CrossRef] [PubMed]
68. Imig, C.; Lopez-Murcia, F.J.; Maus, L.; Garcia-Plaza, I.H.; Mortensen, L.S.; Schwark, M.; Schwarze, V.; Angibaud, J.; Nagerl, U.V.;Taschenberger, H.; et al. Ultrastructural imaging of activity-dependent synaptic membrane-trafficking events in cultured brainslices. Neuron 2020, 108, 843–860.e8. [CrossRef]
69. Maus, L.; Lee, C.; Altas, B.; Sertel, S.M.; Weyand, K.; Rizzoli, S.O.; Rhee, J.; Brose, N.; Imig, C.; Cooper, B.H. Ultrastructuralcorrelates of presynaptic functional heterogeneity in hippocampal synapses. Cell Rep. 2020, 30, 3632–3643.e8. [CrossRef]
70. Fujimoto, K. Freeze-fracture replica electron microscopy combined with SDS digestion for cytochemical labeling of integralmembrane proteins. Application to the immunogold labeling of intercellular junctional complexes. J. Cell Sci. 1995, 108, 3443–3449.[CrossRef]
71. Masugi-Tokita, M.; Shigemoto, R. High-resolution quantitative visualization of glutamate and GABA receptors at central synapses.Curr. Opin. Neurobiol. 2007, 17, 387–393. [CrossRef]
72. Mobius, W.; Cooper, B.; Kaufmann, W.A.; Imig, C.; Ruhwedel, T.; Snaidero, N.; Saab, A.S.; Varoqueaux, F. Electron microscopy ofthe mouse central nervous system. Methods Cell Biol. 2010, 96, 475–512. [CrossRef]

Int. J. Mol. Sci. 2021, 22, 12470 13 of 15
73. Martin-Belmonte, A.; Aguado, C.; Alfaro-Ruiz, R.; Itakura, M.; Moreno-Martinez, A.E.; de la Ossa, L.; Molnar, E.; Fukazawa,Y.; Lujan, R. Age-dependent shift of AMPA receptors from synapses to intracellular compartments in Alzheimer’s disease:Immunocytochemical analysis of the CA1 hippocampal region in APP/PS1 transgenic mouse model. Front. Aging Neurosci. 2020,12, 577996. [CrossRef] [PubMed]
74. Martin-Belmonte, A.; Aguado, C.; Alfaro-Ruiz, R.; Moreno-Martinez, A.E.; de la Ossa, L.; Martinez-Hernandez, J.; Buisson, A.;Fruh, S.; Bettler, B.; Shigemoto, R.; et al. Reduction in the neuronal surface of post and presynaptic GABAB receptors in thehippocampus in a mouse model of Alzheimer.s disease. Brain Pathol. 2020, 30, 554–575. [CrossRef] [PubMed]
75. Martin-Belmonte, A.; Aguado, C.; Alfaro-Ruiz, R.; Moreno-Martinez, A.E.; de la Ossa, L.; Martinez-Hernandez, J.; Buisson, A.;Shigemoto, R.; Fukazawa, Y.; Lujan, R. Density of GABAB receptors is reduced in granule cells of the hippocampus in a mousemodel of Alzheimer’s disease. Int. J. Mol. Sci. 2020, 21, 2459. [CrossRef] [PubMed]
76. Dittmayer, C.; Volcker, E.; Wacker, I.; Schroder, R.R.; Bachmann, S. Modern field emission scanning electron microscopy providesnew perspectives for imaging kidney ultrastructure. Kidney Int. 2018, 94, 625–631. [CrossRef]
77. Titze, B.; Genoud, C. Volume scanning electron microscopy for imaging biological ultrastructure. Biol. Cell 2016, 108, 307–323.[CrossRef] [PubMed]
78. Hylton, R.K.; Swulius, M.T. Challenges and triumphs in cryo-electron tomography. iScience 2021, 24, 102959. [CrossRef] [PubMed]79. Fernandez-Busnadiego, R. Cryo-Electron Tomography of the Mammalian Synapse. Methods Mol. Biol. 2018, 1847, 217–224.
[CrossRef]80. Gipson, P.; Fukuda, Y.; Danev, R.; Lai, Y.; Chen, D.H.; Baumeister, W.; Brunger, A.T. Morphologies of synaptic protein membrane
fusion interfaces. Proc. Natl. Acad. Sci. USA 2017, 114, 9110–9115. [CrossRef]81. Lucic, V.; Fernandez-Busnadiego, R.; Laugks, U.; Baumeister, W. Hierarchical detection and analysis of macromolecular complexes
in cryo-electron tomograms using Pyto software. J. Struct. Biol. 2016, 196, 503–514. [CrossRef]82. Schrod, N.; Vanhecke, D.; Laugks, U.; Stein, V.; Fukuda, Y.; Schaffer, M.; Baumeister, W.; Lucic, V. Pleomorphic linkers as
ubiquitous structural organizers of vesicles in axons. PLoS ONE 2018, 13, e0197886. [CrossRef] [PubMed]83. Liu, Y.T.; Tao, C.L.; Lau, P.M.; Zhou, Z.H.; Bi, G.Q. Postsynaptic protein organization revealed by electron microscopy. Curr. Opin.
Struct. Biol. 2019, 54, 152–160. [CrossRef]84. Zuber, B.; Lucic, V. Molecular architecture of the presynaptic terminal. Curr. Opin. Struct. Biol. 2019, 54, 129–138. [CrossRef]85. Orlando, M.; Ravasenga, T.; Petrini, E.M.; Falqui, A.; Marotta, R.; Barberis, A. Correlating Fluorescence and High-Resolution
Scanning Electron Microscopy (HRSEM) for the study of GABAA receptor clustering induced by inhibitory synaptic plasticity.Sci. Rep. 2017, 7, 13768. [CrossRef] [PubMed]
86. Yip, K.M.; Fischer, N.; Paknia, E.; Chari, A.; Stark, H. Atomic-resolution protein structure determination by cryo-EM. Nature 2020,587, 157–161. [CrossRef] [PubMed]
87. Shen, P.S. The 2017 Nobel Prize in Chemistry: Cryo-EM comes of age. Anal. Bioanal. Chem. 2018, 410, 2053–2057. [CrossRef]88. Liu, S.; Xu, L.; Guan, F.; Liu, Y.T.; Cui, Y.; Zhang, Q.; Zheng, X.; Bi, G.Q.; Zhou, Z.H.; Zhang, X.; et al. Cryo-EM structure of the
human alpha5beta3 GABAA receptor. Cell Res. 2018, 28, 958–961. [CrossRef]89. Phulera, S.; Zhu, H.; Yu, J.; Claxton, D.P.; Yoder, N.; Yoshioka, C.; Gouaux, E. Cryo-EM structure of the benzodiazepine-sensitive
alpha1beta1gamma2S tri-heteromeric GABAA receptor in complex with GABA. eLife 2018, 7, e39383. [CrossRef]90. Zhu, S.; Noviello, C.M.; Teng, J.; Walsh, R.M., Jr.; Kim, J.J.; Hibbs, R.E. Structure of a human synaptic GABAA receptor. Nature
2018, 559, 67–72. [CrossRef]91. Kim, J.J.; Gharpure, A.; Teng, J.; Zhuang, Y.; Howard, R.J.; Zhu, S.; Noviello, C.M.; Walsh, R.M., Jr.; Lindahl, E.; Hibbs, R.E. Shared
structural mechanisms of general anaesthetics and benzodiazepines. Nature 2020, 585, 303–308. [CrossRef] [PubMed]92. Kim, J.J.; Hibbs, R.E. Direct structural insights into GABAA receptor pharmacology. Trends Biochem. Sci. 2021, 46, 502–517.
[CrossRef] [PubMed]93. Mao, C.; Shen, C.; Li, C.; Shen, D.D.; Xu, C.; Zhang, S.; Zhou, R.; Shen, Q.; Chen, L.N.; Jiang, Z.; et al. Cryo-EM structures of
inactive and active GABAB receptor. Cell Res. 2020, 30, 564–573. [CrossRef] [PubMed]94. Park, J.; Fu, Z.; Frangaj, A.; Liu, J.; Mosyak, L.; Shen, T.; Slavkovich, V.N.; Ray, K.M.; Taura, J.; Cao, B.; et al. Structure of human
GABAB receptor in an inactive state. Nature 2020, 584, 304–309. [CrossRef] [PubMed]95. Shaye, H.; Ishchenko, A.; Lam, J.H.; Han, G.W.; Xue, L.; Rondard, P.; Pin, J.P.; Katritch, V.; Gati, C.; Cherezov, V. Structural basis of
the activation of a metabotropic GABA receptor. Nature 2020, 584, 298–303. [CrossRef] [PubMed]96. Papasergi-Scott, M.M.; Robertson, M.J.; Seven, A.B.; Panova, O.; Mathiesen, J.M.; Skiniotis, G. Structures of metabotropic GABAB
receptor. Nature 2020, 584, 310–314. [CrossRef]97. Evenseth, L.S.M.; Gabrielsen, M.; Sylte, I. The GABAB receptor-structure, ligand binding and drug development. Molecules 2020,
25, 3093. [CrossRef] [PubMed]98. Biermann, B.; Ivankova-Susankova, K.; Bradaia, A.; Abdel Aziz, S.; Besseyrias, V.; Kapfhammer, J.P.; Missler, M.; Gassmann, M.;
Bettler, B. The Sushi domains of GABAB receptors function as axonal targeting signals. J. Neurosci. 2010, 30, 1385–1394. [CrossRef]99. Rice, H.C.; de Malmazet, D.; Schreurs, A.; Frere, S.; Van Molle, I.; Volkov, A.N.; Creemers, E.; Vertkin, I.; Nys, J.;
Ranaivoson, F.M.; et al. Secreted amyloid-beta precursor protein functions as a GABABR1a ligand to modulate synaptictransmission. Science 2019, 363, 6423. [CrossRef]
100. Igarashi, M.; Nozumi, M.; Wu, L.G.; Zanacchi, F.C.; Katona, I.; Barna, L.; Xu, P.; Zhang, M.; Xue, F.; Boyden, E. New observationsin neuroscience using superresolution microscopy. J. Neurosci. 2018, 38, 9459–9467. [CrossRef]
Int. J. Mol. Sci. 2021, 22, 12470 14 of 15
101. Gustafsson, M.G. Surpassing the lateral resolution limit by a factor of two using structured illumination microscopy. J. Microsc.2000, 198, 82–87. [CrossRef] [PubMed]
102. Demmerle, J.; Innocent, C.; North, A.J.; Ball, G.; Muller, M.; Miron, E.; Matsuda, A.; Dobbie, I.M.; Markaki, Y.; Schermelleh, L.Strategic and practical guidelines for successful structured illumination microscopy. Nat. Protoc. 2017, 12, 988–1010. [CrossRef][PubMed]
103. Schurmann, B.; Bermingham, D.P.; Kopeikina, K.J.; Myczek, K.; Yoon, S.; Horan, K.E.; Kelly, C.J.; Martin-de-Saavedra, M.D.;Forrest, M.P.; Fawcett-Patel, J.M.; et al. A novel role for the late-onset Alzheimer’s disease (LOAD)-associated protein Bin1 inregulating postsynaptic trafficking and glutamatergic signaling. Mol. Psychiatry 2020, 25, 2000–2016. [CrossRef] [PubMed]
104. Crosby, K.C.; Gookin, S.E.; Garcia, J.D.; Hahm, K.M.; Dell’Acqua, M.L.; Smith, K.R. Nanoscale subsynaptic domains underlie theorganization of the inhibitory synapse. Cell Rep. 2019, 26, 3284–3297.e3283. [CrossRef]
105. Hell, S.W.; Wichmann, J. Breaking the diffraction resolution limit by stimulated emission: Stimulated-emission-depletionfluorescence microscopy. Opt. Lett. 1994, 19, 780–782. [CrossRef]
106. Hell, S.W. Far-field optical nanoscopy. Science 2007, 316, 1153–1158. [CrossRef]107. Yu, Y.; Gao, Y.; Winblad, B.; Tjernberg, L.O.; Schedin-Weiss, S. A super-resolved view of the Alzheimer’s disease-related
amyloidogenic pathway in hippocampal neurons. J. Alzheimers Dis. 2021, 83, 833–852. [CrossRef]108. De Rossi, P.; Nomura, T.; Andrew, R.J.; Masse, N.Y.; Sampathkumar, V.; Musial, T.F.; Sudwarts, A.; Recupero, A.J.; Le Metayer, T.;
Hansen, M.T.; et al. Neuronal BIN1 Regulates Presynaptic Neurotransmitter Release and Memory Consolidation. Cell Rep. 2020,30, 3520–3535.e7. [CrossRef]
109. Yu, Y.; Jans, D.C.; Winblad, B.; Tjernberg, L.O.; Schedin-Weiss, S. Neuronal Aβ42 is enriched in small vesicles at the presynapticside of synapses. Life Sci. Alliance 2018, 1, e201800028. [CrossRef]
110. Shcherbakova, D.M.; Sengupta, P.; Lippincott-Schwartz, J.; Verkhusha, V.V. Photocontrollable fluorescent proteins for superresolu-tion imaging. Annu. Rev. Biophys. 2014, 43, 303–329. [CrossRef]
111. Schedin-Weiss, S.; Caesar, I.; Winblad, B.; Blom, H.; Tjernberg, L.O. Super-resolution microscopy reveals gamma-secretase at bothsides of the neuronal synapse. Acta Neuropathol. Commun. 2016, 4, 29. [CrossRef] [PubMed]
112. Nanguneri, S.; Pramod, R.T.; Efimova, N.; Das, D.; Jose, M.; Svitkina, T.; Nair, D. Characterization of nanoscale arganization ofF-actin in morphologically distinct dendritic spines in vitro using supervised learning. eNeuro 2019, 6. [CrossRef]
113. Yang, X.; Le Corronc, H.; Legendre, P.; Triller, A.; Specht, C.G. Differential regulation of glycinergic and GABAergic nanocolumnsat mixed inhibitory synapses. EMBO Rep. 2021, 22, e52154. [CrossRef]
114. Grabner, C.P.; Jansen, I.; Neef, J.; Weiss, T.; Schmidt, R.; Riedel, D.; Wurm, C.A.; Moser, T. Resolving the molecular architecture ofthe photoreceptor active zone by MINFLUX nanoscopy. bioRxiv 2021. [CrossRef]
115. Paasila, P.J.; Fok, S.Y.Y.; Flores-Rodriguez, N.; Sajjan, S.; Svahn, A.J.; Dennis, C.V.; Holsinger, R.M.D.; Kril, J.J.; Becker, T.S.;Banati, R.B.; et al. Ground state depletion microscopy as a tool for studying microglia-synapse interactions. J. Neurosci. Res. 2021,99, 1515–1532. [CrossRef] [PubMed]
116. Schmidt, R.; Weihs, T.; Wurm, C.A.; Jansen, I.; Rehman, J.; Sahl, S.J.; Hell, S.W. MINFLUX nanometer-scale 3D imaging andmicrosecond-range tracking on a common fluorescence microscope. Nat. Commun. 2021, 12, 1478. [CrossRef]
117. Manley, S.; Gillette, J.M.; Lippincott-Schwartz, J. Single-particle tracking photoactivated localization microscopy for mappingsingle-molecule dynamics. Methods Enzym. 2010, 475, 109–120. [CrossRef]
118. Sauerbeck, A.D.; Gangolli, M.; Reitz, S.J.; Salyards, M.H.; Kim, S.H.; Hemingway, C.; Gratuze, M.; Makkapati, T.;Kerschensteiner, M.; Holtzman, D.M.; et al. SEQUIN multiscale imaging of mammalian central synapses reveals loss ofsynaptic connectivity resulting from diffuse traumatic brain injury. Neuron 2020, 107, 257–273.e5. [CrossRef]
119. Dev, S.; Babitt, J.L. Overview of iron metabolism in health and disease. Hemodial. Int. 2017, 21, S6–S20. [CrossRef] [PubMed]120. Lane, D.J.R.; Ayton, S.; Bush, A.I. Iron and Alzheimer’s disease: An update on emerging mechanisms. J. Alzheimers Dis. 2018, 64,
S379–S395. [CrossRef]121. Ndayisaba, A.; Kaindlstorfer, C.; Wenning, G.K. Iron in neurodegeneration—Cause or consequence? Front. Neurosci. 2019, 13, 180.
[CrossRef] [PubMed]122. Bulk, M.; Abdelmoula, W.M.; Nabuurs, R.J.A.; van der Graaf, L.M.; Mulders, C.W.H.; Mulder, A.A.; Jost, C.R.; Koster, A.J.;
van Buchem, M.A.; Natte, R.; et al. Postmortem MRI and histology demonstrate differential iron accumulation and corticalmyelin organization in early- and late-onset Alzheimer’s disease. Neurobiol. Aging 2018, 62, 231–242. [CrossRef] [PubMed]
123. Bulk, M.; Van Der Weerd, L.; Breimer, W.; Lebedev, N.; Webb, A.; Goeman, J.J.; Ward, R.J.; Huber, M.; Oosterkamp, T.H.; Bossoni, L.Quantitative comparison of different iron forms in the temporal cortex of Alzheimer patients and control subjects. Sci. Rep. 2018,8, 6898. [CrossRef] [PubMed]
124. Yumoto, S.; Nagai, H.; Matsuzaki, H.; Matsumura, H.; Tada, W.; Nagatsuma, E.; Kobayashi, K. Aluminium incorporation into thebrain of rat fetuses and sucklings. Brain Res. Bull. 2001, 55, 229–234. [CrossRef]
125. Madsen, S.J.; DiGiacomo, P.S.; Zeng, Y.; Goubran, M.; Chen, Y.; Rutt, B.K.; Born, D.; Vogel, H.; Sinclair, R.; Zeineh, M.M.Correlative microscopy to localize and characterize iron deposition in Alzheimer’s disease. J. Alzheimers Dis. Rep. 2020, 4, 525–536.[CrossRef] [PubMed]
126. Rogers, J.T.; Randall, J.D.; Cahill, C.M.; Eder, P.S.; Huang, X.; Gunshin, H.; Leiter, L.; McPhee, J.; Sarang, S.S.; Utsuki, T.; et al. Aniron-responsive element type II in the 5′-untranslated region of the Alzheimer’s amyloid precursor protein transcript. J. Biol.Chem. 2002, 277, 45518–45528. [CrossRef]

Int. J. Mol. Sci. 2021, 22, 12470 15 of 15
127. Boopathi, S.; Kolandaivel, P. Fe2+ binding on amyloid beta-peptide promotes aggregation. Proteins 2016, 84, 1257–1274. [CrossRef]128. Duce, J.A.; Tsatsanis, A.; Cater, M.A.; James, S.A.; Robb, E.; Wikhe, K.; Leong, S.L.; Perez, K.; Johanssen, T.; Greenough, M.A.; et al.
Iron-export ferroxidase activity of β-amyloid precursor protein is inhibited by zinc in Alzheimer’s disease. Cell 2010, 142, 857–867.[CrossRef]
129. Everett, J.; Brooks, J.; Lermyte, F.; O’Connor, P.B.; Sadler, P.J.; Dobson, J.; Collingwood, J.F.; Telling, N.D. Iron stored in ferritin ischemically reduced in the presence of aggregating Abeta(1-42). Sci Rep. 2020, 10, 10332. [CrossRef]
130. Belaidi, A.A.; Bush, A.I. Iron neurochemistry in Alzheimer’s disease and Parkinson’s disease: Targets for therapeutics. J.Neurochem. 2016, 139 (Suppl. S1), 179–197. [CrossRef]
131. Masaldan, S.; Bush, A.I.; Devos, D.; Rolland, A.S.; Moreau, C. Striking while the iron is hot: Iron metabolism and ferroptosis inneurodegeneration. Free Radic. Biol Med. 2019, 133, 221–233. [CrossRef] [PubMed]
132. Langkammer, C.; Ropele, S.; Pirpamer, L.; Fazekas, F.; Schmidt, R. MRI for iron mapping in Alzheimer’s disease. Neurodegener.Dis. 2014, 13, 189–191. [CrossRef] [PubMed]
133. Ropele, S.; Langkammer, C. Iron quantification with susceptibility. NMR Biomed. 2017, 30, e3534. [CrossRef]134. Yumoto, S.; Kakimi, S.; Ishikawa, A. Colocalization of aluminum and iron in nuclei of nerve cells in brains of patients with
Alzheimer’s disease. J. Alzheimers Dis. 2018, 65, 1267–1281. [CrossRef] [PubMed]135. Lal, A. Iron in health and disease: An update. Indian J. Pediatr. 2020, 87, 58–65. [CrossRef]
Copyright © 2022 FDOKUMEN