ADVANCED INFORMATION TECHNOLOGY (AICITSS)
339
Downloaded from : taxupindia.com main source : ICAI ADVANCED INFORMATION TECHNOLOGY (AICITSS) COURSE MATERIAL MODULE – I Board of Studies The Institute of Chartered Accountants of India, New Delhi
-
Upload
khangminh22 -
Category
Documents
-
view
0 -
download
0
Transcript of ADVANCED INFORMATION TECHNOLOGY (AICITSS)

Downloaded from : taxupindia.com
main source : ICAI
ADVANCED INFORMATION TECHNOLOGY
(AICITSS)
COURSE MATERIAL
MODULE – I
Board of Studies
The Institute of Chartered Accountants of India, New Delhi

Downloaded from : taxupindia.com
main source : ICAI
©The Institute of Chartered Accountants of India
The objective of this background material is to provide uniform reference material to the students undergoing Advanced Information Technology under AICITSS.
All attempts have been made to make the discussion simple and comprehensive. Students may note that the material has been prepared with an objective to help them in acquiring requisite knowledge and skillsin the subject and gain hands on experience.
This is also expected to serve as a source of reference book in their future education and training. In case students have any suggestions to make for further improvement of the material contained herein, they may write to Board of Studies, ICAI Bhawan, A-29, Sector 62, Noida. Queries can alsobe sent to : [email protected].
All care has been taken to provide the material in a manner useful to the students. However the material has not been specifically discussed by the Council of the Institute or any of its Committees and the views expressed herein may not be taken to necessarily represent the views of the Council orany of its Committees.
All rights reserved.No part of this publication may be reproduced, stored in aretrieval systemor transmitted, in any forms or by any means, electronic, mechanical, photocopying, recording orotherwise, without prior permission, in writing, from the Institute.
Revised Edition : August, 2017
ISBN : 978-81- 8441-
Published by The Publication Department on behalf of The Institute of Chartered Accountants of India, ICAI Bhawan, Post Box No. 7100, Indraprastha Marg, New Delhi- 110 002, India.

Downloaded from : taxupindia.com
main source : ICAI
PREFACE The impact of Information Technology (IT) on several aspects of accounting profession and practice has been pronounced over the last two decades. The revolutionary developments of various IT tools and techniques have a far reaching impact on the organizations.
In today’s business world, accounting professionals have to interact with computer-based Information systems on a regular basis. As primary users of information systems in organizations, accountants need to participate in the design, development and operations of IT systems. Accountants today need to measure and evaluate the performance of information systems. Internal auditors must assess the quality of information systems for operations, compliance and financial reporting while external auditors must assess for financial reporting and both must also evaluate the accuracy of information input and output.
There are many stakeholders relying on the data provided by ERP systems. While these systems provide a high level of automation, they also have attached risks pertaining to data and processes within the Environment. This course will provide a gateway to the students in their journey to understand auditing in an ERP environment.
The Institute of Chartered Accountants of India has been making earnest efforts to develop a contemporary body of knowledge and skill set for its studentsby updating its curriculum from time to time.
In order to impart synchronized and uniform theoretical and practical knowledge to all the aspiring CA students in the IT area,the Institute has established its own IT Lab sequipped withcomputers of latest configuration,software and other infrastructural facilities at almost all its branches and regional offices.
Auditing in an ERP environment, Advanced features of MS-Access and MS-Excel, MS-Excel as Audit tool, and ERP using Tally arethe main components which would be covered during the training programme.
This uniform course material has been prepared by Board of Studies of the ICAI in accordance with the course contents covered in the specially designed curriculum to disseminate qualityeducation to its students and the same has been printed by The Board of Studies for distribution to CAstudents across India and abroad.
We hope that this coursematerial would help the students in building their IT skills which is amust for all, in the current scenario.

Downloaded from : taxupindia.com
main source : ICAI

Downloaded from : taxupindia.com
main source : ICAI
CONTENTS
UNIT-1 : AUDITING IN AN ERP ENVIRONMENT
Chapter - 1 Auditing in ERP Environment 3-15
Chapter - 2 General Information Technology Controls 16-44
Chapter - 3 Automated Application Controls 45-68
Chapter - 4 Segregation of Duties and Sensitive Access 69-81
Chapter - 5 System Generated Reports 82-96
Chapter - 6 New System and Data Migration Review 97-108
Chapter - 7 Non Standard Journal Entries 109-120
UNIT-2 : DATABASE APPLICATION USING MS - ACCESS
Chapter - 1 Advanced SQL Queries 123-188
Chapter - 2 Designing Forms and Reports 189-243
Chapter - 3 Building Criteria Expressions 244-279
Chapter - 4 Macros and Switchboards 280-333

Downloaded from : taxupindia.com
main source : ICAI

Downloaded from : taxupindia.com
main source : ICAI
UNIT-1 AUDITING IN AN ERP ENVIRONMENT

Downloaded from : taxupindia.com
main source : ICAI

Downloaded from : taxupindia.com
main source : ICAI
AUDITING IN ERP ENVIRONMENT
1.1 Overview For the last 2 decades, India has been on a fast track to use Information Technology in the day to day activities. Individuals and Businesses/Corporations are increasingly dependent on IT to undertake most of their activities. Individuals using simple calculations or Corporations devising complex security features and transactions have taken the assistance of IT. While the risk of individuals using IT is limited to perhaps the individual himself, the risks of Corporations using IT are varied and have an impact on the entity, society or even the country. In such a scenario, there needs to be a check/audit on the use of IT by Corporations.
Businesses today rely on ERP systems and applications more than ever. Many of these systems generate and process data that is used in the preparation of financial statements of a company. The auditors also often rely on the data and reports that are generated from these systems. In this context, it is critical to understand the IT specific risks that could potentially impact the integrity and reliability of financial transactions and data flowing through a company's systems.
Some of the examples of ERP systems are SAP, Oracle, Peoplesoft, TALLY etc. These are available in the market and can be purchased and customised as per requirements.
In addition, the companies can develop ERP systems on their own. Companies in niche sectors like Oil and Gas etc. where the operations are complex and transactions can be different from the usual. These are categorised under Developed ERP systems.
LEARNING OBJECTIVES
To understand the requirements of SA315 and SA330 relating to IT and auditing in an ERP environment.
To understand the types of Books of Accounts in an ERP
To understand Controls Based audit
To understand the difficulties in performing only Substantive audits in ERP environment
To understand the process of Access to systems relevant for audit
To understand the Use of work of experts in an audit
CHAPTER
1

Downloaded from : taxupindia.com
main source : ICAI
AUDITING IN AN ERP ENVIRONMENT
4 ADVANCED INFORMATION TECHNOLOGY
1.2 Understand the requirements of SA315 and SA330 relating to IT and auditing in an ERP environment
SA 315 states that the objective of the auditor is to identify and assess the risks of material misstatement, whether due to fraud or error, at the financial statement and assertion levels through,
Understanding the entity and its control environment, including the entity’s internal control framework.
Understanding the information systems environment relevant to financial reporting and communication.
Understanding and assessing the risks associated with the relevant environment.
The auditor will have to understand the nature of the entity and the governance structure. The governance structure will provide an indication over the Internal Control Framework. One important aspect of Control framework in an IT environment is that the entity should have separate reporting structures for the IT team and the Business team. The IT team is the owner of the application and the Business team is the owner of the data residing within the application. The roles of both the teams should be segregated and should not overlap. This communication lines are strictly drawn so as to maintain the integrity of the data within the application.
An example of the Governance framework as shown in Fig 1.2.1.
Fig. 1.2.1: Governance framework
Along with an understanding of the entity, the auditor identifies the industry to which it belongs. This will enable the auditor to get an idea of the complexity and class of transactions, account balances and disclosures to be expected in the financial statements.
The next step for the auditor is to understand the IT systems and related procedures within IT and business processes by which these transactions are initiated, recorded, processed, reported etc. These could happen within IT systems or outside.
There may be instances where the events and conditions, other than routine transactions but are significant for financial reporting, may be captured in the Information Systems. We are referring to Non Standard Journal Entries. The auditor has to understand the process and controls in recording such entries.
Some examples of the Information Systems environment relevant to financial reports are given below:
1. The audit client is an entity that has many branches, depots, sales outlets across the country etc. Transactions such as invoice entries, debit/credit notes etc. may be passed at each of these locations.

Downloaded from : taxupindia.com
main source : ICAI
AUDITING IN ERP ENVIRONMENT
ADVANCED INFORMATION TECHNOLOGY 5
2. The audit client is in the retail industry. They have many Point of Sale outlets (POS) where the sales are recorded. These POS machines should have the latest price catalogue at the time of invoicing.
3. The audit client is in the IT industry. They have many types of revenue such as milestone billing, time spent on projects etc. along with markup. This data is captured in various applications and the invoice is raised in the integrated ERP.
The information gathered during the understanding phase of the IT environment should be captured in a summary format to plan out the audit strategy.
Fig. 1.2.2: Audit Strategy
An example of the understanding of the Control Environment is given:
It is possible that the information flow as mentioned above may be in a partially or fully automated environment.
Automated environment refers to one with less manual process intervention and relies more on the systems driving the activities. The risks in an automated environment are many. For example, the risks may be due to the number and location of applications, interfaces between the applications, security within the applications etc. We shall learn more on the components of an Automated Environment in the sessions on General IT Controls and Automated Application Controls. However, given below are a sample of risks in an automated environment as well as an example of an IT Automated environment.
Domain Inherent Risk of Material Misstatement Control Description
Control Environment
Lack of segregation of incompatible IT functions/duties may lead to increased risk of fraud and unauthorized activities.
Segregation of duties has been clearly defined and documented for all critical IT functions. It is clearly communicated to all critical IT function users.
System Security
Generic users and contractor's user IDs may be used to gain unauthorized access to the network.
Generic user ID's and service accounts are identified and a "user owner" is assigned to the user ID.
System Security
Unauthorized users could access corporate data if passwords are not set according to security standards
Application, Database and Operating Systems Password controls are configured according to the Information Security Policies.
Table 1: Control Description

Downloaded from : taxupindia.com
main source : ICAI
AUDITING IN AN ERP ENVIRONMENT
6 ADVANCED INFORMATION TECHNOLOGY
Fig. 1.2.2: IT Automated Environment
In addition to SA 315, the auditors, in response to Clause (i) of Sub-section 3 of Section 143 of the Companies Act, 2013 (“the 2013 Act” or “the Act”) , have to report whether the entity has adequate internal financial controls system in place.
The auditors have to express an opinion on the effectiveness of the entity’s internal financial controls over financial reporting and have also to mention the audit procedures conducted to arrive at the opinion. These procedures will be carried out along with the audit of financial statements. The requirement is applicable for listed and unlisted companies.
Budget King
AUDIT CLIENT
Web Server
Information flow
Information flow

Downloaded from : taxupindia.com
main source : ICAI
AUDITING IN ERP ENVIRONMENT
ADVANCED INFORMATION TECHNOLOGY 7
1.2.1 Objectives of SA 330
SA 330 deals with the auditor’s responsibility to design and implement responses in the form of audit procedures in response to work done as part of SA 315. The objective of the procedures is to reduce the risk of material misstatement to an acceptable level. These audit responses will be a part of the overall audit strategy. The strategy will set the scope, timing and direction of the audit. Depending on the level of automation achieved by a Corporation, these audit procedures will revolve around a mixture of controls and substantive based approach. Such audit procedures form a part of the overall financial statement audit procedures.
Given below is the chart that explains the link between the works done as per SA 315 and SA 330 as shown in Fig 1.2.3.
Fig. 1.2.3: The link between the works done as per SA 315 and SA 330.
Thus, the auditor as per requirements of SA 330, has to plan and execute the audit procedures to achieve the objectives of SA315 and Internal Financial Controls reporting.
1.3 Books of Accounts in an ERP An integrated enterprise resource planning system inherently means that all the modules within the system are seamlessly connected with each other and the transactions flow through the relevant modules. Thus, there is one Primary Set of Books and all the transactions reside here.
Where the books were maintained in a manual format or in the earlier version of the systems, there were various books of accounts or ledgers. For example, there were Purchase ledgers, sales ledgers, cash book, bank book etc. Entries were passed in these books depending on the type of transactions. At the end of a

Downloaded from : taxupindia.com
main source : ICAI
AUDITING IN AN ERP ENVIRONMENT
8 ADVANCED INFORMATION TECHNOLOGY
period – for example on a daily basis, weekly basis or on a monthly basis, the totals of these books were posted to the General Ledger.
With the advent of ERP, such different types of books or ledgers were not used. ERP’s were integrated which meant that for any type of transactions, the impact to the General Ledger was automatic and on a real time basis. The General Ledger had Control Accounts which was a summation of the respective transactions.
For example, if we take 2 purchase transactions involving 2 Vendors
Purchases Dr - Purchase Control Account
To Vendor 1 A/c - Creditors Control Account
Purchases Dr - Purchase Control Account
To Vendor 2 A/c - Creditors Control Account
In the above example, the ERP will maintain the details of transactions separately for Vendor 1 and Vendor 2 and also have a Creditors Control Account to capture the total of all Creditors balances.
The auditor, to audit the books of accounts and as per requirements of SA 330 will have to assess the risks and put in place an audit program which is a combination of
Tests of Controls
Substantive procedures including Substantive Analytical Procedures and Test of Details
In the below Fig 1.3.1 is given the type of audit evidence that can be obtained from the client as per SA 330 and SA 500.
Fig. 1.3.1: Audit Evidence

Downloaded from : taxupindia.com
main source : ICAI
AUDITING IN ERP ENVIRONMENT
ADVANCED INFORMATION TECHNOLOGY 9
While deciding on the audit procedures the auditor should take into account the risk of material misstatement at the assertion level for each class of transactions, account balance and disclosure.
1.4 Difficulties in Substantive audits in ERP In the current automated environment, an auditor cannot devise an audit plan which is entirely made up of substantive procedures. The client may have automated complete processes in the systems to minimise or eliminate manual procedures. This increases the risk of any misstatement not being detected only by substantive procedures. Hence, the auditor will have to rely on audit procedures which include auditing within or surrounding the systems. Some other possible reasons why substantive procedures themselves may not be feasible or sufficient are:
Increased use & complexity of Systems and Application software in Business (for example, use of old legacy systems, multiple applications)
nature of business (Telecom, e-Commerce)
Volume of transactions are high (Retail, Manufacturing)
Systems distributed over different geographies(main ERP in India, Payroll application in Europe)
Company Policy (Compliance)
Regulatory requirements - Companies Act 2013 IFC, IT Act 2008
Required by Indian and International Standards - ISO, PCI-DSS, SA 315, SOC, ISAE
Outsourced processes (Part of the Purchase process outsourced to an organization outside the country)
Increases efficiency and effectiveness of audit
1.5 Controls Based Audit Some key aspects of SA 300 - Planning of Audit of Financial Statements, have to be taken into consideration.
Involvement of Key Team Members – If the company/auditee is using ERP, then the audit team will have to incorporate experts/specialists in the audit team who can extract data from the ERP, navigate within the ERP, understand any rules defined by the Company within the ERP etc.
Areas where Computer Assisted Audit Techniques - CAATS may be used as part of the audit procedures.
In determining the audit approach to include Controls Based audit, the below Fig 1.5.1 as shown the questions/criteria to be considered:

Downloaded from : taxupindia.com
main source : ICAI
AUDITING IN AN ERP ENVIRONMENT
10 ADVANCED INFORMATION TECHNOLOGY
Fig. 1.5.1: Control Based Audit
The auditor after having evaluated and tested the Internal Control Framework may adopt a strategy that includes Tests of controls. The auditor may have to an appropriate mix of Controls testing along with substantive procedures. A test of controls is an audit procedure to test the effectiveness of a control used by a client entity to prevent or detect material misstatements. Depending on the results of this test, auditors may choose to rely upon a client's system of controls as part of their auditing activities. These controls may be manual, automated, inherent etc.
1.6 Access to systems for audit When auditing in an ERP environment it is essential for the auditor to have access to that environment. Here are some possible reasons for requiring access to ERP
To extract data and reports required for audit, independently. Obtaining audit data independently gives the auditor more direct audit evidence. For example, the auditor may want to get a daybook, purchase register, sales register, trial balance from an ERP system. For this purpose, the auditor should first have a user id and password to login to the ERP system of the company. The Fig 1.6.1 as shown below a sample trial balance report generated from an ERP.

Downloaded from : taxupindia.com
main source : ICAI
AUDITING IN ERP ENVIRONMENT
ADVANCED INFORMATION TECHNOLOGY 11
Fig. 1.6.1: A sample trial balance report generated from an ERP.
To test automated application controls through the system by inspection of configurations. For example, consider a solution of a situation where duplicate vendor invoices are automatically identified and blocked in the ERP system. To test this automated control, the auditor needs to review the relevant configurations or settings in the ERP . The auditor will require access to ERP for carrying out this test of control. Refer below screenshot of configuration for duplicate invoice check in ERP application as shown in Fig 1.6.2.
Fig. 1.6.2: Configuration for duplicate Invoice Check an ERP.
Configuration will check duplicate invoice for a vendor

Downloaded from : taxupindia.com
main source : ICAI
AUDITING IN AN ERP ENVIRONMENT
12 ADVANCED INFORMATION TECHNOLOGY
When auditors have access to systems, it makes the audit process more efficient and effective and also reduces the amount of time the company staff have to devote for audit. However, there are certain points to remember when requesting for access to systems. They are,
Auditors should always request access to the production or live environment. Production environment is where business transactions are posted, financial statements including trial balance, balance sheet and profit & loss statements are generated. Access to non-production environments alone viz., quality, test systems will not suffice unless additional audit evidence is obtained to corroborate that data obtained from non-production systems is consistent with the production system data. We will learn more about the various system environments in the chapters on General IT Controls.
The type of access that auditors request should be Display-Only or Read-Only i.e., access without the ability to create, alter or delete data in the ERP environment. This is essential because auditors should not make changes to business data, even inadvertently.
Super user, privileged or administrative access is not always necessary for auditors and should not be requested. Even when provided with super user, privileged or administrative access to systems, it is better to decline acceptance of such access. For example, in SAP ERP the users who are assigned the role SAP_ALL or SAP_NEW have super user access which means these users can perform any transaction or activity in the ERP. This level of super user access is generally not necessary for an auditor.
Fig. 1.6.3: Super user Roles
Auditor should request for temporary access for the duration of audit to minimise any possible misuse of the same access at a later date.
Prior to obtaining access to company systems, the auditor should receive sufficient training or orientation in navigating through the systems and applications. Experimenting on company systems should be avoided. In case the auditor does not have sufficient knowledge of an ERP, they should take help from experienced and authorised users of the ERP.
Super user Roles

Downloaded from : taxupindia.com
main source : ICAI
AUDITING IN ERP ENVIRONMENT
ADVANCED INFORMATION TECHNOLOGY 13
To obtain data from core technology components of an ERP environment viz., operating systems, databases, networks, the auditor should take help from the respective administrators of those systems.
Before obtaining access to systems, the auditor should also gain an understanding of the company IT policies including password policy, user access policy and acceptable usage policy and so on. For example, complexity, duration and length of passwords etc. This is essential so that the auditor does not inadvertently violate the company policies or compromise IT security.
1.7 Involvement of experts When auditing in an ERP environment, it is likely that the auditor will come across certain aspects of and ERP environment that require more in-depth understanding and knowledge of the technical subjects. Examples of what an auditor may have to looking at and review could include,
Complex ERPs like SAP
Legacy systems including mainframes and AS/400 systems
Latest technology like cloud computing
In-house developed systems and applications
Customised and specialised systems
Database like Oracle or SQL Server
Operating systems like Unix and variants
To determine the scope, understand the ERP environment, assess risks and carry out audit tests will require special training, expertise and skills for an auditor (of financial statements). In certain cases where the auditor may not possess such knowledge and skills an expert should be involved. Just like how auditors sometimes involve experts from the fields of Taxation, Transfer Pricing, Valuators, Actuaries, even IT specialists can be involved as experts in an audit of financial statements. The standard SA 610 - Using the Work of an Auditor's Expert provides the necessary guidance on involving experts.
1.8 Exercise 1. _________ states that the objective of the auditor is to identify and assess the risks of material
misstatement, whether due to fraud or error, at the financial statement and assertion levels.
2. Understanding the information systems environment relevant to financial reporting and communication is a part of:
(a) SA300
(b) SA315
(c) SA330
(d) SA500
3. The __________ team is the owner of the application.

Downloaded from : taxupindia.com
main source : ICAI
AUDITING IN AN ERP ENVIRONMENT
14 ADVANCED INFORMATION TECHNOLOGY
4. The __________ team is the owner of the data within the application.
5. In response to Clause ___ of Sub-section __ of Section 143 of the Companies Act, 2013, the auditor has to report whether the entity has adequate internal financial controls system in place.
6. ______ deals with the auditor’s responsibility to design and design and implement responses in the form of audit procedures in response to work done as part of SA 315.
7. Involvement of key team members and usage of CAATS is a part of SA _______, Planning of Audit of Financial Statements.
8. Involvement of Experts in audit is covered under SA ______.
9. Complexity, duration and length of passwords are a part of :
(a) User access policy
(b) Password policy
(c) Acceptable usage policy
(d) None of the above.
10. Typically, the auditors should request for ___________ access or ___________ access to the client’s ERP system.
1.9 Glossary ERP – Enterprise Resource Planning
POS – Point of Sale
GITC – General Information Technology Controls
CAATS – Computer Assisted Audit Techniques
ISO – International Organisation for Standardisation
PCI-DSS – Payment Card Industry – Data Security Standard
ISAE – International Standard for Assurance Engagements
SOC – Service Organisation Controls
1.10 References and other reading material 1. Standards on Auditing published by the Institute of Chartered Accountants of India (ICAI), www.icai.org >
Resources
2. Guidance Note on Audit of Internal Financial Controls Over Financial Reporting issued by Auditing and Assurance Standards Board. - (14-09-2015), www.icai.org
3. Companies Act 2013, www.mca.gov.in/Ministry/pdf/CompaniesAct2013.pdf

Downloaded from : taxupindia.com
main source : ICAI
AUDITING IN ERP ENVIRONMENT
ADVANCED INFORMATION TECHNOLOGY 15
1.11 Answer to Exercise 1. SA 315
2. Answer is b – SA 315.
o SA 315 mentions that it is key to understand the information systems environment relevant to financial reporting and communication.
3. IT Team
4. Business team
5. Clause (i) of Sub-section 3 of Section 143 of the Companies Act, 2013
6. SA330
7. SA 300
8. SA 610
9. Answer is b – Password policy
10. Display only or Read only

Downloaded from : taxupindia.com
main source : ICAI
GENERAL INFORMATION TECHNOLOGY CONTROLS
2.1 What are General IT Controls “General IT controls are policies and procedures that relate to many applications and support the effective functioning of application controls. They apply to mainframe, miniframe, and end-user environments. General IT-controls that maintain the integrity of information and security of data commonly include controls over the following:” (SA 315)
These are IT controls generally implemented to mitigate the IT specific risks and applied commonly across multiple IT systems, applications and business processes. Hence, General IT controls are known as “pervasive” controls or “indirect” controls.
2.2 Categories of GITCS There are basically four categories of General IT Controls which are as follows:
Data center and network operations
Program change
Access security
Application system acquisition, development, and maintenance (Business Applications)
In addition to the above there are aspects of that relate to the governance and oversight of IT systems at the entity level known as IT Governance. The auditor is required to obtain an understanding of IT Governance as part of the review of Entity Level Controls.
LEARNING OBJECTIVES
To understand about General IT Controls
To understand the categories and types of General IT Controls
To understand the impact of General IT Controls on Audit of financial statements
To know which systems to scope for review of General IT Controls
To learn about the sample size requirements for General IT Controls
To understand the procedures for review of various categories or domains of General IT Controls including IT Governance, Program Changes, Access Security, Data center and network Operations, Application system acquisition, development and maintenance
To understand how to evaluate impact of deficiencies in General IT Controls on overall audit
To know when to test General IT Controls
CHAPTER
2

Downloaded from : taxupindia.com
main source : ICAI
GENERAL INFORMATION TECHNOLOGY CONTROLS
ADVANCED INFORMATION TECHNOLOGY 17
2.3 Types of Controls The different types of controls are as follows:
Automated Controls
Automated controls are embedded into IT applications viz., ERPs and help in ensuring the completeness, accuracy and integrity of data in those systems. Examples of automated controls include edit checks and validation of input data, sequence number checks, user limit checks, reasonableness checks, mandatory data fields, user access controls and password controls.
Manual Controls
Manual controls are activities in a business process that are performed by individuals or employees manually i.e., without the need to rely on a IT system or data generated by a system. For example, manual controls include approval of a manual journal voucher, reviewing reconciliations, authorisation for payments, approving credit limits and segregation of duties, user acceptance testing of program changes.
IT-Dependent Controls
IT dependent controls are basically manual controls that make use of some form of data or information or report produced from IT systems and applications. In this case, even though the control is performed manually, the design and effectiveness of such controls depends on the reliability of source data.
2.4 How do GITCS Impact Audit When IT systems are used in a company for processing of business transactions and activities there will be risks which are specific to the use of IT systems that need to be considered. Examples of IT risks are given below:
Inaccurate processing of data, processing inaccurate data, or both
Unauthorized access to data
Direct data changes (backend changes)
Excessive access / Privileged access (super users)
Lack of adequate segregation of duties
Unauthorized changes to systems or programs
Failure to make necessary changes to systems or programs
Loss of data
The auditor should identify, evaluate and assess the IT risks to determine impact on audit. General IT Controls or GITCs are internal controls that are implemented by a company to mitigate IT risks. Effective implementation and operation of General IT Controls are essential for relying on the following:
Information Produced by Entity (IPE) i.e., data, information or reports that are generated from systems
Automated controls, calculations, accounting procedures that are built into the applications
IT dependent controls

Downloaded from : taxupindia.com
main source : ICAI
AUDITING IN AN ERP ENVIRONMENT
18 ADVANCED INFORMATION TECHNOLOGY
Due to the inherent dependency on IT, the effectiveness and reliability of Automated controls and IT dependent controls require the General IT Controls to be effective.
2.5 Which Systems to Scope for Review of GITCS In an audit of financial statements, the auditor is required to understand the entity and its business, including IT as per SA 315. As mentioned in the introduction section, obtaining an understanding of a company and its automated environment involves understanding how IT department is organised, IT activities, the IT dependencies, relevant risks and controls. Depending on the nature, size and complexity of operations, a company could be using one or more IT systems and applications.
While the auditor is required to obtain an understanding, document the IT environment at a company, including all IT systems, the auditor is required to consider only those General IT Controls that mitigate risks relevant to financial statements.
Which IT systems and General IT Controls to include in-scope for an audit depends on the auditors’ judgement and assessment of risk of material misstatements to financial statements and the planned audit response to these risks.
Fig 2.5.1: IT environment
In this example, the auditor has obtained an understanding if IT environment which has four different IT applications being used at a company. However, the auditor has considered two applications i.e., SAP and Paymaster as “In-Scope” for audit since these two applications are used in the processing of financial transactions which has a direct impact on the accounting and preparation of financial statements.
However, two other applications “Accent” and “BudgetKing” are not considered in scope for audit because these systems, even though are important for the company, do not impact the financial data and accounting of the company.
2.6 Sample Size The methodology and approach for testing General IT Controls in an audit of financial statements is the same as approach for testing other internal controls including manual controls, automated controls or IT-dependent

Downloaded from : taxupindia.com
main source : ICAI
GENERAL INFORMATION TECHNOLOGY CONTROLS
ADVANCED INFORMATION TECHNOLOGY 19
controls. Accordingly, the sample size requirements when testing General IT Controls are also the same. The considerations for determining sample size include the following:
Size of population to test
Type of control - Manual/Automated/IT-Dependent
Frequency of control - Daily/Weekly/Monthly/Quarterly
Nature of test - Inquiry/Observation/Inspection/Reperformance
Timing of test - Interim/Year-end/Full Period
History of errors and exceptions
Tolerance for exceptions
Effectiveness of Entity Level Controls
Risk assessment - High/Medium/Low
The auditor should apply professional judgement in determining the sample size for testing controls and is required to explicitly document the following as per SA 230,
factors considered and justification for sample size
how the auditor ensured completeness of population
2.7 Procedures for Review of IT Governance IT Governance is a part of the larger corporate governance of a company that involves establishment of the IT framework in a company which includes
Defining IT objectives
Alignment of IT objectives with business objectives
Setup IT organisation structure
Define Roles & Responsibilities of IT personnel
Create IT policies and processes
Monitor quality and effectiveness of IT
In an audit of financial statements, the auditor is required to understand and evaluate the internal controls components other than control activities i.e., Control Environment, Risk Assessment, Information & Communication and Monitoring as a part of reviewing Entity Level Controls. The Information & Communication component requires the auditor to obtain an understanding of
how business processes operate,
the relevant information systems used in the processing of business transactions and activities,
the risks and controls pertaining to the information systems and underlying infrastructure
reliability of information generated from systems

Downloaded from : taxupindia.com
main source : ICAI
AUDITING IN AN ERP ENVIRONMENT
20 ADVANCED INFORMATION TECHNOLOGY
While Information & Communication is more relevant to the use of information systems in a company, in large and complex ERP environments it is likely that the other components of internal controls viz., Control environment, Risk assessment and Monitoring will also be relevant.
The following is a sample procedure of how the auditor performs an understanding and evaluation of the IT Governance in a company.
Ref No. IT Governance Review Checklist
1 How is the IT department organised
2 Who has ownership and provides leadership for IT function
3 The manner in which IT function reports to those charged with governance i.e., Board of Directors/Audit Committee
4 Have formal IT policies and procedures been defined
5 Are roles and responsibilities defined and assigned to IT personnel
6 Is there segregation of duties within key IT functions
7 Do human resource policies and process ensure that right people are hired for key IT functions
8 Is security training and awareness provided to employees
9 How does IT communicate and collaborate with other business functions
10 What is the process for identifying and addressing IT risks
11 How does the company ensure the reliability, effectiveness of IT systems
12 Is compliance with and adherence to IT policies and procedures monitored and measured
Table 1: IT Governance
2.8 Procedures for Review of Program Changes The Program changes domain of General IT Controls involves the understanding and evaluating the process, risks and controls that are relevant to making changes to the IT systems and applications.
The objective of program changes is “To ensure that modified systems continue to meet financial reporting objectives”. The change management process and activities in the process can be understood from the illustration as shown in Fig 2.8.1:

Downloaded from : taxupindia.com
main source : ICAI
GENERAL INFORMATION TECHNOLOGY CONTROLS
ADVANCED INFORMATION TECHNOLOGY 21
Fig 2.8.1: The change management process
The process for program changes is similar to the process that is followed for acquisition, development and implementation of new systems. The program change process begins after a new system or ERP is implemented and involves the ongoing maintenance of ERP system. In other words, program changes process begins from the point where program development ends i.e., after go-live stage.
Change Requests: A user initiates a request for change based on a business requirement. For example, a new report may be required because of a regulatory requirement or for internal reporting. The change request is reviewed and approved by a supervisor or head of department. All changes are recorded and tracked to ensure timely completion.
There are different types of changes including the following:
Normal changes – these are changes required in the existing functionality of the ERP due a business need.
Bug fixes – a bug is an error in software which affects business transactions or reports in an ERP. Changes are required to be made to the program or configuration of the ERP to rectify or fix the bug. Identification of bugs normally happens when a user reports a problem to the IT Helpdesk. In such cases it is likely that a request made to helpdesk is converted to a program change request by the IT department and approval is provided by a IT Manager or ERP consultant instead of the supervisor of business user.
Enhancements – when new improvements or functionality is added to an existing ERP. For example, a workflow process is introduced for processing purchase orders to facilitate system based approvals.

Downloaded from : taxupindia.com
main source : ICAI
AUDITING IN AN ERP ENVIRONMENT
22 ADVANCED INFORMATION TECHNOLOGY
Minor changes – changes that take less time and effort are classified as minor changes. For example, any program change that requires less than 40 hrs of effort may be considered as minor change.
Major changes – these are changes that require more time and effort to develop and implement. For example, changes that take more than 100 hrs of effort may be considered as major change.
Sometimes where major enhancements and major changes take place in an ERP, such changes may fall under the GITC domain of Program development instead of program changes.
Patches and updates – these are changes provided by the vendor of ERP to address known bugs, security, or provide improvements to functionality to existing ERP.
Patches and updates are typically initiated and processed by the IT department. Depending on the nature of the patch or update, the business user involvement could vary.
Data changes – these are direct changes to data carried out in the backend database using SQL statements or tools.
Direct data changes are high risk because they bypass the application controls and directly impact integrity of financial data.
Emergency changes – these are changes that are required to be carried out urgently to prevent disruption to business transactions. For example, an emergency change is required to fix a bug that impacts critical business transaction viz., invoice / despatches or patches released by ERP vendor to address a security vulnerability found in the ERP.
Due to the nature of emergency changes, it is likely that the change management process may be bypassed for implementing the change. However, the necessary approvals and documentation should be obtained subsequently within a reasonable time frame.
Changes in IT Infrastructure – These are changes made to the IT infrastructure components that support the ERP. For example, upgrades in operating system or database, changes to network configuration, installation of new hardware, etc.
Infrastructure changes are technical in nature and do not affect the business functionality. These changes are initiated and processed by the IT department.
Development: Approved change requests are provided to the IT department where the systems analysts perform analysis & design and prepare the functional / technical requirement specification for the change. The programmers develop the change by writing the program code or modify the configuration in the development environment. Once development is completed, the change is moved to test environment for testing.
Testing: Program changes are tested to verify that a change works as intended. Testing is done at different levels. Unit testing is done by developer to test the working of specific change made. The functional consultant tests the change by preparing test cases and test scripts to simulate different scenarios and verify if the change meets the functional specifications under all scenarios including integration with other modules and interfaces to other systems, if any. Business user, who initially

Downloaded from : taxupindia.com
main source : ICAI
GENERAL INFORMATION TECHNOLOGY CONTROLS
ADVANCED INFORMATION TECHNOLOGY 23
requested the change, performs the user acceptance testing to verify that a program change meets business requirement for which change request made.
The extent of testing a program change could vary depending on the nature of the change itself. For example, a change in existing report format and layout may not require extensive testing, whereas a new report that is developed may require more testing. Bug fixes and other IT specific changes may require unit testing and integration testing, but not user acceptance testing.
Implementation: Prior to implementing changes in production environment, a quality assurance team reviews the changes and documentation prepared for adherence to company’s change management process. After clearance is obtained from quality assurance, the IT head or equivalent approves the implementation of change in production environment based on which an administrator moves the change from test to production environment.
In case of major changes or enhancements that impacts a larger user group, training and awareness of change should be provided to users.
Segregation of duties: The change management process requires several tasks to be carried out by different people in different environments viz., development, test and production. These tasks and environments should be adequately segregated to prevent unauthorised changes from being made. The illustration as shown in Fig 2.8.2 below is an example of how this segregation can be implemented.
Fig 2.8.2: Segregation of duties
Example of configuration to prevent direct changes in ERP production environment:

Downloaded from : taxupindia.com
main source : ICAI
AUDITING IN AN ERP ENVIRONMENT
24 ADVANCED INFORMATION TECHNOLOGY
Fig 2.8.3: To prevent direct changes in ERP
Example showing three separate environments for development (SBD), testing (SBQ) and production (SBP) in Fig 2.8.3
Fig 2.8.3: Three separate environment for development, testing and production
Documentation: Sufficient and appropriate documentation should be prepared and maintained to support all program changes. The documentation should include the following,
change request forms
approvals and sign-offs
source code
test cases and test scripts with results obtained
user acceptance testing outputs and results
record of training provided to users
updates to user manuals and technical manuals to reflect the changes

Downloaded from : taxupindia.com
main source : ICAI
GENERAL INFORMATION TECHNOLOGY CONTROLS
ADVANCED INFORMATION TECHNOLOGY 25
The below illustration is an example of change request form
ABC Private Limited Change Request in ERP
Project Name CR No
Project Id CR Date
Requestor Request No.
Designation Request Date
Contact Number
E-Mail Id
Sl. No.
Application Module/Functionality/ Screen
Change Request Details Proposed Changes
Status
1
Requested by HOD / In-Charge UAT Sign-off (Sign, Name & Date) (Sign, Name & Date) (Sign, Name & Date) Developed by Change Implemented by IT In-Charge / IT Head (Sign, Name & Date) (Sign, Name & Date) (Sign, Name & Date)
The table below has examples of risk and controls that an auditor may consider when reviewing program changes
Ref No. Activity Risk Control description
1 Change Request Unauthorised changes are processed
The change request is approved by the department In-charge or Head of department (HOD). Changes to IT infrastructure components are approved by IT Head.
2 Testing Untested changes could compromise the integrity of financial data
Unit testing is performed by developer, user acceptance testing is done by end user prior to implementing in production environment.
3 Segregation of duties
Changes are made directly in production environment and may result in loss of data
Three separate environments exist for development, quality (test) and production. Separate teams are involved in development and migration of changes to production.
Downloaded from : taxupindia.com
main source : ICAI
AUDITING IN AN ERP ENVIRONMENT
26 ADVANCED INFORMATION TECHNOLOGY
Ref No. Activity Risk Control description and program integrity. Development of changes is done by consultants and
movement of changes to production is performed by System Administration only after approval.
4 Implementation Changes are implemented by unauthorised persons.
Access to migrate changes to production is restricted to System Administrators only.
5 Documentation Changes are applied bypassing the change management process.
A monthly review of all changes to application programs is performed by internal audit/quality assurance team. Exceptions and deviations are reported to senior management and those charged with governance.
Table 2: Risk & Control description
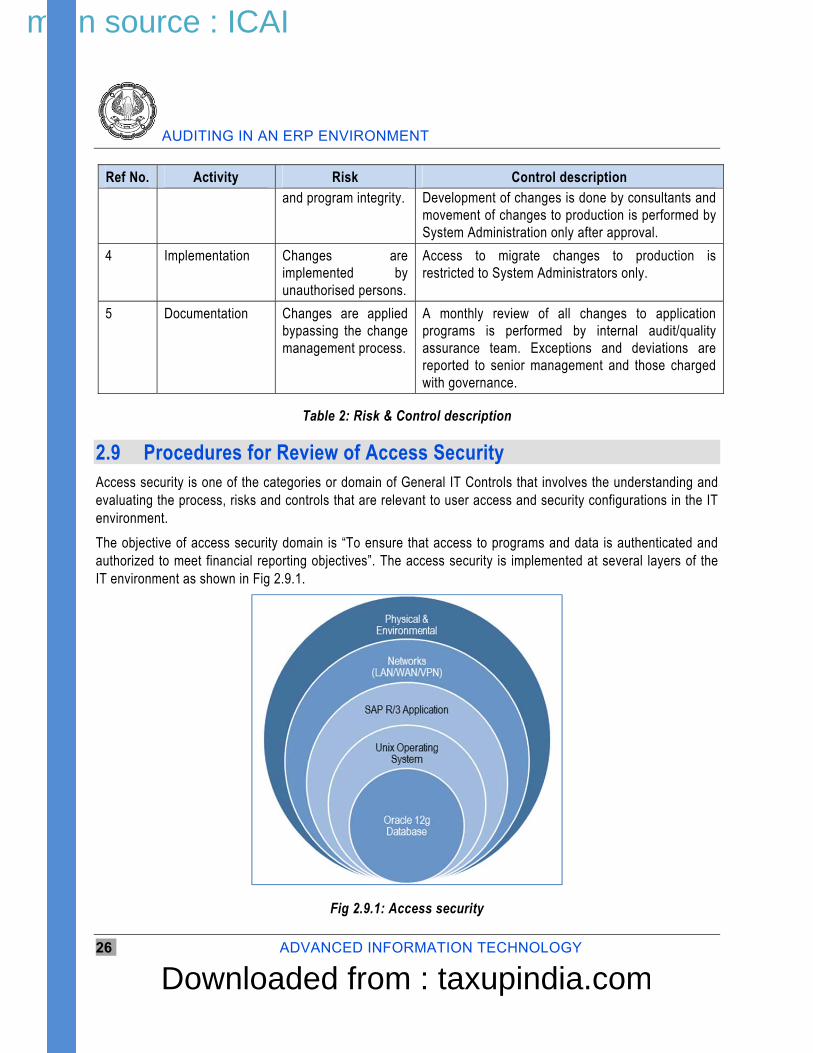
2.9 Procedures for Review of Access Security Access security is one of the categories or domain of General IT Controls that involves the understanding and evaluating the process, risks and controls that are relevant to user access and security configurations in the IT environment.
The objective of access security domain is “To ensure that access to programs and data is authenticated and authorized to meet financial reporting objectives”. The access security is implemented at several layers of the IT environment as shown in Fig 2.9.1.
Fig 2.9.1: Access security

Downloaded from : taxupindia.com
main source : ICAI
GENERAL INFORMATION TECHNOLOGY CONTROLS
ADVANCED INFORMATION TECHNOLOGY 27
The various activities in this domain include the following:
User management: involves granting, modification and revocation of user access and periodic review of user access to ensure that access granted is consistent with user job responsibilities and excessive access is not granted. For example, when a new employee joins a company in the stores department, a new user id is created and granted access to company network and ERP to process goods movements.
In case existing employee in accounts payables section is promoted as finance manager and transferred to from factory office to head office, his/her access in ERP should be modified by removing access to process accounts payables transactions at plant/factory and providing access to approve payments at head office level.
When an employee resigns and leaves a company, access of the employee should be revoked/removed from network, ERP application and office premises without delay.
User management apply to all layers of access security i.e., application, database, operating system, network and physical layers because users are created, modified and revoked at all layers.
Sensitive Access and Segregation of Duties (SA/SoD): involves granting user the ability to perform critical business activities in an ERP. Segregation of duties refers to the identification of conflicting business activities and preventing users from being granted to access these conflicting activities. The chapter “Segregation of Duties and Sensitive Access” gives a detailed explanation with examples about SA/SoD at ERP application layer.
Apart from the application layer, SA/SoD is relevant at other layers of security. Examples of how sensitive access and segregation of duties is implemented (for other than application layer) in an IT environment are as follows,
In modern client/server and web-based applications, business users are generally not created at the database and operating system layers. However, some companies could be using legacy systems in which user access may be created at database and/or operating systems.
Only administrators, or IT operations personnel should be granted access to database, operating system and network layers for day-to-day management of IT operations, not business users.
Developers and programmer access should be restricted to development environment and testing environments. Developers should not have access to production environment.
Privileged user access: commonly known as super users or admin users, a privileged user is someone with full or unlimited access to IT systems or applications. Privileged users may exist at all layers of access security. Typically, these users are system administrators, database administrators or network administrators. Because of the excessive level of access, it may not be possible to enforce security controls viz., SA/SOD for privileged users and hence privileged user access is considered high risk. Hence, activities of these users should be logged and reviewed periodically.
Audit logging and monitoring: an audit log or audit trail is a historical record of events and activities that take place in an IT environment. Audit logs are relevant to all layers of access security. In most IT systems and applications, enabling audit log is an optional feature and must be explicitly enabled and configured appropriately. Audit logs can quickly grow in size and occupy high volume of data and storage space and likely to impact performance of a system. However, some systems including, Windows

Downloaded from : taxupindia.com
main source : ICAI
AUDITING IN AN ERP ENVIRONMENT
28 ADVANCED INFORMATION TECHNOLOGY
Servers OS, Oracle database and Unix provide advanced audit management features so that only relevant events and activities viz., privileged user activity, changes to master are logged.
In addition to enabling the audit logs in systems, there should be a process in place to periodically review audit logs to detect any unauthorized events, activities and exceptions. Typically, audit logs should be generated and reviewed by someone independent of the IT function or those having privileged user access.
Example of audit log configuration in Windows Server. In this example, audit logs are set as Not Defined i.e., auditing is not enabled
Fig 2.9.2: Audit log configuration
Example of shows configuration to enable table logs and security logs in ERP. OFF indicates table log are not enabled, 0 indicates security logs are not enabled.
Fig 2.9.3: Security Logs in ERP
Password configuration: a password is a secret code that is used in combination with a user id to gain access into an IT system or application. Because of the sensitive nature of a password, unauthorised users including hackers most often target the passwords of users, specifically privileged users. Most systems provide the options for configuring the security and strength of passwords in order to protect being compromised from attacks. Password configuration and controls are applicable for all layers of access security.
Example of a password configuration in ERP as shown in Fig 2.9.4.

Downloaded from : taxupindia.com
main source : ICAI
GENERAL INFORMATION TECHNOLOGY CONTROLS
ADVANCED INFORMATION TECHNOLOGY 29
Fig 2.9.4: Password configuration in ERP
All new systems, applications and network equipment are supplied with one or more pre-created user ids, commonly known as “default users”, including the administration user id. The purpose of these default users is to facilitate easy installation and implementation of the respective software. However, the risk with default users is they are supplied with a password (known as “default password”) that is published openly and known to all. The default passwords should be changed immediately after installation but many companies forget to change the default passwords which can be misused by an unauthorized user or hacker.
Example of default users and corresponding default passwords in an oracle database.
User ID Password Password hash value
ORACLE ORACLE 38E38619A12E0257
ORADBA ORADBAPASS C37E732953A8ABDB
DBSNMP DBSNMP E066D214D5421CCC
DEMO DEMO 4646116A123897CF
ADMIN JETSPEED CAC22318F162D597
ADMINISTRATOR ADMIN F9ED601D936158BD
APPLSYS APPLSYS FE84888987A6BF5A
SYSTEM CHANGE_ON_INSTALL 8BF0DA8E551DE1B9
SYS 0RACLE8 1FA22316B703EBDD
OUTLN OUTLN 4A3BA55E08595C81
SAPR3 SAP 58872B4319A76363
SCOTT TIGER F894844C34402B67
SYSADM SYSADM BA3E855E93B5B9B0
Table 3: Default password in Oracle
Direct data access: all data including financial data, master data, transaction data and user data is stored in a database, logically represented as rows and columns (similar to an excel spreadsheet). Some common databases include Oracle 12g, MS-SQL Server 2012 and MySQL. The data is physically stored
Downloaded from : taxupindia.com
main source : ICAI
AUDITING IN AN ERP ENVIRONMENT
30 ADVANCED INFORMATION TECHNOLOGY
in the form of data files located in the operating system. Direct data access is relevant at the database and operating system layers of access security.
It is possible to directly access and modify/ manipulate data in a database using tools viz., SQL Plus, Toad, SQL Navigator, Enterprise Database Management tools. Direct data access is high risk because it bypasses security and business controls defined at the application layer. Normally only a limited number of users are likely to have database access including database administrators and IT operations personnel.
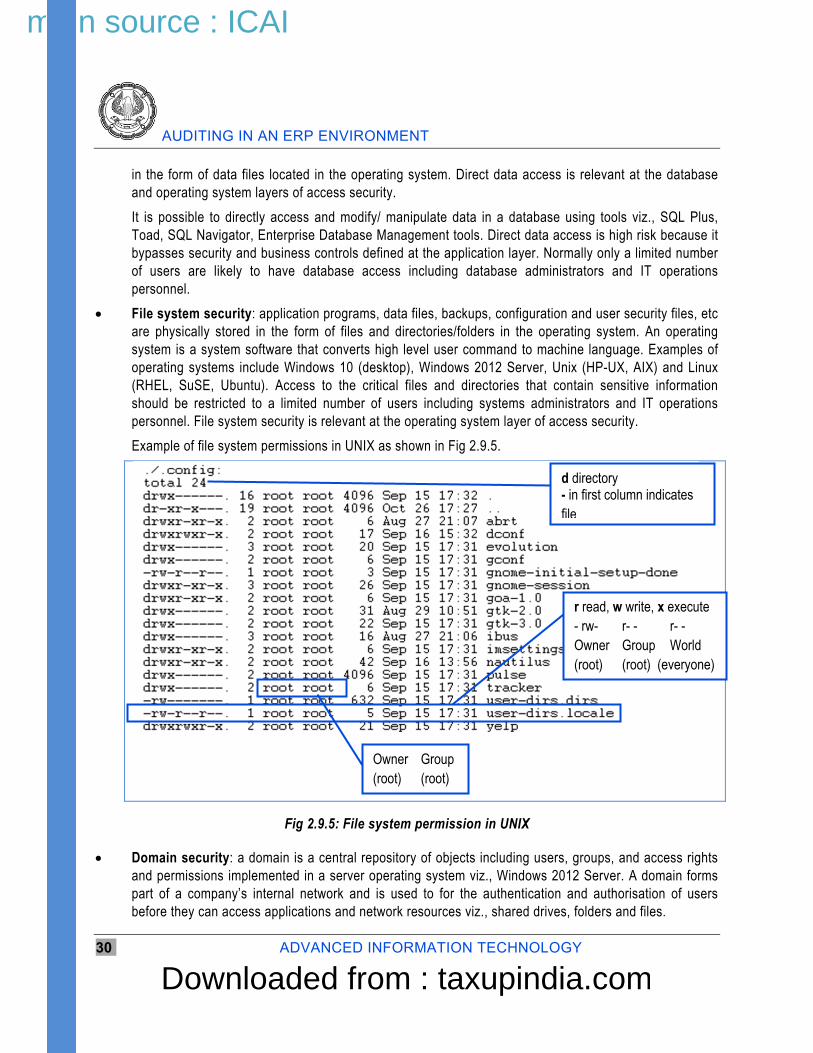
File system security: application programs, data files, backups, configuration and user security files, etc are physically stored in the form of files and directories/folders in the operating system. An operating system is a system software that converts high level user command to machine language. Examples of operating systems include Windows 10 (desktop), Windows 2012 Server, Unix (HP-UX, AIX) and Linux (RHEL, SuSE, Ubuntu). Access to the critical files and directories that contain sensitive information should be restricted to a limited number of users including systems administrators and IT operations personnel. File system security is relevant at the operating system layer of access security.
Example of file system permissions in UNIX as shown in Fig 2.9.5.
Fig 2.9.5: File system permission in UNIX
Domain security: a domain is a central repository of objects including users, groups, and access rights and permissions implemented in a server operating system viz., Windows 2012 Server. A domain forms part of a company’s internal network and is used to for the authentication and authorisation of users before they can access applications and network resources viz., shared drives, folders and files.
d directory - in first column indicates file
r read, w write, x execute - rw- r- - r- - Owner Group World (root) (root) (everyone)
Owner Group (root) (root)

Downloaded from : taxupindia.com
main source : ICAI
GENERAL INFORMATION TECHNOLOGY CONTROLS
ADVANCED INFORMATION TECHNOLOGY 31
Firewall, VPN, Anti-virus/malware: IT systems operate in a networked environment in which several systems and devices are connected and communicate with each other and exchange data using ports, services and network protocols. Firewalls are installed and configured at the perimeter network layer to protect the company’s IT systems from external threats and remote attacks. Virtual Private Network (VPN) allows users to remotely access to a company IT systems and applications using a secure and encrypted channel through a public network like the internet. Anti-virus and anti-malware software is used to protect data corruption that are caused by computer viruses.
Example of a remote access through external network, firewall, and internal network as shown in Fig 2.9.6
Fig 2.9.6: remote access through external network, firewall, and internal network
Environmental controls: environmental controls form part of the physical security layer of access security. Computing facilities that process, store, and transmit sensitive and critical data require protection from environmental hazards viz., fire, water, dust, humidity and heat that could result in system failures, data corruption and loss of data. Smoke detectors, fire extinguisher, air conditioning, temperature and humidity control, raised flooring are implemented to protect systems from environmental controls.
The manner in which access security is implemented will vary based on the nature, size and complexity of business operations and the extent to which IT systems are used. While most of the activities mentioned above are critical for the company, it is likely that some of these activities are less relevant to an audit of financial statements.
For example, security activities at the database and application layer that directly protect the integrity of financial data will be more relevant to audit. Whereas, the security activities at the outer layers of network and physical layers would be less relevant to audit. The auditor should determine the relevant activities and controls based on risk assessment.

Downloaded from : taxupindia.com
main source : ICAI
AUDITING IN AN ERP ENVIRONMENT
32 ADVANCED INFORMATION TECHNOLOGY
The illustration below summarises the relevance of the various access security activities to the layers of security.
Fig 2.9.7: Various access security activities
The table below has examples of risk and controls that an auditor may consider when reviewing access security
Ref No.
Activity Risk Control description
1 User management Unauthorised access to systems
There is a formal approval process of creating, changing and removing all access to the application.
2 User management Users have excessive access to systems
There is a process of periodic reviews to verify that user access is consistent with job responsibilities.
3 Password Configuration
Weak passwords may compromise security controls.
A robust password policy is implemented at the application level, database and operating system.
4 Access logging and monitoring
Unauthorised activities may go undetected.
Special system utilities for accessing data are logged and reviewed on a regular basis.
5 Access logging and monitoring
Unauthorised activities may go undetected.
Audit trail controls are designed and monitored by the management for potential unauthorized activities.
Security Layer
Security Activity Appl
icat
ion
Secu
rity
Dat
abas
e Se
curit
y
Ope
ratin
g Sy
stem
Sec
urity
Net
wor
k Se
curit
y
Phys
ical
Sec
urity
User management Segregation of Duties & Sensitive Access Privileged user access Audit logging and monitoring Password configuration Direct data access File system security Domain Security Firewall, VPN, Anti-virus/malware Environmental controls

Downloaded from : taxupindia.com
main source : ICAI
GENERAL INFORMATION TECHNOLOGY CONTROLS
ADVANCED INFORMATION TECHNOLOGY 33
Ref No.
Activity Risk Control description
6 Network security Computer virus may cause data loss and corruption
Appropriate software is installed, updated regularly to protect the system from virus attacks.
7 Perimeter network security
Unauthorised persons and hackers may gain access to financial data remotely.
The internal network is protected from unauthorized access via external network connections (i.e. internet) by appropriate placements of firewalls, etc.
8 Physical security Unauthorised users may gain access to computing facilities and data
Physical access to computer facilities, data centres, and removable storage media is appropriately restricted.
Table 4
2.10 Procedures for Review of Data Center and Network Operations Data centre and network operations, also known as computer operations, is one of the categories or domain of General IT Controls that involves the understanding and evaluating the process, risks and controls that are relevant to day-to-day operations carried out in the IT environment.
The objective of data center and network operations is “To ensure that production systems are processed to meet financial reporting objectives”. The various activities in this domain include the following
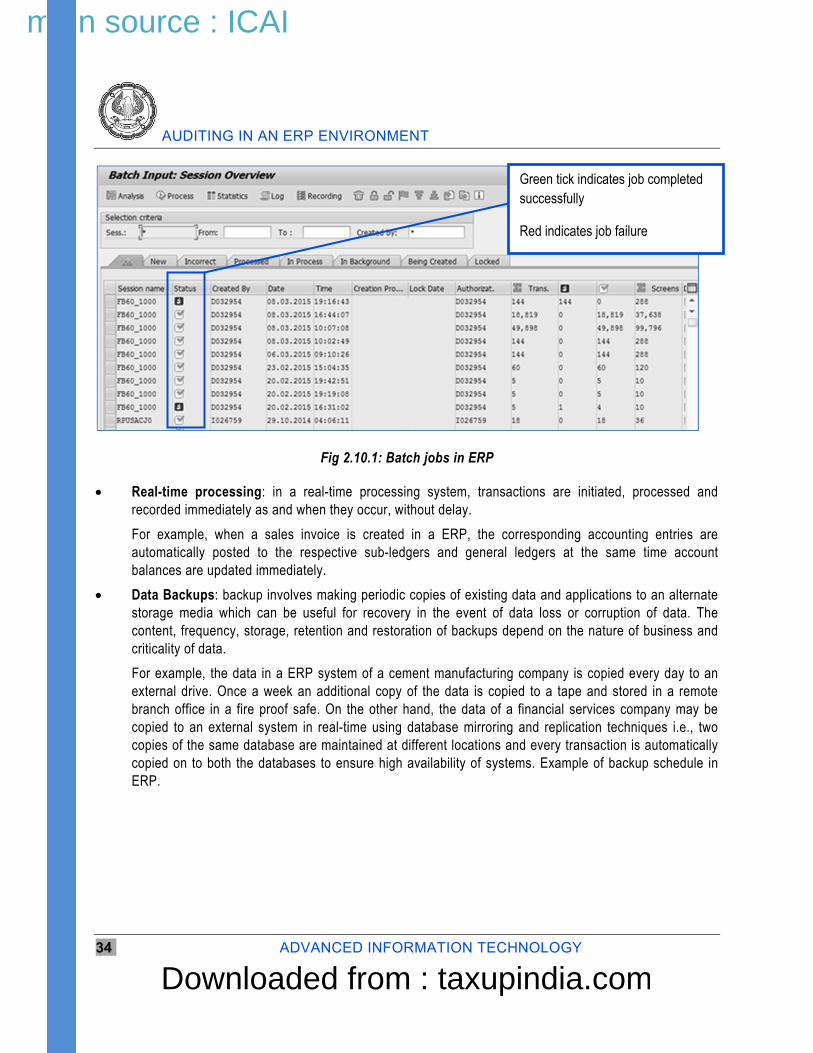
Batch jobs: processing of batch jobs involves combining several transactions of the same nature for processing at the same time. Typically, batch jobs are designed to execute automatically at a pre-scheduled time without user intervention. A user could also initiate a batch job and schedule it for execution at a particular point of time.
For example, all the purchase invoices are processed overnight by a batch job which is scheduled to execute at midnight daily so that the payment can be made next day. Another common example is of a batch job is a discount calculation program that is manually executed by a user at the end of every month to process discounts to dealers.
Example of monitoring batch jobs in ERP as shown in Fig 2.10.1.
Downloaded from : taxupindia.com
main source : ICAI
AUDITING IN AN ERP ENVIRONMENT
34 ADVANCED INFORMATION TECHNOLOGY
Fig 2.10.1: Batch jobs in ERP
Real-time processing: in a real-time processing system, transactions are initiated, processed and recorded immediately as and when they occur, without delay.
For example, when a sales invoice is created in a ERP, the corresponding accounting entries are automatically posted to the respective sub-ledgers and general ledgers at the same time account balances are updated immediately.
Data Backups: backup involves making periodic copies of existing data and applications to an alternate storage media which can be useful for recovery in the event of data loss or corruption of data. The content, frequency, storage, retention and restoration of backups depend on the nature of business and criticality of data.
For example, the data in a ERP system of a cement manufacturing company is copied every day to an external drive. Once a week an additional copy of the data is copied to a tape and stored in a remote branch office in a fire proof safe. On the other hand, the data of a financial services company may be copied to an external system in real-time using database mirroring and replication techniques i.e., two copies of the same database are maintained at different locations and every transaction is automatically copied on to both the databases to ensure high availability of systems. Example of backup schedule in ERP.
Green tick indicates job completed successfully
Red indicates job failure

Downloaded from : taxupindia.com
main source : ICAI
GENERAL INFORMATION TECHNOLOGY CONTROLS
ADVANCED INFORMATION TECHNOLOGY 35
Fig 2.10.2: Backup Data in ERP
Configuration indicates daily full backup, except Sunday

Downloaded from : taxupindia.com
main source : ICAI
AUDITING IN AN ERP ENVIRONMENT
36 ADVANCED INFORMATION TECHNOLOGY
Example of backup log, return code RC 0000 indicates successful completion of backup, RC 0005 and 0003 indicate error in backup.
Fig 2.10.3: Backup & return Code
Interfaces between systems: data flows between two or more IT systems is known as an interface. The flow of data could be real-time, scheduled using batch jobs or manual. In case a company is using only a single ERP system, interfaces may not be relevant.
For example, consider a software services company that has in-house application for Projects, PeopleSoft for HR & Payroll and Oracle EBS for accounting and financial reporting. At month end, invoicing is done in Oracle EBS based on the project status and rates obtained from the Projects application, staff information and timesheets from PeopleSoft. The data flow between the three systems happens through interfaces. On the other hand, consider a mid-sized manufacturing company using an Oracle EBS application for all business transactions. In this example, there are no interfaces because there is only one system.
Recovery from Failures: In the event of failures that impacts the availability of IT systems the company should be able to cope with and recover from the system failures. A business continuity plan is a document that details the risks, business impact analysis and other procedures to help a company in going on with business transactions when failures occur. Disaster recovery plan, which is a part of the larger business continuity plan, focuses on the procedures for restoring the IT systems back to normal state after the failure.
For example, a telecom company installs multiple backup power systems including diesel generators at tower sites to keep the network operational in the event of power outages. Core banking systems, railway/airline ticketing systems, e-commerce portals, etc., have an operational secondary data center located at a remote site that would allow the bank to continue operations in the event of failure of the primary data center.
IT Helpdesk: a helpdesk is a facility to address and resolve user requests including queries, incidents and problems related to IT systems and applications. Typically, all requests are logged and monitored to minimize disruption to business.
For example, a mid-sized consumer retail company with several outlets across a city has a central IT helpdesk to resolve user requests. All requests are recorded in an online intranet portal and there is also a toll-free number which users can make use of to log service requests. Requests have to be resolved in a timely manner based on the priority and severity recorded and governed by service level agreements between IT department and business.

Downloaded from : taxupindia.com
main source : ICAI
GENERAL INFORMATION TECHNOLOGY CONTROLS
ADVANCED INFORMATION TECHNOLOGY 37
The activities in this domain are mainly to ensure that IT systems are available for carrying on business transactions and to detect and correct disruptions to IT systems and applications. All activities in computer operations may not be relevant to an audit of financial statements being operational in nature.
For example, service level agreements are put in place to ensure that systems are available for users to process transactions, similarly a IT helpdesk provides support to users so they can continue using systems for transactions. While the service level agreements and helpdesk are important activities for ensuring availability of systems for business, there is no direct impact on the financial transactions and reporting aspects.
However, activities viz., batch jobs, interfaces and backups could directly impact the integrity of financial transactions and data and hence considered relevant for audit.
The table below has examples of risk and controls that an auditor may consider when reviewing computer operations.
Ref No.
Activity Risk Control description
1 Batch scheduling and processing
Unauthorized changes are made to batch jobs.
Additions, changes and deletion to job schedules are documented and authorized.
2 Batch scheduling and processing
Failures in execution of batch job.
All batch jobs are monitored for successful completion. Any errors and incomplete jobs are identified and rectified in a timely manner.
3 Real-time processing
Unauthorised changes are made to the configuration of real-time components.
There exists a consistent procedure for making changes to the configuration of real-time processing components (including middleware, where applicable).
4 Backup and Recovery
Loss of critical data due to data corruption system failures.
Formal backup policy exists, is implemented and duly monitored for compliance.
5 Backup and Recovery
Loss of critical data due to fire and theft
On site and Off-site backups are maintained securely.
6 Backup and Recovery
Backup is incomplete or corruption of backup media
Back up recovery is periodically tested to ensure that it works when required.
7 Interfaces between systems
Data transfer between systems is incomplete or inaccurate
Plans for the business continuity is kept up to date and tested.
8 Disaster recovery Data recovery plan is obsolete
Disaster recovery plans are updated once a year and tested two times a year.
Table 5

Downloaded from : taxupindia.com
main source : ICAI
AUDITING IN AN ERP ENVIRONMENT
38 ADVANCED INFORMATION TECHNOLOGY
2.11 Procedures for Review of Application System Acquisition, Development and Maintenance
The application system acquisition, development and maintenance, also called program development, is one of the categories or domain of General IT Controls that involves the understanding and evaluating the process, risks and controls that are relevant to a company when major changes occur in the IT environment. For example,
New IT systems and applications are acquired and implemented in the company
Existing IT systems are migrated to a different system
Major changes occur in IT applications or infrastructure
The objective of application system acquisition, development and maintenance is “To ensure that systems are developed, configured and implemented to meet financial reporting objectives”. The various activities in this domain include the following
Project Planning
Analysis & Design
Data Conversion/Development
Testing
Go-Live Decision
Documentation & Training
In activities mentioned above represent the System Development Life Cycle (SDLC) in software development terminology which is one of the most common method that is followed for development and implementation of new systems and applications including ERP systems.
The auditor should consider this domain of General IT Controls to be relevant for audit only when major changes occur in the IT environment that impact the financial reporting. For example, if a company is implementing a new ERP system to automate the business process of sales, purchase, inventory, payroll and general ledger, the auditor should consider reviewing process and controls in this domain because this change impacts the financial reporting. On the other hand, if a company is implementing a new customer relationship management (CRM) system for improving marketing and customer service, the auditor may not consider reviewing this implementation because there is no impact on financial reporting.
The audit approach, methods and review procedures that and auditor should consider have been provided in more detail in the chapter on “New System and Data Migration Review”
2.12 Concluding on Impact of Deficiencies in GITCS on Audit During a review of General IT Controls, deficiencies in design and operating effectiveness may be observed. Examples of deficiencies in GITCs include:
(a) password controls are not enabled

Downloaded from : taxupindia.com
main source : ICAI
GENERAL INFORMATION TECHNOLOGY CONTROLS
ADVANCED INFORMATION TECHNOLOGY 39
(b) a formal sign-off for user acceptance testing has not been obtained for program changes
(c) errors and batch jobs have not been resolved
(d) privileged user access has been granted to unauthorised users
(e) direct-data changes have been made in database without approvals
(f) audit logs have not been enabled
Having found deficiencies, the auditor should evaluate the impact of these deficiencies on the audit. For this evaluation, the auditor should consider the following:
which automated controls, IT dependent controls and reports/IPE will be impacted
are there compensating controls that mitigate the risk, can we test the compensating controls. For example, are there manual checks and controls that mitigate risk of material misstatement.
is there evidence that deficiency was not exploited. For example, even though privileged user access was granted to unauthorised users, have the users used this level of access (it is possible the users may not be even aware they had the access)
consider data analytics using CAATs to verify the integrity of account balances. For example, the auditor can extract transaction data from the ERP system and use ACL to independently reconcile sub-ledger with general ledger balance.
determine the aggregate financial impact of the deficiencies and compare with materiality.
The above examples are some of the ways in which the auditor evaluates the deficiencies to assess impact on audit. Wherever necessary, the auditor should consider revising the planned audit response by altering the nature, timing and extent of audit procedures, including controls testing and substantive testing, to address the risk of material misstatement in financial statements. For example, the auditor may increase the sample sizes for controls testing or test reports and IPE substantively.
Evaluation and assessment of deficiencies requires the auditor to apply professional judgement and the auditor is required, as per SA 230, to explicitly document the process of evaluation, factors considered, additional audit evidence obtained and conclusions reached to support the audit opinion.
2.13 When to Test GITCS Understanding of the ERP environment is obtained during the planning phase of an audit of financial statements. The timing for testing General IT Controls in an ERP environment will vary depending on several factors including the following:
Effectiveness of the Entity Level Controls
Understanding of Business process and controls
Level of automation in business process
Dependencies on IT i.e., IPE/Reports, IT Dependent controls
Risk assessment, including IT risks
IT systems and application in scope

Downloaded from : taxupindia.com
main source : ICAI
AUDITING IN AN ERP ENVIRONMENT
40 ADVANCED INFORMATION TECHNOLOGY
Outsourced IT activities
Deficiencies observed in past audits
New systems and changes in existing IT environment
The above are some of the factors that the auditor should consider in determining the timing of General IT Controls. In a typical ERP environment, it is more likely that the testing for GITCs is performed early in the audit process, close to the planning stage, because of the dependencies that other audit work, including controls and substantive testing, have on effectiveness of GITCs.
In deciding the timing for GITCs tests, the auditor should also factor the possibility of finding deficiencies and the time required for remediation and re-testing GITCs. In other words, if the GITCs are tested during the planning phase of audit, there will be sufficient time to rectify any exceptions and deficiencies and re-test or plan alternate audit procedures prior to balance sheet date. On the other hand, if the GITCs are tested closer to year-end, there may not be sufficient time to rectify deficiencies or carry out alternate audit procedures.
2.14 Exercises
Multiple Choice Questions
1. What are data flows between multiple IT systems also known as,
(a) Batch jobs
(b) Interfaces
(c) Databases
(d) Operating systems
2. Which of the following activity from the Data center and network operations domain of GITCs is less likely to have an impact on audit,
(a) Service Level Agreements
(b) Data backups
(c) Real-time processing
(d) All of the above
3 What is the risk due to default passwords,
(a) They are easy to guess
(b) Openly know
(c) Do not comply with company’s password policy
(d) All of the above
4. Privileged users are more commonly known as,
(a) Business users

Downloaded from : taxupindia.com
main source : ICAI
GENERAL INFORMATION TECHNOLOGY CONTROLS
ADVANCED INFORMATION TECHNOLOGY 41
(b) Normal users
(c) Super users
(d) End users
5. Segregation of duties is applicable to which layer of access security,
(a) Application security
(b) Database security
(c) Network security
(d) All of the above
Fill in the blanks
6. With respect to samples selected for testing, the auditor is required to document _________ for sample size and how the auditor ensured ______
7. The software methodology used for carrying out program development and program changes is known as _____________
8. Deficiencies in GITCs will impact the ________ of automated controls, IT-dependent controls and IPEs
9. ____________ is considered high risk because it bypasses the application controls and could compromise data integrity.
10. A _________ contains procedures for restoring the IT systems back to normal state after a failure.
True or False
11. The auditor should review GITCs for all IT systems and applications used at a company (True/False)
12. Developers and programmers should not be given access to production environment (True/False)
13. It is more efficient to test GITCs at year-end (True/False)
14. Batch jobs should be monitored for failures so that corrective action can be taken (True/False)
15. Environmental controls are applicable to all layers of access security (True/False)
2.15 Case study Access Ltd. is using an ERP which has Sales, Purchase, Inventory and GL modules. The ERP has standard reports for P&L account, Balance Sheet, Cash Flow statement. However, the Finance Controller wanted three new reports with a different presentation and format which were created and implemented during the year under audit.
You have been a member of the audit team for the last three years. For the current year, in the initial meetings with the client, you are informed that the company has developed these three new reports. From the audit of the previous years you are aware that the General IT Controls at the company are effective.

Downloaded from : taxupindia.com
main source : ICAI
AUDITING IN AN ERP ENVIRONMENT
42 ADVANCED INFORMATION TECHNOLOGY
You have started the GITCs review for the current year. Your task is to,
(a) Identify which domains of GITCs will be applicable
(b) Document three risks and relevant controls you plan to test to validate whether the reports have been prepared in a controlled manner.
2.16 Glossary
ACL Audit Command Language (CAAT Tool)AIX Unix Operating System for IBM serversBCP Business Continuity PlanCAATs Computer Assisted Audit TechniquesCR Change Request CRM Customer Relationship Management (application software)DB Data Base DMZ De-Militarized Zone DR Disaster Recovery ELC Entity Level Controls ERP Enterprise Resource Planning (application software)GITC General Information Technology ControlsHOD Head of Department HP-UX Unix Operating System for HP serversHR Human Resource IPE Information Produced by Entity (reports, etc)IT Information TechnologyLAN Local Area Network Oracle EBS Enterprise Business Suite, ERP application software provided by Oracle CorporationOS Operating System RHEL Red Hat Enterprise Linux, a type of Linux Operating System SA Standards on AuditingSA/SOD Sensitive Access / Segregation of DutiesSAP Systems, Applications and Products in data processing, ERP application software SDLC System Development Life Cycle, a software development methodology SQL Structured Query Language, high-level software language for database systems SuSE A type of Linux Operating SystemUAT User Acceptance TestingVPN Virtual Private NetworkWAN Wide Area Network

Downloaded from : taxupindia.com
main source : ICAI
GENERAL INFORMATION TECHNOLOGY CONTROLS
ADVANCED INFORMATION TECHNOLOGY 43
2.17 References and Further Reading 1. Standards on Auditing published by the Institute of Chartered Accountants of India (ICAI), www.icai.org >
Resources
2. Guidance Note on Audit of Internal Financial Controls Over Financial Reporting issued by Auditing and Assurance Standards Board. - (14-09-2015), www.icai.org
3. Companies Act 2013, www.mca.gov.in/Ministry/pdf/CompaniesAct2013.pdf
2.18 Answers to Excises 1. Correct answer is B
Interfaces are data flows between two or more systems in an IT environment
2. Correct answer is A
Service level agreements are operational controls put in place to ensure availability and quality of IT services and hence less likely to impact the financial reporting aspects.
Backups and Real-time processing are more likely to be relevant because there is a risk of data loss and data corruption due to system failures.
3. Correct answer is D
All three risks mentioned are relevant.
4. Correct answer is C
Privileged users are also known as super users or administrators and have unrestricted access to systems.
Business users, normal users and end users refer to the same type of users who have restricted access to systems.
5. Correct answer is D
Segregation of Duties is pervasive and applicable to all layers of access security
6. Justification, Completeness of population
7. Systems Development Life Cycle or SDLC
8. Reliability
9. Direct data access
10. Disaster Recovery Plan or DR Plan
11. False
The auditor is required to review GITCs for relevant IT systems that impact financial reporting objectives.
12. True
Developers and programmer access should be restricted to development environment and test environment

Downloaded from : taxupindia.com
main source : ICAI
AUDITING IN AN ERP ENVIRONMENT
44 ADVANCED INFORMATION TECHNOLOGY
13. False
Timing for a review of GITCs depends on several factors and could vary based on the outcome of these factors. However, in an ERP environment testing for GITCs is normally performed early in the audit process, close to the planning stage, because other audit work depends on the effectiveness of GITCs.
14. True
Errors or failures in Batch jobs could impact the completeness and accuracy of financial transactions and hence batch jobs should be monitored, any errors and failures should be rectified in a timely manner.
15. False
Environmental controls are applicable to the physical security layer of access security.
2.19 Answer to Case Study (a) The GITC domains that will be applicable are Program Changes and Access Security.
(b) Relevant risks and controls are as follows:
Ref No. Activity Risk Control description
1 Change Request
Unauthorised changes are processed
The change request is approved by the department In-charge or Head of department (HOD). Changes to IT infrastructure components are approved by IT Head.
2 Testing Untested changes could compromise the integrity of financial data
Unit testing is performed by developer, user acceptance testing is done by end user prior to implementing in production environment.
3 Segregation of duties
Changes are made directly in production environment and may result in loss of data and program integrity.
Three separate environments exist for development, quality (test) and production. Separate teams are involved in development and migration of changes to production. Development of changes are done by consultants and movement of changes to production is performed by System Administration only after approval.
4 Implementation Changes are implemented by unauthorised persons.
Access to migrate changes to production is restricted to System Administrators only.

Downloaded from : taxupindia.com
main source : ICAI
AUTOMATED APPLICATION CONTROLS
3.1 Overview Clause (i) of Sub-section 3 of Section 143 of the Companies Act 2013, requires the auditors’ report to state whether the company has adequate internal financial controls system in place and the operating effectiveness of such controls.
In June 2003, the Securities and Exchange Commission (SEC) of the United States of America adopted Rules for the implementation of Sarbanes – Oxley Act, 2002 (SOX) that required certification of the Internal Controls over Financial Reporting (ICFR) by the management and by the auditors.
There are other regulatory requirements such as J-Sox etc. where auditors are required to certify the adequacy of internal controls as implemented by Management.
Thus, the auditors are required to express an opinion on the effectiveness of an company’s internal controls over financial reporting and such opinion is in addition to and distinct from the opinion expressed by the auditor on the financial statements.
As mentioned in the Introduction Chapter, SA 315 talks about identifying the risk of material misstatement through understanding of the Company and its environment. The company implements an internal control framework to minimise the risk. The auditor shall understand the internal controls within the company. While understanding the internal controls, the auditor will understand the types in internal controls as implemented by the company. Internal controls are implemented by a company irrespective of whether they have implemented an ERP or not. In this session, we shall try to understand the implementation of internal controls in an ERP environment.
LEARNING OBJECTIVES
To understand what are Automated Application Controls
To understand the types of Automated Application Controls
To understand the Various Business Cycles, Obtain Process Understanding and Identification of Controls
To understand the procedures for review of Design Effectiveness and Operating Effectiveness of Application Controls
To understand when to test Automated Application Controls
To understand what sample size to follow for testing Automated Application Controls
To analyse and conclude on impact of deficiencies in Automated Application Controls on audit
CHAPTER
3

Downloaded from : taxupindia.com
main source : ICAI
AUDITING IN AN ERP ENVIRONMENT
46 ADVANCED INFORMATION TECHNOLOGY
Some reasons why ERP’s are implemented by companies are:
To move from manual processes to automated processes and achieve better operational efficiencies
To achieve ease of reporting due to high level of sophistication of the reports defined in ERP’s
To have a better internal control environment as ERP’s allow for processes and controls to be automated
To respond faster to competition and the outside business environment.
While there are advantages and efficiencies that can be gained by automation, there is also a heightened risk of processes and controls being compromised within the ERP. Hence, it is important for the company to implement controls within the ERP. Such controls are called as Automated Application Controls (AACs). These controls are implemented over the processing of transactions and data within the application. They are specific to each application. Hence, they are called AACs. In this chapter, we shall understand the AACs and get to know some examples.
The Guidance Note on Internal Financial Controls over Financial Reporting defines “Application controls as those controls that achieve the business objectives of timely, accurate and reliable information.” The application controls that are automated within the ERP are called AACs.
The Committee of the Sponsoring Organisations of the Treadway Commission (COSO) defines controls activities “as the policies and procedures that help management objectives are carried out.” Thus, AACs are those policies, procedures and activities designed to provide reasonable assurance that objectives relevant to a given automated solution are achieved.
Another explanation is AACs are controls that prevents applications from executing unauthorised transactions in a manner that puts data at risk.
The objectives of AACs are to ensure
completeness of data
accuracy of data
the validity of the transactions
only authorised transactions are processed
appropriate segregation of duties.
This is also mentioned in IG 7.5 in The Guidance Note on Internal Financial Controls over Financial Reporting
Some of the risks that are addressed by such AAC’s are:
Risk of unauthorised personnel entering the data
Risk of personnel entering unauthorised data
Risk of inaccurate processing of data
Risk of unauthorised changes / modifications to data
Risk of data being obtained by unauthorised personnel

Downloaded from : taxupindia.com
main source : ICAI
AUTOMATED APPLICATION CONTROLS
ADVANCED INFORMATION TECHNOLOGY 47
3.2 Types of Automated Application Controls Some of the different types of Automated Application Controls to address the above mentioned risks are:
1. Inherent controls – These controls come along with the implemented ERP. These can also be called Input controls. These are some basic controls such as
(i) Debit = Credit. All transactions should match
(ii) Validation checks - Fields where numbers are entered, will not accept alpha numeric or alphabets etc.
Error message while entering account number which is not defined in chart of accounts:
Fig 3.2.1: Error message
(iii) Duplicate check – When a system prevents an invoice number to be entered twice etc.
2. Embedded Calculations – These are controls that also come along with the implemented ERP. These can also be called Processing controls. These are combined with Configurable controls For example:
(i) Depreciation calculation – The depreciation is calculated automatically by the system. This process of calculation is embedded within the ERP. However, the percentage of depreciation has to be defined for each class of asset. This is a configurable control.
Sample depreciation configuration in Asset master:
Error message shown by system.

Downloaded from : taxupindia.com
main source : ICAI
AUDITING IN AN ERP ENVIRONMENT
48 ADVANCED INFORMATION TECHNOLOGY
Fig 3.2.2: Sample depreciation configuration in Asset master
(ii) Discount calculation - Where discounts are provided to customers based on sales value/volume
(a) Discount calculation is an embedded calculation
(b) Discount percentage is a configurable control
3. Configurable controls – These controls are implemented by the Company at the time of installing the ERP. These can also be called Processing controls. These will be implemented as per the process followed by the company.
For example:
(i) 3 way match – The relevant fields within the Purchase Order (PO), Goods Received Note (GRN) and Invoice should match.

Downloaded from : taxupindia.com
main source : ICAI
AUTOMATED APPLICATION CONTROLS
ADVANCED INFORMATION TECHNOLOGY 49
3 way match configuration in ERP
Price Variance between Purchase order and Invoice
Quantity Variance between Goods Receipt and Invoice
Fig 3.2.3 Configuration of Tolerances
(ii) The PO raised by a Purchase Executive is approved by the Purchase Manager
(iii) At the time of raising a Sales invoice, relevant Debtors and Debtors Control account is debited and Sales account is credited.
(iv) Inventory valuation as defined by the Company – FIFO or Weighted Average etc.
Sample configuration for raw material valuation:
Fig 3.2.4: Configuration of Inventory
Configuration of Tolerances for price and quantity variances.
Configuration of Inventory valuation for raw materials

Downloaded from : taxupindia.com
main source : ICAI
AUDITING IN AN ERP ENVIRONMENT
50 ADVANCED INFORMATION TECHNOLOGY
(v) Tolerance percentage as applied by the Company in terms of discount given at the time of raising sales invoice etc.
(vi) Journals are approved based on limits set per person
4. Access / Security controls – Users are provided access to the systems based on their roles and responsibilities and job profiles. These can be called as Sensitive Access and Segregation of Duties. For example
(i) Data entry operator, Purchase Executive, Finance Manager, Sales Manager, CFO etc.
5. Automated Account Posting – Accounting entries are automatically posted in the ERP based on the business operation performed. For example
(i) Goods receipt /Issue in an ERP.
1. The operation of goods receipt triggers an automatic entry in the system:
ACCOUNT CODE PARTCULARS DEBIT CREDIT
300000 Stock Account XXXXX
191100 To Goods Receipt account XXXXX
301100 To Freight Clearing account XXXXX
ACCOUNT CODE PARTCULARS DEBIT CREDIT
301100 Goods Receipt account XXXXX
V11001 To Vendor account XXXXX
Configuration of inventory accounts to be posted automatically during goods receipt posting:
Fig 3.2.5: Configuration of Inventory GL accounts
Inventory GL accounts configured for auto posting during goods receipt

Downloaded from : taxupindia.com
main source : ICAI
AUTOMATED APPLICATION CONTROLS
ADVANCED INFORMATION TECHNOLOGY 51
Configuration of GR/IR Clearing account to be posted automatically during goods receipt posting:
Fig 3.2.6: Configuration of GR/ IR Clearing GL accounts
3.3 Process of identification of Automated Application Controls To the extent that it is relevant to an audit of financial statements, auditors are required to understand, assess and respond to such risks that arise from the use of IT systems [Ref. SA 315 (Revised) – Identifying and assessing the risks of material misstatement through understanding the entity and its environment]. Understanding the entity and its automated environment involves understanding how IT department is organised, IT activities, the IT dependencies, relevant risks and implemented controls.
The understanding of a company’s IT environment that is obtained should be documented [Ref. SA 230 – Audit Documentation] using any standard format or template. This is very important to be performed in the first year of the audit of the company. Once this understanding is obtained and documented, the auditor should update the relevant information in the subsequent years of audit. Any changes will have an impact on the audit strategy to be adopted. This will also impact the locations from which the audit has to be conducted.
In the Introduction Chapter, we have seen a table that captures all the IT systems used by the company. Combining that table with the flow as given in the below diagram should help any an auditor to plan his audit procedures in an ERP environment.
The auditor needs to map how each of the IT systems captured in the table contribute to the significant accounts and disclosures.
The relevant business processes should be mapped to the IT systems.
GR/IR Clearing GL accounts configured for
auto posting during goods receipt

Downloaded from : taxupindia.com
main source : ICAI
AUDITING IN AN ERP ENVIRONMENT
52 ADVANCED INFORMATION TECHNOLOGY
Fig 3.3.1: Process of identification of Automated Application Controls
For example:
IT system Significant Accounts
and Disclosures Major Business
Processes / Cycles
Relevant for financial reporting
Y/N
Automated Controls configured within
the system/Application
Y/N
SAP Sales, Debtors,
Purchases, Creditors, Closing Stock etc.
Sales/ Debtors - Revenue and Receivables
Purchases/Creditors – Purchase Payables
Process Stock – Inventory
Process
Y Y
Pay Master
Salaries, Loans and Advances to
Employees, Leave balances
HR and Payroll process Y Y
Interface between
Paymaster and SAP
Salaries, Loans and Advances to
Employees, Leave balances
HR and Payroll process and Period End Closing
process Y Y

Downloaded from : taxupindia.com
main source : ICAI
AUTOMATED APPLICATION CONTROLS
ADVANCED INFORMATION TECHNOLOGY 53
Once the auditor maps the relevant IT systems to Business processes and to the significant accounts and disclosures, the next step is to gain an understanding of how the business processes function and the controls within these processes. The controls can be manual, automated, IT dependent manual controls. For the purpose of this session, we shall focus only on AACs.
The auditor via an enquiry process gets an understanding of the various business processes. The understanding of the process flows and the controls within the processes can be documented in either of the 2 ways:
1. Process Flow Diagrams
2. Process Narratives
Process Flow Diagrams:
The Guidance Note on Internal Financial Controls over Financial Reporting refers to Process flow diagrams as a helpful form of documentation for auditors to depict the process to initiate, authorise, process, record and report transactions.
Insertion of risks of material misstatement.
o The auditor may insert symbols for risk of material misstatement at the point(s) in the process flow where the risk is present. It is possible that, due to the nature of the risk of material misstatement, it may appear at multiple points in the process flow diagram.
o The auditor may use different symbols for significant and normal risk of material misstatement as necessary.
Attaching control activity symbols
o Symbols may be placed for control activity that address risks of material misstatement on the diagram.
o Automated and manual control symbols may be used as necessary
Identification of applications in the process flow diagram
o If a task relies on an application system when performing an action, the auditor may use a symbol for such applications on the diagram
o If formatting and space allows, the auditor may attach the application symbol directly on the task which it relates
Associating the IPE symbol where appropriate
o If IPE is used in the execution of a control activity or IPE that is produced as part of the process that is important to the audit (e.g., IPE that an auditor uses in his or her substantive procedures), the auditor may attach a separate symbol for the IPE as a document symbol.
An example of a Depreciation Run Process Flow diagram is available in Fig 3.3.2:

Downloaded from : taxupindia.com
main source : ICAI
AUDITING IN AN ERP ENVIRONMENT
54 ADVANCED INFORMATION TECHNOLOGY
Fig 3.3.2: Depreciation Run Process Flow diagram
FA 01 A - Automated control to run depreciation procedure.
Process Narrative:
Another form of documentation as mentioned in the Guidance Note can also be a Process Narrative to capture the process Understanding and controls within the respective Business Process. While documenting the Narrative the following points may be kept in mind:
Who is involved in the process (e.g., departments, roles, and people)?
Are there segregations of duties that are relevant to the process?
What is the general objective of the processes and what are the related sub processes?
When does the process occur?
Does the process involve, or impact, multiple locations?-
What are the tasks within the process and in what sequence do they occur?
What are the points in the process at which a misstatement, including a misstatement due to fraud could arise?
Start
Depreciation is calculated as per the compliance of Schedule-II, the calculation is
automated in ERP.
After finalization of additions and deletions in every quarter, the depreciation is run month –
wise in ERP.
The authorization in ERP to run depreciation is given to Manager –Accounts
Stop
Start
Depreciation is calculated as per the compliance of Schedule-II, the calculation
is automated in ERP.
After finalization of additions and deletions in every quarter, the depreciation is run
month – wise in ERP. FA01- A
The authorization in ERP to run depreciation is given to Manager
– Accounts
Stop

Downloaded from : taxupindia.com
main source : ICAI
AUTOMATED APPLICATION CONTROLS
ADVANCED INFORMATION TECHNOLOGY 55
What control activities address the risks?
What IPE is involved?
How are application systems involved within the process?
For example: Process Narrative for Depreciation Run Procedure:
The Finance Team is in charge of the depreciation run in the ERP. This is run centrally for all locations.
Depreciation is calculated as per Schedule-II and the depreciation calculation is automated in the ERP.
The finalization of additions and deletions are done every quarter.
The depreciation is run month wise in the ERP via path: Transactions - Assets – Depreciation Run.
Depreciation in the ERP can be run only on a monthly basis. The authorization in the ERP to run depreciation is given to Manager–Accounts.
Control FA 01- A = Automated
Manager-Accounts runs the depreciation after all the additions and deletions are updated by accounts team. Depreciation is automatically computed by ERP based on the asset lives entered in Asset Master.
Accounting Entries
ACCOUNT CODE PARTCULARS DEBIT CREDIT
XXXXX Depreciation on Asset Account XXXXX
XXXXX To Accumulated Depreciation Account XXXXX
Risk and Control Matrix
Process Sub
Process Control Ref
No. Risk
DescriptionControl
DescriptionFSA
Frequency of Control
Manual/ Automated
Preventive/Detective
System, IPE
Fixed Assets
Depreciation FA-01
Depreciation calculation
may be incorrect
Manager-Accounts runs the
depreciation after all the additions
and deletions are updated by accounts
team. Depreciation
is automatically computed by ERP based on the asset lives entered
in Asset Master.
Accuracy Monthly Automated Preventive ERP

Downloaded from : taxupindia.com
main source : ICAI
AUDITING IN AN ERP ENVIRONMENT
56 ADVANCED INFORMATION TECHNOLOGY
3.4 Procedures to review Design Effectiveness and Operating Effectiveness of Controls
The Process Narratives and Process Flow Diagrams are useful tools to document the processes followed by the Company and identify the AACs. Once the AACs are identified they have to be evaluated for Design Effectiveness. If the Design of the control is found to be effective, they have to be then tested for Operating Effectiveness.
Evaluation of Design of an AAC:
One commonly preferred method for testing Design effectiveness is a Walkthrough of the control. In a walkthrough, the auditor will track a transaction from start to end i.e. from the initiation of the transaction to the point where it is finally reported in the Financial Statements. This is very important in the first year of audits. In the subsequent years, we may update our understanding for the year based on previous years’ work.
For example: For Fixed Assets cycle the process of walkthrough may be as given below as shown in Fig 3.4.1. At certain stages of the cycle, there are entries that impact the financial statements.
Fig 3.4.1: Fixed Assets cycle the process
Management of the company is responsible for the design of the internal control. The auditor will have to evaluate this design and assess whether the control along with other controls put in place perform the function of preventing or detecting and correcting material misstatements in a timely manner. It the control is not properly designed, the risk is that it may not be able to prevent or detect errors or frauds.
Controls need to be evaluated at entity level too. Entity Level Controls are implemented to monitor the controls at the department level etc. These controls need to be designed properly by the Company and evaluated by the auditor.
Walkthrough Procedure:
The auditor will have to adopt a combination of Inquiry, Observation and Inspection while evaluating the design of a control via Walkthrough process

Downloaded from : taxupindia.com
main source : ICAI
AUTOMATED APPLICATION CONTROLS
ADVANCED INFORMATION TECHNOLOGY 57
o Inquiry should be made of relevant or appropriate personnel performing the control. Probing and open ended questions to be asked of the personnel.
o Observation of the relevant procedures performed by the personnel
o Inspection of relevant supporting documents etc. for the control to be performed.
o Re-performance if necessary
While testing the design of the AAC, the auditor should understand whether the logic of the control has been clearly defined in the system. The auditor will have to check the configuration in the system and understand whether it satisfies the control objective.
Screenshot of DEPRECIATION CALC. CONFIG
Fig 3.4.2: DEPRECIATION CALC. CONFIG

Downloaded from : taxupindia.com
main source : ICAI
AUDITING IN AN ERP ENVIRONMENT
58 ADVANCED INFORMATION TECHNOLOGY
Walkthrough of the Depreciation control:
Fig 3.4.3 Yearly Depreciation

Downloaded from : taxupindia.com
main source : ICAI
AUTOMATED APPLICATION CONTROLS
ADVANCED INFORMATION TECHNOLOGY 59
DEPN1
Fig 3.4.4 Period Depreciation

Downloaded from : taxupindia.com
main source : ICAI
AUDITING IN AN ERP ENVIRONMENT
60 ADVANCED INFORMATION TECHNOLOGY
DEPN 2
Control Walkthrough Procedure Results Exceptions Y/N
The system automatically calculates the depreciation as per the rates defined in the system.
1. From the Asset Register select one asset that was created during the year.
2. Note the Depreciation percentage as given for the asset from the Asset register.
3. For that asset reperform the calculation of depreciation.
4. Reconcile the depreciation amount with the amount automatically calculated by the system.
Obtained the Fixed Assets Register and picked up one asset no. 000000005 – Chairs. Noted that the purchase date of the asset was 31st July 2013. Noted from the configuration that the Cost = 12866.11 Less: Salvage = 643.31 Cost = 12222.80 Useful life = 60 months Depreciation = 12222.80/60= 203.71. Please refer to screenshot DEPN 2 Depreciation for 1 day = 203.71/31 = 6.57. Please refer to screenshot DEPN 2 Thus total depreciation for 2013-14 = 203.71*8 = 1629.68 Depn for 31st July = 6.58 Total Depreciation 2013 =1636.26 Please refer screenshot DEPN2
No exceptions

Downloaded from : taxupindia.com
main source : ICAI
AUTOMATED APPLICATION CONTROLS
ADVANCED INFORMATION TECHNOLOGY 61
The accounting entry is
Account code Particulars Debit Credit
XXXXX Depreciation on Asset Account 1636.26
XXXXX To Accumulated Depreciation Account 1636.26
There may be cases such as in other business cycles like Revenue cycle etc., where, there may be multiple scenarios within the cycle such as
Multiple revenue streams
Multiple modes of sales etc.
Evaluation of Operating Effectiveness of an AAC
The auditor has evaluated the design of an AAC. Before testing the operating effectiveness of AAC, one key element to consider is the effectiveness of GITC’s. As mentioned earlier, AACs are configured within the system after which the system will perform the control once it is triggered. The auditor needs to determine whether the AACs are operating as designed and whether the person operating the control has the required ability and competence to do it. The steps mentioned in the Walkthrough procedure may be used for testing the AACs.
For example: In the above example, on purchase of the Fixed Asset, at the time of creating the entry in the ERP, the company will enter details such as
Gross Amount
Date of Purchase / Installation
Depreciation % or Number of months (life) for the assets to be depreciated etc.
Once these entries are configured, the depreciation is calculated automatically by the system. Hence, it is called an AAC. To add/modify/delete any of the configurations, the company will have to follow the Change Management Procedure. The authorized persons as per Company policy can only make the change in the configurations. These 2 areas fall under the Change Management and Sensitive Access and Segregation of Duties domains of GITC.
3.5 Timing of AACs testing and Sample Size The auditor needs to plan for an appropriate time to test AACs. The factors to be considered to determine the timing to test AACs are:
The period covered under audit
Note: For example If the Revenue process is different for
Export and Domestic sales Cash and Credit sales Separate transactions are to be taken for a walkthrough of each scenario. This applies for all in scope business processes.

Downloaded from : taxupindia.com
main source : ICAI
AUDITING IN AN ERP ENVIRONMENT
62 ADVANCED INFORMATION TECHNOLOGY
Risk associated with the control at the time of risk assessment.
Based on the above factors the auditor will test the AACs. The assumptions before testing the AACs are:
GITCs are effective. This is because they assist in effective functioning of application controls including AACs
Design of the control has been evaluated and is effective.
If the GITCs are effective, then the auditor may adopt a reduced level of testing or minimal sample size. Generally, if the there are no iterations in the process and AACs then the auditor may adopt a test of one sample for testing AACs. The effectiveness of GITCs indicate that the controls operate in a similar manner throughout the period of reliance for all transactions. If there are different iterations or scenarios then the auditor will need to test each iteration/scenario while relying on the GITCs.
If there has been a change in the AAC during the audit period, then the control has to be retested after the change. Thus, at the time of planning for the audit at the beginning of the year, the auditor will have to understand from the client if there may be changes to the business processes. Accordingly, the auditor needs to plan the timing of testing AACs. The auditor should plan the timing of testing of controls after being aware that the design of the control is effective and operating for a sufficient period of time. The auditor needs to test the control for operating effectiveness at an appropriate time for the auditor to conclude that they were effective throughout the year. As per the requirements of Internal Financial Controls, the controls need to be operating as on the Balance Sheet date.
If the GITC’s are found to be ineffective, then the auditor will have to test the automated controls closer to the Balance Sheet date to support the opinion on Internal Financial controls.
3.6 Assess the Impact of Deficiencies The auditor should evaluate the identified deficiencies in controls to develop a response to risk of material misstatement as given in SA 240 “The Auditor’s Responsibilities Relating to Fraud in An Audit of Financial Statements”.
1. A deficiency in a Control will not allow the management to perform their assigned functions. This deficiency may not prevent or detect misstatements. Such deficiencies are called Design Deficiencies.
A Design deficiency is also when (a) a control necessary to meet the control objective is missing or (b) an existing control is not properly designed so that, even if the control operates as designed, the control objective would not be met.
For example
For a Fixed asset:
o The Depreciation rate has not been configured OR
o The Class of the asset has been wrongly configured
2. A deficiency in operation exists when a properly designed control does not operate as designed, or when the person performing the control does not possess the necessary authority or competence to perform the control effectively.

Downloaded from : taxupindia.com
main source : ICAI
AUTOMATED APPLICATION CONTROLS
ADVANCED INFORMATION TECHNOLOGY 63
For example
In Payroll cycle,
o the system is configured to calculate the Leave encashment balance. But the system is not calculating the leave balance correctly as they may be a problem in the logic within the system.
While evaluating the deficiencies, the auditor will have to check if there are any compensating controls either manual or automated and test them accordingly to check if the impact of the deficiencies is minimised.
If there are no compensating controls, the auditor may perform other procedures such as Data Analytics using CAATS tools to assess the impact of the deficiencies.
For example
The Company has implemented an automatic approval of all Purchase Orders. The Company has a PO approval matrix and this hierarchy has been configured in the system. However, the auditor may have found out that the company has bypassed this control and placed orders based on blanket approval of Purchase orders or no approval. Thus the auditor should
o Obtain the complete list of all Purchase orders from the system
o Using CAATS identify all PO’s approved as per the Approval Matrix document
o From the list extracted by the CAATS tool, identify all the PO’s that have blank in the “Approved by field” or persons others than the Approval matrix
o The auditor will have to seek an explanation from the client for the reasons why the approval matrix was bypassed
o The auditor will have to perform other substantive procedures to obtain comfort on the Purchase amount appearing in the financial statement.
Communication of Deficiencies
SA 265 - “Communicating Deficiencies in Internal Control to Those Charged with Governance and Management” makes it necessary for the auditor to communicate control deficiencies to the Management. Prior to issuing such report the auditor may also go through the Internal audit reports and evaluate the control deficiencies identified in the reports.
The auditor must communicate in writing in sufficient advance to provide an opportunity to the company to remediate the deficiencies before the auditor issues the report on Internal Financial controls. The auditor will have to also mention if the deficiencies were present in the prior periods of audit.
NOTE: Refer Guidance on Internal Financial Controls over Financial Reporting
The auditor has identified a design deficiency in a control. Prior to the Balance sheet date, the company has rectified the design of the control. The auditor may test the implemented change for design and operating effectiveness.

Downloaded from : taxupindia.com
main source : ICAI
AUDITING IN AN ERP ENVIRONMENT
64 ADVANCED INFORMATION TECHNOLOGY
3.7 Exercises
Multiple Choice Questions 1. Some of the objectives to be achieved by implementing AACs are:
(a) Completeness
(b) Accuracy
(c) Both a & b
(d) None of the above.
2. Some of the risks that are addressed by such AAC’s are:
(a) Risk of unauthorised personnel entering the data
(b) Risk of personnel entering unauthorised data
(c) Risk of inaccurate processing of data
(d) All of the above
3. Some of the examples of AACs are:
(a) Inherent controls
(b) Configurable controls
(c) A and B
(d) None of the above
4. Understanding the business process can be documented via
(a) Flow chart
(b) Process Narrative
(c) Risk and Control Matrix
(d) A and B
5. A control necessary to meet the control objective is missing. This is an example of
(a) Significant deficiency
(b) Operating deficiency
(c) Design deficiency
(d) None of the above
6. Who is responsible for the design of internal control
(a) Internal auditor
(b) Management
(c) Auditor
(d) None of the above

Downloaded from : taxupindia.com
main source : ICAI
AUTOMATED APPLICATION CONTROLS
ADVANCED INFORMATION TECHNOLOGY 65
Fill in the Blanks 7. Validation checks and Duplicate checks performed by an ERP are part of ________________ Controls
8. Interest Computation performed by an ERP is a component of ________________ which form part of AACs.
9. The Guidance Note on Internal Financial Controls over Financial Reporting refers to ________ as a helpful form of documentation for auditors to depict the process to initiate, authorise, process, record and report transactions.
10. ______________________ is responsible for the design of the internal control.
11. The auditor will have to adopt a combination of _______, _______ and ______ while evaluating the design of a control via Walkthrough process.
12. The 3 way match of fields of PO, GRN and Invoice is an example of a _________ control.
True or False 13. If the design of an AAC is effective and prior to testing the control for operating effectiveness, it is
necessary to test GITC
(a) True
(b) False
14. A deficiency in operation exists when a properly designed control does not operate as designed, or when the person performing the control does not possess the necessary authority or competence to perform the control effectively.
(a) True
(b) False
15. If there are multiple scenarios in a business cycle, it is not necessary to take one sample of each scenario to perform a walkthrough
(a) True
(b) False
Case Study Access Ltd uses an ERP to capture the various operations of its business. The ERP has a fixed assets module which manages the details of the fixed assets of the company. The company informs that the fixed assets purchase procedure is automated within the system. The Purchase executive creates the asset. Based on the Asset class, the depreciation percentage is automatically populated within the system. Once created, the entry is automatically forwarded to the Fixed Asset Manager who approves the entry. For the below transaction,
document the walkthrough of the automated controls,
evaluate the design of the automated controls
test the operating effectiveness of the controls
Assumption: GITCs are effective.

Downloaded from : taxupindia.com
main source : ICAI
AUDITING IN AN ERP ENVIRONMENT
66 ADVANCED INFORMATION TECHNOLOGY
Other details:
Invoice No. Access/1718/22 dated 1st April 2017. Asset No.: PM01-1718 Asset purchased: Plant & machinery Asset class: Plant & machinery Amount: Rs 1000000 (Ten lakhs) Date of Purchase: 1st April 2017
3.8 References and Other Reading Material 1. Standards on Auditing published by the Institute of Chartered Accountants of India (ICAI), www.icai.org
> Resources
2. Guidance Note on Audit of Internal Financial Controls Over Financial Reporting issued by Auditing and Assurance Standards Board. - (14-09-2015), www.icai.org
3. Companies Act 2013, www.mca.gov.in/Ministry/pdf/CompaniesAct2013.pdf
3.9 Answers to Exercise 1 Correct answer is (c) – Completeness and Accuracy are the two objectives of implementing AACs. Other
objectives are validity, segregation of duties etc.
2 Correct answer is (d) – All of the above
All the mentioned risks are addressed by AACs
3 Correct answer is (c)
Inherent, configurable, automated calculations etc. are AACs.
4 Correct answer is (d)
Flow chart and Process Narratives are 2 ways of documenting business processes
5 Correct answer is (c).
If a control is missing it is an example of Design deficiency.
6 Correct answer is (b)
Management is responsible for design of controls. Internal auditors and Auditor are responsible for testing the controls.
Fill in the Blanks
7 Inherent
8 Automated calculations.
9 Process flow diagrams.
10 Management.

Downloaded from : taxupindia.com
main source : ICAI
AUTOMATED APPLICATION CONTROLS
ADVANCED INFORMATION TECHNOLOGY 67
11 Inquiry, Observation and Inspection.
12 Configurable.
True or False
13 True. GITCs have to be effective, to have a strategy to test AACs for operating effectiveness.
14 True. Operating effectiveness deficiency exists when the control does not operate as expected or the person operating the control is not competent.
15 False. If there are different scenarios in a business process, then one transaction per scenario have to be taken for a walkthrough.
Answer to Case Study
Access Ltd.
Process : Fixed Asset
Sub - Process : Fixed Asset
Activity: Creation of Asset Master
Walkthrough Documentation
Date Performed : xx/xx/xx17
Performed By : AAAA
Client representative : BBBB
Ref
Process or
Control Activity/ Control
Walk- through Plan
Walk-through Procedure performed
Systems reports or
spread-sheets
relied on
Evidence Examined
Design Effective-
ness
Operating Effective-
ness
Gaps if any
Report to Client
a) From the ERP, obtain a list of all Fixed asset purchases made during the year 2017-18.
Activity Check whether parameters are given correctly in the ERP to extract the listing
Obtained the Fixed asset additions report for the year 2017-18 and tallied it with the amount appearing in Trial Balance.
Fixed Assets Purchases Listing
Fixed Assets Purchases Listing
None None Not Applicable
b) From the Fixed Asset Register obtain details of the Asset No to be taken for walkthrough.
Activity From the Fixed Assets register, obtain the Fixed assets details. Obtain the invoice number entered there and check if the same is given in Purchase Listing
Obtained Asset No. PM01-1718 and corresponding Invoice no. Checked whether the Invoice number is available in the Purchase Listing
Fixed Assets Purchases Listing Fixed Assets Register
1. Fixed Assets Purchases Listing 2. Fixed Assets Register 3. Invoice No. Access/1718/22 dated 1st April 2017
None None None Not Applicable

Downloaded from : taxupindia.com
main source : ICAI
AUDITING IN AN ERP ENVIRONMENT
68 ADVANCED INFORMATION TECHNOLOGY
c) Match invoice details with Fixed Assets Register
Activity Obtain hard copy of original invoice number and match the details of class of Fixed Assets Purchased with Fixed Assets Register
From Invoice Number Access/1718/22 dated 1st April 2017 understood that asset purchased was Plant and Machinery. With the help of the Purchase Executive, checked the details in the ERP with regard to the Asset. Noted that the categorisation was correct. Invoice date is 1st April 2017.
None 1. The details in the ERP 2. Invoice No. Access/1718/22
None None None Not Applicable
d) Depreciation rate is populated automatically by the ERP
Control Check in the system, the process of population of depreciation rates for the Fixed Assets category.
Noted that based on the categorisation, the depreciation rate is automatically populated. Noted in the ERP that depreciation rate is given correctly as 6.33%
ERP ERP Yes Yes None None
e) The fixed asset entry is automatically approved by the Fixed Asset Manager
Control Check in the system, the process of automatic approval by Fixed Assets Manager
For the approval of the asset, noticed the drop down list in the ERP. The list had only one name i.e., of Fixed Asset Manager, who approved the entry
ERP ERP Yes Yes None None
3.10 Glossary AAC – Automated Application Controls
SEC – Securities and Exchange Commission
SOX – Sarbanes Oxley Act 2002
ICFR – Internal Controls over Financial Reporting.
COSO – Committee of the Sponsoring Organisations of the Treadway Commission
CAPEX – Capital Expense

Downloaded from : taxupindia.com
main source : ICAI
SEGREGATION OF DUTIES AND SENSITIVE ACCESS
4.1 What is Segregation of Duties and Sensitive Access
4.1.1 Sensitive Access (SA)
Sensitive access is when a user has the ability to perform critical business activities in an ERP. In other words, business activities that carry a higher risk and could have wider impact on operations are referred to as sensitive activities and the users who have this access are said to have sensitive access. Examples of sensitive access in an ERP can include ability to
create and modify sales prices
approve purchase orders
master data
payroll information
foreign exchange rates
period open/closure function
4.1.2 Segregation of Duties (SOD)
Segregation of duties refers to the separation or distribution of job roles among employees in such a way that incompatible or conflicting job roles are assigned to different persons.
For example: preparation of a journal entry and approval of that journal are assigned to two different persons. This is because if the same person prepares and approves a journal entry, there is a risk of
(a) unauthorised journal entry being posted
(b) errors in journal entry may not be identified and corrected in a timely manner
LEARNING OBJECTIVES
To understand what is meant by segregation of duties and sensitive access
To understand about roles and profiles in an ERP environment
To understand the methods and procedures to review segregation of duties and sensitive access
To understand how to assess the impact of conclusions of GITCs on segregation of duties and sensitive access
To understand how to determine and evaluate impact of deficiencies in segregation of duties and sensitive access on overall audit
CHAPTER
4

Downloaded from : taxupindia.com
main source : ICAI
AUDITING IN AN ERP ENVIRONMENT
70 ADVANCED INFORMATION TECHNOLOGY
The concept of segregation of duties existed in business as part of the internal control procedures even before the IT systems and ERPs came into use.
For example: in a manual system of accounting and book keeping, hard copy cash vouchers are prepared by the cashier, reviewed by the accountant and authorised by the accounts manager before the transaction is posted to ledgers.
With ERPs now being used extensively, segregation of duties is being implemented and enforced through the user access controls feature of ERP.
4.1.3 User Access in ERP
One of the key feature of an ERP is the ability to control users access to relevant business functions, activities and operations within the ERP. Every person or individual who uses an ERP is called a “user” of the ERP and each such user is assigned an identification called “user id” along with a corresponding secret code called “password”. While the user id is known to all, the password is known only to the person or individual to whom the user id is assigned. The combination of user id and password makes it possible for a person to start using the ERP as shown in Fig 4.1.1.
Fig 4.1.1 Login to ERP
There are several types of users within an ERP, they are
Normal users: These users are typically regular employees who carry out day-to-day business operations and transactions using the ERP. For example, the employees who process sales orders, invoices, stores receipts & issues, processing journal entries, are known as normal users, end users or business users.
System users: These users are internally used within the ERP to perform automated operations and transactions.
For example: automatic posting of monthly accrual entries, batch operations, process period-end routines, interface with other systems and sub-systems are some operations performed using system users viz., WF-BATCH, SYSTEM
Privileged users: These are a type of super users who have very extensive or unlimited access to carry out all or several activities in an ERP environment.
Login to ERP with User Id and Password
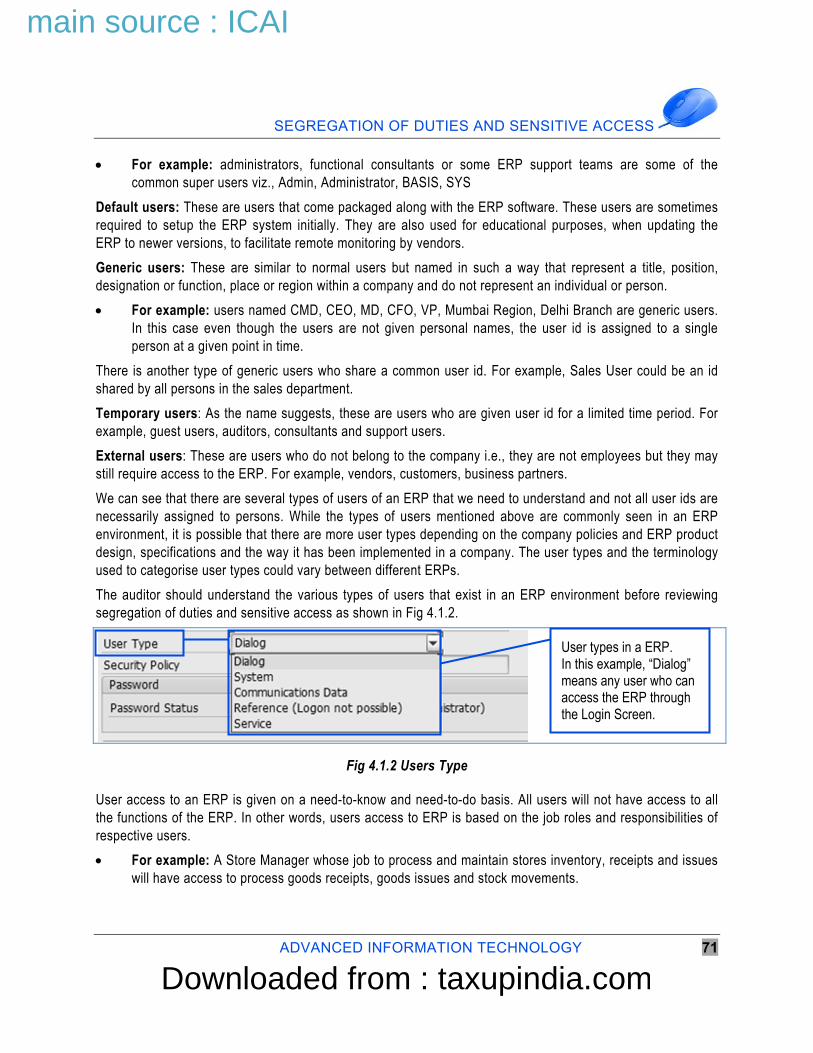
Downloaded from : taxupindia.com
main source : ICAI
SEGREGATION OF DUTIES AND SENSITIVE ACCESS
ADVANCED INFORMATION TECHNOLOGY 71
For example: administrators, functional consultants or some ERP support teams are some of the common super users viz., Admin, Administrator, BASIS, SYS
Default users: These are users that come packaged along with the ERP software. These users are sometimes required to setup the ERP system initially. They are also used for educational purposes, when updating the ERP to newer versions, to facilitate remote monitoring by vendors.
Generic users: These are similar to normal users but named in such a way that represent a title, position, designation or function, place or region within a company and do not represent an individual or person.
For example: users named CMD, CEO, MD, CFO, VP, Mumbai Region, Delhi Branch are generic users. In this case even though the users are not given personal names, the user id is assigned to a single person at a given point in time.
There is another type of generic users who share a common user id. For example, Sales User could be an id shared by all persons in the sales department.
Temporary users: As the name suggests, these are users who are given user id for a limited time period. For example, guest users, auditors, consultants and support users.
External users: These are users who do not belong to the company i.e., they are not employees but they may still require access to the ERP. For example, vendors, customers, business partners.
We can see that there are several types of users of an ERP that we need to understand and not all user ids are necessarily assigned to persons. While the types of users mentioned above are commonly seen in an ERP environment, it is possible that there are more user types depending on the company policies and ERP product design, specifications and the way it has been implemented in a company. The user types and the terminology used to categorise user types could vary between different ERPs.
The auditor should understand the various types of users that exist in an ERP environment before reviewing segregation of duties and sensitive access as shown in Fig 4.1.2.
Fig 4.1.2 Users Type
User access to an ERP is given on a need-to-know and need-to-do basis. All users will not have access to all the functions of the ERP. In other words, users access to ERP is based on the job roles and responsibilities of respective users.
For example: A Store Manager whose job to process and maintain stores inventory, receipts and issues will have access to process goods receipts, goods issues and stock movements.
User types in a ERP. In this example, “Dialog” means any user who can access the ERP through the Login Screen.

Downloaded from : taxupindia.com
main source : ICAI
AUDITING IN AN ERP ENVIRONMENT
72 ADVANCED INFORMATION TECHNOLOGY
4.2 Roles and Profiles
4.2.1 Using ERP Roles for implementing Segregation of Duties and Sensitive Access
Roles and Profiles are access control features in an ERP that enable grouping of several related access rights in to a form which is logical and easy to manage and maintain.
For example: users in a purchase department may typically need to perform activities including creation of purchase orders, change purchase orders and display or view purchase orders. Users in the department should be provided access to each of these activities individually in the ERP.
In a small ERP environment where there are 2-5 users, this may not be difficult but imagine in a larger ERP environment with 20-50 users providing access to each activity may be more time consuming and prone to errors. However, by grouping the purchase activities into a role it is much faster and easier to assign access to all users with reduced chance for error.
The relationship between ERP Roles and users is many-to-many. For example, One ERP role Purchase_Executive can be assigned to many users. On the other hand, one user Arun could be assigned more than one ERP roles.
In the example below, three purchase activities a) Create Purchase Order, b) Change Purchase Order and c) Display Purchase Order have been grouped together to create a role named Purchase_Executive. This role has been assigned to a user named Arun who works in the purchase department.
Fig 4.2.1 Roles and Profile
Roles offer an easy to understand, fast and reliable way to manage user access to an ERP. Generally, Roles are defined at the time of implementation of the ERP based on the job functions of employees. In ERP terms this feature is known as Role Based Access Control (RBAC).
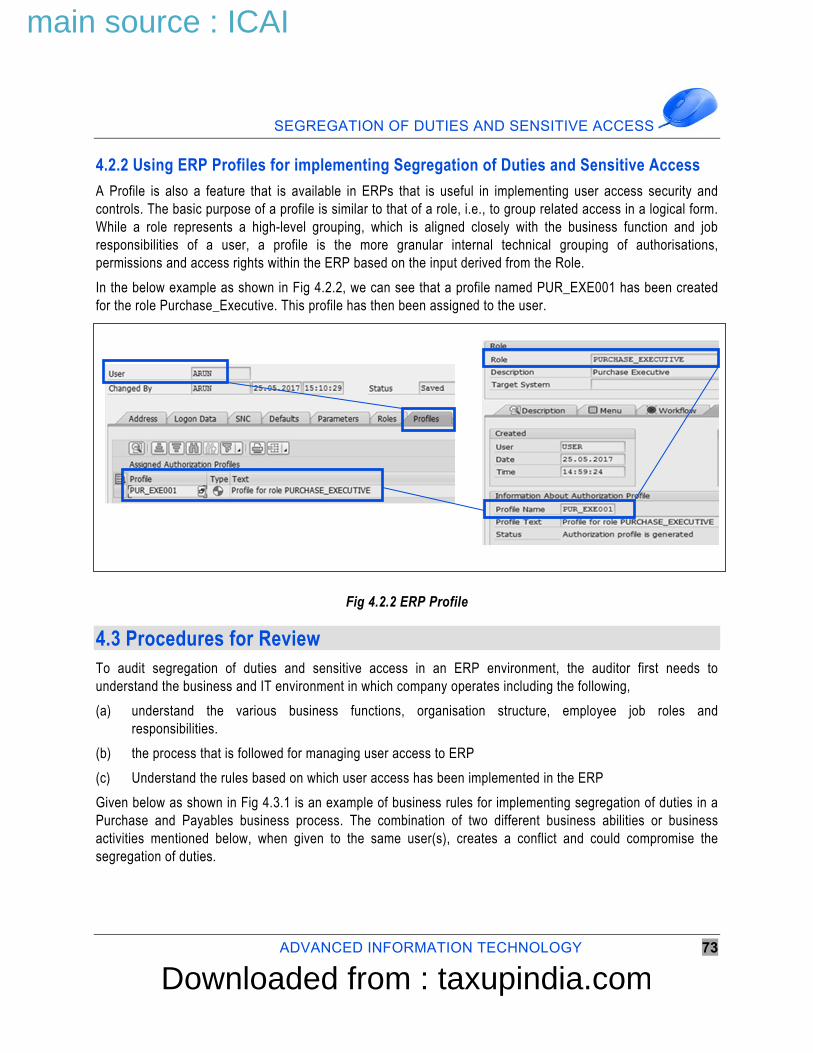
Downloaded from : taxupindia.com
main source : ICAI
SEGREGATION OF DUTIES AND SENSITIVE ACCESS
ADVANCED INFORMATION TECHNOLOGY 73
4.2.2 Using ERP Profiles for implementing Segregation of Duties and Sensitive Access
A Profile is also a feature that is available in ERPs that is useful in implementing user access security and controls. The basic purpose of a profile is similar to that of a role, i.e., to group related access in a logical form. While a role represents a high-level grouping, which is aligned closely with the business function and job responsibilities of a user, a profile is the more granular internal technical grouping of authorisations, permissions and access rights within the ERP based on the input derived from the Role.
In the below example as shown in Fig 4.2.2, we can see that a profile named PUR_EXE001 has been created for the role Purchase_Executive. This profile has then been assigned to the user.
Fig 4.2.2 ERP Profile
4.3 Procedures for Review To audit segregation of duties and sensitive access in an ERP environment, the auditor first needs to understand the business and IT environment in which company operates including the following,
(a) understand the various business functions, organisation structure, employee job roles and responsibilities.
(b) the process that is followed for managing user access to ERP
(c) Understand the rules based on which user access has been implemented in the ERP
Given below as shown in Fig 4.3.1 is an example of business rules for implementing segregation of duties in a Purchase and Payables business process. The combination of two different business abilities or business activities mentioned below, when given to the same user(s), creates a conflict and could compromise the segregation of duties.
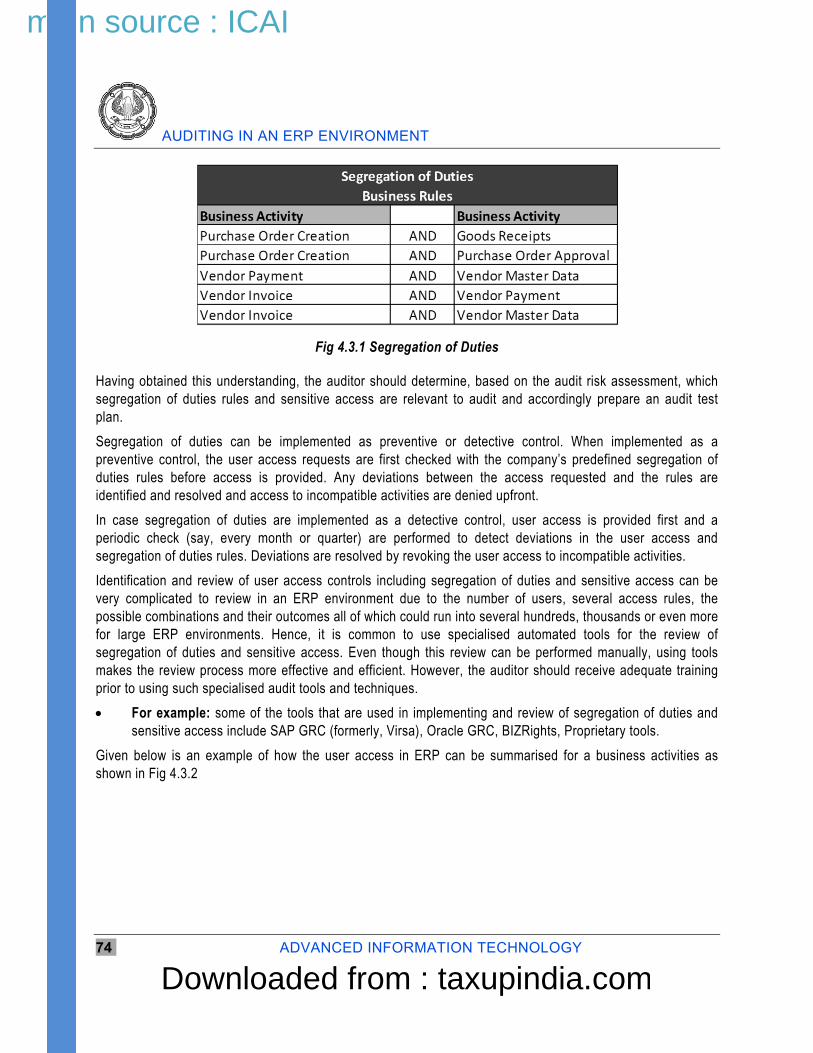
Downloaded from : taxupindia.com
main source : ICAI
AUDITING IN AN ERP ENVIRONMENT
74 ADVANCED INFORMATION TECHNOLOGY
Fig 4.3.1 Segregation of Duties
Having obtained this understanding, the auditor should determine, based on the audit risk assessment, which segregation of duties rules and sensitive access are relevant to audit and accordingly prepare an audit test plan.
Segregation of duties can be implemented as preventive or detective control. When implemented as a preventive control, the user access requests are first checked with the company’s predefined segregation of duties rules before access is provided. Any deviations between the access requested and the rules are identified and resolved and access to incompatible activities are denied upfront.
In case segregation of duties are implemented as a detective control, user access is provided first and a periodic check (say, every month or quarter) are performed to detect deviations in the user access and segregation of duties rules. Deviations are resolved by revoking the user access to incompatible activities.
Identification and review of user access controls including segregation of duties and sensitive access can be very complicated to review in an ERP environment due to the number of users, several access rules, the possible combinations and their outcomes all of which could run into several hundreds, thousands or even more for large ERP environments. Hence, it is common to use specialised automated tools for the review of segregation of duties and sensitive access. Even though this review can be performed manually, using tools makes the review process more effective and efficient. However, the auditor should receive adequate training prior to using such specialised audit tools and techniques.
For example: some of the tools that are used in implementing and review of segregation of duties and sensitive access include SAP GRC (formerly, Virsa), Oracle GRC, BIZRights, Proprietary tools.
Given below is an example of how the user access in ERP can be summarised for a business activities as shown in Fig 4.3.2

Downloaded from : taxupindia.com
main source : ICAI
SEGREGATION OF DUTIES AND SENSITIVE ACCESS
ADVANCED INFORMATION TECHNOLOGY 75
Fig 4.3.2 User access in ERP
4.4 Impact of conclusions of GITCs Implementing and maintaining segregation of duties and sensitive access in an ERP environment is a very dynamic process that keeps changing all the time due to the changes in business environment. For example, employees change, job roles change, processes change and systems change. Whenever such changes in business environment occur, the corresponding changes in user access must be made in the ERP environment too. When an auditor reviews the user access controls in an ERP, the review is done at a point-in-time and the results represent users access at that point only. However, auditing standards require auditors to obtain evidence for the full period of audit.
This is where the effectiveness of GITCs becomes relevant. GITCs are General Information Technology Controls that support the operating effectiveness of automated application controls and IT dependent controls. User access controls are like application controls in an ERP environment and dependent on GITCs.
When GITCs are designed and operating effectively for the entire audit period, the auditor can conclude that user access controls, including segregation of duties and sensitive access, are operating effectively throughout the same period even though testing was performed point-in-time.
Indicates that access to this activity (Goods Receipt) is incompatible with access to another activity (Purchase
Order Creation)
User has Sensitive Access (Vendor Master Data)
X denotes user has access to the activity Coloured cell with X denotes user has
access to incompatible activities Blank cell denotes user does not have
access to that activity

Downloaded from : taxupindia.com
main source : ICAI
AUDITING IN AN ERP ENVIRONMENT
76 ADVANCED INFORMATION TECHNOLOGY
If there are deficiencies in GITCs or when they are not effective, it is likely to have an impact on the design and operating effectiveness of application controls including user access controls. The auditor may have to carry out additional testing and gather more audit evidence to conclude on the effectiveness of user access controls that include segregation of duties and sensitive access.
4.5 Conclusion on Impact of Deficiencies on audit During a review of segregation of duties and sensitive access the auditor may find deficiencies in the user access controls. Examples of such deficiencies are given below:
(a) some users have access to prepare a purchase order and approve the same purchase order
(b) users have access to maintain vendor master data and process vendor payments
(c) users in sales department have access to maintain payroll information
(d) IT department users have access to process business transactions
Having found deficiencies, the auditor should evaluate the impact of these deficiencies on the audit. For this evaluation, the auditor should consider the following:
Is there a business reason because of which the segregation of duties could not be implemented in the ERP?
In case of business reason, has management identified a suitable compensating control.
Can we test the compensating control?
Has any user actually used the access? This means, a user has been inadvertently given access to incompatible functions in the ERP, but the user was not aware of this and never actually used this access.
Are there any manual controls that mitigate the lack of user access controls? For example, there could be a manual control where all purchase orders are manually signed by a higher-level employee viz., a Purchase Director or Managing Director or CEO.
For instances where a user has actually used the access, can management provide a list of all such instances and ratify them all and confirm validity of transactions. The auditor may also consider determining aggregate financial impact of the deficiency and evaluate the same from a materiality viewpoint.
The above examples are some of the ways in which the auditor thinks through the deficiencies and assess impact on audit. Wherever necessary, the auditor may have to obtain additional audit evidence to address the risk of material misstatement.
4.6 Exercises
Multiple Choice Questions 1. Which of the following is NOT an example of an External user type,
(a) Employees

Downloaded from : taxupindia.com
main source : ICAI
SEGREGATION OF DUTIES AND SENSITIVE ACCESS
ADVANCED INFORMATION TECHNOLOGY 77
(b) Customers
(c) Vendors
(d) None of the above
2. Business rules for implementing segregation of duties are defined by
(a) ERP Consultants
(b) Government
(c) Company
(d) Statutory Auditors
3. Examples of specialised tools to review segregation of duties and sensitive access in an ERP include,
(a) SAP GRC.
(b) Proprietary tools
(c) BIZ Rights
(d) All of the above.
4. Auditors review of user access controls in an ERP environment is performed at a point-in-time. What other controls can auditors rely upon to get evidence of operating effectiveness for full year.
(a) Compensating Controls
(b) General IT Controls
(c) Manual Controls
(d) Automated Controls
5. When an auditor finds a deficiency in the user access controls, what should the auditor do next
(a) Report deficiency to management and do nothing more.
(b) Increase substantive testing
(c) Ignore the deficiency
(d) Evaluate the deficiency and determine impact on audit
Fill in the blanks
6. Sensitive access in an ERP refers to the ability of a user to perform _______ business activities.
7. Super users who have very extensive or unlimited access to carry out all or several activities in an ERP environment are also known as _______ users.
8. The auditor should first gain and understanding of the ________ and ________ environments before auditing segregation of duties and sensitive access in an ERP.
9. Segregation of duties can be implemented as either ______ or ______ controls.
10. ______ make it easy to manage user access to an ERP

Downloaded from : taxupindia.com
main source : ICAI
AUDITING IN AN ERP ENVIRONMENT
78 ADVANCED INFORMATION TECHNOLOGY
True/False
11. Segregation of duties can be implemented only in companies that use ERP (True/False)
12. Business Rules for implementing segregation of duties should be defined by the auditor (True/False)
13. A user in purchase department has access to maintain vendor master data and process vendor invoices. This indicates a deficiency in segregation of duties (True/False)
14. User access to an ERP is given based on user job roles and responsibilities (True/False)
15. Reliability of user access controls in an ERP depend on effectiveness of application controls (True/False)
4.7 Case study Access Ltd is a Private Limited Company which is in the business of manufacturing and selling mobile phones within India. Revenues in FY17 is INR 100 crores. Access Ltd is using an ERP for all business operations including Revenue and Receivables functions. You are auditing Access Ltd for FY17 and based on your understanding of business and IT environment you have determined the following:
(a) There are 10 users (User01 to User10) in the ERP who have access to do the following activities:
All users can process Sales orders
User03, User04 and User05 can process despatches
User06, User07, User08 can process sales invoices
User01 can maintain customer master and price master
User09 belongs to Finance/Accounts and has access to process bank receipts/collections
User10 belongs to IT has access do all activities
(b) The company has given ERP access as per business requirements but do not have documented business rules for segregation of duties.
(c) You have reviewed the General IT controls and found them to be effective
Your task is,
(a) Based on your risk assessment identify any five combinations of business activities in the Revenue and Receivables process where segregation of duties should exist.
(b) Identify the activities that are considered as sensitive access
(c) Prepare a list of your observations, if any
4.8 References and Further Reading 1. Standards on Auditing published by the Institute of Chartered Accountants of India (ICAI), www.icai.org
> Resources

Downloaded from : taxupindia.com
main source : ICAI
SEGREGATION OF DUTIES AND SENSITIVE ACCESS
ADVANCED INFORMATION TECHNOLOGY 79
2. Guidance Note on Audit of Internal Financial Controls Over Financial Reporting issued by Auditing and Assurance Standards Board. - (14-09-2015), www.icai.org
3. Companies Act 2013, www.mca.gov.in/Ministry/pdf/CompaniesAct2013.pdf
4.9 Answers to Excises 1. Correct answer is (A).
Employees are typically considered as normal users or end users because they belong to a company, not external.
(B), (C) Vendors, Customers are generally classified as external users.
2. Correct answer is (C).
Company policy should define the rules for segregation of duties as part of the internal control framework.
(A) ERP consultants can help in the implementation of user access controls in ERP to comply with company policy on segregation of duties.
(B) Government does not define rules for segregation of duties for a specific company. However, local laws and regulations should be considered when defining the company policy.
(D) Statutory auditors will review and test user access controls in ERP including segregation of duties based on the risk assessment. However, auditors cannot define the rules for segregation of duties.
3. Correct answer is (D). All the mentioned tools can be used.
4. Correct answer is (B).
When General IT Controls (GITCs) are effective for full year, the auditor can rely on user access controls for the same period.
(A) Compensating controls are considered when a deficiency is found.
(C) Manual controls do not provide assurance for the operating effectiveness of user access controls.
(D) Automated controls are business process controls that also depend on effectiveness of GITC
5. Correct answer is (D)
The auditor should evaluate each deficiency and determine impact on audit. The auditor should consider several mitigating factors and compensating controls and obtain additional audit evidence, if necessary.
(A) All deficiencies should be reported to management. In addition, auditor should evaluate each deficiency.
(B) The auditor may consider more substantive testing only if necessary. But first, the auditor should evaluate the deficiency.
(D) Deficiencies should not be ignored.

Downloaded from : taxupindia.com
main source : ICAI
AUDITING IN AN ERP ENVIRONMENT
80 ADVANCED INFORMATION TECHNOLOGY
6. Critical
7. Privileged
8. Business, IT
9. Preventive, Detective
10. Roles
11. False. Segregation of duties is implemented even in companies where there is no ERP.
12. False. Business rules for implementing segregation of duties should be defined by the company/management.
13. True.
14. True.
15. False. Reliability of user access controls in ERP depend on the effectiveness of General IT Controls.
4.10 Case Study Solution (a) There could be several conflicting combinations of business activities where segregation of duties should
be applied. However, it is based on risk assessment and professional judgement. Five such SOD combinations are as follows:
Process Sale Orders AND Maintain Master Data
Process Sale Orders AND Process Invoices
Process Despatches AND Process Receipts/Collections
Process Invoices AND Process Receipts/Collections
Process Receipts/Collections AND Maintain Master Data
(b) Maintain Master Data and Process Receipts/Collections could be considered as Sensitive Access
(c) Some of the observations are as follows.
Company does not have documented business rules for implementing segregation of duties.
There are instances where segregation of duties does not exist (based on the rules mentioned in a) above
IT users have access to all activities in the Revenue and Receivables process.
User01 has access to maintain master data and also process sale orders
Users06, User07, User08 can process sales orders and also invoices
Note: It is suggested that the auditor prepare a chart of all ERP users and their access to business activities in a matrix format. This will be useful in evaluating the segregation of duties and sensitive access more effectively and efficiently.

Downloaded from : taxupindia.com
main source : ICAI
SEGREGATION OF DUTIES AND SENSITIVE ACCESS
ADVANCED INFORMATION TECHNOLOGY 81
4.11 Glossary ERP – Enterprise Resource Planning
SOD – Segregation of duties
SA – Sensitive Access
GITC – General Information Technology Controls
Role – is a logical grouping of users in an ERP that is aligned to a job function
Profile – is an internal technical grouping of authorisations, permissions and user access rights in an ERP and is derived from a role
GRC – Governance, Risk and Compliance

Downloaded from : taxupindia.com
main source : ICAI
SYSTEM GENERATED REPORTS
5.1 Overview As businesses reliance on ERP systems and applications is on the increase, the information available in these systems become critical. This information or data is critical for decision making or even for compliance purposes for ROC etc. and is relied upon by the various stakeholders of an entity such as the management, auditors etc. Thus the integrity of the information / data etc. on which the stakeholders make decisions becomes crucial. As per the Guidance Note issued by the Institute on Audit of Internal Financial Controls over Financial Reporting, the data or Information Produced by the Entity (IPE) can be generally used for:
IPE is used by entity personnel to perform a relevant control.
IPE is used by the auditor to test a relevant control.
IPE is used by the auditor to perform substantive procedures.
The IPE can be in 2 forms:
Reports generated from the System
Listing/Output created manually with data from the system.
In this session, we shall focus more on understanding the different types of reports, procedures to test them and impact of the testing performed.
Some examples of reports are high level reports such as Cash Flow statement, Analysis of Obsolete inventory or more microscopic level of reports such as Registers – Purchase, Sales or Debtors Aging analysis etc. Profit and Loss account, Balance Sheet can also be termed reports.
LEARNING OBJECTIVES
To understand Types of reports - Standard Reports, Customized Reports, Database Queries
To understand procedures for validation of Reports - accuracy of logic, completeness and accuracy of data
To understand the impact of conclusions of GITCs on Report testing
To understand conclusion of impact of deficiencies in Report testing on audit
To understand when to test.
CHAPTER
5

Downloaded from : taxupindia.com
main source : ICAI
SYSTEM GENERATED REPORTS
ADVANCED INFORMATION TECHNOLOGY 83
5.1.1 Why to test reports
Management may make decisions relating to investments, efficiency of operations, allocation of funds to different business streams etc.
Management may have implemented various manual controls within the business processes. These manual controls might be dependent on an underlying report from the system.
For example –
A Periodic review of a Cash Flow statement by the Finance team.
Provision of bad and doubtful debts. The finance team extracts a report from the system which lists the dues outstanding from the customers bucketed as per number of days due. This report is reviewed by the Finance Head and provisions are made for bad and doubtful debts in the books of accounts as per Company policy.
Compliance purposes
The above examples give an idea as to how management of an entity depend on reports from the ERP systems that also have a bearing on the financial reports. These same reports are also used and relied upon by the Auditors during the course of the audit. This information is used by the Auditors via their audit opinion to provide assurance to other stakeholders on the integrity of the data.
Thus there is a need to test the reports from the ERP systems and applications relevant for financial reporting.
5.2 Types of Reports There could be approximately 3 types of reports that can be extracted from ERP systems. The purpose for which these reports may be used are for analysing Financial or Operational data. These reports may also be used as part of statutory filing / compliance with SEBI, ROC, etc.
1. Standard Reports – These are reports that are available at the time of implementation of the ERP systems by the entity. These reports are inbuilt into the systems. Each ERP comes with a set of reports that can be used as is, if the company has implemented the ERP without too many modifications.
This means that the Company is following the pattern of the Chart of Accounts, etc. as defined in the ERP and have not modified them. Thus if they stay within the parameters as defined in the ERP, these standard reports can be used without any modifications. In the below table, Company 1 can use the Standard Reports.
For example: Purchase Register, Sales Register, Fixed Asset Register, Cash Flow statement etc.
2. Customised Reports – These reports are created by the entities with respect to their businesses, revenue streams, divisions etc.
Here, the company has followed their own pattern or code for Chart of Accounts (CoA), Vendors, Customers etc.
For example: B/S, P&L account etc. Alternatively the examples mentioned above such as Purchase/Sales/Fixed Assets Register can also be developed for the company specifically. These can be categorised as Customised reports.

Downloaded from : taxupindia.com
main source : ICAI
AUDITING IN AN ERP ENVIRONMENT
84 ADVANCED INFORMATION TECHNOLOGY
Both the above types of reports are configured/coded and reside in the ERP systems.
COMPANY 1 COMPANY 2
Sr. No.
Details
Codes used as given when ERP
implemented
Details
Codes as configured by Company at the time of
implementation
1 2 3 4 5
1 CoA including Vendors, Employees, Customers etc.
1000001 to 9999999
CoA Control Accounts 100000 to 999999
Vendors VE100001 to VE110000
Employees EP0001 to EP999999
Customers CS100000 to CS 999999
Fig No. 5.2.1 Customised Reports
Thus, in Column 5, the Company 2 has followed its own model of defining CoA, Vendor codes, Employee codes, Customer codes etc. Thus the Standard reports based on CoA as defined in Column 3 cannot be used. The company will have to define its own TB, P&L account, B/S, Cash Flow statement etc. Such reports are called Customised Reports.
3. Database queries / Other tools etc.
Queries are used to retrieve information or data from a database in a readable format using a SELECT statement.
For example: database queries can be used to extract payroll information from a payroll database such as leaves available per employee, blank PAN details of employees who have not submitted PAN etc. These are converted into Excel spreadsheets etc. and used as reports.
5.3 Validation of Reports – Accuracy of Logic, Completeness and Accuracy of Data
In this session we shall understand the procedures to validate/test the reports. These procedures will be specific to the ERP/system implemented by the audited entity.
As per the Guidance Note, the three elements for determining the testing strategy for reports are to understand:
Source Data
Report Logic
Report Parameters
At the start of the audit process, the auditor along with the auditee have to make a list of all relevant reports used by the company and the purpose for which they are used. The auditor will also have to understand the risks involved with each report.

Downloaded from : taxupindia.com
main source : ICAI
SYSTEM GENERATED REPORTS
ADVANCED INFORMATION TECHNOLOGY 85
For example: if there is a mistake/error in the report, what is the potential impact on the business and the audit procedure? How frequently are changes made to the report
Complexity of the report in terms of how are the values populated, number of formulae etc.
Target audience of the reports – Senior Management, Staff etc.
Before the auditor plans to understand the types of reports and the procedures to validate them, it is necessary to check the integrity of the data within the system. The auditor has to:
Test the General Information Technology controls (GITC’s) within and surrounding the ERP systems.
Test the controls within the business processes including sensitive access and segregation of duties etc. within and surrounding the systems. This is the source data for the reports.
This will give a reasonable indication to the auditor on the integrity of the data within the system. The results of the above mentioned procedures will determine the extent and type of procedures to be used to validate/test the reports for completeness and accuracy. There can be 2 scenarios pertaining to the results of the procedures:
If the controls in GITC and Business Processes are found to be effective then the auditor may limit himself to performing certain tests on the reports.
If the controls are found to be ineffective, the auditor will have to perform more detailed and substantive procedures. These procedures will be specific to the conditions relevant to the entity.
We shall talk of the procedures to test these reports later in this session.
The auditor as a first step need to understand the different types of reports that can be extracted from ERP systems/applications.
NOTE: The company may have implemented a control on Quarterly Review of Aging Analysis by Finance Controller. In such a scenario, the auditor will have to test 2 aspects of the control:
1. The Review by the Finance Controller 2. The integrity of the report. The procedure mentioned above can be used to test the integrity of the report. Here
the timing of the extraction of the report becomes important. The auditor will also have to check whether the Finance Controller has reviewed the relevant latest report. The same report has to be independently extracted by the auditor and tested.

Downloaded from : taxupindia.com
main source : ICAI
AUDITING IN AN ERP ENVIRONMENT
86 ADVANCED INFORMATION TECHNOLOGY
Fig. 5.3.1 implemented a control on Quarterly Review of Aging Analysis
5.3.1 Standard Reports
5.3.1.1 1st year of audit of the entity:
For example if the company has implemented SAP, the auditor may take steps as mentioned below:
Example 1: Debtors outstanding statement
Assumption – The results of GITC and Controls in business process testing are positive and reliance may be placed on them. Access to add/modify/delete these reports are restricted and changes to the reports are authorised.
The company uses the following indicative commands in SAP to generate reports:
(a) se16
(b) se16n
(c) sa38
The auditor should ensure with the IT personnel whether there has been any change to the program code of the said report. In a case of a standard report, the creator/modifier of the report would be the vendor i.e. SAP themselves. The auditor can take a screenshot to ensure the same.

Downloaded from : taxupindia.com
main source : ICAI
SYSTEM GENERATED REPORTS
ADVANCED INFORMATION TECHNOLOGY 87
If the evidence found in the change management logs indicates that the vendor - SAP was the last user to access the report at the time of implementation of the ERP.
Fig. 5.3.2 Debtors outstanding statement
Report Parameters:
Fig. 5.3.2: Report Parameters
Report Parameters Customer account,
Company code and Key
Transaction Code for Debtors Ageing

Downloaded from : taxupindia.com
main source : ICAI
AUDITING IN AN ERP ENVIRONMENT
88 ADVANCED INFORMATION TECHNOLOGY
Report Output:
Fig. 5.3.3: Report Output
The auditor needs to then understand and test the completeness and accuracy of the report. The debtor’s outstanding statement will have various buckets or columns. The buckets could be Upto 30 days, 31-60 days, 61-90 days, 91-180 days and Above 180 days, depending on the date of invoice which is outstanding.
For example: Debtor 1
The auditor can devise a procedure to take one transaction – one sample per scenario. In this case, one invoice per bucket as a sample is to be tested. Since these transactions are automatically populated in the report, if the tests pass for one transaction, then the same inference can be made for other transactions too.
The original hard copy of the Invoice can be compared with the entry in the Outstanding statement for the following fields: Date/Invoice no./Customer name/Amount etc. If the values match between the original Invoice and the details in the Outstanding statement, the accuracy assertion is established.
To establish the completeness assertion, the Grand Total of the Outstanding statement for all Debtors can be compared to the total of the value of Debtors appearing in the B/S or TB or can be checked on the screen itself.
Once the values are found to be matching, then a decision to rely on the report can be taken.
The above example pertained to SAP. Even in other ERP’s/tools/manual reports, the Company may be using reports as given below. In this scenarios, testing of such reports as mentioned above have to be performed.
Ageing Buckets

Downloaded from : taxupindia.com
main source : ICAI
SYSTEM GENERATED REPORTS
ADVANCED INFORMATION TECHNOLOGY 89

Downloaded from : taxupindia.com
main source : ICAI
AUDITING IN AN ERP ENVIRONMENT
90 ADVANCED INFORMATION TECHNOLOGY
The same procedure as mentioned for Standardised reports need to be followed. The differences are:
1. While testing for users who have access to create/modify report, the auditor will have to verify whether the user names who have created/modified the reports are authorised users. If any change to the report has happened in the year of audit, then appropriate approvals should be verified.
2. The auditor has to follow the same test procedures to test for completeness and accuracy as mentioned above.
3. Unlike standard reports, the procedures to test the completeness and accuracy of the customised reports have to be performed every year.
Path:
Fig. 5.3.5: Customised Report
Report Parameters
Fig. 5.3.6: Report Parameters
Customized report for GL balance

Downloaded from : taxupindia.com
main source : ICAI
SYSTEM GENERATED REPORTS
ADVANCED INFORMATION TECHNOLOGY 91
Underlying Program of the Report
Fig. 5.3.6: Underlying Program of the Report
5.3.3 Database Queries/Other Tools
Since, these reports are extracted on ad hoc basis or on as and when basis, the auditor needs to adopt a more substantive approach to test the data extracted. Such reports have a high probability of the data being manipulated after creation.
For example, MS Access reports, excel sheets etc. come under this category.
For example, refer below the screenshot of a query in MS Access for extraction of infrequently used GL accounts for less than 6 times in a year.
5.4 Impact of conclusions of GITCs on Report testing As mentioned in the earlier sections of this chapter, before we start to test the reports, the auditor needs to understand, evaluate and test the General Information Technology Controls (GITC’s). The results of the GITC tests will have a bearing on the procedures to be followed to test reports.
Scenario 1: Controls in all domains of GITC’s are effective and there are no relevant deficiencies.
Query for extraction of data from MS ACCESS
Last change date and the user name

Downloaded from : taxupindia.com
main source : ICAI
AUDITING IN AN ERP ENVIRONMENT
92 ADVANCED INFORMATION TECHNOLOGY
In such a case, the auditor can follow the procedures as mentioned above to test the reports – both standard and customised.
Scenario 2: Controls are ineffective in all domains of GITC’s
Therefore, the procedures to test the reports have to be different from the above mentioned. The auditor will have to devise a more substantive approach and other substantive procedures to testing the reports. The auditor cannot rely on just one sample to test the completeness and accuracy assertions of the report.
This will be further elaborated in the session on GITC’s.
5.5 Timing of Report Testing Deciding when to test a report is a critical element of the audit. Some of the criteria to be used to decide timing of report testing are:
1. The data captured by a report is also essential in deciding the timing to test a report.
A report may capture real time data.
For example in a telecom industry, reports may be used to for revenue assurance, value added services etc. Such reports may have values changing on a daily/monthly/quarterly/yearly basis. Hence, such reports have to be tested as per the frequency in which they are used. If the auditor delays testing the report, the values may be outdated and the results may not be accurate.
2. Company policy – If a report is generated and used by a Company on an annual basis.
For example Provisions made on obsolescence of inventory. The report is reviewed and entry is made in the books of accounts as per this report. The auditor will also have to test a report as per the frequency used by the company.
3. There may be instances where the company has implemented a new ERP during the financial year. The legacy/older ERP is no longer used. The auditor may have to test the reports in both the systems as per the frequency of the report.
For example, the company has implemented a new ERP from October 1st. They have a control of review outstanding debtors and provisions made in the books of accounts every quarter. If the auditor decides to test for 2 quarters - In such a scenario, the auditor may have to test the reports in both the systems.
4. Another important factor to be considered is the inclusion of Period end entries. The auditor will have to understand the type of entries passed and whether they are included in the logic of the reports.
5.6 Conclusion of Impact of Deficiencies in Report testing on audit The auditor may be faced with a situation where there are deficiencies in the reports/IPE that have been tested. The errors at a minimum may be of 2 types:
o Logic errors
o Arithmetical errors

Downloaded from : taxupindia.com
main source : ICAI
SYSTEM GENERATED REPORTS
ADVANCED INFORMATION TECHNOLOGY 93
o As per the scoping details, these reports are used by the Company and relied by the auditor during the audit process. Hence these reports are tested by the auditors.
Thus, the auditor will have to accordingly coordinate with the company to make them understand the deficiencies found and check if they have rectified the report/IPE. The auditor will have to modify their audit procedures to calculate the impact on the financial statements. Also, the auditor will have to independently obtain the information from the company’s ERP for the purposes of their audit.
Example 1:
The debtors ageing statement given in Section 3 of this session:
All the details such as Invoice number, Party name, Amount etc. are correctly appearing in the name. However, the ageing buckets to calculate the number of days outstanding of the invoice is calculated from the due date of payment of invoice. This is wrong as the date has to be calculated from invoice date.
In such a scenario, the auditor will have to ask the company
o to create a new report or
o calculate the ageing correctly in the same report.
Accordingly the provisions etc may undergo a change in the financial statements.
Example 2:
In the same debtors ageing report, the outstanding buckets along with other details such as Invoice no. name of party, Date etc is appearing correctly. However, there are arithmetical errors. The total of all the buckets are not totalled correctly.
This can be verified by taking the Grand total of the Debtor ageing statement and tallying it with the total in the Trial Balance.
In both the above scenarios, the auditor will have to adopt appropriate substantive procedures to test the data.
5.7 Exercise 1. Which of the following method is used to produce reports about data.
(a) Standard Reports
(b) Customised Reports
(c) Database queries.
(d) All of the above
2. SELECT statement is used to generate which type of reports:
(a) Standard Reports
(b) Customised Reports

Downloaded from : taxupindia.com
main source : ICAI
AUDITING IN AN ERP ENVIRONMENT
94 ADVANCED INFORMATION TECHNOLOGY
(c) Database queries.
(d) None of the above
3. The auditor may limit the test procedures to test reports when
(a) Controls in Business process and GITC are effective
(b) Controls in Business process are effective and GITC are ineffective
(c) Controls are ineffective
(d) None of the above
4. What are the factors to be considered for timing of report testing:
(a) Quality and type of entries
(b) Company Policy
(c) Implementation of new systems
(d) All of the above
5. Some of the reasons to test reports by auditors:
(a) Used by management to take decisions
(b) Used by auditors as part of audit
(c) Used by management for compliance purposes
(d) All of the above.
6. Prior to testing of reports, the auditor needs to understand, evaluate and test the ________ and _______.
7. On the assumption that the GITC’s are effective, the auditor needs to follow which sampling procedure to test a report:
(a) One transaction
(b) One transaction per scenario
(c) Appropriate substantive procedures
(d) None of the above
8. The GITC’s are effective and a report has been tested in earlier years. In subsequent years, the auditor may adopt an approach of testing ______________ of the report.
9. The 2 assertions generally evaluated at the time of testing reports are ______________ and __________.
10. System Reports which are used to analyse business operations and are extracted from systems not relevant for financial reporting, need not be tested.
(a) True
(b) False

Downloaded from : taxupindia.com
main source : ICAI
SYSTEM GENERATED REPORTS
ADVANCED INFORMATION TECHNOLOGY 95
5.8 Case Study Access Limited is Private Limited Company. It is using SAP as its main ERP. The Company at the time of implementation of ERP decided to use only the Purchase and Sales Register as given by SAP. The IT team of Access Ltd along with the Finance team created a customised report for Debtors Aging Statement. However, it decided to prepare the P&L and Balance Sheet outside the system in MS Excel.
This is the second year of audit of Access Ltd. You are in the audit team and have been given the task of testing the reports as part of the Audit of Financial Statements. Devise a testing strategy to test these reports. The GITCs have been tested and found to be effective.
ANSWER TO EXERCISE
1. Correct answer is d: All of the above
All the 3 types of reports – Standard, Customised and Database queries are methods to extract data or Information from the systems.
2. Correct answer is c: Database queries
Database queries using SELECT statement is commonly used to generate data. Standard reports and customised are generated using pre-existing commands or menu paths in the ERP.
3. Correct answer is a: Controls in Business process and GITC are effective
When the controls are ineffective either in Business Processes or GITC then one of the elements of determining testing strategy is affected namely source data.
Thus, controls in Business process and GITC have to be effective for the auditor to consider specific test procedures.
4. Correct answer is d: All of the above.
The company may have period end entries to be passed. Another scenario could be that the company has implemented a new system. Hence reports in both the systems may have to be tested for different periods. Also, the company may have a policy for provisions for debts, obsolescence etc. Hence, all the criteria have to be considered to determine the time to test reports.
5. Correct answer is b: Used by the auditors as part of the audit
The reports which the auditors use as part of the audit need to be tested. This list may also include reports used by the Management.
6. Correct answer is General Information Technology Controls and Business Process Controls
7. Correct answer is b – One transaction per scenario.
In the case of Debtors outstanding statement, if there are various buckets depending on the number of days outstanding of the invoice, one transaction per bucket has to be tested.
8. Correct answer is Last change date
9. Correct answer is Completeness and Accuracy

Downloaded from : taxupindia.com
main source : ICAI
AUDITING IN AN ERP ENVIRONMENT
96 ADVANCED INFORMATION TECHNOLOGY
10. Correct answer is True. If a system is not relevant for financial reporting, then reports from that system need not be tested.
5.9 Answer to Case Study Report Testing Strategy for second year of audit.
Standard Reports – Purchase and Sales Register -
Ascertain from last year audit work papers if there were no issues in testing these reports.
If so, test the Last change date of the report.
If no change from previous year, no further testing required.
Customised Reports – Debtors Ageing Statement
Take one sample per bucket and reconcile with original documents/evidences.
Excel Reports – P&L account, Balance Sheet
To be tested by using appropriate substantive procedures.
5.10 References and Further Reading 1. Standards on Auditing published by the Institute of Chartered Accountants of India (ICAI), www.icai.org
> Resources
2. Guidance Note on Audit of Internal Financial Controls Over Financial Reporting issued by Auditing and Assurance Standards Board. - (14-09-2015), www.icai.org
3. Companies Act 2013, www.mca.gov.in/Ministry/pdf/CompaniesAct2013.pdf
5.11 Glossary ERP – Enterprise Resource Planning
ROC – Registrar of Companies
IPE – Information Produced by the Entity
GITC – General Information Technology Controls

Downloaded from : taxupindia.com
main source : ICAI
NEW SYSTEMS AND DATA MIGRATION REVIEW
6.1 New Systems and System Upgrades (Functional Vs Technical) Enterprise resource planning (ERP) is a company-wide integrated computer software system used to manage and coordinate all the resources, information, and functions of a business from shared data sources. ERP delivers a single database that contains all data for the software modules, which include Sales, Purchase, Materials Management, Human Resource & Payroll, Finance & Accounts, etc. Every ERP will have their own terminology to map business process to software modules. For example, in SAP the purchase and inventory processes are provided in the module known as Materials Management the same processes in Oracle are known as Procurement and Inventory.
Some of the reasons why companies consider implementing a new ERP system or migrating from existing legacy systems to ERP are as follows:
To enable growth in business
Take advantage of technology to carry out business faster and accurately
Centralisation of data for better reporting and MIS
Implement automated controls and enhance internal controls
increase the level of automation in business process and increase operational efficiencies
to respond to changes in business environment including regulatory changes
obsolescence of existing technology or older versions are no longer supported by system vendors
Outsourcing of business process to a third party
With the pace and frequency of changes in the overall business environment increasing periodically, the need for migrating systems has also become more common. The following scenarios may exist when systems are being implemented or migrated.
LEARNING OBJECTIVES
To understand about new systems implementations
To understand the data migration strategy and approach in an ERP environment
To understand how to review new system implementations and data migrations
To understand how to determine and evaluate impact of deficiencies in data migrations on overall audit
CHAPTER
6

Downloaded from : taxupindia.com
main source : ICAI
AUDITING IN AN ERP ENVIRONMENT
98 ADVANCED INFORMATION TECHNOLOGY
Implementation of a completely new accounting system or ERP. For example, Tally, Quickbooks, In-house developed ERP or SAP
Migrating from an existing system to a new ERP. For example, Tally/Quickbooks to SAP
Migrating from an existing system to an enhanced version of the same system. For example, SAP 4.7 to SAP 6.0, Oracle 11i to Oracle R12
Technical migration where the IT infrastructure including operating system, database, network or hardware are changed but no change in version or functioning of ERP.
For example, the existing Windows 2008 R2 Server, on which the ERP is installed, is migrated to a newer Windows 2016 Server operating system and all the desktop operating systems in the company are upgraded from Windows 7 to Windows 10. In this example, the business functionality of ERP does not change and hence it is considered as a technical migration.
Implementing new modules in an existing ERP. For example, Payroll module is implemented in an existing ERP where other modules viz., Finance & Accounts, Sales, Purchases and Inventory are already operational.
The auditor needs to understand well in advance any plans a company may have to undertake major changes in the IT environment during an audit period. The auditor has to consider the possibility of auditing in two very different IT environments in the same year and should assess risks accordingly. Some of the areas where a migration could impact audit include the following:
Change in understanding of existing business process
New risks could arise
Activities and existing controls could undergo a change
More automated controls are likely to be implemented
User access rights and segregation of duties could change
Reports and system generated data i.e., information produced by entity (IPE) could change
Considerations for outsourced activities
6.2 Data Migration Strategy ERP migrations are similar to any other project and accordingly the auditor should understand the strategy and approach that is being adopted in a particular migration project. The key phases in any ERP migration project will consist of the following as shown in Fig 6.2.1:
Fig 6.2.1: Data Migration Strategy
Planning System Design
Data Conversion Testing Go Live
Documentation

Downloaded from : taxupindia.com
main source : ICAI
NEW SYSTEMS AND DATA MIGRATION REVIEW
ADVANCED INFORMATION TECHNOLOGY 99
Planning: In this phase of migration the objectives of migration and the migration strategy are defined. Commitment and involvement of top management is defined and an individual who will be the business sponsor is identified to take key decisions. Team is formed and roles and responsibilities are assigned. A budget for the migration is allocated. Key dates, timelines and milestones are determined. A risk assessment carried out and critical dependencies - including availability of staff for the migration project, support from vendors and external consultants, readiness of IT environments, etc. - are identified upfront. Back-out and rollback procedures are planned as a contingency measure.
System Design: In this phase of migration the AS-IS (existing) system and process is understood and the TO-BE (proposed) system and process prepared including the process flows, data flows and business process re-engineering. Configuration and Customisations required are determined and the codification is prepared. Interfaces with other systems and applications are determined.
Data Conversion: In this phase of migration involves identification of source data, data mapping between source(existing) and target (proposed) systems is defined including the development of automated data extraction and transfer programs or scripts. Intermediary data stores called staging areas are used to hold, convert and transfer data. Inconsistencies in data, incomplete and inaccurate data are identified and corrected as part of data cleansing and data enhancement. Integrity checks are done to ensure completeness and accuracy of data. Mock conversions are carried out iteratively to rectify errors and data inconsistencies.
Testing: In this phase of migration various levels of testing are carried out that include, unit testing, integration testing, user acceptance testing. Test cases, scenarios and test scripts are prepared to test the functionality of the new system.
Implementation (Go Live): In this phase of migration the team checks if all objectives of migration and the migration strategy are achieved. Any deviations should be identified and resolved. Adequate training has been provided to the user of the new system. Assurance should be obtained from an independent auditor prior to implementation in the form of a pre-implementation review report. A representative of top management should provide approval for Go live and communicate to all stakeholders about the launch of new system. A rollback plan is defined as a contingency measure in case migration is not successful.
Documentation: For all phases and migration activities, relevant documentation should be prepared and signed off by the project team.
The below illustration is an example of a high-level ERP Migration Plan as shown in Fig 6.2.2.
Fig 6.2.2: High Level ERP Migration Plan
Access Ltd ERP Migration PlanDuration: 01-Jul-201x to 20-Aug-201x
Tue
Wed
Thu Fri
Sat
Sun
Mon
Tue
Wed
Thu Fri
Sat
Sun
Mon
Tue
Wed
Thu Fri
Sat
Sun
Mon
Tue
Wed
Thu Fri
Sat
Sun
Mon
Tue
Wed
Thu
1 2 3 4 5 6 7 8 9 1 0 1 1 1 2 1 3 1 4 1 5 1 6 1 7 1 8 1 9 2 0 2 1 2 2 2 3 2 4 2 5 2 6 2 7 2 8 2 9 3 0 3 1
Pla nning / Kick-Off
Sy st em Design
Da t a Conv ersion
Fri
Sat
Sun
Mon
Tue
Wed
Thu Fri
Sat
Sun
Mon
Tue
Wed
Thu Fri
Sat
Sun
Mon
Tue
Wed
Thu Fri
Sat
Sun
Mon
Tue
Wed
Thu Fri
Sat
Sun
1 2 3 4 5 6 7 8 9 1 0 1 1 1 2 1 3 1 4 1 5 1 6 1 7 1 8 1 9 2 0 2 1 2 2 2 3 2 4 2 5 2 6 2 7 2 8 2 9 3 0 3 1
Migra t ion T est in g
Pre-Im plem en t a t ion Rev iew
Im plem ent a t ion / GO-Liv e Hol
iday
Hol
iday
July - 201x
Phase
August - 201x
Hol
iday

Downloaded from : taxupindia.com
main source : ICAI
AUDITING IN AN ERP ENVIRONMENT
100 ADVANCED INFORMATION TECHNOLOGY
It should be noted that the migration strategy could vary from company to company and depends on the scope and nature of migration i.e., technical or functional. The auditor should obtain an understanding of the scope and nature of migration to assess impact on audit.
6.3 Masters, Balances, Line-items, Open items When planning a migration from an existing system to a new system, some of the important considerations include determining an approach for migration of existing master data, historical transaction data, open items and account balances.
A migration project provides an opportunity to review and carry forward only the relevant data and discard obsolete data. The likely scenarios may be as follows:
Duplicate master data is identified and blocked
Obsolete or dormant master data is blocked
Only current price masters are carried over to new system OR revised prices with effect from Go live date could be adopted
Missing fields, additional fields, mandatory fields in new system are identified and updated. Additional data that is presently not available may have to be obtained from the respective source viz., customer, vendors
For migrating the financial data and account balances, the following scenarios can be considered.
Definition of new chart of accounts
Mapping the legacy and new charts of accounts. See illustration for examples of one-to-many and many-to-one GL mappings
Closing balance in the legacy system is carried over as opening balance in new system
Opening balances are directly entered or uploaded in new system OR processed through temporary migration accounts as accounting entries for better control.

Downloaded from : taxupindia.com
main source : ICAI
NEW SYSTEMS AND DATA MIGRATION REVIEW
ADVANCED INFORMATION TECHNOLOGY 101
Sample Chart of Accounts Mapping – Tally to SAP
Fig 6.3.1: Sample Chart of Accounts Mapping – Tally to SAP
Historical transaction data including orders, invoices, goods receipt and dispatch notes and other standard and non-standard journal entries may not be migrated to new system and will most likely remain in the legacy system. The implications of this need to be considered from the following points of view
Legal and statutory requirements including maintaining books of accounts in accordance with Companies Act 2013
Availability of records for tax audit and assessments.
The duration for which books of accounts and records are required to be maintained in legacy system
Access controls for the legacy system
Protection of legacy data from being changed
Software license terms of use for legacy system including application, operating system and database
Open items could exist as on the day of migration and it is important that the migration approach should envisage and factor for such open items. Open items could exist the following scenarios
Open orders – purchase, sales and production orders
Open invoices – vendor, sales invoices
Single account is mapped to multiple accounts in SAP.
Multiple accounts in Tally are mapped to a single account in SAP.

Downloaded from : taxupindia.com
main source : ICAI
AUDITING IN AN ERP ENVIRONMENT
102 ADVANCED INFORMATION TECHNOLOGY
Advances – received and paid
Loans to employees
Stock-in-transit
Depreciation history and accumulated depreciation for fixed assets.
The auditor should understand the approach adopted by the company management to assess the impact on audit.
6.4 When to Test? Having obtained an understanding of the migration approach, the business environment and the IT environment, the auditor should perform a risk assessment for each phase of the migration process and identify the risks that could impact the audit. The auditor should design appropriate audit procedures that include evaluation of controls that are in place to mitigate the risks. The auditor should test these controls for design and operating effectiveness.
The testing for data migrations can be performed pre-implementation which means either immediately preceding the Go live phase, when a substantial part of the migration has been completed, or post-implementation meaning after the Go live phase. The suggested approach is to perform both pre-implementation and post-implementation reviews because of the following reasons
a pre-implementation review provides an opportunity for the company to identify gaps, if any, in the migration process and address the same in a timely manner.
a pre-implementation also provides early assurance on the migration process and controls which can be useful in planning other audit procedures better.
a post-implementation review provides assurance on the effectiveness of migration process and controls. However, in case of any gaps or deficiencies that are identified there is no opportunity to address and remediate these gaps. The auditor should evaluate and report the gaps and deficiencies and design further audit procedures, if necessary, in the same way as for other control deficiencies.
It should be noted that pre-implementation or post-implementation reviews can be carried out as separate non-audit engagements by internal audit or another third-party auditor depending on the company’s requirements. In any case, the statutory auditor is still required to perform a review of migration process and controls as part of the audit process as part of testing General IT Controls, it is not an option. However, the auditor may consider using the work performed by internal auditors in accordance with guidance given in SA 610. Whether the auditor plans to rely on the work done by internal auditor or not, the auditor is required to evaluate and address the gaps and deficiencies, if any, that have been identified by the internal auditor/third party auditors.
The table below has examples of some of the risks and controls at each phase of the migration process that are relevant when implementing or migrating to new systems

Downloaded from : taxupindia.com
main source : ICAI
NEW SYSTEMS AND DATA MIGRATION REVIEW
ADVANCED INFORMATION TECHNOLOGY 103
Phase Risk Control Activity
Planning Project may not go as per the plan.
Project manager prepares the detailed Project Plan which includes step by step activities involved, the key dates and milestones, budgets, team allocation, etc. This plan is approved by the Business Sponsor/Steering Committee.
System Design
Business process may not be accurately or completely mapped
As-Is and To-Be process document or Blueprint of existing business processes with the proposed processes is mapped and documented by System Analysts. This document is reviewed by appropriate functional team members and approved by the Project Manager, Business Sponsor/Steering Committee.
Data Conversion
Transaction data may not be uploaded accurately in to the new system.
Converted account balances, data counts and totals are compared with comparative data from legacy system to ensure the accuracy and completeness data conversion. Project manager reviews data conversion results and ensures that differences are identified and resolved in a timely manner. Results of data conversion is documented and approved by the Business Sponsor.
Testing Configurations made in ERP may not be accurate/may not function as per the requirement
Unit testing and Integration testing is done by project team and reviewed by module leader and project manager. User acceptance testing is done by business users and approved by the respective process leads. Testing results are documented and approved by the Business Sponsor.
Go Live Processing business transactions may be started in the new system even before migration if fully completed and objectives are not met.
The Project Manager ensures that all planned objectives have been met and new system is ready for use. A pre-implementation review is carried out by an independent auditor to provide assurance that migration process and controls are effective. The Business Sponsor/Steering Committee reviews the project status and the pre-implementation report. Business Sponsor gives formal approval to start using the new system.

Downloaded from : taxupindia.com
main source : ICAI
AUDITING IN AN ERP ENVIRONMENT
104 ADVANCED INFORMATION TECHNOLOGY
6.5 Conclusion on Impact of Deficiencies on Audit As noted in the previous section, it is likely that deficiencies will be found during a review of migration process. Examples of such deficiencies include:
(a) a documented migration strategy and plan is not prepared
(b) a formal sign-off for user acceptance testing has not been obtained
(c) errors in data conversion have not been rectified
(d) approval for go-live was not formally obtained
Having found deficiencies, the auditor should evaluate the impact of these deficiencies on the audit. For this evaluation, the auditor should consider the following:
are there any alternate sources which can compensate for lack of structured documentation. For example, email communications, minutes of meetings, project folders and working papers.
In case of errors in data conversion, the auditor should determine if the errors are specific to a particular set of transactions, business process or pervasive. Based on this assessment, the auditor may be able to limit further audit procedures. For example, if the data conversion errors pertain to 25 sales invoices, the auditor may test these specific invoices substantively.
consider using CAATs to ensure completeness and accuracy of data. For example, the auditor can rebuild the trial balance by extracting all transaction as on conversion date separately from legacy and new system, summarise these transactions in ACL and compare net account balances. Ideally, there should not be any difference between the legacy and new system after factoring for changes in chart of accounts.
determine the aggregate financial impact of the deficiencies and compare with materiality.
The above examples are some of the ways in which the auditor thinks through the deficiencies and assess impact on audit. Wherever necessary, the auditor may have to obtain additional audit evidence to address the risk of material misstatement.
6.6 Exercises
Multiple Choice Questions
1. Which of the following is example of an ERP,
(a) SAP
(b) Oracle R12
(c) In-House developed
(d) All of the above
2. Which of the following activity is part of the System Design phase of a migration,
(a) Allocation of Budget

Downloaded from : taxupindia.com
main source : ICAI
NEW SYSTEMS AND DATA MIGRATION REVIEW
ADVANCED INFORMATION TECHNOLOGY 105
(b) Configuration
(c) Mock conversion
(d) All of the above
3. At which phase of the migration would rollback procedures be triggered, if necessary
(a) Planning
(b) Data Conversion
(c) Go-Live
(d) Migration Testing
4. Which of the following require specific considerations during a migration,
(a) User access and segregation of duties
(b) Open items
(c) Master data
(d) All of the above
5. When would auditors review migration process and controls,
(a) During Pre-implementation/Post-implementation reviews
(b) When reviewing General IT Controls
(c) Both A & B
(d) None of the above
Fill in the blanks
6. ___________ should be prepared and maintained for all phases of migration.
7. The auditor should evaluate the _______ of deficiencies identified in the migration process.
8. A ______________ review provides an opportunity for the company to identify gaps in the migration process and address the same in a timely manner.
9. The auditor may consider using the work performed by internal auditors in accordance with guidance given in __________
10. Interfaces with other systems and applications are determined during ____________ phase of the migration process.
True/False
11. When a pre-implementation review has been performed and the gaps have been rectified, the auditor is not required to evaluate and test controls in the migration process. (True/False)
12. The auditor should consider using CAATs when evaluating deficiencies in migration controls. (True/False)

Downloaded from : taxupindia.com
main source : ICAI
AUDITING IN AN ERP ENVIRONMENT
106 ADVANCED INFORMATION TECHNOLOGY
13. Migration approach and strategy will be the same for all companies. (True/False)
14. Duplicate master data records should not be considered for migration from legacy to new system. (True/False)
15. After migrating to the new system, the data in legacy system can be discarded. (True/False)
6.7 Case Study Access Ltd is in the business of manufacturing and selling of mobile phones. Revenue in FY17 is INR 100 Crore and expected to grow at over 30% per annum for the next three years considering the significant increase in demand for mobile phones.
Access Ltd is currently using SAP ERP for accounting, sales and purchases and inventory. In view of upcoming GST tax reforms, which will be effective mid of FY18, the company is in the process of upgrading the SAP system to meet the new requirements. The company is also implementing a cloud based SalesForce CRM solution which will be integrated to the SAP ERP system to drive the Marketing and Customer Relation Management activities.
You are the auditor of Access Ltd for FY18. Your task is to,
(a) Identify the systems at Access Ltd.
(b) Determine which system is relevant for audit and why.
(c) Think of three audit considerations that come to your mind because of the change in existing systems.
6.8 References and Further Reading 1. Standards on Auditing published by the Institute of Chartered Accountants of India (ICAI), www.icai.org
> Resources.
2. Guidance Note on Audit of Internal Financial Controls Over Financial Reporting issued by Auditing and Assurance Standards Board. - (14-09-2015), www.icai.org.
3. Companies Act 2013, www.mca.gov.in/Ministry/pdf/CompaniesAct2013.pdf.
6.9 Glossary ERP – Enterprise Resource Planning
GITC – General Information Technology Controls
SA – Standards on Auditing
CAATs – Computer Assisted Auditing Techniques
MIS – Management Information System
IPE – Information Produced by Entity
ACL – Audit Command Language (CAAT Tool)

Downloaded from : taxupindia.com
main source : ICAI
NEW SYSTEMS AND DATA MIGRATION REVIEW
ADVANCED INFORMATION TECHNOLOGY 107
IT – Information Technology
CRM – Customer Relationship Management
GST – Goods and Services Tax
6.10 Answers to Excises 1. Correct answer is D).
SAP, Oracle R12 and In-house developed are examples of ERP.
2. Correct answer is B).
Allocation of budget happens in Planning phase. Mock conversion is part of Data Conversion phase.
3. Correct answer is C).
Rollback procedures are defined in the Planning phase and triggered during the implementation or Go live phase, if necessary.
4. Correct answer is D).
Approach for migration of user access and segregation of duties, open items and master data should be considered.
5. Correct answer is C).
Auditors can evaluate and test migration controls as part of pre-implementation, post-implementation reviews or during while reviewing General IT Controls during audit process.
6. Documentation.
7. Impact.
8. Pre-implementation review.
9. SA 610.
10. Planning.
11. False.
The auditor has to evaluate and test the remediated controls.
12. True.
The auditor can assess impact of deficiencies by analysing data using CAATs.
13. False.
The migration approach will vary from company to company depending on several factors including the scope and nature of migration.
14. True.
Duplicate master data is identified and discarded as part of data cleansing during migration.
15. False.
Downloaded from : taxupindia.com
main source : ICAI
AUDITING IN AN ERP ENVIRONMENT
108 ADVANCED INFORMATION TECHNOLOGY
Several factors should be considered including legal and statutory requirements before legacy system is discarded.
6.11 Answer to Case Study (a) The two systems are SAP ERP and Sales Force CRM
(b) SAP ERP is relevant because the financial accounting and transactions are processed in SAP.
Sales Force CRM does not have financial data that and hence, not relevant from an audit point of view.
(c) Some of the audit considerations are as follows:
Changes in the general ledgers and Chart of Accounts – new ledger codes for GST will be created
Changes in transactions – invoice formats, tax calculations
Master data updates – customer and vendor masters to be updated with new GST tax codes
Changes in business process and internal controls, including automated controls
Changes in IPE – new reports will be created, reporting formats will be new

Downloaded from : taxupindia.com
main source : ICAI
NON STANDARD JOURNAL ENTRIES
7.1 Overview Companies use ERP’s to record transactions. In most ERP’s these transactions are automated based on the business process. In addition to the sub-leger entries that arise out of business processes, the companies may also pass journal entries that impact the financial statements. We shall now try to understand the different types of journal entries
Standard Entries – These transactions pertaining to sales, purchases, inventory, rent, audit fees, AMC expenses, salaries etc. are subject to internal controls as defined by the company.
Non Standard Entries – In addition to the automated entries, these entities also record nonrecurring, unusual transactions or adjustment entries in the ERP’s. These entries may not be subject to the same level of rigour of the internal controls or may not have passed through any controls at all.
These transactions could be manual in nature and may pertain for example:
Estimates, impairments etc.
Adjustments to amounts already reported in financial statements – combinations, reclassifications etc.
Top Up entries – These are residing outside the books – for example in excel sheets etc. and may impact the financial statements.
Inter company set off entries etc.
For the purpose of this session we shall concentrate on Non Standard Journal Entries (NSJE) only. SA 240 and The Guidance Note on Audit of Internal Financial Controls Over Financial Reporting in paragraphs 64,66,80,90, IG 4.4 and IG 5.6, IG 19.21 and IG 21.9 also talk about unusual transactions and the audit procedures to deal with them.
LEARNING OBJECTIVES
What are Non-Standard Journal Entries in ERP’s
Process to identify Non-Standard Journal Entries
Process to ensure completeness of data
Identify Criteria for JE analytics
Software Testing for scripts
CHAPTER
7

Downloaded from : taxupindia.com
main source : ICAI
AUDITING IN AN ERP ENVIRONMENT
110 ADVANCED INFORMATION TECHNOLOGY
Before identifying the various type of journal entries – standard, non-standard and top up, the auditor will have to understand, evaluate and test the process of internal controls in place to pass such entries.
These entries may be passed throughout the year or more generally at the end of a financial period. There is a possibility that these entries may be passed through sub ledgers like purchase or sales. However, in this case, there may be a level of collusion required, which may be difficult.
Hence, such NSJE are generally directly passed in the General Ledger. There is a risk of management override of controls in passing such entries. In each entity, the level of this risk may vary, but the risk is present. The risk of management override may also lead to risk of material misstatement to fraud which is a significant risk. As a result, the audit procedures should be very robust and relevant to the entity that is being audited.
There is another key aspect to remember while auditing in ERP environment. Other entries – automated etc. will be supported by relevant printed documents. These NSJE’s may exist only in electronic form directly in the General Ledger with no supporting physical documents.
7.2 Process to identify Non Standard Journal Entries
Fig 7.2.1 Process to identify Non Standard Journal Entries
The above process will assist the auditor in understanding the type of journal entries passed and more specifically Non Standard Journal Entries.
The points to note for understanding the business systems and processes are:
Accounting software – ERP/customised/off the shelf packages
IT team – in house/outsourced

Downloaded from : taxupindia.com
main source : ICAI
NON STANDARD JOURNAL ENTRIES
ADVANCED INFORMATION TECHNOLOGY 111
Type of entries – automated or manual etc.
SA/SOD among IT and business teams etc.
Timing of passing journal entries – end of day, weekend etc.
The points to note for understanding the fraud risk factors are:
Sales targets to be achieved – important to investors, stock holders etc.
Bonuses and incentives – employees
Debt requirements – banks etc.
The auditor should generally ask open ended questions to the management to understand if there were any unusual activities during the year under audit.
Whether the employee who recorded entries went on vacation and if there was a substitute during that period
Whether the employee shared his user id and password with any person during the year.
Whether any entries were passed during the year without any supporting documents.
Once the auditor gathers all the information, the assessment has to be made whether any of the replies received has translated to any journal entries. The criteria to be used to for selecting the non standard journal entries will be taken up later in this session. Prior to this, the population of journal entries have to be extracted and the completeness of data has to be ensured.
7.3 Process to ensure completeness of data Once the auditor has completed his inquiries and gathered the requisite information, the next step is to understand the timing of performing the journal entry testing.
Generally, the auditor will wait for the company to have passed most of the entries and closed the books of accounts for the period before deciding to take up the testing.
Once the books are closed, even if the entries need to be passed, a register or a tracker is maintained on the further entries that may need to be passed.
If the auditor decides to perform JE analysis before the year end, then the auditor along with the company will have to keep track of the entries passed subsequently and if required, analyse them later.
Once the auditor has decided to perform the journal entry testing, the entries need to be extracted. There are various ways of identifying journal entries passed in the system:
If the journal entries are passed using a specific journal type then a list of such entries can be extracted from the system.
o For example, journal types could be MJV – Manual Journal Vouchers etc
If the journal entries cannot be distinctly identified by the journal type, then the complete list of all entries are extracted. Out of this full list of entries, the auditor will have to identify journals for testing.

Downloaded from : taxupindia.com
main source : ICAI
AUDITING IN AN ERP ENVIRONMENT
112 ADVANCED INFORMATION TECHNOLOGY
The process can be described as:
Extract the full list of entries.
Perform completeness testing
Based on understanding obtained from the company, identify the JE criteria to pick the Non Standard Journal Entries.
Apply the criteria filter on the full list of JE entries
Test the filtered list of Non Standard Journal Entries.
7.3.1 Data fields to be extracted
Generally, some of the common fields for which data need to be extracted are given below. One point to keep in mind is that the ERP/application should have these fields and the company must be entering data in these fields for them to be extracted.
1. Date
2. Journal No.
3. Journal Type
4. Entry Date
5. Approved date
6. Posted date
7. Period
8. Business Unit
9. Account Number
10. Account Name
11. Description
12. Debit Amount
13. Credit amount
14. Line no.
15. Prepared by
16. Approved by
17. Posted by
7.3.2 Common methods to test for completeness of data:
Some of the common methods to test for completeness of data are:

Downloaded from : taxupindia.com
main source : ICAI
NON STANDARD JOURNAL ENTRIES
ADVANCED INFORMATION TECHNOLOGY 113
Roll forward testing – Roll forward the entries passed during the year to the balances in the Trial Balance. The auditor may use ACL/IDEA Caseware/MS Access/Excel to perform Roll forward testing
Procedures other than Roll Forward Testing.
Roll Forward Testing
o Using CAATS to test for completeness of data:
Using tools such as ACL, IDEA Caseware, MS Access, Excel etc., the auditor can test the data for completeness.
Match the number of entries in the system with that extracted in the CAATS tool. Both the numbers should match.
Match the total number of debits with total number of credits for all the entries. The difference should be zero.
SCREENSHOT of number of entries in MS Access with system as shown in Fig 7.3.1
Number of entries which are uploaded into CAAT tool i.e. MS Access.
Fig 7.3.1 Number of entries in MS Access with system
SCREENSHOT of debits = credits as shown in Fig 7.3.2

Downloaded from : taxupindia.com
main source : ICAI
AUDITING IN AN ERP ENVIRONMENT
114 ADVANCED INFORMATION TECHNOLOGY
Fig 7.3.1 Debits=Credits
If the company is using an ERP, then, the auditor can ask for a full list of entries based on Journal type and summarise the data based on Journal type. This can be reconciled with the Trial Balance and tested for completeness.
The entries in the data extracted need to be match the highlighted areas.
Details Opening balance Debits Credits Closing Balance
Balance Sheet
Cash balance 10000 2000 4000 8000
Profit & Loss
Salaries 0 50000 2000 48000
Procedures Other than Roll Forward Testing
o There are industries/sectors where the roll forward testing may not be appropriate or feasible.
o For example - in banks/financial institutions/e-commerce/retail sectors where the volume of transactions are huge, the auditor may have to think of a different method to test for completeness of data.
The auditor can identify the key account balances and perform roll forward testing only for those accounts and not for all accounts.
Journal Type Amount
Sales
Purchase
Cash
Total

Downloaded from : taxupindia.com
main source : ICAI
NON STANDARD JOURNAL ENTRIES
ADVANCED INFORMATION TECHNOLOGY 115
There are high risk accounts such as - intercompany accounts and related party transactions the auditor can reconcile the opening balances and closing balances with previous year and current year financial statements and then test by roll forward the transactions (debit and credit).
Holding company audits – A holding company with many subsidiaries - Journal entry testing may be very challenging. A possible path would be to adopt roll forward testing in the subsidiaries. At the holding company level, the auditor can test the consolidating and eliminating entries.
CAATS can also help in finding out gaps in the sequence numbers of journal entries. This is useful where the volume of transactions are huge such as banks/financial institutions etc.
CAATS can also help in finding out if there are duplicate journal numbers used.
7.4 Identify Criteria for JE Analytics The auditor will have to know the business of the client and the industry and then decide on the criteria to be used for JE analytics. Some of the common criteria can be:
1. Seldom used accounts – Accounts that are used very infrequently.
2. Unusual combination of accounts –
a. Debit cash - Credit Revenue
3. Posted and approved by the same person
4. Persons passing entries or adjustments who generally do not pass entries
5. Unusual time of the day / on holidays/weekends etc.
6. Amounts having round numbers or same ending numbers
a. Numbers ending with 0000 or 9999 etc.
7. Small value entries but the volume of such entries are many.
8. Accounts that have significant estimates or period end adjustments
9. Accounts identified with risk of material misstatement
10. Entries passed after the books have been closed. Etc.
7.5 Software Testing of Scripts The process of identifying NSJE and applying the JE criteria for testing is a long and time consuming process every year. Once the auditor understands the processes and controls in place to pass Journal entries, the type of journal entries, the information system (ERP) used to pass such entries etc., this process may be automated to build in efficiencies within the audit. The auditor need not spend time on operational matters. This will also assist the auditor in spending productive time performing the audit, analysing the data.
The auditor can take help from IT members in his audit team to develop a script whereby the data can be extracted.

Downloaded from : taxupindia.com
main source : ICAI
AUDITING IN AN ERP ENVIRONMENT
116 ADVANCED INFORMATION TECHNOLOGY
The auditor can build in the rules or code, the data fields mentioned in Section 3.1 above to extract the data.
The auditor can provide this to the company’s IT team to schedule the data extraction automatically.
Once data is obtained, the auditor can also write scripts for the JE criteria to run automatically. The JE criteria is mentioned in Section 4.
Based on the results obtained, the auditor can test the list of journal entries obtained after applying the filters.
Safeguards to be applied while using scripts:
The auditor should be careful to see that the scripts are updated in all respects. For example – if the company has added a new period/ new journal type/new user id, the scripts should be updated immediately.
The auditor should ensure that the company do not make any unauthorised changes to the script without the knowledge of the auditor. The scripts are the property of the auditor.
The auditor should plan the process of extraction in such a way that the scripts are run by the company’s IT team in the presence of the audit team and the output is provided to the auditor without any modifications.
7.6 Exercises 1. The unusual, non recurring transactions may generally be directly entered in
(a) Sub ledgers
(b) General Ledger
(c) Excel sheets
(d) None of the above
2. Estimates, impairments are generally a type of
(a) Standard Journals
(b) Top up journals
(c) Non Standard journals
(d) None of the above
3. While understanding the IT/ERP systems used to record entries, the points to note are:
(a) Accounting software / ERP used
(b) Automated or Manual entries
(c) SA/SOD among IT and Business teams
(d) Timing of passing the entries
(e) All of the above

Downloaded from : taxupindia.com
main source : ICAI
NON STANDARD JOURNAL ENTRIES
ADVANCED INFORMATION TECHNOLOGY 117
4. Some of the fraud risk factors to note which may lead to unusual transactions are:
(a) Sales Targets
(b) Personal gain such as Bonus, incentives etc.
(c) Debts requirements for banks etc.
(d) All of the above
5. A key factor to be kept in mind while making enquiries of personnel are:
(a) Ask close ended questions
(b) No discussions required
(c) Ask open ended questions
(d) None of the above
6. Entries maintained outside the system and impact the financial statements are:
(a) Top up entries
(b) Standard Journal entries
(c) Non Standard Journal Entries
(d) None of the above
7. Which is the main risk due to Non Standard Journal entries:
(a) Risk of Material misstatement
(b) Risk of management override of controls
(c) Risk of lack of sensitive access
(d) Risk of lack of segregation of duties.
8. It is possible that a Non standard journal entry may not have relevant ____________ supportings.
9. A common method to test for completeness of data is _________________ testing.
10. In industries/sectors, where volume of data is huge, ________________ testing may not be an appropriate way of testing completeness of data.
11. Before testing Journal entries, it is necessary to test the controls surrounding the process of passing Journal Entries.
(a) True
(b) False
12. One way of auditor enquiring about unusual activities at a client location is to ask ________ questions.
13. ______________ to be achieved may be a key fraud risk factor from an investor/ stock holder perspective leading to Non standard journal entries.
14. _____________ to be achieved may be a key fraud risk factor from a bank/financial institution perspective.

Downloaded from : taxupindia.com
main source : ICAI
AUDITING IN AN ERP ENVIRONMENT
118 ADVANCED INFORMATION TECHNOLOGY
15. To bring in efficiencies in the process of extraction and analysis of JE data, the auditor may use ____________ .
7.7 References and further reading 1. Standards on Auditing published by the Institute of Chartered Accountants of India (ICAI), www.icai.org
> Resources
2. Guidance Note on Audit of Internal Financial Controls Over Financial Reporting issued by Auditing and Assurance Standards Board. - (14-09-2015), www.icai.org
3. Companies Act 2013, www.mca.gov.in/Ministry/pdf/CompaniesAct2013.pdf
7.8 Case Study Access Ltd is an IT company with its headquarters in India and 6 branches across the globe - 2 in USA, 2 in Europe and 2 in Asia Pacific. The main revenue streams of the company are IT/ITES services. The company services customers in the Americas, Europe and Asia Pacific. They have 7 offices along with the Headquarters in India.
These 7 offices have their own administrative teams, finance teams , sales teams etc. They transact with the HQ as well amongst themselves. Each office is a Revenue centre and hence costs/expenses are tracked separately by them. The finance team individually draws up a TB, P&L account and B/S capturing their numbers separately. The books of accounts are maintained separately by each office and audited at the location by a locally appointed auditor. The signed audit report is sent to HQ for consolidation.
Since, the HQ is in India, the main auditors are located in India. The main auditors, audit the consolidated set of accounts.
The company is using SAP as their main ERP. Since, the company is a well established company with a large clientele, the number of transactions are substantial. Totally they have about 5000 transactions per month at the HQ. The transactions are passed by the Sales Personnel, Finance personnel etc. All the operations are automated and hence most of the entries automatically flow into the General Ledger. The Finance team as part of the book closure process also pass manual entries as appropriate.
You are a member of the audit team. You have been informed that the IT personnel in the team have evaluated and tested the GITC’s and found them effective. You have tested the Sensitive access (SA) and Segregation of Duties (SOD) as defined in the process and the system and found them effective. The other internal controls in the processes are also effective.
The audit strategy is to test Non standard Journal entries. You have been asked to devise a procedure to test the entries. You will discuss and finalise the audit procedure with your Audit Manager.
7.9 Answer to Exercise 1. Answer is b - General Ledger.

Downloaded from : taxupindia.com
main source : ICAI
NON STANDARD JOURNAL ENTRIES
ADVANCED INFORMATION TECHNOLOGY 119
Generally, the non-recurring transactions may not have a supporting. To be passed in Sub ledgers, it may require collusion among personnel. Hence, they are passed in General Ledger.
2. Answer is c – Non Standard Journals.
These are based on certain assumptions etc and not passed as part of a standard/routine operation.
3. The answer is e – All of the above.
All the factors are necessary to be noted while understanding the IT/ERP system.
4. The answer is d – All of the above.
All are relevant risk factors which may lead to unusual transactions.
5. The answer is c – Ask open ended questions
By asking open ended questions, the auditor will be able to extract more information from the auditee. This will enable the auditor to ask more relevant questions.
6. The answer is a – Top up entries.
These entries are usually passed after the books are closed and before the financial statements are finalised.
7. The answer is a – Risk of material misstatement.
NSJE are entries that may be passed as a result of fraud. Hence, this is the main risk. Another risk can also be risk of management override of controls.
8. “Printed”
9. “Roll forward”
10. “Roll forward”
11. The answer is True.
As part of the requirements of IFC, the controls pertaining to Journal entry process need also to be evaluated and tested.
12. “Open ended”
13. “Sales targets”
14. “Debt requirements”
15. “Software scripts”
7.10 ANSWER TO CASE STUDY 1. The HQ in India will have regular transactions and Inter company transactions.
2. As part of the evaluation of the IT and Business processes, the automated controls have been found to be effective. The journal types of automated entries should be identified.
3. Understand from the company, the manual entries and inter company entries passed. Understand the Journal type used for such entries.

Downloaded from : taxupindia.com
main source : ICAI
AUDITING IN AN ERP ENVIRONMENT
120 ADVANCED INFORMATION TECHNOLOGY
4. Focus should be only on those entries. If the list of such entries can be separately extracted, the list should be reconciled with the TB and then tested.
5. If the separate list cannot be extracted:
(a) the full list of entries should be extracted including automated entries.
(b) Roll forward testing should be performed including the Opening and Closing Trial Balances
(c) The automated transactions, based on the Journal types identified earlier should be removed from the list. Thus, only manual transactions remain.
(d) From the manual transactions list, the inter company transactions should be removed.
(e) On the remaining population, the auditor should apply the JE criteria and obtain a filtered list to test.
6. The full list of Intercompany transactions should be tested separately. A reconciliation statement may be sent to each office to confirm the balance.
7. The auditor may also speak to the component auditors to understand the procedures followed by them to test NSJE at the individual offices.
7.11 Glossary NSJE - Non Standard Journal Entries
ERP – Enterprise Resource Planning
SA – Sensitive Access
SOD – Segregation of Duties
ACL – Automated Command Language
CAATS – Computer Assisted Audit Techniques

Downloaded from : taxupindia.com
main source : ICAI
UNIT-2 DATABASE APPLICATION USING MS-ACCESS

Downloaded from : taxupindia.com
main source : ICAI

Downloaded from : taxupindia.com
main source : ICAI
ADVANCED SQL QUERIES
1.1 Introduction Queries are an essential part of database. They are used to extract required data from one or more tables and present the result in a datasheet or on a Form or Report. They can be considered as questions asked to a table in a database. Access 2010 provides a graphical tool known as Query Designer to create queries. Queries are not only used to retrieve data from tables, but can also be used to insert, update or append data in tables, to filter data, to perform calculations with data, to summarize data and to automate data management tasks.
This chapter focuses on creating different types of queries and their different usage. The first part of the chapter talks about Sub-queries, in which the criterion for a query is query itself, i.e. writing a query within query. The next part of the chapter talks about working with Query Wizard and learning how to find unmatched data between two tables and to find duplicate rows within a table. We will also learn to create a summarised result out of queries using the crosstab queries. Crosstab queries can be taken as a tabular format of Pivot tables. This chapter also introduces the multiple views of the query and how to get query results in the form of Pivot Tables or Pivot Charts.
In addition to the above queries, we will also learn to create a query on multiple tables, specify different join types to retrieve the desired result. We can create joins between the tables using relationship window provided by Access 2010, or we can create joins at the query design window. Access 2010 also has many functions and operators which can be used to create expressions. This chapter discusses how to use these functions to create a new column from an existing column. The chapter also highlights some of the advanced queries available in Access 2010 and illustrates their significance using case studies.
LEARNING OBJECTIVES Writing Advanced Queries
Creating Sub-queries Creating Unmatched and Duplicate Queries Grouping and Summarizing Records using Criteria Summarizing Data using Crosstab Query Creating a Pivot Table and a Pivot Chart
Joining Tables in Queries Calculated Fields
CHAPTER
1

Downloaded from : taxupindia.com
main source : ICAI
DATABASE APPLICATIONS USING MS-ACCESS
124 ADVANCED INFORMATION TECHNOLOGY
1.2 Writing Advanced Queries Access 2010 has the capability to handle far advanced queries than the simple criteria based queries. The queries in Access 2010 not only allow users to change the existing data, but also to generate summary reports. This section discusses few advanced queries handled by Access 2010, such as Sub-queries, Crosstab Queries, Creating Unmatched and Duplicate Queries, and also creating PivotTable and PivotChart through queries.
1.2.1 Creating Sub-queries
A sub-query is a query nested inside another query. We can use Sub-queries within Select query, Action query or within other Sub-queries. Sub-queries in Select statement can be the part of Where clause or having clause in Group By query. For Action queries, we can use Sub-queries to change the records which match some values in other tables.
Fig. 1.2.1 shows an example of a sub-query in a Select statement.
SELECT * FROM Products
WHERE ProductID IN
(SELECT ProductID FROM OrderDetails WHERE Discount >= .25);
Fig. 1.2.1. Subquery Example
This query retrieves all the columns from table Products based on the criteria that the discount on the products in the OrderDetails table must be greater than or equal to 25%. Notice that to present the criteria of discount for Products, we have used a sub-query in the WHERE clause.
Points to be noted while writing a sub-query:
The sub-query must always be written as an SQL statement.
The sub-query is always written in brackets ( ).
If we are using the same table for the main query and sub-query, we need to provide aliases (alternate names) to the tables.
If a sub-query is returning more than one row, the IN, ANY, ALL or EXISTS clause should be used in the WHERE statement.
1.2.1.1 Problem Scenario
Rohit is an Accountant in Apex Ltd. At the closing of the quarter, he has to check the Invoices for which the payments are made in Quarter-I of year 2008.
Solution
For the purpose of solving the above requirement, a query is created to retrieve all records from Invoices table for which the Payment Date in Payments table lies in Quarter-I i.e. between 1/1/2008 and 4/30/2008. Since we do not require any details from the Payments table, we use the table in a sub-query.

Downloaded from : taxupindia.com
main source : ICAI
ADVANCED SQL QUERIES
ADVANCED INFORMATION TECHNOLOGY 125
Steps for retrieving records from table INVOICES
1. Open the Show Table dialog box, by clicking on Create -> Queries -> Query Design.
2. Select the Invoice table from Show Table window and click Add, as shown in Fig. 1.2.2.
Fig. 1.2.2: Show Table window
3. Click Close.
4. The Query Designer Window appears, as shown in Fig. 1.2.3.
Fig. 1.2.3: Query Designer Window

Downloaded from : taxupindia.com
main source : ICAI
DATABASE APPLICATIONS USING MS-ACCESS
126 ADVANCED INFORMATION TECHNOLOGY
5. Select the fields Invoice Number, Sales Order Number, Type of Invoice, Invoice Date, Source of Order and Payment Terms from table Invoice and drag them to the Columns tab as shown in Fig. 1.2.4.
Fig. 1.2.4: Drag the required columns
6. Click the Save button at Quick Access Toolbar to save the query. Type the name of query as Invoices Paid Q1 as shown in Fig. 1.2.5.
Fig. 1.2.5: Save the Query

Downloaded from : taxupindia.com
main source : ICAI
ADVANCED SQL QUERIES
ADVANCED INFORMATION TECHNOLOGY 127
Now we create a SQL Statement for sub-query. The SQL Statement for the sub-query can be written directly in the criteria clause with the Select syntax or we may create another query using Query Designer and then copy the generated SQL. For the current scenario, we use the latter method.
Steps for writing a query to retrieve Invoice Number from Payments where Paid Date is in Quarter-I of year 2008
1. Open the Show Table dialog box, by clicking on Create -> Queries -> Query Design.
2. Select the Payments table from Show Table window and click Add, as shown in Fig. 1.2.6.
Fig. 1.2.6: Show Table window 3. Click Close.
4. Double-click the columns Invoice Number and Date Paid so that they appear in the Columns tab in Query Design as shown in Fig. 1.2.7.

Downloaded from : taxupindia.com
main source : ICAI
DATABASE APPLICATIONS USING MS-ACCESS
128 ADVANCED INFORMATION TECHNOLOGY
Fig. 1.2.7: Select Required columns 5. In the Criteria section of the Date Paid Column, write the criteria BETWEEN #1/1/2008# AND
#4/30/2008# and clear the Show checkbox. The Query Design window should appear, as shown in Fig. 1.2.8.
Fig. 1.2.8: Specify the criteria

Downloaded from : taxupindia.com
main source : ICAI
ADVANCED SQL QUERIES
ADVANCED INFORMATION TECHNOLOGY 129
6. Click the Run icon in Design -> Results to view that the proper result is coming.
7. Click on SQL View from Design -> Results -> View drop-down to view the SQL statement of the query. The SQL statement appears for the query, as shown in Fig. 1.2.9.
Fig. 1.2.9: Query SQL View
8. Copy the SQL statement and switch to the Query window of Invoices Paid Q1.
Steps to add a sub-query to Invoices Paid Q1 query
9. In the Criteria tab of Invoice Number column, type IN() and paste the copied query within the braces. The Query window appears, as shown in Fig. 1.2.10.
Fig. 1.2.10: Write subquery in Criteria

Downloaded from : taxupindia.com
main source : ICAI
DATABASE APPLICATIONS USING MS-ACCESS
130 ADVANCED INFORMATION TECHNOLOGY
10. Click the Run icon in Design -> Results to view that the proper result is coming.
In a similar manner as demonstrated by an example above, Sub-queries can be used as a SQL statement for criteria of Action queries, Group By queries etc.
NOTE: We can also use Sub-queries as an expression to create a new column as a query result.
1.2.2 Creating Unmatched and Duplicate Queries Query Wizard available in Access 2010 can be used to create different types of queries. Along with several different queries, it also provides queries to find duplicate records in a table on the basis of one or more fields in a table. In a similar manner, we can create Unmatched Query to compare two tables and find the records that do not have matching values in given columns.
1.2.2.1 Unmatched Queries
Find Unmatched Records Query will examine the data found in two different tables/queries and compare the records based on a common field. It will return the records from the first table which do not have matching values in second table.
The easiest way to create Unmatched Query is by using the Find Unmatched Query Wizard. After the wizard builds query, we can modify the query's design to add or remove fields, or to modify joins as required.
Unmatched Query Wizard in Access 2010 asks for the names of the two tables to compare, and common field name between the tables. The wizard then confirms the fields that we wish to retrieve from the first table as a query result. Finally, the wizard prompts to enter the query name and creates the query.
This type of query can help find records that have no corresponding records in other tables. For example, we may be looking for products that have not been sold in any order or may be for customers who have not placed any orders.
1.2.2.2 Problem Scenario
Ankur Mathur, Sales Head of Apex Ltd. wishes to reduce the production of few products. To analyse which products should not be produced further, he needs to find out the products which have not been ordered so far.
Solution
For the purpose of finding the unmatched products in Sales Item Description, we use Unmatched Query Wizard and find out products from Inventory table which do not have a matching Item Number in Sales Item Description table.
Steps for creating Unmatched Query using Query Wizard:
1. Open the Query Wizard by selecting Query Wizard from Create -> Queries, as indicated in Fig. 1.2.11.
Fig. 1.2.11: Open Query Wizard

Downloaded from : taxupindia.com
main source : ICAI
ADVANCED SQL QUERIES
ADVANCED INFORMATION TECHNOLOGY 131
2. The New Query window appears, as shown in Fig. 1.2.12.
Fig. 1.2.12: New Query Dialog Box
3. Select Find Unmatched Query Wizard from the New Query window and click OK, as shown in Fig. 1.2.13.
Fig. 1.2.13: Select Find Unmatched Query Wizard
4. The Find Unmatched Query Wizard appears. Select the table Inventory and click Next, as shown in Fig. 1.2.14.

Downloaded from : taxupindia.com
main source : ICAI
DATABASE APPLICATIONS USING MS-ACCESS
132 ADVANCED INFORMATION TECHNOLOGY
Fig. 1.2.14: Select Table Inventory
5. Select the table Sales Item Description from second page of the wizard as we need to compare Inventory table to Sales Item Description table, as shown in Fig. 1.2.15. Click Next.
Fig. 1.2.15: Select Table Sales Item Description
6. Now, we need to mark the common field in both the tables to be compared. For this example, select
the Item Number in both Inventory and Sales Item Description table and click button, as

Downloaded from : taxupindia.com
main source : ICAI
ADVANCED SQL QUERIES
ADVANCED INFORMATION TECHNOLOGY 133
shown in Fig. 1.2.16. Click Next to move to next page.
Fig. 1.2.16: Match the common fields between two tables
7. On the next page in wizard, select the columns that should be the part of query result and click Next. In this page, select Item Number, Class, Category, Sub Category, Description, Manufacturer, Model and Cost fields as shown in Fig. 1.2.17. Click Next to move to next page.
Fig. 1.2.17: Select the Fields
NOTE: Use button to move a selected field from Available fields to Selected fields,

Downloaded from : taxupindia.com
main source : ICAI
DATABASE APPLICATIONS USING MS-ACCESS
134 ADVANCED INFORMATION TECHNOLOGY
button to move all fields from Available fields to Selected fields, button to move selected
field from Selected fields to Available fields, button to move all fields from Selected fields to Available fields.
8. Name the Query as “Products without Orders” in the final window that appears and click Finish as shown in Fig. 1.2.18.
Fig. 1.2.18: Name the query
9. The result of the query appears as in datasheet form, indicating the products that do not have an order associated with them, as shown in Fig. 1.2.19.
Fig. 1.2.19: Query Result

Downloaded from : taxupindia.com
main source : ICAI
ADVANCED SQL QUERIES
ADVANCED INFORMATION TECHNOLOGY 135
1.2.2.3 Duplicate Queries
The Duplicate Queries option creates a query that reports which records in a table are duplicated by matching one or more fields in the table. The Query Wizard first confirms which fields have to be used to check for duplication and then prompts to enter some other fields that may be a part of query result. Finally, Access 2010 accepts a name for the query and displays the results as a datasheet.
This type of query is useful when we have no unique indexes or primary key in the table, or the data for the table is imported from a source where we do not have mechanism to check duplicate values.
1.2.2.4 Problem Scenario
Varun Gupta, a Chartered Accountant in Apex Ltd., is required to audit the invoices and the payments. While tracking the payments he noticed that multiple invoices have been created for a single sales order. To sort out the things, he wishes to check all the sales order having duplicate invoices.
Solution
Create a Find Duplicate Query for table Invoices based on the field Sales Order Number so that it displays all the duplicate invoices created for a single sales order.
Steps for Finding Duplicate records in the table Invoices
1. Open the Query Wizard by selecting Query Wizard from Create -> Queries.
2. Select Find Duplicates Query Wizard from the New Query dialog box and click OK, as shown in Fig. 1.2.20.
Fig. 1.2.20: Select Find Duplicates Query Wizard
3. The Find Duplicates Query Wizard appears. Select the table Invoice and click Next as shown in Fig. 1.2.21.

Downloaded from : taxupindia.com
main source : ICAI
DATABASE APPLICATIONS USING MS-ACCESS
136 ADVANCED INFORMATION TECHNOLOGY
Fig. 1.2.21: Select Table Invoice
4. Select the column on the basis of which the duplicate records need to be matched and click Next. In this scenario, select Sales Order Number as shown in Fig. 1.2.22. Click Next.
Fig. 1.2.22: Select the column for Duplicate values

Downloaded from : taxupindia.com
main source : ICAI
ADVANCED SQL QUERIES
ADVANCED INFORMATION TECHNOLOGY 137
5. Select the columns that should be the part of the query result and click Next. In this dialog box, select Invoice Number, Type of Invoice, Invoice Date, Source of Order and Payments Terms, as shown in Fig. 1.2.23. Click Next.
Fig. 1.2.23: Select the columns for Query Result
6. Name the Query as “Duplicate Invoices” in the final window that appears and click Finish, as shown in Fig. 1.2.24.
Fig. 1.2.24: Name the Query

Downloaded from : taxupindia.com
main source : ICAI
DATABASE APPLICATIONS USING MS-ACCESS
138 ADVANCED INFORMATION TECHNOLOGY
7. The result of the query appears in Datasheet form with all the Sales Order having multiple invoices, as shown in Fig. 1.2.25.
NOTE: We can create Find Duplicate Query by matching records on multiple fields also. This query can also be used to find duplicate records in a table by matching records on all the fields (considering that we can match only 10 fields at a time).
Fig. 1.2.25: Query Result
1.2.3 Grouping and summarising Records using Criteria Access 2010 provides queries that can be used for obtaining the aggregated results instead of individual records. These queries may be helpful in retrieving count of records, sum, average, and maximum or minimum of the values in a column. These queries are known as Group By queries or Totals Query. Such queries can return the aggregated results from the entire table or the records of the table filtered by a certain criteria.
1.2.3.1 Grouping and summarising Records
At times, it is required to retrieve information in tables based on a group of one or more fields. For example, total number of contacts from a particular area or a sum of all the payments received in a month. Access 2010 provides a method to obtain the desired result using queries without the need of any complex programming. It calculates the totals using several aggregate functions.
Access 2010 performs grouping of the records by using Totals option available in the Query Tools tab, as shown in Fig. 1.2.26.

Downloaded from : taxupindia.com
main source : ICAI
ADVANCED SQL QUERIES
ADVANCED INFORMATION TECHNOLOGY 139
Fig. 1.2.26: Totals option in Design tab
The Totals option adds a new row in the Query Designer window which enables the application of summary functions to columns as indicated in Fig. 1.2.27.
Fig. 1.2.27: Total Row added
A list of Aggregate Functions that can be used with Totals Query is given in Table 1.2.1.
FUNCTION NAME EXPLANATION
Sum() Returns the sum of numeric data for a column or set of values in a column
Count() Counts the set of values that satisfy the given criteria
Avg() Returns average of numeric data for a column or set of values in a column
Max() Returns a maximum value from a set of values
Min() Returns a minimum value from a set of values
Var() Returns the variance of values in a column or set of values
Stdev() Returns a standard deviation for a set of data values
First() Returns the first value from a list of text values
Last() Returns the last value from a list of text values
Table 1.2.1: Aggregate Functions
1.2.3.2 Problem Scenario
The Country Head in Apex Ltd. wishes to compute the sales volume of its products. He also would like to see the number of orders placed for each product, so that they can focus on products with greater sales volume.

Downloaded from : taxupindia.com
main source : ICAI
DATABASE APPLICATIONS USING MS-ACCESS
140 ADVANCED INFORMATION TECHNOLOGY
Solution:
Create a Total query that calculates the count of orders placed for each product and arrange them in descending order of the counts so as to find the products which are sold more.
Steps for creating a total query
1. Open the Query Design window by selecting Query Design from Create -> Queries, as indicated in Fig. 1.2.28.
Fig. 1.2.28: Opening the Query Design window
2. Select the Inventory and Sales Item Description tables from Show Table dialog box and click Add, as shown in Fig. 1.2.29.
NOTE: Multiple tables can be selected in the Show Table window by pressing CTRL key and then selecting the tables.
Fig. 1.2.29: Show Table window
3. Click Close. We can see the two tables with a 1:∞ relationship. This relationship has been created while creating the database.

Downloaded from : taxupindia.com
main source : ICAI
ADVANCED SQL QUERIES
ADVANCED INFORMATION TECHNOLOGY 141
4. Click the Totals button in the Show/Hide group on the Design tab, as shown as Fig. 1.2.30.
Fig. 1.2.30: Click on Totals button
5. Select the fields Category and Item Number from Inventory table and drag them to the Columns tab. Similarly, select fields Sales Order Number from Sales Item Description table and drag it to Columns tab. The Query Window appears as shown in Fig. 1.2.31.
Fig. 1.2.31: Select the required columns

Downloaded from : taxupindia.com
main source : ICAI
DATABASE APPLICATIONS USING MS-ACCESS
142 ADVANCED INFORMATION TECHNOLOGY
6. In the column Sales Order Number, change the Group By function to Count, as shown in Fig. 1.2.32.
Notice that we have set Group By on columns Category and Item Number, so that the query first groups all the items according to their category and then all the items in same category on the basis of Item Number. The Count function with Sales Order Number indicates that we wish to compute the count of total Sales Orders for a group created.
Fig. 1.2.32: Set the Totals Function
7. Click Run in Design -> Results to view the results. The result of the query appears, as shown in
Fig. 1.2.33.

Downloaded from : taxupindia.com
main source : ICAI
ADVANCED SQL QUERIES
ADVANCED INFORMATION TECHNOLOGY 143
Fig. 1.2.33: Query Result
NOTE: The Query result just shows all the products arranged in group of Category and Item Number and their volume sold. To get the products which are sold more, the column CountOfSales Order Number has to be arranged in order that it appears from most sold to least sold.
8. Reopen the query in Design View by clicking Design View from Home -> Views.
9. In the column Sales Order Number, set the sort order as descending, as shown in Fig. 1.2.34.

Downloaded from : taxupindia.com
main source : ICAI
DATABASE APPLICATIONS USING MS-ACCESS
144 ADVANCED INFORMATION TECHNOLOGY
Fig. 1.2.34: Set the sort order
10. Click Run in Design -> Results to view the result. The result appears as shown in Fig. 1.2.35.

Downloaded from : taxupindia.com
main source : ICAI
ADVANCED SQL QUERIES
ADVANCED INFORMATION TECHNOLOGY 145
Fig. 1.2.35: Query Results sorted according to sales of Product
11. Click the Save button on Quick Access Toolbar to save the query. Type the name of query as Product Sales Volume.
NOTE: Queries are required to be saved for future use if the same result is desired again; it saves the effort and time of recreating the query.
1.2.3.3 Applying Criteria to Records
A criterion limits the records that are displayed as result, on the basis of values in a field. A criterion in Total queries can be created against Group By, Aggregate Total, Non-Aggregate Total fields. For Group By and Aggregate Total, criteria can be mentioned using Criteria tab of Query Design window. For the Non-Aggregate Total field, the criteria can only be specified using the Where clause instead of Group By or Aggregate function in Total tab of Query Design window.
Using any one, any two, or all three of these criteria, the scope of Total query can be limited to finite criteria.
1.2.3.4 Problem Scenario
Considering the problem of retrieving Sales volume of Products as discussed in Section 2.2.3.1, Country Head wants to have a look at only the products with at least an order count of three. The management authority also thought of maintaining the products which are cheaper and have more sales volume.
Solution
Update the Total query Product Sales Volume created above and apply criteria “>=3” on the Sales Order Number count to ensure that only the products with at least an order count of three are retrieved as a query result. Also, add criteria “<50” to the Cost field of the products so that management can have a view on the cheaper products.

Downloaded from : taxupindia.com
main source : ICAI
DATABASE APPLICATIONS USING MS-ACCESS
146 ADVANCED INFORMATION TECHNOLOGY
1. Open the query Product Sales Volume in Design view. To do this, right-click the query and select Design View.
2. In the column Sales Order Number, type “>=3” in the Criteria tab as shown in Fig. 1.2.36.
Fig. 1.2.36: Insert Criteria for Sales Order Number
3. Click Run in Design -> Results to view the result. The result of the query appears as shown in Fig.
1.2.37.

Downloaded from : taxupindia.com
main source : ICAI
ADVANCED SQL QUERIES
ADVANCED INFORMATION TECHNOLOGY 147
. Fig. 1.2.37: Query Result for Products having at least 3 Sales Orders
Now, include only the products which cost less than 50.00 in the query result. Since Cost is a non-aggregate field, the criteria for the Cost is included in the Where clause of Total tab.
4. Double-click the field Cost in the Inventory table so as to include it into the Field tab of Query Design window.
5. Change the Group By function of column Cost to Where clause in Total tab and write “<50” in the Criteria tab, as shown in Fig. 1.2.38.
Note that the Show checkbox is cleared as Cost is a non-aggregate field and not a part of the query result.
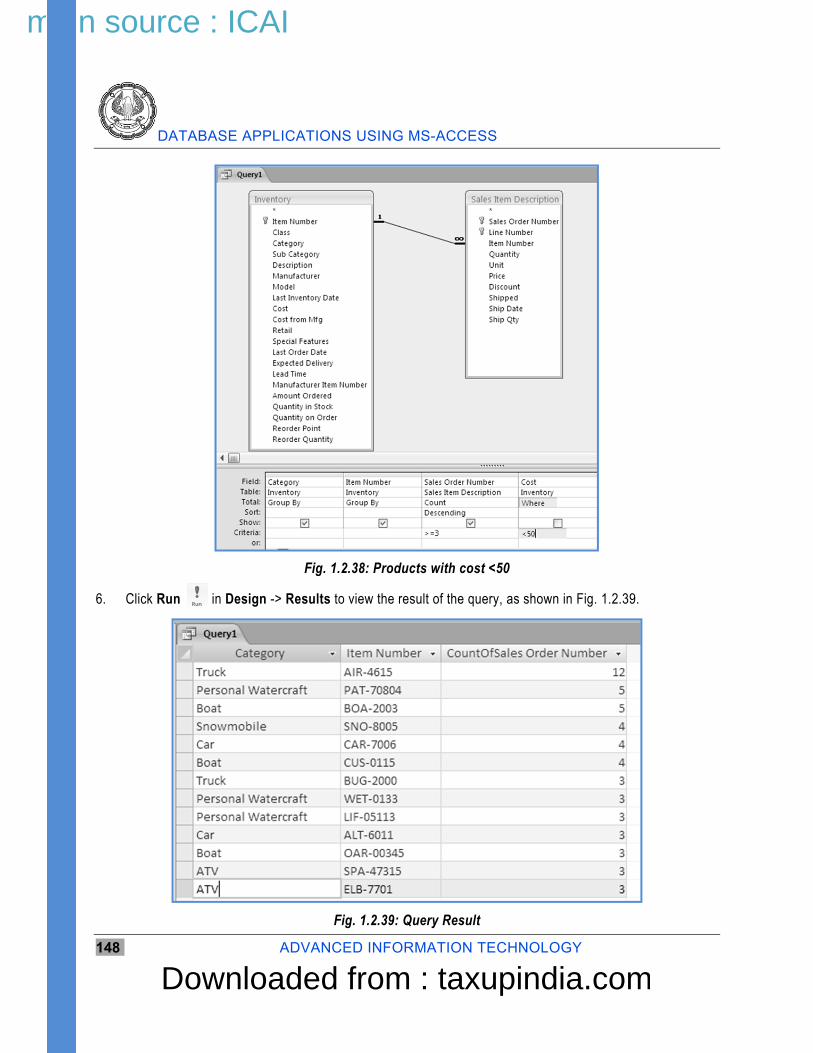
Downloaded from : taxupindia.com
main source : ICAI
DATABASE APPLICATIONS USING MS-ACCESS
148 ADVANCED INFORMATION TECHNOLOGY
Fig. 1.2.38: Products with cost <50
6. Click Run in Design -> Results to view the result of the query, as shown in Fig. 1.2.39.
Fig. 1.2.39: Query Result

Downloaded from : taxupindia.com
main source : ICAI
ADVANCED SQL QUERIES
ADVANCED INFORMATION TECHNOLOGY 149
7. Click Save at Quick Access Toolbar to save the query.
1.2.4 Grouping and summarizing Records using a Crosstab Query Crosstab query is an excellent analytical tool. It is a special type of query that can be created to describe one numerical quantity in terms of two other fields. Crosstab queries are useful for summarizing information, and are somewhat similar to pivot tables in MS-Excel.
For example, we might want to have a table that contains the sales figures of entire inventory for the whole year, and the amount of money that is made per product during each month of the year. In this case, a crosstab query would be the right way to display the information.
Access 2010 provides an option to create Crosstab query through Query Wizard. Each crosstab query will include one or more Row Heading, a single Column Heading and a Value to be displayed at the intersection of row and column.
1.2.4.1 Problem Scenario
The company Apex Ltd. wishes to revise the credit limit of its customers. For this purpose, Ashish, the PRO needs a summary report that indicates the count of orders placed by each customer in every month of last financial year i.e. 2011-2012.
Solution
To obtain the desired summary report, create a Crosstab query on table Sales Order with month of Sales Date as row heading, Customer Number as column heading and count of Sales Order Number as values. We create this query using the Query Wizard.
Steps for creating Crosstab queries
1. Open the Query Wizard by selecting Query Wizard from Create -> Queries
2. Select Crosstab Query Wizard from the New Query dialog box and click OK as in Fig. 1.2.40.
Fig. 1.2.40: Select Crosstab Query Wizard

Downloaded from : taxupindia.com
main source : ICAI
DATABASE APPLICATIONS USING MS-ACCESS
150 ADVANCED INFORMATION TECHNOLOGY
3. The Crosstab Query Wizard appears. Select the table Sales Order and click Next as shown in Fig. 1.2.41.
Fig. 1.2.41: Select Table Sales Order
4. The next page in Query Wizard confirms the column to be taken as Row Heading. In this window, select the column Sales Date as shown in Fig. 1.2.42 and click Next.
Fig. 1.2.42: Select column Sales Date for Row Heading

Downloaded from : taxupindia.com
main source : ICAI
ADVANCED SQL QUERIES
ADVANCED INFORMATION TECHNOLOGY 151
5. Select the column to be taken as Column Heading in the next window of the Query Wizard that appears. In this window, select the column Sold to Customer as shown in Fig. 1.2.43 and click Next.
Fig. 1.2.43: Select column Sold to Customer for Column Heading
6. Next page in the wizard prompts to specify the values that should appear on the intersection of rows and columns. Select the column Sales Order Number from the Fields tab and Count from the Functions tab in this page, as shown in Fig. 1.2.44. Click Next.
NOTE: This page has a checkbox Yes, include row sums; which if checked, allows the inclusion of the grand total of values in the row as a column in the query result.

Downloaded from : taxupindia.com
main source : ICAI
DATABASE APPLICATIONS USING MS-ACCESS
152 ADVANCED INFORMATION TECHNOLOGY
Fig. 1.2.44: Select Sales Order Number Count as values
7. Write the name for the query as “Customer-Month wise Sales” in the final window that appears and click Finish, as shown in Fig. 1.2.45. We can also choose the default query name that the wizard displays.
Fig. 1.2.45: Name the query

Downloaded from : taxupindia.com
main source : ICAI
ADVANCED SQL QUERIES
ADVANCED INFORMATION TECHNOLOGY 153
8. The result of the query appears in Datasheet form, as shown in Fig. 1.2.46.
Fig. 1.2.46: Query Result
NOTE: The query result is not as desired as it displays the values on the basis of the Sales Date and not on Sales Month. To view these results on the basis of Sales Month, we are required to make changes in the query design and change the column Sales Date to the Month (Sales Date) and also provide a criterion that the months must be in last financial year.
Steps to group results on Sales Order Month
1. Reopen the query in design view by clicking the Design View from Home -> Views.
2. Click on field Sales Date and write the expression Sales Month: Month ([Sales Date]) in Field tab as shown in Fig. 1.2.47.
NOTE: We can use the function Month Name() to get names of month instead of numbers in query results.

Downloaded from : taxupindia.com
main source : ICAI
DATABASE APPLICATIONS USING MS-ACCESS
154 ADVANCED INFORMATION TECHNOLOGY
Fig. 1.2.47: Change the expression of field Sales Date
Steps to provide the criteria for last financial year
1. Double-click the column Sales Date from table Sales Order such that it appears in Field tab. Change the value of Total tab to Where and add the expression Between 4/1/2011 AND 3/31/2012 to the Criteria tab as shown in Fig. 1.2.48.
Fig. 1.2.48: Provide a criteria to Sales Date column

Downloaded from : taxupindia.com
main source : ICAI
ADVANCED SQL QUERIES
ADVANCED INFORMATION TECHNOLOGY 155
NOTE: The Access 2010 query window has changed the criteria expression suitable to match column values.
2. Click Run in Design -> Results to view the modified result as shown in Fig.1.2.49.
Fig. 1.2.49: Query Result
NOTE: The result of the query appears as a 3-dimensional table with Months on rows, Customer No. on columns and the Count of orders as values.
Crosstab Queries are capable of handling much more complex calculations. These queries can be based on another query using multiple tables or may use different level of grouping by having more than one row heading. Also, Crosstab queries can be created by Query Design by changing the query type to Crosstab.
1.2.5 Creating a PivotTable and PivotChart
The powerful tool of MS-Excel PivotTable and PivotChart is also available in Access 2010 to summarize data. Interactive Pivot Tables and Pivot Charts enable the manipulation of summary data, and therefore can save ample time to create multiple queries and reports to achieve the same results.
1.2.5.1 PivotTable
A PivotTable is a view in Access Queries that allows summarising and examining data in a datasheet form. It is used to group values as rows and columns with a calculated value at the intersection of each row and column. A PivotTable can be considered as a modified form of Crosstab queries discussed in the above section. A PivotTable is created by dragging fields to the appropriate area on the design screen. Data can also be broken down to different levels of detail, such as showing earnings by year, quarter, or month.
The PivotTable view in a query can be obtained by selecting the PivotTable View from the Views drop-down in Home tab as indicated in Fig. 1.2.50.

Downloaded from : taxupindia.com
main source : ICAI
DATABASE APPLICATIONS USING MS-ACCESS
156 ADVANCED INFORMATION TECHNOLOGY
Fig. 1.2.50: PivotTable View
The PivotTable is shown in Fig. 1.2.51.
Fig. 1.2.51: PivotTable
A PivotTable has four areas for dropping fields whose values are summarized. The description of these areas is shown in Table 2.2.2.

Downloaded from : taxupindia.com
main source : ICAI
ADVANCED SQL QUERIES
ADVANCED INFORMATION TECHNOLOGY 157
Drop Area Description
Filter Area Is used for the fields that are used as a filter for PivotTable
Column Area The fields selected to be displayed as column headings are included in this area
Row Area The fields selected to be displayed as row headings are dropped in this area
Totals Or Detail Area The field values to be used for calculations or summarization are dragged and dropped in this area, and the value is displayed at the intersection of a row and column
Table 1.2.2: Drop Area in Pivot Table
1.2.5.2 Problem Scenario
The Head of Sales Department in Apex Ltd. has demanded a Sales Summary report for review. The following are the desired requirements: the sales of the products can be viewed in terms of Year, Quarters and Months; the report should enable the user to view the products filtered by Category.
Solution
To create this Summary report, first a query is created that displays the Products and their Category, Sales amount of each product, and also the date on which they were sold. Then to create summary sheet, we create a PivotTable view of the query having:
Category field as a filter
Product field on row
Year, Quarter and Month on columns
Total Sales (which is computed as Quantity sold into Product cost) displayed as values
Steps for creating the query to obtain Sales Data
1. Open the Query Design window, by clicking Create -> Queries -> Query Design. 2. Select the Inventory, Sales Item Description and Sales Order tables from Show Table window and click
Add, as shown in Fig. 1.2.52.

Downloaded from : taxupindia.com
main source : ICAI
DATABASE APPLICATIONS USING MS-ACCESS
158 ADVANCED INFORMATION TECHNOLOGY
Fig. 1.2.52: Show Table window
3. Select the columns Category and Item Number from Inventory Table and drag them to the columns tab. Similarly, select column Sales Date from table Sales Order and drag it to the columns tab. The query window appears as in Fig. 1.2.53.
Fig. 1.2.53: Select the required columns

Downloaded from : taxupindia.com
main source : ICAI
ADVANCED SQL QUERIES
ADVANCED INFORMATION TECHNOLOGY 159
4. Now to compute the Total Sales of the Product, multiply Quantity * Price and create a new column. Write the expression Total Sales: [Quantity]*[Price] in the Field tab of the next column as displayed in Fig. 1.2.54.
Fig. 1.2.54: Compute Total Sales
5. Click Run in Design –> Results to view the query result. The result appears as shown in Fig.
1.2.55.
Fig. 1.2.55: Query Result

Downloaded from : taxupindia.com
main source : ICAI
DATABASE APPLICATIONS USING MS-ACCESS
160 ADVANCED INFORMATION TECHNOLOGY
Now, we have achieved the desired result from the query. However, the Summary Report through PivotTable is required to be created.
Steps for Creating PivotTable from the query
1. Open the query in PivotTable View by clicking PivotTable View from Home -> Views, as displayed in Fig. 1.2.56.
Fig. 1.2.56: Select PivotTable View
2. The PivotTable view appears with the field list on right side as displayed in Fig. 1.2.57.
Fig. 1.2.57: PivotTable View

Downloaded from : taxupindia.com
main source : ICAI
ADVANCED SQL QUERIES
ADVANCED INFORMATION TECHNOLOGY 161
NOTE: If the PivotTable Field List does not appear, obtain the list by clicking Field List from Show/Hide group on the Design tab as indicated in Fig. 1.2.58.
Fig. 1.2.58: Field List Button
3. Select the Category field from PivotTable Field List and drag it to the Drop Filter Fields Here area.
4. Select the Item Number field from PivotTable Field List and drag it to the Drop Row Fields Here area.
5. Select the Year by expanding the Sales Date By Month field and drag it to the Drop Column Fields Here area. Similarly, select and drag Quarter and Month to the Drop Column Fields Here area.
6. Select and drag the Total Sales field to the Drop Totals or Detail Fields Here area. The PivotTable window should appear as in Fig. 1.2.59.
Fig. 1.2.59: Drag Fields in PivotTable Area
7. Click Save at Quick Access Toolbar to save the query. Type the name of the query as “Sales Summary Report”.
If we wish to see the Quarterly sales of all the Products from Personal Watercraft category, the PivotTable query is obtained as follows:

Downloaded from : taxupindia.com
main source : ICAI
DATABASE APPLICATIONS USING MS-ACCESS
162 ADVANCED INFORMATION TECHNOLOGY
8. Open the drop-down in Category Filter Area, clear all checkboxes and check the Personal Watercraft and click OK as in Fig. 1.2.60.
Fig. 1.2.60: Select Personal Watercraft from Category Filter
9. Click on the negative sign on Quarter tab so that the months disappear. Also, click on the plus sign with Totals to make the Grand Total appear. Make sure that all the plus signs in Item Number Row are clicked so as to make the Total Sales value appear. The final query should appear as shown in Fig. 1.2.61.

Downloaded from : taxupindia.com
main source : ICAI
ADVANCED SQL QUERIES
ADVANCED INFORMATION TECHNOLOGY 163
Fig. 1.2.61: Quarterly sales of all the Products from Personal Watercraft category
1.2.5.3 PivotChart
A PivotChart is a tool used for graphical analysis of data. In simple terms, PivotChart helps visualize a PivotTable, Query or a Form. It can display summarized data in different chart formats and enables data analysis. Data can be presented by using different chart formats as required, and unwanted items can be hidden from being viewed.
The PivotChart view in a query can be obtained by selecting the PivotChart View from Home -> Views, as indicated in Fig. 1.2.62.

Downloaded from : taxupindia.com
main source : ICAI
DATABASE APPLICATIONS USING MS-ACCESS
164 ADVANCED INFORMATION TECHNOLOGY
Fig. 1.2.62: PivotChart View
A sample PivotChart indicating sales of a Category of Products in each Quarter in a year is shown in Fig. 1.2.63.
Fig. 1.2.63: PivotChart View

Downloaded from : taxupindia.com
main source : ICAI
ADVANCED SQL QUERIES
ADVANCED INFORMATION TECHNOLOGY 165
Description of the various headings marked in PivotChart above is given in Table 2.2.3.
Headings Description
X-Axis The horizontal axis in PivotChart
Y-Axis The vertical axis in PivotChart
Legend A table displaying the color code used for each data series in PivotChart
Filter Field A field on basis of which filter can be applied on PivotChart.
Data Field Field values to be shown along the Y-axis.
Category Field Field values to be shown along the X-axis.
Series Field Field values that will form the legend of the graph.
Table 1.2.3: Various fields in PivotChart
1.2.5.4 Problem Scenario
Considering the Summary Sales Report discussed in Section 1.2.5.1, a graphical representation of the same data is required.
Solution
To represent the data graphically, we need to create a PivotChart. For this purpose, we first create a query to display Summary Report and then create a PivotChart based on that query. In the Pivot Chart, the fields will be placed as:
Category as Filter Field
Years & Quarters field on X-Axis
Total Sales on Y-Axis
Item Number as Series Field
Steps to create a query of Summary Report
Follow the steps discussed in Section 1.2.5.1 to create a query Sales Summary Report and create another query Graph of Sales Summary Report with columns as Category, Item Number, Sales Date and Total Sales (Quantity * Price). Steps to create a copy of Summary Report
1. Double-click the Graph of Sales Summary Report query to open it in the Datasheet view.
2. Open the PivotChart view of the query by selecting PivotChart View from Home -> Views drop-down list. The PivotChart view appears as in Fig. 1.2.64.

Downloaded from : taxupindia.com
main source : ICAI
DATABASE APPLICATIONS USING MS-ACCESS
166 ADVANCED INFORMATION TECHNOLOGY
Fig. 1.2.64: PivotChart View
3. If the Chart Field List is not there, select the Field List option from the Show/Hide group on the Design tab.
4. Select the Category field from Chart Field List and drag it to the Drop Filter Fields Here area.
5. Select Years by expanding the Sales Date By Month field and drag it to the Drop Category Fields Here area. Similarly, select and drag Quarters to the Drop Category Fields Here area.
6. Select the Item Number field and drag it to the Drop Series Fields Here area.
7. Select and drag the Total Sales field to the Drop Data Fields Here area.
8. To display the legend, select Legend from the Show/Hide group on the Design tab, as indicated in Fig. 1.2.65.
Fig. 1.2.65: Select Legend option

Downloaded from : taxupindia.com
main source : ICAI
ADVANCED SQL QUERIES
ADVANCED INFORMATION TECHNOLOGY 167
9. The PivotChart window should appear, as shown in Fig. 1.2.66.
Fig. 1.2.66: Drag and Drop Fields in PivotChart Area
NOTE: The Total Sales of few products is much lesser as compared to other products that they are hardly visible on data bar. To solve this problem, the axis has to be changed to Logarithmic axis so as to make data bars more visible.
Steps for changing the axis to logarithmic axis
1. Right-click on any value in Y-axis so the entire scale is selected and select Properties from the menu, as shown in Fig. 1.2.67.

Downloaded from : taxupindia.com
main source : ICAI
DATABASE APPLICATIONS USING MS-ACCESS
168 ADVANCED INFORMATION TECHNOLOGY
Fig. 1.2.67: Select properties for Y-Axis
2. In the Properties window that appears, go to the Scale tab and check Logarithmic Scale checkbox as displayed in Fig. 1.2.68.
Fig. 1.2.68: Scale Properties

Downloaded from : taxupindia.com
main source : ICAI
ADVANCED SQL QUERIES
ADVANCED INFORMATION TECHNOLOGY 169
3. Close the Properties window.
In order to make graph more explanatory, we will provide a name to X-Axis and Y-Axis of the graph.
Steps for naming Axis in PivotChart
1. Right-click the Axis Title on X-Axis and select Properties from the menu, as shown in Fig. 1.2.69.
Fig. 1.2.69: Open X-Axis Properties
2. In the Properties window, go to the Format tab and change the Caption property to Sales Quarter as in Fig. 1.2.70.

Downloaded from : taxupindia.com
main source : ICAI
DATABASE APPLICATIONS USING MS-ACCESS
170 ADVANCED INFORMATION TECHNOLOGY
Fig. 1.2.70: Change caption of X-Axis
3. In a similar manner, change the caption of Y-Axis to Total Sales. The PivotChart appears as in Fig. 1.2.71.
Fig. 1.2.71: Pivot Chart with Axis Captions

Downloaded from : taxupindia.com
main source : ICAI
ADVANCED SQL QUERIES
ADVANCED INFORMATION TECHNOLOGY 171
Now if we wish to see the chart of quarterly sales of all the products from Truck category for the year 2011, the PivotChart will be obtained as follows:
4. Open the drop-down in the Category Filter area, clear all checkboxes check the Truck checkbox and click OK as in Fig. 1.2.72.
Fig. 1.2.72: Select Truck from Category
5. In a similar manner, select 2011 from Years drop-down in horizontal axis. The resultant chart appears as in Fig. 1.2.73 indicating the sale of different items of Truck category, which is maximum in Quarter2 and minimum in Quarter4.

Downloaded from : taxupindia.com
main source : ICAI
DATABASE APPLICATIONS USING MS-ACCESS
172 ADVANCED INFORMATION TECHNOLOGY
Fig. 1.2.73: Quarter-wise Truck Sales
NOTE: Different PivotCharts can be made to represent different kinds of data. Both PivotChart and PivotTable can also be made directly on tables rather than making a query first.
1.3 Joining Tables in Queries A Join is a temporary relationship that is created between two tables in a query or the relationship window using a common field in both the tables having same data type and usually the same name. Joins created in a query are temporary and are meant for the current query only. Joining tables in a query is required to view data from two or more tables. For example, to retrieve products ordered by each customer, tables Customers, Sales Order and Inventory are required to be joined to get the desired output.
When two or more tables are added to the Query Design window, Access 2010 creates Joins between them based on the relationships that have been defined in the relationship window. Joins establish the criteria that the data must match to be included in the query operations. If the tables are not joined, the query result will match each record of one table to every record in another table, resulting in spurious rows. Different types of joins are available to get a different set of records as query result.
There are three types of joins available in Access 2010: inner join, left outer join, and right outer join.
Inner Join: Returns only those rows from both tables that match on the joining field.
Left Outer Join: The query returns all of the rows from left table, and also those rows from the right table that share a common value on both sides of the join. Since some of the rows in left table of a left outer join will not have corresponding rows in right table, some of the fields returned as a query result will be empty when the rows do not correspond.

Downloaded from : taxupindia.com
main source : ICAI
ADVANCED SQL QUERIES
ADVANCED INFORMATION TECHNOLOGY 173
Right Outer Join: It is just the opposite of left outer join. The query using right outer join returns all the rows from right table, and also those rows from the left table that share a common value on both sides of the join.
1.3.1 Problem Scenario
The Operations Regional Head of Apex Ltd. is required to produce a report giving the details of the payments received.
For this purpose, two reports are required to be prepared:
First report indicating the Invoices for which payments have been made, including the invoice and payments detail.
Second report displaying a list of all the sales order, their invoices and details of payments, including those invoices for which payments have not been received.
Solution
To get the desired result, we create two queries:
First query to fulfill the requirement using inner join between tables Invoice and Payments. Second query to achieve the second requirement which includes Sales Order, Invoice and Payments tables with an left outer join between Invoice and Payments tables.
Steps to create the first query - to obtain invoices for which payments have been made
1. Open the Query Design window, by clicking Create -> Queries -> Query Design.
2. Select the Invoice and Payments tables from Show Table window and click Add. Click Close.
3. To join the two tables, click the Invoice Number from Invoice table and drag it to Invoice Number in Payments table. The query window appears, as shown in Fig. 1.3.1.
NOTE: If the tables are already related through relationship window, the joining line automatically appears between the tables.

Downloaded from : taxupindia.com
main source : ICAI
DATABASE APPLICATIONS USING MS-ACCESS
174 ADVANCED INFORMATION TECHNOLOGY
Fig. 1.3.1: Create Relationship between tables
4. Select the columns Invoice Number, Sales Order Number, Type of Invoice, Invoice Date and Source of Order from the table Invoice and drag them to the columns tab. Similarly, select columns Date Paid, How Paid, Amount Paid and Amount Alloc from Payments table and drag them to the columns tab. The query window appears as shown in Fig. 1.3.2.
Fig. 1.3.2: Add required columns

Downloaded from : taxupindia.com
main source : ICAI
ADVANCED SQL QUERIES
ADVANCED INFORMATION TECHNOLOGY 175
5. Click the Save button on Quick Access Toolbar to save the query. Type the name of the query as Payment Made.
6. Click the Run icon in Design -> Results to view the query result displaying invoices with their
payment details as shown in Fig. 1.3.3.
Fig. 1.3.3: Query Result
Steps to create the second query - to display list of all the sales order, their invoices and payments details, including those invoices for which payments have not been received
1. Open the Query Design window, by clicking Create -> Queries -> Query Design.
2. Select the Sales Order, Invoice and Payments table from Show Table window and click Add. Click Close.
3. To join the tables, click the Sales Order Number from Sales Order table and drag it to the Sales Order Number in Invoice table. Similarly, join Invoice and Payments table on Invoice Number field. The query window appears as shown in Fig. 1.3.4.

Downloaded from : taxupindia.com
main source : ICAI
DATABASE APPLICATIONS USING MS-ACCESS
176 ADVANCED INFORMATION TECHNOLOGY
Fig. 1.3.4: Join Tables
4. Select the fields Sales Order Number, Sold to Customer and Sales Date from Sales Order table and drag them to the Columns tab. Similarly, select fields Invoice Number, Type of Invoice, Invoice Date, Source of Order and Payment Terms from Invoice table and columns Date Paid, How Paid, Amount Paid and Amount Alloc from Payments table. The query window appears as in Fig. 1.3.5.

Downloaded from : taxupindia.com
main source : ICAI
ADVANCED SQL QUERIES
ADVANCED INFORMATION TECHNOLOGY 177
Fig. 1.3.5: Select required columns
5. Click Run in Design -> Results to view the query result as shown in Fig. 1.3.6.
Fig. 1.3.6: Sales Order with Payments

Downloaded from : taxupindia.com
main source : ICAI
DATABASE APPLICATIONS USING MS-ACCESS
178 ADVANCED INFORMATION TECHNOLOGY
Notice that these query results are showing only the records for which payments have been received. To get the records for which the payment are not yet received, the join between Invoice and Payments table has to be converted to left outer join.
Steps to create left outer join between Invoice and Payments tables
6. Switch to the query design view by clicking Design View in Home -> Views.
7. Right-click the joining line between Invoice and Payments tables and select Join Properties from the menu, or double-click the joining line. The Join Properties window appears, as shown in Fig. 1.3.7.
Fig. 1.3.7: Join Properties dialog box
8. Select the option 2: Include ALL records from ‘Invoice’ and only those records from ‘Payments’ where the joined fields are equal., and click OK. The Join Properties window appears as displayed in Fig. 1.3.8.
Fig. 1.3.8: Set the Join Properties to Left Outer Join

Downloaded from : taxupindia.com
main source : ICAI
ADVANCED SQL QUERIES
ADVANCED INFORMATION TECHNOLOGY 179
9. The Join line changes to indicate that it is a left outer join. Notice an arrow pointing towards the Payments table as indicated in Fig. 1.3.9.
Fig. 1.3.9: Left Outer Join between Invoice and Payments tables
10. Click Save on Quick Access Toolbar to save the query. Type the name of the query as Sales Order Details.
11. Click Run in Design -> Results to view the query result shown in Fig. 1.3.10. Notice that the Date Paid, How Paid, Amount Paid and Amount Alloc fields from table Payments are blank for few records, indicating the invoices for which payments have not been received.

Downloaded from : taxupindia.com
main source : ICAI
DATABASE APPLICATIONS USING MS-ACCESS
180 ADVANCED INFORMATION TECHNOLOGY
Fig. 1.3.10: Query Result
A more complex join can be created among any number of tables and modified accordingly to get the desired results.
1.4 Calculated Fields The Access 2010 query’s result is not restricted to the fields in tables only, but can display many other computed columns known as Calculated Fields. The Calculated fields can be compared to cells containing functions or formulas in Excel Worksheet. In Access, these cells can be considered as the columns of the table. Normalization forbids tables to have columns whose values can be computed using the existing fields. Calculations in a query are recomputed each time the query is run. As such, data is always current. The results of the calculations are not stored in a table. A calculated field performs some type of arithmetic calculations on one or more fields in a table to come up with a completely new field. For example, if a table has an Order Total field and a Tax Rate field, Access 2010 can calculate these two fields to find out the Sales Tax for each order as [Order Total] * [Tax Rate]. The calculated fields create new fields in a record by combining the values of other fields in the record. Calculated fields can store numeric, date, or text fields for each record using expressions and functions.
1.4.1 Problem Scenario
Ramit, an executive in Apex Ltd. is required to produce a report displaying all the sales orders which contains the field Total Amount Paid as a sum of Tax, Freight and Other Charges.
Solution
As a solution to the above problem, a query has to be created on table Sales Order with a calculated column Total Amount Paid computed as a sum of Tax, Freight and Other Charges.

Downloaded from : taxupindia.com
main source : ICAI
ADVANCED SQL QUERIES
ADVANCED INFORMATION TECHNOLOGY 181
Steps for creating query with Calculated Columns
1. Open the Query Design window, by clicking Create -> Queries -> Query Design.
2. Select the Sales Order table from Show Table window and click Add. Click Close.
3. Select the columns Sales Order Number, Sold to Customer, Sales Date, Payment Terms and Shipped via from Sales Order table and drag them to the columns tab as displayed in Fig. 1.4.1.
Fig. 1.4.1: Select Required Columns
4. To create the calculated column, write the expression Total Amount Paid: [Tax] + [Freight] + [Other] in the Field tab of the next column as displayed in Fig. 1.4.2.

Downloaded from : taxupindia.com
main source : ICAI
DATABASE APPLICATIONS USING MS-ACCESS
182 ADVANCED INFORMATION TECHNOLOGY
Fig. 1.4.2: Calculated Column - Total Amount Paid
5. Click Run in Design -> Results to view the query result. The result is displayed in Fig. 1.4.3. Note
the calculated column Total Amount Paid in query result.

Downloaded from : taxupindia.com
main source : ICAI
ADVANCED SQL QUERIES
ADVANCED INFORMATION TECHNOLOGY 183
Fig. 1.4.3: Query Result
6. Save the query as Sales Order Report and close the query window.
1.5 Summary Queries are the heart of every database application. Queries are responsible for converting diffuse data contained in tables into information that users can actually use. Without queries, we would have to write a complex code for every data extraction and transformation.
This chapter talks about more complex part of queries. Sub-queries, as the name indicates is a query within query and helps us to retrieve data from multiple tables, and can also be used to replace Joins. The Query Wizard can be used to create queries like Find Unmatched and Find Duplicate. Apart from this, queries can generate summary reports using Group By and Crosstab Queries. Queries can be very interactive in terms of PivotTables and PivotCharts which can be obtained by just changing the query view.
Queries can be based on multiple tables using different types of joins. Joins can be Inner Join or Outer Joins. Queries provide much more liberty, such as adding newly calculated columns to query result or restrict number of rows returned by specifying the criteria. Calculated columns enable us to implement normalization by omitting unnecessary columns in the table and introducing them as calculated columns later.

Downloaded from : taxupindia.com
main source : ICAI
DATABASE APPLICATIONS USING MS-ACCESS
184 ADVANCED INFORMATION TECHNOLOGY
1.6 Lab Exercises
1.2.6 Case Study
For the database Apex Inventory Shipment of Apex Ltd., consider the scenario and provide their solutions.
1. The company is launching a new sales campaign for its existing customers. For this, the marketing department needs the list of customers with the highest credit limit. Create a query using sub-query to retrieve this list.
2. A sales person made a mistake and skipped entering the item description for an order made by the customer. Using query, retrieve the sales order information for which the item description has not been entered.
3. For the above exercise, retrieve the information about the customer who has placed the order so that the items can be reconfirmed.
4. The company launched its new office in India and asked the sales executive to interact with various people and enter the details of possible customers in a table named Customers_India. The table has the following structure:
Field Name Data type
Customer Number Text
Salutation Text
First Name Text
Last Name Text
Company Text
Phone Text
Email Text
Street Text
City Text
State Text
ZIP Code Text
In the absence of any constraints on the table, the sales team ended up inserting duplicate records of a single customer. Write a query to find these duplicate records. (Consider the Customer Number as unique for each customer.)
5. The Finance Head who keeps track of their inventory shipped, requires the report displaying the quantity of items shipped every month of year 2011. Create a Totals query displaying the required data.
6. The company is issuing a discount policy to its customers. For this purpose, the Marketing Regional Manager needs a detailed report of the customers. The report should contain Customers Names on rows and Month Name as columns, and count of orders placed by each customer on the intersection cells of rows and columns.
Downloaded from : taxupindia.com
main source : ICAI
ADVANCED SQL QUERIES
ADVANCED INFORMATION TECHNOLOGY 185
7. Create a user interactive report using PivotTable to display payments made by customers. The user should be able to filter the customers according to their states and should be able to drill the payments in terms of years, quarters, months and days.
8. Considering the scenario given in the above exercise, create a graphical view using PivotChart indicating the total payments received quarter-wise from all the customers from a particular city. User should be able to filter the city on the basis of their country.
9. Create a query containing mailing address list for all the customers with the following field list:
1 Salutation FirstName Last Name
2 Company
3 Street, City
4 State
5 Country
6 Postal Code 10. Display the list of all customers from New York (State Code – NY), with details of items they have ordered
and Total Amount to be paid by them.
1.2.7 Multiple Choice Questions
1. For the database Apex Inventory Shipment of the Apex Ltd., we wish to retrieve records for customers who have not placed any orders yet. What type of query can be used?
(a) Duplicate Query
(b) Crosstab Query
(c) Find Unmatched Query
(d) Group By query
2. Considering the database Apex Inventory Shipment of the Apex Ltd., how can we display sales grouped by country, state, and customer, all at the same time?
(a) Use the Sort Descending command
(b) Use the PivotTable View command
(c) Use the Find command on specified groups
(d) All of the above
3. For the database Apex Inventory Shipment, the number of items for each category is required to be computed, which query type is required to be used?
(a) Select Query
(b) Group By query
(c) Crosstab Query
(d) Duplicate Query

Downloaded from : taxupindia.com
main source : ICAI
DATABASE APPLICATIONS USING MS-ACCESS
186 ADVANCED INFORMATION TECHNOLOGY
4. Considering the scenario in question above, which function should be used with Item Number in query?
(a) Count
(b) Compute
(c) Sum
(d) Calculate
5. In the database Apex Inventory Shipment, to see total amount received from Payments table, it should be dragged into which area of the PivotTable?
(a) Drop Column Fields Here
(b) Drop Row Fields Here
(c) Drop Totals or Detail Fields Here
(d) None of the above
6. Considering the database Apex Inventory Shipment, we wish to get all the sales orders with cash payments. What needs to be done to achieve this?
(a) Create a sub-query with Sales Order as Payment type
(b) Create a select query on Sales Order table and write Cash as criteria for Payment Terms
(c) Create a Group-By query on Payment Terms
(d) None of the above
7. From the database Apex Inventory Shipment, we wish to retrieve a report displaying details of all the invoices including the payments details (if already made) of the invoices. What type of Join should be used in Query window to achieve the desired result?
(a) Left outer join
(b) Right outer join
(c) Default join
(d) No joins will be used
8. How can we add a table to the Query Design window?
(a) Select Create -> Add Table
(b) Select Database Tools -> Add Table
(c) Select Design -> Show Table
(d) Select the table from the Navigation Pane
9. If we are creating a Crosstab query, the table we are querying must contain what?
(a) Lots of confusing information
(b) More than 100 records

Downloaded from : taxupindia.com
main source : ICAI
ADVANCED SQL QUERIES
ADVANCED INFORMATION TECHNOLOGY 187
(c) At least one field
(d) At least three fields
10. _______ type of query summarises information in a grid, organized by regions and months.
(a) An update query
(b) A parameter query
(c) An action query
(d) A Crosstab query
11. When we double click a query object, we open
(a) The object in design view
(b) The object in print preview
(c) The result of the query
(d) The underlying table on which the query is based
12. What is the primary difference between a PivotTable report and a Crosstab query?
(a) A PivotTable report can contain sums, counts, and averages, while a Crosstab query cannot
(b) We cannot create a PivotTable from a Crosstab query
(c) A Crosstab query lets us group similar items, while a PivotTable query does not
(d) None of the above
13. In Access 2010, the best types of queries to use for data analysis are:
(a) Select queries
(b) Parameter queries
(c) Action queries
(d) All of the above
14. Which view allows adding tables to the query?
(a) Datasheet view
(b) PivotTable view
(c) PivotChart view
(d) Design view
15. Which type of join in multi-table query permits to view all the records from one table and matching from another?
(a) Inner Join
(b) Outer Join
(c) Equi Join
(d) Non-Equi Join
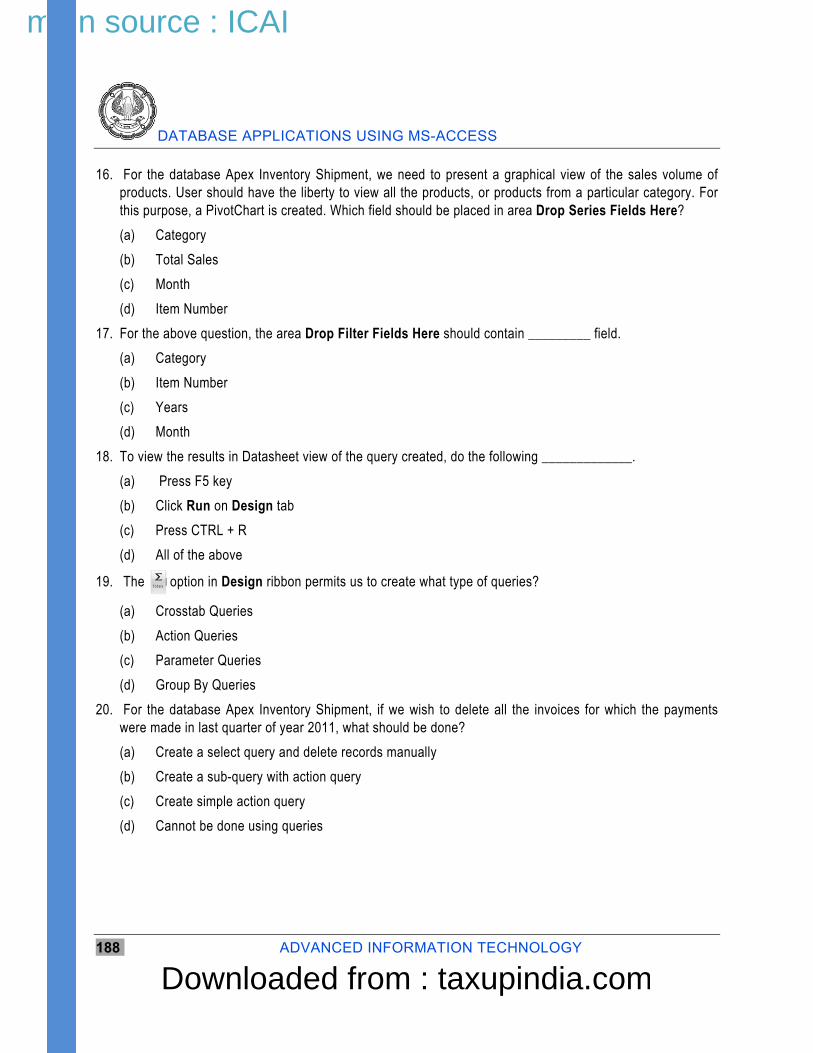
Downloaded from : taxupindia.com
main source : ICAI
DATABASE APPLICATIONS USING MS-ACCESS
188 ADVANCED INFORMATION TECHNOLOGY
16. For the database Apex Inventory Shipment, we need to present a graphical view of the sales volume of products. User should have the liberty to view all the products, or products from a particular category. For this purpose, a PivotChart is created. Which field should be placed in area Drop Series Fields Here?
(a) Category
(b) Total Sales
(c) Month
(d) Item Number
17. For the above question, the area Drop Filter Fields Here should contain _________ field.
(a) Category
(b) Item Number
(c) Years
(d) Month
18. To view the results in Datasheet view of the query created, do the following _____________.
(a) Press F5 key
(b) Click Run on Design tab
(c) Press CTRL + R
(d) All of the above
19. The option in Design ribbon permits us to create what type of queries?
(a) Crosstab Queries
(b) Action Queries
(c) Parameter Queries
(d) Group By Queries
20. For the database Apex Inventory Shipment, if we wish to delete all the invoices for which the payments were made in last quarter of year 2011, what should be done?
(a) Create a select query and delete records manually
(b) Create a sub-query with action query
(c) Create simple action query
(d) Cannot be done using queries

Downloaded from : taxupindia.com
main source : ICAI
DESIGNING FORMS AND REPORTS
2.1 Introduction
Forms help to display, add, modify, and delete data. Different features available in Access 2010 enable to create forms such that it becomes easier for the users to handle data. Access 2010 provides various methods to make forms handier and simpler. Different controls can be added to a form to enhance their working. Access also provides ActiveX controls which are Microsoft control meant for different purposes. A form can be divided into pages to increase the readability, or can include a summary section to display grouped data.
Reports can be considered as the static version of forms. Reports are the best way to present data to higher authority and communicate the information to the people. They can be customized using header and footers, calculated values, and sub-reports to represent linked data. Access 2010 also provides the facility to create
LEARNING OBJECTIVES Advanced Form Design
Adding Unbound Controls Adding Graphics to Form Adding Calculated Values Adding Combo Boxes
Make effective use of forms Displaying a calendar control on a form Organising information with tab pages Displaying a summary of data in a form
Advanced Reports Creating customised headers and footers Adding calculated values Sub-reports
Make Reports more effective Including a chart in a report Printing data in columns Cancelling the printing of a blank report
CHAPTER
2

Downloaded from : taxupindia.com
main source : ICAI
DATABASE APPLICATIONS USING MS-ACCESS
190 ADVANCED INFORMATION TECHNOLOGY
charts in reports which represents data diagrammatically. Since reports are used for business communication, it must be available for everyone.
2.2 Advanced Form Design
Forms are an important medium of representing data in Access 2010. Forms are not only used for entering of data, but also to view the data in a user friendly manner. Access 2010 provides various controls and utility to make the forms more presentable. For example, forms can contain unbounded controls, graphics, calculated values, and combo boxes.
2.2.1 Adding Unbound Controls
An Access 2010 Form can contain multiple controls, each having its own significance. These controls can be selected from Create tab in Forms ribbon. In general, all the controls are bounded to one field of the table or query the form is based on. However, there are few controls which retain the entered value, but are not linked with any table fields. These controls can be used for text label display, for controls such as lines and rectangles, or for holding unbound OLE objects (such as bitmap pictures or logo) that are not stored in a table, but in the form itself. Unbound controls are also known as variables or memory variables.
2.2.2 Problem Scenario
The database Apex Inventory Shipment has a form frmOrders as shown in Fig. 2.2.1, based on table Sales Order which keeps track of all the orders placed. The Sales Manager wishes to add a current date on the form, so that it becomes easy for the user to keep track of dates.
Fig 2.2.1. frmOrders form
Solution
The Database Developer adds an unbounded control, a label to the form and sets its property to store the current date.

Downloaded from : taxupindia.com
main source : ICAI
DESIGNING FORMS AND REPORTS
ADVANCED INFORMATION TECHNOLOGY 191
Steps for adding an unbounded control
1. Right-click the form frmOrders under All Access Objects -> Forms tab. Select Design View from the dropdown to open the table in Design View, as shown in Fig. 2.2.2.
Fig 2.2.2. Open the form frmOrders in Design view
2. Select the Date & Time control from Design ribbon ->Header/Footer tab. The Date and Time window appears, as shown in Fig. 2.2.3 select the date & time format from this window.

Downloaded from : taxupindia.com
main source : ICAI
DATABASE APPLICATIONS USING MS-ACCESS
192 ADVANCED INFORMATION TECHNOLOGY
Fig. 2.2.3: Date and Time window
3. Click OK to close the window and draw the control on the Form Header portion on the form. The form should appear, as shown in Fig. 2.2.4.
Fig. 2.2.4: Date and Time unbounded control added to a form
NOTE: In a same way, other controls like shapes, logo, etc. can be added to form. The properties of these controls can be set to meet user requirements.
2.2.3 Adding Graphics to Form
Attractive forms are always a valuable addition. Access 2010 makes it easy to add a graphic to the background of a form, such as a “watermark” which appear on expensive bond paper. The picture can contain a company logo, text, or any other graphic element. The picture is specified by the form’s picture property and can be

Downloaded from : taxupindia.com
main source : ICAI
DESIGNING FORMS AND REPORTS
ADVANCED INFORMATION TECHNOLOGY 193
embedded in the form or linked to an external file. If the picture is linked, the graphic displayed on the form changes any time the external file is edited.
The graphic can be inserted into the form in the following ways:
1. Import a graphic file (clip art, gif, jpeg, bmp, etc.) directly into the form.
2. Attach a link to the graphic that opens a website or other database object.
3. Associate the graphic with an existing macro in the database.
2.2.4 Problem Scenario
Consider the frmOrders discussed in section 2.2.1. The Database Developer wants to make it more presentable and thought of adding a picture to the background of the form.
Solution
The picture can be set as form background using the image control. Select the picture to be added, draw the image control and adjust its properties to make image as a background.
Steps for adding graphics
1. Right-click the form frmOrders under All Access Objects -> Forms tab. Select Design View from the dropdown to open the table in Design View.
2. Select the insert image button from Design ribbon -> Controls tab and drag it to cover the Details section of the form.
3. The Insert Picture window appears. Browse for the picture to be inserted and click OK to close the window. The Insert Picture window is displayed in Fig. 2.2.5.

Downloaded from : taxupindia.com
main source : ICAI
DATABASE APPLICATIONS USING MS-ACCESS
194 ADVANCED INFORMATION TECHNOLOGY
Fig. 2.2.5. Insert Picture window
4. The form after the picture is inserted appears, as shown in Fig. 2.2.6.

Downloaded from : taxupindia.com
main source : ICAI
DESIGNING FORMS AND REPORTS
ADVANCED INFORMATION TECHNOLOGY 195
Fig. 2.2.6: Image inserted in form frmOrders
5. The picture is required to move to the back of controls. Right-click the picture and select Position -> Send to Back from the dropdown, as indicated in Fig. 2.2.7.
Fig. 2.2.7. Send the picture to back of controls
6. The form appears, as shown in Fig. 2.2.8.

Downloaded from : taxupindia.com
main source : ICAI
DATABASE APPLICATIONS USING MS-ACCESS
196 ADVANCED INFORMATION TECHNOLOGY
Fig. 2.2.8. Form with Graphics
7. Select the picture and press F4 to view its properties. In the property sheet, move to format and set the Size Mode property of picture to stretch, as shown in Fig 3.2.9.
Fig. 2.2.9. Set the image property
8. The final form appears, as in Fig. 2.2.10.

Downloaded from : taxupindia.com
main source : ICAI
DESIGNING FORMS AND REPORTS
ADVANCED INFORMATION TECHNOLOGY 197
Fig. 2.2.10. frmOrders with Graphics inserted
NOTE: While adding a graphic to the form, a link to that graphic can also be created. The link ensures that the changes made to original file are also reflected in form.
2.2.5 Adding Calculated Values
Access 2010 provides many features to give forms enhanced behavior and a modern look. One of the major requirements in Access 2010form that it can be display computed results. These results may be bounded to some field in the table or may be unbounded. For example, we may need to display the complete name of the customer instead of displaying the first name and last name separately.
Calculated controls can use any of the existing function or user build function available in Access 2010. Calculated values can also be expressions computed with a combination of other fields and operators.
2.2.6 Problem Scenario
Consider the form frmOrders discussed in section 3.2.1. The Manager wishes to add another date in form, which may indicate when the order will reach customers. This date can be computed as 15 days after the date of shipment.
Solution
A textbox is added to the form.This textbox contains calculated value, which is computed as 15 days + date of shipment.
Steps to add calculated values to form
1. Right-click the form frmOrders under All Access Objects -> Forms tab. Select Design View from the dropdown to open the table in Design View.
2. Select the textbox control from Design ribbon -> Controls tab and draw it on the details section of the form. The form should appear, as in Fig. 2.2.11.

Downloaded from : taxupindia.com
main source : ICAI
DATABASE APPLICATIONS USING MS-ACCESS
198 ADVANCED INFORMATION TECHNOLOGY
Fig. 2.2.11. Insert Textbox in Form
3. Double-click the label and type Delivery Date instead of Text25. Similarly, double-click the textbox and type =DateAdd("d",15,[Ship Date]). The form should appear, as shown in Fig. 2.2.12.
Fig. 2.2.12. Specify values for Textbox control

Downloaded from : taxupindia.com
main source : ICAI
DESIGNING FORMS AND REPORTS
ADVANCED INFORMATION TECHNOLOGY 199
NOTE: The formatting of the new added textbox can be copied from above cells.
4. Select Form View from Home ribbon -> Views tab to open the form in Form View. Confirm the textbox displays the calculated value.
2.2.7 Adding Combo Boxes
Combo boxes in Access 2010 provide a way of selecting a value from a list. This is quicker than remembering which value to type and ensures that the entered value is valid. A combo box is a compact method of presenting a list of choices and allows user to enter a value that is not in the list.
The values in a combo box are displayed by clicking the arrow at the end. In combo box values can be selected by clicking it or by typing the first few characters of the value into the text box area of the combo box. If the Auto Expand property is set to Yes, the default setting, Access 2010automatically fills in the rest of the value. Combo box consists of rows of data with one or more columns, which can appear with or without headings. One of the columns contains the values to be stored in the field (bound control) or use for other purposes (unbound control); the other columns contain explanatory information.
2.2.8 Problem Scenario
Consider the form frmOrders created in section 3.2.1.Theexecutives are making many mistakes while typing the reference of the customer to which orders are sold. The Sales Manager asked the Database Developer to find the solution to this problem.
Solution
The Database Developer thought that it will be a good way to add a combo box for the customers. Users will have an option to choose the value from the list or type a new value if required, thereby decreasing the typing mistakes.
Steps to add a combo box in Form
1. Right-click the form and select Design View from the dropdown to open the form in Design View. The form appears, as shown in Fig. 2.2.13.

Downloaded from : taxupindia.com
main source : ICAI
DATABASE APPLICATIONS USING MS-ACCESS
200 ADVANCED INFORMATION TECHNOLOGY
Fig. 2.2.13: frmOrders in Design View
2. Delete the Sale to Customer textbox.
3. Select the Combo Box control from Design ribbon -> Controls tab and draw it in the place of Sale to Customer textbox. The Combo Box wizard appears, as shown in Fig. 2.2.14.
Fig. 2.2.14. Combo Box wizard

Downloaded from : taxupindia.com
main source : ICAI
DESIGNING FORMS AND REPORTS
ADVANCED INFORMATION TECHNOLOGY 201
4. Select the first option i.e. I want the combo box to look up the values in a table or query and click Next.
5. In the Select Table or Query window, select the table option from View tab and choose table Customer from the list, as indicated in Fig. 2.2.15. Click Next to continue.
Fig. 2.2.15. Select the required table
6. In the Select Field window, select field Customer Number from Available field and click on sign to put it into selected fields. Similarly, add First Name and Last Name to selected field. The window appears, as shown in Fig. 2.2.16. Alternatively, the user can double-click the fields to add them to selected field.
Fig. 2.2.16. Add field to Combo Box

Downloaded from : taxupindia.com
main source : ICAI
DATABASE APPLICATIONS USING MS-ACCESS
202 ADVANCED INFORMATION TECHNOLOGY
NOTE: Even if the multiple fields are selected to be displayed in Combo Box, the Primary Key will be stored in table or form.
7. Click Next to continue. In the Sort Order window select Customer Number as 1. This is indicated in Fig. 2.2.17.
Fig. 2.2.17. Select Customer Number for Sort Order
8. In the Hide Key Column window, uncheck the Hide Key Column checkbox, as shown in Fig. 2.2.18. Click Next to proceed.
Fig. 2.2.18. Uncheck Hide Key Column Option

Downloaded from : taxupindia.com
main source : ICAI
DESIGNING FORMS AND REPORTS
ADVANCED INFORMATION TECHNOLOGY 203
NOTE: Hide Key Column hides the Primary Key to be displayed as a value in combo box, though internally only Primary key is stored.
9. The next window confirms a unique value to be stored in table. Select Customer Number and click Next, as indicated in Fig. 2.2.19.
Fig. 2.2.19. Select Field to be stored in Table
10. In the next window that appears, select the option Store the value in this field and select the value Sale to Customer from the dropdown, as indicated in Fig. 2.2.20.
NOTE: The first option Remember the value for later use is used in case of unbound controls.

Downloaded from : taxupindia.com
main source : ICAI
DATABASE APPLICATIONS USING MS-ACCESS
204 ADVANCED INFORMATION TECHNOLOGY
Fig. 2.2.20. Select field to store the value
11. Click Next to make the Name window appear. Type the name cmbCustomers for the Combo Box and click Finish to close the wizard, as indicated in Fig. 2.2.21.
Fig. 2.2.21: Type Name for Combo Box
12. The Sale to Customer combo box appears on the form, as displayed in Fig. 2.2.22.
Fig. 2.2.22. Combo Box added in form
13. Set the formatting of the label and combo box to make it more presentable. Open the form in Form View to verify the added combo box. The form should appear, as shown in Fig. 2.2.23.

Downloaded from : taxupindia.com
main source : ICAI
DESIGNING FORMS AND REPORTS
ADVANCED INFORMATION TECHNOLOGY 205
Fig. 2.2.23. The Combo Box List appears
2.3 Make effective use of Forms
Most databases provide forms for data entry and for viewing data. Access 2010 provides few techniques that help enhancing the usability of forms, and in turn, the productivity of the users of database. Forms are used by most of the users on a regular basis, and hence it is very crucial to make the effective use of forms. Adding more capabilities to forms helps to save user time and work, and also present data in a more organised way. Some of the extended functionality of the form can be:
Adding calendar control on a form
Organising information with tab pages
Displaying a summary with tab pages
2.3.1 Displaying a calendar control on a Form
To make forms more presentable and user friendly, different types of controls can be added to forms. These controls can be as simple as controls that are available in the design ribbon -> controls tab, or can be a third party ActiveX control. ActiveX controls are usually graphical objects that do not operate as standalone solutions, and they run only in the Windows environment.
Calendar control is one of the most popular ActiveX controls. While working with dates, it is always helpful to have a calendar nearby. If a form contains a date field, it is always good to add a calendar control which displays dates graphically and make the form more user-friendly. The calendar control provides properties that enable to set and retrieve dates in/from a table.
2.3.2 Problem Scenario
Database Designer of Apex Ltd. has designed the frmOrders form to be used for Sales Orders table, as shown in Fig. 2.3.1 The Supervisor of the Customer Service Group informs the designer that the people taking orders

Downloaded from : taxupindia.com
main source : ICAI
DATABASE APPLICATIONS USING MS-ACCESS
206 ADVANCED INFORMATION TECHNOLOGY
often need to refer to a calendar to answer customer questions, such as when they will receive a shipment. A calendar is necessary so that the customer service employees can take weekends and holidays into account when they make an estimate as to when orders will be shipped.
Fig. 2.3.1. frmOrders Form
Solution
A Calendar control is added to all the date fields to make the form convenient for the users. The Database Developer adds a calendar control for Sales Date and Ship Date for users to pick up date graphically.
Steps to add a Calendar Control
1. Right-click the frmOrders and select Design View from the dropdown to open the form in Design View, as shown in Fig. 2.3.2.
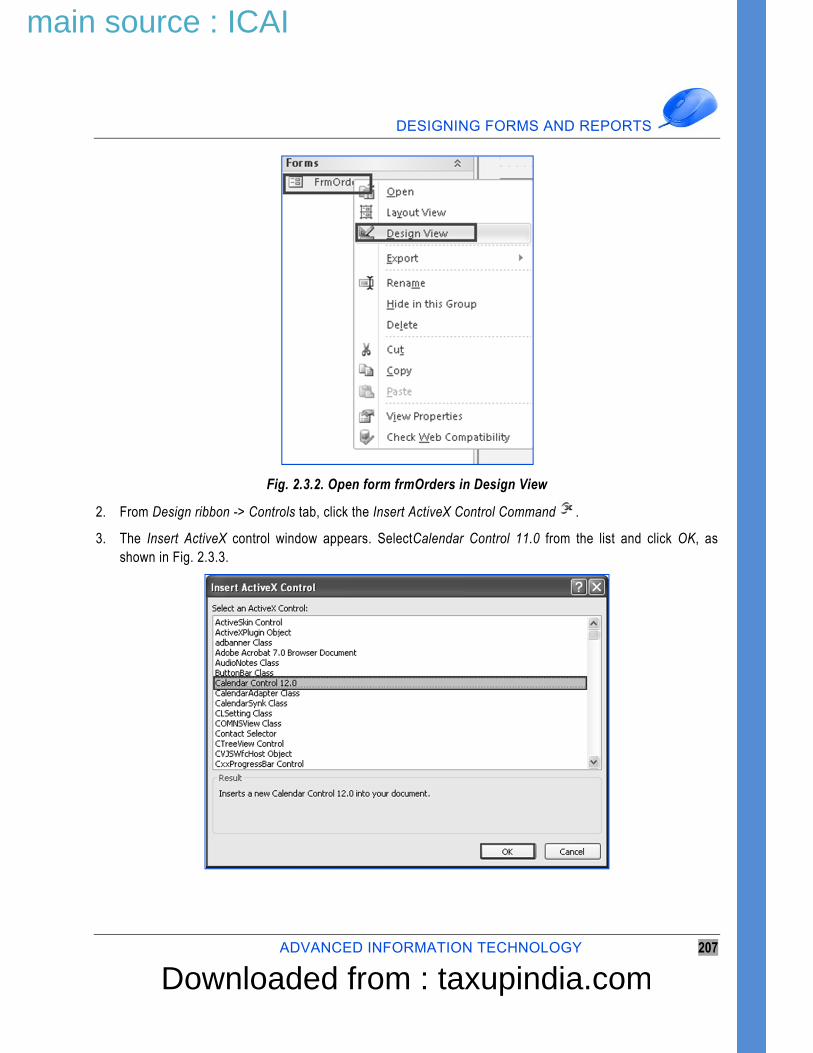
Downloaded from : taxupindia.com
main source : ICAI
DESIGNING FORMS AND REPORTS
ADVANCED INFORMATION TECHNOLOGY 207
Fig. 2.3.2. Open form frmOrders in Design View
2. From Design ribbon -> Controls tab, click the Insert ActiveX Control Command .
3. The Insert ActiveX control window appears. SelectCalendar Control 11.0 from the list and click OK, as shown in Fig. 2.3.3.

Downloaded from : taxupindia.com
main source : ICAI
DATABASE APPLICATIONS USING MS-ACCESS
208 ADVANCED INFORMATION TECHNOLOGY
Fig. 2.3.3. Select Calendar control
4. The Calendar control is placed in the upper-left corner of the form. Drag it to the required position. The frmOrders after inserting the Calendar control appears, as displayed in Fig. 2.3.4.

Downloaded from : taxupindia.com
main source : ICAI
DESIGNING FORMS AND REPORTS
ADVANCED INFORMATION TECHNOLOGY 209
Fig. 2.3.4: Calendar control inserted on the form
5. Select the Calendar control and press F4 to open the Property Sheet for the Calendar control
6. Move to the data tab in property sheet. Click the arrow next to the Control Source property, and choose Sales Date from the list, as shown in Fig. 2.3.5.
Fig. 2.3.5. Set the Control Source property

Downloaded from : taxupindia.com
main source : ICAI
DATABASE APPLICATIONS USING MS-ACCESS
210 ADVANCED INFORMATION TECHNOLOGY
NOTE: The Calendar control has many properties that you can set to create a custom appearance.
7. To set other properties of Calendar control, click on button in the Custom property in Other tab. The Calendar properties appear, as shown in Fig. 2.3.6.
Fig. 2.3.6. Calendar Properties
2.3.3 Organising information with Tab Pages
A Tab control is an Access 2010control that allows user to create multiple pages in one form. Each page is separated by its own tab and becomes active when the user selects a tab. Tab controls are useful for presenting grouped information that can be assembled by category. A tab control has pages, each with a tab of its own. Each tab page can contain all types of controls, such as text boxes, combo boxes, images, and even command buttons.
2.3.4 Problem Scenario
The Sales Manager asks the Information Analyst to store the information of the customer which could be displayed in a friendly manner, such that the customer’s personal details and company details can be viewed separately.
Solution
The Information Analyst advises the developer to divide the information into separate tab in a form. One tab in the form should contain customer contact detail, while the other can contain customer’s company details, and third tab can contain customer’s terms with the company.

Downloaded from : taxupindia.com
main source : ICAI
DESIGNING FORMS AND REPORTS
ADVANCED INFORMATION TECHNOLOGY 211
Steps to add tab in a form
1. On the Create ribbon -> Forms tab, click Blank Form to create a new form, as shown in Fig. 2.3.7.
Fig. 2.3.7: Open a blank Form
2. From the Field List window, open the plus sign with Customers table and drag the fields Customer Number, First Name, Middle Name and Last Name to the form. The form appears, as shown in Fig. 2.3.8.
Fig. 2.3.8. Add Fields to a blank form
NOTE: If the field list window does not appear, click on Add Existing Field from Design ribbon -> Tools tab.
3. Click Home ribbon -> Views tab -> View and select Design View from the dropdown to open the form in Design View. The form appears in Design View, as shown in Fig. 2.3.9.
Fig. 2.3.9. Form in Design View

Downloaded from : taxupindia.com
main source : ICAI
DATABASE APPLICATIONS USING MS-ACCESS
212 ADVANCED INFORMATION TECHNOLOGY
4. Extend the size of the form as required. Click on tab control in Design ribbon -> Controls tab and draw it into the form. The form appears, as shown in Fig. 2.3.10.
Fig. 2.3.10. Add tab control to a form
5. Double-click the tab Page28. Property sheet appears. Type the value Personal Details in Name property, as shown in Fig. 2.3.11.
Fig. 2.3.11. Change the name of first tab
6. In a similar manner, change the name of the second tab to Company Details. Right-click the Tab control and select Insert Page from the dropdown to add a new tab and change its name to Other Details. The form should appear, as in Fig. 2.3.12.

Downloaded from : taxupindia.com
main source : ICAI
DESIGNING FORMS AND REPORTS
ADVANCED INFORMATION TECHNOLOGY 213
Fig. 2.3.12. Add three tabs to Form
7. Move to the Personal Details tab, and select the field Street, City, Country, Zip/Postal Code, Phone, Other Phone, and Email from the Field List window. The resultant form is displayed in Fig. 2.3.13.
Fig. 2.3.13: Add required field to personal Details tab

Downloaded from : taxupindia.com
main source : ICAI
DATABASE APPLICATIONS USING MS-ACCESS
214 ADVANCED INFORMATION TECHNOLOGY
8. In a similar manner, add the fields CompanyName, Company Details and Job Title to the Company Details tab and also the fields Credit Limit, Payment Terms, Comments, and Document submitted to the Other Details tab.
9. A tabbed form is prepared. Now the user can navigate between different tabs to view the information required.
10. Save the form as frmCutomers.
2.3.5 Displaying a Summary of Data in a Form
Presenting a summary of data can be very useful to users who access database. PivotCharts and PivotTables are created in forms to display a summary of data. Pivot Table is used to summarize and analyzes data in a form. The idea of Pivot Table is to let users slice and dice the data in any way required at a given moment in time. Pivot Table represents the data in spreadsheet form, while Pivot Chart represents the same data in a graphical form. Both Pivot Chart and Pivot Table are different views of a form.
Pivot Table represents the data in tabular form, in which one or more vales are represented in rows, another value in columns, and a summarized value at the intersection of row and column. Forms that lend themselves to be displayed in PivotTable or PivotChart view provide many ways for users to manipulate data. An example of such a form is one that contains information about country, city, salesperson, sales, and date of sale. Such form can be used to determine sales by city and salesperson for each month, or sales in each country for each salesperson during the year.
2.3.6 Problem Scenario
The Sales Manager wishes to see the summarized data of sales. He requests the Database Developer to create a form in such a manner, that it should display the summarized data in terms of cost of Item Sold per year, per country. For example, he needs a report displaying summary of the items sold country wise and state wise in year 2008 Quarter-2.
Solution
The Database Developer first creates a query based on table Sales Order, Customers, Sales Item Description, and Inventory and fetches the required data from it. Once query is created, then a form using pivot table option is created over the query.
Steps for creating a query
1. Open the Query Design window by clicking Create ribbon ->Queries tab -> Query Design.
2. Select the tables Customers, Sales Order, Sales Item Description and Inventory table from the Show Table window. Click OK to close the window. The Query Design window appears, as shown in Fig. 2.3.14.

Downloaded from : taxupindia.com
main source : ICAI
DESIGNING FORMS AND REPORTS
ADVANCED INFORMATION TECHNOLOGY 215
Fig. 2.3.14. Query Design window
3. Select Country and State from the Customers table and drag them to the Add Columns tab. Similarly add the column Sales Date from Sales Order table and Item Number from Inventory table. Also add a calculated column as Total Sale: [Quantity] * [Price]. The resultant query window is displayed in Fig. 2.3.15.
Fig. 2.3.15. The query Design window
4. Save the query as SummarizedData and run to confirm the results.
Steps for creating a Pivot Table Form
1. Select the query SummarizedData under All Access Objects -> Queries tab. From the Create ribbon -> Forms tab ->, click the dropdown arrow near More Forms and select Pivot Table from the list, as indicated in Fig. 2.3.16.

Downloaded from : taxupindia.com
main source : ICAI
DATABASE APPLICATIONS USING MS-ACCESS
216 ADVANCED INFORMATION TECHNOLOGY
Fig. 2.3.16. Select the Pivot Table option
2. The Pivot Table window appears along with the field list, as shown in Fig. 2.3.17.
Fig. 2.3.17. The Pivot Table window
NOTE: If the Field List window does not appear, click Design ribbon -> Show/Hide tab and Field List.
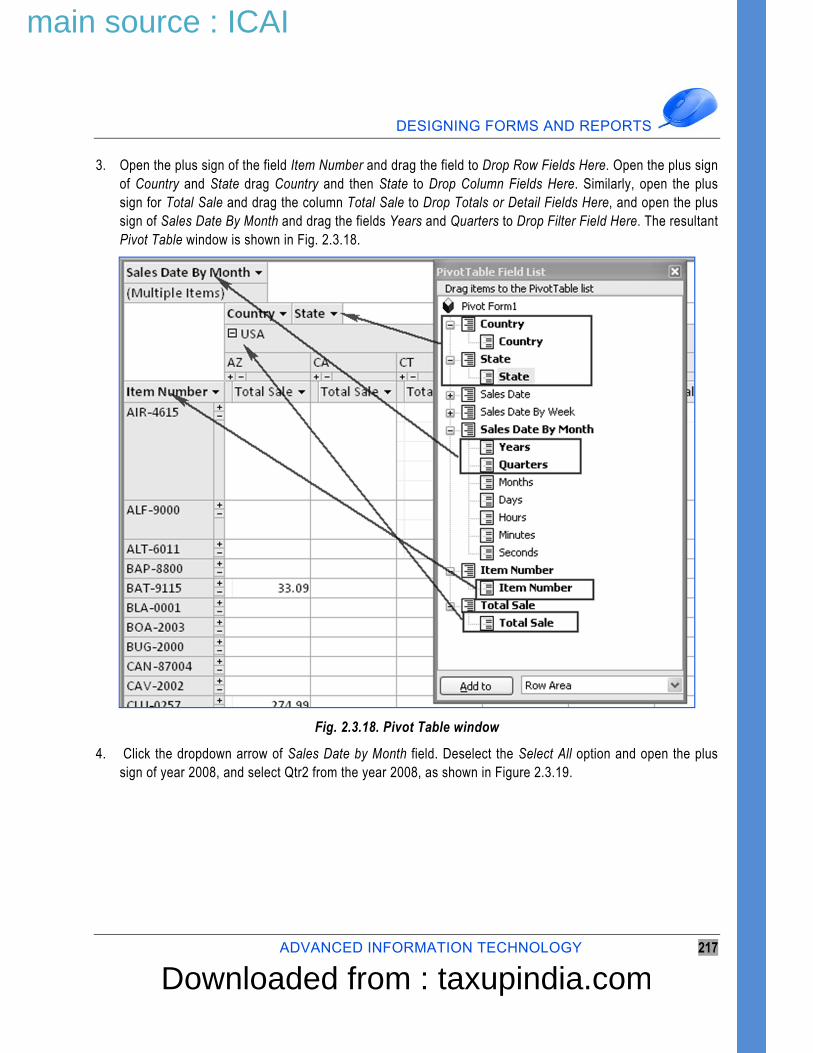
Downloaded from : taxupindia.com
main source : ICAI
DESIGNING FORMS AND REPORTS
ADVANCED INFORMATION TECHNOLOGY 217
3. Open the plus sign of the field Item Number and drag the field to Drop Row Fields Here. Open the plus sign of Country and State drag Country and then State to Drop Column Fields Here. Similarly, open the plus sign for Total Sale and drag the column Total Sale to Drop Totals or Detail Fields Here, and open the plus sign of Sales Date By Month and drag the fields Years and Quarters to Drop Filter Field Here. The resultant Pivot Table window is shown in Fig. 2.3.18.
Fig. 2.3.18. Pivot Table window
4. Click the dropdown arrow of Sales Date by Month field. Deselect the Select All option and open the plus sign of year 2008, and select Qtr2 from the year 2008, as shown in Figure 2.3.19.

Downloaded from : taxupindia.com
main source : ICAI
DATABASE APPLICATIONS USING MS-ACCESS
218 ADVANCED INFORMATION TECHNOLOGY
Fig. 2.3.19. Select the required year
5. The Pivot Table window displays the sales made for each item country and state wise in Quarter2 of year 2008.
NOTE: Pivot Table gives you a flexibility of selecting the desired data and view the data according to your requirements.
2.4 Advanced Reports
Reports are one of the best ways to represent data. Reports can be made more advanced and more user friendly to represent the data in a more organized form. The Reports can include customized Headers and Footers such as to display the company Logo or the department. Also the calculated controls can be added to report to display computed values.
2.4.1 Creating Customised Headers and Footers
Reports can include pairs of header and footer sections:
Report Header and Footer for printing information at the beginning and end of the report.
Page Header and Footer for printing information at the top and bottom of each page.
Group Header and Footer for printing information when the group starts or the group ends, if groups exist in the report.
To add a header/footer pair, right-click in the report design and choose Page Header/Footer or Report Header/ Footer from the shortcut menu. Page and report headers and footers are added as pairs, while In Group only Headers can be added.

Downloaded from : taxupindia.com
main source : ICAI
DESIGNING FORMS AND REPORTS
ADVANCED INFORMATION TECHNOLOGY 219
Controls in the Report Header & Footer section are printed only once at the beginning and the end of the report. A common use of a Report Header section is as a cover page or a cover letter, or for presenting information that needs to be communicated only once to the user of the report. The Report Footer section can be used to display the summarized data of whole report, like author of report, date & time, etc.
Controls in the Page Header & Footer section are normally printed at the top and bottom of every page. Typically, Page Headers serve as column headers in group/total reports; they can also contain a title for the report. A Group Header section normally displays the name of the group. Group Headers immediately precede Detail sections. A Group Header is added to the report if any grouping is done in the report.
Each Header& Footer section in reports can be customized from their traditional look to meet user’s requirement. Different controls can be added to header and footer. The textboxes or labels can be used to display a user-defined message. Various functions and expression can be used to display summary results and computed data.
2.4.2 Problem Scenario
The Database Developer has prepared a report rptCustomers to display all the details of the customers, as shown in Fig. 2.4.1. The Zonal Sales Head requires the report to be customized; each page of the report must contain the Report Title at the top and date & time at bottom.
Fig. 2.4.1: Report rptCustomers

Downloaded from : taxupindia.com
main source : ICAI
DATABASE APPLICATIONS USING MS-ACCESS
220 ADVANCED INFORMATION TECHNOLOGY
Solution
The Database Developer adds a Page Header & Footer to the report and customizes the Page Header to hold a label with Report Title, and Page Footer to contain the date & Time using Date Time control.
Steps to customize Page Header & Footer of the Report
1. Right-click the report rptCustomers under All Access Object -> Reports tab and select Design View from the dropdown to open the report in Design View. The Report Design View should appear, as in Fig. 2.4.2.
Fig. 2.4.2: Report rptCustomers Design view
2. Expand the Page Header section. Select a label control from Design ribbon -> Controls tab and draw it on the Page Header section, as indicated in Fig. 2.4.3.
Fig. 2.4.3. Add Label to Page Header
NOTE: If Report Header does not appear right-click the report and select Page Header /Footer to view them.

Downloaded from : taxupindia.com
main source : ICAI
DESIGNING FORMS AND REPORTS
ADVANCED INFORMATION TECHNOLOGY 221
3. Type the text Customers into the label and format it according to the requirement, as shown in Fig. 2.4.4.
Fig. 2.4.4. Add Title to Label
4. In a similar manner, add a Textbox control to the Page Footer of the report from Design ribbon -> Controls tab. The resultant report appears, as shown in Fig. 2.4.5.
Fig. 2.4.5: Add Textbox to the Report
5. Delete the label of the Textbox and type =Now() in the textbox. The report appears, as shown in Fig. 2.4.6.
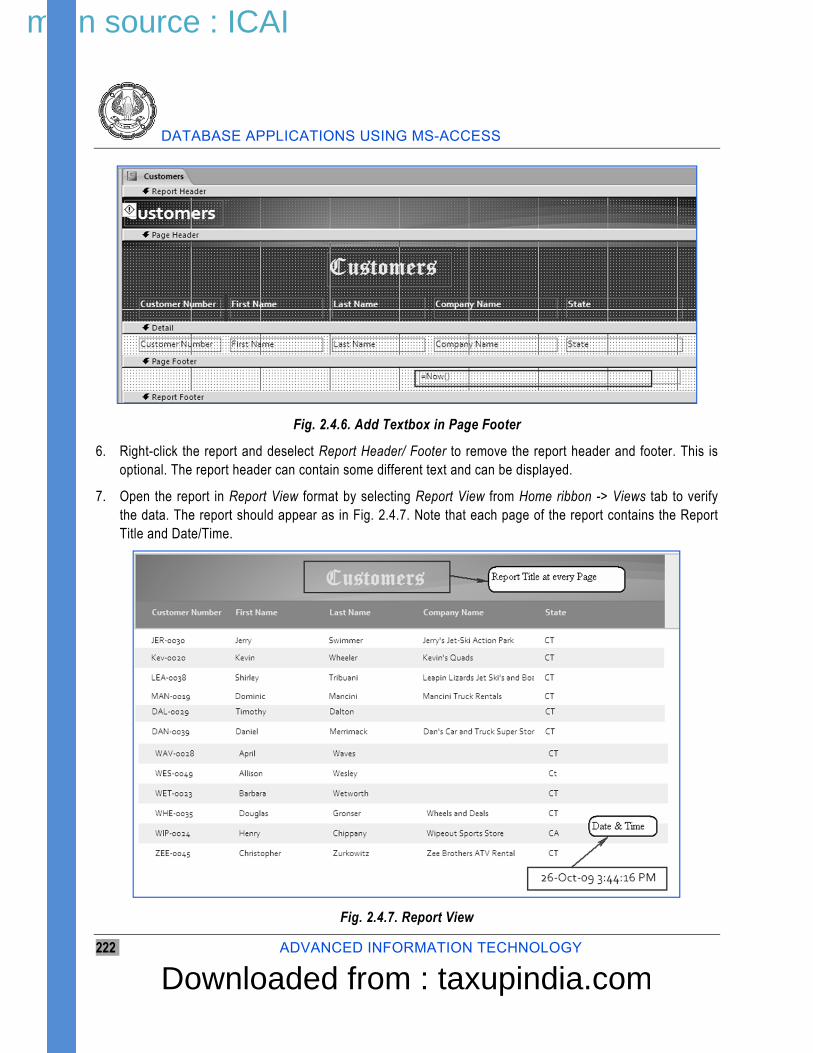
Downloaded from : taxupindia.com
main source : ICAI
DATABASE APPLICATIONS USING MS-ACCESS
222 ADVANCED INFORMATION TECHNOLOGY
Fig. 2.4.6. Add Textbox in Page Footer
6. Right-click the report and deselect Report Header/ Footer to remove the report header and footer. This is optional. The report header can contain some different text and can be displayed.
7. Open the report in Report View format by selecting Report View from Home ribbon -> Views tab to verify the data. The report should appear as in Fig. 2.4.7. Note that each page of the report contains the Report Title and Date/Time.
Fig. 2.4.7. Report View

Downloaded from : taxupindia.com
main source : ICAI
DESIGNING FORMS AND REPORTS
ADVANCED INFORMATION TECHNOLOGY 223
2.4.3 Adding Calculated Values
Reports in Access 2010 can be modified to display the data as per user requirements. In general, reports contain fields from the table, but many times it becomes necessary to add some computed values in reports. These computed values may count, sum, or calculate an average of the numeric values in a group created in the report. Also, these computed values can be calculated using one or more fields in a table, for example, to display the total cost by multiplying quantity and price.
The calculated values in reports are added using a text box and specifying an expression. The liberty of displaying computed values helps to display the reports in a user-friendly format. The calculated values in the report can be displayed in two ways: using queries with calculated columns and creating reports based on them, or by computing values in the report itself using Expression and Functions. The calculated values in queries are displayed as fields in reports which use them.
2.4.4 Problem scenario
Consider the report rptCustomers discussed in section 3.4.1.The Sales Head wishes the customer name should be displayed as a complete name, not as first name and last name. He requests the Database Developer to implement the change.
Solution
The Database Developer adds a calculated value that concatenates first name and last name in the report rptCustomers and replaces the First Name and Last Name textboxes.
Steps to add Calculated Values
1. Right-click the report rptCustomers under All Access Objects -> Reports tab and select Design View from the dropdown. The report appears in Design View, as shown in Fig. 2.4.8.
Fig.2.4.8: report in Design View
2. Select the First Name and Last Name textboxes and delete them. Add a new Textbox control from Design ribbon -> Controls tab.
3. Drag the Textbox in place of First Name and Last Name textboxes. The report should appear, as shown in Fig. 2.4.9.

Downloaded from : taxupindia.com
main source : ICAI
DATABASE APPLICATIONS USING MS-ACCESS
224 ADVANCED INFORMATION TECHNOLOGY
Fig. 2.4.9. Add Textbox control to Report
4. Delete the Textbox Label and type the text = [First Name] + “ “ + [Last Name] in the textbox. The report window appears, as shown in Fig. 2.4.10.
Fig. 2.4.10. Write the expression in calculated control
5. Add a label control from Design ribbon -> Controls tab in the Page Header tab along with other headings. The Report should appear, as in Fig. 2.4.11.
Fig. 2.4.11. Add Label Control to Page Header

Downloaded from : taxupindia.com
main source : ICAI
DESIGNING FORMS AND REPORTS
ADVANCED INFORMATION TECHNOLOGY 225
6. Type text Name in label and format the label accordingly. The Report should appear, as shown in Fig. 2.4.12.
Fig. 2.4.12: Format the label
7. Select Report View from Home ribbon -> Views tab to open the report in Report View. The resultant report should appear, as in Fig. 2.4.13.
Fig. 2.4.13. Report view
2.4.5 Sub-Reports
Sub-Report is a report that is inserted in another report. A sub-report, a complete report in its own right, is inserted into another report, called the Main Report. Main Report can be either bound or unbound. A bound main report is based on a table or query and its sub-reports contain related information. An unbound main report is not based on a table or query, but can serve as a container for one or more sub-reports. A main report can include as many sub-reports as necessary. The sub-reports can be added to two hierarchy levels.

Downloaded from : taxupindia.com
main source : ICAI
DATABASE APPLICATIONS USING MS-ACCESS
226 ADVANCED INFORMATION TECHNOLOGY
Sub-Reports are usually an extension of data in main report. For example, the main report can contain details about the sales in a year, while the sub-report can show data for sale of each item or charts and graphs summarising and illustrating the numbers in the main report. If a sub report is inserted in a bounded main report, it should contain some field to link to main report.
2.4.6 Problem Scenario
Consider the Report rptCustomersdiscussed in section 3.4.1. The Regional Head notices that the database users face a big problem while tracing the orders placed by each customer. He asks the Database Developer to create a user-friendly object which can display both the customer’s details and orders placed by the customer.
Solution
The Database Developer decides to add a sub report to the report rptCustomers which include details of the orders placed by the customers. For this purpose, the table Sales Order is used and the fields Sale to Customer from Sales Order and Customer Number from Customers are mapped.
Steps to add a Sub Report to Main Report
1. Right-click the report rptCustomers and select Design View from the dropdown to open the report in Design View.
2. In the Design View, expand the Details section. Select the sub-report control from Design ribbon -> Controls tab and draw the control in Details section.
3. The SubReport Wizard appears, as shown in Fig. 2.4.14.
Fig. 2.4.14. SubReport Wizard

Downloaded from : taxupindia.com
main source : ICAI
DESIGNING FORMS AND REPORTS
ADVANCED INFORMATION TECHNOLOGY 227
4. Select the option Use Existing Tables and Queries and click Next to proceed further, as shown in Fig. 2.4.15.
Fig. 2.4.15. Select option to use existing table
5. In the Select Table or Query window, select the table Sales Orders from the list. Select the fields Sales Order Number, Sale to Customer, Sales Date, Ship Date from selected field to available field, as shown in Fig. 2.4.16.
Fig. 2.4.16. Select required Table

Downloaded from : taxupindia.com
main source : ICAI
DATABASE APPLICATIONS USING MS-ACCESS
228 ADVANCED INFORMATION TECHNOLOGY
6. Click Next to advance. The Link Field window appears. Select Customer Number from Forms/Reports field and Sale to Customer from Subforms /Sub reports field. The Sub Report Wizard appears, as shown in Fig. 2.4.17.
Fig. 2.4.17. Link fields of main report and sub report
7. Click Next to proceed to Name of Sub report window. Provide a suitable name to your sub report, and click Finish to close the window as indicated in Fig. 2.4.18.
Fig. 2.4.18: Provide a name to the sub report.

Downloaded from : taxupindia.com
main source : ICAI
DESIGNING FORMS AND REPORTS
ADVANCED INFORMATION TECHNOLOGY 229
8. Open the resultant report in Report View by selecting Report View from Home ribbon -> Views tab. Final report appears, as shown in Figure 2.4.19.
Fig. 2.4.19. Customers and Orders placed by them
2.5 Make Reports more effective
Reports are a way of communicating database information. By customizing reports, the information can be presented in the most effective format. A customized report developed by using Access 2010 tools can reach a wider audience and enable more users to handle them. Different methods to make reports effective can be:
including charts in a report
printing data in columns
canceling the printing of a blank report
creating report snapshot
2.5.1 Including a Chart in a Report
Chart is a graphical representation of information used to illustrate quantitative relationships. It is a diagram that depicts a relationship, often functional, between two sets of numbers or between a set of numbers and a set of categories.
Microsoft Graph is used to chart data from any of the database tables or data stored within other applications. It creates graphs in a wide variety of styles, such as bar graphs, pie charts, line charts, and others. Because Microsoft Graph is an embedded OLE application, it does not work by itself. As such, it has to be run from within Access 2010. In other words, it is dependent on Access 2010.

Downloaded from : taxupindia.com
main source : ICAI
DATABASE APPLICATIONS USING MS-ACCESS
230 ADVANCED INFORMATION TECHNOLOGY
Different Chart Types
Chart Type Purpose
Column Chart Used to compare multiple values of categories or differences over a period of time. The horizontal axis depicts categories and the vertical axis depicts values.
Bar Chart Used for the same purposes as a Column Chart. However, the horizontal axis of a Bar Chart shows values and the vertical axis shows categories or periods of time.
Area Chart Used to emphasize differences in individual values to the total, over a period of time.
Line Chart Used to compare trends over a period of time.
Pie Chart Used to show the relationship of a part to the whole. It is suitable for depicting one data series or data at a point in time.
Charts can be included in reports to illustrate the information more clearly. Charts enhance the data presented in reports by summarising the information and illustrating it in easily understandable ways. The reader can analyse trends and make comparisons using charting tools. The chart can be linked to a field in the underlying table or query.
2.5.2 Problem Scenario
The Sales Head wishes to create a summary report. The report should show the quarterly total sales for each category. The Sales Head requests the Information Analyst to show a diagrammatic representation of the report.
Solution
The best way to display the summary report is to create charts to represent the data. The charts can be included in a report, and based on a query to show its diagrammatic representation.
Steps to Include Chart in Report
1. The Query Sales data represents the summarized data for per quarter sale. The design of the query is displayed in Fig. 2.5.1.

Downloaded from : taxupindia.com
main source : ICAI
DESIGNING FORMS AND REPORTS
ADVANCED INFORMATION TECHNOLOGY 231
Fig. 2.5.1. Sales Data Query
2. Select Report Design from Create ribbon -> Reports tab. A blank report opens.
3. Select Chart control from Design ribbon -> Controls tab and draw it on the report. The Chart Wizard appears, as shown in Fig. 2.5.2.
Fig. 2.5.2. Chat Wizard

Downloaded from : taxupindia.com
main source : ICAI
DATABASE APPLICATIONS USING MS-ACCESS
232 ADVANCED INFORMATION TECHNOLOGY
4. Select the Queries option, and select Query: Sales Data from the list, as indicated in Fig. 2.5.3.
Fig. 2.5.3. Select Queries Sales Data
5. Click Next to advance. The Select Field window appears. Select all the fields: Category, Qtr, and Sales, as shown in Fig. 2.5.4.
Fig. 2.5.4. Select required fields

Downloaded from : taxupindia.com
main source : ICAI
DESIGNING FORMS AND REPORTS
ADVANCED INFORMATION TECHNOLOGY 233
6. Click Next to proceed. In the Choose Chart Type, select the Column Chart and click Next.
7. In Preview Chart window drag field Qtr to Axis, Category to Series and Sales to Data as shown in Fig. 2.5.5. Click Next to advance.
Fig. 2.5.5. Drag the fields to chart
8. Specify the title for the chart and select the Display Legend option. Click Finish to close the window.
9. The resultant chart appears, as shown in Fig. 2.5.6.
Fig. 2.5.6. The Sales Data Report

Downloaded from : taxupindia.com
main source : ICAI
DATABASE APPLICATIONS USING MS-ACCESS
234 ADVANCED INFORMATION TECHNOLOGY
NOTE: The chart object can be modified by right-clicking and selecting Chart Object -> Edit from the dropdown. Also, the chart object can be embedded with existing data in the report so that the chart changes with each record display.
2.5.3 Printing Data in Columns
Reports are a handy tool to represent data. The visibility of the reports makes an impact on how data can be viewed. Some of the reports may involve long lists of just a few fields of data—such as a phone or product list. These may be best arranged in multiple columns for better readability.
While working with many databases, it is natural to come across some that consists of long lists of information. As a result, printing such data can mean printing a single column on many pages.
The multiple columns for the report can be set using the Report Page Setup property and setting the number of columns to 2 or more, as shown in Fig. 2.5.7.
Fig. 2.5.7. Select multiple columns from Page Setup
2.5.4 Cancelling the Printing of a Blank Report
If a report contains no records, the detail area of the report will be blank. While printing reports, it is not be advisable to print blank report. Macros can be used to cancel printing of a blank report and thus save time and effort. Depending on the availability of data, certain records may be absent in a report and printing a blank report would be meaningless.

Downloaded from : taxupindia.com
main source : ICAI
DESIGNING FORMS AND REPORTS
ADVANCED INFORMATION TECHNOLOGY 235
To cancel previewing or printing of a blank report when the underlying query has been run with no records returned, the On No Data event of the report is used.
2.5.5 Problem scenario
The Database Developer has prepared a report CustOrders, which accepts the customer’sfirst name and displays all orders placed by the customer in the current quarter. However, most users while printing the report found that the even when the query returns no results, the report is printed. They requested the Database Developer to resolve the problem.
Solution
The report event On No Data can be used to cancel the printing of report when no data is returned.
Steps for Canceling the Print
1. Open the CustOrders Report in Design View.
2. Press F4 to open the property sheet of report. Make sure that the report is selected in the Selection Type textbox. On the Event tab, select the property On No Data, as indicated in Fig. 2.5.8.
Fig. 2.5.8. Property Sheet of Report
3. Select button of On No Data property.Choose Builder window appears. Select Macro Builder and click OK as shown in Fig. 2.5.9.
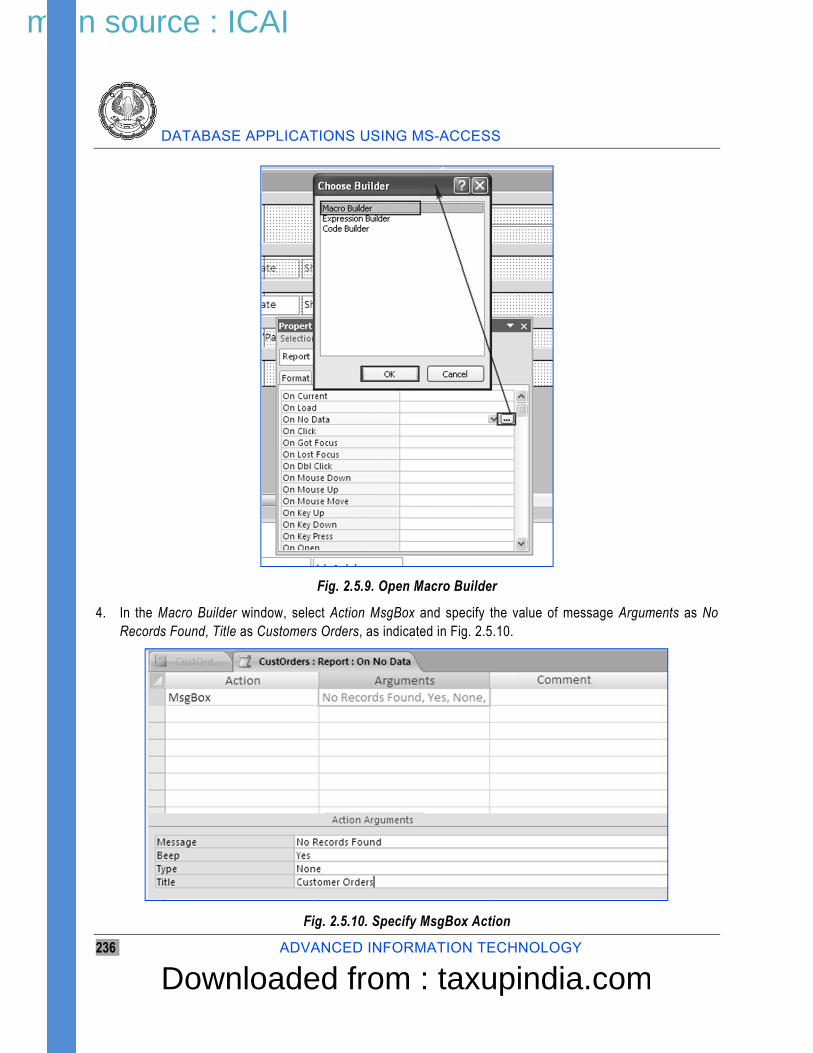
Downloaded from : taxupindia.com
main source : ICAI
DATABASE APPLICATIONS USING MS-ACCESS
236 ADVANCED INFORMATION TECHNOLOGY
Fig. 2.5.9. Open Macro Builder
4. In the Macro Builder window, select Action MsgBox and specify the value of message Arguments as No Records Found, Title as Customers Orders, as indicated in Fig. 2.5.10.
Fig. 2.5.10. Specify MsgBox Action

Downloaded from : taxupindia.com
main source : ICAI
DESIGNING FORMS AND REPORTS
ADVANCED INFORMATION TECHNOLOGY 237
4. Specify the second action as CancelEvent and click the Close button to close the Macro window. The confirmation message appears, as indicated in Fig. 2.5.11.
Fig. 2.5.11. Confirm to close the macro
5. Click Yes to save the macro and close the message window. The macro now appears on No Data event.
6. Open the report and verify that the macro is working.
2.6 Summary
Forms and Reports are a crucial part of data representation in Access 2010. Access 2010 provides various utilities to make Forms and Reports more user-friendly and presentable. Different controls can be added to forms to display the logo of the company, date and time, and pictures. Forms also permit the inclusion calculated values and combo boxes which make it much easier to handle the controls and present data to user. This control helps make data handling easier for the user. Access 2010 provides various ActiveX like calendar control to make forms more interactive. Sometimes, it is required to display the information on a form in groups. The tab control available with Access 2010 can be used for this purpose. The popular utility for summarizing data of Pivot Table to summarize data is also available in Access 2010.
Reports represent static data, but are a useful way of communicating. Reports in Access 2010 can be customized to user’s requirements including its header and footers. Another crucial feature available with reports is sub-reports, which enable data linking in several tables. Apart from this, we can add charts and calculated controls to reports to make them more visible. The properties of reports can be used to avoid printing of blank reports.
2.7 Lab Exercises
Considering the Apex Inventory Shipment database of Apex Ltd. Provide a solution to the following problem scenarios:
1. The Sales Manager of the company has demanded a form displaying the details of the orders, containing with Items ordered, Shipping Details and Invoice Information. Design the form Order Details as displayed in Figure below. Create tabs to represent the data.

Downloaded from : taxupindia.com
main source : ICAI
DATABASE APPLICATIONS USING MS-ACCESS
238 ADVANCED INFORMATION TECHNOLOGY
On the Order Details Form created in Question1 implement the Question 2 to 7:
2. In the Order Details form, convert the Customer Textbox to Combo Box which contains Customer Number and Company Name.
3. To make the Order Details form more user-friendly, add a calendar control to the form to select the Order Date.
4. The Sales Manager asked the developer to add a logo of the company the Order Details form as the form will be circulated among all divisions.
5. The database developer needs to make the form more presentable and has to add a picture on the background of each tab. Implement the needful.
6. In the Order Details tab of the form, add a calculated value that calculates the Total Price as Qty * Unit Price – Discount as shown in Figure below:
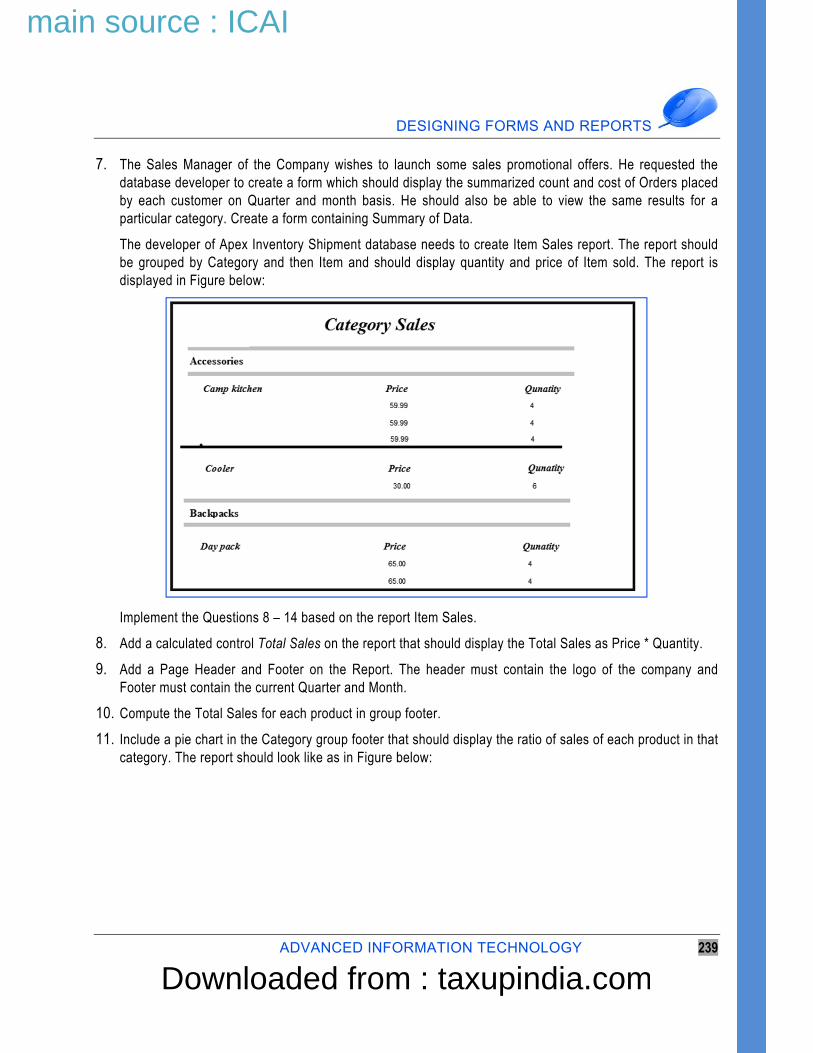
Downloaded from : taxupindia.com
main source : ICAI
DESIGNING FORMS AND REPORTS
ADVANCED INFORMATION TECHNOLOGY 239
7. The Sales Manager of the Company wishes to launch some sales promotional offers. He requested the database developer to create a form which should display the summarized count and cost of Orders placed by each customer on Quarter and month basis. He should also be able to view the same results for a particular category. Create a form containing Summary of Data.
The developer of Apex Inventory Shipment database needs to create Item Sales report. The report should be grouped by Category and then Item and should display quantity and price of Item sold. The report is displayed in Figure below:
Implement the Questions 8 – 14 based on the report Item Sales.
8. Add a calculated control Total Sales on the report that should display the Total Sales as Price * Quantity.
9. Add a Page Header and Footer on the Report. The header must contain the logo of the company and Footer must contain the current Quarter and Month.
10. Compute the Total Sales for each product in group footer.
11. Include a pie chart in the Category group footer that should display the ratio of sales of each product in that category. The report should look like as in Figure below:

Downloaded from : taxupindia.com
main source : ICAI
DATABASE APPLICATIONS USING MS-ACCESS
240 ADVANCED INFORMATION TECHNOLOGY
12. The details of the Sales of Item were to be presented in the Monthly meeting as a hardcopy. So the Manager asked the executive to get the report into columnar format so that is more readable. Remove the Page Headers and the chart, and print the report in two columns.
13. For the Annual review of the sales, the Vice President demanded a report displaying the product sales by month. The reports should display the products from a particular category, which is given by the user. The report should represent the data diagrammatically using charts. Create the required Report.
14. The Sales Manager found that there are few categories which are not produced any more by the company but are not discarded in the report. As a result if such category is entered, a blank report gets printed. As a report administrator, cancel the printing of the blank report.
Multiple Choice Questions
1. The controls that are not linked to any field of the table or query on the form are known as ________.
(a) ActiveX control
(b) Unbounded Controls
(c) Graphics Control
(d) Bound Controls
2. The Vice President of the Company wishes to add the image of the company vision statement as a background of all the forms. Which control can be used for the purpose?
(a) Calendar Control

Downloaded from : taxupindia.com
main source : ICAI
DESIGNING FORMS AND REPORTS
ADVANCED INFORMATION TECHNOLOGY 241
(b) ActiveX control
(c) Image Control
(d) Graphics Control
3. Which of the Header in reports can be viewed separately from the Footer?
(a) Page Header
(b) Group Header
(c) Report Header
(d) All of the above
4. The Manager requested the developer to create a Inventory form in a manner such that the Product’s description is stored in one group, the cost and supplier information another group. Which is the best control to display the required information?
(a) Use the Tab Control
(b) Use SubForms
(c) Add ActiveX Control
(d) None of the above
5. Which property of the form can be used to insert a background image?
(a) Caption
(b) Background
(c) Record Source
(d) Picture
6. The Sales Executive while filling the details of the orders placed find it very difficult to type the name of each product every time it is ordered. They demanded that the form should provide them a drop down to select the product to be ordered. How can we implement the required?
(a) Using the query in the form
(b) Using the Combo Box control
(c) Using a SubForm
(d) Cannot be done
7. The Calendar control can be selected from _______________
(a) Microsoft Office-> Access Options
(b) Design -> Controls
(c) Design -> Controls -> ActiveX controls
(d) Create -> Forms

Downloaded from : taxupindia.com
main source : ICAI
DATABASE APPLICATIONS USING MS-ACCESS
242 ADVANCED INFORMATION TECHNOLOGY
8. The Regional Sales Head demanded a summary report indicating the monthly sales done by each employee in each zone. Which kind of form is best to display the required data?
(a) Use tabbed browsing
(b) Insert an Image in form
(c) Insert SubForm
(d) Create Pivot Table
9. To print the multi-columnar report, the number of columns can be set through _________ property.
(a) Report property sheet
(b) Page Setup
(c) Report wizard
(d) Grouping
10. The persons from the delivery team found it very annoying that even when the reports contained no data, they are printed and they have to search for such reports among all the printed data. They requested the developer to find the solution to this problem. Which property of report can be used to implement the requirement?
(a) CancelPrint
(b) CancelEvent
(c) Create a macro called On No Data
(d) Create a macro called On Print
11. To display the data of the Products and the orders placed for each product in the current month. The following feature available in Reports can be used.
(a) Report Wizard
(b) Nested Reports
(c) Grouping
(d) SubReports
12. The Regional Head wishes to view the diagrammatic representation of data indicating the sales made by each zone in his region. Which feature can help to implement the requirement?
(a) Graphics
(b) ActiveX
(c) Charts
(d) Pivot Table
13. To display the list of employees grouped according to first letter of their name, which type of controls can be used in reports?

Downloaded from : taxupindia.com
main source : ICAI
DESIGNING FORMS AND REPORTS
ADVANCED INFORMATION TECHNOLOGY 243
(a) Use Calculated values in group
(b) Add grouping control
(c) Add Function control
(d) Add ActiveX control
14. Which property of the control is used to bind it to a field of a table or a query?
(a) Data
(b) Record Source
(c) Field
(d) None of the above
15. Each tab in a tab control is known as _________.
(a) Page
(b) Data Tab
(c) Control Page
(d) Control
16. The Sales Manager requested a summary form which should enable him to choose the category and display the monthly sale of each product in the category. In the created Pivot Table Form, The category field should be placed in which area?
(a) Drop Row Fields Here
(b) Drop Column Fields Here
(c) Drop Totals or Detail Fields Here
(d) Drop Filter Field Here
17. A developer created a report displaying the information of customer grouped according to country and state. To add a count of customer in each state the count textbox should be placed in which section of the report?
(a) Page Footer
(b) Report Footer
(c) State Group Footer
(d) Country Group Footer
18. The SubReport in the main report can be inserted to _______________ hierarchy level?
(a) 7
(b) 3
(c) 2
(d) 4

Downloaded from : taxupindia.com
main source : ICAI
BUILDING CRITERIA EXPRESSIONS
3.1 Introduction Expressions in Microsoft Access 2010 can be considered similar to formulae in Microsoft Excel. Expressions are a combination of operands, operators, functions, and values that are evaluated according to their order of precedence. Expressions can be used with tables, queries, forms, reports, and macros. In Access, expressions are used to obtain calculated values, provide criteria, and query or supply constraint to table columns. Access also provides a powerful user interactive graphical tool to create expressions known as Expression Builder.
In this chapter, we will discuss how to build criteria expressions in Access. We will also look at using various components of an expression for building query criteria. This chapter will also identify various operators available in Access 2010. Next, we will discuss the available built-in functions in Access. We will discuss the different type of functions and their utilisation. Further, this chapter will cover how to use Expression Builder to create expressions using Objects, Functions, Operators, and Identifiers.
3.2 Using Operands in Criteria Expressions Query criteria are the most important part of any query as they permit users to select only the desired records from an existing table. An operand is a value on which a calculation is performed. In other words, an operand is a data value that gets manipulated in the query expression. Operands can be literals, identifiers, or functions.
3.2.1 Literals
A literal is value that is not addressed by any name. It can be typed directly into the criteria expression. In Access, literal can be of type number, text, date, or logical value (i.e. True or False). Literals are also referred as constants as their values remain static throughout the evaluation of expression.
Examples of literal:
“Hello” + “ “ + “Everyone” , Here Hello and Everyone are Text literals
[Date] > #1/1/2011#, Here 1/1/2011 (1-Jan-2011) is a Date literal
CHAPTER
3 LEARNING OBJECTIVES Using operands in Criteria Expressions Using built-in functions Working with Expression Builder

Downloaded from : taxupindia.com
main source : ICAI
BUILDING CRITERIA EXPRESSIONS
ADVANCED INFORMATION TECHNOLOGY 245
3.2.2 Identifiers
Identifiers are variables. In Access, identifiers represent field name, table name, or control name. Identifiers are a crucial part of expression building as they specify the column to which an expression represents. While creating an expression in Access, identifiers are always represented in square brackets [ ].
Examples of identifiers used in an expression:
[Basic Salary] + [Tax]: Where Basic Salary and Tax are identifiers
3.2.3 Functions
Functions provide specialised operations to enhance the working of Access. Functions are built-in expressions that take an input, perform necessary calculations on it, and return the output. The input accepted by the function is called arguments; a function may have one or more number of arguments. Access provides us different functions to work with different type of data, such as Text functions, Date and Time functions, Numeric functions, and Mathematical functions.
For example, a text function Length takes an input string as an argument and returns the length of the string in number as:
Length (“MS Access”) will return 9.
3.2.3.1 Problem Scenario
Apex Ltd. is launching a new production unit in “California”, which will also focus on some new products. To promote these products a detailed list of all existing customers from “California” (state code CA) is required.
Solution
To achieve this, a query displaying Name, Contact Info, and Address of the customers is required. To get only the customers from “California”, the value CA in the criteria for the state field needs to be specified. Here, CA is a literal operand and is typed direct in query criteria.
Steps for creating required query
1. Click Create ribbon -> Other -> Query Design to open the Query Design window.
2. Select Customers from Show Table and click Add, as displayed in Fig. 3.2.1.

Downloaded from : taxupindia.com
main source : ICAI
DATABASE APPLICATIONS USING MS-ACCESS
246 ADVANCED INFORMATION TECHNOLOGY
Fig. 3.2.1. Show Table window
3. Select the columns Salutation, First Name, Middle Name, Last Name, Company, Street City, State, Zip/Postal Code Phone, and Email from table Customers and drag them to the columns tab. The Query window appears, as shown in Fig. 3.2.2.
Fig. 3.2.2. Select Required Columns

Downloaded from : taxupindia.com
main source : ICAI
BUILDING CRITERIA EXPRESSIONS
ADVANCED INFORMATION TECHNOLOGY 247
Now, we will add criteria to get records from “California”.
4. In the Criteria tab of field State, write the literal “CA”, as indicated in Fig. 3.2.3.
Fig. 3.2.3. Specify criteria for State
5. Click Save in the toolbar to save the query. Type the name of query as “Customers from California”.
6. Click the Run sign in Design ribbon -> Results to view the results of the query, as shown in Fig. 3.2.4.
NOTE: Literals are usually combined with operators to form complex expressions for query criteria.
Fig. 3.2.4. Query Results

Downloaded from : taxupindia.com
main source : ICAI
DATABASE APPLICATIONS USING MS-ACCESS
248 ADVANCED INFORMATION TECHNOLOGY
3.3 Using Operators in Criteria Expressions Operators make the expression complete. They are special symbols, such as +, -, used with operands to perform calculations. Every operator has a specific meaning and a symbol. Operators help create expressions with the combination of identifiers and values. Every operator is executed according to its priority.
For example: In [BasicSalary] + [Tax], “+” is an operator.
Different types of operators are:
Comparison operators
Arithmetic operators
Miscellaneous operators
Compound criteria and logical operators
3.3.1 Comparison Operators
Comparison operators, also known as relational operators, define relation between two identifiers or two values by comparing them. These operators can be used with Numeric or Date data type.
Comparison Operators are listed in Table 3.1
OPERATOR NAME EXPLAINATION
> Greater Than Num1 > Num2 returns true if Num1 is greater than Num2
< Less Than Num1 < Num2 returns true if Num1 is less than Num2
>= Greater Than Equal to
Num1 >= Num2 returns true if Num1 is greater than or Equal to Num2
<= Less Than Equal To Num1 <= Num2 returns true if Num1 is less than or equal to Num2
<> Not Equal To Num1 <> Num2 returns true if Num1 is not equal to Num2
= Equal To Num1 = Num2 returns true if Num1 is equal to Num2
Table 3.1: Comparison Operators
3.3.2 Arithmetic Operators
Arithmetic operators, commonly known as mathematical operators, are used with numeric data to perform calculations.

Downloaded from : taxupindia.com
main source : ICAI
BUILDING CRITERIA EXPRESSIONS
ADVANCED INFORMATION TECHNOLOGY 249
Arithmetic Operators are displayed in Table 3.2.
OPERATOR NAME EXPLAINATION
+ Addition
- Subtraction
* Multiplication
/ Divide Returns integer as a result of division of integer numbers and decimal as a result of division of decimal numbers, that is, 5\2 will return 2.5 and 5\2.5 will return 2.
\ Integer Divide Returns integer as a result of division, that is, 5\2 will return 2 and 5\2.5 will return 2.
^ Exponentiation Computes power, that is, the result of 5^3 is 125.
Mod Modulo Returns the remainder of the division of two integers, that is, 5/2 will return 1.
Table 3.2: Arithmetic Operator
3.3.3 Miscellaneous operators
In Access, a special set of operators is used with multiple data types. These operators provide an additional functionality to create expressions. Some of the miscellaneous operators are – LIKE, Between, IN, Is Null etc.
3.3.3.1 The LIKE Operator
The LIKE operator works with text or date data type. LIKE is used to match text patterns in the query criteria. This operator uses various wildcards to form different patterns. The various wildcards that can be used with LIKE are mentioned in Table 3.3.
Wildcard Explanation Example
* Denotes any number of characters (0 or more)
LIKE ‘A*’ will match all the characters starting from A
For example, Accounts, Audit
? Denotes a single character LIKE ‘B??K’ will match all the text with B as first letter, k as last letter and 2 letters in between.
For example- Book, Back
# Denotes a single digit LIKE ‘#ABC’ will match text which starts from a digit followed by ABC.
[xyz] Denotes a set of characters LIKE [ABC]* will match all text starting from either A, B, or C.
Table 3.3: Wildcards with LIKE operators

Downloaded from : taxupindia.com
main source : ICAI
DATABASE APPLICATIONS USING MS-ACCESS
250 ADVANCED INFORMATION TECHNOLOGY
3.3.3.2 The Between… And Operator
The Between operator is used with Numeric and Date data type to obtain a set of values within a specified range of values.
For Example:
Between 10 and 20 will give all the values within the range of 10 and 20 including 10 and 20.
Between #1/1/2011# And #8/1/2011# will return all the dates between 1-Jan-2011 And 1-Aug-2011.
(Note that dates are included between # and are written in “mm/dd/yyyy” format).
3.3.3.3 The IN operator
The IN operator is used to match a value to a set of values given. This operator can be used with Numeric, Text, or Date data types.
For Example:
[Month] IN (‘Jan’, ‘Feb’, ‘Apr’, ‘May’) will match all the month values which are either from the specified values.
3.3.3.4 The IS NULL operator
The IS NULL operator is used to find the null records in table. We use IS with NULL to indicate all the record which are null in the table. Note: Null is not “0” or “blank”.
For Example:
[Discount] IS NULL will return all the records with [Discount] value as NULL.
Similar to IS NULL, IS NOT NULL searches for non-null values.
For Example:
[Advance Amount] IS NOT NULL will return all records where [Advance Amount] is not null.
3.3.4 The Logical Operators
A logical operator results in expression that returns True or False. These operators are used to combine multiple expressions. They are also known as Boolean operators.
The logical operators are listed in Table 3.4.
OPERATOR NAME EXPLAINATION
And Logical And Returns True if both the expressions compared are True
Or Logical Or Returns True if either of the expressions compared is True
Eqv Logical Exclusive Nor Return True if either both the expressions are True or both the expressions are False
Xor Logical Exclusive Or Return True if either of the expressions is True
Not Logical Not Works with a single expression and returns True if the expression is False
Table 3.4: List of Logical Operators

Downloaded from : taxupindia.com
main source : ICAI
BUILDING CRITERIA EXPRESSIONS
ADVANCED INFORMATION TECHNOLOGY 251
3.3.5 Understanding the Operator Precedence
Access permits to create complex expressions containing multiple operators. To evaluate these expressions, Access determines which operator to evaluated first, and then which is next, and so forth according to a predetermined order. This order is known as operator precedence. Every operator is assigned a precedence order and is calculated in the same order.
The only exception to this rule is parenthesis (). Parentheses are used to group expressions and override the default order of precedence. Operations within parentheses are performed before any operations outside them. Within the parenthesis all operators are computed on basis of their precedence.
Operator precedence is similar to BODMAS order that is followed in algebra. Parenthesis or brackets over here perform the same function to change the priority order of operators.
Note: BODMAS =
B Brackets first
O Orders (ie Powers and Square Roots, etc.)
DM Division and Multiplication (left-to-right)
AS Addition and Subtraction (left-to-right)
Operators are first preceded in the order of their category and then within each category each operator has its own precedence order. Operators precedence according to their category is displayed in Table 3.5, from the highest to the lowest.
Operator Category Precedence Order
Arithmetic I
Comparison II
Boolean III
Table 3.5: Operator Precedence according to Category
Table 3.6 displays precedence of each operator within different categories from the highest to the lowest.
Category Operator Symbol Precedence Order
Arithmetic
Exponentiation ^ I
Multiplication and/or division (left to right) * , / II
Integer division \ III
Modulo Mod IV
Addition and/or subtraction (left to right) +, - V

Downloaded from : taxupindia.com
main source : ICAI
DATABASE APPLICATIONS USING MS-ACCESS
252 ADVANCED INFORMATION TECHNOLOGY
Comparison
Equal = I
Not equal <> II
Less than < III
Greater than > IV
Less than or equal to <= V
Greater than or equal to >= VI
Logical
Not I
And II
Or III
Xor IV
Eqv V
Imp VI
Table 3.6: Operator Precedence within Category
3.3.6 Using Compound Criteria
Queries can help retrieve data in any form. Queries are usually created on multiple criteria, known as compound criteria.
There are two types of compound criteria - “AND” and “OR.”
3.3.6.1 AND Criterion
In AND, compound criteria will return results only if each individual criterion is true.
For example, if we add criteria to the query from the Customer table as:
[State] = “CA” AND [Credit Limit] > 500000, it will return customers from California who have credit limit greater than 500000.
The AND criteria in a query designer is specified by writing all the criteria in some row of the Criteria tab, as shown in Fig.3.3.1.

Downloaded from : taxupindia.com
main source : ICAI
BUILDING CRITERIA EXPRESSIONS
ADVANCED INFORMATION TECHNOLOGY 253
Fig. 3.3.1. Specifying AND compound criteria
3.3.6.2 OR Criteria
The OR compound criteria are used in queries where we need to match either of the criterion specified in query criteria. OR returns result even if any criterion is true.
For example, if we add criteria to the query from the Customer table as:
[State] = “CA” OR [Credit Limit] > 500000, it will return all customers who are either from California or who have credit limit greater than 500000.
The OR criteria in a query designer is specified by writing all the criteria in different rows of the Criteria tab, as shown in Fig. 3.3.2.

Downloaded from : taxupindia.com
main source : ICAI
DATABASE APPLICATIONS USING MS-ACCESS
254 ADVANCED INFORMATION TECHNOLOGY
Fig. 3.3.2: Specifying OR Compound Criteria

Downloaded from : taxupindia.com
main source : ICAI
BUILDING CRITERIA EXPRESSIONS
ADVANCED INFORMATION TECHNOLOGY 255
3.3.6.3 Problem Scenario
This case study focuses on the operators discussed above and how to use them as a Criteria Expression.
At the end of a quarter, Country Head of Apex Ltd. wishes to review the following data:
A report displaying all sales orders placed in from January to March 2008.
All inventory details from the “Car”, “Snowmobile”, and “Boat” categories along with the details of the order placed for them.
A list of all the products that were sold with a quantity greater than 5, or the price greater than 1000.
A contact list for all Customers whose first name starts with A, B, or C.
Solution
For creating the query containing the report of Sales Order, the query will be created on the Sales Order table, using “Between” and ”And” operator in query criteria.
The inventory details query will contain the Inventory table and Sales Item Description. The query criteria will be based on the IN operator.
For obtaining the list of products, query needs to be based on Inventory and Sales Item Description containing compound criteria.
To retrieve the contact list of Customers, query will be based on the Customers table and the criteria for the first name will contain the LIKE operator.
Steps for creating query containing the report of Sales Order
1. Click Create ribbon -> Queries -> Query Design to open the Query Design window.
2. Select the Sales Order table from the Show Table window and click Add, as shown in Fig. 3.3.3.
Fig. 3.3.3. Show Table window

Downloaded from : taxupindia.com
main source : ICAI
DATABASE APPLICATIONS USING MS-ACCESS
256 ADVANCED INFORMATION TECHNOLOGY
Select all the columns from the Sales Order table and drag them to the Columns tab. The Query window appears, as shown in Fig. 3.3.4.
Fig. 3.3.4. Select Required Columns
3. In the Criteria section of the Sales Date column, write the criteria BETWEEN 1/1/2008 AND 3/31/2008. Set the Sort order of column as Ascending, as shown in Fig. 3.3.5.
NOTE: The Query Builder window formats the date with # sign.
Fig. 3.3.5. Specify Query Criteria

Downloaded from : taxupindia.com
main source : ICAI
BUILDING CRITERIA EXPRESSIONS
ADVANCED INFORMATION TECHNOLOGY 257
4. Click the Run sign in Design ribbon -> Results to view results, as shown in Fig. 3.3.6.
Fig. 3.3.6. Query Result
5. Click on the toolbar to save the query. Type the name of query as “Sales Order QTR1”.
Steps for creating inventory details query
1. Click Create ribbon -> Queries -> Query Design to open the Query Design window.
2. Select the Inventory and Sales Item Description table from the Show Table window and click Add, as shown in Fig. 3.3.7.
Fig. 3.3.7: Show Table Window

Downloaded from : taxupindia.com
main source : ICAI
DATABASE APPLICATIONS USING MS-ACCESS
258 ADVANCED INFORMATION TECHNOLOGY
3. Select Item Number, Category, Sub Category, Description, and Model from the Inventory table and drag them to the Columns tab. Similarly drag Sales Order Number, Quantity, Unit, and Price. The Query window appears, as shown in Fig. 3.3.8.
Fig. 3.3.8: Specify Required Fields
4. In the Criteria section of the Category column write the criteria IN (Car, Snowmobile, Boat), as shown in Fig. 3.3.9.
Fig. 3.3.9: Specify Criteria for Column

Downloaded from : taxupindia.com
main source : ICAI
BUILDING CRITERIA EXPRESSIONS
ADVANCED INFORMATION TECHNOLOGY 259
5. Click on the toolbar to save the query. Type the name of query as “Inventory Sales”.
Steps for creating the query to obtain the list of products
1. Click Create ribbon -> Queries -> Query Design to open the Query Design window.
2. Select the Inventory and Sales Item Description table from the Show Table window and click Add.
3. Select Item Number, Category, Sub Category, Description, and Model from the Inventory table and drag them to the Columns tab. Similarly, drag Sales Order Number, Quantity, and Price. The Query window appears, as shown in Fig. 3.3.10.
Fig. 3.3.10. Specify Required Columns
4. In the Criteria section of the Quantity column write the criteria > 5. In the next row, write the criteria for Price as > 1000. The Query design window should appear as shown in Fig. 3.3.11.
NOTE: Since this is an OR compound criteria, both the criteria are written in different rows.

Downloaded from : taxupindia.com
main source : ICAI
DATABASE APPLICATIONS USING MS-ACCESS
260 ADVANCED INFORMATION TECHNOLOGY
Fig. 3.3.11. Specify Compound Criteria
5. Click on the toolbar to save the query. Type the name of query as “Inventory Sales – Qty Price”.
6. Click in Design ribbon -> Results to view the results, as shown in Fig. 3.3.12.
Fig. 3.3.12. Query Results

Downloaded from : taxupindia.com
main source : ICAI
BUILDING CRITERIA EXPRESSIONS
ADVANCED INFORMATION TECHNOLOGY 261
Steps for creating query to retrieve the contact list of Customers
1. Click Create ribbon -> Queries -> Query Design to open the Query Design window.
2. Select the Customers table from the Show Table window and click Add.
3. Select Customer Number, First Name, Last Name, Company, City, State, Country, and Phone from Customers and drag them to the Columns tab. The Query window appears, as shown in Fig. 3.3.13.
Fig. 3.3.13. Specify Require Fields
4. In the Criteria section of the First Name column write the criteria LIKE “[ABC]*”. The wildcard [ABC]* with operator LIKE specifies that it should match any string starting from A, B, or C. Also set the sort order of the First Name field to Ascending. The Query Design window should appear as shown in Fig. 3.3.14.

Downloaded from : taxupindia.com
main source : ICAI
DATABASE APPLICATIONS USING MS-ACCESS
262 ADVANCED INFORMATION TECHNOLOGY
Fig. 3.3.14. Specify Query Criteria
5. Click on the toolbar to save the query. Type the name of query as “Customers Contact List – ABC”.
6. Click in Design ribbon -> Results to view the results, as shown in Fig. 3.3.15.
Fig. 3.3.15. Query Results
Many complex Criteria Expressions for a query can be created using the combination of operators and operands. Combining multiple criteria and different operators can help get the required data.
3.4 Using the Built-In Functions Built-In Functions provide specialized operations to enhance the working of Access. We can perform mathematical, financial, comparative, and other operations using functions.

Downloaded from : taxupindia.com
main source : ICAI
BUILDING CRITERIA EXPRESSIONS
ADVANCED INFORMATION TECHNOLOGY 263
Some useful types of functions available in Access are:
Mathematical
Date/Time
Financial
SQL Aggregate
Text
3.4.1 Using Text Functions
Text functions are used to perform various operations on strings, such as manipulating strings, concatenate the string, extracting a portion of string.
Some useful string functions are listed in Table 3.7.
FUNCTION NAME EXPLAINATION EXAMPLE Left() Returns specified number of
characters from left of the string Left(“Access”,3) will return Acc
Right() Returns specified number of characters from right of the string
Right(“Access”,3) will return ess
Mid() Returns specified number of characters from the given position in string
Mid(“Access”,2,3) will return 3 characters from 2 positions, that is, cce
Len() Returns the length of the given string
Len(“Access”) will return 6
Lcase() Converts the text to lower case Lcase(“ACCESS”) will return access Ucase() Converts the text to capital case Ucase(“access”) will return ACCESS Instr() Returns the position of first
occurrence of a string in another string
Instr(“Operations”,”ra”) will return 4
Trim() Removes leading or trailing spaces in a text
Trim(“ Acc ess “) will return “Acc ess”
Replace() Converts a substring from the given string into specified string
Replace(“Account Transactions”,”Account”,”Daily”) returns Daily Transactions
Strcomp() Compares two strings Returns 0 if strings are same. 1 if first string is greater the second. -1 If first string is less than the second.
Strcomp(“Access”,”Access”) returns 0 Strcomp(“Access”,”Training”) returns -1 as “Training” is greater than “Access”
StrReverse() Returns the string in reverse order StrReverse(“access”) returns “ssecca”
Table 3.7: Text Functions

Downloaded from : taxupindia.com
main source : ICAI
DATABASE APPLICATIONS USING MS-ACCESS
264 ADVANCED INFORMATION TECHNOLOGY
3.4.2 Using Date and Time Functions
These functions are used to handle Date and Time data. This group contains various functions such as extracting a part of date or adding two dates.
Few of the important Date/Time functions, are shown in Table 3.8.
FUNCTION NAME EXPLANATION EXAMPLE
Now() Returns current date and time Now() Returns 07/18/2012 12:20:55
Date() Returns current date Date()_ Returns 07/18/2012
Time() Returns current time Time()_ Returns 12:30:15
DateDiff() Returns difference two dates. The interval for difference can be in terms of Days (“d”), months(“m”), Quarter (“q”), years(“yyyy”), weeks (“ww”)
DateDiff (“m”,#7/18/2011#,#12/3/2011#) Returns 5 as the difference between two dates in terms of months is 5.
DateAdd() Adds a specified interval to the given Date. Intervals in this can be used as same in DateDiff
DateAdd(“q”,1,#1/11/2012#) will return 4/11/2012 As a Quarter added to January returns April.
DatePart() Extracts a portion of a date from the given date
DatePart(“ww”,#2/3/2012#) returns 6
Month() Returns month in integer from the given date
Month(#12/1/2011#) returns 12
MonthName() Returns name of the month, that is, given as an integer
MonthName(12) returns December
Year() Returns year from a given date Year(#2/2/2012#) returns 2012
Table 3.8: Date and Time Functions
3.4.3 Using Math Functions
Math functions are used for performing calculations on Numeric data. These functions provide us the property of performing various mathematical operations.

Downloaded from : taxupindia.com
main source : ICAI
BUILDING CRITERIA EXPRESSIONS
ADVANCED INFORMATION TECHNOLOGY 265
Some important mathematical functions are listed in Table 3.9.
FUNCTION NAME
EXPLANATION EXAMPLE
Abs() Returns the absolute value of a number Abs (14) returns 14 Abs(-14) returns 14
Fix() Returns the nearest integer for a negative number Fix(-125.64) returns -125
Int() Returns an integer for a specific value Int(23.64) returns 23
Round() Returns a number rounded to specified number of digits
Round(18.234,2) returns 18.23 Round(18.246) return 18.25
Rnd() Returns any generated random number Rnd() returns any Random no.
Sgn() Returns an integer representing sign of a number -1 for –ve number 1 for +ve number 0 for Zero
Sgn(-14) returns -1
Sqr() Returns square root of a number Sqr(16) returns 4
Log() Returns logarithm of a number
Table 3.9: Math Function
3.4.4 Using Financial Functions
Financial functions are used to perform many standard financial calculations, such as interest rates, annuity or loan payments, and depreciation.
Some extensively used financial functions are listed in Table 3.10.
FUNCTION NAME
EXPLAINATION EXAMPLE
DDB() Returns the double-declining balance method of depreciation return based on the formula: Depreciation / period = ((cost salvage) * factor) / life
DDB(cost, salvage, life, period[, factor]) If we calculate depreciation for Rs.5, 000 computer with a Rs.200 salvage value and an estimated useful life of three years for the first year. DDB(5000,200,3,1)
FV() Returns the future value of an annuity based on periodic, fixed payment and fixed interest rate
FV(Rate, Payment Periods, Payment [, Present Value] [, Type]) If we calculate Future value for a rate of 8% for 10 installments depositing an amount of Rs. 200 monthly. FV will be calculated as: FV(0.08/12,10,-200)
PV() Returns the present value of an annuity PV (Rate, Payment Periods, Payment [,

Downloaded from : taxupindia.com
main source : ICAI
DATABASE APPLICATIONS USING MS-ACCESS
266 ADVANCED INFORMATION TECHNOLOGY
based on periodic, fixed payments to be paid in future and fixed interest rate
Future Value] [, Type]) To calculate Present value of an annuity that will provide 5,000 a year for the next 20 years at a rate of .0825. We will use: PV(.08,5000,20)
SYD() Returns the sum-of-years depreciation of an asset for a specific period
SYD(Cost Of Asset, Salvage Value, Length Of Useful Life, Period) To calculate the depreciation charges of a building that cost 365820 to build has a salvage value of 5390, and an estimated useful life of 30 years. We will use function SYD as: SYD(365820,5390,15,1)
PMT() Returns the payment for an annuity based on periodic, fixed payment and fixed interest rate
To calculate a payment amount for a 6 percent loan of 360 months for 110000. The formula will be: PMT(.005, 360, -110000)
RATE() Returns the interest rate per period Rate (nper, pmt, pv [, fv ] [, type ] ) To calculate interest rate on a Rs. 5,000 loan where monthly payments of Rs.250 are made for 2 years Rate(2*12,250,5000)
Table 3.10: Financial Functions
3.4.5 Problem Scenario
The Operations Manager of Apex Ltd. received many complaints from customers about the orders not reaching them on time. He wants a report to be submitted for all the orders which were delayed (under normal cycle orders must be shipped within 7 days).
Solution
The required query will use the tables Sales Order, the criteria will be placed on shipped date using the DateDiff () function.
Steps for creating a query
1. Click Create ribbon -> Queries -> Query Design to open the Query Design window.
Select the Sales Order table from the Show Table window and click Add.
2. Select the columns Sales Order Number, Sold to Customer, Sales Date, Ship Date, Shipped Via. The Query window appears, as shown in Fig. 3.4.1.

Downloaded from : taxupindia.com
main source : ICAI
BUILDING CRITERIA EXPRESSIONS
ADVANCED INFORMATION TECHNOLOGY 267
Fig. 3.4.1. Select required column
Specify the criteria for Shipped Date as DateDiff("d",[Sales Date],[Ship Date])>7. The DateDiff() function returns difference between two dates, “d” forces it to return it in terms of days. The query looks like, as shown in Fig. 3.4.2.
Fig. 3.4.2. Specify Query criteria using Functions

Downloaded from : taxupindia.com
main source : ICAI
DATABASE APPLICATIONS USING MS-ACCESS
268 ADVANCED INFORMATION TECHNOLOGY
3. Click on the toolbar to save the query. Type the name of query as Orders Delayed.
4. Click in Design ribbon -> Results to view the results, as shown in Fig. 3.4.3.
Fig. 3.4.3. Query Results
3.5 Working with Expression Builder The Expression Builder tool in Access helps build complex expressions. It contains easy access to access names and properties of columns of the tables. Expression Builder also contains a set of predefined functions in Access and also some prebuilt expression as to display page numbers.
The Expression Builder window is shown in Fig. 3.5.1.
Fig. 3.5.1: Expression Builder Window

Downloaded from : taxupindia.com
main source : ICAI
BUILDING CRITERIA EXPRESSIONS
ADVANCED INFORMATION TECHNOLOGY 269
3.5.1 View of Expression Builder
Expression box - A text box in which expressions are written. Any value from the Operators button or Expression Elements can be pasted into Expression Box.
Operator buttons - Various operators are available in the Operators Buttons tab. We can just click any operator to get it in the Expression Box text box.
Expression elements – Expression element contains three tabs
First one is for the objects in the database like Tables, Queries, Forms, or Reports.
Second is for the sub elements of the objects selected in the First tab like fields of the table, containers in Reports and Forms.
Third is for the properties of the element selected in second tab.
3.5.2 Complete view of all the three tabs in Expression Elements
The first tab contains functions, the second contains different types of functions, and the third contains all the functions in a particular type.
Click the Paste button to get any function in Expression Box, as shown in Fig. 3.5.2.
Fig. 3.5.2. Three tabs in Expression Elements

Downloaded from : taxupindia.com
main source : ICAI
DATABASE APPLICATIONS USING MS-ACCESS
270 ADVANCED INFORMATION TECHNOLOGY
3.5.3 Problem Scenario
Consider the case scenario discussed in section 3.3.4 database Apex Inventory Shipment. The Marketing Manager of Apex Ltd., found that there were few orders which were prepared on time, but could not be sent because of customer details are not available. By mistake, a sales executive while typing has put a wrong customer number. Customer Number general format is XXX-0000, where X represents character and 0 represents any digit. The executive has inserted five digits instead of four. List the names of all such customers.
Solution
For this query, again the Sales Order table needs to be used. The criteria would be formed using the text function Len (), length of Customer Number is normally 8 but would be 9 in this case. Expression Builder can be used to specify the criteria.
Steps for second creating query
1. Click Create ribbon -> Queries -> Query Design to open the Query Design window.
2. Select the Sales Order table from the Show Table window and click Add.
3. Select the Sales Order Number Sold to Customer, Sales Date, Ship Date, Shipped Via columns.
4. Right-click on the Criteria tab of the Sold to Customer column and select Build from the drop-down, as shown in Fig. 3.5.3. The build will open the Expression Builder window.
Fig. 3.5.3. Select build from drop down
5. The Expression Builder window appears, as shown in Fig. 3.5.4.

Downloaded from : taxupindia.com
main source : ICAI
BUILDING CRITERIA EXPRESSIONS
ADVANCED INFORMATION TECHNOLOGY 271
Fig. 3.5.4. Expression Builder window
6. The expression in the criteria should be Len ([Sold to Customer]) > 8. To include the length () function, select Functions -> Built-In functions from first tab, Text on the second tab, and Len on the third tab from Expression Elements in Expression Builder, as displayed in Fig. 3.5.5.
Fig. 3.5.5. Select Len function

Downloaded from : taxupindia.com
main source : ICAI
DATABASE APPLICATIONS USING MS-ACCESS
272 ADVANCED INFORMATION TECHNOLOGY
7. Double Click the Len function to include expression in Expression Box, as shown as in Fig. 3.5.6.
Fig. 3.5.6. Paste the expression
8. Now the string which is a part of the Len () function must be replaced by field name. To do this select Table -> Sales Order from the first tab, Sale to Customer from the second tab in Expression Elements part of Expression Builder.
9. Select the string argument of the Len () function and Double click to Paste the argument in Len() function. The column Name (Sale to Customer) will be pasted in place of string, the Expression Builder looks like as in Fig. 3.5.7.

Downloaded from : taxupindia.com
main source : ICAI
BUILDING CRITERIA EXPRESSIONS
ADVANCED INFORMATION TECHNOLOGY 273
Fig. 3.5.7. Place the required column as function argument
10. Now click on > (Greater Than sign) from the Operators tab so that it gets pasted on Expression Box and write 3 after that so the Expression Builder window looks like as in Fig. 3.5.8.
Fig. 3.5.8. The Complete expression

Downloaded from : taxupindia.com
main source : ICAI
DATABASE APPLICATIONS USING MS-ACCESS
274 ADVANCED INFORMATION TECHNOLOGY
11. Click OK to save the expression. Note the written expression appears in criteria of the Sale to Customer field, as shown in Fig. 3.5.9.
Fig. 3.5.9. Expression appears in Criteria
Click on the toolbar to save the query. Type the name of query as “Sale to customer Criteria”.
12. Click in Design ribbon -> Results to view the results, as shown in Fig. 3.5.10.
Fig. 3.5.10. Query Results
The Expression Builder makes it easier to remember function names and also avoids typing error in the name of the columns. The operators’ option can be used to place all the available operators in criteria expression.
3.6 Summary This chapter focused on creation of criteria expressions in Access 2010. The different components of the expression are – operators, operands, and functions. Operands can be considered as values used for performing operations. Operands can be further distinguished as literals, identifiers, and functions. Further, this chapter introduced different types of operators as – comparison, arithmetic, logical, and miscellaneous.
Functions are built in code to help us work better with expressions. There are different types of functions available in Access to work with different data types. Various functions available are - Text Function, Date and

Downloaded from : taxupindia.com
main source : ICAI
BUILDING CRITERIA EXPRESSIONS
ADVANCED INFORMATION TECHNOLOGY 275
Time Functions, Math Functions, and Financial Functions.
Expressions can be written directly or by using an interactive tool Expression Builder to create expression. Expression Builder has various tabs as Expression Box, Operator Buttons, and Expression Elements.
3.7 Lab Exercises For Apex Inventory Shipment database of Apex Ltd. Provide a solution to the following problem scenarios:
1. A sales executive while inserting records in the Sales Order table by mistake inserted the Sales Date with a previous year. For instance, instead of 1/2/2012, he typed 1/2/2011. Write an Update query to add 1 year to all the dates which were written in previous year.
2. The Finance manager came to know that there had been a problem in receiving payments that were paid through Cheque or Electronic Card. Create a record set displaying all the invoices that were paid through Cheque, Master Card, or Visa Card.
3. For year-end review, the Vice President of the Company needs a report displaying a list of all the customers, and value and count of the orders placed by them.
(To solve the above query create a Group By query on Customer, Sales Order, and Sales Item Description. Calculate the value of orders as Sum of Quantity and Price).
4. Considering the query in question 3, a customer named James having Customer Number as END-0010 wishes to pay his entire amount in monthly installments. Company charges an interest rate of 5% for the part payments. Calculate the amount that James has to pay as a monthly installment. (Use the PMT function).
5. Display a list of all the orders which have not been shipped. (Check for orders with NULL Shipped Date).
6. A sales person was trying to fetch all the customers from India from city – New Delhi, but he found that the city has been typed in many different ways. For instance New Delhi was also written as Delhi, N Delhi, or Old Delhi. Find all the records from table Customers which have country as India and contain ‘Delhi’ in city name.
7. The Marketing Manager defined a standard format of creating Customer Code as XXX-0000 where XXX are first three letters of Customer’s Company and 0000 is a four digit numeric code for customer. This format was not followed by some executives. Find all the customers for whom first three letters of the Customer Number does not match first three letters of their Company Name.
8. It was noticed that in the table Sales Item Description some values for Ship Qty are inserted as negative. Write a query to retrieve data having all the values of Ship Qty converted to positive and also the Price removing the decimal values. (Use math functions for the purpose).
9. Display a list of all the inventory items which are to be reordered. (Check all the Inventory which have Reorder Point greater than Inventory in Stock + Inventory on Order).
10. Considering the above query, retrieve a list of all the inventories which have not been ordered from past one month. (Make use of DateDiff and Date function)
Downloaded from : taxupindia.com
main source : ICAI
DATABASE APPLICATIONS USING MS-ACCESS
276 ADVANCED INFORMATION TECHNOLOGY
Multiple Choice Questions
1. For the Apex Inventory Shipment database, a list of orders placed ten months ago or more from the Sales Order table needs to be created. What would be appropriate query criteria for the Sales Date field?
(a) DateValue(DateAdd(“yyyy”,-3,[Sales Date]) > Today()
(b) >= 3 Months
(c) Between 3 And 5
(d) DateAdd("m",3,[Sales Date])<Date()
2. Which record will be retrieved if the query criteria is < #1/1/11#?
(a) All values less or more than 1,195
(b) Value less than 95 characters
(c) Records with date before 2011
(d) All of above
3. The query criteria on Shipped Date for deleting all the records from the Sales Order table which were shipped before April 2011 or were never shipped would be ____________?
(a) ">=#4/1/2011# OR IS NULL
(b) Month() = April
(c) IS NULL
(d) None of the above
4. For the criteria BETWEEN 1/1/2011 and 12/31/2011, which rows will be displayed as result?
(a) Display records between the dates 1/2/2011 and 1/1/2012
(b) Display records between the dates 1/1/2011 and 12/31/2011
(c) Display records whose dates equaled 1/1/2011 or 12/31/2011
(d) All of the above
5. In the criteria expression Total Amount Paid: [Tax] + [Freight] + [Other], which value is an Identifier.
(a) Total Amount Paid
(b) [Tax]
(c) +
(d) All of the above
6. A report is needed to be prepared, checking all the orders that are pending to be shipped within one week. The criteria expression in Shipped Date can be?

Downloaded from : taxupindia.com
main source : ICAI
BUILDING CRITERIA EXPRESSIONS
ADVANCED INFORMATION TECHNOLOGY 277
(a) > Today()
(b) < DateAdd(“d”,7,”[Shipped Date])
(c) > Date() + 7
(d) = Now()
7. The tab in Expression Builder in which we write expressions is known as _____________.
(a) Expression Elements
(b) Operator Button
(c) Expression Box
(d) Expression Builder window
8. The criterion for the Category column in the Inventory table is IN (“Truck”, “Boat”, “Car”). This is equivalent to:
(a) [Category] Like “Truck”,”Boat”,”Car”
(b) [Category] = “Truck”,”Boat”,”Car”
(c) [Category] = “Truck” AND [Category] = ”Boat” AND [Category] = ”Car”
(d) [Category] = “Truck” OR [Category] = ”Boat” OR [Category] = ”Car”
9. Among +, <>, MOD, AND, <= operator which operator has the highest priority.
(a) +
(b) MOD
(c) AND
(d) <>
10. The criteria expression LIKE?a*.
(a) Will match all text starting from A
(b) Will match all text ending from A
(c) Will match all text having second character as A
(d) Will match all text starting with a digit
11. Which criteria would be used to find the records where the mode of payment is not known from Payments table?
(a) [How Paid] IS NULL
(b) [How Paid] = “”
(c) NOT IN [How Paid]
(d) None of the above

Downloaded from : taxupindia.com
main source : ICAI
DATABASE APPLICATIONS USING MS-ACCESS
278 ADVANCED INFORMATION TECHNOLOGY
12. The criteria [Sales Date] > #1/1/2011# XOR [Payment Terms] = “Cheque” will return records only when …
(a) [Sales Date] is greater than 1-Jan-2011 And [Payment Terms] is “Cheque”
(b) Either [Sales Date] is greater than 1-Jan-2011 Or [Payment Terms] is “Cheque”, but not both
(c) [Sales Date] is greater than 1-Jan-2011 Or [Payment Terms] is “Cheque”
(d) All of the above
13. Consider the query on the Inventory table:
This query will return:
(a) All records from Inventory table
(b) All records from Inventory table having Quantity in Stock greater than 20 AND Quantity on Order > 25.
(c) All records from Inventory table except having Quantity in Stock less than 20 and Quantity on Order > 25.
(d) All records from Inventory table having Quantity in Stock greater than 20 OR Quantity on Order > 25.
14. The Mid(“Apex Limited”,5,4) function will return
(a) Apex
(b) Ted
(c) Limi
(d) Apex Limited
15. The SGN() function is a ____________ type function:

Downloaded from : taxupindia.com
main source : ICAI
BUILDING CRITERIA EXPRESSIONS
ADVANCED INFORMATION TECHNOLOGY 279
(a) Math
(b) Financial
(c) Text
(d) Date & Time
16. The expression to combine first three characters of Customer First Name and last four characters of Sales Order Number placed by customer will be:
(a) [First Name] + [Sales Order Number]
(b) [First Name] & [Sales Order Number]
(c) Left([First Name],3) + Right([Sales Order Number],4)
(d) Left([First Name]) + Right([Sales Order Number])
17. The expression 3\4 will return
(a) 0.75
(b) ¾
(c) 0
(d) None of the above
18. The Instr(4, “XXpXXpXXPXXP" , “P”) function will return
(a) 3
(b) 6
(c) 9
(d) None
19. Which of the following is not a Date Time function?
(a) Today()
(b) Date()
(c) Now()
(d) MonthName()
20. A query with compound criteria, where both the criteria are written on the same row of two different fields. This will be creating_____________ compound criteria?
(a) OR compound criteria
(b) AND compound criteria
(c) XOR compound criteria
(d) EQV compound criteria

Downloaded from : taxupindia.com
main source : ICAI
MACROS AND SWITCHBOARDS
Adding Unbound Controls
4.1 Introduction A macro allows you to automate tasks and add functionality to your forms, reports, and controls. Access macros let you perform defined actions and add functionality to your forms and reports. Macros in Access can be thought of a graphical and a simpler way to do programming. Every macro has a list of actions and arguments defined for each action. Macros can be used independently or attached to a form, report, or control events. Arguments provided in a macro can restrict, validate, or automate data entry. Microsoft Access 2010 has added new features to macros to eliminate the need to writing VBA code.
Switchboards are forms available in Access 2010 to present data in the form so that users can focus on using the database as intended. A switchboard form presents the user with a limited number of choices for working with the application and makes the application easier to use. For example, a switchboard may give choice to open the tables, forms, and open or print reports.
4.2 Simplifying Task with Macros In Access, macros can be considered as a simplified version of VBA programming. Macros are used to execute any task that can be initiated with the keyboard or the mouse. Macros are written by specifying a list of to perform and providing arguments for these actions. Access 2010 provides enables macros so that they can automate responses to many types of events (events can be change in the data, the opening or closing of a form or a report, or even a change of focus from one control to another) without forcing actually using a programming language.
CHAPTER
4 LEARNING OBJECTIVES Simplifying Task with Macros
Creating a Macro Attaching a Macro Restricting Records Using a Condition Validating Data Using a Macro Automating Data Entry Using a Macro
Managing Switchboards Creating a Database Switchboard Modifying a Database Switchboard Setting the Startup Options

Downloaded from : taxupindia.com
main source : ICAI
MACROS AND SWITCHBOARDS
ADVANCED INFORMATION TECHNOLOGY 281
4.2.1 Creating a Macro
In Access, macros can be created using the Macro Design window. This window can be opened by clicking Create Other Macro, as shown in Fig. 4.2.1
Fig. 4.2.1 Create New Macro
The Macro Design window is displayed in Fig. 4.2.2.
Fig. 4.2.2. Macro Designer Window
In the new Macro Designer for Access 2010, the layout more closely resembles a text editor. Actions and conditional statements displayed in a familiar top-down format that is used by programmers. Arguments are displayed inline in a dialog box as shown in Figure.4.2.3

Downloaded from : taxupindia.com
main source : ICAI
DATABASE APPLICATIONS USING MS-ACCESS
282 ADVANCED INFORMATION TECHNOLOGY
Fig. 4.2.3: Macro Designer Window
Adding a new action or conditional statement is simple. Either select it from the actions drop-down list, from a right-click menu, or select it from the Action Catalog pane as shown in Fig. 4.2.4 to the right side of the Macro Designer.
Fig. 4.2.4: Action Catalog
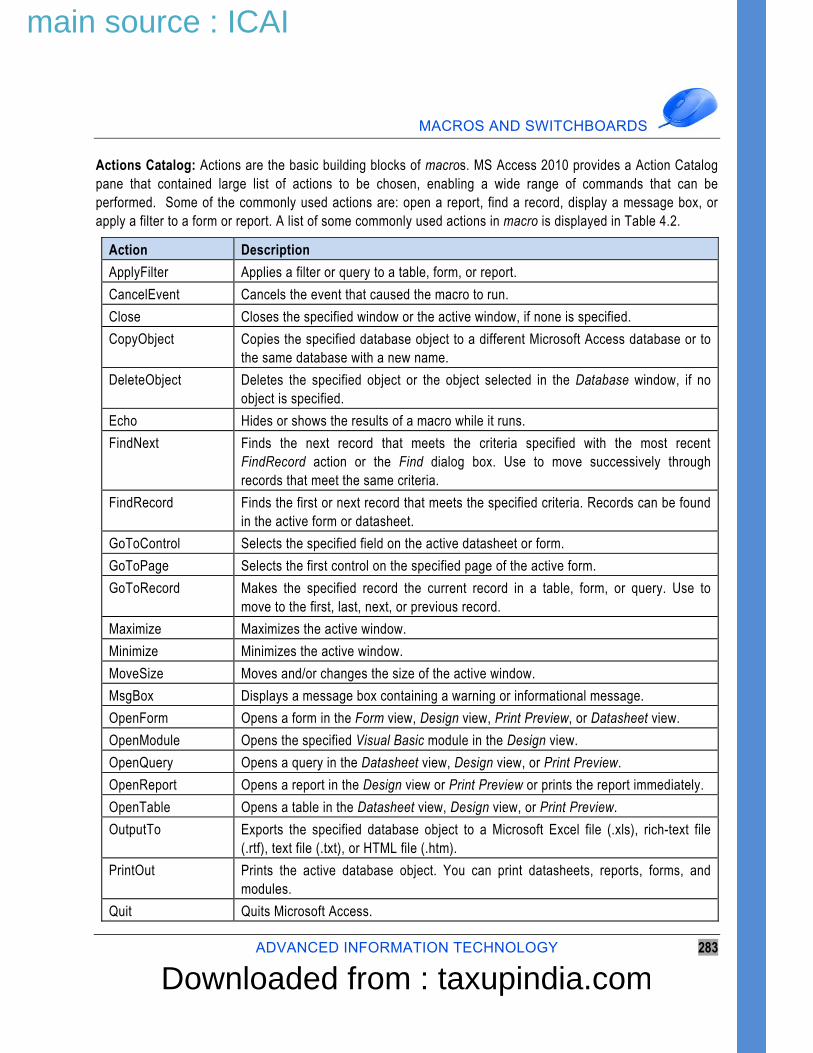
Downloaded from : taxupindia.com
main source : ICAI
MACROS AND SWITCHBOARDS
ADVANCED INFORMATION TECHNOLOGY 283
Actions Catalog: Actions are the basic building blocks of macros. MS Access 2010 provides a Action Catalog pane that contained large list of actions to be chosen, enabling a wide range of commands that can be performed. Some of the commonly used actions are: open a report, find a record, display a message box, or apply a filter to a form or report. A list of some commonly used actions in macro is displayed in Table 4.2.
Action Description
ApplyFilter Applies a filter or query to a table, form, or report.
CancelEvent Cancels the event that caused the macro to run.
Close Closes the specified window or the active window, if none is specified.
CopyObject Copies the specified database object to a different Microsoft Access database or to the same database with a new name.
DeleteObject Deletes the specified object or the object selected in the Database window, if no object is specified.
Echo Hides or shows the results of a macro while it runs.
FindNext Finds the next record that meets the criteria specified with the most recent FindRecord action or the Find dialog box. Use to move successively through records that meet the same criteria.
FindRecord Finds the first or next record that meets the specified criteria. Records can be found in the active form or datasheet.
GoToControl Selects the specified field on the active datasheet or form.
GoToPage Selects the first control on the specified page of the active form.
GoToRecord Makes the specified record the current record in a table, form, or query. Use to move to the first, last, next, or previous record.
Maximize Maximizes the active window.
Minimize Minimizes the active window.
MoveSize Moves and/or changes the size of the active window.
MsgBox Displays a message box containing a warning or informational message.
OpenForm Opens a form in the Form view, Design view, Print Preview, or Datasheet view.
OpenModule Opens the specified Visual Basic module in the Design view.
OpenQuery Opens a query in the Datasheet view, Design view, or Print Preview.
OpenReport Opens a report in the Design view or Print Preview or prints the report immediately.
OpenTable Opens a table in the Datasheet view, Design view, or Print Preview.
OutputTo Exports the specified database object to a Microsoft Excel file (.xls), rich-text file (.rtf), text file (.txt), or HTML file (.htm).
PrintOut Prints the active database object. You can print datasheets, reports, forms, and modules.
Quit Quits Microsoft Access.

Downloaded from : taxupindia.com
main source : ICAI
DATABASE APPLICATIONS USING MS-ACCESS
284 ADVANCED INFORMATION TECHNOLOGY
Rename Renames the specified object.
Requery Forces a re-query of a specific control on the active database object.
Restore Restores a maximized or minimized window to its previous size.
RunApp Starts another program, such as Microsoft Excel or Word.
RunCode Runs a Visual Basic Function procedure.
RunCommand Runs a command from Microsoft Access's menus. For example, File Save.
RunMacro Runs a macro.
RunSQL Runs the specified SQL statement for an action query.
Save Saves the specified object or the active object, if none is specified.
SelectObject Selects a specified database object. You can then run an action that applies to that object.
SendObject Sends the specified database objects as an attachment in an e-mail.
SetValue Sets the value for a control, field, or property on a form or report.
SetWarnings Turns all system messages on or off. This has the same effect as clicking OK or Yes in each message box.
StopAllMacros Stops all currently running macros.
StopMacro Stops the currently running macro. Use to stop a macro when a certain condition is met.
TransferDatabase Imports or exports data to or from the current database from or to another database.
TransferSpreadsheet Imports data from a spreadsheet file into the current database or exports data from the current database into a spreadsheet file.
TransferText Imports data from a text file into the current database or exports data from the current database into a text file.
Table 4.1: Macro Actions
4.2.1.1 Problem Scenario
Kanika Mathur, a sales executive in Apex Ltd. is required to send a detailed report of all the orders that have been placed today to the Sales Head every evening in a form of an Excel sheet, also the same sheet also has to be uploaded in a shared folder for delivery to check. She thought to automate the process of transferring records so as to save the efforts required.
Solution
As a solution to the above problem, create a macro that transfers the table Orders into Excel and stores it in a shared folder using the TransferSpreadSheet Action. Then, use Send Object Action to mail it to the Sales Head.
Steps for creating the macro
1. Open Macro Designer. Click Create Macro & Code Macro.

Downloaded from : taxupindia.com
main source : ICAI
MACROS AND SWITCHBOARDS
ADVANCED INFORMATION TECHNOLOGY 285
2. Click AddNew Action drop-down box Select ExportWithFormatting.Note that the ExportWithFormatting option will also be available in Action Catalog. The Macro Designer window appears, as shown in Fig. 4.2.5.
Fig. 4.2.5 : Select Export with Formatting Action
3. When we select an action that needs more than one argument, it would appear, followed by a box for each argument as shown in Fig. 4.2.6.
Fig. 4.2.6 : Box for each argument and type necessary values
Object Type : Table
Object Name : Orders
Output Format : Excel Workbook (*.xlsx)

Downloaded from : taxupindia.com
main source : ICAI
DATABASE APPLICATIONS USING MS-ACCESS
286 ADVANCED INFORMATION TECHNOLOGY
Output File : C:\Desktop\Order.xlsx
NOTE: Output File Name should include the complete absolute path of the shared folder. Macro Designer appears, as shown in Fig. 4.2.6.
4. Select the next action in the Query Designer window as EmailDatabaseObject and specify Action Arguments, as shown below in Fig. 4.2.5:
5. Fig. 4.4: Action SendObject
Object Type : Table
Object Name : Orders
Output Format : Excel Workbook (*.xlsx)
To : [email protected] <email of Sales Head>
Cc :
Bcc :
Subject : <Subject line for the mail>
Message Text : <Message to be sent along with attachment>
Edit Message : No (Select Yes to edit message before sending>
Template File : <template file for output to be generated>
NOTE: The EmailDatabaseObject action can only be used if the Outlook is configured and is open. The To, Cc, Bcc, Subject, Message Text options can be set according to the requirement.
6. Click Quick Access . The window prompts for the name of the macro, write the name of macros as MailCurrentOrders and click OK. Close the Macro Design window.
7. Double-click the Macro Name under the Macro option in the All Access Objects tab to execute it.
Fig. 4.2.7: EmailDatabaseObject Macro
All Macros are saved automatically in default name.

Downloaded from : taxupindia.com
main source : ICAI
MACROS AND SWITCHBOARDS
ADVANCED INFORMATION TECHNOLOGY 287
Macro Builder can use many actions in a single macro or create multiple macros in one macro designer by using macro names. Macro can also be assigned shortcut keys using the AutoKeys macro.
4.2.2 Attaching a Macro
A macro can be attached to an event of a control, a form, or a report. Macros are used to provide an added functionality to Access Objects. Macros can automate responses to many types of events without using a programming language. Events are the property of a form or a control. Macros are always attached to one event or another to perform some action. To view the events for a control, open its Property window and move to the Events tab as shown in Fig. 4.2.8. For example, if a button on a form is required to print a report, a macro which opens a report in print preview from can be attached to click event of the button. Access permits to create macros embedded to the control or attach an existing macro to events.
Fig. 4.2.8: Events in Form Properties

Downloaded from : taxupindia.com
main source : ICAI
DATABASE APPLICATIONS USING MS-ACCESS
288 ADVANCED INFORMATION TECHNOLOGY
4.2.2.1 Problem Scenario
Consider the problem scenario discussed in section 4.2.1. Now the same functionality is required to be added to the Orders form. This means that the Orders form should have a button that enables the user to export and mail the table.
Solution
Consider the form frmOrders which is based on Orders table, as shown in Fig. 4.2.9.
Fig. 4.2.9: Orders Form

Downloaded from : taxupindia.com
main source : ICAI
MACROS AND SWITCHBOARDS
ADVANCED INFORMATION TECHNOLOGY 289
Now, add a button on the form and attach a macro to the click event of the button. Macro is the same as created in section 4.2.9 and exports and mails the list.
1. Open the Orders form in the Design view. To do this, right-click the form and select Design View from the list.
2. To add a button to the form, select Design -> Controls button to be added and draw it on the form, as shown in Fig. 4.2.10. Cancel the Command Button wizard that appears.
Fig. 4.2.10: Draw the button on the form
NOTE: The Command Button wizard may not appear if Use Control -> Controls in Design is not selected.
Fig. 4.2.11: Use Control Wizards option

Downloaded from : taxupindia.com
main source : ICAI
DATABASE APPLICATIONS USING MS-ACCESS
290 ADVANCED INFORMATION TECHNOLOGY
3. Open the control properties by selecting the Command button and press F4. Alternatively, select Property Sheet from Design -> Tools, as shown in Fig. 4.2.12.
Fig. 4.2.12: Select Property Sheet
4. The Property window appears as shown in Fig. 4.2.13.
Fig. 4.2.13: Property Sheet for Button
5. In the Format tab of Property Sheet, set the value of the Caption property to Export And Mail as shown in Fig. 4.2.14.

Downloaded from : taxupindia.com
main source : ICAI
MACROS AND SWITCHBOARDS
ADVANCED INFORMATION TECHNOLOGY 291
Fig. 4.2.14: Set Caption Property
6. In the Event tab of the Property Sheet, set the value of the On Click event. To do this, click to open the list and select MailCurrentOrders, as shown in Fig. 4.2.15.
Fig. 4.2.15: Set the On Click event Property
NOTE: A macro embedded to the control can also be created, by clicking on button and selecting Macro Builder from the Choose Builder window that appears, as shown in Fig. 4.2.16.
Command24

Downloaded from : taxupindia.com
main source : ICAI
DATABASE APPLICATIONS USING MS-ACCESS
292 ADVANCED INFORMATION TECHNOLOGY
Fig. 4.2.16: Create an embedded Macro
7. The form appears as shown in Fig. 4.2.17; the macro will be executed on clicking the Export And Mail button.
Fig. 4.2.17: Click Button to execute the Macro
Command24

Downloaded from : taxupindia.com
main source : ICAI
MACROS AND SWITCHBOARDS
ADVANCED INFORMATION TECHNOLOGY 293
Multiple macros can be created in a single Macro Designer window by giving each macro a different name and can be attached to an event of form or control by specifying their name.
4.2.3 Restricting Records using a Condition A macro condition is an expression that enables a macro to perform certain tasks only if a specific situation exists. When a condition is used in a macro, the macro performs a defined set of tasks depending on whether the expression returns the True or False value. When the expression returns True, all the actions are performed. When the expression returns False, none of the actions are performed. Conditions can be entered in the Conditions column of the Macro Builder window. A single condition can control more than one action.
4.2.3.1 The Where Condition
The Where condition filters and selects records in reports or forms and their underlying tables or queries. This condition is applicable as an argument for the macro actions OpenForm and OpenReport. The Where condition is an Action Argument for macro actions such as OpenForm or OpenReport. For example, the Where condition specified for an OpenForm action can be used to compare and display matching records from two related forms.
4.2.3.2 Problem Scenario
In the Database Apex Inventory Shipment, as an enhancement to the Orders form created in Section 4.2.2, the Manager wishes to see the details of the Customer who has placed the order.
Solution
As a solution to the above requirement, a command button will be added to the form. On the click event of the command, a macro will be created that displays the Customers form restricted to the Customer Number for the order.
For the purpose of displaying the customer information the frmCustomers form is created based on the Customers table, as shown in Fig. 4.2.18.
Fig. 4.2.18: Form frmCustomers

Downloaded from : taxupindia.com
main source : ICAI
DATABASE APPLICATIONS USING MS-ACCESS
294 ADVANCED INFORMATION TECHNOLOGY
Steps for adding a button to frmOrders
1. Open the frmOrders form in Design view. To do this, right-click the frmOrders form under the All Access Objects tab and select Design View from the list. The form opens in Design View, as shown in Fig. 4.2.19.
Fig. 4.2.19: Open form frmOrders in Design View
2. To add a button to the form, select the button from Design -> Controls and draw it on the form, as shown in Fig. 4.2.20. Cancel the Command Button wizard that appears.

Downloaded from : taxupindia.com
main source : ICAI
MACROS AND SWITCHBOARDS
ADVANCED INFORMATION TECHNOLOGY 295
Fig. 4.2.20: Draw Command Button on Form
3. Open the control properties by selecting the Command button and pressing F4. Set the value of Caption property as View Customer Details, as shown in Fig. 4.2.21.

Downloaded from : taxupindia.com
main source : ICAI
DATABASE APPLICATIONS USING MS-ACCESS
296 ADVANCED INFORMATION TECHNOLOGY
Fig. 4.2.21: Set Caption Property
Steps for embedding a macro to On Click event of the command button
4. In the Event tab of Property Sheet, set the value of the On Click event. To do this, click next to the On Click property. The Choose Builder window appears, as shown in Fig. 4.2.22.

Downloaded from : taxupindia.com
main source : ICAI
MACROS AND SWITCHBOARDS
ADVANCED INFORMATION TECHNOLOGY 297
Fig. 4.2.22: Open the Choose Builder window
5. In the Choose Builder window, select Macro Builder from the list and click OK. The Macro Designer window appears, as shown in Fig. 4.2.23(A).

Downloaded from : taxupindia.com
main source : ICAI
DATABASE APPLICATIONS USING MS-ACCESS
298 ADVANCED INFORMATION TECHNOLOGY
Fig. 4.2.23(A): Macro Designer window
6. In the Add New Actions Dropdown list, select the OpenForm Action from the list. Set the value of Action arguments as shown in Fig 4.2.23(B):

Downloaded from : taxupindia.com
main source : ICAI
MACROS AND SWITCHBOARDS
ADVANCED INFORMATION TECHNOLOGY 299
Fig 4.2.23(B): Fill the arguments of OpenForm Action
Form Name : Customers
View : Form
Filter Name :
Where Condition : [Customer Number]=[Forms]![Orders]![Sold to Customer]
Data Mode : Yes
Window Mode :
7. Click Design -> Close -> Close, as shown in Fig. 4.2.24(A).
Fig. 4.2.24(A): Close the macro
8. A message box appears prompts to save the macro created, as shown in Fig. 4.2.25(B). Click Yes to save the macro.
Fig. 4.2.25(B): Confirm to save the macro

Downloaded from : taxupindia.com
main source : ICAI
DATABASE APPLICATIONS USING MS-ACCESS
300 ADVANCED INFORMATION TECHNOLOGY
9. The created macro gets embedded in the Property window and is shown in the On Click property. The Property Sheet appears, as shown in Fig. 4.2.26.
Fig. 4.2.26: Property Sheet
10. To check the macro, open the frmOrders form in Form View and click the View Customer Details button. This should display the frmCustomers form only with the record of current customer, as indicated in Fig. 4.2.27.
Fig. 4.2.27: Customer Records restricted by Orders form.

Downloaded from : taxupindia.com
main source : ICAI
MACROS AND SWITCHBOARDS
ADVANCED INFORMATION TECHNOLOGY 301
4.2.4. Validating Data using a Macro
Microsoft Access provides a variety of ways to control how data is entered in a database. For example, the data that a user can enter into a field can be limited to a range of values or to the format in which it must be entered. The validations can be defined at the table level by specifying table properties or the validation can be done at the form level. To validate data entry in a form, the properties of the controls may be used or alternatively all these validations can be defined using macros. Macros provide a good flexibility to place complex validation.
Macros are useful for validating records when:
Validation rule is to be applied on multiple fields in the form or to same field in different forms.
To display customized error messages for different types of errors in the field.
Instead of Validation Rule, it must be just a warning message.
The validation involves references to controls on other forms or contains a function.
Table 4.2 lists some control events on which macro can be attached for Data Validation.
Event Property When the Macro Will Execute
Before Update Before the entered data is updated.
After Update After the entered data is updated.
Before Insert After you type in a new record.
On Delete In response to a deletion request, but before the record is deleted.
Table 4.2: Event Property
Table 4.3 lists some macro actions that can be used as a response to validation.
Action Use Action To
Cancel Event Prevents a user from posting a new record unless certain conditions are met.
GoToControl Specifies where on the form the insertion point is to be placed.
MsgBox Displays a custom message box.
Table 4.3: Macro Actions for Data Validation
4.2.4.1 Problem Scenario
Consider the frmOrders form created in Section 4.2.2. Rahul Sharma, the database developer in Apex Ltd. is asked to place a check on the Item Number field. It is to be ensured that Item Number should not be left blank.

Downloaded from : taxupindia.com
main source : ICAI
DATABASE APPLICATIONS USING MS-ACCESS
302 ADVANCED INFORMATION TECHNOLOGY
Solution
To solve the above problem, a macro will be embedded on the Click event property of the Save Command Button. This macro will check if the Item Number is blank and will display a message accordingly.
Steps for Validating Item Number
1. Open the frmOrders form in Design View. To do this right-click the frmOrders form under the All Access Objects tab and select Design View from the list.
2. Add a button to the form by selecting the button from Design -> Controls and draw it on the form. Cancel the Command Button wizard that appears.
3. Open the control properties by selecting the Command button and pressing F4. Set the value of the Caption property as Save, as shown in Fig. 4.2.28.
Fig. 4.2.28: Set the caption property as Save.
4. In the Event tab of Property Sheet, set the value of the On Click event. To do this, click to the right side of the On Click property and open the Choose Builder window.
5. Select Macro Builder from the list in the Choose Builder window, as shown in Fig. 4.2.29. Click the OK button.

Downloaded from : taxupindia.com
main source : ICAI
MACROS AND SWITCHBOARDS
ADVANCED INFORMATION TECHNOLOGY 303
Fig. 4.2.29: Open Macro Builder
6. In the Macro Designer window that appears, add the conditions from selecting If from Add New Action Menu as displayed in Fig. 4.2.30.
Fig. 4.2.30: Add Condition
7. In the Condition Argument textbox of the Macro Designer type the text [Item Number] IS NULL, this condition checks whether the Item Number value is blank.
8. In the Add New Action Dropdown, select the CancelEvent action from the list. The Query Designer window appears, as shown in Fig. 4.2.31.

Downloaded from : taxupindia.com
main source : ICAI
DATABASE APPLICATIONS USING MS-ACCESS
304 ADVANCED INFORMATION TECHNOLOGY
Fig. 4.2.32: Specify Condition & Action
9. In the next row, type … in the Condition tab. In the Action tab, select MsgBox from the list and specify Action Arguments as:
Message : Item Number cannot be left Blank
Beep : Yes
Type : Warning?
Title : Validate
10. In the next row, type … in the Condition tab. In the Action tab, select GoToControl from the list and specify Action Arguments:
Control Name : Item Number
The Macro Designer window appears, as shown in Fig. 4.2.33.
Fig. 4.2.33: Specify GoToControl Action
11. Click Design -> Close -> Close, as shown in Fig. 4.2.34.

Downloaded from : taxupindia.com
main source : ICAI
MACROS AND SWITCHBOARDS
ADVANCED INFORMATION TECHNOLOGY 305
Fig. 4.2.35: Click Close to save and close the macro
12. A message box appears prompting to save the macro created, as displayed in Fig. 4.2.36. Click Yes to save the macro.
Fig. 4.2.36: Confirm to Save the macro
Note that the created macro gets embedded in the Property window and is shown in the On Click property. Property Sheet appears, as shown in Fig. 4.2.37.
Fig. 4.2.37: Property Sheet

Downloaded from : taxupindia.com
main source : ICAI
DATABASE APPLICATIONS USING MS-ACCESS
306 ADVANCED INFORMATION TECHNOLOGY
13. To check the macro, open the frmOrders form in Form View and enter a new record with the values, as shown in Fig. 4.2.38.
Fig. 4.2.38: Enter a New Record
14. Click the Save button to save the record. Since the Item Number field is left blank the macro gets executed and the message is displayed, as shown in Fig. 4.2.39.
Fig. 4.2.39: Macro Executes

Downloaded from : taxupindia.com
main source : ICAI
MACROS AND SWITCHBOARDS
ADVANCED INFORMATION TECHNOLOGY 307
Note that the multiple conditions and their post actions can be specified in the same macro; specifying the validation rule for other fields also.
4.2.5. Automating Data Entry Using a Macro
Macros can be used to avoid errors and save time during data entry by automating the data entry process. Instead of having users type in the same data over and over for each record with the possibility of invalid data being entered, a macro can automate data entry. Microsoft Access Macros can be used to speed up the process of data entry. While automating the entry of data, it can be ensured that the possibility of errors in database data is minimized, which can have an impact on the accuracy of the data available for reports and queries.
Macros can also be used for data entry where the value to be entered is dependent on value of other fields. For Example, a macro can be created to enter the total cost of an order if the unit price and quantity to be ordered of an item is provided.
Table 4.4 lists the common events that can be used for Automating Data Entry.
Event Property When the Macro Will Be Executed
On Enter Upon arriving on a control, but before the control has focus.
Before Update Before the control data is updated.
After Update After the changed control data is updated.
On Exit Upon leaving a control, but before the focus is removed.
Table 4.4: Event for Automating Data Entry
Table 4.5 specifies macro action used for Automating Data Entry.
Action Description
SetLocalVar Enters a value automatically in a field. The field name and the value that needs to be entered in the field are mentioned as arguments. You need to enter the arguments in the Action Arguments pane for this action.
GoToControl Specifies the field where the insertion point needs to be moved after a value.
Table 4.5: Macro Actions for Automating Data Entry
4.2.5.1 Problem Scenario
In the frmOrders form discussed in section 4.2.2, the Operational Manager wishes to see the total cost of the order, which would be computed as Quantity ordered * price of an Item.

Downloaded from : taxupindia.com
main source : ICAI
DATABASE APPLICATIONS USING MS-ACCESS
308 ADVANCED INFORMATION TECHNOLOGY
Solution
A text box as Total Order Cost is added to the form, and a macro is created on the Exit event of price to compute the total cost of an order. This macro first checks the value of Quantity is not null and then computes Total Cost.
Steps for creating a macro to automate data entry
1. Open the frmOrders form in the Design view. Add a TextBox to a form, select the TextBox control from Design -> Controls and draw it on the form, as shown in Fig. 4.2.40.
Note that the TextBox also creates a label on the form so as the label to the Text value can be specified.
Fig. 4.2.40: Draw the TextBox on form

Downloaded from : taxupindia.com
main source : ICAI
MACROS AND SWITCHBOARDS
ADVANCED INFORMATION TECHNOLOGY 309
2. Double-click the label and write the text Total Cost. Change the format of the label to match it with other controls. In this case, set the format as “Times New Roman, size 12, Bold”. The Form Design window appears, as shown in Fig. 4.2.41.
Fig. 4.2.41: Specify the text as Total Cost
3. Open the control properties by selecting TextBox and pressing F4. In the All tab of Property Sheet, set the value of the Name property as “Total Cost”, as shown in Fig. 4.2.42.

Downloaded from : taxupindia.com
main source : ICAI
DATABASE APPLICATIONS USING MS-ACCESS
310 ADVANCED INFORMATION TECHNOLOGY
Fig. 4.2.42: Set the Name property
4. In the Event tab of Property Sheet, set the value of the On Click event. To do this, click to the right side of the On Click property and open the Choose Builder window.
5. Select Macro Builder from the list in the Choose Builder window, as shown in Fig. 4.2.43. Click the OK button.
Fig. 4.2.43: Open Macro Builder
6. In the Macro Designer window, add the Conditions tab by selecting Condition from Design -> Show/Hide.

Downloaded from : taxupindia.com
main source : ICAI
MACROS AND SWITCHBOARDS
ADVANCED INFORMATION TECHNOLOGY 311
7. In the Condition tab of the Macro Designer type the text [Quantity] Is Not Null, this condition checks if the Quantity value is blank.
8. In the Action drop down, select the SetLocalVar action from the list. Set the value of Action arguments as:
Name : Name of the local Vatriable
Expression : [Quantity] * [Price]
The Query Designer window appears, as shown in Fig. 4.2.44.
Fig. 4.2.44: The Macro Designer window
9. Click Design -> Close -> Close to save and close the macro. A message box appears prompting to save the macro created, as displayed in Fig. 4.2.36. Click Yes to save the macro.
Fig. 4.2.45: Click Yes to save the macro
10. The created macro gets embedded in the On Exit event property of the Price TextBox control. Property Sheet appears, as shown in Fig. 4.2.46.

Downloaded from : taxupindia.com
main source : ICAI
DATABASE APPLICATIONS USING MS-ACCESS
312 ADVANCED INFORMATION TECHNOLOGY
Fig. 4.2.46: Property Sheet
11. Open the frmOrders form in Form View and enter a new record with the values, as shown in Fig. 4.2.47.
Fig. 4.2.47 : Insert a new record in frmOrders

Downloaded from : taxupindia.com
main source : ICAI
MACROS AND SWITCHBOARDS
ADVANCED INFORMATION TECHNOLOGY 313
12. As you enter the value for price and move to the next textbox, the On Exit event of the Price control gets executed and the total cost is calculated, as shown as Fig. 4.2.48.
Fig. 4.2.48: Automated Data Entry for Total Cost
4.3 Managing Switchboards A switchboard is a Microsoft Office Access 2010 form that facilitates navigation in Access and access to different parts of an application. It functions as an interface between the user and the application. A switchboard is similar to the Ribbon of the Access application. It provides users with direct access to the specific functions of the application and acts as an interface between the user and the application.
Switchboard contains command buttons that execute specified actions. These buttons can be programmed to open forms, reports, queries. Each button on the switchboard triggers some action within the database or leads to another switchboard form. Switchboard forms are an invaluable way to keep users focused on using the database as intended.
A switchboard form presents the user with a limited number of choices for working with the application and makes the application easier and user specific to use. The user’s login information can determine which of a

Downloaded from : taxupindia.com
main source : ICAI
DATABASE APPLICATIONS USING MS-ACCESS
314 ADVANCED INFORMATION TECHNOLOGY
number of switchboard forms to use. For instance, a manager with a higher level of privileges may be given a form with more options than a clerical worker would be given.
4.3.1. Creating a Database Switchboard
The Switchboard Manager is a dialog box that allows creating a switchboard for an Access database. It lists the switchboards currently available in a database and provides an option to create new ones. In each switchboard, command buttons can be added, deleted, or edited. The command buttons can be configured for accessing forms, reports, macros, or functions in the database. Switchboard Manager only allows a maximum of eight command buttons on a switchboard. The operations that the command button on switchboard can perform are listed in Table 4.6.
Command Action performed
Go to Switchboard Opens a secondary switchboard.
Open Form in Add Mode Opens a form in a mode that only allows new records to be added.
Open form in Edit Mode Opens a form in a mode that allows any record to be added or edited.
Open Report Opens a report in Print Preview.
Design Application Opens the Switchboard Manager.
Exit Application Closes the current database.
Run Macro Runs a macro.
Run Code Runs a Visual Basic function.
Table 4.6: Different Commands that Switchboard can perform
When a switchboard is created with Switchboard Manager, Access creates the Switchboard Items table that describes what the display text and action performed by the buttons on the Switchboard form.
4.3.1.1 Problem Scenario
Employees of Apex Ltd. need to keep updating the company database frequently for various reasons. However, employees are confused over the interface that appears when the application is started. The application developer wishes to resolve this confusion by providing a clear and concise environment in which users can reduce the amount of time spent figuring out how to obtain the information they are looking for.
Solution
To resolve the problem of navigation in the database, a Switchboard form that contains buttons to open the Customers and Inventory tables and the frmOrders form needs to be created.
Since switchboard is not capable of opening the tables directly through the Command button, so we have created macros to open the Customers and Inventory tables named as MacroCust and MacroInvent respectively. The structure of macros is displayed in Fig. 4.3.1.

Downloaded from : taxupindia.com
main source : ICAI
MACROS AND SWITCHBOARDS
ADVANCED INFORMATION TECHNOLOGY 315
Fig. 4.3.1: Macro to open Customers and Inventory table
NOTE: Notice that both the MacroCust and MacroInvent macros are created in the same Macro Designer window using the Macro Name property.
Steps for Adding Switchboard in Access 2010
The Switchboard Manager is still available in Access 2010, but it's not included in the Database Utilities Ribbon as in Access 2007 and 2003. You have to launch it as doing the following steps as shown in Fig.4.3.2:
Step 1: First click the File tab and Options button, then we will get into Access Options window;
Step 2: Click the Quick Access Toolbar at left bar;
Step 3: In the Choose commands from drop down box, select the Commands Not in the Ribbon item;
Step 4: Select the Switchboard Manager item in the command list box;
Step 4: Click the Add button;
Step 6: At last click the Ok button at the bottom.

Downloaded from : taxupindia.com
main source : ICAI
DATABASE APPLICATIONS USING MS-ACCESS
316 ADVANCED INFORMATION TECHNOLOGY
Fig. 4.3.2: Open Switchboard Manager in MS Access 2010
Steps for creating Switchboard in Access 2010:
On the New tab, in the Ribbon, click Switchboard Manager, as shown in Fig. 4.3.3.
Fig. 4.3.3: Switchboard Manager
NOTE: If the database does not contain any switchboard, a message box as indicated in Fig. 4.3.4 appears confirming to create a new Switchboard.

Downloaded from : taxupindia.com
main source : ICAI
MACROS AND SWITCHBOARDS
ADVANCED INFORMATION TECHNOLOGY 317
Fig. 4.3.4: Confirming New Switchboard
1. The Switchboard Manager Dialog box appears. Click New to create a Switchboard. Switchboard Manager is displayed as in Fig. 4.3.5.
Fig. 4.3.5: Switchboard Manager Dialog box
NOTE: Instead of creating a new Switchboard, the default created switchboard can also be used.
2. In the Create New dialog box, in the Switchboard Page Name text box, enter User Switchboard and then click OK to create a sub-switchboard with that name, as shown in Fig. 4.3.6.

Downloaded from : taxupindia.com
main source : ICAI
DATABASE APPLICATIONS USING MS-ACCESS
318 ADVANCED INFORMATION TECHNOLOGY
Fig. 4.3.6: Create New Dialog Box
3. In the Switchboard Manager dialog box, in the Switchboard Pages section, verify that User Switchboard is selected and click Edit, as displayed in Fig. 4.3.7.
Fig. 4.3.7: Edit the switchboard to add buttons
4. In the Edit Switchboard Page dialog box, click New to add buttons to Switchboard. The Edit Switchboard Item dialog box appears, as shown in Fig. 4.3.8.

Downloaded from : taxupindia.com
main source : ICAI
MACROS AND SWITCHBOARDS
ADVANCED INFORMATION TECHNOLOGY 319
Fig. 4.3.8: Create a New Button
5. In the Edit Switchboard Item dialog box, in the Text field, type Customers as name of the button.
6. From the Command list, select Run Macro.
7. From the Form list, select MacroOpenTable.MacroCust and click OK. The Edit Switchboard window appears, as shown in Fig. 4.3.9.
Fig. 4.3.9: Provide details of the button
8. Click OK to close the Edit Switchboard window, the created button appears in Items on the Switchboard tab, as shown in Fig. 4.3.10.

Downloaded from : taxupindia.com
main source : ICAI
DATABASE APPLICATIONS USING MS-ACCESS
320 ADVANCED INFORMATION TECHNOLOGY
Fig. 4.3.10: Customers Button
9. Repeat steps 4 - 8 to add another button to the form which opens the Inventory table. The final Edit Switchboard window appears, as shown in Fig. 4.3.11.
Fig. 4.3.11: Create Button Inventory
Steps to add frmOrders form to the Switchboard
10. In the Edit Switchboard Page dialog box, click New to add buttons to Switchboard. The Edit Switchboard Item dialog box appears.

Downloaded from : taxupindia.com
main source : ICAI
MACROS AND SWITCHBOARDS
ADVANCED INFORMATION TECHNOLOGY 321
11. In the Edit Switchboard Item dialog box, in the Text field, type Orders as name of the button. From the Command list, select Open Form in Add Mode.
12. From the Form list, select frmOrders and click OK. The Edit Switchboard window appears, as shown in Fig. 4.3.12.
Fig. 4.3.12: Create Orders Button
13. The final Edit Switchboard window appears, as shown in Fig. 4.3.13. Click Close to close the Edit Switchboard window.
Fig. 4.3.13: Final Edit Switchboard window

Downloaded from : taxupindia.com
main source : ICAI
DATABASE APPLICATIONS USING MS-ACCESS
322 ADVANCED INFORMATION TECHNOLOGY
14. The Switchboard Manager window appears. Select User Switchboard and click the Make Default button. This option will set the User Switchboard as default switchboard. The Switchboard Manager window appears, as shown in Fig. 4.3.14.
Fig. 4.3.14: Make User Switchboard as Default Switchboard
NOTE: Notice that Switchboard Manager has created a new table Switchboard Items and a new form Switchboard.
15. To test the switchboard created, double-click Switchboard under All Access Objects -> Forms to launch the User Switchboard window. The switchboard form appears, as shown in Fig. 4.3.15
Fig. 4.3.15: User Switchboard

Downloaded from : taxupindia.com
main source : ICAI
MACROS AND SWITCHBOARDS
ADVANCED INFORMATION TECHNOLOGY 323
4.3.2 Modify a Database Switchboard
A switchboard created using Switchboard Manager can display only the default settings for the elements on the switchboard. Switchboards can be made more handy and effective by modifying the properties of a switchboard. Access provides different features to customize a switchboard.
A Database Switchboard can be modified in the Design view using the Property Sheet pane. The VB Editor can also be used for making switchboard modifications. Switchboard can be modified by changing its design, moving controls, adding text, modifying text properties, adding graphics, and changing the control properties. To add or delete buttons to Switchboard, the Edit option in Switchboard Manager is used.
4.3.2.1 Problem Scenario
The developer noticed that the switchboard created in section 4.3.15 is not giving a professional look. He wishes to add the company logo to the switchboard. In addition, he wants to add a new button to the switchboard which will help the user to create an excel copy of data and mail it to the manager.
Solution
To add a company logo to the switchboard, modify the switchboard in the Design view. To add a new button to the switchboard, use the Edit option in Switchboard Manager. Create a command button to execute the macro MailCurrentOrders created in section 4.2.1.
Steps for adding a company logo to Switchboard
1. Right-click the switchboard under All Access Objects -> Forms and select the Design view from the list to open the switchboard in the Design view. The switchboard appears, as shown in Fig. 4.3.16.
Fig. 4.3.16: Open Switchboard in Design View

Downloaded from : taxupindia.com
main source : ICAI
DATABASE APPLICATIONS USING MS-ACCESS
324 ADVANCED INFORMATION TECHNOLOGY
2. Click Design -> Controls -> logo button and browse to the logo image, as shown in Fig. 4.3.17.
Fig. 4.3.17: Form Design Tools View
Fig. 4.3.18: Print the desired logo
3. The logo appears in the Switchboard form, as displayed in Fig. 4.3.19.

Downloaded from : taxupindia.com
main source : ICAI
MACROS AND SWITCHBOARDS
ADVANCED INFORMATION TECHNOLOGY 325
Fig. 4.3.19: The Switchboard form with logo.
Steps to customize the text in Label
1. Select the Apex Inventory Shipment label and press F4 to open the Property window.
2. Set the value of caption property as Inventory Shipment Data. The Caption property is visible under the Format tab. The Property window appears, as shown in Fig. 4.3.20.
Fig. 4.3.21: Change Caption of the label
3. Save the Switchboard form and open it in the Form view to view the changes made. The Switchboard form appears, as shown in Fig. 4.3.22.

Downloaded from : taxupindia.com
main source : ICAI
DATABASE APPLICATIONS USING MS-ACCESS
326 ADVANCED INFORMATION TECHNOLOGY
Fig. 4.3.22: Switchboard Form
Steps for adding a new button to the Switchboard Form
4. On the New Tab or where the Switchboard Manager in your tab, New Tab, click Switchboard Manager.
5. The Switchboard Manager Dialog box appears. Select User Switchboard and click Edit to edit the switchboard, as shown in Fig. 4.3.23.
Fig. 4.3.23: Edit the Switchboard User Switchboard

Downloaded from : taxupindia.com
main source : ICAI
MACROS AND SWITCHBOARDS
ADVANCED INFORMATION TECHNOLOGY 327
6. Edit Switchboard Page appears. Click New to create a button, as shown in Fig. 4.3.24.
Fig. 4.3.24: Create a new button
7. In the Edit Switchboard Item dialog box that appears as a result, in the Text field, enter Mail and Create Excel copy.
8. From the Command list, select Run Macro.
9. From the Form list, select MailCurrentOrders and click OK. The Edit Switchboard window appears, as shown in Fig. 4.3.25.
Fig. 4.3.25: Add a button to run macro MailCurrentOrders
10. Click OK to close the Edit Switchboard window, the button appears in Items on the Switchboard tab, as shown in Fig. 4.3.26.

Downloaded from : taxupindia.com
main source : ICAI
DATABASE APPLICATIONS USING MS-ACCESS
328 ADVANCED INFORMATION TECHNOLOGY
Fig. 4.3.26: Button appears in Edit Switchboard window
11. Close the Edit Switchboard window and the Switchboard Manager window.
12. To test the switchboard created, double-click Switchboard under All Access Objects -> Forms to launch the User Switchboard window. The switchboard form appears, as shown in Fig. 4.3.27.
Fig. 4.3.27: Switchboard Form
4.3.3 Setting the Startup Options
Since most database users do not require direct access to the entire application, the switchboard can be used as a means to direct the user only to the objects specific to their job role. To make a switchboard appear while opening the database so as to make the application more convenient set the startup option of the database. Displaying the switchboard at startup helps to implement a level of security by hiding the key elements of the interface from the user. This allows users to access the database objects relevant to their tasks.

Downloaded from : taxupindia.com
main source : ICAI
MACROS AND SWITCHBOARDS
ADVANCED INFORMATION TECHNOLOGY 329
4.3.3.1 Problem Scenario
The Country Head of Apex Ltd., desired that the database Apex Inventory Shipment should be more users friendly. This means that users should not waste time navigating through various objects. The application should guide the user provide only the required functionality.
Solution
The Switchboard form has already made the application user friendly, with a difference that user needs to open the application search switchboard among the forms and then execute it. This is time-consuming a long process and user may be confused with various options and forms available. To avoid this, set the switchboard form at the Startup option so that as and when the user opens the application the Switchboard form should appear and user may select the required task from it.
Steps to set the switchboard form at startup
1. Open the Apex Inventory Shipment database and click .
2. Select Access Options from the list, as shown in Fig. 4.3.28.
Fig. 4.3.28: Open Access Options
3. The Access Options window appears select Current Database from the left tab, as shown in Fig. 4.3.29.

Downloaded from : taxupindia.com
main source : ICAI
DATABASE APPLICATIONS USING MS-ACCESS
330 ADVANCED INFORMATION TECHNOLOGY
Fig. 4.3.29: Select Current Database
4. Go to Application Options, click in the Display form and select Switchboard from the list that appears, as shown in Fig. 4.3.30.

Downloaded from : taxupindia.com
main source : ICAI
MACROS AND SWITCHBOARDS
ADVANCED INFORMATION TECHNOLOGY 331
Fig. 4.3.30. Select Switchboard for Display Form option
5. Click OK to close the window.
6. To test the startup option, close and reopen the database. The Switchboard form should display automatically.
NOTE: Other than switchboard, any other form can also be set as a database startup option. So it helps to create a login form or a switchboard form and launch it at the startup of database.
4.4 Summary Macros can be created from simple to complex with one or multiple actions. Macro can be executed as a separate object or can be attached to an event property of form, controls, or reports. The attached macros are executed when the event occurs. Macro can also be useful in restricting the number of records to retrieve using the Where clause available with certain actions. Using macro names, can help one macro object hold many macros. Conditions can also be specified with macros to validate the data entry. Macros can also be embedded with the control so that it is stored in the control and moves around with the control.
Switchboards can help to navigate between the various database objects easily and manage data more effectively. The switchboard is essentially a steering wheel for users to find their way through the functions and forms that are available in the application. The switchboard is used as a navigation form, using buttons to display other forms. Switchboards are created using Switchboard Manager. A Switchboard Manager creates a

Downloaded from : taxupindia.com
main source : ICAI
DATABASE APPLICATIONS USING MS-ACCESS
332 ADVANCED INFORMATION TECHNOLOGY
switchboard form and a switchboard items table automatically. Switchboards can be set as database startup options so they should be displayed as the database is opened and can guide the user through proper options.
4.5 Lab Exercises Consider the Apex Inventory Shipment database of Apex Ltd. Provide a solution to below problems.
1. The executive from California has sent the details of all the Orders received today as an Excel 2007 (.xlsx) file named Orders_CA. Create a macro to convert the file to Access table and append the records to the Orders table.
(NOTE: To append the records, create a query and execute it through macros.)
2. The executive in the Operations department are using the frmOrders form to view the orders placed. They want a functionality that the orders should be displayed only for the given period and the date should be accepted each time when they open the form. Create a macro to fulfill the requirement. (Use the Where clause)
3. The operations manager is facing a problem in checking whether the Items ordered are available or not. He wishes to have a button on frmOrders which should display the details of the Items requested in Order. Create a button on frmOrders and attach a macro to get desired functionality.
4. A form was created to track Inventory, as shown in the Fig. below. Attach a macro to the Calculate button that should make an auto entry to the field Order and Available. The order field should be set to Yes if sum of Quantity in Stock and Quantity on Order is less than Reorder Point. The Available Point should be set to Yes if the sum of Quantity in Stock and Quantity on Order is greater than Quantity ordered in Orders table.
Inventory Form

Downloaded from : taxupindia.com
main source : ICAI
MACROS AND SWITCHBOARDS
ADVANCED INFORMATION TECHNOLOGY 333
5. Consider the Inventory form created in previous example, create a macro to ensure that Category and Sub Category of an Item should not be left blank and Quantity on Order should not be less than Reorder Quantity. Display customized message if the validation is not followed.
6. The operations manager wishes to have the application customized for the users of Operations department. The operations manager asked the developer to create a switchboard form that should contain the link to open Inventory table, also it should display the Sales Orders along with their Invoices. Create a switchboard for the purpose.
7. Modify the above created switchboard so as when users selects inventory option another switchboard must be opened. This switchboard gives user option to display the entire Inventory, Inventory from a particular category and Items for which Quantity in Stock is more than 100.
8. Set the Switchboard created in Question No. 6 to the startup option of database so that it opens automatically as user opens the database.
9. Add a button to the Inventory form created in Question 4. The button should display all the orders from Sales Order Description table that were placed for the particular item. The item must be the item that is displayed currently in the form. (Attach a macro to the button for the purpose).
10. Edit the switchboard in Question No. 7. Add a button to the switchboard that should open the Inventory form.