
INFORMATION TECHNOLOGY - Amazon AWS
56
INFORMATION TECHNOLOGY DRAFT ASSET MANAGEMENT PLAN
-
Upload
khangminh22 -
Category
Documents
-
view
5 -
download
0
Transcript of INFORMATION TECHNOLOGY - Amazon AWS
INFORMATION TECHNOLOGYDRAFT ASSET MANAGEMENT PLAN
Document controls
Document ID: D19/15827Rev No Date Revision details Author Reviewer Approver
1 Mar 2019 Initial draft WR (CTTG) EG (CTTG)2 Apr 2019 Incorporating
feedback from Director Organisational Services & Excellence
WR (CTTG) RM (CTTG)
3 May 2019 Final WR (CTTG)4 Jun 2016 Minor revisions to align
with new Strategic and Organisation Plans and latest Community Survey results, in preparation for community consultation
WR (CTTG)
CONTENTS
1 EXECUTIVE SUMMARY .........................................................1Context ........................................................................................................................... 1
What does it cost? ........................................................................................................ 1
What we will do ............................................................................................................ 1
Managing the risks ....................................................................................................... 1
The next steps .............................................................................................................. 2
Questions you may have ............................................................................................ 2
2 INTRODUCTION ..................................................................32.1 Background ........................................................................................................ 3
2.2 Goals and objectives of asset management ............................................... 5
2.3 Plan framework ................................................................................................. 5
2.4 Core and advanced asset management ...................................................... 7
2.5 Community consultation ................................................................................ 7
3 LEVELS OF SERVICE ............................................................83.1 Customer research and expectations ........................................................... 8
3.2 Strategic and corporate goals ........................................................................ 8
3.3 Legislative requirements ................................................................................. 9
3.4 Current levels of service ................................................................................... 9
4 FUTURE DEMAND ............................................................. 114.1 Demand drivers ...............................................................................................11
4.2 Demand forecast .............................................................................................11
4.3 Demand impact on assets ............................................................................11
4.4 Demand management plan .........................................................................11
4.5 Asset programs to meet demand ................................................................12
5 LIFE CYCLE MANAGEMENT PLAN ........................................ 155.1 Background data ............................................................................................15
5.2 Risk management plan ..................................................................................16
5.3 Routine operations and maintenance plan ..............................................17
5.4 Renewal/replacement plan ..........................................................................18
5.5 Creation/acquisition/upgrade plan ............................................................21
6 PLAN IMPROVEMENT AND MONITORING ............................. 256.1 Status of asset management practices ......................................................25
6.2 Improvement planning ..................................................................................26
6.3 Monitoring and review procedures .............................................................26
6.4 Performance measures ..................................................................................26
7 REFERENCES ................................................................... 28
8 APPENDICES .................................................................... 29Appendix A Projected 10 Year IT asset expenditure .................................30
Appendix B IT Application Investment Roadmap .....................................31
Appendix C IT Application Strategy – Executive Summary .....................32
Appendix D IT Application Roadmap ..........................................................39
Appendix E IT Application Roadmap – expenditures estimates ...........40
Appendix F Abbreviations .............................................................................42
Appendix G Glossary .......................................................................................43
Information Technology Asset Management Plan1
1
CONTEXTCouncil provides Information Technology (IT) infrastructure and applications to enable the delivery of functions and services to the community. IT assets are provided in partnership with Council staff to enable the capture, organisation, sharing and use of information to meet our strategic objectives.
WHAT DOES IT COST?The projected outlays necessary to provide the services covered by this Asset Management Plan (AM Plan) over the 10-year planning period is $11.99m or $1.19m on average per year.
WHAT WE WILL DOWe plan to provide Information Technology infrastructure and applications to achieve the following strategic objectives:
• Maintain and extend the capability of digital services for connected customers and community who can interact with Council 24/7
• Design our places and spaces to anticipate community expectations and technology needs
• Maintain the agility of our workforce to respond to customer needs.
MANAGING THE RISKSQuality
IT assets will be maintained in a usable condition. Defects found or reported that are outside our service standard will be repaired. See our maintenance response service levels (Appendix A) for details of defect prioritisation
and response time.
Function
Our intent is that appropriate IT infrastructure and applications are maintained in collaboration with the Local Government sector, other levels of government and stakeholders for the sustainable delivery of IT systems.
IT assets will be maintained at a secure and reliable level and associated equipment and tools will be provided to ensure key business goals are met:
• Improve customer experience
• Achieve financial sustainability
• Deliver continuous improvement.
The main functional goal of our IT services are to deliver more efficient and effective services to our community, and thereby achieve Council’s strategic objectives by:
• Developing and implementing strategies to build knowledge and information management capabilities and stimulate innovation
• Proactively managing the IT environment to ensure high reliability, performance and customer service levels
• Leveraging alternative sourcing models and aligning with a workforce strategy to improve service delivery and cost-effectiveness.
Reliability
There are risks associated with providing the service and not being able to complete all identified activities and projects. We monitor IT assets through proactive platform monitoring and alerting and actioning user requests and ensuring that maintenance
EXECUTIVE SUMMARY
Information Technology Asset Management Plan2
programs are undertaken in a proactive manner.
We will endeavour to manage these risks within available funding by:
• Monitoring and prioritising the risks
• Keeping IT users informed
• Managing IT assets throughout their lifecycle.
Flexibility
Our IT strategies balance a due diligence approach through the development of business cases at each stage, which examine the cost benefit of various options and offer the flexibility to adapt to emerging trends and opportunities, such as Shared Services or collaborative initiatives.
THE NEXT STEPSThe actions resulting from this IT AM Plan are to:
• Ensure the LTFP is based on asset life cycle funding requirements
• Monitor performance and customer satisfaction surveys, to better understand IT asset performance and service delivery
• Continuously improve IT asset management processes and procedures
• Continual review of the IT Application Strategy and Roadmap.
QUESTIONS YOU MAY HAVEWhat is this plan about?
This AM Plan covers the Information Technology assets that serve the City of Tea Tree Gully. These assets include IT applications/software and the underpinning IT network and infrastructure required to support the delivery of services to the community.
What is an asset management plan?
Asset management planning is a comprehensive process to ensure that delivery of services from infrastructure is provided in a financially sustainable manner.
Asset management plans detail information about infrastructure assets including actions required to provide an agreed level of service in the most cost-effective manner. The plan defines the services to be provided, how the services are provided and what funds are required to provide the services.

Information Technology Asset Management Plan3
2 INTRODUCTION
2.1 BACKGROUNDThis asset management plan (AM Plan) aims to demonstrate responsive management of assets (and services provided from assets), compliance with regulatory requirements and to outline the funding needed to provide the required levels of service.
The expectations associated with IT levels of service held by Council staff and the community continue to increase. Historically, IT investment has been opportunistic and driven by demand, resulting in inadequate resources to maintain and upgrade IT assets.
A strategic and planned approach to IT investment has been taken (and is formalised by this AM Plan) to ensure that the Council can respond to current needs, such as delivering digital services, and to anticipate future opportunities.
The AM Plan follows the format recommended in Section 4.2.6 of the International Infrastructure Management Manual1.
The IT AM Plan is to be read in conjunction with Council’s Asset Management Policy, Asset Management Strategy and the following associated planning documents:
• Council Strategic Plan 2016–2020
• Long-Term Financial Plan (LTFP)
• Digital (IT) Strategy 2016–2020
• IT Application Strategy and Roadmap 2015–2022
• Annual Business Plan
• IT Solutions Business Plan
• IT Disaster Recovery Plan.
The IT asset categories covered by this Information Technology AM Plan are shown in Table 2.1. These categories are used in Council’s Asset Register to define IT services.
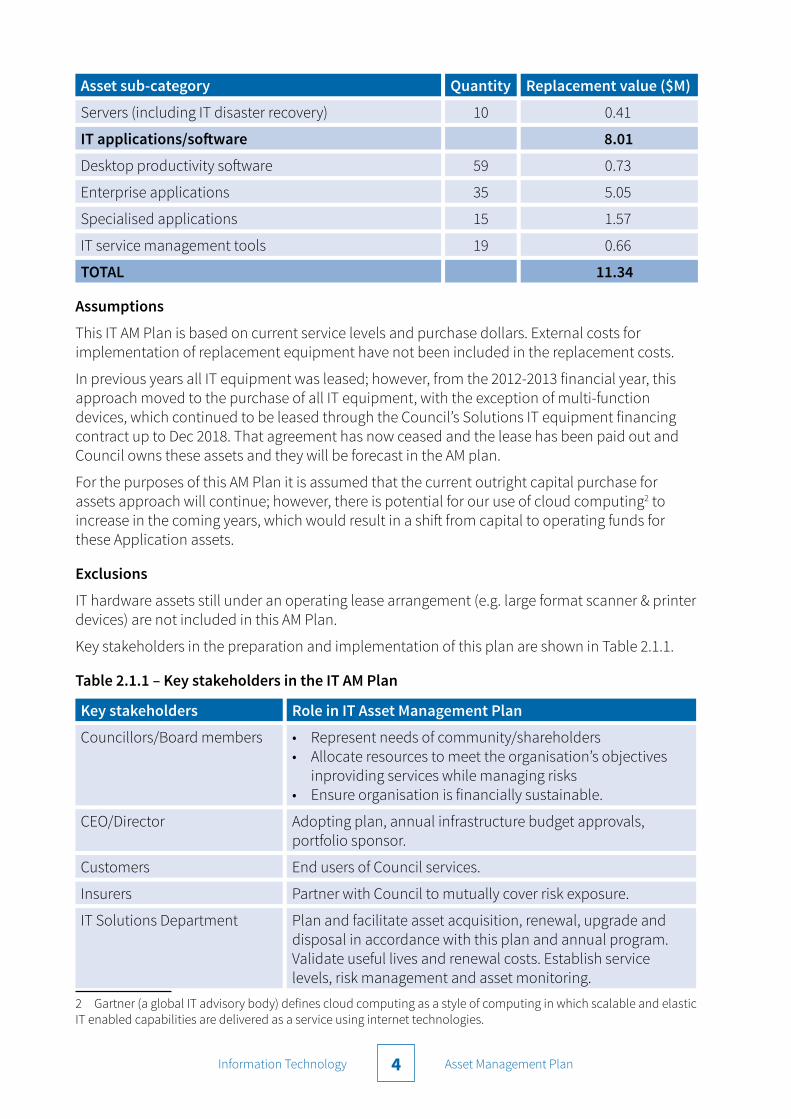
Table 2.1 – Assets covered by this AM Plan
Asset sub-category Quantity Replacement value ($M)
IT Hardware 3.33
Audiovisual 56 .14
Desktops (including laptops, monitors & tablets) 1,684 1.30
Infrastructure/network (including telephony) 461 1.08
Mobile 280 .12
Printers/scanners/plotters 62 .28
1 IPWEA, 2011, Sec 4.2.6, Example of an asset management plan structure, pp 4|24–27.
Information Technology Asset Management Plan4
Asset sub-category Quantity Replacement value ($M)
Servers (including IT disaster recovery) 10 0.41
IT applications/software 8.01
Desktop productivity software 59 0.73
Enterprise applications 35 5.05
Specialised applications 15 1.57
IT service management tools 19 0.66
TOTAL 11.34
Assumptions
This IT AM Plan is based on current service levels and purchase dollars. External costs for implementation of replacement equipment have not been included in the replacement costs.
In previous years all IT equipment was leased; however, from the 2012-2013 financial year, this approach moved to the purchase of all IT equipment, with the exception of multi-function devices, which continued to be leased through the Council’s Solutions IT equipment financing contract up to Dec 2018. That agreement has now ceased and the lease has been paid out and Council owns these assets and they will be forecast in the AM plan.
For the purposes of this AM Plan it is assumed that the current outright capital purchase for assets approach will continue; however, there is potential for our use of cloud computing2 to increase in the coming years, which would result in a shift from capital to operating funds for these Application assets.
Exclusions
IT hardware assets still under an operating lease arrangement (e.g. large format scanner & printer devices) are not included in this AM Plan.
Key stakeholders in the preparation and implementation of this plan are shown in Table 2.1.1.
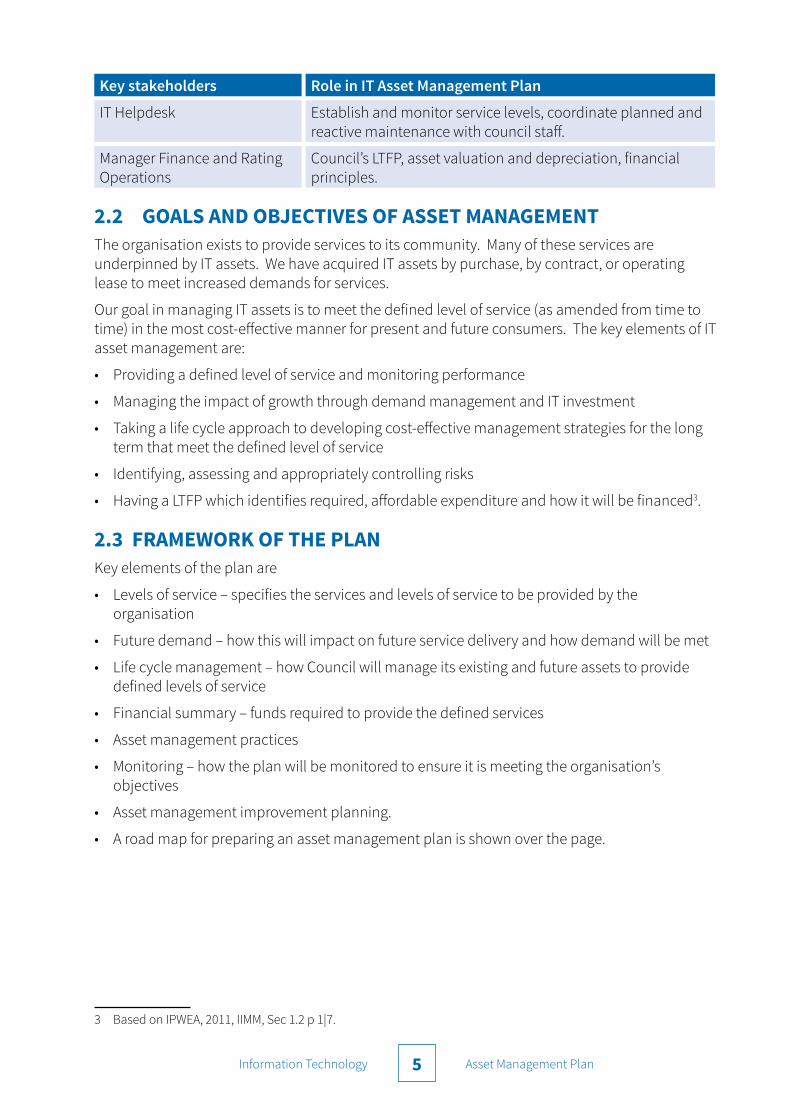
Table 2.1.1 – Key stakeholders in the IT AM Plan
Key stakeholders Role in IT Asset Management Plan
Councillors/Board members • Represent needs of community/shareholders• Allocate resources to meet the organisation’s objectives
inproviding services while managing risks• Ensure organisation is financially sustainable.
CEO/Director Adopting plan, annual infrastructure budget approvals, portfolio sponsor.
Customers End users of Council services.
Insurers Partner with Council to mutually cover risk exposure.
IT Solutions Department Plan and facilitate asset acquisition, renewal, upgrade and disposal in accordance with this plan and annual program. Validate useful lives and renewal costs. Establish service levels, risk management and asset monitoring.
2 Gartner (a global IT advisory body) defines cloud computing as a style of computing in which scalable and elastic IT enabled capabilities are delivered as a service using internet technologies.
Information Technology Asset Management Plan5
Key stakeholders Role in IT Asset Management Plan
IT Helpdesk Establish and monitor service levels, coordinate planned and reactive maintenance with council staff.
Manager Finance and Rating Operations
Council’s LTFP, asset valuation and depreciation, financial principles.
2.2 GOALS AND OBJECTIVES OF ASSET MANAGEMENTThe organisation exists to provide services to its community. Many of these services are underpinned by IT assets. We have acquired IT assets by purchase, by contract, or operating lease to meet increased demands for services.
Our goal in managing IT assets is to meet the defined level of service (as amended from time to time) in the most cost-effective manner for present and future consumers. The key elements of IT asset management are:
• Providing a defined level of service and monitoring performance
• Managing the impact of growth through demand management and IT investment
• Taking a life cycle approach to developing cost-effective management strategies for the long term that meet the defined level of service
• Identifying, assessing and appropriately controlling risks
• Having a LTFP which identifies required, affordable expenditure and how it will be financed3.
2.3 FRAMEWORK OF THE PLANKey elements of the plan are
• Levels of service – specifies the services and levels of service to be provided by the organisation
• Future demand – how this will impact on future service delivery and how demand will be met
• Life cycle management – how Council will manage its existing and future assets to provide defined levels of service
• Financial summary – funds required to provide the defined services
• Asset management practices
• Monitoring – how the plan will be monitored to ensure it is meeting the organisation’s objectives
• Asset management improvement planning.
• A road map for preparing an asset management plan is shown over the page.
3 Based on IPWEA, 2011, IIMM, Sec 1.2 p 1|7.
Information Technology Asset Management Plan6
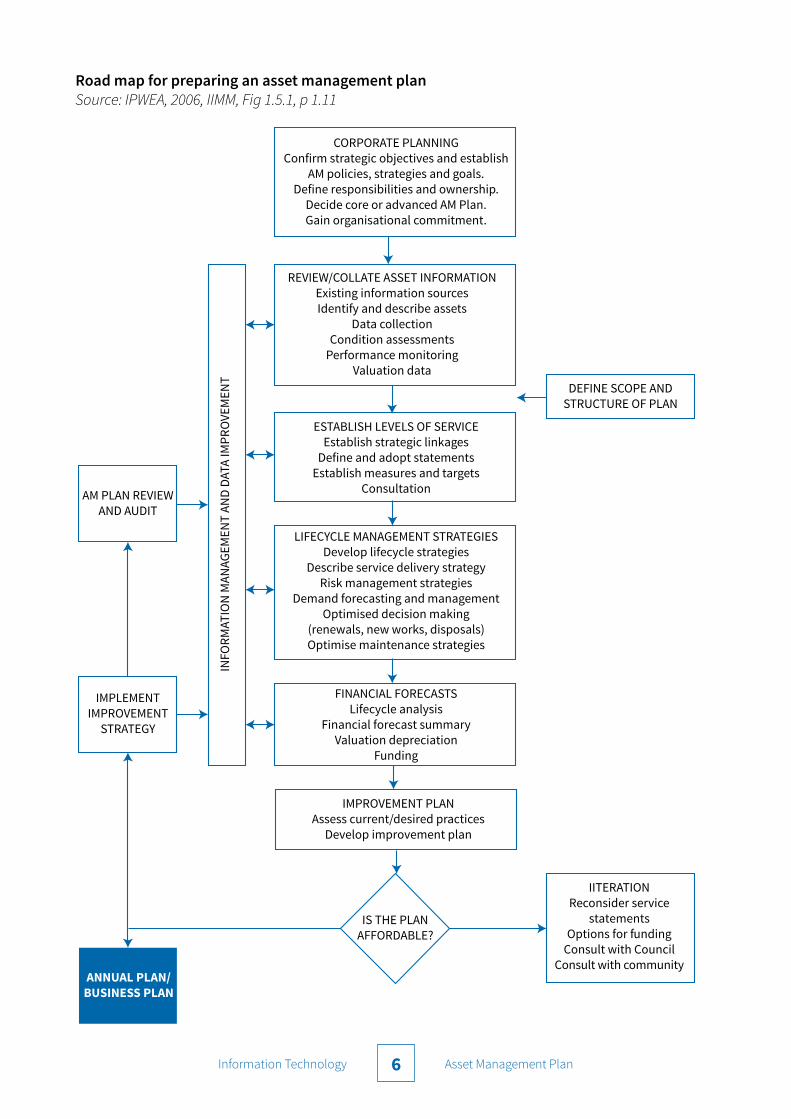
Road map for preparing an asset management planSource: IPWEA, 2006, IIMM, Fig 1.5.1, p 1.11
ANNUAL PLAN/BUSINESS PLAN
IMPLEMENT IMPROVEMENT
STRATEGY
AM PLAN REVIEWAND AUDIT
IS THE PLANAFFORDABLE?
CORPORATE PLANNINGConfirm strategic objectives and establish
AM policies, strategies and goals.Define responsibilities and ownership.
Decide core or advanced AM Plan.Gain organisational commitment.
REVIEW/COLLATE ASSET INFORMATIONExisting information sourcesIdentify and describe assets
Data collectionCondition assessments
Performance monitoringValuation data
ESTABLISH LEVELS OF SERVICEEstablish strategic linkages
Define and adopt statementsEstablish measures and targets
Consultation
LIFECYCLE MANAGEMENT STRATEGIESDevelop lifecycle strategies
Describe service delivery strategyRisk management strategies
Demand forecasting and managementOptimised decision making
(renewals, new works, disposals)Optimise maintenance strategies
FINANCIAL FORECASTSLifecycle analysis
Financial forecast summaryValuation depreciation
Funding
IMPROVEMENT PLANAssess current/desired practices
Develop improvement plan
DEFINE SCOPE ANDSTRUCTURE OF PLAN
IITERATIONReconsider service
statementsOptions for funding
Consult with CouncilConsult with community
Information Technology Asset Management Plan7
2.4 CORE AND ADVANCED ASSET MANAGEMENTThis asset management plan is prepared as a ‘core’ plan in accordance with the International Infrastructure Management Manual4. It is prepared to meet minimum legislative and organisational requirements for sustainable service delivery and long term financial planning and reporting. Core asset management takes a ‘top down’ approach where analysis is applied at the system or network level.
Future revisions of this AM Plan will move towards ‘advanced’ asset management using a ‘bottom-up’ approach for gathering information about individual assets to support the optimisation of activities and programs to meet agreed service levels in a financially sustainable manner.
2.5 COMMUNITY CONSULTATIONThis ‘core’ AM Plan is prepared to facilitate community consultation; initially this will happen by inviting feedback on a public display of draft asset management plans prior to their adoption by Council. Future revisions will incorporate community consultation on service levels and costs of provision. This will assist the Council and the community in balancing the level of service needed by the community, service risks and consequences with the community’s ability and willingness to pay for the service.
4 IPWEA, 2011, IIMM
Information Technology Asset Management Plan8
3 LEVELS OF SERVICE
3.1 CUSTOMER RESEARCH AND EXPECTATIONSThe Council has conducted a community survey on an annual basis since 2001. The survey is an important way for Council to understand how the community views its performance and service delivery and the level of satisfaction residents have with key services.
Since 2011 we have conducted a telephone survey with a demographically representative random sample of 400 CTTG residents, asking questions relating to:
• Service awareness, usage and value
• Satisfaction with key Council services, events, community engagement and value for money
• Perceptions of wellbeing.
Overall satisfaction with Council’s performance is relatively high at 74% in 2018.
3.2 STRATEGIC AND CORPORATE GOALSThis AM plan is prepared under the direction of the organisation’s vision, mission, goals and objectives.
Our vision is:
“To create a thriving community with a quality lifestyle that values its people and natural environment.”
The wellbeing of our community is our priority. Council’s Strategic Plan is focused on promoting the wellbeing of our community; that is, to ensure we have a healthy community that enjoys a quality lifestyle.
The aspirations and objectives included in the Strategic Plan fall under three key themes as follows:
• Healthy and safe
• Prosperous and connected
• Vibrant and liveable.
Organisational goals and objectives relevant to this plan are shown below.
Table 3.2 – Organisational goals and objectives
Goal Objective How goals and objectives are addressed in IT AM Plan
Council to comply with statutory requirements of legislation
Compliance with legislation Proactive management of IT assets will ensure that Council complies with legislation
Information Technology Asset Management Plan9
Goal Objective How goals and objectives are addressed in IT AM Plan
Update the Asset Management Strategy annually to have expenditure on refurbishment and/or replacement assets meet average projected required expenditure values.
Expenditure for refurbishment and/or replacement assets meets average projected required expenditure
The IT Asset Management Plan links to Council’s LTFP in terms of required funding for assets.
The organisation will exercise its duty of care to ensure public safety in accordance with the risk management plan prepared in conjunction with this IT AM Plan. Management of asset risks is covered in Section 5.2.
3.3 LEGISLATIVE REQUIREMENTSThe organisation has to meet many legislative requirements including Australian Government and State legislation and State Regulations. These include:
Table 3.3 – Legislative requirements
Legislation Requirement
Local Government Act, 1999 Sets out role, purpose, responsibilities and powers of local governments, including the preparation of a long-term financial plan supported by asset management plans for sustainable service delivery.
State Records Act, 1997 Sets out responsibilities and requirements in relation to the management of Council records
Freedom of Information Act, 1991 Sets out the framework for processing requests for Council information and records
Work Health and Safety Act, 2012 Sets out roles and responsibilities to secure the health, safety and welfare of persons at work
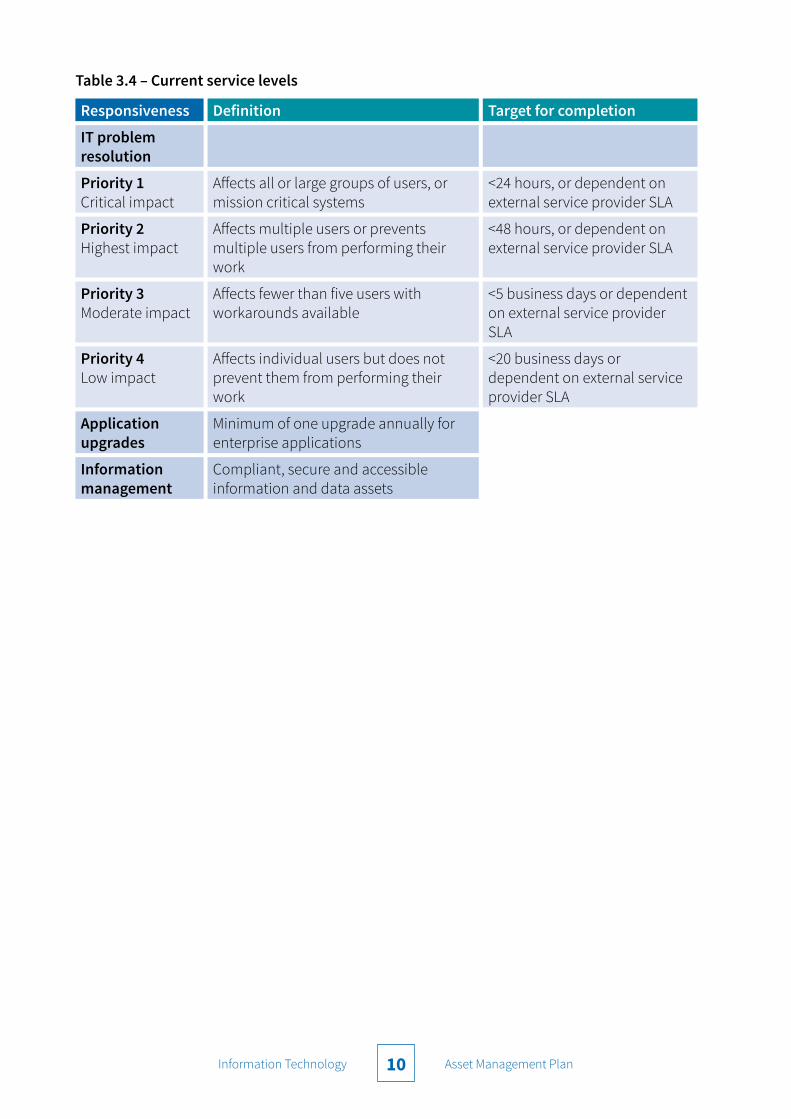
3.4 CURRENT LEVELS OF SERVICEIn the IT environment there are two aspects to service level. These are:
• Appropriate facilities (hardware and software) provided to users, replacement of which is usually determined by age and technological development rather than deterioration of an asset
• Availability of IT services in terms of robust systems and resolution of user problems.
Service and asset managers plan, implement and control service levels to optimise customer service levels5.
Council’s current IT service levels are set out in Table 3.4.
5 IPWEA, 2011, IIMM, p 2.22
Information Technology Asset Management Plan10
Table 3.4 – Current service levels
Responsiveness Definition Target for completion
IT problem resolution
Priority 1 Critical impact
Affects all or large groups of users, or mission critical systems
<24 hours, or dependent on external service provider SLA
Priority 2 Highest impact
Affects multiple users or prevents multiple users from performing their work
<48 hours, or dependent on external service provider SLA
Priority 3 Moderate impact
Affects fewer than five users with workarounds available
<5 business days or dependent on external service provider SLA
Priority 4 Low impact
Affects individual users but does not prevent them from performing their work
<20 business days or dependent on external service provider SLA
Application upgrades
Minimum of one upgrade annually for enterprise applications
Information management
Compliant, secure and accessible information and data assets

Information Technology Asset Management Plan11
4
4.1 DEMAND DRIVERSDrivers affecting demand include population change, changes in demographics, seasonal factors, consumer preferences and expectations, technological changes, economic factors, environmental awareness.
4.2 DEMAND FORECASTThe present situation and future projections regarding demand drivers are documented in Table 4.3.
4.3 DEMAND DRIVERS – IMPACT ON ASSETSThe impact of demand drivers that may affect future service delivery and utilisation of assets are shown in Table 4.3.
Table 4.3 – Demand drivers, projections and impact on services
Demand drivers Present position Projection Impact on services
Community expectations of service value and ease of interaction
Customer First solution implementation, Unified Communications refresh, Community Space Wi-Fi.
Provide multiple customer service channels and improved customer experience
Increased investment and resources required to meet demand and maintain existing services
Information and data asset maintenance and utilisation demand
Commencement of organisation wide data management and analytics, sensor network testing
Increase data maturity and awareness to support efficient, effective operations and delivery of services
Increased investment and resources required to meet demand and maintain existing services
Staff expectations, financial sustainability and continuous improvement
Office 365 adoption, ERP system review, processing automation
Deliver services promptly and efficiently, build financial capacity to increase investment
Increased investment and resources required to meet demand and maintain existing services
4.4 DEMAND MANAGEMENT PLANDemand for new services will be managed through a combination of managing existing assets, upgrading of existing assets and providing new assets to meet demand and demand
FUTURE DEMAND

Information Technology Asset Management Plan12
management. Demand management practices include non-asset solutions, insuring against risks and managing failures.
Non-asset solutions focus on providing the required service without the need for the organisation to own the assets. Management actions include reducing demand for the service, reducing the level of service (allowing some assets to deteriorate beyond current service levels) or educating customers to accept appropriate asset failures6. Other examples of non-asset solutions include providing services from existing infrastructure, such as aquatic centres and libraries, which may be in another community area, or providing access to public toilets in commercial premises.
Opportunities identified to date for demand management are shown in Table 4.4. Further opportunities will be developed in future revisions of this IT AM Plan.
Table 4.4 – Demand management plan summary
Demand driver Impact on services Demand management plan
Community expectations of service value and ease of interaction
Need to maintain multiple customer service channels, and increasingly respond to demand for online services
Maintain and extend the capability of digital services for connected customers and community who can interact with Council 24/7
Infrastructure asset renewal and maintenance demand
Need for more advanced asset management systems and tools
Design our places and spaces to anticipate community expectations and to deliver sustainably
Staff expectations, financial sustainability and continuous improvement
Need for highly available and mobile solutions and systems for streamlining and automating processes
Provide IT solutions to increase the agility of our workforce to respond to customer needs
4.5 ASSET PROGRAMS TO MEET DEMANDDevelopment of Council’s IT Strategy was initiated through workshops with internal stakeholders to identify the key strategic priorities to meet organisational and community demands over the following three to five years.
The IT Strategic Plan underpins the IT Strategy and is comprised of demand, control, and supply elements, in accordance with the Gartner7 IT Strategy Model. The IT Strategic Plan provides a roadmap for delivery by outlining the key change initiatives (programs and projects) that the IT Solutions Department expect to lead and participate in over the next three to seven years.
One of the key change initiatives is the maturity of the IT Application and Strategy Roadmap to guide the prioritisation, selection, implementation and renewal of our IT applications. Organisational and community demand will continue to outstrip our existing IT application suite’s ability to meet evolving needs in the areas of customer service, fiscal controls and continuous improvement.
Organisational and community drivers will shape future IT investment decisions, including:
• Providing the community with fast, reliable and effective services
• Responding to community and staff expectations in a dynamic environment with constantly
6 IPWEA, 2011, IIMM, Table 3.4.`, p 3|58.7 Gartner is a leading global IT research and advisory body.

Information Technology Asset Management Plan13
changing business models and rapid advancements in technology
• Greater demand for solutions to support the mobile worker, and for the right information to be at users’ fingertips when and wherever needed
• A need for improved governance over key IT strategic and investment decisions and a coordinated approach to ensure consistent delivery
• Business demand outstripping IT’s ability to deliver solutions within desired timeframes
• Enterprise Resource Planning (ERP), system implemented in 1997, that is currently struggling to meet business demands
• Emerging opportunities to rationalise applications through alternative service delivery methods and technologies, including outsourcing and cloud solutions
• Investment decisions that balance business needs and IT solutions within budgetary constraints.
The IT Application Strategy and Roadmap will deliver enhanced and/or new systems and business capabilities over the next three to seven years including:
• Financial management system
• Property, rates & compliance system
• Corporate reporting & analytics system (Business Intelligence BI)
• Data management, warehousing and Open Data
• Customer Request Management (CRM) Customer Engagement Centre (CEC) including eServices
• Integration of systems and API standards
• Electronic Document & Records Management System (EDRMS)
• Geographic Information Systems (GIS).
Each of the system initiatives listed above will be initiated through an approved business case, with the timing and implementation approach being subject to change based on the business case outcomes. The initiatives will require capital investments as outlined in Figure 6: IT Application investment roadmap.
The outcomes of the IT Application Strategy and Roadmap will directly support Council’s Customer Experience Strategy and include:
• Tighter fiscal control with improved and cost-effective delivery of services
• Agreed asset levels of services to the community for optimal cost
• Improved access to information for better decision-making
• Improved communications, collaboration and knowledge sharing to support improved customer services
• Standardised and efficient systems for service delivery to the community
• Improved online financial transactions for customers
• Easier to do business with Council, with multi-channel and 24/7 access to information and services
• Continuous improvement of services

Information Technology Asset Management Plan14
• Maximising productivity, reducing costs and improving the quality of information and processes.
Acquiring these new assets will commit the organisation to fund ongoing operations, maintenance and renewal costs for the period; however, the enhancements are likely to be offset by other operational efficiencies and cost savings.
Information Technology Asset Management Plan15
5
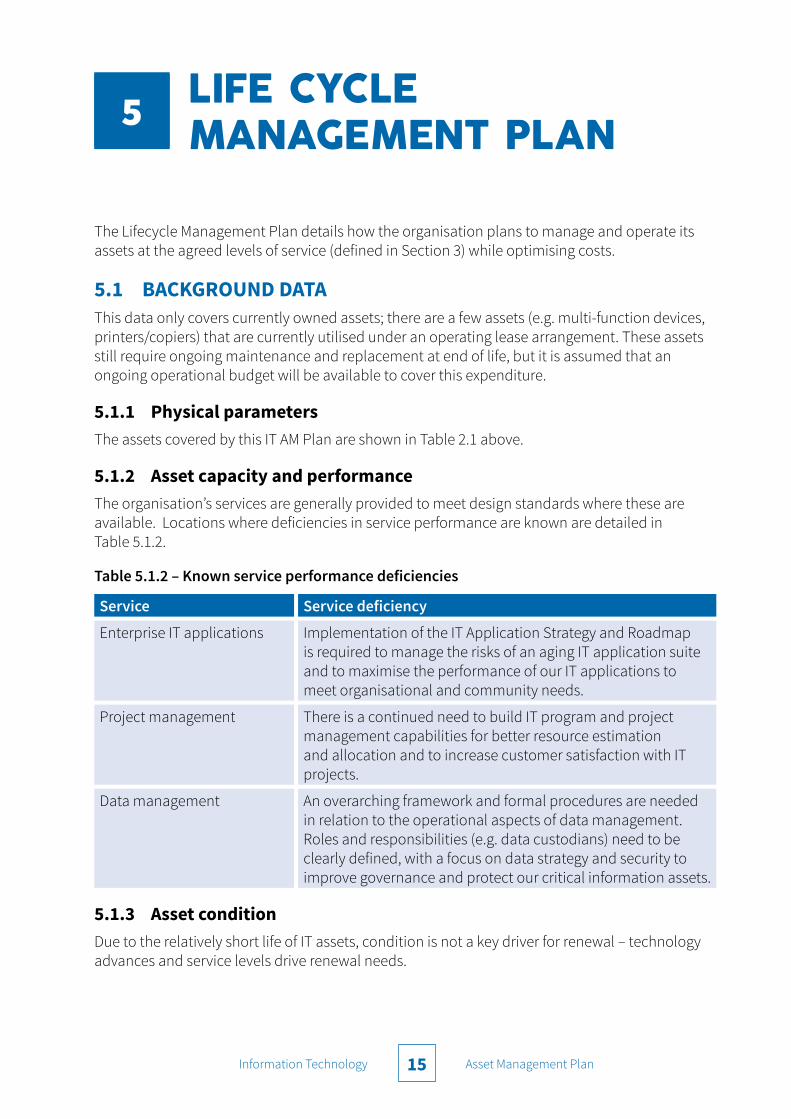
The Lifecycle Management Plan details how the organisation plans to manage and operate its assets at the agreed levels of service (defined in Section 3) while optimising costs.
5.1 BACKGROUND DATAThis data only covers currently owned assets; there are a few assets (e.g. multi-function devices, printers/copiers) that are currently utilised under an operating lease arrangement. These assets still require ongoing maintenance and replacement at end of life, but it is assumed that an ongoing operational budget will be available to cover this expenditure.
5.1.1 Physical parametersThe assets covered by this IT AM Plan are shown in Table 2.1 above.
5.1.2 Asset capacity and performanceThe organisation’s services are generally provided to meet design standards where these are available. Locations where deficiencies in service performance are known are detailed in Table 5.1.2.
Table 5.1.2 – Known service performance deficiencies
Service Service deficiency
Enterprise IT applications Implementation of the IT Application Strategy and Roadmap is required to manage the risks of an aging IT application suite and to maximise the performance of our IT applications to meet organisational and community needs.
Project management There is a continued need to build IT program and project management capabilities for better resource estimation and allocation and to increase customer satisfaction with IT projects.
Data management An overarching framework and formal procedures are needed in relation to the operational aspects of data management. Roles and responsibilities (e.g. data custodians) need to be clearly defined, with a focus on data strategy and security to improve governance and protect our critical information assets.
5.1.3 Asset conditionDue to the relatively short life of IT assets, condition is not a key driver for renewal – technology advances and service levels drive renewal needs.
LIFE CYCLE MANAGEMENT PLAN

Information Technology Asset Management Plan16
5.2 RISK MANAGEMENT An assessment of risks associated with service delivery from IT assets has identified critical risks. The risk assessment process identifies credible risks, the likelihood of the risk event occurring, the consequences should the event occur, develops a risk rating, evaluates the risk and develops a risk treatment plan for non-acceptable risks.
Critical risks, being those assessed as ‘Very High’ – requiring immediate corrective action and ‘High’ – requiring prioritised corrective action, are identified in the IT Risk Management Plan, together with the estimated residual risk after the selected treatment plan is operational, are summarised in Table 5.2. These risks are reported to management and Council.
Table 5.2 – Critical risks and treatment plans
Service or asset at risk
What can happen
Risk rating (VH, H)
Risk treatment plan Residual risk
Treatment costs
Security of Council information
Loss, misuse, or disclosure of information assets – resulting in threats, vulnerabilities, sabotage, fraud, inaccessibility
H Develop overarching information security framework
M
Completed
$30,000
Security of IT network and Council information
IT network breaches, outages, unreliability, performance issues and lost productivity
H Continual review of internal network improvements, undertake technical vulnerability assessment and heighten security awareness
M
Continual Process
$Covered under Capital submissions
Recovery of IT assets and Council information
Loss of essential staff access and recovery of critical IT applications and information in the event of a disaster
H As part of the Server & Storage Technical refresh implement system enhancements to achieve an Active/Active computer room model where Recovery Time Objectives and Recovery Point objectives are reduced to <1h. This project will provide IT disaster recovery capabilities that will meet the Council’s Business Continuity Plan
M
In Progress, Existing DR process remains in force until the Active/Active computer room & services model is live
$Covered under FY18/19 Capex
Note – The residual risk is the risk remaining after the selected risk treatment plan is operational.

Information Technology Asset Management Plan17
5.3 ROUTINE OPERATIONS AND MAINTENANCERoutine maintenance is the regular ongoing work that is necessary to keep assets operating, including instances where portions of the asset fail and need immediate repair to make the asset operational again. We regularly update our software to latest versions as they become available. In relation to our hardware, we have implementing a monitoring tool called Solarwinds to ensure that the equipment is being utilised efficiently.
5.3.2 Operations and maintenance strategiesThe organisation will operate and maintain assets to provide the defined level of service to approved budgets in the most cost-efficient manner. Operation and maintenance activities include:
• Scheduling operations activities to deliver the defined level of service in the most efficient manner
• Undertaking maintenance activities through a planned maintenance system to reduce costs and improve outcomes. Undertake cost-benefit analysis to determine the most cost-effective split between planned and unplanned maintenance activities (50–70% planned desirable)
• Maintain a current infrastructure risk register for assets and present service risks associated with providing services from infrastructure assets; report Very High and High risks, and residual risks after treatment to management and Council
• Review current and required skills base and implement workforce training and development to meet required operations and maintenance needs
• Review asset utilisation to identify underutilised assets and appropriate remedies, and over-utilised assets and customer demand management options
• Maintain a current hierarchy of critical assets and required operations and maintenance activities
• Develop and regularly review appropriate emergency response capability
• Review management of operations and maintenance activities to ensure Council is obtaining best value from resources.
Critical assets
Critical assets are those assets which have a high consequence of failure but not necessarily a high likelihood of failure. By identifying critical assets and critical failure modes, organisations can target and refine investigative activities, maintenance plans and capital expenditure plans at the appropriate time.
Operations and maintenances activities may be targeted to mitigate critical assets failure and maintain service levels. These activities may include increased inspection frequency, higher maintenance intervention levels, etc.
Within the IT AM Plan, the following asset sub-categories are considered critical:
• Infrastructure / network (including telephony)
• Servers and Storage Area Networks (SAN’s) (including IT disaster recovery)
As identified in the May 2015 IT audit report, the identification of critical assets within sub-categories is still required.

Information Technology Asset Management Plan18
Standards and specifications
Maintenance work is carried out in accordance with the following Standards and Specifications.
• Hardware – as per manufacturer warranty conditions
• Applications/software – as per manufacturer warranty and support level conditions
• Council standards and specifications
5.4 RENEWAL/REPLACEMENT PLANRenewal and replacement expenditure is major work which does not increase the asset’s design capacity but restores, rehabilitates, replaces or renews an existing asset to its original or lesser required service potential. Work over and above restoring an asset to original service potential is classed as upgrade/expansion or new works expenditure.
5.4.1 Renewal planAssets requiring renewal/replacement are identified from one of three methods provided in the ‘expenditure template’.
• Method 1 uses Asset Register data to project the renewal costs using acquisition year and useful life to determine the renewal year
• Method 2 uses capital renewal expenditure projections from external condition modelling systems (such as pavement management systems)
• Method 3 uses a combination of average network renewals plus defect repairs in the Renewal Plan and Defect Repair Plan worksheets on the expenditure template.
Method 1 was used for this AM Plan.
The useful lives of assets used to develop projected asset renewal expenditures are shown in Table 5.4.1. Asset useful lives were reviewed with the development of this plan in 20158.
Table 5.4.1 – Indicative useful lives of assets
Asset (sub) category Useful life Comments
IT hardware
Audiovisual• Auxiliary equipment 5–7 years Electronic whiteboards and peripheral
equipment• Videoconferencing
equipment4 years
Desktop• Desktop PCs 3–5 years Includes laptops and 2–in–1 devices• Thin clients 5 years
Infrastructure/network• Network infrastructure
(links)10–15 years Or until technology makes this
redundant• Desk phones 5–8 years
8 Internal review and IT industry standards

Information Technology Asset Management Plan19
Asset (sub) category Useful life Comments• Switches and other
network hardware5 years
• Uninterrupted power supply (UPS)
5–7 years Serviced annually
• Other IT infrastructure 3–5 years Technology will make this redundant and growth of systems will require upgrade
Mobile• Mobile devices 2–3 years
Printers/scanners/plotters• Printers 3 years Desktop printers• Scanners/plotters 3–6 years Replacement determined by
requirements• Multi-function devices 5–7 years (or if
leased, life of lease)Replacement determined by cost effective maintenance life of the units
Servers 4–5 years Dependent on business criticality
IT applications/software
Desktop productivity software 3 years e.g. Microsoft Office
Enterprise applications 7–10 years e.g. Authority enterprise resource planning (ERP) system
Specialised applications 3–10 years e.g. Dashboard
IT service management tools 5 years e.g. IT Helpdesk software
5.4.2 Renewal and replacement strategiesThe organisation will plan capital renewal and replacement projects to meet level of service objectives and minimise infrastructure service risks by:
• Planning and scheduling renewal projects to deliver the defined level of service in the most efficient manner
• Undertaking project scoping for all capital renewal and replacement projects to identify:
ᵒ o the service delivery deficiency, present risk and optimum time for renewal/replacement
ᵒ o the project objectives to rectify the deficiency
ᵒ o the range of options, estimated capital and life cycle costs for each option that could address the service deficiency.
• Evaluating the options against evaluation criteria adopted by the organisation
• Selecting the best option to be included in capital renewal programs using low cost renewal methods (cost of renewal is less than replacement) wherever possible
• Maintaining a current infrastructure risk register for assets and service risks associated with providing services from infrastructure assets and reporting Very High and High risks and residual risks after treatment to management and Council
• Review current and required skills base and implement workforce training and development

Information Technology Asset Management Plan20
to meet required construction and renewal needs
• Maintain a current hierarchy of critical assets and capital renewal treatments and timings required
• Review capital renewal and replacement activities to ensure Council is obtaining best value from IT resources.
Renewal ranking criteria
Asset renewal and replacement is typically undertaken to either:
• Ensure the reliability of the existing infrastructure to deliver the service it was constructed to facilitate, or
• To ensure the infrastructure is of sufficient quality to meet the service requirements9.
It is possible to get some indication of capital renewal and replacement priorities by identifying assets or asset groups that:
• Have a high incidence of failure
• Have heavy use and so impact of failure on users would be greatest
• The total value represents the greatest net value to the organisation
• Have the highest average age relative to their expected lives
• Are identified in the IT AM Plan as key cost factors
• Have high operational or maintenance costs
• Would yield material savings if replaced with modern equivalent assets10.
The ranking criteria used to determine priority of identified renewal and replacement proposals is detailed in Table 5.4.2.
Table 5.4.2 – Renewal and replacement priority ranking criteria
Criteria Weighting
Age 40%
Technology 20%
Service level 40%
Total 100%
Renewal and replacement standards
Renewal work is carried out in accordance with the following standards and specifications.
• As per the manufacturer’s recommendations
• As per the manufacturer’s stated life expectation
• As per current IT trends and industry standards.
9 IPWEA, 2011, IIMM, Sec 3.4.4, p 3|6010 Based on IPWEA, 2011, IIMM< Sec 3.4.5, p 3|66
Information Technology Asset Management Plan21
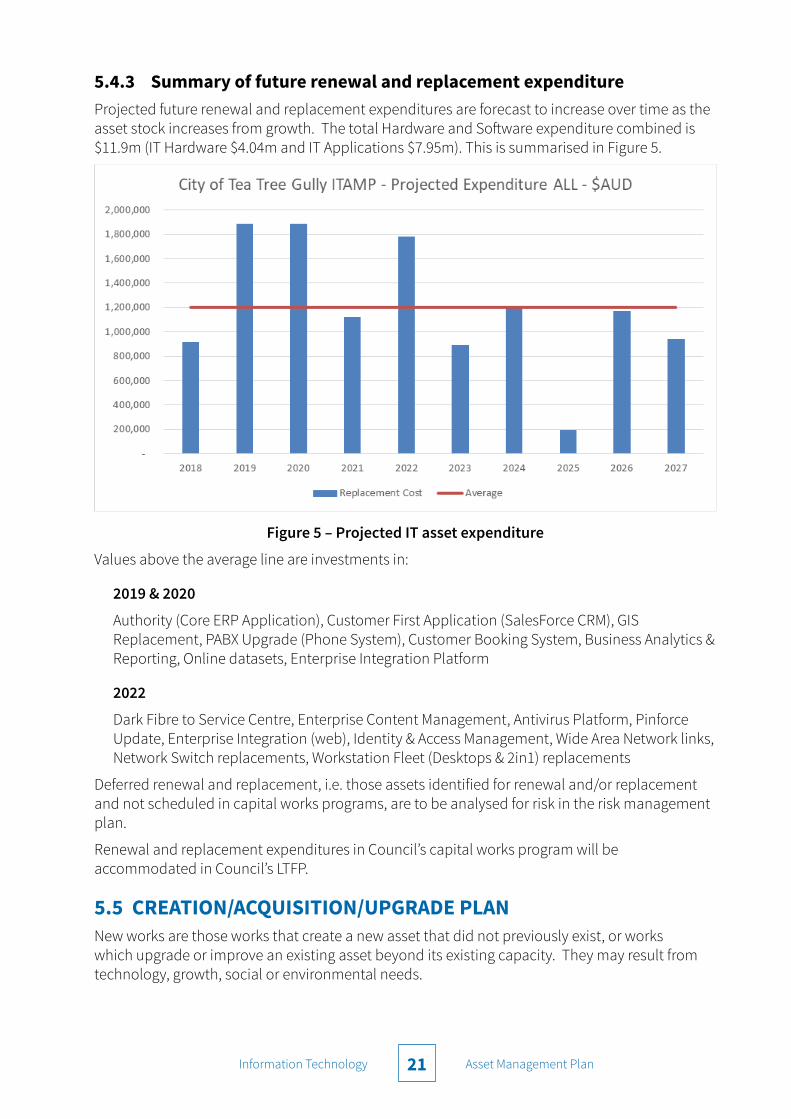
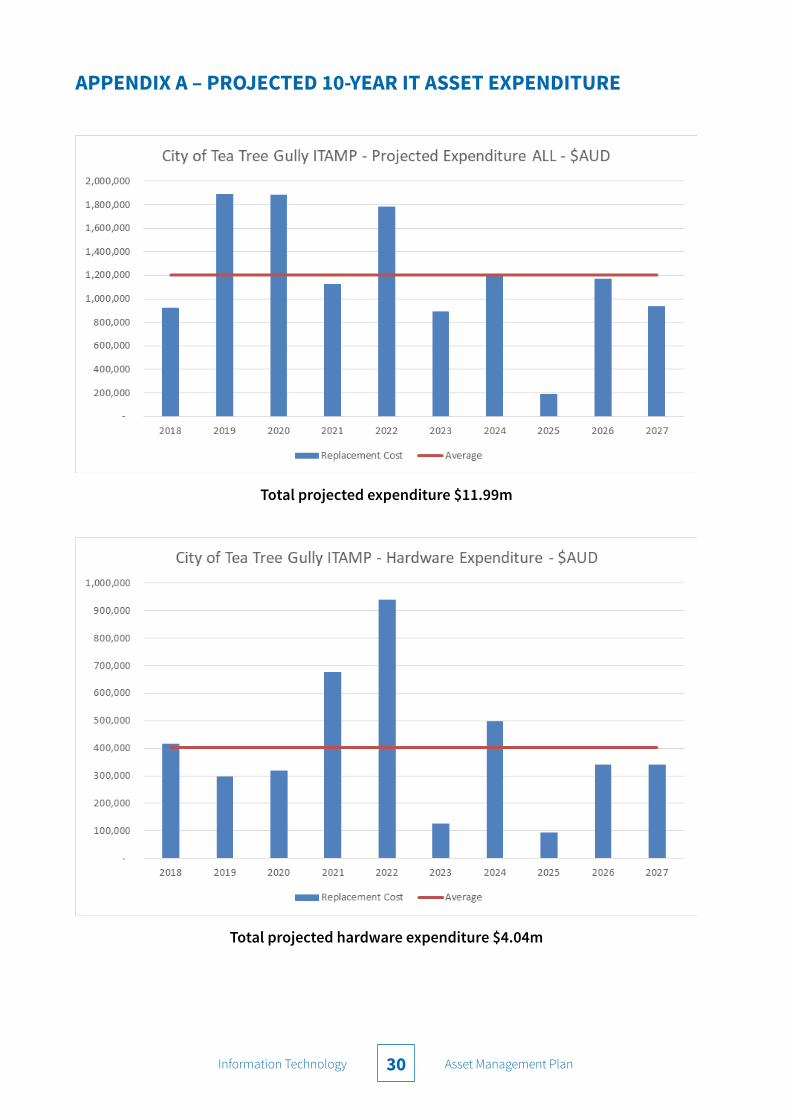
5.4.3 Summary of future renewal and replacement expenditureProjected future renewal and replacement expenditures are forecast to increase over time as the asset stock increases from growth. The total Hardware and Software expenditure combined is $11.9m (IT Hardware $4.04m and IT Applications $7.95m). This is summarised in Figure 5.
Figure 5 – Projected IT asset expenditure
Values above the average line are investments in:
2019 & 2020
Authority (Core ERP Application), Customer First Application (SalesForce CRM), GIS Replacement, PABX Upgrade (Phone System), Customer Booking System, Business Analytics & Reporting, Online datasets, Enterprise Integration Platform
2022
Dark Fibre to Service Centre, Enterprise Content Management, Antivirus Platform, Pinforce Update, Enterprise Integration (web), Identity & Access Management, Wide Area Network links, Network Switch replacements, Workstation Fleet (Desktops & 2in1) replacements
Deferred renewal and replacement, i.e. those assets identified for renewal and/or replacement and not scheduled in capital works programs, are to be analysed for risk in the risk management plan.
Renewal and replacement expenditures in Council’s capital works program will be accommodated in Council’s LTFP.
5.5 CREATION/ACQUISITION/UPGRADE PLANNew works are those works that create a new asset that did not previously exist, or works which upgrade or improve an existing asset beyond its existing capacity. They may result from technology, growth, social or environmental needs.
Information Technology Asset Management Plan22
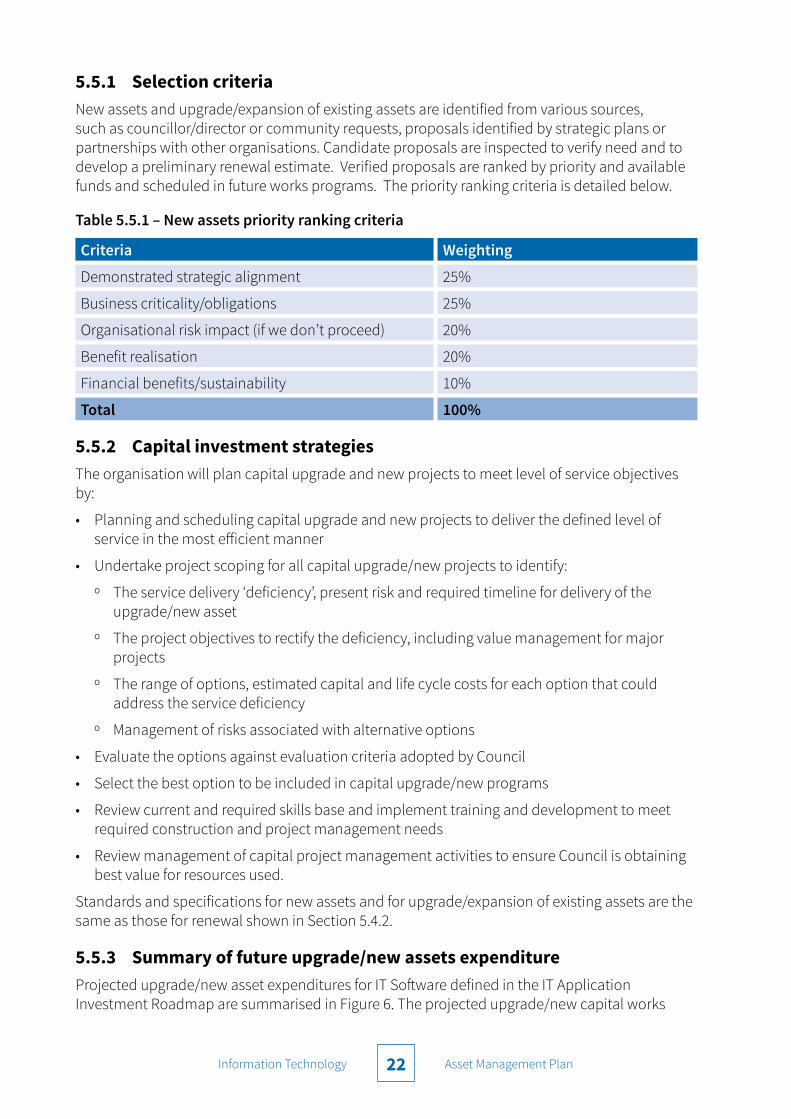
5.5.1 Selection criteriaNew assets and upgrade/expansion of existing assets are identified from various sources, such as councillor/director or community requests, proposals identified by strategic plans or partnerships with other organisations. Candidate proposals are inspected to verify need and to develop a preliminary renewal estimate. Verified proposals are ranked by priority and available funds and scheduled in future works programs. The priority ranking criteria is detailed below.
Table 5.5.1 – New assets priority ranking criteria
Criteria Weighting
Demonstrated strategic alignment 25%
Business criticality/obligations 25%
Organisational risk impact (if we don’t proceed) 20%
Benefit realisation 20%
Financial benefits/sustainability 10%
Total 100%
5.5.2 Capital investment strategiesThe organisation will plan capital upgrade and new projects to meet level of service objectives by:
• Planning and scheduling capital upgrade and new projects to deliver the defined level of service in the most efficient manner
• Undertake project scoping for all capital upgrade/new projects to identify:
ᵒ The service delivery ‘deficiency’, present risk and required timeline for delivery of the upgrade/new asset
ᵒ The project objectives to rectify the deficiency, including value management for major projects
ᵒ The range of options, estimated capital and life cycle costs for each option that could address the service deficiency
ᵒ Management of risks associated with alternative options
• Evaluate the options against evaluation criteria adopted by Council
• Select the best option to be included in capital upgrade/new programs
• Review current and required skills base and implement training and development to meet required construction and project management needs
• Review management of capital project management activities to ensure Council is obtaining best value for resources used.
Standards and specifications for new assets and for upgrade/expansion of existing assets are the same as those for renewal shown in Section 5.4.2.
5.5.3 Summary of future upgrade/new assets expenditureProjected upgrade/new asset expenditures for IT Software defined in the IT Application Investment Roadmap are summarised in Figure 6. The projected upgrade/new capital works

Information Technology Asset Management Plan23
program $7.95m and is detailed in Appendix E.
Figure 6 – IT Application Investment Roadmap
Item above the line in Figure 6 consist of investments in:
2019
Authority Application - Finance, SalesForce CRM, Microsoft Office Tools, GIS Replacement, Customer booking System
2020
Authority Application - Property Rating and Compliance, Business Analytics & Reporting, Enterprise Integration Platform, Online datasets
5.5.4 Key assumptions made in financial forecastsThis section details the key assumptions made in presenting the information contained in this asset management plan and in preparing forecasts of required operating and capital expenditure and asset values, depreciation expense and carrying amount estimates. It is presented to enable readers to gain an understanding of the levels of confidence in the data behind the financial forecasts.
Key assumptions made in this IT AM Plan and risks that these may change are:
• Replacement capital calculated only for currently owned assets
• Software assets (and annual license costs) included
• Increased use of cloud applications, which would result in a shift from capital to operating funds.
Accuracy of financial forecasts may be improved in future revisions of this AM Plan by the following actions.
• Improved tracking of operation/maintenance and rehabilitation costs
• Centralised asset management and data analysis
Information Technology Asset Management Plan24
• Asset audit and improved data collection
• Ongoing identification of limitations and adoption of improved processes.
5.5.5 Forecast reliability and confidenceThe expenditure and valuations projections in this IT AM Plan are based on best available data. Currency and accuracy of data is critical to effective asset and financial management.
With the majority of IT hardware being manufactured overseas, fluctuations in the Australian dollar will naturally impact the projections.
Appendix E provides the expenditure estimates (+/-20 %) for each initiative within the IT Application Strategy and Roadmap, which are based on past experience, current research and market scans. These estimates will be refined within the business cases to be developed for each initiative.
Information Technology Asset Management Plan25
6
6.1 STATUS OF ASSET MANAGEMENT PRACTICES
6.1.1 Accounting and financial systemsCouncil uses Civica Authority as its accounting / financial system.
Accountabilities for financial systems
This system is linked with Council’s asset management system “ASSETIC” hosted via SaaS which is integrated with the Civica System.
Accounting Standards and Regulations
The Australian Accounting Standards provide the benchmark against which Council reports on asset accounting.
Capital/maintenance threshold
Council’s draft Capitalisation Policy considers issues other than just monetary or materiality thresholds when defining whether expenditure be considered as either maintenance or capital.
Required changes to accounting financial systems arising from this IT AM Plan
Council uses ASSETIC as its infrastructure asset management system; it is linked with Council’s finance system, geographical information system Mapinfo, and Exponaire.
6.1.2 Asset management systemInformation Technology assets are managed using the Solarwinds helpdesk system (implemented in 2014), which associates problem tickets with IT assets and tracks the history of asset service requests and complaints. The use of this system has significantly improved our ability to effectively manage IT assets throughout their life cycle, and continuous improvement of our asset management practices, processes and procedures will ensure an increased maturity in the development of future IT AM plans.
The Assets Register includes:
• Data on size, age, value, and remaining life of the network
• The unit rates for categories of work/materials
• The adopted service levels
• Projections of various factors affecting future demand for services
• Correlation between maintenance and renewal
• Data on new assets acquired by Council.
PLAN IMPROVEMENT AND MONITORING
Information Technology Asset Management Plan26
Required changes to Council’s AM system arising from this IT AM Plan
Council will continuously improve its asset management processes and reporting.
6.2 IMPROVEMENT PLANNINGThis is our second IT AM Plan developed under the IPWEA framework and in view of the relatively recent implementation of our IT asset management system, increased maturity can be expected from future revisions of this plan.
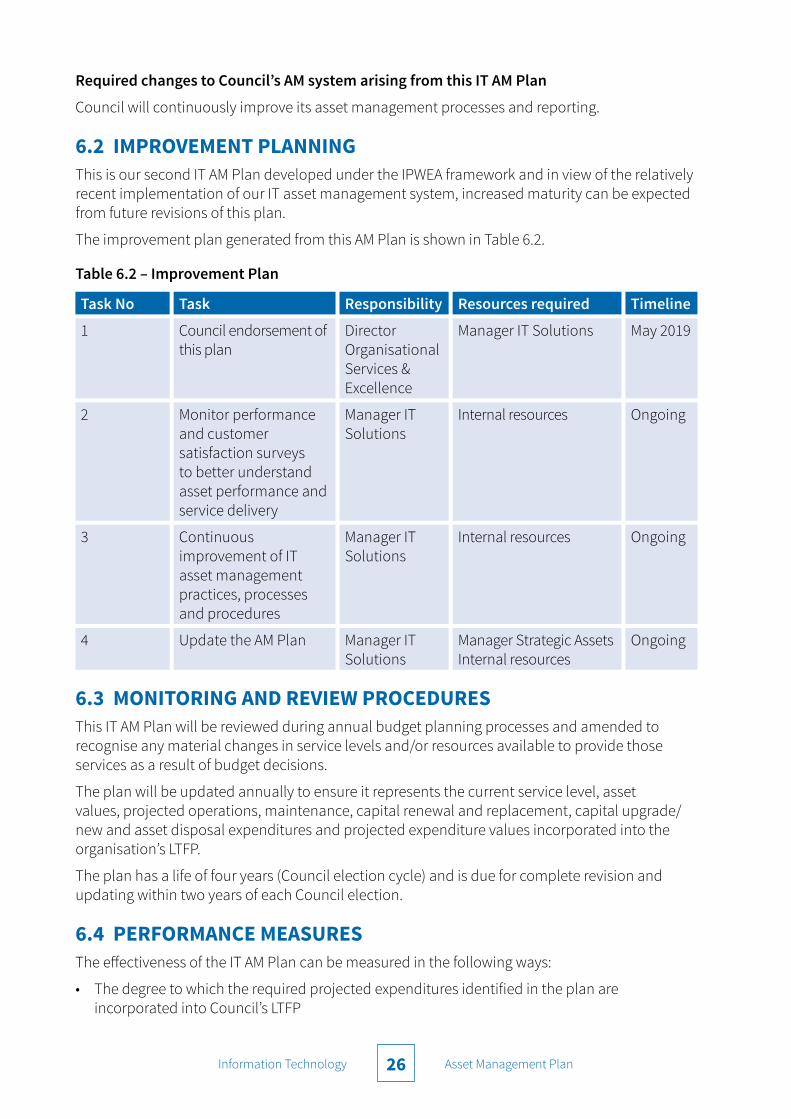
The improvement plan generated from this AM Plan is shown in Table 6.2.
Table 6.2 – Improvement Plan
Task No Task Responsibility Resources required Timeline
1 Council endorsement of this plan
Director Organisational Services & Excellence
Manager IT Solutions May 2019
2 Monitor performance and customer satisfaction surveys to better understand asset performance and service delivery
Manager IT Solutions
Internal resources Ongoing
3 Continuous improvement of IT asset management practices, processes and procedures
Manager IT Solutions
Internal resources Ongoing
4 Update the AM Plan Manager IT Solutions
Manager Strategic Assets Internal resources
Ongoing
6.3 MONITORING AND REVIEW PROCEDURESThis IT AM Plan will be reviewed during annual budget planning processes and amended to recognise any material changes in service levels and/or resources available to provide those services as a result of budget decisions.
The plan will be updated annually to ensure it represents the current service level, asset values, projected operations, maintenance, capital renewal and replacement, capital upgrade/new and asset disposal expenditures and projected expenditure values incorporated into the organisation’s LTFP.
The plan has a life of four years (Council election cycle) and is due for complete revision and updating within two years of each Council election.
6.4 PERFORMANCE MEASURESThe effectiveness of the IT AM Plan can be measured in the following ways:
• The degree to which the required projected expenditures identified in the plan are incorporated into Council’s LTFP
Information Technology Asset Management Plan27
• The degree to which 1 to 5-year detailed works programs, budgets, business plans and organisational structures take into account the global works program trends provided by the plan
• The degree to which existing and projected service levels and service consequences (what we cannot do), risks and residual risks are incorporated into Council’s Strategic Plan and associated plans,
• The Asset Renewal Funding Ratio achieving the target of 1.0.
Information Technology Asset Management Plan28
7
IPWEA, 2006, ‘International Infrastructure Management Manual’, Institute of Public Works Engineering Australasia, Sydney, www.ipwea.org/IIMM
IPWEA, 2008, ‘NAMS.PLUS Asset Management’, Institute of Public Works Engineering Australasia, Sydney, www.ipwea.org/namsplus.
IPWEA, 2009, ‘Australian Infrastructure Financial Management Guidelines’, Institute of Public Works Engineering Australasia, Sydney, www.ipwea.org/AIFMG.
IPWEA, 2011, ‘International Infrastructure Management Manual’, Institute of Public Works Engineering Australasia, Sydney, www.ipwea.org/IIMM
REFERENCES
Information Technology Asset Management Plan29
8
Appendix A Projected 10–year IT Asset Expenditure
Appendix B IT Application Investment Roadmap
Appendix C IT Application Strategy – Executive Summary
Appendix D IT Application Roadmap
Appendix E IT Application Roadmap - Expenditure Estimates
Appendix F Abbreviations
Appendix G Glossary
APPENDICES
Information Technology Asset Management Plan30
APPENDIX A – PROJECTED 10-YEAR IT ASSET EXPENDITURE
Total projected expenditure $11.99m
Total projected hardware expenditure $4.04m

Information Technology Asset Management Plan31
APPENDIX B – IT APPLICATION INVESTMENT ROADMAP
Total projected software expenditure $7.95m

Information Technology Asset Management Plan32
APPENDIX C – IT APPLICATION STRATEGY – EXECUTIVE SUMMARY
1.1 OverviewThis IT Application Strategy (ITAS) will ensure that City of Tea Tree Gully (CTTG) invests in suitable IT applications and technologies to underpin the strategy, and will anticipate future business transformation needs that will support the delivery of Council services to its community and customers.
“An application strategy is a process of continuous iteration driven to improve business value by engaging all stakeholders in measuring the current state of applications and developing options for improvement”11.
The ITAS will provide a flexible and actionable roadmap that will guide prioritisation, selection, implementation and renewal of CTTG applications and technologies based on business driven solutions.
CTTG corporate leaders are looking for modern, easy-to-use applications that can respond to their problems or opportunities in a timely manner. At the same time the Council is committed to working towards the strategic goals of standardising and limiting the number of applications in order to minimise the risk and costs of integration, support and security concerns. The ITAS will align these two goals to ensure that investment decisions in information, technology and communications are well governed by transparent cost-benefit analyses aligned to CTTG’s strategic directions.
1.2 Strategic contextCTTG’s strategic objectives are to continue to enhance and remain focused on the customer experience by:
• Adopting tight fiscal management
• Improving its customer service
• Continuously seeking ways to do business more efficiently and effectively.
The ITAS will support these objectives by ensuring that business transformation is enabled and governed by agreed and sound business, data, application and technology principles.
The ITAS aligns to the business outcomes of the Digital (IT) Strategy 2016–2020, and its three strategic focus areas (and referenced throughout this ITAS):
1. Our customers
2. Our places & spaces
3. Our people.
Further strategic alignment to Council’s key strategic, corporate and business plans includes:
• Strategic Plan 2020
• Organisational plan 2020
• Long-Term Financial Plan (LTFP)
• Customer Experience Strategy
• Annual Business Plan.11 What is an Application Strategy? Darryl Carlton, Gartner Application Architect Summit, June 2014
Information Technology Asset Management Plan33
The ITAS has:
• Outlined the current business capabilities, which appropriate IT applications and technologies need to support
• Documented the key principles that will underpin IT strategies and decisions
• Explored relevant IT industry and local government sector developments and recommended an approach suitable for CTTG in its future application development and solution design
• Recommended an IT application high-level roadmap for IT investment to support current and future planned business initiatives
• Provided a strategic context for the evolution of IT solutions in alignment with Council’s Strategic, Corporate and Business Plan.
In February 2014, Council undertook a ‘fitness review’ or health-check on the current Enterprise Resource Planning (ERP) suite to assess the solution’s ability to progress the strategic IT initiatives. The primary drivers for the review, from a range of stakeholders, included: audit concerns, mixed effectiveness, level of quality assurance, level of support and responsiveness, slow delivery and the high cost of development.
The outcomes of the ERP fitness review highlighted the need to evolve Council’s application suite to meet not only current gaps but also emerging business transformation needs. However, since these ERP applications are “modules”, which form part of the broader suite, they cannot be easily treated in complete isolation. The ITAS has considered integration/connectivity issues when contemplating elimination, migration and implementation to newer platforms. It is important not to adopt integration solutions without detailed understanding of Council’s information assets and data integrity requirements.
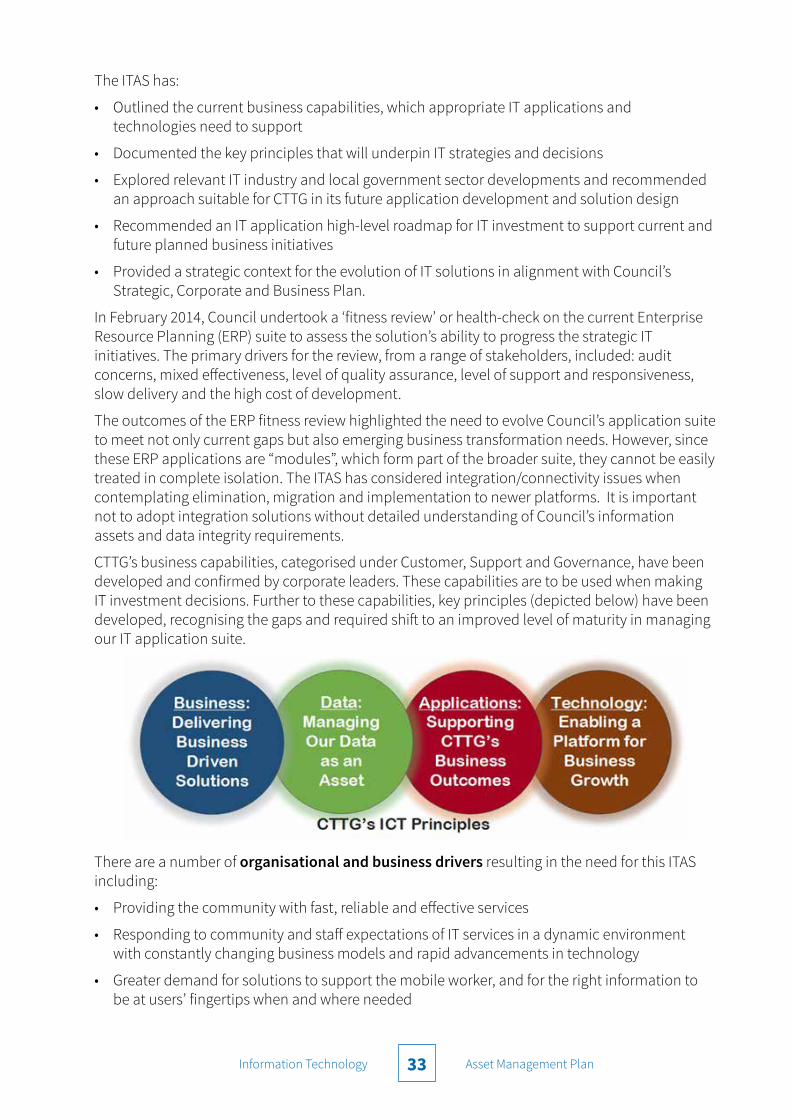
CTTG’s business capabilities, categorised under Customer, Support and Governance, have been developed and confirmed by corporate leaders. These capabilities are to be used when making IT investment decisions. Further to these capabilities, key principles (depicted below) have been developed, recognising the gaps and required shift to an improved level of maturity in managing our IT application suite.
There are a number of organisational and business drivers resulting in the need for this ITAS including:
• Providing the community with fast, reliable and effective services
• Responding to community and staff expectations of IT services in a dynamic environment with constantly changing business models and rapid advancements in technology
• Greater demand for solutions to support the mobile worker, and for the right information to be at users’ fingertips when and where needed

Information Technology Asset Management Plan34
• Uncoordinated IT projects with mixed delivery results, and a need for improved governance over key IT strategic and investment decisions
• Business demand outstripping IT’s ability to deliver solutions within business areas desired time frames
• An ERP system implemented in 1997 that, in many areas, is struggling to meet the demands of the business
• Emerging opportunities to rationalise applications through alternative service delivery methods and technologies including outsourcing and cloud solutions
• Investment decisions that balance business needs and IT solutions within budgetary constraints.
CTTG is currently faced with many external IT management challenges including:
• Growing cost of support and maintenance of legacy systems
• Demand to support the ‘digital community’ – blending business with personal use of technology devices and applications
• Shift to provide solutions in alternative ways, such as externally hosted solutions
• Responding to greater business demands with fewer resources
• Uplifting of skills, knowledge and capabilities of IT and non-IT staff.
This ITAS is intended for use across CTTG in the consideration and selection of all future (and existing) IT solutions, whether initiated by IT Solutions, or by individual business units. Since the ERP fitness review in 2014, IT Solutions have worked with the relevant business areas to address several modules in Council’s legacy ERP Civica Authority, which have been replaced or superseded with fit for purpose and centralised corporate applications, including;
• Dog Registrations – Migrated from ERP to State Government managed, centralised Dogs and Cates Online (DACO).
• Asset Register – Migrated from ERP to Assetic platform providing asset registers and condition based assessments.
• Customer Request Management (CRM) – Nearing completion in 2019, migrating from ERP to Salesforce dedicated ‘Customer First’ application.
1.3 Key results and findingsBusiness demand across CTTG will continue to apply pressure to Council’s existing IT application suite’s ability to meet transformational needs in the areas of improved customer service, application of tighter fiscal controls and continuous improvement. For this reason there is a need for a business driven adaptable ITAS and roadmap to underpin future IT investment decisions.
The development of this ITAS has been based on leading global IT research and advisory services (Gartner), learnings from other local governments (across South Australia and Victoria) and organisations (including the University of Adelaide), and close assessment of CTTG’s current applications, and emerging business needs.
Information Technology Asset Management Plan35
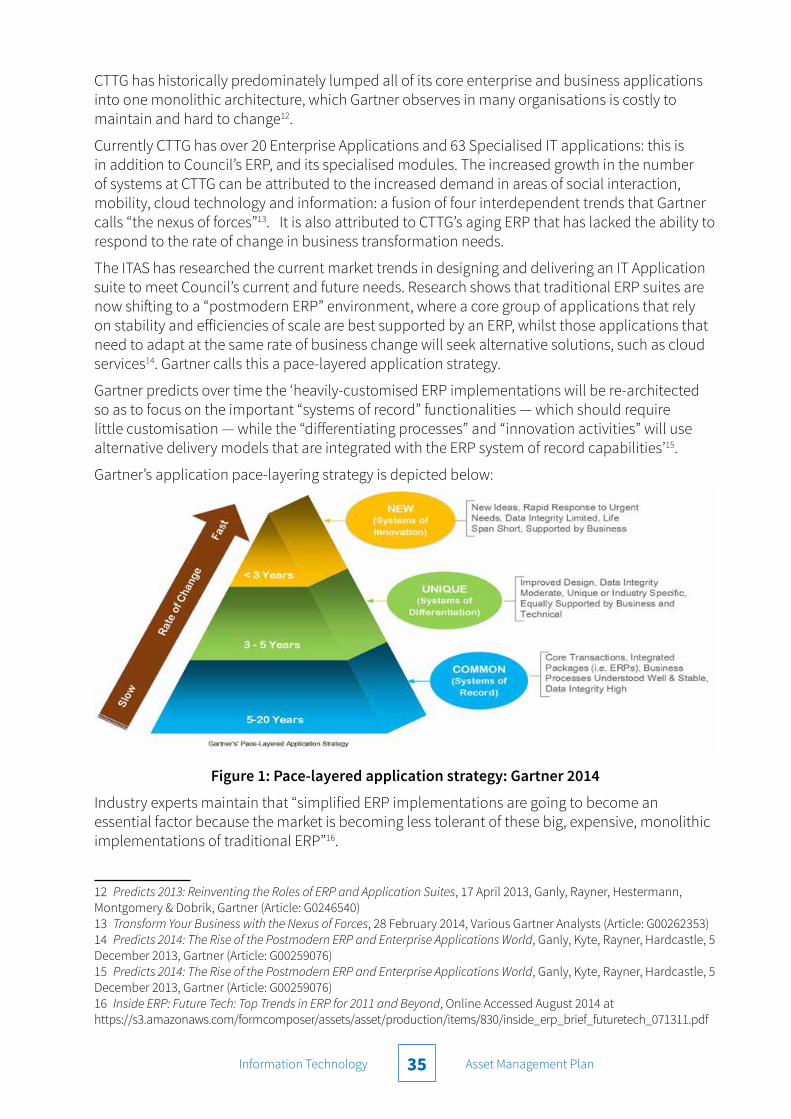
CTTG has historically predominately lumped all of its core enterprise and business applications into one monolithic architecture, which Gartner observes in many organisations is costly to maintain and hard to change12.
Currently CTTG has over 20 Enterprise Applications and 63 Specialised IT applications: this is in addition to Council’s ERP, and its specialised modules. The increased growth in the number of systems at CTTG can be attributed to the increased demand in areas of social interaction, mobility, cloud technology and information: a fusion of four interdependent trends that Gartner calls “the nexus of forces”13. It is also attributed to CTTG’s aging ERP that has lacked the ability to respond to the rate of change in business transformation needs.
The ITAS has researched the current market trends in designing and delivering an IT Application suite to meet Council’s current and future needs. Research shows that traditional ERP suites are now shifting to a “postmodern ERP” environment, where a core group of applications that rely on stability and efficiencies of scale are best supported by an ERP, whilst those applications that need to adapt at the same rate of business change will seek alternative solutions, such as cloud services14. Gartner calls this a pace-layered application strategy.
Gartner predicts over time the ‘heavily-customised ERP implementations will be re-architected so as to focus on the important “systems of record” functionalities — which should require little customisation — while the “differentiating processes” and “innovation activities” will use alternative delivery models that are integrated with the ERP system of record capabilities’15.
Gartner’s application pace-layering strategy is depicted below:
Figure 1: Pace-layered application strategy: Gartner 2014
Industry experts maintain that “simplified ERP implementations are going to become an essential factor because the market is becoming less tolerant of these big, expensive, monolithic implementations of traditional ERP”16.
12 Predicts 2013: Reinventing the Roles of ERP and Application Suites, 17 April 2013, Ganly, Rayner, Hestermann, Montgomery & Dobrik, Gartner (Article: G0246540)13 Transform Your Business with the Nexus of Forces, 28 February 2014, Various Gartner Analysts (Article: G00262353)14 Predicts 2014: The Rise of the Postmodern ERP and Enterprise Applications World, Ganly, Kyte, Rayner, Hardcastle, 5 December 2013, Gartner (Article: G00259076)15 Predicts 2014: The Rise of the Postmodern ERP and Enterprise Applications World, Ganly, Kyte, Rayner, Hardcastle, 5 December 2013, Gartner (Article: G00259076)16 Inside ERP: Future Tech: Top Trends in ERP for 2011 and Beyond, Online Accessed August 2014 at https://s3.amazonaws.com/formcomposer/assets/asset/production/items/830/inside_erp_brief_futuretech_071311.pdf

Information Technology Asset Management Plan36
The adoption of the pace-layered strategy offered by Gartner will provide CTTG with a framework to consider investment in types of IT solutions based on their business transformation needs to meet customer experience improvements under tighter budgetary constraints.
The ITAS was reviewed and revised to ensure it aligns to Council’s Strategic Plan 2020, and major strategic initiatives including the Customer Experience Strategy and the Managing Assets through Capability and Knowledge Program (MACK). It determines a clear roadmap, and clarifies priorities and directions to build business cases for significant change initiatives for investment decision making.
The key findings of the ITAS are as follows:
Ref Area Finding
1 Paced-layered application strategy
When selecting future IT solutions for CTTG, assess business applications based on the required pace of change, and their business distinctiveness.
2 Application strategy CTTG’s long term IT strategic decisions will be based on stabilising core enterprise applications as records systems, whilst considering appropriate solutions for those business applications that are classified as differentiating and innovating processes.
3 Application strategy CTTG’s applications are best supported by a core ERP solution where integration adds value through business standardisation and operating efficiencies.
4 Data and integration IT Solutions will need to consider what their data needs are in the wider context of CTTG’s IT application suite, while ensuring that integration provides the desired return on investment (ROI).
5 IT governance framework
Develop and support and IT governance framework to ensure project success is achievable at CTTG based on agreed business, data, application and technology principles.
6 Application rationalisation
Pursue the goals of reducing the cost and complexity of IT applications, while transforming the business investment processes, governance and culture that led to the current inflexible application environment.
7 Application rationalisation & ROI
Develop solid business cases for IT projects at CTTG to include cost-benefit analysis (ROI) and total cost of ownership. Define all requirements before selecting the solution and consider non-functional requirements, such as integration and ongoing support and upgrades.
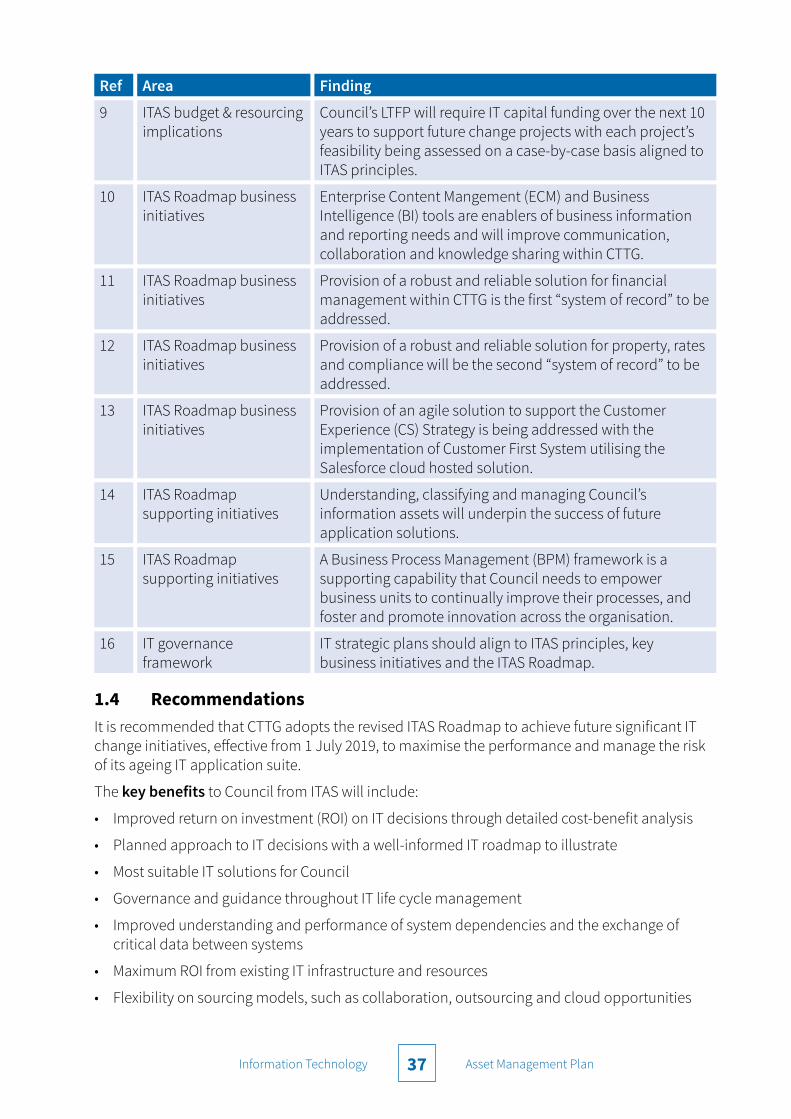
8 ITAS budget & resourcing implications
Significant change reforms underway in Council Cloud hosted platforms (MACK program, payroll services, RMSS Risk Management and Customer First – Salesforce) will influence future change projects and will be supported by the principles of ITAS.
Information Technology Asset Management Plan37
Ref Area Finding
9 ITAS budget & resourcing implications
Council’s LTFP will require IT capital funding over the next 10 years to support future change projects with each project’s feasibility being assessed on a case-by-case basis aligned to ITAS principles.
10 ITAS Roadmap business initiatives
Enterprise Content Mangement (ECM) and Business Intelligence (BI) tools are enablers of business information and reporting needs and will improve communication, collaboration and knowledge sharing within CTTG.
11 ITAS Roadmap business initiatives
Provision of a robust and reliable solution for financial management within CTTG is the first “system of record” to be addressed.
12 ITAS Roadmap business initiatives
Provision of a robust and reliable solution for property, rates and compliance will be the second “system of record” to be addressed.
13 ITAS Roadmap business initiatives
Provision of an agile solution to support the Customer Experience (CS) Strategy is being addressed with the implementation of Customer First System utilising the Salesforce cloud hosted solution.
14 ITAS Roadmap supporting initiatives
Understanding, classifying and managing Council’s information assets will underpin the success of future application solutions.
15 ITAS Roadmap supporting initiatives
A Business Process Management (BPM) framework is a supporting capability that Council needs to empower business units to continually improve their processes, and foster and promote innovation across the organisation.
16 IT governance framework
IT strategic plans should align to ITAS principles, key business initiatives and the ITAS Roadmap.
1.4 RecommendationsIt is recommended that CTTG adopts the revised ITAS Roadmap to achieve future significant IT change initiatives, effective from 1 July 2019, to maximise the performance and manage the risk of its ageing IT application suite.
The key benefits to Council from ITAS will include:
• Improved return on investment (ROI) on IT decisions through detailed cost-benefit analysis
• Planned approach to IT decisions with a well-informed IT roadmap to illustrate
• Most suitable IT solutions for Council
• Governance and guidance throughout IT life cycle management
• Improved understanding and performance of system dependencies and the exchange of critical data between systems
• Maximum ROI from existing IT infrastructure and resources
• Flexibility on sourcing models, such as collaboration, outsourcing and cloud opportunities

Information Technology Asset Management Plan38
• Achieving the desired balance between IT efficiency and support for business innovation.
The key assumptions of the ITAS are:
• CTTG to continue with the adoption of a pace-layered application strategy approach to determine its core ERP footprint, migrating residual ERP modules to alternative solutions as soon as practical.
• Commitment to an appropriate IT governance model to guide and underpin future IT decisions and investment
• Individual business cases for IT initiatives to justify ROI and consider alternative delivery models such as cloud-delivered solutions and/or collaboration opportunities.
Supporting recommendations to activate this ITAS and its roadmap are:
• Seek endorsement of the ITAS time frame and funding strategy from the IT Strategy Steering Group, Executive Leadership Team, Audit Committee, and Elected Members
• Engage with corporate leaders to promote the endorsed ITAS and its principles and confirm the roadmap
• Ensure future business change initiatives with significant IT change outcomes uphold ITAS key principles and its proposed solution architecture
• Maturity of the IT Governance Framework to uphold the ITAS key principles and solution architecture, including development of KPIs and regular ITAS performance reporting.
• Continue existing IT capital investment program to support short-term business outcomes in line with ITAS principles.
Information Technology Asset Management Plan39
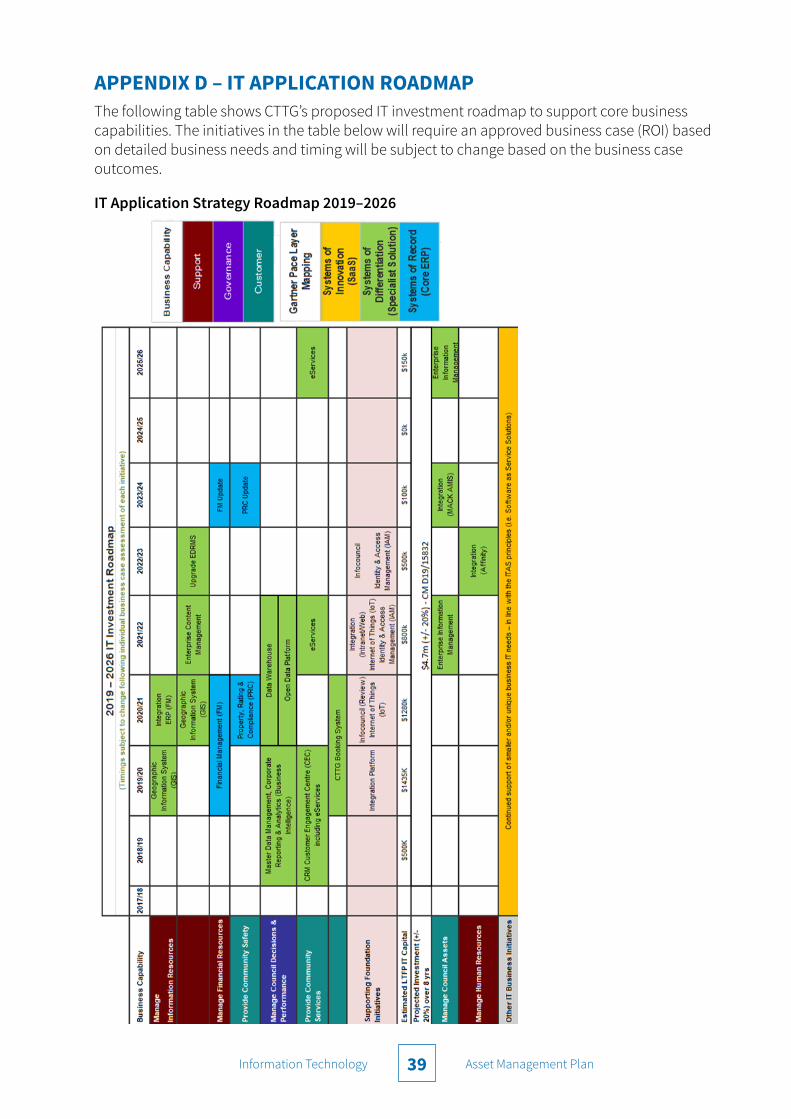
APPENDIX D – IT APPLICATION ROADMAPThe following table shows CTTG’s proposed IT investment roadmap to support core business capabilities. The initiatives in the table below will require an approved business case (ROI) based on detailed business needs and timing will be subject to change based on the business case outcomes.
IT Application Strategy Roadmap 2019–2026
Information Technology Asset Management Plan40
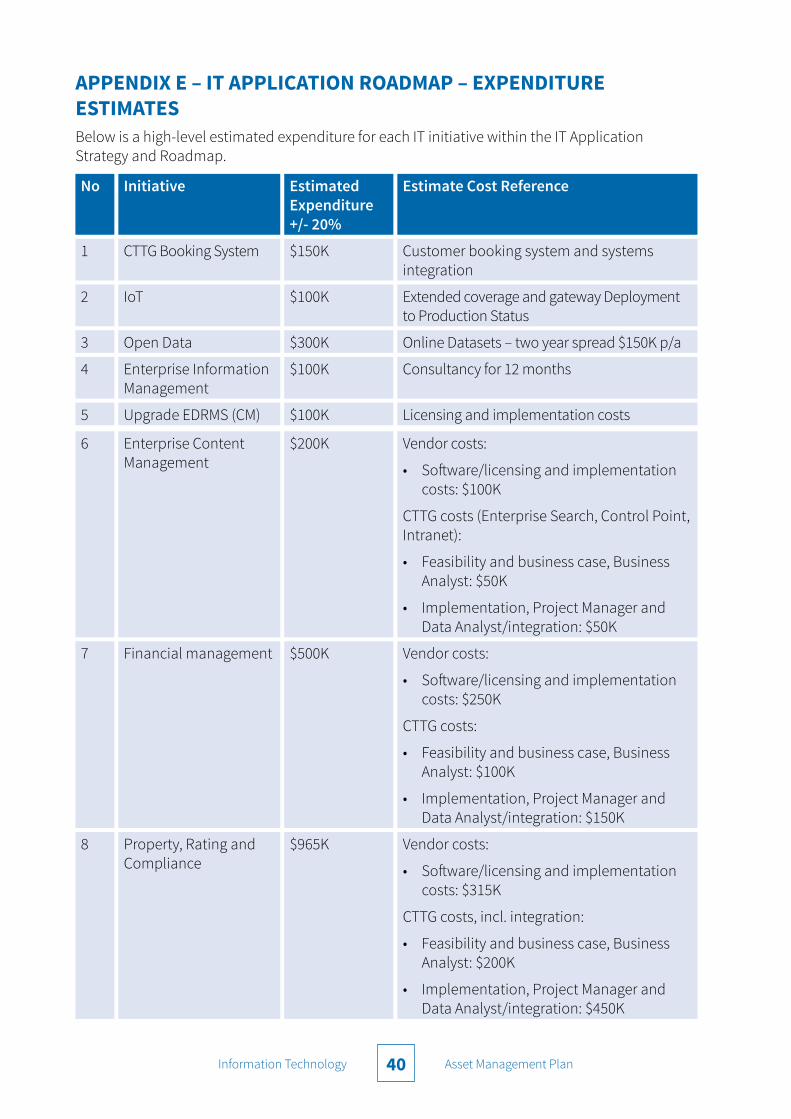
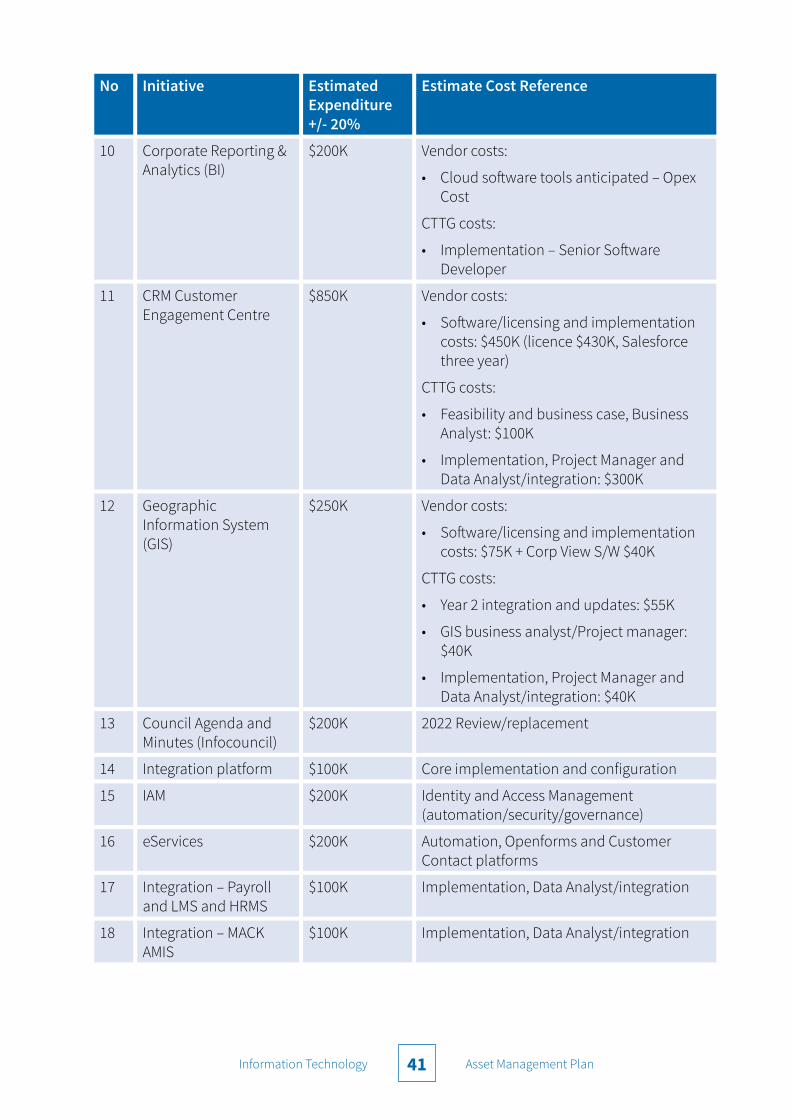
APPENDIX E – IT APPLICATION ROADMAP – EXPENDITURE ESTIMATESBelow is a high-level estimated expenditure for each IT initiative within the IT Application Strategy and Roadmap.
No Initiative Estimated Expenditure +/- 20%
Estimate Cost Reference
1 CTTG Booking System $150K Customer booking system and systems integration
2 IoT $100K Extended coverage and gateway Deployment to Production Status
3 Open Data $300K Online Datasets – two year spread $150K p/a
4 Enterprise Information Management
$100K Consultancy for 12 months
5 Upgrade EDRMS (CM) $100K Licensing and implementation costs
6 Enterprise Content Management
$200K Vendor costs:
• Software/licensing and implementation costs: $100K
CTTG costs (Enterprise Search, Control Point, Intranet):
• Feasibility and business case, Business Analyst: $50K
• Implementation, Project Manager and Data Analyst/integration: $50K
7 Financial management $500K Vendor costs:
• Software/licensing and implementation costs: $250K
CTTG costs:
• Feasibility and business case, Business Analyst: $100K
• Implementation, Project Manager and Data Analyst/integration: $150K
8 Property, Rating and Compliance
$965K Vendor costs:
• Software/licensing and implementation costs: $315K
CTTG costs, incl. integration:
• Feasibility and business case, Business Analyst: $200K
• Implementation, Project Manager and Data Analyst/integration: $450K
Information Technology Asset Management Plan41
No Initiative Estimated Expenditure +/- 20%
Estimate Cost Reference
10 Corporate Reporting & Analytics (BI)
$200K Vendor costs:
• Cloud software tools anticipated – Opex Cost
CTTG costs:
• Implementation – Senior Software Developer
11 CRM Customer Engagement Centre
$850K Vendor costs:
• Software/licensing and implementation costs: $450K (licence $430K, Salesforce three year)
CTTG costs:
• Feasibility and business case, Business Analyst: $100K
• Implementation, Project Manager and Data Analyst/integration: $300K
12 Geographic Information System (GIS)
$250K Vendor costs:
• Software/licensing and implementation costs: $75K + Corp View S/W $40K
CTTG costs:
• Year 2 integration and updates: $55K
• GIS business analyst/Project manager: $40K
• Implementation, Project Manager and Data Analyst/integration: $40K
13 Council Agenda and Minutes (Infocouncil)
$200K 2022 Review/replacement
14 Integration platform $100K Core implementation and configuration
15 IAM $200K Identity and Access Management (automation/security/governance)
16 eServices $200K Automation, Openforms and Customer Contact platforms
17 Integration – Payroll and LMS and HRMS
$100K Implementation, Data Analyst/integration
18 Integration – MACK AMIS
$100K Implementation, Data Analyst/integration
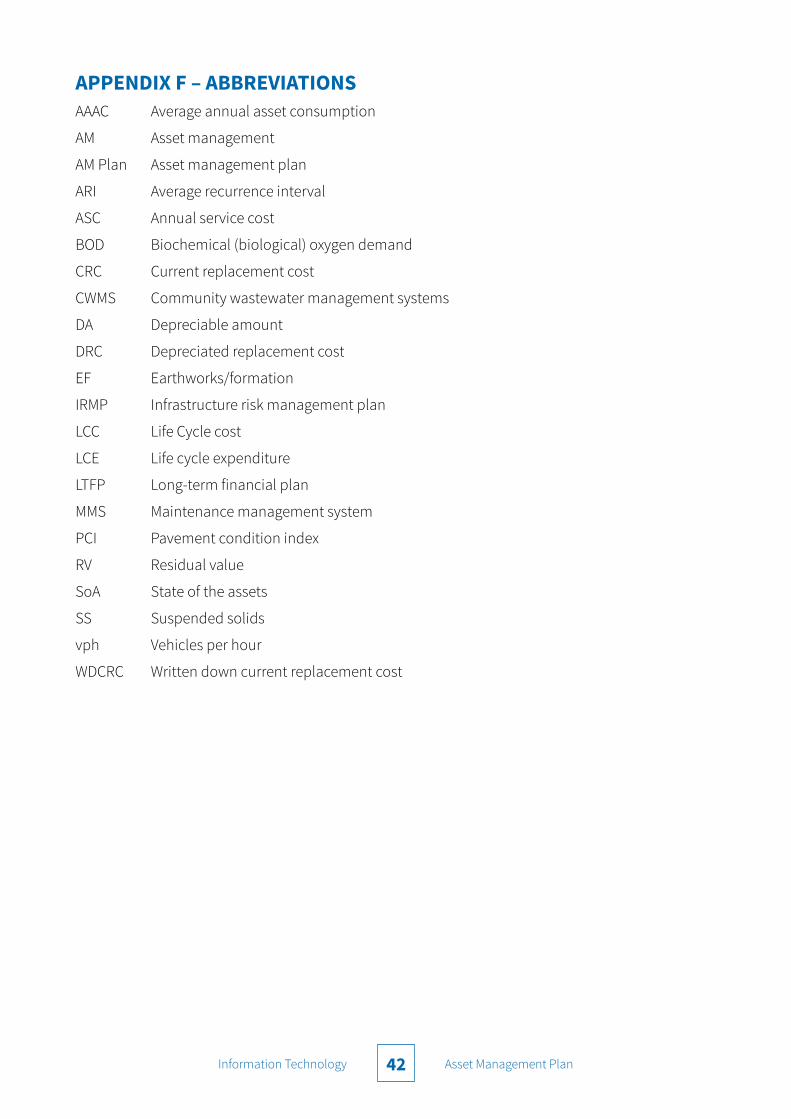
Information Technology Asset Management Plan42
APPENDIX F – ABBREVIATIONSAAAC Average annual asset consumption
AM Asset management
AM Plan Asset management plan
ARI Average recurrence interval
ASC Annual service cost
BOD Biochemical (biological) oxygen demand
CRC Current replacement cost
CWMS Community wastewater management systems
DA Depreciable amount
DRC Depreciated replacement cost
EF Earthworks/formation
IRMP Infrastructure risk management plan
LCC Life Cycle cost
LCE Life cycle expenditure
LTFP Long-term financial plan
MMS Maintenance management system
PCI Pavement condition index
RV Residual value
SoA State of the assets
SS Suspended solids
vph Vehicles per hour
WDCRC Written down current replacement cost

Information Technology Asset Management Plan43
APPENDIX G – GLOSSARYAnnual service cost (ASC)
1) Reporting actual cost
The annual (accrual) cost of providing a service including operations, maintenance, depreciation, finance/opportunity and disposal costs less revenue.
2) For investment analysis and budgeting
An estimate of the cost that would be tendered, per annum, if tenders were called for the supply of a service to a performance specification for a fixed term. The ASC includes operations, maintenance, depreciation, finance/ opportunity and disposal costs, less revenue.
Asset
A resource controlled by an entity as a result of past events and from which future economic benefits are expected to flow to the entity. Infrastructure assets are a sub-class of property, plant and equipment, which are non-current assets with a life greater than 12 months and that enable services to be provided.
Asset category
Sub-group of assets within a class hierarchy for financial reporting and management purposes.
Asset class
A group of assets having a similar nature or function in the operations of an entity, and which, for purposes of disclosure, is shown as a single item without supplementary disclosure.
Asset condition assessment
The process of continuous or periodic inspection, assessment, measurement and interpretation of the resultant data to indicate the condition of a specific asset so as to determine the need for some preventative or remedial action.
Asset hierarchy
A framework for segmenting an asset base into appropriate classifications. The asset hierarchy can be based on asset function or asset type or a combination of the two.
Asset management (AM)
The combination of management, financial, economic, engineering and other practices applied to physical assets with the objective of providing the required level of service in the most cost-effective manner.
Asset renewal funding ratio
The ratio of the net present value of asset renewal funding accommodated over a 10-year period in a LTFP relative to the net present value of projected capital renewal expenditures identified in an asset management plan for the same period [AIFMG Financial Sustainability Indicator No 8].
Average annual asset consumption (AAAC)*
The amount of an organisation’s asset base consumed during a reporting period (generally a year). This may be calculated by dividing the depreciable amount by the useful life (or total future economic benefits/service potential) and totalled for each asset OR by dividing the carrying amount (depreciated replacement cost) by the remaining useful life (or remaining future economic benefits/service potential) and totalled for each asset in an asset category or class.
Borrowings
A borrowing or loan is a contractual obligation of the borrowing entity to deliver cash or another financial asset to the lending entity over a specified period of time or at a specified point in time, to cover both the initial capital provided and the cost of the interest incurred for providing this capital. A borrowing or loan provides the means for the borrowing entity to finance outlays (typically physical assets) when it has insufficient
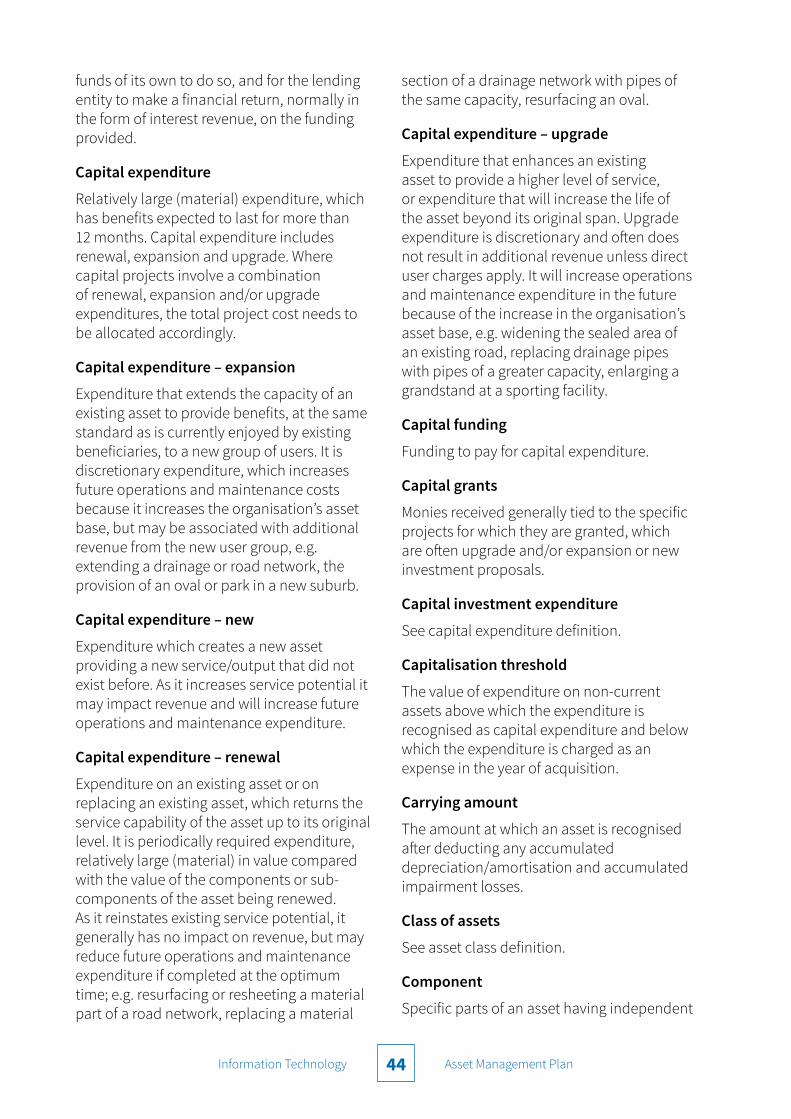
Information Technology Asset Management Plan44
funds of its own to do so, and for the lending entity to make a financial return, normally in the form of interest revenue, on the funding provided.
Capital expenditure
Relatively large (material) expenditure, which has benefits expected to last for more than 12 months. Capital expenditure includes renewal, expansion and upgrade. Where capital projects involve a combination of renewal, expansion and/or upgrade expenditures, the total project cost needs to be allocated accordingly.
Capital expenditure – expansion
Expenditure that extends the capacity of an existing asset to provide benefits, at the same standard as is currently enjoyed by existing beneficiaries, to a new group of users. It is discretionary expenditure, which increases future operations and maintenance costs because it increases the organisation’s asset base, but may be associated with additional revenue from the new user group, e.g. extending a drainage or road network, the provision of an oval or park in a new suburb.
Capital expenditure – new
Expenditure which creates a new asset providing a new service/output that did not exist before. As it increases service potential it may impact revenue and will increase future operations and maintenance expenditure.
Capital expenditure – renewal
Expenditure on an existing asset or on replacing an existing asset, which returns the service capability of the asset up to its original level. It is periodically required expenditure, relatively large (material) in value compared with the value of the components or sub-components of the asset being renewed. As it reinstates existing service potential, it generally has no impact on revenue, but may reduce future operations and maintenance expenditure if completed at the optimum time; e.g. resurfacing or resheeting a material part of a road network, replacing a material
section of a drainage network with pipes of the same capacity, resurfacing an oval.
Capital expenditure – upgrade
Expenditure that enhances an existing asset to provide a higher level of service, or expenditure that will increase the life of the asset beyond its original span. Upgrade expenditure is discretionary and often does not result in additional revenue unless direct user charges apply. It will increase operations and maintenance expenditure in the future because of the increase in the organisation’s asset base, e.g. widening the sealed area of an existing road, replacing drainage pipes with pipes of a greater capacity, enlarging a grandstand at a sporting facility.
Capital funding
Funding to pay for capital expenditure.
Capital grants
Monies received generally tied to the specific projects for which they are granted, which are often upgrade and/or expansion or new investment proposals.
Capital investment expenditure
See capital expenditure definition.
Capitalisation threshold
The value of expenditure on non-current assets above which the expenditure is recognised as capital expenditure and below which the expenditure is charged as an expense in the year of acquisition.
Carrying amount
The amount at which an asset is recognised after deducting any accumulated depreciation/amortisation and accumulated impairment losses.
Class of assets
See asset class definition.
Component
Specific parts of an asset having independent

Information Technology Asset Management Plan45
physical or functional identity and having specific attributes such as different life expectancy, maintenance regimes, risk or criticality.
Core asset management
Asset management which relies primarily on the use of an asset register, maintenance management systems, job resource management, inventory control, condition assessment, simple risk assessment and defined levels of service, in order to establish alternative treatment options and long-term cash flow predictions. Priorities are usually established on the basis of financial return gained by carrying out the work (rather than detailed risk analysis and optimised decision making).
Cost of an asset
The amount of cash or cash equivalents paid or the fair value of the consideration given to acquire an asset at the time of its acquisition or construction, including any costs necessary to place the asset into service. This includes one-off design and project management costs.
Critical assets
Assets for which the financial, business or service level consequences of failure are sufficiently severe to justify proactive inspection and rehabilitation. Critical assets have a lower threshold for action than non¬critical assets.
Current replacement cost (CRC)
The cost the entity would incur to acquire the asset on the reporting date. The cost is measured by reference to the lowest cost at which the gross future economic benefits could be obtained in the normal course of business or the minimum it would cost to replace the existing asset with a technologically up-to-date equivalent new asset (not a second hand one) with the same economic benefits (gross service potential), allowing for any differences in the quantity and quality of output and in operating costs.
Deferred maintenance
The shortfall in rehabilitation work undertaken relative to that required to maintain the service potential of an asset.
Depreciable amount
The cost of an asset, or other amount substituted for its cost, less its residual value.
Depreciated replacement cost (DRC)
The current replacement cost (CRC) of an asset less, where applicable, accumulated depreciation calculated on the basis of such cost to reflect the already consumed or expired future economic benefits of the asset.
Depreciation/amortisation
The systematic allocation of the depreciable amount (service potential) of an asset over its useful life.
Economic life
See useful life definition.
Expenditure
The spending of money on goods and services. Expenditure includes recurrent and capital outlays.
Expenses
Decreases in economic benefits during the accounting period in the form of outflows or depletions of assets or increases in liabilities that result in decreases in equity, other than those relating to distributions to equity participants.
Fair value
The amount for which an asset could be exchanged, or a liability settled, between knowledgeable, willing parties, in an arms-length transaction.
Financing gap
A financing gap exists whenever an entity has insufficient capacity to finance asset renewal and other expenditure necessary to be able to appropriately maintain the range and
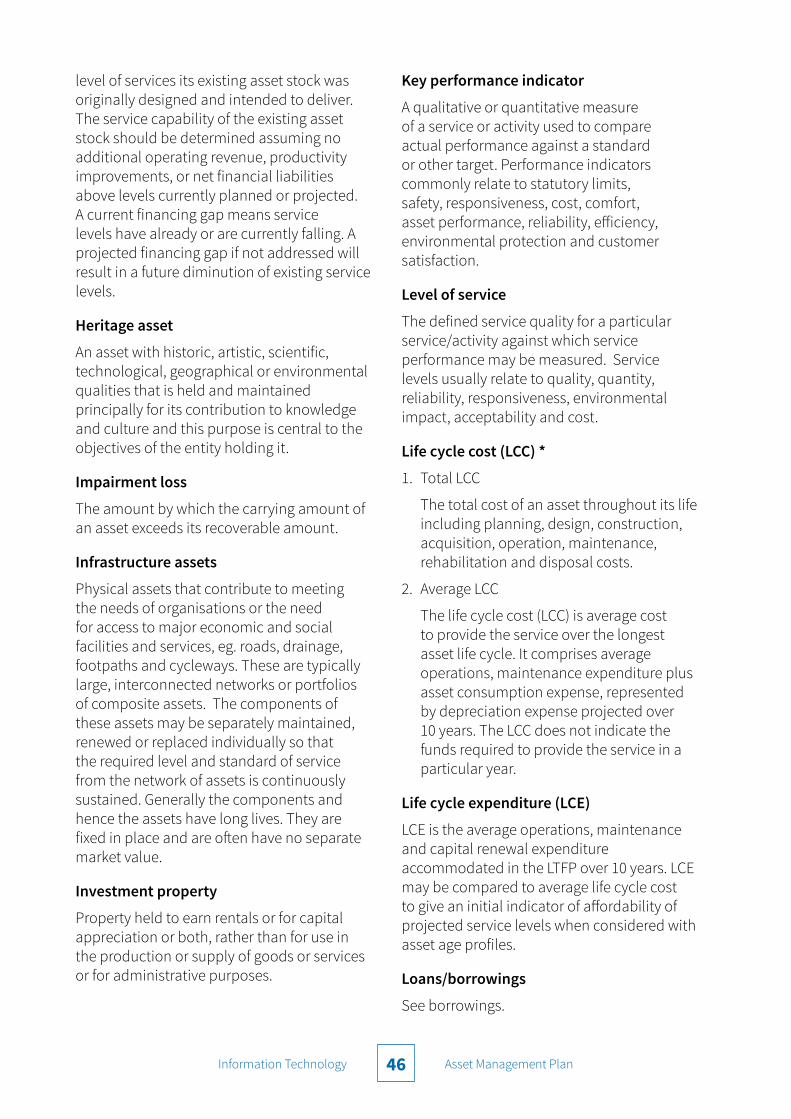
Information Technology Asset Management Plan46
level of services its existing asset stock was originally designed and intended to deliver. The service capability of the existing asset stock should be determined assuming no additional operating revenue, productivity improvements, or net financial liabilities above levels currently planned or projected. A current financing gap means service levels have already or are currently falling. A projected financing gap if not addressed will result in a future diminution of existing service levels.
Heritage asset
An asset with historic, artistic, scientific, technological, geographical or environmental qualities that is held and maintained principally for its contribution to knowledge and culture and this purpose is central to the objectives of the entity holding it.
Impairment loss
The amount by which the carrying amount of an asset exceeds its recoverable amount.
Infrastructure assets
Physical assets that contribute to meeting the needs of organisations or the need for access to major economic and social facilities and services, eg. roads, drainage, footpaths and cycleways. These are typically large, interconnected networks or portfolios of composite assets. The components of these assets may be separately maintained, renewed or replaced individually so that the required level and standard of service from the network of assets is continuously sustained. Generally the components and hence the assets have long lives. They are fixed in place and are often have no separate market value.
Investment property
Property held to earn rentals or for capital appreciation or both, rather than for use in the production or supply of goods or services or for administrative purposes.
Key performance indicator
A qualitative or quantitative measure of a service or activity used to compare actual performance against a standard or other target. Performance indicators commonly relate to statutory limits, safety, responsiveness, cost, comfort, asset performance, reliability, efficiency, environmental protection and customer satisfaction.
Level of service
The defined service quality for a particular service/activity against which service performance may be measured. Service levels usually relate to quality, quantity, reliability, responsiveness, environmental impact, acceptability and cost.
Life cycle cost (LCC) *
1. Total LCC
The total cost of an asset throughout its life including planning, design, construction, acquisition, operation, maintenance, rehabilitation and disposal costs.
2. Average LCC
The life cycle cost (LCC) is average cost to provide the service over the longest asset life cycle. It comprises average operations, maintenance expenditure plus asset consumption expense, represented by depreciation expense projected over 10 years. The LCC does not indicate the funds required to provide the service in a particular year.
Life cycle expenditure (LCE)
LCE is the average operations, maintenance and capital renewal expenditure accommodated in the LTFP over 10 years. LCE may be compared to average life cycle cost to give an initial indicator of affordability of projected service levels when considered with asset age profiles.
Loans/borrowings
See borrowings.
Information Technology Asset Management Plan47
Maintenance
All actions necessary for retaining an asset as near as practicable to an appropriate service condition, including regular day-to-day work necessary to keep assets operating, e.g. road patching, but excluding rehabilitation or renewal. It is operating expenditure required to ensure that the asset reaches its expected useful life.
• Planned maintenance
Repair work that is identified and managed through a maintenance management system (MMS). MMS activities include inspection, assessing the condition against failure/breakdown criteria/experience, prioritising scheduling, actioning the work and reporting what was done to develop a maintenance history and improve maintenance and service delivery performance.
• Reactive maintenance
Unplanned repair work that is carried out in response to service requests and management/ supervisory directions.
• Specific maintenance
Maintenance work to repair components or replace sub-components that need to be identified as a specific maintenance item in the maintenance budget.
• Unplanned maintenance
Corrective work required in the short term to restore an asset to working condition so it can continue to deliver the required service or to maintain its level of security and integrity.
Maintenance expenditure*
Recurrent expenditure, which is periodically or regularly required as part of the anticipated schedule of works required to ensure that the asset achieves its useful life and provides the required level of service. It is expenditure which was anticipated in determining the asset’s useful life.
Materiality
The notion of materiality guides the margin of error acceptable, the degree of precision required and the extent of the disclosure required when preparing general purpose financial reports. Information is material if its omission, mis-statement or non-disclosure has the potential, individually or collectively, to influence the economic decisions of users taken on the basis of the financial report or affect the discharge of accountability by the management or governing body of the entity.
Modern equivalent asset
Assets that replicate what is in existence with the most cost-effective asset performing the same level of service. It is the most cost-efficient, currently available asset which will provide the same stream of services as the existing asset. It allows for technology changes and, improvements and efficiencies in production and installation techniques.
Net present value (NPV)
The value to the organisation of the cash flows associated with an asset, liability, activity or event, calculated using a discount rate to reflect the time value of money. It is the net amount of discounted total cash inflows after deducting the value of the discounted total cash outflows arising from e.g. the continued use and subsequent disposal of the asset after deducting the value of the discounted total cash outflows.
Non-revenue generating investments
Investments for the provision of goods and services to sustain or improve services to the community that are not expected to generate any savings or revenue to the Council, e.g. parks and playgrounds, footpaths, roads and bridges, libraries, etc.
Operations
Regular activities to provide services, such as public health, safety and amenity, e.g. street sweeping, grass mowing and street lighting.

Information Technology Asset Management Plan48
Operating expenditure
Recurrent expenditure required to provide a service. In common use the term typically includes, power, fuel, staff, plant equipment, on-costs and overheads but excludes maintenance and depreciation. Maintenance and depreciation is included in operating expenses.
Operating expense
The gross outflow of economic benefits, being cash and non-cash items, during the period arising in the course of ordinary activities of an entity when those outflows result in decreases in equity, other than decreases relating to distributions to equity participants.
Operating expenses
Recurrent expenses for providing a service, including power, fuel, staff, plant equipment, maintenance, depreciation, on-costs and overheads.
Operations, maintenance and renewal financing ratio
Ratio of estimated budget to projected expenditure for operations, maintenance and renewal of assets over a defined time (e.g. 5, 10 and 15 years).
Operations, maintenance and renewal gap
Difference between budgeted expenditures in a LTFP (or estimated future budgets in absence of LTFP) and projected expenditures for operations, maintenance and renewal of assets to achieve/maintain specified service levels, totalled over a defined time (e.g. 5, 10 and 15 years).
Pavement management system (PMS)
A systematic process for measuring and predicting the condition of road pavements and wearing surfaces over time and recommending corrective actions.
PMS Score
A measure of condition of a road segment determined from a pavement management
system.
Ratio of annual asset consumption*
The ratio of annual asset consumption relative to the depreciable amount of the assets. It measures the amount of the consumable parts of assets that are consumed in a period (depreciation) expressed as a percentage of the depreciable amount.
Ratio of annual asset renewal*
The ratio of asset renewal and replacement expenditure relative to depreciable amount for a period. It measures whether assets are being replaced at the rate they are wearing out with capital renewal expenditure expressed as a percentage of depreciable amount (capital renewal expenditure/DA).
Ratio of annual asset upgrade/new*
A measure of the rate at which assets are being upgraded and expanded per annum with capital upgrade/new expenditure expressed as a percentage of depreciable amount (capital upgrade/expansion expenditure/DA).
Recoverable amount
The higher amount of an asset’s fair value, less costs, to sell as opposed to its value to remain in use.
Recurrent expenditure
Relatively small (immaterial) expenditure or that which has benefits expected to last less than 12 months. Recurrent expenditure includes operations and maintenance expenditure.
Recurrent funding
Funding to pay for recurrent expenditure.
Rehabilitation
See capital renewal expenditure definition above.
Information Technology Asset Management Plan49
Remaining useful life
The time remaining until an asset ceases to provide the required service level or economic usefulness. Age plus remaining useful life is useful life.
Renewal
See capital renewal expenditure definition above.
Residual value
The estimated amount that an entity would currently obtain from disposal of the asset, after deducting the estimated costs of disposal, if the asset were already of the age and in the condition expected at the end of its useful life.
Revenue generating investments
Investments for the provision of goods and services to sustain or improve services to the community that are expected to generate some savings or revenue to offset operating costs; e.g. public halls and theatres, childcare centres, sporting and recreation facilities, tourist information centres, etc.
Risk management
The application of a formal process to the range of possible values relating to key factors associated with a risk in order to determine the resultant ranges of outcomes and their probability of occurrence.
Section or segment
A self-contained part or piece of an infrastructure asset.
Service potential
The total future service capacity of an asset. It is normally determined by reference to the operating capacity and economic life of an asset. A measure of service potential is used in the not-for-profit sector/public sector to value assets, particularly those not producing a cash flow.
Service potential remaining
A measure of the future economic benefits remaining in assets. It may be expressed in dollar values (fair value) or as a percentage of total anticipated future economic benefits. It is also a measure of the percentage of the asset’s potential to provide services. (Depreciated replacement cost/depreciable amount).
Specific maintenance
Replacement of higher value components/sub-components of assets that is undertaken on a regular cycle, including repainting, replacement of air conditioning equipment, etc. This work generally falls below the capital/ maintenance threshold and needs to be identified in a specific maintenance budget allocation.
Strategic longer-term plan
A plan covering the term of office of councillors (4 years minimum), reflecting the needs of the community for the foreseeable future. It brings together the detailed requirements in Council’s longer-term plans such as the AM plans and the LTFP. The plan is prepared in consultation with the community and details where the Council is at that point in time, where it wants to go, how it is going to get there, mechanisms for monitoring the achievement of the outcomes and how the plan will be resourced.
Sub-component
Smaller individual parts that make up a component part.
Useful life
Either:
(a) the period over which an asset is expected to be available for use by an entity, or
(b) the number of production or similar units expected to be obtained from the asset by the entity.
It is the estimated or expected time between placing the asset into service and removing
Information Technology Asset Management Plan50
it from service, or the estimated period of time over which the future economic benefits embodied in a depreciable asset, are expected to be consumed by Council.
Value in use
The present value of future cash flows expected to be derived from an asset or cash generating unit. It is deemed to be depreciated replacement cost (DRC) for those assets whose future economic benefits are not primarily dependent on the asset’s ability to generate net cash inflows, where the entity would, if deprived of the asset, replace its remaining future economic benefits.
Source: IPWEA, 2009, Glossary
Additional and modified glossary items shown*.


571 Montague Road, Modbury 5092 PO Box 571, Modbury 5092
Telephone 08 8397 7444 cttg.sa.gov.au