Advanced information extraction by example
169
HAL Id: tel-03194624 https://pastel.archives-ouvertes.fr/tel-03194624 Submitted on 9 Apr 2021 HAL is a multi-disciplinary open access archive for the deposit and dissemination of sci- entific research documents, whether they are pub- lished or not. The documents may come from teaching and research institutions in France or abroad, or from public or private research centers. L’archive ouverte pluridisciplinaire HAL, est destinée au dépôt et à la diffusion de documents scientifiques de niveau recherche, publiés ou non, émanant des établissements d’enseignement et de recherche français ou étrangers, des laboratoires publics ou privés. Advanced information extraction by example Ngurah Agus Sanjaya Er To cite this version: Ngurah Agus Sanjaya Er. Advanced information extraction by example. Information Retrieval [cs.IR]. Télécom ParisTech, 2018. English. NNT: 2018ENST0060. tel-03194624
-
Upload
khangminh22 -
Category
Documents
-
view
3 -
download
0
Transcript of Advanced information extraction by example

HAL Id: tel-03194624https://pastel.archives-ouvertes.fr/tel-03194624
Submitted on 9 Apr 2021
HAL is a multi-disciplinary open accessarchive for the deposit and dissemination of sci-entific research documents, whether they are pub-lished or not. The documents may come fromteaching and research institutions in France orabroad, or from public or private research centers.
L’archive ouverte pluridisciplinaire HAL, estdestinée au dépôt et à la diffusion de documentsscientifiques de niveau recherche, publiés ou non,émanant des établissements d’enseignement et derecherche français ou étrangers, des laboratoirespublics ou privés.
Advanced information extraction by exampleNgurah Agus Sanjaya Er
To cite this version:Ngurah Agus Sanjaya Er. Advanced information extraction by example. Information Retrieval [cs.IR].Télécom ParisTech, 2018. English. �NNT : 2018ENST0060�. �tel-03194624�

THÈSE
2018-ENST-0060
EDITE - ED 130
Doctorat ParisTech
T H È S Epour obtenir le grade de docteur délivré par
TELECOM ParisTech
Spécialité “Informatique et Réseaux”
présentée et soutenue publiquement par
Ngurah Agus Sanjaya ERle 17 Décembre 2018
Techniques avancées
pour l’extraction d’information par l’exemple
JuryMme. Salima BENBERNOU, Professeur, Université Paris Descartes ExaminateurM. Ismail KHALIL, Professor, Johannes Kepler University RapporteurM. Pierre SENELLART, Professeur, École normale supérieure ExaminateurMme. Genoveva VARGAS-SOLAR, Chargé de recherche (HDR), CNRS RapporteurM. Talel ABDESSALEM, Professeur, Télécom ParisTech Directeur de thèseM. Stéphane BRESSAN, Associate Professor, National University of Singapore Co-directeur de thèse
TELECOM ParisTechécole de l’Institut Mines-Télécom - membre de ParisTech
46 rue Barrault 75013 Paris - (+33) 1 45 81 77 77 - www.telecom-paristech.fr


Abstract
Searching for information on the Web is generally achieved by constructing a queryfrom a set of keywords and firing it to a search engine. This traditional methodrequires the user to have a relatively good knowledge of the domain of the targetedinformation to come up with the correct keywords. The search results, in the formof Web pages, are ranked based on the relevancy of each Web page to the givenkeywords. For the same set of keywords, the Web pages returned by the searchengine would be ranked di�erently depending on the user. Moreover, finding specificinformation such as a country and its capital city would require the user to browsethrough all the documents and reading its content manually. This is not only timeconsuming but also requires a great deal of e�ort. We address in this thesis analternative method of searching for information, i.e. by giving examples of theinformation in question. First, we try to improve the accuracy of the search byexample systems by expanding the given examples syntactically. Next, we use truthdiscovery paradigm to rank the returned query results. Finally, we investigate thepossibility of expanding the examples semantically through labelling each group ofelements of the examples.
We begin with the problem of the set of tuples expansion by example. Setexpansion deals with the problem of expanding a set given a set of examples of itsmembers. Existing approaches mostly consider sets of atomic data. In the relationalmodel, relation instances in first normal form are not sets of atomic values butrather are sets of tuples of atomic values. We extend the idea of set expansion tothe expansion of sets of tuples, that is of relation instances or tables. Our approachenables the extraction of relation instances from the Web given a handful set ofexample tuples. For instance, when a user inputs the set of tuples < Indonesia,Jakarta, IDR>, <China, Beijing, CYN>, <Canada, Ottawa, CAD> the systemthat we have implemented returns relational instances composed of countries withtheir corresponding capital cities and currency codes.
Both set and set of tuples expansions require a ranking mechanism to present themost relevant candidates to the user. Such ranking mechanism typically analyses theheterogeneous graph of sources, seeds, wrappers, attributes, ontological information,and candidates, to automatically select the relevant candidates, or as we call them,true candidates. We propose of harnessing the truth finding algorithm as a possiblemethod of finding the true candidates among all candidates extracted by the set oftuples expansion system. We empirically and comparatively evaluate the accuracyof several di�erent state-of-the-art truth finding algorithms with several cases ofthe set of tuples expansion. From the result of the experiments, we find that the
iii

Accu algorithm achieves the best performance. Accu also outperforms the classicalranking method based on lazy walk process on the heterogeneous graph typicallyapplied by set expansion systems.
Web documents which contain information in the form of n-elements (n > 2)tuples rarely exist, while on the other hand, binary tuples are common to be found.We propose here the task of tuple reconstruction which leverages the binary tuplesto reconstruct n-elements tuples. Starting with the given seeds of n-elements tuples,we break each tuple into binary ones by introducing the key element concept of atuple on which the remaining elements depend on. We then search the Web tofind and extract other binary tuples which have the same relation as the ones wehave generated previously from the set of examples by leveraging the set of tuplesexpansion. Next, we reconstruct n-elements tuples from these extracted binarytuples. The tuple reconstruction task provides a method of discovering n-elementstuples which set of tuples expansion system fail to retrieve.
Each group of elements in the given set of examples describes a semantic class.However, the label of each semantic class of the seeds is unknown a priori. Havingthe labels of the semantic classes may help in expanding the set of examples itselfas well as identifying the true member of the class. Following this intuition, as thefirst work, we leverage the topic labelling approach to label groups of elements ofthe given examples. We argue here that the set of examples can be viewed as thetop-N words of a topic model. We generate the candidate labels from the categoriesassigned in documents returned as the search result when querying an ontology usingthe set of words. We then again rely on truth finding algorithms to map each wordto the best label. To label the topic, we select the label from each correspondinglabel of its top-N words.
Finally, we propose the task of set labelling where we start from some examplemembers of a set and then infer the most appropriate labels for the given set ofterms or words. We illustrate the task and a possible solution with an applicationto the classification of cosmetic products and hotels. The novel solution proposedin this research is to incorporate a multi-label classifier trained from the labelleddatasets. The multi-label classifier is responsible for retrieving the relevant labelsfor a given input. We use vectorization of the description of the data as input to theclassifier as well as labels assigned to it. Given a previously unseen data, the trainedclassifier then returns a ranked list of candidate labels (i.e., additional seeds) for theset. These results could then be used to infer the labels for the set.
Keywords: set of tuples expansion, ranking, graph of entities, truth finding, setlabelling, topic labelling

Résumé
La recherche d’information sur le Web requiert généralement la création d’une re-quête à partir d’un ensemble de mots-clés et sa soumission à un moteur de recherche.Le résultat de la recherche, qui est une liste de pages Web, est trié en fonction dela pertinence de chaque page par rapport aux mots clés donnés. Cette méthodeclassique nécessite de l’utilisateur une connaissance relativement bonne du domainede l’information ciblée afin de trouver les bons mots-clés. étant donnée une mêmerequête, i.e. une liste de mots-clés, les pages renvoyées par le moteur de rechercheseraient classées di�éremment selon l’utilisateur. Sous un autre angle, la recherched’informations très précises telles que celle d’un pays et de sa capitale obligerait, sansdoute, l’utilisateur à parcourir tous les documents retournés et à lire chaque contenumanuellement. Cela prend non seulement du temps, mais exige également beaucoupd’e�orts. Nous abordons dans cette thèse une méthode alternative de recherched’informations, c’est-à-dire une méthode qui consiste à des exemples d’informationsrecherchées. Tout d’abord, nous essayons d’améliorer la précision de la recherchedes méthodes existantes en étendant syntaxiquement les exemples donnés. Ensuite,nous utilisons le paradigme de découverte de la vérité pour classer les résultats ren-voyés. Enfin, nous étudions la possibilité d’élargir les exemples sémantiquement enannotant (ou étiquetant) chaque groupe d’éléments dans les exemples.
Nous commençons par le problème de l’extension d’un ensemble de n-upletsdonné en exemple dans une requête de recherche d’information. L’extension d’ensemblestraite le problème de l’élargissement d’une collection à partir d’un ensemble d’exemplesde ses membres. Les approches existantes considèrent principalement des ensemblesde données atomiques. Dans le modèle relationnel, cependant, les instances derelation de la première forme normale ne sont pas des ensembles de valeurs atom-iques, mais plutôt des ensembles de n-uplets de valeurs atomiques. Nous étendonsl’idée d’extension d’ensembles de données atomiques à celle d’ensembles de n-uplets,c’est- à-dire d’instances de relations ou de tables. Notre approche permet l’extractiond’instances de relations à partir du Web, étant donné quelques exemples de n-uplets.Par exemple, lorsqu’un utilisateur entre l’ensemble des n-uplets <Indonésie, Jakarta,IDR>, <Chine, Beijing, CYN>, <Canada, Ottawa, CAD>, le système que nousavons implémenté renvoie des instances relationnelles composées des noms de paysavec leur capitale et les codes de leurs devises.
L’extension d’ensembles et d’ensembles de n-uplets nécessite un mécanisme de tripour pouvoir présenter les candidats (i.e. n-uplets extraits à l’issu de la recherche) lesplus pertinents à l’utilisateur. Un tel mécanisme de classement analyse généralementle graphe hétérogène de sources, d’exemples, d’extracteurs, d’attributs, d’informations
v

ontologiques et de n-uplets candidats, afin de sélectionner automatiquement les can-didats les plus pertinents, ou, comme nous les appelons, les vrais candidats. Nousproposons d’exploiter le paradigme de recherche de la vérité comme méthode possiblepour trouver les vrais candidats parmi tous les candidats extraits par notre systèmed’extension de n-uplets. Nous évaluons de manière empirique et comparative laprécision de plusieurs algorithmes de recherche de vérité populaire sur plusieurs casd’extension de jeu de n-uplets. D’après les résultats des expériences, l’algorithmeAccu obtient les meilleures performances. Accu surpasse également la méthodede classement classique basée sur le processus de marche paresseuse sur le graphehétérogène généralement appliquée par les systèmes d’extension.
Les documents Web contenant des n-uplets de taille supérieure à 2 existentrarement, alors que, par contre, les n-uplets binaires sont fréquents. Nous proposonsici la tâche de reconstruction de n-uplets qui utilise les n-uplets binaires pour re-construire des n-uplets de n éléments. En commençant par les exemples donnés den-uplets à n éléments, nous décomposons chaque n-uplets en binaire en introduisantle concept d’élément clé d’un n-uplets dont dépend les éléments restants. Nous cher-chons ensuite sur le Web pour trouver et extraire d’autres n-uplets binaires ayant lamême relation que ceux que nous avons générés précédemment à partir de la séried’exemples en tirant parti de l’expansion de la série de n-uplets. Ensuite, nous re-construisons des n-uplets à n-éléments à partir de ces n-uplets binaires extraits. Latâche de reconstruction de n-uplets fournit une méthode de découverte des n-upletsde n éléments que le système d’extension de n-uplets, présenté précédemment, neparvient pas à récupérer.
Chaque groupe d’éléments dans l’ensemble donné d’exemples décrit une classesémantique. Cependant, l’étiquette de chaque classe sémantique des exemples estinconnue à priori. Avoir les étiquettes des classes sémantiques peut aider à étendrel’ensemble des exemples plus aisément et à identifier le membre réel de la classe.Suite à cette intuition, et en tant que premier travail, nous exploitons l’approched’étiquetage sur sujet (ou « topic labelling » en anglais) pour étiqueter des groupesd’éléments des exemples donnés. Nous soutenons ici que l’ensemble d’exemples peutêtre considéré comme les N premiers mots d’un modèle de sujet. Nous générons lesétiquettes candidates à partir des catégories attribuées dans les documents renvoyéscomme résultat de la recherche lors de l’interrogation d’une ontologie à l’aide del’ensemble des mots. Nous nous basons ensuite sur des algorithmes de recherche dela vérité pour faire correspondre à chaque mot la meilleure étiquette. Enfin, pourtrouver le bon le sujet pour chaque valeur, nous sélectionnons l’étiquette correspon-dante à ses N premiers mots.
Enfin, nous proposons la tâche d’étiquetage d’ensembles, en partant de quelquesexemples puis en déduisant les étiquettes les plus appropriées pour cet ensemble determes ou de mots. Nous illustrons la tâche et une solution possible avec une appli-cation à la classification des produits cosmétiques et des hôtels. La nouvelle solutionproposée dans cette recherche consiste à incorporer un classifieur multi-étiquettesentrainé à partir de jeux de données étiquetées. Le classifieur multi-étiquettes estchargé de récupérer les étiquettes pertinentes pour une entrée donnée. Nous util-isons la vectorisation de la description des données en entrée du classifieur ainsi que

les étiquettes qui lui sont attribuées. En se basant sur des données nouvelles (i.e.non encore lues), le classifieur entraîné retourne ensuite une liste classée d’étiquettescandidates (c’est-à-dire des exemples supplémentaires) pour l’ensemble. Ces résul-tats pourraient ensuite être utilisés pour déduire les étiquettes de l’ensemble.
Mots-clés: extension de n-uplets, tri, graphe des entités, recherche de la vérité,annotation d’ensembles, étiquetage de sujets


Contents
Contents ix
List of Figures xiii
List of Tables xv
Acknowledgements xvii
1 Introduction 11.1 Motivations . . . . . . . . . . . . . . . . . . . . . . . . . . . . . . . . 21.2 Contributions . . . . . . . . . . . . . . . . . . . . . . . . . . . . . . . 41.3 Outline of the Thesis . . . . . . . . . . . . . . . . . . . . . . . . . . . 6
2 Related Work 72.1 Automatic Information Extraction . . . . . . . . . . . . . . . . . . . . 7
2.1.1 Taxonomy Based on Data Source . . . . . . . . . . . . . . . . 72.1.2 Taxonomy Based on Degree of Automation of the Process . . 10
2.2 Set Expansion . . . . . . . . . . . . . . . . . . . . . . . . . . . . . . . 122.2.1 Taxonomy Based on Data Source . . . . . . . . . . . . . . . . 122.2.2 Taxonomy Based on Target Relations . . . . . . . . . . . . . . 132.2.3 Taxonomy Based on Pattern Construction . . . . . . . . . . . 132.2.4 Taxonomy Based on Ranking Mechanism . . . . . . . . . . . . 18
2.3 Truth Finding . . . . . . . . . . . . . . . . . . . . . . . . . . . . . . . 202.3.1 Taxonomy of Truth Finding Approach . . . . . . . . . . . . . 202.3.2 Ensemble Approach . . . . . . . . . . . . . . . . . . . . . . . . 22
2.4 Topic Labelling . . . . . . . . . . . . . . . . . . . . . . . . . . . . . . 222.5 Multi-label Classification . . . . . . . . . . . . . . . . . . . . . . . . . 24
I Finding the Truth in Set of Tuples Expansion 27
3 Set of Tuples Expansion 293.1 Problem Definition . . . . . . . . . . . . . . . . . . . . . . . . . . . . 303.2 Proposed Approach . . . . . . . . . . . . . . . . . . . . . . . . . . . . 30
3.2.1 Crawling . . . . . . . . . . . . . . . . . . . . . . . . . . . . . . 303.2.2 Wrapper Generation and Candidates Extraction . . . . . . . . 31
ix

3.2.3 Ranking . . . . . . . . . . . . . . . . . . . . . . . . . . . . . . 363.3 Performance Evaluation . . . . . . . . . . . . . . . . . . . . . . . . . 40
3.3.1 Experiment Setting . . . . . . . . . . . . . . . . . . . . . . . . 403.3.2 Result and Discussion . . . . . . . . . . . . . . . . . . . . . . 41
3.4 Comparison with state-of-the-art . . . . . . . . . . . . . . . . . . . . 463.5 Conclusion . . . . . . . . . . . . . . . . . . . . . . . . . . . . . . . . . 47
4 Truthfulness in Set of Tuples Expansion 494.1 Problem Definition . . . . . . . . . . . . . . . . . . . . . . . . . . . . 494.2 Proposed Approach . . . . . . . . . . . . . . . . . . . . . . . . . . . . 514.3 Performance Evaluation . . . . . . . . . . . . . . . . . . . . . . . . . 53
4.3.1 Experiment Setting . . . . . . . . . . . . . . . . . . . . . . . . 534.3.2 Result and Discussion . . . . . . . . . . . . . . . . . . . . . . 57
4.4 Conclusion . . . . . . . . . . . . . . . . . . . . . . . . . . . . . . . . . 61
5 Tuple Reconstruction 635.1 Problem Definition . . . . . . . . . . . . . . . . . . . . . . . . . . . . 645.2 Proposed Approach . . . . . . . . . . . . . . . . . . . . . . . . . . . . 665.3 Performance Evaluation . . . . . . . . . . . . . . . . . . . . . . . . . 70
5.3.1 Experiment Setting . . . . . . . . . . . . . . . . . . . . . . . . 715.3.2 Result and Discussion . . . . . . . . . . . . . . . . . . . . . . 73
5.4 Conclusion . . . . . . . . . . . . . . . . . . . . . . . . . . . . . . . . . 75
II Expanding the Set of Examples Semantically 77
6 Topic Labelling with Truth Finding 796.1 Introduction . . . . . . . . . . . . . . . . . . . . . . . . . . . . . . . . 796.2 Problem Definition . . . . . . . . . . . . . . . . . . . . . . . . . . . . 806.3 Proposed Approach . . . . . . . . . . . . . . . . . . . . . . . . . . . . 81
6.3.1 Generating Candidate Labels . . . . . . . . . . . . . . . . . . 816.3.2 Ranking the Labels . . . . . . . . . . . . . . . . . . . . . . . . 82
6.4 Performance Evaluation . . . . . . . . . . . . . . . . . . . . . . . . . 866.4.1 Experiment Setting . . . . . . . . . . . . . . . . . . . . . . . . 866.4.2 Experiments . . . . . . . . . . . . . . . . . . . . . . . . . . . . 876.4.3 Result and Discussion . . . . . . . . . . . . . . . . . . . . . . 88
6.5 Conclusion . . . . . . . . . . . . . . . . . . . . . . . . . . . . . . . . . 92
7 Set Labelling using Multi-label Classification 937.1 Introduction . . . . . . . . . . . . . . . . . . . . . . . . . . . . . . . . 937.2 Problem Definition . . . . . . . . . . . . . . . . . . . . . . . . . . . . 947.3 Proposed Approach . . . . . . . . . . . . . . . . . . . . . . . . . . . . 94
7.3.1 Training Process . . . . . . . . . . . . . . . . . . . . . . . . . 957.3.2 User Interaction . . . . . . . . . . . . . . . . . . . . . . . . . . 95
7.4 Performance Evaluation . . . . . . . . . . . . . . . . . . . . . . . . . 967.4.1 Experiment Setting . . . . . . . . . . . . . . . . . . . . . . . . 96

7.4.2 Result and Discussion . . . . . . . . . . . . . . . . . . . . . . 997.5 Conclusion . . . . . . . . . . . . . . . . . . . . . . . . . . . . . . . . . 101
8 Conclusions and Perspectives 1038.1 Conclusive Summary . . . . . . . . . . . . . . . . . . . . . . . . . . . 1038.2 Perspectives . . . . . . . . . . . . . . . . . . . . . . . . . . . . . . . . 105
A Ranking of Sources 107
B Résumé en Français 113B.1 Ensemble d’expansion de n-uplets . . . . . . . . . . . . . . . . . . . . 113
B.1.1 Robot d’aspiration de site Web . . . . . . . . . . . . . . . . . 114B.1.2 Génération de wrappers et extraction de candidats . . . . . . 115B.1.3 Classement . . . . . . . . . . . . . . . . . . . . . . . . . . . . 116B.1.4 Comparaison avec l’état de l’art . . . . . . . . . . . . . . . . . 117
B.2 Vérité dans la série d’expansion de n-uplets . . . . . . . . . . . . . . . 119B.2.1 Définition du problème . . . . . . . . . . . . . . . . . . . . . . 119B.2.2 Approche proposée . . . . . . . . . . . . . . . . . . . . . . . . 121B.2.3 Évaluation des performances . . . . . . . . . . . . . . . . . . . 123
B.3 Reconstruction de n-uplets . . . . . . . . . . . . . . . . . . . . . . . . 123B.3.1 Définition du problème . . . . . . . . . . . . . . . . . . . . . . 125B.3.2 Approche proposée . . . . . . . . . . . . . . . . . . . . . . . . 126B.3.3 Évaluation des performances . . . . . . . . . . . . . . . . . . . 128
B.4 Étiquetage de sujet avec recherche de vérité . . . . . . . . . . . . . . 130B.4.1 Approche proposée . . . . . . . . . . . . . . . . . . . . . . . . 131B.4.2 Évaluation des performances . . . . . . . . . . . . . . . . . . . 132
B.5 Définir l’étiquetage . . . . . . . . . . . . . . . . . . . . . . . . . . . . 133B.5.1 Définition du problème . . . . . . . . . . . . . . . . . . . . . . 134B.5.2 Approche proposée . . . . . . . . . . . . . . . . . . . . . . . . 134B.5.3 Évaluation des performances . . . . . . . . . . . . . . . . . . . 136
B.6 Conclusion . . . . . . . . . . . . . . . . . . . . . . . . . . . . . . . . . 137


List of Figures
2.1 Plate diagram of LDA [1] . . . . . . . . . . . . . . . . . . . . . . . . . 23
3.1 Wrapper generation process . . . . . . . . . . . . . . . . . . . . . . . 313.2 An illustration of the graph of entities . . . . . . . . . . . . . . . . . 39
4.1 Average F-measure scores . . . . . . . . . . . . . . . . . . . . . . . . 57
5.1 Tuple reconstruction illustration . . . . . . . . . . . . . . . . . . . . . 655.2 Graph of entities with reconstructed tuples . . . . . . . . . . . . . . . 71
6.1 n-grams average accuracy comparison for dataset DT1 . . . . . . . . 896.2 Average accuracy of truth discovery algorithms for 2-grams . . . . . . 906.3 Average accuracy of Depen on varying the top-l (l=1, 2, 3, 4, 5) . . . 91
7.1 Flowchart of the system . . . . . . . . . . . . . . . . . . . . . . . . . 947.2 Screenshots of the search engine . . . . . . . . . . . . . . . . . . . . . 100
B.1 Scores moyens de la F-mesure . . . . . . . . . . . . . . . . . . . . . . 124
xiii


List of Tables
1.1 An example of a customer table . . . . . . . . . . . . . . . . . . . . . 2
2.1 The set of seeds used in DIPRE . . . . . . . . . . . . . . . . . . . . . 132.2 A small example of multi-label dataset based on the Yves Rocher set 26
3.1 An example of calculating edit distance of two strings . . . . . . . . . 353.2 The list of entities and relationships of the graph of entities in STEP 383.3 Topics used for performance evaluation in the set of tuples expansion 413.4 Precision of top-K (K = 10, 25, 50, 100, 200, 300, 400) candidates
(OR=Original order, PW=Permutation in wrapper) . . . . . . . . . . 423.5 Recall of top-K (K = 10, 25, 50, 100, 200, 300, 400) candidates
(OR=Original order, PW=Permutation in wrapper) . . . . . . . . . . 433.6 Running time of STEP (in minutes) . . . . . . . . . . . . . . . . . . . 443.7 Performance comparison of DIPRE, Ext. SEAL, and STEP . . . . . 46
4.1 Excerpt of input dataset in AllegatorTrack . . . . . . . . . . . . . . . 534.2 Description of the di�erent topics and corresponding ground truth . . 544.3 Precision measures per-attribute of the di�erent truth finding algo-
rithms . . . . . . . . . . . . . . . . . . . . . . . . . . . . . . . . . . . 554.4 Recall measures per-attribute of the di�erent truth finding algorithms 564.5 Overall precision measures of the di�erent truth finding algorithms . 564.6 Overal recall measures of the di�erent truth finding algorithms . . . . 574.7 Average number of conflicts and sources of the di�erent topics . . . . 584.8 Ranking of sources for topic DT1 - Calling Code . . . . . . . . . . . . 594.9 Correlation of ranking of sources . . . . . . . . . . . . . . . . . . . . . 60
5.1 Topics used for performance evaluation in tuple reconstruction . . . . 725.2 Comparison of Precision, Recall, and F-measure of STEP with and
without tuple reconstruction . . . . . . . . . . . . . . . . . . . . . . . 73
6.1 Excerpt of input for truth discovery algorithms . . . . . . . . . . . . 846.2 Indexes for labels extracted from the same article . . . . . . . . . . . 856.3 Candidate labels generation . . . . . . . . . . . . . . . . . . . . . . . 87
7.1 Yves Rocher & Tripadvisor dataset . . . . . . . . . . . . . . . . . . . 987.2 Comparison of CountVectorizer (CV) and TFIDFVectorizer (TF) . . 997.3 Comparison of TFIDFVectorizer (TF) and doc2vec (DC) . . . . . . . 99
xv

7.4 Set Labelling Accuracy on Yves Rocher Dataset . . . . . . . . . . . . 101
A.1 Ranking of sources for DT2 . . . . . . . . . . . . . . . . . . . . . . . 107A.2 Ranking of sources for DT3 . . . . . . . . . . . . . . . . . . . . . . . 108A.3 Ranking of sources for DT4 . . . . . . . . . . . . . . . . . . . . . . . 109A.4 Ranking of sources for DT5 . . . . . . . . . . . . . . . . . . . . . . . 110A.5 Ranking of sources for DT6 . . . . . . . . . . . . . . . . . . . . . . . 110A.6 Ranking of sources for DT7 . . . . . . . . . . . . . . . . . . . . . . . 111
B.1 Comparaison des performances de DIPRE, Ext. SEAL, et STEP . . . 117B.2 Extrait du jeu de données en entrée dans AllegatorTrack . . . . . . . 122B.3 Comparaison de la précision, du rappel et de la F-mesure de STEP
avec et sans reconstruction du n-uplet . . . . . . . . . . . . . . . . . . 128

Acknowledgements
This thesis would not have been possible without the support and guidance frommany people during my Ph.D. study. It is now my great pleasure to finally be ableto thank them.
First and foremost, I would like to express my most profound gratitude to mysupervisors, Talel Abdessalem and Stéphane Bressan for giving me the opportunityto do this Ph.D. research as well as their valuable guidance, continuous support, andgreat patience. They allowed me to pursue my research interests without having alot of restrictions. They have never doubted and always trusted me in my research.They improved my research background through various collaborations and projectswhich I have been involved in.
I would also like to thank the member of my Ph.D. committee, particularly, Gen-oveva Vargas-Solar and Ismail Khalil, for reviewing this thesis; Salima Benbernouand Pierre Senellart for providing valuable insights.
During my Ph.D., I have the privilege of working both in Singapore and Paris.In Paris, I really enjoyed being a member of the DbWeb research group of theDepartment of Computer Science and Networks. The group provides an excellentresearch environment, thus I would like to thank Albert Bifet, Fabian M. Suchanek,Antoine Amarilli, Marie Al-Ghossein, and Atef Shaar. In Singapore, I conductedmy research in the Database Research Lab at School of Computing Sciences in theNational University of Singapore (NUS). Thanks to all members of the group fortheir invaluable discussions and friendships especially Ashish Dandekar, DebabrotaBasu, Remmy Zen, Naheed Arafat, and Fajrian Yunus.
My acknowledgements also go to colleagues with whom I had the chance tocollaborate in other contexts. I have to thank Mouhamadou Lamine Ba for our col-laboration in incorporating truth discovery with my work in information extractionand your insights regarding this thesis. I would also like to thank Jesse Read forthe valuable discussions on multi-label classification.
Last but not least, I have to be grateful to my family. In particular, I wouldlike to dedicate this thesis to my dearest wife, Novi. This Ph.D. journey is full ofall kinds of obstacles, only with your love and support have I managed to reach theend of the journey. My children, Reswa and Aurelia, may this achievement set anexample for both of you to always do your best. My late father who has taughtme that knowledge is of the utmost importance and paved the way for me to havea good education. My mother who has always given me her great support. Mybrother and sisters, thank you all for the support.
xvii


Chapter 1
Introduction
When the computer industry emerged in the late 1980s, it revolutionised the wayorganisations stored information. Before, any information, be it important or not,must be recorded manually through writings in papers. This method was highlytime-consuming as well as prone to human errors. Moreover, data was highly un-organised, due to the lack of or missing structure of the data, and searching for apiece of information in a stack of papers seemed to be a very impossible task toachieve. The introduction of the database management system with the emergenceof the computer industry changed all that. Storing information still needed humaninteraction but was done very e�ciently through means of easy to use graphicaluser interface and organised into relational tables. For example, in the database ofa retail company, a customer table records all attributes related to customer (name,address, telephone number, etc.) such as shown in Table 1.1. The company mayalso have a purchase table which stores other information detailing the purchasedata (date, item, quantity, amount, etc.). In a table, the attributes are representedas columns, while rows contain instances of data. Each table in the database hasa primary key which is an attribute, or a combination of attributes, that uniquelyidentifies each row in the table. The relationship between the two tables is definedusing the foreign key, a column in the table which links to the primary key in othertables. Searching for any piece of information stored in the database was madepossible using a specifically designed structured query language (SQL) that manip-ulates the relationship between tables. For example, if we want to know what itemsare purchased by a customer, then we have to find the foreign key that links the twotables and select the attributes that we are interested in from the relation.
Since the World Wide Web gained its popularity in the early 1990s and gradu-ally becoming the ultimate source of information, more and more data are presentedon Web pages. The simplest method of presenting data on a Web page is as text.This type of Web page is similar to the traditional paper-based method previouslymentioned. The only di�erence is that it is represented in a Web page thus publiclyavailable via the Internet. A more subtle way of presenting data on Web page isby enclosing the data using specific tags/markups (e.g. <TABLE> </TABLE>or <UL></UL>). An example of such HTML code for the data in Table 1.1 ispresented in Listing 1.1. As we can see, each row in Table 1.1 is transformed into
1

2 CHAPTER 1. INTRODUCTION
a sequence of string starting and ending with the <tr> and </tr> tags. Eachvalue of the column is then bracketed with the <td></td> tags. The HTML codeis then rendered by the Web server and presented to the audience. This type ofWeb page can be categorised as the semi-structured document. A semi-structureddocument is a type of structured data which does not comply with the rules ofrelational databases or data tables but uses special tags or other markers to sep-arate semantic data. Semi-structured data also ensures the hierarchical structureof rows and columns within the data. Each row in the table is enclosed with the<tr></tr>. Inside this tags, a column value of the table is presented by enclosingit with <td></td> tags. Seeking for information on a semi-structured documentsuch as a Web page cannot be achieved easily. One needs to read through the wholepage to find the information needed which is time-consuming and requires exhaus-tive workload. From the point of view of the audience, it is sometimes necessary todownload the data from a Web page and maintain them in a database. This can beviewed as a reverse engineering of the process that is described earlier, which startsfrom a table in a database and ends with the data being presented on a Web page.The need of finding a specific piece of information from the vast amount of Webpages, extracting and maintaining them to a database leads to the introduction ofthe task of information extraction.
Table 1.1: An example of a customer tableCustomer ID First Name Last Name Address CityCust-001 Agus Sanjaya Tukad Melangit DenpasarCust-002 Remy Zen University Town Singapore... ... ... ... ...
1.1 MotivationsThe goal of the information extraction task is to extract specific data from unstruc-tured or semi-structured data. Information extraction on unstructured data or freetext aims at simplifying the text by creating a structured view of the information con-tained in the text. Two popular sub-tasks of information extraction on unstructureddata include Named Entity Recognition (NER) and Relationship Extraction (RE).The former of the two sub-tasks tries to identify information units like names (e.g.person, organisation, location names), numeric (date, money, percent) and temporal(times of day, duration) expressions [2] by leveraging domain-specific knowledge orextracting information from neighboring sentences. For example, in the sentence“Steve Jobs and Steve Wozniak were the co-founders of Apple Inc.”, an NER systemwould identify Steve Jobs and Steve Wozniak as candidates for a person, and AppleInc. as an organisation. Early approaches of named entity recognition were basedon manually crafted rules [3, 4, 5, 6], while more recent studies focus on applyingmachine learning techniques including Conditional Random Fields [7, 8], HiddenMarkov Model [9, 10], Neural Networks and Deep Learning [11, 12]. Relationship

1.1. MOTIVATIONS 3
extraction is related to the task of finding relations between entities, e.g. PERSONworks for ORGANISATION, PERSON was born in LOCATION. From the previousexample of a sentence, an RE system would extract the following relations “SteveJobs works for Apple Inc.”, “Steve Wozniak works for Apple Inc.”. RE systems canbe classified as supervised approach which requires labelled data [13, 14, 15], semi-supervised approach where a few examples of the targeted relation [16, 17, 18, 19]are given, and unsupervised approach which does not require labelled data or ex-amples [20, 21, 22, 23].
Listing 1.1: Customer Data Presented in HTML Code<html><table>
<tr><th>Customer ID</th><th>F i r s t Name</th><th>Last Name</th><th>Address</th><th>City</th>
</ tr><tr>
<td>C≠001</td><td>Agus</td><td>Sanjaya</td><td>Tukad Melangit</td><td>Denpasar</td>
</ tr><tr>
<td>C≠002</td><td>Remmy</td><td>Zen</td><td>Unive r s i ty Town</td><td>Singapore</td>
</ tr><\table><\html>
The set expansion task is a sub-task of information extraction which generally ap-plied on semi-structured documents such as Web pages. This specific type of in-formation extraction task deals with finding elements of a semantic set given someexample members (seeds). Google Sets was a popular Web-based set expansion sys-tem provided by Google Labs and later o�ered in Google Docs Spreadsheet thatsearched the Web to complete a set of examples given by the user. Indeed, whena given user gave the following set of examples <IDR>, <CYN> and <CAD>,Google Sets returned a list of currency codes including <EUR>, <GBP>, <SGD>,<USD>, etc. Existing set expansion approaches mostly only consider sets of atomic

4 CHAPTER 1. INTRODUCTION
data [24, 25, 26, 27] or binary relations [16, 28, 29, 30]. However, in the relationalmodel, relation instances in the first normal form are not sets of atomic values butrather are sets of tuples of atomic values. Several solutions have been proposed toextract tuples from the Web by exploiting the structure of the data [31, 32, 33, 34]but they either require specific knowledge in linguistics, only work if certain struc-tures present in the document, or need human supervision. This motivates us togeneralise the set expansion problem to the set of tuples expansion problem.
1.2 ContributionsIn this thesis, we focus on extracting information in the form of n-ary relations(tuples) from semi-structured data. We refer the task as tuples expansion. In thefirst part of the thesis, we detail our approach that starts with a few examplesof tuples and extends them from the Web syntactically. To rank the candidates,we build a heterogeneous graph and apply a random walk on the graph. We thenturn our attention to the reliability of the extracted candidates and apply a rankingmechanism using truth finding approach as an alternative to the previous rankingmechanism. In the second part of the thesis, we investigate ways of expanding thetuples semantically. To extend the tuples semantically, we need to be able to labelthe semantic class of each element of the tuples. Once the label is acquired, findingother members of the semantic class would be easier to achieve. We summarise ourcontributions as follows.
• Part I: On Finding the Truth in Set of Tuples ExpansionWe start with the definition of the set of tuples expansion task. Given a userseed inputs, for instance, the set of tuples <Indonesia, Jakarta, IndonesianRupiah>, <China, Beijing, Yuan Renminbi>, <Canada, Ottawa, CanadianDollar> the system that we have implemented returns relational instancescomposed of countries with their corresponding capital cities and currencynames. We extend this idea of tuples expansion from set expansion problem.However, generalising the set expansion problem to set of tuples expansionintroduces di�erent challenges in the crawling, wrapper generation and candi-date extraction, as well as the ranking phase.One of the main purposes of the set of tuples expansion is to be able topresent to the user a reliable list of candidate tuples. In Chapter I, we adoptthe ranking mechanism proposed by SEAL [24] on our approach of tuplesexpansion. However, this ranking mechanism is not able to reliably determinethe true values amongst the extracted candidates. Distinguishing amongsttrue and false values in an automated way, usually known as truth finding, is achallenging problem that has been extensively studied in several contexts suchas data integration and fact-checking. Consequently, we propose to incorporatea truth finding algorithm into our expansion process. The goal is to be ableto present the true candidates to the user and achieve better performance interms of precision, recall, and F-measure. We show that using the truth finding

1.2. CONTRIBUTIONS 5
algorithm, our approach achieves better performance in terms of precision,recall, and F-measure than our previous work.
We try to further improve the reliability of the extracted candidates by addingmore knowledge. To achieve this, we propose the task of tuple reconstruction.The goal of the task is to be able to reconstruct reliable tuples from binaryones. Each tuple from the given set of examples has a key element whichall the remaining elements of the tuple is depended on. For example, in theset of examples <Indonesia, Jakarta, Indonesian Rupiah>, <China, Beijing,Yuan Renminbi>, <Canada, Ottawa, Canadian Dollar>, obviously “Indone-sia”, “China”, and “Canada” are the key elements of each tuple. These keyelements are from the semantic class “country”. All remaining elements arevalues that explain some attributes of the country. “Jakarta”, “Beijing”, and“Ottawa” denote the values of the semantic class “capital city”, while “In-donesian Rupiah”, “Yuan Renminbi”, and “Canadian Dollar” are all values ofthe “currency name” class. We split the tuples into two sets of binary tuplesof the form country-capital city and country-currency name. We use the twosets of binary tuples to form queries and try to retrieve other possible binaryrelations from a knowledge base. The extracted binary relations are then usedto reconstruct the tuples.
• Part II: Expanding the Examples SemanticallyIn the second part of the thesis, we explore the possibility of expanding theexamples semantically. First, we leverage topic labelling as a mean to labelthe set of examples. Instead of giving examples member of a semantic set,we consider the top-N words of topics generated by topic models. We arguethat these top-N words can be viewed as members of a semantic class as theyhave found to have strong correlations between them by the topic model. Tocollect candidate labels, we use words of each topic to query an ontology. Theontology then returns a collection of documents with their categories. We usethese documents’ categories as the candidate labels. We then leverage truthfinding algorithms to infer a one-to-one relationship between each word in atopic with the label. The label for each topic is then selected from the labelof its top-N words.
Next, we propose the task of set labelling. The set labelling task consists offinding the most suitable label for a set when given examples of its members.Our approach relies on a multi-label classifier to propose a set of relevantlabels. We apply our approach to cosmetic products and hotel domain. Inboth domains, we use textual data (description of the cosmetic product andreviews of the hotel) as the features to train the classifier. We also takethe labels assigned to each product and hotel as input to the classifier. Forunknown data, we then ask the classifier to propose a set of labels for eachdata and we take the intersection of the two sets of labels as the label for theset.

6 CHAPTER 1. INTRODUCTION
1.3 Outline of the ThesisIn the next chapter, we provide a brief summary of research areas that are relevantto this thesis: information extraction, set expansion, truth finding, topic labelling,and multi-label classification. We discuss only areas of literature where the researchhave intersected with ours in some degree. Chapters 3-6 cover the work we havedone on tuples expansion and investigate the reliability of the extracted candidates.Chapters 6-7 detail our work on expanding the examples semantically. We concludethe thesis and discuss possible future works in Chapter 8. All of these chapterspresent coherent research work and contributions on extracting tuples from theWeb, assessing the reliability of the extracted candidates as well as investigating thepossibility of expanding the examples semantically.
On all projects presented in this thesis, I was the lead researcher. Almost allof the research works have been published on conferences and journal. The workon tuples expansion has been published in iiWAS 2016 [35]. The work we havedone on investigating the reliability of the extracted candidates using truth findingalgorithms was presented in DEXA 2017 [36]. An extended version of the workwith added datasets and experiments appeared in IJWIS 2017 [37]. We showed thework on tuples reconstruction in DASFAA-SeCoP 2018 workshop [38]. Our workon harnessing truth discovery algorithms on the topic labelling problem and setlabelling using multi-label classification have both been submitted to iiWAS 2018and will be published in November of 2018 [39, 40].

Chapter 2
Related Work
This section overviews the related work on automatic information extraction, setexpansion, truth finding, topic labelling, and multi-label classification.
2.1 Automatic Information ExtractionInformation extraction is the task consisting of the extraction of structured data fromunstructured or semi-structured documents. In particular, extraction from Webdocuments generally leverages the HTML structure of Web pages to identify andextract data. The basic assumption here is that the general formatting of the page,and more specifically its HTML formatting, reflects the structure of the informationthat it contains and presents. A wrapper ’s job is to extract the data containedin the Web pages. There have been many solutions proposed by researchers oninformation extraction. The solutions can be classified according to the data sourceand the degree of automation involved in the process.
2.1.1 Taxonomy Based on Data SourceInformation extraction (IE) has been applied to di�erent sources of data, includingemails [41, 42, 43], Web documents [44, 45, 46, 47, 48], and para-relational data [49,27, 50].
Zhang et al. [41] present an approach to extract structured data from emails.The repetitive structures of emails are used to induce the templates. The contentof the email which is not part of the templates is then annotated for its semantictype. Types which are common such as dates, address, price, etc. are pre-annotatedusing existing annotators. Text without any pre-annotated type associated withit is then classified as a product name or not. The classification task is done byimplementing a weak classifier using Conditional Random Fields and then applyingthe Expectation-Maximization algorithm. In [42], Sheng et al. propose Juicer whichis a framework for extracting information from large-scale email service. It achievesthe goal without hurting the privacy of the users. Juicer learns from a representativesample of emails by clustering them based on templates from which the emails areinstantiated (purchase receipts, bills, hotel reservations, etc.). Juicer then applied
7

8 CHAPTER 2. RELATED WORK
a set of classifiers as well as field extractors for each cluster. The result of thislearning process is then aggregated into a set of static rules. This set of staticrules is then used online for extracting the needed information from newly arrivedemails. Mahlawi et al. [43] propose a novel approach to extract structured datafrom emails about a specific domain. The data extraction process consists of severalsub-processes including keyword extraction, sentiment analysis, regular expressionextraction, entity extraction, and summary extraction. Keywords in the email areextracted based on the word frequency analysis with refers to the individual emailas well as the whole corpus. The sentiment analysis process leverages a dictionarycorpus to evaluate the sentiment value of each email. Predefined regular expressionsare used to extract important information such as the email of the sender andreceiver, date, URL, and phone number. To extract entities from the email, it usesPOS tagging technique. From the result of the POS tagging, common nouns areremoved while the rest of the nouns are identified as entities. To summarise thecontent of the email, the authors build a graph using sentences as the vertices. Iftwo sentences are overlapped in terms of content or have semantic similarity, an edgeis drawn between the two vertices representing the words. The number of inboundedges is used to rank the vertices. The summary is extracted from the graph as themost important vertex and its corresponding edges.
Information extraction systems which extract information from Web documentsassume that the collection of Web pages in the targeted domain are generated fromthe same unknown template. ExAlg [44] based its approach of extracting databasevalues from the Web on this assumption. This unknown template is responsible fortransforming the database values to a scripting language that is accepted by theserver to render the Web page. Thus, given a set of template-generated Web pages,the algorithm then tries to deduce the template that is used to generate the Webpages in the first place. Once the template is deduced, the database values encodedcan be easily extracted from the Web page. ObjectRunner [45], on the other hand,allows the user to freely specify the targeted data in the form of a Structured ObjectDescription (SOD). A SOD consists of atomic entities and its type (set or tuple).For example, a book object can be specified as a tuple type SOD composed of threetype of entities: title, author, and price. Each type of entity has a specific recognizerwhich is simply a regular expression. Based on the specified SOD and a corpusof Web pages, ObjectRunner builds the wrapper to extract the possible instancesof the given SOD. Textual information extracted along with the structured datais stored in a repository for future query. Both of the previous approaches can beapplied to any domain, but others focus on a very specific domain. DEXTER [46]specialises on finding product sites on the Web, detecting, and extracting productspecifications from these sites. Starting with a small set of seed Web pages fromlarge and popular Websites, DEXTER iteratively finds new Websites which publishthe product specifications. Each of the product in the seed Web pages is used asthe query to the search engine. DEXTER then produces two rankings of the Web-sites. First, the retrieved Websites are then ranked based on the number of timeseach Website is present in the results. From the search results, DEXTER identifieshubs and analyses the backlinks of the hubs to give more score to relevant Websites

2.1. AUTOMATIC INFORMATION EXTRACTION 9
and produces the second ranking. The two rankings are then combined based onunion and intersection to produce the final ranking of Websites. To detect productspecifications Websites as well as to locate product category entry pages and indexpages, DEXTER trains a classifier using the anchor text of the links in the homepage as the features. Another classifier is trained to detect the portion of the Webpage which contains the product specifications. The features used for training in-clude the number of links, number of items, the size of the text, etc. To extractattribute-value pairs from the specifications, DEXTER implements a heuristic ap-proach to find common HTML structures from di�erent specifications and combinesthis with pattern inference extraction based on noisy annotations. Although ExAlg,ObjectRunner, and DEXTER have been proved to achieve their respective goals,they do not take into consideration the large volume of the Web. DIADEM [47]is a system that can automatically extract large scale (thousands of Websites) ofstructured data. To explore Websites, identify structured data, and induce wrapperautomatically, DIADEM incorporates phenomenological and ontological knowledge.This phenomenological knowledge enables DIADEM to understand that, for exam-ple, some attributes are necessary or some values of the attributes are just wild cardsfor form filling. The ontological knowledge, on the other hand, helps DIADEM torecognize domain schema as well as the entity recognizers for each of the schematype taking into account the Web sites’ appearance. The adaptability of DIADEMto various Websites is made possible by the self-adaptive network of relational trans-ducers implemented in each of the components of DIADEM. Previous knowledge ofa Web site is used to rearrange the order of execution of the transducers or to re-act to some specific exceptions. To e�ciently extract information from the Web,IE systems need to avoid visiting unimportant Web pages. Unfortunately, most ofthe approaches to IE implement the conventional crawling technique of using searchengines. ACEBot (Adaptive Crawler Bot for Data Extraction) [48] is an intelligentcrawling technique to find only important Web pages with content-rich areas. In thelearning phase, ACEBot first derives the DOM tree of the pages. It then establishesconnections between the pages based on the root-to-link paths of the DOM tree.Each of these paths may or may not lead to important Web pages, i.e. pages withrich content. The paths are then ranked based on its importance. The most impor-tant path is selected to navigate the crawling process and ACEBot then performsmassive downloading from the targeted Web pages.
Recently, information extraction has also been applied to para-relational data.This data type refers to nearly relational data with the characteristics of relationaldata but di�ers in terms of formatting, for example, spreadsheets [49] and dia-grams [50]. In [49], Chen et al. propose Senbazuru which is a prototype spreadsheetdatabase management system. Senbazuru allows the user to extract relational datafrom a large collection of spreadsheets. The collection of spreadsheets is indexedbased on the text contained. When a user query arrives, Senbazuru retrieves therelevant datasets using the inverted index and Term Frequency-Inverse DocumentFrequency (TF-IDF) style ranking. Converting the data in each spreadsheet to re-lational format is done by first locating data frames (value region, attribute regions,etc.). A data frame is simply non-empty rows region of the spreadsheet. Assigning

10 CHAPTER 2. RELATED WORK
semantic labels to the data frames is accomplished by Conditional Random Field(CRF). CRF is also responsible for identifying the parent-child relationship betweenthe data frames. Each value in the value region is then extracted as a tuple by pair-ing it with the relevant attributes from the attribute region. Finally, the relationaltuples are assembled into relational tables. The attributes in di�erent tuples areclustered together into consistent columns. The clustering model takes into consid-eration the hierarchical relationship as well as schema from knowledge bases such asFreebase [51] and Yago [52]. DiagramFlyer [50] extracts elements of the graphicalspecification of a diagram, e.g. title, legend, caption, scale, x-axis and y-axis labels,and type from PDFs. Words are extracted from PDFs by PDF processor with itscorresponding two-dimensional bounding box of coordinates. These words boxesare then grouped together as segments based on the proximity and orientation ofneighboring word boxes. Unnecessary segments that do not indicate a diagram areremoved. Each segment is then assigned a label from the previously mentioned setof labels by using a classifier. The input to the classifier is a set of textual featuresderived from the segments.
2.1.2 Taxonomy Based on Degree of Automation of the Pro-cess
Earlier information extraction systems require the user to manually write the extrac-tion rules or wrappers. This manual method has since been left behind as machinelearning was introduced to help in generating the rules automatically. From thepoint of view of how the wrappers are generated, information extraction systemscan be classified as supervised, semi-supervised, and unsupervised systems.
In supervised IE systems, a set of Web pages are annotated with the data tobe extracted and used as input. The IE systems then infer the wrapper from thelabelled Web pages. RAPIER [53] generates the extraction rules in a bottom-upmanner. It starts with the most specific rules and then iteratively replaces themwith more general rules. The generated rules are only used to extract single-slotdata. The rules are comprised of three di�erent patterns, a pattern to match textpreceding the filler, a pattern to match the actual filler, and a pattern to match thetext following the filler. In this learning process, RAPIER combines the syntacticand semantic information of the input Web pages. The semantic information comesfrom the part of speech tagger and lexicon such as Wordnet [54]. As opposed toRAPIER, WHISK [55] can extract multi-slot information. The rules are generatedusing a covering learning algorithm and can be applied to various sources of doc-uments including structured and free text. When applied to free text documents,the input data needs to be labelled with a syntactic analyser and semantic tagger.WHISK employs a top-down manner when generating the rules. The rules are inthe form of regular expressions. The initial rules are the most general rules whichencompass all instances, then WHISK continually adds a new term to extend theinitial rules. In NoDoSe [56], a user can interactively decompose semi-structureddocument hierarchically. This helps NoDoSe to handle nested objects. It separatesthe text from the HTML code and applies heuristic-based mining components to

2.1. AUTOMATIC INFORMATION EXTRACTION 11
each group. The goal of the mining component is to find the common prefix andsu�x that identify di�erent attributes. A tree describing the document structure isthe output of this mining task.
The semi-supervised approach requires a small set (instead of complete as insupervised systems) of example from the users to generate the extraction rules.IEPAD [57] tries to find the repetitive patterns in a Web page. The intuition is thatdata records are commonly rendered using the same template for good presentation.The repetitive patterns can be identified by using a binary su�x tree. This type oftree only considers the exact match of su�xes, therefore the center start algorithmis then applied to align multiple strings. This alignment of strings starts at thebeginning of each repetitive pattern and ends before the next repeat. Olera [58] triesto discover blocks with the record similar to the ones supplied by the user. Uponfinding such blocks, it then generalises the pattern using multiple string alignmenttechniques. This helps Olera to extract those pages with only single data recordswhich IEPAD fails to accomplish. Tresher [59] requires the help of user to highlightthe examples of semantic contents as well as labelling them. These examples arethen represented by a DOM tree on which a tree edit distance is used to generatethe wrapper.
Labelled examples and human interactions are completely unnecessary in theunsupervised approach. RoadRunner [28] argues that a Web page is generated froma template by encoding the database values into HTML code. Extracting the datais considered as the decoding process. RoadRunner infers a universal wrapper fora set of HTML pages of the same class, i.e. pages that are generated by the sametemplate, by iteratively comparing pairs of pages. The ACME (for Align, Collapseunder Matching, and Extract) matching technique is used to compare the two pagesin each iteration. The goal of the comparison is to align matched tokens as well asto collapse any mismatches. The mismatched tokens can be of two types: stringmismatches or tag mismatches. String mismatches lead to the discovery of datavalues, while tag mismatches correspond to iterator or optional. The comparisonprocess can yield several alignments, thus RoadRunner employs universal free regularexpression to reduce the complexity. The alignments serve as wrappers and can beused to extract the data. ExAlg [44] deduces the unknown template from a givenset of Web pages and the values to be extracted. ExAlg proposes two techniques,di�erentiating role and equivalence class, to detect the template. ExAlg also definesa token as either a word or HTML tag. The first technique relies on di�erentiatingthe role of a particular token. For example, the role of “Name” in “Book Name” and“Reviewer Name” is di�erent. The latter technique finds a set of tokens that haveexactly the same number of occurrences across the training pages. This is denotedas equivalence class (EC). The intuition is that a data tuple must be encompassedby a set of template tokens from the same equivalence class. ECs that do not havea minimum support, i.e. tokens in the EC do not appear in a su�cient numberof pages, are removed. ECs must also have a minimum number of tokens to beaccepted, otherwise, they are filtered. It is also necessary that all tokens in an EC areordered and ECs are mutually nested. The original template is then reconstructedusing the remaining valid ECs. DeLa [60] is an extension of IEPAD and tackle the

12 CHAPTER 2. RELATED WORK
problem of nested object extraction. The wrapper generation process is conducted intwo phase. In the first phase, data-rich sections of pairs of Web pages are identifiedbased on the DOM tree. Nodes with identical sub-trees are removed. Next, repeatedpatterns are discovered using su�x trees. From each of the discovered patterns, thelast occurrence of the pattern is used to find the new repeated pattern from the newsequence. A repeated pattern is enclosed inside a pair of brackets and closed witha “*” symbol as in regular expression. DeLa then selects the pattern with the mostpage support to extract the data.
2.2 Set ExpansionThe goal of the set expansion task is to find elements of a semantic class given someexamples (seeds) of its members. It has also been studied under various di�erentnames such as named entity extraction [61, 62], concept expansion [26, 63], or entityexpansion [64, 65]. Most of the set expansion systems only consider the problem ofextracting atomic values, while others try to extract binary or even n-ary relations.Generally, set expansion approaches implement a three-step framework. It startswith collecting the relevant documents from the data source taking into considerationthe set of seeds provided by the user. The next step is to infer wrappers from thecollected documents and extract the candidates using the generated wrapper. Thelast step is applying a ranking mechanism on the extracted candidates. Based onthis framework, the set expansion system can be classified in terms of the datasource, the target relations, the pattern construction, and the ranking mechanism.
2.2.1 Taxonomy Based on Data SourceIn terms of the data source, set expansion systems can be viewed as two sepa-rate groups, i.e. corpus-based and Web-based systems. Corpus-based set expansionsystems typically deal with building domain-specific semantic lexicons from a collec-tion of specific domain textual documents. This is understandable because domain-specific documents are likely to contain specialised terminology. However, as thenumber of specific-domain corpora available is relatively small then the accuracy ofthose systems, although acceptable, are quite low. The World Wide Web or the deepWeb, on the other hand, is a source of vast knowledge repository which is highly dis-tributed with varying quality and granularity. It is then an excellent yet challengingsource of data especially for finding and extracting specialised terminologies.
Corpus-based set expansions systems generally can only be applied to free textdocuments, thus require specialised natural language processing (NLP) techniques,including parsing, part-of-speech tagging (POS), named-entity-recognition (NER),etc. In [66, 67], the authors compute co-occurrence statistics of the text collectionsource to identify and extract candidate entities from the given set of seed entities.Syntactic relationships, such as Subject-Verb and Verb-Objects, are later used to ex-tract specific elements from the corpus [68]. The previous approach is then extendedto incorporate lexicon knowledge to generate patterns and extract the targeted rela-

2.2. SET EXPANSION 13
Table 2.1: The set of seeds used in DIPREAuthor Book TitleIsaac Asimov The Robots of DawnDavid Brin Startide RisingJames Gleick Chaos: Making a New ScienceCharles Dickens Great ExpectationsWilliam Shakespeare The Comedy of Errors
tions [29]. A few Web-based set expansion systems focus on extracting candidates ofa semantic class by using hyponym patterns [69, 70], while others propose approachapplied on specific type of Web documents, i.e. Weblogs [70], Web list and querylogs [25], Web tables [26], and XML [33]. To extract the targeted entities or rela-tions, several set expansion systems leverage the structural information of the Webpage such as DIPRE [16], SEAL [24], Extended SEAL [30], RoadRunner [28], Lyre-Tail [27], FOIL [34]. Igo et al. [71] take the advantages of both the corpus-basedand Web-based techniques. From the set of seeds, they first expand a semanticlexicon on the corpus specific to the domain. Later, they calculate the PointwiseMutual Information (PMI) between the candidates and the seeds based on queriesto a search engine. The PMI scores are then used to filter out irrelevant candidates.
2.2.2 Taxonomy Based on Target RelationsFrom the point of view of target relations, many solutions have been proposed toextract atomic values (i.e. unary relation) from the data source, e.g. SEAL [24],SEISA [25], ConceptExpand [26], and LyreTail [27]. These systems focus on the taskof either building a semantic lexicon [71, 70], identifying certain named entities [64,62], expanding a semantic concept [26] or solving long-concept queries [63]. Thereare also some solutions that have been proposed to extract binary relations, e.g.DIPRE [16], RoadRunner [28], TextRunner [29], and Extended SEAL [30]. Theproposed systems mainly approach the problem of identifying relations betweenpairs of entities by exploiting character-level features [30], structural information [16,28], or distant supervision [22]. In comparison to unary and binary relation, n-ary relations have not been explored intensively. Only a few solutions have beenproposed to tackle this problem by exploiting the graph [31, 32], XML [33], orunranked ordered tree [34] structure of the data.
2.2.3 Taxonomy Based on Pattern ConstructionWith regards to the pattern construction process, set expansion systems can beclassified into several groups including Semantic Similarity (SS), Labelled Learning(LL) and Wrapper Inference (WI).
The basic assumption in the SS approach is that words describing the sameconcept would occur together in a similar context. SS approach computes the featurevector of all the words distribution or the surrounding words of a context window.

14 CHAPTER 2. RELATED WORK
Algorithm 1: DIPRE’s AlgorithmInput : Set of binary seeds S and documents D
Output: Set of binary relations R
1 R = ÿ; O = ÿ;2 R = R fi S;3 while R is not large enough do4 foreach r œ R do5 O = O fi FindOccurrences(r, D);6 end7 P = InferPatterns(O);8 R
Õ = ExtractCandidates(P, D);9 R = R fi R
Õ;10 end11 return R;12 Function InferPatterns(O)13 O
Õ = {Group occurrences of O based on the order and middle};14 P = ÿ;15 foreach Oi œ O
Õ do16 p =GenerateAPattern(Oi);17 if (specificity(p) satisfies Equation 2.2) then18 P = P fi p;19 else20 Group occurrences based on the URL: O
Õ
i= {Oi1, Oi2, ..., Oin};
21 OÕ = O
Õfi {O
Õ
i};
22 end23 O
Õ = OÕ \{Oi};
24 end25 return P ;26 end27 Function GenerateAPattern(O = {o1, o2, ..., on})28 if (o1.order=o2.order=...=on.order) &
(o1.middle=o2.middle=...=on.middle) then29 order = o1.order;30 middle = o1.middle;31 urlprefix = LongestCommonPrefix(o1.url, o2.url, ..., on.url);32 prefix = LongestCommonSu�x(o1.prefix, o2.prefix, ..., on.prefix);33 suffix = LongestCommonPrefix(o1.suffix, o2.suffix, ...,
on.suffix);34 end35 return p;36 end

2.2. SET EXPANSION 15
To find candidates, SS calculates the similarity score of the seeds vectors against allof the other words vectors using specific metrics such as PMI [64], Cosine [66], etc.
Approaches in the LL category view set expansion problem as a binary classi-fication. To be more precise, the binary classifier is trained using a set of positiveexamples from a particular class and responsible for assigning the class of unlabelledexamples [72]. The Bayesian Sets [73, 74], which can be considered as a specialisedLL, uses a Reliable Negative Set together with the positive examples to train theclassifier.
Set expansion systems that fall into the Wrapper Inference category generatewrappers by exploiting the character-level features [24] or other structural infor-mation (HTML tags) [16]. Next, we look into the details of how both approachesinfer the wrappers. In [16], Brin proposes Dual Iterative Pattern Relation Expan-sion (DIPRE) which looks for attribute-value pairs. In the paper, Brin shows howDIPRE extracts pairs of author and book title by giving a set of five seeds as shownin Table 2.1. DIPRE exploits the duality between patterns and target relations.Assuming that the set of seeds given by the user are good instances of the targetrelations, DIPRE will generate a good set of patterns. The set of instances foundusing the generated set of patterns are also good candidates for the target relations.The construction of the search string(s) from the given seeds and the search engineused by DIPRE are not specified by the author in the paper. Algorithm 1 showsthe approach in DIPRE. From each of the Web pages collected, DIPRE locates alloccurrences of all seed pairs of author and book title (line 4-6). Specifically, eachoccurrence of a seed pair is recorded as a 7-tuple. For instance, the 7-tuple for theauthor and book title example is of the form: <author, title, order, url, prefix, mid-dle, su�x>. The value of order is equal to 1 if the occurrence of author precedes theoccurrence of title, or 0 otherwise. The url denotes the URL of the Web page, whileprefix, su�x, and middle are the characters preceding, following and separating theelements of the seed in the Web page. DIPRE limits the number of characters forthe prefix and su�x to only 10 characters. DIPRE then infers patterns based onthe set of occurrences (line 7). The patterns are then used to extract candidatesfrom the Web page (line 8). This procedure can be repeated until the candidatesare considered large enough.
The input to the pattern inference process in DIPRE is groups of occurrences(OÕ) based on their respective order and middle as shown in function InferPatternsof Algorithm 1. For each group (Oi) in O
Õ, DIPRE tries to infer a pattern (line 15).If a pattern p is successfully inferred then DIPRE calculates its specificity usingEquation 2.1. The specificity of a pattern p is basically the length multiplicationof all its components. DIPRE also checks the number of seeds (n) which can beretrieved using the pattern p. A pattern p is considered as potential if it satisfiesEquation 2.2 (line 16), where t is a predefined threshold. Otherwise, Oi is dividedinto groups based on the URL and the same process is repeated on each of thegroups (line 19-20).
specificity(p) = |p.urlprefix||p.middle||p.prefix||p.suffix| (2.1)

16 CHAPTER 2. RELATED WORK
n > 1 & specificity(p) ú n > t (2.2)
Function GenerateAPattern of Algorithm 1 shows how DIPRE infers a patternp from a set of occurrences (O) of the seeds. First of all, it ensures that all entriesin O have the same order and middle (line 28). If the condition is not satisfied thenthe procedure returns no pattern, otherwise, the order and middle of the pattern pare set equal to o1.order and o1.middle (line 29-30). The urlprefix of the patternis set as the longest common prefix of all the URLs of the set of occurrences. Theprefix and su�x of the pattern are set to the longest common su�x and prefix ofall the prefixes and su�xes respectively (line 31-33). DIPRE does not apply anyranking mechanism to the extracted candidates. Thus instead of a ranked list, itreturns a set of candidates.
Wang et al. [24] propose Set Expander for Any Language (SEAL) to expand a setof atomic entities from a semi-structured corpus. The authors claim that SEAL isable to extract candidates regardless of the language used in the corpus. To retrieverelevant documents, SEAL uses the concatenation of all seeds as a keyword to thesearch engine (Google). For example, given the set of seeds of car manufacturers{Ford, Toyota, Nissan}, the query to the Google is “Ford Toyota Nissan”. Thesearch engine then returns a number of Web pages (URL) that contain the seedsbut SEAL only considers the top n pages.
SEAL generates specific wrappers for each Web page. Given the set of seeds,SEAL first locates the occurrences of all seeds in the Web page. Each of suchoccurrences is assigned a unique id. SEAL stores the contexts of an occurrence ina trie data structure. A trie data structure [75], also known as digital/radix/prefixtree, is a tree for storing strings in which there is one node for every common prefix.The strings are stored in extra leaf nodes. The left and right contexts (characterspreceding and following the occurrence of a seed) are then inserted into a separateleft and right trie. In the left trie, the context is stored inversely. Each node in theleft trie maintains a list of ids which are preceded by the string from root to thatparticular node. SEAL defines a wrapper as a pair of maximally long common leftand right context from which at least a seed is located. To find the maximally longcommon left contexts, SEAL traverses nodes on the left trie with a minimum of oneentry in its list of ids and none of its child nodes has the same property. For eachsuch longest common strings, SEAL traverses the right trie to find all the maximallylong common right contexts. The wrapper generation process in SEAL is shown inAlgorithm 2 where seeds and l denote the set of seeds and minimum length of thecontext respectively. To rank the candidates, SEAL first builds a heterogeneousgraph consisting of seeds, Web pages, wrappers, and candidates as the nodes andrelationships among them as edges. A random walk [76] is then performed on thegraph. After reaching the steady state, the weight assigned by the random walk toeach node is used as the score on which the ranking is based on.

2.2. SET EXPANSION 17
Algorithm 2: SEAL’s AlgorithmInput : A pair of trie (t1, t2)Output: A set of wrappers W
1 foreach n1 œ TopNodes(t1,l) do2 foreach n2 œ BottomNodes(t2, n1) do3 foreach n1 œ BottomNodes(t1, n2) do4 w = ConstructWrapper(n1, n2);5 W = W fi w;6 end7 end8 end9 return W ;
10 Function BottomNodes(Trie t, Node nÕ)
11 N = ÿ;12 foreach n œ t do13 nseeds = CommonSeeds(n, n
Õ);14 nchild = {children nodes of n};15 nchild_seeds = {’ni œ nchild & CommonSeeds(ni, n
Õ) == |seeds|};16 if (nseeds == |seeds|) & (nchild_seeds == ÿ) then17 N = N fi n;18 end19 end20 return N ;21 end22 Function TopNodes(Trie t, int l)23 N = ÿ;24 foreach n œ t do25 nparent = {parent node of n};26 textn = {string from root to n};27 textn_parent = {string from root to nparent};28 if (|textn| Ø l) & (|textn_parent| < l) then29 N = N fi n;30 end31 end32 return N ;33 end34 Function CommonSeeds(Node n1, Node n2)35 R = ÿ;36 I = n1.indexes fl n2.indexes;37 foreach i œ I do38 R = R fi {seeds at index i};39 end40 return |R|;41 end

18 CHAPTER 2. RELATED WORK
2.2.4 Taxonomy Based on Ranking Mechanism
The last step of the three steps framework for set expansion approach is to applya ranking mechanism on the extracted candidates. However, there exists severalset expansion systems that return a set of candidates instead of a ranked list ofcandidates. DIPRE [77], RoadRunner [28], TextRunner [29], FOIL [34] are examplesof such system that do not apply any ranking mechanism. On the other hand, setexpansion systems that do apply a ranking mechanism can be classified into twolarge groups, i.e. statistical-based and graph-based ranking. The former depends onspecific metrics such as PMI [64], Jensen-Shannon [62], co-occurrence statistics [66,67, 27], iterative similarity aggregation [25] to rank the extracted candidates, whilethe latter computes the similarity between the candidates and the seeds on a graphdata structure [24, 26, 32, 31].
In [67], a context window is defined as the noun words directly preceding andfollowing an occurrence of a seed. For the given context windows of a category, thecategory score for a word is calculated as the conditional probability of the wordappears in a category context. In [62], an occurrence of a seed in a Web search queryis represented as a search-query which is the concatenation of the remaining wordspreceding (prefix) and following (postfix) the seed in the query. This search-queryis added as an entry to a query template vector and acts as a search-signature of thecandidates with respect to the targeted class. Each entry in the vector is assigneda weight which corresponds to the number of times the query occurs in the querylogs. A similarity function, i.e. Jensen-Shannon, is calculated between the search-signature vector of each candidate and search-signature vector of the class and usedto rank the candidates. Sarmento et al. [66] define a membership function to rankcandidate entities for the given set of seeds. The basic assumption of the approachis that members of the same semantic class tend to occur together in the text.Thus, the membership function is based on the co-occurrence statistics betweenthe candidate and the set of seeds computed from the text corpus. LyreTail [27]measures the co-occurrence statistics between the candidates and the set of positiveand negative seeds. If a candidate is likely to co-occur with the positive seedsthen it is a positive candidate. On the contrary, if the candidate co-occurs oftenwith the negative seeds, then it is not a positive candidate. Zhang et al. [63],rank candidate entities of a long concept based on its relevancy to shorter concepts.Entities that appear in more shorter concepts have higher relevancy scores thusare good candidates to expand the long concept. In [64], the authors representterms (entities) as its NP chunks. The features of the terms are defined as the leftand right most stemmed chunks. PMI score is calculated between a term w and afeature f. A PMI vector is then constructed for each term by calculating its PMIagainst all possible features. The similarities between the terms and the seeds aremeasured using these PMI vectors and similarity metrics such as Cosine, Jaccard,and Dice. SEISA [25] is a set expansion system which specifically targets Web Listsand Query Logs. To evaluate the goodness of the candidates, SEISA applies aniterative similarity aggregation based on the previously mentioned metrics. Thesimilarity aggregation is calculated in terms of relevance and coherence between the

2.2. SET EXPANSION 19
set of seeds and the set of candidates. The relevance score is defined as the weightedsimilarity between the two sets. The coherence score is the similarity among themembers of the candidate set. A set of candidates is considered as good if themembers are similar to the seeds and they belong to a consistent concept.
In [68], nodes in the constructed graph represent nouns extracted from the cor-pus. An edge between nodes is created whenever the two represented nouns co-occurseparated only by conjunctions “and” or “or”. The frequency of the co-occurrence isused as the weight for the edges which has to satisfy a certain threshold. Thus, theweight is used as the ranking mechanism for candidates. Kozareva et al. [70] builda hyponym pattern linkage graph which consists of only candidates as the nodes.An edge between two nodes (u, v) denotes a “generated by” relationship betweenthe two candidates (v is generated by u). This edge is weighted with the number oftimes u generates v. The authors also evaluate di�erent scoring function that takesinto account both the in-degree and out-degree of each node (Betweenness [78] andPageRank [77]). SEAL [24] considers a heterogeneous graph of seeds, Web pages,wrappers, and candidates. The edges of the graph represent relationships amongvertices. A seed and a Web page have a find relationship because the Web pageis retrieved by using the seed as the query to a search engine. A Web page and awrapper have a derive relationship as a wrapper is inferred from the Web page. Awrapper and a candidate have an extract relationship because a wrapper is used toextract the candidate. SEAL calculates the rank of the candidates using a lazy walkprocess on the graph similar to that of PageRank [77]. ConceptExpand [26] takes asinput an ad-hoc concept name and a few seeds of entities. It then uses the conceptname as the keyword to query a Web table search system (e.g. Google’s Web Ta-bles1 or Microsoft’s Excel Power Query2). From the resulting tables along with thecandidate entities, they build a bipartite graph of tables and entities mentioned oneach table. A table is said to be exclusive if the entities contained are all relevant tothe concept. Likewise, an entity is said to be relevant, if it is contained in at leastone exclusive table. The relevancy of entities and the exclusivity of the tables arethen inferred iteratively and used to rank the entities and the tables. Jayaram etal. [32] propose Graph Query by Example (GQBE), a system that queries knowl-edge graphs (e.g. DBpedia [79], Yago [52], Freebase [51], Probase [80]) when givenexamples of entity tuples. For instance, if one wants to find the name of the CEOof IT companies, he or she can give an example tuple such as <Tim Cook, Apple>to the system. GQBE captures the user’s query intent by deriving a neighborhoodgraph from the knowledge graph based on the example tuple. Query graphs whichcontain all entities of the query are then identified from the neighborhood graph.For each of the query graphs, GQBE finds answer graphs which are edge-isomorphicto the query graph. The quality of an answer graph is based on two components,i.e. the structure and content score. Structure score of an answer graph is the totalweight of all edges, while the content score is the total matching nodes. The systemthen returns a ranked list of candidate tuples based on the sum of the two scores(e.g. <Mark Zuckerberg, Facebook>, <Sundar Pichai, Google>, etc.).
1https://research.google.com/tables
2http://office.microsoft.com/powerbi

20 CHAPTER 2. RELATED WORK
2.3 Truth FindingTruth finding also referred to as truth discovery [81, 82, 83, 84], fact checking anddata fusion [85, 86, 87, 88], solves the problem of automatically determining true(or actual) information and trustworthy sources by only analysing provided datavalues, source overlapping, and conflicts. It has numerous application domains suchas data integration [89, 83], information retrieval [90], Open Linked Data [91], andset expansion [36].
Truth finding’s main objective is to deterministically integrate conflicting state-ments and automatically compute a confidence value for each statement built on thetrustworthiness level of its sources. The trustworthiness level is itself unknown ingeneral and therefore should be estimated by the process. This leads to an iterativealgorithm with the specified convergence criteria. At convergence, the truth findingfunction determines the truth as the statements with the highest confidence scores.Example 1 shows and explains a general application case of truth finding.
Example 1. As an example, consider three sources which give statements aboutthe capital city and the currency of the country Algeria. Source_1 and Source_3state that “Alger” and “Dinar Algerian” are the correct values while Source_2 gives“Alger” and “Leka Algerian”. We can observe that while all sources agree on thecapital city, they disagree on the currency. A typical majority voting-based processwill automatically break down this disagreement by choosing “Dinar Algerian” asthe correct value for the currency of Algeria because it is voted by 2 out of the 3sources. The accuracy of each source is then calculated as the proportion of state-ments given by the source which conform to the correct value, while the confidenceof each statement is defined as the weighted accuracy of sources that support thestatement. Thus, the accuracy values of Source_1, Source_2, and Source_3 are 1,1/2, and 1 respectively, while the confidence scores for “Alger”, “Leka Algerian”,and “Dinar Algerian” are set to 5/6, 1, and 1/2.
2.3.1 Taxonomy of Truth Finding ApproachMajority Voting is a naive truth finding model. It assumes an identical source trust-worthiness and takes the values provided by the majority as the truth. Such astraightforward and very intuitive approach, however, does not capture the di�erentlevels of trustworthiness of the sources, especially Web sources. This has led to theadoption of a weighted voting strategy, with weights being the quality levels of theinput sources, by most of the truth finding algorithms. In this setting, as sourcequality is unknown a priori, it is estimated based on the level of the truthfulnessof the provided statements, yielding an iterative process. According to the manner,such an iterative process is implemented, one can classify, to some extent, truth find-ing algorithms as agreement-based, MAP estimation-based, and Bayesian-inferencemethod.
Algorithms in the agreement-based class use the notion of majority to iterativelycompute source trustworthiness and confidence score until convergence. In [81],Yin et al. propose TruthFinder which extends majority voting. It considers a

2.3. TRUTH FINDING 21
similarity metric in its weighting model by leveraging the intuition that the levels ofthe truthfulness of two similar values should influence each other in a certain sense.An important feature of the truth is hardness. Providing the correct values for easyobject attributes should not increase significantly the trustworthiness of the sources.In contrast, when the attributes are hard, sources that provide the correspondingcorrect values should become more trustworthy as proposed by Galland et al. in [92].The authors propose three algorithms: Cosine, 2-Estimates, and 3-Estimates whichdi�er in the series of parameters estimated. The first two algorithms only estimatethe correct value of facts and the trustworthiness of the sources, while the lastalgorithm also estimates the error of each fact.
All of the approaches in MAP estimation-based class are built on Maximum APosteriori (MAP) paradigm. In LTM [83], the authors regard a source as a classifierbecause each source makes true/false claims for the statements. The quality of thesources is represented by the sensitivity and specificity. The two features are asso-ciated with the false negatives and false positives made by the sources respectively.Both quality features and the truth values of the facts are modelled as latent vari-ables in a Bayesian probabilistic graphical model. Given the observed data, theselatent variables are then approximated using MAP estimation which maximises theposterior likelihoods of the corresponding latent variables. MLE [93] is applicable tothe crowd or social sensing. Any observations made by a user is modelled as binaryvariables. The default state of each variable is always “negative”. The truth findingtask in this scenario is transformed into a maximum likelihood estimation problem.The problem is then solved using the Expectation-Maximization (EM) algorithm.LCA models [94] assume that the truth values of facts are latent variables, while thecredibility of sources is represented by a set of modelled parameters including hon-esty, di�culty, mistake, and lying. SimpleLCA considers honesty of sources whichis the probability of the source being honest. GuessLCA takes into considerationthe di�culty of telling the truth. When telling the truth becomes harder, somesources tend to guess to make the claims. MistakeLCA asserts how likely an honestsource make a mistake. LieLCA di�erentiates between sources that intentionally lieand that of making an honest mistake. These parameters give di�erent aspects ofcredibility to the sources.
In Bayesian-inference methods, the family of algorithms is based on the Bayesiananalysis [95]. Depen model and four variants have been proposed in [89, 82]. De-pen investigates and finds, based on a Bayesian analysis, source dependence viacopying relationships. The copying relationships should not significantly increasethe confidence in any information and more credit must be given to data from in-dependent sources. Accu algorithm extends Depen by introducing di�erent sourceaccuracy level. It then estimates the level of accuracy of a source as a function ofthe vote count of their provided values. The other variants of Depen, i.e. AccuN-oDep, AccuSim, and AccuPr, relax the source dependence assumption while alsoconsider value similarity and source popularity respectively. Sources are not onlycorrelated by dependence, but negative correlations can also occur, as studied bythe authors in [87]. In [96, 97], Fang et al. propose a multi-valued truth findingmodel called SmartMTD (Smart Multi-valued Truth Discovery) that considers four

22 CHAPTER 2. RELATED WORK
important implications to conduct truth discovery. Two graphs are constructed andfurther used to derive two aspects of source reliability via random walk computa-tions. Fang also presents in [96] a general approach, which utilises Markov chainmodels with Bayesian inference, for comparing the existing truth discovery methods.Liu et al. applied truth finding on Open Linked Data. They demonstrated in [91]TruthDiscover which is a novel system that identifies the truth in Linked Data witha scale-free property. TruthDiscover estimates the prior beliefs of sources by lever-aging topological properties of the Source Belief Graph. The estimates are thenutilised to smooth the trustworthiness of the sources. To model inter-dependenciesamong objects which are used for accurately estimating the trust values of objects,TruthDiscover exploits Hidden Markov Random Field.
2.3.2 Ensemble ApproachThe main limitation of the current truth discovery approaches is that none of themoutperforms the others in all application scenarios. Consequently, Ba et al. haveconsidered in [98] possible structural correlations among data attributes to presenta complementary study of the proposed truth discovering algorithms. Any specifictruth finding algorithm can be used in their model. In the same spirit, VERA [90]is a Web platform enabling to verify the veracity of Web facts (of numerical types)using an ensembling of several truth finding algorithms. It combines the best ofseveral algorithms which enables to overcome the weakness of each of them [99].[90] employs, for the same purposes, existing truth finding algorithms as [99].
2.4 Topic LabellingEvery document has an underlying topic which the author based their content on.For example, upon writing a scientific paper, a researcher may choose a broad topicsuch as “machine learning” or a very specific one like “topic labelling” to base thecontent of the paper. However, it is rarely seen that a document only influenced by asingle topic. Instead, most of the time the document is built on a mixture of topics.In the case of the scientific paper, the writer may also write some applications ofthe machine learning algorithms in “biology” or “medicine”. This is the generalassumption adopted by topic modelling algorithms.
Topic modelling approaches learn the “abstract” topics that appear in a collectionof documents. One of the most well-known topic modelling algorithms is LatentDirichlet Allocation (LDA) [1]. LDA considers every topic as a distribution overthe top-N words and every document as a distribution over K topics where K andN are input to the model. This makes LDA a probabilistic clustering technique.Intuitively, LDA works on co-occurrence of words in the documents. If a certainset of words co-occur in multiple documents then this set gets a higher probabilityfor a certain topic then the rest of the words. Additionally, there is an intrinsicduality in the LDA: the documents is a distribution over topics whereas a topic isalso considered as a distribution over documents. The plate diagram such as shown

2.4. TOPIC LABELLING 23
in Figure 2.1 is an illustrative way of explaining the LDA model. The boxes in thediagram denote “plates”, whereas plate here represents replication. The D plateis the corpus or the collection of documents, the M plate represents the repeatedchoice of topics and words in a document, and K denotes the topics.
„k
wwzw◊d
–
—
D M
K
Figure 2.1: Plate diagram of LDA [1]
To generate a new document based on this model, one must first decide thenumber of words M that the new document contains. We can draw M from aPoisson distribution [100]. Next, select a mixture of K topics for the new document.The distribution of the K topics is drawn from a Dirichlet distribution. Let usassume K=3. A draw from the Dirichlet distribution would return 0.3, 0.5, 0.2where the mixture of topics is 30%, 50%, and 20% for Topic 1, Topic 2, and Topic 3respectively. The next step is we generate each word in the new document by firstselecting the topic (from the multinomial distribution of topics we sampled before),and then randomly choose the word under the selected topic (according to thetopic’s distribution of words). In reality, we are only presented with the collectionof documents. Assuming that the collection of documents are generated by thisgenerative model, LDA then tries to learn the topic representation of each documentas well as the words associated with each topic. There are several methods that canbe used to achieve this goal including variational Bayes [1], Gibbs sampling [101]and expectation propagation [102].
As we have previously mentioned, LDA represents a topic via the top-N wordswith refers to their marginal probability in that topic. For example, {charles, prince,king, diana, royal, queen, family, parker, british, bowles} is a set of words whichdescribes a topic. The set of words are extracted from a corpus of news articles.Unfortunately, LDA does not provide us with the label for the topic. Althoughone can guess what the topic is about from the words (e.g. “British royal family”),it requires a significant cognitive knowledge with the risk of subjectivity. Thus,automatically finding an appropriate label for the topic model is more preferable.
Automatically labelling a topic model is the task of topic labelling. The task wasproposed by Mei et al. [103]. In the paper, they extracted bigram phrases from thecorpus. They use these bigrams as the candidate labels. To decide which bigramphrases to extract, they applied a lexical association measure. Next, they calculatedthe Kullback-Leibler (KL) divergence [104] between pairs of label candidate andtopic and used them to rank the labels. Lau et al. [105] applied a di�erent approachof extracting candidate labels. They queried Wikipedia and also performed a site-

24 CHAPTER 2. RELATED WORK
restricted search on Google using the top-N topic words as the keywords. Theinitial set of primary candidate labels were constituted from the articles titles ofthe search result. A set of secondary candidate labels were then generated fromeach of the primary candidates. They first extracted noun chunk from the labelby using OpenNLP chunker3. n-grams were then generated from only these nounchunks. They discarded n-grams which were not article titles in Wikipedia. RACOscores [106] were then computed for each pair of secondary and primary labels withinthe same topic and used to remove unrelated labels. The ranking process takes intoconsideration features from the candidate labels. These features include lexicalassociation measures, the raw number of words, and the relative number of words inthe label candidate that are in the set of topic words. They experimented with anunsupervised model by using each feature individually to rank the label candidatesand then selecting the top-N. The combination of the features is used as input to asupport vector regression model. The model was trained over topics of which theyhave the gold-standard labels for the candidate labels.
Bhatia et al. [107] represented a Wikipedia title by its documents as well as wordsembedding. The model was built using the entire collection of English Wikipediaas the training set for doc2vec [108] and word2vec [109]. The candidate labelswere ranked using a supervised learn-to-rank model. They trained a support vectorregression model using four features including cosine similarity of letter trigramvector of the label and topic words, PageRank value of each label on a directed graphbased on hyperlinks found within the article text, number of words in the candidatelabel, as well as the lexical overlap between the candidate label and the top-N topicwords. Kou et al. [110] extracted phrases which contain the top-N words of a topicfrom a collection of topic-related documents as the candidate labels. They mappedboth topics and candidate labels to vector space and ranked them based on thecosine similarity. Hulpus et al. [111] constructed a graph from DBpedia conceptscorresponding to the top-N words of each topic. They removed noised from thegraph based on connectivity. They then calculated defined several graph centralitymeasures which are based on the closeness and betweenness [112], information [113]as well as random walk betweenness [114] centrality. The best label for a topicwas then selected using these graph centrality measures. Automatic topic labellinghas also been applied to Twitter data [115] by first calculating words relevance ofdocuments. The documents in consideration must be related to the topic. Next, asummarisation algorithm was used to generate the relevant labels.
2.5 Multi-label ClassificationClassification is the task in machine learning which assigns unknown objects to one ofseveral predefined categories (labels) by learning a classifier from a training dataset.The training dataset contains a set of observations whose category of membershipis known. The classification task can be applied in diverse areas such as categoriz-ing emails as “spam” or “not spam”, identifying a new species of animal as either
3http://opennlp.soundforge.net

2.5. MULTI-LABEL CLASSIFICATION 25
“mammal”, “reptile”, “bird”, “fish” or “amphibian” based on the characteristics orfeatures of the email and animal respectively. In the first example, there are only twocategories (“spam” or “not spam”) which one of them can be assigned to unknownobjects. This is the typical setting of the classification task, i.e. binary classification.In the second example, there are more than two categories (“mammal”, “reptile”,“bird”, “fish” or “amphibian”), but still, an animal can only be classified to one ofthe categories. This setting is referred to as multi-class classification. Consider thecase where the classifier is asked to predict the genre of a song. There are plenty ofmusic genres such as “rock”, “pop”, “country”, “jazz”, etc. to choose from. A songcannot be exclusively categorized into one of the genres but instead into multiplecategories. This type of setting is known as multi-label classification.
In multi-label classification, multiple predictions must be made for each dataobject, corresponding to the number of labels. Each label takes a binary value,where a 1 represents the presence or relevance of a label, and a 0 otherwise. Previousworks on multi-label classification are often categorized into two approaches, i.e.problem transformation, and algorithm adaptation. The first approach remodels themulti-label problem as one or more single-label problems. Any o�-the-shelf single-label classifier can then be chosen to make the single-label classifications. Thepredictions made by the single-label classifiers are then mapped into multi-labelrepresentations. Naive Bayes [116] and Support Vector Machine [117] are some of thealgorithms employed in earlier research using problem transformation approach. Inthe latter approach, an existing single-label algorithm is modified to fit the purposeof multi-label classification. Decision trees [118] and AdaBoost [119] are amongthe earliest single-label algorithms adapted to multi-label classification problem.Problem transformation approach is more preferable than algorithm adaptation dueto its flexibility.
Binary relevance method (BM) [117, 120] is one of the most recognized problemtransformation methods. To present the BM method we first formalize the multi-label classification problem. Consider X
dµ IR as the input domain of all possible
attribute values. To represent an object x, we use the vector notation x = [x1, ..., xd],where d is the number of attribute values. The output domain of all possible labelsis represented by the set L = {1, ..., L}. An L-vector y = [y1, ..., yL], is used torepresent labels which are associated with x. The value of each yj is equal to 1 ifobject x is associated with label j, and 0 otherwise. For a training dataset D of N
labelled examples, we represent it as D = {(xi, yi)|i = 1, ..., N}. The superscripts
i and j are used to di�erentiate between the data and label dimension. Thus, yi
j
corresponds to the binary relevance of label j for the i-th example. BM methodtrains a classifier c from D. c itself is composed of L binary classifiers, where eachcj predicts whether x is associated with label j or not. Hence, the output of c forany object x is the vector y œ {0, 1}
L.Although BM is arguably one of the most popular problem transformation meth-
ods, it is consistently cast aside. The reason is that it is believed that BM does notcapture the relationships among the labels, i.e. it assumes that labels are indepen-dent. Any correlations between labels that exist in the training data are lost duringthe transformation process. This a�ects the resulting set of labels predicted by BM

26 CHAPTER 2. RELATED WORK
ID Description Skin
Car
e
Ant
i-agi
ng
Nai
lCar
e
Nai
lPol
ish
x x1 x2 x3 x4 x5 y1 y2 y3 y41 0 1 1 1 0 1 1 0 02 1 1 1 0 1 0 1 1 03 1 0 1 0 1 0 1 0 04 0 0 1 0 1 0 1 0 05 1 1 1 0 1 0 0 1 1
Table 2.2: A small example of multi-label dataset based on the Yves Rocher set
which can contain too few or too many labels and sometimes produce labels that areunlikely to occur together in the real world. But Read et al. [121] claim that usingtheir proposed chaining method the BM-based methods can overcome the previousconcerns.
As in BM, the Classifier Chain model (CC) trains L binary classifiers. Thefundamental di�erence between the two methods is that in BM, each classifier cj,which is responsible for the binary relevance problem for label j œ L, is indepen-dent to each other, while in CC, a chain connects all classifiers. In the learningphase for CC, each classifier cj is trained sequentially using a transformed dataset((x, y1, ..., yj≠1), yj). Suppose that we have a dataset as in Table 2.2. To train c1for label y1 we use objects x1, ..., x5, where the initial input space for each objectconsists of x1, ..., x5. Next, to train c2, we augment y1 to the initial input space ofeach object. We do the same process for all cj by adding y1, ..., yj≠1 to the initialinput space. In general, to train cj we add y1, ... yj≠1 to the initial input space.The classification process is done in a similar fashion. Using the feature vector of anunknown object as the input space for c1, we first predict y1. We add the predictedvalue of y1 to the initial input space and use it as the input for c2 to predict y2. Thisprocess is repeated until we have predicted all yj.

Part I
Finding the Truth in Set of TuplesExpansion
27


Chapter 3
Set of Tuples Expansion
The task of set expansion consists of extracting, from a corpus, elements of aparticular semantic class characterised by some examples of its members. Moreprecisely, given a set of examples, also referred to as seeds (e.g. names) characterisinga particular semantic class (e.g. US Presidents) and a collection of documents(e.g. HTML pages), the set expansion problem is to extract more elements of theparticular semantic class from the collection of documents. For example, we maywant to find the names of presidents of the United States of America by giving thethree examples Barrack Obama, George Bush, and Bill Clinton as seeds. The goalhere is to extract the names of all the other US Presidents from the Web.
Set expansion approaches use a three steps framework. The first step is crawl-ing. Given the set of seeds, crawling finds relevant documents containing the seeds.The di�erent methods of composing the queries from the seeds can be applied tocrawl the search engine and collect the Web pages. The next step is the wrappergeneration and candidate extraction. The former involves finding all occurrences ofthe seeds in the collected Web pages. It then identifies patterns (wrappers) fromcontexts surrounding the occurrences of the seeds. The latter uses these wrappersto find and extract other possible candidates from the Web pages. The last step isranking. The wrapper generation and candidate extraction processes are likely toextract extraneous and erroneous data because of the imperfection of the patternsinferred. Ranking the candidates according to their plausibility is then paramountto presenting satisfactory results to users.
Existing set expansion approaches (DIPRE [16], SEAL [24]) largely deals withatomic seeds. Each seed in the set of examples given by the user consists of onlyone element. However, most of the time, a user demands information in a form ofrelation instances much like in the relational model of a database. In this case, arelation instance or tuple is composed of a set of atomic values. The aforementionedset expansion approaches need to be generalised to tackle this problem. We proposeour approach of extending the set expansion problem to the expansion of sets oftuples. This chapter is organised as follows. We start with a formal definition of ourproposed task of the set of tuples expansion in Section 3.1. Section 3.2 explains indetails our approach of the set of tuples expansion. We show the experiment resultsin Section 3.3. We conclude the chapter by highlighting the work we have done and
29

30 CHAPTER 3. SET OF TUPLES EXPANSION
introduce some future works in Section 3.5.
3.1 Problem DefinitionTo be precise, we formulate the task of the set of tuples expansion as follows. LetD be a collection of documents (corpus), while S is the set of all semantic classes.A member (element) of a semantic class is denoted by e where e œ si and e /œ S \ si.The previous definition is basically saying that e can only be a member of exactlyone semantic class. A tuple, T , is a set of n elements (n > 1) and each of theseelements belongs to a di�erent semantic class. When given the set of seeds R ={T1, T2, ..., TNs}, the goal of set of tuples expansion is to extract a candidate setof tuples, T = {T
Õ
1, TÕ
2, ..., TÕ
Nc}, from D. Nc and Ns are the size of the seeds and
candidate set respectively, where Nc Ø 2 and generally Nc > Ns. As a runningexample, consider the following set of seeds, R = {<Indonesia, Jakarta, IndonesianRupiah>, <Singapore, Singapore, Singapore Dollar>}. Each tuple in R consists ofthree elements. The first, second, and third element of the tuples belong to thesemantic class of “country”, “capital city”, and “currency name” respectively. Eachelement of the tuples in the candidate set T must also be in the same semantic classas the element of the seeds.
3.2 Proposed ApproachWe propose to design, implement and evaluate an extension of the set expansionapproach to set of tuples expansion (STEP). The generalisation of the set expansionraises new challenges in every stage of the set expansion framework: retrieving therelevant documents, wrapper generation to extract the candidate tuples, and rankingof the candidate tuples. The challenges mainly arise due to the fact that the seedsare constituted of multiple elements (composite seeds) and each of the element mayappear arbitrarily on a Web page. Furthermore, there is no consistent structurethat separates each element of the seed on the Web page. We tackle this problemby adopting regular expression-based wrapper where we leverage a slightly modifiedversion of the edit distance algorithm (Section 3.2.2). To rank the candidate, webase our mechanism on SEAL [24] where we add a new node (domain) and its setof relations (Section 3.2.3).
3.2.1 CrawlingConsidering composite seeds rather than atomic ones raises the problem of the orderof the elements in the seed. The issue is neither discussed by the authors of [16] norof [24] for crawling. Indeed, search engines like Google are relatively robust whengiven keywords in di�erent orders. This robustness, however, su�ers from long listsof keywords as it happens with seeds composed of numerous elements. We have triedand considered search strings formed with permutations of the elements of the seeds.Although it can improve the performance in some cases, we are not considering such

3.2. PROPOSED APPROACH 31
permutations due to the high number of possible permutations. In the wrappergeneration phase (Section 3.2.2), however, such permutations is important in findingthe occurrences of the seeds. We use Google search engine to collect Web pages. Thesearch query is the concatenation of all the elements of all the seeds. For the set ofseeds <Indonesia, Jakarta, Indonesian Rupiah>, <Singapore, Singapore, SingaporeDollar>, the input query for Google is “Indonesia” + “Jakarta” + “IndonesianRupiah” + “Singapore” + “Singapore” + “Singapore Dollar”’.
Figure 3.1: Wrapper generation process
3.2.2 Wrapper Generation and Candidates ExtractionWe want to extract the candidates from documents (Web pages) in our corpus. Forthe sake of simplicity, in this work without loss of generality, we consider that theWeb pages are HTML documents. In order to be able to extract candidates fromWeb pages, we must first infer the underlying wrapper. This wrapper generallyconsists of contexts (characters) surrounding the attributes of the given seeds andthe candidate tuples that are going to be fetched later. DIPRE [16] enforces aconstraint that a wrapper can only be generated if it brackets all the occurrence ofthe seeds on the pages. This is a really strict constraint that drastically decreasesthe recall (the percentage of correct results among all possible correct results) of thesystem. SEAL [24], on the other hand, relaxes the constraint while constructing thewrappers. A wrapper is generated if it brackets at least one occurrence of each seedon a page. By relaxing the constraint, SEAL outperforms DIPRE, especially in therecall. Based on this, we adopt SEAL’s approach to wrapper induction. However,SEAL only works on seeds with atomic values or binary relations. For seeds withmore than one element, we must first find the contexts between each element, inferthe wrapper and use the inferred wrapper to extract the candidates. An illustrationof the wrapper generation process can be seen from Figure 3.1 where we have a set

32 CHAPTER 3. SET OF TUPLES EXPANSION
of seeds R, each of which has n elements and a document d that contains the seeds.Each occurrence of a seed is represented by a left and right context, as well as n-1middle contexts. We generate the wrapper by finding the longest common stringfor the left and right contexts and obtaining the common regular expression for themiddle contexts from the set of occurrences. As can be seen from Figure 3.1, theleft contexts for both seeds are the same which is “r><tr><td>”. The middle1 andmiddle2 contexts are also the same, while the right contexts only di�er in the lastcharacter (“I” and “S”). The result of comparing the left, middle1, middle2, and rightcontexts are “r><tr><td>”, “</td><td>”, “</td><td>”, and “</td><td>”respectively. The detail of the process is explained next.
Algorithm 3 shows how we find the occurrences of the seeds. To find an occur-rence of a tuple seed with n elements in a Web page, we use a regular expression in theform of (.{1, max_context_length})e1(.*)e2(.*) ... en(.{1, max_-context_length})(line 2) where max_context_length is a variable controlling the number of char-acters. The order of each element ei in the regular expression is the same as theorder of each element of the tuple seeds. Each occurrence of a seed is denoted bya (n+1)-tuple: <left, middle1, middle2, . . . , middlen≠1, right>. The left representsa sequence of characters max_context_length preceding the first element (e1) (line5), right represents a sequence of max_context_length characters following the lastelement (en) (line 6), and middlei represents a sequence of characters between theith and the (i+1)th element of this occurrence (line 9-12).
Algorithm 3: FindSeedsOccurrencesInput : A set of seeds R = {T1, T2, ..., TNs}, a document d
Output: A set of left contexts LC, a set of right contexts RC, and sets ofmiddle contexts MC1, MC2, ..., MCn≠1
1 foreach Ti œ R do2 Oi = {occurrences of Ti in d};3 if Oi ”= ÿ then4 foreach o œ Oi do5 left = {characters of length max_context_length preceding e1};6 right = {characters of length max_context_length following en};7 LC = LC fi left;8 RC = RC fi right;9 for i Ω 1 to n ≠ 1 do
10 middlei = {characters between i and i+1 element};11 MCi = MCi fi middlei;12 end13 end14 end15 end16 return LC, RC, MC1, ..., MCN ;
Once all occurrences of each of the tuple seeds are found, we then try to infer

3.2. PROPOSED APPROACH 33
pattern from each of the set of contexts as shown in Algorithm 4. We do a character-wise comparison for pairs of left and right contexts (line 1-8) and take the longestcommon string as the result (LCWrap, RCWrap). For the right context, we do thecomparison from left to right while for the left part we have to inverse the process.As for the middle contexts, we generate a common regular expression from pairs ofthe context using a slightly modified edit distance algorithm as shown in Algorithm 5(line 9-14). The results are denoted as MCWrap1, MCWrap2, ..., MCWrapn≠1 foreach of the middle contexts. The set of wrappers is then defined as the combinationsof each of the LCWrap, MCWrap1, MCWrap2, ..., MCWrapn≠1, and RCWrap
(line 15). We use the generated wrapper to extract candidates from the Web page.The extraction process is fairly straightforward. We add a capturing group, denotedby (.*?) in the regular expression, in between the LCWrap, MCWrap1, MCWrap2,..., MCWrapn≠1, and RCWrap. We then use regular expression parser to searchfor its occurrences in the Web page and extract the intended information from thecapturing group.
Algorithm 4: WrapperGenerationInput : A set of left contexts LC, a set of right contexts RC, and sets of
middle contexts MC1, MC2, ..., MCn≠1Output: A set of wrappers Wrappers
1 foreach pairs of lc œ LC do2 LCSLeft = LongestCommonSu�x(lc);3 LCWrap = LCWrap fi LCSLeft;4 end5 foreach pairs of rc œ RC do6 LCPRight = LongestCommonPrefix(rc);7 RCWrap = RCWrap fi LCPRight;8 end9 for i Ω 1 to n ≠ 1 do
10 foreach pairs of mc œ MCi do11 MCRegex = CommonRegularExpression(mc);12 MCWrapi = MCWrapi fi MCRegex;13 end14 end15 Wrappers = {combinations of LCWrap, MCWrap1, MCWrap2, ...,
MCWrapn≠1, RCWrap};16 return Wrappers;
Algorithm 5 shows the process of generating the common regular expression forpairs of the middle contexts. The algorithm is based on the edit distance (Leven-shtein distance [122]) algorithm. The true purpose of the edit distance algorithm isto calculate the minimum number of operations (insert, update, delete) needed totransform a string A to string B. In our perspective, however, this algorithm canbe used to generate a common regular expression of two strings by replacing when-

34 CHAPTER 3. SET OF TUPLES EXPANSION
Algorithm 5: CommonRegularExpressionInput : Two strings s[1..m], t[1..n]Output: A regular expression
1 for i Ω 1 to m do2 d[i, 0] Ω i;3 end4 for j Ω 1 to n do5 d[0, j] Ω j;6 end7 min Ω 0; result Ω “”;8 for j Ω 1 to n do9 currmin Ω min;
10 min Ω length(s)+1;11 for i Ω 1 to m do12 if s[i] = t[j] then13 d[i, j] Ω d[i ≠ 1, j ≠ 1];14 else15 d[i, j] Ω minimum(d[i ≠ 1, j] + 1, d[i, j ≠ 1] + 1, d[i ≠ 1, j ≠ 1] + cost);16 end17 if d[i, j] < min then18 min Ω d[i, j];19 end20 end21 if min > currmin then22 result Ω result + “.”;23 else24 result Ω result + t[i ≠ 1];25 end26 end27 return result;

3.2. PROPOSED APPROACH 35
Table 3.1: An example of calculating edit distance of two strings< / a > _
0 1 2 3 4 5: 1 1 2 3 4 5_ 2 2 2 3 4 4< 3 2 3 3 4 5/ 4 3 2 3 4 5b 5 4 3 3 4 5> 6 5 4 4 3 4_ 7 6 5 5 4 3
ever there is an operation of insert, update or delete with a “.”. The dot characterin regular expression stands for any character. The input to the algorithm is twostrings with size m and n. The algorithm then starts with the initialization of anm ú n matrix d (line 1-6). The usual edit distance process is then carried out (line8-19) with the exception of line 9-10. We add the two lines of code to calculate thecurrent minimum score of the j-th row. We add a check (line 21-25) to see whetherthe current row’s minimum score is greater than the previous row’s minimum. Ifyes, this means that there is an operation performed on the current row and thuswe add a “.” to the result string. Otherwise, the “edit cost” for the current rowis the same as in the previous one, then we just add the current character to theresult string. To illustrate the idea, let us use “:_</b>_” and “</a>_” as thetwo input strings. The edit distance matrix for these two strings is shown in Table3.1. We start at the top left corner of the matrix where the value is 0 and this iswhat we call the current minimum (currmin). Next, on row 1, we check that theminimum value of row 1 is 1 and this is greater than the currmin which is 0, thuswe can conclude that there is an operation performed here. We add “.” to the resultand set currmin to 1. Next, in row 2, the minimum value is 2 and this is greaterthan the currmin, thus we add another “.” to the result. We continue finding theminimum value of each row and compare it with the currmin until we reach the lastrow. The result of the algorithm for the example above is “..</.>_”.
We briefly mentioned in Section 3.2 that one of the challenges that arise due tothe composite seeds is that each of the element of the seed may appear arbitrar-ily on a Web page. Consider the seed, <Indonesia, Jakarta, Indonesian Rupiah>.The regular expression used by Algorithm 4 to locate the occurrences of the previ-ous seed would be: “(.{1, max_context_length})Indonesia(.*)Jakarta(.*)IndonesianRupiah(.{1, max_context_length})”. This regular expression would fail to detect anoccurrence of the seed if the element ’Indonesian Rupiah’ appears at the beginningof the Web page and then is followed by ’Indonesia’ and ’Jakarta’ respectively. Ifwe do not consider such a case then we would not find any occurrence of the tuplein the Web page and can not generate any wrapper. To tackle this problem, wealso consider locating the occurrences of the permutations of elements of the seed.Algorithm 6 shows how we generate wrappers for all of the possible permutations ofthe elements of the seed. For the set of seeds with n elements, we first generate allthe possible permutation of order n (line 1). We denote the order of the elementsfrom the given seeds as the “actual” order. Next, for each generated order o, wereorder the elements of each seed accordingly (line 4-7). Using the new set of seeds

36 CHAPTER 3. SET OF TUPLES EXPANSION
we then infer the wrapper from the Web page (line 8). We return as the output ofthe algorithm pairs of the inferred wrappers and the order of elements of the seedwhich is used to infer the wrappers (line 10). We refer the wrappers generated byAlgorithm 6 as permutated wrappers. All of the candidates extracted using thesepermutated wrappers need to put back into the order of the given seeds.
Algorithm 6: GenerateWrappersWithPermutationInput : A set of seeds R = {T1, T2, ..., TNs}, a document d
Output: A set of left contexts LC, a set of right contexts RC, and sets ofmiddle contexts MC1, MC2, ..., MCn≠1
1 Order = {generate permutation of order n};2 foreach o œ Order do3 R_new = ÿ;4 foreach r œ R do5 r
Õ = Reorder(r, o);6 R_new = R_new fi r
Õ;7 end8 Wrappers =
{WrapperGeneration(FindSeedsOccurrences(R_new, d))};9 end
10 return Wrappers, Order;
3.2.3 RankingWe adopt the ranking mechanism introduced in SEAL [24]. The nodes in the graphrepresent entities, i.e. seeds, Web page, wrapper, candidate and domain. The do-main entity shows to which a Web page belongs to. This type of entity is notmandatory in the graph used by SEAL. We argue di�erently because this relation-ship is important to produce a ranked list of domains which are relevant to theseeds. This is byproducts of our ranking mechanism where we can not only answerthe previous query but also others such as the most relevant Web pages to the seeds,etc. An edge relates two entities if there is a relationship between them. For exam-ple, an edge exists from seeds to Web pages because the corresponding Web pagesare retrieved by using the seeds as the query to search engine. The entities and itsrelationships used in our graph of entities are summarised in Table 3.2.
The process of building the graph of entities is shown in Algorithm 7. To havea better understanding of the algorithm, consider Figure 3.2 where we have a setof three seeds <Indonesia, Jakarta, Indonesian Rupiah>, <Singapore, Singapore,Singapore Dollar>, and <Malaysia, Kuala Lumpur, Malaysian Ringgit>. The firststep of building the graph is to query the search engine using the three seeds (line 2).Suppose that we find two Web pages, http://1min.in/content/international/currency-codes and http://www.science.co.il/International/Currency-codes.asp after running the query. Each of the set of Web pages is then added as a new

3.2. PROPOSED APPROACH 37
Algorithm 7: BuildGraphInput : A set of seeds R = {T1, T2, ..., TNs}Output: A graph G = {V, E}
1 V = ÿ; E = ÿ; V = V fi R;2 P = FindDocuments(R);3 foreach Pi œ P do4 V = V fi Pi;5 d = FindDomain(Pi);6 V = V fi d;7 E = E fi {< Pi, BELONG_TO, d >, < d, INV _BELONG_TO, Pi >};8 foreach r in R do9 E = E fi {< Pi, INV _RETRIEV E, r >, < r, RETRIEV E, Pi >};
10 end11 if UsePermutation then12 Wrappers, Order = {GenerateWrappersWithPermutation(R, Pi)};13 else14 Wrappers = {WrapperGeneration(FindSeedsOccurrences(R, Pi))};15 end16 if Wrappers ”= ÿ then17 foreach w œ Wrappers do18 V = V fi w;19 E = E fi {< Pi, GENERATE, w >, <
w, INV _GENERATE, Pi >};20 Candidates = {extract tuples from Pi using w};21 if Candidates ”= ÿ then22 foreach c œ Candidates do23 if UsePermutation then24 c = PutToOriginalOrder(c, Order);25 end26 V = V fi c;27 E = E fi {< w, EXTRACT, c >, <
c, INV _EXTRACT, w >};28 end29 end30 end31 end32 end33 return G;34 Function FindDocuments(A set of seeds R = {T1, T2, ..., TNs})35 P ={retrieve set of pages containing R};36 return P ;37 end

38 CHAPTER 3. SET OF TUPLES EXPANSION
Table 3.2: The list of entities and relationships of the graph of entities in STEPSourceNode
Relation TargetNode
Seeds RETRIEVE Web pageWeb page GENERATE Wrapper
BELONG_TO DomainINV_RETRIEVE Seeds
Wrapper EXTRACT CandidateINV_GENERATE Web page
Candidate INV_EXTRACT WrapperDomain INV_BELONG_TO Web page
node to the graph (line 4). We find the domain to which the Web page belongsto, and then add the domain to the set of nodes (line 5-6). We add edges betweenthe Web page and the domain (line 7). We also connect the Web page to each ofthe seeds (line 8-10). Using the set of seeds and the Web page, we then generatethe set of wrappers (line 11-15). Recall that there are two ways of generating thewrappers: using Algorithm 4 or Algorithm 6. The latter is used when we also takeinto consideration that the elements of the seeds can be found arbitrarily in a Webpage and not necessarily be in the same order as the given seeds. As can be seenfrom Figure 3.2, from http://1min.in/content/international/currency-codeswe generate two wrappers. Each of the wrappers is then added as a node to thegraph (line 18) and its relationships to the Web page is added as edges (line 19).For each of the wrappers, we try to extract candidates from the Web page (line20). If we are succeeded to do so, then we add each candidate as a node as wellas create the edge between the candidate and wrapper (line 22-28). Note that ifwe extract the candidates using a permutated wrapper, then we need to put theorder of the elements of the extracted candidates the same as the order of the givenseeds (line 23-25). From the leftmost wrapper in Figure 3.2, we extract the threecandidate tuples <United Kingdom, London, Poundsterling>, <USA, WashingtonDC, US Dollar>, <France, Paris, Euro> and create edges between the nodes.
Aú = (A ≠ I)≠1 (3.1)
After the graph is generated, an iterative process is run to do a random walk [76]on the graph. The weight assigned to each node, once the iterative process has beencompleted or reaches a stationary probability, is then used to produce a rankinglist of entities. However, the exact solution to finding the stationary probability ofa random walk in a graph consisting of calculating Equation 3.1, where A and Iare the transition matrix and the identity matrix respectively. The random walkproblem is not only computationally expensive but also does not work for specialcases of graph, i.e. graph whose nodes have no outgoing edges (dangling nodes) andgraph with disconnected components. In this case, all nodes receive 0 as their finalweight. This is counter intuitive because only nodes that have no incoming edgeshould receive 0 as their final weight. In the latter case, the notation of ranking

3.2. PROPOSED APPROACH 39
pages from one connected component to another connected component becomesambiguous. Page et. al. [77] give the solution to this problem by introducing apositive constant p between 0 and 1, which they call the damping factor. They alsodefine the PageRank matrix (or Google matrix) of the graph by Equation 3.2. Adenotes the initial distribution of the nodes while B is the “teleportation” probability.The teleportation probability is an n-by-n matrix with every entry equals to 1
n. The
matrix M models the random walk as follows. If we are at a node i, on the nextmove, most of the time, we follow the outgoing edges from i to one of its neighboringnodes. A smaller, but a positive percentage of the time, we leave the current nodeand choose arbitrarily a new node from the graph and “teleport” to this node. It hasalso been proven in [123] that PageRank algorithm performed competitively againstother ranking methods, i.e. Random Walk with Restart [124], Bayesian Sets [125],and Wrapper Length [123]. Due to these reasons, we choose to apply PageRank onthe graph of entities. The weight computed by PageRank for each node can then beused to rank nodes of the same type. The candidates presented as the output of thesystem are ranked based on their PageRank weight. We are also able to produce aranked list of the domain given the seeds. This can be viewed as the most relevantdomain for a particular user’s query.
M = (1 ≠ p) · A + p · B (3.2)
Figure 3.2: An illustration of the graph of entities

40 CHAPTER 3. SET OF TUPLES EXPANSION
3.3 Performance Evaluation
3.3.1 Experiment SettingWe implement our approach into a system of extracting tuples from the Web. Toevaluate the performance of the system, we first manually define several topics whereeach topic defines a set of tuples or table. To compare the candidates extracted bythe system, we manually construct the ground truth for each topic by collectingdata from various reference Web pages. These reference Web pages are manuallyidentified using various search engines including Google1 and Google Tables2. Wehave inspected and fixed typos and errors in the resulting tables. All the tuples thatthey contain are correct. The reference tables are generally complete to the extentdiscussed below for individual topics. For each topic, we define a query consistingof two to four example tuples from the reference table. For the sake of fairness, inthe experiments presented here, we artificially exclude the Web pages that are usedto construct the ground truth for the crawling results. The eleven topics, queries,and their corresponding reference ground truth are presented in Table 3.3.
We use two metrics to measure the e�ectiveness of the system. We measure theprecision and recall of the system for the top-K results for varying values of K (Kdenotes the number of candidates). While the candidates are ranked, the list ofreferences given as ground truth is not. Let O be the candidates extracted by thesystem and B is the ground truth. The Precision, p, is the percentage of correctcandidates among O. The Recall, r, is the percentage of correct candidates amongall possible correct candidates. p and r are defined in Equation 3.3.
p =q|O|
i=1 Entity(i)|O|
; r =q|O|
i=1 Entity(i)|B|
(3.3)
Entity(i) is a binary function that returns 1 if the i-th candidate belongs to theground truth and 0 otherwise.
There are several options for crawling. The simplest is to present all seeds as theyare given as a set of keywords to the search engine. Alternatively, we can considerpermutations of the elements in the seeds. As we have discussed in Section 3.2.1, wedo not consider such permutations in the crawling phase due to the high number ofpossible permutations. However, we take into consideration the permutation of theelements in the wrapper generation and extraction phases. In the first experimentdenoted by “OR” in Table 3.4 and 3.5, the keywords are ordered as they appear in theseed tuple. We generate the wrapper for the “OR” experiment using Algorithm 4.The result is shown in the corresponding rows. In the experiment denoted by “PW”in tables 3.4 and 3.5, we use all permutations of keywords. For example, if the seedis <Indonesia, Jakarta, Indonesian Rupiah>, then we also search for <Indonesia,Indonesian Rupiah, Jakarta>, <Jakarta, Indonesia, Indonesian Rupiah>, etc. Inthis second approach, we use Algorithm 6 to generate the wrappers. Note that ifthe candidates are extracted by what we refer as permutated wrappers then before
1http://www.google.com
2https://research.google.com/tables

3.3. PERFORMANCE EVALUATION 41
Table 3.3: Topics used for performance evaluation in the set of tuples expansionTopics Seeds Reference
DT1 - Airports<London Heathrow Airport, London>,<Charles De Gaulle International Airport,Paris>, <Schipol Airport, Amsterdam>
http://www.kccusa.com/airport-codes
DT2 - Universities
<Massachusetts Institute of Technology(MIT), United States>, <Stanford Uni-versity, United States>, <University ofCambridge, United Kingdom>
https://www.theguardian.com/
higher-education-network/2011/sep/05/
top-100-universities
DT3 - Car brands <Chevrolet, USA>, <Daihatsu, Japan>,<Kia, Korea>
http://www.autosaur.com/
car-brands-complete-list
DT4 - US agencies <ARB, Administrative Review Board>,<VOA, Voice of America>
http://www.fedjobs.com/chat/agency_
acronymns.html
DT5 - Rock bands <Creep,Radiohead>, <Black Hole Sun,Soundgarden>, <In Bloom, Nirvana>
https://en.wikipedia.org/wiki/List_of_
downloadable_songs_for_the_Rock_Band_
series
DT6 - MLM <mary kay, usa>, <herbalife, usa>, <amway,usa>
https://www.businessforhome.org/2015/04/
100-solid-top-mlm-companies/
DT7 - Olympic <1896, Athens, Greece>, <1900, Paris,France>, <1904, St Louis, USA>
https://www.google.com/mymaps/viewer?
mid=1rb34I18jAquXiPT_EP9E4diE6QU&hl=en
DT8 - FIFA Player<2015, Lionel Messi, Argentina>, <2014,Cristiano Ronaldo, Portugal>, <2007, Kaka,Brazil>, <1992, Marco van Basten, Nether-lands>
http://www.topendsports.com/sport/
soccer/list-player-of-the-year-fifa.htm
DT9 - US Governor <Rick Scott, Florida, Republican>, <AndrewCuomo, New York, Democratic>
https://en.wikipedia.org/wiki/List_of_
current_United_States_governors
DT10 - Currency<China, Beijing, Yuan Renminbi>,<Canada, Ottawa, Canadian Dollar>,<Iceland, Reykjavik, Iceland Krona>
http://1min.in/content/international/
currency-codes
adding the candidates to the graph we have to change the order of its elements tomatch the order of the elements of the given seeds. This is done to ensure that eachelement of the candidates matches the semantic class of the corresponding elementin the seeds.
The rows of Table 3.4 and 3.5 correspond to topics DT1 to DT11. For eachtopic, we report the results of both experiments, OR and PW. We select 10, 25, 50,100, 200, 300, 400 as the values for K. The value inside the brackets, for example(441) for row DT1 and K=400 for the “OR” experiment, gives the number of theextracted tuples from the Web (|O|=441).
3.3.2 Result and DiscussionFrom Table 3.4 we can see that, for topics DT1, DT3, DT4, and DT10, we achievea precision of at least 0.78. When we look closely at the details of the result ofthe experiments, we find that the extracted candidates come from a single Webpage except for topic DT3. The system extracts 441 candidates from http://www.airportcodes.us/airports.htm for topic DT1, but seven candidates are notincluded in our ground truth. We check and find that these 7 candidates are actu-ally spelled di�erently. For example, N’Djamena Airport is written as N_Djamena

42 CHAPTER 3. SET OF TUPLES EXPANSION
Airport, Marseille / Provence Airport is written as Marseille/Provence Airportand Dakar - Yo� International Airport is written as Dakar _ Yo� InternationalAirport. For topic DT4, 332 candidates are extracted from http://www.onvia.com/business-resources/articles/guide-government-acronyms. 18 of the ex-tracted candidates are rejected by our ground truth from which 13 are again spelleddi�erently. For example, Bio-informatics is written as Bioinformatics, Organiza-tion as Organisation. Other problems we encounter include the omission of anapostrophe, special characters (“&”), additional information and acronyms.This leaves only five of the extracted candidates that objectively are not includedin the ground truth. For topic DT10, we extract 274 candidates from http://www.science.co.il/International/Currency-codes.asp. 240 out of the 274extracted candidates are correct. Four entries from our ground truth are miss-ing in the extracted candidates because we extract the encoded character “&” as“&” as part of the data instead of “&”. For topic DT3, 87 candidates are ex-tracted from four di�erent Web pages of which 68 are included in the ground truth.Two out of four Web pages from which we extract the candidates for this topicare Youtube pages (https://www.youtube.com/watch?v=dF0bTRbTEDE, https://www.youtube.com/watch?v=o6U7KIgkt_c). This case illustrates the versatility ofsources of information on the World Wide Web.
Table 3.4: Precision of top-K (K = 10, 25, 50, 100, 200, 300, 400) candidates(OR=Original order, PW=Permutation in wrapper)
DataTop-K
10 25 50 100 200 300 400
DT1 -
Airports
OR 1.0 1.0 1.0 0.99 0.985 0.98 0.984 (441)PW 1.0 1.0 1.0 0.99 0.98 0.98 0.984 (441)
DT2 -
Universities
OR 0.7 0.44 0.3 0.24 0.13 0.1 0.08 (473)PW 0.7 0.4 0.26 0.23 0.135 0.1 0.07 (542)
DT3 -
Car brands
OR 0.9 0.84 0.92 0.78 (87) 0.78 (87) 0.78 (87) 0.78 (87)PW 0.9 0.84 0.84 0.76 0.75 (102) 0.75 (102) 0.75 (102)
DT4 -
US agencies
OR 1.0 1.0 0.96 0.97 0.935 0.943 0.945 (332)PW 1.0 1.0 0.98 0.94 0.94 0.95 0.945 (332)
DT5 -
Rock bands
OR 0.2 0.28 0.32 0.32 0.19 0.156 0.156 (319)PW 0.2 0.28 0.34 0.3 0.225 0.186 0.133 (1813)
DT6 -
MLM
OR 0.6 0.52 0.66 0.59 0.365 0.403 0.39 (330)PW 0.6 0.44 0.28 0.35 0.36 0.243 0.182 (884)
DT7 -
Olympic
OR 0.9 0.56 0.44 0.23 0.135 0.135 (200) 0.135 (200)PW 0.9 0.64 0.44 0.22 0.11 0.073 0.044 (624)
DT8 -
FIFA player
OR 0.2 0.24 0.12 0.07 0.075 0.069 (215) 0.069 (215)PW 0.3 0.24 0.12 0.1 0.06 0.056 (284) 0.056 (284)
DT9 -
US governor
OR 0.6 0.68 0.46 0.23 0.125 0.113 (220) 0.113 (220)PW 0.5 0.48 0.48 0.24 0.13 0.116 (223) 0.116 (223)
DT10 -
Currency
OR 1.0 1.0 0.66 0.83 0.91 0.875 (274) 0.875 (274)PW 1.0 1.0 0.66 0.83 0.91 0.875 (274) 0.875 (274)
DT11 -
Formula 1
OR 0.9 0.36 0.18 0.19 0.18 0.152 (289) 0.152 (289)PW 0.7 0.48 0.24 0.12 0.11 0.073 0.055 (798)
For other topics, the precision is below 0.5. There are several reasons why the per-formance of these topics is low. Topic DT2 is concerned with universities and theircountry. We rely on Google table (http://research.google.com/tables) to provide uswith the source for our ground truth. We searched “NUS Singapore Oxford UK” andused the data from the top-100 QS ranking for computer science and information

3.3. PERFORMANCE EVALUATION 43
Table 3.5: Recall of top-K (K = 10, 25, 50, 100, 200, 300, 400) candidates(OR=Original order, PW=Permutation in wrapper)
DataTop-K
10 25 50 100 200 300 400
DT1 -
Airports
OR 0.022 0.056 0.1133 0.2244 0.4467 0.66 0.984 (441)PW 0.0226 0.056 0.1133 0.2244 0.44 0.66 0.984 (441)
DT2 -
Universities
OR 0.07 0.11 0.15 0.24 0.26 0.3 0.38 (473)PW 0.07 0.1 0.13 0.23 0.27 0.3 0.38 (542)
DT3 -
Car brands
OR 0.086 0.201 0.442 0.653 (87) 0.653 (87) 0.653 (87) 0.653 (87)PW 0.086 0.201 0.403 0.73 0.74 (102) 0.74 (102) 0.74 (102)
DT4 -
US agencies
OR 0.014 0.035 0.067 0.136 0.262 0.397 0.441 (332)PW 0.014 0.035 0.068 0.132 0.264 0.4 0.441 (332)
DT5 -
Rock bands
OR 0.001 0.0036 0.0083 0.0167 0.0199 0.0246 0.0277 (319)PW 0.001 0.0036 0.0089 0.015 0.023 0.029 0.1269 (1813)
DT6 -
MLM
OR 0.0625 0.135 0.343 0.614 0.76 1.0 1.0 (330)PW 0.0625 0.1145 0.1458 0.3645 0.75 0.76 1.0 (884)
DT7 -
Olympic
OR 0.3 0.46 0.73 0.76 0.9 0.9 (200) 0.9 (200)PW 0.3 0.53 0.73 0.73 0.73 0.73 0.93 (624)
DT8 -
FIFA player
OR 0.08 0.24 0.24 0.28 0.6 0.6 (215) 0.6 (215)PW 0.12 0.24 0.24 0.4 0.48 0.64 (284) 0.64 (284)
DT9 -
US governor
OR 0.12 0.34 0.46 0.46 0.5 0.5 (220) 0.5 (220)PW 0.1 0.24 0.48 0.48 0.52 0.52 (223) 0.52 (223)
DT10 -
Currency
OR 0.04 0.102 0.135 0.34 0.74 0.98 (274) 0.98 (274)PW 0.04 0.102 0.135 0.34 0.74 0.98 (274) 0.98 (274)
DT11 -
Formula 1
OR 0.136 0.136 0.136 0.287 0.54 0.66 (289) 0.66 (289)PW 0.106 0.181 0.181 0.181 0.33 0.33 0.66 (798)
systems departments3. Our system is able to extract 234 candidates. However, mostof them are not in the ground truth. For example, we find <Swiss Federal Instituteof Technology Zurich, Switzerland>, <University of Illinois at Urbana-Champaign,United States>, <Technical University of Denmark, Denmark>, <Delft Universityof Technology, Netherlands>, <The University of Tokyo, Japan> in the top 20 ex-tracted candidates. They are indeed universities but are not in the top 100 QSranking for computer science and information systems departments. This illustratesthe inherent ambiguity of the concept set amplified by the set of seeds in a hierarchyof concepts. The top 100 universities for computer science and information systemsdepartment are universities. We face a similar problem with topics DT5 and DT6.For topic DT5, the ground truth has a large number of entries (1907). Our system isable to extract 289 candidates where only 43 of the extracted candidates are in theground truth. Topics DT6, DT7, DT8, and DT11 yield poor precision yet achievegood recall.
The presentation of data on a Web page clearly also has an impact on the pre-cision and recall of our system. With topic DT9, where we look for US governornames, the states governed and the political parties, we retrieve a Web page at theURL http://www.ontheissues.org/2014_State.htm. We process the page andgenerate a wrapper of the form “.htm’>(.*?)</a> (.*?) (.*?) Governor”. The threecapturing groups, denoted by (.*?) in the wrapper, correspond to the three elementsin the tuple. When we look at the wrapper, the second and third element of the tupleis separated by a blank space. In this case, the separator (blank character) is verycommon which leads to the failing of the wrapper in extracting the correct infor-
3https://www.theguardian.com/higher-education-network/2011/sep/05/
top-100-universities-world-computer-science-and-information-systems-2011

44 CHAPTER 3. SET OF TUPLES EXPANSION
Table 3.6: Running time of STEP (in minutes)DT1 DT2 DT3 DT4 DT5 DT6 DT7 DT8 DT9 DT10 DT11
CrawlingOR 0.1639 0.8237 0.9403 0.0707 0.7330 1.210 0.7831 0.4848 0.7375 0.2926 0.7584PW 0.2628 0.6322 0.7095 0.0546 0.4996 0.7929 0.5590 0.3833 0.6147 0.1351 0.5262
Wrapper
Generation
OR 0.0009 0.0044 0.0028 0.0003 0.0010 0.0010 0.0013 0.0022 0.0004 0.0003 0.0012PW 0.0008 0.0029 0.0071 0.0005 0.0020 0.0017 0.0014 0.0036 0.0011 0.0004 0.0020
ExtractionOR 0.0004 0.5695 0.0056 0.0001 0.0257 0.0136 0.0037 0.0117 0.0013 0.0002 0.1912PW 0.0005 0.7493 0.0080 0.0001 0.0985 0.0182 0.0043 0.0145 0.2852 0.0003 0.6291
RankingOR 0.0079 0.0244 0.0037 0.0054 0.0119 0.0096 0.0091 0.0059 0.0036 0.0033 0.0096PW 0.0043 0.0168 0.0036 0.0043 0.0564 0.0208 0.0132 0.009 0.0078 0.0064 0.0272
mation. For example, if we have the text “...martinez.htm’>Susana Martinez</a>New Mexico Republican Governor” and apply our wrapper to the text, the threematching groups correspond to “Susana Martinez”, “New” and “Mexico Republi-can”. Thus the candidate extracted from the text is <Susana Martinez, New, MexicoRepublican>. This extracted candidate is rejected by the system because the correctentry in the ground truth is <Susana Martinez, New Mexico, Republican>.
Using seeds with an element that is a member of more than one semantic class(multifaceted element) can also hurt the precision of the system. In Section 3.1 weconsider an element e as a member of a semantic class si if and only if e is œ si butnot in S \ si. Nevertheless, we come across cases where this multifaceted elementa�ects the performance of our system. For example, when we want to extract citiesin the United Kingdom (UK) and use <Liverpool>, <Manchester>, <Norwich> asthe input to the system, the system fails to extract the correct candidates. Insteadof extracting other cities in the United Kingdom, our system extracts football clubs<Chelsea>, <Arsenal>, <Tottenham>. This and the issue raised by the results fortopics DT2, DT5 and DT6 compel for the use of ontological information and suggestthe new problem of set labelling (Chapter 7). From table 3.5, we can see that therecall values for topics DT1, DT3, DT6, DT7, DT8, DT9, DT10, and DT11 aremore than 0.5. For topic DT6, we register a perfect recall score of 1.0. This meansthat our system can extract candidates correctly. Nevertheless, due to the lack ofsource Web pages with the information sought, the number of extracted candidatesis at least half of that in the ground truth. The lack of source Web pages is relatedto the search in Google. In this experiment, we use the concatenation of all theseeds as keywords to the Google search engine. This limits the number of Webpages returned by Google. For example, in the experiment for topic DT4, we use“ARB Administrative Review Board VOA Voice of America” as the search keywordto Google and only retrieve one Web page. From this Web page, we extract 332candidates and 314 are in the ground truth. It receives less than 0.5 on the recallscore because the ground truth contains 712 entries. For topic DT4, the lack of Webpage retrieved from Google a�ects the recall of our system.
In topic DT5, we have 1907 entries of songs and the singers. Our seeds consistof <Creep, Radiohead>, <Black Hole Sun, Soundgarden>, <In Bloom, Nirvana>.All of the seeds come from a typical genre of music which is rock. But in our exper-iment, the extracted candidates come from a di�erent music genre. For example,<Can This Be Love, Jennifer Lopez> and <Louie, Nelly> are from R&B and rapgenre respectively. This happens because the Web pages retrieved from Google donot specifically belong to one music genre. Furthermore, some Web pages provide

3.3. PERFORMANCE EVALUATION 45
information about music in general. To improve the recall values of the systemwe need to be able to direct our search on Google to match the intended targetinformation or choose a reliable Web page as the source for ground truth. TopicDT2 receives low recall because the ground truth only has 100 entries whilst weextract many candidates. Although the extracted candidates belong to the samesemantic group (universities) since it is not included in the ground truth, the recallvalue becomes low. For the experiment with topic DT6 (MLM), the system receivesthe maximum score (1.0) for recall. Our ground truth includes 96 entries and thesystem manages to extract it from various Web pages. In fact, when we check on theextracted candidates, the system is able to extract many “true” candidates whichare not in the list of ground truth. In this context, the word “true” means that thecandidate belongs to the same semantic group as the seeds, but is missing from theground truth.
Now we look at the impact of elements permutation in tuple seeds for wrappergeneration. In general, permutation has a negative impact on the precision of thesystem while the recall is positively a�ected. The precision of the system becomeslower because we extract more candidates. However, this also increases the possibil-ity of extracting “junk”. This happens to topics DT2, DT3, DT5, DT6, DT7, DT8,and DT11. From table 3.4, the precision values for topics DT1, DT4, and DT10remain the same for both experiments (OR and PW). For topic DT9, the precisionfor experiment PW slightly increases compared to that of OR because the systemmanages to extract more correct candidates.
To see whether doing the permutation of elements of tuple seeds in wrappergeneration process really improves the system’s performance, we conduct anotherexperiment using topic DT4. The actual seeds are <ARB, Administrative ReviewBoard>, <VOA, Voice of America> and we change the seeds to <AdministrativeReview Board, ARB>, <Voice of America, VOA>. We run the OR experiment andget no result. There is only one Web page retrieved by Google. The system cannotfind any occurrence of the seeds as the order of elements in the seeds is not thesame as the order of occurrences of each element in the Web page. We then run thePW experiment with the same topics. The system manages to retrieve 26 candidatesfrom the Web page. This shows us that doing permutation of each element of a tuplewhen generating the wrapper is indeed improving the performance of our system.
We conduct the above experiments with queries with two to four seeds. We varyand increase the number of seeds in a query in other experiments whose resultsare not reported here. The performance is negatively a�ected by more seeds in thecurrent implementation. The crawling phase returns fewer candidate Web pages.We can see this problem with DT8. We use four seeds as the input and the numberof Web pages retrieved by the search engine is 15 (half of the maximum number of 30pages that we collected for each experiment). This and the above highlight that weneed to find more e�ective ways of collecting candidate Web pages for a sustainablesolution. We are currently working on various ways to improve the crawling phaseaccordingly, for instance by decomposing the query into several subqueries.
The running time for each phase of our system for all topics can be seen in Ta-ble 3.6. The crawling phase consumes most of the time as retrieving Web pages

46 CHAPTER 3. SET OF TUPLES EXPANSION
from Google depends highly on the stability of the connection. Considering permu-tations of elements of the seeds a�ect the running time in the wrapper generationand candidate extraction, as well as the ranking. In wrapper generation, the systemhas to do more runs in order to find the occurrences of the seeds due to the numberof possible permutations. The more wrappers, the more extractions, and the moreentities added to our final graph. This is why the ranking process also needs moretime to complete.
All of the above experiments are run under the setting where we exclude theWeb pages used to build the reference tables constituting the ground truth. We donot consider these reference pages in the crawling and subsequent phases for thesake of fairness. We also run experiments in which we do not exclude the Webpages used to build the ground truth. It is noticeable that these Web pages arenot always discovered by the crawling phase (that these pages are not in the top 30pages returned by the search engine presented with the query string formed from theexamples). Furthermore, when these reference pages are identified by the crawlerand used for the expansion, the performance results (precision, recall, and runningtime) do not di�er significantly. This means that, for the eleven topics, there aregenerally su�ciently enough sources of information on the Web.
Table 3.7: Performance comparison of DIPRE, Ext. SEAL, and STEPAlgorithm
TopicAverage
DT1 DT2 DT3 DT4 DT5 DT6
PrecisionDIPRE 0 0 0 0.945 0.256 0 0.2
Ext. SEAL 0 0.6 0.46 0.93 0 0.6 0.43STEP 0.97 0.07 0.74 0.945 0.136 0.182 0.51
RecallDIPRE 0 0 0 0.845 0.005 0 0.14
Ext. SEAL 0 0.24 0.125 0.83 0 0.88 0.345STEP 0.986 0.38 0.98 0.441 0.126 1.0 0.65
3.4 Comparison with state-of-the-artIn this section, we compare our proposed approach of the set of tuples expansion withtwo state-of-the-art in set expansion systems: DIPRE [16] and Extended SEAL [30].Both DIPRE and Extended SEAL can only extract binary relations, thus to makea fair comparison, we evaluate the performance of DIPRE, Extended SEAL (Ext.SEAL), and STEP in terms of its precision and recall only for extracting binarytuples. For this experiment, we consider only DT1-DT6 from Table 3.3 using thegiven seeds. We run each of the algorithms by giving the seeds as input and retrieveall Web pages (without excluding any reference Web pages). All approaches incomparison find the occurrences of the seeds by locating each element in the sameorder as the order of the elements in the seeds. Next, all algorithms also find theoccurrences of the seeds where the elements are in reversed order. As DIPRE doesnot employ any ranking mechanism, we compare the complete list of candidatesproduced by each algorithm without taking into consideration the ranking of eachcandidate. We set all parameters required by each algorithm to its default values.

3.5. CONCLUSION 47
Table 3.7 shows the result of the comparison of the three approaches. In terms ofthe average precision and recall, STEP outperforms DIPRE and Ext. SEAL. STEPconsistently achieves higher precision than DIPRE on topic DT1, DT2, DT3, DT4,and DT6. Among these topics, DIPRE receives the lowest precision score of 0 inDT1, DT2, DT3, and DT6. As it has been pointed out in Algorithm 1, DIPRE firstcluster the occurrences of the seeds based on their middle contexts. It then enforcesexact matching on the middle contexts before generating the wrapper. Furthermore,it can only infer wrappers from Web pages that use semi-structured templates (e.g.HTML table, ordered or unordered list) to present the data, otherwise, it will fail toachieve the goal. On the other hand, out of the six topics used in this experiment,STEP achieves higher precision scores than Ext. SEAL in topics DT1, DT3, DT5and DT6. As a matter of fact, in topics DT1 and DT5, Ext. SEAL does not extractany candidates, whilst STEP manages to extract 448 and 1759 candidates out ofwhich 435 and 240 are in the ground truth respectively. Ext. SEAL achieves higherprecision than STEP for topics DT2 and DT6. We take a look into the specificsand find that Ext. SEAL only extracts 40 and 140 candidates compare to 542and 884 candidates extracted by STEP. In DT2, the number of candidates whichconform with the ground truth for Ext. SEAL is 24 while STEP 38. However,STEP extracts an order of magnitude larger candidates than SEAL, thus it receivesa lower precision score. We also browse the list of candidates extracted by STEPand find that it contains a large number of university names which do not appearin the ground truth. STEP dominates Ext. SEAL in terms of recall. Indeed, theone case where Ext. SEAL achieves higher recall than STEP is in topic DT4. Inthis topic, Ext. SEAL manage to extract 637 candidates. This number is almostdouble the number of candidates extracted by STEP. In DT6, STEP receives arecall score of 1.0 while SEAL only 0.88 despite the fact that it has a much lowerprecision. This once again proves the fact that STEP extracts more candidates thatappear in the ground truth and relevant to the given seeds. The reason behindthis is that SEAL implements an exact matching algorithm to infer the commonmiddle contexts of all the occurrences of the seeds. This is a very strict requirementbecause Web pages are generated from di�erent templates thus they are highlyunlikely to have the same middle contexts. This failure cause SEAL to not be ableto construct wrappers and hence can not extract any candidates. Our proposedapproach to finding common middle contexts are based on regular expression. Thisallows STEP to be more flexible in constructing the wrapper and extracting thecandidates. From the comparison result, we conclude that our approach is ableto extract more candidates that are relevant to the seeds. This, in turn, helpsthe performance of our approach in optimising the recall while giving comparableprecision to the state-of-the-art.
3.5 ConclusionWe present an approach to the set of tuples expansion from the World Wide Web.The approach consists of three phases: crawling, wrapper generation and data ex-

48 CHAPTER 3. SET OF TUPLES EXPANSION
traction, and ranking. Examples given in the form of tuples create a combinatorialissue for the crawling, wrapper generation, and data extraction. The empirical eval-uation shows that the system is e�cient, e�ective, and practical. The comparisonwith two state-of-the-art approaches shows that STEP consistently extracts morecorrect candidates with refers to the ground truth. Nevertheless, we also highlightsome of the shortcomings of the current system and suggests new engineering andresearch issues to be studied. One of them is the characterisation of the concept char-acterised by the examples. Additional semantics knowledge in the form of integrityconstraints, such as candidate keys, admissible values and ranges, and dependencies,also has the potential to improve crawling, wrapper generation and data extraction.

Chapter 4
Truthfulness in Set of TuplesExpansion
In the previous chapter, we present the set of tuples expansion problem. We proposean approach to tackle the problem by generalising the set expansion problem. Wepresent and detail our approach in each phase, i.e. crawling, wrapper generationand candidate extraction, as well as the ranking method. We extend the idea origi-nally proposed by Wang et al. in [24] and applied a random walk on a heterogeneousgraph of Web pages, wrappers, seeds, and candidates in order to rank the candidatesaccording to their relevance to the seeds. However, this ranking mechanism is notable to reliably determine the true values amongst the extracted candidates. Dis-tinguishing amongst true and false values of some given facts in an automated way,usually known as truth finding, is a challenging problem that has been extensivelystudied in several contexts such as data integration and fact-checking. In this chap-ter, we propose to incorporate a truth finding algorithm into our expansion process.The goal is to be able to present the true candidates to the user and achieve betterperformance in terms of precision, recall, and F-measure. We first formulate theproblem we are addressing in Section 4.1. We then present our proposed approachin Section 4.2. We show the performance of a system implementing our approach inSection 4.3, while Section 4.4 concludes this chapter.
4.1 Problem DefinitionWe address here the problem of finding the true values amongst the candidatesextracted by the set of tuples expansion system. Before we present our approachof leveraging truth finding algorithm into the expansion process, we start with thedefinition of the problem.
We fix the set of candidate tuples T extracted by STEP. These extracted tu-ples represent instances of real-world objects characterised by some attributes (orproperties). We restrict ourselves in this work to the common one-truth frameworkwhere any attribute of every object has only one correct value and many possiblewrong values. We consider fixed finite sets of attribute labels A and values V , as well
49

50 CHAPTER 4. TRUTHFULNESS IN SET OF TUPLES EXPANSION
as a finite set of object identifiers I. Then, we have formally:
Definition 1. A tuple t is a pair (i, v) where i is a given object identifier in I andv a mapping v : A æ V.
Set of tuples expansion algorithm inspects documents using wrappers to extracta collection of tuples, i.e., its statements about the values of some attributes of someobjects: see Example 2. In this setting, we describe a data source as modelled by agiven document (where the value has been extracted) and a wrapper (the extractorof the value). At attribute level, we define indeed a data source as follows:
Definition 2. A source is a partial function S : I ◊ A æ V a with non-emptydomain. A (candidate) ground truth is a total function G : I ◊ A æ V.
Given a data source, a particular tuple t is represented by the set of couples ofthe object identifier and attribute value which share the same object identifier. Thatis, given a source S and two distinct attributes a, a
՜ A we state that S(i1, a) and
S(i2, aÕ) refer to statements about attributes a and a
Õ of the same tuple if i1 = i2where i1 and i2 are object identifiers in I.
Example 2. Reconsidering tuples in Example 1 of Section 2.3, one can observe theseare about the real world object “Country” with their properties (attributes) “CapitalCity” and “Currency”: we have three candidate tuples <Algeria, Alger, Dinar Al-gerian>, <Algeria, Alger, Leka Algerian> and <Algeria, Alger, Dinar Algerian>from three di�erent data sources Source_1, Source_2 and Source_3. Note that inExample 1, for simplicity reasons, the object identifier, i.e. “Algeria” was omittedwhile provided attribute values are “Alger”, “Dinar Algerian” and “Leka Algerian”respectively.
Truth finding problem’s main goal is to determine the actual ground truth basedon the statements of a number of sources. Sources are specifically defined as possiblyincomplete; in particular, they may not cover all attributes:
Definition 3. The attribute coverage of a source S with respect to X ™ A is theproportion of attributes a œ A for which there exists at least one object o œ O suchthat S(o, a) is defined: Cov(S, X) := |{ aœX|÷oœO S(o,a) defined}|
|X|.
Two sources S and SÕ are contradicting each other, i.e. disagree, whenever there
exists i œ I, a œ A such that S(i, a) and SÕ(i, a) are both defined and S(i, a) ”=
SÕ(i, a). A source is correct with respect to the ground truth G on i œ I, a œ A
when S(i, a) = G(i, a), and wrong when S(i, a) is defined but S(i, a) ”= G(i, a). Atruth finding process, such as those reviewed in Section 2.3, is formally defined asfollows:
Definition 4. A truth finding algorithm F is an algorithm that takes as input a setof sources S and returns a candidate ground truth F (S), as well as an estimated ac-curacy Accuracy
F(S) for each source S œ S and confidence score Confidence
F(S(i, a))
for every statement S(i, a) made by a source S on any attribute a of the object i.
4.2. PROPOSED APPROACH 51
A large number of truth finding processes are fixed-point iteration algorithmswhich compute a candidate ground truth based on source accuracy (or trustworthi-ness) values and confidence scores. If a truth finding algorithm F does not specifi-cally use source accuracy values (this is the case, for instance, of majority voting),one can respectively define source accuracy and confidence for F simply as:
AccuracyF (S) :=|{ i œ I, a œ A | S(i, a) = F (S)(o, a)}|
|{ i œ I, a œ A | S(i, a) defined}|(4.1)
For a fixed object identifier i œ I and attribute a œ A, we have:
ConfidenceF (S(i, a)) :=
qSÕœS|SÕ(i,a)=S(i,a) AccuracyF (SÕ
)
|{ SÕ œ S | SÕ(i, a) = S(i, a)}|(4.2)
Example 3. Applying Equation 4.1 on candidate tuples in Example 2, we obtainthe accuracy values of 1, 1/2 and 1 for Source_1, Source_2, and Source_3 re-spectively. Indeed the true values are chosen by voting thus the values for attributes“Capital City” and “Currency” will be “Alger” and “Dinar Algerian”. According toEquation 4.2, the confidence scores of the statements “Alger”, “Algerian” and “LekaAlgerian” will be set to 5/6, 1 and 1/2. Obviously, “Dinar Algerian” comes fromtop-ranked sources, i.e. Source_1 and Source_3, thus is chosen instead of “DinarAlgerian”.
This is how the simplest approach of truth finding, i.e voting, determines the truevalues of some given facts. In our setting, the facts are some values of attributesof some real-world objects. We, therefore, leverage the truth finding algorithm inthe tuples expansion process to find the true values of these attributes and in turndecide the correct candidates. We formally present next such a process.
4.2 Proposed ApproachAs detailed in Section 3.2.3, we build the graph of entities and apply PageRankon the graph before finally rank the candidates based on the weight assigned byPageRank. In this work, we propose to incorporate truth finding algorithm into theexpansion process to decide the true candidates amongst the extracted candidatesand present a ranked list of candidates as the end result. To be able to achieve thisgoal, we need to relate the graph of entities to the truth finding setting.
From Definition 4.1, a truth finding algorithm takes as input a set of statementsmade by sources on any attribute of an object. We consider here the statements asthe tuple candidates and the sources as the Web pages where we derive the wrapperused to extract the corresponding candidates. The overall objective of embeddingtruth finding algorithm into our approach is to improve the candidates presented asthe end result. However, in the set of tuples expansion problem, the concept of anobject and its attributes are not explicitly modelled. However, elements in the seedsand in extracted tuples do have some kind of relationships. Considering the tuple<Angola, Luanda, Kwanza>, one can easily argue that Luanda and Kwanza arethe attributes of Angola. To be consistent with the truth finding setting, we then

52 CHAPTER 4. TRUTHFULNESS IN SET OF TUPLES EXPANSION
technically decompose the object and its attributes in the tuples extracted by oursystem. An object is represented by the first element of the tuple, which is denotedas the object key, while the other remaining elements serve as the attributes. Wefurther use this key element to decompose a tuple into key-attribute binary tuples.The previous tuple is decomposed into <Angola, Luanda> and <Angola, Kwanza>.In general, if a tuple is composed of n elements, then after decomposition we obtainn-1 key-attribute tuples.
Algorithm 8: GenerateFactsInput : A graph of entities G = {V, E}
Output: A set of facts tuples B
1 B = ÿ;2 C = {retrieve all nodes from G where the type of node==“candidates”};3 foreach c œ C do4 p = FindSourceParentOf(c);5 k = c[1];6 for i Ω 2 to n do7 b =< k, Attri≠1, c[i], p >;8 B = B fi {b};9 end
10 end11 return B;
To experiment with state-of-the-art truth finding algorithms presented in Sec-tion 2.3 we rely on the DAFNA platform1. DAFNA provides AllegatorTrack [126]which is a Web application setting up an implementation of most of the state-of-the-art truth finding algorithms within the same setting. AllegatorTrack acceptsas input a set of entries whose main elements consist of an object key, an objectattribute, an attribute value, and a data source. Thus, in each of the key-attributetuple, we have to also include the object’s attribute and the source. The source isthe Web page from which the wrapper used to extract the candidate is derived from.Since the object’s attribute is not known a priori, we simply give “Attr” followed byan index as the label.
We use Algorithm 8 to generate the facts from the graph of entities. We firstretrieve all candidate nodes from the graph (line 2). Then for each node c, we findthe Web page p from which the candidate is extracted from (line 4). We do thisby following the edge from the candidate node to the wrapper and then to the Webpage. The object key k is the first element of the n elements tuple candidate c[1],while the rest of the elements (c[2], ..., c[n]) are the attribute values. Thus, for eachof the attribute values, we form the tuple in the form <k, Attrn≠1, c[i], p> and addit to the result (line 6-9).
STEP produces wrappers for a Web page by combining the left, right and middlecontexts (see Section 3.2.2). This leads to the possibility of extracting the identical
1http://da.qcri.org/dafna/#/dafna/home_sections/home.html

4.3. PERFORMANCE EVALUATION 53
Table 4.1: Excerpt of input dataset in AllegatorTrackObject Attribute Value Source
Angola Attr_1 Luanda http://1min.in/content/international/currency-codes_1
Angola Attr_2 Kwanza http://1min.in/content/international/currency-codes_1
Angola Attr_2 Kuanza http://1min.in/content/international/currency-codes_2
or distinct tuples from the same Web page by means of di�erent wrappers. One hasto observe that a given source cannot provide more than one statement for the sameobject attribute within our truth finding setting. As a result, we refer to the sourceof a given candidate tuple by indexing the name of the inspected Web page withthe number of the used wrapper. Table 4.1 shows an excerpt of an input dataset toAllegatorTrack in which each row consists respectively of the object key, followed bythe attribute of the object, then the value of the attribute, and finally the source.
4.3 Performance Evaluation4.3.1 Experiment SettingWe intensively performed our evaluation on seven topics consisting of a set of tuplesextracted by our STEP system for distinct domains; we have detailed in Section 3.2how our system returns a set of tuples in a certain domain given some seeds. Ta-ble 4.2 summarises the details of the seven topics used in our performance evaluation.Its columns indicate the name of the topic, the number of inspected Web pages, thenumber of wrappers generated from the Web pages, the number of extracted candi-date tuples, the number of distinct candidate tuples, and the number of entries inthe ground truth. Next, we briefly summarise every topic.
• DT1 - Calling Code. We extracted tuples composed of country and theprefix country calling code from the Web. We used the following four seedsas input to STEP: <United States, 1>, <Indonesia, 62>, <France, 33>,<Afghanistan, 93>.
• DT2 - Nobel. We extracted from the Web tuples consisting of a year and thename of Nobel prize winner in Physics. We used the following three seeds asinput to our STEP system: <1921, Albert Einstein>, <1971, Dennis Gabor>,<1938, Enrico Fermi>.
• DT3 - Chat Abbr. We extracted from the Web tuples composed of textingabbreviations or internet acronyms and its descriptions. We used the followingseeds as input: <brb, be right back>, <afk, away from keyboard>.
• DT4 - Currency. We extracted from the Web tuples composed of coun-tries with their corresponding capital cities and currency names. We used thefollowing seeds as input to the STEP System: <Angola, Luanda, Kwanza>,<Bolivia, La Paz, Boliviano>, <India, New Delhi, Rupee>,<Cuba, Havana,Peso>.

54 CHAPTER 4. TRUTHFULNESS IN SET OF TUPLES EXPANSION
• DT5 - FIFA player. We extracted tuples from the Web composed of ayear, the winner of the FIFA player of the year award, and his country oforigin. The seeds are the following: <2015, Lionel Messi, Argentina>, <2014,Cristiano Ronaldo, Portugal>, <2007, Kaka, Brazil>.
• DT6 - Miss Universe. We collected tuples composed of a year, the winnerof Miss Universe beauty pageant, and her country of origin from the Web. Weused the following seeds as input: <2000, India, Lara Dutta>, <2012, USA,Olivia Culpo>,<2015, Philippines, Pia Wurtzbach>.
• DT7 - Oscar. We extracted tuples from the Web composed of a year, theacademy award winner for best actor, and the name of the movie in which theactor is nominated in. We used the following seeds as input: <2016, LeonardoDiCaprio, The Revenant>, <2002, Adrien Brody, The Pianist>, <1995, TomHanks, Forrest Gump>, <1999, Kevin Spacey, American Beauty>.
• Ground Truth Datasets. For performance evaluation of the truth findingalgorithms and PageRank, we also gathered ground truth for each tested topic.To do so, we selected authoritative Web source as a base for the ground truthof each topic and manually extracted golden standard for each extracted objectinstance. The number of entries in each ground truth is indicated in the lastcolumn of Table 4.2.
Our tests intend to compare the precision, recall, and F-measure (a.k.a. the har-monic mean) of PageRank and eleven truth finding algorithms in terms of percentageof true and false candidates according to a certain ground truth. We compute theprecision and recall using Equation 3.3, while F-measure is calculated using Equa-tion 4.3.
F-measure = 2 úp ú r
p + r(4.3)
In Equation 3.3, Entity(i) is a binary function that returns 1 if the i-th candidate isfound in the ground truth and 0 otherwise, |O| is the number of distinct extractedcandidates, and |B| is the size of the ground truth. |O| and |B| is the fifth and lastcolumn in Table 4.2.
Table 4.2: Description of the di�erent topics and corresponding ground truthTopic #Web_Page #Wrapper #Candidate_Tuples #Distinct_Tuples Ground_Truth
DT1 - Calling Code 16 98 5572 1001 239DT2 - Nobel 5 7 446 237 107DT3 - Chat Abbr. 12 11 5758 5167 2697DT4 - Currency 9 39 2473 927 244DT5 - FIFA Player 10 13 260 141 61DT6 - Miss Universe 8 3 130 82 65DT7 - Oscar 6 5 368 337 87
We investigate the correlation of ranking of sources between PageRank, truthfinding algorithms, and the ground truth ranking in terms of precision, recall, andF-measure by computing the weighted Kendall’s Tau score [127] using Equation 4.4.

4.3. PERFORMANCE EVALUATION 55
C and D are the numbers of concordant and discordant pairs from any two rankedlists in comparison.
· =C ≠ D
C + D(4.4)
Table 4.3: Precision measures per-attribute of the di�erent truth finding algorithmsCO 2E 3E DP AC AS AN TF SL GL CM PR
DT1 Attr1 0.172 0.361 0.368 0.360 0.368 0.368 0.368 0.360 0.368 0.360 0.361 0.368
DT2 Attr1 0.137 0.147 0.168 0.147 0.153 0.153 0.153 0.147 0.153 0.153 0.158 0.153
DT3 Attr1 0.246 0.194 0.201 0.241 0.231 0.236 0.231 0.283 0.214 0.220 0.255 0.064
DT4Attr1 0.620 0.667 0.702 0.647 0.676 0.676 0.676 0.632 0.702 0.673 0.647 0.620Attr2 0.084 0 0.017 0.003 0 0 0 0.005 0 0.003 0.005 0.020
DT5Attr1 0.730 0.888 0.873 0.841 0.888 0.888 0.888 0.793 0.888 0.793 0.841 0.888Attr2 0.873 0.841 0.809 0.888 0.873 0.873 0.873 0.873 0.873 0.873 0.873 0.920
DT6Attr1 0.924 0.878 0.924 0.924 0.924 0.924 0.924 0.924 0.924 0.924 0.924 0.939Attr2 0.818 0.787 0.818 0.787 0.838 0.838 0.848 0.803 0.818 0.848 0.787 0.803
DT7Attr1 0.442 0.863 0.915 0.536 0.915 0.915 0.915 0.547 0.915 0.884 0.915 0.410Attr2 0.410 0.810 0.831 0.452 0.831 0.831 0.831 0.494 0.915 0.778 0.831 0.336
We started by experimenting with truth finding algorithms via AllegatorTrack.We considered each of our seven topics and performed on it the following algorithms:Cosine (CO), 2-Estimates (2E), 3-Estimates (3E), Depen (DP), Accu (AC), AccuSim(AS), AccuNoDep (AN), TruthFinder (TF), SimpleLCA (SL), GuessLCA (GL), andCombiner (CM). We ran those tests without changing the default values of themandatory parameters for each algorithm, i.e. the prior source trustworthiness andconvergence threshold which are set by default to 0.8 and 0.001 respectively: theseare default values proven to be optimal. The output of every truth finding algorithmis, for every object’s attribute, a confidence score and a truth label (true or false).To evaluate the performance of truth finding algorithm w.r.t to the ground truth, weonly consider the tuples whose truth labels are set to true. For the sake of fairness,we consider the same extracted candidates for each topic and perform PageRankto it. We only consider tuples with the highest score for each object returned bythe PageRank algorithm. We use the same implementation as well as the identicalexperimentation setting as in our previous work [35].
In the first phase of the experiment, we are interested in finding the best truthfinding algorithm for the set of tuples expansion task. To achieve this, we conductthe following two experiments. In the first experiment we are interested in doing testson topics per attribute, i.e., if a given topic contains objects with several attributes,we have considered sub-topics per attributes and run experiments on each sub-topicseparately. We do such a splitting of each tested topic because we focus on theperformance of the algorithms per attribute, as we later explain with the results inTable 4.3 and Table 4.4. In this perspective, we use “Attr”, the abbreviation foran attribute, and add an index to di�erentiate the di�erent attributes belonging tothe same given topic when the latter has been split into several sub-topics. In thesecond experiment, we conduct tests using every overall topic, i.e. without doing

56 CHAPTER 4. TRUTHFULNESS IN SET OF TUPLES EXPANSION
the splitting according to the attributes. The goal is to study the performance ofthe ranking algorithms on any given entire input topic.
Table 4.4: Recall measures per-attribute of the di�erent truth finding algorithmsCO 2E 3E DP AC AS AN TF SL GL CM PR
DT1 Attr1 0.423 0.887 0.904 0.883 0.904 0.904 0.904 0.883 0.904 0.883 0.887 0.895
DT2 Attr1 0.252 0.271 0.308 0.271 0.280 0.280 0.280 0.271 0.280 0.280 0.290 0.280
DT3 Attr1 0.247 0.195 0.201 0.241 0.232 0.236 0.232 0.284 0.215 0.221 0.255 0.064
DT4Attr1 0.873 0.939 0.988 0.910 0.951 0.951 0.951 0.889 0.988 0.947 0.910 0.873Attr2 0.119 0 0.025 0.004 0 0 0 0.008 0 0.004 0.008 0.029
DT5Attr1 0.754 0.918 0.902 0.869 0.918 0.918 0.918 0.820 0.918 0.820 0.869 0.918Attr2 0.902 0.869 0.836 0.918 0.902 0.902 0.902 0.902 0.902 0.902 0.902 0.951
DT6Attr1 0.938 0.892 0.938 0.938 0.938 0.938 0.938 0.938 0.938 0.938 0.938 0.954Attr2 0.831 0.800 0.831 0.800 0.862 0.862 0.862 0.815 0.831 0.862 0.800 0.815
DT7Attr1 0.442 0.863 0.916 0.537 0.916 0.916 0.916 0.547 0.916 0.884 0.916 0.411Attr2 0.411 0.811 0.832 0.453 0.832 0.832 0.832 0.495 0.916 0.779 0.832 0.337
Table 4.5: Overall precision measures of the di�erent truth finding algorithmsCO 2E 3E DP AC AS AN TF SL GL CM PR
DT1 0.172 0.361 0.368 0.360 0.368 0.368 0.368 0.360 0.368 0.360 0.361 0.366DT2 0.137 0.147 0.168 0.147 0.153 0.153 0.153 0.147 0.153 0.153 0.153 0.153DT3 0.261 0.208 0.213 0.256 0.245 0.244 0.245 0.459 0.226 0.233 0.242 0.069DT4 0 0 0.003 0 0 0 0 0.003 0.000 0.003 0.055 0.128DT5 0.841 0.809 0.809 0.777 0.809 0.809 0.809 0.730 0.809 0.809 0.460 0.079DT6 0.787 0.742 0.818 0.757 0.818 0.818 0.818 0.772 0.787 0.818 0.742 0.696DT7 0.378 0.842 0.915 0.442 0.925 0.915 0.915 0.484 0.915 0.915 0.263 0.010
Average 0.368 0.444 0.471 0.391 0.474 0.472 0.473 0.422 0.465 0.470 0.325 0.214
In the second phase of the experiment, we want to investigate the performanceof the best truth finding algorithm found in the first phase. We start by studyingthe evolution of the truth finding algorithm according to the number of conflictingvalues and sources. As previously explained, the goal of truth finding algorithms isto deterministically integrate conflicting statements and automatically compute aconfidence value for each statement built on the trustworthiness level of its sources.Based on this, our hypothesis is that there is a positive relationship between theaverage number of conflicts and sources with the precision, recall, and F-measure.Next, we evaluate the correlation of the ranking of sources given by the truth findingalgorithm and other rankings based on the precision, recall and F-measure scores.We also study the same correlation from the ranking produced by PageRank. Toachieve this, we first get the ranked list of sources from PageRank and the truthfinding algorithm. An example of the ranked lists for DT1 is shown in Table 4.8.The first column lists all the Web pages’ URL for this topic. We then show theweight assigned by PageRank for each Web page along with its corresponding rank.The next two columns show the accuracy and rank inferred by the truth findingalgorithm. In the last three columns, we show the ranked list of Web pages basedon the precision, recall, and F-measure scores. We calculate the precision, recall,and F-measure score of a Web page by comparing the candidates extracted fromit with the ground truth. We then evaluate the correlation between the ranking of

4.3. PERFORMANCE EVALUATION 57
sources given by PageRank and the truth finding algorithm with the ranking fromthe precision, recall, and F-measure.
4.3.2 Result and DiscussionMeasures in Table 4.3 and Table 4.4 show that at least one truth finding algorithm isbetter or equal in performance to PageRank, except for DT4 (Attr2), DT5 (Attr2),and DT6 (Attr1). In topic DT4, five truth finding algorithms (2E, AC, AS, AN,and SL) receive 0 in precision, while the highest score is achieved by Cosine (CO).They achieve the minimum precision score because these algorithms a�ect a falsetrue label to the second attribute (Attr2) of the object.
According to Table 4.5 and Table 4.6, PageRank achieves the lowest average forthe overall precision and recall. The best truth finding algorithms, in this case, areAccu and TruthFinder respectively (indicated by bold in Table 4.5 and Table 4.6).However, in terms of the trade-o� between precision and recall, Figure 4.1 provesthat Accu is an obvious choice. We conclude our analysis by stating that the setexpansion problem can significantly gain e�ectiveness with truth finding, as demon-strated by the di�erent results of our intensive experiments on various topics.
Table 4.6: Overal recall measures of the di�erent truth finding algorithmsCO 2E 3E DP AC AS AN TF SL GL CM PR
DT1 0.423 0.891 0.908 0.887 0.908 0.908 0.908 0.887 0.908 0.891 0.787 0.891DT2 0.252 0.271 0.308 0.271 0.280 0.280 0.280 0.271 0.280 0.280 0.280 0.280DT3 0.262 0.209 0.213 0.257 0.245 0.245 0.245 0.460 0.226 0.233 0.242 0.069DT4 0 0 0.004 0 0 0 0 0.004 0 0.004 0.078 0.180DT5 0.869 0.836 0.836 0.803 0.836 0.836 0.836 0.754 0.836 0.836 0.475 0.082DT6 0.800 0.754 0.831 0.769 0.831 0.831 0.831 0.785 0.800 0.831 0.754 0.692DT7 0.379 0.842 0.916 0.442 0.916 0.916 0.916 0.484 0.916 0.916 0.263 0.011
Average 0.434 0.493 0.517 0.498 0.517 0.517 0.517 0.527 0.508 0.513 0.436 0.366
Overall dataset
0.25
0.3
0.35
0.4
0.45
0.5
Aver
age
F-m
easu
re
CO 2E
3E DP
AC AS
AN TF
SL GL
CM PR
Figure 4.1: Average F-measure scores
Figure 4.1 compares average F-measure of truth finding algorithms and PageR-ank given the F-measure scores of every approach over our seven topics. Obviously,truth finding algorithms outperforms PageRank with an improvement ranging from10% to 26% in terms of both precision and recall. Accu (AC) is the best truthfinding model for ranking w.r.t. computed F-measure scores. The only exception is

58 CHAPTER 4. TRUTHFULNESS IN SET OF TUPLES EXPANSION
Table 4.7: Average number of conflicts and sources of the di�erent topicsTopic Avg_#Conflict Avg_#Source Precision Recall F-measureDT1 1.71 3.77 0.368 0.908 1.816DT2 1.2 2.09 0.153 0.280 0.56DT3 2.15 2.19 0.244 0.245 0.49DT4 2.97 5.65 0 0 0DT5 2.26 3.58 0.809 0.836 1.672DT6 1.24 1.96 0.818 0.831 1.662DT7 3.55 3.87 0.925 0.916 1.832
T4 where Accu receives the minimal score for all three metrics. We investigate thisspecial case further by first running Majority Voting on the extracted candidatesand then calculating the precision, recall, and F-measure of the result. We observethat the score is very low indicating that the candidates extracted from most ofthe sources are not correct yielding a biased truth finding process. The candidatesextracted also contain a lot of noises, for example, two sources extracted “SingaporeDollar” and “Dollar” as the value of one of the attributes. While a person wouldconsider these two values are referring to the same currency name for the countrySingapore, it would be a challenge for a system to infer this without any humaninteraction. Nevertheless, Accu improves the precision, recall, and F-measure ofour approach by 0.54%, 0.29%, and 0.51% respectively. Based on this, we concludethat leveraging a truth finding algorithm can indeed improve the performance of ourapproach.
For the next two experiments, we only select Accu (AC) as the representativeof the truth finding algorithms since it is shown from earlier experiments that Accuachieves the best score for the three metrics (precision, recall, F-measure). Table 4.7summarises the description of each topic in terms of the average number of conflictand the average number of sources (the second and third column of Table 4.7).The next three columns correspond to the precision, recall, and F-measure scoresacquired by Accu for each dataset. From Table 4.7, we can see that DT2 has thelowest number of average conflicts, thus we expect it would achieve the lowest score interms of precision, recall, and F-measure, but DT4 receives the lowest score instead.Although DT4 has an average number of conflicts of 2.97, it achieves a minimumscore of 0 for all metrics among all the topics. We have explained a possible reasonfor DT4 achieving such a low score in the previous experiment. The same conclusioncan be inferred when we relate the average number of sources with the precision,recall, and F-measure of the system. DT4 which has the highest average number ofsources records the lowest scores for all three metrics, while topic DT7 which hasthe second highest average number of sources achieves the highest score in precision.Based on Table 4.7, we can not find any correlation (positive or negative), betweenthe average number of conflicts and sources with the precision, recall, and F-measurescores. We conclude our analysis by stating that the average number of sources orconflicts do not influence the performance of the system in terms of precision, recall,

4.3. PERFORMANCE EVALUATION 59
Table 4.8: Ranking of sources for topic DT1 - Calling CodeURL
PageRank Accu Precision Recall F-measure
Weight Rank Acc. Rank Score Rank Score Rank Score Rank
https://
countrycode.
org
0.003 1 0.916 7 0.850 2 0.854 1 0.852 1
http://www.
howtocallabroad.
com/codes.
html
0.002 2 0.925 5 0.832 3 0.828 2 0.830 2
http://www.
howtocallinternationally.
com/codes.
html
0.002 3 0 10 0 10 0 10 0 10
https://www.
telstra.
com.au/
home-phone/
international-calling/
international-dialling-codes
0.001 4 0.886 8 0.744 6 0.707 6 0.725 6
http://www.
areacodehelp.
com/world/
country-calling-codes.
shtml
0.001 5 0.929 4 0.758 4 0.812 3 0.784 3
https:
//weendeavor.
com/
telephone/
international-country-codes/
0.001 6 0.792 9 0.185 9 0.142 9 0.161 9
http:
//wikitravel.
org/en/List\
_of\_country\
_calling\
_codes
0.001 7 0.942 3 0.702 8 0.611 7 0.653 7
http://www.
nationsonline.
org/oneworld/
international-calling-codes.
htm
0.001 8 1 1 0.854 1 0.711 5 0.776 4
http://www.
1areacodescountrycodes.
com/
all-country-code-numbers-countrycodes.
htm
0.001 9 0.981 2 0.704 7 0.339 8 0.458 8
http://www.
ldpost.com/
countries/
0.001 10 0.918 6 0.746 5 0.774 4 0.760 5

60 CHAPTER 4. TRUTHFULNESS IN SET OF TUPLES EXPANSION
Table 4.9: Correlation of ranking of sourcesDT1 DT2 DT3 DT4 DT5 DT6 DT7 Average
PageRank
Precision -0.10 -1.00 0.09 0.39 -0.14 -0.36 -1.00 -0.30Recall -0.03 -0.29 0.33 0.32 -0.38 -0.36 -1.00 -0.20F-measure 0.03 -1.00 0.33 0.39 -0.38 -0.36 -1.00 -0.28
Accu
Precision 0.61 0.53 -0.26 -0.35 0.44 -0.36 1.00 0.23Recall 0.50 1.00 -0.43 -0.46 0.22 -0.36 1.00 0.21F-measure 0.52 0.53 -0.43 -0.35 0.22 -0.36 1.00 0.16
and F-measure.Table 4.8 shows the ranking of sources for topic DT1. The ranking of sources
for the rest of the topics can be found in Appendix A. We show the weight assignedby PageRank, the accuracy inferred by Accu, and also the precision, recall, andF-measure for each Web page along with its corresponding rank. All of the rankingsproduced by PageRank, Accu, or rankings by precision, recall, and F-measure do notagree on the order of importance of the URLs. This is also true for all of the rankingof sources for the rest of the topics as shown in Appendix A. An interesting case canbe seen in Table 4.8 where a Web page (row 3 in Table 4.8) receives a weight of 0.002from PageRank although it achieves 0 scores for precision, recall, and F-measure.Note that when we build our graph of entities, we add any Web page from whichwe can infer wrappers and the corresponding candidates. This opens the possibilityof adding Web pages which extract “junk” candidates. Web pages are assigned aweight after we run the PageRank algorithm on the graph. When we calculate theprecision with refers to the ground truth, a Web page receives a 0 score because itextracts only irrelevant candidates.
In Table 4.8, we are presented with five di�erent rankings for the same topic DT1(rankings for other topics can be found in Appendix A). We further investigate thecorrelation between the rankings in Table 4.8 by calculating their Kendall’s Tauscore. The result is shown in Table 4.9. Please note that a Kendall’s Tau score ofless than zero indicates that there is a negative association between the two listswhich are in comparison. In general, the ranking of sources given by Accu has apositive association with the ranking of sources using the precision, recall, and F-measure scores. In DT6, the performance of PageRank and Accu is equal. We lookat the experiment result closely and find that Accu infers its ground truth basedon three Web pages. Among these three Web pages, the one that ranks the highestactually extract candidates which contain many special characters such as é, &,etc. Subsequently, this Web page achieves low rank in the precision, recall, andF-measure rankings. Normalising special characters into its standard form beforeinserting the candidates into our graph of entities or perform truth finding algorithmis a possible way of improving the result. On the other hand, PageRank outperformsAccu in topics DT3 and DT4. In both cases, Accu su�ers from the fact that themajority of the sources are constantly wrong which resulted in a biased truth findingprocess. Moreover, we find that the sources have many candidates which are notincluded in the ground truth. Nevertheless, we can conclude that leveraging truthfinding algorithm into our approach can also improve the ranking of sources.

4.4. CONCLUSION 61
4.4 ConclusionWe have proposed to leverage the truth finding algorithm to candidates extractedby the set of tuples expansion. We empirically showed that truth finding algorithmscan significantly improve the truthfulness of the extracted candidates. We intend touse truth finding algorithms into our STEP system, by also tackling di�cult cases.However, an in-depth analysis of the truth finding algorithm integrated into ourapproach shows that the average number of sources or conflicts do not a�ect theperformance of the system. The ranking of sources is also positively a�ected byleveraging truth finding algorithm. We have shown this by computing the Kendall’sTau score of the ranking of sources provided by Accu with the ranking of sources interms of the precision, recall, and F-measure scores.

62 CHAPTER 4. TRUTHFULNESS IN SET OF TUPLES EXPANSION

Chapter 5
Tuple Reconstruction
Set of tuples expansion system, such as STEP [35], extracts information from theWorld Wide Web in the form of tuples. Particularly, given a set of tuple examples<Indonesia, Jakarta, Indonesian Rupiah>, <Singapore, Singapore, Singapore Dol-lar>, STEP returns a list consisting of the name of a country, its capital city, aswell as the name of the currency. STEP applies a voting ranking mechanism basedon PageRank on the tuple candidates. PageRank [77] is primarily used by Google tomeasure the importance or relevance of Web pages with refers to a query given by theuser. Each link from other Web pages to a target Web page is treated as a vote forthe target Web page. The Web pages are then ranked according to its correspondingvote count. In the particular case of STEP [35], a graph is built by defining a set ofentities (Web pages, wrappers, seeds, domains, and tuple candidates) as nodes andthe relationships between entities as links (edges). A tuple candidate node is onlylinked with wrapper nodes. This means that the rank of a tuple candidate in thefinal list only depends on the number of wrappers used to extract that particularcandidate. The wrappers in STEP are regular expression-based wrappers. Theyare generated by comparing the contexts of a pair of occurrences of seeds in a Webpage. This method may produce more tuple candidates, but on the other hand, itis highly likely to extract false ones, i.e. candidates whose elements are not fromthe same semantic class as the seeds. These false candidates may receive as manyvote count as the true candidates due to the nature of the graph of entities. Theymay have more votes if they are extracted by many wrappers from the same pageor by other wrappers from other Web pages. The reverse situation where true can-didates have more votes than the false ones may also occur. Nevertheless, ensuringthat extracting true candidates rather than false ones is utmost importance. Thisis the motivation of this research where we propose a solution to ensure that truecandidates will always have more votes than the false ones and rank higher on thelist. Our proposed solution incorporates a tuple reconstruction phase by combiningbinary tuples. We explain briefly our proposed method next.
Tuples such as those given as examples earlier consist of n elements, i.e. theterm n-elements tuple. Each element is a value for an attribute of a real-worldentity (object). We use the term element and attribute interchangeably throughoutthis chapter. Among these n elements, one of them can be considered as the key
63

64 CHAPTER 5. TUPLE RECONSTRUCTION
attribute while all the remaining elements are the values of the properties of the keyattribute. Consider the tuple <Indonesia, Jakarta, Indonesian Rupiah> where n=3,one can surely identify that the key attribute in the tuple is the country “Indonesia”while “Jakarta” and “Indonesian Rupiah” are the values for attributes “capital city”and “currency” of Indonesia respectively. By noticing this key attribute notion, theprevious tuple can be decomposed into two 2 -elements tuples (binary tuples). Weaccomplish this by pairing the attribute values with the key attribute: <Indonesia,Jakarta> and <Indonesia, Indonesian Rupiah>. Suppose that we have the knowl-edge of the two binary tuples a priori (by querying an ontology or extracting binarytuples with the same relation), add them to the graph of entities as new nodes, andcreate links to the the candidate tuple <Indonesia, Jakarta, Indonesian Rupiah>,then the candidate tuple should gain more weight after we perform the PageRankalgorithm. Subsequently, the candidate tuple should also rank higher in the finallist presented to the user. Based on this intuition, we propose the problem of tuplereconstruction. Starting from the binary tuples, we reconstruct tuples of n-elements(n>2). The reconstructed tuples can then be added to the graph of entities with thepurpose of enriching the graph. We show that the addition of these reconstructedtuples can improve the confidence in the extracted candidate tuples. We organisethis chapter as follows. Section 5.1 gives a formal definition of the tuple recon-struction problem. We then detail our proposed approach to solving the problem inSection 5.2. In Section 5.3, we evaluate the performance of the proposed solutionwhile Section 5.4 concludes this chapter.
5.1 Problem DefinitionWe consider fixed finite sets of attribute labels A and values V . Let n represents thenumber of attributes (elements). We formally defined the following.
Definition 5. A tuple t consists of a set of v where v is a mapping v : A æ V.
To form a tuple, we must first select a set of attributes for a real-world entity. Forinstance, we select the entity to be a country, and for this entity, we choose n=3attributes which include the capital city, currency code, and the currency name.Each of these attributes can take exactly one value from the V domain. Suppose wetake “Indonesia”, “Jakarta”, “IDR”, and “Indonesian Rupiah” as the values for theattributes then we form the tuple <Indonesia, Jakarta, IDR, Indonesian Rupiah>.We define next the key attribute of a tuple. Let i denotes the index of each elementin a tuple respectively.
Definition 6. The key attribute is the identifier of a tuple and comprised of thefirst n-1 elements for n-elements tuple where nØ2.
The key attribute acts as the identifier of the tuple. For example, in the tuple<Indonesia, Jakarta>, the key attribute is “Indonesia” where it represents the nameof a country.

5.1. PROBLEM DEFINITION 65
Following the above definitions, we can proceed with defining the tuple recon-struction problem. The tuple reconstruction problem deals with the task of con-structing n-elements tuples from binary ones. We propose here two methods ofreconstructing tuples, i.e. strict and loose. As we described briefly earlier, an n-elements tuple can be constructed from a pair of (n-1)-elements tuples for n>2.These two (n-1)-elements tuples should have the same elements ordered from indexi=1 to n-2.
Definition 7. A pair of n-elements tuples can be merged to construct an (n+1)-elements tuple if they both have the same n-1 key attribute with nØ2 (strict).
Figure 5.1: Tuple reconstruction illustration
Consider Figure 5.1 where on the first level of the graph we have three binary tuples<Indonesia, Jakarta>, <Indonesia, IDR>, and <Indonesia, Indonesian Rupiah>.By applying Definition 7 on the binary tuples, we generate the nodes in the secondlevel, i.e. <Indonesia, Jakarta, IDR>, <Indonesia, Jakarta, Indonesian Rupiah>,and <Indonesia, IDR, Indonesian Rupiah>. Two out of the three tuples in thesecond level have the same key attribute by Definition 6. Thus, again by applyingDefinition 7 on the second level, we get in the third level the tuple <Indonesia,Jakarta, IDR, Indonesian Rupiah> by combining the leftmost and middle nodes.
Definition 8. Two n-elements tuples (n > 2) can be merged to form (n+1)-elementstuples if they have the same values for the first n-2 elements and di�er in one valueof the remaining elements (loose).
The strict method of generating tuples may lead to the possibility of overlookingsome potential candidates. We can not generate the previous tuple by combiningeither the leftmost or middle node with the rightmost node on the second level ofthe tree because it violates Definition 6 and 7. If we take a closer look at the threenodes, we can see that they share the same n-2 key attribute and only di�er in oneof the attribute values in the remaining n-1 attributes. Thus, we define anothermethod of generating the tuples as in Definition 8. Using Definition 8, we are ableto generate the tuple on the third level by combining the rightmost node on thesecond level with any of the other two nodes. We refer to the tuples generated fromDefinition 7 and Definition 8 as reconstructed tuples.

66 CHAPTER 5. TUPLE RECONSTRUCTION
5.2 Proposed ApproachThe tuple reconstruction process as described in the previous section requires theavailability of binary tuples at the start of the process. These binary tuples can beretrieved by leveraging any of the set expansion systems that are able to extractbinary relations, i.e. DIPRE [16], Ext. SEAL [30], STEP [35], etc. However,our motivation in proposing the tuple reconstruction problem is to assist STEP ingenerating a more trustworthy list of candidates. For this reason, we incorporatethe tuple reconstruction as a part of the process of building the graph of entities inSTEP [35]. This tuple reconstruction process can only be carried out for seeds withthe number of elements n > 2. We first show the tuple reconstruction process can beapplied by leveraging FindSeedsOccurrences and WrapperGeneration algorithms ofSTEP (Algorithm 3 and 4). Later, we incorporate directly the tuple reconstructionprocess into building the graph of entities by modifying Algorithm 7.
Algorithm 9: FindBinaryTuplesInput : A set of seeds R = {T1, T2, ..., TNs}
Output: A list of binary tuples RÕ
1 B = ÿ;2 for i Ω 1 to n ≠ 1 do3 R
Õ = ÿ;4 foreach t œ R do5 R
Õ = RÕfi {< t[0], t[i] >};
6 end7 D = {FindDocuments(RÕ)};8 foreach d œ D do9 Wrappers = {WrapperGeneration(FindSeedsOccurrences(RÕ
, d))};10 foreach w œ Wrappers do11 C = {extract binary tuples from d using w};12 B = B fi C;13 end14 end15 end16 return B;
Algorithm 9 details the process of finding binary tuples given a set of seeds withelements n > 2. We use as our running example the following set of tuple seeds:<Indonesia, Jakarta, Indonesian Rupiah, IDR>, <Singapore, Singapore, SingaporeDollar, SGD> and <Malaysia, Kuala Lumpur, Malaysian Ringgit, MYR>. We as-sume that for each tuple seed the key element is always the first element of thetuple. We first decompose the seeds into binary ones starting from the second ele-ment until the n-th element (line 2). Next, for each of the tuple seeds, we composethe binary seeds by pairing the first element of the tuple with the i-th element (line4-6). Thus, the tuple seeds given as the running example will be decomposed into<Indonesia, Jakarta>, <Singapore, Singapore>, and <Malaysia, Kuala Lumpur>

5.2. PROPOSED APPROACH 67
on the first run, while <Indonesia, Indonesian Rupiah>, <Singapore, SingaporeDollar>, and <Malaysia, Malaysian Ringgit> on the second, and finally <Indone-sia, IDR>, <Singapore, SGD>, and <Malaysia, MYR>. Using these binary seedsas the new set of seeds, we retrieve a set of Web pages containing them (line 7).For each of the Web page retrieved we find the occurrences of the seeds using Algo-rithm 3. The occurrences and the document are then fed into Algorithm 4 to infera set of wrappers. We then extract binary tuples from the document using the setof wrappers (line 8-14).
Algorithm 10: ReconstructTupleInput : A set of binary tuples B, an integer n
Output: A set of reconstructed tuples BÕ
1 BÕ = ÿ;
2 BÕ = B
Õfi B;
3 for i Ω 2 to n ≠ 1 do4 b = {retrieve tuples from B
Õ where number of elements = i};5 foreach bi œ b do6 c = ÿ;7 if strict then8 c = {retrieve tuples from b where elements e1, ..., ei≠1 of the tuples
are the sames as in bi};9 else
10 c = {retrieve tuples from b where elements e1, ..., ei≠2 of the tuplesare the sames as in bi and for elements ei≠1, ..., ei they di�er inonly one value};
11 end12 foreach ci œ c do13 t = {combine bi with ci};14 B
Õ = BÕfi t;
15 end16 end17 end18 return B
Õ;
We start the reconstruction process by combining the binary tuples using Def-inition 7 or Definition 8 to form tuples with n=3. Next, we combine 3 -elementstuples to form 4 -elements tuples, and so on. The process is stopped when we finallyhave constructed n-elements tuples. We use Algorithm 10 to reconstruct n-elementtuples from the set of binary tuples. At the start of the process, B
Õ consists of all thebinary tuples extracted by Algorithm 9. We repeat the following process for i=2 ton ≠ 1 (line 3). On the first iteration, we retrieve a set of binary (2 -elements) tuplesb from B
Õ (line 4). For each element bi of b, depending on the tuple reconstructionmethod, we collect a set of tuples c from b that satisfy Definition 7 or Definition 8(line 6-11). We then combine bi with each ci of c and add the reconstructed tuple

68 CHAPTER 5. TUPLE RECONSTRUCTION
to BÕ (line 12-15). On the second iteration, we retrieve 3 -elements tuples from B
Õ
and repeat the process (line 5-16). We continue repeating the process until we haveconstructed all n-elements tuples.
We explain next how we incorporate the tuple reconstruction process directly tobuild the graph of entities of STEP. STEP takes as input a set of tuple seeds whereeach of the seeds consists of n-elements. The strict method of tuple reconstructionrequires that n Ø 2 while from the definition of the loose method the requirementis at least n = 3. Let us reconsider the set of tuple seeds of our running example:<Indonesia, Jakarta, Indonesian Rupiah, IDR>, <Singapore, Singapore, SingaporeDollar, SGD> and <Malaysia, Kuala Lumpur, Malaysian Ringgit, MYR> wheren = 4. Our goal is to reconstruct tuples by first extracting binary tuples from thegiven seeds and recursively combine the binary tuples to generate n elements tu-ples. We modify Algorithm 7 to incorporate tuple reconstruction into the processof building the graph of entities as shown in Algorithm 11 and Algorithm 12. InAlgorithm 11, we find binary tuples from the given set of seeds. We decompose eachtuple seeds into groups of binary seeds constructed from pairing the key element andone of the remaining elements alternately (line 4-6). Next, we retrieve a set of Webpages containing the binary seeds. For each of the Web page, we generate wrappersand extract the binary tuples. We add the entities to the graph as well as createthe edges between them as summarised in Table 3.2 (line 8-27). The result of thealgorithm is a graph with the addition of binary tuples as the nodes as well as therelationships between the nodes as the edges and the set of binary tuples. We thenreconstruct the tuples from the set of binary tuples using Algorithm 12. We add allreconstructed tuples as new nodes on the graph but leaving out the binary ones asit has been added to the graph earlier (line 3). We start adding the reconstructedtuples to the graph from tuples of length 3 to n (line 3-4). For each tuple in theselected set of the reconstructed tuples, we find its ancestors and descendants. Theancestors, in this case, are the set of (n-1)-elements tuples that can be used to con-struct the corresponding n element tuple. Suppose that <United Kingdom, London,Poundsterling> is a reconstructed tuple, the ancestors of this tuple are <UnitedKingdom, London>, <United Kingdom, Poundsterling>. We can also add <Lon-don, Poundsterling> to the set of ancestors if we generate the corresponding tupleusing Definition 8. For each of the ancestors, we create an edge to the correspondingtuple and label it as CONSTRUCT (line 8-10). On the other hand, the descendantsare the set of n+1 reconstructed tuples that are generated from the correspondingtuple. For the reconstructed tuple <United Kingdom, London, Poundsterling>, anexample of its descendant is <United Kingdom, London, Poundsterling, GBP>. Wethen create an edge from each of the descendants to the corresponding tuple andassign INV_CONSTRUCT as the label (line 12-14).
Figure 5.2 shows an example of the graph produced by Algorithm 12. The lowerpart of the figure (denoted by the rectangle with the dashed line) is the tuple recon-struction process, while the upper part is the graph of entities constructed by STEP.The tuple reconstruction is carried out in parallel with the process of building thegraph of entities. Both processes start with the given set of tuple seeds as its input.For the tuple reconstruction, we then decompose the tuple seeds into binary seeds.

5.2. PROPOSED APPROACH 69
Algorithm 11: RetrieveBinaryTuplesInput : A graph of entities G = (V, E), a set of n elements tuple seeds
R = {T1, T2, ..., TNs}
Output: A graph of entities GÕ = (V Õ
, EÕ), a set of binary tuples B
1 GÕ = G;
2 for i Ω 1 to n ≠ 1 do3 R
Õ = ÿ;4 foreach t œ R do5 R
Õ = RÕfi {< t[0], t[i] >};
6 end7 P = {FindDocuments(RÕ)};8 foreach Pi œ P do9 V
Õ = VÕfi Pi;
10 d = FindDomain(Pi);11 V
Õ = VÕfi d;
12 EÕ = E
Õfi {< Pi, BELONG_TO, d >, <
d, INV _BELONG_TO, Pi >};13 foreach r in R
Õ do14 E
Õ = EÕfi {< Pi, INV _RETRIEV E, r >, < r, RETRIEV E, Pi >
};15 end16 Wrappers = {WrapperGeneration(FindSeedsOccurrences(RÕ
, Pi))};17 foreach w œ Wrappers do18 V
Õ = VÕfi w;
19 EÕ = E
Õfi {< Pi, GENERATE, w >, <
w, INV _GENERATE, Pi >};20 C = {extract binary tuples from Pi using w};21 foreach ci œ C do22 V
Õ = VÕfi ci;
23 EÕ = E
Õfi {< w, EXTRACT, ci >, <
c, INV _EXTRACT, w >};24 end25 B = B fi C;26 end27 end28 return G
Õ, B;
29 end

70 CHAPTER 5. TUPLE RECONSTRUCTION
Algorithm 12: BuildGraphWithReconstructedTuplesInput : A graph of entities G = (V, E), a set of n elements tuple seeds
R = {T1, T2, ..., TNs}
Output: A graph of entities with reconstructed tuples GÕ = (V Õ
, EÕ)
1 GÕ, B = RetrieveBinaryTuples(G);
2 BÕ = {ReconstructTuple(B, n)};
3 VÕ = V
Õfi B
Õ\B;4 for i Ω 3 to n do5 Bnew = {Select tuples of length i from B
Õ};6 foreach t œ Bnew do7 Anc = {Find ancestors of t};8 foreach a œ Anc do9 E
Õ = EÕfi {< a, CONSTRUCT, t >};
10 end11 Des = {Find descendants of t};12 foreach a œ Des do13 E
Õ = EÕfi {< a, INV _CONSTRUCT, t >};
14 end15 end16 end17 return G
Õ;
Since a binary seed contains a key element (the first element of the tuple seed) andan attribute value, after decomposing the tuple seeds we will have three sets of bi-nary seeds. In Figure 5.2, we only show one set of the binary seeds (<Indonesia,Jakarta>, <Singapore Singapore>, and <Malaysia, Kuala Lumpur>). Using thisbinary seeds then we retrieve a set of Web pages, infer wrappers from each of theWeb pages, and finally extract other binary tuples (<United Kingdom, London>,<United Kingdom, Poundsterling>, and <United Kingdom, GBP>). From thesebinary tuples, we then reconstructed 3 -elements tuples (<United Kingdom, London,Poundsterling>, <United Kingdom, London, GBP>. We then relate the recon-structed tuples to its ancestors and descendants. In this setting, the descendantsare n-elements tuples which are extracted by STEP. By reconstructing tuples fromthe set of binary seeds, we are actually giving more votes to the n-elements tuple ofSTEP which in turn increase the confidence of the extracted tuples.
5.3 Performance EvaluationOur goal in this performance evaluation is to show that the proposed approach oftuple reconstruction can be directly integrated into the set of tuples expansion prob-lem. Furthermore, we also intend to prove that tuple reconstruction present a fewadvantages to the expansion process: (1) it introduces new n-elements candidatetuples which might not be extracted by STEP and in turns can improve the pre-

5.3. PERFORMANCE EVALUATION 71
Figure 5.2: Graph of entities with reconstructed tuples
cision or recall, (2) provided that the 2 -elements, ..., (n-1)-elements reconstructedtuples are correct, they can boost the confidence of the n-elements tuples which areextracted by STEP.
5.3.1 Experiment SettingWe implement the proposed approach of tuple reconstruction as a system whichcan extract tuples from the Web as well as reconstruct tuples from binary ones. Weevaluate the performance of the system based on the extracted candidates. We defineseveral topics and compare the extracted candidates to the manually constructed

72 CHAPTER 5. TUPLE RECONSTRUCTION
Table 5.1: Topics used for performance evaluation in tuple reconstructionTopics Seeds Reference No. Entries
DT1 - Currency<Indonesia, Jakarta, Indonesian Rupiah,IDR>, <Singapore, Singapore, Singapore Dol-lar, SGD>, <France, Paris, Euro, EUR>
https://www.ibpsguide.com/
country-capitals-and-currency244
DT2 - Car brands<Alfa Romeo, Italy, Fiat S.p.A, al-faromeo.com>, <Chevrolet, USA, GeneralMotors, chevrolet.com>
http://www.autocarbrands.com/
car-brands-information-list/104
DT3 - Airports
<CGK, Soekarno-Hatta International Air-port, Jakarta, Indonesia>, <CDG, Charles DeGaulle International Airport, Paris, France>,<SIN, Changi International Airport, Singa-pore, Singapore>
http://http://www.nationsonline.org/
oneworld/IATA_Codes9220
ground truth for each topic. The ground truth of each topic is collected from areference Website and excluded from the set of tuples expansion process. We haveinspected and verified that the resulting tables are correct and generally complete.The topics, the set of seeds, the corresponding reference, and the number of entriescontained in the reference are presented in Table 5.1. We briefly summarise everytopic as follows.
• DT1 - Currency. This topic associates countries with their correspondingcapital city, currency name, and currency code. We choose https://www.ibpsguide.com/country-capitals-and-currency as the reference Websitewhich has 244 entries. We use the following set of seeds: <Indonesia, Jakarta,Indonesian Rupiah, IDR>, <Singapore, Singapore, Singapore Dollar, SGD>,<France, Paris, Euro, EUR>.
• DT2 - Car brands. This topic associates automotive brands with their man-ufacturing country, the parent company, and its o�cial Website. We choosehttp://www.autocarbrands.com/car-brands-information-list/ as the ref-erence Website which has 104 entries. We use the following set of seeds: <AlfaRomeo, Italy, Fiat S.p.A, alfaromeo.com>, <Chevrolet, USA, General Motors,chevrolet.com>.
• DT3 - Airports. This topic associates airport codes with their name, thelocation, and the country. We choose http://http://www.nationsonline.org/oneworld/IATA_Codes as the reference Website which has 9220 entries.We use the following set of seeds: <CGK, Soekarno-Hatta International Air-port, Jakarta, Indonesia>, <CDG, Charles De Gaulle International Airport,Paris, France>, <JFK, John F. Kennedy International Airport, New York,USA>.
The metrics used in the experiment are precision, recall, and F-measure. Theprecision and recall are calculated using Equation 3.3, while the F-measure usingEquation 4.3.
In STEP [35], we use Algorithm 7 to build the graph of entities consisting of seeds,Web pages, domains, wrappers and candidates as the nodes and the relationshipsbetween the entities as its edges. We then introduce the tuple reconstruction prob-lem and integrate a solution to the problem directly to STEP in Algorithm 12. Toevaluate the performance of our proposed approach of tuple reconstruction, we com-pare the candidates extracted by STEP which uses Algorithm 7 and Algorithm 12

5.3. PERFORMANCE EVALUATION 73
Table 5.2: Comparison of Precision, Recall, and F-measure of STEP with and with-out tuple reconstructionTopic Number of Candidates Precision Recall F-measure
w/o TR With TR w/o TR with TR w/o TR With TR w/o TR With TRDT1 193 (187) 304 (207) 0.968 0.68 0.766 0.848 0.855 0.754DT2 53 (44) 53 (44) 0.83 0.83 0.423 0.423 0.526 0.526DT3 451 (326) 1235 (968) 0.035 0.104 0.722 0.783 0.066 0.183
in building the graph of entities. We calculate the precision and recall using Equa-tion 3.3, as well as the F-measure using Equation 4.3 on the extracted candidateswith refers to the ground truth. First, we run STEP that implements Algorithm 7on each topic with the given set of seeds and then extract the candidates. We referto this as STEP without tuple reconstruction (w/o TR). Next, we repeat the sameprocess but we replace Algorithm 7 with Algorithm 12 to build the graph of enti-ties (with TR). Table 5.2 compares the number of candidates extracted, precision,recall, and F-measure of STEP with (with TR) and without tuple reconstruction(w/o TR). The number in brackets in the number of candidates denotes the numberof correct candidates, i.e. candidates that are present in the ground truth.
5.3.2 Result and DiscussionFrom Table 5.2, we can see that integrating tuple reconstruction into the set oftuples expansion system improve the number of extracted candidates and the recallof the system, especially in topics DT1 and DT3. In topic DT2, the performance ofSTEP with and without the tuple reconstruction is the same. We investigate furtherthe impact of the tuple reconstruction for each topic and detail the result next.
We start with topic DT2 as this is an interesting case where using tuple re-construction does not improve the performance of STEP in terms of the candi-dates extracted as well as the three metrics we use. As we give the set of seeds<Alfa Romeo, Italy, Fiat S.p.A, alfaromeo.com>, <Chevrolet, USA, General Mo-tors, chevrolet.com> as input to STEP, we notice that the search engine only returnsseveral Web pages. http://www.autosaur.com/car-brands-complete-list/ isone of the URLs returned from which STEP manages to extract 53 candidates.Out of these candidates, 9 are rejected with refers to the ground truth for variousreasons, i.e. noise in the candidates (HTML tags), minor di�erence in the writing(“&” instead of “&”), or no reference in the ground truth (“adical sportscars”is not contained by our ground truth). On the second run of STEP (with tuple re-construction), the number of extracted candidates is exactly the same. This meansthat the tuple reconstruction fails to add even a single candidate. We take a lookinto the process to find out the reason for the failure. We decompose each of thetuple seeds into three groups of binary seeds, i.e. first group: <Alfa Romeo, Italy>,<Chevrolet, USA>, second group: <Alfa Romeo, Fiat S.p.A>, <Chevrolet, GeneralMotors> and <Alfa Romeo, alfaromeo.com>, <Chevrolet, chevrolet.com>. Fromthe first group of the binary seeds, we try to find relations containing the name ofan automobile brand and their country of origin. We manage to extract 84 can-

74 CHAPTER 5. TUPLE RECONSTRUCTION
didates. Using the second group of binary seeds, from the set of URLs returnedby the search engine, we only manage to extract 22 candidates. If we combine thetwo sets of candidates, we expect to have 22 reconstructed tuples of length n=3with the relations of automobile car brands, the country of origin and the parentcompany. However, when we use the last group of binary seeds, we fail to extractany candidates from the set of URLs. This prevents us from reconstructing tuple oflength n=3 with the o�cial Website of the automobile brand as one of its element.Furthermore, this failure also impedes us from constructing tuples of length n=4.We find this as the reason why the tuple reconstruction does not contribute anycandidate to the final set of candidates.
Tuple reconstruction shows its potential of improving the number of candidateson topics DT1 and DT3. In the former case, STEP without tuple reconstruc-tion extracts 193 candidates. This number is improved by tuple reconstructionby 57% to 304 candidates. From the three groups of binary seeds, i.e. <Indone-sia, Jakarta>, <Singapore, Singapore>, <France, Paris>; <Indonesia, IndonesianRupiah>, <Singapore, Singapore Dollar>, <France, Euro>; <Indonesia, IDR>,<Singapore, SGD>, <France, EUR>; we manage to extract 297, 276, and 164 can-didates respectively. From these three groups of binary candidates, we are thenable to reconstruct 111 tuples of length n=4, out of which 20 of them are ac-cepted by the ground truth. The 20 new candidates help to improve the recallof STEP from 0.766 to 0.848. However, the remaining 91 reconstructed tuplescontribute to the decrease of the precision from 0.968 to 0.68. The most signif-icant improvement of tuple reconstruction is shown in topic DT3. Without tu-ple reconstruction, STEP only extracts 451 candidates. This number is improvedmore than tripled to 1235 candidates when we integrate tuple reconstruction intothe expansion process. The reconstructed tuples also contribute to the improve-ment of the recall from 0.722 to 0.783. However, the precision scores of both runsof STEP (with and without tuple reconstruction) are really low. In topic DT3,we try to extract relations of all airports code with their respective names, loca-tions, and countries with http://www.nationsonline.org/oneworld/IATA_Codesas the reference Website. The reference Website itself consists of 9220 entries. Thistotal number of entries in the ground truth is a magnitude higher than the ex-tracted candidates of 451 and 1235 for STEP without and with tuple reconstruc-tion respectively. We investigate further the candidates extracted by STEP with-out tuple reconstruction and find that they consist of only the major airports inthe world. Tuple reconstruction then helps in adding 784 new candidates. Wefind that these new candidates are actually all airports in the USA alone. In-deed, when we check on the URLs returned by the search engine using the decom-posed binary seeds <CGK, Soekarno-Hatta International Airport>, <CDG, CharlesDe Gaulle International Airport>, <JFK, John F. Kennedy International Air-port>; <CGK, Jakarta>, <CDG, Paris>, <JFK, New York>; <CGK, Indonesia>,<CDG, France>, <JFK, USA>; we manage to extract binary relations of airportcodes and its names, airport codes and the corresponding locations of city and coun-try from the same URL http://www.airportcodes.us/airports-by-name.htm.We are certain that if the URLs returned by the search engine point to relevant

5.4. CONCLUSION 75
Web pages, i.e. Web pages which contain the targeted binary relations, the tuplereconstruction would add many more new candidates. Nevertheless, from the resultof the performance evaluation, we conclude that tuple reconstruction has the poten-tial of finding candidate tuples which are not extracted by the set of tuple expansionsystem.
5.4 ConclusionWe propose the tuple reconstruction problem which deals with the task of recon-structing tuples of length n from binary ones. We present two methods for the taskof tuple reconstruction. The solution of the problem is integrated directly into theprocess of building the graph of entities in a set of tuples expansion system. Weevaluate the performance of the solution in terms of precision, recall, and F-measureon three real-world topics. Empirical results show that new candidates can indeedbe added by the tuple reconstruction which previously are not found by the set oftuples expansion system without the tuple reconstruction. However, the integrationof tuple reconstruction into the set of tuples expansion system must be carefully con-sidered as it improves the recall but on the other hand can also negatively impactthe precision.

76 CHAPTER 5. TUPLE RECONSTRUCTION

Part II
Expanding the Set of ExamplesSemantically
77


Chapter 6
Topic Labelling with TruthFinding
6.1 IntroductionIn the first part of the thesis, we focus our e�ort on expanding the set of n-elementstuples (n is the number of elements) by giving a set of tuple seeds of equal lengthand a corpus. To achieve this, we infer wrappers from the set of occurrences ofthe seeds in the corpus and apply the inferred wrappers on the corpus to retrievethe candidates. This approach relies heavily on the availability of documents in thecorpus which contain the seeds. Failure to retrieve any occurrences of the seeds inthe documents leads to none of the candidates being extracted. In the second part ofthe thesis, we investigate the possibility of expanding the tuple seeds semantically,i.e. by finding other corresponding elements of the di�erent groups of elements in theseeds. Consider the following tuple seeds <Indonesia, Jakarta, Indonesian Rupiah>,<Singapore, Singapore, Singapore Dollar>, <France, Paris, Euro>. Looking at thefirst, second, and third element of each seed, one can assume that these groupof elements belongs to the semantic class “country”, “capital city”, and “currencyname” respectively. However, these class labels are not defined a priori but can beinferred based on the examples of the elements provided. Once the correct labelof each group of elements is identified, we can then expand the set of examplesusing the other members of the class. For example, “Malaysia”, “United Kingdom”,“Germany” are all members of the semantic class “country” and can, therefore, beused to expand the first group of elements. This type of task of automatically findingthe label for a set of examples is closely related to topic labelling.
A topic modelling approach learns groups of words that best describe latenttopics underlying a collection of documents. The process of finding these groupsof words constitutes of learning the topic-word distributions as well as the mixtureof topics in the documents. Upon learning the set of words describing each topic,one then has to figure out the right label for that topic. While feasible, manuallabelling requires hard work and may be fairly time-consuming in some scenarios.The given label can be quite subjective with respect to the knowledge possessed bythe person performing the task. For the following set of words {charles, prince, king,
79

80 CHAPTER 6. TOPIC LABELLING WITH TRUTH FINDING
diana, royal, queen, family, parker, british, bowles}, a person who is knowledgeablein world a�airs would group the words as “prince charles”, “diana”, “royal queen”,“parker bowles”, “british” and then suggest “British royal family” as the label. Onthe other hand, “royal family” might be chosen by many as the relevant label byonly considering “king”, “prince”, “queen”, and “family” and disregarding the restof the words. In this scenario, we see that a di�erent person has a di�erent opinionon the label. This motivates the task of topic labelling.
Topic labelling deals with the task of automatically finding labels for the topicmodels. Generally, the task mainly focuses on two subtasks, candidate labels gener-ation, and ranking. The former focuses on retrieving or generating a set of candidatelabels, while the latter applies a ranking mechanism on the candidate labels to se-lect the most relevant label for the topic. Many methods have been proposed totackle the task including those that leverage knowledge bases[111, 128, 105] and usedata mining or machine learning algorithms [107, 110, 115]. In [105], the authorsgenerate a set of primary and secondary candidate labels from Wikipedia, while theranking process is carried out on features of the candidate labels using a supportvector regression model. Bhatia et al. [107] also leverage Wikipedia as a source forthe candidate labels, but they use documents and words embedding to represent thelabels in the ranking process.
In this research, we propose to leverage topic labelling to automatically label theset of elements in the given tuple seeds. We treat the semantic class as the topicwhile the elements of the class as the set of words describing the correspondingtopic. We transform the problem of proposing the label of a topic into truth finding(truth discovery) domain where we find the label for each of the top-N words in thetopic. The label for a topic is then selected from the labels of the correspondingtop-N words. The rest of the chapter is structured as follows. We begin with theproblem definition of the task we are addressing in Section 6.2. We then detailour proposed method of generating and ranking candidate labels in Section 6.3.Section 6.4 explains the experiments we conducted to evaluate the performance ofour proposed method, and Section 6.5 concludes the paper.
6.2 Problem DefinitionWe properly define the task we are addressing in this research as follows. Let S
and L be the set of all semantic classes and a fixed finite set of class labels respec-tively. An element e of a semantic class si œ S is defined as e œ si and e /œ S \ si.We further define a tuple T as a set of n elements (n > 1), where each of the nelements belongs to a di�erent semantic class of S. Topic labelling is then dealswith the task of mapping an attribute label l œ L to the semantic class si givensome examples of its members (e1, e2, ..., ei). Given a set of tuples T1, T2, ..., Tj thentopic labelling has to find a set of labels {l1, l2, ..., ln} from the set of examples mem-bers {e11, e12, ..., e1j}, {e21, e22, ..., e1j}, ..., {e11, e12, ..., eij}. Given the set of tupleseeds as follows <Indonesia, Jakarta, Indonesian Rupiah>, <Singapore, Singapore,Singapore Dollar>, <France, Paris, Euro>, we expect topic labelling to return

6.3. PROPOSED APPROACH 81
“country”, “capital city”, and “currency name” for the set of {Indonesia, Singapore,France}, {Jakarta, Singapore, Paris}, and {Indonesian Rupiah, Singapore Dollar,Euro} respectively.
Algorithm 13: FindCandidateLabelsInput : A set of words W = {w1, w2, ..., wk}
Output: A set of candidate labels L
1 L = ÿ;2 foreach wi œ W do3 D = {FindDocuments(wi)};4 foreach d œ D do5 L = L fi {ExtractCategories(d)};6 end7 end8 return L;
6.3 Proposed ApproachIn this research, we propose to automatically label topics generated via topic modelsby analysing a heterogeneous graph of relating the di�erent objects and conceptscharacterising the problem: topics, words, Wikipedia articles, ancillary semanticinformation, and candidate labels. The graph is processed using truth discoveryalgorithms to produce a ranked list of candidate labels for each topic. We firstdescribe how we generate candidate labels and then detail the ranking process.
6.3.1 Generating Candidate LabelsOur method of generating candidate labels is inspired by Lau et al. [105]. We lever-age a knowledge base, in our case, it is Wikipedia1, as the source for the candidatelabels. Each article in Wikipedia has a list of categories associated with it. Thecategories are placed at the bottom of the page near the end of every article. We usethese categories as our candidate labels. We perform the following two methods ofextracting candidate labels for the topic model. To detail each method, we considerthe following set of words {charles, prince, king, diana, royal, queen, family, parker,british, bowles} which are sorted in descending order based on the weight given byLDA.
Our first method of generating candidate labels is detailed in Algorithm 13. Thealgorithm accepts as input a set of k words W . We use each of the words wi in W asthe search query to Wikipedia (line 2-3). From each of the search result return byWikipedia, we consider only the top ten articles. We extract categories from thesearticles as the set of candidate labels for the topic (line 5). Since each topic given
1http://en.wikipedia.org

82 CHAPTER 6. TOPIC LABELLING WITH TRUTH FINDING
by LDA is described by a set of ten words, thus we have ten runs of the previouslydescribed method for every topic. The algorithm returns the set of candidate labelsL (line 8).
Lau et al. [105] stated that a good label for a topic is usually better expressedusing a combination of words. Intuitively, using a combination of words to queryWikipedia may lead to more relevant articles. These relevant articles obviously havemore relevant categories. This is the motivation behind our next method which ispresented in Algorithm 14. The algorithm accepts a set of k words W and an integern. n controls the n-grams we want to create and is di�er of n in n-element tuples.We build n-grams from the set of words (line 2). Using the running example setof words and n=2, the bigrams constructed are {charles prince}, {prince king}, ...,{british bowles}, etc. As in the previous method, we then search Wikipedia usingeach of the bigrams and retrieve the categories from the articles in the search resultas the candidate labels (line 3). We experiment with n=3, 4 and 5 to investigatethe most e�ective n-grams to use as the query. We also investigate which of the twomethods is better in terms of accuracy in proposing the most relevant label. Wepresent the details of the result of the experiments in Section 6.4.2.
Algorithm 14: FindCandidateLabelsNGramsInput : A set of words W = {w1, w2, ..., wk}, an integer n
Output: A set of candidate labels L
1 L = ÿ;2 W = CreateNGrams(W , n);3 L = {FindCandidateLabels(W )};4 return L;
6.3.2 Ranking the LabelsAfter generating a set of candidate labels, the next step is to rank the labels andselect the most relevant label for each topic. To achieve the task, we first construct agraph of entities with topics, words, Wikipedia articles, and candidate labels as thenodes while relationships among them as the edges. We then generate facts fromthe graph of entities as input to the truth discovery algorithm. Finally, we selectthe label for each topic based on the result of the truth discovery algorithm. Wedetail each of the steps in the process next.
Building Graph of Entities
Algorithm 15 details the process of building the graph of entities. We start the graphwith the K topics which we denote in the graph as Topic-1, Topic-2, ..., Topic-K(line 2). Each of the topics has a set of words, thus we add all of the words tothe graph as nodes (line 4). We relate each topic to its set of words by drawingedges between them (line 5-7). As detailed in Algorithm 13 and Algorithm 14 inSection 6.3.1, we propose two methods of retrieving candidate labels, i.e. using each

6.3. PROPOSED APPROACH 83
Algorithm 15: BuildGraphInput : A set of topics T , where each topic ti œ T is a set of words Wi
Output: A graph of entities G = (V, E)1 V = ÿ; E = ÿ;2 V = V fi {T};3 foreach ti œ T do4 V = V fi {Wi};5 foreach w œ Wi do6 E = E fi {< ti, CONSISTS_OF, w >};7 end8 if useNGrams then9 W
Õ
i= CreateNGrams(Wi, n);
10 V = V fi {WÕ
i};
11 foreach w œ Desc do12 Desc = FindDescendant(w, W
Õ
i);
13 foreach w՜ W
Õ
ido
14 E = E fi {< w, GENERATE, wÕ>};
15 end16 end17 Wi = W
Õ
i;
18 end19 foreach w œ Wi do20 D = {FindDocuments(w)};21 V = V fi {D};22 foreach d œ D do23 E = E fi {< w, RETRIEV E, d >};24 L = {ExtractCategories(d)};25 V = V fi {L};26 foreach l œ L do27 E = E fi {< d, EXTRACT, l >};28 end29 end30 end31 end32 return G;

84 CHAPTER 6. TOPIC LABELLING WITH TRUTH FINDING
Table 6.1: Excerpt of input for truth discovery algorithmsWord Attribute Candidate Label Wikipedia Articlesserum Label serology clinical_pathologyserum Label blood plasma hematologyserum Label serology epidemiology
word or n-grams to query Wikipedia. In the latter approach, we first generate then-grams from the set of words Wi, add the n-grams to the graph, and link eachword that is used to compose the n-grams (line 8-16). We then replace Wi with theset of n-grams (line 17). From each element (word/bigram) of Wi, we retrieve a setof Wikipedia articles (line 20). Thus, we link each word/bigram and the resultingWikipedia articles in the graph (line 23). We then extract categories on each articleas the candidate labels, add them to the graph, and create links between the articlesand the candidate labels (line 24-28).
Algorithm 16: GenerateFactsInput : A graph of entities G = {V, E}
Output: A set of facts tuples B
1 B = ÿ;2 W = {retrieve “word” node from G};3 foreach w œ W do4 D = {retrieve child nodes of w and the type of node=“document”};5 foreach d œ D do6 L = {retrieve child nodes of d and the type of node=“label”};7 foreach l œ L do8 b =< w, ”label”, l, d >;9 B = B fi {b};
10 end11 end12 end13 return B;
Generating Facts
Truth discovery algorithm takes as input a collection of facts proposed by somesources regarding properties values of some objects. The goal of the truth discoveryalgorithm is to determine the true value of the properties as well as the level oftrustworthiness of each source. In accordance with this definition, in this research,we define objects, sources, and facts as words describing the topics, documents(Wikipedia articles), and candidate labels extracted from the articles respectively.We generate the input to the truth discovery algorithms from the graph of entitiesconstructed in our candidate labels generation process using Algorithm 16. We startby retrieving a set of nodes W with the type of “word” (line 2). For each word w in

6.3. PROPOSED APPROACH 85
Table 6.2: Indexes for labels extracted from the same articleWord Attribute Candidate Label Wikipedia Articlesserum Label blood sugar level blood_test_1serum Label blood plasma blood_test_2serum Label serology blood_test_3
W , we retrieve its child nodes D where the nodes’ type is “document” (line 4). In theconstructed graph, a “word” type node can be directly linked to a “documents” or viathe n-grams. In the latter case, we first find the “n-grams” nodes which are derivedfrom the “word” node and then collect the “document” nodes to the n-grams. Truthdiscovery algorithms do not acknowledge the relationships in between the objectsand sources (words and documents), thus we disregard the n-grams when generatingthe facts. For each of the document, we then retrieve the labels and generate thefacts as tuples consisting of the word, the label and the document (line 5-11). Anexample of the generated input for truth discovery algorithms is shown in Table 6.1.
From Table 6.1, we can see that there are three sources where each of the sourcesproposes a label for the word “serum”. An agreement-based algorithm such as Ma-
jority voting would choose “serology” as the best label for the word based on thefacts given. The decision is based entirely on the number of sources which supportthe fact and disregard the trustworthiness level of the sources. However, this can bea problem since sources can propagate false information among them deliberately orunintentionally. Advance truth discovery approaches, on the other hand, not onlyconsider the number of votes received by a fact but also the trustworthiness of thesources. For the same facts as in Table 6.1, an advance truth discovery algorithmcould choose “blood plasma” as the best label depending on the level of trustworthi-ness of each of the sources. The confidence of the facts and the trustworthiness ofthe sources are calculated iteratively. As an initial setup, all sources are consideredto have the same level of trustworthiness. The trustworthiness level of a source is up-dated based on the number of facts contributed by the source which are consideredas true on each iteration. After completion, the truth discovery algorithm returnsthe confidence level of each fact and the level of trustworthiness of each source.
As described earlier in Section 6.3.1, we extract categories from Wikipedia articleas candidate labels. Wikipedia can assign more than one category to an article.Thus in our graph of entities, a Wikipedia article can be connected to more thanone label. In the truth discovery algorithm setting, a source can only contribute onefact of an object’s property. In our research, if we apply the setting strictly, thismeans that a Wikipedia article can only contribute a label for a given word. Thiscould potentially remove good candidate labels as we have to choose only a labelfrom the article. To accommodate this with the truth discovery algorithms, we addindexes at the end of the article name for labels extracted from the same Wikipediaarticle as shown in Table 6.2. We generate the facts for input to the truth discoveryalgorithms using Algorithm 16.
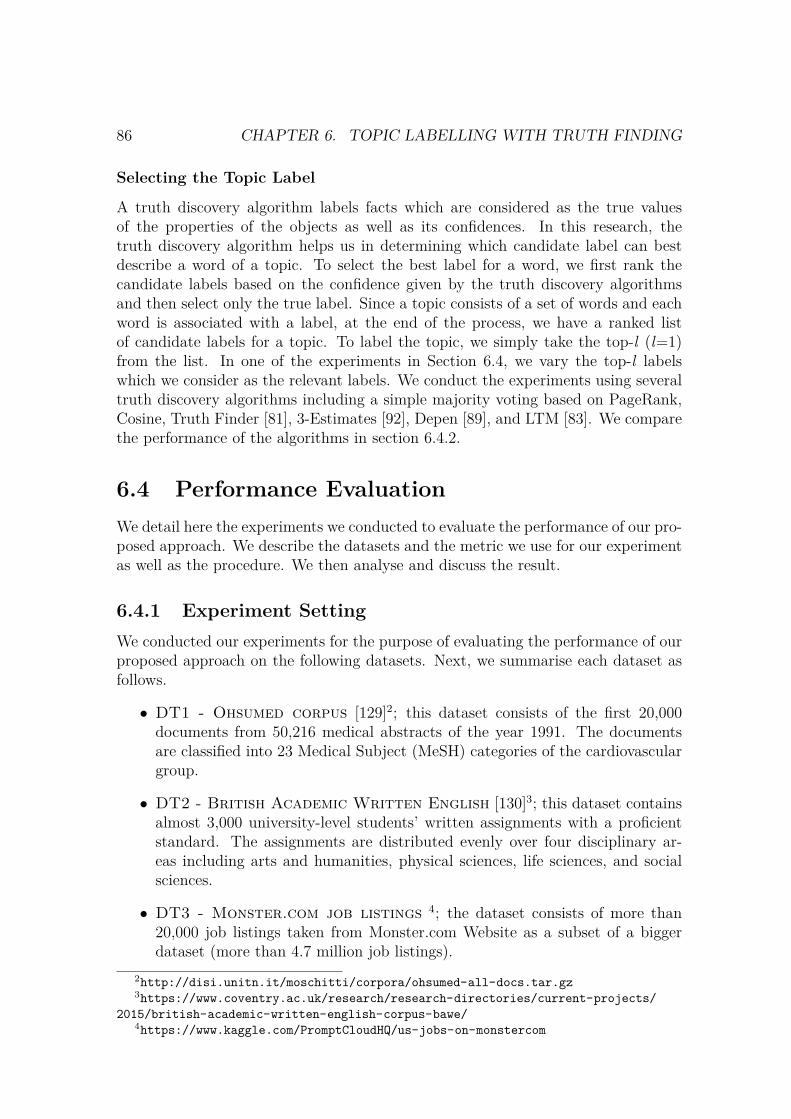
86 CHAPTER 6. TOPIC LABELLING WITH TRUTH FINDING
Selecting the Topic Label
A truth discovery algorithm labels facts which are considered as the true valuesof the properties of the objects as well as its confidences. In this research, thetruth discovery algorithm helps us in determining which candidate label can bestdescribe a word of a topic. To select the best label for a word, we first rank thecandidate labels based on the confidence given by the truth discovery algorithmsand then select only the true label. Since a topic consists of a set of words and eachword is associated with a label, at the end of the process, we have a ranked listof candidate labels for a topic. To label the topic, we simply take the top-l (l=1)from the list. In one of the experiments in Section 6.4, we vary the top-l labelswhich we consider as the relevant labels. We conduct the experiments using severaltruth discovery algorithms including a simple majority voting based on PageRank,Cosine, Truth Finder [81], 3-Estimates [92], Depen [89], and LTM [83]. We comparethe performance of the algorithms in section 6.4.2.
6.4 Performance EvaluationWe detail here the experiments we conducted to evaluate the performance of our pro-posed approach. We describe the datasets and the metric we use for our experimentas well as the procedure. We then analyse and discuss the result.
6.4.1 Experiment SettingWe conducted our experiments for the purpose of evaluating the performance of ourproposed approach on the following datasets. Next, we summarise each dataset asfollows.
• DT1 - Ohsumed corpus [129]2; this dataset consists of the first 20,000documents from 50,216 medical abstracts of the year 1991. The documentsare classified into 23 Medical Subject (MeSH) categories of the cardiovasculargroup.
• DT2 - British Academic Written English [130]3; this dataset containsalmost 3,000 university-level students’ written assignments with a proficientstandard. The assignments are distributed evenly over four disciplinary ar-eas including arts and humanities, physical sciences, life sciences, and socialsciences.
• DT3 - Monster.com job listings4; the dataset consists of more than
20,000 job listings taken from Monster.com Website as a subset of a biggerdataset (more than 4.7 million job listings).
2http://disi.unitn.it/moschitti/corpora/ohsumed-all-docs.tar.gz
3https://www.coventry.ac.uk/research/research-directories/current-projects/
2015/british-academic-written-english-corpus-bawe/
4https://www.kaggle.com/PromptCloudHQ/us-jobs-on-monstercom

6.4. PERFORMANCE EVALUATION 87
Table 6.3: Candidate labels generationDataset Method Topic
T1 T2 T3 T4 T5 T6 T7 T8 T9 T10
DT1 Keywords 0.27 0 0.13 0 0.44 0.13 0.22 0 0 0.062 -grams 0.23 0 0.23 0.11 0.50 0.20 0.28 0.22 0 0
DT2 Keywords 0.27 0 0.10 0.14 0.17 0.19 0.37 0.25 0.07 0.172 -grams 0.43 0.29 0.17 0.31 0.26 0.39 0.43 0.42 0.40 0.54
DT3 Keywords 0.21 0.44 0.13 0.21 0.38 0.28 0.17 0.22 0.36 0.272 -grams 0.33 0.50 0.57 0.54 0.46 0.67 0.33 0.47 0.56 0.40
Acc =
q|R|i=1 Label(i)
| G |; (6.1)
We evaluate the performance of the truth discovery algorithms for the task oftopic labelling in terms of accuracy. To be able to achieve this we need to havebaselines. In this research, we manually build our baselines for each dataset. Wefirst run LDA on each corpus and learn K topics where each topic is represented bythe top-10 words. For example, the following top-10 words are given by LDA forthe 2nd topic: {patients, levels, serum, renal, less, plasma, insulin, blood, normal,increased}. For each topic learned by LDA, we select labels from the set of candidatelabels which are relevant to the topic. For the previous set of top words, the rele-vant labels are “diabetes”, “blood plasma”, “kidney failure”, “disorders of endocrinepancreas”, and “insulin”. We then compare the list of candidate labels generatedby the truth discovery algorithms with the baselines to calculate the accuracy usingEquation 6.1. Label(i) returns 1 if the i-th candidate label is found in our baseline,otherwise, it returns 0. |G| and |R| denotes the size of the baseline and the totalnumber of candidate labels respectively.
6.4.2 ExperimentsWe start the experiment by investigating the candidate labels generation process.We apply the following approach for the three datasets we use in the performanceevaluation where each dataset consists of ten topics. The candidate labels are gener-ated by extracting the categories from each article returned by Wikipedia. We applythe two methods detailed in Section 6.3.1 to retrieve the Wikipedia articles. At first,we use each word as a separate query to Wikipedia. Next, we generate n-grams fromthe set of words. After each run of the search, we build our graph of entities. For eachof the graphs generated from the previous step, we apply truth discovery algorithmsincluding majority voting, Cosine, Truth Finder [81], 3-Estimates [92], Depen [89],and LTM [83]. We then measure the accuracy of each algorithm using Equation 6.1.We then calculate the average accuracy for each candidate label generation methodfor each topic on the datasets across di�erent truth discovery algorithms. Table 6.3shows the result of this experiment. The first column in Table 6.3 corresponds tothe three datasets which we use in our experiments. For each dataset in column 1,we perform two methods of candidate labels generation including using each word

88 CHAPTER 6. TOPIC LABELLING WITH TRUTH FINDING
as the query to Wikipedia (Keywords) and building 2-grams (bigrams) from the setof top-N words. The columns T1, T2, ..., T10 refer to the topic number of eachdataset.
Next, we investigate the impact of using di�erent n-grams for n=2, 3, 4, 5 toquery Wikipedia. Our intuition is that using more words as a query would give morespecific Wikipedia articles. In the end, this would lead to more specific labels. Theresult of this experiment is shown in Figure 6.1. We evaluate the impact of usingdi�erent n-grams on the following truth discovery algorithms majority voting (MV),cosine (CO), TruthFinder (TF), 3-Estimates (3E), Depen (DP) and LTM (LT). Weshow in Figure 6.1 the average accuracy (y-axis) of each algorithm (x-axis) acrossthe topics in each dataset.
In this experiment, we are interested in investigating the best truth discoveryalgorithm for our task of topic labelling. To focus our examination, we conductthe experiments using the best candidate label generation method. The methodselection is based on the previous experiment. Figure 6.2 shows the comparisonresult of the truth discovery algorithms in terms of average accuracy (y-axis). Thetruth discovery algorithms in comparison are shown as x-axis (MV=majority voting,CO=cosine, TF=TruthFinder, 3E=3-Estimates, DP=Depen, LT=LTM).
As our last experiment, we investigate the possibility of improving the perfor-mance of our proposed method by varying the selection of the top labels from thelist of candidate labels for the topic. For this experiment, we only use the best truthdiscovery algorithm using the best method for generating the candidate labels bothof which are based on the results of the previous experiments. The result of theexperiment is shown in Figure 6.3. The x-axis of Figure 6.3 shows the number oftop labels (l) we consider when calculating the average accuracy (y-axis) for eachtopic of the datasets. We show the average accuracy for each dataset across the tentopics.
6.4.3 Result and DiscussionFrom Table 6.3, we can see that generally using 2-grams for querying Wikipediais more e�ective than queries using each individual word. For T2, T4, T8, T9 ondataset DT1 as well as T2 on DT2, querying each word to Wikipedia yield a scoreof 0 on accuracy. We then take a closer look at each of these topics and datasets.We find that among the set of words in each topic of the datasets, there are somevery general words such as women, disease, patients, god, magnetic, etc. Whenwe query Wikipedia using one of the words, for example magnetic, we retrieve thecandidate label “magnetism” from the article. This label itself is very general. Theterm magnetic is a member of the topic T8 of dataset DT1. The other set of wordsare {patients, imaging, nerve, syndrome, brain, may, cerebral, spinal, clinical}. Wewould not consider “magnetism” as a relevant label as it is clear that it can notdescribe the topic. The relevant labels in our baseline for the topic T8 of dataset DT1are “magnetic resonance imaging”, “medical imaging”, and “neurology”. The firstand second label in the baseline can be retrieved by querying magnetic imaging andpatients imaging to Wikipedia. This is where our proposed method of using 2-grams

6.4. PERFORMANCE EVALUATION 89
MV CO TF 3E DP LT0
0.1
0.2
0.3
0.11
0.21
0.19
0.25
0.25
5·10
≠2
4·10
≠2
5·10
≠2
5·10
≠2
2·10
≠2
5·10
≠2 0.
11
4·10
≠2
2·10
≠2
5·10
≠2
3·10
≠2
2·10
≠2
0.11
4·10
≠2
2·10
≠2
2·10
≠2 7·10
≠2
2·10
≠2
3·10
≠2
Aver
age
Acc
urac
y
2-grams 3-grams 4-grams 5-grams
Figure 6.1: n-grams average accuracy comparison for dataset DT1
as the query to Wikipedia yield more relevant labels than querying each word. Onespecial case where querying each word achieves better accuracy than 2-grams is ontopic T10 for dataset DT1. The set of words for this topic are the following {induced,cells, activity, e�ect, animals, rats, mice, response, increased, e�ects}. The labels inour baseline for topic T10 are “germ cells”, “induced mice”, and “invasive mammalspecies”. Out of the three labels, “invasive mammal species” can be retrieved fromWikipedia articles using the word rats as the query. Using the 2-grams generatedfrom the set of words, we fail to retrieve any of the labels in our baseline. Bothmethods, however, fail to propose relevant labels on dataset DT1 for topic T2 andT9. Both topics are specific topics related to “diabetes” and “cognitive behavioraltherapy” respectively. For topic T2, the closest labels proposed by both methods are“kidney cancer” or “insulin therapies”. A human judgment would probably relateboth labels to “diabetes” but since our method is completely unsupervised, it rejectsthe labels. In topic T9, our methods could only propose a more general labels suchas “psychotherapy” and “medical terminology” for the set of topic words {patients,treatment, therapy, group, treated, dose, study, months, less, received} whereas thelabels expected are “cognitive behavioral therapy”, “group psychotherapy”, “therapygroup” or “psychology”. Nevertheless, based on the examination of the experimentresult we conclude that using 2-grams as the query to Wikipedia is better thanquerying each word.
Figure 6.1 shows the average accuracy comparison of varying the n=2, 3, 4, 5for the n-grams on dataset DT1. In general, forming 2-grams from the set of top-Nwords as query to Wikipedia gives better accuracy than using n=3, 4 or 5. 2-gramsachieves 2 to 10 times higher than 3-grams, 4-grams or 5-grams for majority voting(MV), cosine (CO, TruthFinder (TF), 3-Estimates (3E) and Depen (DP). We lookat the result of the experiments and find that querying Wikipedia using 3-grams

90 CHAPTER 6. TOPIC LABELLING WITH TRUTH FINDING
MV CO TF 3E DP LT0
0.2
0.4
0.6
0.8
1
0.11 0.
21
0.19 0.
25
0.25
5·10
≠2
5·10
≠2
0.58
0.57
0.21
0.62
2·10
≠2
0.15
0.62 0.63
0.54 0.
62
8·10
≠2
Aver
age
Acc
urac
y
DT1 DT2 DT3
Figure 6.2: Average accuracy of truth discovery algorithms for 2-grams
returns more articles. This also means that we extract more candidate labels. Un-fortunately, most of the labels are not correct according to our baseline. For example,in T1 of dataset DT1, the 3-grams “surgery treatment years” retrieves the followinglabels “cardiac surgery”, “thoracic surgery” and “vascular surgery” among others,whereas “complications patient postoperative” retrieves “anesthesia”, “vomiting”and “intensive care medicine”. From the former 3-grams, we are given the specifictype of surgeries which probably need years of treatment after the operative pro-cedure. The latter 3-grams retrieves a symptom and ways to handle complicationsexperienced by the patients. None of the retrieved labels are in the baseline. Thiscontributes to the fact that 3-grams achieves low average accuracy score. Moreover,as we have mentioned previously, most of the labels extracted by the 3-grams arequite specific. However, a special case where 2-grams achieves lower average accu-racy than 3-grams and 4-grams can be seen on algorithm LT. The average accuracyachieves by LT on 3-grams is 0.11. We investigate the result of the experiments toexplain this case. In T2, T8 and T9 of dataset DT1, LT selects “coronary arterydiseases”, “magnetic resonance imaging” and “group psychotherapy” as the labelrespectively. All of the selected labels are in our baseline. In this case, the 3-gramsagain retrieves specific labels but since they are all in the baseline the average ac-curacy of LT increases. This shows that a more sophisticated method of generatingthe baseline is necessary. The method must also balance the granularity level of theselected labels. Using too specific or too general labels could hurt the accuracy ofthe topic labelling model.
We have established from the previous experiment that the best method forcandidate generation is by using n-grams of the set of words. We now focus ourattention to find the best truth discovery algorithm for the task of topic labelling.For this examination, we only consider the results of the experiments in which we use

6.4. PERFORMANCE EVALUATION 91
1 2 3 4 50
0.2
0.4
0.6
0.8
1
0.25 0.
33 0.43 0.
49
0.49
0.62 0.
71 0.78 0.81 0.
85
0.62
0.79 0.
87 0.91 0.93
Aver
age
Acc
urac
y
DT1 DT2 DT3
Figure 6.3: Average accuracy of Depen on varying the top-l (l=1, 2, 3, 4, 5)
2-grams as the query to Wikipedia as shown in Figure 6.2. Looking at the accuracyof the truth discovery algorithms in Figure 6.2, we find that LTM and majorityvoting su�ers in all the datasets. The average accuracies of both algorithms are inthe range of 0.02-0.08 and 0.05-0.15. These values are considerably less than theother truth discovery algorithms in all three datasets. In dataset DT2, the accuraciesof LTM and majority voting are as low as 0 for most of the topics. We take a look atthese topics and find that majority voting only retrieves two to three labels for eachtopic. From the retrieved labels, a maximum of one label is true according to ourbaselines which means that the algorithm constantly voting for the wrong labels.The same case also applies for LTM where the approach mostly discovers wronglabels. In dataset DT1, 3-Estimates receives the same average accuracy as Depen,while TruthFinder ranks the highest in terms of accuracy in dataset DT3. However,both algorithms fall short of Depen in the other two datasets. Interesting caseswhere all truth discovery algorithms receive 0 in terms of accuracy can be found indataset DT1 (topic T2, T9, and T10). The set of words describing the topic T2of dataset DT1 are as follows {patients, levels, serum, renal, less, plasma, insulin,blood, normal, increased}. The set of labels in our baseline are “blood plasma”,“diabetes”, “disorders of endocrine pancreas”, “insulin”, “kidney failure”. We takea look at each algorithm and find that most of the algorithms actually consider“insulin therapies” or “kidney anatomy” as the relevant labels. Both of these labels,from human judgment point of view, can be considered as having a relationship withthe labels in our baseline. “insulin therapies” is a more specific topic than “insulin”whereas “kidney anatomy” is more general than “kidney failure”. Both of these casesshow hierarchical relationships. This opens up a new possibility of a future work infinding relationships among the extracted labels. From this set of experiments, we

92 CHAPTER 6. TOPIC LABELLING WITH TRUTH FINDING
conclude that the best truth discovery algorithm for the task of topic labelling isDepen.
The goal of the last experiment is to investigate the impact of varying the numberof top-l labels selected for each topic. Figure 6.3 shows the average accuracy of Depenacross the ten topics in each dataset when we vary the top-l from 1 to 5. The generalconclusion that can be inferred from Figure 6.3 is that the correct labels tend toappear in the top-5 of the list. We take a closer look at datasets DT1 where Depenreceives relatively low score than on the other datasets. When we set l=1, in everytopic of dataset DT1 we find that there is at least one label which is referred to asthe true value for some of the words on the topic. For example, in Topic 5 wherethe set of words are {patients, tumor, disease, cancer, carcinoma, cases, tumors,cell, diagnosis, lesions}, the words diseases, cancer, and cases all refer to the samelabel “infectious causes of cancer”. We refer to this type of labels where it is referredto by many words in the topic as the dominant label. We search through all ofthe other topics and find the same case where there is at least one dominant labelin it. These dominant labels are extracted from di�erent Wikipedia articles usingdi�erent 2 -grams queries. Our method then select “infectious causes of cancer” forTopic 5 label because it has the highest weight given by Depen. Indeed, this is notthe correct label because our baselines are “carcinoma diagnosis”, “oncology” and“medical terminology”. When we vary the number of labels to be selected for eachtopic (l=2 or 3), our method retrieves “medical terminology” which is one of thebaselines. This helps improve the accuracy score of Depen.
6.5 ConclusionWe propose to leverage truth discovery algorithms for the task of finding and rank-ing candidate labels of the topics in a topic model. We use Wikipedia as the sourceto extract the candidate labels by composing queries using the set of words of thetopics. We apply di�erent techniques of composing the query including generatingthe n-grams as the queries from the set of topic words. Several truth discovery algo-rithms are then used to retrieve the top-l labels for each of the word in the topic. Weevaluate the performance of the truth discovery algorithms in terms of accuracy onthe retrieved labels. From the result of the empirical evaluation, we show that ourapproach is both e�cient as well as practical. We are investigating the possibilityof improving the approach by detecting relationships between candidate labels. Ac-quiring the knowledge of relationships between candidate labels of the topic domaina priori may have a positive impact on the performance of our approach.

Chapter 7
Set Labelling using Multi-labelClassification
7.1 Introduction
In this chapter, we investigate a di�erent approach of labelling the set of tuple seeds.Instead of considering each group of tuple seeds as words describing topic models asin Chapter 6, we treat them as elements constituting a set and then attempt to inferthe appropriate label for the set using some features of the elements. To achievethe goal of inferring the label for the set, we leverage a multi-label classifier. Weillustrate the task which we address in this research by the following simple real-lifescenario. Consider Alice who is searching for cosmetics products. She browses Kiko’sWebsite and is interested in two products that she finds on the Website: “BrightLift Night” and “Bright Lift Mask”. Unfortunately, the two products seem to beout-of-stock and nowhere to be shopped online. Alice decides to search for similarproducts on other brands’ Websites. She visits Yves Rocher’s Website. She coulduse the Website’s search box or browse it by categories, but not only the names ofthe products but also their categories are di�erent and Alice is not sure about whatkeywords to use. The problem which Alice faces in the scenario described previouslyis how to infer a label (category) for a set (the set of products) given some examplesof its members (products). Of course, in the case of Alice, inferring the label requiresmore than just the name of the products. It is therefore imperative to find othercharacteristics (features) of the products to infer the label. We properly define theproblem in the next section as well as propose a possible solution to the problem.In the case of Alice, we apply the proposed solution that allows Alice to discoverthe categories of products in which she is interested. The solution, is applied in theform of a search tool, finds the corresponding categories in Yves Rocher’s Websiteto the categories of the products of Kiko’s Website.
We organised this chapter as follows. In Section 7.2, we define the task of setlabelling, propose a solution to the problem as well as implements the approach totwo real-life scenarios in Section 7.3. We then evaluate the performance of a systemimplementing our approach in Section 7.4. We conclude the chapter in Section 7.5.
93

94 CHAPTER 7. SET LABELLING USING MULTI-LABEL CLASSIFICATION
7.2 Problem DefinitionWe properly define the task of set labelling that we are addressing in this chapter. Setlabelling deals with finding the most suitable label for a set, given some examplesof its members. The example members are referred to as seeds while the set ofseeds itself is the query. The task assumes that the set is homogeneous, i.e. eachmember of the set belong to the same class of objects or concepts. Set labellingtries to find an appropriate characterisation, a name or label, for the class. For thiswork, we consider sets of terms (words). For instance, given the seeds “Indonesia”,“Singapore”, and “Malaysia”, set labelling can infer that these three objects belongto a set of countries, which can, therefore, be labelled as “country”. One can alsoargue that the label should or could be “Asian country”, “Southeast Asian country”,“ASEAN members” as all of the seeds also belong to the aforementioned sets. Thus,set labelling returns a set of labels as the result instead of only a single relevantlabel. There is also inherent uncertainty regarding the sources that are used forthe labelling. Therefore, it is imperative to return results ranked according to somedegree of confidence or certainty.
Figure 7.1: Flowchart of the system
7.3 Proposed ApproachWe propose a solution to the task of set labelling by leveraging a multi-label classifier.In the traditional multi-class problem, the classifier must decide for a given input asingle label which is considered as the most relevant. However, in the set labellingtask, a given set of seeds can be assigned to more than one relevant label. In thissetting, it is more appropriate to adopt the multi-label classification to our taskas a multi-label classifier returns a set of relevant labels for the given input. The

7.3. PROPOSED APPROACH 95
classifier also ranks the labels according to their level of confidence which is also inline with the definition of the set labelling task.
To be able to evaluate our proposed approach of the set labelling task, we applyit to two real-life domains, i.e. cosmetic products and hotels. Alice’s scenario is themotivation behind the first domain, while the similar setting can also happen in thesecond. Consider a person who is planning his holiday where he needs to arrangethe accommodation. He has traveled to various places and enjoyed the hotel wherehe stayed in each place. Based on this past experiences, he already has the specificcriteria for his favorite hotel. However, upon booking the accommodation, theWebsite does not provide the search tool that accommodating to all of his criteria.In this scenario, the problem that is faced by the person is how to find other hotelssimilar to the ones he has stayed in before based on his preferences. This problemcan easily be tackled, that is, considering that we can retrieve the labels for all theprevious hotels that the person has visited and then return other hotels under thesame labels.
To propose a solution to both domains, we implement our approach into a searchengine. This search engine can be embedded in various domains, not only the twowe use as examples. The flowchart of the proposed solution is shown in Figure 7.1.In Figure 7.1, we show both the training and the user interaction process as a singleflowchart.
7.3.1 Training ProcessThe process starts with training the multi-label classifier using labelled dataset.Each entry in the dataset consists of an object, the labels assigned and the featuresof the object. In this implementation, we choose the features as a set of wordsdescribing the corresponding object, i.e. descriptions of the cosmetic products andreviews given by users for the hotels. We then transform the features to a lowerdimension as vectorized bag-of-words. To acquire the bag-of-words vectors, we useScikit-learn [131] using the module CountVectorizer and TFIDFVectorizer [132].We also conduct experiments using gensim’s doc2vec [133] as a comparison. Theresult of the experiments using di�erent methods of vectorization is presented inSection 7.4. This vectorized bag-of-words and the labels are the input to train theclassifier.
7.3.2 User InteractionOnce the classifier has been trained, the user can interact with the system by givingeither keywords or a description of the unknown objects as input. Since the multi-label classifier is trained using descriptions of the objects and its assigned labels,when interacting with the system, it is better to give also a form of description ofthe unknown objects as the queries. Nevertheless, if the user only provides keywordsfor each object then we need to be able to expand the given keywords and use it asthe features of the unknown object instead. We achieve this by leveraging LatentDirichlet Allocation (LDA) [1] into the expansion process.

96 CHAPTER 7. SET LABELLING USING MULTI-LABEL CLASSIFICATION
LDA is a generative probabilistic model of a corpus. LDA assumes that a docu-ment is composed of random mixtures over latent topics, where each topic itself is adistribution over words. In the cosmetics products and hotels scenario, we considerthe product labels and hotel categories as topics respectively. We use the descrip-tions of all products or reviews of hotels as input and ask LDA to learn K topics(number of product labels or hotel categories). The output of LDA is K topicswhere each topic is a distribution of words. We use the distribution of words in eachtopic in the query expansion process which is detailed next.
Algorithm 17: Query ExpansionInput : A set of words I, topic distribution K, integer T
Output: A set of words O
1 O = I;2 foreach w œ I do3 z Ω {select from K where w has the highest probability};4 m Ω {select top-T words from z};5 O = O fi m;6 end7 return O;
To expand the query, we use Algorithm 17 and give as input a set of keywordsO, K topic-words distribution, and a number C. For each word o in the set ofkeywords O, we select topic z among K topics where o has the highest probability(line 3). Word o may appear in all of the K topic-words distribution but has di�erentprobabilities. Our intuition is to select the topic where o has the highest probability,i.e. o most likely belongs to that topic. From topic z, we take the top-T words toappend o (line 4). This means that the T words are the best words to describetopic z. We do the same procedure for every words o and return the union of all thewords as the expansion result (line 7).
The same procedure is repeated as many times as required depending on thenumber of unknown objects. Each query to the multi-label classifier returns a rankedlist of labels considered relevant by the classifier with refers to the given input. Theproposed labels for the set of the unknown objects is then retrieved by intersectingall ranked list of labels from each run of the query. From the set of proposed labels,we retrieve other objects under those labels and present them to the user.
7.4 Performance Evaluation
7.4.1 Experiment SettingPerformance evaluation is done on a system implementing our proposed solutionusing two datasets from the cosmetics products and hotels domains. Table 7.1shows a snippet of the Yves Rocher and Tripadvisor dataset. Each row in thedataset consists of an object name, a description, and labels assigned to it.

7.4. PERFORMANCE EVALUATION 97
• DT1 - Yves Rocher. We collect our corpus of product names, descriptions,and labels assigned to the products from four Yves Rocher’s Web pages (http://yvesrocher.com.my, http://yvesrocherusa.com, http://yves-rocher.co.uk, http://www.yvesrocher.ca). The total number of distinct productsis 692. Each product can be assigned to at least a label (hence the multi-labelaspect), where the number of distinct labels is 182. We also include commentsgiven by users who have tried the product into the description. We also retrieveYves Rocher’s product reviews from https://www.makeupalley.com.
• DT2 - Tripadvisor. We collect the data of hotel reviews from Tripadvisor.There are 2,943 distinct hotels from this data with reviews. However, thereview data does not have any information regarding the hotel labels. Thus,we manually collect labels for each hotel from Tripadvisor Web page. Thereare 52 unique hotel labels, such as ’Hotels with Free Wifi, ’Cheap Hotels’,’Hotels with Kitchenette’, ’Apartment Hotels’, etc.
In the multi-class (i.e., single-label) classification problems, the standard evalua-tion metric is accuracy where we measure the number of correct predictions from allof the predictions. In addition, precision, recall, F-measure and ROC area, completethe list of metrics for single multi-class classification problems [134]. However, noneof this traditional metrics can be used to evaluate multi-label classification. Theprediction for an object in multi-label problems is a set of labels instead of just asingle label. The traditional metrics failed to capture the partially correct notionwhere only some of the predicted labels are correct. Godbole et al. in [117] extendthe definitions for accuracy1 (A), precision (P), recall (R), and F-measure (F1) asthe following. For each object i, let Si and Si denote the correct and the predictedset of labels respectively.
A = 1N
Nÿ
i=1
|Si fl Si|
|Si fi Si|; P = 1
N
Nÿ
i=1
|Si fl Si|
|Si|(7.1)
R = 1N
Nÿ
i=1
|Si fl Si|
|Si|; F1 = 1
N
Nÿ
i=1
2|Si fl Si|
|Si| + |Si|(7.2)
We use the metrics in Equation 7.1 and Equation 7.2 to evaluate the performanceof the multi-label classifier.
In multi-label classification problem, the confidence output for each label is usu-ally of real-valued. Thus, we need a threshold to be able to separate the relevantand irrelevant labels. For a given vector w œ IRL of real-valued confidence outputs,a threshold function ft(w) mapped a multi-label prediction y such that:
yj =
Y]
[1 if wj Ø t
0 if wj < t(7.3)
In [121], the author claims that using a single threshold throughout the evaluationis more e�cient and just as e�ective as using a threshold vector. Thus, in our
1Also known as Jaccard index in this formulation

98 CHAPTER 7. SET LABELLING USING MULTI-LABEL CLASSIFICATION
Table 7.1: Yves Rocher & Tripadvisor datasetOBJECT NAME DESCRIPTION LABELS
Anti Age Global Kit This care struggle against the main charac-teristics of skin aging such as wrinkles, darkcircles, sagging skin and dull skin. Plant na-tive cells bring you their full potential self-regeneration. Set includes: Complete Anti-aging Day Care 15ml Complete Anti-agingNight Care 15ml
Anti Age Global, SkinCare
... ... ...
ADAGIO AC-CESS BORDEAUXRODESSE
The apartments were in a very good locationfor the city. Rooms clean and comfortable andsta� friendly. There is a basic kitchen in theroom which is a real bonus. Secure on siteparking. We did not use any of the hotel facil-ities. The apartment was very good value formoney. It had a single bed ...
Hotels with Free Wifi,Cheap Hotels, Hotelswith Kitchenette,Apartment Hotels
... ... ...
performance evaluation, we calibrate the threshold t using Equation 7.4 [121].
t = arg mint
......1N
Nÿ
i=1
Lÿ
j=1y
i
j≠
A1N
Nÿ
i=1
Lÿ
j=11wjØt
B......(7.4)
In Equation 7.4, N refers to the number of examples in the test set while L is thenumber of labels. The first part of Equation 7.4 is basically just the average numberof labels associated with each example [120]. The second part of the equation alsocalculates the same value, but in this case in the predicted labels with thresholdt. We choose t such that it minimises Equation 7.4. We find that t = 0.2 satisfiesEquation 7.4 for both datasets.
We set the maximum and minimum document frequency (max_df and min_df )to 0.95 and 2 for both CountVectorizer and TFIDFVectorizer. If either max_dfor min_df is of real value, the parameter represents a proportion of documents,otherwise, it is considered as absolute counts. Setting the two parameters ensuresthat words which appear too frequent or infrequent are going to be ignored whenbuilding the vocabulary.
To vectorize the description of an object using doc2vec, we set the hyperparame-ters as suggested in [135]. The initial (–) and minimum learning rate (–min) are setto 0.025 and 0.001 respectively. The vector size for each description is 300 and thenumber of epoch we use is 20. We train our multi-label classifier using a chainingmethod proposed in [121]. By using the chaining method instead of BM, we canstill capture the correlations that exist among labels without the expense of com-putational complexity. The base algorithm we use for each classifier in the chain isthe random forest with 100 estimators.
Since the multi-label classifier is the core of our proposed solution, we focus onevaluating its performance on two datasets as summarised in Table 7.1. Initially, wecompare the unnormalised vector (CountVectorizer) against the normalised (TFID-FVectorizer). The result is shown in Table 7.2. We use 100, 300, and 500 as thenumber of features extracted from each of the descriptions. Secondly, we compare

7.4. PERFORMANCE EVALUATION 99
Table 7.2: Comparison of CountVectorizer (CV) and TFIDFVectorizer (TF)Accuracy Precision Recall F1
100 300 500 100 300 500 100 300 500 100 300 500
Yves RocherCV 0.27 0.32 0.33 0.3 0.36 0.36 0.53 0.61 0.61 0.59 0.65 0.66TF 0.26 0.31 0.33 0.29 0.35 0.36 0.51 0.62 0.62 0.55 0.67 0.67
TripadvisorCV 0.35 0.35 0.35 0.38 0.38 0.38 0.7 0.71 0.71 0.74 0.75 0.75TF 0.35 0.35 0.35 0.38 0.38 0.38 0.71 0.71 0.71 0.75 0.75 0.75
Table 7.3: Comparison of TFIDFVectorizer (TF) and doc2vec (DC)Accuracy Precision Recall F1300 500 300 500 300 500 300 500
Yves RocherTF 0.31 0.33 0.35 0.36 0.62 0.62 0.67 0.67DC 0.04 0.03 0.05 0.04 0.11 0.09 0.12 0.1
TripadvisorTF 0.35 0.35 0.38 0.38 0.71 0.71 0.75 0.75DC 0.32 0.32 0.37 0.37 0.64 0.62 0.68 0.67
the best vectorization method from the first experiment with doc2vec. In both ex-periments, we split the dataset as train and test set. We fix the training and test setto 85% and 15% respectively. From the result of the second experiment, we choosethe best vectorization method and implement it to the search engine.
To evaluate the performance of our proposed method of set labelling, we createn unknown products from each category in the Yves Rocher dataset. To producethe description of each unknown product, we randomly select two products withinthe same category and concatenate the product descriptions. Next, we ask theclassifier to assign the labels for each of these unknown products. We then take theintersection of the labels and compare the result with the original labels assigned byYves Rocher to calculate the accuracy. Table 7.4 shows the result of the experiments.
7.4.2 Result and DiscussionFrom Table 7.2, we can see that for Yves Rocher dataset, CountVectorizer performsbetter for a small number of features. On the other hand, the performance ofTFIDFVectorizer increases in corresponds to the number of features. The increasein performance for both CountVectorizer and TFIDFVectorizer is noticeable whenwe change the number of features from 100 to 300. However, a higher number offeatures than 300 does not improve the performance. For Tripadvisor data, on theother hand, varying the vectorization method or the number of features does nota�ect the performance. We take a closer look at the predicted labels for this dataset.We find that the classifier almost always returns a particular label as the prediction.This label is ’Hotels’. This is something that is quite ’predictable’ because 2
3 of thedataset is labelled as ’Hotels’. We intend to find a better source of labels for theTripadvisor dataset. From this result, we can also see that we achieve better recallwhen we use TFIDFVectorizer and set the number of features to 300 or 500. Thus,we choose TFIDFVectorizer to compare with doc2vec in the second experiment.
Table 7.3 shows the result of the second experiment. For Yves Rocher dataset, wecan see that using doc2vec to vectorize the description yields low result in all of the

100CHAPTER 7. SET LABELLING USING MULTI-LABEL CLASSIFICATION
metrics. Increasing the number of features to 500 does not improve the performanceeither. On the contrary, doc2vec achieves considerably the same performance asTFIDFVectorizer for Tripadvisor dataset. This result is possibly a�ected by thelarge number of the Tripadvisor dataset, which is four times greater than the YvesRocher dataset. Moreover, the number of reviews for each hotel in the Tripadvisordataset is also likely to have a positive impact on the final result. This result agreeswith the claim that doc2vec needs more words to learn and produce good vectorrepresentation of the data as indicated by Lau et al. [135].
Figure 7.2: Screenshots of the search engine
Using the result of the experiments, we choose TFIDFVectorizer as the vector-ization method for our multi-label classifier to use in the search engine for YvesRocher and Tripadvisor. A few snapshots of the implemented search engine can beseen in Figure 7.2. In the first snapshot, we can see that the input to the system isdescriptions. From each of the descriptions, our system infers a ranked list of labelsthrough the use of the multi-label classifier. We take the intersection of these rankedlists of labels as the final set of labels. The final set of labels is then used by thesystem to query the database and retrieve all objects under each label in the set. Wepresent the final set of labels and its objects to the user. In the second snapshot, theinput to the system is only one keyword for each object. The system then expandsthe keyword using Algorithm 17 and feeds the result of the query expansion into theclassifier. The same process as described earlier is then carried out to present theuser with the relevant objects.
Table 7.4 shows the result of our experiments in finding the label of n unknownproducts for the Yves Rocher dataset. The first column denotes the number of n

7.5. CONCLUSION 101
Table 7.4: Set Labelling Accuracy on Yves Rocher Datasetn Trial
Average1 2 3 4 5 6 7 8 9 102 0.95 0.93 0.97 0.93 0.95 0.95 0.97 0.95 0.94 0.96 0.953 0.93 0.95 0.94 0.92 0.94 0.93 0.95 0.93 0.95 0.94 0.944 0.95 0.94 0.93 0.90 0.92 0.91 0.94 0.93 0.94 0.91 0.93
unknown products (n=1, 2, 3). In the second column, for each value of n, we conductten trials and calculate the accuracy of the set labelling approach. The last columnshows the average accuracy of the experiments. From the experiment results, wefind that our set labelling approach achieves an average accuracy of more than 90%.
7.5 ConclusionWe introduce the set labelling problem and propose a possible solution to the prob-lem by using multi-label classification. We show that the multi-label classifier pro-duces a relatively good result in accuracy, precision, recall, and F-measure for YvesRocher and Tripadvisor dataset. The set labelling approach achieves an averageaccuracy of more than 90% in finding the labels of n unknown products of YvesRocher dataset. We apply the solution of this set labelling problem to a search en-gine for Yves Rocher and Tripadvisor. We are currently investigating various waysof improving the precision and recall of the multi-label classifier as well as evaluatingthe performance of our implemented solution in comparison to the traditional searchengine provided on the site.

102CHAPTER 7. SET LABELLING USING MULTI-LABEL CLASSIFICATION

Chapter 8
Conclusions and Perspectives
8.1 Conclusive SummaryIn this thesis, we have addressed several challenges in searching information byexamples, particularly information in the form of n-ary relations (tuple). We pre-sented a number of contributions that aid in extracting and ranking the extractedcandidate tuples. We addressed the following important problems: the set of tuplesexpansion, the truthfulness of the extracted candidates, tuple reconstruction andsemantically expanding the set of examples, which make a promising step towardsrealizing examples-oriented information extraction.
In the first part of the thesis, we generalised the set expansion problem to set oftuples expansion [35]. The proposed method takes as input a set of n-elements tu-ples as examples whereas traditional set expansion approaches mainly only consideratomic values. The generalisation process raises challenges in the crawling, wrappergeneration, and candidate extraction phases. Our proposed method applies severalstrategies to retrieve relevant documents based on the given seeds including permu-tation of the seeds as keywords to the search engine. Locating occurrences of theseeds in the documents also consider the fact that each element of the seeds mayappear arbitrarily. We implemented our proposed approach to a system (STEP)and demonstrated its e�ectiveness using eleven topics where each topic defines a setof tuples or table. We also compared our system to state-of-the-art set expansionsystems (DIPRE [16] and Extended SEAL [30]) and showed that it achieves betterperformance in terms of precision and recall in several topics.
In [35], we adopted the ranking mechanism of SEAL [24] which is based on agraph of entities where the nodes represent entities while the edges between themdenote the relationships. We then added a new entity, i.e. domain, into the graphand its relationships. The candidates are then ranked based on the weight assignedto the nodes after the walk has been completed. However, this ranking mechanismdoes not guarantee that the candidates with higher weight are true candidates asSTEP may also extract false candidates. We proposed to leverage truth findingapproach to find the true candidates among all candidates extracted by STEP [36].We generated facts as input to the truth finding algorithms from the graph of entities.Our experiments using several state-of-the-art truth finding algorithms on seven
103

104 CHAPTER 8. CONCLUSIONS AND PERSPECTIVES
topics showed that Accu [89] is the best algorithm. Accu also gives significantimprovement in terms of precision, recall, and F-measure compared to the graph-based ranking mechanism. In [37], we also compared the ranking of sources producedby the graph-based method and Accu. We found that leveraging truth findingalgorithm, particularly Accu, can indeed improve the confidence in the producedranking based on the Kendall’s Tau scores.
We proposed the tuple reconstruction [38] task with the purposing of recon-structing n-elements tuples from binary ones. The motivation behind this task isthat documents (e.g. Web pages) that contain information in the form of n-elementstuples are rarely to be found, while on the contrary binary tuples are very common.We presented two methods to reconstruct the n-elements tuples. To evaluate theperformance of the proposed approach, we embedded the tuple reconstruction intothe process of building the graph of entities in STEP. Experiment results on threetopics showed that the tuple reconstruction can propose new candidates which arenot extracted by STEP. Indeed, this integration of tuple reconstruction into STEPhas increased its recall. However, this improvement may also impact the precisionnegatively.
In the second part of the thesis, we focus our attention on expanding the set ofexamples semantically. A set of n-elements tuples can be considered as n groups ofwords describing n topics. Having the knowledge of the label of each topic wouldmake expanding the set of examples semantically be possible. As the first work, weleveraged topic labelling to give relevant labels for the topics. We transformed theproblem of proposing the label of a topic into truth finding domain [40]. We usedthe words as the query to a knowledge base and retrieved categories of the returneddocuments as the candidate labels. We then associated a label for each word in thetopic by leveraging truth finding approach. The topic label is then selected as thelabel of the words in the topic with the highest confidence given by the truth findingapproach.
Finally, we addressed the set labelling problem which deals with the task offinding an appropriate label for a set given some examples of its members. Weconsidered elements of a group in the set of examples as members of a set. Thus,by inferring the label of the set from features of the elements, we could expand theexamples semantically. We proposed a solution to the problem by first training amulti-label classifier using labelled dataset. Each entry in the dataset denotes anobject, the labels assigned and features of the object. We used the description ofthe object as its feature. Once we have trained the multi-label classifier, for a set ofunknown or unseen objects, the classifier then inferred the relevant labels for each ofthe objects. The labels for the set is then selected as the intersection of all the labelsreturned by the classifier for all unknown objects. We applied our solution of theset labeling problem into a search engine [39] and experimented with two real-worldscenarios, i.e. cosmetic products and hotels. We showed how the search engine caninfer the labels and then present the user with all objects under the correspondinglabels.
All of the research presented in this thesis provide coherent work on extractingand ranking candidate tuples. The research work also helps in achieving examples-

8.2. PERSPECTIVES 105
oriented information extraction.
8.2 PerspectivesWe propose in this section the most promising research directions identified fromthe study conducted during this thesis. We discuss the following main challenges ontargeted crawling, expansion on sibling pages, multiple facts from a source settingin truth discovery, and harnessing the hierarchy of labels for topic or set labelling.
Targeted crawling One of the main challenges we face in the set of tuples ex-pansion is to collect the relevant documents with refers to the given tuple seeds. Wehave experimented on a search engine by querying it using the concatenation of allthe seeds and then changing the order of each word in the query. However, this ap-proach does not have a significant impact on finding the relevant documents. Sincea rich collection of documents containing the seeds is critical in order to generatewrappers, the method of finding the relevant documents is paramount.
Expansion on sibling pages Information in the form of n-ary relations frequentlyis presented as paginated Web pages (sibling pages). However, these paginated Webpages do not appear in the search result. Failure of identifying and retrieving suchpaginated Web pages may lead to the loss of potential candidates.
Multiple facts from a source In a single truth setting of truth finding problem,a source can only contribute to a single fact regarding an attribute of an object.Embedding truth finding into the ranking process of our set of tuples expansion ap-proach forces us to adopt the single truth setting by considering facts from a singlesource as multiple facts from di�erent sources. One possible direction for dealingwith this challenge is by harnessing current research on truth finding which can ac-commodate multiple facts from a single source. This could potentially improve theconfidence of candidates ranked by the truth finding.
Hierarchy of labels An ontology generally groups elements of a set into a hierar-chy of labels. It is interesting to investigate for the set labelling or topic labellingproblem if we could harness this hierarchy of labels to propose the relevant labelsfor the set given the set of seeds.

106 CHAPTER 8. CONCLUSIONS AND PERSPECTIVES

Appendix A
Ranking of Sources
Table A.1: Ranking of sources for DT2URL
PageRank Accu Precision Recall F-measure
Weight Rank Acc. Rank Score Rank Score Rank Score Rank
http://www.
upi.com/
List-of-Nobel-Prize-in-Physics-winners/
68891381229493/
0.00653 1 0.5526 4 0.0896 4 0.1214 4 0.1031 4
https:
//simple.
wikipedia.
org/wiki/
List_of_
Nobel_Prize_
winners_in_
Physics
0.00561 2 1.000 2 0.2385 3 0.2429 2 0.2407 3
https://en.
wikipedia.
org/wiki/
List_of_
Nobel_
laureates_
in_Physics
0.00561 3 1.000 1 0.2385 2 0.2429 1 0.2407 2
https://www.
nobelprize.
org/nobel_
prizes/
physics/
laureates/
0.005 4 0.7446 3 0.4893 1 0.2149 3 0.2987 1
http://math.
ucr.edu/home/
baez/physics/
Administrivia/
nobel.html
0.00425 5 - - - - - - - -
107

108 APPENDIX A. RANKING OF SOURCES
Table A.2: Ranking of sources for DT3URL
PageRank Accu Precision Recall F-measure
Weight Rank Acc. Rank Score Rank Score Rank Score Rank
http://www.
safesurfingkids.
com/chat_
room_
internet_
acronyms.htm
0.0005 1 0.5074 4 0.00325 5 0.0011 5 0.00165 5
http://www.
netlingo.com/
acronyms.php
0.00036 2 0.1875 6 0.4488 1 0.4167 1 0.4322 1
http://www.
webopedia.
com/
quick_ref/
textmessageabbreviations.
asp
0.00035 3 0.4718 5 0.0163 4 0.01186 2 0.0137 2
http://www.
smart-words.
org/
abbreviations/
text.html
0.00027 4 0.7669 1 0.1951 2 0.0059 3 0.0115 3
http:
//mistupid.
com/internet/
chattalk.htm
0.00027 5 0.5713 3 0 6 0 6 0 6
http://www.
txtdrop.com/
abbreviations.
php
0.00026 6 0.6884 2 0.045 3 0.00185 4 0.0035 4

109
Table A.3: Ranking of sources for DT4URL
PageRank Accu Precision Recall F-measure
Weight Rank Acc. Rank Score Rank Score Rank Score Rank
http://www.
worldclasslearning.
com/
general-knowledge/
list-countries-capital-currencies-languages.
html
0.00127 1 0.4252 6 0.1246 1 0.1762 1 0.14601 1
https://www.
spotthelost.
com/
country-capital-currency.
php
0.00062 2 0.5533 4 - 4 - 4 - 4
http://www.
science.
co.il/
international/
Currency-codes.
php
0.0006 3 0.8635 2 - 4 - 4 - 4
http://www.
currentaffairsandgk.
com/
list-of-countries-and-capitals-with-currency-and-official-languages/
0.0006 4 0.4774 5 0.0714 2 0.0983 3 0.0827 2
http://1min.
in/content/
international/
currency-codes
0.0006 5 0.9049 1 - 4 - 4 - 4
http://self.
gutenberg.
org/articles/
list_of_
countries_
and_capitals_
with_
currency_
and_language
0.00052 6 0.1237 7 0.0627 3 0.1106 2 0.0801 3
http://
bankersadda.
in/
country-capital-currency-list/
0.00045 7 0.7088 3 - 4 - 4 - 4

110 APPENDIX A. RANKING OF SOURCES
Table A.4: Ranking of sources for DT5URL
PageRank Accu Precision Recall F-measure
Weight Rank Acc. Rank Score Rank Score Rank Score Rank
http:
//english.
ahram.org.eg/
NewsContent/
6/55/251949/
Sports/World/
List-of-Ballon-dOr-winners.
aspx
0.0042 1 0.9603 2 0.7627 2 0.7377 1 0.75 1
https:
//sg.news.
yahoo.com/
list-ballon-dor-winners-191013973--sow.
html
0.00359 2 0.9749 1 0.5 5 0.0163 6 0.0317 6
http://www.
totalsportek.
com/list/
fifa-ballon-dor-winners-of-all-time/
0.00302 3 0.099 6 0.0806 6 0.0819 5 0.0813 5
http://www.
nairaland.
com/3520320/
list-previous-ballon-dor-winners
0.00297 4 0.8039 4 0.8275 1 0.3934 3 0.533 3
http://www.
topendsports.
com/sport/
soccer/
list-player-of-the-year-fifa.
htm
0.00287 5 0.6923 5 0.5384 4 0.1147 4 0.1891 4
http://www.
topendsports.
com/sport/
soccer/
list-player-of-the-year-ballondor.
htm
0.00283 6 0.8136 3 0.6229 3 0.6229 2 0.6229 2
Table A.5: Ranking of sources for DT6URL
PageRank Accu Precision Recall F-measure
Weight Rank Acc. Rank Score Rank Score Rank Score Rank
https://
www.youtube.
com/watch?v=
qxzIeQ_y5lE
0.00505 1 0.4715 3 0.3846 3 0.0769 3 0.1282 3
http:
//www.betdsi.
com/events/
entertainment/
miss-universe
0.00505 2 0.8788 2 0.796875 1 0.78461 1 0.79069 1
https://en.
wikipedia.
org/wiki/
List_of_Miss_
Universe_
titleholders
0.00475 3 0.9373 1 0.7924 2 0.6461 2 0.7118 2

111
Table A.6: Ranking of sources for DT7URL
PageRank Accu Precision Recall F-measure
Weight Rank Acc. Rank Score Rank Score Rank Score Rank
http://www.
widescreenings.
com/
who-beat-oscar-best-actor.
html
0.001675 1 0.00069 3 0 3 0 3 0 3
http:
//www.1728.
org/page8.htm
0.00165 2 0.3889 2 0.1554 2 0.3448 2 0.2142 2
http://www.
nndb.com/
honors/511/
000032415/
0.00163 3 0.7804 1 1.0 1 1.0 1 1.0 1

112 APPENDIX A. RANKING OF SOURCES

Appendix B
Résumé en Français
Pour rechercher des informations sur le Web, il faut généralement créer une requêteà partir d’un ensemble de mots-clés et l’envoyer à un moteur de recherche. Cetteméthode traditionnelle nécessite que l’utilisateur connaisse relativement bien le do-maine de l’information ciblée pour trouver les bons mots clés. Les résultats de larecherche, sous la forme de pages Web, sont classés en fonction de la pertinencede chaque page Web par rapport aux mots clés donnés. Pour le même ensemblede mots-clés, les pages Web renvoyées par le moteur de recherche seraient classéesdi�éremment en fonction de l’utilisateur. De plus, pour trouver des informationsspécifiques telles que le nom d’un pays et sa capitale, l’utilisateur devrait parcourirtous les documents et en lire le contenu manuellement. Cela prend non seulementdu temps, mais exige également beaucoup d’e�orts. Nous abordons dans cette thèseune méthode alternative de recherche d’informations, c’est-à-dire en donnant desexemples des informations en question. Tout d’abord, nous essayons d’améliorer laprécision de la recherche à l’aide d’exemples de systèmes en développant syntax-iquement les exemples donnés. Ensuite, nous utilisons le paradigme de découvertede vérité pour classer les résultats de la requête renvoyée. Enfin, nous étudionsla possibilité d’étendre sémantiquement les exemples en étiquetant chaque grouped’éléments des exemples.
B.1 Ensemble d’expansion de n-upletsLa tâche d’extension des ensembles consiste à extraire d’un corpus des éléments d’uneclasse sémantique particulière caractérisée par quelques exemples de ses membres.Plus précisément, étant donné un ensemble d’exemples, également appelés semences(par exemple, noms) caractérisant une classe sémantique particulière (par exemple,les présidents américains) et une collection de documents (par exemple, des pagesHTML), le problème de l’extension de l’ensemble est d’extraire davantage d’élémentsde la classe sémantique particulière de la collection de documents. Par exemple, nousvoudrons peut-être trouver les noms des présidents des États-Unis d’Amérique endonnant comme exemples les trois exemples Barrack Obama, George Bush et BillClinton. Le but ici est d’extraire les noms de tous les autres présidents américainsdu Web.
113

114 APPENDIX B. RÉSUMÉ EN FRANÇAIS
Les approches d’expansion d’ensemble utilisent un cadre en trois étapes. La pre-mière étape est l’exploration. Compte tenu de l’ensemble des graines, l’explorationrecherche les documents pertinents contenant les graines. Les di�érentes méth-odes de composition des requêtes à partir des sources peuvent être appliquées pouranalyser le moteur de recherche et collecter les pages Web. La prochaine étapeest la génération de wrapper et l’extraction de candidats. La première consiste àrechercher toutes les occurrences des graines dans les pages Web collectées. Il identi-fie ensuite des modèles (wrappers) à partir de contextes entourant les occurrences dessemences. Ce dernier utilise ces wrappers pour rechercher et extraire d’autres can-didats possibles des pages Web. La dernière étape est le classement. Les processusde génération d’enveloppe et d’extraction de candidats sont susceptibles d’extrairedes données superflues et erronées en raison de l’imperfection des modèles inférés.Classer les candidats en fonction de leur vraisemblance est alors primordial pourprésenter des résultats satisfaisants aux utilisateurs.
Les approches d’expansion d’ensembles existantes (DIPRE [16], SEAL [24]) trait-ent en grande partie des semences atomiques. Chaque graine dans l’ensembled’exemples donnés par l’utilisateur est constituée d’un seul élément. Cependant, laplupart du temps, un utilisateur demande des informations sous la forme d’instancesde relations, comme dans le modèle relationnel d’une base de données. Dans cecas, une instance de relation ou un n-uplet est composé d’un ensemble de valeursatomiques. Les approches d’expansion des ensembles susmentionnées doivent êtregénéralisées pour résoudre ce problème. Nous proposons notre approche consistantà étendre le problème de l’extension des ensembles à celui des ensembles de n-uplets.
Nous proposons de concevoir, mettre en œuvre et ávaluer une extension del’approche d’extension d’ensemble à l’extension d’ensemble de n-uplets (STEP). Lagénéralisation de l’extension de l’ensemble soulève de nouveaux défis à chaque étapedu cadre d’expansion de l’ensemble: récupération des documents pertinents, généra-tion d’encapsuleurs pour extraire les n-uplets candidats et classement des n-upletscandidats. Les di�cultés proviennent principalement du fait que les graines sontconstituées de multiples éléments (graines composites) et que chacun des élémentspeut apparaître de manière arbitraire sur une page Web. En outre, aucune structurecohérente ne sépare chaque élément de la graine sur la page Web. Nous abordonsce problème en adoptant un wrapper basé sur des expressions régulières dans lequelnous tirons parti d’une version légèrement modifiée de l’algorithme de modificationde distance (Section 3.2.2). Pour classer le candidat, nous basons notre mécanismesur SEAL [24] où nous ajoutons un nouveau nœud (domaine) et son ensemble derelations (Section 3.2.3).
B.1.1 Robot d’aspiration de site WebConsidérer les semences composées plutôt que atomiques pose le problème de l’ordredes éléments dans la graine. La question n’est ni discutée par les auteurs de [16]ni par [24]. En e�et, les moteurs de recherche tels que Google sont relativementrobustes lorsqu’on leur attribue des mots-clés dans des ordres di�érents. Cetterobustesse, cependant, sou�re de longues listes de mots-clés, comme c’est le cas avec

B.1. ENSEMBLE D’EXPANSION DE N-UPLETS 115
des graines composées de nombreux éléments. Nous avons essayé et pris en compteles chaînes de recherche formées avec la permutation des éléments des graines. Bienque cela puisse améliorer les performances dans certains cas, nous n’envisageonspas de telles permutations en raison du nombre élevé de permutations possibles.Dans la phase de génération de l’emballage (Section 3.2.2), cependant, de tellespermutations sont importantes pour déterminer l’occurrence des semences. Nousutilisons le moteur de recherche Google pour collecter des pages Web. La requêtede recherche est la concaténation de tous les éléments de toutes les graines. Pourl’ensemble des graines <Indonésie, Jakarta, Rupiah Indonésienne>, <Singapour,Singapour, Dollar de Singapour>, la requête de saisie de Google est «Indonésie» +«Jakarta» + «Rupiah Indonésienne» + «Singapour» + «Singapour» + «Dollar deSingapour».
B.1.2 Génération de wrappers et extraction de candidatsNous voulons extraire les candidats des documents (pages Web) de notre corpus.Par souci de simplicité, dans ce travail sans perte de généralité, nous considéronsque les pages Web sont des documents HTML. Afin de pouvoir extraire les candidatsdes pages Web, nous devons d’abord déduire le wrapper sous-jacent. Ce wrapper estgénéralement constitué de contextes (caractères) entourant les attributs des grainesdonnées et des n-uplets candidats à récupérer ultérieurement. DIPRE [16] imposeune contrainte selon laquelle un wrapper ne peut être généré que s’il met toutes lesoccurrences des graines sur les pages. C’est une contrainte très stricte qui diminueconsidérablement le rappel (le pourcentage de résultats corrects parmi tous les ré-sultats corrects possibles) du systme. SEAL [24], en revanche, relâche la contraintelors de la construction des wrappers. Un wrapper est généré s’il met entre paren-thèses au moins une occurrence de chaque graine sur une page. En relâchant lacontrainte, SEAL surpasse DIPRE, notamment lors du rappel. Sur cette base, nousadoptons l’approche de SEAL en matière d’induction par emballage. Cependant,SEAL ne fonctionne que sur des graines avec des valeurs atomiques ou des relationsbinaires. Pour les graines avec plus d’un élément, nous devons d’abord trouver lescontextes entre chaque élément, déduire l’encapsuleur et utiliser l’encapsuleur inférépour extraire les candidats.
Une fois que toutes les occurrences de chacune des graines du n-uplet sont trou-vées, nous essayons ensuite d’inférer un motif de chacun des ensembles de con-textes. Nous appliquons une comparaison caractre-caractre pour des paires decontextes gauche et droit et prenons comme résultat la chaîne commune la pluslongue (LCWrap, RCWrap). Pour le contexte de droite, nous faisons la comparai-son de gauche à droite, tandis que pour la partie de gauche, nous devons inverserle processus. En ce qui concerne les contextes intermédiaires, nous générons uneexpression régulière commune à partir de paires du contexte en utilisant un al-gorithme de modification de la distance légèrement modifié. Les résultats sontnotés MCWrap1, MCWrap2, ..., MCWrapn≠1 pour chacun des contextes du mi-lieu. L’ensemble de wrappers est ensuite défini comme les combinaisons de chacundes LCWrap, MCWrap1, MCWrap2, ..., MCWrapn≠1 et RCWrap. Nous utilisons le

116 APPENDIX B. RÉSUMÉ EN FRANÇAIS
wrapper généré pour extraire les candidats de la page Web. Le processus d’extractionest assez simple. Nous ajoutons un groupe de capture, noté (.*?) dans l’expressionrégulière, entre LCWrap, MCWrap1, MCWrap2, ..., MCWrapn≠1 et RCWrap. Nousutilisons ensuite un analyseur d’expression régulière pour rechercher ses occurrencesdans la page Web et extraire les informations souhaitées du groupe de capture.
L’un des problèmes liés aux semences composites est que chaque élément de lagraine peut apparaître de manière arbitraire sur une page Web. Considérez la graine<Indonésie, Jakarta, Rupiah Indonésienne>. L’expression régulière utilisée pour lo-caliser les occurrences de la graine précédente serait: «(. {1, max_context_length})Indonesia(.*)Jakarta(.*)Roupie indonésienne(.{1, max_context_length})». Cetteexpression régulière ne parviendrait pas à détecter l’occurrence de la graine si l’élément«Roupie indonésienne» apparaît au début de la page Web, suivi de «Indonésie» et«Jakarta», Si nous ne considérons pas un tel cas, nous ne trouverons aucune oc-currence du n-uplet dans la page Web et nous ne pourrons générer aucun wrapper.Pour résoudre ce problème, nous envisageons également de localiser les occurrencesdes permutations des éléments de la graine. Tous les candidats extraits à l’aide deces enveloppes permutées doivent être replacés dans l’ordre des graines données.
B.1.3 ClassementNous adoptons le mécanisme de classement introduit dans SEAL [24]. Les noeuds dugraphique représentent des entités, à savoir des graines, une page Web, un wrapper,un candidat et un domaine. L’entité principale indique à quelle page Web appartient.Ce type d’entité n’est pas obligatoire dans le graphique utilisé par SEAL. Nousdiscutons di�éremment parce que cette relation est importante pour produire uneliste classée des domaines pertinents pour les semences. Ceci est un sous-produit denotre mécanisme de classement dans lequel nous pouvons non seulement répondre àla requête précédente, mais également à d’autres, telles que les pages Web les pluspertinentes, etc. Par exemple, il existe une frontiére entre les semences et les pagesWeb, car les pages Web correspondantes sont extraites en utilisant les semencescomme requête du moteur de recherche. Les entités et leurs relations utilisées dansnotre graphique d’entités sont résumées dans le tableau 3.2.
Une fois le graphique généré, un processus itératif est exécuté pour e�ectuerune marche aléatoire [76] sur le graphique. Le poids attribué à chaque nœud, unefois que le processus itératif est terminé ou atteint une probabilité stationnaire, estensuite utilisé pour produire une liste de classement des entités. Cependant, la so-lution exacte pour trouver la probabilité stationnaire d’une marche aléatoire dansun graphique consistant à calculer l’équation A
ú = (A ≠ I)≠1, où A et I sont respec-tivement la matrice de transition et la matrice d’identité. Le problème de la marchealéatoire est non seulement coûteux en calcul, mais ne fonctionne pas non plus dansles cas particuliers de graphe, c’est-à-dire un graphe dont les noeuds n’ont pas debord sortant (nœuds pendants) et un graphe avec des composants déconnectés. Dansce cas, tous les nœuds reçoivent 0 comme poids final. Ceci est contre-intuitif carseuls les nœuds qui n’ont pas de bord entrant doivent recevoir 0 comme poids final.Dans ce dernier cas, la notation des pages de classement d’un composant connecté

B.1. ENSEMBLE D’EXPANSION DE N-UPLETS 117
à un autre composant connecté devient ambiguë. Page et. Al. [77] apportent lasolution à ce probléme en introduisant une constante positive p entre 0 et 1, qu’ilsappellent le facteur d’amortissement. Ils définissent également la matrice PageRank(ou matrice Google) du graphique par l’équation M = (1 ≠ p) · A + p · B. A désignela distribution initiale des nœuds tandis que B est la probabilité de «téléportation».La probabilité de téléportation est une matrice n-par-n avec chaque entrée égaleà 1
n. La matrice n M modélise la marche aléatoire comme suit. Si nous sommes
à un nœud i, au mouvement suivant, la plupart du temps, nous suivons les bordssortants de i vers l’un de ses nœuds voisins. Un pourcentage du temps plus petitmais positif, nous quittons le nœud actuel et choisissons arbitrairement un nouveaunœud dans le graphe et le «téléportent» vers ce nœud. Il a également été prouvédans [123] que l’algorithme PageRank était compétitif par rapport à d’autres méth-odes de classement, telles que Random Walk with Restart [124], Bayesian Sets [125]et Wrapper Length [123]. Pour ces raisons, nous avons choisi d’appliquer Pagerankau graphique des entités. Le poids calculé par PageRank pour chaque nœud peutensuite être utilisé pour classer les nœuds du même type. Les candidats présentéscomme sortie du système sont classés en fonction de leur poids en tant que PageR-ank. Nous sommes également en mesure de produire une liste classée du domaine enfonction des semences. Cela peut être considéré comme le domaine le plus pertinentpour la requête d’un utilisateur particulier.
Table B.1: Comparaison des performances de DIPRE, Ext. SEAL, et STEPAlgorithme
SujetMoyenne
DT1 DT2 DT3 DT4 DT5 DT6
PrécisionDIPRE 0 0 0 0.945 0.256 0 0.2
Ext. SEAL 0 0.6 0.46 0.93 0 0.6 0.43STEP 0.97 0.07 0.74 0.945 0.136 0.182 0.51
RappelDIPRE 0 0 0 0.845 0.005 0 0.14
Ext. SEAL 0 0.24 0.125 0.83 0 0.88 0.345STEP 0.986 0.38 0.98 0.441 0.126 1.0 0.65
B.1.4 Comparaison avec l’état de l’artNous comparons notre approche proposée de l’extension de jeu de n-uplets à deuxsystèmes d’extension de jeu à la pointe de la technologie: DIPRE [16] et ExtendedSEAL [30]. DIPRE et Extended SEAL ne peuvent extraire que des relations binaires.Par conséquent, pour une comparaison équitable, nous évaluons les performances deDIPRE, Extended SEAL (Ext. SEAL) et STEP en termes de précision et de rappeluniquement pour l’extraction de n-uplets binaires. Pour cette expérience, nous neconsidérons que DT1-DT6 du tableau 3.3 en utilisant les germes donnés. Nousexécutons chacun des algorithmes en donnant les graines en entrée et en récupéranttoutes les pages Web (sans exclure aucune page Web de référence). Toutes lesapproches en comparaison trouvent les occurrences des graines en plaçant chaqueélément dans le même ordre que celui des éléments dans les graines. Ensuite, tousles algorithmes trouvent également les occurrences des germes où les éléments sontinversés. DIPRE n’utilisant aucun mécanisme de classement, nous comparons la liste

118 APPENDIX B. RÉSUMÉ EN FRANÇAIS
complète des candidats produite par chaque algorithme sans prendre en compte leclassement de chaque candidat. Nous définissons tous les paramètres requis parchaque algorithme à ses valeurs par défaut.
Le tableau B.1 montre le résultat de la comparaison des trois approches. Entermes de précision moyenne et de rappel, STEP surpasse DIPRE et Ext. JOINT.STEP obtient systématiquement une précision supérieure à celle de DIPRE sur lessujets DT1, DT2, DT3, DT4 et DT6. Parmi ces sujets, DIPRE reçoit le score deprécision le plus faible, à savoir 0 pour DT1, DT2, DT3 et DT6. Comme cela a étésouligné dans l’algorithme 1, DIPRE regroupe d’abord les occurrences des grainesen fonction de leurs contextes intermédiaires. Il applique ensuite la correspondanceexacte sur les contextes intermédiaires avant de générer le wrapper. De plus, il nepeut déduire que des pages Web qui utilisent des modèles semi-structurés (tableauHTML, liste ordonnée ou non ordonnée, par exemple) pour présenter les données.Sinon, l’objectif ne sera pas atteint. D’autre part, sur les six sujets utilisés danscette expérience, STEP obtient des scores de précision plus élevés que Ext. SCEAUdans les sujets DT1, DT3, DT5 et DT6. En fait, dans les sujets DT1 et DT5, Ext.SEAL n’extrait aucun candidat, tandis que STEP parvient à extraire 448 et 1759candidats dont 435 et 240 sont dans la réalité, respectivement. Ext. SEAL atteintune précision supérieure à STEP pour les thèmes DT2 et DT6. Nous examinons lesdétails et trouvons que Ext. SEAL extrait seulement 40 et 140 candidats, contre542 et 884 candidats extraits par STEP. Dans DT2, le nombre de candidats quisont conformes à la vérité au sol pour Ext. SEAL est égal à 24 alors que STEP 38.Cependant, STEP extrait un ordre de grandeur plus grand que les candidats SEAL,il obtient donc un score de précision inférieur. Nous parcourons également la listedes candidats extraits par STEP et constatons qu’elle contient un grand nombrede noms d’universités qui ne figurent pas dans la vérité au sol. STEP domineExt. SEAL en termes de rappel. En e�et, le seul cas où Ext. SEAL obtient unrappel supérieur à celui de STEP dans la rubrique DT4. Dans ce sujet, Ext. SEALparvient à extraire 637 candidats. Ce nombre est presque le double du nombre decandidats extraits par STEP. En DT6, STEP reçoit un score de rappel de 1,0 alorsque SEAL n’atteint que 0,88 alors que sa précision est bien inférieure. Cela prouveencore une fois le fait que STEP extrait davantage de candidats qui apparaissentdans la vérité au sol et qui sont pertinents pour les semences données. La raisonen est que SEAL implémente un algorithme de correspondance exacte pour déduireles contextes intermédiaires communs de toutes les occurrences des semences. Ceciest une exigence très stricte car les pages Web sont générées à partir de modèlesdi�érents et qu’il est donc très peu probable qu’elles aient les mêmes contextesintermédiaires. En raison de cet échec, SEAL ne peut pas créer de wrappers etne peut donc extraire aucun candidat. Notre approche proposée pour trouver descontextes intermédiaires communs repose sur l’expression régulière. Cela permetà STEP d’être plus flexible dans la construction du wrapper et dans l’extractiondes candidats. à partir des résultats de la comparaison, nous concluons que notreapproche peut extraire davantage de candidats pertinents pour les semences. Ceci,à son tour, contribue à la performance de notre approche en optimisant le rappeltout en o�rant une précision comparable à celle de l’état de la technique.

B.2. VÉRITÉ DANS LA SÉRIE D’EXPANSION DE N-UPLETS 119
B.2 Vérité dans la série d’expansion de n-upletsAuparavant, nous avions présenté le problème de l’extension des ensembles de n-uplets et proposé une approche permettant de résoudre ce problème en généralisantle problème de l’expansion de l’ensemble. Nous présentons et détaillons notre ap-proche à chaque phase, c.-à-d. l’exploration, la génération d’enveloppes et l’extractionpotentielle, ainsi que la méthode de classement. Nous étendons l’idée proposéeà l’origine par Wang et al. dans [24] et a appliqué une marche aléatoire sur ungraphique hétérogène de pages Web, de wrappers, de graines et de candidats afinde classer les candidats en fonction de leur pertinence pour les graines. Cependant,ce mécanisme de classement n’est pas en mesure de déterminer de manière fiableles vraies valeurs parmi les candidats extraits. Faire la distinction entre les valeursvraies et fausses de certains faits de manière automatisée, généralement connue sousle nom de recherche de la vérité, est un problème complexe qui a été étudié endétail dans plusieurs contextes tels que l’intégration des données et la vérificationdes faits. Nous proposons d’intégrer un algorithme de recherche de la vérité dansnotre processus d’expansion. L’objectif est de pouvoir présenter les vrais candidatsà l’utilisateur et d’obtenir de meilleures performances en termes de précision, derappel et de F-mesure.
B.2.1 Définition du problèmeNous abordons ici le problème de la recherche des vraies valeurs parmi les candidatsextraits par le système d’extension des ensembles de n-uplets. Avant de présenternotre approche consistant à utiliser l’algorithme de recherche de la vérité dans leprocessus d’expansion, nous commençons par la définition du problème.
Nous fixons l’ensemble des n-uplets candidats T extraits par STEP. Ces tuilesextraites représentent des exemples d’objets du monde réel caractérisés par certainsattributs (ou propriétés). Nous nous limitons dans ce travail au cadre commun à unevérité où tout attribut de chaque objet n’a qu’une valeur correcte et de nombreusesvaleurs possibles. Nous considérons des ensembles finis fixes d’étiquettes d’attributA et de valeurs V , ainsi qu’un ensemble fini d’identificateurs d’objet I. Ensuite,nous avons formellement:
Definition 1. Un n-uplet t est un couple (i, v) où i est un identifiant d’objet donnédans I et v une correspondance v : A æ V.
L’algorithme d’expansion de jeu de n-uplets inspecte les documents en utilisantdes wrappers pour extraire une collection de n-uplets, c’est-à-dire ses déclarationssur les valeurs de certains attributs d’objets: voir Example 1. Dans ce paramètre,nous décrivons une source de données modélisée par un document donné ( où lavaleur a été extraite) et un wrapper (l’extracteur de la valeur). Au niveau desattributs, nous définissons en e�et une source de données comme suit:
Definition 2. Une source est une fonction partielle S : I ◊ A æ V a avec undomaine non vide. Une vérité de terrain (candidate) est une fonction totale G :I ◊ A æ V.
120 APPENDIX B. RÉSUMÉ EN FRANÇAIS
Étant donné une source de données, un n-uplet particulier t est représenté parl’ensemble des couples d’identificateur d’objet et de valeur d’attribut qui partagentle même identificateur d’objet. C’est-à-dire que, étant donné une source S et deuxattributs distincts a, un a
Õœ A, nous déclarons que S(i1, a) et S(i2, a
Õ) font référenceà des déclarations concernant les attributs a et a
Õ du même n-uplet i1 = i2 où i1 eti2 sont des identificateurs d’objet dans I.
Example 1. En réexaminant les n-uplets dans l’exemple 1 de la section 2.3, on peutobserver qu’il s’agit d’objet du monde réel «Pays» avec leurs propriétés (attributs)«Capitale» et «Monnaie»: nous avons trois n-uplets candidats <Algérie, Alger, Di-nar Algerian>, <Algérie, Alger, Leka Algérienne> et <Algérie, Alger, Dinar Al-gérienne> à partir de trois sources de données di�érentes Source_1, Source_2 etSource_3. Notez que dans l’exemple 1, pour des raisons de simplicité, l’identificateurd’objet, c’est-à-dire «Algérie», a été omis, tandis que les valeurs d’attribut fourniessont «Alger», «Dinar algérien» et «Leka algérienne», respectivement.
L’objectif principal du problème de recherche de la vérité est de déterminer lavérité sur le terrain à partir des déclarations d’un certain nombre de sources. Lessources sont spécifiquement définies comme éventuellement incomplètes; en partic-ulier, ils peuvent ne pas couvrir tous les attributs:
Definition 3. La couverture d’attribut d’une source S par rapport à X ™ A est laproportion d’attributs a œ A pour lesquels il existe au moins un objet o œ O tel queS(o, a) est défini: Cov(S, X) := |{ aœX|÷oœO S(o,a) defined}|
|X|.
Deux sources S et SÕ ’se contredisent, c’est-à-dire en désaccord, chaque fois
qu’il existe i œ I, a œ A tel que S(i, a) et SÕ(i, a) soient tous deux définis et
S(i, a) ”= SÕ(i, a). Une source est correcte par rapport à la vérité sur le sol G sur
i œ I, a œ A lorsque S(i, a) = G(i, a) et fausse lorsque S(i, a) est défini, maisS(i, a) ”= G(i, a). Un processus de recherche de la vérité, tel que ceux examinés à lasection 2.3, est formellement défini comme suit:
Definition 4. Un algorithme de recherche de vérité F est un algorithme qui prend enentrée un ensemble de sources S et renvoie une vérité au sol candidate F (S), ainsiqu’une précision estimée Accuracy
F(S) pour chaque source S œ S et un score de
confiance ConfidenceF
(S(i, a)) pour chaque déclaration S(i, a) faite par une sourceS sur tout attribut a de l’objet i.
Un grand nombre de processus de recherche de la vérité sont des algorithmesd’itération à virgule fixe qui calculent une vérité au sol candidate en fonction devaleurs de précision de la source (ou de fiabilité) et de scores de confiance. Siun algorithme de recherche de vérité F n’utilise pas spécifiquement les valeurs deprécision de la source (c’est le cas, par exemple, du vote à la majorité), on peutdéfinir respectivement la précision de la source et la confiance pour F simplement:
AccuracyF (S) :=|{ i œ I, a œ A | S(i, a) = F (S)(o, a)}|
|{ i œ I, a œ A | S(i, a) défini}|(B.1)

B.2. VÉRITÉ DANS LA SÉRIE D’EXPANSION DE N-UPLETS 121
Pour un identifiant d’objet fixe i œ I et un attribut a œ A, on a:
ConfidenceF (S(i, a)) :=
qSÕœS|SÕ(i,a)=S(i,a) AccuracyF (SÕ
)
|{ SÕ œ S | SÕ(i, a) = S(i, a)}|(B.2)
Example 2. En appliquant l’équation B.1 sur les n-uplets candidats de l’exemple1, nous obtenons les valeurs de précision de 1, 1/2 et 1 pour Source_1, Source_2et Source_3 respectivement. En e�et les valeurs vraies sont choisies en votant ainsiles valeurs pour les attributs “Capitale” et “Monnaie” seront “Alger” et “Dinaralgérien”. Selon l’équation B.2, les scores de confiance des a�rmations «Alger»,«Algérienne» et «Leka Algérienne» seront fixés à 5/6, 1 et 1/2. De toute évi-dence, «Dinar algérien» provient de sources de premier plan, c’est-à-dire Source_1et Source_3, est donc choisi à la place de «Dinar algérien».
C’est ainsi que l’approche la plus simple de recherche de la vérité, c’est-à-direle vote, détermine les vraies valeurs de certains faits. Dans notre contexte, lesfaits sont des valeurs d’attributs de certains objets du monde réel. Par conséquent,nous exploitons l’algorithme de recherche de la vérité dans le processus d’extensiondes n-uplets pour trouver les valeurs vraies de ces attributs et choisir les candidatsappropriés. Nous présentons o�ciellement la suite d’un tel processus.
B.2.2 Approche proposéeComme indiqué en détail à la section 3.2.3, nous construisons le graphique d’entitéset appliquons Pagerank au graphique avant de classer les candidats en fonctiondu poids attribué par PageRank. Dans ce travail, nous proposons d’incorporerl’algorithme de recherche de la vérité dans le processus d’expansion afin de déter-miner les vrais candidats parmi les candidats extraits et de présenter une liste classéedes candidats comme résultat final. Pour pouvoir atteindre cet objectif, nous devonsassocier le graphique des entités au paramètre de recherche de la vérité.
Algorithme 18 : Générer_des_faitsEntrées : Un graphique d’entités G = {V, E}
Sorties : Un ensemble de faits n-uplets B
1 B = ÿ;2 C = {récupérer tous les noeuds de G où le type de noeud == «candidats»};3 pour chaque c œ C faire4 p =Trouver_le_parent_source_de(c);5 k = c[1];6 pour i Ω 2 à n faire7 b =< k, Attri≠1, c[i], p >;8 B = B fi {b};9 fin
10 fin11 return B;

122 APPENDIX B. RÉSUMÉ EN FRANÇAIS
À partir de la définition B.2.1, un algorithme de recherche de vérité prend enentrée un ensemble d’instructions faites par des sources sur tout attribut d’un objet.Nous considérons ici les déclarations en tant que candidats du n-uplet et les sourcesen tant que pages Web où nous dérivons le wrapper utilisé pour extraire les candidatscorrespondants. L’objectif général d’intégrer l’algorithme de recherche de la véritédans notre approche est d’améliorer les candidats présentés comme résultat final.Cependant, dans le problème de l’extension des n-uplets, le concept d’objet et sesattributs ne sont pas explicitement modélisés. Cependant, les éléments dans lessemences et dans les n-uplets extraits entretiennent des relations. Compte tenudu n-uplet <Angola, Luanda, Kwanza>, on peut facilement a�rmer que Luandaet Kwanza sont les attributs de l’Angola. Pour être cohérent avec le paramètrede recherche de la vérité, nous décomposons ensuite techniquement l’objet et sesattributs dans les n-uplets extraits par notre système. Un objet est représenté par lepremier élément du n-uplet, désigné par la clé d’objet, tandis que les autres élémentsrestants servent d’attributs. Nous utilisons en outre cet élément clé pour décomposerun n-uplet en n-uplets binaires attribut-clé. Le n-uplet précédent est décomposé en<Angola, Luanda> et <Angola, Kwanza>. En général, si un n-uplet est composéde n éléments, alors, après décomposition, nous obtenons n-1 n-uplets d’attributsclés.
Pour expérimenter des algorithmes de recherche de vérité à la pointe de latechnologie présentés dans la section 2.3, nous nous appuyons sur la plateformeDAFNA 1. DAFNA fournit AllegatorTrack [126], une application Web configurantune implémentation de la plupart des algorithmes de recherche de vérité à la pointede la technologie dans le même contexte. AllegatorTrack accepte en entrée un ensem-ble d’entrées dont les éléments principaux sont une clé d’objet, un attribut d’objet,une valeur d’attribut et une source de données. Ainsi, dans chacun des n-upletsd’attributs-clés, nous devons également inclure l’attribut de l’objet et la source. Lasource est la page Web à partir de laquelle l’encapsuleur utilisé pour extraire le can-didat est dérivé. Comme l’attribut de l’objet n’est pas connu a priori, nous donnonssimplement «Attr» suivi d’un index comme libellé.
Nous utilisons l’algorithme 18 pour générer les faits à partir du graphe d’entités.Nous récupérons d’abord tous les nœuds candidats du graphe (ligne 2). Ensuite,pour chaque nœud c, nous trouvons la page Web p à partir de laquelle le candidatest extrait (ligne 4). Pour ce faire, nous suivons le périmètre du nœud candidatau wrapper, puis à la page Web. La clé d’objet k est le premier élément du n-uplet candidat de n éléments, c[1], tandis que les autres éléments (c[2], ..., c[n]) sontles valeurs d’attribut. Ainsi, pour chacune des valeurs d’attribut, nous formons len-uplet sous la forme <k, Attrn≠1, c[i], p> et l’ajoutons au résultat (ligne 6-9).
Table B.2: Extrait du jeu de données en entrée dans AllegatorTrackObjet Attribut Valeur La source
Angola Attr_1 Luanda http://1min.in/content/international/currency-codes_1
Angola Attr_2 Kwanza http://1min.in/content/international/currency-codes_1
Angola Attr_2 Kuanza http://1min.in/content/international/currency-codes_2
1http://da.qcri.org/dafna/#/dafna/home_sections/home.html

B.3. RECONSTRUCTION DE N-UPLETS 123
STEP génère des wrappers pour une page Web en combinant les contextesgauche, droit et moyen (voir section 3.2.2)). Cela donne la possibilité d’extraireles n-uplets identiques ou distincts d’une même page Web au moyen de wrappersdi�érents. Il est à noter qu’une source donnée ne peut pas fournir plus d’une déclara-tion pour le même attribut d’objet dans notre paramètre de recherche de la v’erit’e.En conséquence, nous nous référons à la source d’un n-uplet candidat donné enindexant le nom de la page Web inspectée avec le numéro du wrapper utilisé. Letableau B.2 montre un extrait d’un jeu de données en entrée dans AllegatorTrackdans lequel chaque ligne est composée respectivement de la clé d’objet, suivie del’attribut de l’objet, puis de la valeur de l’attribut et enfin de la source.
B.2.3 Évaluation des performancesNous avons e�ectué notre évaluation de manière intensive sur sept sujets constituésd’un ensemble de n-uplets extraits par notre système STEP pour des domaines dis-tincts; Nous avons détaillé dans la section 3.2 comment notre système retourne unensemble de n-uplets dans un domaine donné, à partir de certaines graines. La fig-ure B.1 compare la F-mesure moyenne des algorithmes de recherche de la vérité et dePageRank en fonction des scores F-mesure de chaque approche sur nos sept sujets.De toute évidence, les algorithmes de recherche de la vérité surpassent PageRankavec une amélioration allant de 10% à 26% en termes de précision et de rappel.Accu (AC) est le meilleur modèle de recherche de la vérité pour classer w.r.t. scoresde F-mesure calculés. La seule exception est T4 où Accu reçoit le score minimalpour les trois métriques. Nous étudions davantage ce cas particulier en appliquantd’abord le vote à la majorité sur les candidats extraits, puis en calculant la pré-cision, le rappel et la F-mesure du résultat. Nous observons que le score est trèsfaible, ce qui indique que les candidats extraits de la plupart des sources ne sont pascorrects, ce qui engendre un processus de recherche de la vérité biaisé. Les candi-dats extraits contiennent également beaucoup de bruits, par exemple, deux sourcesextraites «Dollar de Singapour» et «Dollar» en tant que valeur d’un des attributs.Alors qu’une personne considérerait que ces deux valeurs font référence au mêmenom de devise pour le pays Singapour, il serait di�cile pour un système d’inférercela sans aucune interaction humaine. Néanmoins, Accu améliore la précision, lerappel et la F-mesure de notre approche de 0,54%, 0,29% et 0,51% respectivement.Sur cette base, nous concluons que l’utilisation d’un algorithme de recherche de lavérité peut e�ectivement améliorer les performances de notre approche.
B.3 Reconstruction de n-upletsUn ensemble de systèmes d’extension de n-uplets, tel que STEP [35], extrait desinformations du World Wide Web sous la forme de n-uplets. Particulièrement,étant donné un ensemble d’exemples de n-uplets <Indonésie, Jakarta, Roupie in-donésienne>, <Singapour, Singapour, Singapour, Dolor>, STEP renvoie une listecomprenant le nom d’un pays, sa capitale, ainsi que le nom de la devise. STEP

124 APPENDIX B. RÉSUMÉ EN FRANÇAIS
Ensemble de données
0.25
0.3
0.35
0.4
0.45
0.5
F-m
esur
em
oyen
ne
CO 2E
3E DP
AC AS
AN TF
SL GL
CM PR
Figure B.1: Scores moyens de la F-mesure
applique un mécanisme de classement des votes basé sur la valeur Pagerank desn-uplets candidats.
PageRank [77] est principalement utilisé par Google pour mesurer l’importanceou l’importance des pages Web. Il s’agit d’une requête donnée par l’utilisateur.Chaque lien d’autres pages Web vers une page Web cible est traité comme un votepour la page Web cible. Les pages Web sont ensuite classées en fonction du nombrede votes correspondant. Dans le cas particulier de STEP [35], un graphe est construiten définissant un ensemble d’entités (pages Web, wrappers, semences, domaines etn-uplet candidats) en tant que nœuds et les relations entre entités en tant que liens. Un n-uplet candidat est uniquement lié à des nœuds wrapper. Cela signifie quele rang d’un n-uplet candidat dans la liste finale dépend uniquement du nombre dewrappers utilisés pour extraire ce candidat particulier.
Les wrappers dans STEP sont des wrappers basés sur des expressions régulières.Ils sont générés en comparant les contextes d’une paire d’occurrences de grainesdans une page Web. Cette méthode peut produire davantage de candidats-n-uplets,mais d’un autre côté, elle est très susceptible d’en extraire de faux, c’est-à-dire descandidats dont les éléments ne font pas partie de la même classe sémantique queles semences. Ces faux candidats peuvent recevoir autant de votes que les vraiscandidats en raison de la nature du graphique d’entités. Ils peuvent avoir plus devotes s’ils sont extraits par de nombreux wrappers de la même page ou par d’autreswrappers d’autres pages Web. La situation inverse où les vrais candidats ont plusde votes que les faux peut également se produire. Néanmoins, il est de la plus hauteimportance d’extraire de vrais candidats plutôt que de faux. Telle est la motivationde cette recherche pour laquelle nous proposons une solution visant à garantir queles vrais candidats auront toujours plus de voix que les faux et se classeront plushaut sur la liste. Notre solution proposée incorpore une phase de reconstructionde n-uplets en combinant des n-uplets binaires. Nous expliquons brièvement notreméthode proposée ensuite.
Les n-uplets tels que ceux donnés à titre d’exemple plus haut sont constitués den éléments, c’est-à-dire le n-uplet n-éléments. Chaque élément est une valeur pourun attribut d’une entité du monde réel (objet). Nous utilisons le terme élémentet attribut de manière interchangeable tout au long de ce chapitre. Parmi ces néléments, l’un d’entre eux peut être considéré comme l’attribut clé, tandis que tous

B.3. RECONSTRUCTION DE N-UPLETS 125
les éléments restants sont les valeurs des propriétés de l’attribut clé. Considéronsle n-uplet <Indonésie, Jakarta, Rupiah Indonésienne> où n = 3, on peut certaine-ment identifier que l’attribut clé dans le n-uplet est le pays «Indonésie», tandis que«Jakarta» et «Rupiah Indonésienne» sont les valeurs pour les attributs «capitale»et «monnaie» de l’Indonésie, respectivement. En remarquant cette notion d’attributde clé, le n-uplet précédent peut être décomposé en deux n-uplets à 2 éléments (n-uplets binaires). Nous y parvenons en associant les valeurs d’attribut à l’attributclé: <Indonesia, Jakarta> et <Indonesia, Roupie indonésienne>. Supposons quenous ayons la connaissance des deux n-uplets binaires a priori (en interrogeant uneontologie ou en extrayant des n-uplets binaires avec la même relation), les ajoutonsau graphe d’entités en tant que nouveaux nœuds et créons des liens vers le n-upletcandidat < Indonésie, Jakarta, roupie indonésienne>, le n-uplet candidat devraitprendre plus de poids après l’application de l’algorithme PageRank. Par la suite, len-uplet candidat devrait également se classer plus haut dans la liste finale présentéeà l’utilisateur.
Sur la base de cette intuition, nous proposons le problème de la reconstructiondes n-uplets. à partir des n-uplets binaires, nous reconstruisons des n-uplets de n-éléments (n> 2). Les n-uplets reconstruits peuvent ensuite être ajoutés au graphed’entités dans le but d’enrichir le graphe. Nous montrons que l’ajout de ces n-upletsreconstruits peut améliorer la confiance dans les n-uplets candidats extraits.
B.3.1 Définition du problèmeNous considérons des ensembles finis fixes d’étiquettes d’attribut A et de valeurs V .Soit n le nombre d’attributs (éléments). Nous avons formellement défini ce qui suit.
Definition 5. Un n-uplet t consiste en un ensemble de {v} où v est un mappagev : A æ V.
Pour former un n-uplet, nous devons d’abord sélectionner un ensemble d’attributspour une entité du monde réel. Par exemple, nous sélectionnons l’entité comme étantun pays et pour cette entité, nous choisissons n = 3 attributs, qui incluent la capitale,le code de la devise et le nom de la devise. Chacun de ces attributs peut prendreexactement une valeur du domaine V . Supposons que nous prenions «Indonésie»,«Jakarta», «IDR» et «Roupie indonésienne» comme valeurs des attributs, puis quenous formions le n-uplet <Indonésie, Jakarta, IDR, Roupie indonésienne>. Nousdéfinissons ensuite l’attribut clé d’un n-uplet. Soit i, l’indice de chaque élément d’unn-uplet, respectivement.
Definition 6. L’attribut clef est l’identifiant d’un n-uplet et est composé des n-1premiers éléments du n-élément où n Ø2.
L’attribut clef agit comme l’identifiant du n-uplet. Par exemple, dans le n-uplet<Indonesia, Jakarta>, l’attribut clé est «Indonesia» où il représente le nom d’unpays.
En suivant les définitions ci-dessus, nous pouvons définir le problème de la re-construction des n-uplets. Le problème de la reconstruction des n-uplets concerne la

126 APPENDIX B. RÉSUMÉ EN FRANÇAIS
tâche de construire des n-uplets à n éléments à partir de binaires. Nous proposonsici deux méthodes de reconstruction des n-uplets, à savoir stricte et lâche. Commenous l’avons décrit brièvement plus tôt, un n-uplet à n éléments peut être construità partir d’une paire d’éléments (n-1)-éléments pour n Ø 2. Ces deux (n-1)-élémentsn-uplets doivent avoir les mêmes éléments ordonnés de l’indice i = 1 à n-2.
Definition 7. Une paire de n-uplets à n éléments peut être fusionnée pour construireun n-uplet d’éléments (n+1) s’ils ont tous deux le même attribut de clé n-1 avec n Ø2(strict).
Considérons la figure 5.1 où, au premier niveau du graphique, nous avons troisn-uplets binaires <Indonésie, Jakarta>, <Indonésie, IDR> et <Indonésie, roupie in-donésienne>. En appliquant la définition 7 sur les n-uplets binaires, nous généronsles nœuds du deuxième niveau, à savoir <Indonésie, Jakarta, IDR>, <Indonésie,Jakarta, Roupie indonésienne> et <Indonésie, IDR, Roupie indonésienne>. Deuxdes trois n-uplets du deuxième niveau ont le même attribut de clé selon la défini-tion 6. Ainsi, en appliquant à nouveau la définition 7 au deuxième niveau, nousobtenons au troisième niveau le n-uplet <Indonésie, Jakarta, IDR, roupie indonési-enne> en combinant les nœuds le plus à gauche et le milieu.
Definition 8. Deux n-uplets de n-éléments (n Ø 2) peuvent être fusionnés pourformer (n+1)-éléments des n-uplets s’ils ont les mêmes valeurs pour les n-2 premierséléments et di�èrent par une valeur des éléments restants (en vrac).
La méthode stricte de génération de n-uplets peut entraîner la possibilité d’ignorercertains candidats potentiels. Nous ne pouvons pas générer le n-uplet précédent encombinant le nœud le plus à gauche ou le nœud du milieu avec le nœud le plus àdroite au deuxiéme niveau de l’arborescence, car il enfreint les définitions 6 et 7. Sinous examinons de plus près les trois nœuds, nous pouvons voir qu’ils partagent lemême attribut de clé n-2 et ne di�èrent que par l’une des valeurs d’attribut dansles n-1 attributs restants. Ainsi, nous définissons une autre méthode de générationdes n-uplets, comme dans la définition 8. En utilisant la définition 8, nous sommesen mesure de générer le n-uplet au troisième niveau en combinant le nœud le plus àdroite du deuxième niveau avec l’un des deux autres nœuds. Nous nous référons auxn-uplets générés à partir de la définition 7 et de la définition 8 en tant que n-upletsreconstruits.
B.3.2 Approche proposéeNous expliquons ensuite comment nous intégrons directement le processus de recon-struction des n-uplets pour construire le graphe des entités de STEP. STEP prenden entrée un ensemble de graines de n-uplet, chacune d’elles étant composée den-éléments. La méthode stricte de reconstruction des n-uplets nécessite que n Ø
2 alors que, d’après la définition de la méthode souple, l’exigence est au moinsn=3. Reprenons l’ensemble des graines de n-uplet de notre exemple en cours: <In-donesia, Jakarta, Rupiah indonésienne, IDR >, <Singapour, Singapour, dollar deSingapour, SGD> et <Malaisie, Kuala Lumpur, Ringgit malaisien, MYR> où n=4.

B.3. RECONSTRUCTION DE N-UPLETS 127
Algorithme 19 : Graphique_avec_n-uplets_reconstruitsEntrées : Un graphique d’entités G = (V, E), un ensemble de n éléments de
n-uplet R = {T1, T2, ..., TNs}
Sorties : Un graphique d’entités avec des n-uplets reconstruits GÕ = (V Õ
, EÕ)
1 GÕ, B = Récupérer_des_n-uplets_binaires(G);
2 BÕ ={Reconstruire_n-uplet(B, n)};
3 VÕ = V
Õfi B
Õ\B;4 pour i Ω 3 à n faire5 Bnew = {sélectionnez des n-uplets de longueur i dans B
Õ };6 pour chaque t œ Bnew faire7 Anc = {Trouver des ancêtres de t};8 pour chaque a œ Anc faire9 E
Õ = EÕfi {< a, CONSTRUCT, t >};
10 fin11 Des = {Trouver des descendants de t};12 pour chaque a œ Des faire13 E
Õ = EÕfi {< a, INV _CONSTRUCT, t >};
14 fin15 fin16 fin17 return G
Õ;
Notre objectif est de reconstruire des n-uplets en extrayant d’abord des n-upletsbinaires des graines données et en combinant récursivement les n-uplets binaires.générer n éléments n-uplets. Nous modifions l’algorithme 7 de la section 3 pour in-corporer la reconstruction des n-uplets dans le processus de construction du graphed’entités, comme indiqué dans l’algorithme 11 de la section 5 et l’algorithme 19.Dans l’algorithme 11 de la section 5, nous trouvons des n-uplets binaires à partir del’ensemble donné de germes. Nous décomposons chaque grappe de graines en groupesde graines binaires construites en appariant en alternance l’élément clé et l’un deséléments restants (ligne 4-6). Ensuite, nous récupérons un ensemble de pages Webcontenant les semences binaires. Pour chaque page Web, nous générons des wrapperset extrayons les n-uplets binaires. Nous ajoutons les entités au graphique et créonsles arêtes entre elles, comme indiqué dans le tableau 3.2 (lignes 8-27). Le résultatde l’algorithme est un graphe avec l’ajout de n-uplets binaires ainsi que les relationsentre les nœuds en tant qu’arêtes et l’ensemble de n-uplets binaires. Nous recon-struisons ensuite les n-uplets à partir de l’ensemble de n-uplets binaires en utilisantl’algorithme 19. Nous ajoutons tous les n-uplets reconstruits en tant que nouveauxnoeuds sur le graphe, mais en laissant de côté les binaires tels qu’ils ont été ajoutésau graphe plus tôt (ligne 3). Nous commenons à ajouter les n-uplets reconstruits augraphe à partir de n-uplets de longueur 3 à n (ligne 3-4). Pour chaque n-uplet del’ensemble sélectionné des n-uplets reconstruits, nous trouvons ses ancêtres et ses de-scendants. Les ancêtres, dans ce cas, sont l’ensemble des n-uplets (n-1)-éléments quipeuvent être utilisés pour construire le n-uplet de n éléments correspondant. Sup-

128 APPENDIX B. RÉSUMÉ EN FRANÇAIS
Table B.3: Comparaison de la précision, du rappel et de la F-mesure de STEP avecet sans reconstruction du n-upletSujet Nombre de candidats Précision Rappel F-mesure
sans TR avec TR sans TR avec TR sans TR avec TR sans TR avec TRDT1 193 (187) 304 (207) 0.968 0.68 0.766 0.848 0.855 0.754DT2 53 (44) 53 (44) 0.83 0.83 0.423 0.423 0.526 0.526DT3 451 (326) 1235 (968) 0.035 0.104 0.722 0.783 0.066 0.183
posons que <Royaume-Uni, Londres, Poundsterling> soit un n-uplet reconstruit,les ancêtres de ce n-uplet sont <Royaume-Uni, Londres>, <Royaume-Uni, Pound-sterling>. Nous pouvons également ajouter <London, Poundsterling> à l’ensembledes ancêtres si nous générons le n-uplet correspondant à l’aide de la définition 8.Pour chacun des ancêtres, nous créons un bord pour le n-uplet correspondant etnous le désignons comme CONSTRUCT (ligne 8-10). D’autre part, les descendantssont l’ensemble des n+1 n-uplets reconstruits générés à partir du n-uplet corre-spondant. Pour le n-uplet reconstruit <Royaume-Uni, Londres, Poundsterling>,un exemple de son descendant est <Royaume-Uni, Londres, Poundsterling, GBP>.Nous créons ensuite un bord de chacun des descendants au n-uplet correspondantet a�ectez INV_CONSTRUCT comme étiquette (ligne 12-14).
B.3.3 Évaluation des performancesLe tableau B.3 montre que l’intégration de la reconstruction des n-uplets dans lesystème d’extension des n-uplets améliore le nombre de candidats extraits et lerappel du système, en particulier dans les thèmes DT1 et DT3. Dans la rubriqueDT2, les performances de STEP avec et sans la reconstruction du n-uplet sont lesmêmes. Nous étudions plus avant l’impact de la reconstruction du n-uplet pourchaque sujet et détaillons ensuite le résultat.
Nous commenons par le sujet DT2 car il s’agit d’un cas intéressant où l’utilisationde la reconstruction des n-uplets n’améliore pas les performances de STEP en termesde candidats extraits ainsi que des trois métriques que nous utilisons. Lorsque nousdonnons l’ensemble des graines <Alfa Romeo, Italie, Fiat SpA, alfaromeo.com>,<Chevrolet, états-Unis, Maîtres, chevrolet.com> en tant qu’entrée dans STEP,nous remarquons que le moteur de recherche renvoie uniquement plusieurs infor-mations Web pages. http://www.autosaur.com/car-brands-complete-list/ estune des URL renvoyées à partir de laquelle STEP parvient à extraire 53 candidats.Sur ces candidats, 9 sont rejetés avec référence à la vérité du sol pour diversesraisons, telles que le bruit des candidats (balises HTML), une di�érence mineuredans l’écriture («& amp» au lieu de «&») ou aucune référence dans le sol. la vérité(«les voitures de sport adicales» ne sont pas contenues dans notre vérité au sol).Lors de la deuxième exécution de STEP (avec reconstruction des n-uplets), le nom-bre de candidats extraits est exactement le même. Cela signifie que la reconstructionde n-uplet ne parvient pas à ajouter même un seul candidat. Nous examinons leprocessus pour déterminer la raison de cet échec. Nous décomposons chacune desgraines du n-uplet en trois groupes de graines binaires, à savoir le premier groupe:

B.3. RECONSTRUCTION DE N-UPLETS 129
<Alfa Romeo, Italie>, <Chevrolet, USA>, le deuxième groupe: <Alfa Romeo, FiatSpA>, <Chevrolet, General Motors> et < Alfa Romeo, alfaromeo.com>, <Chevro-let, chevrolet.com>. à partir du premier groupe de graines binaires, nous essayonsde trouver des relations contenant le nom d’une marque automobile et son paysd’origine. Nous avons réussi à extraire 84 candidats. En utilisant le deuxièmegroupe de semences binaires, à partir de l’ensemble des URL renvoyées par le mo-teur de recherche, nous ne parvenons qu’à extraire 22 candidats. Si nous combinonsles deux groupes de candidats, nous prévoyons avoir 22 n-uplets reconstruits delongueur n = 3 avec les relations des marques de voitures automobiles, du paysd’origine et de la société mère. Cependant, lorsque nous utilisons le dernier groupede semences binaires, nous ne parvenons pas à extraire les candidats de l’ensembledes URL. Cela nous empêche de reconstituer un n-uplet de longueur n = 3 avec lesite o�ciel de la marque automobile comme l’un de ses éléments. De plus, cet échecnous empêche également de construire des n-uplets de longueur n = 4. Nous trou-vons cela comme la raison pour laquelle la reconstruction du n-uplet ne contribue àaucun candidat dans le groupe final de candidats.
La reconstruction des n-uplets montre son potentiel d’amélioration du nombre decandidats sur les sujets DT1 et DT3. Dans le premier cas, STEP sans reconstructionde n-uplet extrait 193 candidats. Ce nombre est amélioré de 57% à 304 candidatspar reconstruction de n-uplets. Parmi les trois groupes de semences binaires, à savoir<Indonésie, Jakarta>, <Singapour, Singapour>, <France, Paris>; <Indonésie, Ru-piah Indonésienne>, <Singapour, Dollar de Singapour>, <France, Euro>; <In-donésie, IDR>, <Singapour, SGD>, <France, EUR>; nous parvenons à extraire re-spectivement 297, 276 et 164 candidats. à partir de ces trois groupes de candidats bi-naires, nous sommes alors en mesure de reconstruire 111 n-uplets de longueur n = 4,dont 20 sont acceptés par la vérité du sol. Les 20 nouveaux candidats contribuent àaméliorer le rappel de STEP de 0,766 à 0,848. Cependant, les 91 n-uplets reconstru-its contribuent à la diminution de la précision de 0,968 à 0,68. L’amélioration la plussignificative de la reconstruction des n-uplets est présentée dans la rubrique DT3.STEP ne recueille que 451 candidats sans reconstitution de masse. Ce nombre estplus que triplé, passant à 1235 candidats lorsque nous intégrons la reconstructiondes n-uplets dans le processus d’expansion. Les n-uplets reconstruits contribuentégalement à l’amélioration du rappel de 0,722 à 0,783. Cependant, les scores deprécision des deux exécutions de STEP (avec et sans reconstruction de n-uplet)sont vraiment faibles. Dans la rubrique DT3, nous essayons d’extraire les rela-tions de tous les codes d’aéroports avec leurs noms, localisations et pays respectifsavec http://www.nationsonline.org/oneworld/IATA_Codes comme site Web deréférence. Le site Web de référence lui-même comprend 9220 entrées. Ce nom-bre total d’entrées dans la vérité au sol est d’une magnitude supérieure à celle descandidats obtenus de 451 et 1235 pour STEP sans et avec reconstruction du n-uplet, respectivement. Nous étudions plus en détail les candidats extraits par STEPsans reconstruction du n-uplet et nous constatons qu’ils ne sont constitués que desgrands aéroports du monde. La reconstruction de n-uplet aide ensuite à ajouter 784nouveaux candidats. Nous constatons que ces nouveaux candidats sont en réalitétous les aéroports des états-Unis. En e�et, lorsque nous vérifions les URL ren-

130 APPENDIX B. RÉSUMÉ EN FRANÇAIS
voyées par le moteur de recherche à l’aide des graines binaires décomposées <CGK,aéroport international Soekarno-Hatta>, <CDG, aéroport international Charles DeGaulle>, <JFK, John F. Kennedy International Aéroport>; <CGK, Jakarta>,<CDG, Paris>, <JFK, New York>; <CGK, Indonésie>, <CDG, France>, <JFK,USA>; nous parvenons à extraire les relations binaires des codes d’aéroport et leursnoms, les codes d’aéroport et les emplacements correspondants de la ville et du paysà partir de la même URL http://www.airportcodes.us/airports-by-name.htm.Nous sommes certains que si les URL renvoyées par le moteur de recherche pointentvers des pages Web pertinentes, c’est-à-dire des pages Web contenant les relationsbinaires ciblées, la reconstruction du n-uplet ajoutera encore plus de nouveaux can-didats. Néanmoins, d’après les résultats de l’évaluation des performances, nousconcluons que la reconstruction des n-uplets a le potentiel de trouver des n-upletscandidats qui ne sont pas extraits par l’ensemble du système d’expansion des n-uplets.
B.4 Étiquetage de sujet avec recherche de véritéDans la deuxième partie de la thèse, nous étudions la possibilité d’étendre séman-tiquement les graines de n-uplet, c’est-à-dire en recherchant d’autres éléments corre-spondants des di�érents groupes d’éléments dans les graines. Considérez les grainesde n-uplet suivantes: <Indonésie, Jakarta, Rupiah Indonésienne>, <Singapour, Sin-gapour, Dollar de Singapour>, <France, Paris, Euro>. En examinant les premier,deuxième et troisième éléments de chaque graine, on peut supposer que ces groupesappartiennent respectivement à la classe sémantique «pays», «capitale» et «nomde la devise». Cependant, ces étiquettes de classe ne sont pas définies a priori,mais peuvent être déduites à partir des exemples d’éléments fournis. Une fois quel’étiquette correcte de chaque groupe d’éléments est identifiée, nous pouvons ensuitedévelopper l’ensemble d’exemples en utilisant les autres membres de la classe. Parexemple, «Malaisie», «Royaume-Uni», «Allemagne» appartiennent tous à la classesémantique «pays» et peuvent donc être utilisés pour développer le premier grouped’éléments. Ce type de tâche consistant à rechercher automatiquement l’étiquettepour un ensemble d’exemples est étroitement lié à l’étiquetage de rubrique.
Une approche de modélisation de sujet telle que Latent Dirichlet Allocation [1](LDA) apprend des groupes de mots décrivant le mieux les sujets latents sous-jacentsà une collection de documents. Après avoir appris les mots décrivant chaque sujet,il faut ensuite trouver l’étiquette qui convient pour ce sujet. Bien que réalisable,l’étiquetage manuel exige un travail di�cile et peut prendre beaucoup de tempsdans certains scénarios. Cela motive la tâche de l’étiquetage de sujet. L’étiquetagede rubrique traite de la recherche automatique d’étiquettes pour les modèles derubrique. Généralement, la tâche est principalement axée sur deux sous-tâches: lagénération d’étiquettes candidates et le classement. La première consiste à récupérerou à générer un ensemble d’étiquettes candidates, tandis que la dernière applique unmécanisme de classement sur les étiquettes candidates pour sélectionner l’étiquette laplus pertinente pour le sujet. De nombreuses méthodes ont été proposées pour abor-

B.4. ÉTIQUETAGE DE SUJET AVEC RECHERCHE DE VÉRITÉ 131
der la tâche, y compris celles qui exploitent les bases de connaissances[111, 128, 105]et utilisent des algorithmes d’exploration de données ou d’apprentissage automa-tique [107, 110, 115]. Dans [105], les auteurs génèrent un ensemble d’étiquettescandidates principales et secondaires à partir de Wikipedia, tandis que le processusde classement est e�ectué sur les caractéristiques des étiquettes candidates à l’aided’un modèle de régression à vecteur de support. Bhatia et al. [107] utilise égale-ment Wikipedia comme source pour les libellés candidats, mais ceux-ci utilisent desdocuments et des mots incorporés pour représenter les libellés dans le processus declassement.
Dans cette recherche, nous proposons de tirer parti de l’étiquetage par sujet pourétiqueter automatiquement l’ensemble des éléments dans les graines de n-uplet don-nées. Nous traitons la classe sémantique comme le sujet tandis que les éléments de laclasse sont l’ensemble de mots décrivant le sujet correspondant. Nous transformonsle problème de la proposition de l’étiquette d’un sujet en domaine de recherche dela vérité (découverte de la vérité) où nous trouvons l’étiquette de chacun des N
premiers mots du sujet. L’étiquette d’un sujet est ensuite sélectionnée parmi lesétiquettes des N premiers mots correspondants.
B.4.1 Approche proposéeNous proposons d’étiqueter automatiquement les sujets générés via des modèles desujets en analysant un graphe hétérogène reliant les di�érents objets et concepts car-actérisant le problème: sujets, mots, articles Wikipedia, informations sémantiquesauxiliaires et étiquettes candidates. Le graphique est traité à l’aide d’algorithmes dedécouverte de vérité afin de produire une liste classée d’étiquettes candidates pourchaque sujet. Nous décrivons d’abord la manière dont nous générons les étiquettesde candidats, puis détaillons le processus de classement.
Générer des étiquettes de candidat Notre méthode de génération d’étiquettescandidates s’inspire de Lau et al. [105]. Nous exploitons une base de connaissances.Dans notre cas, il s’agit de Wikipedia2, en tant que source des libellés candidats.Chaque article de Wikipedia est associé à une liste de catégories. Les catégories sontplacées au bas de la page vers la fin de chaque article. Nous utilisons ces catégoriescomme étiquettes de candidats. Nous appliquons les deux méthodes suivantes pourextraire les étiquettes candidates pour le modèle de sujet. Pour détailler chaqueméthode, considérons les mots suivants (charles, prince, roi, diana, royale, reine,famille, parker, britannique, bowles) qui sont triés par ordre décroissant en fonctiondu poids attribué par LDA. Tout d’abord, nous utilisons chaque mot pour interrogerWikipedia et obtenir le top 10 des articles. De chacun des articles, nous extrayonsles catégories en tant qu’étiquettes candidates. Ensuite, nous construisons des n-grammes à partir de l’ensemble de mots et répétons le processus.
Classement des étiquettes Après avoir généré un ensemble d’étiquettes candi-dates, l’étape suivante consiste à classer les étiquettes et à sélectionner l’étiquettela plus pertinente pour chaque sujet. Pour réaliser cette tâche, nous construisons
2http://en.wikipedia.org

132 APPENDIX B. RÉSUMÉ EN FRANÇAIS
d’abord un graphique d’entités avec des rubriques, des mots, des articles Wikipediaet des libellés candidats en tant que nœuds, tandis que les relations entre eux en sontles contours. Nous générons ensuite des faits à partir du graphe d’entités en tantqu’entrée dans l’algorithme de découverte de la vérité. Enfin, nous sélectionnonsl’étiquette de chaque sujet en fonction du résultat de l’algorithme de découverte devérité.
Le processus de construction du graphe d’entités commence par les K sujets quenous désignons dans le graphe par Topic-1, Topic-2, ..., Topic-K. Chacun des sujetsa un ensemble de mots, nous ajoutons donc tous les mots au graphique en tant quenœuds. Nous établissons un lien entre chaque sujet et son ensemble de mots entraçant des contours entre eux. Nous proposons deux méthodes pour récupérer lesétiquettes candidates, c’est-à-dire utiliser chaque mot ou n-grammes pour interrogerWikipedia. Dans cette dernière approche, nous générons d’abord les n-grammes àpartir de l’ensemble des mots Wi, ajoutons les n-grammes au graphique et relionschaque mot utilisé pour composer les n-grammes. Nous remplaçons ensuite Wi parl’ensemble des n-grammes. à partir de chaque élément (mot / bigramme) de Wi,nous récupérons un ensemble d’articles de Wikipedia. Ainsi, nous relions chaque mot/ bigramme et les articles Wikipedia résultants dans le graphique. Nous extrayonsensuite des catégories sur chaque article en tant qu’étiquettes candidates, nous lesajoutons au graphique et nous créons des liens entre les articles et les étiquettescandidates.
L’algorithme de découverte de la vérité prend en entrée un ensemble de faitsproposés par certaines sources concernant les valeurs de propriétés de certains ob-jets. L’objectif de l’algorithme de découverte de la vérité est de déterminer la valeurréelle des propriétés ainsi que le niveau de fiabilité de chaque source. Conformémentà cette définition, dans cette recherche, nous définissons les objets, les sources et lesfaits comme des mots décrivant les sujets, des documents (articles Wikipedia) et desétiquettes de candidats extraites des articles, respectivement. Nous générons l’entréedans les algorithmes de découverte de la vérité à partir du graphique d’entités con-struit dans notre processus de génération d’étiquettes candidates. Nous commençonspar récupérer un ensemble de nœuds W avec le type de «mot». Pour chaque motw dans W , nous récupérons ses nœuds enfants D où le type de nœuds est «docu-ment». Dans le graphe construit, un nœud de type «mot» peut être directementlié à un «document» ou via les n-grammes. Dans ce dernier cas, nous trouvonsd’abord les nœuds «n-grammes» dérivés du nœud «mot», puis nous collectons lesnœuds «document» dans les n-grammes. Les algorithmes de découverte de la vériténe reconnaissent pas les relations entre les objets et les sources (mots et documents),nous ne tenons donc pas compte des n-grammes lors de la génération des faits. Pourchacun des documents, nous récupérons les étiquettes et générons les faits sous formede n-uplets comprenant le mot, l’étiquette et le document.
B.4.2 Évaluation des performancesNous commençons l’expérience en explorant le processus de génération d’étiquettescandidates. Nous appliquons l’approche suivante aux trois jeux de données que nous

B.5. DÉFINIR L’ÉTIQUETAGE 133
utilisons dans l’évaluation de la performance, chaque jeu de données comprenantdix sujets. Les étiquettes de candidats sont générées en extrayant les catégories dechaque article renvoyé par Wikipedia. Nous appliquons les deux méthodes décritesprécédemment pour récupérer les articles de Wikipedia. Au début, nous utilisonschaque mot comme une requête distincte de Wikipedia. Ensuite, nous généronsdes n-grammes à partir de l’ensemble de mots. Après chaque recherche, nous con-struisons notre graphique d’entités. Pour chacun des graphiques générés à l’étapeprécédente, nous appliquons des algorithmes de découverte de la vérité, notammentle vote à la majorité, Cosinus, Truth Finder [81], 3-Estimates [92], Depen [89] etLTM [83]. Nous mesurons ensuite la précision de chaque algorithme. Nous calculonsensuite la précision moyenne pour chaque méthode de génération d’étiquettes candi-dates pour chaque sujet des jeux de données via di�érents algorithmes de découvertede vérité. Sur la base de l’examen des résultats de l’expérience, nous concluons qu’ilest préférable d’utiliser 2 grammes comme interrogation sur Wikipedia plutôt qued’interroger chaque mot.
Ensuite, nous étudions l’impact de l’utilisation de n-grammes di�érents pourn=2, 3, 4, 5 pour interroger Wikipedia. Notre intuition est que l’utilisation de plusde mots en tant que requête donnerait des articles plus spécifiques sur Wikipedia.En fin de compte, cela conduirait à des étiquettes plus spécifiques. Nous évaluonsl’impact de l’utilisation de di�érents n-grammes sur les algorithmes suivants: voteà la majorité (MV), cosinus (CO), TruthFinder (TF), 3-estimations (3E), Depen(DP) et LTM (LT). En général, former 2 grammes de l’ensemble des N premiersmots en tant que requête sur Wikipedia donne une meilleure précision que d’utilisern=3, 4 ou 5. Dans cette expérience, nous nous intéressons à l’analyse du meilleuralgorithme de découverte de la vérité pour notre tâche de étiquetage de sujet. Pourcentrer notre examen, nous menons les expériences en utilisant la meilleure méth-ode de génération d’étiquettes candidates. La sélection de la méthode est baséesur l’expérience précédente. De cet ensemble d’expériences, nous concluons que lemeilleur algorithme de découverte de vérité pour la tâche d’étiquetage de sujet estDepen. Lors de notre dernière expérience, nous étudions la possibilité d’améliorerles performances de la méthode proposée en faisant varier la sélection des étiquettesles plus importantes de la liste des étiquettes candidates pour le sujet. Pour cette ex-périence, nous utilisons uniquement le meilleur algorithme de découverte de véritéen utilisant la meilleure méthode pour générer les étiquettes candidates qui sonttoutes deux basées sur les résultats des expériences précédentes. Nous constatonsque le plus d’étiquettes sélectionné pour chaque sujet, plus la précision de la méthodeproposée sera précise.
B.5 Définir l’étiquetage à l’aide de la classifica-tion multi-étiquettes
Dans cette recherche, nous étudions une approche di�érente d’étiquetage de l’ensembledes graines de n-uplet. Au lieu de considérer chaque groupe de graines de n-upletcomme des mots décrivant les modèles de sujet décrits précédemment, nous les

134 APPENDIX B. RÉSUMÉ EN FRANÇAIS
traitons comme des éléments constituant un ensemble, puis nous essayons d’inférerl’étiquette appropriée pour cet ensemble en utilisant certaines caractéristiques deséléments. Pour atteindre l’objectif de déduire l’étiquette de l’ensemble, nous util-isons un classificateur multi-étiquettes. Nous illustrons la tâche que nous abor-dons dans cette recherche par le scénario simple et réel suivant. Considérons Alicequi recherche des produits cosmétiques. Elle navigue sur le site Web de Kiko ets’intéresse à deux produits qu’elle trouve sur le site Web: «Bright Lift Night» et«Bright Lift Mask». Malheureusement, les deux produits semblent être en rupturede stock et ne peuvent être achetés en ligne. Alice décide de rechercher des produitssimilaires sur les sites Web d’autres marques. Elle visite le site Web d’Yves Rocher.Elle pourrait utiliser le champ de recherche du site Web ou parcourir les catégories,mais non seulement les noms des produits, mais également leurs catégories, et Al-ice n’est pas sûre des mots-clés à utiliser. Le problème auquel Alice est confrontéedans le scénario décrit précédemment est de savoir comment inférer une étiquette(catégorie) pour un ensemble (l’ensemble de produits) à partir de quelques exemplesde ses membres (produits). Bien entendu, dans le cas d’Alice, déduire l’étiquettenécessite plus que le nom des produits. Il est donc impératif de rechercher d’autrescaractéristiques (caractéristiques) des produits pour en déduire l’étiquette. Nousdéfinissons correctement le probléme dans la section suivante et proposons une solu-tion possible. Dans le cas d’Alice, nous appliquons la solution proposée qui permet àAlice de découvrir les catégories de produits qui l’intéressent. La solution, appliquéesous la forme d’un outil de recherche, permet de retrouver les catégories correspon-dantes dans le site Web d’Yves Rocher aux catégories des produits du site Web deKiko.
B.5.1 Définition du problèmeNous définissons correctement la tâche d’étiquetage des ensembles que nous abor-dons dans ce chapitre. L’étiquetage des ensembles consiste â trouver l’étiquette laplus appropriée pour un ensemble, â partir de quelques exemples de ses membres.Les exemples de membres sont appelés des «semences», tandis que l’ensemble de cessemences constitue la requête. La tâche suppose que l’ensemble est homogène, c’est-â-dire que chaque membre de l’ensemble appartient â la même classe d’objets ou deconcepts. Set labelling essaie de trouver une caractérisation appropriée, un nom ouune étiquette, pour la classe. Pour ce travail, nous considérons des ensembles determes (mots). Par exemple, étant donné les graines «Indonésie», «Singapour» et«Malaisie», l’étiquetage des ensembles peut en déduire que ces trois objets apparti-ennent â un ensemble de pays, qui peuvent donc être étiquetés comme «pays».
B.5.2 Approche proposéeNous proposons une solution à la tâche consistant à étiqueter les ensembles en util-isant un classificateur multi-étiquettes. Dans le problème classique multi-classe, leclassifieur doit choisir pour une entrée donnée une seule étiquette considérée commela plus pertinente. Cependant, dans la tâche d’étiquetage d’ensemble, un ensem-

B.5. DÉFINIR L’ÉTIQUETAGE 135
ble donné de semences peut être a�ecté à plusieurs étiquettes pertinentes. Dansce contexte, il est plus approprié d’adopter la classification multi-étiquettes pournotre tâche, car un classifieur multi-étiquettes renvoie un ensemble d’étiquettes per-tinentes pour l’entrée donnée. Le classificateur classe également les étiquettes enfonction de leur niveau de confiance, ce qui correspond également à la définition dela tâche d’étiquetage définie.
Le processus commence par l’apprentissage du classifieur multi-étiquettes à l’aided’un jeu de données étiqueté. Chaque entrée du jeu de données est composée d’unobjet, des étiquettes attribuées et des caractéristiques de l’objet. Dans cette mise enœuvre, nous choisissons les caractéristiques comme un ensemble de mots décrivantl’objet correspondant, c’est-à-dire des descriptions des produits cosmétiques. Noustransformons ensuite les entités en une dimension inférieure sous forme de sacde mots vectorisé. Pour acquérir les vecteurs sac-de-mots, nous utilisons Scikit-learn [131] en utilisant les modules CountVector et TFIDFVectorizer [132]. Nousmenons également des expériences en utilisant le doc2vec [133] de gensim à titre decomparaison.
Une fois que le classificateur a été formé, l’utilisateur peut interagir avec lesystème en fournissant soit des mots-clés, soit une description des objets inconnus.étant donné que le classifieur multi-étiquettes est formé à l’aide de descriptions desobjets et des étiquettes qui lui sont a�ectées, il est préférable, lors de l’interactionavec le système, de donner également une forme de description des objets inconnussous forme de requêtes. Néanmoins, si l’utilisateur ne fournit que des mots-clés pourchaque objet, nous devons être en mesure de développer les mots-clés donnés et deles utiliser plutôt comme caractéristiques de l’objet inconnu. Nous y parvenons enintégrant LDA (Latent Dirichlet Allocation) [1] dans le processus d’expansion.
LDA est un modèle probabiliste génératif d’un corpus. LDA suppose qu’undocument est composé de mélanges aléatoires sur des sujets latents, chaque sujetétant lui-même une distribution sur des mots. Dans le scénario relatif aux produitscosmétiques et aux hôtels, nous considérons respectivement les étiquettes de produitset les catégories d’hôtels. Nous utilisons les descriptions de tous les produits ou lescritiques d’hôtels comme entrée et demandons à LDA d’apprendre des sujets K
(nombre d’étiquettes de produits ou de catégories d’hôtels). La sortie de LDA est K
sujets oùchaque sujet est une distribution de mots. Nous utilisons la distribution demots dans chaque sujet dans le processus d’extension de la requête, qui est détailléci-après.
Pour développer la requête, nous utilisons l’algorithme 20 et donnons en entréeun ensemble de mots-clés O, une distribution de mots-sujets K et un nombre C.Pour chaque mot o de l’ensemble de mots-clés O, nous sélectionnons le sujet z parmiles K sujets où o a la probabilité la plus élevée (ligne 3). Word o peut apparaîtredans toutes les distributions de K topic-words mais a des probabilités di�érentes.Notre intuition est de sélectionner le sujet où o a la probabilité la plus élevée, c’est-à-dire où appartient probablement à ce sujet. Du sujet z, nous prenons les motsdu top-to pour ajouter o (ligne 4). Cela signifie que les mots T sont les meilleursmots pour décrire le sujet z. Nous faisons la même procédure pour chaque mot o etretournons l’union de tous les mots en tant que résultat d’expansion (ligne 7).

136 APPENDIX B. RÉSUMÉ EN FRANÇAIS
Algorithme 20 : Extension_de_requêteEntrées : Un ensemble de mots I, distribution du sujet K, entier T
Sorties : Un ensemble de mots O
1 O = I;2 pour chaque w œ I faire3 z Ω {sélectionnez parmi K où w a la probabilité la plus élevée};4 m Ω {sélectionnez top-T mots de z};5 O = O fi m;6 fin7 return O;
La même procédure est répétée autant de fois que nécessaire en fonction dunombre d’objets inconnus. Chaque requête adressée au classifieur multi-étiquettesrenvoie une liste classée d’étiquettes jugées pertinentes par le classifieur avec uneréférence à l’entrée donnée. Les étiquettes proposées pour l’ensemble des objetsinconnus sont ensuite récupérées en croisant toutes les listes d’étiquettes classées dechaque exécution de la requête. Parmi l’ensemble des étiquettes proposées, nousrécupérons d’autres objets sous ces étiquettes et les présentons à l’utilisateur.
B.5.3 Évaluation des performances
D’après les résultats de l’expérience, nous constatons que, pour le jeu de donnéesYves Rocher, CountVectorizer fonctionne mieux pour un petit nombre d’entités.D’autre part, les performances de TFIDFVectorizer augmentent en fonction du nom-bre de fonctionnalités. L’augmentation des performances de CountVectorizer et deTFIDFVectorizer est perceptible lorsque nous modifions le nombre de fonctionnalitésde 100 à 300. Toutefois, un nombre supérieur à 300 n’améliore pas les performances.Dans la deuxième expérience, nous avons choisi TFIDFVectorizer pour le comparerà doc2vec. Pour Yves Rocher, nous pouvons constater que l’utilisation de doc2vecpour vectoriser la description produit des résultats faibles pour toutes les métriques.L’augmentation du nombre de fonctionnalités à 500 n’améliore pas non plus les per-formances. Pour évaluer les performances de notre méthode proposée d’étiquetagedes ensembles, nous créons n produits inconnus à partir de chaque catégorie dansle jeu de données Yves Rocher. Pour chaque produit, nous concaténons de manièrealéatoire deux descriptions de produit dans la même catégorie. Nous demandons auclassificateur d’attribuer les étiquettes à chacun des produits. Nous prenons ensuitel’intersection des étiquettes et comparons le résultat avec l’étiquette d’origine pourcalculer la précision. D’après les résultats de l’expérience, nous constatons que notreapproche d’étiquetage d’ensemble atteint une précision moyenne de plus de 90%.

B.6. CONCLUSION 137
B.6 Conclusion
Dans cette thèse, nous avons abordé plusieurs défis dans la recherche d’informationspar des exemples, en particulier des informations sous la forme de relations n-aires(n-uplet). Nous avons présenté un certain nombre de contributions qui aident à ex-traire et à classer les n-uplets candidats extraits. Nous avons abordé les problèmesimportants suivants: extension du jeu de n-uplets, véracité des candidats extraits,reconstruction du n-uplet et extension sémantique de la série d’exemples, qui con-stituent une étape prometteuse dans la réalisation d’une extraction d’informationaxée sur les exemples.
Dans la première partie de la thèse, nous avons généralisé le problème de l’extensionset à l’extension des ensembles de n-uplets [35]. La méthode proposée prend enentrée un ensemble de n-éléments n-éléments comme exemples, tandis que les ap-proches classiques d’expansion d’ensembles ne prennent en compte que les valeursatomiques. Le processus de généralisation soulève des di�cultés dans les phasesd’exploration, de génération d’emballages et d’extraction. Notre méthode proposéeapplique plusieurs stratégies pour récupérer des documents pertinents basés sur lessemences données, y compris la permutation des semences en tant que mots-clésdu moteur de recherche. La localisation des occurrences des semences dans lesdocuments prend également en compte le fait que chaque élément des semencespeut apparaître de manière arbitraire. Nous avons mis en œuvre notre approcheproposée d’un système (STEP) et démontré son e�cacité en utilisant onze sujets,chaque sujet définissant un ensemble de n-uplets ou de tables. Nous avons égalementcomparé notre système à des systèmes d’expansion de jeux à la pointe de la tech-nologie (DIPRE [16] et Extended SEAL [30]) et montré qu’il o�rait de meilleuresperformances en termes de précision et de rappel dans plusieurs domaines.
Dans [35], nous avons adopté le mécanisme de classement de SEAL [24] qui estbasé sur un graphe d’entités où les nœuds représentent des entités alors que lesarêtes entre elles dénotent les relations. Nous avons ensuite ajouté une nouvelleentité, c’est-à-dire un domaine, au graphe et à ses relations. Les candidats sontensuite classés en fonction du poids attribué aux nœuds une fois la marche terminée.Cependant, ce mécanisme de classement ne garantit pas que les candidats ayant lepoids le plus élevé sont de véritables candidats, STEP pouvant également extrairede faux candidats. Nous avons proposé de tirer parti de l’approche de recherchede la vérité pour trouver les vrais candidats parmi tous les candidats extraits parSTEP [36]. Nous avons généré des faits en tant qu’entrée dans les algorithmes derecherche de la vérité à partir du graphe d’entités. Nos expériences utilisant plusieursalgorithmes de recherche de vérité de pointe sur sept sujets ont montré que Accu [89]est le meilleur algorithme. Accu apporte également une amélioration significativeen termes de précision, de rappel et de mesure F par rapport au mécanisme declassement basé sur des graphiques. Dans [37], nous avons également comparé leclassement des sources produit par la méthode des graphes et Accu. Nous avonsconstaté que l’utilisation de l’algorithme de recherche de la vérité, en particulier deAccu, peut e�ectivement améliorer la confiance dans le classement établi sur la basedes scores de Tau de Kendall.

138 APPENDIX B. RÉSUMÉ EN FRANÇAIS
Nous avons proposé la tâche de reconstruction de n-uplets [38] avec l’objectif dereconstituer des uplets à n éléments à partir d’éléments binaires. Cette tâche estmotivée par le fait que les documents (par exemple, les pages Web) contenant desinformations sous la forme de n-uplets à n éléments sont rares, alors qu’au contraire,les n-uplets binaires sont très courants. Nous avons présenté deux méthodes pourreconstruire les n-uplets de n éléments. Pour évaluer les performances de l’approcheproposée, nous avons intégré la reconstruction du n-uplet au processus de construc-tion du graphe d’entités dans STEP. Les résultats des expériences sur trois sujetsont montré que la reconstruction du n-uplet peut proposer de nouveaux candidatsqui ne sont pas extraits par STEP. En e�et, cette intégration de la reconstructionde n-uplets dans STEP a augmenté son rappel. Cependant, cette amélioration peutégalement avoir un impact négatif sur la précision.
Dans la deuxième partie de la thèse, nous concentrons notre attention sur l’extensionsémantique de la série d’exemples. Un ensemble de n-éléments de n-uplets peut êtreconsidéré comme n groupes de mots décrivant n sujets. Connaître l’étiquette dechaque sujet permettrait d’élargir sémantiquement l’ensemble des exemples. Entant que premier travail, nous avons tiré parti de l’étiquetage des sujets pour don-ner des étiquettes pertinentes pour les sujets. Nous avons transformé le problèmede la proposition de l’étiquette d’un sujet en domaine de recherche de la vérité[40]. Nous avons utilisé les mots comme interrogation dans une base de connais-sances et récupéré les catégories des documents retournés en tant qu’étiquettes can-didates. Nous avons ensuite associé une étiquette à chaque mot du sujet en utilisantl’approche de recherche de la vérité. L’étiquette de sujet est ensuite sélectionnéeen tant qu’étiquette des mots du sujet avec la plus grande confiance donnée parl’approche de recherche de la vérité.
Enfin, nous avons abordé le problème de l’étiquetage des ensembles, qui consisteà trouver une étiquette appropriée pour un ensemble à partir de quelques exemplesde ses membres. Nous avons considéré les éléments d’un groupe dans l’ensembled’exemples en tant que membres d’un ensemble. Ainsi, en déduisant l’étiquettede l’ensemble à partir des caractéristiques des éléments, nous pourrions dévelop-per les exemples sémantiquement. Nous avons proposé une solution au problèmeen formant d’abord un classifieur multi-étiquettes à l’aide d’un jeu de données éti-queté. Chaque entrée du jeu de données désigne un objet, les étiquettes attribuéeset les caractéristiques de l’objet. Nous avons utilisé la description de l’objet commecaractéristique. Une fois que nous avons formé le classifieur multi-étiquettes pourun ensemble d’objets inconnus ou inconnus, le classificateur a ensuite déduit lesétiquettes pertinentes pour chacun des objets. Les étiquettes de l’ensemble sontensuite sélectionnées en tant qu’intersection de toutes les étiquettes renvoyées par leclassificateur pour tous les objets inconnus. Nous avons appliqué notre solution duproblème d’étiquetage défini dans un moteur de recherche [39] et avons expérimentédeux scénarios concrets, à savoir les produits cosmétiques et les hôtels. Nous avonsmontré comment le moteur de recherche peut déduire les étiquettes, puis présenterà l’utilisateur tous les objets situés sous les étiquettes correspondantes.

Bibliography
[1] D. M. Blei, A. Y. Ng, and M. I. Jordan, “Latent dirichlet allocation,” J. Mach.Learn. Res., vol. 3, pp. 993–1022, Mar. 2003.
[2] D. Nadeau and S. Sekine, “A survey of named entity recognition and classifica-tion,” Linguisticae Investigationes, vol. 30, pp. 3–26, January 2007. Publisher:John Benjamins Publishing Company.
[3] L. F. Rau, “Extracting company names from text,” in [1991] Proceedings. TheSeventh IEEE Conference on Artificial Intelligence Application, vol. i, pp. 29–32, Feb 1991.
[4] K. Humphreys, R. Gaizauskas, S. Azzam, C. Huyck, B. Mitchell, H. Cunning-ham, and Y. Wilks, “University of she�eld: Description of the lasie-ii systemas used for muc-7,” 06 2001.
[5] S. Sekine and C. Nobata, “Definition, dictionaries and tagger for extendednamed entity hierarchy.,” in LREC, European Language Resources Associa-tion, 2004.
[6] O. Etzioni, M. Cafarella, D. Downey, A.-M. Popescu, T. Shaked, S. Soderland,D. S. Weld, and A. Yates, “Unsupervised named-entity extraction from theweb: An experimental study,” Artif. Intell., vol. 165, pp. 91–134, June 2005.
[7] A. McCallum and W. Li, “Early results for named entity recognition withconditional random fields, feature induction and web-enhanced lexicons,” inProceedings of the Seventh Conference on Natural Language Learning at HLT-NAACL 2003 - Volume 4, CONLL ’03, (Stroudsburg, PA, USA), pp. 188–191,Association for Computational Linguistics, 2003.
[8] G. Lample, M. Ballesteros, S. Subramanian, K. Kawakami, and C. Dyer, “Neu-ral architectures for named entity recognition,” CoRR, vol. abs/1603.01360,2016.
[9] D. Klein, J. Smarr, H. Nguyen, and C. D. Manning, “Named entity recogni-tion with character-level models,” in Proceedings of the Seventh Conferenceon Natural Language Learning at HLT-NAACL 2003 - Volume 4, CONLL ’03,(Stroudsburg, PA, USA), pp. 180–183, Association for Computational Lin-guistics, 2003.
139

140 BIBLIOGRAPHY
[10] D. M. Bikel, R. Schwartz, and R. M. Weischedel, “An algorithm that learnswhat’s in a name,” Machine Learning, vol. 34, pp. 211–231, Feb 1999.
[11] J. P. C. Chiu and E. Nichols, “Named entity recognition with bidirectionallstm-cnns,” CoRR, vol. abs/1511.08308, 2015.
[12] M. Habibi, L. Weber, M. L. Neves, D. L. Wiegandt, and U. Leser, “Deeplearning with word embeddings improves biomedical named entity recogni-tion,” Bioinformatics, vol. 33, no. 14, pp. i37–i48, 2017.
[13] N. Kambhatla, “Combining lexical, syntactic, and semantic features with max-imum entropy models for extracting relations,” in Proceedings of the ACL 2004on Interactive Poster and Demonstration Sessions, ACLdemo ’04, (Strouds-burg, PA, USA), Association for Computational Linguistics, 2004.
[14] Z. GuoDong, S. Jian, Z. Jie, and Z. Min, “Exploring various knowledge inrelation extraction,” in Proceedings of the 43rd Annual Meeting on Associationfor Computational Linguistics, ACL ’05, (Stroudsburg, PA, USA), pp. 427–434, Association for Computational Linguistics, 2005.
[15] D. P. T. Nguyen, Y. Matsuo, and M. Ishizuka, “Relation extraction fromwikipedia using subtree mining,” in Proceedings of the 22Nd National Con-ference on Artificial Intelligence - Volume 2, AAAI’07, pp. 1414–1420, AAAIPress, 2007.
[16] S. Brin, “Extracting patterns and relations from the world wide web,” inWebDB, pp. 172–183, 1999.
[17] E. Agichtein and L. Gravano, “Snowball: Extracting relations from large plain-text collections,” in Proceedings of the Fifth ACM Conference on Digital Li-braries, DL ’00, (New York, NY, USA), pp. 85–94, ACM, 2000.
[18] R. Gabbard, M. Freedman, and R. Weischedel, “Coreference for learning toextract relations: Yes, virginia, coreference matters,” in Proceedings of the49th Annual Meeting of the Association for Computational Linguistics: HumanLanguage Technologies: Short Papers - Volume 2, HLT ’11, (Stroudsburg, PA,USA), pp. 288–293, Association for Computational Linguistics, 2011.
[19] J. Chen, D. Ji, C. L. Tan, and Z. Niu, “Relation extraction using label propaga-tion based semi-supervised learning,” in Proceedings of the 21st InternationalConference on Computational Linguistics and the 44th Annual Meeting of theAssociation for Computational Linguistics, ACL-44, (Stroudsburg, PA, USA),pp. 129–136, Association for Computational Linguistics, 2006.
[20] T. Hasegawa, S. Sekine, and R. Grishman, “Discovering relations amongnamed entities from large corpora,” in Proceedings of the 42Nd Annual Meet-ing on Association for Computational Linguistics, ACL ’04, (Stroudsburg, PA,USA), Association for Computational Linguistics, 2004.

BIBLIOGRAPHY 141
[21] J. Chen, D.-H. Ji, C. L. Tan, and Z.-Y. Niu, “Unsupervised feature selectionfor relation extraction,” in IJCNLP, 2005.
[22] M. Mintz, S. Bills, R. Snow, and D. Jurafsky, “Distant supervision for relationextraction without labeled data,” in Proceedings of the Joint Conference of the47th Annual Meeting of the ACL and the 4th International Joint Conferenceon Natural Language Processing of the AFNLP: Volume 2 - Volume 2, ACL’09, (Stroudsburg, PA, USA), pp. 1003–1011, Association for ComputationalLinguistics, 2009.
[23] O. Lopez de Lacalle and M. Lapata, “Unsupervised relation extraction withgeneral domain knowledge,” in Proceedings of the 2013 Conference on Em-pirical Methods in Natural Language Processing, pp. 415–425, Association forComputational Linguistics, 2013.
[24] R. C. Wang and W. W. Cohen, “Language-independent set expansion ofnamed entities using the web,” in ICDM, pp. 342–350, 2007.
[25] D. X. Yeye He, “SEISA: Set expansion by iterative similarity aggregation,” inWWW, 2011.
[26] C. Wang, K. Chakrabarti, Y. He, K. Ganjam, Z. Chen, and P. A. Bernstein,“Concept expansion using web tables,” in WWW, pp. 1198–1208, 2015.
[27] Z. Chen, M. Cafarella, and H. V. Jagadish, “Long-tail vocabulary dictionaryextraction from the web,” in WSDM, pp. 625–634, 2016.
[28] V. Crescenzi, “RoadRunner: Towards Automatic Data Extraction from LargeWeb Sites,” International Conference on Very Large Data Bases (VLDB),2001.
[29] M. Banko, M. J. Cafarella, S. Soderland, M. Broadhead, and O. Etzioni,“Open information extraction from the web,” in Proceedings of the 20th Inter-national Joint Conference on Artifical Intelligence, IJCAI’07, (San Francisco,CA, USA), pp. 2670–2676, Morgan Kaufmann Publishers Inc., 2007.
[30] R. C. Wang and W. W. Cohen, “Character-level analysis of semi-structureddocuments for set expansion,” in EMNLP, pp. 1503–1512, 2009.
[31] R. McDonald, F. Pereira, S. Kulick, S. Winters, Y. Jin, and P. White, “Simplealgorithms for complex relation extraction with applications to biomedical ie,”in Proceedings of the 43rd Annual Meeting on Association for ComputationalLinguistics, ACL ’05, (Stroudsburg, PA, USA), pp. 491–498, Association forComputational Linguistics, 2005.
[32] N. Jayaram, A. Khan, C. Li, X. Yan, and R. Elmasri, “Querying knowledgegraphs by example entity tuples,” in ICDE, pp. 1494–1495, May 2016.

142 BIBLIOGRAPHY
[33] R. Gilleron, P. Marty, M. Tommasi, and F. Torre, “Interactive tuples extrac-tion from semi-structured data,” in 2006 IEEE/WIC/ACM International Con-ference on Web Intelligence (WI 2006 Main Conference Proceedings)(WI’06),pp. 997–1004, Dec 2006.
[34] C. B�dic� and A. B�dic�, “Rule learning for feature values extraction fromhtml product information sheets,” in Rules and Rule Markup Languages forthe Semantic Web (G. Antoniou and H. Boley, eds.), (Berlin, Heidelberg),pp. 37–48, Springer Berlin Heidelberg, 2004.
[35] N. A. S. Er, T. Abdessalem, and S. Bressan, “Set of t-uples expansion byexample,” in iiWAS, pp. 221–230, 2016.
[36] N. A. S. Er, M. L. Ba, T. Abdessalem, and S. Bressan, “Truthfulness of can-didates in set of t-uples expansion,” in Database and Expert Systems Applica-tions (D. Benslimane, E. Damiani, W. I. Grosky, A. Hameurlain, A. Sheth, andR. R. Wagner, eds.), (Cham), pp. 314–323, Springer International Publishing,2017.
[37] N. A. S. Er, M. L. Ba, T. Abdessalem, and S. Bressan, “Set of tuples expan-sion by example with reliability,” International Journal of Web InformationSystems, vol. 13, no. 4, pp. 425–444, 2017.
[38] N. A. S. Er, M. L. Ba, T. Abdessalem, and S. Bressan, “Tuple reconstruction,”in DASFAA Workshops, vol. 10829 of Lecture Notes in Computer Science,pp. 239–254, Springer, 2018.
[39] N. A. S. Er, J. Read, T. Abdessalem, and S. Bressan, “Set labelling usingmulti-label classification,” in press.
[40] N. A. S. Er, M. L. Ba, T. Abdessalem, and S. Bressan, “Harnessing truthdiscovery algorithms on the topic labelling problem,” in press.
[41] W. Zhang, A. Ahmed, J. Yang, V. Josifovski, and A. J. Smola, “Annotatingneedles in the haystack without looking: Product information extraction fromemails,” in KDD, pp. 2257–2266, 2015.
[42] Y. Sheng, S. Tata, J. B. Wendt, J. Xie, Q. Zhao, and M. Najork, “Anatomy ofa privacy-safe large-scale information extraction system over email,” in 24thACM SIGKDD International Conference on Knowledge Discovery and DataMining, pp. 734–743, 2018.
[43] A. Q. Mahlawi and S. Sasi, “Structured data extraction from emails,” in 2017International Conference on Networks Advances in Computational Technolo-gies (NetACT), pp. 323–328, July 2017.
[44] A. Arasu and H. Garcia-Molina, “Extracting structured data from web pages,”Technical Report 2002-40, Stanford InfoLab, July 2002.

BIBLIOGRAPHY 143
[45] T. Abdessalem, B. Cautis, and N. Derouiche, “Objectrunner: Lightweight,targeted extraction and querying of structured web data,” PVLDB, vol. 3,no. 2, pp. 1585–1588, 2010.
[46] D. Qiu, L. Barbosa, X. L. Dong, Y. Shen, and D. Srivastava, “Dexter: Large-scale discovery and extraction of product specifications on the web,” Proc.VLDB Endow., vol. 8, pp. 2194–2205, Sept. 2015.
[47] T. Furche, G. Gottlob, G. Grasso, X. Guo, G. Orsi, C. Schallhart, andC. Wang, “Diadem: Thousands of websites to a single database,” Proc. VLDBEndow., 2014.
[48] M. Faheem and P. Senellart, “Adaptive web crawling through structure-basedlink classification,” in ICADL, pp. 39–51, 2015.
[49] Z. Chen, M. Cafarella, J. Chen, D. Prevo, and J. Zhuang, “Senbazuru: Aprototype spreadsheet database management system,” Proc. VLDB Endow.,vol. 6, pp. 1202–1205, Aug. 2013.
[50] Z. Chen, M. J. Cafarella, and E. Adar, “Diagramflyer: A search engine fordata-driven diagrams,” in WWW, 2015.
[51] K. Bollacker, C. Evans, P. Paritosh, T. Sturge, and J. Taylor, “Freebase: Acollaboratively created graph database for structuring human knowledge,” inProceedings of the 2008 ACM SIGMOD International Conference on Manage-ment of Data, SIGMOD ’08, (New York, NY, USA), pp. 1247–1250, ACM,2008.
[52] F. M. Suchanek, G. Kasneci, and G. Weikum, “Yago: A core of semanticknowledge,” in Proceedings of the 16th International Conference on WorldWide Web, WWW ’07, (New York, NY, USA), pp. 697–706, ACM, 2007.
[53] M. E. Cali� and R. J. Mooney, “Relational learning of pattern-match rules forinformation extraction,” in Proceedings of the Sixteenth National Conferenceon Artificial Intelligence and the Eleventh Innovative Applications of Artifi-cial Intelligence Conference Innovative Applications of Artificial Intelligence,AAAI ’99/IAAI ’99, (Menlo Park, CA, USA), pp. 328–334, American Associ-ation for Artificial Intelligence, 1999.
[54] C. Fellbaum, WordNet: An Electronic Lexical Database. Bradford Books, 1998.
[55] S. Soderland, “Learning information extraction rules for semi-structured andfree text,” Mach. Learn., vol. 34, pp. 233–272, Feb. 1999.
[56] B. Adelberg, “Nodose—a tool for semi-automatically extracting struc-tured and semistructured data from text documents,” in Proceedings of the1998 ACM SIGMOD International Conference on Management of Data, SIG-MOD ’98, (New York, NY, USA), pp. 283–294, ACM, 1998.

144 BIBLIOGRAPHY
[57] C.-H. Chang and S.-C. Lui, “Iepad: Information extraction based on patterndiscovery,” in Proceedings of the 10th International Conference on World WideWeb, WWW ’01, (New York, NY, USA), pp. 681–688, ACM, 2001.
[58] C.-H. Chang and S.-C. Kuo, “Olera: semisupervised web-data extraction withvisual support,” IEEE Intelligent Systems, vol. 19, pp. 56–64, 2004.
[59] A. Hogue and D. Karger, “Thresher: Automating the unwrapping of semanticcontent from the world wide web,” in Proceedings of the 14th InternationalConference on World Wide Web, WWW ’05, (New York, NY, USA), pp. 86–95, ACM, 2005.
[60] J. Wang and F. H. Lochovsky, “Data extraction and label assignment forweb databases,” in Proceedings of the 12th International Conference on WorldWide Web, WWW ’03, (New York, NY, USA), pp. 187–196, ACM, 2003.
[61] P. P. Talukdar, T. Brants, M. Liberman, and F. Pereira, “A context pat-tern induction method for named entity extraction,” in Proceedings of theTenth Conference on Computational Natural Language Learning, CoNLL-X’06, (Stroudsburg, PA, USA), pp. 141–148, Association for ComputationalLinguistics, 2006.
[62] M. Pa�ca, “Weakly-supervised discovery of named entities using web searchqueries,” in Proceedings of the Sixteenth ACM Conference on Conference onInformation and Knowledge Management, CIKM ’07, (New York, NY, USA),pp. 683–690, ACM, 2007.
[63] Y. Zhang, Y. Xiao, S.-w. Hwang, and W. Wang, “Long concept query onconceptual taxonomies,” arXiv preprint arXiv:1511.09009, 2015.
[64] P. Pantel, E. Crestan, A. Borkovsky, A.-M. Popescu, and V. Vyas, “Web-scaledistributional similarity and entity set expansion,” in Proceedings of the 2009Conference on Empirical Methods in Natural Language Processing: Volume 2- Volume 2, EMNLP ’09, (Stroudsburg, PA, USA), pp. 938–947, Associationfor Computational Linguistics, 2009.
[65] X. Zhang, Y. Chen, J. Chen, X. Du, K. Wang, and J.-R. Wen, “Entity set ex-pansion via knowledge graphs,” in Proceedings of the 40th International ACMSIGIR Conference on Research and Development in Information Retrieval,SIGIR ’17, (New York, NY, USA), pp. 1101–1104, ACM, 2017.
[66] L. Sarmento, V. Jijkuon, M. de Rijke, and E. Oliveira, ““more like these”:Growing entity classes from seeds,” in CIKM, pp. 959–962, 2007.
[67] E. Rilo� and J. Shepherd, “A corpus-based approach for building semanticlexicons,” 06 1997.

BIBLIOGRAPHY 145
[68] D. Widdows and B. Dorow, “A graph model for unsupervised lexical acquisi-tion,” in Proceedings of the 19th International Conference on ComputationalLinguistics - Volume 1, COLING ’02, (Stroudsburg, PA, USA), pp. 1–7, As-sociation for Computational Linguistics, 2002.
[69] M. A. Hearst, “Automatic acquisition of hyponyms from large text corpora,”in Proceedings of the 14th Conference on Computational Linguistics - Vol-ume 2, COLING ’92, (Stroudsburg, PA, USA), pp. 539–545, Association forComputational Linguistics, 1992.
[70] Z. Kozareva, E. Rilo�, and E. Hovy, “Semantic class learning from the webwith hyponym pattern linkage graphs,” in Proceedings of ACL-08: HLT,pp. 1048–1056, Association for Computational Linguistics, 2008.
[71] S. P. Igo and E. Rilo�, “Corpus-based semantic lexicon induction with web-based corroboration,” in Proceedings of the Workshop on Unsupervised andMinimally Supervised Learning of Lexical Semantics, UMSLLS ’09, (Strouds-burg, PA, USA), pp. 18–26, Association for Computational Linguistics, 2009.
[72] X.-L. Li, L. Zhang, B. Liu, and S.-K. Ng, “Distributional similarity vs. pulearning for entity set expansion,” in Proceedings of the ACL 2010 ConferenceShort Papers, ACLShort ’10, (Stroudsburg, PA, USA), pp. 359–364, Associa-tion for Computational Linguistics, 2010.
[73] Z. Ghahramani and K. A. Heller, “Bayesian sets,” in Advances in NeuralInformation Processing Systems 18 (Y. Weiss, B. Schölkopf, and J. C. Platt,eds.), pp. 435–442, MIT Press, 2006.
[74] L. Zhang and B. Liu, “Entity set expansion in opinion documents,” in Pro-ceedings of the 22Nd ACM Conference on Hypertext and Hypermedia, HT ’11,(New York, NY, USA), pp. 281–290, ACM, 2011.
[75] E. Fredkin, “Trie memory,” Commun. ACM, vol. 3, pp. 490–499, Sept. 1960.
[76] B. G. Malkiel, A Random Walk Down Wall Street. Norton, New York, 1973.
[77] L. Page, S. Brin, R. Motwani, and T. Winograd, “The pagerank citationranking: Bringing order to the web.,” Technical Report 1999-66, StanfordInfoLab, November 1999.
[78] L. C. Freeman, “Centrality in social networks conceptual clarification,” SocialNetworks, p. 215, 1978.
[79] S. Auer, C. Bizer, G. Kobilarov, J. Lehmann, R. Cyganiak, and Z. Ives, “Dbpe-dia: A nucleus for a web of open data,” in Proceedings of the 6th InternationalThe Semantic Web and 2Nd Asian Conference on Asian Semantic Web Confer-ence, ISWC’07/ASWC’07, (Berlin, Heidelberg), pp. 722–735, Springer-Verlag,2007.

146 BIBLIOGRAPHY
[80] W. Wu, H. Li, H. Wang, and K. Q. Zhu, “Probase: A probabilistic taxonomyfor text understanding,” in Proceedings of the 2012 ACM SIGMOD Interna-tional Conference on Management of Data, SIGMOD ’12, (New York, NY,USA), pp. 481–492, ACM, 2012.
[81] X. Yin, J. Han, and P. S. Yu, “Truth discovery with multiple conflicting in-formation providers on the web,” IEEE TKDE, June 2008.
[82] X. L. Dong, L. Berti-Equille, and D. Srivastava, “Truth discovery and copyingdetection in a dynamic world,” PVLDB, vol. 2, August 2009.
[83] B. Zhao, B. I. P. Rubinstein, J. Gemmell, and J. Han, “A Bayesian approachto discovering truth from conflicting sources for data integration,” PVLDB,vol. 5, February 2012.
[84] Z. Zhao, J. Cheng, and W. Ng, “Truth discovery in data streams: A single-passprobabilistic approach,” in CIKM, (Shangai, China), November 2014.
[85] J. Bleiholder, K. Draba, and F. Naumann, “FuSem: exploring di�erent se-mantics of data fusion,” in VLDB, (Vienna, Austria), 2007.
[86] X. L. Dong and F. Naumann, “Data fusion: Resolving data conflicts for inte-gration,” PVLDB, vol. 2, August 2009.
[87] R. Pochampally, A. Das Sarma, X. L. Dong, A. Meliou, and D. Srivastava,“Fusing data with correlations,” in SIGMOD, (Snowbird, Utah, USA), May2014.
[88] Q. Li, Y. Li, J. Gao, B. Zhao, W. Fan, and J. Han, “Resolving conflicts inheterogeneous data by truth discovery and source reliability estimation,” inSIGMOD, (Snowbird, Utah, USA), May 2014.
[89] X. L. Dong, L. Berti-Equille, and D. Srivastava, “Integrating conflicting data:the role of source dependence,” PVLDB, vol. 2, August 2009.
[90] M. L. Ba, L. Berti-Equille, K. Shah, and H. M. Hammady, “VERA: A platformfor veracity estimation over web data,” in WWW, 2016.
[91] W. Liu, J. Liu, H. Duan, J. Zhang, W. Hu, and B. Wei, “TruthDiscover:Resolving object conflicts on massive linked data,” in WWW, pp. 243–246,2017.
[92] A. Galland, S. Abiteboul, A. Marian, and P. Senellart, “Corroborating in-formation from disagreeing views,” in WSDM, (New York, USA), February2010.
[93] D. Wang, L. Kaplan, H. Le, and T. Abdelzaher, “On truth discovery in so-cial sensing: A maximum likelihood estimation approach,” in IPSN, (Beijing,China), April 2012.

BIBLIOGRAPHY 147
[94] J. Pasternack and D. Roth, “Latent credibility analysis,” in WWW, (Rio deJaneiro, Brazil), May 2013.
[95] X. L. Dong, L. Berti-Equille, Y. Hu, and D. Srivastava, “Global detectionof complex copying relationships between sources,” VLDB Endow., vol. 3,September 2010.
[96] X. S. Fang, “Truth discovery from conflicting multi-valued objects,” in WWW,pp. 711–715, 2017.
[97] X. S. Fang, Q. Z. Sheng, X. Wang, and A. H. Ngu, “Value veracity estimationfor multi-truth objects via a graph-based approach,” in WWW, pp. 777–778,2017.
[98] M. L. Ba, R. Horincar, P. Senellart, and H. Wu, “Truth finding with attributepartitioning,” in WebDB SIGMOD Workshop, (Melbourne, Australia), May2015.
[99] L. Berti-Equille, “Data Veracity Estimation with Ensembling Truth DiscoveryMethods,” in IEEE Big Data Workshop, 2015.
[100] T. Yamane, Statistics an introductory analysis. Harper & Row, 1969.
[101] T. L. Gri�ths and M. Steyvers, “Finding scientific topics,” Proceedings of theNational Academy of Sciences, vol. 101, pp. 5228–5235, April 2004.
[102] T. Minka and J. La�erty, “Expectation-Propagation for the Generative AspectModel,” in Proceedings of the 18th Conference on Uncertainty in ArtificialIntelligence, pp. 352–359, 2002.
[103] Q. Mei, X. Shen, and C. Zhai, “Automatic labeling of multinomial topic mod-els,” in Proceedings of the 13th ACM SIGKDD International Conference onKnowledge Discovery and Data Mining, KDD ’07, (New York, NY, USA),pp. 490–499, ACM, 2007.
[104] S. Kullback and R. A. Leibler, “On information and su�ciency,” Ann. Math.Statist., vol. 22, no. 1, pp. 79–86, 1951.
[105] J. H. Lau, K. Grieser, D. Newman, and T. Baldwin, “Automatic labelling oftopic models,” in Proceedings of the 49th Annual Meeting of the Association forComputational Linguistics: Human Language Technologies - Volume 1, HLT’11, (Stroudsburg, PA, USA), pp. 1536–1545, Association for ComputationalLinguistics, 2011.
[106] K. Grieser, T. Baldwin, F. Bohnert, and L. Sonenberg, “Using ontologicaland document similarity to estimate museum exhibit relatedness,” J. Comput.Cult. Herit., vol. 3, pp. 10:1–10:20, Feb. 2011.
[107] S. Bhatia, J. H. Lau, and T. Baldwin, “Automatic labelling of topics withneural embeddings,” CoRR, vol. abs/1612.05340, 2016.

148 BIBLIOGRAPHY
[108] Q. V. Le and T. Mikolov, “Distributed representations of sentences and doc-uments,” CoRR, vol. abs/1405.4053, 2014.
[109] T. Mikolov, K. Chen, G. Corrado, and J. Dean, “E�cient estimation of wordrepresentations in vector space,” CoRR, vol. abs/1301.3781, 2013.
[110] W. Kou, F. Li, and T. Baldwin, “Automatic labelling of topic models usingword vectors and letter trigram vectors,” in Information Retrieval Technology- 11th Asia Information Retrieval Societies Conference, AIRS 2015, Brisbane,QLD, Australia, December 2-4, 2015. Proceedings, pp. 253–264, 2015.
[111] I. Hulpus, C. Hayes, M. Karnstedt, and D. Greene, “Unsupervised graph-basedtopic labelling using dbpedia,” in Proceedings of the Sixth ACM InternationalConference on Web Search and Data Mining, WSDM ’13, (New York, NY,USA), pp. 465–474, ACM, 2013.
[112] M. Newman, Networks: An Introduction. New York, NY, USA: Oxford Uni-versity Press, Inc., 2010.
[113] K. Stephenson and M. Zelen, “Rethinking centrality: Methods and examples,”Social Networks, vol. 11, no. 1, pp. 1–37, 1989.
[114] M. E. J. Newman, “A measure of betweenness centrality based on randomwalks,” Social Networks, vol. 27, pp. 39–54, 2005.
[115] A. E. C. Basave, Y. He, and R. Xu, “Automatic labelling of topic modelslearned from twitter by summarisation,” in Proceedings of the 52nd AnnualMeeting of the Association for Computational Linguistics, ACL 2014, June22-27, 2014, Baltimore, MD, USA, Volume 2: Short Papers, pp. 618–624,2014.
[116] A. K. McCallum, “Multi-label text classification with a mixture model trainedby em,” 1999.
[117] S. Godbole and S. Sarawagi, “Discriminative methods for multi-labeled clas-sification,” Advances in Knowledge Discovery and Data Mining, pp. 22–30,2004.
[118] C. Vens, J. Struyf, L. Schietgat, S. Dûeroski, and H. Blockeel, “Decision treesfor hierarchical multi-label classification,” Mach. Learn., vol. 73, pp. 185–214,Nov. 2008.
[119] R. E. Schapire and Y. Singer, “Boostexter: A boosting-based systemfor textcategorization,” Mach. Learn., vol. 39, pp. 135–168, May 2000.
[120] G. Tsoumakas and I. Katakis, “Multi-label classification: An overview,” Int JData Warehousing and Mining, vol. 2007, pp. 1–13, 2007.
[121] J. Read, B. Pfahringer, G. Holmes, and E. Frank, “Classifier chains for multi-label classification,” Machine Learning, vol. 85, p. 333, Jun 2011.

BIBLIOGRAPHY 149
[122] V. I. Levenshtein, “Binary codes capable of correcting deletions, insertions andreversals.,” Soviet Physics Doklady, vol. 10, no. 8, pp. 707–710, 1966. DokladyAkademii Nauk SSSR, V163 No4 845-848 1965.
[123] R. C. Wang and W. W. Cohen, “Iterative set expansion of named entities usingthe web,” in Proceedings of the 2008 Eighth IEEE International Conferenceon Data Mining, ICDM ’08, (Washington, DC, USA), pp. 1091–1096, IEEEComputer Society, 2008.
[124] H. Tong, C. Faloutsos, and J.-Y. Pan, “Fast random walk with restart and itsapplications,” in Proceedings of the Sixth International Conference on DataMining, ICDM ’06, (Washington, DC, USA), pp. 613–622, IEEE ComputerSociety, 2006.
[125] Z. Ghahramani and K. A. Heller, “Bayesian sets,” in Advances in NeuralInformation Processing Systems 18 (Y. Weiss, B. Schölkopf, and J. C. Platt,eds.), pp. 435–442, MIT Press, 2006.
[126] D. A. Waguih, N. Goel, H. M. Hammady, and L. Berti-Equille, “Allegator-Track: Combining and reporting results of truth discovery from multi-sourcedata,” in ICDE, (Seoul, Korea), 2015.
[127] M. Kendall, Rank correlation methods. London: Gri�n, 1948.
[128] M. Allahyari and K. J. Kochut, “Automatic topic labeling using ontology-based topic models,” 2015 IEEE 14th International Conference on MachineLearning and Applications (ICMLA), pp. 259–264, 2015.
[129] T. Joachims, “Text categorization with suport vector machines: Learning withmany relevant features,” in Proceedings of the 10th European Conference onMachine Learning, ECML ’98, (London, UK, UK), pp. 137–142, Springer-Verlag, 1998.
[130] S. Gardner and H. Nesi, “A classification of genre families in university studentwriting,” Applied Linguistics, vol. 34, no. 1, pp. 25–52, 2013.
[131] F. Pedregosa, G. Varoquaux, A. Gramfort, V. Michel, B. Thirion, O. Grisel,M. Blondel, P. Prettenhofer, R. Weiss, V. Dubourg, J. Vanderplas, A. Passos,D. Cournapeau, M. Brucher, M. Perrot, and E. Duchesnay, “Scikit-learn: Ma-chine learning in python,” J. Mach. Learn. Res., vol. 12, pp. 2825–2830, Nov.2011.
[132] L. Buitinck, G. Louppe, M. Blondel, F. Pedregosa, A. Mueller, O. Grisel,V. Niculae, P. Prettenhofer, A. Gramfort, J. Grobler, R. Layton, J. Van-derPlas, A. Joly, B. Holt, and G. Varoquaux, “Api design for ma-chine learning software: experiences from the scikit-learn project.,” CoRR,vol. abs/1309.0238, 2013.

150 BIBLIOGRAPHY
[133] R. �eh��ek and P. Sojka, “Software Framework for Topic Modelling with LargeCorpora,” in Proceedings of the LREC 2010 Workshop on New Challenges forNLP Frameworks, (Valletta, Malta), pp. 45–50, ELRA, May 2010.
[134] T. Fawcett, “An introduction to roc analysis,” Pattern Recogn. Lett., vol. 27,pp. 861–874, June 2006.
[135] J. H. Lau and T. Baldwin, “An empirical evaluation of doc2vec with practicalinsights into document embedding generation,” CoRR, vol. abs/1607.05368,2016.