advanced cost and management accounting - BDU OMS
197
advanced cost and management accounting IV Semester – M.Com Dr. v. saravanan, M.Com., M.Phil., Ph.D., BHARATHIDASAN UNIVERSITY CONSTITUENT COLLEGE OF ARTS AND SCIENCE NAGAPATTINAM
-
Upload
khangminh22 -
Category
Documents
-
view
1 -
download
0
Transcript of advanced cost and management accounting - BDU OMS
advancedcost and management
accounting
IV Semester – M.Com
Dr. v. saravanan,M.Com., M.Phil., Ph.D.,
BHARATHIDASAN UNIVERSITY
CONSTITUENT COLLEGE OFARTS AND SCIENCE
NAGAPATTINAM

Introduction
Costing and Cost Accounting
The costing terminology of C.I.M.A ., London defines costing as the “the techniques andprocesses of ascertaining costs”. These techniques consist of principles and rules which govern theprocedure of ascertaining cost of products or services. The techniques to be followed for theanalysis of expenses and the processes by which such an analysis should be related to differentproducts or services differ from industry to industry. These techniques are also dynamic and theychange with time.
The main object of traditional cost accounts is the analysis of financial records, so as tosubdivide expenditure and to allocate it carefully to selected cost centers, and hence to build up atotal cost for the departments, processes or jobs or contracts of the undertaking. The extent to whichthe analysis of expenditure should be carried will depend upon the nature of business and degree ofaccuracy desired. The other important objective of costing are cost control and cost reduction.
Cost Accounting may be regarded as “a specialized branch of accounting which involvesclassification, accumulation, assignment and control of costs.” The costing terminology of C.I.M.A,London defines cost accounting as “the process of accounting for costs from the point at whichexpenditure is incurred or committed to the establishment of its ultimate relationship with costcenters and cost units. In its widest usage, it embraces the preparation of statistical data, theapplication of cost control methods and the ascertainment of profitability of activities carried out orplanned”.
Wheldon defines cost accounting as “classifying, recording and appropriate allocation of
expenditure for determination of costs of products or services and for the presentation of suitably
arranged data purposes of control and guidance of management”. It is thus a formal mechanism by
means of which costs of products or services are ascertained and controlled.
General Principles of Cost Accounting
The following may be considered as the General Principles of Cost Accounting:
1. A cost should be related to its causes: Cost should be related as closely as possible to their
causes so that cost will be shared only among the cost units that pass thorough the
department of which the expenses are related.
UNIT - I
Cost Accounting is a branch of accounting and has been developed due to limitations of financialaccounting. Financial accounting is primarily concerned with record keeping directed towards thepreparation of Profit and Loss Account and Balance Sheet. It provides information regarding theprofit and loss that the business enterprise is making and also its financial position on a particulardate. The financial accounting reports help the management to control in a general way the variousfunctions of the business but it fails to give detailed reports on the efficiency of various divisions.The limitations of Financial Accounting which led to the development of cost accounting are asfollows.

2. A cost should be charged only after it has been incurred: While determining the cost of
individual units those costs which have actually been incurred should be considered. For
example, a cost unit should not be charged to the selling costs, while it is still in the factory.
Selling costs can be charged with the products which are sold.
3. The convention of prudence should be ignored: Usually accountants believe in historical
costs and while determining cost, they always attach importance to historical cost. In Cost
Accounting this convention must be ignored, otherwise, the management appraisal of the
profitability of the projects may be vitiated. According to W.M. Harper, “a cost statement
should, as far as possible, give facts with no known bias. If a contingency needs to be taken
into consideration it should be shown separately and distinctly”.
4. Abnormal costs should be excluded from cost accounts: Costs which are of abnormal
nature (eg. Accident, negligence etc.) should be ignored while computing the cost,
otherwise, it will distort costs figures and mislead management as to working results of their
undertaking under normal conditions.
5. Past costs not to be charged to future period: Costs which could not be recovered or charged
in full during the concerned period should not be taken to a future period, for recovery. If
past costs are included in the future period, they are likely to influence the future period
and future results are likely to be distorted.
6. Principles of double entry should be applied wherever necessary: Costing requires a greater
use of cost sheets and cost statements for the purpose of cost ascertainment and cost control,
but cost ledger and cost control accounts should be kept on double entry principle as far as
possible.
Objectives of Cost Accounting
Cost accounting aims at systematic recording of expenses and analysis of the same so as to
ascertain the cost of each product manufactured or service rendered by an organization. Information
regarding cost of each product or service would enable the management to know where to
economize on costs, how to fix prices, how to maximize profits and so on. Thus, the main
objectives of cost accounting are the following.
1. To analyse and classify all expenditure with reference to the cost of products and
operations.
2. To arrive at the cost of production of every unit, job, operation, process, department or
service and to develop cost standard.
3. To indicate to the management any inefficiencies and the extent of various forms of waste,
whether of materials, time, expenses or in the use of machinery, equipment and tools.
Analysis of the causes of unsatisfactory results may indicate remedial measures.
4. To provide data for periodical profit and loss accounts and balance sheets at such intervals,e.g. weekly, monthly or quarterly as may be desired by the management during the financial

year, not only for the whole business but also by departments or individual products. Also,to explain in detail the exact reasons for profit or loss revealed in total in the profit and lossaccounts.
5. To reveal sources of economies in production having regard to methods, types of
equipment, design, output and layout. Daily, Weekly, Monthly or Quarterly information
may be necessary to ensure prompt constructive action.
6. To provide actual figures of costs for comparison with estimates and to serve as a guide for
future estimates or quotations and to assist the management in their price fixing policy.
7. To show, where Standard Costs are prepared, what the cost of production ought to be and
with which the actual costs which are eventually recorded may be compared.
8. To present comparative cost data for different periods and various volume of output and to
provide guidance in the development of business. This is also helpful in budgetary control.
9. To record the relative production results of each unit of plant and machinery in use as a
basis for examining its efficiency. A comparison with the performance of other types of
machines may suggest the necessity for replacement.
10. To provide a perpetual inventory of stores and other materials so that interim Profit and
Loss Account and Balance Sheet can be prepared without stock taking and checks on stores
and adjustments are made at frequent intervals. Also to provide the basis for production
planning and for avoiding unnecessary wastages or losses of materials and stores.
Last but not the least, to provide information to enable management to make short termdecisions of various types, such as quotation of price to special customers or during a slump, makeor buy decision, assigning priorities to various products, etc.
Cost Accounting and Financial Accounting-
Both financial accounting and cost accounting are concerned with systematic recording andpresentation of financial data. Financial accounting reveals profits and losses of the business as awhole during a particular period, while cost accounting shows, by analysis and localization, the unitcosts and profits and losses of different product lines. The main difference between financialaccounting and cost accounting are summarized below.
1. Financial accounting aims at safeguarding the interests of the business and its proprietorsand others connected with it. This is done by providing suitable information to variousparties, such as shareholders or partners, present or prospective creditors etc. Costaccounting on the other hand, renders information for the guidance of the management forproper planning, operation, control and decision making.
2. Financial accounts are kept in such a way as to meet the requirements of the CompaniesAct, Income Tax Act and other statues. On the other hand cost accounts are generally keptvoluntarily to meet the requirements of the management. But now the Companies Act hasmade it obligatory to keep cost records in some manufacturing industries.
3. Financial accounting emphasizes the measurement of profitability, while cost accountingaims at ascertainment of costs and accumulates data for this very purpose.

4. Financial accounts disclose the net profit and loss of the business as a whole, whereas costaccounts disclose profit or loss of each product, job or service. This enables themanagement to eliminate less profitable product lines and maximize the profits byconcentrating on more profitable ones.
5. Financial accounting provides operating results and financial position usually givesinformation through cost reports to the management as and when desired.
6. Financial accounts deal mainly with actual facts and figures, but cost accounts deal partlywith facts and figures, but cost accounts deal with facts and figures and partly withestimates.
7. In case of financial accounts stress is on the ascertainment and exhibition of profits earnedor losses incurred in the business. On account of this reason in financial accounts, thetransactions are recorded, classified and analyzed in a subjective manner i.e. according tothe nature of expenditure. In cost accounts the emphasis is more on aspects of planning andcontrol and therefore transactions are recorded in an objective manner.
8. Financial accounts are concerned with external transactions i.e. transactions between thebusiness concern on one side and third parties on the other. These transactions form thebasis for payment or receipt of cash. While cost accounts are concerned with internaltransactions which do not form the basis of payment or receipt of cash.
9. The costs are reported in aggregate in financial accounts but costs are broken into unit basisin cost accounts.
10. Financial accounts do not provide information on the relative efficiencies of variousworkers, plants and machinery while cost accounts provide valuable information on therelative efficiencies of various plants and machinery.
11. In financial accounts stocks are valued at cost or market price whichever is less, whereasstocks are valued at cost price in cost accounts.
Importance of Cost Accounting
The limitations of financial accounting have made the management to realize theimportance of cost accounting. Whatever may be the type of business, it involves expenditure onlabour, materials and other items required for manufacturing and disposing of the product. Themanagement has to avoid the possibility of waste at each stage. It has to ensure that no machineremains idle, efficient labour gets due incentive, by-products are properly utilized and costs areproperly ascertained. Besides the management, the creditors and employees are also benefited innumerous ways by installation of a good costing system. Cost accounting increases the overallproductivity of an organization and serves as an important tool, in bringing prosperity to the nation,thus, the importance of cost accounting can be discussed under the following headings:
a) Costing as an aid to management:- Cost accounting provides invaluable aid to management.It provides detailed costing information to the management to enable them to maintain effectivecontrol over stores and inventory, to increase efficiency of the organization and to checkwastage and losses. It facilitates delegation of responsibility for important tasks and rating ofemployees. For all these the management should be capable of using the information providedby cost accounts in a proper way. The various advantages derived by the management from agood system of costing are as follows:

1. Cost accounting helps in periods of trade depression and trade competition. In periods oftrade depression, the organization cannot afford to have wastages which pass unchecked. Themanagement must know areas where economies may be sought, waste eliminated andefficiency increased. The organization must wage a war not only for its survival but alsocontinued growth. The management should know the actual cost of their products beforeembarking on any scheme of price reduction. Adequate system of costing facilitates this.
2. Cost accounting aids price fixation. Although the law of supply and demand determines theprice of the product, cost to the producer does play an important role. The producer can takenecessary guidance from his costing records in case he is in a position to fix or change the pricecharged.
3. Cost accounting helps in making estimates. Adequate costing records provide a reliable basisfor making estimates and quoting tenders.
4. Cost accounting helps in channelizing production on right lines. Proper costing informationmakes it possible for the management to distinguish between profitable and non-profitableactivities; profits can be maximized by concentrating on profitable operations and eliminatingnon-profitable ones.
5. Cost accounting eliminates wastages. As cost accounting is concerned with detailed breakup
of costs, it is possible to check various forms of wastages or losses.6. Cost accounting makes comparisons possible. Proper maintenance of costing records
provides various costing data for comparisons which in turn helps the management informulating future lines of action.
7. Cost accounting provides data for periodical Profit and Loss Account. Adequate costingrecords provide the management with such data as may be necessary for preparation of Profitand Loss Account and Balance Sheet at such intervals as may be desired by the management.
8. Cost accounting helps in determining and enhancing efficiency. Losses due to wastage ofmaterials, idle time of workers, poor supervision etc will be disclosed if the various operationsinvolved in the production are studied carefully. Efficiency can be measured, cost controlledand various steps can be taken to increase the efficiency.
9. Cost accounting helps in inventory control. Cost accounting furnishes control whichmanagement requires, in respect of stock of materials, work in progress and finished goods.
b) Costing as an aid to Creditors.
Investors, banks and other money lending institutions have a stake in the success of thebusiness concern are therefore benefitted immensely by the installation of an efficientsystem of costing. They can base their judgment about the profitability and future prospectsof the enterprise on the costing records.
c) Costing as an aid to employees.
Employees have a vital interest in their employer’s enterprise in which they are employed.They are benefited by a number of ways by the installation of an efficient system of costing.They are benefited, through continuous employment and higher remuneration by way ofincentives, bonus plans, etc.

d) Costing as an aid to National Economy
An efficient system of costing brings prosperity to the business enterprise which in turnbrings prosperity to the business enterprise which in turn results in stepping up of thegovernment revenue. The overall economic development o f a country takes place as aconsequence of increase in efficiency of production. Control of costs, elimination ofwastages and inefficiencies led to the progress of the industry and, in consequence of thenation as a whole.
Cost units- The Chartered Institute of Management Accountants, London, defines a unit of cost as“a unit of quantity of product, service or time in relation to which costs may be ascertained orexpressed”.
The forms of measurement used as cost units are usually the units of physical measurements likenumber, weight, area, length, value, time etc.
Following are some examples of cost unit.
Industry/product Cost unit basis
Automobile Numbers
Brick works per 1000 bricks
Cement per Tonne
Chemicals Litre, gallon, kilogram, ton
Steel Tonne
Sugar Tonne
Transport Passenger-kilometre, tonne kilometer
Cost centre – According to Chartered Institute of Management Accountants, London, cost centremeans “a location, person or item of equipment (or group of these) for which costs may beascertained and used for the purpose of cost control”. Cost centre is the smallest organizational sub-unit for which separate cost collection is attempted. Thus cost centre refers to one of the convenientunit into which the whole factory organization has been appropriately divided for costing purposes.Each such unit consists of a department or a sub-department or item of equipment or , machinery ora person or a group of persons.
For example, although an assembly department may be supervised by one foreman, it may containseveral assembly lines. Some times each assembly line is regarded as a separate cost centre with itsown assistant foreman.
The selection of suitable cost centres or cost units for which costs are to be ascertained in anundertaking depends upon a number of factors which are listed as follows.
1. Organization of the factory2. Conditions of incidence of cost3. Requirements of the costing system ie. Suitability of the units or centres for cost purposes.4. Availability of information5. Management policy regarding making a particular choice from several alternatives.

Profit centre – A profit centre is that segment of activity of a business which is responsible for
both revenue and expenses and discloses the profit of a particular segment of activity. Profit centres
are created to delegate responsibility to individuals and measure their performance.
Difference between Profit centre and Cost centre
The various points of difference between Profit centre and cost centre are as follows. Cost centreis the smallest unit of activity or area of responsibility for which costs are collected whereas a profitcentre is that segment of activity of a business which is responsible for both revenue and expenses.
(i) Cost centres are created for accounting conveniences of costs and their controlwhereas as a profit centre is created because of decentralization of operations i.e., todelegate responsibility to individuals who have greater knowledge of local conditionsetc.
(ii) Cost centers are not autonomous whereas profit centres are autonomous.(iii) A cost centre does not have target cost but efforts are made to minimize costs, but
each profit centre has a profit target and enjoys authority to adopt such policies as arenecessary to achieve its targets.
(iv) There may be a number of cost centres in a profit centre in a profit centre asproduction or service cost centres or personal or impersonal but a profit centre may be asubsidiary company within a group or division in a company.
Cost classificationCosts can be classified or grouped according to their common characteristics. Proper
classification of costs is very important for identifying the costs with the cost centers or cost units.The same costs are classified according to different ways of costing depending upon the purpose tobe achieved and requirements of a particular concern. The important ways of classification are:1. By Nature or Elements. According to this classification the costs are classified into three
categories i.e., Materials, Labour and Expenses. Materials can further be sub-classified as rawmaterials components, spare parts, consumable stores, packing materials etc. This helps infinding the total cost of production and the percentage of materials (labour or other expenses)constituted in the total cost. It also helps in valuation of work-in-progress.
2. By Functions: This classification is on the basis of costs incurred in various functions of anorganization ie. Production, administration, selling and distribution. According to thisclassification, costs are divided into Manufacturing and Production Costs and Commercialcosts.
Manufacturing and Production Costs are costs involved in manufacture, construction andfabrication of products.
Commercial Costs are (a) administration costs (b) selling and distribution costs.
3. By Degree of Traceability to the Product : According to this, costs are divided indirect costsand indirect costs. Direct Costs are those costs which are incurred for a particular product andcan be identified with a particular cost centre or cost unit. Eg:- Materials, Labour. IndirectCosts are those costs which are incurred for the benefit of a number of cost centre or cost unitsand cannot be conveniently identified with a particular cost centre or cost unit. Eg:- Rent ofBuilding, electricity charges, salary of staff etc.

4. By Changes in Activity or Volume: According to this costs are classified according to theirbehavior in relation to changes in the level of activity or volume of production. They are fixed,variable and semi-variable. Fixed Costs are those costs which remain fixed in total amount withincrease or decrease in the volume of the output or productive activity for a given period oftime. Fixed Costs per unit decreases as production increases and vice versa. Eg:- rent, insuranceof factory building, factory manager’s salary etc. Variable Costs are those costs which vary indirect proportion to the volume of output. These costs fluctuate in total but remain constant perunit as production activity changes. Eg:- direct material costs, direct labour costs, power, repairsetc. Semi-variable Costs are those which are partly fixed and partly variable. For example;Depreciation, for two shifts working the total depreciation may be only 50% more than that forsingle shift working. They may change with comparatively small changes in output but not inthe same proportion.
5. Association with the Product: Cost can be classified as product costs and period costs.Product costs are those which are traceable to the product and included in inventory cost, thusproduct cost is full factory cost. Period costs are incurred on the basis of time such as rent,salaries etc. thus it includes all selling and administration costs. These costs are incurred for aperiod and are treated as expenses.
6. By Controllability: The CIMA defines controllable cost as “a cost which can be influenced bythe action of a specified member of an undertaking” and a non-controllable cost as “a costwhich cannot be influenced by the action of a specified member of an undertaking”.
7. By Normality: There are normal costs and abnormal costs. Normal costs are the costs whichare normally incurred at a given level of output under normal conditions. Abnormal costs arecosts incurred under abnormal conditions which are not normally incurred in the normal courseof production.Eg:- damaged goods due to machine break down, extra expenses due todisruption of electricity, inefficiency of workers etc.
8. By Relationship with Accounting Period: There are capital and revenue expenses dependingon the length of the period for which it is incurred. The cost which is incurred in purchasing anasset either to earn income or increasing the earning capacity of the business is called capitalcost, for example, the cost of a machine in a factory. Such cost is incurred at one point of timebut the benefits accruing from it are spread over a number of accounting years. The cost whichis incurred for maintaining an asset or running a business is revenue expenditure. Eg:- cost ofmaterials, salary and wages paid, depreciation, repairs and maintenance, selling anddistribution.
9. By Time..Costs can be classified as 1) Historical cost and 2) Predetermined Costs.The costs which are ascertained and recorded after it has been incurred is called historical costs.
They are based on recorded facts hence they can be verified and are always supported byevidences. Predetermined costs are also known as estimated costs as they are computed inadvance of production taking into consideration the previous periods’ costs and the factorsaffecting such costs. Predetermined costs when calculated scientifically become standard costs.Standard costs are used to prepare budgets and then the actual cost incurred is later-oncompared with such predetermined cost and the variance is studied for future correction.
Types, Methods and Techniques of Costing
The general fundamental principles of ascertaining costs are the same in every system ofcost accounting, but the methods of analysis and presenting the costs vary from industry toindustry. Different methods are used because business enterprises vary in their nature and in thetype of products or services they produce or render. Basically, there are two principal methods ofcosting, namely (i) Job Costing, and (ii) Process costing.
1. Job costing: It refers to a system of costing in which costs are ascertained in terms of specificjobs or orders which are not comparable with each other. Industries where this method ofcosting is generally applied are Printing Process, Automobile Garages, Repair Shops, Ship-building, House building, Engine and Machine construction, etc. Job Costing includes thefollowing methods of costing:
(a) Contract Costing: Although contract costing does not differ in principle from job costing, it isconvenient to treat contract cost accounts separately. The term is usually applied to the costingmethod adopted where large scale contracts at different sites are carried out, as in the case ofbuilding construction.
(b) Bach Costing: This method is also a type of job costing. A batch of similar products is regardedas one job and the cost of this complete batch is ascertained. It is then used to determine the unitcost of the articles produced. It should, however, be noted that the articles produced should notlose their identity in manufacturing operations.
(c) Terminal Costing: This method is also a type of job costing. This method emphasizes theessential nature of job costing, ie, the cost can be properly terminated at some point and relatedto a particular job.
(d) Operation Costing: This method is adopted when it is desired to ascertain the cost of carryingout an operation in a department, for example, welding. For large undertaking, it is frequentlynecessary to ascertain the cost of various operations.
2. Process Costing: Where a product passes through distinct stages or processes, the output of oneprocess being the input of the subsequent process, it is frequently desired to ascertain the cost ofeach stage or process of production. This is known as process costing. This method is usedwhere it is difficult to trace the item of prime cost to a particular order because its identity islost in volume of continuous production. Process costing is generally adopted in textileindustries, chemical industries, oil refineries, soap manufacturing, paper manufacturing,tanneries, etc.
3. Unit or single or output or single output costing: This method is used where a single articleis produced or service is rendered by continuous manufacturing activity. The cost of the wholeproduction cycle is ascertained as a process or series of processes and the cost per unit is arrivedat by dividing the total cost by the number of units produced. The unit of costing is chosenaccording to the nature of the product. Cost statements or cost sheets are prepared under whichvarious items of expenses are classified and the total expenditure is divided by total quantityproduced in order to arrive at unit cost of production. This method is suitable in industries likebrick-making, collieries, flour mills, cement manufacturing, etc. this method is useful for theassembly department in a factory producing a mechanical article eg. Bicycle.

4. Operating Costing: This method is applicable where services are rendered rather than goods
produced. The procedure is same as in the case of single output costing. The total expenses of
the operation are divided by the units and cost per unit of services is arrived at. This method is
employed in Railways, Road Transport, Water supply undertakings, Telephone services,
Electricity companies, Hospital services, Municipal services, etc.
5. Multiple or Complete Costing: Some products are so complex that no single system of costing
is applicable. It is used where there are a variety of components separately produced and
subsequently assembled in a complex production. Total cost is ascertained by computing
component costs which are collected by job or process costing and then aggregating the costs
through use of the single or output costing system. This method is applicable to manufacturing
concerns producing Motor Cars, Aeroplanes, Machine tools, Type-writers, Radios, Cycles,
Sewing Machines, etc.
6. Uniform Costing: It is not a distinct method of costing by itself. It is the name given to a
common system of costing followed by a number of firms in the same industry. This helps in
comparing performance of one firm with that of another.
7. Departmental Costing: When costs are ascertained department by department, the method is
called “Departmental Costing”. Usually, for ascertaining the cost of various goods or services
produced by the department, the total costs will have to be analysed, say, by the use of job
costing or unit costing.In addition to the above methods of costing, mention can be made of the following techniquesof costing which can be applied to any one of the above method of costing for special purposesof cost control and policy making:
a) Standard or Predetermined Costs.b) Marginal CostsElements of Cost- The management of an organization needs necessary data to analyze and
classify costs for proper control and for taking decisions for future course of action. Hence thetotal cost is analyzed by elements of costs ie by the nature of expenses. The elements of costsare three and they are materials, labour and other expenses. These can be further analyzed asfollows.

By grouping the above elements of cost, the following divisions of cost are obtained.
1. Prime cost = Direct Materials + Direct Labour+ Direct Expenses
2. Works or Factory Cost = Prime Cost + Works or Factory Overheads
3. Cost of Production = Works Cost + Administration Overheads
4. Total Cost or Cost of Sales = Cost of Production + Selling and Distribution Overheads
The difference between the cost of sales and selling price represents profit or loss.
1. Direct Materials are those materials which can be identified in the product and can beconveniently measured and directly charged to the product. For example, bricks in houses,wood in furniture etc. Hence all raw materials, materials purchased specifically for a job orprocess like glue for book making, parts or components purchased or produced like batteries forradios and tyres for cycles, and primary packing materials are direct materials.
2. Indirect Materials are those materials which cannot be classified as direct materials. Examplesare consumables like cotton waste, lubricants, brooms, rags, cleaning materials, materials forrepairs and maintenance of fixed assets, high speed diesel used in power generators etc.
3. Direct Labour is all labour expended in altering the construction, composition, confirmation orcondition of the product. Thus direct wages means the wages of labour which can beconveniently identified or attributed wholly to a particular job, product or process or expendedin converting raw materials into finished goods. Thus payment made to groups of labourersengaged in actual production, or carrying out of an operation or process, or supervision,maintenance, tools setting, transportation of materials, inspection, analysis etc is direct labour.
4. Direct Expenses are expenses directly identified to a particular cost centre. Hence expensesincurred for a particular product, job, department etc are direct expenses. Example royalty,excise duty, hire charges of a specific plant and equipment, cost of any experimental workcarried out especially for a particular job, travelling expenses incurred in connection with aparticular contract or job etc.
5. Overheads may be defined as the aggregate of the cost of indirect materials, indirect labour andsuch other expenses including services as cannot conveniently be charged direct ot specific costunits. Overheads may be sub-divided into (i) Manufacturing Overheads; (ii) AdministrationOverheads; (iii) Selling Overheads; (iv) Distribution Overheads; (v) Research and DevelopmentOverheads.
Cost sheet or Statement of Cost: When costing information is set out in the form of a statement, itis called “Cost Sheet”. It is usually adopted when there is only one main product and all costsalmost are incurred for that product only. The information incorporated in a cost sheet woulddepend upon the requirement of management for the purpose of control.
MaterialsMaterials: - The materials are a major part of the total cost of producing a product and are one ofthe most important assets in majority of the business enterprises. Hence the total cost of a productcan be controlled and reduced by efficiently using materials.
The materials are of two types, namely:
(i) Direct materials: The materials which can be easily identified and attributable to the individualunits being manufactured are known as direct materials. These materials also form part offinished products. All costs which are incurred to obtain direct materials are known as directmaterial costs.
(ii) Indirect materials: Indirect materials, on the other hand, are those materials which are of smallvalue such as nuts, pins, screws, etc. and do not physically form part of the finished product.Costs associated with indirect materials are known as indirect material costs.
Factory supplies, office supplies and selling supplies are generally termed as stores.
Purchasing Control and Procedure: Purchasing is an art. Wrong purchases increase the cost ofmaterials, store equipments and the finished goods. Hence it is imperative that purchases should beeffectively, efficiently and economically performed.
Dr. Walters defines scientific purchasing as the “Procurement by purchase of the propermaterials, machinery, equipment and supplies of stores used in the manufacture of a product,adapted to marketing in the proper quantity and quality at the proper time and the lowest priceconsistent with the quality desired”.
According to Alford and Beatty, “Purchasing is the procuring of materials, supplies,machines tools and services required for the equipment, maintenance and operation of amanufacturing plant”.
The major objectives of scientific purchasing it to purchase the right quantity at the bestprice, materials purchased should suit the objective, production should not be held up,unnecessarily capital should not be locked up in stores, best quality of materials should bepurchased and company’s competitive position and its reputation for fairness and integrity shouldbe safeguarded.
Only scientific purchasing will help in achieving the above objectives. With proper plans,materials can be purchased at a lower price than competitors, turnover of investment in inventoriescan be high, purchasing department can advise regarding substitute materials, new products, changein trends, creating goodwill etc.
Methods of Purchasing
Purchasing can be broadly classified as centralized and localized purchasing.
(a) Centralized Purchasing: In a large organization, manufacturing units are many. In suchcases centralized purchasing is beneficial. The advantages of centralized purchasing are:1. Specialized and expert knowledge is available.2. Advantages arise due to bulk purchases.

Tender Nos.
Issued on.
3. The cost of purchasing can be reduced and selling price can be lowered.4. As there is good knowledge of market conditions, greater control can be exercised.5. When materials have to be imported, it is advantageous to centralize the buying.6. Economy and ease in compilation and consultation of results.7. It can take advantage of market changes.8. Investment in inventories can be reduced.9. Other advantages include undivided responsibility, consistent buying policies.
Factors to be considered when decision regarding centralization has to be taken aregeographical separation of plants, homogeneity of products, type of material bought,location of supplies etc.
(b) Decentralization of Purchases: The advantages of localized purchasing or decentralizationof purchases are:-
1. Each plant may have its own particular need. This can be given special attention.2. Direct contact can be established with suppliers.3. The time lag between indenting and receiving materials can be reduced.4. Technical requirements of each plant can be ascertained.
Purchase Procedure: The steps usually followed for purchase of materials may be enumerated asfollows:-
1. Indenting for materials : The stores department prepares indents for the purchase ofmaterials for replenishment of stocks (regular indents) or for a special job(special indents)and sends it to the purchase department. Regular indents are prepared periodically andplaced when the ordering level for different items of stocks are reached. The quantityindented is equal to the ordering quantity fixed for each item. The special indents are basedon the demands received either from the planning or production department.
XYZ Co. Ltd.MATERIAL PURCHASE INDENTDate: For the Period:Indent No: Demand Note No:Regular/SpecialSl.
No. DescriptionStores
Code No.Quantity
Last Pur.Order No.
Special remarks
Store KeeperFor Purchase Dept. Use

2. Issue of tenders to suppliers: The purchase department issue tenders to suppliers or publishthem in papers. The suppliers quote their terms of price and delivery/payment. After the lastdate for receipt of quotations is over, the tenders are opened and a comparative statement isprepared. Tenders are prepared in triplicate. Of them, two are sent to the suppliers and one isretained with the purchase department. The supplier mentions his terms in the original.
While considering the tenders, the reliability of the supplier has to be taken into account. Thequality of goods and time taken to deliver the goods on previous occasions should be checked.The financial stability and capacity to deliver goods should be ensured.
Sometimes purchases may be made without inviting quotations. The circumstances are whenprices are controlled, or purchases are made under long term contracts, or catalogue prices areavailable or when there is a cost plus contract. If purchase is made under cost plus profit basis,the cost composition and reasonableness of price should be checked.
INVITATION TO TENDERIndent No: Tender No:Date: Date:ToXYZ Co.Ltd.…………….…………….Dear Sirs,
The stores mentioned below are required to be delivered at our works godown. The terms andconditions of supply are mentioned overleaf. The first copy of this tender should be returned to usduly filled in before………………….
A security deposit of Rs…………should also accompany your reply which will be returned ifwe do not place an order with you.
Yours faithfully,
For ABC Co.Ltd.
ParticularsOf stores/Supplies
Quantityrequired
Place ofDelivery
Date ofdeliveryrequired
Quantitywhich canbe supplied
Rate
Per Unit Price
We agree to supply the above on terms mentioned below.Special conditions:Place: For XYZ Co. Ltd.
3. Placing of purchase orders: Normally six copies of purchase order are made. The supplier,stores, inspection department, store accounting section, purchase department and progressdepartment are sent one copy each.
The purchase order has legal and accounting significance. From legal point of view, it binds boththe parties to the terms of the contract. Form the accounting point of view; it signifies the

amount which has to be spent. It signifies the stores department to accept the goods and theaccounts department to accept the bill.
A.B.C. CO. LTD.
MATERIALS PURCHASE ORDER
Order No: Indent No: Store Receipt No:
Date: Quotation No: Inspection Note No:
To
……………….
……………….
This is in response to your quotation against our Tender No:…………….. The terms and
conditions mentioned overleaf will be applicable. Please supply the following items at the prices
indicated below:
Sl.No.
Description StoresCodeNo.
Specification Quantity Unit Price
Terms of Delivery: Please send bill to:
Terms of Payment:
Special Conditions: For A.B.C. Co. Ltd.
4. Inspection: The supplier delivers goods at the place specified. Two delivery challans areprepared by the supplier one of which is returned. It is a proof of delivery. After receivingthe goods, the inspection department or production department or maintenance department(as the case may be) is intimated.The inspector checks that the materials are in accordance with the quality required, standardexpected, tolerances allowed etc. After inspection an inspection note is prepared intriplicate, one copy is sent to the supplier, one to the stores, and one to the inspectiondepartment.
5. Receiving Stores: The stores department prepares a Stores Receipt Note for the quantity ofstock accepted in inspection. After issuing of the Stores Receipt, the Storekeeper is

responsible for the stocks. The stores receipt is the document for the posting of receipts inBin Card and the Stores Ledger. It is prepared in quadruplicate and sent to the supplier;stores accounting section and purchase department and one copy are retained with thestores. The supplier encloses this copy along with his bill. The stores accounting sectioncompares the note with the purchase order.
ABC CO. Ltd.
STORES RECEIPT NOTE
S.R. No: P.O.No: Inspection Note No:
Date: Date: Date:
Received form M/s under their delivery challan no: dated
the following items of stores against the above purchase order:
Stores
Code No:
Description Unit Quantity PriceValue
Posted in:-
Bin Card ………………. Stores Ledger………………… Signature of
Storekeeper……………….
6. Checking and passing of bills for payment: Bills received by the purchase department are
forwarded to the stores accounting section to check the authenticity regarding quantity and
price and the arithmetical accuracy. Special items included in the bills eg:- freight, packing
charges are verified with the purchase order. The bill is later passed for payment.Storekeeping: Store keeping is a service function. The storekeeper is a custodian of all the itemskept in the store. The stores should be maintained properly and cost minimized. The mainobjectives of store keeping are:-
i) To protect stores against lossesii) To keep goods ready for delivery/issueiii) To provide maximum service at minimum cost.
The duties and functions of Store-keeper can be summarized as follows:
i) Materials should be received, unloaded, inspected and then moved to stores. The materialshave to be stored in appropriate places and records the receipts in proper books.
ii) The stores records should be maintained in an efficient and orderly manner so that materialscan be easily located and information can be obtained for various departments.

iii) The stores should provide maximum protection and safety and accessibility and utilizeminimum space. Suitable storage devices should be installed.
iv) The materials should be given special covering to prevent damage due to atmosphericconditions.
v) All issues should be properly recorded, efficiently, promptly and accurately. All issuesshould be duly authorized and procedures laid down should be duly followed.
vi) The storekeeper is responsible for co-ordination with materials control according to thetype of production, size of the company, the organization structure etc.
vii) Ensure that all transactions are posted in the Bin Card see that the Bin Card is up-to-date.
viii) All items should be in its proper place.
ix) Maintenance of stores at required levels.
x) Neatness in stores to facilitate physical verification.
xi) Co-ordination and supervision of staff in the stores department.
xii) Periodical review of various scales, measuring instruments, conversion ratios etc.
xiii) Protect stores from fires, rust, erosion, dust, theft, weather, heat, cold, moisture anddeterioration etc.
Requisitioning for Stores
One of the duties of the storekeeper is to send requisitions for materials for replenishment in timeso that the production is not held up due to shortage of materials. The storekeeper should also seethat there is no unnecessary blocking of capital due to overstocking of materials. For this he keeps acheck on the re-order level, economic ordering quantity, and the maximum and minimum quantitywhich he is authorized to store in respect of each kind of material.(a) Re-ordering Level
Re-ordering level is that point of level of stock of a material where the storekeeper starts theprocess of initiating purchase requisition for fresh supplies of that materials. This level isfixed somewhere between the maximum and minimum levels in such a way that thedifference of quantity of the material between the re-ordering level and minimum level willbe sufficient to meet the requirements of production until the fresh supply of the materials isreceived.
Re-ordering Level= Minimum Level + Consumption during the time required to get thefresh delivery
According to Wheldon,Re-ordering Level= Maximum Level x Minimum re-order period.
Here, maximum re-order period means the maximum period taken to get the material oncethe order for new material is placed. Wheldon has taken the maximum period and maximumconsumption during that period so that factory may not stop production due to shortage ofmaterials.

(b) Economic Ordering QuantityThe quantity of material to be ordered at one time is known as economic ordering quantity. Thisquantity is fixed in such a manner as to minimize the cost of ordering and carrying the stock.The total costs of a material usually consist of:Total acquisition cost + total ordering cost + total carrying cost.Since the acquisition cost per unit of material is same whatever is the quantity purchased, it isusually excluded when deciding the quantity of a material to be ordered at one time. The onlycosts to be taken care of are the ordering costs and carrying costs which vary with the quantityordered.
Carrying Cost: It is the cost of holding the materials in the store and includes:
1. Cost of storage space which could have been utilized for some other purpose.2. Cost of bins and racks3. Cost of maintaining the materials to avoid deterioration.4. Amount of interest payable on the amount of money locked up in the materials.5. Cost of spoilage in stores and handling.6. Transportation cost in relation to stock.7. Cost of obsolescence of materials due to change in the process or product.8. Insurance cost9. Clerical cost etc.
In India all these costs amount to 20 to 25 % of the cost of materials per year. Hence itbecomes necessary to reduce such carrying cost for efficient operations.
Ordering Cost: It is the cost of placing orders for the purchase of materials and includes:
1. Cost of staff posted in the purchasing department, inspection section and stores accountsdepartment.
2. Cost of stationary postage and telephone charges.
Thus, this type of costs includes cost of floating tenders, cost of comparative evaluation ofquotations, cost of paper work, and postage involved in placing the order, cost of inspection andcost of accounting and making payments. In other words, the cost varies with the number of orders.
When the quantity of materials ordered is less, the cost of carrying will decrease but ordering cost
will increase and vice versa.
Q = 2ABCS
Q = Quantity to be orderedA = Consumption of the material concerned in units during a year.B = Cost of placing one order including the cost of receiving the goods i.e. the cost of getting an item
into the firms inventoryCS = Interest payment including variable cost of storing per unit per year i.e holding costs ofinventory.
c) Minimum Level or Safety Stock levelThe minimum level is the minimum quantity of the material which must be maintained in hand atall times. The quantity is fixed so that the production is not held up due to shortage of the

materials. In fixing this level, the following factors should be considered:1. Lead time i.e. time lag between indenting and receiving of the material. It is the time
required to replenish the supply.2. Rate of consumption of the material during the lead time.3. Nature of the material. Minimum level is not required in case of a special material which is
required against customer’s specific order.Formula for calculating minimum level or safety stock level given by Wheldon is as follows:Minimum Stock Level = Re-ordering level – (Normal consumption x Normal Re-order period)d) Maximum LevelIt is the maximum of stock which should be held in stock at any time during the year. The quantityis fixed so as to avoid overstocking as it leads to the following disadvantages.
1. Overstocking leads to increase in working capital requirement which could be profitableused somewhere else.
2. Overstocking will need more godown space, so more rent will have to be paid.3. It may also lead to obsolescence on account of overstocking.4. There are chances that the quality of materials will deteriorate because large stock will
require more time before they are consumed.5. There may be fear of depreciation in market values of the overstocked materials.
According to Wheldon,Maximum Stock level = Reordering level + Re-ordering Quantity –
(Minimum consumption x Minimum re-ordering period)e) Danger Level
This level means that level of stock at which normal issues of the material are stopped and issuesare made only under specific instructions. The purchase officer will make special arrangements toget the materials which reach at their danger levels so that the production may not stop due toshortage of materials.Danger Level = Average consumption x Max.re-order period for emergency purchases.f) Average Stock Level
The average stock level is calculated by the following formula:Average Stock Level = Minimum Stock Level + ½ of Re-order Quantity.Or ½ (Minimum Stock Level + Maximum Stock Level)
Stores (or Materials) records
In the stores the most important two records kept are bin cards and stores ledger.(a) Bin Card. A bin card is a record of the receipt and issue of material and is prepared by the
store keeper for each item of stores. A bin card is also known as bin tag or stock card and isusually kept in the rack where the material is kept. In a bin card not only the receipt andissue of material is recorded, minimum quantity, maximum quantity and ordering quantityare stated on the card. This helps the store keeper to send the material requisition for thepurchase of material in time.
(b) Stores Ledger: This ledger is kept in the costing department and is identical with the bincard except that receipts, issues and balances are shown along with their money values. Thisprovides the information for the pricing of materials issued and the money value at any timeof each item of stores.

Perpetual Inventory SystemThe Chartered Institute of Management Accountants, London, defines the perpetual inventory as “asystem of records maintained by the controlling department, which reflects the physical movementsof stocks and their current balance”. Thus this is a system in which, with the help of Bin Cards andStores Ledger, the balance of stock is ascertained after every receipt and issue of materials. This ishelps in avoiding closing down of firm for physical verification.Advantages of the Perpetual Inventory System
The following are the advantages of the perpetual inventory system:
1. It avoids the disruption of production for physical checking of all items of stores at the endof the year.
2. The preparation of Profit and Loss Account and Balance Sheet is possible without physicalverification of stock.
3. A detailed and more reliable control on the materials in store is obtained.4. As the work of recording and continuous stocktaking is carried out systematically and
without undue haste, the figures are more reliable.5. Continuous stocktaking will make the storekeeper and the stores accountant more vigilant in
their work and they will try to keep the records accurate and up-to-date.6. Planning of production can be done without any fear of shortage as the management is
constantly informed of the stores position.
7. An inbuilt system of internal check will be in operation as bin cards and the stores ledgerkeep a check on each other.
8. Errors and shortage of stock are readily discovered and efforts are made to avoid theshortage of stock in future.
9. The capital invested in the stores can be kept under control and efficiently used as stock canbe compared with the minimum and maximum levels.
10. It makes available correct stock figures for claim to be lodged with the insurance companyfor loss on account of stock destroyed by fire.
ABC Analysis
Under ABC Analysis, the materials in stock are divided into three categories for the purpose ofcontrol. Generally it is seen that the materials which constitute the least percentage of items in stockmay contribute to a large percentage of value and a large percentage of items may represent asmaller percentage of value of items consumed. Between these two items are those items, thepercentage of which is more or less equal to their value in consumption. Items falling in the firstcategory are treated as ‘A’ items, of the second category as ‘B’ items and items of the thirdcategory are taken as ‘C’ items. Such an analysis of material is known as ABC analysis. Thistechnique of stock control is also known as stock control according to value method or AlwaysBetter Control method or Proportional Parts Value Analysis method. Thus, under this technique ofmaterial control, materials are listed in ‘A’, ‘B’ and ‘C’ categories in descending order based onmoney value of consumption.
Issue of materialsMaterials issued from stores are debited to the jobs or work orders which received them andcredited to the materials account. These jobs are debited with the value of materials issued to them.
But what is the value of materials? Theoretically the value includes the invoice price less tradediscount, the freight, cartage, octroi and insurance on incoming materials, expenses of purchase,receiving, storing and record keeping and carriage from the stores up to the process plant. However,in practice, it involves minute calculations for including all these expenses and is a big taskcompared to the benefit derived from it.
Moreover the price changes according to the market conditions and at any given time there will bestock of materials purchased at different times at different prices. Hence the problem as to at whatprice the materials should be issued?
There are many methods of pricing material issues. The most important being: FIFO, LIFO,simple and weighed average methods.
1) First in First Out (FIFO)Under this method material is first issued from the earliest consignment on hand and pricedat the cost at which that consignment was placed in the stores. In other words, materialsreceived first are issued first. The units in the opening stock of materials are treated asif they are issued first, the units from the first purchase issued next, and so on until theunits left in the closing stock of materials are valued at the latest cost of purchases.This method is most suitable in times of falling prices because the issue price of materialsto jobs or work order will be high while the cost of replacement of materials will be low.But in case of rising prices this method is not suitable because the issue price of materialsto production will be low while the cost of replacement of materials will be high.The following example will illustrate how issues of materials are valued under this method.
2) Last in Last Out (LILO)
Under this method, issues are priced in the reverse order of purchase i.e., the prices of thelatest available consignment is taken. This method is suitable in times of rising pricesbecause material will be issued from the latest consignment at a price which isclosely related to the current price levels. Valuing material issues at the price of the latestavailable consignment will help the management in fixing the competitive selling prices ofthe products.
4) Weighted Average Methods
In this method, price is calculated by dividing the total cost of materials in the stock from
which the materials to be priced could be drawn by the total quantity of materials in that
stock.
In the periods of heavy fluctuations in the prices of materials, the average cost method
gives better results because it tends to smooth out the fluctuations in prices by taking the
average of prices of various lots in stock.


Scanned by CamScanner

Scanned by CamScanner

Scanned by CamScanner

Scanned by CamScanner

Scanned by CamScanner
Scanned by CamScanner

Scanned by CamScanner

Scanned by CamScanner

Scanned by CamScanner

Scanned by CamScanner

Scanned by CamScanner

Scanned by CamScanner

Scanned by CamScanner

Scanned by CamScanner

Scanned by CamScanner

Scanned by CamScanner
Scanned by CamScanner

Scanned by CamScanner

Scanned by CamScanner

Scanned by CamScanner

Scanned by CamScanner

Scanned by CamScanner

Scanned by CamScanner

UNIT - II
Labour
Labour cost is a second major element of cost. The control of labour cost and its accounting is verydifficult as it deals with human element. Labour is the most perishable commodity and as suchshould be effectively utilized immediately.
Importance of Labour Cost Control
Labour is of two types (a) direct labour, (b) indirect labour. Direct Labour is that labour which isdirectly engaged in the production of goods or services and which can be conveniently allocated tothe job, process or commodity or process. For example labour engaged in spinning department canbe conveniently allocated to the spinning process.Indirect Labour is that labour which is not directly engaged in the production of goods and servicesbut which indirectly helps the direct labour engaged in production. The examples of indirect labourare supervisors, sweepers, cleaners, time-keepers, watchmen etc. The cost of indirect labour cannotbe conveniently allocated to a particular job, order, process or article.The distinction between direct and indirect labour must be observed carefully because payment ofdirect labour is a direct expenditure and is a part of prime cost whereas payment of indirect labouris an item of indirect expenditure and is shown as works, office, selling and distribution expenditureaccording to the nature of the time spent by the indirect worker.Management is interested in the labour costs due to the following reasons.
To use direct labour cost as a basis for increasing the efficiency of workers.
To identify direct labour cost with products, orders, jobs or processes for ascertaining thecost of every product, order, or process.
To use direct labour cost as a basis for absorption of overhead, if percentage of direct labourcost to overhead is to be used as a method of absorption of overhead.
To determine indirect labour cost to be treated as overhead and To reduce the labour turnover.
Hence control of labour cost is an important objective of management and the realization ofthis objective depends upon the co-operation of every member of the supervisory force fromthe top executive to foremen.
Time keeping
Time-keeping will serve the following purposes:1. Preparation of Pay Rolls in case of time-paid workers.2. Meeting the statutory requirements.3. Ensuring discipline in attendance.4. Recording of each worker’s time ‘in’ and ‘out’ of the factory making distinction between
normal time, overtime, late attendance, early leaving.5. For overhead distribution when overheads are absorbed on the basis of labour hours.
Methods of Time-keeping
There are two methods of time-keeping. They are the manual methods and themechanicalmethods. Whichever method is used it should make a correct record of the time and themethod should be cost effective and minimize the risk of fraud.
The manual methods of time keeping are as follows:

a) Attendance Register Method, and
b) Metal Disc Method
Attendance Register Method
This is the traditional method where an attendance register or muster roll is kept at the time officenear the factory gate or in each department. The timekeeper records the name of the worker, theworker’s number, the department in which he is working, the rate of wages, the time of arrival anddeparture, normal time and overtime. If the workers are literate, they may make a record of timethemselves in the presence of a time-keeper or foreman.
This method is simple and inexpensive and can be used in small firms where the number of workersis not large. However recording the time of workers who work at customers’ premises and placeswhich are situated at a distance from the factory is not practical in this method.
Metal Disc Method
Under this method, each worker is allotted a metal disc or a token with a hole bearing hisidentification number. A board is kept at the gate with pegs on it and all tokens are hung on thisboard. These boards can be maintained separately for each department so that the workers canremove the token without delay and put it in a tray or box kept near the board. Immediately afterthe scheduled time for entering the factory, the box is removed and the latecomers will have to givetheir tokens to the timekeeper and their exact time of arrival is recorded. The tokens or disc left onthe board will represent the absentee workers. Later the timekeeper records the attendance in theattendance register and subsequently it is passed on to the Pay Roll Department.
Mechanical Methods
The mechanical methods that are generally used for the recording of time of workers may be asfollows:
(a) Time Recording Clocks
(b) Dial Time Records
Time Recording ClocksThe time recording clock is a mechanical device which automatically records the time of theworkers. Under this method, each worker is given a Time Card which is kept in a tray near thefactory gate and as the worker enters the gate, he picks up his card from the tray, puts it in the timerecording clock which prints the exact time of arrival in the proper space against the particular day.This procedure is repeated for recording time of departure for lunch, return from lunch and time ofleaving the factory in the evening. Late arrivals and overtime are recorded in red to attract theattention of the management.
Dial Time Records
Under this method, a dial time recorder machine us used. It has a dial with number of holes (usuallyabout 150) and each hole bears a number corresponding to the identification number of the workerconcerned. There is one radial arm at the centre of the dial. As a worker enters the factory gate, heis to press the radial arm after placing it at the hole of his number and his time will automatically berecorded on roll of a paper inside the dial time recorder against the number. The sheet on which thetime is recorded provides a running account of the worker’s time and it can calculate the number ofhours and prepare the wage sheets. However, the high installation cost of the dial time recorder andits use for only a limited number of worker are the drawbacks of this method.

Time Booking
Time booking is the recording of time spent by the worker on different jobs or work orders carriedout by him during his period of attendance in the factory. The objects of time booking are:
1. To ensure that time spent by a worker in a factory is properly utilized on different jobs orwork orders.
2. To ascertain the labour cost of each individual job or work order.
3. To provide a basis for the apportionment of overhead expenses over various jobs or workorders when the method for the allocation of overheads depends upon time spent ondifferent jobs.
4. To ascertain unproductive time or idle time so as to make efforts to keep it in limit.
5. To know the time taken to complete a particular job so that bonus can be paid as per theincentive schemes.
6. To know the efficiency of workers, it is necessary to make the comparison of actual timetaken with time allowed for completing a particular task.
Following documents are generally used for time booking:
1. Daily Time Sheets2. Weekly Time Sheets3. Job Tickets or Job Cards.
Daily time sheets are given to each worker where he records the time spent by him on each job orwork order. Weekly time sheets record the same particulars for a week and hence one card isrequired for a week. Job cards are used to keep a close watch on the time spent by a worker on eachjob so that the labour cost of a job may be conveniently ascertained.
Idle Time
There is always a difference between the time booked to different jobs or work orders and the time
recorded at the factory gate. This difference is known as idle time. Idle time is of two types.
(a) Normal Idle Time
(b) Abnormal Idle Time
Normal Idle Time: This represents the time, the wastage of which cannot be avoided and,therefore, the employer must bear the labour cost of this time. But every effort should be made toreduce it to the lowest possible level. Examples of normal idle time are: time taken in going fromthe factory gate to the department in which the worker is to work and back at the end of the day,time taken in picking up the work for the day, time between the completion of one work and thestart of another work, time taken for personal needs like tea or toilet, time taken for machinemaintenance, time taken for waiting for instructions, printouts, machine set-up time etc.Normal Idle Time is unavoidable cost as such should be included in cost of production. The cost ofnormal idle time can be treated as an item of factory expenses and recovered as an indirect chargeor added to labour cost.
Abnormal Idle Time: It is that time the wastage of which can be avoided if proper precautions aretaken. Example: time wasted due:- to breakdown of machinery on account of inefficiency of theworks engineer, failure of the power supply, shortage of materials, waiting for instructions, waitingfor tools and raw materials, strikes or lock-outs in the factory.

It is a principle of costing that all abnormal expenses and losses should not be included in costs andas such wages paid for abnormal idle time should not form part of the cost of production. Hence itis debited to Costing Profit and Loss Account.
Over Time: - It is the work done beyond the normal working period in a day or week. For overtimedone, the workers are given double the wages for the overtime done. The additional amount paid onaccount of overtime is known as overtime premium.Overtime increases the cost of production and should not be encouraged as it has the followingdisadvantages.
1. Overtime is paid at higher rate.
2. Overtime is done at late hours when workers have become tired and efficiency will it be asmuch as during the normal working hours.
3. Workers will develop the habit of working slowly during normal hours and complete thework using overtime to earn more wages.
4. Expenses like lighting, cost of supervision, and wear and tear of machines will increasedisproportionately.
Overtime should be recorded separately and thoroughly investigated to see that it is incurred onlywhen genuinely required.
The treatment of overtime depends on the situation. If overtime is incurred for because of thesequence of jobs, then normal wages is charged to labour cost for the overtime also but if it is arush job, then the overtime wages is added to the cost of labour. On the other hand if overtimearises due to any abnormal reason like breakdown of machinery or power failure, overtimepremium is excluded from the cost of production and is debited to the Costing Profit and LossAccount.
System of Wage Payment
There is no single method of wage payment which is acceptable both to the employers and theworkers. The system of wages should result into higher production, improved quality of output anda contented labour force.
There are two principal wage systems: (i) Payment on the basis of time spent in the factoryirrespective of the amount of work done. This method is known as time wage system. (ii) Paymenton the basis of the work done irrespective of the time taken by the worker. This method is calledpiece rate system.Other methods called premium plans or bonus and profit sharing schemes are used with either ofthe two principal methods of wage payment.Time Wage SystemUnder this method of wage payment, the worker is paid at an hourly, daily, weekly or monthly rate.This payment is made according to the time worked irrespective of the work done.This method is highly suitable for following types of work:
1. Where highly skilled and apprentices are working.2. Where quality of goods produced is of extreme importance eg., artistic goods3. Where the speed of work is beyond the control of the workers.4. Where close supervision of work is possible.5. Where output cannot be measured.

The disadvantages of this method are:
1. Workers are not motivated.2. Workers will get payment for idle time.3. Efficient workers will become inefficient in the long run as all of them get same wages.4. Employer finds it difficult to calculate labour cost per unit as it varies as production
increases and decreases.5. Strict supervision is necessary to get the work done.6. Inefficiency results in upsetting the production schedule and increases the cost per unit.7. It will encourage a tendency among workers to go slow so as to earn overtime wages.
Thus this method does not establish a proportionate relationship between effort and reward and theresult is that it is not helpful in increasing production and lowering labour cost per unit.
Piece Rate System (payment by result)Under this system of wage payment, a fixed rate is paid for each unit produced, job completed or anoperation performed. Thus, payment is made according to the quantity of work done noconsideration is given to the time taken by the workers to perform the work.
There are four variants of this system.a) Straight piece rate systemb) Taylor’s differential piece rate systemc) Merrick’s multiple piece rate systemd) Gant’s task and bonus plan
(a) Straight piece rate system
Payment is made as per the number of units produced at a fixed rate per unit. Another method ispiece rate with guaranteed time rate in which the worker is given time rate wages if his piece ratewages is less than the time rate.
Advantages
1. Wages are linked to output so workers are paid according to their merits.2. Workers are motivated to increase production to earn more wages.3. Increased production leads to decreased cost per unit of production and hence profit per unit
increases.4. Idle time is not paid for and is minimized.5. The employer knows his exact labour cost and hence can make quotations confidently.6. Workers use their tools and machinery with a greater care so that the production may not be
held up on account of their defective tools and machinery.7. Less supervision is required because workers get wages for only the units produced.8. Inefficient workers are motivated to become efficient and earn more wages by producing more.
Disadvantages
1. Fixing of piece work rate is difficult as low piece rate will not induce workers to increaseproduction.
2. Quality of output will suffer because workers will try to produce more quickly to earn morewages.
3. There may not be an effective use of material, because of the efforts of workers to increase theproduction. Haste makes waste. Thus there will be more wastage of material.
4. When there is increased production, there may be increased wastage of materials, high cost ofsupervision and inspection and high tools cost and hence cost of production might increase.

5. Increased production will not reduce the labour cost per unit because the same rate will be paidfor all units. On the other hand, increased production will reduce the labour cost per unit underthe time wage system.
6. Workers have the fear of losing wages if they are not able to work due to some reason.
7. Workers may work for long hours to earn more wages, and thus, may spoil their health.
8. Workers may work at a very high speed for a few days, earn good wages and then absentthemselves for a few days, upsetting the uniform flow of production.
9. Workers in the habit of producing quality goods will suffer because they will not get any extraremuneration for good quality.
10. The system will cause discontentment among the slower workers because they are not able toearn more wages.
This method can be successfully applied when:
1. The work is of a repetitive type.
2. Quantity of output can be measured.
3. Quality of goods can be controlled.
4. It is possible to fix an equitable and acceptable piece rate
5. The system is flexible and rates can be adjusted to changes in price level.6. Materials, tools and machines are sufficiently available to cope with the possible increase in
production.
7. Time cards are maintained so that workers are punctual and regular so that production may
not slow down.
(b) Taylor’s Differential Piece Rate system
This system was introduced by Taylor, the father of scientific management to encourage theworkers to complete the work within or less than the standard time. Taylor advocated twopiece rates, so that if a worker performs the work within or less than the standard time, he ispaid a higher piece rate and if he does not complete the work within the standard time, he isgiven a lower piece rate.
c) Merrick’s Multiple Piece Rate System
This method seeks to make an improvement in the Taylor’s differential piece rate system. Underthis method, three piece rates are applied for workers with different levels of performance. Wagesare paid at ordinary piece rate to those workers whose performance is less than 83% of the standardoutput, 110% of the ordinary piece rate is given to workers whose level of performance is between83% and 100% of the standard and 120% of the ordinary piece rate is given to workers whoproduce more than 100% of the standard output.
This method is not as harsh as Taylor’s piece rate because penalty for slow workers is relativelylower.
Premium and Bonus Plan
The object of a premium plan is to increase the production by giving an inducement to the workersin the form of higher wages for less time worked.
Under a premium plan, a standard time is fixed for the completion of a specific job or operation at
an hourly rate plus wages for a certain fraction of the time saved by way of a bonus. The plan is
also known as incentive plan because a worker has the incentive to earn more wages by completing
the work in less time.
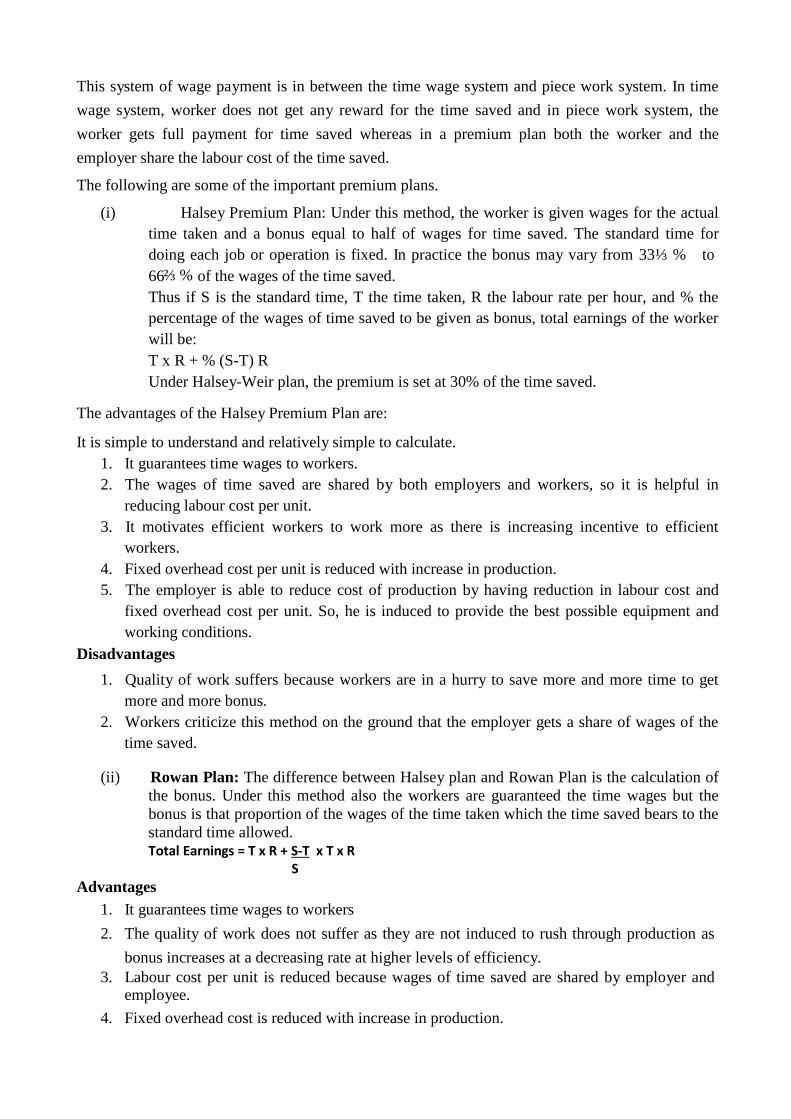
This system of wage payment is in between the time wage system and piece work system. In time
wage system, worker does not get any reward for the time saved and in piece work system, the
worker gets full payment for time saved whereas in a premium plan both the worker and the
employer share the labour cost of the time saved.
The following are some of the important premium plans.
(i) Halsey Premium Plan: Under this method, the worker is given wages for the actualtime taken and a bonus equal to half of wages for time saved. The standard time fordoing each job or operation is fixed. In practice the bonus may vary from 33⅓ % to66⅔ % of the wages of the time saved.Thus if S is the standard time, T the time taken, R the labour rate per hour, and % thepercentage of the wages of time saved to be given as bonus, total earnings of the workerwill be:T x R + % (S-T) RUnder Halsey-Weir plan, the premium is set at 30% of the time saved.
The advantages of the Halsey Premium Plan are:
It is simple to understand and relatively simple to calculate.1. It guarantees time wages to workers.2. The wages of time saved are shared by both employers and workers, so it is helpful in
reducing labour cost per unit.3. It motivates efficient workers to work more as there is increasing incentive to efficient
workers.4. Fixed overhead cost per unit is reduced with increase in production.5. The employer is able to reduce cost of production by having reduction in labour cost and
fixed overhead cost per unit. So, he is induced to provide the best possible equipment andworking conditions.
Disadvantages
1. Quality of work suffers because workers are in a hurry to save more and more time to getmore and more bonus.
2. Workers criticize this method on the ground that the employer gets a share of wages of thetime saved.
(ii) Rowan Plan: The difference between Halsey plan and Rowan Plan is the calculation ofthe bonus. Under this method also the workers are guaranteed the time wages but thebonus is that proportion of the wages of the time taken which the time saved bears to thestandard time allowed.Total Earnings = T x R + S-T x T x R
SAdvantages
1. It guarantees time wages to workers
2. The quality of work does not suffer as they are not induced to rush through production as
bonus increases at a decreasing rate at higher levels of efficiency.3. Labour cost per unit is reduced because wages of time saved are shared by employer and
employee.
4. Fixed overhead cost is reduced with increase in production.

Disadvantages1. The Rowan plan is criticized by workers on the ground that they do not get the full benefit
of the time saved by them as they are paid bonus for a portion of the time saved.
2. The Rowan plan suffers from another drawback that two workers, one very efficient and theother not so efficient, may get the same bonus.
OVERHEADSCost related to a cost center or cost unit may be divided into two ie. Direct and Indirect cost. TheIndirect cost is the overhead cost and is the total of indirect material cost, indirect labour cost,indirect expenses. CIMA defines indirect cost as “expenditure on labour, materials or serviceswhich cannot be economically identified with a specific salable cost per unit”. Indirect costs arethose costs which are incurred for the benefit of a number of cost centers or cost units. So anyexpenditure over and above prime cost is known as overhead. It is also called ‘burden’,‘supplementary costs’, ‘on costs’, ‘indirect expenses’.
Classification of Overheads
Overheads can be classified on the following basis:
i) Function-wise classification: Overheads can be divided into the following categories onfunctional basis.
(a) Manufacturing or production overheads eg:- indirect materials like lubricants, cottonwastes, indirect labour like salaries and wages of supervisors, inspectors,storekeepers, indirect expenses like rent, rates and insurance of factory, power,lighting of factory, welfare expenses like canteen, medical etc.
(b) Administration overheads eg:- indirect materials like office stationery and printing,indirect labour salaries of office clerks, secretaries, accountants, indirect expensesrent, rates and insurance of office, lighting heating and cleaning of office, etc.
(c) Selling and Distribution overheads eg:- indirect materials like catalogues, printing,stationery, price list, indirect salary of salesmen, agents, travellers, sales managers,indirect expenses like rent, rates and insurance of showroom, finished goods,godown etc., advertising expenses, after sales service, discounts, bad debts etc.
ii) Behavior-wise classification: Overheads can be classified into the following categories asper behavior pattern.
(a) Fixed overheads like managerial remuneration, rent of building, insurance ofbuilding, plant etc.
(b) Variable overheads like direct material and direct labour.
(c) Semi-variable overheads like depreciation, telephone charges, repair andmaintenance of buildings, machines and equipment etc.
iii) Element-wise classification: Overheads can be classified into the following categories asper element.
(a) Indirect materials(b) Indirect labour(c) Indirect expenses

Allocation and Apportionment of Overhead to Cost Centres (Depart-mentalisation ofOverhead)
When all the items are collected properly under suitable account headings, the next step isallocation and apportionment of such expenses to cost centres. This is also known asdepartmentalization or primary distribution of overhead.
A factory is administratively divided into different departments like Manufacturing orProducing department, Service department, partly producing departments.
Allocation of Overhead Expenses
Allocation is the process of identification of overheads with cost centres. An expense which isdirectly identifiable with a specific cost centre is allocated to that centre. Thus it is allotment of awhole item of cost to a cost centre or cost unit. For example the total overtime wages of workers ofa department should be charged to that department. The electricity charges of a department ifseparate meters are there should be charged to that particular department only.
Apportionment of Overhead Expenses
Cost apportionment is the allotment of proportions of cost to cost centres or cost units. If a cost isincurred for two or more divisions or departments then it is to be apportioned to the differentdepartments on the basis of benefit received by them. Common items of overheads are rent andrates, depreciation, repairs and maintenance, lighting, works manager’s salary etc.
Basis of Apportionment
Suitable bases have to be found out for apportioning the items of overhead cost to production andservice departments and then for reapportionment of service departments costs to other service andproduction departments. The basis selected should be correlated to the expenses and the expenseshould be measurable by the basis. This process of distribution of common expenses over thedepartments on some equitable basis is known as ‘Primary Distribution’.The following are the main bases of overhead apportionment utilized in manufacturing concerns:
Direct Allocation. Under direct allocation, overheads are directly allocated to the department forwhich it is incurred. Example overtime premium of workers engaged in a particular department,power, repairs of a particular department etc.
(i) Direct Labour/Machine Hours. Under this basis, overhead expenses are distributed tovarious departments in the ratio of total number of labour or machine hours worked ineach department. Majority of general overhead items are apportioned on this basis.
(ii) Value of materials passing through cost centres. This basis is adopted for expensesassociated with material such as material handling expenses.
(iii) Direct wages. Expenses which are booked with the amounts of wages eg:- worker’sinsurance, their contribution to provident fund, worker’s compensation etc. aredistributed amongst the departments in the ratio of wages. Re-apportionment of ServiceDepartment Costs to Production Departments
Service department costs are to be reapportioned to the production departments or the cost
centres where production is going on. This process of re-apportionment of overhead expenses is
known as ‘Service Distribution’. The following is a list of the bases of apportionment which may
be accepted for the service departments noted against

Service Department Cost Basis of Apportionment
1. Maintenance Department2. Payroll or time-keeping department
3. Store keeping department4. Employment or Personnel epartment.
5. Purchase Department6. Welfare, ambulance, canteen service,
recreation room expenses.7. Building service department8. Internal transport service or
overhead crane service9. Transport Department
10. Power House (Electric power cost)
-Hours worked for each department-Total labour or Machine hours or number ofemployees in each department- no. of requisitions or value of materials ofeach department.- Rate of labour turnover or number ofemployees in each department.
-no. of purchase orders or value of materials-No. of employees in each department.-Relative are in each department-Weight, value graded product handled, weightand distance travelled.
-crane hours, truck hours, truck mileage,truck tonnage, truck tonne-hours, tonnagehandled, number of packages.–wattage, horse power, horse power machine
hours, number of electric points etc.
The following are the various methods of re-distribution of service department costs to productiondepartments.
1. Direct re-distribution method
2. Step distribution method
3. Reciprocal Services method
a. Simultaneous Equation
Method b. Repeated Distribution
Method c. Trial and Error
Method
Direct re-distributionmethod
Under this method, the costs of service departments are directly apportioned to productiondepartments without taking into consideration any service from one service department to anotherservice department. Thus, proper apportionment cannot be done on the assumption that servicedepartments do not serve each other and as a result the production departments may either beovercharged or undercharged. The share of each service department cannot be ascertainedaccurately for control purposes. Budget for each department cannot be prepared thoroughly.Therefore, Department Overhead rates cannot be ascertained correctly.
Step Distribution Method
Under this method, the cost of most serviceable department is first apportioned to other servicedepartments and production departments. The next service department is taken up and its cost isapportioned and this process goes on till the cost of the last service department is apportioned.Thus, the cost of last service department is apportioned only to production departments.

Reciprocal Services Method
In order to avoid the limitation of Step Method, this method is adopted. This method recognizes thefact that if a given department receives service from another department, the department receivingsuch service should be charged. If two departments provide service to each other, each departmentshould be charged for the cost of services rendered by the other. There are three methods availablefor dealing with inter-service departmental transfer:
a. Simultaneous Equation Methodb. Repeated Distribution Methodc. Trial and Error Method
(a) Simultaneous Equation method
Under this method, the true cost of the service departments are ascertained first with the help ofsimultaneous equations; these are then redistributed to production departments on the basis ofgiven percentage. The following illustration may be taken to discuss the application of thismethod.
(b) Repeated Distribution Method
Under this method, the totals are shown in the departmental distribution summary, are put out ina line, and then the service department totals are exhausted in turn repeatedly according to theagreed percentages until the figures become too small to matter.
ABSORPTION OF OVERHEAD
Absorption means the distribution of the overhead expenses allotted to a particular departmentover the units produced in that department. Overhead absorption is accomplished by overheadrates.
Methods of Absorption of Manufacturing OverheadThe following are the main methods of absorption of manufacturing or factory overheads.
(a) Direct Material Cost Method. Under this method percentage of factory expenses to value
of direct materials consumed in production is calculated to absorb manufacturing
overheads.
The formula is Overhead Rate = Production Overhead Expenses (Budgeted)
Anticipated Direct Material Cost
It is assumed that relationship between materials and factory expenses will not change. This
method is simple and can be adopted under the following circumstances:
(i) Where the proportion of overheads to the total cost is significant.
(ii) Where the prices of materials are stable.
(iii) Where the output is uniform ie. Only one kind of article is produced.

(b) Direct Labour Cost (or Direct Wages) Method. This is a simple and easy method andwidely used in most of the concerns. The overhead rate is calculated as under:
Overhead Rate= Production Overhead ExpensesDirect Labour Cost
If from past experience, the percentage of factory expenses to direct wages is 50%, then thefactory expenses in the next year is taken as 50% of the direct wages.
This method is suitable under the following situations:
(i) Where direct labour constitutes a major proportion of the total cost of production.
(ii) Where production is uniform.
(iii) Where labour employed and types of work performed are uniform.
(iv) Where the ratio of skilled and unskilled labour is constant.
(v) Where there are no variations in the rates of pay ie., the rates of pay and the methods arethe same for the majority of the workers in the concern.
In some concerns a separate rate is calculated for the fringe benefits and applied on the basis ofdirect labour cost.
(c) Prime Cost Method. Under this method the recovery rate is calculated dividing the
budgeted overhead expenses by the aggregate of direct materials and direct labour cost of
all the products of a cost centre. The formula is
Overhead Recovery Rate = Production Budgeted Overhead ExpensesAnticipated Direct Materials and Direct Labour Cost
d) Direct Labour (or Production) Hour Method. This rate is obtained by dividing the
overhead expenses by the aggregate of the productive hours of direct workers. The formula
is
Overhead rate = Production Overhead ExpensesDirect Labour Hours
(e) Machine Hour Rate. Machine hour rate is the cost of running a machine per hour. It is one
of the methods of absorbing factory expenses to production. There is a basic similarity
between the machine hour and the direct labour hour rate methods, in so far as both are
based on the time factor. The choice of one or the other method depends on the actual
circumstances of the individual case. In respect of departments or operations, in
whichmachines predominate and the operators perform a relatively a passive part, the
machine hour rate is more appropriate. This is generally the case for operations or processes
performed by costly machines which are automatic or semi-automatic and where operators
are needed merely for feeding and tending them rather than for regulating the quality or
quantity of their output. In such cases, the machine hour rate method alone can be depended
on to correctly apportion the manufacturing overhead expenses to different items of
production. What is needed for computing the machine hour rate is to divide overhead
expenses for a specific machine or group of machines for a period by the operating hours of
the machine or the group of machines for the period. It is calculated as follows:

Machine hour rate = Amount of overheads----------------------------------------------Machine hours during a given period
The following steps are required to be taken for the calculation of machine hour rate:
1) Each machine or group of machine should be treated as a cost centre.
2) The estimated overhead expenses for the period should be determined for each machineor group of machines.
3) Overheads relating to a machine are divided into two parts i.e., fixed or standing chargesand variable or machine expenses.
4) Standing charges are estimated for a period for every machine and the amount soestimated is divided by the total number of normal working hours of the machine duringthat period in order to calculate an hourly rate for fixed charges. For machine expenses,an hourly rate is calculated for each item of expenses separately by dividing theexpenses by the normal working hours.
5) Total of standing charges and machines expenses rates will give the ordinary machinehour rate.
Some of the bases which may be adopted for apportioning the different expenses for thepurpose of calculation of machine hour rate are given below.
Some of the expenses and the basis of apportionment are given below.
1. Rent and Rates - Floor area occupied by each machine includingthe surrounding space.
2. Heating and Lighting - The number of points used plus cost of special lighting orheating for any individual machine, alternatively according to floor area occupied byeach machine.
3. Supervision – estimated time devoted by the supervisory staff to each machine.
4. Lubricating Oil and Consumable Stores – On the basis of past experience.
5. Insurance – Insurable value of each machine
6. Miscellaneous Expenses – Equitable basis depending upon facts.
Machine Expenses
1. Depreciation – cost of machine including cost of stand-by equipment such asspare motors, switchgears etc., less residual value spread over its working life.
2. Power – Actual consumption as shown by meter readings or estimatedconsumption ascertained from past experience.
3. Repairs – Cost of repairs spread over its working life.
(f) Rate Per Unit of Production. This method is simple, direct and easy. It is suitable for
mining and other extractive industries, foundries and brick laying industries, where the
output is measured in convenient physical units like number, weight, volume etc. the rate is
calculated as under:
Overhead Rate= Overhead expenses (budgeted)Budgeted production

(g) Sale Price Method: Under this method, budgeted overhead expenses are divided by the sale
price of units of production in order to calculate the overhead recovery rate. The formula is
sale price of units of production in order to calculate the overhead recovery rate, the formula
isOverhead Recovery Rate= Budgeted overhead expenses
Sale value of units of production
The method is more suitable for apportioning of administration, selling and distribution,
research, development and design costs of products. It can also be used with advantage for
the appropriation of joint products costs.

Scanned by CamScanner
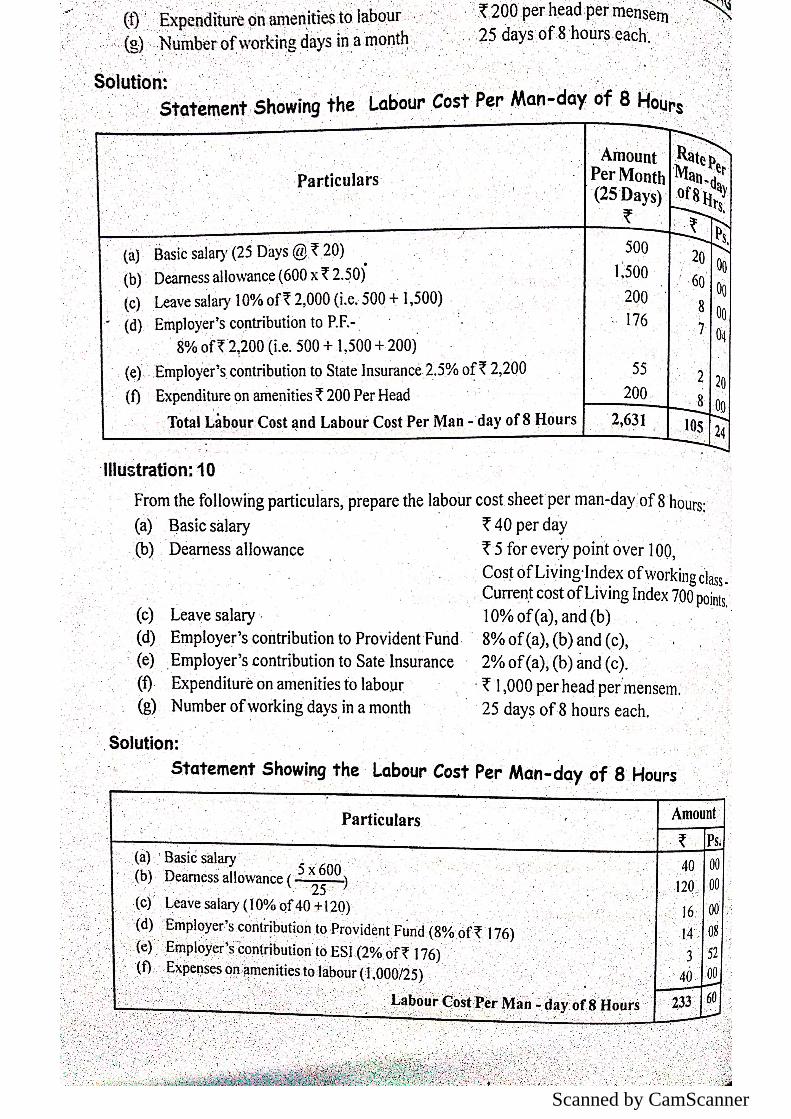
Scanned by CamScanner

Scanned by CamScanner

Scanned by CamScanner

Scanned by CamScanner

Scanned by CamScanner

Scanned by CamScanner

Scanned by CamScanner

Scanned by CamScanner

Scanned by CamScanner

Scanned by CamScanner
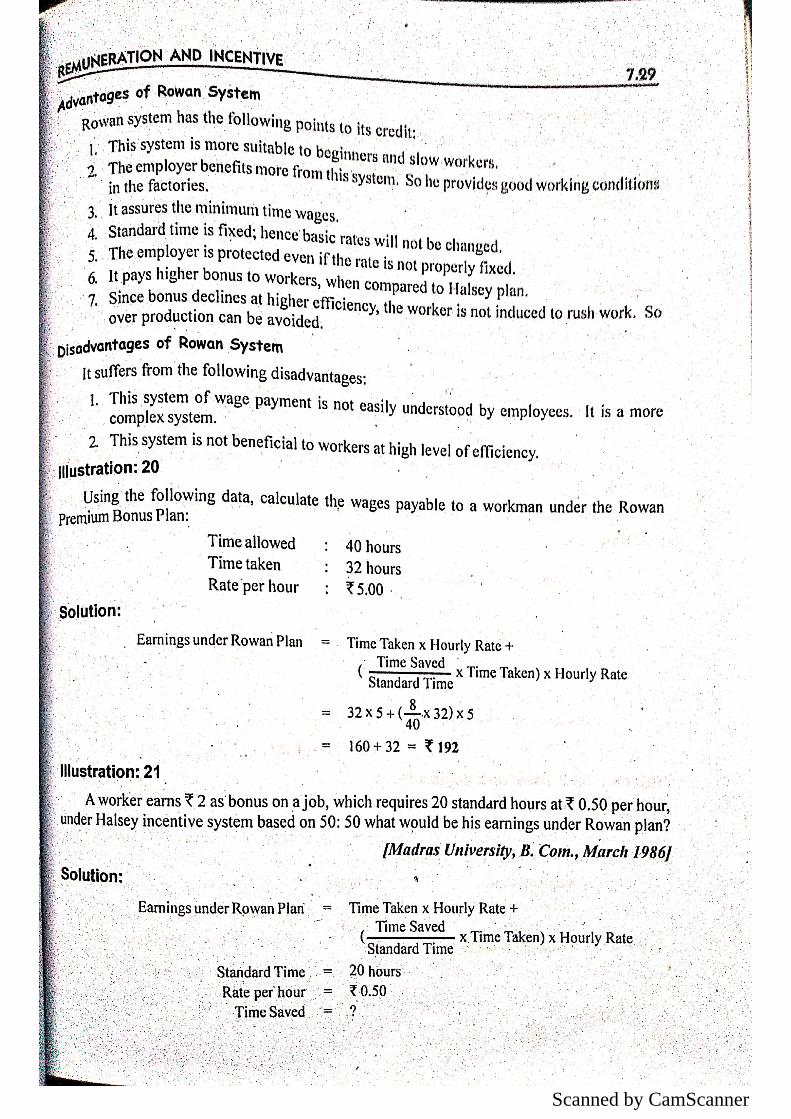
Scanned by CamScanner

Scanned by CamScanner

Scanned by CamScanner

Scanned by CamScanner

Scanned by CamScanner

Scanned by CamScanner

Scanned by CamScanner

Scanned by CamScanner

Scanned by CamScanner

Scanned by CamScanner

Scanned by CamScanner

Scanned by CamScanner

Scanned by CamScanner
UNIT – IIIPROCESS COSTING
Process costing is the method of costing applied in the industries engaged in continuous ormass production. Process costing is a method of costing used to ascertain the cost of a product ateach process or stage of manufacturing.
According to ICMA terminology, “Process Costing is that form of operation costing whichapplies where standardized goods are produced”.
So it is a basic method to ascertain the cost at each stage of manufacturing. Separateaccounts are maintained at each process to which expenditure incurred. At the end of each processthe cost per unit is determined by dividing the total cost by the number of units produced at eachstage. Hence, this costing is also called as “Average Costing” or “Continuous Costing”. ProcessCosting is used in the industries like manufacturing industries, chemical industries, mining worksand public utility undertakings.
Characteristics of Process Costing
1. Production is continuous
2. Products pass through two or more distinct processes of completion.
3. Products are standardized and homogeneous.
4. Products are not distinguishable in processing stage.
5. The finished product of one process becomes the raw material of the subsequent process.
6. Cost of material, labour and overheads are collected for each process and charged accordingly.
Advantages of Process Costing1. It is easy to compute average cot because the products are homogeneous in Process Costing.
2. It is possible to ascertain the process costs at short intervals.
3. Process Costing is simple and less expensive in relation o job costing.
4. By evaluating the performance of each process effective managerial control is possible.
Disadvantages of Process Costing
1. Valuation of work in progress is difficult.
2. It is not easy to value losses, wastes, scraps etc.
3. The apportionment of total cost among joint products and by-products is difficult.
4. Process cost are not accurate, they are only average costs
5. Process costs are only historical.
Principles of Process Costing
The following points are considered while determining the cost under Process Costing.1. Production activity should be divided into different processes or departments.
2. A separate account is opened for each process.
3. Both direct and indirect costs are collected for each process.
4. The quantity of output and costs are recorded in the respective process accounts.
5. The cost per unit is determined by dividing the total cost at the end of each process by thenumber of output of each process.
6. Normal loss and abnormal loss are credited in the process account
7. The accumulated cost of each process is transferred to subsequent process along withoutput. The output of the last process along with cost is transferred to the finished goodsaccount.

8. In case of by-products and joint products their share in joint cost should be estimated andcredited to the min process.
9. When there is work in progress at the end of the period the computation of inventory ismade I terms of complete units.
Difference between Process Costing and Job Costing
Process Costing Job Costing
1. Production is continuous
2. Production is for stock
3. All units produced are identical orhomogeneous
4. There is regular transfer of cost of oneprocess to subsequent processes
5. Work in progress always exists
Procedure for Process Costing
1. Production is according tocustomers’ orders
2. Production is not for stock
3. Each job is different from the other
4. There is no regular transfer of costfrom one job to another
5. Work in progress may or may notexist
1. Each process is separately identified. Separate process account is opened for each process.
2. Along with ‘Particulars Column’, two columns are provided on both sides of the processaccount – units (quantity) and amount (Rupees).
3. All the expenses are debited in the respective process account.4. Wastage, sale of scrap, by-products etc are reordered on the credit side 0f the process
account.5. The difference between debit and credit side shows the cost of production and output of that
particular process which is transferred to the next process.6. The cost per unit in every process is calculated by dividing the net cost by the output.7. The output of last process is transferred to the Finished Stock Account.8. Incomplete units at the end of the each period ion every process s converted in terms of
completed units.
Specimen of Process AccountProcess Account
Units Rs. Units Rs.
To Direct materials
To Direct Wages
To Direct Expenses
To Indirect expenses
To Other Expenses (if any)
By Loss in weight(Normal
Loss)
By sale of Scrap
By Next Process
Account(Transfer)
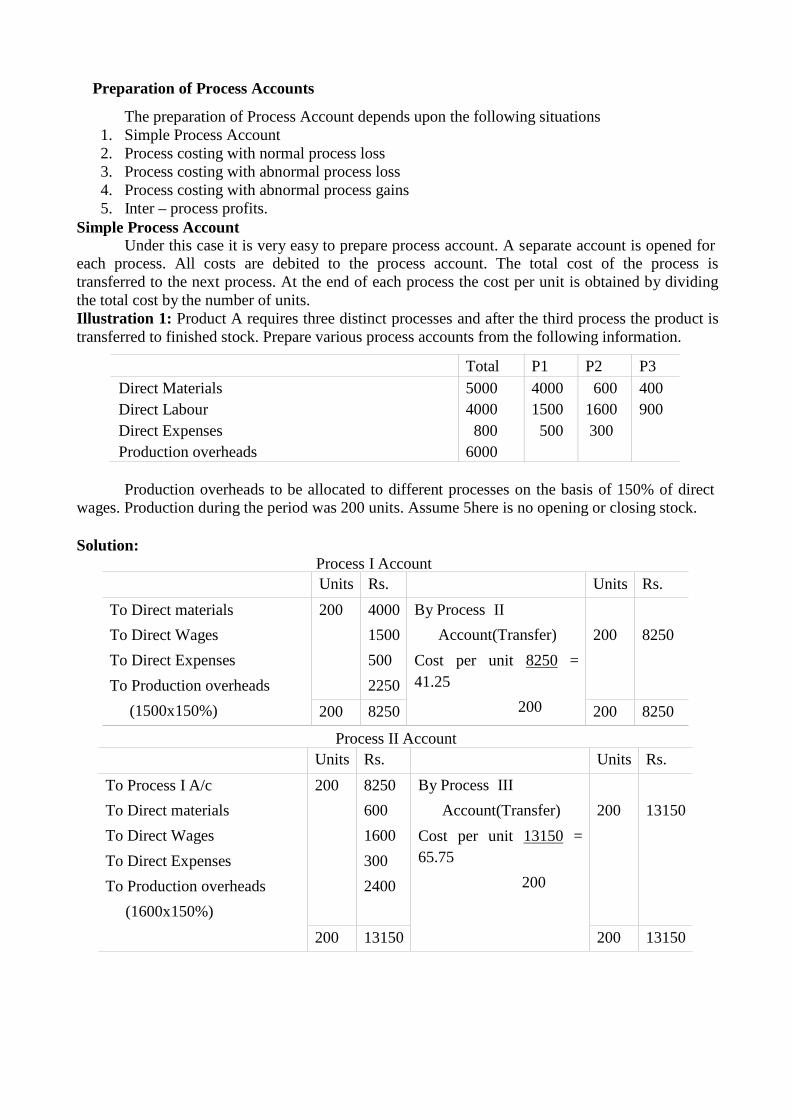
Preparation of Process Accounts
The preparation of Process Account depends upon the following situations1. Simple Process Account2. Process costing with normal process loss3. Process costing with abnormal process loss4. Process costing with abnormal process gains5. Inter – process profits.
Simple Process AccountUnder this case it is very easy to prepare process account. A separate account is opened for
each process. All costs are debited to the process account. The total cost of the process istransferred to the next process. At the end of each process the cost per unit is obtained by dividingthe total cost by the number of units.Illustration 1: Product A requires three distinct processes and after the third process the product istransferred to finished stock. Prepare various process accounts from the following information.
Total P1 P2 P3Direct MaterialsDirect LabourDirect ExpensesProduction overheads
50004000800
6000
40001500500
6001600300
400900
Production overheads to be allocated to different processes on the basis of 150% of directwages. Production during the period was 200 units. Assume 5here is no opening or closing stock.
Solution:Process I AccountUnits Rs. Units Rs.
To Direct materials
To Direct Wages
To Direct Expenses
To Production overheads
(1500x150%)
200 4000
1500
500
2250
By Process II
Account(Transfer)
Cost per unit 8250 =41.25
200
200 8250
200 8250 200 8250
Process II AccountUnits Rs. Units Rs.
To Process I A/c
To Direct materials
To Direct Wages
To Direct Expenses
To Production overheads
(1600x150%)
200 8250
600
1600
300
2400
By Process III
Account(Transfer)
Cost per unit 13150 =65.75
200
200 13150
200 13150 200 13150

Process III AccountUnits Rs. Units Rs.
To Process II A/cTo Direct materialsTo Direct WagesTo Production overheads
(900x150%)
200 13150400900
1350
By Finished stock A/c(Output Transferred )Cost per unit 15800 = 79
200
200 15800
200 15800 200 15800
Process lossesThe process loss is classified into two- normal process loss and abnormal process loss.
Normal process lossThis is the loss which is unavoidable on account of inherent nature of production process. It
arises under normal conditions. It is usually calculated as a certain percentage of input. Normalprocess los includes either waste or scrap r both. Waste is unsalable and has no value. Loss inweight is an example of waste. Loss in weight should be credited to the concerned process account.It should be recorded only in terms of quantity.
Loss in weight = Opening Stock + output from the preceding process – (output of theConcerned process + closing stock)
Illustration 2: From the following figures, show the cost of three processes of manufacture. Theproduction of each process is passed on to the next process immediately on completion.
ProcessA
ProcessB
ProcessC
Wages and MaterialsWorks OverheadProduction ion unitsStock on 1 July 2012 (units from precedingprocess)Stock on 31 July 2012 (units from precedingprocess)
30400560036000
12000525037500
4000
1000
29250600048000
16500
5500Solution:
Process A AccountUnits Rs. Units Rs.
To Wages and Materials
To Works Overhead
36000 30400
5600
By Process B A/c(Transfer )
Cost per unit 36000 = 1
36000
36000 36000
36000 36000 36000 36000

Process B Account
Units Rs. Units Rs.
To Opening Stock (Re.1 p.u)
To Process A A/c (transfer)
To Wages and Materials
To Works Overhead
4000
36000
4000
36000
12000
5250
By loss in weight (Bal. fig)
By Closing stock @ Re.1
p.u
By Process C A/c (Transfer )
Cost per unit 56250 = 1.50
37500
1500
1000
37500
1000
56250
40000 57250 40000 57250
Process C Account
Units Rs. Units Rs.
To Opening Stock (Rs.1.50
p.u)
To Process B A/c (transfer)
To Wages and Materials
To Works Overhead
16500
37500
24750
56250
29250
6000
By loss in weight (Bal.
fig)
By Closing
By Finished stock A/c
(Transfer)
Cost per unit108000 =
2.25
48000
500
5500
48000
8250
108000
54000 116250 54000 116250
Illustration 3: Bihar Chemicals Ltd produced three chemicals during the month of July 2012 bythree consecutive processes. In each process 2% of the total weight put in is lost and 10 % is scrapwhich from process 1 and 2 realizes Rs.100 a ton and from process 3Rs.20 a ton.
The product of three processes is dealt with as follows:
Process 1 Process 2 Process 3
Passed on to the next process
Sent to warehouse for sale
75%
25%
50%
50% 100%
Expenses incurred:Rs Tons Rs Tons Rs Tons
Raw materials
Manufacturing wages
General expenses
120000
20500
10300
1000 28000
18520
7240
140 107840
15000
3100
1348
Prepare Process Cost Accounts showing the cost per ton of each product.

Solution:Process 1 Account
Tons Rs. Tons Rs.
To Raw materials
To Manufacturing wages
To General expenses
1000 120000
20500
10300
By loss in weight (2%)
By Sale of scrap (10%)
By Warehouse - transfer(880x25%)
By Process 2A/c(Transfer )
Cost per unit 140800 =160
880
20
100
220
660
10000
35200
105600
1000 150800 1000 150800
Process 2 AccountTons Rs. Tons Rs.
To Process 1 A/c(Transfer )
To Raw materials
To Manufacturing wages
To General expenses
660
140
105600
28000
18520
7240
By loss in weight (2%)
By Sale of scrap (10%)
By Warehouse - transfer(704x50%)
By Process 2A/c(Transfer )
Cost per unit 151360 =215
704
16
80
352
352
8000
75680
75680
800 159360 800 159360
Process 3 AccountTons Rs. Tons Rs.
To Process 2 A/c(Transfer )To Raw materialsTo Manufacturing wagesTo General expenses
3521348
75680107840150003100
By loss in weight (2%)By Sale of scrap (10%)By Warehouse - transferCost p unit 198220=132.5
1496
34170
1496
3400198220
1700 201620 1700 201620
Abnormal Process LossAny loss caused by unexpected or abnormal conditions such as plant break don, substandard
materials, carelessness, accident etc. or loss in exceeds of the margin anticipated for normal processloss can be called as abnormal process loss. It is controllable and avoidable. When actual loss in theprocess is greater than the estimated normal loss, it is a case of abnormal loss. It may also bedetermined by comparing actual output with expected or normal output. If actual output is les thanthe normal output, the difference is abnormal loss.
Value of Abnormal loss = Normal cost of normal output x Units of Abnormal lossNormal output
Normal cost of normal output = Total expenditure (i.e., total debit of process A/c) – SaleProceeds of scrap (i.e. Value of normal loss)

Units Rs. Units Rs.
To Raw Materials
To Other expenses
100 1000
602
By Normal loss-100x10% @Rs.3 each
By Abnormal loss(Bal.Fig)
By Process B A/c(transfer)
10
15
75
30
262*
1310
100 1602 100 1602
Normal output = Input – Units of normal loss
Illustration 4: In process A 100 units of raw materials were introduced at a cost of Rs.1000. theother expenditure incurred by the process was Rs. 602. Of the units introduced 10% are normallylost in the course of manufacture and them posses a scrap value of Rs.3 each. The output of processA was only 75 units. Prepare Process A A/c and Abnormal loss A/c.
Solution:
Process A A/c
Working Note:
Normal cost of normal output = Total expenditure – Sale Proceeds of scrap
= 1602-30= 1572Normal output = Input – Units of normal loss
= 100 – 10 = 90
Value of Abnormal loss = Normal cost of normal output x Units of Abnormal lossNormal output
= 1572 x 15 = Rs. 26290
Abnormal Loss A/cUnits Rs. Units Rs.
To Process A 15 262 By Cash (scrap value of
loss @ Rs.3)
By Costing P&L A/c
15 45
217
15 262 15 262
Abnormal Gain (or Abnormal Effective)Sometimes actual loss or wastage in a process is less than expected normal loss. In this case
the difference between actual loss and expected loss is known as abnormal gain or abnormaleffective. It is the excess of actual production over normal output.
Abnormal gain is valued in the same manner as abnormal loss. The value of abnormal gainis debited to process A/c and credited to abnormal gain A/c. the value of scrap is debited toabnormal gain A/.c and credited to normal loss A/c. finally abnormal loss A/c is closed bytransferring the credit balance to Costing P&L A/c.
Value of Abnormal Gain = Normal cost of normal output x Units of Abnormal gainNormal output

Normal cost of normal output = Total expenditure– Sale Proceeds of scrapNormal output = Input – Units of normal loss
Units of Abnormal gain = Normal loss- Actual lossOr = Actual output - Normal output
Illustration 5: Product X is obtained after it passes through three distinct processes. 2000 kg ofmaterials at Rs.5 per kg were issued to the first process. Direct wages amounted to Rs.900 andproduction overhead incurred was Rs.500. Normal loss is estimated at 10% of input. This wastageis sold at Rs.3 per kg. The actual output is 1850 kg. Prepare process I A/c and Abnormal Gain/Abnormal loss A/c as the case may be.Solution:
Process I AccountKg Rs. Kg Rs.
To Materials
To Direct wages
To Production OH
To Abnormal gain (Bal.)
2000
501
10000
900
500
3003
By Normal loss (Sale ofscrap )
By Process II - transfer200
1850
600
111002
2050 11700 2050 11700
Abnormal Gain A/c
Kg Rs. Kg Rs.
To Normal loss (loss ofincome)
To Costing P&L A/c (Bal.)
50 150
150
By Process I A/c 50 300
50 300 50 300
Working note:1. (200+1850)-2000=502. (10000+900+500)-600 = Rs.6
1850-501850x6=11100
3. 50x6=30
Illustration 6: The product of a company passes through three distinct processes to completion –A,B and C. from the past experience it s ascertained that los s incurred in each process as – A-2%,B-5% and C-10%.
In each case the percentage of loss is computed on te number of units entering the processconcerned. The loss of each process possesses a scrap value. The los of processes A and B sold atRs.5 per 100 units and that of C at Rs.20 per 100 units.
The output of each process passes immediately to the next process and the finished units arepassed from process C into stock.
Process A Process B Process C
Materials consumed
Direct labour
Manufacturing expenses
6000
8000
1000
4000
6000
1000
2000
3000
1500

20000 units have been issued to process A at a cost of Rs.10000. the output of each processhas been as under:
A-19500, B- 18800 and C - 16000.There is no work in progress in any process. Prepare process accounts. Calculations should be madeto the nearest rupee.Solution:
Process A AccountUnits Rs. Units Rs.
To Units introduced
To Materials
To Direct labour
To Manufacturing Expenses
20000 10000
6000
8000
1000
By Normal loss
By Abnormal loss (Bal.)
By Process B - transfer
400
100
19500
20
127
24853
20000 25000 20000 25000
Process B AccountUnits Rs. Units Rs.
To Process A A/c
To Materials
To Direct labour
To Manufacturing Expenses
To abnormal gain
19500
275
24853
4000
6000
1000
532
By Normal loss
By Process C - transfer
975
18800
49
36336
19775 36385 19775 36385
Process C AccountUnits Rs. Units Rs.
To Process B A/c
To Materials
To Direct labour
To Manufacturing Expenses
18800 36336
2000
3000
1500
By Normal loss
By To abnormal loss
By Finished stock A/c -transfer
1880
920
16000
376
2309
40151
18800 42836 18800 42836
Finished Stock A/c
Units Rs. Units Rs.
To Process C A/c 16000 40151
16000 40151 16000 40151
Abnormal Loss A/c
Units Rs. Units Rs.
To Process A
To Process C
100
920
127
2309
By Cash ([email protected] [email protected] 100)
By Costing P&L A/c1020 189
2247
1020 2436 1020 2436

Normal loss A/c
Units Rs. Units Rs.
To Process A
To Process B
To Process C
400
975
1880
20
49
376
By Abnormal Gain
By Cash/Debtors A/c
275
2980
14
431
3255 445 3255 445
Abnormal Gain A/c
Units Rs. Units Rs.
To Normal loss (loss ofincome)
To Costing P&L A/c (Bal.)
275 14
538
By Process C A/c 275 532
275 532 275 532
Working note:Process A:Value of Abnormal loss = Rs.24980/19600 units x 100 units = Rs. 127.Process B:Value of Abnormal gain = Rs.35804/18525 units x 275 units = Rs. 532.Process C:Value of Abnormal loss = Rs.42460/16920 units x 920 units = Rs. 2309.
Work-in-Progress
In most of the firms manufacturing is on a continuous basis and the problem of work-in-progress is quite common. The work-in-progress consists of direct materials, direct wages andproduction overhead.
Equivalent Production
Equivalent production represents the production of a process in terms of completed units. Inother words, it means converting the incomplete units into its equivalent of completed units. It isalso known as effective production. For calculating equivalent production, work-in-progress needsto be inspected. Then an estimate is made of the degree of completion, usually on a percentagebasis.
Steps and procedure of computation of Equivalent Production
1. Ascertain Equivalent Production in respect of opening work-in-progress, if any. In this case theEquivalent Production is computed by taking into consideration the percentage of work required tofinish now in the process. The following formula is used.
Opening WIP (Units) x % of work needed to complete.
2. Find the units introduced and completed and add this to (1). It is calculated as follows:
Units completed and transferred – Opening work-in-progress.

3. Convert the equivalent production of closing work-in-progress and add to the above.The formula is:
Closing work-in-progress (units) x% of work completed.4. Obtain the total Equivalent Production terms of materials, labour and overhead separately (if
degree of completion is different). For this, ‘Statement of Equivalent Production’ is prepared.
5. Find out the net process costs, element wise- materials, labour and overheads.6. Ascertain the cost per unit of Equivalent Production for each element of cost separately.
Material cost per unit= Material costEquivalent Production in respect of materials
Labour cost per unit = Labour costEquivalent Production in respect of labour
Overhead cost per unit = Overhead costEquivalent Production in respect of overhead
For this purpose ‘Statement of Cost is prepared’7. Find out the value of opening work-in-progress, finished units and closing work-in-progress. Theformula is:
Equivalent Production in respect of materials x Material cost per unit
Equivalent Production in respect of labour x Labour cost per unit
Equivalent Production in respect of overhead x Overhead cost per unit
For this purpose ‘Statement of Evaluation or Apportionment’ is prepared.In short, the following three statements are to be prepared:
1. Statement of Equivalent Production2. Statement of Cost3. Statement of Evaluation.I. When there is only closing work-in-progress but with no process losses
Under this case the closing work-in-progress is converted into equivalent units on the basisof estimate as regards degree of completion o materials, labour and production overhead.Illustration 7: Input 3800 units, Output 3000 units and closing work-in-progress 800 units.
Degree ofcompletion
Process costs Rs.
Materials
Labour
Overheads
80%
70%
70%
7280
10680
7120
Find out Equivalent Production, Cost per unit of equivalent production and prepare the
Process A A/c assuming that there is no opening work-in-progress and process loss.
Solution:Statement of Equivalent Production
Input Output Equivalent Production
Items Units Items UnitsMaterials
Labour &Overhead
Units % Units %Unitsintroduced 3800
Units completed &transferredWork in progress
3000800
3000640
10080
3000560
10070
3800 3800 3640 3560

Statement of Cost
Elements of cost Cost (Rs.)Equivalent Production(units)
Cost per completedunit
Materials
Labour
Overheads
7280
10680
7120
3640
3560
3560
2.00
3.00
2.00
25080 7.00
Statement of Evaluation
Finished goods 3000x7
Work-in-progress:
Materials 640x2
Labour 560x3
Overhead 560x2
1280
1680
1120
21000
4080
Process A A/c
Units Rs. Units Rs.
To Materials
To Labour
To Overhead
3800 7280
106807120
By Finished stock A/c -transfer
By Work-in-progress3000
800
21000
4080
3800 25080 3800 25080
II. When there is only closing work-in-progress but with process losses
In case of normal loss, nothing should be added as equivalent production. However,abnormal loss should be considered as production of good units completed during the period.Illustration 8: During January 2000 units were introduced into Process I. the normal loss wasestimated at 5% on input. At the end of the month, 1400 units had been produce and transferred tothe next process, 460 units were uncompleted and 140 units had been scrapped. It was estimatedthat uncompleted units had reached a stage in production as follows:
Material 75% completedLabour 50% completedOverheads 50% completed
The cost of 20000 units was Rs.5800Direct material introduced during the process Rs.1440Direct wages Rs.3340Production overheads incurred were Rs. 1670Units scrapped realized Re.1 each.

Units scrapped passed through the process, so were 100% completed as regards material, labourand overhead.
Find out Equivalent Production, Cost per unit and prepare the necessary accounts.
Solution:
Statement of Equivalent Production
Input
Units
OutputUnits
Equivalent Production
Materials Labour &Overhead
Units % Units %
2000 Normal loss
Abnormal loss
Finished production
Work in progress
100
40
1400
460
40
1400
345
100
100
75
40
1400
230
100
100
50
2000 2000 1785 1670
Statement of Cost
Elements of cost Cost(Rs.)
EquivalentProduction (units)
Cost per completedunit
Materials
Cost of units introduced
Direct Materials
Less: Scrap vale of normal loss
Direct wages
Overheads
Total
5800
1440
1785
1670
1670
4
2
1
7240
100
7140
3340
1670
12150 5125 7
Statement of Evaluation
Production Cost Elements Equivalent Production Cost per unit Cost Total Cost
Abnormalloss
Material
Labour
Overheads
40
40
40
4
2
1
160
80
40 280
Finishedproduction
Material
Labour
Overheads
1400
1400
1400
4
2
1
5600
2800
1400 9800
Work-in-progress
Material
Labour
Overheads
345
230
230
4
2
1
1380
460
230 2070
12150

Process I A/cUnits Rs. Units Rs.
To Units introduced
To Materials
To Labour
To Overhead
2000 5800
1440
3340
1670
By Normal loss
By abnormal loss
By Finished production
By Balance c/d
(Work-in-progress)
100
40
1400
460
100
280
9800
2070
2000 12250 2000 12250
Finished Production A/cUnits Rs. Units Rs.
To Process I A/c 1400 9800
Abnormal Loss A/cUnits Rs. Units Rs.
To Process I A/c 40 280 By Cash (sale @ Re.1 p.u)
By Costing P&L A/c (loss)
40 40
240
40 280 40 280
III. When there is opening as well as closing work in progress but with no process loss.
Sometimes in a continuous process there will be opening as well as closing work inprogress which are to be converted into equivalent of completed units for apportionment of processcosts. The procedure of conversion of opening work in progress will vary depending upon whetheraverage cost or FIFO or LIFO method of apportionment of costs is followed.
Illustration 9: From the following details, prepare statement of equivalent production, statement ofcost, statement of evaluation and process A/c by following FIFO method.
Opening work-in-progress (2000 units):Materials (100% complete) Rs. 5000Labour (60% complete) Rs. 3000Overheads (60% complete) Rs. 1500
Units introdu4ed into the process Rs. 8000
There are 2000 units in progress and the stage of completion is estimated to be:Materials 100%Labour 50%Overheads 50%
8000 units are transferred to the next process:
The process costs for the period are:Materials Rs.96000Labour Rs. 54600Overheads Rs. 31200

OutputUnits
Equivalent Production
MaterialsLabour &Overhead
Units % Units %
2000
60002000
60002000
100100
800
60001000
40
10050
10000 8000 7800
Solution:Statement of Equivalent Production
Opening WIPCompleted processed during theperiod(8000-2000)Closing WIP
Total
Statement of CostElements of cost Cost
(Rs.)EquivalentProduction (units)
Cost percompleted unit
Materials
Labour
Overheads
Total
96000
54600
31200
8000
7800
7800
12
7
4
181800 23
Statement of EvaluationOpening Work-in-progress (current cost)
MaterialsLabour 800x7
Overhead 800x4
Closing WIP
Materials 2000x12
Labour 1000x7
Overhead 1000x4
units completely processed during the period 6000@23
5600
3200
24000
7000
4000
8800
35000
138000
181800
Process A/cUnits Rs. Units Rs.
To Opening WIP
To Materials
To Labour
To Overhead
2000
8000
9500
96000
54600
31200
By Finished stock transferredto next process
(9500+8800+138000)
By Closing WIP
8000
2000
156300
35000
10000 191300 10000 191300

IV. When there is opening as well as closing work-in-progress but with losses.
Under this equivalent production units regarding opening and closing work in progress areto be calculated with due adjustment for process losses.
Illustration 10: Following data are relating Process A for March 2012.Opening WIP – 1500 units for Rs.15000Degree of completion:Materials 100%, Labour and overheads 33 1/3%Input of materials 18500 units at Rs.52000Direct labour Rs. 14000Overheads Rs. 28000Closing WIP - 5000 units.Degree of completion: Materials 90% and labour and overheads 30%.Norma process loss is 10% of total input (opening WIP units + units put in)Scrap value Rs. 2 per unit.Unit transferred to the next process 15000 units.
Compute equivalent units of production, cost per equivalent unit for each cost element andcost of finished output and closing WIP. Also prepare Process and other accounts. Assume thatFIFO method is used by the company and the cost of opening WIP is fully transferred to the nextprocess.
Solution:Statement of Equivalent Production and Cost
Input
Units
Output Units Equivalent Production
Materials Labour Overhead
Units % Units % Units %
1500
18500
Opening WIPtransfer
Normal loss
Finished goods
Closing WIP
less: Abnormalgain
Materials
less: scrap value
Cost perequivalent unit
1500
2000
13500
5000
13500
4500
100
90
100
1000
13500
1500
662/3
100
30
100
1000
13500
1500
16000
2000
14000
28000
Rs.2
662/3
100
30
100
20000 22000
2000
20000
52000
4000
18000
2000
16000
48000
Rs.3
16000
2000
14000
14000
Rs.1

Statement of Evaluation
Opening Work-in-progress
Materials
Labour 1000x1 1000
Overhead 1000x2 2000 3000
Finished goods 13500x6 81000
Abnormal gain 2000x6 12000
Closing WIP
Materials 4500x3 13500
Labour 1500x1 1500
Overhead 1500x2 3000 18000
Process I A/c
Units Rs. Units Rs.
To Opening WIP
To Materials
To Labour
To Overhead
To Abnormal gain
1500
18500
2000
15000
52000
14000
28000
12000
By normal loss
By Finished stock
(18000+81000)
By Closing WIP
2000
15000
5000
4000
99000
18000
22000 121000 22000 121000
Normal loss A/c
Units Rs. Units Rs.
To Process I 2000 4000 By Abnormal Gain 2000 4000
Abnormal Gain A/cUnits Rs. Units Rs.
To Normal loss (loss of income)
To Costing P&L A/c (Bal.)
2000 4000
8000
By Process I A/c 2000 12000
2000 12000 2000 12000

CONTRACT COSTINGMeaning
It is a special form of job costing and it is the most appropriate method to be adopted insuch industries as building and construction work, civil engineering, mechanical fabrication andship building. In other words, it is a form of specific order costing which applies where the work isundertaken to customer’s requirements and each order of long duration as compared to job costing.It is also known as terminal costing.
The official CIMA terminology defines contract costing as “ a form of specific ordercosting in which costs are attributed to individual contracts.”Basic features:
1. Each contract itself a cost unit.2. Work is executed at customers site3. The existence of sub contract4. Most of the expenses incurred upon the contracts are direct.5. Cost control is very difficult in contract costing.
Types of contracts
Generally there are three types of contracts:
1. Fixed price contracts: Under these contracts both parties agree to a fixed contract price.2. Fixed price contract with Escalation clause3. Cost plus contract: Under this contract no fixed price could be settled for a contract.
Contract Account
A contract account is a nominal account in nature. It is prepared to find out the cost of contract andto know profit or loss made on the contract. A contractor may undertake a number of contracts at atime. For each contract a separate account is opened. In the contract account all direct cost suchas material, labour and other direct expenses incurred during an accounting period are debited andthe indirect expenses are apportioned on an equitable basis. The differences between the two sidesare known as Notional profit or notional loss.
SPECIAL TERMS IN CONTRACT ACCOUNT
1. Work in Progress: It is the unfinished contract at the end of the accounting period and itincludes amount of work certified and amount of work uncertified. Work in progress is anasset, shown in the balance sheet by deducting there from any advance received from thecontractee.
2. Work certified: The sales value of work completed as certified by the architect is known as
‘work certified’. In the case of contracts of long duration, the amount payable by the
customer to the contractor is based on the sales value of work done as certified by the
architect. At the end of the financial year, the total sales value of work done and certified
by the architect is credited to the contract account.
3. Work Uncertified: It means work which has been carried out by the contractor but has
not been certified by the architect. Sometimes, work which is complete remains
uncertified at the end of the financial year. The reasons for the same may be

a. Work not sufficient enough to be certified
b. Work has not reached the stipulated stage to qualify for certification
It is always valued at cost and credited to the contract account.
4. Retention money: - Regardless of the amount of work certified, the contractor is paid
a specified percentage of the same and the balance is held or retained by the contractee.
This is because of the fact that the contractee has to safe guard himself against any
contingency arising from the non fulfillment of the terms of the contract by the contractor.
The unpaid balance of work certified or the amount held back or retained by the
contractee is known as
‘retention money’.
5. Sub contract: Sometimes the contractor enters into contracts with another contractor
to give a portion of work undertaken by him. In such cases the work performed by the
subcontractor s forms a direct charge to the contract concerned. Sub contract cost will be
shown on the debit side of the contract account.
6. Escalation clause: This is clause which is provided in the contract to cover up any
increase in the price of the contract due to increase in the prices of raw material or labour
or in the utilization of any other factors of production. If material and labour utilization
exceeds a particular limit, the customer agrees to bear the additional cost occasioned by
excessive utilization. Here, the contractor has to satisfy the customer that excessive
utilization is not the result of decreased efficiency.
SPECIMEN FORM OF CONTRACT ACCOUNT (Unfinishedcontract)
ContractA/C
To materialsTo LabourTo PlantTo OverheadsTo cost of sub contractsTo Notional Profit c/d(B/F)
To Profit and Loss A/CTo WIP (B/F)
XxxXxxXxxXxxXxxXxx
Xxx
XxxXxxXxx=======
By work in progress:Work certified xxxWork uncertified xxxBy material returnedBy plant xxxLess:Depreciation xxBy material lying at site
By Notional profit B/d
XxxXxx
XxxXxxXxx
Xxx
Xxx========

Treatment of Plant and Machinery:
One of the distinguishing features of a contract is the use of special plant and machinery. The costof these is capital expenditure, but yet, the usage of these should be reflected in the form ofdepreciation. There are two distinct methods of charging depreciation.
1. At the time of issue of plant to contract the contract account is debited with the full value ofthe plant. At the end of the period contract account is credited with the depreciated value.This method is used when plant and machinery is used at the contract site for a long period.
2. In the second method, contract account is debited with an hourly rate of depreciation for thenumber of hours the plant is used on the contract. A cost centre is set up for each machine.An estimate is made is made of the cost such as maintenance, depreciation, driver’s wageetc to be incurred. The total of this cost is divided by the number of hours that the machineis expected to be used.
Profit on Incomplete Contract:In the case of a small contract extending over the financial period, profit or loss on the same may beascertained by crediting it with the contract price due by the contractee. This procedure cannot beadopted in the case of contracts extending beyond the accounting period, and taking a long time forcompletion. If there is any profit upon the incomplete contract, it cannot be taken as actual profit.The profit upon the incomplete contract is called notional profit.
For the purpose of determining the amount of profit to be transferred to profit and lossaccount and making provision for future contingencies, the following guidelines may be kept inmind.
1. When the work has not reasonably advanced (1/4 or less than ¼) : - No profit should betaken to the credit of p/L account in the case of contracts which have just commenced and asmall portion of the work is complete.
2. Where the work is complete more than ¼ but less than ½ of contract price: In this case1/3 of the notional profit as reduced by the percentage of cash received may be credited toprofit and loss account. The usual formula is
Notional profit x1/3 x Cash receivedWork certified
The balance of notional profit shall be kept as reserve till the completion3. If the contract completed is more than 1/2 but less than 90%: Here 2/3 rd of the notional
profit should be taken to profit and loss account.Notional profit x2/3 x Cash received
Work certifiedThe balance of notional profit shall be transferred to work in progress as reserve. It is to benoted that in order to find out how much portion of contract is completed, work certifiedshould be compared with contract price.
4. If the contract is nearing completion: Here, estimated profit may be ascertained bydeducting the total cost of contract to date plus estimated additional expenses to completethe contract , from the contract price. It is calculated by using the following formula
Estimated profit x Cash receivedContract price
The loss on incomplete contract should be fully transferred to profit and loss account.
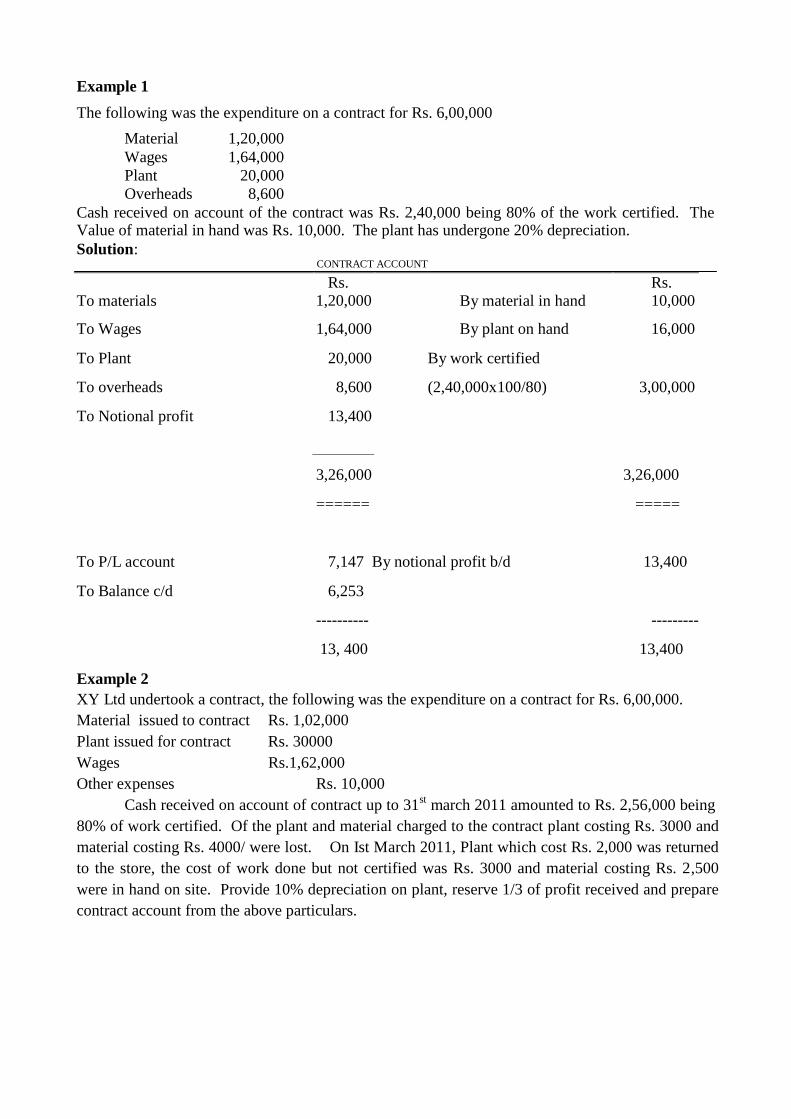
Example 1
The following was the expenditure on a contract for Rs. 6,00,000
Material 1,20,000Wages 1,64,000Plant 20,000Overheads 8,600
Cash received on account of the contract was Rs. 2,40,000 being 80% of the work certified. TheValue of material in hand was Rs. 10,000. The plant has undergone 20% depreciation.Solution:
CONTRACT ACCOUNT
To materialsRs.
1,20,000 By material in handRs.10,000
To Wages 1,64,000 By plant on hand 16,000
To Plant 20,000 By work certified
To overheads 8,600 (2,40,000x100/80) 3,00,000
To Notional profit 13,400
3,26,000 3,26,000
====== =====
To P/L account 7,147 By notional profit b/d 13,400
To Balance c/d 6,253
---------- ---------
13, 400 13,400
Example 2XY Ltd undertook a contract, the following was the expenditure on a contract for Rs. 6,00,000.Material issued to contract Rs. 1,02,000Plant issued for contract Rs. 30000Wages Rs.1,62,000Other expenses Rs. 10,000
Cash received on account of contract up to 31st march 2011 amounted to Rs. 2,56,000 being80% of work certified. Of the plant and material charged to the contract plant costing Rs. 3000 andmaterial costing Rs. 4000/ were lost. On Ist March 2011, Plant which cost Rs. 2,000 was returnedto the store, the cost of work done but not certified was Rs. 3000 and material costing Rs. 2,500were in hand on site. Provide 10% depreciation on plant, reserve 1/3 of profit received and preparecontract account from the above particulars.

Direct purchase of material 1,80,000Material issued from stores 50,000Wages 2,44000Direct expenses 24,000Machinery purchased 1,60,000Establishment charges 54,000
SolutionCONTRACT ACCOUNT
To materials
To Plant
To wages
To other expenses
To Notional profit c/d (B. F)
To P/L Account52800x2/3x80/100
Reserve BF
1,02,000
30,000
1,62,000
10,000
52800
356800
28160
24640
52 800
========
By work in progress:
Work certified
256000x100/80 3,20000
Work uncertified 3000
By P & L Account
Plant lost 3000
Material lost 4000
By plant returned: 2,000
Less: depreciation 200
By material in hand
By plant at site(30000-3000-2000) 25000
Less: depr 2500
By notional profit B/d
3,23,000
7000
1,800
2,500
22500
356800
=========
52 800
52 800
=========
WORK IN PROGRESS ACCOUNTTo contract A/c 3 23,000
3,23,000
==========
By Contract A/c (reserve)
By Balance c/d
24640
2,98,360
3,23,000
==========
Note: It is assumed that the contract has begun on 1/4/10.Example- 3Mr. A has undertaken several contract works. He maintains a separate record for each contract.From the records for the year ending 31-12-98, Prepare contract account for Contract No.50 andfind the amount transferred to profit and loss account.

The contract price was Rs. 15,00,000. Cash received up to 31-12-2008 was Rs. 6,00,000 which is80% of work certified . Material at site Rs. 16,000. Depreciation for Machine Rs. 16,000.
Solution:To materials:
Direct purchase
Issued from stores
Wages
Direct expenses
Machinery purchased
Establishment
Notional profit
To P/L account
Work in progress A/c
1,80,000
50,000
2,44,000
24,000
1,60,000
54,000
1,98,000
9,10,000
=======
1,05,600
92,400
1,98,000
========
By material at site
Machinery on hand (1,60,000-16000)
Work certified
By notional profit b/d
16,000
1, 44,000
7, 50,000
9, 10,000
=======
1,98,000
1,98,000
=======

Scanned by CamScanner

Scanned by CamScanner

Scanned by CamScanner
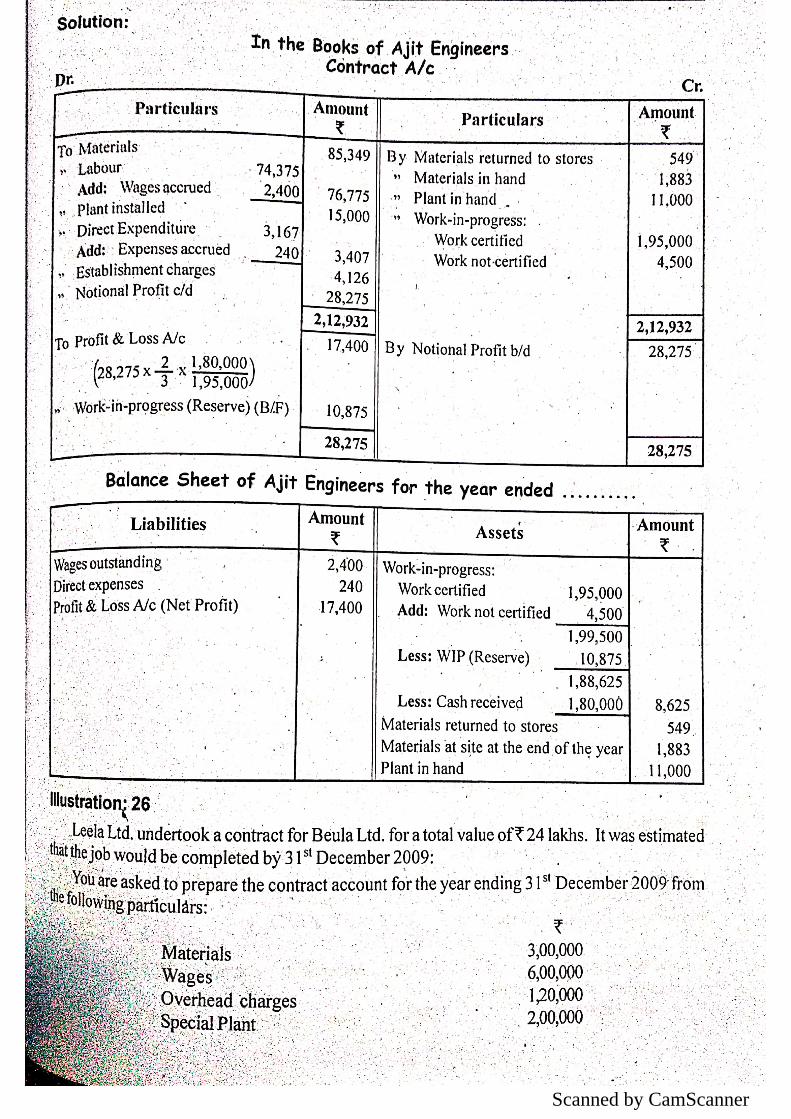
Scanned by CamScanner

Scanned by CamScanner

UNIT - IV
ACCOUNTING FOR MANAGEMENT- INTRODUCTION
Management accounting can be viewed as Management-orientedAccounting. Basically it is the study of managerial aspect of financialaccounting,” accounting in relation to management function". It is developedmainly to help the management in the discharge of its functions and for takingvarious decisions.
The Report of the Anglo-American Council of Productivity (1950) has alsogiven a definition of management accounting, which has been widely accepted.According to it, "Management accounting is the presentation of accountinginformation in such a way as to assist the management in creation of policy andthe day to day operation of an undertaking".
According to the Institute of Chartered Accountants of England and Wales“any form of accounting which enables a business to be conducted moreefficiently can be regarded as Management Accounting “
The term management accounting is composed of 'management' and'accounting ‘It is the use of Accounting Information for discharging Managementfunctions, especially planning and decision making.
FUNCTIONS OF MANAGEMENT ACCOUNTING
The basic function of management accounting is to assist the managementin performing its functions effectively. The functions of the management are
planning, organizing, directing and controlling. Management accounting helps
in the performance of each of these functions in the following ways:
(i) Provides data: Management accounting serves as a vital source of data formanagement planning. The accounts and documents are a repository of a vastquantity of data about the past progress of the enterprise, which are a must formaking forecasts for the future.
Modifies data: The accounting data required for managerial decisions is properlycompiled and classified. For example, purchase figures for different months maybe classified to know total purchases made during each period product-wise,supplier-wise and territory-wise.
(iii) Analyses and interprets data: The accounting data is analyzedmeaningfully for effective planning and decision-making. For this purpose thedata is presented in a comparative form. Ratios are calculated and likely trendsare projected.
(iv) Serves as a means of communicating: Management accounting provides ameans of communicating management plans upward, downward and outwardthrough the organization. Initially, it means identifying the feasibility andconsistency of the various segments of the plan. At later stages it keeps allparties informed about the plans that have been agreed upon and their roles inthese plans.
(v) Facilitates control: Management accounting helps in translating givenobjectives and strategy into specified goals for attainment by a specified time andsecures effective accomplishment of these goals in an efficient manner. All this ismade possible through budgetary control and standard costing which is anintegral part of management accounting.
(vi) Uses also qualitative information: Management accounting does notrestrict itself to financial data for helping the management in decision makingbut also uses such information which may not be capable of being measured inmonetary terms. Such information may be collected form special surveys,statistical compilations, engineering records, etc.
SCOPE OF MANAGEMENT ACCOUNTING
Management accounting is concerned with presentation of accountinginformation in the most useful way for the management. Its scope is, therefore,quite vast and includes within its fold almost all aspects of business operations.However, the following areas can rightly be identified as falling within the ambitof management accounting:
(i) Financial Accounting: Management accounting is mainly concerned with therearrangement of the information provided by financial accounting. Hence,management cannot obtain full control and coordination of operations without aproperly designed financial accounting system.
(ii) Cost Accounting: Standard costing, marginal costing, opportunity costanalysis, differential costing and other cost techniques play a useful role inoperation and control of the business undertaking.
(iii) Revaluation Accounting: This is concerned with ensuring that capital ismaintained intact in real terms and profit is calculated with this fact in mind.

(iv) Budgetary Control: This includes framing of budgets, comparison of actualperformance with the budgeted performance, computation of variances, finding oftheir causes, etc.
(v) Inventory Control: It includes control over inventory from the time it isacquired till its final disposal.
(vi) Statistical Methods: Graphs, charts, pictorial presentation, index numbersand other statistical methods make the information more impressive andintelligible.
(vii) Interim Reporting: This includes preparation of monthly, quarterly, half-yearly income statements and the related reports, cash flow and funds flowstatements, scrap reports, etc.
(viii) Taxation: This includes computation of income in accordance with the taxlaws, filing of returns and making tax payments.
(ix) Office Services: This includes maintenance of proper data processing andother office management services, reporting on best use of mechanical andelectronic devices.
(x) Internal Audit: Development of a suitable internal audit system for internalcontrol.
(xi)Management Information System [MIS]: Management Accounting serves asa centre for collection and dissemination of information.MIS is an essential partof Management Accounting.
MANAGEMENT ACCOUNTING AND FINANCIAL ACCOUNTING
Financial accounting and management accounting are closely interrelatedsince management accounting is to a large extent rearrangement of the dataprovided by financial accounting. Moreover, all accounting is financial in thesense that all accounting systems are in monetary terms and management isresponsible for the contents of the financial accounting statements. In spite ofsuch a close relationship between the two, there are certain fundamentaldifferences. These differences can be laid down as follows:
(i) Objectives: Financial accounting is designed to supply information in theform of profit and loss account and balance sheet to external parties likeshareholders, creditors, banks, investors and Government. Information issupplied periodically and is usually of such type in which management is notmuch interested. Management Accounting is designed principally for providingaccounting information for internal use of the management. Thus, financialaccounting is primarily an external reporting process while managementaccounting is primarily an internal reporting process.

(ii) Analyzing performance: Financial accounting portrays the position ofbusiness as a whole. The financial statements like income statement and balancesheet report on overall performance or statues of the business. On the otherhand, management accounting directs its attention to the various divisions,departments of the business and reports about the profitability, performance,etc., of each of them.
(iii) Data used: Financial accounting is concerned with the monetary record ofpast events. It is a post-mortem analysis of past activity and, therefore, out thedate for management action. Management accounting is accounting for futureand, therefore, it supplies data both for present and future duly analyzed indetail in the 'management language' so that it becomes a base for managementaction.
(iv) Monetary measurement: In financial accounting only such economic eventsfind place, which can be described in money. However, the management isequally interested in non-monetary economic events, viz., technical innovations,personnel in the organization, changes in the value of money, etc. These eventsaffect management's decision and, therefore, management accounting cannotafford to ignore them.
(v) Periodicity of reporting: The period of reporting is much longer in financialaccounting as compared to management accounting. The Income Statement andthe Balance Sheet are usually prepared yearly or in some cases half-yearly.Management requires information at frequent intervals and, therefore, financialaccounting fails to cater to the needs of the management. In managementaccounting there is more emphasis on furnishing information quickly and atcomparatively short intervals as per the requirements of the management.
(vi) Precision: There is less emphasis on precision in case of managementaccounting as compared to financial accounting since the information is meantfor internal consumption.
(vii) Nature: Financial accounting is more objective while managementaccounting is more subjective. This is because management accounting isfundamentally based on judgment rather than on measurement.
(viii) Legal compulsion: Financial accounting has more or less becomecompulsory for every business on account of the legal provisions of one or theother Act. However, a business is free to install or not to install system ofmanagement accounting.
COST ACCOUNTING AND MANAGEMENT ACCOUNTING
Cost accounting is the process of accounting for costs. It embraces theaccounting procedures relating to recording of all income and expenditure andthe preparation of periodical statements and reports with the object ofascertaining and controlling costs. It is, thus, the formal mechanism by means ofwhich the costs of products or services are ascertained and controlled. On theother hand, management accounting involves collecting, analyzing, interpretingand presenting all accounting information, which is useful to the management. Itis closely associated with management control, which comprises planning,executing, measuring and evaluating the performance of an organization. Thus,management accounting draws heavily on cost data and other informationderived from cost accounting.
Today cost accounting is generally indistinguishable from the so-calledmanagement accounting or internal accounting because it serves multiplepurposes. However, management accounting can be distinguished from costaccounting in one important respect.
Management accounting has a wider scope as compared to costaccounting. Cost accounting deals primarily with cost data while managementaccounting involves the considerations of both cost and revenue. Managementaccounting is an all inclusive accounting information system, which coversfinancial accounting, cost accounting, and all aspects of financial management.But it is not a substitute for other accounting functions. It involves a continuousprocess of reporting cost, financial and other relevant data in an analytical andinformative way to management.
We should not be very much concerned with boundaries of cost accountingand management accounting since they are complementary in nature. In theabsence of a suitable system of cost accounting, management accountant will notbe in a position to have detailed cost information and his function is bound tolose significance. On the other hand, the management accountant cannoteffectively use the cost data unless it has been reported to him in a meaningfuland informative form.
OBJECTIVES OF MANAGEMENT ACCOUNTING
The primary objective is to enable the management to maximize profits orminimize losses. The fundamental objective of management accounting is toassist management in their functions.

The other main objectives are:
1. Planning and policy formulation: planning is one of the primary functions ofmanagement. It involves forecasting on the basis of available information.
2. Help in the interpretation process: The main object is to present financialinformation. The financial information must be presented in easilyunderstandable manner.
3. Helps in decision making: Management accounting makes decision makingprocess more modern and scientific by providing significant information relatingto various alternatives.
4. Controlling: The actual results are compared with pre determined objectives.The management is able to control performance of each and every individual withthe help of management accounting devices.
5. Reporting: This facilitates management to take proper and timely decisions. Itpresents the different alternative plans before the management in a comparativemanner.
6. Motivating: Delegation increases the job satisfaction of employees andencourages them to look forward. so it serves as a motivational devise.
7. Helps in organizing: “return on capital employed” is one of the tools ifmanagement accounting. All these aspects are helpful in setting up effective andefficient organization.
8. Coordinating operations: It provides tools which are helpful in coordinating theactivities of different sections.
DISTINCTION BETWEEN FINANCIAL ACCOUNTING AND MANAGEMENTACCOUNTING
Financial accounting is concerned with the recording of day to day transactionsof the business. Management accounting is to provide the quantitative as well asthe qualitative to the management.
FINANCIAL ACCOUNTING MANAGEMENT ACCOUNTING
Objective
It gives the periodical reports toowners, creditors and government.
Its assist the internal management.
Nature
It concerned with historical records. It concerned with future plans and

policies.
Subject matter
It deals the business as a whole. It deals only a limited coverage.
Flexibility
Here standards are fixed by externalparties.
Standards are fixed by managementitself.
Legal compulsion
Statutory for every business. Adopted on voluntary basis.
Periodicity of reporting
The period is longer Its prepared when its required.
Precision
Transactions are very accurate. Sometimes approximate figures areused.
Unit of account
Recognizes whole business. Results of the divisions.
Coverage
Covers entire range of business inmonetary items.
Non monetary items are considered.
Publication and audit
Its very essential for the use of public It.s for management only.
Accounting principles
It has principles and conventions No such principles.
LIMITATIONS OF MANAGEMENT ACCOUNTING
Management accounting, being comparatively a new discipline, suffersfrom certain limitations, which limit its effectiveness. These limitations are asfollows:
1. Limitations of basic records: Management accounting derives its informationfrom financial accounting, cost accounting and other records. The strength andweakness of the management accounting, therefore, depends upon the strengthand weakness of these basic records. In other words, their limitations are alsothe limitations of management accounting.

2. Persistent efforts. The conclusions draws by the management accountant arenot executed automatically. He has to convince people at all levels. In otherwords, he must be an efficient salesman in selling his ideas.
3. Management accounting is only a tool: Management accounting cannotreplace the management. Management accountant is only an adviser to themanagement. The decision regarding implementing his advice is to be taken bythe management. There is always a temptation to take an easy course of arrivingat decision by intuition rather than going by the advice of the managementaccountant.
4. Wide scope: Management accounting has a very wide scope incorporatingmany disciplines. It considers both monetary as well as non-monetary factors.This all brings inexactness and subjectivity in the conclusions obtained through it.
5. Top-heavy structure: The installation of management accounting systemrequires heavy costs on account of an elaborate organization and numerous rulesand regulations. It can, therefore, be adopted only by big concerns.
6. Opposition to change: Management accounting demands a break away fromtraditional accounting practices. It calls for a rearrangement of the personnel andtheir activities, which is generally not like by the people involved.
7. Evolutionary stage: Management accounting is still in its initial stage. It has,therefore, the same impediments as a new discipline will have, e.g., fluidity ofconcepts, raw techniques and imperfect analytical tools. This all creates doubtabout the very utility of management accounting.
RECENT TRENDS IN MANAGEMENT REPORTING
Reporting is the process of communicating of information to those whoneed such information relevant for decision making. Some trends in reporting are:
1. Financial reporting using IFRS
International Financial Reporting Standards [IFRS] is recognized asglobal financial reporting standards. From 1st April 2011 Indian AccountingStandards were merged with the new IFRS.IFRS ensures more transparency,consistency and uniformity in accounting policies.
2. Interim Reporting
Interim Reporting is the reporting of financial results of any period that isshorter than a fiscal year. SEBI guidelines require companies listed on StockExchanges to publish their financial results on quarterly basis.
3. Segmental Reporting [AS-7]
It is the reporting of the operation segments of a company in thedisclosure accompanying financial statements. AS 17 requires to report asegment if it has at least 10% of the revenue, 10% of the profit or loss, or 10% ofthe combined assets of the company.
4. Corporate Governance Report
The SEBI regulates governance practices of companies listed on StockExchanges. These regulations are notified under clause 49 of the ListingAgreements of Stock Exchanges. It prescribes the standards to be followed in thegovernance of the companies.
5. Reporting of Information Relating to Group Companies [AS 21]
AS 21 requires companies to prepare consolidated FinancialStatements. It is the presentation of subsidiary companies. The objective ofconsolidation is to show the performance of the group as if it were a single entity.The inter group transactions are eliminated in the consolidated FinancialStatements.
Meaning of Ratio
A ratio is a simple arithmetical expression of the relationship of onenumber to another. It may be defined as the indicated quotient of twomathematical expressions. According to Accountant’s Handbook by Wixon , Kelland Bedford, a ratio is an expression of the quantitative relationship between twonumbers. In simple language ratio is one number expressed in terms of anotherand can be worked out by dividing one number into the other. A ratio can beexpressed in the form of a fraction, number of times, percentage or in proportion.
Nature of Ratio analysis
Ratio analysis is a technique of analysis and interpretation of financialstatements. It is the process of establishing and interpreting various ratios forhelping in making certain decisions. It is not an end in itself and is only a meansof better understanding of financial strengths and weakness of a firm. A ratio willbe meaningful only when it is analysed and interpreted. The following are thefour steps involved in ratio analysis.
1. Selection of relevant data from the financial statements depending upon theobjective of the analysis.
2. Solution of appropriate ratios from the above data

3. Comparison of the calculated ratios with the ratios of the same firm in thepast, or the ratios developed from projected financial statements or the ratios ofsome other firms or the comparison with ratios of the industry to which the firmbelongs.
4. Interpretation of the ratios.
Ratio analysis will be meaningful only when the analyst will consider thefollowing factors while interpreting ratios:
1. Accuracy of financial statements
2. Clear about the objective or Purpose of analysis
3. Selection of appropriate ratios that suits the need of the analyst
4. Use of appropriate standards while analyzing ratios
5. Calibre of the analyst
6. Analyst should understand that the ratios provide only a base
Use and Significance of Ratio analysis
Mainly the persons interested in the analysis of the financial statementscan be grouped under three heads (i) Owners or investors, (ii) Creditors and (iii)Financial executives. The importance of analysis varies materially with thepurpose for which it is calculated. The primary information which seeks to beobtained from these statements differs considerable reflecting the purpose thatthe statement is to serve.
The significance of these ratios varies for these three groups as theirpurpose differs widely. These investors are mainly concerned with the earningcapacity of the company whereas the creditors including bankers and financialinstitutions are interesting in knowing the ability of enterprise to meet itsfinancial obligations timely. The financial executives are concerned with evolvinganalytical tools that will measure and compare costs, efficiency, liquidity andprofitability with a view to making intelligent decisions.
{a} Managerial uses of Ratio analysis
1. Helps in decision making
2. Helps in financial forecasting and planning
3. Helps in communicating
4. Helps in co-ordination
5. Helps in control
{b}Utility to Share holders/ Investors
An investor is particularly interested to know about the Long term financialposition and profitability position. Ratio analysis will be useful to the investor inmaking up his mind whether present financial position of the concern warrantsfurther investment or not.
{c}Utility to Creditors
The creditors or suppliers extend short term credit to the concern. They areinterested to know whether financial position of the concern warrants theirpayments at a specified time or not.
{d}utility to the Employees
The employees are also interested in the financial position of the concernespecially profitability because their wage increases and amount of fringe benefitsare related to the volume of profits earned by the concern.
{e}Utility to government
Government is interested to know the overall strength of the industry.Various financial statements published by industrial units are used to calculateratios for determining short term, long term and overall financial position of theconcerns. Ratio analysis also serves this purpose.
{f}Tax audit requirements
Clause 32 of the Income tax Act requires that the business shouldcalculate Gross Profit/turnover, Net Profit/turnover , stock in trade/ turnoverand Material consumed/finished goods produced ratios.
LIMITATIONS OF RATIO ANALYSIS
The ratio analysis is one of the most powerful tools of financialmanagement. Though ratios are simple to calculate and easy to understand, theysuffer from some serious limitations.
1. Limited use of a single ratio. A single ratio usually does not convey muchof a sense. To make a better interpretation a number of ratios have to becalculated which is likely to confuse the analyst than help him in making anymeaningful conclusion.
2. Lack of adequate standards. There are no well accepted standards orrules of thumb for all ratios which can be accepted as norms. It rendersinterpretation of the ratios difficult.

3. Inherent limitations of accounting. Like financial statements, ratios alsosuffer from the inherent weakness of accounting records such as their historicalnature. Ratios of the past are not necessarily true indicators of the future.
4. Change of accounting procedure. Change in accounting procedure by afirm often makes ratio analysis misleading. E.g., a change in the valuationmethods of inventories, from FIFO to LIFO increases the cost of sales andreduces considerably the value of closing stocks which makes stock turnoverratio to be lucrative and an unfavorable gross profit ratio.
5. Window dressing. Financial statements can easily be window dressed topresent a better picture of its financial and profitability position to outsiders.Hence, one has to be very careful in making a decision from ratios calculatedfrom such financial statements. But it may be very difficult for an outsider toknow about the window dressing made by the firm.
6. Personal bias Ratio are only means of financial analysis and not an endin itself. Ratios have to be interpreted and different people may interpret thesame ratio in different ways.
7. Incomparable. Not only industries differ in their nature but also thefirms of the similar business widely differ in their size and accounting proceduresetc. It makes comparison of ratios difficult and misleading. Moreover,comparisons are made difficult due to differences in definitions of variousfinancial terms used in ratio analysis.
8. Absolute Figures Distortive. Ratios devoid of absolute figures may provedistortive as ratio analysis is primarily a quantitative analysis and not aqualitative analysis
9. Price level changes. While making ratio analysis, no consideration ismade to the changes in price levels and this makes the interpretation of ratiosinvalid.
10. Ratios no substitutes. Ratio analysis is merely a tool of financialstatements. Hence, ratios become useless if separated from the statements fromwhich they are computed.
CLASSIFICATION OF RATIOS
The use of ratio analysis is not confined to financial manger only. There aredifferent parties interested in the ratio analysis for knowing the financial positionof the firm for different purposes. In view of various users of ratios, there aremany types of ratios which be calculated from the information given in thefinancial statements. The particular purpose of the use determines the particularratios that might be used for financial analyses

Ratios can be classified on the basis of function, significant and statementof ratios or traditional classification of ratios.
On the basis of the functions performed ratios can be classified in to thefollowing types :-
FUNCTIONAL CLASSIFICATION OF RATIOS
LIQUIDITY RATIOS LONG TERMSOLVENCY ANDLEVERAGE
ACTIVITY RATIOSOR ASSETMANAGEMENTRATIOS
PROFITABILITYRATIOS
[A]1.Current Ratio Debt/EquityRatio
InventoryTurnover Ratio
In relation to Sales
1.Gross Profit Ratio
2.Liquid(Acid)Ratio or QuickRatio
Debt to totalcapital ratio
Debtors TurnoverRatio
2.Operating Ratio
3.Absolute Liquidor Cash ratio
Interestcoverage Ratio
Fixed Assetsturnover Ratio
3.Operating ProfitRatio
[B]1.Debtorsturnover Ratio
Cash flow/Debtratio
Total assetsturnover ratio
4.Net profit Ratio
2.CreditorsTurnover ratio
Capital GearingRatio
Working capitalTurnover ratio
5.Expense Ratio
3.Inventoryturnover ratio
Payables turnoverratio
In relation toInvestments
1.Return onInvestments
Capital employedturnover ratio
2.Return on capital
3.Return on EquityCapital
4.Return on TotalResources
5.Earnings Pershare
6.Price Earningratio

ANALYSIS OF SHORT-TERM FINANCIAL POSITION OR TEST OF LIQUIDITY
The short term creditors of a company like suppliers of goods of credit andcommercial banks providing short-term loans are primarily interested in knowingthe company’s ability to meet its current or short term obligations as and whenthese become due. The short term obligations of a firm can be met only whenthere are sufficient liquid assets. Therefore, a firm must ensure that it does notsuffer from lack of liquidity or the capacity to pay its current obligations. Even avery high degree of liquidity is not good for the firm because such a situationrepresents unnecessarily excessive funds of the firm being tied up in currentassets. Two types of ratios can be calculated for measuring short term financialposition or short term solvency of the firm.
A. Liquidity Ratios B. Current assets movement or Efficiency Ratios
A. Liquidity Ratios
Liquidity refers to the ability of a concern to meet its current obligations as andwhen these become due. The short term obligations are met by realizing amountsfrom current, floating or circulating assets. The current assets should either beliquid or near liquidity. These should be convertible into cash for payingobligations of short term nature. The sufficiency or insufficiency of current assetsshould be assessed by comparing them with short term (current) Liabilities. Ifcurrent assets can pay off the current liabilities, then liquidity position will besatisfactory. The important liquidity ratios include
1. Current ratio
Current ratio may be defined as the relationship between current assetsand current liabilities. This ratio, also known as working capital ratio, is ameasure of general liquidity and is most widely used to make the analysis of ashort term financial position or liquidity of the firm. It is calculated by dividingthe total of current assets by total of the current liabilities.
Current ratio= Cu rrent Assets
Cu rrent Lia bilites
Current assets include cash and those assets which can be converted intocash within a short period of time, generally, one year, such as marketablesecurities, bills receivables, sundry debtors, inventories, work-in-progress etc.Prepaid expenses should also be included in current assts because theyrepresent payments made in advance which will not have to be paid in ear future.Current liabilities are those obligations which are payable within a short periodof generally one year and include outstanding expenses, bills payable, sundry

creditors, accrued expenses, short term advances, income tax payable, dividendpayable, etc. Bank overdraft should also generally be included in currentliabilities because it represents short term arrangement with the bank and ispayable within a short period. But where bank overdraft is a permanent or longterm arrangement with the bank, it should be excluded.
A relatively high current ratio is an indication that the firm is liquid andhas the ability to pay its current obligations in time as and when they becomedue. An increase in current ratio represents the improvement in the liquidityposition of the firm while a decrease in the current ratio indicates that there hasbeen deterioration in the liquidity position of the firm. As a convention aminimum of 2: 1 is considered as the standard current ratio of a firm.
Illustration 1: On December 31, 2010 Company B had total asset of 150,000,equity of 75,000, non-current assets of 50,000 and non-current liabilities of0,000. Calculate the current ratio.
SolutionTo calculate current ratio, we need to calculate current assets and currentliabilities first:Current Assets = Total Asset − Non-Current Assets =150,000 − 50,000 = 100,000Total Liabilities = Total Assets − Total Equity = 150,000 − 75,000 =75,000Current Liabilities = 75,000 − 50,000 = 25,000Current Ratio = 100,000 ÷ 25,000 = 4
Illustration 2
X Ltd. has a current ratio of 3.5:1 and quick ratio of 2:1. If excess of currentassets over quick assets represented by stock is Rs. 1, 50,000, calculate currentassets and current liabilities.
Solution
Let Current Liabilities = x
Current Assets = 3.5x
And Quick Assets = 2x
Stock = Current Assets – Quick Assets
1,50,000 = 3.5x – 2x
1,50,000 = 1.5x
x = Rs.1,00,000
Current Assets = 3.5x = 3.5 × 1,00,000 = Rs. 3,50,000.

2. Quick Ratio
Quick ratio, also known as Acid Test Ratio or Liquid Ratio, is a morerigorous test of liquidity than the current ratio. The term liquidity refers to theability of a firm to pay its short term obligations as and when they become due.Quick ratio may be defined as the relationship between quick/liquid assets andcurrent or liquid liabilities. An asset is said to be liquid if it can be converted intocash within a short period without loss of value. In that sense cash in hand andcash at bank are the most liquid assets. The other liquid assets include billsreceivable, sundry debtors, marketable securities and short term or temporaryinvestments. Prepaid expenses and Inventories cannot be termed as liquid assetbecause they cannot be converted into cash without loss of value. A ratio of 1:1 isconsidered as satisfactory quick ratio.
Quick Ratio = Qu ick / Liqu id Assets
Cu rrent Lia bilites
Illustration 3
Calculate the current ratio from the following information:
Working capital Rs. 9,60,000; Total debts Rs.20,80,000; Long-term LiabilitiesRs.16,00,000; Stock Rs. 4,00,000; prepaid expenses Rs. 80,000.
Solution
Current Liabilities = Total debt- Long term debt
= 20,80,000 – 16,00,000
= 4,80,000
Working capital = Current Assets – Current liability
9,60,000 = Current Assets – 4,80,000
Current Assets = 14,40,000
Quick Assets = Current Assets – (stock + prepaid expenses)
= 14,40,000 – (4,00,000 + 80,000)
= 9,60,000
Current ratio = Current Assets / Current liabilities
= 14,40,000/4,80,000
= 3:1

Quick ratio = Quick Assets / Current liabilities
= 9,60,000/4,80,000
= 2:1
Illustration 4
Calculate quick ratio from the information
Stock Rs .60,000 ; Cash 40,000; Debtors 40,000; Creditors 50,000
Bills Receivable 20,000; Bills Payable 30,000; Advance Tax 4,000
Bank Overdraft 4,000; Debentures Rs. 2,00,000; Accrued interest Rs. 4,000.
Solution
Quick Assets = Current Assets – Stock – Advance Tax
Quick Assets = Rs. 1,68,000 – (Rs. 60,000 + Rs. 4,000) = Rs. 1,04,000
Current Liabilities = Rs. 84,000
Quick ratio = Quick Assets / Current Liabilities
= Rs. 1,04,000 : Rs. 84,000
= 1.23:1
3. Absolute Liquid Ratio or Cash Ratio
Absolute Liquid Ratio is calculated by dividing Absolute Liquid assets bycurrent Liabilities .Absolute Liquid Assets include cash in hand and at bank andmarketable securities or temporary investments. The acceptable norm for thisratio is 50% or 0.5 :1 or 1 :2.
Illustration 5
Calculate Absolute Liquid ratio from the following information
Goodwill 50000 Cash at Bank 30000
Plant and machinery 400000 Inventories 75000
Trade investments 200000 Bank overdraft 70000
Marketable securities 150000 Sundry creditors 60000
Bills receivable 40000 Bills payable 90000
Cash in hand 45000 Outstanding expenses 30000

Solution
Absolute Liquid Ratio = Absolu te Liqu id Assets
Cu rrent Lia bilites
Absolute Liquid assets = Mark. Securities+ Cash in hand and at Bank
= 150000+45000+30000 = 225000
Current Liabilities = BOD + Creditors + B/P+O/S Expenses
= 70000+60000+90000+30000 = 250000
Absolute Liquid Ratio = Absolu te Liqu id Assets
Cu rrent Lia bilites= 2 2 5 0 0 0
2 5 0 0 0 0= 0.9
Practice Problems
1. Find out current ratio.
Gross Debtors Rs. 20,000; Provision for Bad debts Rs. 3,000; Bills receivableRs. 13,000; Stock twice of net debtors; Cash in hand Rs. 16,000; Advance tosuppliers Rs. 15,000; Creditors for goods Rs. 27,000; Bills payable Rs. 8,000;Outstanding expenses Rs. 15,000; Prepaid expenses Rs. 5,000 Investment (Longterm) Rs. 12,000;
[Ans. Current Ratio 2:1]
2. Find out current liabilities when current ratio is 2.5:1 and current assetsare Rs. 75,000.
[Ans. Current Liabilities Rs. 30,000]
3. The ratio of current assets (Rs. 6, 00,000) to current liabilities is 1.5:1. Theaccountant of this firm is interested in maintaining a current ratio of 2:1 bypaying some part of current liabilities. You are required to suggest him theamount of current liabilities which must be paid for this purpose.
[Ans. Rs. 2, 00,000]
4. A firm had current liabilities of Rs. 90,000. It then acquired stock-in-trade at acost of Rs. 10,000 on credit. After this acquisition the current ratio was 2:1.Determine the size of current assets and working capital after and before thestock was acquired.
[Ans. C.A. Rs. 2,00,000, Rs. 1,90,000; W.C. Rs. 1,00,000, Rs. 1,00,000]

5.A Ltd. company has a current ratio of 3.5:1 and acid test ratio of 2:1. Ifthe inventory is Rs. 30,000, find out its total current assets and total currentliabilities.
[Ans. Current Assets Rs. 70,000; Current Liabilities Rs. 20,000]
6.Given: Current ratio 2.8; Acid test ratio 1.5; Working capital = Rs.1,62,000.
Find out: Current assets;, Current liabilities; Liquid Assets.
[Ans. A) Rs. 2,52,000; (b) Rs. 90,000; (c) 1,35,000]
ANALYSIS OF SOLVENCY – SOLVENCY RATIOS
The term solvency refers to the ability of a firm to meet all liabilities in fullin the event of liquidation. It is the long- term liquidity of the firm. The Balancesheet discloses the long term financial position in the form of sources andapplications of long term funds in the business. The important measures ofsolvency and analysis of capital structure are
1. Debt-Equity Ratio
A firm uses both equity and debt for financing its assets. The ratio of thesetwo sources of funds is turned as Debt Equity Ratio.
Debt Equity Ratio = Tot al borrow ed funds
Ow ned fund s
Total Borrowed funds include both long term and short term borrowings orcurrent liabilities. It is the aggregate of bonds, debentures, bank loans and all thecurrent liabilities.
Owned funds include equity capital, preference capital and all items of reserveand surplus.
The standard norm of Debt-Equity ratio is 2:1. It indicates that total borrowedfund can be two times of equity or owned funds. The intention is to maximize thereturn of equity share holders by taking, advantage of cheap borrowed funds.
2. Capital Gearing Ratio
This ratio indicates the relationship between fixed interest bearingsecurities and equity shareholders funds.
Capital Gearing Ratio = Fixed Income bearing securites
Equ ity Shareholders funds
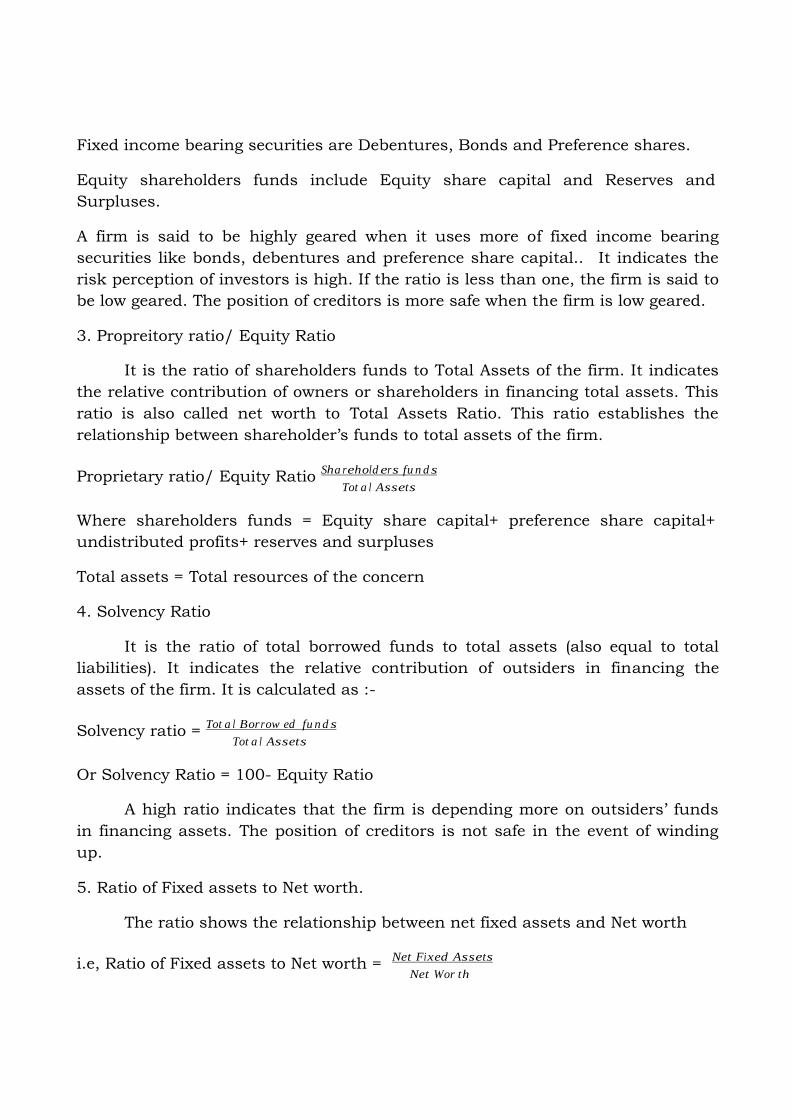
Fixed income bearing securities are Debentures, Bonds and Preference shares.
Equity shareholders funds include Equity share capital and Reserves andSurpluses.
A firm is said to be highly geared when it uses more of fixed income bearingsecurities like bonds, debentures and preference share capital.. It indicates therisk perception of investors is high. If the ratio is less than one, the firm is said tobe low geared. The position of creditors is more safe when the firm is low geared.
3. Propreitory ratio/ Equity Ratio
It is the ratio of shareholders funds to Total Assets of the firm. It indicatesthe relative contribution of owners or shareholders in financing total assets. Thisratio is also called net worth to Total Assets Ratio. This ratio establishes therelationship between shareholder’s funds to total assets of the firm.
Proprietary ratio/ Equity Ratio Sha rehold ers fu n d s
Tot a l Assets
Where shareholders funds = Equity share capital+ preference share capital+undistributed profits+ reserves and surpluses
Total assets = Total resources of the concern
4. Solvency Ratio
It is the ratio of total borrowed funds to total assets (also equal to totalliabilities). It indicates the relative contribution of outsiders in financing theassets of the firm. It is calculated as :-
Solvency ratio = Tot a l Borrow ed fu n d s
Tot a l Assets
Or Solvency Ratio = 100- Equity Ratio
A high ratio indicates that the firm is depending more on outsiders’ fundsin financing assets. The position of creditors is not safe in the event of windingup.
5. Ratio of Fixed assets to Net worth.
The ratio shows the relationship between net fixed assets and Net worth
i.e, Ratio of Fixed assets to Net worth = Net Fixed Assets
Net Wor th

6. Funded Debt to capitalization
This ratio indicates the contribution of owners in financing fixed assets. Ifthe ratio is less than one, it is considered as ideal. It means that the whole offixed assets and a part of working capital are financed from shareholders funds.If the ratio is more than one, it means that a part of the fixed assets is financedusing borrowed funds.
Funded Debt to capitalization = Lon g term d ebt
Tota l Assets or Tot a l Lia bil ites
Illustration 6
The following Balance sheets of ABC Limited is given. Calculate.
(a)Current Ratio
(b)Acid Test Ratio
(c)Debt- Equity Ratio
(d)Proprietary ratio
(e) Capital gearing ratio
(f)Fixed assets to shareholders Funds Ratio
Balance sheet as at 31st March 2012
Liabilities Amount Assets Amount
Equity share capital 150000 Fixed Assets 150000
5% Preference share capital 20000 Inventory 50000
General Reserve 25000 debtors 25000
Profit and Loss A/c 20000 cash 90000
6% Debentures 55000
Creditors 45000
315000 315000
Solution
(a)Current ratio = current assets / current liabilities = 165000/45000 = 3.67 :1
Current assets = inventory + debtors + cash = 50000+25000+90000 = 165000

[b] Liquid ratio = liquid liabilities / current liabilities
Liquid assets -= current assets – inventory = 165000-50000 = 115000
Liquid ratio = 165000/45000 = 2.56 :1
[c] debt equity ratio = outsiders funds / shareholders funds
Outsiders funds = debentures + creditors = 55000+45000 = 100000
Shareholders’ funds = equity capital + preference capital + reserves+ profit andloss account
= 150000+20000+25000+20000 = 215000
Debt equity ratio = 100000/215000 = 0.46 :1
[d]Proprietary ratio = Shareholder’s Funds / Total Assets
Shareholder’s Funds = 215000 / 315000 = 0.68 :1
[e] Capital gearing ratio = Fixed Income bearing Securities
Equity Shareholders fund
= 75000/195000 = 0.38 :1
[f] Fixed assets to shareholders funds = Fixed Assets
Shareholders fund
= 150000/215000 = 0.69 :1
Activity Ratios
Activity ratios, sometimes referred to as operating ratios or management ratios,measure the efficiency with which a business uses its assets, such asinventories, accounts receivable, and fixed (or capital) assets. The morecommonly used operating ratios are the average collection period, the inventoryturnover, the fixed assets turnover, and the total assets turnover.
These ratios indicate the efficiency of management in the use of resources,both short term and long term. The overall performance of a company isevaluated on the basis of its ability to make sales using minimum resources.Turnover ratios reflect the speed at which assets are utilized in effecting sales. Ahigher turnover ratio means efficient use of funds by management in generatingmore sales. The important turnover ratios are :

1. Inventory turnover ratio
2. Debtors turnover ratio
3. Creditors turnover ratio
4. Total assets turnover ratio
5. fixed assets turnover ratio
6. Working capital turnover ratio
1. Inventory turnover ratio
Inventory Turnover: This ratio measures the number of times a company'sinvestment in inventory is turned over during a given year. The higher theturnover ratio, the better, since a company with a high turnover requires asmaller investment in inventory than one producing the same level of sales with alow turnover rate. Company management has to be sure, however, to keepinventory at a level that is just right in order not to miss sales.
This ratio indicates the efficiency in turning over inventory and can be comparedwith the experience of other companies in the same industry. It also providessome indication as to the adequacy of a company's inventory for the volume ofbusiness being handled. If a company has an inventory turnover rate that isabove the industry average, it means that a better balance is being maintainedbetween inventory and cost of goods sold. As a result, there will be less risk forthe business of being caught with top-heavy inventory in the event of a decline inthe price of raw materials or finished products.
Cost of good s sold
Inventory
Some companies calculate the inventory turnover by using sales instead of costof goods sold as the numerator. This may be less appropriate because salesinclude a profit markup which is absent from inventory.
Inventory includes all types of stocks like raw materials, work in progress,finished goods, consumable stores, spares etc. Inventory turnover ratio is therelationship of cost of goods sold to average inventory. It is computed as:
Inventory turnover ratio = cost of goods sold/ average inventory
Cost of goods sold = net sales – gross profit
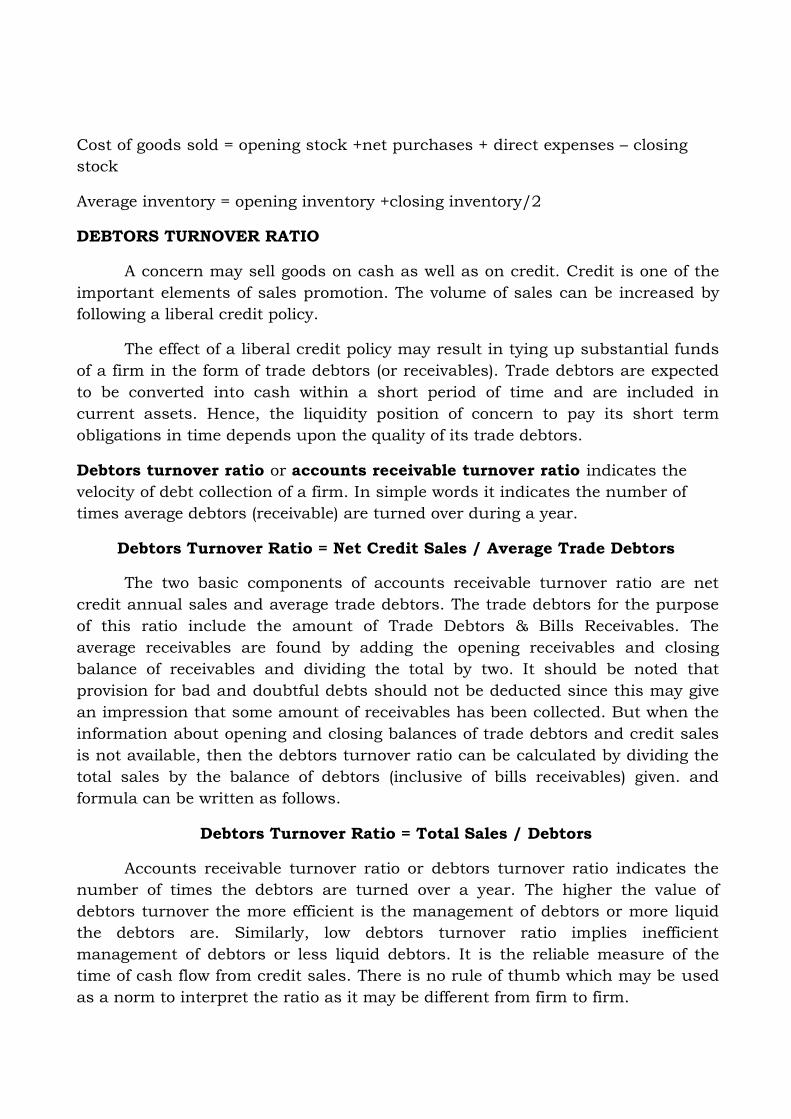
Cost of goods sold = opening stock +net purchases + direct expenses – closingstock
Average inventory = opening inventory +closing inventory/2
DEBTORS TURNOVER RATIO
A concern may sell goods on cash as well as on credit. Credit is one of theimportant elements of sales promotion. The volume of sales can be increased byfollowing a liberal credit policy.
The effect of a liberal credit policy may result in tying up substantial fundsof a firm in the form of trade debtors (or receivables). Trade debtors are expectedto be converted into cash within a short period of time and are included incurrent assets. Hence, the liquidity position of concern to pay its short termobligations in time depends upon the quality of its trade debtors.
Debtors turnover ratio or accounts receivable turnover ratio indicates thevelocity of debt collection of a firm. In simple words it indicates the number oftimes average debtors (receivable) are turned over during a year.
Debtors Turnover Ratio = Net Credit Sales / Average Trade Debtors
The two basic components of accounts receivable turnover ratio are netcredit annual sales and average trade debtors. The trade debtors for the purposeof this ratio include the amount of Trade Debtors & Bills Receivables. Theaverage receivables are found by adding the opening receivables and closingbalance of receivables and dividing the total by two. It should be noted thatprovision for bad and doubtful debts should not be deducted since this may givean impression that some amount of receivables has been collected. But when theinformation about opening and closing balances of trade debtors and credit salesis not available, then the debtors turnover ratio can be calculated by dividing thetotal sales by the balance of debtors (inclusive of bills receivables) given. andformula can be written as follows.
Debtors Turnover Ratio = Total Sales / Debtors
Accounts receivable turnover ratio or debtors turnover ratio indicates thenumber of times the debtors are turned over a year. The higher the value ofdebtors turnover the more efficient is the management of debtors or more liquidthe debtors are. Similarly, low debtors turnover ratio implies inefficientmanagement of debtors or less liquid debtors. It is the reliable measure of thetime of cash flow from credit sales. There is no rule of thumb which may be usedas a norm to interpret the ratio as it may be different from firm to firm.

Illustration 7
Credit sales 25,000; Return inwards1,000; Debtors 3,000; Bills Receivables1,000.
Calculate debtors turnover ratio
Debtors Turnover Ratio = Net Credit Sales / Average Trade Debtors
= 24,000 / 4,000
= 6 Times
Average Collection Period Ratio:
Average Collection Period. This ratio measures how long a firm's averagesales remains in the hands of its customers. A longer collection periodautomatically creates a larger investment in assets.
The average collection period is calculated in two steps. The first step iscalculating the average daily sales, which is done by dividing the total annual netsales by 365 days. The second step is dividing the average daily sales intoaccounts receivable.
Accountsreceivable
Average dailysales
The Debtors/Receivable Turnover ratio when calculated in terms of days isknown as Average Collection Period or Debtors Collection Period Ratio.
The average collection period ratio represents the average number of days forwhich a firm has to wait before its debtors are converted into cash.
Following formula is used to calculate average collection period:
(Trade Debtors × No. of Working Days) / Net Credit Sales
Illustration 8
Credit sales 25,000; Return inwards 1,000; Debtors 3,000; Bills Receivables1,000.

Calculate average collection period.
Solution:
Average collection period can be calculated as follows:
Average Collection Period = (Trade Debtors × No. of Working Days) / Net CreditSales
4,000 × 360 / 24,000 = 60 Days
Debtors and bills receivables are added.For calculating this ratio usually the number of working days in a year is
assumed to be 360.
This ratio measures the quality of debtors. A short collection period impliesprompt payment by debtors. It reduces the chances of bad debts. Similarly, alonger collection period implies too liberal and inefficient credit collectionperformance. It is difficult to provide a standard collection period of debtors.
Creditors / Accounts Payable Turnover Ratio:
This ratio is similar to the debtor’s turnover ratio. It compares creditorswith the total credit purchases.
It signifies the credit period enjoyed by the firm in paying creditors.Accounts payable include both sundry creditors and bills payable. Same asdebtor’s turnover ratio, creditors turnover ratio can be calculated in two forms,creditors turnover ratio and average payment period.
Following formula is used to calculate creditors turnover ratio:
Creditors Turnover Ratio = Credit Purchase / Average Trade Creditors
Average payment period ratio gives the average credit period enjoyed from thecreditors. It can be calculated using the following formula:
Average Payment Period = Trade Creditors / Average Daily Credit Purchase
Average Daily Credit Purchase= Credit Purchase / No. of working days in a year
Or
Average Payment Period = (Trade Creditors × No. of Working Days) / Net CreditPurchase
(In case information about credit purchase is not available total purchases may beassumed to be credit purchase.)

The average payment period ratio represents the number of days by thefirm to pay its creditors. A high creditor’s turnover ratio or a lower credit periodratio signifies that the creditors are being paid promptly. This situation enhancesthe credit worthiness of the company. However a very favorable ratio to this effectalso shows that the business is not taking the full advantage of credit facilitiesallowed by the creditors.
Fixed Assets Turnover: The fixed (or capital) assets turnover ratio measureshow intensively a firm's fixed assets such as land, buildings, and equipment areused to generate sales. A low fixed assets turnover implies that a firm has toomuch investment in fixed assets relative to sales; it is basically a measure of
productivity. Sales
Fixed Assets
Fixed assets turnover ratio is also known as sales to fixed assets ratio. This ratiomeasures the efficiency and profit earning capacity of the concern.
Higher the ratio, greater is the intensive utilization of fixed assets. Lower ratiomeans under-utilization of fixed assets. The ratio is calculated by using followingformula:
Fixed assets turnover ratio turnover ratio is also calculated by the followingformula:
Fixed Assets Turnover Ratio = Cost of Sales / Net Fixed Asset
If a business shows a weakness in this ratio, its plant may be operating belowcapacity and the manage should be looking at the possibility of selling the lessproductive assets.
Total Assets Turnover. This ratio takes into account both net fixed asset; andcurrent assets. It also gives an indication of the efficiency with which assets areused; a low ratio means that excessive assets are employed to generate salesand/or that some assets (fixed or current assets) should be liquidated or
reduced. Sales
Tota l Assets
Working Capital Turnover Ratio:
Working capital turnover ratio indicates the velocity of the utilization of networking capital.

This ratio represents the number of times the working capital is turned over inthe course of year and is calculated as follows:
Following formula is used to calculate working capital turnover ratio
Working Capital Turnover Ratio = Cost of Sales / Net Working Capital
The two components of the ratio are cost of sales and the net working capital. Ifthe information about cost of sales is not available the figure of sales may betaken as the numerator. Net working capital is found by deduction from the totalof the current assets the total of the current liabilities.
Illustration 9
Cash 10,000Bills Receivables 5,000Sundry Debtors 25,000Stock 20,000Sundry Creditors 30,000Cost of sales 150,000
Calculate working capital turnover ratio
Solution:-
Working Capital Turnover Ratio = Cost of Sales / Net Working Capital
Current Assets = 10,000 + 5,000 + 25,000 + 20,000 = 60,000
Current Liabilities = 30,000
Net Working Capital = Current assets – Current liabilities
= 60,000 − 30,000 = 30,000
So the working Capital Turnover Ratio = 150,000 / 30,000 = 5 times
The working capital turnover ratio measures the efficiency with which theworking capital is being used by a firm. A high ratio indicates efficient utilizationof working capital and a low ratio indicates otherwise. But a very high workingcapital turnover ratio may also mean lack of sufficient working capital which isnot a good situation.
PROFITABILITY RATIOS
Profitability ratios may be classified in to two types :

[a] operating profitability ratios
[b]overall profitability ratios
[a] operating profitability ratios
In this type of analysis profit is related to the volume of operation or sales.The important measures of operating profitability are :
1. Gross profit ratio
2. Operating profit ratio
3. Operating ratio
4. Net profit ratio
1. Gross Profit Ratio (GP Ratio)::
Gross profit ratio (GP ratio) is the ratio of gross profit to net sales expressedas a percentage. It expresses the relationship between gross profit and sales.
The basic components for the solution of gross profit ratio are gross profit andnet sales. Net sales mean those sales minus sales returns. Gross profit would bethe difference between net sales and cost of goods sold. Cost of goods sold in thecase of a trading concern would be equal to opening stock plus purchases, minusclosing stock plus all direct expenses relating to purchases. In the case ofmanufacturing concern, it would be equal to the sum of the cost of raw materials,wages, direct expenses and all manufacturing expenses. In other words, generallythe expenses charged to profit and loss account or operating expenses areexcluded from the solution of cost of goods sold.
Following formula is used to calculate gross profit ratios:
[Gross Profit Ratio = (Gross profit / Net sales) × 100]
Illustration 10
Total sales = 520,000; Sales returns = 20,000; Cost of goods sold 400,000
Required: Calculate gross profit ratio.
Solution :
Gross profit = [(520,000 – 20,000) – 400,000]
= 100,000

Gross Profit Ratio = (100,000 / 500,000) × 100
= 20%
Gross profit ratio may be indicated to what extent the selling prices of goods perunit may be reduced without incurring losses on operations. It reflects efficiencywith which a firm produces its products. As the gross profit is found bydeducting cost of goods sold from net sales, higher the gross profit better it is.There is no standard GP ratio for evaluation. It may vary from business tobusiness. However, the gross profit earned should be sufficient to recover alloperating expenses and to build up reserves after paying all fixed interest chargesand dividends.
Causes/reasons of increase or decrease in gross profit ratio:
It should be observed that an increase in the GP ratio may be due to the followingfactors.
1. Increase in the selling price of goods sold without any correspondingincrease in the cost of goods sold.
2. Decrease in cost of goods sold without corresponding decrease in sellingprice.
3. Omission of purchase invoices from accounts.
4. Under valuation of opening stock or overvaluation of closing stock.
On the other hand, the decrease in the gross profit ratio may be due to thefollowing factors.
1. Decrease in the selling price of goods, without corresponding decrease inthe cost of goods sold.
2. Increase in the cost of goods sold without any increase in selling price.
3. Unfavorable purchasing or markup policies.
4. Inability of management to improve sales volume, or omission of sales.
5. Over valuation of opening stock or under valuation of closing stock
Hence, an analysis of gross profit margin should be carried out in the light ofthe information relating to purchasing, mark-ups and markdowns, credit andcollections as well as merchandising policies.

Net Profit Ratio (NP Ratio):
Net profit ratio is the ratio of net profit (after taxes) to net sales. It is expressedas percentage.
The two basic components of the net profit ratio are the net profit and sales.The net profits are obtained after deducting income-tax and, generally, non-operating expenses and incomes are excluded from the net profits for calculatingthis ratio. Thus, incomes such as interest on investments outside the business,profit on sales of fixed assets and losses on sales of fixed assets, etc are excluded.
Net Profit Ratio = (Net profit / Net sales) × 100
Illustration 11
Total sales = 520,000; Sales returns = 20,000; Net profit 40,000
Calculate net profit ratio.
Solution:
Net sales = (520,000 – 20,000) = 500,000
Net Profit Ratio = [(40,000 / 500,000) × 100]
= 8%
NP ratio is used to measure the overall profitability and hence it is very useful toproprietors. The ratio is very useful as if the net profit is not sufficient, the firmshall not be able to achieve a satisfactory return on its investment.
This ratio also indicates the firm's capacity to face adverse economic conditionssuch as price competition, low demand, etc. Obviously, higher the ratio the betteris the profitability. But while interpreting the ratio it should be kept in mind thatthe performance of profits also be seen in relation to investments or capital of thefirm and not only in relation to sales.
Operating Ratio:
Operating ratio is the ratio of cost of goods sold plus operating expenses to netsales. It is generally expressed in percentage.
Operating ratio measures the cost of operations per Rs. of sales. This is closelyrelated to the ratio of operating profit to net sales.
The two basic components for the solution of operating ratio are operating cost(cost of goods sold plus operating expenses) and net sales. Operating expenses

normally include (a) administrative and office expenses and (b) selling anddistribution expenses. Financial charges such as interest, provision for taxationetc. are generally excluded from operating expenses.
Operating Ratio = [(Cost of goods sold + Operating expenses) / Net sales] × 100
Illustration 12
Cost of goods sold is 180,000 and other operating expenses are 30,000 and netsales is 300,000.
Calculate operating ratio.
Solution:
Operating ratio = [(180,000 + 30,000) / 300,000] × 100
= [210,000 / 300,000] × 100
= 70%
Operating ratio shows the operational efficiency of the business. Loweroperating ratio shows higher operating profit and vice versa. An operating ratioranging between 75% and 80% is generally considered as standard formanufacturing concerns. This ratio is considered to be a yardstick of operatingefficiency but it should be used cautiously because it may be affected by anumber of uncontrollable factors beyond the control of the firm. Moreover, insome firms, non-operating expenses from a substantial part of the total expensesand in such cases operating ratio may give misleading results.
Operating profit Ratio or Operating Margin Ratio
The operating profit of a business is the profit after meeting all operatingexpenses incurred in the regular course of operations. It is a measure ofoperating efficiency of a business. The ratio is calculated by dividing operatingprofit or earnings before interest and taxes [EBIT] by Net Sales
Operating profit Ratio = Opera tin g prof it or EB IT1 0 0
Net Sales
Expense Ratio:
Expense ratios indicate the relationship of various expenses to net sales. Theoperating ratio reveals the average total variations in expenses. But some of theexpenses may be increasing while some may be falling. Hence, expense ratios are

calculated by dividing each item of expenses or group of expense with the netsales to analyze the cause of variation of the operating ratio.
The ratio can be calculated for individual items of expense or a group ofitems of a particular type of expense like cost of sales ratio, administrativeexpense ratio, selling expense ratio, materials consumed ratio, etc. The lower theoperating ratio, the larger is the profitability and higher the operating ratio, loweris the profitability.
While interpreting expense ratio, it must be remembered that for a fixedexpense like rent, the ratio will fall if the sales increase and for a variableexpense, the ratio in proportion to sales shall remain nearly the same.
Following formula is used for the solution of expense ratio:
Particular Expense = (Particular expense / Net sales) × 100
Illustration 13
Administrative expenses are 2,500, selling expenses are 3,200 and sales are25,00,000.
Calculate expense ratio.
Solution :
Administrative expenses ratio = (2,500 / 25,00,000) × 100
= 0.1%
Selling expense ratio = (3,200 / 25,00,000) × 100
= 0.128%
[b] OVERALL PROFITABILITY RATIOS
It is the analysis of profitability in relation to the volume of capitalemployed or investment in the business. Management and shareholders areinterested in ascertaining the return on capital employed, return onshareholders’ funds etc. the important tests applied to measure overallprofitability are :
1. Return on total assets
2. Return on capital employed
3. Return on shareholder’s equity
4. Return on equity capital

Return on Shareholders’ Investment or Net Worth Ratio:
It is the ratio of net profit to share holder's investment. It is the relationshipbetween net profit (after interest and tax) and share holder's/proprietor's fund.
This ratio establishes the profitability from the share holders' point of view. Theratio is generally calculated in percentage.
The two basic components of this ratio are net profits and shareholder's funds.Shareholder's funds include equity share capital, (preference share capital) andall reserves and surplus belonging to shareholders. Net profit means net incomeafter payment of interest and income tax because those will be the only profitsavailable for share holders.
[Return on share holder's investment = {Net profit (after interest and tax) /Share holder's fund} × 100]
Illustration 14
Suppose net income in an organization is 60,000 where as shareholder'sinvestments or funds are 400,000.
Calculate return on shareholders’ investment or net worth
Return on share holders’ investment = (60,000 / 400,000) × 100 = 15%
This means that the return on shareholders’ funds is 15 percent/Rs.
This ratio is one of the most important ratios used for measuring theoverall efficiency of a firm. As the primary objective of business is to maximize itsearnings, this ratio indicates the extent to which this primary objective ofbusinesses being achieved. This ratio is of great importance to the present andprospective shareholders as well as the management of the company. As the ratioreveals how well the resources of the firm are being used, higher the ratio, betterare the results. The inter firm comparison of this ratio determines whether theinvestments in the firm are attractive or not as the investors would like to investonly where the return is higher.
Return on Equity Capital (ROEC) Ratio
In real sense, ordinary shareholders are the real owners of the company.They assume the highest risk in the company. (Preference share holders have apreference over ordinary shareholders in the payment of dividend as well ascapital.

Preference share holders get a fixed rate of dividend irrespective of thequantum of profits of the company). The rate of dividends varies with theavailability of profits in case of ordinary shares only. Thus ordinary shareholdersare more interested in the profitability of a company and the performance of acompany should be judged on the basis of return on equity capital of thecompany. Return on equity capital which is the relationship between profits of acompany and its equity, can be calculated as follows:
Formula of return on equity capital ratio is:
Return on Equity Capital = [(Net profit after tax − Preference dividend) /Equity share capital] × 100
Equity share capital should be the total called-up value of equity shares.As the profit used for the solutions are the final profits available to equityshareholders as dividend, therefore the preference dividend and taxes arededucted in order to arrive at such profits.
Illustration 15
Calculate return on equity share capital from the following information:
Equity share capital): 1,000,000 ; 9% Preference share capital: 500,000;Taxation rate: 50% of net profit; Net profit before tax: 400,000.
Solution :
Return on Equity Capital (ROEC) ratio = [(400,000 − 200,000 − 45,000) /1000,000 )× 100]
= 15.5%
This ratio is more meaningful to the equity shareholders who are interested toknow profits earned by the company and those profits which can be madeavailable to pay dividends to them. Interpretation of the ratio is similar to theinterpretation of return on shareholder's investments and higher the ratio betteris.
Return on Capital Employed Ratio (ROCE Ratio)
The prime objective of making investments in any business is to obtainsatisfactory return on capital invested. Hence, the return on capital employed isused as a measure of success of a business in realizing this objective.

Return on capital employed establishes the relationship between the profitand the capital employed. It indicates the percentage of return on capitalemployed in the business and it can be used to show the overall profitability andefficiency of the business.
Capital employed and operating profits are the main items. Capital employedmay be defined in a number of ways. However, two widely accepted definitionsare "gross capital employed" and "net capital employed". Gross capitalemployed usually means the total assets, fixed as well as current, used inbusiness, while net capital employed refers to total assets minus liabilities. Onthe other hand, it refers to total of capital, capital reserves, revenue reserves(including profit and loss account balance), debentures and long term loans.
Solution of Capital Employed:
Method--1. If it is calculated from the assets side, It can be worked out by addingthe following:
1. The fixed assets should be included at their net values, either at originalcost or at replacement cost after deducting depreciation. In days ofinflation, it is better to include fixed assets at replacement cost which isthe current market value of the assets.
2. Investments inside the business
3. All current assets such as cash in hand, cash at bank, sundry debtors,bills receivable, stock, etc.
4. To find out net capital employed, current liabilities are deducted from thetotal of the assets as calculated above.
Gross capital employed = Fixed assets + Investments + Current assets
Net capital employed = Fixed assets + Investments + Working capital .
Working capital = current assets − current liabilities.
Method--2. Alternatively, capital employed can be calculated from the liabilitiesside of a balance sheet. If it is calculated from the liabilities side, it will includethe following items:
Share capital:Issued share capital (Equity + Preference)
Reserves and Surplus:General reserve
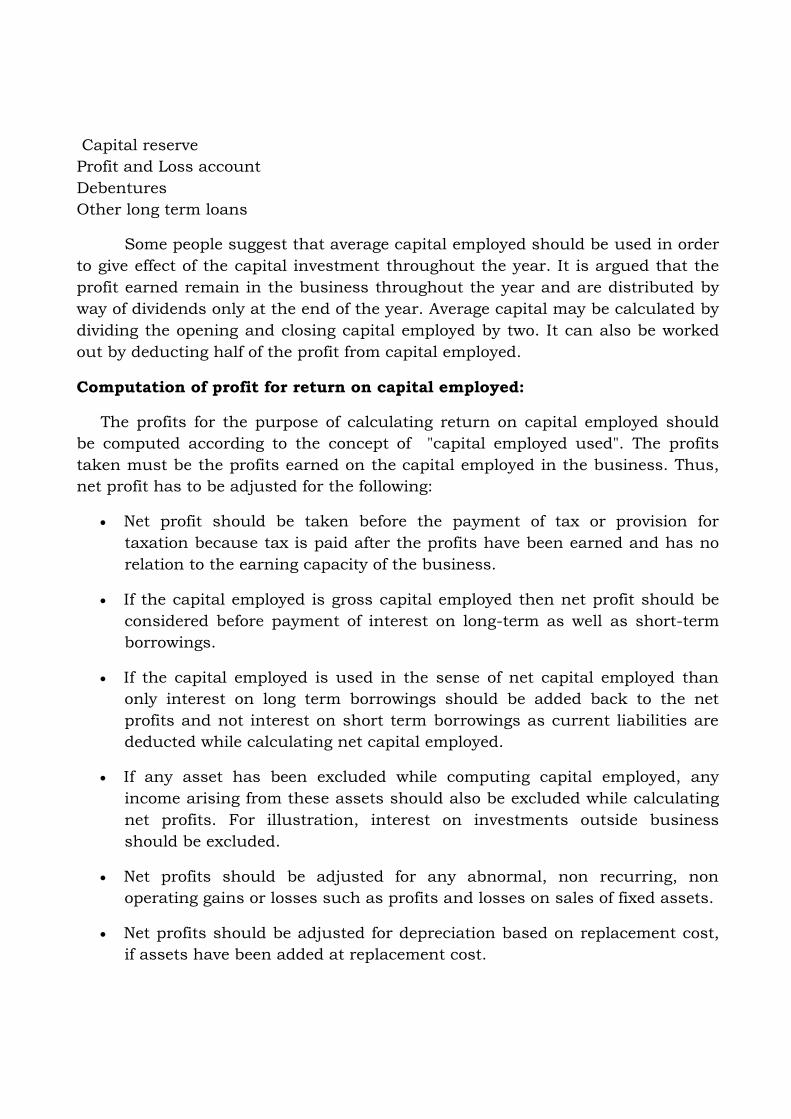
Capital reserveProfit and Loss accountDebenturesOther long term loans
Some people suggest that average capital employed should be used in orderto give effect of the capital investment throughout the year. It is argued that theprofit earned remain in the business throughout the year and are distributed byway of dividends only at the end of the year. Average capital may be calculated bydividing the opening and closing capital employed by two. It can also be workedout by deducting half of the profit from capital employed.
Computation of profit for return on capital employed:
The profits for the purpose of calculating return on capital employed shouldbe computed according to the concept of "capital employed used". The profitstaken must be the profits earned on the capital employed in the business. Thus,net profit has to be adjusted for the following:
Net profit should be taken before the payment of tax or provision fortaxation because tax is paid after the profits have been earned and has norelation to the earning capacity of the business.
If the capital employed is gross capital employed then net profit should beconsidered before payment of interest on long-term as well as short-termborrowings.
If the capital employed is used in the sense of net capital employed thanonly interest on long term borrowings should be added back to the netprofits and not interest on short term borrowings as current liabilities arededucted while calculating net capital employed.
If any asset has been excluded while computing capital employed, anyincome arising from these assets should also be excluded while calculatingnet profits. For illustration, interest on investments outside businessshould be excluded.
Net profits should be adjusted for any abnormal, non recurring, nonoperating gains or losses such as profits and losses on sales of fixed assets.
Net profits should be adjusted for depreciation based on replacement cost,if assets have been added at replacement cost.

Return on Capital Employed=(Adjusted net profits /Capital employed)×100
Net profit before interest and tax minus income from investments.
Return on capital employed ratio is considered to be the best measure ofprofitability in order to assess the overall performance of the business. Itindicates how well the management has used the investment made by ownersand creditors into the business. It is commonly used as a basis for variousmanagerial decisions. As the primary objective of business is to earn profit,higher the return on capital employed, the more efficient the firm is in using itsfunds. The ratio can be found for a number of years so as to find a trend as towhether the profitability of the company is improving or otherwise.
Return on Total Assets
Return on total Assets is also called Return on Investment or ROI. It iscalculated by dividing operating profit by total tangible assets.
Return on total Assets = Operating Profit x100
Total Tangible Assets
A high ratio implies better overall performance of the business or efficient use oftotal assets
MARKET TEST RATIOS
Market test ratios are used by shareholders and investors to evaluate theperformance of a company in the market place. These ratios include
Dividend Yield Ratio
Dividend Payout Ratio
Earnings Per Share (EPS) Ratio
Price Earnings Ratio (PE Ratio)
Coverage Ratios
Dividend Yield Ratio:
Dividend yield ratio is the relationship between dividends per share and themarket value of the shares.

Share holders are real owners of a company and they are interested in real sensein the earnings distributed and paid to them as dividend. Therefore, dividendyield ratio is calculated to evaluate the relationship between dividends per sharepaid and the market value of the shares.
Following formula is used for the solution of dividend yield ratio:
Dividend Yield Ratio = Dividend Per Share / Market Value Per Share
Illustration 16
For illustration, if a company declares dividend at 20% on its shares, each havinga paid up value of 8.00 and market value of 25.00.
Calculate dividend yield ratio:
Solution :
Dividend Per Share = (20 / 100) × 8
= 1.60
Dividend Yield Ratio = (1.60 / 25) × 100
= 6.4%
This ratio helps as intending investor is knowing the effective return he is goingto get on the proposed investment.
Dividend Payout Ratio:
Dividend payout ratio is calculated to find the extent to which earnings pershare have been used for paying dividend and to know what portion of earningshas been retained in the business. It is an important ratio because ploughingback of profits enables a company to grow and pay more dividends in future.
Following formula is used for the solution of dividend payout ratio
Dividend Payout Ratio = Dividend per Equity Share / Earnings per Share
A complementary of this ratio is retained earnings ratio. Retained earning ratiois calculated by using the following formula:
Retained Earning Ratio = Retained Earning Per Equity Share / Earning PerEquity Share

Illustration 17
Calculate dividend payout ratio and retained earnings from the followingdata:
Net Profit 10,000 No. of equity shares 3,000Provision for taxation 5,000 Dividend per equity share 0.40Preference dividend 2,000
Payout Ratio = ( 0.40 / 1) × 100
= 40%
Retained Earnings Ratio = ( 0.60 / 1) × 100
= 60%
The payout ratio and the retained earning ratio are the indicators of theamount of earnings that have been ploughed back in the business. The lower thepayout ratio, the higher will be the amount of earnings ploughed back in thebusiness and vice versa. A lower payout ratio or higher retained earnings ratiomeans a stronger financial position of the company.
Earnings per Share (EPS) Ratio
Earnings per share ratio (EPS Ratio) is a small variation of return on equitycapital ratio and is calculated by dividing the net profit after taxes and preferencedividend by the total number of equity shares.
The formula of earnings per share is:
Earnings per share (EPS) Ratio = (Net profit after tax − Preference dividend)/ No. of equity shares (common shares)
Illustration 18
Equity share capital ( 1): 1,000,000; 9% Preference share capital: 500,000;Taxation rate: 50% of net profit; Net profit before tax: 400,000.
Calculate earnings per share ratio.
Solution:
EPS = 1,55,000 / 10,000
= 15.50 per share.
The earnings per share is a good measure of profitability and whencompared with EPS of similar companies, it gives a view of the comparative

earnings or earnings power of the firm. EPS ratio calculated for a number ofyears indicates whether or not the earning power of the company has increased.
Price Earnings Ratio (PE Ratio)
Price earnings ratio (P/E ratio) is the ratio between market price per equityshare and earning per share.
The ratio is calculated to make an estimate of appreciation in the value of ashare of a company and is widely used by investors to decide whether or not tobuy shares in a particular company.
Following formula is used to calculate price earnings ratio:
Price Earnings Ratio = Market price per equity share / Earnings per share
Illustration 18
The market price of a share is 30 and earnings per share is 5.
Calculate price earnings ratio.
Solution:
Price earnings ratio = 30 / 5
= 6
The market value of every one Rs. of earning is six times or 6. The ratio isuseful in financial forecasting. It also helps in knowing whether the share of acompany are under or overvalued. For illustration, if the earning per share of ABlimited is 20, its market price 140 and earnings ratio of similar companies is 8,it means that the market value of a share of AB Limited should be 160 (i.e., 8 ×20). The share of AB Limited is, therefore, undervalued in the market by 20. Incase the price earnings ratio of similar companies is only 6, the value of the shareof AB Limited should have been 120 (i.e., 6 × 20), thus the share is overvaluedby 20.
Price earnings ratio helps the investor in deciding whether to buy or not to buythe shares of a particular company at a particular market price.
Generally, higher the price earnings ratio the better it is. If the P/E ratio falls, themanagement should look into the causes that have resulted into the fall of thisratio.

Coverage Ratios
It includes interest coverage ratio, preference share dividend coverage ratio andequity dividend coverage ratio
Debt Service Ratio or Interest Coverage Ratio:
Interest coverage ratio is also known as debt service ratio or debt servicecoverage ratio.
This ratio relates the fixed interest charges to the income earned by the business.It indicates whether the business has earned sufficient profits to pay periodicallythe interest charges. It is calculated by using the following formula.
Interest Coverage Ratio = Net Profit before Interest and Tax / Fixed InterestCharges
Illustration 19
If the net profit (after taxes) of a firm is 75,000 and its fixed interest charges onlong-term borrowings are 10,000. The rate of income tax is 50%.
Calculate debt service ratio / interest coverage ratio
Solution:
Interest Coverage Ratio = (75,000 + 75,000 + 10,000) / 10,000
= 16 times
Income after interest is 7,5000 + income tax 75,000
The interest coverage ratio is very important from the lender's point of view. Itindicates the number of times interest is covered by the profits available to payinterest charges.
It is an index of the financial strength of an enterprise. A high debt service ratioor interest coverage ratio assures the lenders a regular and periodical interestincome. But the weakness of the ratio may create some problems to the financialmanager in raising funds from debt sources.
Preference share dividend cover = Profit after tax / Preference share dividend
Equity dividend cover = profit after tax – preference share dividend / equityshare dividend

19911992
500,000400,000
Equity Share CapitalReserves & Surplus
300,000 200,000Long Term Loans6% Debentures
Capital Gearing Ratio
Closely related to solvency ratio is the capital gearing ratio. Capitalgearing ratio is mainly used to analyze the capital structure of a company.
The term capital structure refers to the relationship between the variouslong-term form of financing such as debentures, preference and equity sharecapital including reserves and surpluses. Leverage of capital structure ratios arecalculated to test the long-term financial position of a firm.
The term "capital gearing" or "leverage" normally refers to the proportion ofrelationship between equity share capital including reserves and surpluses topreference share capital and other fixed interest bearing funds or loans. In otherwords it is the proportion between the fixed interest or dividend bearing fundsand non fixed interest or dividend bearing funds. Equity share capital includesequity share capital and all reserves and surpluses items that belong toshareholders. Fixed interest bearing funds includes debentures, preference sharecapital and other long-term loans.
[Capital Gearing Ratio = Equity Share Capital / Fixed Interest Bearing Funds]
Illustration 20
Calculate capital gearing ratio from the following data:
250,000250,000
300,000400,000
Solution:
Capital Gearing Ratio 1992 = (500,000 + 300,000) / (250,000 + 250,000)
= 8 : 5 (Low Gear)
1993 = (400,000 + 200,000) / (300,000 + 400,000)
6 : 7 (High Gear)
It may be noted that gearing is an inverse ratio to the equity share capital.
Highly Geared------------Low Equity Share Capital
Low Geared---------------High Equity Share Capital
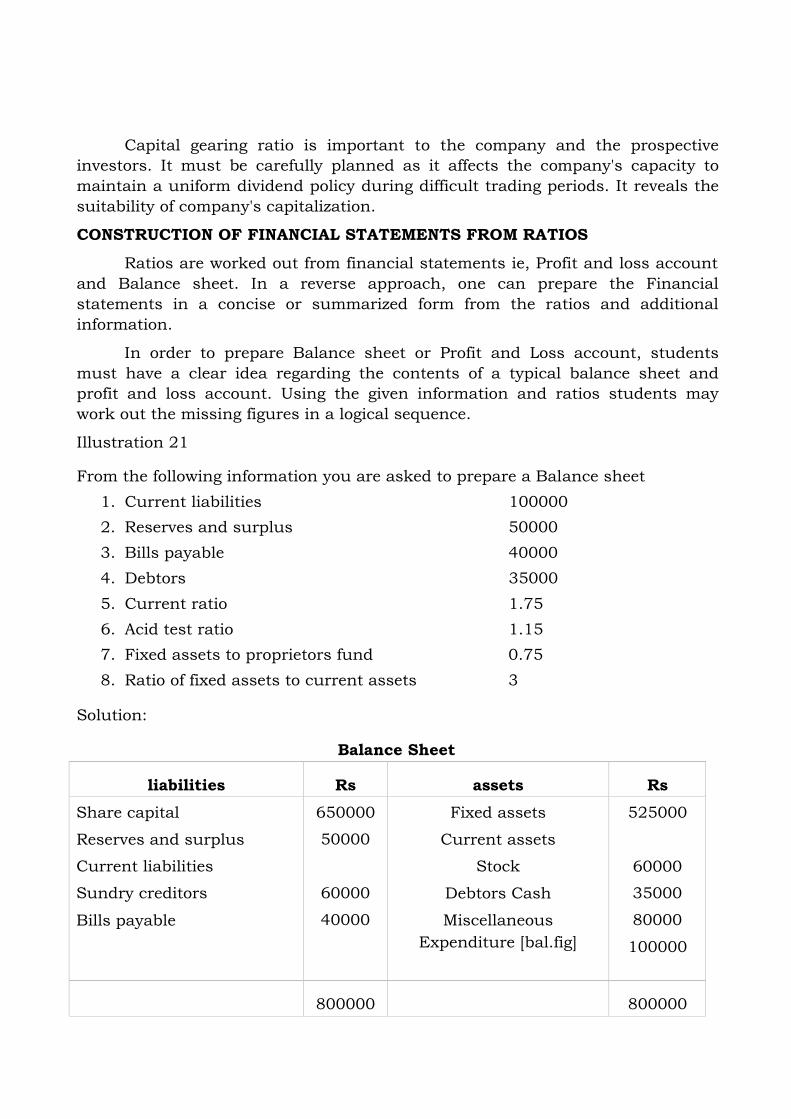
Capital gearing ratio is important to the company and the prospectiveinvestors. It must be carefully planned as it affects the company's capacity tomaintain a uniform dividend policy during difficult trading periods. It reveals thesuitability of company's capitalization.
CONSTRUCTION OF FINANCIAL STATEMENTS FROM RATIOSRatios are worked out from financial statements ie, Profit and loss account
and Balance sheet. In a reverse approach, one can prepare the Financialstatements in a concise or summarized form from the ratios and additionalinformation.
In order to prepare Balance sheet or Profit and Loss account, studentsmust have a clear idea regarding the contents of a typical balance sheet andprofit and loss account. Using the given information and ratios students maywork out the missing figures in a logical sequence.
Illustration 21
From the following information you are asked to prepare a Balance sheet1. Current liabilities 1000002. Reserves and surplus 500003. Bills payable 400004. Debtors 350005. Current ratio 1.756. Acid test ratio 1.157. Fixed assets to proprietors fund 0.758. Ratio of fixed assets to current assets 3
Solution:
Balance Sheet
liabilities Rs assets RsShare capital
Reserves and surplus
Current liabilities
Sundry creditors
Bills payable
650000
50000
60000
40000
Fixed assets
Current assets
Stock
Debtors Cash
MiscellaneousExpenditure [bal.fig]
525000
60000
35000
80000
100000
800000 800000

1. Current assets
Current ratio = current assets / current liabilities = 1.75
Current assets = 1.75 x current liabilities = 1.75 x 100000 = 175000
2.Liquid assets
Acid test ratio = liquid assets / current liabilities = 1.15
Liquid assets = 1.15x current liabilities = 1.15 x 100000 = 115000
3.stock
Stock = current assets – liquid assets
175000-115000 = 60000
4.cash balance = current assets – [ stock + debtors]
= 1750000-[60000+35000] = 80000
5. Fixed assets
Ratio of fixed assets to current assets = fixed assets / current assets = 3
Fixed assets = 3x current assets = 3x 175000 = 525000
6. Propreitors funds
Fixed assets to proprietors funds = fixed assets / proprietors funds = 0.75
Prop. Funds = fixed assets / 0.75 = 525000/0.75 = 700000
7. Share capital
Prop. Fund = s. capital + reserves and surplus
Share capital = prop. Funds – reserves and surplus = 700000-50000=650000
Sundry creditors = current liabilities – bills payable
= 100000-40000=60000
9. Miscellaneous expenditure
Balance on the asset side of balance sheet may be treated as miscellaneousexpenditure

Illustration 22
Prepare a balance sheet from the following data
a. Current ratio 1.4
b. Liquid ratio 1.0
c. Stock turnover ratio 8 [ based on closing stock]
d. Gross profit ratio 20%
e. Debt collection period 1.5 months
f. Reserves and surplus to capital 0.6
g. Fixed assets turnover ratio 1.6
h. Capital gearing ratio 0.5
i. Fixed assets to net worth 1.25
j. Sales for the year Rs.1000000
Solution
1. Cost of sales
GP = 20% of sales = 1000000x20/100 = 200000
Cost of sales = sales –GP = 1000000-200000=800000
2. Closing stock
STR = Cost of sales/ closing stock = 8 times
Closing stock = 800000/8 = 100000
3. Current assets and current liabilities
CR = 1.4 And LR = 1.0
Let current liabilities be x, current assets will be 1.4x and liquid assetswill be 1.4x and liquid liabilities will be 1x
Stock = current assets – liquid assets
100000 = 1.4x-1x
0.4x = 100000

X = 100000/0.4 = 250000
Current liabilities = 250000
Current assets = 1.4x250000= 350000
4. Debtors
Debt collection period = debtors/credit sales x12 = 1.5
Debtors = 1000000x1.5/12 = 125000
5. Cash and bank
=liquid assets – debtors
LR = LA/CL = 1
Liquid assets are equal to current liabilities = 250000
Cash and bank = 250000-125000 = 125000
6. Fixed assets T/o ratio
= 1.6
Fixed assets = 800000/1.6= 500000
7. Net worth
Fixed assets /NW = 1.25
Net worth = 400000
8. Share capital
Res. And surplus to capital = 0.6
If capital is x reserves and surplus will be 0.6x and net worth will be 1.6x
400000= x+0.6x
X = 250000
Share capital = 250000
9. Reserves and surplus = 250000x0.6 = 150000
10. Long term debt
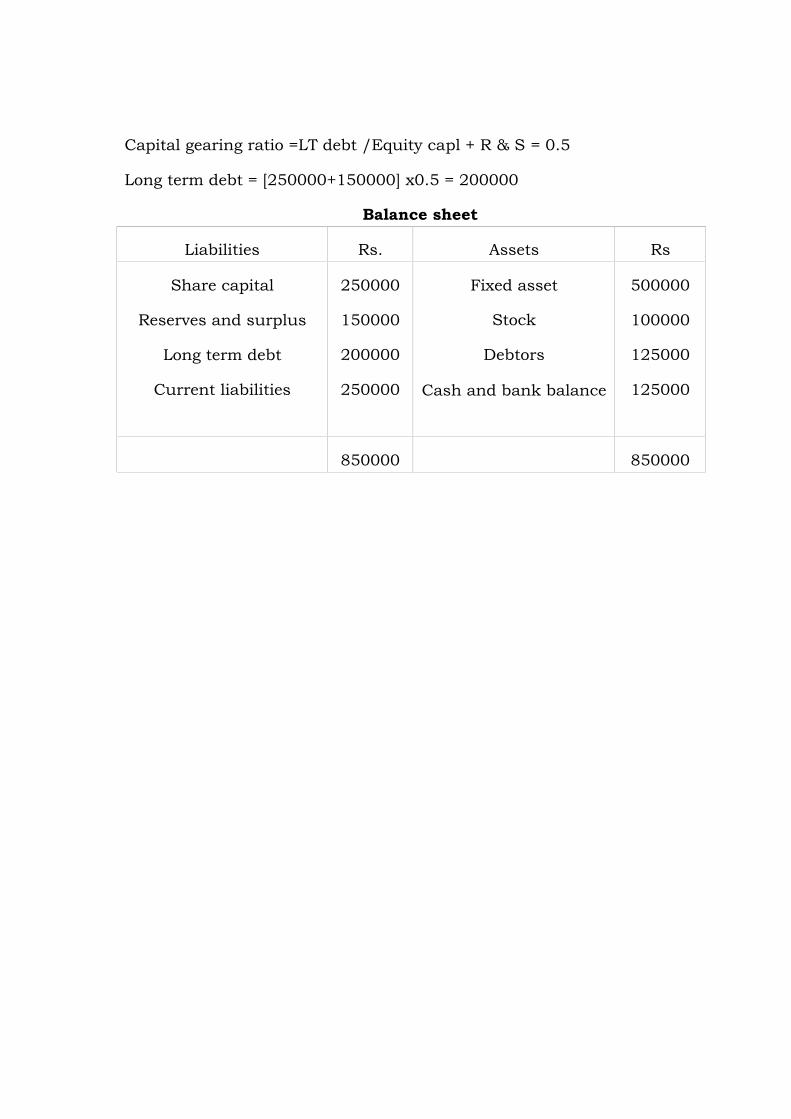
Capital gearing ratio =LT debt /Equity capl + R & S = 0.5
Long term debt = [250000+150000] x0.5 = 200000
Balance sheet
Liabilities Rs. Assets Rs
Share capital
Reserves and surplus
Long term debt
Current liabilities
250000
150000
200000
250000
Fixed asset
Stock
Debtors
Cash and bank balance
500000
100000
125000
125000
850000 850000

MARGINAL COSTING
The basic objectives of Cost Accounting are cost ascertainment and costcontrol. In order to help management in cost control and decision making, costaccounting has developed certain tools and techniques. Marginal costing andBreak even analysis are important techniques used for cost control and decisionmaking.
Marginal Cost
The term Marginal cost means the additional cost incurred for producingan additional unit of output. It is the addition made to total cost when the outputis increased by one unit.
Marginal cost of nth unit = Total cost of nth unit- total cost of n-1 unit.
Eg. When 100 units are produced, the total cost is Rs. 5000.When the output isincreased by one unit, i.e, 101 units, total cost is Rs.5040.Then marginal cost of101th unit is Rs. 40[5040-5000]
Marginal cost is also equal to the total variable cost of production or it isthe aggregate of prime cost and variable overheads. The chartered Institute ofManagement Accountants [CIMA] England defines Marginal as “the amount atany given volume of output by which aggregate costs are changed if the volume ofoutput is increased or decreased by one unit
MARGINAL COSTING
It is the technique of costing in which only marginal costs or variable arecharged to output or production. The cost of the output includes only variablecosts .Fixed costs are not charged to output. These are regarded as ‘Period Costs’.These are incurred for a period. Therefore, these fixed costs are directlytransferred to Costing Profit and Loss Account.
According to CIMA, marginal costing is “the ascertainment, bydifferentiating between fixed and variable costs, of marginal costs and of theeffect on profit of changes in volume or type of output.
Under marginal costing, it is assumed that all costs can be classified intofixed and variable costs. Fixed costs remain constant irrespective of the volume ofoutput. Variable costs change in direct proportion with the volume of output. Thevariable or marginal cost per unit remains constant at all levels of output

FEATURES OF MARGINAL COSTING [ASSUMPTIONS IN MARGINALCOSTING]
1. All costs can be classified into fixed and variable elements. Semi variable costsare also segregated into fixed and variable elements.
2. The total variable costs change in direct proportion with units of output. Itfollows a linear relation with volume of output and sales.
3. The total fixed costs remain constant at all levels of output. These are incurredfor a period and have no relation with output.
4. Only variable costs are treated as product costs and are charged to output,product, process or operation
5. Fixed costs are treated as ‘Period costs’ and are directly transferred to CostingProfit and Loss Account.
6. The closing stock is also valued at marginal cost and not at total cost.
7. The relative profitability of product or department is based on the contributionit gives and not based on the profit
8. It is also assumed that the selling price per unit remains the same i.e, anynumber of units can be sold at the current market price.
9. The product or sales mix remains constant over a period of time.
CONCEPT OF CONTRIBUTION
Contribution is the excess of sales over marginal cost. It is not purelyprofit. It is the profit before recovery of fixed assets. Fixed costs are first met outof contribution and only the remaining amount is regarded as profit.Contribution is an index of profitability. It has a fixed relationship with sales.Larger the sales more will be the contribution and vice versa.
Contribution = Sales – Marginal cost
Marginal cost equation
Sales-Marginal cost = Contribution
Contribution = Fixed costs + Profit
Therefore, Fixed cost = Contribution – Profit’

PROFIT VOLUME RATIO [P/V RATIO].
Contribution is an absolute measure of profitability but it cannot be usedfor comparison of two products or departments. Therefore, the contribution isrelated to volume of sales. It is called Contribution / Sales Ratio or Profit/VolumeRatio [P/V Ratio]
P/V Ratio = Contribution x
Sales
When the P/V Ratio is higher, profitability of the product will also be higher. It isan index of relative profitability of products or departments.
Sales = ContributionP/V Ratio
Contribution = Sales x P/V Ratio
P/V Ratio can also be find out by the following formula :-
P/V Ratio = Change in Profit x100Change in Sales
Or P/V Ratio = Fixed Cost x 100Break even sales
Marginal cost statement
The Marginal cost statement is a profitability statement prepared accordingto marginal costing principles. It is prepared in the following format.
SalesLess: Variable/Marginal cost Xx
Direct LabourDirect ExpensesVariable Factory overheadsVariable Administration overheadsVariable Selling and distribution overheadsContributionLess Fixed CostsProfit
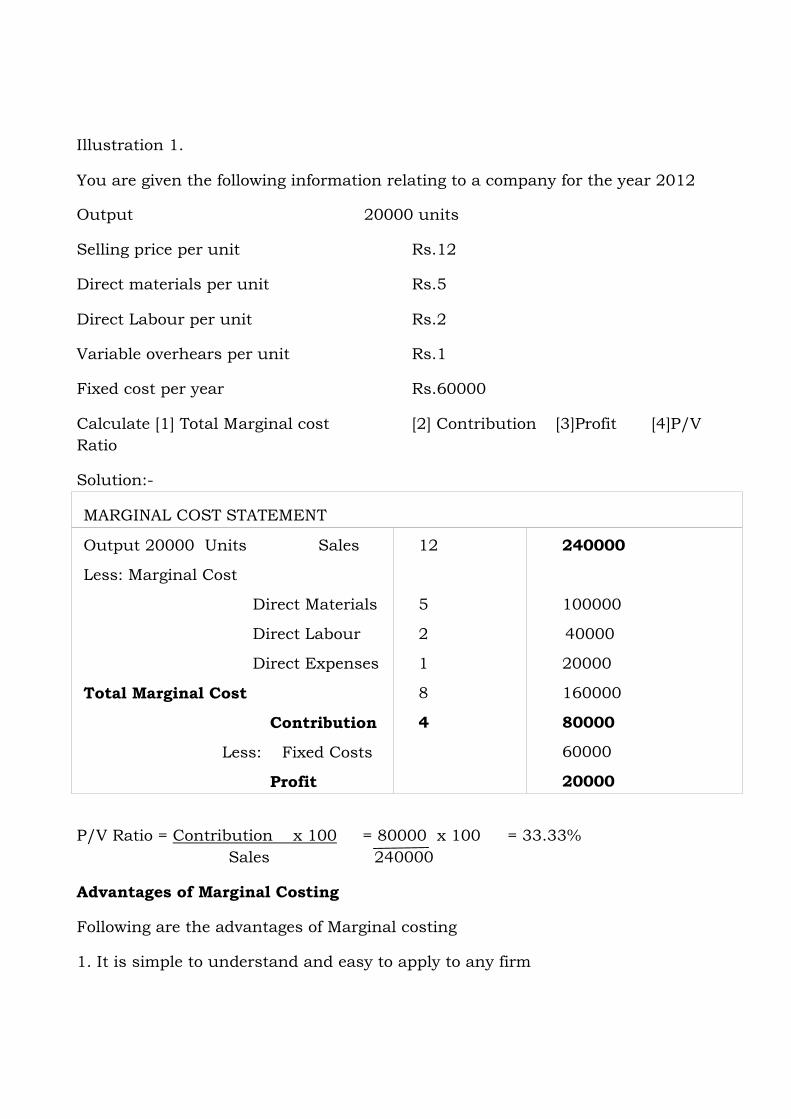
Output
Selling price per unit
Direct materials per unit
20000 units
Rs.12
Rs.5
Direct Labour per unit Rs.2
Variable overhears per unit Rs.1
Fixed cost per year Rs.60000
Calculate [1] Total Marginal costRatio
[2] Contribution [3]Profit [4]P/V
Solution:-
Illustration 1.
You are given the following information relating to a company for the year 2012
MARGINAL COST STATEMENT
Output 20000 Units Sales
Less: Marginal Cost
Direct Materials
Direct Labour
Direct Expenses
Total Marginal Cost
Contribution
Less: Fixed Costs
Profit
12
5
2
1
8
4
240000
100000
40000
20000
160000
80000
60000
20000
P/V Ratio = Contribution x 100 = 80000 x 100 = 33.33%Sales 240000
Advantages of Marginal Costing
Following are the advantages of Marginal costing
1. It is simple to understand and easy to apply to any firm

2. There is no arbitrary apportionment of fixed cost in this system. Fixed costsare transferred to costing profit and Loss account.
3. It also prevents the illegal carry forward in stock valuation of some proportionof current years fixed cost.
4. The effect of different sales mix on profit can be ascertained and managementcan adopt the optimum sales mix
5. It is used in control of cost by concentrating on variable cost of production.
6. It helps in profit planning by break even and cost volume profit analysis
7. It helps management to take a number of short term decisions like pricing,output, closing down of department, sales mix, make or buy etc..
Disadvantages
Important disadvantages of marginal costing are ;
1. All Assumptions of marginal costing are not appropriate. The assumption fixedcost remains constant for all levels may not hold good in the long run.
2. The assumption that changes in direct proportion with the volume of also donot hold good under all circumstances.
3. It is difficult to segregate all costs into fixed and variable elements.
4. The exclusion of fixed costs in ascertaining cost of production may givemisleading results and lead to non recovery of total costs.
5. The exclusion of fixed costs from inventories affect profit and financialstatements may not reflect true and fair view of financial affairs.
Marginal costing and Absorption costing
Marginal costing is the practice of charging only variable costs to cost ofproduction, leaving fixed costs to be charged to the costing profit and lossaccount.
In Absorption costing or Total costing all types of costs are charged to output orprocess. While variable costs are wholly allocated to output or production, fixedcosts are apportioned and a portion is charged to output or production.
The profits disclosed under the two methods will be the same, provided there isno closing stock. But in the event of closing stock, the profits disclosed will bedifferent under the two methods. This is due to the practice followed in stock

Accounting for Management Page100100100
valuation. In marginal costing stock is valued at marginal cost, whereas in totalcosting it is valued at total cost.
DIFFERENCE BETWEEN MARGINAL COSTING AND ABSORPTION COSTING
1. Marginal costing is the practice of charging only variable costs to products,outputs or processes and absorption costing variable and fixed cost to products,outputs or processes
2. There is no apportionment of fixed costs and they are charged to profit andloss account under marginal costing. But fixed costs are apportioned andcharged to outputs or processes under absorption costing.
3. Under marginal costing, inventories or stocks are valued at marginal costs andunder absorption costing they are valued at total costs.
4. Under marginal costing, the profitability of a product or department is judgedon the basis of the contribution that it gives but under absorption costing it isjudged on the basis of the ultimate profit that it gives.
5. Under marginal costing, profit is ascertained by deducting fixed costs fromcontribution and under absorption costing it is ascertained by deducting totalcosts from sales.
BREAK EVEN ANALYSIS
Every business is interested in ascertaining the breakeven point. It is thelevel of operation where total revenue or sales are equal to total cost. It is thepoint of no profit or no loss. The contribution received at Breakeven point is justsufficient to meet the fixed costs, leaving nothing as profit. The firm ceases toincur losses at this point or it starts to earn a profit from this point. Breakevenpoint can be expressed in algebraic method or graphical method.
Algebraic Method
Breakeven point may be expressed in terms of number of units to be produced,or in terms of volume of sales or in terms of the capacity of operation. It can becalculated by the following formula.
1.Break even point in units = Total Fixed costsContribution per unit
2.Break even point in value = Total Fixed costs or Total Fixed cost x salesP/V Ratio Contribution

Accounting for Management Page101101101
3.Break even point (in % of capacity utilization) = Total Fixed Costs x 100Contribution
Illustration 2
From the following information calculate
1. P/V Ratio
2. Breakeven point in Units
3. Breakeven point in Value
Given :
Selling price per unit Rs.20
Variable cost per unit Rs.12
Fixed costs Rs.32000
1. P/V Ratio = Contribution/Sales x 100 = 20-12/20x100 = 40 %
2. Breakeven point in units = Fixed costs/ Contribution per unit = 32000/8=4000 units
3. Breakeven point in value = Fixed costs = 32000/40 x100 = Rs.80000P/V Ratio
Target Profit
The Break even analysis can guide an organization to determine thevolume of sales required to earn a desired level of profit. The firm can decideupon the target return or profit in advance. To achieve this profit, efforts wouldbe taken to increase the volume of sales. The volume of sales required to achievethe desired level of profit may be computed as follows :-
Number of units to be sold = Fixed costs + desired ProfitContribution per unit
Sales volume required = Fixed costs+ Desired ProfitsP/V Ratio
Illustration 3
Product A is sold at a unit selling price of Rs. 40 and the variable cost incurredper unit is Rs.32.The firm’s fixed cost are Rx.40000.Find out

Accounting for Management Page102102102
1. The number of units to be produced to break even
2. The number of units to be sold to earn a profit of Rs.10000
Solution
Contribution = SP-VC
= 40-32 = 8 per unit
1. Number of units to be produced to Break even
BEP= Fixed cost/ Contribution per unit = 40000/8 = 5000 units.
2. Number of units to be sold to earn a profit of Rs.10000
Fixed Cost + Desired Profit = 40000+10000/8 = 6250 unitsContribution per unit
Break Even Chart [Graphic Method]
It is the graphical presentation of breakeven point. It shows therelationship between sales volume, variable and fixed costs. It also shows theprofit or loss at different levels of output or volume of sales.
Construction of Break even Chart
A Break even chart shows the total sales line, total cost line and the point ofintersection called the breakeven point. It is constructed using a database ofvariable costs, fixed costs, total costs and sales at different levels of output.
The units of output or sales revenue are plotted along the X axis, usingsuitable scale of measurement. The costs and sales are plotted along the Y axis.The fixed costs line is plotted first. It forms a parallel line to the X axis indicatingthat the fixed cost remain constant at all levels of output. The variable cost line isplotted next, starting from zero it progresses continuously indicating that thevariable cost increase with the volume fixed cost line of sales. The total cost lineis plotted above the variable cost line. It starts from the fixed cost line on the Yaxis and follows the same pattern of variable cost line. The sales line is plottedfinally. It starts from the zero and progresses continuously, indicating that thesales increase with larger units of output. The point of intersection of sales lineand total cost line indicates the Break even point. A vertical line drawn to the Xaxis from this point shows the volume of output required to Break even.

Accounting for Management Page103103103
ANGLE OF INCIDENCE
It is the angle caused by the intersection of the total sales line and totalcost line at the Break even point. The width of the angle represents the rate ofprofitability i.e, the larger the angle the greater will be the profit the business ismaking on additional sales
MARGIN OF SAFETY
Margin of safety represents the strength of the business to face an adversemarket condition. It is the excess of actual sales over break even sales. Higherthe Margin of safety, better the position of the firm.
Margin of safety = Actual sales- Break even sales
Margin of safety = Profit / P/V Ratio
Or Profit = margin of safety x P/V Ratio
Illustration 5
Calculate BEP and Margin of safety from the following?
Sales 50000 units @ Rs.6 per unit
Prime cost Rs. 3 per unit
Variable overhead Rs. 1 per unit
Fixed costs Rs.75000 per annum
Solution :-
BEP = Fixed Cost = 75000 = 37500 units
SP- VC per unit 6-4
BEP in value = 37500 x 6 = 225000
Margin of safety = Actual sales – BE sales
= [50000x6]-225000= Rs.75000
Illustration 6
The following data have been obtained from the records of a manufacturing firm.
Period I Period II
Sales 300000 320000
Total cost 260000 272000
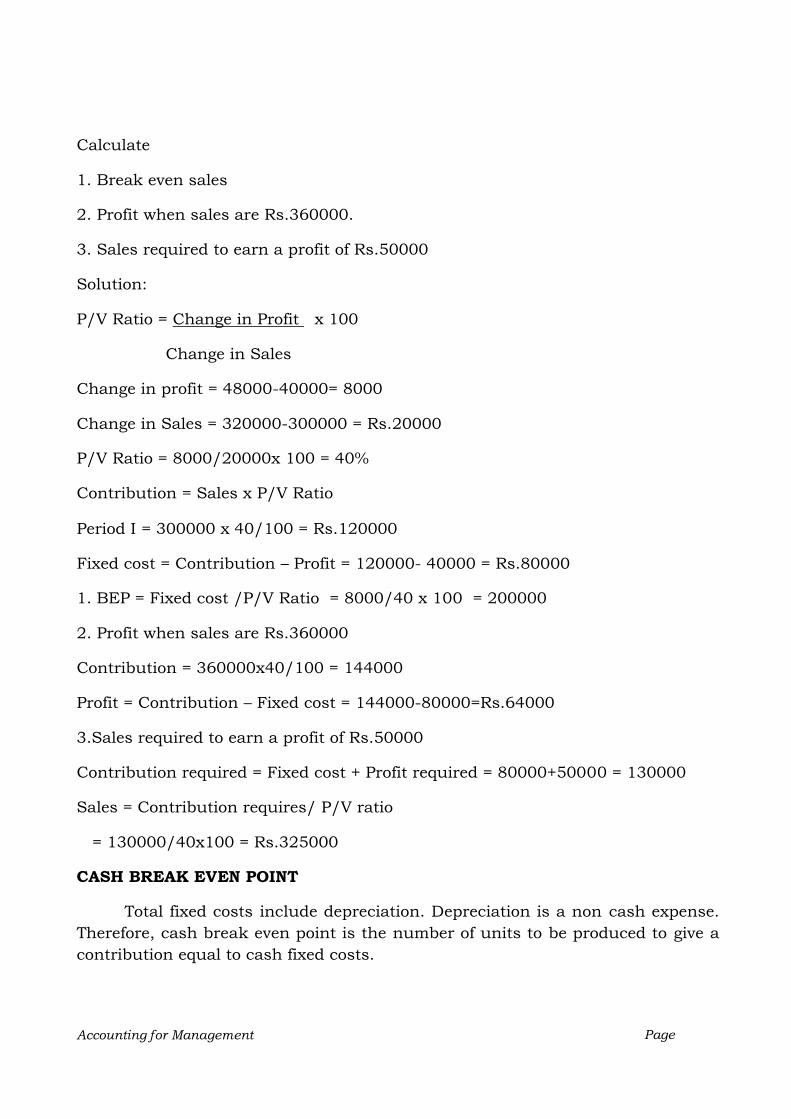
Accounting for Management Page104104104
Calculate
1. Break even sales
2. Profit when sales are Rs.360000.
3. Sales required to earn a profit of Rs.50000
Solution:
P/V Ratio = Change in Profit x 100
Change in Sales
Change in profit = 48000-40000= 8000
Change in Sales = 320000-300000 = Rs.20000
P/V Ratio = 8000/20000x 100 = 40%
Contribution = Sales x P/V Ratio
Period I = 300000 x 40/100 = Rs.120000
Fixed cost = Contribution – Profit = 120000- 40000 = Rs.80000
1. BEP = Fixed cost /P/V Ratio = 8000/40 x 100 = 200000
2. Profit when sales are Rs.360000
Contribution = 360000x40/100 = 144000
Profit = Contribution – Fixed cost = 144000-80000=Rs.64000
3.Sales required to earn a profit of Rs.50000
Contribution required = Fixed cost + Profit required = 80000+50000 = 130000
Sales = Contribution requires/ P/V ratio
= 130000/40x100 = Rs.325000
CASH BREAK EVEN POINT
Total fixed costs include depreciation. Depreciation is a non cash expense.Therefore, cash break even point is the number of units to be produced to give acontribution equal to cash fixed costs.

Accounting for Management Page105105105
Cash Break even point = Fixed cost – DepreciationContribution per unit
Illustration 7
Calculate cash Break even point for the following
Selling price per unit Rs.40
Variable cost per unit Rs.32
Fixed cost [including depreciation of Rs.20000] Rs.60000 per annum
Solution
Contribution per unit = S- VC = 40-32 = 8
Cash break even point = Fixed cost – depreciationContribution per unit
= 60000-20000/8 = 5000 units
COMPOSITE BREAK EVEN POINT
In the case of companies producing more than one product an over all orcomposite break even point is calculated.
Composite Break even point = Total Fixed CostsComposite P/V Ratio
Composite P/V Ratio = Total contribution x 100Total Sales of all products
Cost-Volume Profit Analysis [ CVP Analysis]
It is the study of the impact of a change in cost , price and volume onprofit. Break even analysis is a narrow interpretation of cost volume profitanalysis. But it is mainly confined to finding out the Break even point. In CVPanalysis the relationship between cost, volume and profit is studied in detail. Ithelps management in profit planning, decision making and cost control.
Assumptions in CVP analysis
The assumptions in CVP analysis are the same as that under marginalcosting.

Accounting for Management Page106106106
Cost can be classified into fixed and variable components.
Total fixed cost remain constant at all levels of output
The variable cost change in direct proportion with the volume of output
The product mix remains constant
The selling price per unit remains the same at all the levels of sales
There is synchronization of output and sales, i.e, what ever output isproduced , the same is sold during that period.
PROFIT VOLUME CHART OR [P/V CHART]
It shows the amount of profit or loss at different levels of output. When theoutput is zero, total loss will be equal to fixed costs. The fixed costs are recoveredgradually when the volume of output is increased. When the output reaches theBreak even point, the whole fixed costs are recovered. The firm incurs no loss orearns no profit. Thereafter, the firm makes a profit and the amount of profitincreases with the increase in sales volume.
CONSTRUCTION OF P/V CHART
The same data used for drawing a Break even chart may be used forconstructing a P/V chart. The following steps may be followed for constructing aP/V chart.
1. Sales or units of output are plotted along the X axis
2. The Y axis is used for marking fixed costs losses and profits
3. Points of Profits or losses are marked at different levels of sales and thesepoints are joined to get the profit or loss line.
4. The point where the profit or loss line intersects the X axis is marked asthe Break even point.
5. The angle at the BEP measures the angle of incidence
6. The distance between BEP and actual sales on the X axis measures themargin of safety
Illustration 7
Draw a Profit/ Volume graph from the following data and find out the BEP?

Sales for the year [ 20000units] Rs.2000000
Variable Costs Rs.1600000
Fixed costs for the year Rs.200000
What would be the profits when the output is 22000 units?
.MANAGERIAL USES OF MARGINAL COSTING AND BREAK EVENANALYSIS
Marginal costing and Beak even analysis are very useful tomanagement. The important uses of marginal costing and Break Evenanalysis are the following
1. Profit Planning
The first step in profit planning is the ascertainment of Break evenpoint. It is the level of operation when there is no profit no loss. Once BEP isfound out the management can decide upon the required level of sales to earna particular amount of profit.
2. Cost control
Cost control is an important function of management. In marginalcosting all costs are classified into fixed and variable elements. Fixed costs aregenerally non controllable in nature. But variable costs can be controlled bymanagerial actions.Therefore, managerial attention is drawn towards thecontrol of variable costs in marginal costing.
3. Decision making
Marginal costing helps to take important managerial decisions like ;-
1. Fixation of selling price under different market conditions
2. Whether to accept a special order or not
3. Whether to accept an export order or not
4. Selection of suitable product or sales mix
5. Make or buy decisions
6. Whether to discontinue a product or not
7. Closing down of a department
8. Merger of plant capacities

9. Key factor or limiting factor
10. Shut down or continue
4. Fixation of selling price
Selling price is actually the profit plus cost. But under severecompetition or in a depressed market, it may not be possible to earn a uniformprofit on sales. Some times the price may be fixed even below the cost. Inmarginal costing any product which gives the positive contribution is profitableand recommended in the long run.
Illustration 8
ABC Ltd is working below the normal capacity due to adverse market conditions.The present sales and costs of the firm are:
Normal capacity 5000 units
Actual output 3000 units
Direct Materials Rs.30000
Direct Labour Rs.12000
Variable overheads Rs.3000
Fixed overheads Rs.25000
Selling price per unit Rs.20
It is difficult to sell additional units in the market over the present level of output. The company has received enquiries for supply of additional units below thecurrent market price. You are advises to suggest the minimum price to becharged for additional units?Calculation of Marginal cost
Direct Materials Rs.30000
Direct Labour Rs.12000
Variable overheads Rs.3000
Marginal Cost Rs.45000
Marginal cost per unit = 45000/3000 = Rs.15
Therefore, the minimum price to be charged is Rs.15.Any price above themarginal cost will reduce the present loss by recovery of fixed costs.
Accepting Special Offer / Export Offer
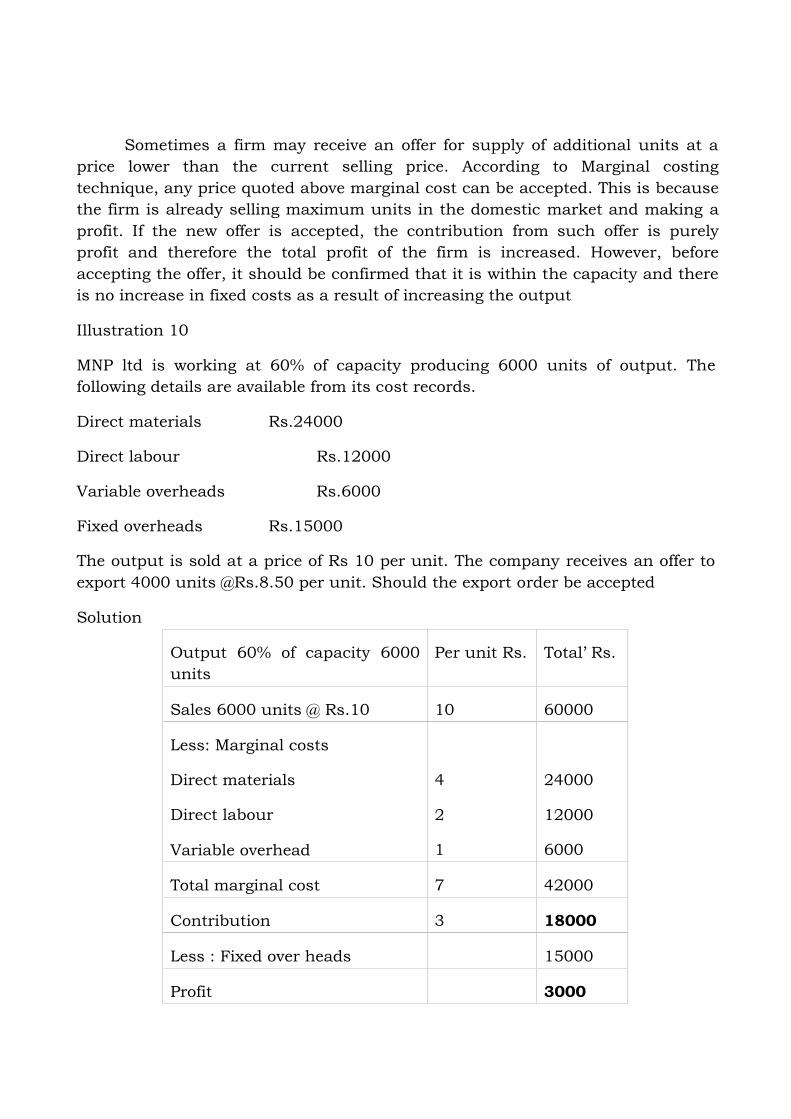
Sometimes a firm may receive an offer for supply of additional units at aprice lower than the current selling price. According to Marginal costingtechnique, any price quoted above marginal cost can be accepted. This is becausethe firm is already selling maximum units in the domestic market and making aprofit. If the new offer is accepted, the contribution from such offer is purelyprofit and therefore the total profit of the firm is increased. However, beforeaccepting the offer, it should be confirmed that it is within the capacity and thereis no increase in fixed costs as a result of increasing the output
Illustration 10
MNP ltd is working at 60% of capacity producing 6000 units of output. Thefollowing details are available from its cost records.
Direct materials Rs.24000
Direct labour Rs.12000
Variable overheads Rs.6000
Fixed overheads Rs.15000
The output is sold at a price of Rs 10 per unit. The company receives an offer toexport 4000 units @Rs.8.50 per unit. Should the export order be accepted
Solution
Output 60% of capacity 6000units
Per unit Rs. Total’ Rs.
Sales 6000 units @ Rs.10 10 60000
Less: Marginal costs
Direct materials
Direct labour
Variable overhead
4
2
1
24000
12000
6000
Total marginal cost 7 42000
Contribution 3 18000
Less : Fixed over heads 15000
Profit 3000

The marginal cost of the product is Rs. 7 per unit. Since the price quotedby the exporters is higher than the marginal cost, the export offer should beaccepted. There is a contribution of Rs.1.50 per unit [ 8.50-7] from every unit ofexport. Therefore, the total profit will increase by Rs.6000 [ 4000 units x1.50 ] byaccepting the offer as shown below.
Profitability statement [ after accepting export offer]
Capacity 100 % output10000 units
Per unit
Rs.
Total
Rs.
Sales: Domestic [email protected]
Export [email protected]
10
8.5
60000
34000
94000
Less: marginal cost
Direct materials
Direct labour
Variable overheads
4
2
1
40000
20000
10000
Total marginal cost 70000
Contribution 24000
Less; fixed costs 15000
Profit 9000
Selection of a Product/ sales mix
The marginal costing technique is useful for deciding the optimumproduct/sales mix. The product which shows higher P/V ratio is more profitable.Therefore, the company should produce maximum units of that product whichshows the highest P/V ratio so as to maximize profits.

Illustration 11
ABC Ltd produces and sells two products A and B. the cost and sales data aregiven as
Product A product B
Selling price 20 30
Direct material 10 15
Direct labour 4 5
Fixed overheads Rs.1200
Variable overheads are absorbed at 50% of direct labour
The proposed sales mix are
a. 100 units of A and 200 units of B
b. 150 units of A and 150 units of B
c. 200 units of A and 100 units of B
Recommend which of the above sales mix the company should adopt
Solution
Marginal cost statement
PRODUCT A PRODUCT B
SELLING PRICE 20 30
Less: marginal costs
Direct materials
Direct labour
Variable overheads
[50% of direct labour]
10
4
2
15
5
2.5
16 22.5
Contribution 4 7.5
P/V ratio =
contribution/sales x 100
20% 25%

Since product B gives a higher P/V ratio . sales mix with the highest unitsof product B should be adopted . therefore the proposal [a], 100 units of A and200 units of B is recommended. The profit will be the maximum as shown below
[a]100 units of A and 200 units of B
Contribution A 100 x 4 = 400
B 200x7.5 = 1500
---------------
1900
Less: fixed cost 1200
-----------------
Profit 700
[b]150 units of A and 150 units of B
Contribution A 150 x 4 = 600
B 150x7.5 = 1125
---------------
1725
Less: fixed cost 1200
-----------------
Profit 525
[c] 200 units of A and 100 units of B
Contribution A 200 x 4 = 800
B 100x7.5 = 750---------------
1550
Less: fixed cost 1200-----------------
Profit 350

UNIT – V
BUDGET AND BUDGETORY CONTROLMeaning and definition of budget:A budget is a plan of action for a future period. It simply means a financial plan expressed in termsof money. The budget pertaining to any of the activities of business is always forward looking.The term ‘budget’ has been derived from the French word, ”bougette”, which means a leather baginto which funds are appropriated to meet the anticipated expenses.The CIMA Official Terminology defines a budget as “ A quantitative statement, for a definedperiod of time, which may include planned revenues, expenses, assets, liabilities and cash flows.”
Budgeting and Budgetary control:
Budgeting simply means preparing budgets. It is a process of preparation, implementation and theoperation of budget. Being a plan of action, a budget guides every manager in the decision makingprocess.
In the words of Rowland Harr, “Budgeting is the process of building budgets”.Budgetary control is a system of using budgets for planning and controlling costs. The officialterminology of CIMA defines the term ‘budgetary control , as “ the establishment of budgetsrelating to the responsibilities of executives to the requirement of a policy, and the continuouscomparison of actual with budgetary result, either to secure by individual action the objectives ofthat policy or to provide a basis for its revision.” Thus, when plans are embodied in a budget andthe same is used as the basis for regulating operations, we have budgetary control. As suchbudgetary control starts with budgeting and ends with control.
Objectives of Budget and Budgetary control:
The following points reveal the objectives of Budget and budgetary control:-1. To aid the planning of annual operations2. To co ordinate the activities of the various parts of the organization3. To communicate plans to the various responsibility centre managers4. To motivate managers to strive to achieve the organizational goals.5. To control activities6. To eliminates the wastes of all kinds7. To provide a yard stick against which actual results can be compared8. To evaluate the performance of managers.9. To reduce the uncertainties
Meaning of Estimate, forecast and Budget:An estimate is predetermination of future events either on the basis of simple guess work orfollowing scientific principles.Forecast is an assessment of probable future events. Budget is based on the implication of aforecast and related to planned events. To establish a realistic budget, it is necessary to forecast awide range of factors like sales volume, sales prices, material availability, wage rate, the cost ofoverheads etc.

Steps involved in Budgetary Control:The following steps may be considered necessary for a comprehensive budgetary controlprogramme:-
1. Laying down organizational goals or objectives2. Formulating the necessary plans to ensure that the desired objectives are achieved.3. Translating plans into budget4. Relating the responsibilities of executives to the requirements of a policy.5. Recording and reporting actual performance6. Continuous comparison of actual with budgeted results7. Ascertainment of deviations, if any8. Focusing attention on significant deviations9. Investigation into deviations to establish causes10. Presentation of information to management, relating the variations to individual
responsibility.11. Taking corrective action to prevent recurrence of variations.12. Provide a basis for revision of budgets.
Essentials of a Budgetary Control system: Successful implementation of a budgetary controlsystem depends up on the following essentials.
1. Support by top management: The wholehearted support of all managerial persons is verynecessary for the success of a budgetary control system.
2. Formal organization: The existence of a formal and sound organizational structure is of anabsolute necessity for an effective system of budgetary control.
3. Budget centers: For budgetary control purposes, the entire organization will be split into anumber of departments, area or functions, known as ‘centres’, and budgets will be preparedfor each such centers
4. Clear cut objectives and reasonably attainable goals:- If goals are too high to beattained, the purpose of budgeting is defeated. On the other hand, if the goals are so lowthat they can be attained very easily, there will be no incentive to special effort.
5. Participative budgeting: Every executive responsible for the implementation of budgetsshould be given an opportunity to take part in the preparation of budgets.
6. Budget committee: The work of preparing a budget manual should be entrusted to aBudget committee. The work of scrutinizing the budgets as well as approving of the sameshould be the work of this committee.
7. Comprehensive budgeting: Budgeting should not be partial, it should cover all thefunctions .
8. Adequate accounting system: There should be an adequate accounting system for thesuccessful budgetary control system, because those who are involved in the preparation ofestimates depend heavily on the accounting department.
9. Periodic reporting: - There should be a prompt and timely communication and reportingsystem for the effective implementation of a budgetary control system.

Material cost 70Labour cost 25Variable factory over head 20Fixed over head (Rs. 1,00,000) 10Variable expenses(Direct) 5Selling expenses (20% fixed) 15Distribution overhead (10% fixed) 10Administration expenses (Rs, 50,000) 5
Budget manual:CIMA England, defines a budget manual as “ a document , schedule or booklets which sets out;inter alia, the responsibilities of the persons engaged in the routine of and the forms and recordsrequired for budgetary control”. In other words, it is a written document which guides theexecutives in preparing various budgets.
Budget period: This may be defined as the period for which a budget is prepared and employed.The budget period will depend on the type of business and the control aspects. There is no generalrule governing the selection of the budget period.Classification of Budget
1. Classification according to time factor2. Classification according to flexibility factor3. Classification according to function.
I. Classification according to time factor: - On this basis, budgets can be of three types:1. Long term budget – for a period of 5 to 10 years2. Short term budgets – Usually for a period of one to two years3. Current budgets - Usually covers a period of one month or so,
II. Classification according to flexibility: It includes1. Flexible budgets and2. Fixed budgetsFlexible budgets: It is a dynamic budget. It gives different budgeted cost for different levels ofactivity. It is prepared after making an intelligent classification of all expenses between fixed ,semi variable and variable because the usefulness of such a budget depends up on the accuracywith which the expenses can be classified.
Steps in preparing flexible budgets:
1. Identifying the relevant range of activity2. Classify cost according to variability3. Determine variable cost4. Determine fixed cost5. Determine semi variable cost6. Prepare the budget for selected levels of activity
Example 1The expenses budgeted for production of 10,000 unit in a factory are furnished below:
Per unit in Rs

Prepare a flexible budget for production of 8,000 units.
Solution:
Out putPerunit(Rs)
10,000 unitsTotal
Out putPer unit(Rs)
8,000 unitsTotal(Rs.)
MaterialLabourDirect expe, (variable)
Factory overhead :VariableFixed
Administrative expenses:
Selling expenses:Fixed (20% of 15)Variable (80% of 15)
Distribution expenses:Fixed (10% of Rs. 10)Variable (90% of 10)
70.0025.005.00
100.00
20.0010.00
130.00
5.00
135.00
3.0012.00
1.009.00
160.00
7,00,0002,50,00050,000
10,00,000
2,00,0001,00,000
13,00,000
50,000
13,50,000
30,0001,20,000
10,00090,000
16,00,000
70.0025.005.00
100.00
20.0012.50
132.50
6.25
138.75
3.7512.00
1.259.00
164.75
5,60,0002,00,000
40,000
8,00,000
1,60,0001,00,000
10,60,000
50,000
11,10,000
30,00096,000
10,00072,000
13,18,000
Fixed Budget
It is a budget which is designed to remain unchanged irrespective of the level of activity attained. Itdoes not change with the change in the level of activity. This type of budget are most suited forfixed expenses. It is a single budget with no analysis of cost.
III. Classification according to function: It includes:
1. Functional budgets and2. Master budgets
Functional budgets are those which are prepared by heads of functional department s for theirrespective departments and are subsidiary to the master budget. Functional budget may beOperating budgets or financial budget. Operating budgets are those budgets which relate to thedifferent activities or operations of a firm. These are the primary budgets. Financial budgets arethose which incorporate financial decisions of an organization. They show in detail the inflow andoutflow of cash and the overall financial position.
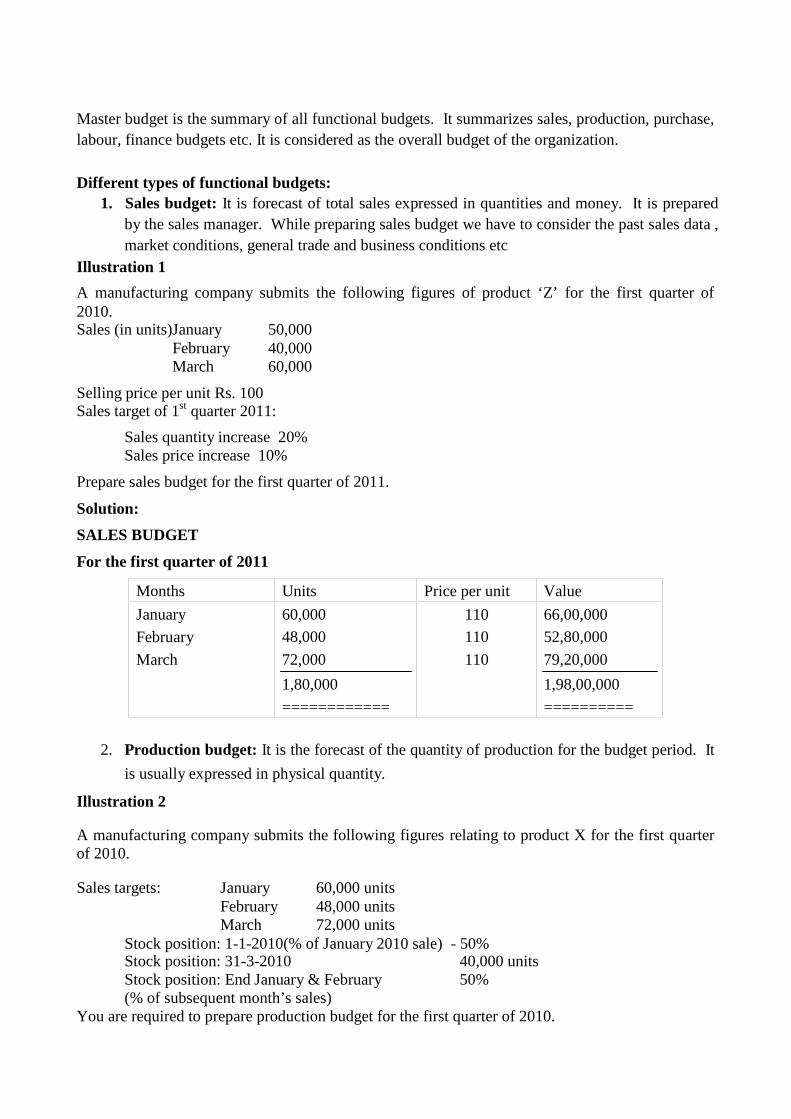
Master budget is the summary of all functional budgets. It summarizes sales, production, purchase,labour, finance budgets etc. It is considered as the overall budget of the organization.
Different types of functional budgets:1. Sales budget: It is forecast of total sales expressed in quantities and money. It is prepared
by the sales manager. While preparing sales budget we have to consider the past sales data ,market conditions, general trade and business conditions etc
Illustration 1
A manufacturing company submits the following figures of product ‘Z’ for the first quarter of2010.Sales (in units)January 50,000
February 40,000March 60,000
Selling price per unit Rs. 100Sales target of 1st quarter 2011:
Sales quantity increase 20%Sales price increase 10%
Prepare sales budget for the first quarter of 2011.
Solution:
SALES BUDGET
For the first quarter of 2011
Months Units Price per unit Value
January
February
March
60,000
48,000
72,000
1,80,000
============
110
110
110
66,00,000
52,80,000
79,20,000
1,98,00,000
==========
2. Production budget: It is the forecast of the quantity of production for the budget period. It
is usually expressed in physical quantity.
Illustration 2
A manufacturing company submits the following figures relating to product X for the first quarterof 2010.
Sales targets: January 60,000 unitsFebruary 48,000 unitsMarch 72,000 units
Stock position: 1-1-2010(% of January 2010 sale) - 50%Stock position: 31-3-2010 40,000 unitsStock position: End January & February 50%(% of subsequent month’s sales)
You are required to prepare production budget for the first quarter of 2010.
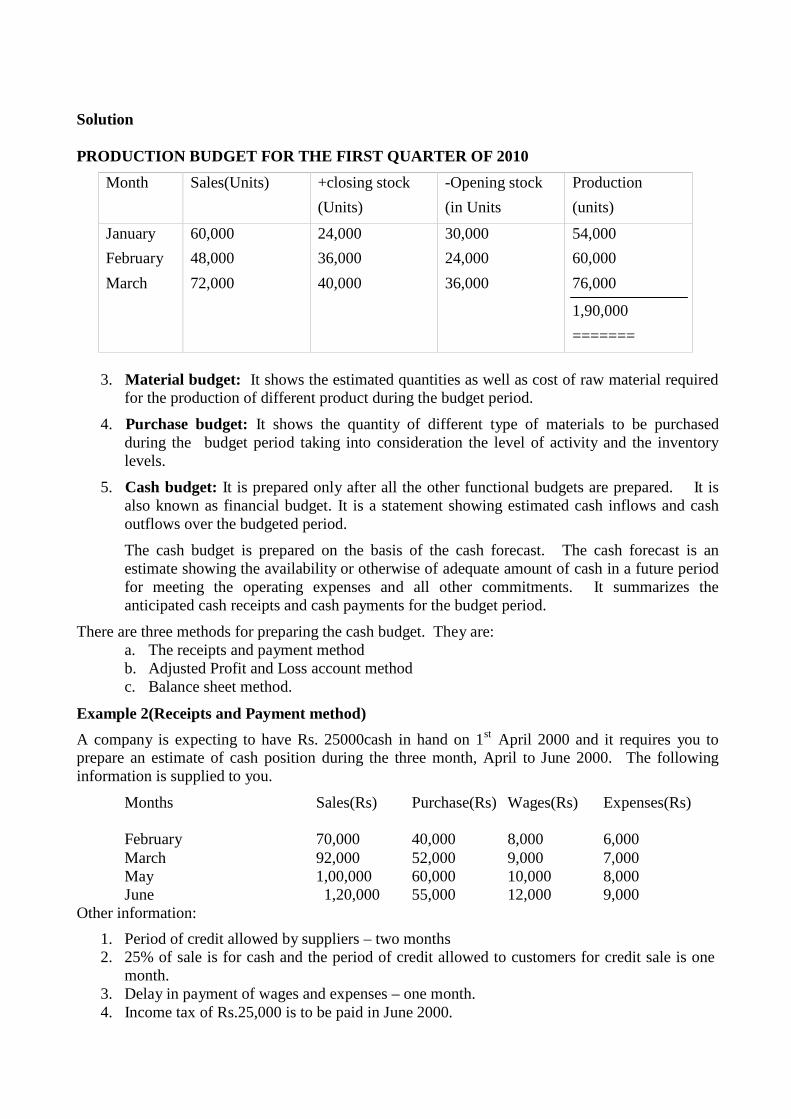
Solution
PRODUCTION BUDGET FOR THE FIRST QUARTER OF 2010
Month Sales(Units) +closing stock
(Units)
-Opening stock
(in Units
Production
(units)
January
February
March
60,000
48,000
72,000
24,000
36,000
40,000
30,000
24,000
36,000
54,000
60,000
76,000
1,90,000
=======
3. Material budget: It shows the estimated quantities as well as cost of raw material requiredfor the production of different product during the budget period.
4. Purchase budget: It shows the quantity of different type of materials to be purchasedduring the budget period taking into consideration the level of activity and the inventorylevels.
5. Cash budget: It is prepared only after all the other functional budgets are prepared. It isalso known as financial budget. It is a statement showing estimated cash inflows and cashoutflows over the budgeted period.
The cash budget is prepared on the basis of the cash forecast. The cash forecast is anestimate showing the availability or otherwise of adequate amount of cash in a future periodfor meeting the operating expenses and all other commitments. It summarizes theanticipated cash receipts and cash payments for the budget period.
There are three methods for preparing the cash budget. They are:a. The receipts and payment methodb. Adjusted Profit and Loss account methodc. Balance sheet method.
Example 2(Receipts and Payment method)
A company is expecting to have Rs. 25000cash in hand on 1st April 2000 and it requires you toprepare an estimate of cash position during the three month, April to June 2000. The followinginformation is supplied to you.
Months
February
Sales(Rs)
70,000
Purchase(Rs)
40,000
Wages(Rs)
8,000
Expenses(Rs)
6,000March 92,000 52,000 9,000 7,000May 1,00,000 60,000 10,000 8,000June 1,20,000 55,000 12,000 9,000
Other information:
1. Period of credit allowed by suppliers – two months2. 25% of sale is for cash and the period of credit allowed to customers for credit sale is one
month.3. Delay in payment of wages and expenses – one month.4. Income tax of Rs.25,000 is to be paid in June 2000.
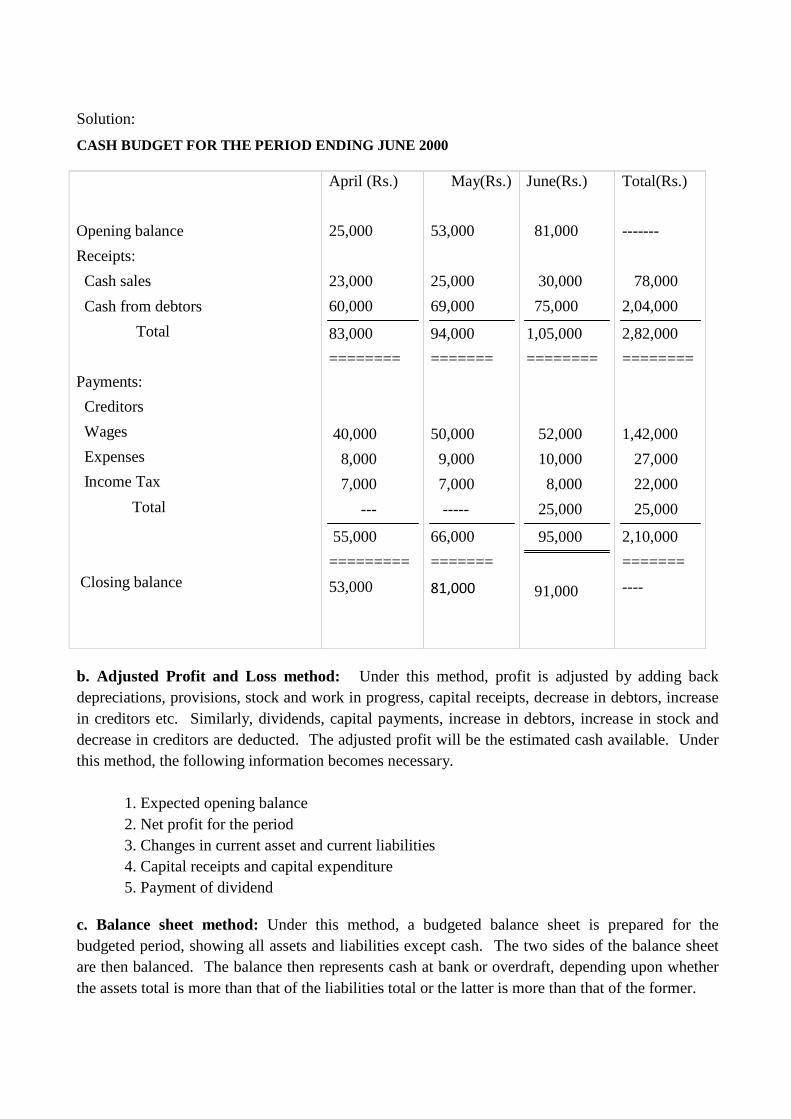
Solution:
CASH BUDGET FOR THE PERIOD ENDING JUNE 2000
Opening balance
Receipts:
Cash sales
Cash from debtors
Total
Payments:
Creditors
Wages
Expenses
Income Tax
Total
Closing balance
April (Rs.)
25,000
23,000
60,000
83,000
========
40,000
8,000
7,000
---
55,000
=========
53,000
May(Rs.)
53,000
25,000
69,000
94,000
=======
50,000
9,000
7,000
-----
66,000
=======
81,000
June(Rs.)
81,000
30,000
75,000
1,05,000
========
52,000
10,000
8,000
25,000
95,000
91,000
Total(Rs.)
-------
78,000
2,04,000
2,82,000
========
1,42,000
27,000
22,000
25,000
2,10,000
=======
----
b. Adjusted Profit and Loss method: Under this method, profit is adjusted by adding backdepreciations, provisions, stock and work in progress, capital receipts, decrease in debtors, increasein creditors etc. Similarly, dividends, capital payments, increase in debtors, increase in stock anddecrease in creditors are deducted. The adjusted profit will be the estimated cash available. Underthis method, the following information becomes necessary.
1. Expected opening balance2. Net profit for the period3. Changes in current asset and current liabilities4. Capital receipts and capital expenditure5. Payment of dividend
c. Balance sheet method: Under this method, a budgeted balance sheet is prepared for thebudgeted period, showing all assets and liabilities except cash. The two sides of the balance sheetare then balanced. The balance then represents cash at bank or overdraft, depending upon whetherthe assets total is more than that of the liabilities total or the latter is more than that of the former.

Advantages of Cash budget:
1. It helps to ascertain the shortage of cash
2. It helps to identify excess of cash, so that the surplus cash can be invested for a short period
3. It helps to ensure sufficient cash is available when required.
Recent trends in budgeting:
1. Zero Base Budgeting (ZBB): According to the official CIMA terminology, zero basebudgeting is, “ a method of budgeting which requires each cost element to be specificallyjustified, as though the activities to which the budget relates were being undertaken for thefirst time. Without approval, the budget allowance is zero” . Under ZBB theprogrammes and activities get evaluated and ranked from zero base as if these werelaunched for first time. In this technique of budgeting the unwanted projects and activitiesget dropped and wanted and desirable activities and projects get included in the budget.
Features:
a. It starts from zero
b. All activities are identified in appropriate decision packages
c. All programmes are considered totally afresh
d. A detailed cost benefit analysis of each programme is undertaken
e. There is an officer responsible for each decision packages
f. Priorities are established and decision packages are ranked
Advantages of ZBB1. It considers every time alternative ways of performing the same job. It helps the
management to get a critical appraisal of its activities.2. It is helpful to the management in making optimum allocation of scarce resources3. ZBB is particularly useful for service departments and Governments4. It ensures active participation of managers in the budgeting process.5. It promote high level of motivation at the level of unit managers6. It focuses on output in relation to value for money.7. It makes managers cost conscious and helps them in identifying priorities in the overall
interest of the organization.Difference between Traditional budgeting and ZBB
Traditional budgeting ZBB
1. Begins with previous year’sbudget
2. Focuses on money3. Produces a single level of
expenditure for an activity
4. Resources are allocated not on thebasis of cost benefit analysis
5. Prepared annually
1. Begins with zero a based
2. Focuses on goals and objectives3. Produces alternative level of
expenditure and desired result
4. Resources are allocated on the basis ofcost benefit analysis
5. Prepared once in every five years

2. Activity base budgeting: The CIMA official terminology defines activity based budgetingas,” a method of budgeting based on an activity frame work and utilizing cost driver data inthe budget setting and variance feedback processes.” In the case of traditional budgeting,budgets are established on the basis of budget centers. In the case of activity basedbudgeting, however, the budget centres are activity based cost pools or cost centres inrelation to which budgets are prepared. Separate cost pools are established for each type ofactivity.
3. Performance budgeting: - Performance oriented budgets are established in such a manner
that each item of expenditure related to a specific responsibility centre is closely linked with
the performance of that centre. The following matters will be specified very clearly in such
budgeting
a. Objectives of the organization and for which funds are requestedb. Cost of activities proposed for the achievement of these objectivesc. Quantitative measures to measure the performanced. Quantum of work to be performed under each activity.
Advantages of performance budgeting:
1. It improves budget formulation process2. It enhances accountability of the executives3. It facilitate more effective performance audit4. It presents clearly the purpose and objectives for which funds are required
Practical Problems:
I. ABC Company Ltd .has given the following particulars. You are required to prepare aCash budget for the three months ending 31st Dec. 2010.
Months Sales(Rs) Materials(Rs) Wages(Rs) Overhead(Rs)August 20,000 10200 3,800 1,900September 25,000 11000 3,900 2,100October 23,000 9800 4,000 2,300November 26,000 9000 4,200 2,400December 30,000 10800 4,500 2,500Credit items are:-
1. Debtors/Sales – 10% sales are on cash basis, 50% of the credit sales are collectednext month and the balance in the following month.
2. Creditors - - Materials 2 months--Wages 1/5 month-- Overhead ½ month
3. Cash balance on 1st October 2010 is expected to be Rs. 8,000
4. A machinery will be installed in August, 2010 at a cost of Rs. 1,00,000. The monthlyInstallment of Rs. 5,000 is payable from October onwards.
5. Dividend at 10% on preference share capital of Rs. 3,00,000 will be paid on 1st
December ,20106. Advance to be received for sale of vehicles Rs. 20,000 in December7. Income tax (advance) to be paid in December Rs. 5,000.

STANDARD COSTING
Meaning of ‘standard’ and ‘standard cost’: In the ordinary language, the term ‘standard’ meansa yardstick of measurement. The CIMA terminology defines this term as, “a benchmarkmeasurement of resources usage, set in defined conditions.”
Standard cost is a pre determined operating cost calculated from management’s standards ofefficient operation and the relevant necessary expenditure.Need for Standard Costs: The need for standard cost arises for the following reasons.
1. Cost control2. Measurement of efficiency3. Fixation of selling price4. Economy in cost of costing
Estimated cost: Pre determined costs may either be estimated or standard cost. Estimated cost is apre determined cost for a future period under normal conditions of operations. It is a prospectivecosting. Cost estimation is made for submitting tenders or quoting price of a product or a unit ofservices.
Definition of standard costing:
Standard costing is a technique of cost control. The CIMA official terminology defines it as “ acontrol technique which compares standard costs and revenues with actual results to obtainvariances which are used to stimulated improved performance.”
In standard costing the actual costs incurred are compared with the standard costs. The differencebetween the two is called variance.
Features: The following are the important characteristics of the standard costing system
1. Standard costs are set for various elements of total cost2. It makes a comparison of actual cost with standard cost3. Main objective of standard costing is to control cost4. Variances are reported to management for the purpose of decision making
Standard costing and Budgetary control
Both standard costing and budgetary control are similar in principle since both are concerned withsetting performance and cost levels for control purposes. Neither of the two techniques can beoperated successfully without the other. Budgetary control and standard costing are inseparablylinked together.Distinction between standard costing and budgetary control:
1. Budget is based on past performance, while standard is established on the basis of technicalestimates.
2. Budgets consider both income and expenditure whereas standards are for expenditure only.3. Budgets projects financial accounts, while standard cost project cost accounts4. In standard costing, variances are analyzed in detail, but such a detailed analysis of variance
is not possible in budgetary control.5. Budget fix minimum limit while standard fix targets.

6. Budgets are used for the forecasting men, money and materials, standards cannot be usedfor forecasting.
7. Budgetary control technique is applicable to all types of businesses. However standardcosting is useful only for manufacturing organizations.
8. The standards are expressed in per unit of production whereas budgets are for specificperiods and are expressed in total.
9. Budgetary control does not require standardization of product. But standard costingrequires standardization of product.
Objectives of standard costing:
1. Performance measurement2. Cost control3. Stock valuation4. Establishing selling prices5. Profit planning and decision making6. Basis of estimating7. Assisting establishment of budgets
Basic requirements of standard costing:
a. Organization structure: The existence of a sound organization structure with well definedauthority relationship is the basic requirement of a standard costing system.
b. Technical and engineering studies: It is very necessary to make thorough study of theproduction methods and the processes required for production.
c. Preparation of manual: It is also necessary to prepare a detailed manual for the guidanceof staff. The manual should describe the system to be introduced and the benefits thereof.
d. Type of standards: It is very necessary to determine the type of standard to be used,whether current, basic or normal standard.
e. Co-operation of Executives and staff:- Without the co-operation of the executives andstaff, it is very difficult to run the standard costing system.
f. Fixation of standards: Standard should be set for each element of cost and it should bescientific.
Steps involved in Standard Costing:-
The procedure for establishing standard costing is summarized as follows:-
1. Establishment of cost centres: - A cost centre is a location, person or item of equipmentfor which costs may be ascertained and used for the purpose of cost control. Cost centresare set up for cost ascertainment and cost control.
2. Classification and codification of accounts: - It facilitates quick collection and analysis ofcost information.
3. Establishment of standards: The success of the standard costing system depends up on thereliability and accuracy of standards. Standards are always established scientifically.
4. Ascertainment of actual cost: Measuring the actual cost which is incurred in the next stepin the standard costing.

5. Comparison of Standard cost and Actual cost.6. Analysis of Variances7. Reporting of variance
Types of standards
1. Basic standards: A standard established for use over a long period is known as the basicstandard. It remains unaltered over a long period. Its use is to show long term trends, and itoperates in a similar way to index numbers. It is also known as the ‘bogey, standard. Thisstandard is used for items or costs which are likely to remain constant over a long period.
2. Current standard: A standard established for use over a short period of time and related tocurrent conditions, is known as the ‘current standard’. This standard shows what theperformance should be under current conditions. Conditions during which period thestandard is used are known as current conditions.
3. Ideal standards & Expected standards:- Ideal standard is that which can be attainedunder the most favourable conditions, while expected standard is that which is expected tobe attained during a specified budget period. It is a target which is attainable and can beachieved if the expected conditions operate during the period for which the standard is set.
4. Normal standard: This standard is defined as “the average standard which it is anticipatedcan be attained over a future period of time, preferably long enough to cover one tradecycle.”It is difficult to follow normal standards in practice as it is not possible to forecastperformance with a reasonable degree of accuracy for a long period of time.
Analysis of Variances:
Variance is the difference between a standard cost and the comparable actual cost incurred during aperiod. It is the deviation of actual cost from the standard cost. In other words, the deviation of theactual cost or profit or sales from the standard cost or profit or sales is known as variance. If theactual cost is less than the standard, the difference is known as favourable or positive variance andit is symbol of efficiency. If the actual cost is more than the standard cost, the difference is knownas unfavorable variance. Analysis of variance means carrying out the appropriate investigation toidentify the reasons for the variance.
Another way of classifying variance may be controllable and uncontrollable variances. If avariance is due to inefficiency of a cost centre, it is said to be controllable variance. Such variancecan be corrected by taking a suitable action. A variance due to external reasons like increase inprices of material, labour etc it is a case of uncontrollable variances.
Types of variancesAnalysis of variances may be done in respect of each element of cost and sales. It includes
1. Direct material variance2. Direct labour variance3. Overhead variance4. Sales variance
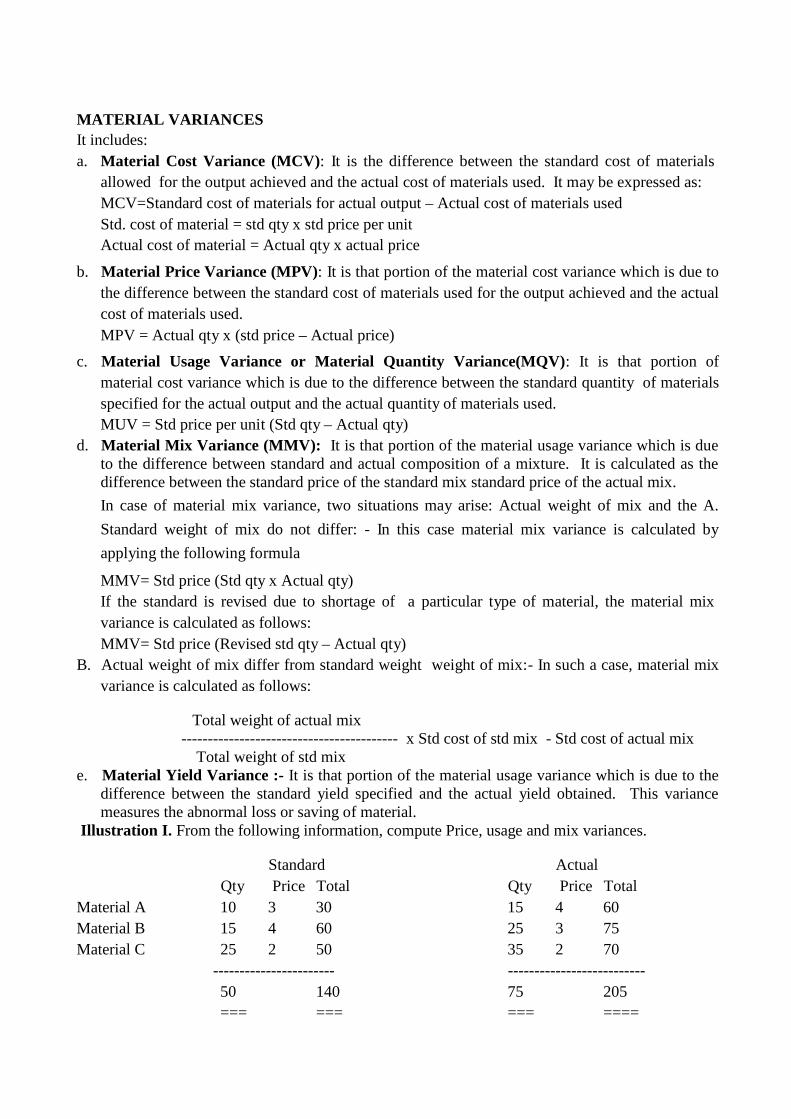
50 140 75 205=== === === ====
MATERIAL VARIANCESIt includes:a. Material Cost Variance (MCV): It is the difference between the standard cost of materials
allowed for the output achieved and the actual cost of materials used. It may be expressed as:MCV=Standard cost of materials for actual output – Actual cost of materials usedStd. cost of material = std qty x std price per unitActual cost of material = Actual qty x actual price
b. Material Price Variance (MPV): It is that portion of the material cost variance which is due tothe difference between the standard cost of materials used for the output achieved and the actualcost of materials used.MPV = Actual qty x (std price – Actual price)
c. Material Usage Variance or Material Quantity Variance(MQV): It is that portion ofmaterial cost variance which is due to the difference between the standard quantity of materialsspecified for the actual output and the actual quantity of materials used.MUV = Std price per unit (Std qty – Actual qty)
d. Material Mix Variance (MMV): It is that portion of the material usage variance which is dueto the difference between standard and actual composition of a mixture. It is calculated as thedifference between the standard price of the standard mix standard price of the actual mix.
In case of material mix variance, two situations may arise: Actual weight of mix and the A.
Standard weight of mix do not differ: - In this case material mix variance is calculated by
applying the following formula
MMV= Std price (Std qty x Actual qty)If the standard is revised due to shortage of a particular type of material, the material mixvariance is calculated as follows:MMV= Std price (Revised std qty – Actual qty)
B. Actual weight of mix differ from standard weight weight of mix:- In such a case, material mixvariance is calculated as follows:
Total weight of actual mix----------------------------------------- x Std cost of std mix - Std cost of actual mix
Total weight of std mixe. Material Yield Variance :- It is that portion of the material usage variance which is due to the
difference between the standard yield specified and the actual yield obtained. This variancemeasures the abnormal loss or saving of material.
Illustration I. From the following information, compute Price, usage and mix variances.
Standard ActualQty Price Total Qty Price Total
Material A 10 3 30 15 4 60Material B 15 4 60 25 3 75Material C 25 2 50 35 2 70
----------------------- --------------------------

Solution:
1. Material price variance:Actual usage (Std price - Actual Price)Material A = 15 (3 - 4) = Rs. 15 adverseMaterial B = 25 (4 – 3) = Rs. 25 FavourableMaterial C = 35 (2 – 2) = Nil
-------Total Price variance Rs. 10 Favourable
==============2. Material Usage variance:
Standard rate (Std usage – actual usage)Material A = 3( 10 – 15 ) =Rs. 15 AdverseMaterial B = 4 (15 – 25 ) =Rs. 40 AdverseMaterial C = 2 (25 – 35) = Rs. 20 Adverse
----------------------Total material usage Variance=Rs. 75 Adverse
3. Material Mix Variance:
Total weight of actual mix----------------------------------------- x Std cost of std mix - Std cost of actual mix
Total weight of std mix15+25+35------------ x 10 x Rs. 15 x Rs4 + 25 x Rs. 2) - 15 x Rs. 3 + 25 x Rs. 4 + 35 x Rs. 210+15+25
=75/50 x Rs. 140 – Rs. 215= Rs. 210 – Rs. 215 = Rs. 5 Adverse
Illustration 2. It is estimated that a product requires 50 units of material at the rate of Rs. 3 perunit. The actual consumption of material for manufacturing the same product came to 60 units atthe rate of Rs. 2.9 per unit. Calculate
1. Material cost variance2. Material price variance3. Material usage variance
Solution:
1. Material cost variance = Std cost – Actual costStd cost = Std qty x Std price per unit = 50 x 3 = 150Actual cost = Actual qty x Actual price per unit = 60 x 2.90 =174Material Cost Variance = 150 – 174 = 24 un favourable
2. Material Price Variance = Actual qty x (Std price – actual price)60 x (3 – 2.90) = 6 favourable
3. Material usage variance = Std price x (Std qty – Actual qty)3x (50 -60 ) = Rs. 30 unfavourable

Labour Variance: When standard cost of labour differs from actual wage cost, the labour variancearises. The following are the important types of labour variances
1. Labour cost variance: It is the difference between standard cost of labour allowed foractual output achieved and the actual cost of labour.LCV = Std cost of labour – Actual cost labour
2. Labour rate variance: It is that part of labour cost variance, which arises due to thedifference between standard rate specified and the actual rate paid.LRV = Actual time x (Std rate – Actual rate)
3. Labour Efficiency Variance: It is that portion of labour cost variance which arises due tothe difference between standard labour hours specified for the activity achieved and theactual labour hours expended.LEV = Standard rate x (Standard time for actual output – Actual time)
It arises because of the following reasons:
a. Use of incorrect grade of labourb. Insufficient trainingc. Bad supervisiond. Incorrect instructionse. Bad working conditionsf. Worker’s dissatisfactiong. Defective equipment and machineryh. Wrong item of equipmentsi. Excessive labour turn over, andj. Fixation of incorrect standards.
Illustration: I
Calculate labour cost variance from the following data:Standard hours: 40Rate : Rs. 3 per hourActual hours : 60Rate : Rs. 4 per hour
Solution:
Labour cost Variance = Standard cost of labour – Actual cost of labour= (40x3) – (60x4)=120 – 240 =Rs. 120 Adverse
Illustration II
The standard and actual figures of a firm are as underStandard time for the job : 1000 hrsStandard rate per hour : Re.0.50Actual time taken : 900 hoursActual wages paid : Rs.360
Compute labour variances.

Solution:Labour Cost Variance:= Standard cost of labour – Actual cost of labour
= (1000x0.50) – (900 x 0.40)=500 – 360= Rs. 140 Fav
Labour Mix Variance = Actual time x (Standard rate – Actual rate)= 900x (0.50 – 0.40)= Rs. 90 Fav
Labour efficiency Variance = Standard rate x (Standard time for actual output – Actual time)=0.50 x (1000 – 900)= Rs. 50 Fav.
Overhead Variances:
The term overhead, which comprises indirect materials, indirect labour and indirect expenses, mayrelate to factory, office or selling and distribution. It is the sum of variable overhead variance andfixed overhead variance. In other words, it is the difference between standard overhead costcharged to production and the actual overhead cost incurred.
Variable overhead Cost variance: This represents the difference between the standard cost ofvariable overhead allowed for actual output and the actual variable overhead incurred during theperiod. Variable overhead cost variance is made up of variable overhead expenditure variance andvariable overhead efficiency variance.
It is computed by the application of the following formula:
a. When OH rate per unit is usedVOH Cost Variance = (Actual output x Std variable OH rate per unit) – Actual Variable OHStd. VOH rate per unit = Std variable OH
--------------------Std out put
b. When OH rate per hour is usedVOH Cost Variance =(Std hours for actual output x Std variable OH rate per hour) – ActualVOHStd VOH rate per hour = Std VOH
----------------Std hours
Variable Over head Expenditure Variance:
It is the difference between the standard variable OH rate per hour and the actual variable OH rateper hour, multiplied by the actual hours worked.
Variable OH expenditure Variance = (Actual hours worked x Std Variable OH rate perhour) – Actual variable OH
OR
(Std output for actual hours x Std OH rate per unit) – Actual variable OH

Variable OH efficiency Variance: It is the difference between the variable overhead allowed forproduction and the variable overhead absorbed through production.
Variable OH Efficiency Variance = Std Variable OH rate per hour (Std hours for actualproduction – Actual hours)
If actual hours is less, it is favourable variance and vice versa.
Illustration
From the following data for the month of Feb., Calculate OH variances.
Budgeted production for the month - 150 units
Budgeted variable OHs - Rs. 3750
Std time for one unit - 10 hrs
Actual production for the month - 125 units
Actual variable OHs -Rs. 3 600/
Actual hours worked - 2250 hrs
Solution
Std OHs for actual production (125 units) = 3750/150 x 125
= Rs. 3125
Std OH rate per hour:
Total std hours = 150 units x 10 =1500 hrs
Rate per hour = 3750/1500 = Rs. 2.5
Actual OH rate per hour = 3600/2250 hrs = Rs. 1.6
Std. hours for actual production = 125 units x 10 hours = 1250 hrs
1. VOH Cost Variance = (Actual output x Std variable OH rate per unit) – Actual Variable OH= (125 x 25) – 3600=3125 – 3600 = 475 Adverse
2. Variable Overhead Expenditure Variance = (Actual hours worked x Std Variable OH rateper hour) – Actual variable OH
= (2250 x2.5) – 3600= Rs. 2025 F
3. Variable Overhead Efficiency Variance = Std Variable OH rate per hour(Std hours foractual production – Actual hours)
=2.5 (1250 -2250)= Rs. 2500 A

Fixed Over head variance:
It is the difference between standard fixed overhead allowed for actual output and the actual fixedoverhead incurred. Fixed overhead cost variance is calculated by using the following equation
Fixed OH cost Variance = Std. fixed OH for actual Output – Actual fixed OH
If actual OH is less, it is favourable variance and vice versa. Fixed OH cost variance is divided intotwo – fixed overhead expenditure variance and fixed overhead volume variance.
Fixed OH Expenditure variance: It is the difference between budgeted fixed overhead and actualfixed overhead.
Fixed Overhead expenditure variance = Budgeted fixed OH – Actual Fixed OH
Fixed OH volume Variance: It is the difference between Std fixed OH allowed for actual outputand the budgeted fixed overhead for the period.
Fixed Overhead Volume Variance = Std. fixed overhead for actual output – Budgeted fixedOverheads.
Illustration:
From the following data relating to June 2011, Calculate fixed OH variances:
Budgeted hours for the month = 180 hrs
Budgeted output for the month = 9,000 units
Budgeted fixed overheads = Rs. 27,000
Actual production for the month = 9,200 units
Actual hours for production = 175 units
Actual fixed overheads = Rs. 28,000
Solution:
1. Fixed overhead cost variance = Std fixed overhead for actual output – Actual fixed overhead= 27600 – 28000 = Rs. 400 A
2. Fixed Overhead expenditure Variance = Budgeted fixed overhead – Actual fixed overhead= 27,000 - 28,000 = Rs. 1000 A
3. Fixed Overhead Volume Variance = Std fixed overhead for actual output – Budgeted fixedoverheads
= 27600 - 27000 = Rs. 600 F
Note: Std. overhead for actual output (9200 units) = 27000/9000 x 9200
= Rs. 27600
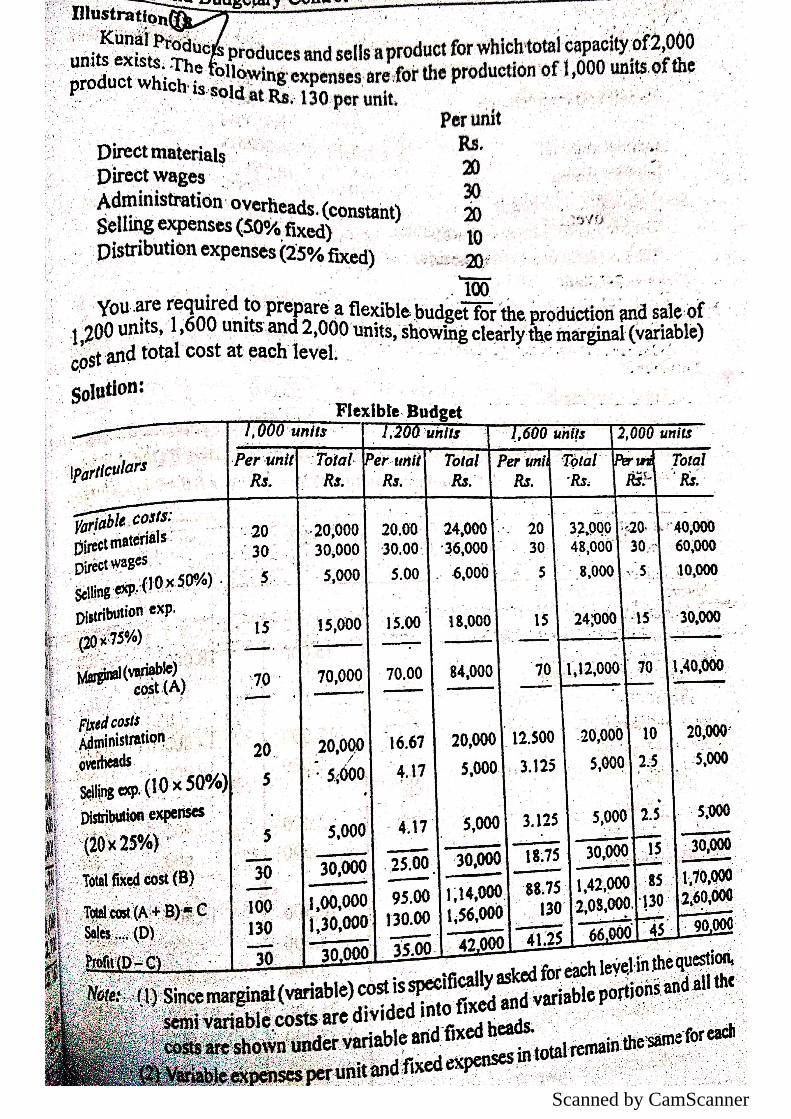
Scanned by CamScanner