
Lucent Optical Management System (OMS) - Nokia Online ...
226
Lucent Optical Management System (OMS) Release 6.1 SP Service Assurance Guide 365-315-148R6.1SP Issue 1 October 2007
-
Upload
khangminh22 -
Category
Documents
-
view
0 -
download
0
Transcript of Lucent Optical Management System (OMS) - Nokia Online ...
Lucent Optical Management System(OMS)Release 6.1 SPService Assurance Guide
365-315-148R6.1SPIssue 1
October 2007

Alcatel, Lucent, Alcatel-Lucent and the Alcatel-Lucent logo are trademarks of Alcatel-Lucent. All other trademarks are the property of theirrespective owners.
The information presented is subject to change without notice. Alcatel-Lucent assumes no responsibility for inaccuracies contained herein.
Copyright © 2007 Alcatel-Lucent. All Rights Reserved.
Notice
Every effort was made to ensure that the information in this document was complete and accurate at the time of printing. However,information is subject to change.
Warranty
Alcatel-Lucent provides a limited warranty for this product. For more information, consult your local Alcatel-Lucent customer support team.
Ordering information
The ordering number for this document is 365-315-148R6.1SP. To order Lucent OMS information products, contact your local Alcatel-Lucentcustomer support team.
Technical support
For technical support, contact your local customer support team. You can reach them via the Web at the Alcatel-Lucent Customer Support website (http://www. alcatel-lucent.com/support) or the customer support telephone number listed at the Alcatel-Lucent Contact Us web site(http://www.alcatel-lucent.com/contact).
Information product support
For questions or concerns about this or any other Alcatel-Lucent information product, please contact us at one of the following numbers: (888)727 3615 (for the continental United States), +1 (630) 713 5000 (for all countries).

Contents
About this information product
Purpose............................................................................................................................................................................................ ixix
Reason for reissue....................................................................................................................................................................... ixix
Intended audience........................................................................................................................................................................ ixix
Safety information....................................................................................................................................................................... ixix
How to use this information product.................................................................................................................................. ixix
Conventions used.......................................................................................................................................................................... xx
Related documentation............................................................................................................................................................. xiixii
How to order .............................................................................................................................................................................. xiiixiii
How to comment....................................................................................................................................................................... xivxiv
1 Service Assurance
Overview ...................................................................................................................................................................................... 1-11-1
Product Overview..................................................................................................................................................................... 1-21-2
Lucent OMS as an MST for OMC-RAN....................................................................................................................... 1-41-4
Supported Network Elements.............................................................................................................................................. 1-51-5
A Quick Look at Service Assurance................................................................................................................................. 1-91-9
2 Fault Management
Overview ...................................................................................................................................................................................... 2-12-1
The Fault Management Feature.......................................................................................................................................... 2-32-3
Alarm Holdoff ............................................................................................................................................................................ 2-62-6
...................................................................................................................................................................................................................................365-315-148R6.1SPIssue 1, October 2007
iii

Database Synchronization of Alarms................................................................................................................................ 2-82-8
Alarm Notification ................................................................................................................................................................... 2-92-9
Fault Management Pages.................................................................................................................................................... 2-122-12
Related Fault Management Pages................................................................................................................................... 2-142-14
Alarms Page............................................................................................................................................................................. 2-162-16
Alarm Log ................................................................................................................................................................................. 2-182-18
Network Event Summary.................................................................................................................................................. 2-202-20
Alarm Filtering ........................................................................................................................................................................ 2-262-26
Threshold Crossing Alert (TCA) Processing.............................................................................................................. 2-272-27
Threshold Crossing Alert page......................................................................................................................................... 2-282-28
Protection Switch Event Processing............................................................................................................................. 2-292-29
Protection Switch Event Log Page................................................................................................................................. 2-312-31
Root Cause Failure Processing......................................................................................................................................... 2-322-32
Root Cause Failures Page................................................................................................................................................... 2-352-35
View a List of Alarms on the Alarms Page................................................................................................................ 2-372-37
View the Details of an Alarm on the Alarms Page.................................................................................................. 2-412-41
Acknowledge Alarms on the Alarms Page.................................................................................................................. 2-422-42
Delete Instantaneous Alarms on the Alarms Page.................................................................................................... 2-432-43
Acknowledge and Delete Alarms on the Alarms Page........................................................................................... 2-442-44
View the Network Event Summary Page..................................................................................................................... 2-462-46
Update Alarm Counts on the Network Event Summary Page............................................................................ 2-472-47
Reset the New Event Indicator on the Network Event Summary Page.......................................................... 2-492-49
View the Details of Alarms from the Network Event Summary Page............................................................ 2-512-51
View the Details of Equipment from the Network Event Summary Page..................................................... 2-532-53
View the Details of Root Cause Failures from the Network Event Summary Page................................. 2-552-55
Update Root Cause Failure Counts on the Network Event Summary Page.................................................. 2-572-57
Perform a Partial Database Synchronization for Alarms and Events............................................................... 2-582-58
Contents
...................................................................................................................................................................................................................................
iv 365-315-148R6.1SPIssue 1, October 2007

View the Alarm Status of an Equipment Component............................................................................................. 2-602-60
View Alarm Log Records................................................................................................................................................... 2-622-62
Export Alarm Log Records................................................................................................................................................ 2-632-63
Delete Alarm Log Records................................................................................................................................................. 2-652-65
View a List of Root Cause Failures on the Root Cause Failures Page........................................................... 2-672-67
View the Details of a Root Cause Failure on the Root Cause Failure Page................................................ 2-712-71
Acknowledge Root Cause Failures on the Root Cause Failures Page............................................................. 2-722-72
View Client Connections for a Root Cause.............................................................................................................. 2-732-73
View Services for a Root Cause...................................................................................................................................... 2-742-74
View Affected Ports for a Root Cause.......................................................................................................................... 2-752-75
View Affected Ports on an NE for a Root Cause..................................................................................................... 2-762-76
View a List of Threshold Crossing alerts.................................................................................................................... 2-772-77
View the Details of Threshold Crossing Alerts from the Network Event Summary Page...................... 2-812-81
Acknowledge a Threshold Crossing Alert.................................................................................................................. 2-832-83
View a List of Events on the Protection Switch Event Page.............................................................................. 2-842-84
Acknowledge a Protection Switch Event Log page................................................................................................ 2-882-88
3 Performance Monitoring
Overview ...................................................................................................................................................................................... 3-13-1
The Performance Monitoring Feature.............................................................................................................................. 3-33-3
Performance Monitoring Pages........................................................................................................................................... 3-53-5
PM Time Intervals and Data Viewing............................................................................................................................. 3-73-7
PM Data Storage Behavior................................................................................................................................................... 3-93-9
Performance Monitoring Counters.................................................................................................................................. 3-113-11
Supported PM Parameters for NEs in the SDH/Ethernet Environment.......................................................... 3-463-46
Supported PM Parameters for NEs in the SONET/Ethernet Environment.................................................... 3-543-54
Supported PM Parameters for NEs in the WDM Environment.......................................................................... 3-553-55
View a List of Performance Measurements Statistics............................................................................................. 3-573-57
Contents
...................................................................................................................................................................................................................................365-315-148R6.1SPIssue 1, October 2007
v

View a List of PM-Capable Termination Points....................................................................................................... 3-583-58
Enable PM Data Collection............................................................................................................................................... 3-603-60
Disable PM Data Collection.............................................................................................................................................. 3-623-62
Schedule Disable PM Data Collection.......................................................................................................................... 3-643-64
Clear PM Data Collection for Selected Termination Points................................................................................. 3-663-66
View the Current PM Measurements of a Termination Point............................................................................. 3-683-68
View the Monitored NE Layer Rate Report............................................................................................................... 3-703-70
Enable/Disable NE Layer Rates....................................................................................................................................... 3-723-72
Generate a PM Report......................................................................................................................................................... 3-743-74
Save a PM Report.................................................................................................................................................................. 3-763-76
Polling Current Measurements......................................................................................................................................... 3-773-77
4 Profile Management
Overview ...................................................................................................................................................................................... 4-14-1
The Profile Management Feature....................................................................................................................................... 4-24-2
View a List of NE Profiles................................................................................................................................................... 4-34-3
View a List of Current Assignments for NE Profiles................................................................................................ 4-44-4
View Resource Details of a Current Assignment for an NE Profile................................................................... 4-54-5
Create an NE Profile............................................................................................................................................................... 4-64-6
Modify an NE Profile ............................................................................................................................................................. 4-84-8
Delete an NE Profile............................................................................................................................................................ 4-104-10
View the OMS NE Profile Template............................................................................................................................. 4-124-12
Create an OMS NE Profile Template............................................................................................................................ 4-144-14
Modify an OMS NE Profile Template.......................................................................................................................... 4-164-16
Delete an OMS NE Profile Template............................................................................................................................ 4-184-18
Assign an OMS TCA Profile to an NE........................................................................................................................ 4-204-20
Assign Threshold Profiles to Termination Points from PM Points Page...................................................... 4-224-22
Enable an NE Profile .......................................................................................................................................................... 4-244-24
Contents
...................................................................................................................................................................................................................................
vi 365-315-148R6.1SPIssue 1, October 2007

Disable an NE Profile......................................................................................................................................................... 4-264-26
Assign an NE Profile to a Resource.............................................................................................................................. 4-284-28
Index
Contents
...................................................................................................................................................................................................................................365-315-148R6.1SPIssue 1, October 2007
vii


About this information productAbout this information product
Purpose
This preface provides an overview of this information product, which is theLucentOptical Management System Service Assurance Guide.
The purpose of thisLucent OMS Service Assurance Guideis to explain to users howthe Lucent OMS is to be used to identify and isolate fault conditions and events in thenetwork and to obtain performance monitoring data.
Reason for reissue
Issue 1 of thisLucent OMS Service Assurance Guideis a revised document thatsupports Lucent OMS Release 6.1 SP
Intended audience
This Lucent OMS Service Assurance Guideis written primarily for operationspersonnel who use and administer the Lucent OMS.
Safety information
This document does not contain any safety information or warnings because LucentOMS is a software product.
How to use this information product
In the broadest sense, thisLucent OMS Service Assurance Guidecontains:
• Conceptualinformation, which is specific data related to the tasks
• Taskinformation, which includes user tasks (that is, step-by-step instructions)
The conceptual information complements and enhances the step-by-step instructionsthat are found in each task. Use the conceptual information to broaden your generalknowledge of the management system. It is best if you read all conceptual informationand have a good understanding of the concepts being presented before undertaking thestep-by-step instructions given in any task.
....................................................................................................................................................................................................................................365-315-148R6.1SPIssue 1, October 2007,
ix

The task information is based on a user needs analysis that has been performed foreach management system user job; therefore, use the task information to get the job athand done quickly and with minimal system impact.
The conceptual and task information portions of the document have extensivehyperlinks. Use these links to toggle between the two types of information presented soyou can access all pertinent information related to particular concepts and tasks.
This document can be used in its online versions (HTML/PDF) or in paper version(print PDF). The online HTML document version has a search capability, a full tableof contents in the front matter of the document and a partial table of contents in eachchapter, and an index for each document and for the entire management system library.Use all of these tools to help find information quickly. However, be aware that theindex for each document in the management system library and the index for the entiremanagement system library are the preferred search tools.
Important! This document contains information on the complete line of networkelements (NEs) that the Lucent OMS product supports. For a list of NEs that aresupported in Release 6.1 SP of the management system, refer to the Summary ofSupported NEs that is provided in Chapter 1 of this document.
In addition, this document contains information that is related to service packs(SPs) or maintenance releases that the Lucent OMS product is to support in thenear future. This material may not yet be visible or operable on the managementsystem servers and/or GUI and has been added only as a convenience for ourLucent OMS customers. This material is subject to change.
This document supports three hardware platforms on which Lucent OMS currentlyfunctions, which are the Lucent OMS HP® PA-RISC Server Platform (oftenreferred to as theServer Platform), the Lucent OMS HP® Itanium® ServerPlatform (often referred to as theServer Platform), and the Lucent OMS PCPlatform (often referred to as thePC Platform). Because the features that eachplatform supports vary, the variations of support are indicated in the text of thisdocument where appropriate. In addition, the document library is offered on twoCD-ROMs, depending on the platform on which Lucent OMS functions. Refer to“Related documentation”, which is in this section of the document for detailsregarding the two CD-ROMs that are available.
Conventions used
The conceptual information typically introduces each chapter or section of eachchapter. The information presented in this area varies according to the topic beingexplained—sections, subsections, tables, figures, and screen captures can be commonlyfound.
About this information product
...................................................................................................................................................................................................................................
x 365-315-148R6.1SPIssue 1, October 2007
,

The task information is presented as series of tasks that follows the conceptualinformation. These tasks are typically presented in the following functional order,depending on the nature of the subject being explained:
• View a List of . . .
• View the Details of . . .
• Add . . .
• Create . . .
• Modify . . .
• Delete . . .
Each task consists of sections that are calledWhen to use, Before you begin, Relatedinformation, andTask.
The intent of the When to use, Before you begin, and Related information sections isself-explanatory—they explain when a task is to be used, what needs to be consideredor done before you begin the task, and any related information that you would need toknow while doing the task.
When a task does not have any conditions that must be considered before it is started,the Before you begin section for that task states:This task does not have anypreconditions.
Each Task section consists of any number of steps. The completion of all steps, whichare sequentially numbered, are required for the entire task to be completedsuccessfully. In some instances, a step might be prefaced with the wordingOptional,which indicates that the step can be skipped and the task can still be successfullycompleted. A task is considered to be completed when all of its steps are completedand when the wordingEnd of Steps appears.
Many times, the management system affords the user with multiple ways to accomplishthe same task. In these instances, one task can present the user with severalMethodsof how to accomplish the same set of steps successfully.
In addition, thisLucent OMS Service Assurance Guiderelies on the followingtypographical conventions to distinguish between user input and computer output.
• When describing the Lucent OMS software, fields in windows and field entries areidentified with this font .
• When describing the UNIX® environment, text and numbers that the user inputs tothe computer are identified withboldface type.
• In the UNIX® environment, text and numbers that the computer outputs to the userare identified withmonospace type.
This Lucent OMS Service Assurance Guideuses the following convention to indicate apath of pages that should be navigated through to arrive at a destination page:
• Alarms and Events > Alarms
About this information product
...................................................................................................................................................................................................................................365-315-148R6.1SPIssue 1, October 2007,
xi

This same convention is also used to show a path through a series of menu items, forexample:
• Click the filtering tool, and selectNode > Node Type .
Occasionally, a set of management system features is not supported for all NEs or forboth operating environments. This set of features is clearly marked to show theseexceptions.
Related documentation
This Lucent OMS Service Assurance Guideis part of a set of documents that supportsthe Lucent OMS. An online version, in HTML format, of this document set is availableon CD-ROM. TheLucent OMS User Documentation CD-ROM(365-315-144R6.1SP)includes the full set of documents listed below.
An online version, in HTML format, of this document set is provided as part of theLucent OMS software.
Documentation
The document set that supports the Lucent OMS is comprised of the followingdocuments:
1. Lucent OMS Getting Started Guide(365-315-145R6.1SP), which instructs newusers how to use Lucent OMS. This document contains a glossary of terms.
2. Lucent OMS Network Element Management Guide(365-315-146R6.1SP), whichinstructs users how to use Lucent OMS to provision and manage network elements.
3. Lucent OMS Ethernet Management Guide(365-315-147R6.1SP), which instructsusers on how to use the Ethernet Management feature to provision and manageEthernet connections in a network.
4. Lucent OMS Service Assurance Guide(365-315-148R6.1SP), which instructs userson how to manage and interpret fault information collected from the network.
5. Lucent OMS Administration Guide(365-315-149R6.1SP), which instructs users onhow to administer and maintain Lucent OMS and the network.
6. Lucent OMS Connection Management Guide(365-315-150R6.1SP), which instructsusers on how to provision connections and manage connections in the Lucent OMSand the network.
About this information product
...................................................................................................................................................................................................................................
xii 365-315-148R6.1SPIssue 1, October 2007
,
Help products
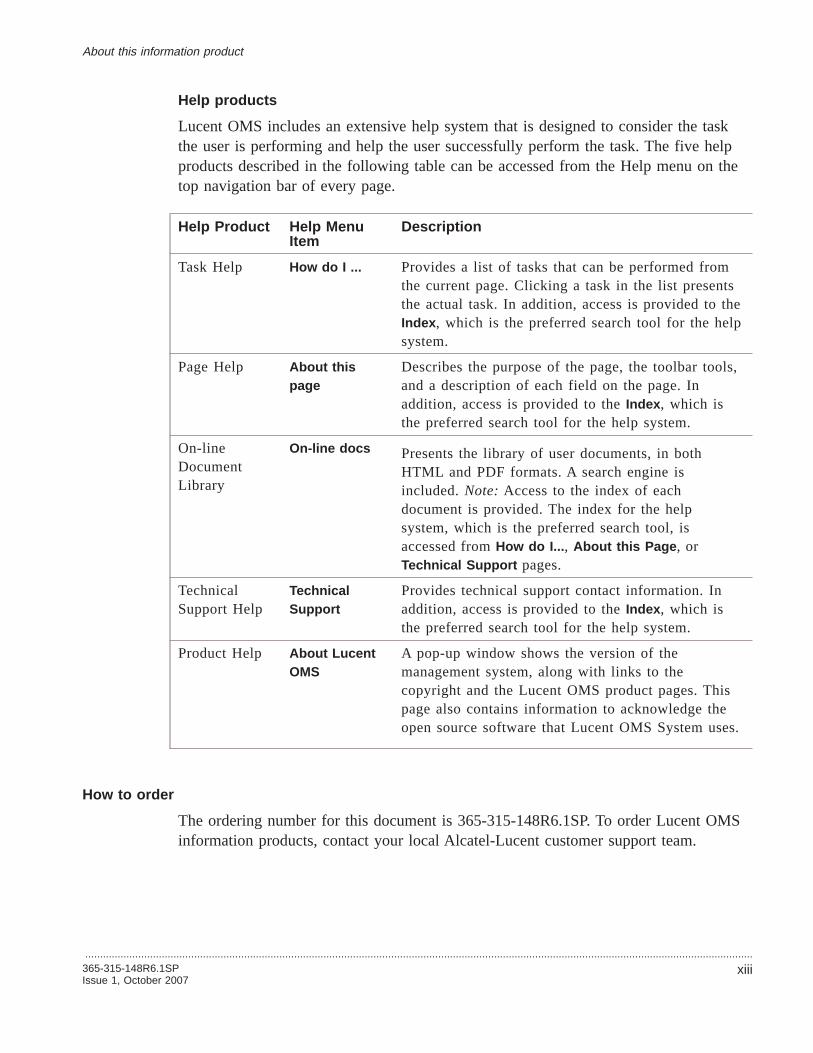
Lucent OMS includes an extensive help system that is designed to consider the taskthe user is performing and help the user successfully perform the task. The five helpproducts described in the following table can be accessed from the Help menu on thetop navigation bar of every page.
Help Product Help MenuItem
Description
Task Help How do I ... Provides a list of tasks that can be performed fromthe current page. Clicking a task in the list presentsthe actual task. In addition, access is provided to theIndex , which is the preferred search tool for the helpsystem.
Page Help About thispage
Describes the purpose of the page, the toolbar tools,and a description of each field on the page. Inaddition, access is provided to theIndex , which isthe preferred search tool for the help system.
On-lineDocumentLibrary
On-line docs Presents the library of user documents, in bothHTML and PDF formats. A search engine isincluded.Note: Access to the index of eachdocument is provided. The index for the helpsystem, which is the preferred search tool, isaccessed fromHow do I... , About this Page , orTechnical Support pages.
TechnicalSupport Help
TechnicalSupport
Provides technical support contact information. Inaddition, access is provided to theIndex , which isthe preferred search tool for the help system.
Product Help About LucentOMS
A pop-up window shows the version of themanagement system, along with links to thecopyright and the Lucent OMS product pages. Thispage also contains information to acknowledge theopen source software that Lucent OMS System uses.
How to order
The ordering number for this document is 365-315-148R6.1SP. To order Lucent OMSinformation products, contact your local Alcatel-Lucent customer support team.
About this information product
...................................................................................................................................................................................................................................365-315-148R6.1SPIssue 1, October 2007,
xiii

How to comment
To comment on this information product, go to theOnline Comment Form(http://www.lucent-info.com/comments/enus/) or e-mail your comments to theComments Hotline ([email protected]).
About this information product
...................................................................................................................................................................................................................................
xiv 365-315-148R6.1SPIssue 1, October 2007
,

1 1Service Assurance
Overview...................................................................................................................................................................................................................................
Purpose
This chapter provides general information about the Lucent OMS product and serviceassurance, which includes fault management and performance monitoring.
Contents
Product Overview 1-2
Lucent OMS as an MST for OMC-RAN 1-4
Supported Network Elements 1-5
A Quick Look at Service Assurance 1-9
...................................................................................................................................................................................................................................365-315-148R6.1SPIssue 1, October 2007
1-1

Product Overview...................................................................................................................................................................................................................................
Definition
Lucent OMS is an integrated, modular system that offers a range of network element(NE), network connection, and service/order management functions. It links themanagement of traditional network equipment with next-generation technology andoffers distribution options that can grow with network expansion. Lucent OMS controlsservice-restoration properties within the network, and complements this service-qualitymanagement with its own high-availability configurations.
Lucent OMS offers the benefits of fast service activation, state-of-the-art provisioning,reduced operating and equipment costs, accurate record keeping, fault management,and fast problem resolution. In addition, the management system candiscovermuch ofthe information about NEs and network connections, instead of requiring thatinformation to be entered manually, which minimizes network operator effort andreduces errors.
About the software
Lucent OMS is run through an Internet browser-based Graphical User Interface(GUI)—it is a weblicationthat runs through a browser. It supports the standard webfeatures that a browser offers, such as bookmarks, back, forward, reload, and print.
In addition, the management system provides standard machine-to-machine interfacesso it can be easily integrated into the embedded operations environment of the serviceprovider.
Support for both the SONET/SDH operating environments
The management system supports both the Synchronous Optical Network (SONET)and the Synchronous Digital Hierarchy (SDH) operating environments. The particularoperating environment to be used is controlled by an installation parameter; refer to theLucent OMS Administration Guidefor details.
User role profiles
When a user account is created, it is assigned a user role profile, which restricts thetasks the user login can perform. The management system offers these three predefinedfactory user role profiles:
• NOC Administrator
• NOC Expert Operator
• NOC Operator
Service Assurance
...................................................................................................................................................................................................................................
1-2 365-315-148R6.1SPIssue 1, October 2007

In addition, the management system allows the creation of a user-defined user roleprofile, which is a user role profile that consists of a customized list of tasks that isspecific to the job responsibilities of the user.
Refer to theLucent OMS Administration Guidefor details.
Installation parameters
An installation parameter is a parameter that is set during installation of themanagement system and may control the behavior of a feature.
Refer to theLucent OMS Administration Guidefor details.
User Activity Log
All provisioning changes done using the management system are logged in the UserActivity Log. For more information, see theLucent OMS Provisioning Guide.
Although it is not stated as part of the results for every task in this document, you canassume that all tasks that result in a management system weblication change are loggedto the User Activity Log.
Service Assurance Product Overview
...................................................................................................................................................................................................................................365-315-148R6.1SPIssue 1, October 2007
1-3

Lucent OMS as an MST for OMC-RAN...................................................................................................................................................................................................................................
Interworking with OMC-RAN
OMC-RAN, which offers element management for the mobility back haul networks,provides an integrated network view and overall network surveillance, which includesfault management (FM) for an entire network. OMC-RAN offers a cut-through toLucent OMS for the configuration management of the Mobile Access Transport System(MATS) and general access to configure appropriate NEs. When OMC-RAN userscut-through to Lucent OMS, they view a tree-like hierarchal GUI, and not thetraditional GUI of Lucent OMS.
When deployed in this capacity, Lucent OMS functions as a subtending elementmanagement system (EMS) under Lucent’s OMC-RAN; and, in this capacity, theLucent OMS is known as MST, or theManagement System for Transport, toOMS-RAN users.
Platform and license
To interwork with OMC-RAN and to function as an MST, Lucent OMS andOMC-RAN must be co-located on a single SUN Netra v1280 server running the SunSolaris operating system. Each management system, meaning OMC-RAN and LucentOMS, runs independently on this single server.
In addition, to enable the cut-through, the OMS_NE_MATS license must be installedand enabled on the Lucent OMS/MST management system.
Additional Details
When the Lucent OMS functions as an MST for OMC-RAN, refer to theManagementSystem for Transport (MST) User Guide, which is part of this documentation library,and the OMC-RAN documentation for additional details.
Service Assurance
...................................................................................................................................................................................................................................
1-4 365-315-148R6.1SPIssue 1, October 2007
Supported Network Elements...................................................................................................................................................................................................................................
The management system and its supported NEs
Lucent OMS supports Lucent’s family of optical NEs. To accommodate the world ofoptical transmission standards, these Lucent NEs operate using different transportstructures and they support different native command languages. Refer to“Summary ofsupported NEs” (p. 1-6)for a list of the particular NEs and the releases of those NEsthat the management system supports.
Supported transport structures
Lucent’s NEs are designed to operate in the Synchronous Digital Hierarchy (SDH)operating environment, the Synchronous Optical Network (SONET) operatingenvironment, or both environments. The Mobility Aggregation and Transport System(MATS) NE is an Ethernet NE that operates using Ethernet transport structure. Refer to“Summary of supported NEs” (p. 1-6)for a list of the transport structure of eachsupported NE.
Native command languages
Each NE supports a native command language that is used to control the NE at thenetwork-element-level via the Craft Interface Terminal (CIT).
The management system supports NEs that are controlled with the following threedifferent native command languages:
• TL1, which is Transaction Language 1
• CMISE, which is Common Management Information Service Element
• Simple Network Management Protocol (SNMP)/Command Line Interface (CLI)Note: SNMP is generally used to retrieve information from the NE; CLI isgenerally used for provisioning of the NE.
The management system uses the native command language of the NE to implementsome of its features; consequently, differences in management system behavior can beattributed to one native command language or another, which is why this categorizationis significant. The management system also indirectly manages CBX-3500 NEs via aTMF-814 interface to the management system of the CBX-3500 NEs calledCBGX-EMS. Therefore, throughout this document, references are made toTL1 NEs,CMISE NEs, or SNMP/CLI NEs.
Refer to“Summary of supported NEs” (p. 1-6)for a list of the native commandlanguage of each supported NE.
Service Assurance
...................................................................................................................................................................................................................................365-315-148R6.1SPIssue 1, October 2007
1-5

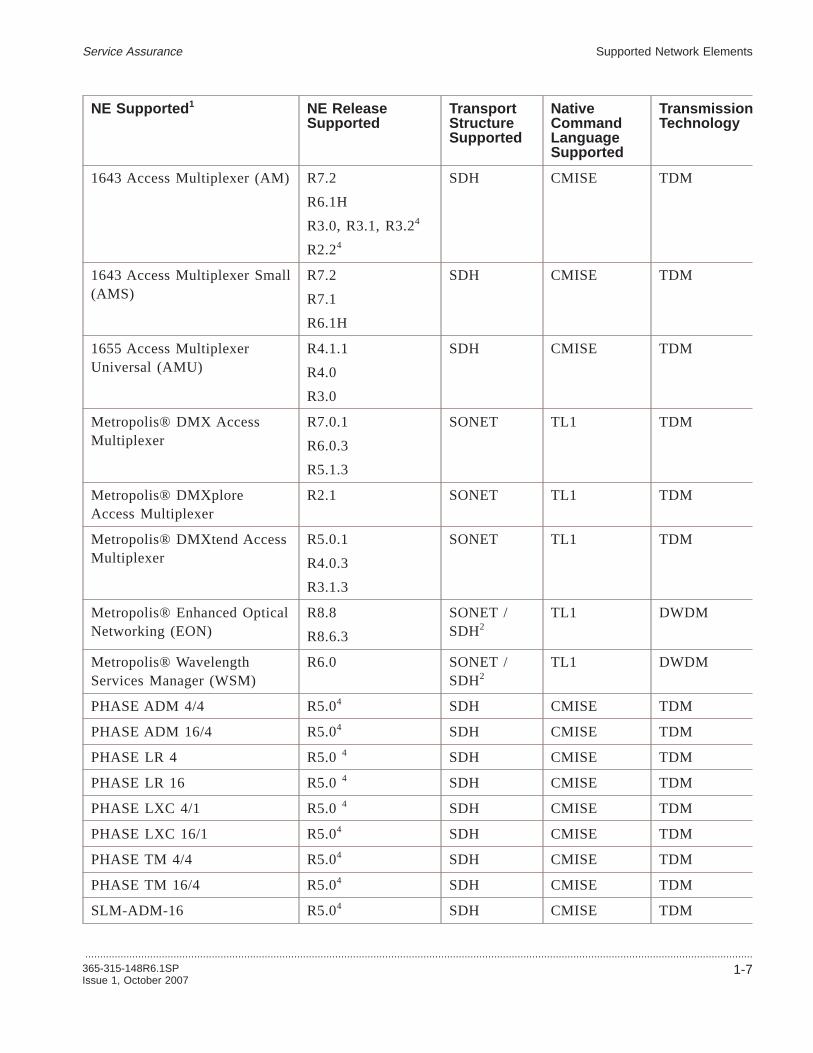
Summary of supported NEs
The following table summarizes each supported NE and its release, along with itstransport structure and its native command language.
Important! Each release of Lucent OMS supports certain NEs within Lucent’s familyof optical NEs. Mention of NEs or specific NE features in the text of this documentthat are not supported in this particular release of the management system apply toprior releases of the management system. Such material may not be currently visible oroperable on the management system GUI and has been added only as a conveniencefor our Lucent OMS customers.
NE Supported 1 NE ReleaseSupported
TransportStructureSupported
NativeCommandLanguageSupported
TransmissionTechnology
ISM ADM 1 R2.54
R3.54
SDH CMISE TDM
ISM ADM 4 R2.54
R3.54
SDH CMISE TDM
ISM Repeater 1 R2.54
R3.54
SDH CMISE TDM
ISM Repeater 4 R2.54
R3.54
SDH CMISE TDM
ISM TM 1 R2.54
R3.54
SDH CMISE TDM
ISM TM 4 R2.54
R3.54
SDH CMISE TDM
1675 Lambda UniteMultiService Switch (MSS)
R9.1, R9.0,R8.0.20, R7.0.2,R6.1.1
SONET /SDH
TL1 TDM
LambdaXtreme™ Transport R7.0.1, R5.1.1 SONET /SDH2
TL1 DWDM
Metropolis® ADMMultiService Mux (CompactShelf)
R5.0.3
R3.1, R3.2, R3.34SDH CMISE TDM
1663 Add DropMultiplexer-universal (ADMu)
R6.0
R5.0.1
SDH CMISE TDM
Service Assurance Supported Network Elements
...................................................................................................................................................................................................................................
1-6 365-315-148R6.1SPIssue 1, October 2007
NE Supported 1 NE ReleaseSupported
TransportStructureSupported
NativeCommandLanguageSupported
TransmissionTechnology
1643 Access Multiplexer (AM) R7.2
R6.1H
R3.0, R3.1, R3.24
R2.24
SDH CMISE TDM
1643 Access Multiplexer Small(AMS)
R7.2
R7.1
R6.1H
SDH CMISE TDM
1655 Access MultiplexerUniversal (AMU)
R4.1.1
R4.0
R3.0
SDH CMISE TDM
Metropolis® DMX AccessMultiplexer
R7.0.1
R6.0.3
R5.1.3
SONET TL1 TDM
Metropolis® DMXploreAccess Multiplexer
R2.1 SONET TL1 TDM
Metropolis® DMXtend AccessMultiplexer
R5.0.1
R4.0.3
R3.1.3
SONET TL1 TDM
Metropolis® Enhanced OpticalNetworking (EON)
R8.8
R8.6.3
SONET /SDH2
TL1 DWDM
Metropolis® WavelengthServices Manager (WSM)
R6.0 SONET /SDH2
TL1 DWDM
PHASE ADM 4/4 R5.04 SDH CMISE TDM
PHASE ADM 16/4 R5.04 SDH CMISE TDM
PHASE LR 4 R5.04 SDH CMISE TDM
PHASE LR 16 R5.04 SDH CMISE TDM
PHASE LXC 4/1 R5.04 SDH CMISE TDM
PHASE LXC 16/1 R5.04 SDH CMISE TDM
PHASE TM 4/4 R5.04 SDH CMISE TDM
PHASE TM 16/4 R5.04 SDH CMISE TDM
SLM-ADM-16 R5.04 SDH CMISE TDM
Service Assurance Supported Network Elements
...................................................................................................................................................................................................................................365-315-148R6.1SPIssue 1, October 2007
1-7

NE Supported 1 NE ReleaseSupported
TransportStructureSupported
NativeCommandLanguageSupported
TransmissionTechnology
SLM MS Protected TM 4 R5.04 SDH CMISE TDM
SLM MS Protected TM 16 R5.04 SDH CMISE TDM
SLM Regenerator 4 R5.04 SDH CMISE TDM
SLM Regenerator 16 R5.04 SDH CMISE TDM
SLM Unprotected TM 4 R5.04 SDH CMISE TDM
SLM Unprotected TM 16 R5.04 SDH CMISE TDM
WaveStar® ADM 4/1 V5 R44 SDH CMISE TDM
WaveStar® ADM 16/1 R8.0.3
R7.0.1
R6.2.54
R6.1, R6.04
SDH CMISE TDM
WaveStar® AM 1 R3.14 SDH CMISE TDM
WaveStar® BandwidthManager
R4.1.63 SONET TL1 TDM
WaveStar® DACS 4/4/1 R3.14, R3.04 SDH CMISE TDM
WaveStar® OLS 1.6T R8.03 , R7.16,R6.2.26
SDH CMISE DWDM
WaveStar® TDM 10G(STM64)
R5.05, R4.0 5 SDH TL1 TDM
1. Also supports the Unknown NE type, the Non-managed NE, and the Unmanaged Device.
2. Carries SONET/SDH transparently.
3. Releases listed are supported via cut-through to Lucent EMS R10.3.2. Domain and network levelsupport is also provided via the EMS G7 interface by the management system’s Lucent OMS GUI.
4. Release listed is supported via cut-through to ITM-SC R10.2 and NE is considered to be indirectlymanaged. Domain and network level support is also provided by the management system’s LucentOMS GUI via the XML interface between ITM-SC and the management system.
5. Releases 5.0 and 4.0 are supported directly by Lucent OMS R6.1SP. Release 5.0 is also supportedindirectly via Lucent EMS R10.3.1.
6. Releases listed are supported via cut-through to Lucent EMS R10.3.1.
Service Assurance Supported Network Elements
...................................................................................................................................................................................................................................
1-8 365-315-148R6.1SPIssue 1, October 2007

A Quick Look at Service Assurance...................................................................................................................................................................................................................................
Service Assurance definition
Service Assurance is a combination of management system features that affords theuser the capabilities of fault management and performance monitoring.
Fault Management features
A comprehensive set of Fault Management features allows users to monitor and trackalarms and transient condition events in the network. The management system receivesand processes the alarms on the network in real time, which enables a networkoperator to locate and repair faults in the network. The following features can be usedto monitor and track alarms and events that occur in the network:
• Alarm synchronization
• Alarm and event logging
• Audible and visual notification of alarms and events
• Alarm List
• Network Event Summary (NES)
• Symptomatic Alarm Filtering (SAF)
• Threshold Crossing Alert (TCA)
• Protection Switch Event Log (PSE)
• TMN Integration Module (TIM) Alarms Northbound Interface. For more detailsabout this feature, refer to theLucent OMS Administration Guide.
• Root Cause Failures (RCF)
Complete details about the Fault Management feature are provided inChapter 2, “FaultManagement”.
Performance Monitoring features
Performance Monitoring facilitates the planning and implementation of proactive,forward-looking network maintenance strategies by providing a centralized facility tomonitor network performance systematically, which is accomplished by non-intrusivelygathering in-service information about the state of the managed NEs. This process iscommonly referred to asperformance monitoring (PM) data. The PM data that isgathered can be used to track recurring traffic errors and service degradation at specificpoints in the network, with the intention of identifying facilities that should be repairedor upgraded to avoid possible interruption of service.
Performance Monitoring features enables the user to do the following:
• Enable the collection of PM data on termination points, which can include ports
• Enable or disable on-demand PM data collection for one or more NE ports
Service Assurance
...................................................................................................................................................................................................................................365-315-148R6.1SPIssue 1, October 2007
1-9

• Display current PM parameter measurements for a selected NE port or signal
• Enable the scheduled collection of PM data for one or more NE ports for a specificdate/time period, or cancel the scheduled PM data collection on selected port orports
• Generate and view a formatted report of PM data collected from one or more NEports that have PM data collection enabled
Complete details about the Performance Monitoring feature are provided inChapter 3,“Performance Monitoring”.
Profile Management features
Profile Management allows the user to create various configurations (profiles) for aresource (ports and pieces of equipment) for NEs that are supported. Theseconfigurations are then linked to a set of resources.
The Profile Management feature has the following parts:
• NE Profile Management
• NE Profile Assignment
Complete details about the Profile Management feature are provided inChapter 4,“Profile Management”.
Service Assurance A Quick Look at Service Assurance
...................................................................................................................................................................................................................................
1-10 365-315-148R6.1SPIssue 1, October 2007

2 2Fault Management
Overview...................................................................................................................................................................................................................................
Purpose
This chapter provides general information about monitoring alarms and fault conditionsin the managed network using the Lucent OMS and the tasks that can be performed tomonitor alarms and fault conditions.
Contents
The Fault Management Feature 2-3
Alarm Holdoff 2-6
Database Synchronization of Alarms 2-8
Alarm Notification 2-9
Fault Management Pages 2-12
Related Fault Management Pages 2-14
Alarms Page 2-16
Alarm Log 2-18
Network Event Summary 2-20
Alarm Filtering 2-26
Threshold Crossing Alert (TCA) Processing 2-27
Threshold Crossing Alert page 2-28
Protection Switch Event Processing 2-29
Protection Switch Event Log Page 2-31
Root Cause Failure Processing 2-32
Root Cause Failures Page 2-35
View a List of Alarms on the Alarms Page 2-37
...................................................................................................................................................................................................................................365-315-148R6.1SPIssue 1, October 2007
2-1

View the Details of an Alarm on the Alarms Page 2-41
Acknowledge Alarms on the Alarms Page 2-42
Delete Instantaneous Alarms on the Alarms Page 2-43
Acknowledge and Delete Alarms on the Alarms Page 2-44
View the Network Event Summary Page 2-46
Update Alarm Counts on the Network Event Summary Page 2-47
Reset the New Event Indicator on the Network Event Summary Page 2-49
View the Details of Alarms from the Network Event Summary Page 2-51
View the Details of Equipment from the Network Event Summary Page 2-53
View the Details of Root Cause Failures from the Network EventSummary Page
2-55
Update Root Cause Failure Counts on the Network Event Summary Page 2-57
Perform a Partial Database Synchronization for Alarms and Events 2-58
View the Alarm Status of an Equipment Component 2-60
View Alarm Log Records 2-62
Export Alarm Log Records 2-63
Delete Alarm Log Records 2-65
View a List of Root Cause Failures on the Root Cause Failures Page 2-67
View the Details of a Root Cause Failure on the Root Cause FailurePage
2-71
Acknowledge Root Cause Failures on the Root Cause Failures Page 2-72
View Client Connections for a Root Cause 2-73
View Services for a Root Cause 2-74
View Affected Ports for a Root Cause 2-75
View Affected Ports on an NE for a Root Cause 2-76
View a List of Threshold Crossing alerts 2-77
View the Details of Threshold Crossing Alerts from the Network EventSummary Page
2-81
Acknowledge a Threshold Crossing Alert 2-83
View a List of Events on the Protection Switch Event Page 2-84
Acknowledge a Protection Switch Event Log page 2-88
Fault Management Overview
...................................................................................................................................................................................................................................
2-2 365-315-148R6.1SPIssue 1, October 2007
The Fault Management Feature...................................................................................................................................................................................................................................
Fault Management definitions
Fault Management is a management system feature that enables users to monitor andtrack events and transient events in the network. With the addition of the FaultManagement Correlation Logic (OMS_RCF) license, Fault Management enables usersto identify potential Root Cause Failures in the network and the network services thatare impacted by those failures.
Events tracked
The management system tracks the following two broad categories of events in anetwork:
• An alarm, which is a visible or audible signal that indicates that an equipment ortransmission failure or a significant event/condition has occurred. Alarms arecategorized into multiple levels that identify their relative severity.
• A Threshold Crossing Alert (TCA)is a message that an NE issues if the value of aperformance monitoring (PM) parameter exceeds a set threshold value. An exampleof a PM parameter for which a TCA can be issued if the threshold value isexceeded is the Number of Errored Seconds.
• A Protection Switch Events (PSE)Log is generated when a protection switchoccurs in a network element and causes traffic to be switched between a workerand a protection entity.You will be able to use the Protection Switch Event log to acknowledge a PSE inorder to mark it as seen by a network operator.
Lucent Optical Management System will include the following protection switch eventtypes:
• Equipment Protection Groups
• MS Protection Groups
• MS-SPRing Groups
• High Order (OCH, STS1, STS3c, AU3 and AU4) SNCP
• RPR Protection for Ethernet
Important! The management system stores a maximum of 300,000 historic alarms and100,000 current alarms.
Process overview
In general, the management system processes and analyzes alarms generated from themanaged NEs. Alarms and events are first received in the management system; then,NE alarms and events are pinpointed to the shelf, slot, physical port, or logical portlevel.
Fault Management
...................................................................................................................................................................................................................................365-315-148R6.1SPIssue 1, October 2007
2-3

In addition, the management system generates and logs security alarms in order totrack such occurrences as the number of failed login attempts by an unauthorized user.
Alarm status
The management system informs users about the current alarm status and alerts themto a new raised alarm through the following mechanisms:
• The use of color; see“Alarm Notification” (p. 2-9) for details.
• The use of audible signals; see“Audible notification” (p. 2-9)for details.
• Immediately available alarm details; see“Network Event Summary ” (p. 2-20)fordetails.
• Current tallies of alarms; see“Network Event Summary ” (p. 2-20)for details.
Data “Chunking”
If a search request results in at least 150 data records, the search result data is“chunked” (grouped) into sets of 150 data records. If the search request results in morethan 150 records, the next set of 150 data records is “chunked” in the same manner.Links to each set of the 150 records numbered sequentially from 1 to 3 are displayedat the bottom of the table. The user can also click on the Next or Previous links todisplay additional search request data results in groups of 150 records.
Alarm Visibility within Domains
An alarm is visible to a user only if the object that the alarm is reported on is amember of the user’s parent geographical domain or a member of any of the childrenbelonging to that domain.
The following table lists the alarm types that will be visible.
Alarm Types Description
NES These alarm types are visible in the NESand contribute to the NES counters:
• OMS Platform Alarms
• Alarms on objects which are in theuser’s domain or sub-domain
Note: The network discrepancy eventscounters are not filtered by domain.
Fault Management The Fault Management Feature
...................................................................................................................................................................................................................................
2-4 365-315-148R6.1SPIssue 1, October 2007

Alarm Types Description
Alarm List These alarm types are visible in the alarmlist:
• OMS Platform Alarms
• Alarms on objects which are in theuser’s domain or sub-domain
Alarm Log All alarms are visible in the alarm logindependently of domain settings.
To determine the domain for an object, consider the alarm type, which provides theobject that controls the domain:
Alarm Type Object to Check Domain
TP Alarm NE
NE Alarm NE
Equipment Alarm NE
AID Alarm NE
Alarm raised by node for which thesystem cannot find an associatedTP/equipment object
NE
OMS Platform Alarm <Always Visible>
Platform Alarm on an NE NE
ONNS Connection Alarm NE issuing alarm
Fault Management The Fault Management Feature
...................................................................................................................................................................................................................................365-315-148R6.1SPIssue 1, October 2007
2-5

Alarm Holdoff...................................................................................................................................................................................................................................
Alarm holdoff definition
Alarm holdoff is the amount of time that the management system waits beforeprocessing an alarm raise or an alarm clear state. With alarm holdoff, alarm recordscan be placed directly into the Alarm Log without being displayed in the alarm list orNEs.
Alarms that increase the load
The following two types of alarms can increase the alarm burden on the managementsystem, and their occurrence would likely warrant the enabling of alarm holdoff:
• Short duration alarmsare those alarms that are raised and cleared within a fewseconds. These alarms are caused by transient alarms that occur during theprovisioning process or by incorrectly-set raise hold offs in the NEs.
• Flapping alarmsare those alarms that are raised, cleared, and then re-raised on aregular basis, for instance, due to repeating transient faults detected in the samesource. The “same source” is defined as alarms which match. For example: NEName, Native Probable Cause and Native EMS Name. The system will perform acheck for flapping alarms across the alarm list and alarm log at regular intervalsand will raise a platform alarm against each NE which has them. You can thencheck the alarm list and alarm log to find the offending alarm and correct theproblem.
Alarm hold off functionality
If the duration of an alarm is short so that the Raise Hold Off time is in effect, thealarm is stored directly in the Alarm Log without being displayed in the Alarm List.
Note: If a short duration alarm is held off, it is not immediately stored in the AlarmLog. The management system will retrieve these alarms and place them in the AlarmLog periodically.
At regular intervals, the management system checks if any suppressed alarms havebeen added to the Alarm Log since the last check occurred, and raises a platform alarmif it finds any suppressed alarms.
Alarm priorities
Alarms are assigned a priority based upon the alarm’s probable cause. In the networkadaptor each priority is assigned to a different hold off time, lower priority alarms areassigned a greater hold off time than higher priority alarms. This can result in higherpriority alarms overtaking lower priority alarms during processing, which will aid theuser in more rapid fault diagnosis.
Fault Management
...................................................................................................................................................................................................................................
2-6 365-315-148R6.1SPIssue 1, October 2007

Topology Based Alarm Filtering
For connections across large networks fault management is performed on asubsetofthe alarms reported by the connection midpoints, rather than on all alarms types onevery TP connection. This results in the reduction of the number of alarms beingprocessed without reducing the quality of connection monitoring being performed.
Lucent OMS identifies important TP types in the network, based on topology, and thento provide filtering of alarms at those points, based on the incoming alarm type. Thisfeature is controlled by a installation parameter (FM_TOPOLOGY_FILTERING) whichcan be used to enable/disable it.
Fault Management Alarm Holdoff
...................................................................................................................................................................................................................................365-315-148R6.1SPIssue 1, October 2007
2-7

Database Synchronization of Alarms...................................................................................................................................................................................................................................
Database synchronization of alarms definition
Database synchronization of alarms is the process of retrieving the current alarm statusfrom the network, and auditing and updating the management system view of thecurrent alarm status to match the current network view. The management systemcreates and clears alarms in its view as necessary to become consistent with the currentnetwork status.
Synchronization Types
The Application supports and uses Full Alarm synchronization which may be executedautomatically or manually. Synchronization of persistent raised TCAs is supported;however transient TCAs or PSEs are not supported.
Automatic alarm synchronization
The management system automatically synchronizes alarms whenever communicationwith an NE is reestablished or when an NE is added to the management systemdatabase.
Manual Synchronization
The Application provides the user with the ability to Full Alarm synchronization for allraise notifications held in the OMS for a single NE with those actually held by the NE.The database synchronization process can be initiated from the Initiate DatabaseSynchronization page of the management system.
Refer to theLucent OMS Network Element Management Guide, DatabaseSynchronization section, for a further explanation of on-demand alarm synchronization.
Fault Management
...................................................................................................................................................................................................................................
2-8 365-315-148R6.1SPIssue 1, October 2007
Alarm Notification...................................................................................................................................................................................................................................
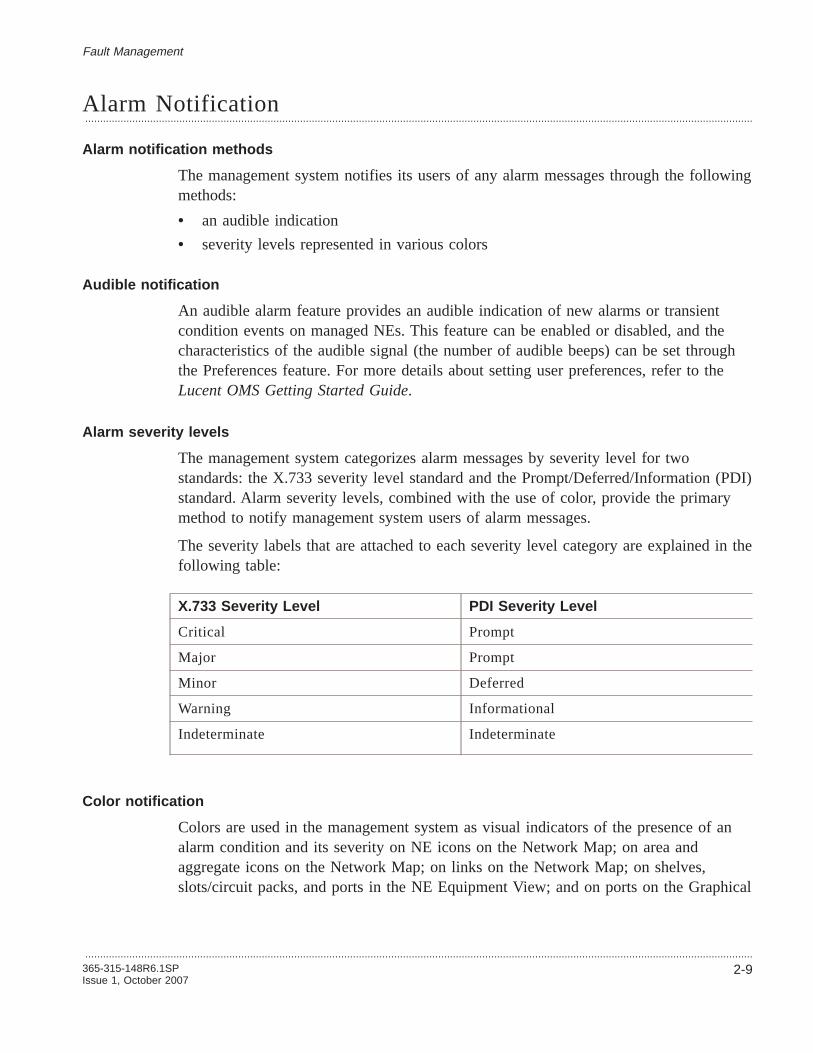
Alarm notification methods
The management system notifies its users of any alarm messages through the followingmethods:
• an audible indication
• severity levels represented in various colors
Audible notification
An audible alarm feature provides an audible indication of new alarms or transientcondition events on managed NEs. This feature can be enabled or disabled, and thecharacteristics of the audible signal (the number of audible beeps) can be set throughthe Preferences feature. For more details about setting user preferences, refer to theLucent OMS Getting Started Guide.
Alarm severity levels
The management system categorizes alarm messages by severity level for twostandards: the X.733 severity level standard and the Prompt/Deferred/Information (PDI)standard. Alarm severity levels, combined with the use of color, provide the primarymethod to notify management system users of alarm messages.
The severity labels that are attached to each severity level category are explained in thefollowing table:
X.733 Severity Level PDI Severity Level
Critical Prompt
Major Prompt
Minor Deferred
Warning Informational
Indeterminate Indeterminate
Color notification
Colors are used in the management system as visual indicators of the presence of analarm condition and its severity on NE icons on the Network Map; on area andaggregate icons on the Network Map; on links on the Network Map; on shelves,slots/circuit packs, and ports in the NE Equipment View; and on ports on the Graphical
Fault Management
...................................................................................................................................................................................................................................365-315-148R6.1SPIssue 1, October 2007
2-9

Layout. Different colors are used to represent the various alarm severity levels. Thecolor displayed indicates the highest severity level of an active alarm, a loss ofcommunication, or an absence of alarms.
Alarm view colors for icons and links
The alarm view is available to users when the OMS_CORE license is installed.
In the alarm view, the color of an NE icon, and/or an area and aggregate icon, or alink indicates the highest severity of an alarm that is present for that entity in thatcategory.
An NE icon and a link have one section.
Area and aggregate icons each have two sections:
• The section marked with an E/T represents Equipment/Transmission.
• The section marked with a C represents Communications.
In the following table, alarms are listed in order of severity with the highest severityalarm at the top of the table.
Note: The colors in the following tables are the default colors in the system.
Color of NE Icon, Link,or E/T Section ofArea/Aggregate
X.733 Severity Level PDI Severity Level
Red Critical alarm Prompt alarm
Yellow Major alarm Not applicable
Light Blue Minor alarm Deferred alarm
Purple Warning Informational alarm
Green Indeterminate Indeterminate
Green No alarm
Grey The association to the node has been released. Also, theentire area or aggregate icon is colored gray if it isempty.
Fault Management Alarm Notification
...................................................................................................................................................................................................................................
2-10 365-315-148R6.1SPIssue 1, October 2007

The following table describes how color is used on an NE icon, link, or in the Csection of an area and aggregate icon to indicate alarm severity. The alarms are listedin order of severity with the highest severity alarm at the top of the table.
Color of NE Icon, Link,or C Section ofArea/Aggregate Icon
X.733 Severity Level PDI Severity Level
Magenta Loss of communication
Green No alarm
Grey The entire area or aggregate icon is colored gray if it isempty.
Equipment page colors
The following table shows the default management system colors used to indicate eachalarm severity level or communication status on any of the Equipment pages. Thesedynamically-updated color indications apply to the alarm icons on the Equipmentpages.
Default Color onEquipment Pages
X.733 Severity Level PDI Severity Level
Red Critical Alarm Prompt Alarm
Yellow Major Alarm Not Applicable
White Not alarmed; equivalent toa Warning alarm level onthe Network Map
Informational; equivalentto a Warning alarm levelon the Network Map
Light Blue Minor Alarm Deferred Alarm
Green No Alarm No Alarm
Fault Management Alarm Notification
...................................................................................................................................................................................................................................365-315-148R6.1SPIssue 1, October 2007
2-11

Fault Management Pages...................................................................................................................................................................................................................................
Specifically designed pages
The pages of the management system that are specifically designed to present faultmanagement information are the following:
• Alarms page
• Alarm Log page
• Network Event Summary page
• Root Cause Failures page
• Protection Switch Event Log page
• Threshold Crossing Alert page
Alarms page
The Alarms page displays a complete, detailed listing of currently active alarms andevents, with related information about the status, source, probable cause, raise date andtime, clear date and time, ID of the user who acknowledged the alarm or event, andother pertinent information. For more details, see the“Alarms Page” (p. 2-16)section.
Alarm Log page
The Alarm Log page displays historic information about alarms and events. For moredetails, see the“Alarm Log” (p. 2-18) section.
Network Event Summary page
The Network Event Summary page displays a current tally of the total number ofraised alarms and Threshold Crossing Alerts (TCAs), total number of acknowledgedraised alarms and TCAs, and unacknowledged cleared alarms and TCAs, with asummary listing of the most recently received raised and cleared alarms. TheNetworkEvent Summary also displays the number of unacknowledged PSEs and a summarylisting of the most recently raised PSEs.
Note: Details about an alarm are immediately available on the Network EventSummary page, which is also accessible from the Alarms page or the Graphical Layoutpage.
Additionally, counts are available for:
• total raised and unacknowledged inconsistent connections
• total raised uncorrelated cross connections
• root cause failures
Note that the settings of the user preferences control which counts are available.
Fault Management
...................................................................................................................................................................................................................................
2-12 365-315-148R6.1SPIssue 1, October 2007

For more details, see the“Network Event Summary ” (p. 2-20)section.
Root Cause Failures Page
The Root Cause Failures page is displayed if the Fault Management Correlation Logic(OMS_RCF) license is installed. This page enables users to view sorted and filteredlists of potential root cause failures in the network.
You can use the Root Cause Failures page to:
• Search for failed services in the network and by using the hyperlink to thegraphical layout diagnose and repair the faults.
• Determine the impact of a failure by viewing a list of client connections and/orservices for connection root cause failures
• Determine the impact of a failure by viewing a list of affected ports for equipmentroot causes.
• Acknowledge a root cause failure in order to mark it as seen by a network operator
For more details, see the“Root Cause Failures Page” (p. 2-13)and“Root CauseFailure Processing” (p. 2-32)
Protection Switch Event Log page
The Protection Switch Event Log page displays a history of protection switch eventsreceived by the system.
You can use the Protection Switch Event log to acknowledge a PSE (Protection SwitchEvent) in order to mark it as seen by a network operator.
For more details, see theProtection Switch Event Log pageandProtection SwitchEvent Processing.
Threshold Crossing Alert page
The threshold crossing alert page displays Threshold Crossing Alerts. These alerts aregenerated when a performance monitoring threshold is crossed (the traffic quality hasfallen below a preassigned quality level) for a termination point (TP).
For more details, seeThreshold Crossing Alert (TCA) ProcessingandThresholdCrossing Alert page.
Fault Management Fault Management Pages
...................................................................................................................................................................................................................................365-315-148R6.1SPIssue 1, October 2007
2-13

Related Fault Management Pages...................................................................................................................................................................................................................................
Related pages
Along with the pages that are specifically designed to present fault managementinformation, the following other management system pages also interact with the pagesrelated to fault management:
• Network Map page
• Database Synchronizations page
• Equipment View page
• Network Elements page
• Graphical Layout page
Network Map page
On theNetwork Map , the icons for NEs, areas, and aggregates change color toindicate the presence and severity of alarm conditions. For additional details aboutdisplay of alarm colors on Network Map icons, refer to“Alarm Notification” (p. 2-9).
Database Synchronizations page
On theDatabase Synchronizations page, one synchronization option offered is tosynchronize alarm and event information for selected NEs in the management systemdatabase. For additional details about Database Synchronizations, refer to theLucentOMS Provisioning Guide.
Equipment View page
The Equipment View page displays the color of the highest severity level alarmpresent on an equipment component. The equipment alarm LEDs display an aggregatedalarm for each equipment entity, which is represented by a color to reflect the highestseverity alarm. For example, if the color red is displayed for a slot/circuit pack, one ormore alarms are present for equipment entities within the slot/circuit pack (such as aphysical or logical port), and the highest alarm severity level is Critical or Prompt. Foradditional details about alarm colors, refer to“Alarm Notification” (p. 2-9).
Network Elements page
On theNetwork Elements page, communication status is displayed by the change inthe color of an icon in theComms status column of the Network Elements page. Foradditional details about alarm colors, refer to“Alarm Notification” (p. 2-9).
Additionally, from the Network Elements page, an alarm synchronization can beperformed.
Fault Management
...................................................................................................................................................................................................................................
2-14 365-315-148R6.1SPIssue 1, October 2007

Graphical Layout page
On theGraphical Layout page, port icons change color to indicate the presence andseverity of alarm conditions, and NEs change to color to indicate a loss ofcommunications. For additional details about the Graphical Layout, refer to theLucentOMS Connection Management Guide. For additional details about alarm colors, referto “Alarm Notification” (p. 2-9).
Fault Management Related Fault Management Pages
...................................................................................................................................................................................................................................365-315-148R6.1SPIssue 1, October 2007
2-15
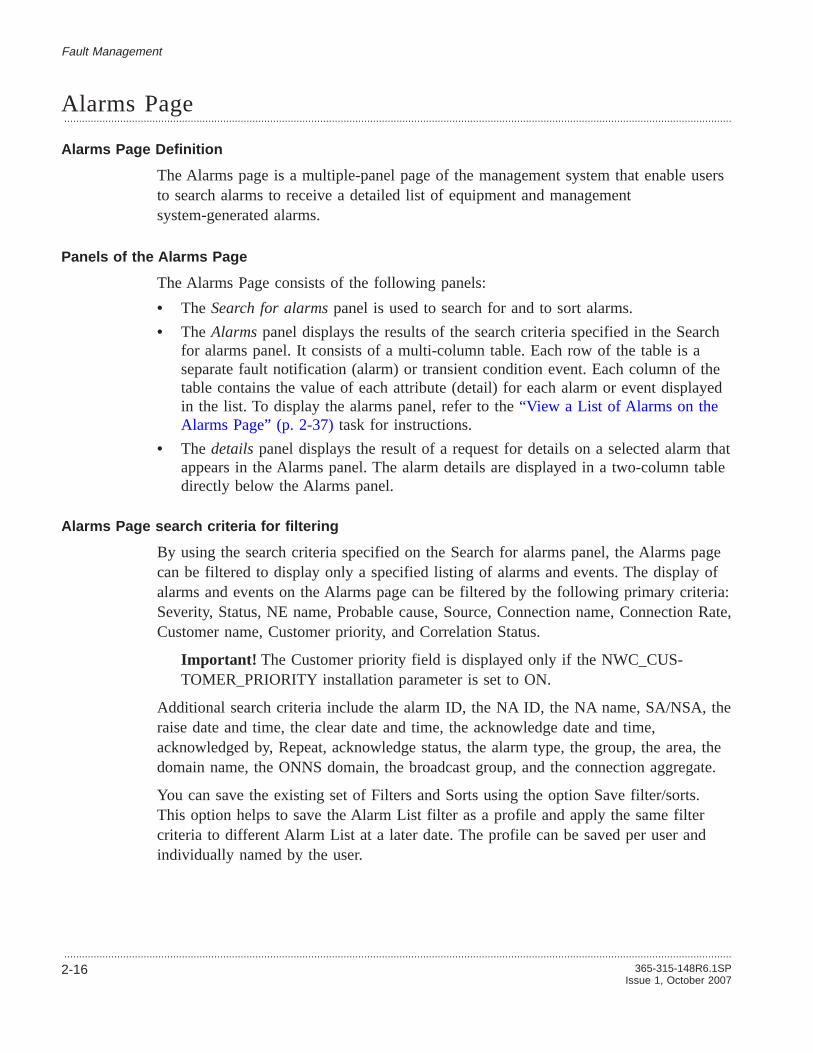
Alarms Page...................................................................................................................................................................................................................................
Alarms Page Definition
The Alarms page is a multiple-panel page of the management system that enable usersto search alarms to receive a detailed list of equipment and managementsystem-generated alarms.
Panels of the Alarms Page
The Alarms Page consists of the following panels:
• The Search for alarmspanel is used to search for and to sort alarms.
• The Alarmspanel displays the results of the search criteria specified in the Searchfor alarms panel. It consists of a multi-column table. Each row of the table is aseparate fault notification (alarm) or transient condition event. Each column of thetable contains the value of each attribute (detail) for each alarm or event displayedin the list. To display the alarms panel, refer to the“View a List of Alarms on theAlarms Page” (p. 2-37)task for instructions.
• The detailspanel displays the result of a request for details on a selected alarm thatappears in the Alarms panel. The alarm details are displayed in a two-column tabledirectly below the Alarms panel.
Alarms Page search criteria for filtering
By using the search criteria specified on the Search for alarms panel, the Alarms pagecan be filtered to display only a specified listing of alarms and events. The display ofalarms and events on the Alarms page can be filtered by the following primary criteria:Severity, Status, NE name, Probable cause, Source, Connection name, Connection Rate,Customer name, Customer priority, and Correlation Status.
Important! The Customer priority field is displayed only if the NWC_CUS-TOMER_PRIORITY installation parameter is set to ON.
Additional search criteria include the alarm ID, the NA ID, the NA name, SA/NSA, theraise date and time, the clear date and time, the acknowledge date and time,acknowledged by, Repeat, acknowledge status, the alarm type, the group, the area, thedomain name, the ONNS domain, the broadcast group, and the connection aggregate.
You can save the existing set of Filters and Sorts using the option Save filter/sorts.This option helps to save the Alarm List filter as a profile and apply the same filtercriteria to different Alarm List at a later date. The profile can be saved per user andindividually named by the user.
Fault Management
...................................................................................................................................................................................................................................
2-16 365-315-148R6.1SPIssue 1, October 2007

Alarm acknowledgement
Individual or multiple alarms can be acknowledged, acknowledged and deleted, or justdeleted directly from the Alarms page.
Refer to the“Acknowledge Alarms on the Alarms Page” (p. 2-42)task for instructions.
The deletion of alarms is only applicable for instantaneous alarms. Any attempts todelete persistent alarms will fail. Refer to the“Delete Instantaneous Alarms on theAlarms Page” (p. 2-43)task for instructions.
The acknowledgement and deletion of alarms acknowledge both persistent andinstantaneous alarms. Any persistent alarms in the cleared state are removed to theAlarm Log. All instantaneous alarms that have just been acknowledged are deleted andare also removed to the Alarm Log. In addition, instantaneous alarms over a certainage can be automatically removed from the alarm list by using theFM_INST_DEL_AGE installation parameter. The parameter reflects the age of thealarm to delete in days (0-31). If this parameter is set to 0, this feature will bedisabled.
Only persistent alarms in the raised acknowledge state remain. Refer to the“Acknowledge and Delete Alarms on the Alarms Page” (p. 2-44)task for instructions.
Historic alarms acknowledgement and deletion
When a persistent raised or cleared alarm is acknowledged the system willautomatically acknowledge older instances of the alarm list on this object. When atransient alarm is deleted, the system automatically deletes older instances of the alarmin the alarm list.
Fault Management Alarms Page
...................................................................................................................................................................................................................................365-315-148R6.1SPIssue 1, October 2007
2-17

Alarm Log...................................................................................................................................................................................................................................
Alarm Log Definition
The Alarm Log is a log generated by the management system that contains records ofall alarms/events and standing conditions that were deleted or automatically removedfrom the Alarm page.
Panels of the Alarm Log page
The Alarm Log page is divided into two panels:
• The Search for historic alarmspanel is used to view alarm log records and to filterthe alarm log display. Refer to the“View Alarm Log Records” (p. 2-62)task forinstructions.
• The Historic Alarmspanel displays the filtered data, which can be exported to afile or a device, or it can be deleted. Refer to the“Export Alarm Log Records”(p. 2-63)and“Delete Alarm Log Records” (p. 2-65)tasks for instructions.
Alarm Log search criteria for filtering
The Search for historic alarms panel of the Alarm Log enables the user to filter alarmsby specifying any of the following as primary search criteria: The alarm severity, theNE name, the probable cause of the alarm, the alarm source, the correlation status, theconnection rate, and the connection name.
Additional search criteria include alarm ID, NA ID, NA name, SA/NSA, alarm type,customer name, customer priority, dates and times for raises, clears, and raiseacknowledges, the user ID who acknowledged the alarm (make historic user), the timethe acknowledged alarm was deleted (make historic time), along with the category,group, area, domain name, ONNS domain, broadcast group, and connection aggregate.
You can save the existing set of Filters and Sorts using the option Save filter/sorts.This option helps to save the Alarm Logs filter as a profile and apply the same filtercriteria to different Alarm Log at a later date. The profile can be saved per user andindividually named by the user.
Important! The connection aggregate fields, filter and sort are displayed only if theSYS.ONNS_ENABLED parameter is set to ON.
Maximum number of Alarm Log records stored
When the count of log records reaches 80% of the maximum number of log recordsallowed, the management system will generate a platform alarm (ALARM-S_LOG_SPACE_LOW). The log administrator should take action upon seeing thisalarm to reduce the number of records in the alarm log by deleting alarm log recordsafter exporting the records to file. Once the number of records falls below 80% the
Fault Management
...................................................................................................................................................................................................................................
2-18 365-315-148R6.1SPIssue 1, October 2007

platform alarm (ALARMS_LOG_SPACE_LOW) is cleared. Should no action be takento reduce the number of records, upon reaching 100% of the maximum number of logrecords allowed, the management system will automatically purge 10% of the oldestrecords and will generate a transient platform alarm (ALARMS_LOG_PURGE).Should the log administrators see this alarm being raised frequently they are advised tocontact Lucent Technologies for assistance in reducing the retention period for the log.
If the count of log records reaches the maximum allowed at any time, the managementsystem automatically purges log records, starting with the oldest log records first, untilthe record count falls below the maximum count level.
Alarm Log installation parameters
Installation parameters control the maximum number of log records that themanagement system stores and the period of time in which the management systemretains Alarm Log records. These installation parameters are documented in theLucentOMS Administration Guide.
Fault Management Alarm Log
...................................................................................................................................................................................................................................365-315-148R6.1SPIssue 1, October 2007
2-19

Network Event Summary...................................................................................................................................................................................................................................
Network Event Summary page function
The Network Event Summary page is used to alert the user to significant network andsystem events.
Note that if the user attempts to close the Network Event Summary (NES) window, awarning will be displayed and the user will have to confirm the operation before theNES is closed.
The following warning will be displayed:Warning: Alarm Counts and Latest Events will no longer be shown if you
close this window
This prevents unintentional closure of the window, which would stop a user from beinginformed of new events.
Panels of the Network Event Summary page
The alarm view of the Network Event Summary page is divided into the followingpanels:
• Alarm Countsthat provide a current count of the number of faults which are raised,and for which a clear has not yet been received; the total number of TCAs in theTCA list which are Ack or Unack; the number of unacknowledged protectionswitch events in the system, and the number of reroute notifications which arepresent in the alarm list.
• Discrepancy Counts, which provides the discrepancy counts.
• Root Cause Failure Counts, which provides a current count of root cause failures.
• Latest Events, which provides a view of the last 100 events in the users domain.
• Latest PSEs, which provides a view of the last 100 protection switch events in theusers domain.
Users can view the Network Event Summary page at any time.
Alarm Counts panel
The Alarm Counts panel displays the counts of each category of alarms currentlyraised and/or cleared for network connections on the OMS management system. Theconnection categories are:
• Faults
• TCAs
• PSEs
• Reroute, if configured
Fault Management
...................................................................................................................................................................................................................................
2-20 365-315-148R6.1SPIssue 1, October 2007
Totals for faults are divided into the following categories:
• Total Raised is the total number of faults that have been raised, but for which aclear has not yet been received.
• Unackd raised is the total number of faults that are raised, but for which a clearhas not yet been received, and have not yet been acknowledged.
• Unackd cleared is the total number of faults that have received a clear, but havenot been transitioned to the Alarms Log because they have not been acknowledged.Note: The Unackd cleared count is only visible depending on the alarm deletionoption.
Totals for Threshold Crossing Alerts (TCAs) are divided into the following categories:
• Total Raised is the total number of persistent TCAs that have been raised, but forwhich a clear has not yet been received. In addition, this number includes thenumber of instantaneous TCAs in the Alarms List.
• Unackd raised is the total number of persistent TCAs that are raised, but forwhich a clear has not yet been received, and have not yet been acknowledged. Inaddition, this number includes the number of instantaneous TCAs in the AlarmsList.
• Unackd cleared is the total number of persistent TCAs that have received a clear,but have not been transitioned to the Alarms Log because they have not beenacknowledged.Note: The Unackd cleared count is only visible depending on the alarm deletionoption.Acknowledged TCAsdo not transition to the Alarms Log. They remain in the TCAlist but have a status of historic. For example, they become historic. In a similarway as acknowledged instantaneous TCAs also become historic.
Totals for Protection Switch Events (PSE) are listed in the following category:
• Unackd raised is the total number of PSEs that have not yet been acknowledged.
The Reroute field is only displayed if the FM ONNS Reroute Display installationparameter is set to display reroute notifications. For more details about the FM ONNSReroute Display installation parameter, refer to theLucent OMS Administration Guide.
Totals for Reroute are divided into the following categories:
• Total raised is the total number of reroute notifications that are present in thealarm list.
• Unack raised is the total number of reroute notifications that are present in thealarm list and have not been acknowledged.
The system dynamically updates these counts, but, the user can manually refresh thesecounts. The date and time of the last alarm and TCA counts update are displayed. Ifthe system receives a new alarm or TCA that has been raised but not yet
Fault Management Network Event Summary
...................................................................................................................................................................................................................................365-315-148R6.1SPIssue 1, October 2007
2-21

acknowledged, anew raise icon is displayed in the Unack raised column and thecount is automatically updated. If an alarm or TCA is cleared, anew clear icon isdisplayed in the Unack clear column and the count is automatically updated.
The management system allows users to jump from any alarm count on the Alarmcounts panel of the Network Event Summary page (raised alarms/events,unacknowledged raised alarms/events, unacknowledged cleared alarms/events) to theThreshold Crossing Alert page. Because the Alarms page is filtered, it displays adetailed list of only those alarms of that alarm count category. The user is also allowedto jump from the Protection Switch Event panel to the Protection Switch Event Logpage.
Discrepancy Counts Panel
The Discrepancy Counts panel displays the counts of transport discrepancies, ethernetdiscrepancies, pre-plan restoration progress and counts of abnormal conditions onnetwork elements.
The Transport categories are:
• An uncorrelated connection, which occurs when a cross-connection is found on theNE, but not in the management system.
• An inconsistent connection, which occurs when a cross-connection associated withan in-effect connection is disconnected or rearranged outside of the managementsystem.
Totals for Inconsistent Connection event counters show current counts of the following:
• Total , which is the total number of all Inconsistent Connections in the managementsystem.
• Unacknowledged , which is the total number of all Inconsistent Connections in themanagement system that are unacknowledged.
Totals for Uncorrelated Cross Connections only show current counts forTotal Raised ,which is the total number of Uncorrelated Cross Connections in the managementsystem.
The Ethernet categories are:
• An uncorrelated Ethernet service, which occurs when an Ethernet notification isnot correlated to an Ethernet service.
• An inconsistent Ethernet service, which occurs when an Ethernet service ismodified outside of the management system.
Totals for all inconsistent counters show the following:
• Total which is the total number of all Inconsistent Ethernet services in themanagement system.
• Unacknowledged , which is the total number of all Inconsistent Ethernet servicesin the management system that are unacknowledged.
Fault Management Network Event Summary
...................................................................................................................................................................................................................................
2-22 365-315-148R6.1SPIssue 1, October 2007

Totals for all uncorrelated counters show the following:
• Total which is the total number of uncorrelated Ethernet services in themanagement system.
• Unacknowledged , which is the total number of uncorrelated Ethernet services inthe management system that are unacknowledged.
The Restoration categories are:
• A Created restoration, which occurs when a preplan restoration order is created dueto alarm triggered restoration. The created restoration event provides an hyperlinkto Preplan Assignment Page, which displays the Restoration pending orders. The″Restoration″ counters will only be available when the system parameterALARM_TRIGGERED_PREPLAN is enabled.Total is the total number of restoration in-progress in the management system.
• Failed restorations, which occurs when an alarm triggered preplan restoration is inthe implementation failed state. The failed restoration event provides an hyperlinkto Restoration Jeopardy page, which displays restoration failure reasons.Total is the total number of restoration failed in the management system.
The NE categories are:
• Abnormal which provides the total number of network elements managed by thesystem that have one or more abnormal conditions.
To open an appropriate filtered list, click a hyperlink from each count in theDiscrepancy Counts panel, The new event icon is removed once the counter is clickedto view the corresponding list. ARefresh Discrepancy Counts button enables user todo an on-demand refresh, which refreshes the counts and updates the date and time.
Root Cause Failure Counts panel
The Root Cause Failure Counts panel displays the counts of each category of rootcause failures currently raised and/or cleared on the Lucent OMS management system.Note that this panel is only displayed if the OMS_RCF licence is present and the userhas enabled theShow panel preference for the Root Cause Failure Counts panel.
Root cause failure counts are calculated for the following categories:
• Service connections
• Infrastructure connections
• Physical
• Equipment
• Ports
Fault Management Network Event Summary
...................................................................................................................................................................................................................................365-315-148R6.1SPIssue 1, October 2007
2-23

For each category of root cause failure the following counts are calculated:
• Total raised which is the total number of raised root cause failures in that category.
• Unacknowledged Raised which is the total number of raised root cause failures inthat category that have not been acknowledged by a network operator
• Unacknowledged Cleared which is the total number of cleared root cause failuresin that category that have not been acknowledged by a network operator.Note this count is only visible depending on the alarm deletion option.
The system dynamically updates these counts; however, the user can manually refreshthese counts. Additionally, the following is true:
• If a new root cause failure is raised, a new raise icon is displayed in the Unackraised column and the count is automatically updated.
• If a root cause failure is cleared, a new clear icon is displayed in the Unack clearcolumn and the count is automatically updated.
The management system allows users to jump from any count on the Root CauseFailure Counts panel of the Network Event Summary page to the Root Cause Failurepage. Because the Root Cause Failure page is filtered, it displays a detailed list of rootcause failures in that root cause failure count category.
Latest events panel
The Latest events panel shows a dynamically updated list of the most recently receivedalarms (including both raised and cleared alarms). Each row of the list provides detailsabout an alarm, including the Alarm ID, Alarm severity, NA name, NE name, Source,Probable cause, Raise date and time, Clear date and time, and Alarm description, andstatus. The most recently received raised or cleared alarm is displayed at the beginningof the list, with the remaining alarms/events sorted in reverse chronological order byraise time.
The Latest events panel provides links to the alarms and equipment pages.
The following behavior governs this panel:
• When a new instance of the NEs is opened, the panel will be empty.
• When an event is received by the system, it will be added to the top of the list.This assumes no sorting has been applied. If sorting is applied, it will appear asappropriate for the sort criteria.
• When the list reaches 100 entries, it is considered full. The 101 entry is added tothe top of the list, and the 100 entry, at the bottom of the list, is deleted.
Network Event Summary page appearance and behavior
The management system allows users to control the behavior of the Network EventSummary page. From the My Network Preferences panel of the Preferences page, userscan control whether the Alarm counts panel, the Latest events panel, or all panels on
Fault Management Network Event Summary
...................................................................................................................................................................................................................................
2-24 365-315-148R6.1SPIssue 1, October 2007

the page are always displayed, and whether one or all panels should automatically popup and be brought to the forefront of the screen display each time a new alarm or TCAoccurs.
For details on and the associated tasks for user preferences, refer to theLucent OMSGetting Started Guide.
Fault Management Network Event Summary
...................................................................................................................................................................................................................................365-315-148R6.1SPIssue 1, October 2007
2-25

Alarm Filtering...................................................................................................................................................................................................................................
SAF
For the SONET and SDH environments, the management system offers SymptomaticAlarm Filtering (SAF) in order to remove selective alarm messages before they areforwarded to the user for notification.
Specifically, SAF filters out a set of defined symptomatic alarms and standingcondition (SC) events. The filtering is based on a group of probable causes (conditiontypes) of the alarm and standing condition events received from all NEs.
For assistance with modifying SAF, contact Alcatel-Lucent’s Global TSS.
Fault Management
...................................................................................................................................................................................................................................
2-26 365-315-148R6.1SPIssue 1, October 2007

Threshold Crossing Alert (TCA) Processing...................................................................................................................................................................................................................................
Network Element Support
A threshold crossing alert is generated when a performance monitoring threshold iscrossed (the traffic quality has fallen below a preassigned quality level) for atermination point (TP).
Threshold Crossing Alerts are raised based on a given granularity (15 minutes or 24hours). Thresholds which are not based on a granularity are handled in the Alarmsrequirements (e.g. Signal Degrade Thresholds).
A threshold crossing alert can be considered as transient or persistent.
Lucent OMS Support
Lucent OMS will display threshold crossing alerts to the user in the following places:
• A counter in the Network Event Summary (NES) page giving the number of activethreshold crossing alerts
• A Threshold Crossing Alert List, which shows a history of threshold crossing alertsreceived by the system
Fault Management
...................................................................................................................................................................................................................................365-315-148R6.1SPIssue 1, October 2007
2-27

Threshold Crossing Alert page...................................................................................................................................................................................................................................
Threshold Crossing Alert page Definition
The Threshold Crossing Alert page shows current raised TCAs, current cleared TCAs,current transient TCAs, acknowledged TCAs and historic TCAs.
The Threshold Crossing Alert page allows you to acknowledge a TCA in order to markit as seen by a network operator.
The Threshold Crossing Alert List can be opened from “Threshold Crossing Alerts”under the Alarms and Events and from the TCA Counter in the NEs screen.
Fault Management
...................................................................................................................................................................................................................................
2-28 365-315-148R6.1SPIssue 1, October 2007

Protection Switch Event Processing...................................................................................................................................................................................................................................
Network Element Support
A protection switch event is generated when a protection switch occurs in a networkelement and causes traffic to be switched between a worker and protection entity.
Lucent OMS will include the following protection switch event types:
• Equipment Protection Groups
• MS Protection Groups
• MS-SPRing Groups
• High Order (OCH, STS1, STS3c, AU3 and AU4) SNCP
• RPR Protection for Ethernet
Lucent OMS Support
Lucent OMS displays threshold crossing alerts to the user in the following places:
• A counter in the Network Event Summary (NES) page giving the number ofunacknowledged protection switch events
• An entry in a latest Protection Switch Events list in the NES
• A Protection Switch Event log which shows a history of protection switch eventsreceived by the systemNote: The data extraction tool will also be able to perform regular extraction of theprotection switch events for historical purposes.
Receiving Protection Switch Events from the Network
The following types of protection switch events are supported:
Type Parameter Name
Equipment FM_PSE_PROCESS_EQM
TDM MSP Switches FM_PSE_PROCESS_TDM_MSP
TDM MS-SPRing Switches FM_PSE_PROCESS_MSPRING
TDM High Order SNCP Switches FM_PSE_PROCESS_HO_TDM_SNCP
WDM High Order SNCP Switches FM_PSE_PROCESS_HO_WDM_SNCP
For each event, an installation parameter can be set so that the system should discardthese events and does not process them.
Fault Management
...................................................................................................................................................................................................................................365-315-148R6.1SPIssue 1, October 2007
2-29

Synchronization
Events which occurred while the association to the Network Element was present aredisplayed. If the OMS/NE association is lost and then recovered, no automatic ormanual PSE synchronization will be performed.
Connection Name
The associated connection name for a PSE is determined as follows:
• For an MSP, MS-SPRing, RPR or SNCP PSE: by using the standard alarmcorrelation rules on the To Resource name and the PSE Rate
• For an Equipment PSE: Always empty
Note: For MS-SPRing protection groups, there is no connection name to display whichis associated with the entire group; therefore, the OMS will display the connectionname of the physical STM-N connection associated with the STM-N port.
Assignment of Protection Switch Event Identifier
A numeric identifier, known as the Protection Switch Event Identifier (PSE ID) isassigned to each protection switch event. The identifiers will be assigned in sequencestarting from “0” and can act as a unique identifier for the event.
Assignment of Domain
Each protection switch event is assigned to the appropriate domain based on thedomain of the NE which contains the resources in the protection switch. If the NE’sdomain is changed, the domain associated with the protection switch will not beupdated.
TP Aliases
The appropriate TP aliases are assigned to the following fields when the resource typeis a TP:
• Protected Resource: called Protected Resource Port User Label
• From Resource: called From Resource Port User Label
• To Resource: called To Resource Port User LabelIf the value of the Port User Label changes in the future, the value assigned to theevent will not be updated.Note: TP Aliasing is controlled by an installation parameter.
Fault Management Protection Switch Event Processing
...................................................................................................................................................................................................................................
2-30 365-315-148R6.1SPIssue 1, October 2007

Protection Switch Event Log Page...................................................................................................................................................................................................................................
Protection Switch Event Log Page Definition
The Protection Switch Event log page shows a history of protection switch eventsreceived by the system.
You can use the Protection Switch Event log to acknowledge a PSE (Protection SwitchEvent) in order to mark it as seen by a network operator. You can also view theProtection Switch Event Log Records.
Fault Management
...................................................................................................................................................................................................................................365-315-148R6.1SPIssue 1, October 2007
2-31

Root Cause Failure Processing...................................................................................................................................................................................................................................
Domain Users
It is recommended that the Root Cause Failure functions be available to only GlobalDomain users with permissions to manage all management system user domains.
Network Element Support
All network elements are supported.
Lucent OMS Support
Lucent OMS supports root cause failure counts, and a root cause failure page. OMSrequires the OMS_RCF licence to use this feature. It is suggested that only globaldomain users use this feature since access to the Root Cause Failure feature is given asa role profile.
Lucent OMS will display root cause failures to the user in the following places:
• A counter in the Network Event Summary Screen (NES) giving the number of totalraised and unacknowledged root cause failures.
• An entry in the Root Cause Failure page, which allows you to search and displayroot cause failures.
Root Cause Failure Creation
The Roots Cause Failure featurerequiresthe OMS_RCF licence.
The Root cause failure feature provides a summary of the alarms correlated to eachresource (connection, equipment, port, subnetwork (correlated and uncorrelated) in thenetwork. By using this feature, you can view and then search for client connectionsand services.
This provides a network level view of the alarm state in the network. As an example, itis possible to identify which circuits are impacted by alarms and then use the graphicallayout to identify the cause of the failure. It is also possible to understand the impacton the network of those alarms by seeing which client services are being carried by analarmed circuit.
The Root Cause Failure feature associates an alarm issued by an entity in the networkto a root cause. The associated alarms are the following:
• TP alarms are associated with connection or port root cause failures as follows:
Fault Management
...................................................................................................................................................................................................................................
2-32 365-315-148R6.1SPIssue 1, October 2007

The values of Connection or location are set as follows:
– If the alarmed port correlates directly to a connection, a connection root causefailure is created. The location of the root cause failure identifies if the rootcause is internal or external to the OMS management domain.
– If the alarmed port correlates indirectly to a connection through an uncatalogedconnection, a port root cause failure is created. The NE name and port name areused as the source of the root cause failure. The location of the root causefailure identifies if the root cause is internal or external to the OMSmanagement domain.
• Equipment alarms are associated with equipment root cause failures. The NE nameand equipment name are used as the source of the root cause failure.
• Subnetwork connection alarms are associated with a connection root cause failure.The location for these root cause failures will always be internal.
Root Cause Retention
The management system retains all root causes until there are no longer any activealarms correlated to the resource which created the root cause. This deletion can becaused by:
• Deletion of all alarms correlated to the resource
• The resource being changed so that it is no longer associated with an alarm
Internal / External Determination
Internal or External Alarms
For each alarmed resource in the network, the root cause failures will indicate if thefailure is internal or external. Note: for a given connection in the network two rootcause failures may be created, one root cause failure indicates all internal failures inthe network and one indicates all external failures in the network.
Root Causes Description
Port root causes Internal or External status depends onwhether the port is on the boundary of thenetwork.
• If the alarm is raised on a boundaryport, the related root cause failures isexternal.
• If the alarm is raised on anon-boundary port, the related rootcause failures is internal.
Equipment root causes All equipment root cause failures areconsidered Internal.
Fault Management Root Cause Failure Processing
...................................................................................................................................................................................................................................365-315-148R6.1SPIssue 1, October 2007
2-33

Connection root causes Internal or external status depends onwhether the failure correlated to theconnection, occurred inside or outside themanagement domain.
• Internal Alarms - An internal failure isone that occurred inside themanagement domain.
• An external failure is one thatoccurred outside the managementdomain.
Subnetwork Connection root causes These RCFs are always internal.
Acknowledgement of Root Causes
All alarms that are correlated to the root cause are acknowledged. Each alarm is givenan acknowledgement time. No acknowledgement user information is retained.
Fault Management Root Cause Failure Processing
...................................................................................................................................................................................................................................
2-34 365-315-148R6.1SPIssue 1, October 2007

Root Cause Failures Page...................................................................................................................................................................................................................................
Root Cause Failures Page Definition
Domain Users
It is recommended that the Root Cause Failure functions be available to only GlobalDomain users with permissions to manage all management system user domains.
The Root cause Failures Page shows a summary of the alarms correlated to eachresource, such as Connection, equipment, port, subnetwork (correlated anduncorrelated) in the network.
Panels of the Root Cause Failures Page
The Root Cause Failures Page consists of the following panels:
• The Search for root cause failurespanel is used to search for and to sort root causefailures.
• The Root Cause Failurespanel displays the results of the search criteria specifiedin the Search for root cause failures panel. It consists of a multi-column table. Eachrow of the table is a separate fault notification or transient condition. Each columnof the table contains the value of each attribute (detail) for each root cause failuredisplayed in the list. To display the root cause failure panel, refer to the“View aList of Root Cause Failures on the Root Cause Failures Page” (p. 2-67)task forinstructions.
• The detailspanel displays the result of a request for details on a selected root causefailure that appears in the Root Cause Failures panel. The root cause failure detailsare displayed in a table directly below the Root Cause Failures panel.
Root Cause Failures Page search criteria for filtering
By using the search criteria specified on the Search for root cause failures panel, theRoot Cause Failures page can be filtered to display only a specified listing of rootcause failures. The display root cause failures on the Root Cause Failures page can befiltered by the following primary criteria: Severity, Status, Group, Type, Overall state,OMS state, Source, and Customer name.
Additional search criteria include the Connection rate, Protection type, the Ack status,Location, Precedence, Start time, and the ONNS domain.
Root Cause Failure acknowledgement
Individual or multiple root cause failures can be acknowledged, directly from the RootCause Failures page. All alarms that are correlated to the root cause are acknowledged.Each alarm is given an acknowledgement time. No acknowledgement user informationis retained.
Fault Management
...................................................................................................................................................................................................................................365-315-148R6.1SPIssue 1, October 2007
2-35

Refer to the“Acknowledge Root Cause Failures on the Root Cause Failures Page”(p. 2-72)task for instructions.
Client Connections
A list of direct and indirect Client Connections that are carried by the root cause canbe viewed from the Network Connections List page. A direct Client Connection ridesdirectly on top of a connection; as an example, a VC-12 is a direct client connection ofa VC-4. An indirect Client Connection rides on top of a connection at any layer; as anexample, a VC-12 is an indirect Client Connection on an MS.“View a List of RootCause Failures on the Root Cause Failures Page” (p. 2-67).
Refer to theLucent OMS Connection Management Guidefor additional information.
Services
A list of services that are carried by the root cause can be viewed from the NetworkConnections List page. The set of services for a root cause is the set of indirect clientconnections for that root cause which are also services themselves.“View a List ofRoot Cause Failures on the Root Cause Failures Page” (p. 2-67).
Refer to theLucent OMS Connection Management Guidefor additional information.
Important! Note that the set of services for a service does not include the serviceconnection.
View Impacted Services
A list of impacted services that are carried by a selected connection root cause can beviewed from the Network Connection Lisp page. This option is only available forconnection root cause in group physical and infrastructure. The user can find all theservices carried by the infrastructure or physical connection that have an overall stateof failed.
Important! This option is only visible if the system parameterFM_RCF_OVERALL is set to SHOW.
Fault Management Root Cause Failures Page
...................................................................................................................................................................................................................................
2-36 365-315-148R6.1SPIssue 1, October 2007

View a List of Alarms on the Alarms Page...................................................................................................................................................................................................................................
When to use
Use this task to view the Alarms page, which provides a detailed list of equipment andmanagement system-generated alarms that can be displayed for an area or NE.
Important! - Due to the limited granularity for Metropolis® Enhanced OpticalNetworking (EON) alarms, the alarm group for a transmission alarm may indicate aworse situation than what the alarm actually is. The user should be aware of thissituation and check the description for detailed information.
Related information
See the following topics in this document:
• “Alarms Page” (p. 2-16)
• “Database Synchronization of Alarms” (p. 2-8)
Before you begin
You are given five methods in which to access, and therefore view, the Alarms page.Use Method 2, which accesses the Alarms page from the Network icon, and Method 3,which accesses the Alarms page from the Network Elements icon, if you want to viewthe Alarms page for a specific NE. Use Method 4, which accesses the Alarms pagefrom the menu bar of any page, if you want a filtered version of the page.
Task, Method 1: from the Alarms and Events Icon
Complete the following steps to view a list of alarms on the Alarms page.
...................................................................................................................................................................................................
1 Use the icons or the object links to follow this path:Alarms and Events > Alarms .
Result: The Alarms page is displayed, which shows the Search for Alarms panel.
...................................................................................................................................................................................................
2 If necessary, expand the search panel, by clicking the+ icon next toMore... .
...................................................................................................................................................................................................
3 Enter the search criteria to view specific alarms or leave the search fields blank toview all alarms and click theSearch button.
Result: The Alarms panel of the Alarms page is displayed.
Fault Management
...................................................................................................................................................................................................................................365-315-148R6.1SPIssue 1, October 2007
2-37
E N D O F S T E P S...................................................................................................................................................................................................

Task, Method 2: from the Network Icon
From the Alarm View, complete the following steps to view a list of alarms on theAlarms page.
...................................................................................................................................................................................................
1 Use the icons or the object links to follow this path:Network .
Result: The Network Map is displayed.
...................................................................................................................................................................................................
2 On the Network Map, position the mouse cursor on the area icon or NE icon (if theNE is contained in an aggregate, you may have to expand the aggregate to display theNE on the Network Map) and click the right mouse button.
Result: The node pop-up menu is displayed.
...................................................................................................................................................................................................
3 SelectAlarm list from the node pop-up menu.
Result: The Alarms page is displayed for the selection made in Step 2.
...................................................................................................................................................................................................
4 If necessary, expand the Search panel, by clicking the+ icon next toMore... .
...................................................................................................................................................................................................
5 Enter the search criteria to view specific alarms or leave the search fields blank toview all alarms and click theSearch button.
Result: The Alarms panel of the Alarms page is displayed.
Task, Method 3: from the Network Elements Icon
Complete the following steps to view a list of alarms on the Alarms page.
...................................................................................................................................................................................................
1 Use the icons or the object links to follow this path:Network Elements .
Result: The Network elements page is displayed.
...................................................................................................................................................................................................
2 Select an NE for which you wish to view alarms.
...................................................................................................................................................................................................
3 From the Go menu, selectAlarm list and click theGo button.
Fault Management View a List of Alarms on the Alarms Page
...................................................................................................................................................................................................................................
2-38 365-315-148R6.1SPIssue 1, October 2007
E N D O F S T E P S...................................................................................................................................................................................................

Result: The Alarms page is displayed for the selection made in Step 2.
...................................................................................................................................................................................................
4 If necessary, expand the Search panel, by clicking the+ icon next toMore... .
...................................................................................................................................................................................................
5 Enter the search criteria to view specific alarms or leave the search fields blank toview all alarms and click theSearch button.
Result: The Alarms panel of the Alarms page is displayed.
Task, Method 4: from the Top Navigation Zone Menu Bar
Complete the following steps to view a list of alarms on the Alarms page.
...................................................................................................................................................................................................
1 In the top navigation zone of any page, click onMy Network .
Result: A submenu is displayed.
...................................................................................................................................................................................................
2 SelectNetwork event summary .
Result: The Network Event Summary page is displayed.
...................................................................................................................................................................................................
3 In the Alarm Counts portion of the page, click on the number shown in the TotalRaised, Unackd raised, or Unackd clear column.
Result: The Alarms page is displayed for your selection.
The Alarms page is filtered to show all alarms/events, all unacknowledged raisedalarms/events, or all unacknowledged cleared alarms/events, depending on thecount selected on the Network Event Summary page.
...................................................................................................................................................................................................
4 If necessary, expand the Search panel, by clicking the+ icon next toMore... .
...................................................................................................................................................................................................
5 Enter the search criteria to view specific alarms or leave the search fields blank toview all alarms and click theSearch button.
Result: The Alarms panel of the Alarms page is displayed.
Fault Management View a List of Alarms on the Alarms Page
...................................................................................................................................................................................................................................365-315-148R6.1SPIssue 1, October 2007
2-39
E N D O F S T E P S...................................................................................................................................................................................................
E N D O F S T E P S...................................................................................................................................................................................................

Task, Method 5: from the Connections Icon
Complete the following steps to view a list of alarms on the Alarms page.
...................................................................................................................................................................................................
1 Use the icons or the object links to follow this path:Connections > NetworkConnections .
Result: The Search for Network Connections panel is displayed.
...................................................................................................................................................................................................
2 Enter or select search criteria for the required connection and click theSearch button.
Result: The Network Connections page is displayed.
...................................................................................................................................................................................................
3 Choose a connection from the list.
...................................................................................................................................................................................................
4 From the Go menu, selectGraphical layout and click theGo button.
Result: The Graphical Layout page is displayed.
...................................................................................................................................................................................................
5 Position the mouse cursor over a port icon and click the right mouse button to displaythe Port menu.
Result: The Port menu is displayed.
...................................................................................................................................................................................................
6 ChooseAlarm list from the Port menu.
Result: The Alarms page is displayed for your selection in Step 3.
...................................................................................................................................................................................................
7 If necessary, expand the Search for Alarms panel; then, enter the search criteria to viewspecific alarms or leave the search fields blank to view all alarms and click theSearchbutton.
Result: The Alarms panel of the Alarms page is displayed.
E N D O F S T E P S...................................................................................................................................................................................................
Fault Management View a List of Alarms on the Alarms Page
...................................................................................................................................................................................................................................
2-40 365-315-148R6.1SPIssue 1, October 2007

View the Details of an Alarm on the Alarms Page...................................................................................................................................................................................................................................
When to use
Use this task to view the details of an alarm on the Alarms page.
Important! - For Metropolis® Enhanced Optical Networking (EON), due to the limitedgranularity for Metropolis® Enhanced Optical Networking (EON) alarms, the alarmgroup for a transmission alarm may indicate a worse situation than what the alarmactually is. The user should be aware of this situation and check the description fordetailed information.
Related information
See the following topic in this document:
• Alarms page
Before you begin
There are no prerequisites before you begin.
Task
Complete the following steps to view the details of an alarm on the Alarms page.
...................................................................................................................................................................................................
1 Access the Alarms page using one of the methods described in the“View a List ofAlarms on the Alarms Page” (p. 2-37)task.
Result: The Alarms page is displayed.
...................................................................................................................................................................................................
2 To display additional details for a specific alarm, click theDetails icon, which appearsin the row to the left the alarm.
Result: Additional alarm details are displayed below the Go menu in the Alarmspanel.
E N D O F S T E P S...................................................................................................................................................................................................
Fault Management
...................................................................................................................................................................................................................................365-315-148R6.1SPIssue 1, October 2007
2-41

Acknowledge Alarms on the Alarms Page...................................................................................................................................................................................................................................
When to use
Use this task to acknowledge one or more raised or cleared alarms on the Alarms page.
Related information
See the following topics in this document:
• “Alarms Page” (p. 2-16)
• “Database Synchronization of Alarms” (p. 2-8)
Before you begin
This task does not have any preconditions.
Task
Complete the following steps to acknowledge one or more raised alarms on the Alarmspage.
...................................................................................................................................................................................................
1 Access the Alarms page using one of the methods described in the“View a List ofAlarms on the Alarms Page” (p. 2-37)task.
Result: The Alarms page is displayed.
...................................................................................................................................................................................................
2 Select one or more alarms on the Alarms page.
...................................................................................................................................................................................................
3 From the Go menu, selectAcknowledge and click theGo button.
Result: The selected alarms are acknowledged.
When a user acknowledges an alarm,all previous instances of that alarm in thecurrent alarm list will be acknowledged.
The Acknowledge date & time field is updated for the acknowledged alarm(s).The Acknowledged by field is updated with the user ID of the user whoacknowledged the alarm(s).
E N D O F S T E P S...................................................................................................................................................................................................
Fault Management
...................................................................................................................................................................................................................................
2-42 365-315-148R6.1SPIssue 1, October 2007

Delete Instantaneous Alarms on the Alarms Page...................................................................................................................................................................................................................................
When to use
Use this task to delete one or more instantaneous alarms on the Alarms page.
Related information
See the following topics in this document:
• “Alarms Page” (p. 2-16)
• “Database Synchronization of Alarms” (p. 2-8)
Before you begin
This task does not have any preconditions.
Task
Complete the following steps to delete one or more instantaneous alarms on the Alarmspage.
...................................................................................................................................................................................................
1 Access the Alarms page using one of the methods described in the“View a List ofAlarms on the Alarms Page” (p. 2-37)task.
Result: The Alarms page is displayed.
...................................................................................................................................................................................................
2 Select one or more instantaneous alarms to be deleted on the Alarms page.
...................................................................................................................................................................................................
3 From the Go menu, selectDelete and click theGo button.
Result: A confirmation dialog box is displayed, asking if you are sure that youwant to delete the selected alarm(s).
...................................................................................................................................................................................................
4 Click the OK button.
Result: The selected instantaneous alarms are deleted.
When a user deletes an alarm, all previous instances of that alarm in the currentalarm list will be deleted.
E N D O F S T E P S...................................................................................................................................................................................................
Fault Management
...................................................................................................................................................................................................................................365-315-148R6.1SPIssue 1, October 2007
2-43

Acknowledge and Delete Alarms on the Alarms Page...................................................................................................................................................................................................................................
When to use
Use this task to acknowledge and delete alarms from the Alarms page in one step.
Both persistent and instantaneous alarms can be acknowledged. Only instantaneousalarms can be deleted. When an instantaneous alarm is deleted, it is moved to theAlarm Log.
Although enabled when any alarm is selected, an attempt to delete a persistent alarmwill fail. The Delete option will be grayed-out for a Service Domain user. This actionwill display a confirmation dialog box. The user can selectOK or Cancel regardingthis action.
Related information
See the following topics in this document:
• “Alarms Page” (p. 2-16)
• “Database Synchronization of Alarms” (p. 2-8)
Before you begin
This task does not have any preconditions.
The FM Alarm Delete Option installation parameter specifies four options that are tobe used to delete persistent alarms. When the management system is installed, itsdefault setting is to delete acknowledged and unacknowledged alarms automatically.System administrators can change this setting; refer to theLucent OMS AdministrationGuide for details.
Task
Complete the following steps to acknowledge and delete alarms on the Alarms page.
...................................................................................................................................................................................................
1 Access the Alarms page using one of the methods described in the“View a List ofAlarms on the Alarms Page” (p. 2-37)task.
Result: The Alarms page is displayed.
...................................................................................................................................................................................................
2 Select one or more persistent or instantaneous alarms on the Alarms page.
...................................................................................................................................................................................................
3 From the Go menu, selectAcknowledge & Delete and click theGo button.
Fault Management
...................................................................................................................................................................................................................................
2-44 365-315-148R6.1SPIssue 1, October 2007

Result: A confirmation dialog box is displayed, asking if you are sure that youwant to acknowledge and delete the selected alarm(s).
...................................................................................................................................................................................................
4 Click the OK button.
Result: All alarms are acknowledged and the selected instantaneous alarms aredeleted from the Alarms page.
When a user acknowledges and deletes an alarm, all previous instances of thatalarm in the current alarm list will be deleted.
Only persistent alarms in a raised state that have been acknowledged remain on theAlarms page after this action.
E N D O F S T E P S...................................................................................................................................................................................................
Fault Management Acknowledge and Delete Alarms on the Alarms Page
...................................................................................................................................................................................................................................365-315-148R6.1SPIssue 1, October 2007
2-45

View the Network Event Summary Page...................................................................................................................................................................................................................................
When to use
Use this task to view the Network Event Summary page.
Related information
See the following topics in this document:
• “Network Event Summary ” (p. 2-20)
• “View a List of Alarms on the Alarms Page” (p. 2-37)
• “Update Alarm Counts on the Network Event Summary Page” (p. 2-47)
• “Reset the New Event Indicator on the Network Event Summary Page” (p. 2-49)
Before you begin
Before you begin to view the Network Event Summary page, access the Preferencespage and verify, on theMy Network Preferences panel of the page, that theShowpanel check boxes for theAlarm summary (Alarm counts) andLatest raise andclear events check boxes are both checked to make these Network Event Summarypanels visible.
The Alarm summary (Alarm counts) andLatest raise and clear events functions arealways enabled, by default.
Task
Complete the following steps to view the Network Event Summary page.
...................................................................................................................................................................................................
1 In the menu bar of any window, click onMy Network .
Result: A submenu is displayed.
...................................................................................................................................................................................................
2 SelectNetwork event summary .
Result: The Network Event Summary page is displayed.
E N D O F S T E P S...................................................................................................................................................................................................
Fault Management
...................................................................................................................................................................................................................................
2-46 365-315-148R6.1SPIssue 1, October 2007

Update Alarm Counts on the Network Event Summary Page...................................................................................................................................................................................................................................
When to use
Use this task to update alarm counts the Network Event Summary page.
Related information
See the following topics in this document:
• “Network Event Summary ” (p. 2-20)
• “View a List of Alarms on the Alarms Page” (p. 2-37)
• “Reset the New Event Indicator on the Network Event Summary Page” (p. 2-49)
Before you begin
Before you begin to view the Network Event Summary page, access the Preferencespage and verify, on theMy Network Preferences panel of the page, that theShowpanel checkboxes for theAlarm summary (Alarm counts) andLatest raise and clearevents checkboxes are both checked to make these Network Event Summary panelsvisible.
The Alarm summary (Alarm counts) andLatest raise and clear events functions arealways enabled, by default.
Task
Complete the following steps to update alarm counts on the Network Event Summarypage.
...................................................................................................................................................................................................
1 In the menu bar of any window, click onMy Network .
Result: A submenu is displayed.
...................................................................................................................................................................................................
2 SelectNetwork event summary .
Result: The Network Event Summary page is displayed.
...................................................................................................................................................................................................
3 In the Alarm Counts panel, click theRefresh alarms count button.
Fault Management
...................................................................................................................................................................................................................................365-315-148R6.1SPIssue 1, October 2007
2-47

Result: The alarm counts are updated. The date and time of the update aredisplayed.
E N D O F S T E P S...................................................................................................................................................................................................
Fault Management Update Alarm Counts on the Network Event SummaryPage
...................................................................................................................................................................................................................................
2-48 365-315-148R6.1SPIssue 1, October 2007

Reset the New Event Indicator on the Network Event SummaryPage...................................................................................................................................................................................................................................
When to use
Use this task to reset the new event indicator on the Network Event Summary page toremove all new alarm icons from the Alarm Counts panel and to refresh the display.
Related information
See the following topics in this document:
• “Network Event Summary ” (p. 2-20)
• “View a List of Alarms on the Alarms Page” (p. 2-37)
• “Update Alarm Counts on the Network Event Summary Page” (p. 2-47)
Before you begin
Before you begin to view the Network Event Summary page, access the Preferencespage and verify, on theMy Network Preferences panel of the page, that theShowpanel checkboxes for theAlarm summary (Alarm counts) andLatest raise and clearevents checkboxes are both checked to make these Network Event Summary panelsvisible.
The Alarm summary (Alarm counts) andLatest raise and clear events functions arealways enabled, by default.
Task
Complete the following steps to reset the new event indicator on the Network EventSummary page.
...................................................................................................................................................................................................
1 In the menu bar of any window, click onMy Network .
Result: A submenu is displayed.
...................................................................................................................................................................................................
2 SelectNetwork event summary .
Result: The Network Event Summary page is displayed.
...................................................................................................................................................................................................
3 In the Alarm Counts panel, click theReset new event indicator button.
Fault Management
...................................................................................................................................................................................................................................365-315-148R6.1SPIssue 1, October 2007
2-49

Result: The new alarm raised and new alarm cleared icons are removed from theAlarms Count panel and the display is refreshed.
E N D O F S T E P S...................................................................................................................................................................................................
Fault Management Reset the New Event Indicator on the Network EventSummary Page
...................................................................................................................................................................................................................................
2-50 365-315-148R6.1SPIssue 1, October 2007

View the Details of Alarms from the Network Event SummaryPage...................................................................................................................................................................................................................................
When to use
Use this task to view alarm details from the Network Event Summary page.
Related information
See the following topics in this document:
• “Network Event Summary ” (p. 2-20)
• “View a List of Alarms on the Alarms Page” (p. 2-37)
• “Update Alarm Counts on the Network Event Summary Page” (p. 2-47)
Before you begin
Before you begin to view the Network Event Summary page, access the Preferencespage and verify, on theMy Network Preferences panel of the page, that theShowpanel checkboxes for theAlarm summary (Alarm counts) andLatest raise and clearevents checkboxes are both checked to make these Network Event Summary panelsvisible.
The Alarm summary (Alarm counts) andLatest raise and clear events functions arealways enabled, by default.
In addition, adjust the counter refresh rate to 5 or 10 seconds.
Task
Complete the following steps to view alarm details from the Network Event Summarypage.
...................................................................................................................................................................................................
1 In the menu bar of any window, click onMy Network .
Result: A submenu is displayed.
...................................................................................................................................................................................................
2 SelectNetwork event summary .
Result: The Network Event Summary page is displayed.
...................................................................................................................................................................................................
3 In the Latest events panel, click on the hyperlink for theAlarm ID .
Fault Management
...................................................................................................................................................................................................................................365-315-148R6.1SPIssue 1, October 2007
2-51

Result: The Alarms page for the selected alarm is displayed.
E N D O F S T E P S...................................................................................................................................................................................................
Fault Management View the Details of Alarms from the Network EventSummary Page
...................................................................................................................................................................................................................................
2-52 365-315-148R6.1SPIssue 1, October 2007

View the Details of Equipment from the Network EventSummary Page...................................................................................................................................................................................................................................
When to use
Use this task to view equipment details from the Network Event Summary page.
Related information
See the following topics in this document:
• “Network Event Summary ” (p. 2-20)
• “View a List of Alarms on the Alarms Page” (p. 2-37)
• “Update Alarm Counts on the Network Event Summary Page” (p. 2-47)
Before you begin
Before you begin to view the Network Event Summary page, access the Preferencespage and verify, on theMy Network Preferences panel of the page, that theShowpanel checkboxes for theAlarm summary (Alarm counts) andLatest raise and clearevents checkboxes are both checked to make these Network Event Summary panelsvisible.
The Alarm summary (Alarm counts) andLatest raise and clear events functions arealways enabled, by default.
In addition, adjust the counter refresh rate to 5 or 10 seconds.
Task
Complete the following steps to view equipment details from the Network EventSummary page.
...................................................................................................................................................................................................
1 In the menu bar of any window, click onMy Network .
Result: A submenu is displayed.
...................................................................................................................................................................................................
2 SelectNetwork event summary .
Result: The Network Event Summary page is displayed.
...................................................................................................................................................................................................
3 In the Latest events panel, click on the hyperlink for theNE name .
Fault Management
...................................................................................................................................................................................................................................365-315-148R6.1SPIssue 1, October 2007
2-53

Result: The Equipment View page for the selected NE is displayed.
Note: The hyperlink may not be available for some alarms.
E N D O F S T E P S...................................................................................................................................................................................................
Fault Management View the Details of Equipment from the Network EventSummary Page
...................................................................................................................................................................................................................................
2-54 365-315-148R6.1SPIssue 1, October 2007

View the Details of Root Cause Failures from the NetworkEvent Summary Page...................................................................................................................................................................................................................................
When to use
Use this task to view the details of a root cause failure from the Network EventSummary page.
This is only available if the OMS_RCF licence is present.
Related information
See the following topics in this document:
• “Network Event Summary ” (p. 2-20)
• “Update Root Cause Failure Counts on the Network Event Summary Page”(p. 2-57)
Before you begin
Before you begin to view the Network Event Summary page, access the Preferencespage and verify, on theMy Network Preferences panel of the page, that theShowpanel checkboxes for theRoot Cause Failure Counts is checked to make theseNetwork Event Summary panels visible.
The feature Root Cause Failure can be used if the OMS_RCF licence is present.
In addition, adjust the counter refresh rate to 5 or 10 seconds.
Task
Complete the following steps to view root cause failure details from the NetworkEvent Summary page.
...................................................................................................................................................................................................
1 In the menu bar of any window, click onMy Network .
Result: A submenu is displayed.
...................................................................................................................................................................................................
2 SelectNetwork event summary .
Result: The Network Event Summary page is displayed.
...................................................................................................................................................................................................
3 In the Root Cause Failure Counts panel, click on any hyperlink showing a count forTotal or Unacknowledged .
Fault Management
...................................................................................................................................................................................................................................365-315-148R6.1SPIssue 1, October 2007
2-55

Result: The Root Cause Failure page is displayed, listing the root cause failures.
E N D O F S T E P S...................................................................................................................................................................................................
Fault Management View the Details of Root Cause Failures from the NetworkEvent Summary Page
...................................................................................................................................................................................................................................
2-56 365-315-148R6.1SPIssue 1, October 2007
Update Root Cause Failure Counts on the Network EventSummary Page...................................................................................................................................................................................................................................
When to use
Use this task to update root cause failure counts on the Network Event Summary page.
Related information
See the following topics in this document:
• “Network Event Summary ” (p. 2-20)
• “View the Details of Root Cause Failures from the Network Event Summary Page”(p. 2-55)
Before you begin
Before you begin to view the Network Event Summary page, access the Preferencespage and verify, on theMy Network Preferences panel of the page, that theShowpanel checkboxes for theRoot Cause Failure Counts is checked to make theseNetwork Event Summary panels visible.
The feature Root Cause Failure can be used if the OMS_RCF licence is present.
Task
Complete the following steps to update root cause failure counts on the Network EventSummary page.
...................................................................................................................................................................................................
1 In the menu bar of any window, click onMy Network .
Result: A submenu is displayed.
...................................................................................................................................................................................................
2 SelectNetwork event summary .
Result: The Network Event Summary page is displayed.
...................................................................................................................................................................................................
3 In the root cause failure counts panel, click theRefresh alarms count button.
Result: The root cause failure counts are updated. The date and time of the updateare displayed.
E N D O F S T E P S...................................................................................................................................................................................................
Fault Management
...................................................................................................................................................................................................................................365-315-148R6.1SPIssue 1, October 2007
2-57

Perform a Partial Database Synchronization for Alarms andEvents...................................................................................................................................................................................................................................
When to use
Use this task to perform a partial database synchronization for alarms and events so themanagement system database is synchronized with network alarm information.
Manual alarm synchronization is not routinely performed, but can be performed toensure that the latest information is available. For example, if an unusual event occursin the network, a manual alarm synchronization can be performed to ensure that theAlarms database is synchronized.
Related information
See the following topic in this document:
• “Database Synchronization of Alarms” (p. 2-8)
Before you begin
This task does not have any preconditions.
Task
Complete the following step to perform a partial database synchronization for alarmsand events.
...................................................................................................................................................................................................
1 In the top navigation bar selectMy network > Job updates .
Result: The Job Updates page is displayed. This page allows you to monitor thestatus of the task.
...................................................................................................................................................................................................
2 Do one of the following:
• Use the icons or the object links to follow this path:Network . The Network Map isdisplayed. Right-click an NE icon. From the Node menu, selectSession >Database Synchronization .
• Use the icons or the object links to follow this path:Network Elements . TheNetwork Elements page is displayed. Click the radio button to the left of the NEfor which you wish to perform a database synchronization. From the Go menu,selectInitiate Database Synchronization , and click theGo button.
• Use the icons or the object links to follow this path:Tools > DatabaseSynchronizations .
Fault Management
...................................................................................................................................................................................................................................
2-58 365-315-148R6.1SPIssue 1, October 2007

Result: The Initiate Database Synchronization page is displayed.
A database synchronization does not synchronize transient alarms, transientThreshold Crossing Alerts (TCAs) or Protection Switch Events (PSEs).
...................................................................................................................................................................................................
3 In the Database synchronization type field, selectFault - Alarm and Events .
...................................................................................................................................................................................................
4 In the Database synchronization scope field, make a selection to indicate withwhich NE or group of NEs the management system should synchronize as follows:
• In the All NEs in network field, select the radio button.
• In the All NEs in following network adapter server field, select a networkadapter server from theNA name drop-down list.
• In the All NEs in following network communications group field, either enterthe NCG name, or click on theNCG name hyperlink to display the NetworkCommunications Group Selection pop-up window. This window is used to select anNCG from a list.
• In the The following NE: field, either enter the NE name, or click on theNE namehyperlink to display the Network Elements pop-up window. This window is used toselect an NE from a list.
...................................................................................................................................................................................................
5 Click the Submit button.
Result: The alarms and events synchronization is performed, and a confirmation isissued in the Messages panel. The Job Updates page is displayed, and reports thestatus of the alarm and events synchronization.
E N D O F S T E P S...................................................................................................................................................................................................
Fault Management Perform a Partial Database Synchronization for Alarmsand Events
...................................................................................................................................................................................................................................365-315-148R6.1SPIssue 1, October 2007
2-59

View the Alarm Status of an Equipment Component...................................................................................................................................................................................................................................
Purpose
Use this task to display information about the alarm status of an equipment component.
Related information
See the following topic in this document:
• “Alarm Notification” (p. 2-9)
Before you begin
This task does not have any preconditions.
Task
Complete the following steps to view the alarm status of an equipment component.
...................................................................................................................................................................................................
1 Do one of the following:
• SelectNetwork from the Lucent OMS home page. The Network Map is displayed.Position the mouse cursor on the NE icon, click the right mouse button to display apop-up menu, and selectNetwork Element > Equipment from the pop-up menu.
• Use the icons or the object links to follow this path:Network Elements . TheNetwork Elements page is displayed. Expand the Search for network elementspanel. Enter search criteria to display the required NE(s) and click theSearchbutton. The NEs that match the specified search criteria is displayed. Select thenetwork element from the Network Elements page listing. From the Go menu,selectEquipment and click theGo button.
Result: The Equipment page is displayed with the view of the selected equipmentcomponent.
The alarm status of the equipment component is indicated by the color of the alarmicon on the component, representing the highest severity alarm currently active.
...................................................................................................................................................................................................
2 To view the alarm status of an equipment component contained within a higher levelof component (for example, to view the alarm status of ports contained in a slot/circuitpack), click on the graphical representation of the component todrill down to the nextequipment component level.
Fault Management
...................................................................................................................................................................................................................................
2-60 365-315-148R6.1SPIssue 1, October 2007

Result: The next level of component is displayed.
Note: If the user jumps from the equipment view for the bay, shelf slot view, afiltered list of all “equipment” alarms and “physical port” alarms on that bay, shelf,slot view will be returned. Likewise, if the user jumps from the NE view, a filteredlist of “all” alarms on that NE will be returned.
E N D O F S T E P S...................................................................................................................................................................................................
Fault Management View the Alarm Status of an Equipment Component
...................................................................................................................................................................................................................................365-315-148R6.1SPIssue 1, October 2007
2-61

View Alarm Log Records...................................................................................................................................................................................................................................
When to use
Use this task to view specific historical alarm/event records in the alarm log.
Related information
See the following topics in this document:
• “Alarm Log” (p. 2-18)
• “Export Alarm Log Records” (p. 2-63)
• “Delete Alarm Log Records” (p. 2-65)
Before you begin
This task does not have any preconditions.
Task
Complete the following steps to view specific historical alarm/event records in thealarm log.
...................................................................................................................................................................................................
1 Use the icons or the object links to follow this path:
• Logs > Alarm Log
Result: The Alarm Log page is displayed.
...................................................................................................................................................................................................
2 Enter the search criteria necessary to display the specific alarm log information, andclick the Search button.
Result: The alarm log information that meets the search criteria is displayed in thelist at the bottom of the page.
...................................................................................................................................................................................................
3 To see detailed alarm log information for a specific log entry, click theDetails icon onthe left side of the required alarm log record.
Result: The detailed alarm log information is displayed below the alarm log list.
E N D O F S T E P S...................................................................................................................................................................................................
Fault Management
...................................................................................................................................................................................................................................
2-62 365-315-148R6.1SPIssue 1, October 2007
Export Alarm Log Records...................................................................................................................................................................................................................................
When to use
Use this task to export specific alarm log records to a file or a device.
Related information
See the following topics in this document:
• “Alarm Log” (p. 2-18)
• “View Alarm Log Records” (p. 2-62)
• “Delete Alarm Log Records” (p. 2-65)
Before you begin
Before you begin to export alarm log records, be aware that you must have the NOCAdministrator factory-defined user role profile or you must have the Fault ManagementLogs Administration user task specified in your user-defined user role profile beforeyou can complete this task. Contact your system administrator or refer to theLucentOMS Administration Guidefor more details on user role profiles.
Task
Complete the following steps to export specific alarm log records to a file or a device.
...................................................................................................................................................................................................
1 Use the icons or the object links to follow this path:
• Logs > Alarm Log
Result: The Alarm Log page is displayed.
...................................................................................................................................................................................................
2 Enter the search criteria necessary to display the specific alarm log information that isto be deleted, and click theSearch button.
Result: The alarm log information that meets the search criteria is displayed in thelist at the bottom of the page.
...................................................................................................................................................................................................
3 To export the Alarm Log records displayed to a file or a device, selectWrite FilteredSelection to Device or Write Filtered Selection to File from the Go menu and clickthe Go button.
Fault Management
...................................................................................................................................................................................................................................365-315-148R6.1SPIssue 1, October 2007
2-63

Result: A pop-up window is displayed that requires you to specify the name of thefile or device.
...................................................................................................................................................................................................
4 Enter the name of the file or the device and clickSubmit .
Result: The file is written to the specified file or device.
E N D O F S T E P S...................................................................................................................................................................................................
Fault Management Export Alarm Log Records
...................................................................................................................................................................................................................................
2-64 365-315-148R6.1SPIssue 1, October 2007

Delete Alarm Log Records...................................................................................................................................................................................................................................
When to use
Use this task to delete specific alarm log records.
This task can only be performed by a user with administrative privileges.
Related information
See the following topics in this document:
• “Alarm Log” (p. 2-18)
• “View Alarm Log Records” (p. 2-62)
• “Export Alarm Log Records” (p. 2-63)
Before you begin
Be aware that you must have the NOC Administrator factory-defined user role profileor you must have the Fault Management Logs Administration user task specified inyour user-defined user role profile before you can complete this task. Contact yoursystem administrator or refer to theLucent OMS Administration Guidefor more detailson user role profiles.
Task
Complete the following steps to delete specific alarm log records.
...................................................................................................................................................................................................
1 To follow this path use the icons or the object links:
• Logs > Alarm Log
Result: The Alarm Log page is displayed.
...................................................................................................................................................................................................
2 Enter the search criteria necessary to display the specific alarm log information that isto be deleted, and click theSearch button.
Result: The alarm log information that meets the search criteria is displayed in thelist at the bottom of the page.
...................................................................................................................................................................................................
3 To delete the Alarm Log records displayed, selectDelete all from the Go menu andclick the Go button.
Fault Management
...................................................................................................................................................................................................................................365-315-148R6.1SPIssue 1, October 2007
2-65

Result: The Alarm Log records are deleted.
E N D O F S T E P S...................................................................................................................................................................................................
Fault Management Delete Alarm Log Records
...................................................................................................................................................................................................................................
2-66 365-315-148R6.1SPIssue 1, October 2007
View a List of Root Cause Failures on the Root Cause FailuresPage...................................................................................................................................................................................................................................
When to use
Use this task to search for potential root cause failures.
Related information
See the following topics in this document:
• “Root Cause Failures Page” (p. 2-13)
• “Root Cause Failure Processing” (p. 2-32)
Before you begin
Before you begin to view a list of root cause failures, be aware that the Root CauseFailures page can be accessed from various locations within the management system;therefore, this task includes methods with which to access the Root Cause Failurespage.
Task, Method 1: from the Alarms and Events Icon
...................................................................................................................................................................................................
1 Use the icons or the object links to follow one of these paths:
Alarms and Events > Root Cause Failures
Result: The Search for failed equipment and facilities panel of the Root CauseFailures page is displayed.
...................................................................................................................................................................................................
2 If necessary, expand the Search for failed equipment and facilities panel, by clickingthe + icon next toMore... .
...................................................................................................................................................................................................
3 Enter the search criteria to view specific root cause failures or leave the search fieldsblank to view all root cause failures and click theSearch button.
Result: The Root Cause Failures panel of the Root Cause Failures page isdisplayed.
Fault Management
...................................................................................................................................................................................................................................365-315-148R6.1SPIssue 1, October 2007
2-67
E N D O F S T E P S...................................................................................................................................................................................................

Task, Method 2: from the Network Map
Complete the following steps to view a list of root cause failures from the NetworkMap.
...................................................................................................................................................................................................
1 Use the icons or the object links to follow one of these paths:
Network
Result: The Network Map is displayed.
...................................................................................................................................................................................................
2 If necessary expand the areas or aggregates. Right click on a network element, andselectRoot cause failures .
Result: The Root Cause Failure page opens and a pre-filtered list of all equipmentand port root cause failures for the network element are displayed
...................................................................................................................................................................................................
3 If necessary expand the areas. Right click on a link between two network elements orareas and selectRoot cause failures .
Result: The Root Cause Failure page opens and a prefiltered list of all connectionroot cause failures on the link, at the current network map rate filter, is displayed.
Task, Method 3: from a Graphical Layout Menu of a Specific Connection
Complete the following steps to view a list of root cause failures from a GraphicalLayout of a specific connection.
...................................................................................................................................................................................................
1 Use the icons or the object links to follow one of these paths:
Connections > Network Connections
Result: The Network Connections page is displayed.
...................................................................................................................................................................................................
2 If necessary, expand the Search for Network Connections panel, by clicking the+ iconnext toMore... .
...................................................................................................................................................................................................
3 Enter the appropriate search criteria and click theSearch button.
Fault Management View a List of Root Cause Failures on the Root CauseFailures Page
...................................................................................................................................................................................................................................
2-68 365-315-148R6.1SPIssue 1, October 2007
E N D O F S T E P S...................................................................................................................................................................................................

Result: The Network Connections panel of the Network Connections page isdisplayed.
...................................................................................................................................................................................................
4 Select a particular connection by clicking the check box to the left of the connection.
...................................................................................................................................................................................................
5 From the Go menu, selectGraphical layout .
Result: The graphical layout for the selected connection is displayed.
...................................................................................................................................................................................................
6 From the Go menu on the Graphical Layout page, selectRoot Cause Failures List .
Result: The Root Cause Failure List of the selected connection is displayed.
Task, Method 4: from a Specific Connection on the Network Connection List page
Complete the following steps to view a list of root cause failures from a specificconnection on the Network Connection List page.
...................................................................................................................................................................................................
1 Use the icons or the object links to follow one of these paths:
Connections > Network Connections
Result: The Network Connections page is displayed.
...................................................................................................................................................................................................
2 Enter the appropriate search criteria and click theSearch button.
Result: The Network Connections panel of the Network Connections page isdisplayed.
...................................................................................................................................................................................................
3 Select a particular connection by clicking the check box to the left of the connection.
...................................................................................................................................................................................................
4 From the Go menu, selectRoot Cause Failure .
Result: The Root Cause Failure List of the selected connection is displayed.
Fault Management View a List of Root Cause Failures on the Root CauseFailures Page
...................................................................................................................................................................................................................................365-315-148R6.1SPIssue 1, October 2007
2-69
E N D O F S T E P S...................................................................................................................................................................................................
E N D O F S T E P S...................................................................................................................................................................................................

Task, Method 5: from the Network Elements page
Complete the following steps to view a list of root cause failures from a specificconnection on the Network Elements page.
...................................................................................................................................................................................................
1 Use the icons or the object links to follow one of these paths:
Connections > Network Elements
Result: The Network Elements page is displayed.
...................................................................................................................................................................................................
2 Enter the appropriate search criteria and click theSearch button.
Result: The Network Elements panel of the Network Elements page is displayed.
...................................................................................................................................................................................................
3 Select a particular connection by clicking the check box to the left of the connection.
...................................................................................................................................................................................................
4 From the Go menu, selectRoot Cause Failure .
Result: The equipment and port root cause failures for the selected networkelement are displayed.
E N D O F S T E P S...................................................................................................................................................................................................
Fault Management View a List of Root Cause Failures on the Root CauseFailures Page
...................................................................................................................................................................................................................................
2-70 365-315-148R6.1SPIssue 1, October 2007
View the Details of a Root Cause Failure on the Root CauseFailure Page...................................................................................................................................................................................................................................
When to use
Use this task to view the details of a root cause failure on the Root Cause Failurepage.
Related information
See the following topic in this document:
• “Root Cause Failure Processing” (p. 2-32)
• “Root Cause Failures Page” (p. 2-13)
• “View a List of Root Cause Failures on the Root Cause Failures Page” (p. 2-67)
Before you begin
Step 1 requires you to complete the“View a List of Root Cause Failures on the RootCause Failures Page” (p. 2-67)task.
Task
Complete the following steps to view the details of a root cause failure on the RootCause Failure page.
...................................................................................................................................................................................................
1 Complete one of the methods in the“View a List of Root Cause Failures on the RootCause Failures Page” (p. 2-67)task.
...................................................................................................................................................................................................
2 To display additional details for a specific root cause failure, click theDetails icon thatappears in the row to the left the root cause failure.
Result: Additional root cause failure details are displayed below the Go menu inthe Root Cause Failures panel.
E N D O F S T E P S...................................................................................................................................................................................................
Fault Management
...................................................................................................................................................................................................................................365-315-148R6.1SPIssue 1, October 2007
2-71

Acknowledge Root Cause Failures on the Root Cause FailuresPage...................................................................................................................................................................................................................................
When to use
Use this task to acknowledge one or more root cause failures on the Root CauseFailures page.
Note: Acknowledging a root cause failure automatically acknowledges any relatedraised or cleared alarms associated with the root cause.
Related information
See the following topics in this document:
• “Root Cause Failure Processing” (p. 2-32)
• “Root Cause Failures Page” (p. 2-13)
• “View a List of Root Cause Failures on the Root Cause Failures Page” (p. 2-67)
Before you begin
Acknowledgement is only possible on records that have not been acknowledged. Inaddition, multiple records can be acknowledged during one acknowledgment iteration.
Task
Complete the following steps to acknowledge one or more root cause failures on theRoot Cause Failures page.
...................................................................................................................................................................................................
1 Complete one of the methods in the“View a List of Root Cause Failures on the RootCause Failures Page” (p. 2-67)task.
...................................................................................................................................................................................................
2 Select one or more root cause failures on the Root Cause Failures page.
...................................................................................................................................................................................................
3 From the Go menu, selectAcknowledge and click theGo button.
Result: The selected root cause failures are acknowledged.
All alarms associated with the root cause failure are acknowledged. The useractivity log is updated with an entry indicating the number of alarms and rootcauses failures acknowledged during the operation.
E N D O F S T E P S...................................................................................................................................................................................................
Fault Management
...................................................................................................................................................................................................................................
2-72 365-315-148R6.1SPIssue 1, October 2007
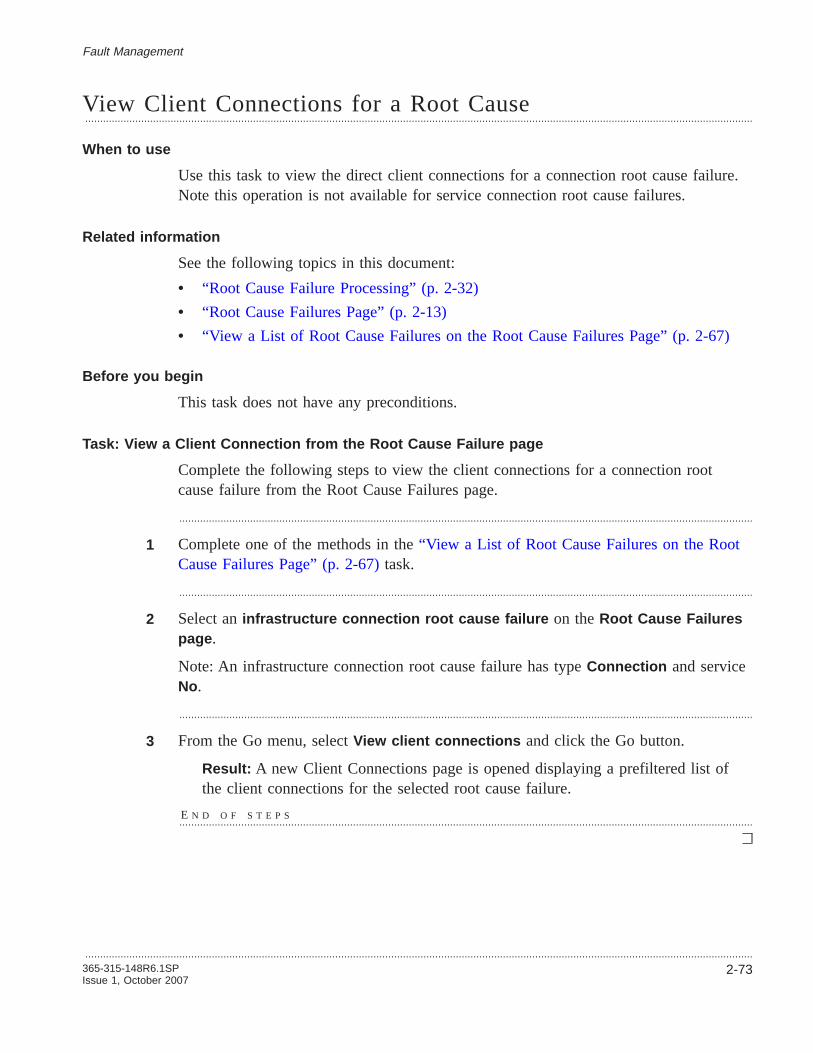
View Client Connections for a Root Cause...................................................................................................................................................................................................................................
When to use
Use this task to view the direct client connections for a connection root cause failure.Note this operation is not available for service connection root cause failures.
Related information
See the following topics in this document:
• “Root Cause Failure Processing” (p. 2-32)
• “Root Cause Failures Page” (p. 2-13)
• “View a List of Root Cause Failures on the Root Cause Failures Page” (p. 2-67)
Before you begin
This task does not have any preconditions.
Task: View a Client Connection from the Root Cause Failure page
Complete the following steps to view the client connections for a connection rootcause failure from the Root Cause Failures page.
...................................................................................................................................................................................................
1 Complete one of the methods in the“View a List of Root Cause Failures on the RootCause Failures Page” (p. 2-67)task.
...................................................................................................................................................................................................
2 Select aninfrastructure connection root cause failure on theRoot Cause Failurespage .
Note: An infrastructure connection root cause failure has typeConnection and serviceNo.
...................................................................................................................................................................................................
3 From the Go menu, selectView client connections and click the Go button.
Result: A new Client Connections page is opened displaying a prefiltered list ofthe client connections for the selected root cause failure.
E N D O F S T E P S...................................................................................................................................................................................................
Fault Management
...................................................................................................................................................................................................................................365-315-148R6.1SPIssue 1, October 2007
2-73

View Services for a Root Cause...................................................................................................................................................................................................................................
When to use
Use this task to view Services for a root cause.
Related information
See the following topics in this document:
• “Root Cause Failure Processing” (p. 2-32)
• “Root Cause Failures Page” (p. 2-13)
• “View a List of Root Cause Failures on the Root Cause Failures Page” (p. 2-67)
Before you begin
This task does not have any preconditions.
Task: View Services from the Root Cause Failures page
Compete the following steps to view the service connections for a connection rootcause failure from the Root Cause Failures page.
...................................................................................................................................................................................................
1 Complete one of the methods in the“View a List of Root Cause Failures on the RootCause Failures Page” (p. 2-67)task.
...................................................................................................................................................................................................
2 Select aninfrastructure connection root cause failure on the Root Cause Failurespage.
Note: An infrastructure connection root cause failure has type″Connection″ and service″No″.
...................................................................................................................................................................................................
3 From the Go menu, selectView services and click the Go button.
Result: A new Service Connections page is opened displaying a prefiltered list ofthe services for the selected root cause failure.
E N D O F S T E P S...................................................................................................................................................................................................
Fault Management
...................................................................................................................................................................................................................................
2-74 365-315-148R6.1SPIssue 1, October 2007

View Affected Ports for a Root Cause...................................................................................................................................................................................................................................
When to use
Use this task to view the contained ports for an equipment root cause failure.
Related information
See the following topics in this document:
• “Root Cause Failure Processing” (p. 2-32)
• “Root Cause Failures Page” (p. 2-13)
• “View a List of Root Cause Failures on the Root Cause Failures Page” (p. 2-67)
Before you begin
This task does not have any preconditions.
Task: View Affected Ports for a Root Cause
Compete the following steps to view the contained ports for an equipment root causefailure from the Root Cause Failures Page.
...................................................................................................................................................................................................
1 Complete one of the methods in the“View a List of Root Cause Failures on the RootCause Failures Page” (p. 2-67)task.
...................................................................................................................................................................................................
2 Select an equipment root cause failure on the Root Cause Failures page.
Note: An equipment root cause failure has typeEquipment .
...................................................................................................................................................................................................
3 From the Go menu, selectView affected ports and click the Go button.
Result: A new Ports page is opened displaying a prefiltered list of the containedports for the selected root cause failure.
E N D O F S T E P S...................................................................................................................................................................................................
Fault Management
...................................................................................................................................................................................................................................365-315-148R6.1SPIssue 1, October 2007
2-75

View Affected Ports on an NE for a Root Cause...................................................................................................................................................................................................................................
When to use
Use this task to view the port assignment for an port root cause failure.
Related information
See the following topics in this document:
• “Root Cause Failure Processing” (p. 2-32)
• “Root Cause Failures Page” (p. 2-13)
• “View a List of Root Cause Failures on the Root Cause Failures Page” (p. 2-67)
Before you begin
This task does not have any preconditions.
Task: View Affected Ports on NE for a Root Cause
Compete the following steps to view the port assignment for a port root cause failurefrom the Root Cause Failures Page.
...................................................................................................................................................................................................
1 Complete one of the methods in the“View a List of Root Cause Failures on the RootCause Failures Page” (p. 2-67)task.
...................................................................................................................................................................................................
2 Select aport root cause failure on the Root Cause Failures page.
Note: A port root cause failure has typePort .
...................................................................................................................................................................................................
3 From the Go menu, selectView affected ports on NEs and click the Go button.
Result: A new Assigned Port page is opened displaying a list of all assigned portson the NE.
E N D O F S T E P S...................................................................................................................................................................................................
Fault Management
...................................................................................................................................................................................................................................
2-76 365-315-148R6.1SPIssue 1, October 2007

View a List of Threshold Crossing alerts...................................................................................................................................................................................................................................
When to use
Use this task to view the Threshold Crossing Alert page, which provides a detailed listof threshold crossing alerts that can be displayed for NE.
Related information
See the following topics in this document:
• Threshold Crossing Alerts (TCA) Processing
• Threshold Crossing Alert Page
• Acknowledge Threshold Crossing Alerts
Before you begin
You are given four methods in which to access, and therefore view, the View a List ofThreshold Crossing alerts. Use Method 2, which accesses the Alarms page from themenu bar of any page, if you want a filtered version of the page.
You can also access the Threshold Crossing Alerts page from a port, or from a go liston all network connections, server connections, client connections, and serviceconnections. Refer to theLucent OMS Connection Management Guideand theConnections chapter of online Help.
Task, Method 1: from the Alarms and Events Icon
Complete the following steps to view a list of events on the Threshold Crossing Alertspage.
...................................................................................................................................................................................................
1 Use the icons or the object links to follow this path:Alarms and Events> ThresholdCrossing Alerts .
Result: The Alarms Threshold Crossing Alerts page is displayed, which shows theSearch for Alarms Threshold Crossing Alerts.
...................................................................................................................................................................................................
2 Enter the search criteria to view specific alerts or leave the search fields blank to viewall alerts and click theSearch button.
Result: The Alarms Threshold Crossing Alerts panel of the Alarms ThresholdCrossing Alerts page is displayed.
Fault Management
...................................................................................................................................................................................................................................365-315-148R6.1SPIssue 1, October 2007
2-77
E N D O F S T E P S...................................................................................................................................................................................................

Task, Method 2: from the Top Navigation Zone Menu Bar
Complete the following steps to view the Alarms Threshold Crossing Alerts page.
...................................................................................................................................................................................................
1 In the top navigation zone of any page, click onMy Network .
Result: A submenu is displayed.
...................................................................................................................................................................................................
2 SelectNetwork Event Summary .
Result: The Network Event Summary page is displayed.
...................................................................................................................................................................................................
3 In the TCA portion of the page, click on the number shown in the Total Raised,Unackd raised, or Unackd clear column.
Result: The Threshold Crossing Alerts page is displayed for your selection.
The Threshold Crossing Alerts page is filtered to show all alerts, allunacknowledged raised alerts, or all unacknowledged cleared alerts, depending onthe count selected on the Network Event Summary page.
...................................................................................................................................................................................................
4 If necessary, expand the Search panel, by clicking the+ icon next toMore... .
...................................................................................................................................................................................................
5 Enter the search criteria to view specific threshold crossing alerts or leave the searchfields blank to view all alarms and click theSearch button.
Result: The Threshold Crossing Alerts panel of the Threshold Crossing Alerts pageis displayed.
Task, Method 3: from a node link on the Network Map page
Complete the following steps to view the Alarms Threshold Crossing Alerts page.
...................................................................................................................................................................................................
1 On the main Lucent EMS panel, click on theNetwork icon.
Result: The Network Map is displayed.
...................................................................................................................................................................................................
2 Right-click on the actual link between two nodes on the Network Map.
Fault Management View a List of Threshold Crossing alerts
...................................................................................................................................................................................................................................
2-78 365-315-148R6.1SPIssue 1, October 2007
E N D O F S T E P S...................................................................................................................................................................................................

Result: A drop menu is displayed, with Threshold Crossing Alerts as one of theselections.
...................................................................................................................................................................................................
3 Select Threshold Crossing Alerts from the drop-down menu.
Result: The Threshold Crossing Alerts page is displayed.
...................................................................................................................................................................................................
4 If necessary, expand the Search panel, by clicking the+ icon next toMore... .
...................................................................................................................................................................................................
5 Enter the search criteria to view specific threshold crossing alerts or leave the searchfields blank to view all alarms and click theSearch button.
Result: The Threshold Crossing Alerts panel of the Threshold Crossing Alerts pageis displayed.
Task, Method 4: from a node on the Network Map page
Complete the following steps to view the Alarms Threshold Crossing Alerts page.
...................................................................................................................................................................................................
1 On the main Lucent EMS panel, click on theNetwork icon.
Result: The Network Map is displayed.
...................................................................................................................................................................................................
2 Right-click on a node on the Network Map.
Result: A drop menu is displayed, with Threshold Crossing Alerts as one of theselections.
...................................................................................................................................................................................................
3 Select Threshold Crossing Alerts from the drop-down menu.
Result: The Threshold Crossing Alerts page is displayed.
...................................................................................................................................................................................................
4 If necessary, expand the Search panel, by clicking the+ icon next toMore... .
...................................................................................................................................................................................................
5 Enter the search criteria to view specific threshold crossing alerts or leave the searchfields blank to view all alarms and click theSearch button.
Fault Management View a List of Threshold Crossing alerts
...................................................................................................................................................................................................................................365-315-148R6.1SPIssue 1, October 2007
2-79
E N D O F S T E P S...................................................................................................................................................................................................

Result: The Threshold Crossing Alerts panel of the Threshold Crossing Alerts pageis displayed.
E N D O F S T E P S...................................................................................................................................................................................................
Fault Management View a List of Threshold Crossing alerts
...................................................................................................................................................................................................................................
2-80 365-315-148R6.1SPIssue 1, October 2007

View the Details of Threshold Crossing Alerts from theNetwork Event Summary Page...................................................................................................................................................................................................................................
When to use
Use this task to View the details of Threshold Crossing alerts.
Related information
See the following topics in this document:
• Threshold Crossing Alerts (TCA) Processing
• Threshold Crossing Alert Page
• Acknowledge Threshold Crossing Alerts
Before you begin
This task does not have any preconditions.
Task
Complete the following steps to view alarm details from the Network Event Summarypage.
...................................................................................................................................................................................................
1 In the menu bar of any window, click onMy Network .
Result: A submenu is displayed.
...................................................................................................................................................................................................
2 SelectNetwork event summary
Result: The Network Event Summary page is displayed.
...................................................................................................................................................................................................
3 In the TCA column, click on the hyperlink for the Total raised or Unackd raised TCA.
Result: The Threshold Crossing Alert page is displayed.
...................................................................................................................................................................................................
4 To display additional details for a specific TCA, click the Details icon, which appearsin the row to the left of the TCA.
Fault Management
...................................................................................................................................................................................................................................365-315-148R6.1SPIssue 1, October 2007
2-81

Result: Additional TCA details are displayed below the Go menu in the TCApanel.
E N D O F S T E P S...................................................................................................................................................................................................
Fault Management View the Details of Threshold Crossing Alerts from theNetwork Event Summary Page
...................................................................................................................................................................................................................................
2-82 365-315-148R6.1SPIssue 1, October 2007

Acknowledge a Threshold Crossing Alert...................................................................................................................................................................................................................................
When to use
Use this task to acknowledge one or more a Threshold Crossing Alerts on theThreshold Crossing Alert page.
Related information
See the following topics in this document:
• Threshold Crossing Alerts (TCA) Processing
• Threshold Crossing Alert Page
• Acknowledge Threshold Crossing Alerts
Before you begin
This task does not have any preconditions.
Task
Complete the following steps to acknowledge one or more events on the ThresholdCrossing Alerts page.
...................................................................................................................................................................................................
1 Access the Protection Switch Events page using one of the methods described in theThreshold Crossing Alert pagetask.
Result: The Threshold Crossing Alerts page is displayed.
...................................................................................................................................................................................................
2 Select one or more alerts on the Threshold Crossing Alerts page.
...................................................................................................................................................................................................
3 From the Go menu, selectAcknowledge and click theGo button.
Result: The selected threshold crossing alerts are acknowledged.
When a user acknowledges threshold crossing alert, all previous instances of thatalert in the current alert list will be acknowledged.
The Acknowledge date & time field is updated for the acknowledged alarm(s).The Acknowledged by field is updated with the user ID of the user whoacknowledged the alarm(s).
E N D O F S T E P S...................................................................................................................................................................................................
Fault Management
...................................................................................................................................................................................................................................365-315-148R6.1SPIssue 1, October 2007
2-83

View a List of Events on the Protection Switch Event Page...................................................................................................................................................................................................................................
When to use
Use this task to view the Protection Switch Event Page, which provides a detailed listof equipment and management system-generated events that can be displayed for eachPSE.
Related information
See the following topics in this document:
• Protection Switch Event Processing
• Protection Switch Event Log page
• Acknowledge Protection Switch Event Log page
Before you begin
You are given two methods in which to access, and therefore view, the Events on theProtection Switch Event page.
Task, Method 1: from the Logs Icon
Complete the following steps to view a list of events on the Protection Switch Eventpage.
...................................................................................................................................................................................................
1 Use the icons or the object links to follow this path:Logs > Protection SwitchEvents .
Result: The Protection Switch Event page is displayed, which shows the Search forAlarms Protection Switch Events panel.
...................................................................................................................................................................................................
2 Enter the search criteria to view specific events or leave the search fields blank to viewall events and click theSearch button.
Result: The Protection Switch Event panel of the Protection Switch Event page isdisplayed.
Fault Management
...................................................................................................................................................................................................................................
2-84 365-315-148R6.1SPIssue 1, October 2007
E N D O F S T E P S...................................................................................................................................................................................................

Task, Method 2: from the Top Navigation Zone Menu Bar
Complete the following steps to view the Protection Switch Events page.
...................................................................................................................................................................................................
1 In the top navigation zone of any page, click onMy Network .
Result: A submenu is displayed.
...................................................................................................................................................................................................
2 SelectNetwork Event Summary .
Result: The Network Event Summary page is displayed.
...................................................................................................................................................................................................
3 In the PSEs column of the page, click on the number shown in the Unackd raised row.
Result: The Protection Switch Events Log page is displayed for your selection.
The Protection Switch Events Log page is filtered to show all unacknowledgedPSEs, all events, all unacknowledged raised events, or all unacknowledged clearedevents, depending on the count selected on the Network Event Summary page.
...................................................................................................................................................................................................
4 If necessary, expand the Search panel, by clicking the+ icon next toMore... .
...................................................................................................................................................................................................
5 Enter the search criteria to view specific Protection Switch Events or leave the searchfields blank to view all events and click theSearch button.
Result: The Protection Switch Events Log panel of the Protection Switch EventsLog page is displayed.
Task, Method 3: from a node link on the Network Map page
Complete the following steps to view the Protection Switch Event page.
...................................................................................................................................................................................................
1 On the main Lucent EMS panel, click on theNetwork icon.
Result: The Network Map is displayed.
...................................................................................................................................................................................................
2 Right-click on the actual link between 2 nodes on the Network Map.
Fault Management View a List of Events on the Protection Switch EventPage
...................................................................................................................................................................................................................................365-315-148R6.1SPIssue 1, October 2007
2-85
E N D O F S T E P S...................................................................................................................................................................................................

Result: A drop menu is displayed, with Protection Switch Event as one of theselections.
...................................................................................................................................................................................................
3 Select Protection Switch Event from the drop-down menu.
Result: The Protection Switch Event page is displayed.
The Protection Switch Events page is filtered to show all unacknowledged PSEs,all events, all unacknowledged raised events, or all unacknowledged cleared events,depending on the count selected on the Network Event Summary page.
...................................................................................................................................................................................................
4 If necessary, expand the Search panel, by clicking the+ icon next toMore... .
...................................................................................................................................................................................................
5 Enter the search criteria to view specific Protection Switch Events or leave the searchfields blank to view all alarms and click theSearch button.
Result: The Protection Switch Events panel of the Protection Switch Events page isdisplayed.
Task, Method 4: from a node on the Network Map page
Complete the following steps to view the Protection Switch Event page.
...................................................................................................................................................................................................
1 On the main Lucent EMS panel, click on theNetwork icon.
Result: The Network Map is displayed.
...................................................................................................................................................................................................
2 Right-click on a node on the Network Map
Result: A drop menu is displayed, with Protection Switch Event as one of theselections.
...................................................................................................................................................................................................
3 Select Protection Switch Event from the drop-down menu.
Result: The Protection Switch Event page is displayed.
The Protection Switch Events page is filtered to show all unacknowledged PSEs,all events, all unacknowledged raised events, or all unacknowledged cleared events,depending on the count selected on the Network Event Summary page.
...................................................................................................................................................................................................
4 If necessary, expand the Search panel, by clicking the+ icon next toMore... .
Fault Management View a List of Events on the Protection Switch EventPage
...................................................................................................................................................................................................................................
2-86 365-315-148R6.1SPIssue 1, October 2007
E N D O F S T E P S...................................................................................................................................................................................................

...................................................................................................................................................................................................
5 Enter the search criteria to view specific Protection Switch Events or leave the searchfields blank to view all alarms and click theSearch button.
Result: The Protection Switch Events panel of the Protection Switch Events page isdisplayed.
E N D O F S T E P S...................................................................................................................................................................................................
Fault Management View a List of Events on the Protection Switch EventPage
...................................................................................................................................................................................................................................365-315-148R6.1SPIssue 1, October 2007
2-87

Acknowledge a Protection Switch Event Log page...................................................................................................................................................................................................................................
When to use
Use this task to acknowledge one or more protection switch events on the ProtectionSwitch Event page.
Related information
See the following topics in this document:
• Protection Switch Event Processing
• Protection Switch Event Log page
Before you begin
This task does not have any preconditions.
Task
Complete the following steps to acknowledge one or more Protection Switch events onthe Protection Switch Events Log page.
...................................................................................................................................................................................................
1 Access the Protection Switch Events page using one of the methods described in theView a list of events on the Protection Switch Event pagetask.
Result: The Protection Switch Events page is displayed.
...................................................................................................................................................................................................
2 Select one or more events on the Protection Switch Events page.
...................................................................................................................................................................................................
3 From the Go menu, selectAcknowledge and click theGo button.
Result: The selected events are acknowledged.
Please note that when a user acknowledges an event, all previous instances of thatevent in the current event list will be acknowledged.
The Acknowledge date & time field is updated for the acknowledged event(s).The Acknowledged by field is updated with the user ID of the user whoacknowledged the event(s).
E N D O F S T E P S...................................................................................................................................................................................................
Fault Management
...................................................................................................................................................................................................................................
2-88 365-315-148R6.1SPIssue 1, October 2007

3 3Performance Monitoring
Overview...................................................................................................................................................................................................................................
Purpose
This chapter provides general information about the Performance Monitoring (PM)feature, which is used to collect and view error and traffic statistics from networkelements in the managed network, and the tasks that can be performed to enable anduse the Performance Monitoring capabilities in the Lucent OMS.
Contents
The Performance Monitoring Feature 3-3
Performance Monitoring Pages 3-5
PM Time Intervals and Data Viewing 3-7
PM Data Storage Behavior 3-9
Performance Monitoring Counters 3-11
Supported PM Parameters for NEs in the SDH/Ethernet Environment 3-46
Supported PM Parameters for NEs in the SONET/Ethernet Environment 3-54
Supported PM Parameters for NEs in the WDM Environment 3-55
View a List of Performance Measurements Statistics 3-57
View a List of PM-Capable Termination Points 3-58
Enable PM Data Collection 3-60
Disable PM Data Collection 3-62
Schedule Disable PM Data Collection 3-64
Clear PM Data Collection for Selected Termination Points 3-66
View the Current PM Measurements of a Termination Point 3-68
View the Monitored NE Layer Rate Report 3-70
...................................................................................................................................................................................................................................365-315-148R6.1SPIssue 1, October 2007
3-1

Enable/Disable NE Layer Rates 3-72
Generate a PM Report 3-74
Save a PM Report 3-76
Polling Current Measurements 3-77
Performance Monitoring Overview
...................................................................................................................................................................................................................................
3-2 365-315-148R6.1SPIssue 1, October 2007

The Performance Monitoring Feature...................................................................................................................................................................................................................................
Performance Monitoring definition
The Performance Monitoring feature enables the user to precisely monitor the qualityof the end-to-end paths, be notified of performance degradation, and initiate correctiveaction, if necessary.
Performance Monitoring provides management system users with network andservice-level error and traffic statistics for various network connection types. Reportscan be generated for monitored network connections to show the error rate count fornetwork connections, or the traffic carried and dropped for Ethernet connections.
Error and traffic performance data can be compared with the Service Level Agreement(SLA) for each service.
TCAs
The management system receives and displays Threshold Crossing Alerts (TCAs) fromNE termination points (TPs) that are set to generate and process PerformanceMonitoring (PM) data. TCAs are sent when the transmission error levels within an NEexceed predefined threshold levels, or when the carried traffic levels exceedbandwidth-usage thresholds.
Threshold settings
PM Threshold settings and Signal Degrade Threshold settings are accessed andspecified throughNetwork Elements > NE Management Functions . Refer to theLucent OMS Network Element Management Guidefor detailed information.
Performance Monitoring as a non-licensed feature
All Performance Monitoring features are available to users through theOMS_CORElicense, which includes those features that are available through thePerformanceMeasurements Statistics , Performance Measurement Points andPerformanceMeasurement Reports object links. With theOMS_CORE license, the PerformanceMonitoring and the Performance Monitoring (view-only) user tasks become availablefor user role profile use.
Operating Mode
The system operates in any one of these two modes which can be specified duringinstallation:
• TP Mode
• Bulk Mode
Performance Monitoring
...................................................................................................................................................................................................................................365-315-148R6.1SPIssue 1, October 2007
3-3
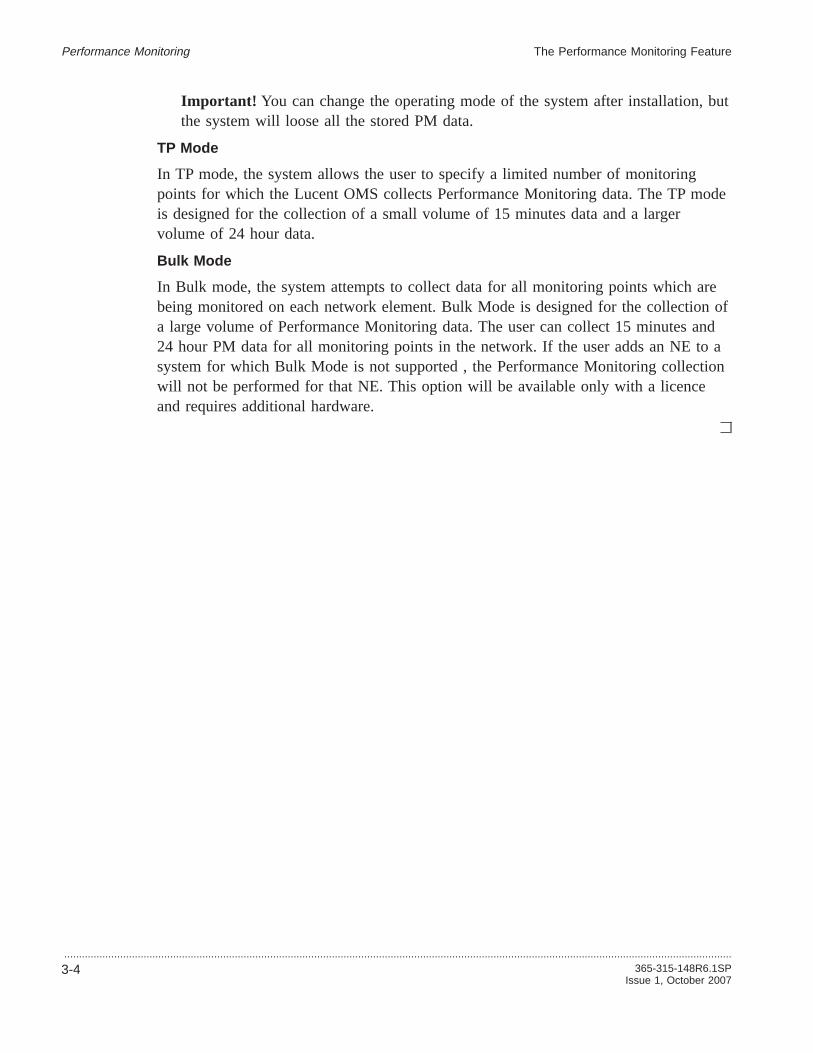
Important! You can change the operating mode of the system after installation, butthe system will loose all the stored PM data.
TP Mode
In TP mode, the system allows the user to specify a limited number of monitoringpoints for which the Lucent OMS collects Performance Monitoring data. The TP modeis designed for the collection of a small volume of 15 minutes data and a largervolume of 24 hour data.
Bulk Mode
In Bulk mode, the system attempts to collect data for all monitoring points which arebeing monitored on each network element. Bulk Mode is designed for the collection ofa large volume of Performance Monitoring data. The user can collect 15 minutes and24 hour PM data for all monitoring points in the network. If the user adds an NE to asystem for which Bulk Mode is not supported , the Performance Monitoring collectionwill not be performed for that NE. This option will be available only with a licenceand requires additional hardware.
Performance Monitoring The Performance Monitoring Feature
...................................................................................................................................................................................................................................
3-4 365-315-148R6.1SPIssue 1, October 2007

Performance Monitoring Pages...................................................................................................................................................................................................................................
Specifically designed pages
The pages of the management system that are specifically designed to presentPerformance Monitoring information are the following:
• “Performance Measurements Statistics page” (p. 3-5)
• “Performance Measurements Points page” (p. 3-5)
• “Current Measurements page” (p. 3-5)
• “Performance Measurements Reports Query page” (p. 3-5)
• “Performance Measurements Report Results page” (p. 3-6)
• “ Monitored NE Layer Rate page” (p. 3-6)
Performance Measurements Statistics page
The Performance Measurements Statistics page provides 15-minute and 24-hourmeasurement data for monitored termination points (TPs) including counts for thenumber of termination points monitored for 15-minute user-demand requests and24-hour data, and the 15-minute and 24-hour retention periods.
Refer to the“View a List of Performance Measurements Statistics” (p. 3-57)task forthe procedure to view this page.
Performance Measurements Points page
The Performance Measurement Points page enables users to display a list ofPM-capable termination points and/or termination points with PM data collectionenabled. Users can start and stop PM data collection on demand or schedule PM datacollection for a specific time period, obtain current PM measurements about a selectedtermination point, and query PM-enabled termination points using specific criteria togenerate and view and/or save a PM report file. The system can display the current PMcounts with periodic update for an interval of time as specified. For example, updateevery 30 seconds for 10 minutes.
Current Measurements page
The Current Measurements page enables users to display current PM parametermeasurements for a selected NE termination point.
Performance Measurements Reports Query page
The Performance Measurement Reports Query page enables users to specify reportcriteria for up to four PM-enabled termination points for output to a PM report file.
Performance Monitoring
...................................................................................................................................................................................................................................365-315-148R6.1SPIssue 1, October 2007
3-5

Performance Measurements Report Results page
The Performance Measurement Report Results page enables users to view and/orsave the PM report file generated from criteria specified on the PerformanceMeasurement Reports Query page.
Monitored NE Layer Rate page
The Monitored NE Layer Rate page is intended to allow the user to view and modifythe behavior of the PM collection algorithm. During typical operating conditions,changes to this page are not necessary.
Performance Monitoring Performance Monitoring Pages
...................................................................................................................................................................................................................................
3-6 365-315-148R6.1SPIssue 1, October 2007

PM Time Intervals and Data Viewing...................................................................................................................................................................................................................................
Granularities
The management system monitors and reports on PM data gathered from two timeintervals:
• 24-hour PM data
• 15-minute PM data (user on-demand request)
PM data reporting
The management system enables 15-minute (on-demand user request) and/or 24-hourPM data collection for the following:
• PM data can be collected and stored in the management system from NEtermination points.
• PM data can be retrieved directly from each NE termination points in which thedata has not yet been collected.
The 24-hour PM data collected from NE termination points is stored in themanagement system for 62 days. The 15-minute PM-data is stored in the managementsystem for 14 days. The 62-day and the 14-day storage values are maximum values.These storage values can be set to lower values by the user.
All PM data older than either time is automatically purged from the managementsystem. Refer to“PM Data Storage Behavior” (p. 3-9)for additional details.
PM data search criteria for filtering
The management system enables the following search criteria to be used to filter PMdata for its appearance in report format:
• Connection name
• NE name
• Connection rate
• Granularity
• Started/Stopped Ports Only
• Data collection from/to
Report file format, fields, and export
From the search criteria specified, the management system produces a report file,which is an ASCII file in Tab Separated Value (tsv ) format. The.tsv file can be readinto an MicroSoft® Excel compatible file and saved as an.xls file in MicroSoft®Excel. The filename of the generated report is in this format:<ReportType>.xls.
Performance Monitoring
...................................................................................................................................................................................................................................365-315-148R6.1SPIssue 1, October 2007
3-7
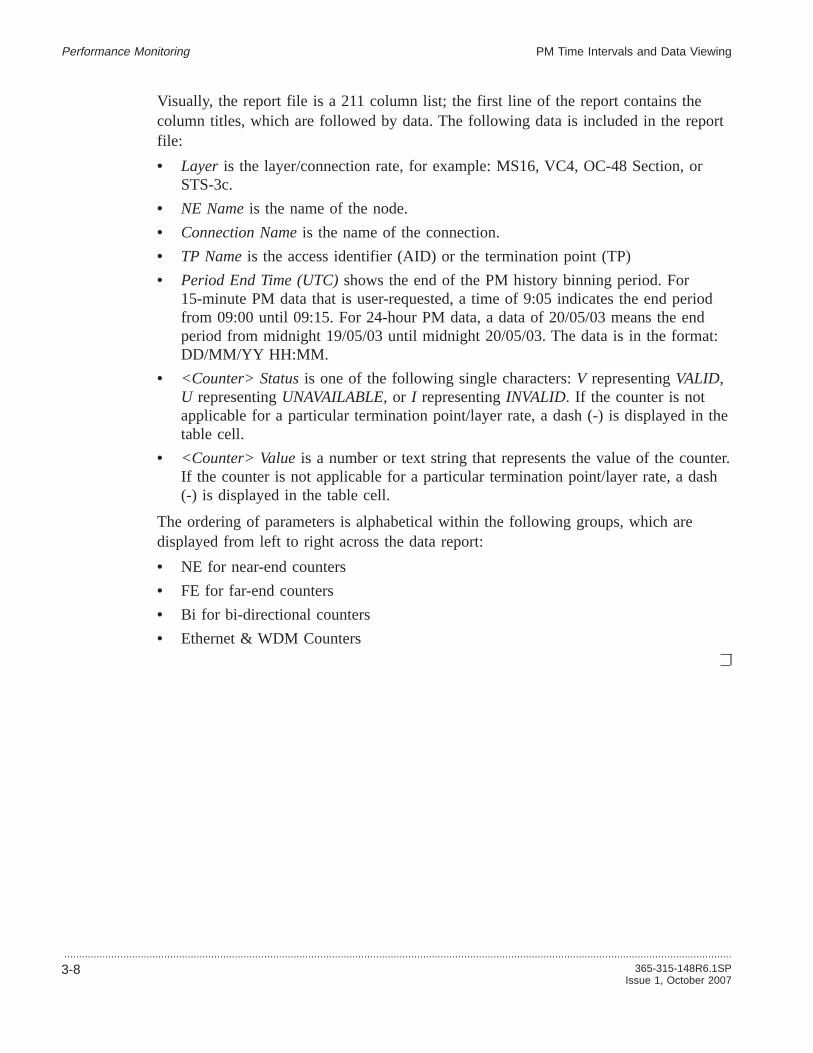
Visually, the report file is a 211 column list; the first line of the report contains thecolumn titles, which are followed by data. The following data is included in the reportfile:
• Layer is the layer/connection rate, for example: MS16, VC4, OC-48 Section, orSTS-3c.
• NE Nameis the name of the node.
• Connection Nameis the name of the connection.
• TP Nameis the access identifier (AID) or the termination point (TP)
• Period End Time (UTC)shows the end of the PM history binning period. For15-minute PM data that is user-requested, a time of 9:05 indicates the end periodfrom 09:00 until 09:15. For 24-hour PM data, a data of 20/05/03 means the endperiod from midnight 19/05/03 until midnight 20/05/03. The data is in the format:DD/MM/YY HH:MM.
• <Counter> Statusis one of the following single characters:V representingVALID,U representingUNAVAILABLE, or I representingINVALID. If the counter is notapplicable for a particular termination point/layer rate, a dash (-) is displayed in thetable cell.
• <Counter> Valueis a number or text string that represents the value of the counter.If the counter is not applicable for a particular termination point/layer rate, a dash(-) is displayed in the table cell.
The ordering of parameters is alphabetical within the following groups, which aredisplayed from left to right across the data report:
• NE for near-end counters
• FE for far-end counters
• Bi for bi-directional counters
• Ethernet & WDM Counters
Performance Monitoring PM Time Intervals and Data Viewing
...................................................................................................................................................................................................................................
3-8 365-315-148R6.1SPIssue 1, October 2007

PM Data Storage Behavior...................................................................................................................................................................................................................................
Behavior in general
The management system supports the following:
• the display of 15-minute on-demand data if requested by the user
• 24-hour PM data
• background PM data collection
• storage of PM data
The functions to enable, collect, and report 15-minute and/or 24-hour PM data are thesame. The user can produce 15-minute reports on demand and retrieve all data that theNE is able to store, which is approximately 8 hours of data. The user can select atermination point for PM collection, or for the display of PM data, from a terminationpoint list or by selecting the termination point on the graphical layout. Users cancollect 24-hour PM data, 15-minute PM data on demand, and/or both. Any request todisplay PM data that has not yet been collected from an NE automatically causes themanagement system to go directly to the NE to retrieve that data.
Note: For CMISE NEs, data that is valid on the NE is reported in the NE Historymeasurements screen as unknown even when the data is valid. CNA only determinesthe data as valid after a monitor operation has been performed on the OMS. CNA usesthe monitor object creation to determine when monitoring was enabled. This is uniqueto PM reports for CMISE NEs.
Implications of data accumulation and throughput
Because 15-minute PM data accumulates much more rapidly than 24-hour data, the15-minute data collection is on demand only.
To alleviate the throughput and data storage concerns, 15-minute PM data collection isavailable on demand only and is limited to both a maximum number of monitoredtermination points (TPs) and a total storage limit. In addition, to reduce storageconcerns, PM data storage is limited to a configurable number of a 14-day maximum.Note: Additionally, users can set the maximum storage capacity that they require, andan alarm is raised if the available storage falls below this capacity.
Performance Monitoring
...................................................................................................................................................................................................................................365-315-148R6.1SPIssue 1, October 2007
3-9

The following tables identify the storage capacity that should be supported for 24-hourPM data. For each HP® server configuration, this capacity is estimated to allow forstorage of all 24-hour data (connection termination points, not intermediate points) for2 months. The management system enforces both the storage limit and the 62 day timelimit (configurable with a maximum of 62 days) for 24-hour PM data.
Standard HP® rp2470 Configuration with 2 CPUs
15-Minute Data 24-Hour Data
Max # of TPs Max # TP Quarter Hours Max # of TP Days
500 336,000 70,000
Large HP® rp5470 Configuration with 2 or 4 CPUs
15-Minute Data 24-Hour Data
Max # of TPs Max # TP Quarter Hours Max # of TP Days
1,000 672,000 140,000
Any Platform with Distributed NAs
15-Minute Data 24-Hour Data
Max # of TPs Max # TP Quarter Hours Max # of TP Days
2,000 1,344,000 700,000
Performance Monitoring PM Data Storage Behavior
...................................................................................................................................................................................................................................
3-10 365-315-148R6.1SPIssue 1, October 2007

Performance Monitoring Counters...................................................................................................................................................................................................................................
Performance Monitoring Counters Mapping
Performance monitoring counters are ordered within the following groupings:Near-End, Far-End, Bidirectional, Ethernet, and WDM.
The following table maps the performance monitoring counter position to the PMcounter name that appears on management system pages. The Position Number in thefollowing table represents the counter position number, not the column number in thefile.
Counter PositionNumber
PM Counter Name Description
1 NE-AISS Near-End AIS Seconds(Alarm Indication Signal)
2 NE-AISS-E Near-End AIS Seconds(Egress)
3 NE-BBE Near-End BackgroundBlock Errors
4 NE-BBE_E Background Block Errors -Egress
5 NE-CV Near-End Code Violations
6 NE-CV-E Near-End Code Violations(Egress)
7 NE-CV-BBE Near-End CodeViolations/BackgroundBlock Errors (LX)
8 NE-ES Near-End Errored Seconds
9 NE-ES_E Near-End Errored Seconds- Egress
10 NE-ESA Near-End Errored Seconds- Egress
11 NE-ESA-E Near-End Errored SecondsA (Egress)
12 NE-ESB Near-End Errored SecondsB
13 NE-ESB-E Near-End Errored SecondsB (Egress)
Performance Monitoring
...................................................................................................................................................................................................................................365-315-148R6.1SPIssue 1, October 2007
3-11

Counter PositionNumber
PM Counter Name Description
14 NE-FC Near-End Frame SlipCounts
15 NE-FC-E Near-End Frame SlipCounts (Egress)
16 NE-FECC Near-End Forward ErrorCorrection
17 NE-FEC-EC Near-End Forward ErrorCorrection - CorrectableErrors
18 NE-FEC_UBC Near-End Forward ErrorCorrection - UncorrectableErrors
19 NE-LOSS Near-End Loss of SignalSeconds
20 NE-NPDE Near-End Negative PointerJustification CountDetected
21 NE-NPGE Near-End Negative PointerJustification CountGenerated
22 NE-NPJ Near-End PointerJustification Counter
23 NE-PJCDIFF-P Near-End PointerJustification CountDifference
24 NE-PPDE Near-End Positive PointerJustification CountDetected
25 NE-PPGE Near-End Positive PointerJustification CountGenerated
26 NE-PSC Near-End Protection SwitchCounts
27 NE-PSC-P Near-End Protection SwitchCounts - Protection
28 NE-PSC-W Near-End Protection SwitchCounts - Worker
Performance Monitoring Performance Monitoring Counters
...................................................................................................................................................................................................................................
3-12 365-315-148R6.1SPIssue 1, October 2007

Counter PositionNumber
PM Counter Name Description
29 NE-PSD Near-End Protection SwitchDuration
30 NE-SAS Near-End Severely ErroredFrame/AIS Seconds
31 NE-SAS-E Near-End Severely ErroredFrame/AIS Seconds(Egress)
32 NE-SEFS Near-End Severely ErroredFraming Seconds
33 NE-SEFS-E Near-End Severely ErroredFraming Seconds (Egress)
34 NE-SES Near-End Severely ErroredSeconds
35 NE-SES_E Near-End Severely ErroredSeconds - Egress
36 NE-UAP Near-End UnavailablePeriods
37 NE-UAS Near-End UnavailableSeconds
38 NE-UAS_E Near-End UnavailableSeconds - Egress
39 FE-BBE Far-End Background BlockErrors
40 FE-CV Far-End Code Violations
41 FE-CV-E Far-End Code Violations(Egress)
42 FE-ES Far-End Errored Seconds
43 FE-ES-E Far-End Errored Seconds(Egress)
44 FE-ESA Far-End Errored Seconds A
45 FE-ESA-E Far-End Errored Seconds A(Egress)
46 FE-ESB Far-End Errored Seconds B
47 FE-ESB-E Far-End Errored Seconds B(Egress)
Performance Monitoring Performance Monitoring Counters
...................................................................................................................................................................................................................................365-315-148R6.1SPIssue 1, October 2007
3-13
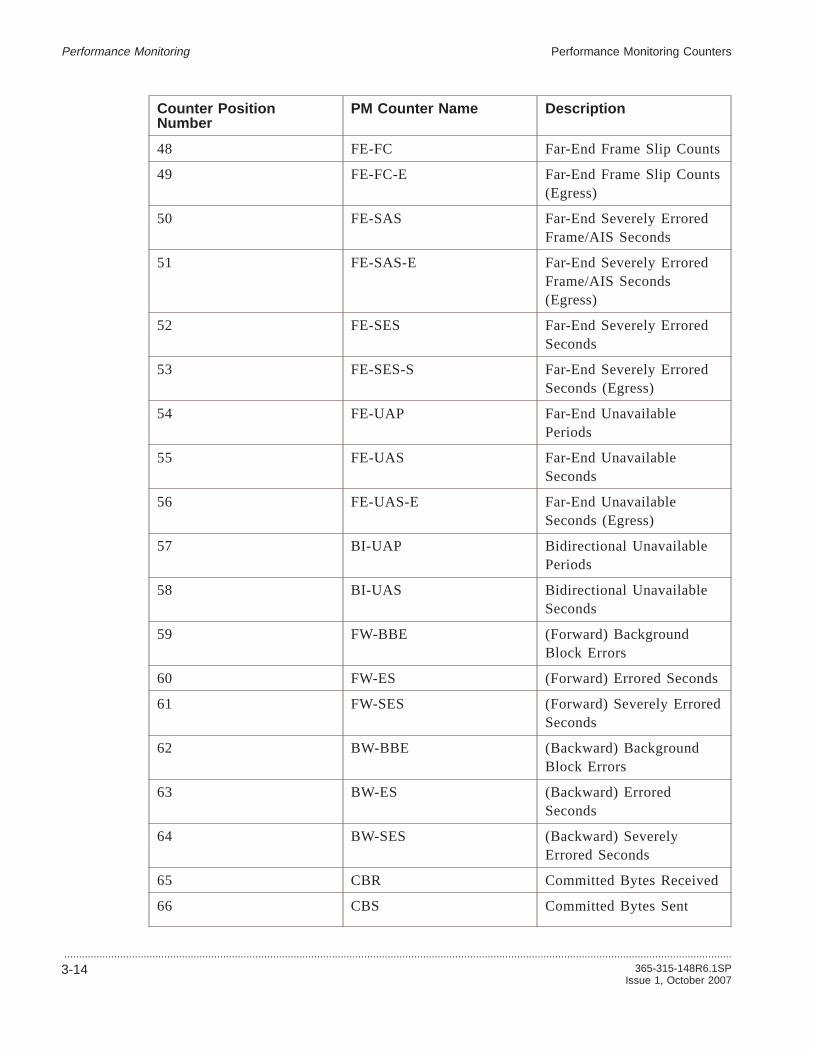
Counter PositionNumber
PM Counter Name Description
48 FE-FC Far-End Frame Slip Counts
49 FE-FC-E Far-End Frame Slip Counts(Egress)
50 FE-SAS Far-End Severely ErroredFrame/AIS Seconds
51 FE-SAS-E Far-End Severely ErroredFrame/AIS Seconds(Egress)
52 FE-SES Far-End Severely ErroredSeconds
53 FE-SES-S Far-End Severely ErroredSeconds (Egress)
54 FE-UAP Far-End UnavailablePeriods
55 FE-UAS Far-End UnavailableSeconds
56 FE-UAS-E Far-End UnavailableSeconds (Egress)
57 BI-UAP Bidirectional UnavailablePeriods
58 BI-UAS Bidirectional UnavailableSeconds
59 FW-BBE (Forward) BackgroundBlock Errors
60 FW-ES (Forward) Errored Seconds
61 FW-SES (Forward) Severely ErroredSeconds
62 BW-BBE (Backward) BackgroundBlock Errors
63 BW-ES (Backward) ErroredSeconds
64 BW-SES (Backward) SeverelyErrored Seconds
65 CBR Committed Bytes Received
66 CBS Committed Bytes Sent
Performance Monitoring Performance Monitoring Counters
...................................................................................................................................................................................................................................
3-14 365-315-148R6.1SPIssue 1, October 2007

Counter PositionNumber
PM Counter Name Description
67 EDFC Dropped Frames -Congestion
68 EDFE Dropped Frames - Errors
69 EDFP Dropped Frames - Policer
70 EINB Incoming Number of Bytes
71 EINF Incoming Number ofFrames
72 EONB Outgoing Number of Bytes
73 EONF Outgoing Number ofFrames
74 PDE Packets Dropped Due toError
75 EDFC-G Dropped Green FramesCongestion (LNW70)
76 EDFC-Y Dropped Yellow FramesCongestion (LNW70)
77 EIND-B Incoming Number ofDropped Frames Broadcast(LNW70)
78 EIND-P Incoming Number ofDropped PAUSE Frames(LNW70)
79 EINF-U Incoming Number ofUnicast Frames (LNW70)
80 EINF-M Incoming Number ofMulticast Frames (LNW70)
81 EINF-B Incoming Number ofBroadcast Frames(LNW70)
82 EONF-U Outing Number of UnicastFrames (LNW70)
83 EONF-M Outing Number ofMulticast Frames (LNW70)
84 EONF-B Outing Number ofBroadcast Frames(LNW70)
Performance Monitoring Performance Monitoring Counters
...................................................................................................................................................................................................................................365-315-148R6.1SPIssue 1, October 2007
3-15

Counter PositionNumber
PM Counter Name Description
85 EINC-P Number of FramesReceived from CPU(LNW70)
86 EOCP Number of Frames Trappedto CPU (LNW70)
87 OPT Optical Power Transmit
88 OPR Optical Power Receive
89 LBC Laser Bias Current
90 LBC-P1 Laser Bias Current for LineOA Pump 1
91 LBC-P2 Laser Bias Current for LineOA Pump 2
92 LBC-P3 Laser Bias Current for LineOA Pump 3
93 LBC-P4 Laser Bias Current for LineOA Pump 4
94 LBFC-P1 Laser Backface Current forLine OA Pump 1
95 LBFC-P2 Laser Backface Current forLine OA Pump 2
96 LBC-SU Laser Bias Current - OC-3Supervisory Signal Only
97 TOPR-OL Total Optical Power -Transmit
98 TOPT-OL Total Optical Power -Receive
99 OPTI-OL Optical Power Tilt -Optical Line
100 SPT-C Signal Power Transmit -Channel
101 SPR-C Signal Power Receive -Channel
102 OSNR-C Optical Channel Signal toNoise Ratio
Performance Monitoring Performance Monitoring Counters
...................................................................................................................................................................................................................................
3-16 365-315-148R6.1SPIssue 1, October 2007

Counter PositionNumber
PM Counter Name Description
103 SPR-SU Signal Power Receive -OC-3 Supervisory SignalOnly
104 SPT-SU Signal Power Transmit -OC-3 Supervisory SignalOnly
105 INTWXD Count of invalidtransmission wordsreceived
106 LOS Count of instances ofsignal loss detected
107 LSYNC Count of instances ofsynchronization lossdetected
108 DSPERR Count of disparity errorsreceived
109 RFOVD Count of received overflowframes dropped
110 TFOVD Count of transmit overflowframes dropped
111 TFCRC Count of transmittedframes with CRC errors
112 T10BERR Count of transmitted10B_ERR errors
113 RCORH Count of receivedsingle-bit error correctedGFP header count
114 RCRCH Count of receiveduncorrected multi-bit errorGFP header count
115 RCORF Count of receivedsingle-bit error correctedGFP super-block count
116 ATTEN Optical Attenuation
117 BREFLEC Back Reflection
118 CMBPWR Total Laser Power
Performance Monitoring Performance Monitoring Counters
...................................................................................................................................................................................................................................365-315-148R6.1SPIssue 1, October 2007
3-17

Counter PositionNumber
PM Counter Name Description
119 CORRECT0 Corrected 0s
120 CORRECT1 Corrected 1s
121 CORRECTBIT Corrected Bits
122 CVSection G.709 Section CodeViolations
123 CVL Code Violations (Line)
124 EDFAG Amplifier Gain
125 EDFAIP Amplifier Input Power
126 EDFALBC Amplifier Laser BiasCurrent
127 EDFALP Amplifier Total Power
128 EDFALT Amplifier LaserTemperature
129 EDFAOP Amplifier Output Power
130 ESSection G.709 Section ErroredSeconds
131 ESL Errored Seconds (Line)
132 LBC1310 Laser Bias Current (1310)
133 LBCOSC Laser Bias Current (Super)
134 LBCA Laser Bias Current A
135 LBCB Laser Bias Current B
136 LMC LMC
137 LPA Laser Power A
138 LPB Laser Power B
139 LT Laser Temperature
140 LTA Laser Temperature A
141 LTB Laser Temperature B
142 LT1310 Laser Temperature (1310)
143 OLP Optical Laser Power
144 OPR1310 Optical Power Received(1310)
Performance Monitoring Performance Monitoring Counters
...................................................................................................................................................................................................................................
3-18 365-315-148R6.1SPIssue 1, October 2007

Counter PositionNumber
PM Counter Name Description
145 OPT1310 Optical Power Transmitted(1310)
146 OPTOSC Optical Power Transmitted(Super)
147 PROT Protocol Violations
148 PROTE Protocol Violations(Egress)
149 PUMPDIFF Raman Pump Differences
150 SEFSSection Severely Errored FrameSeconds (G.709 Section)
151 SEFS_L Severely Errored FrameSeconds (Line)
152 SESSection Severely Errored Seconds(G.709 Section)
153 SES_L Severely Errored Seconds(Line)
154 VALIDBYTES Valid Bytes
155 VALIDE Valid Bytes (Egress)
156 VALIDFRAMES Valid Frames
157 LALIDFRAMESE Valid Frames (Egress)
158 RAMOP Raman Optical Power
159 NCRCERR Number of CRC ErroredFrames Received
160 NDFR Number of Device Frames
161 NFR Number of Frames
162 NLENERR Number of Length ErrorsDetected
163 NLFR Number of Link Frames
164 NROCT Number of Octets (Bytes)
165 NSEQERR Number of Sequence ErrorsDetected
166 PKTS PKTS
167 PKTS1023 PKTS 1023
Performance Monitoring Performance Monitoring Counters
...................................................................................................................................................................................................................................365-315-148R6.1SPIssue 1, October 2007
3-19
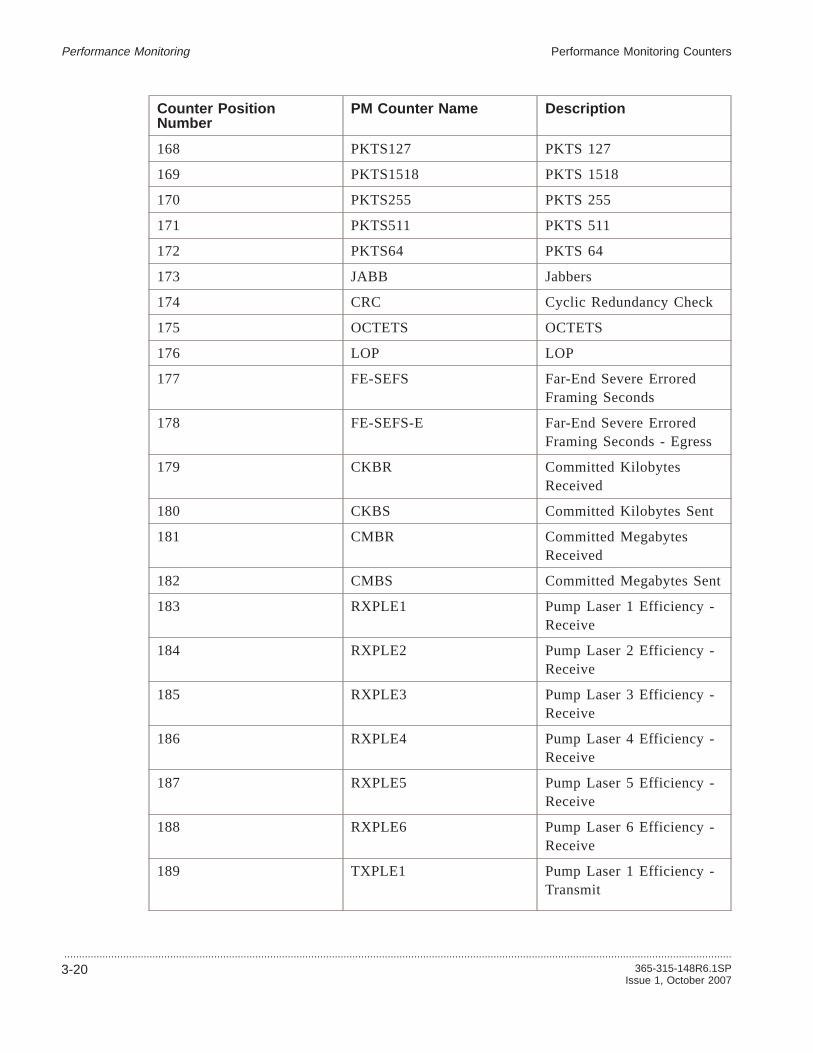
Counter PositionNumber
PM Counter Name Description
168 PKTS127 PKTS 127
169 PKTS1518 PKTS 1518
170 PKTS255 PKTS 255
171 PKTS511 PKTS 511
172 PKTS64 PKTS 64
173 JABB Jabbers
174 CRC Cyclic Redundancy Check
175 OCTETS OCTETS
176 LOP LOP
177 FE-SEFS Far-End Severe ErroredFraming Seconds
178 FE-SEFS-E Far-End Severe ErroredFraming Seconds - Egress
179 CKBR Committed KilobytesReceived
180 CKBS Committed Kilobytes Sent
181 CMBR Committed MegabytesReceived
182 CMBS Committed Megabytes Sent
183 RXPLE1 Pump Laser 1 Efficiency -Receive
184 RXPLE2 Pump Laser 2 Efficiency -Receive
185 RXPLE3 Pump Laser 3 Efficiency -Receive
186 RXPLE4 Pump Laser 4 Efficiency -Receive
187 RXPLE5 Pump Laser 5 Efficiency -Receive
188 RXPLE6 Pump Laser 6 Efficiency -Receive
189 TXPLE1 Pump Laser 1 Efficiency -Transmit
Performance Monitoring Performance Monitoring Counters
...................................................................................................................................................................................................................................
3-20 365-315-148R6.1SPIssue 1, October 2007

Counter PositionNumber
PM Counter Name Description
190 TXPLE2 Pump Laser 2 Efficiency -Transmit
191 TXPLE3 Pump Laser 3 Efficiency -Transmit
192 TXPLE4 Pump Laser 4 Efficiency -Transmit
193 TXPLE5 Pump Laser 5 Efficiency -Transmit
194 TXPLE6 Pump Laser 6 Efficiency -Transmit
195 BBEADD Background Block Errors -Add Direction
196 BBEDROP Background Block Errors -Drop Direction
197 CVADD Code Violations - AddDirection
198 CVDROP Code Violations - DropDirection
199 ESADD Errored Seconds - AddDirection
200 ESDROP Errored Seconds - DropDirection
201 SEFSADD Severely Errored FrameSeconds - Add
202 SEFSDROP Severely Errored FrameSeconds - Drop
203 SESADD Severely Errored Seconds -Add
204 SESDROP Severely Errored Seconds -Drop
205 UASSADD Unavailable Seconds - Add
206 UASSDROP Unavailable Seconds -Drop
207 BES Bursty Errored Seconds
208 OPT-LBIAS Laser Bias Current
Performance Monitoring Performance Monitoring Counters
...................................................................................................................................................................................................................................365-315-148R6.1SPIssue 1, October 2007
3-21
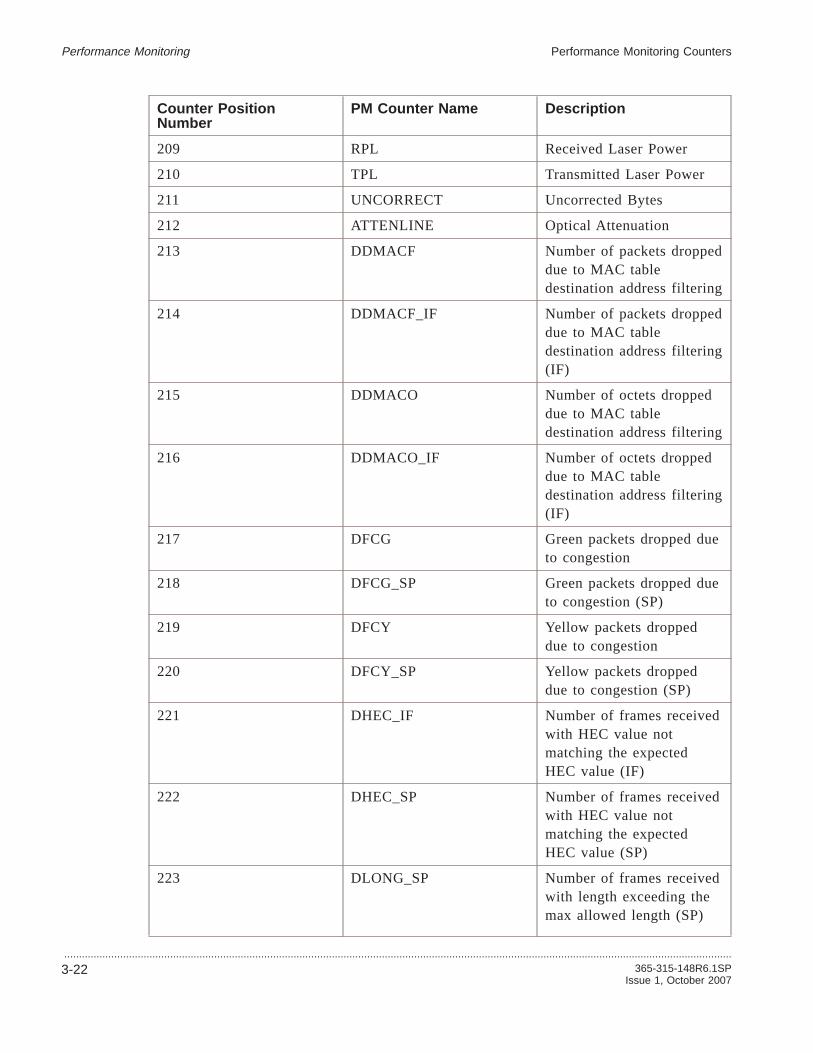
Counter PositionNumber
PM Counter Name Description
209 RPL Received Laser Power
210 TPL Transmitted Laser Power
211 UNCORRECT Uncorrected Bytes
212 ATTENLINE Optical Attenuation
213 DDMACF Number of packets droppeddue to MAC tabledestination address filtering
214 DDMACF_IF Number of packets droppeddue to MAC tabledestination address filtering(IF)
215 DDMACO Number of octets droppeddue to MAC tabledestination address filtering
216 DDMACO_IF Number of octets droppeddue to MAC tabledestination address filtering(IF)
217 DFCG Green packets dropped dueto congestion
218 DFCG_SP Green packets dropped dueto congestion (SP)
219 DFCY Yellow packets droppeddue to congestion
220 DFCY_SP Yellow packets droppeddue to congestion (SP)
221 DHEC_IF Number of frames receivedwith HEC value notmatching the expectedHEC value (IF)
222 DHEC_SP Number of frames receivedwith HEC value notmatching the expectedHEC value (SP)
223 DLONG_SP Number of frames receivedwith length exceeding themax allowed length (SP)
Performance Monitoring Performance Monitoring Counters
...................................................................................................................................................................................................................................
3-22 365-315-148R6.1SPIssue 1, October 2007

Counter PositionNumber
PM Counter Name Description
224 DNOTAGF GF Number of packets droppeddue to no tag whenrequired
225 DNOTAGF_IF Number of packets droppeddue to no tag whenrequired (IF)
226 DPTY_SP Number of frames receivedwith Parity value notmatching the expectedParity value (SP)
227 DRATEF Number of multicast andbroadcast packets droppeddue to exceeding port rate
228 DRATEF_IF Number of multicast andbroadcast packets droppeddue to exceeding port rate(IF)
229 DSA_SP Number of frames receivedwith bad SA (Multicast orBroadcast) (SP)
230 DSCFF_SP Number of SCFF framesreceived with bad FCS orbad parity (SP)
231 DSIZEF Number of packets droppeddue to being greater thanconfigured maximum framesize for port
232 DSIZEF_IF Number of packets droppeddue to being greater thanconfigured maximum framesize for port (IF)
233 DSMACF Number of packets droppeddue to MAC table sourceaddress filtering
234 DSMACF_IF Number of packets droppeddue to MAC table sourceaddress filtering (IF)
Performance Monitoring Performance Monitoring Counters
...................................................................................................................................................................................................................................365-315-148R6.1SPIssue 1, October 2007
3-23

Counter PositionNumber
PM Counter Name Description
235 DSMACO Number of octets droppeddue to MAC table sourceaddress filtering
236 DSMACO_IF Number of octets droppeddue to MAC table sourceaddress filtering (IF)
237 DSPIF Number of packets droppeddue to internal error
238 DSPIF_IF Number of packets droppeddue to internal error (SPI4)(IF)
239 DSS_SP Number of frames receivedsourced by this station andthen received by thisstation (SP)
240 DTAGF Number of packets droppeddue to VLAN filtering
241 DTAGF_IF Number of packets droppeddue to VLAN filtering (IF)
242 EBBCZCS Congestion on the outgoingdata stream
243 EFCRC Count of frames receivedwith Ethernet CRC errors
244 EIBFCS Congestion on theincoming data stream
245 EINBC The number of octets orbytes after compression
246 EONBC The number of octets orbytes before expansion thathave been received fromSONET
247 GFPFCS Count of dropped GFPframes received with FCSerrors
248 IATDF_SP Number of AttributeDiscovery (ATD) frametypes received (SP)
Performance Monitoring Performance Monitoring Counters
...................................................................................................................................................................................................................................
3-24 365-315-148R6.1SPIssue 1, October 2007

Counter PositionNumber
PM Counter Name Description
249 ICPUF Number of packetsreceived and sent to theCPU
250 ICPUF_IF Number of packetsreceived and sent to theCPU (IF)
251 ICRCF_SP Number of checksumframes received (SP)
252 ICTRF_SP Number of control framesreceived (SP)
253 IECHOF_SP Number of echo framesreceived. (OAM) (SP)
254 IFLSHF_SP Number of flush framesreceived. (OAM) (SP)
255 IMCAF Number of Class Amulticast frames receivedwith no error
256 IMCAF_IF Number of Class Amulticast frames receivedwith no error (IF)
257 IMCAF_SP Number of Class Amulticast frames receivedwith no error (SP)
258 IMCAO Number of Class Amulticast octets receivedwith no error
259 IMCAO_IF Number of Class Amulticast octets receivedwith no error (IF)
260 IMCAO_SP Number of Class Amulticast octets receivedwith no error (SP)
261 IMCAREDF Number of Multicastpackets assigned to Class Aand given drop precedenceof red
Performance Monitoring Performance Monitoring Counters
...................................................................................................................................................................................................................................365-315-148R6.1SPIssue 1, October 2007
3-25

Counter PositionNumber
PM Counter Name Description
262 IMCAREDO Number of Multicast octetsassigned to Class A andgiven drop precedence ofred
263 IMCBEF Number of Class Bmulticast frames receivedbelow EIR with no error
264 264 IMCBEF_IF Number of Class Bmulticast frames receivedbelow EIR with no error(IF)
265 IMCBEF_SP Number of Class Bmulticast frames receivedbelow EIR with no error(SP)
266 IMCBEO Number of Class Bmulticast octets receivedbelow EIR with no error
267 IMCBEO_IF Number of Class Bmulticast octets receivedbelow EIR with no error(IF)
268 IMCBEO_SP Number of Class Bmulticast octets receivedbelow EIR with no error(SP)
269 IMCBF Number of Class Bmulticast frames receivedbelow CIR with no error
270 IMCBF_IF Number of Class Bmulticast frames receivedbelow CIR with no error(IF)
271 IMCBF_SP Number of Class Bmulticast frames receivedbelow CIR with no error(SP)
Performance Monitoring Performance Monitoring Counters
...................................................................................................................................................................................................................................
3-26 365-315-148R6.1SPIssue 1, October 2007

Counter PositionNumber
PM Counter Name Description
272 IMCBO Number of Class Bmulticast octets receivedbelow CIR with no error
273 IMCBO_IF Number of Class Bmulticast octets receivedbelow CIR with no error(IF)
274 IMCBO_SP Number of Class Bmulticast octets receivedbelow CIR with no error(SP)
275 IMCBREDF Number of Multicastpackets assigned to Class Band given drop precedenceof red
276 IMCBREDO Number of Multicast octetsassigned to Class B andgiven drop precedence ofred
277 IMCCF Number of Class Cmulticast frames receivedwith no error
278 IMCCF_IF Number of Class Cmulticast frames receivedwith no error (IF)
279 IMCCF_SP Number of Class Cmulticast frames receivedwith no error (SP)
280 IMCCO Number of Class Cmulticast octets receivedwith no error
281 IMCCO_IF Number of Class Cmulticast octets receivedwith no error (IF)
282 IMCCO_SP Number of Class Cmulticast octets receivedwith no error (SP)
Performance Monitoring Performance Monitoring Counters
...................................................................................................................................................................................................................................365-315-148R6.1SPIssue 1, October 2007
3-27

Counter PositionNumber
PM Counter Name Description
283 IMCCREDF Number of Multicastpackets assigned to Class Cand given drop precedenceof red
284 IMCCREDO Number of Multicast octetsassigned to Class C andgiven drop precedence ofred
285 IORGF_SP Number of organizationalframes received. (OAM)(SP)
286 ITPF_SP Number of Topology andProtection (TP) framesreceived (SP)
287 ITTLF_SP Number of frames receivedwith expired TTL (SP)
288 IUCAF IUCAF Number of Class Aunicast frames receivedwith no error
289 IUCAF_IF Number of Class A unicastframes received with noerror (IF)
290 IUCAF_SP Number of Class A unicastframes received with noerror (SP)
291 IUCAO Number of Class A unicastoctets received with noerror
292 IUCAO_IF Number of Class A unicastoctets received with noerror (IF)
293 IUCAO_SP Number of Class A unicastoctets received with noerror (SP)
294 IUCAREDF Number of Unicast packetsassigned to Class A andgiven drop precedence ofred
Performance Monitoring Performance Monitoring Counters
...................................................................................................................................................................................................................................
3-28 365-315-148R6.1SPIssue 1, October 2007
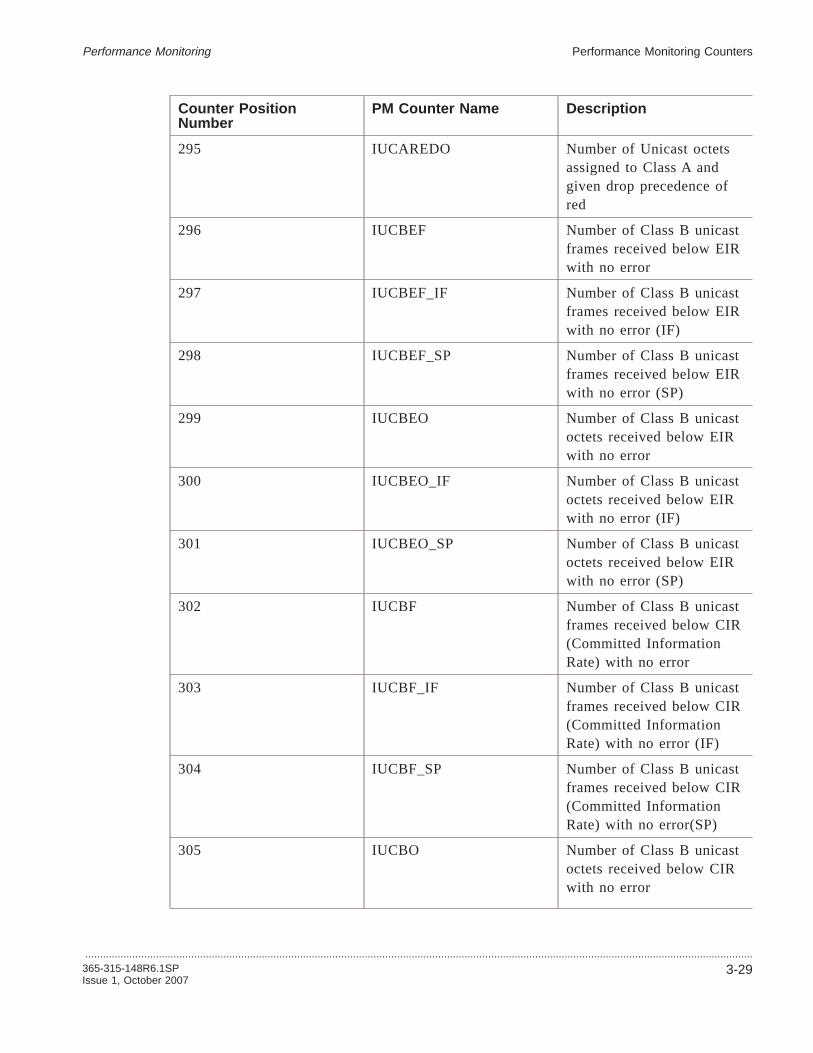
Counter PositionNumber
PM Counter Name Description
295 IUCAREDO Number of Unicast octetsassigned to Class A andgiven drop precedence ofred
296 IUCBEF Number of Class B unicastframes received below EIRwith no error
297 IUCBEF_IF Number of Class B unicastframes received below EIRwith no error (IF)
298 IUCBEF_SP Number of Class B unicastframes received below EIRwith no error (SP)
299 IUCBEO Number of Class B unicastoctets received below EIRwith no error
300 IUCBEO_IF Number of Class B unicastoctets received below EIRwith no error (IF)
301 IUCBEO_SP Number of Class B unicastoctets received below EIRwith no error (SP)
302 IUCBF Number of Class B unicastframes received below CIR(Committed InformationRate) with no error
303 IUCBF_IF Number of Class B unicastframes received below CIR(Committed InformationRate) with no error (IF)
304 IUCBF_SP Number of Class B unicastframes received below CIR(Committed InformationRate) with no error(SP)
305 IUCBO Number of Class B unicastoctets received below CIRwith no error
Performance Monitoring Performance Monitoring Counters
...................................................................................................................................................................................................................................365-315-148R6.1SPIssue 1, October 2007
3-29

Counter PositionNumber
PM Counter Name Description
306 IUCBO_IF Number of Class B unicastoctets received below CIRwith no error (IF)
307 IUCBO_SP Number of Class B unicastoctets received below CIRwith no error (SP)
308 IUCBREDF Number of Unicast packetsassigned to Class B andgiven drop precedence ofred
309 IUCBREDO Number of Unicast octetsassigned to Class B andgiven drop precedence ofred
310 IUCCF Number of Class C unicastframes received with noerror
311 IUCCF_IF Number of Class C unicastframes received with noerror (IF)
312 IUCCF_SP Number of Class C unicastframes received with noerror (SP)
313 IUCCO Number of Class C unicastoctets received with noerror
314 IUCCO_IF Number of Class C unicastoctets received with noerror (IF)
315 IUCCO_SP Number of Class C unicastoctets received with noerror (SP)
316 IUCCREDF Number of Unicast packetsassigned to Class C andgiven drop precedence ofred
Performance Monitoring Performance Monitoring Counters
...................................................................................................................................................................................................................................
3-30 365-315-148R6.1SPIssue 1, October 2007

Counter PositionNumber
PM Counter Name Description
317 IUCCREDO Number of Unicast octetsassigned to Class C andgiven drop precedence ofred
318 OATDF_SP Number of ATD framestransmitted (SP)
319 OCPUF Packets originating fromCPU (management queue)
320 OCPUF_IF Packets originating fromCPU (management queue)(IF)
321 OCRCF_SP Number of checksumframes transmitted (SP)
322 OCTRLF_SP Number of control framestransmitted (SP)
323 OECHOF_SP Number of echo framestransmitted. (OAM) (SP)
324 OFLSHF_SP Number of flush framestransmitted. (OAM) (SP)
325 OMCAF Number of Class Amulticast framestransmitted with no error
326 OMCAF_IF Number of Class Amulticast framestransmitted with no error(IF)
327 OMCAF_SP Number of Class Amulticast framestransmitted with no error(SP)
328 OMCAO Number of Class Amulticast octets transmittedwith no error
329 OMCAO_IF Number of Class Amulticast octets transmittedwith no error (IF)
Performance Monitoring Performance Monitoring Counters
...................................................................................................................................................................................................................................365-315-148R6.1SPIssue 1, October 2007
3-31
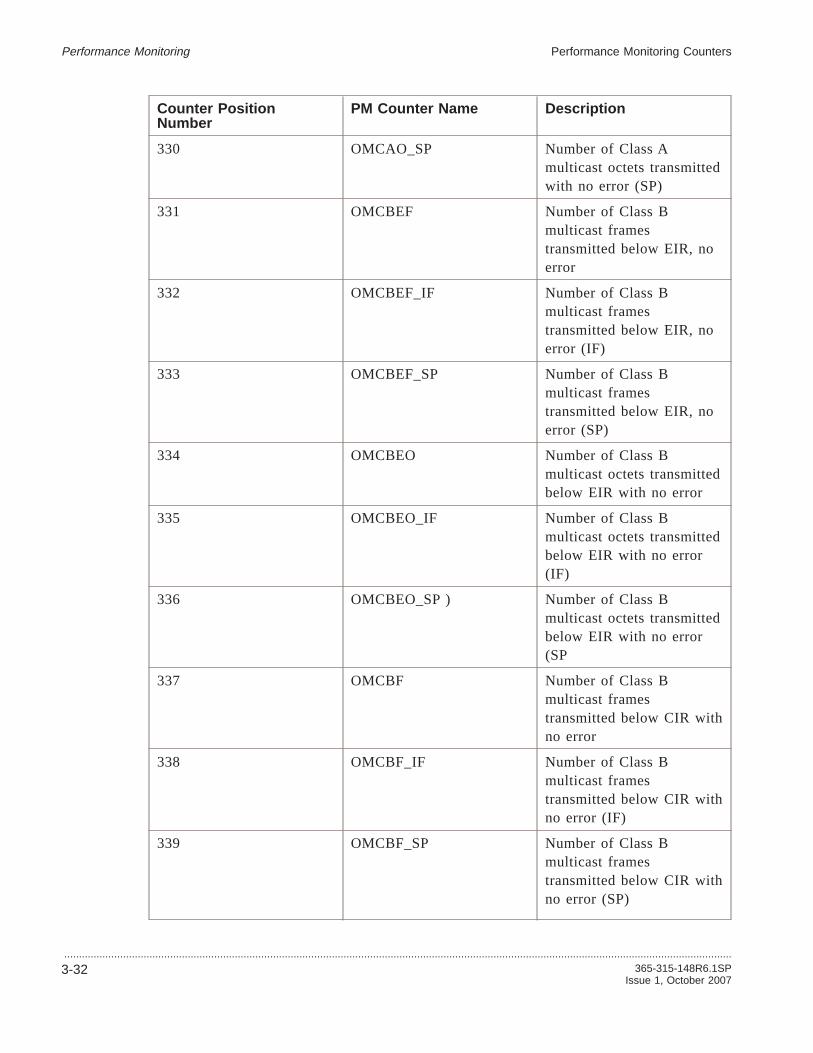
Counter PositionNumber
PM Counter Name Description
330 OMCAO_SP Number of Class Amulticast octets transmittedwith no error (SP)
331 OMCBEF Number of Class Bmulticast framestransmitted below EIR, noerror
332 OMCBEF_IF Number of Class Bmulticast framestransmitted below EIR, noerror (IF)
333 OMCBEF_SP Number of Class Bmulticast framestransmitted below EIR, noerror (SP)
334 OMCBEO Number of Class Bmulticast octets transmittedbelow EIR with no error
335 OMCBEO_IF Number of Class Bmulticast octets transmittedbelow EIR with no error(IF)
336 OMCBEO_SP ) Number of Class Bmulticast octets transmittedbelow EIR with no error(SP
337 OMCBF Number of Class Bmulticast framestransmitted below CIR withno error
338 OMCBF_IF Number of Class Bmulticast framestransmitted below CIR withno error (IF)
339 OMCBF_SP Number of Class Bmulticast framestransmitted below CIR withno error (SP)
Performance Monitoring Performance Monitoring Counters
...................................................................................................................................................................................................................................
3-32 365-315-148R6.1SPIssue 1, October 2007

Counter PositionNumber
PM Counter Name Description
340 OMCBO Number of Class Bmulticast octets transmittedbelow CIR with no error
341 OMCBO_IF Number of Class Bmulticast octets transmittedbelow CIR with no error(IF)
342 OMCBO_SP Number of Class Bmulticast octets transmittedbelow CIR with no error(SP)
343 OMCCF Number of Class Cmulticast framestransmitted with no error
344 OMCCF_IF Number of Class Cmulticast framestransmitted with no error(IF)
345 OMCCF_SP Number of Class Cmulticast framestransmitted with no error(SP)
346 OMCCO Number of Class Cmulticast octets transmittedwith no error
347 OMCCO_IF Number of Class Cmulticast octets transmittedwith no error (IF)
348 OMCCO_SP Number of Class Cmulticast octets transmittedwith no error (SP)
349 OORGF_SP Number of organizationalframes transmitted.
350 OTPF_SP Number of TP framestransmitted (SP)
351 OUCAF Number of Class A unicastframes transmitted with noerror
Performance Monitoring Performance Monitoring Counters
...................................................................................................................................................................................................................................365-315-148R6.1SPIssue 1, October 2007
3-33

Counter PositionNumber
PM Counter Name Description
352 OUCAF_IF Number of Class A unicastframes transmitted with noerror (IF)
353 OUCAF_SP Number of Class A unicastframes transmitted with noerror (SP)
354 OUCAO Number of Class A unicastoctets transmitted with noerror
355 OUCAO_IF Number of Class A unicastoctets transmitted with noerror (IF)
356 OUCAO_SP Number of Class A unicastoctets transmitted with noerror (SP)
357 OUCBEF Number of Class B unicastframes transmitted belowEIR with no error
358 OUCBEF_IF Number of Class B unicastframes transmitted belowEIR with no error (IF)
359 OUCBEF_SP Number of Class B unicastframes transmitted belowEIR with no error(SP)
360 OUCBEO Number of Class B unicastoctets transmitted belowEIR with no error
361 OUCBEO_IF Number of Class B unicastoctets transmitted belowEIR with no error (IF)
362 OUCBEO_SP Number of Class B unicastoctets transmitted belowEIR with no error (SP)
363 OUCBF Number of Class B unicastframes transmitted belowCIR with no error
Performance Monitoring Performance Monitoring Counters
...................................................................................................................................................................................................................................
3-34 365-315-148R6.1SPIssue 1, October 2007

Counter PositionNumber
PM Counter Name Description
364 OUCBF_IF Number of Class B unicastframes transmitted belowCIR with no error (IF)
365 OUCBF_SP Number of Class B unicastframes transmitted belowCIR with no error (SP)
366 OUCBO Number of Class B unicastoctets transmitted belowCIR with no error
367 OUCBO_IF Number of Class B unicastoctets transmitted belowCIR with no error (IF)
368 OUCBO_SP Number of Class B unicastoctets transmitted belowCIR with no error (SP)
369 OUCCF OUCCF Number of ClassC unicast framestransmitted with no errorPMP_OUCCF
370 OUCCF_IF Number of Class C unicastframes transmitted with noerror (IF)
371 OUCCF_SP Number of Class C unicastframes transmitted with noerror (SP)
372 OUCCO Number of Class C unicastoctets transmitted with noerror
373 OUCCO_IF Number of Class C unicastoctets transmitted with noerror (IF)
374 OUCCO_SP Number of Class C unicastoctets transmitted with noerror (SP)
375 PPJ Positive PointerJustification Events
Performance Monitoring Performance Monitoring Counters
...................................................................................................................................................................................................................................365-315-148R6.1SPIssue 1, October 2007
3-35

Counter PositionNumber
PM Counter Name Description
376 NPJ Negative PointerJustification Events
377 QIB-G Incoming Bytes less thanor equal to CIR and CBS
378 QIB-R QIB-R Incoming Bytes lessthan or equal to PIR andEBS and greater then CIRor CBS
379 QIB-Y Incoming Bytes greaterthan CIR or CBS
380 QIP-G Incoming Packets less thanor equal to CIR and CBS
381 QIP-R Incoming Packets less thanor equal to PIR and EBSand greater then CIR orCBS
382 QIP-Y Incoming Packets greaterthan CIR or CBS
383 QOB-0 Outgoing bytes less than orequal to CIR
384 QOB-1 Outgoing bytes less than orequal to PIR and greaterthan CIR
385 QOB-T Outgoing bytes - Total forservice
386 QOP-T Outgoing packets - Totalfor service
387 QPD-A Packet Delay (average)
388 QPD-L Packet Delay (lost probepackets)
389 QPD-V Packet Delay (variance)
390 CV_P Code Violations - Path
391 CV_TCM1 Code Violations - TCM1
392 CV_TCM2 Code Violations - TCM2
393 CV_TCM3 Code Violations - TCM3
Performance Monitoring Performance Monitoring Counters
...................................................................................................................................................................................................................................
3-36 365-315-148R6.1SPIssue 1, October 2007

Counter PositionNumber
PM Counter Name Description
394 CV_TCM4 Code Violations - TCM4
395 CV_TCM5 Code Violations - TCM5
396 CV_TCM6 Code Violations - TCM6
397 ES_P Errored Seconds - Path
398 ES_TCM1 Errored Seconds - TCM1
399 ES_TCM2 Errored Seconds - TCM2
400 ES_TCM3 Errored Seconds - TCM3
401 ES_TCM4 Errored Seconds - TCM4
402 ES_TCM5 Errored Seconds - TCM5
403 ES_TCM6 Errored Seconds - TCM6
404 EXT_P Extension - Path
405 NFR_OUT Number of valid framestransmitted
406 NFRERR_OUT Number of erroredoutbound frames
407 NROCT_OUT Number of outgoing octets
408 NFRERR_IN Number of errrored framesreceived
409 EXT_TCM5 Extension - TCM5
410 EXT_TCM6 Extension - TCM6
411 FC_P Frame Slip Counts - Path
412 FC_TCM1 Frame Slip Counts - TCM1
413 FC_TCM2 Frame Slip Counts - TCM2
414 FC_TCM3 Frame Slip Counts - TCM3
415 FC_TCM4 Frame Slip Counts - TCM4
416 FC_TCM5 Frame Slip Counts - TCM5
417 FC_TCM6 Frame Slip Counts - TCM6
418 SES_P Severely Errored Seconds -Path
419 SES_TCM1 Severely Errored Seconds -TCM1
Performance Monitoring Performance Monitoring Counters
...................................................................................................................................................................................................................................365-315-148R6.1SPIssue 1, October 2007
3-37

Counter PositionNumber
PM Counter Name Description
420 SES_TCM2 Severely Errored Seconds -TCM2
421 SES_TCM3 Severely Errored Seconds -TCM3
422 SES_TCM4 Severely Errored Seconds -TCM4
423 SES_TCM5 Severely Errored Seconds -TCM5
424 SES_TCM6 Severely Errored Seconds -TCM6
425 UAS_P Unavailable Seconds - Path
426 UAS_TCM1 Unavailable Seconds -TCM1
427 UAS_TCM2 Unavailable Seconds -TCM2
428 UAS_TCM3 Unavailable Seconds -TCM3
429 UAS_TCM4 Unavailable Seconds -TCM4
430 UAS_TCM5 Unavailable Seconds -TCM5
431 UAS_TCM6 Unavailable Seconds -TCM6
432 BBER_ADD Background Block ErrorsRatio - Add
433 BBER_DROP Background Block ErrorsRatio - Drop
434 ESR_ADD Errored Seconds Ratio -Add
435 ESR_DROP Errored Seconds Ratio -Drop
436 SESR_ADD Severely Errored SecondsRatio - Add
437 SESR_DROP Severely Errored SecondsRatio - Drop
Performance Monitoring Performance Monitoring Counters
...................................................................................................................................................................................................................................
3-38 365-315-148R6.1SPIssue 1, October 2007

Counter PositionNumber
PM Counter Name Description
438 LOSS_ADD Loss of Signal Seconds -Add
439 LOSS_DROP Loss of Signal Seconds -Drop
440 NFRERR Number of ErroredReceived
441 NOCT Number of Link Frames
442 NE-OFS Out of Frame Seconds
443 BPR Broadcast frames/packetsreceived
444 BPS Broadcast frames/packetssent
445 NE-BSYE Near-End Errored symbolsnot occurring as part of aSeverely Errored Second
446 FE-BSYE Far-End Errored symbolsnot occurring as part of aSeverely Errored Second
447 EDBC-G0 Ethernet dropped bytes dueto congestion of greencolored frames with trafficclass 0 at the egress side ofa lanCTP/wanCTP
448 EDBC-G1 Ethernet dropped bytes dueto congestion of greencolored frames with trafficclass 1 at the egress side ofa lanCTP/wanCTP
449 EDBC-G2 Ethernet dropped bytes dueto congestion of greencolored frames with trafficclass 2 at the egress side ofa lanCTP/wanCTP
Performance Monitoring Performance Monitoring Counters
...................................................................................................................................................................................................................................365-315-148R6.1SPIssue 1, October 2007
3-39
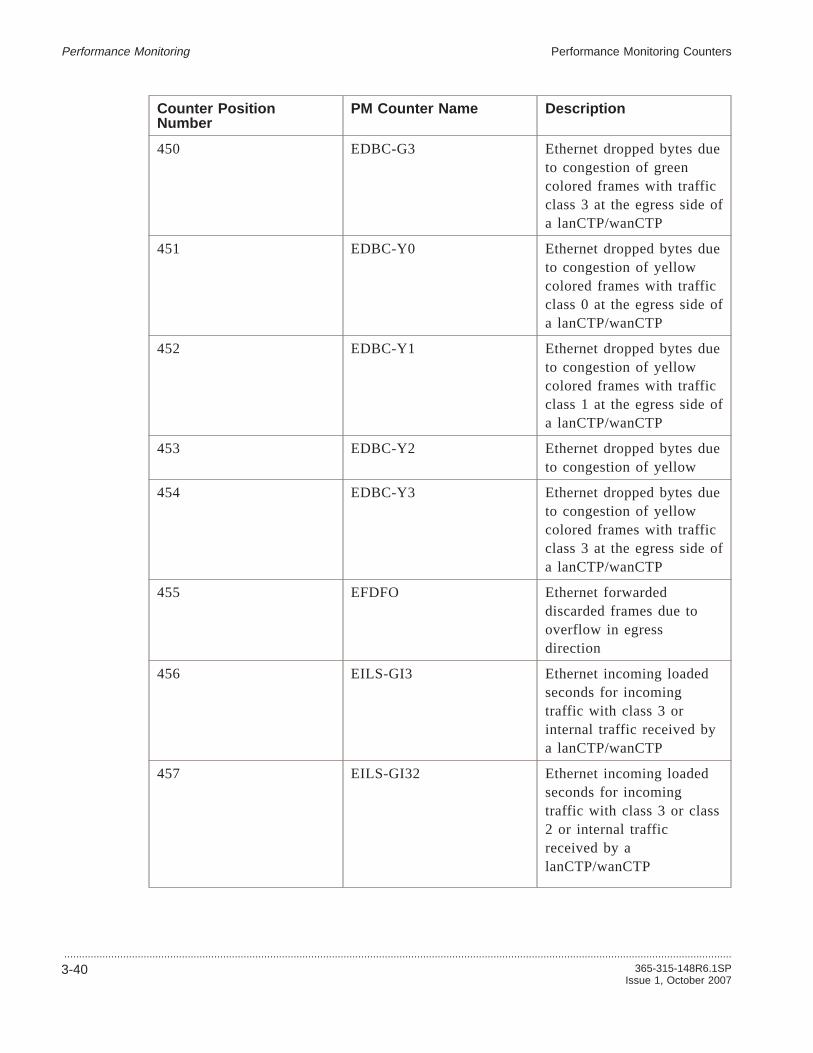
Counter PositionNumber
PM Counter Name Description
450 EDBC-G3 Ethernet dropped bytes dueto congestion of greencolored frames with trafficclass 3 at the egress side ofa lanCTP/wanCTP
451 EDBC-Y0 Ethernet dropped bytes dueto congestion of yellowcolored frames with trafficclass 0 at the egress side ofa lanCTP/wanCTP
452 EDBC-Y1 Ethernet dropped bytes dueto congestion of yellowcolored frames with trafficclass 1 at the egress side ofa lanCTP/wanCTP
453 EDBC-Y2 Ethernet dropped bytes dueto congestion of yellow
454 EDBC-Y3 Ethernet dropped bytes dueto congestion of yellowcolored frames with trafficclass 3 at the egress side ofa lanCTP/wanCTP
455 EFDFO Ethernet forwardeddiscarded frames due tooverflow in egressdirection
456 EILS-GI3 Ethernet incoming loadedseconds for incomingtraffic with class 3 orinternal traffic received bya lanCTP/wanCTP
457 EILS-GI32 Ethernet incoming loadedseconds for incomingtraffic with class 3 or class2 or internal trafficreceived by alanCTP/wanCTP
Performance Monitoring Performance Monitoring Counters
...................................................................................................................................................................................................................................
3-40 365-315-148R6.1SPIssue 1, October 2007

Counter PositionNumber
PM Counter Name Description
458 EINB-G0 Ethernet incoming numberof bytes of green coloredframes with traffic class 0received by a lanCTP/wanCTP
459 EINB-G1 Ethernet incoming numberof bytes of green coloredframes with traffic class 1received by a lanCTP/wanCTP
460 EINB-G2 Ethernet incoming numberof bytes of green coloredframes with traffic class 2received by a lanCTP/wanCTP
461 EINB-G3 Ethernet incoming numberof bytes of green coloredframes with traffic class 3received by a lanCTP/wanCTP
462 C3EIN Ethernet incoming numberof bytes of green coloredframes with traffic class 3or internal traffic receivedby a lanCTP/wanCTP
463 C2EIN Ethernet incoming numberof bytes of green coloredframes with traffic class 3or traffic class 2 or internaltraffic received by alanCTP/wanCTP
464 EINB-Y1 Ethernet incoming numberof bytes of yellow coloredframes with traffic class 1received by a lanCTP/wanCTP
Performance Monitoring Performance Monitoring Counters
...................................................................................................................................................................................................................................365-315-148R6.1SPIssue 1, October 2007
3-41

Counter PositionNumber
PM Counter Name Description
465 EINB-Y0 Ethernet incoming numberof bytes of yellow coloredframes with traffic class 0received by a lanCTP/wanCTP
466 EINB-Y2 Ethernet incoming numberof bytes of yellow coloredframes with traffic class 2received by a lanCTP/wanCTP
467 EINB-Y3 Ethernet incoming numberof bytes of yellow coloredframes with traffic class 3received by a lanCTP/wanCTP
468 EINFC Ethernet incoming frameswith collisions
469 EINF-G0 Ethernet incoming numberof frames with green colorand traffic class 0 receivedby a lanCTP/ wanCTP
470 EINF-G1 Ethernet incoming numberof frames with green colorand traffic class 1 receivedby a lanCTP/ wanCTP
471 EINF-G2 Ethernet incoming numberof frames with green colorand traffic class 2 receivedby a lanCTP/ wanCTP
472 EINF-G3 Ethernet incoming numberof frames with green colorand traffic class 3 receivedby a lanCTP/ wanCTP
473 EINFO Ethernet incoming frameswith oversize
474 EINFU Ethernet incoming frameswith undersize
Performance Monitoring Performance Monitoring Counters
...................................................................................................................................................................................................................................
3-42 365-315-148R6.1SPIssue 1, October 2007

Counter PositionNumber
PM Counter Name Description
475 EINF-Y0 Ethernet incoming numberof frames with yellowcolor and traffic class 0received by a lanCTP/wanCTP
476 EINF-Y1 Ethernet incoming numberof frames with yellowcolor and traffic class 1received by a lanCTP/wanCTP
477 EINF-Y2 Ethernet incoming numberof frames with yellowcolor and traffic class 2received by a lanCTP/wanCTP
478 EINF-Y3 Ethernet incoming numberof frames with yellowcolor and traffic class 3received by a lanCTP/wanCTP
479 EISLS-GI3 Ethernet incoming severelyloaded seconds forincoming traffic with class3 or internal trafficreceived by alanCTP/wanCTP
480 EISLS-GI32 Ethernet incoming severelyloaded seconds forincoming traffic with class3 or class 2 or internaltraffic received by alanCTP/wanCTP
481 ENLD Count of ethernet layer1link down
482 EOCS-G2 Ethernet output congestedseconds for outgoing greencolored frames with class 2at the egress side of alanCTP/wanCTP
Performance Monitoring Performance Monitoring Counters
...................................................................................................................................................................................................................................365-315-148R6.1SPIssue 1, October 2007
3-43

Counter PositionNumber
PM Counter Name Description
483 EOCS-G3 Ethernet output congestedseconds for outgoing greencolored frames with class 3at the egress side of alanCTP/wanCTP
484 EOCS-Y2 Ethernet output congestedseconds for outgoing greencolored frames with class 2at the egress side of alanCTP/wanCTP
485 EOCS-Y3 Ethernet output congestedseconds for outgoing greencolored frames with class 3at the egress side of alanCTP/wanCTP
486 EODFT Ethernet discarded framesdue to storage period on
487 EONFC Ethernet outgoing frameswith collisions
488 MPR Multicast frames/packetsreceived
489 MPS Multicast frames/packetssent
490 PCR Frames/packets with CRCError received
491 PPR Pause frames/packetsreceived
492 PPS Pause frames/packets sent
493 QIB-A Total number of Quality ofservice Incoming bytes
494 RTD-A Average Round Trip Delay
495 RTD-M Minimum Round TripDelay
496 RTD-P900 90.0 percentile Round TripDelay
497 RTD-P990 99.0 percentile Round TripDelay
Performance Monitoring Performance Monitoring Counters
...................................................................................................................................................................................................................................
3-44 365-315-148R6.1SPIssue 1, October 2007

Counter PositionNumber
PM Counter Name Description
498 RTD-P999 99.9 percentile Round TripDelay
499 RTDM-S Successful Round TripDelay Measurements
500 RTDM-U Unsuccessful Round TripDelay Measurements
501 RTD-X Maximum Round TripDelay
502 UPR Unicast frames/packetsreceived
503 UPS Unicast frames/packets sent
504 TEMP Temperature out of range
505 NE-FECC-ADD Near-End Forward ErrorCorrection - CorrectableErrors (Add)
506 NE-FECU-ADD Near-End Forward ErrorCorrection - UncorrectableErrors (Add)
Performance Monitoring Performance Monitoring Counters
...................................................................................................................................................................................................................................365-315-148R6.1SPIssue 1, October 2007
3-45

Supported PM Parameters for NEs in the SDH/EthernetEnvironment...................................................................................................................................................................................................................................
AM 1 in the SDH/Ethernet Environment
The supported uni-directional (Uni-Dir) PM parameters for each monitored terminationpoint (TP) of AM 1 follow. Refer to“Summary of supported NEs” (p. 1-6)for thecurrently supported NE release.
VC3TTP Monitored TP (Uni-Dir) supports the following PM parameters: NE-ES, NE-SES,NE-UAS, NE-BBE.
VC4TTP Monitored TP (Uni-Dir) supports the following PM parameters: NE-ES, NE-SES,NE-UAS, and NE-BBE.
VC11TTP Monitored TP (Uni-Dir) supports the following PM parameters: NE-ES,NE-SES, NE-UAS, NE-BBE.
VC12TTP Monitored TP (Uni-Dir) supports the following PM parameters: NE-ES,NE-SES, NE-UAS, NE-BBE.
MS-TTP Monitored TP (Uni-Dir) supports the following PM parameters: NE-ES, NE-SES,NE-UAS, NE-BBE. The supported rate is MS1.
1675 Lambda Unite MultiService Switch (MSS) in the SDH/Ethernet Environment
The supported uni-directional (Uni-Dir) PM parameters for each monitored terminationpoint (TP) of the 1675 Lambda Unite MultiService Switch (MSS) follow. Refer to“Summary of supported NEs” (p. 1-6)for the currently supported NE release.
VC3TTP Monitored TP (Uni-Dir) supports the following PM parameters: NE-ES, NE-SES,NE-UAS, NE-BBE, FE-ES, FE-SES, FE-UAS, and FE-BBE.
VC4TTP Monitored TP (Uni-Dir) supports the following PM parameters: NE-ES, NE-SES,NE-UAS, NE-BBE, FE-ES, FE-SES, FE-UAS, and FE-BBE. (VC /GE1 CP)
VC12CTP Monitored TP (Uni-Dir) supports the following PM parameters: NE-ES,NE-SES, NE-UAS, NE-BBE, NE-UAP, FE-SES, FE-UAS, FE-BBE.
TU3CTP Monitored TP (Uni-Dir) supports the following PM parameters: NE-ES,NE-SES, NE-UAS, NE-BBE, NE-UAP, FE-SES, FE-UAS, FE-BBE, and FE-UAP forR6.1 only.
T3 (DS3 Line) Monitored TP (Uni-Dir) supports the following PM parameters: NE-LOSS,NE-CV, NE-ES, NE-ESA, NE-ESB, NE-SES.
DS3 (DS3 Path) Monitored TP (Uni-Dir) supports the following PM parameters: NE-CV,NE-ES NE-ESA, NE-ESB NE-SES. NE-SEFS NE-SAS. NE-UAS, NE-FC, NE-AISS,FE-CV, FE-ES, FE-ESA, FE-ESB, FE-SES, FE-SAS, FE-UAS, FE-FC, NE-CV-E,
Performance Monitoring
...................................................................................................................................................................................................................................
3-46 365-315-148R6.1SPIssue 1, October 2007

NE-ES-E, NE-ESA-E, NE-ESB-E, NE-SES-E, NE-SEFS-E, NE-SAS-E, NE-UAS-E,NE-FC-E, NE-AISS-E, FE-CV-E, FE-ES-E FE-ESA-E, FE-ESB-E FE-SES-E,FE-SAS-E FE-UAS-E, and FE-FC-E
AU3CTP Monitored TP (Uni-Dir) supports the following PM parameters: NE-ES,NE-SES, NE-UAS, NE-BBE, FE-ES, FE-SES, FE-UAS, and FE-BBE.
AU4-4C CTP (VC4-4C) Monitored TP (Uni-Dir) supports the following PM parameters:NE-ES, NE-SES, NE-UAS, NE-BBE, FE-ES, FE-SES, FE-UAS, FE-BBE, andFE-UAP.
AU4-16C CTP (VC4-16C) Monitored TP (Uni-Dir) supports, NE-ES, NE-SES, NE-UAS,NE-BBE, FE-ES, FE-SES, FE-UAS, and FE-BBE.
AU4-64C CTP (VC4-64C) Monitored TP (Uni-Dir) supports the following PM parameters:NE-ES, NE-SES, NE-UAS, NE-BBE, NE-UAP, FE-ES, FE-SES, FE-UAS, FE-BBE,FE-UAP.
AU4-64C CTP (VC4-64C) Monitored TP (Uni-Dir) supports the following PM parameters:NE-ES, NE-SES, NE-UAS, NE-BBE, NE-UAP, FE-ES, FE-SES, FE-UAS, FE-BBE,FE-UAP.
Ethernet (LAN/WAN/VCG) Monitored TP (Uni-Dir) supports the following PM parameters:CBR, CBS, and PDE (For GBE Card). NE-EINB, NE-EONB, NE-EINF, NE-EONF,NE-EDFE, NE-EDFC (For 1GBE EPL and 10GBE EPL)
DS3 Line T3 (Uni-Dir) supports the following PM parameters: NE-LOSS, NE-CV,NE-ES, NE-ESA, NE-ESB, and NE-SES.
DS3 Path (Uni-Dir) supports the following PM parameters: NE-CV, NE-ES, NE-ESA,NE-ESB, NE-SES, NE-SEFS, NE-SAS, NE-UAS, NE-FC, NE-AISS, FE-CV, FE-ES,FE-ESA, FE-ESB, FE-SES, FE-SAS, FE-UAS, FE-FC. In addition, for egress (-E) thefollowing are supported: NE-CV-E, NE-ES-E, NE-ESA-E, NE-ESB-E, NE-SES-E,NE-SEFS-E, NE-SAS-E, NE-UAS-E, NE-FC-E, NE-AISS-E, FE-CV-E, FE-ES-E,FE-ESA-E, FE-ESB-E, FE-SES-E, FE-SAS-E, FE-UAS-E, and FE-FC-E.
MS-TTP Monitored TP (Uni-Dir) supports the following PM parameters: NE-ES, NE-SES,NE-UAS, NE-BBE, NE-FECC (for STM-64 and STM-256 only), FE-ES, FE-SES,FE-UAS, and FE-BBE. The supported rates are MS1, MS4, MS16, MS64, and MS256.
RS-TTP Monitored TP (Uni-Dir) supports the following PM parameters: NE-ES, NE-SES,NE-UAS, and NE-BBE. The supported rates are RS1, RS4, RS16, RS64, and RS256.
ODU-TTP Monitored TP (Uni-Dir) supports the following PM parameters: NE-ES,NE-SES, NE-UAS, and NE-BBE.
OTN Ports (OMS LR=OS) Monitored TP (Uni-Dir) supports the following PM parameters:NE:LOSS, NE:FEC-EC.
Performance Monitoring Supported PM Parameters for NEs in the SDH/EthernetEnvironment
...................................................................................................................................................................................................................................365-315-148R6.1SPIssue 1, October 2007
3-47

1663 Add Drop Multiplex-universal (ADM-u) in the SDH/Ethernet Environment
The supported uni-directional (Uni-Dir) and bidirectional (Bi-Dir) PM parameters foreach monitored termination point (TP) of the 1663 Add Drop Multiplex-universal(ADM-u) MSS follow. Refer to“Summary of supported NEs” (p. 1-6)for the currentlysupported NE release.
VC12TTP (Uni-Dir) supports the following PM parameters: NE-ES, NE-SES, NE-UAS,and NE-BBE.
VC12TTP (Uni-Dir) supports the following PM parameters: NE-ES, NE-SES, NE-UAS,and NE-BBE.
VC12TTP (Bi-Dir) supports the following PM parameters: NE-ES, NE-SES, NE-BBE,FE-ES, FE-SES, FE-BBE, BI-UAS, and BI-UAP.
VC11TTP (Uni-Dir) supports the following PM parameters: NE-ES, NE-SES, NE-UAS,and NE-BBE.
VC11TTP (Bi-Dir) supports the following PM parameters: NE-ES, NE-SES, NE-BBE,FE-ES, FE-SES, FE-BBE, BI-UAS, and BI-UAP.
VC3TTP Monitored TP (Uni-Dir) supports the following PM parameters: NE-ES, NE-SES,NE-UAS, and NE-BBE.
VC3TTP Monitored TP (Bi-Dir) supports the following PM parameters: NE-ES, NE-SES,NE-BBE, FE-ES, FE-SES, FE-BBE, BI-UAS, and BI-UAP.
VC4TTP Monitored TP (Uni-Dir) supports the following PM parameters: NE-ES, NE-SES,NE-UAS, and NE-BBE.
VC4TTP Monitored TP (Bi-Dir) supports the following PM parameters: NE-ES, NE-SES,NE-BBE, FE-ES, FE-SES, FE-BBE, BI-UAS, and BI-UAP.
TU12CTP Monitored TP (Uni-Dir) supports the following PM parameters: NE-ES,NE-SES, NE-UAS, and NE-BBE.
TU12CTP Monitored TP (Bi-Dir) supports the following PM parameters: FW-ES,FW-SES, FW-BBE, BW-ES, BW-SES, BW-BBE, BI-UAS, and BI-UAP.
TU3CTP Monitored TP (Uni-Dir) supports the following PM parameters: NE-ES,NE-SES, NE-UAS, and NE-BBE.
TU3CTP Monitored TP (Bi-Dir) supports the following PM parameters: FW-ES, FW-SES,FW-BBE, BW-ES, BW-SES, BW-BBE, BI-UAS, and BI-UAP.
AU4CTP Monitored TP (Uni-Dir) supports the following PM parameters: NE-ES,NE-SES, NE-UAS, NE-BBE, NE-PPGE, and NE-NPGE.
AU4CTP Monitored TP (Bi-Dir) supports the following PM parameters: FW-ES, FW-SES,FW-BBE, BW-ES, BW-SES, BW-BBE, BI-UAS, and BI-UAP.
Performance Monitoring Supported PM Parameters for NEs in the SDH/EthernetEnvironment
...................................................................................................................................................................................................................................
3-48 365-315-148R6.1SPIssue 1, October 2007

AU4-4C CTP (VC4-4C) VC-4 (VC4TTP) Monitored TP (Uni-Dir) supports the following PMparameters: NE-ES, NE-SES, NE-UAS, NE-BBE, NE-PPGE, and NE-NPGE.
AU4-4C CTP (VC4-4C) Monitored TP (Bi-Dir) supports the following PM parameters:FW-ES, FW-SES, FW-BBE, BW-ES, BW-SES, BW-BBE, BI-UAS, and BI-UAP.
AU4-16C CTP (VC4-16C) Monitored TP (Uni-Dir) supports the following PM parameters:NE-ES, NE-SES, NE-UAS, NE-BBE, NE-PPGE, and NE-NPGE.
AU4-16C CTP (VC4-16C) Monitored TP (Bi-Dir) supports the following PM parameters:FW-ES, FW-SES, FW-BBE, BW-ES, BW-SES, BW-BBE, BI-UAS, and BI-UAP.
MS-TTP Monitored TP (Uni-Dir) supports the following PM parameters: NE-ES, NE-SES,NE-UAS, NE-BBE, MS1, MS4, MS16, and MS64.
RS-TTP Monitored TP (Uni-Dir) supports the following PM parameters: NE-ES, NE-SES,NE-UAS, and NE-BBE. The supported rates are RS1, RS4, RS16, and RS64.
E1 Path 2Mb (Uni-Dir) supports the following PM parameters: NE-ES, NE-SES,NE-UAS, and NE-BBE. In addition, for Egress (-E), the following are supported:NE-ES-E, NE-SES-E, NE-UAS-E, and NE-BBE-E.
Ethernet (LAN/WAN/VCG) Monitored TP (Uni-Dir) supports the following PM parameters:NE-PDE, NE-CBR, NE-CBS, NE-UPR, NE-UPS, NE-MPR, NE-MPS, NE-BPR,NE-BPS, NE-PCR, NE-PPR, NE-PPS, NE-EINF, NE-EONF, NE-EINCP, NE-EONCP.
LR_Ethernet_CONG) Monitored TP (Uni-Dir) supports the following PM parameters:NE-EDBC-G0, NE-EDBC-Y0, NE-EDBC-G1, NE-EDBC-Y1, NE-EDBC-G2,NE-EDBC-Y2, NE-EDBC-G3, NE-EDBC-Y3, NE-EOCS-G2, NE-EOCS-Y2,NE-EOCS-G3, NE-EOCS-Y3.
LR_Ethernet_HQ Monitored TP (Uni-Dir) supports the following PM parameters:NE-EINB-G0, NE-EINB-Y0, NE-EINB-G1, NE-EINB-Y1, NE-EINF-G0,NE-EINF-Y0, NE-EINF-G1, NE-EINF-Y1.
LR_Ethernet_LQ Monitored TP (Uni-Dir) supports the following PM parameters:NE-EINB-G0, NE-EINB-Y0, NE-EINB-G1, NE-EINB-Y1, NE-EINF-G0,NE-EINF-Y0, NE-EINF-G1, NE-EINF-Y1.
LR_Ethernet_OAM Monitored TP (Uni-Dir) supports the following PM parameters:NE-BSYE, NE-ES, NE-SES, NE-UAS, FE-BSYE, FE-ES, FE-SES, FE-UAS.
LR_Ethernet_RTD Monitored TP (Uni-Dir) supports the following PM parameters:NE-RTD-A, NERTD- M, NE-RTDX, NE-RTD-P900, NE-RTD-P990, NE-RTD-P999,NE-RTDM-S, NERTDM- U.
LR_Ethernet_Service Monitored TP (Uni-Dir) supports the following PM parameters:NE-QIB-A, NE-QIB-G, NEQIB- Y, NE-QIB-R.
Performance Monitoring Supported PM Parameters for NEs in the SDH/EthernetEnvironment
...................................................................................................................................................................................................................................365-315-148R6.1SPIssue 1, October 2007
3-49
1643 Access Multiplexer (AM) in the SDH/Ethernet Environment
The supported uni-directional (Uni-Dir) and bidirectional (Bi-Dir) PM parameters foreach monitored termination point (TP) of the 1643 Access Multiplexer Small (AMS)MSS follow. Refer to“Summary of supported NEs” (p. 1-6)for the currentlysupported NE release.
VC12TTP (Uni-Dir) supports the following PM parameters: NE-ES, NE-SES, NE-UAS,and NE-BBE.
VC12TTP (Bi-Dir) supports the following PM parameters: NE-ES, NE-SES, NE-BBE,FE-ES, FE-SES, FE-BBE, BI-UAS, and BI-UAP.
VC11TTP (Uni-Dir) supports the following PM parameters: NE-ES, NE-SES, NE-UAS,and NE-BBE.
VC11TTP (Bi-Dir) supports the following PM parameters: NE-ES, NE-SES, NE-BBE,FE-ES, FE-SES, FE-BBE, BI-UAS, and BI-UAP.
VC3TTP Monitored TP (Uni-Dir) supports the following PM parameters: NE-ES, NE-SES,NE-UAS, and NE-BBE.
VC3TTP Monitored TP (Bi-Dir) supports the following PM parameters: NE-ES, NE-SES,NE-BBE, FE-ES, FE-SES, FE-BBE, BI-UAS, and BI-UAP.
VC4TTP Monitored TP (Uni-Dir) supports the following PM parameters: NE-ES, NE-SES,NE-UAS, and NE-BBE.
VC4TTP Monitored TP (Bi-Dir) supports the following PM parameters: NE-ES, NE-SES,NE-BBE, FE-ES, FE-SES, FE-BBE, BI-UAS, and BI-UAP.
MS-TTP Monitored TP (Uni-Dir) supports the following PM parameters: NE-ES, NE-SES,NE-UAS, NE-BBE, MS1, and MS4.
Ethernet (LAN/WAN/VCG) Monitored TP (Uni-Dir) supports the following PM parameters:NE-CKBR, NE-CKBS, NE-PDE, NE-CBR, NE-CBS, NE-UPR, NE-UPS, NE-MPR,NE-MPS, NE-BPR, NE-BPS, NE-PCR, NE-EINF, NE-EONF, NE-EONCP, NEPPS,NE-ENLD, NE-EINFO, NE-EINFU, NE-EINFC, NEEONFC, NE-EFDFO, andNEEODFT.
LR_Ethernet_HQ Monitored TP (Uni-Dir) supports the following PM parameters:NE-EINB-G2, NE-EINB-Y2, NE-EINB-G3, NE-EINB-Y3, NE-EINB-GI3,NE-EINBGI32, NE-EINF-G2, NEEINF- Y2, NE-EINF-G3, NEEINF- Y3,NE-EILS-GI3, NEEILS- GI32, NE-EISLS-GI3, and NE-EISLS-GI323.
LR_Ethernet_LQ Monitored TP (Uni-Dir) supports the following PM parameters:NE-EINB-G0, NE-EINB-Y0, NE-EINB-G1, NE-EINB-Y1, NE-EINF-G0,NE-EINF-Y0, NE-EINF-G1, and NE-EINF-Y1.
Performance Monitoring Supported PM Parameters for NEs in the SDH/EthernetEnvironment
...................................................................................................................................................................................................................................
3-50 365-315-148R6.1SPIssue 1, October 2007
LR_Ethernet_RTD Monitored TP (Uni-Dir) supports the following PM parameters:NE-RTD-A, NERTD- M, NE-RTDX, NE-RTD-P900, NE-RTD-P990, NE-RTD-P999,NE-RTDM-S, and NERTDM-U.
LR_Ethernet_Service Monitored TP (Uni-Dir) supports the following PM parameters:NE-QIB-A, NE-QIB-G, NEQIB-Y, and NE-QIB-R.
1643 Access Multiplexer (AMS) in the SDH/Ethernet Environment
The supported uni-directional (Uni-Dir) and bidirectional (Bi-Dir) PM parameters foreach monitored termination point (TP) of the1643 Access Multiplexer Small (AMS)MSS follow. Refer to“Summary of supported NEs” (p. 1-6)for the currentlysupported NE release.
VC12TTP (Uni-Dir) supports the following PM parameters: NE-ES, NE-SES, NE-UAS,and NE-BBE.
VC12TTP (Bi-Dir) supports the following PM parameters: NE-ES, NE-SES, NE-BBE,FE-ES, FE-SES, FE-BBE, BI-UAS, and BI-UAP.
VC11TTP (Uni-Dir) supports the following PM parameters: NE-ES, NE-SES, NE-UAS,and NE-BBE.
VC11TTP (Bi-Dir) supports the following PM parameters: NE-ES, NE-SES, NE-BBE,FE-ES, FE-SES, FE-BBE, BI-UAS, and BI-UAP.
VC3TTP Monitored TP (Uni-Dir) supports the following PM parameters: NE-ES, NE-SES,NE-UAS, and NE-BBE.
VC3TTP Monitored TP (Bi-Dir) supports the following PM parameters: NE-ES, NE-SES,NE-BBE, FE-ES, FE-SES, FE-BBE, BI-UAS, and BI-UAP.
VC4TTP Monitored TP (Uni-Dir) supports the following PM parameters: NE-ES, NE-SES,NE-UAS, and NE-BBE.
VC4TTP Monitored TP (Bi-Dir) supports the following PM parameters: NE-ES, NE-SES,NE-BBE, FE-ES, FE-SES, FE-BBE, BI-UAS, and BI-UAP.
MS-TTP Monitored TP (Uni-Dir) supports the following PM parameters: NE-ES, NE-SES,NE-UAS, NE-BBE, MS1.
Ethernet (LAN/WAN/VCG) Monitored TP (Uni-Dir) supports the following PM parameters:NE-CKBR, NE-CKBS, NE-PDE, NE-CBR, NE-CBS, NE-UPR, NE-UPS, NE-MPR,NE-MPS, NE-BPR, NE-BPS, NE-PCR, NE-EINF, NE-EONF, NE-EONCP, NEPPS,NE-ENLD, NE-EINFO, NE-EINFU, NE-EINFC, NEEONFC, NE-EFDFO, andNEEODFT.
Performance Monitoring Supported PM Parameters for NEs in the SDH/EthernetEnvironment
...................................................................................................................................................................................................................................365-315-148R6.1SPIssue 1, October 2007
3-51
LR_Ethernet_HQ Monitored TP (Uni-Dir) supports the following PM parameters:NE-EINB-G2, NE-EINB-Y2, NE-EINB-G3, NE-EINB-Y3, NE-EINB-GI3,NE-EINBGI32, NE-EINF-G2, NEEINF- Y2, NE-EINF-G3, NEEINF- Y3,NE-EILS-GI3, NEEILS- GI32, NE-EISLS-GI3, and NE-EISLS-GI323.
LR_Ethernet_LQ Monitored TP (Uni-Dir) supports the following PM parameters:NE-EINB-G0, NE-EINB-Y0, NE-EINB-G1, NE-EINB-Y1, NE-EINF-G0,NE-EINF-Y0, NE-EINF-G1, and NE-EINF-Y1.
LR_Ethernet_RTD Monitored TP (Uni-Dir) supports the following PM parameters:NE-RTD-A, NERTD- M, NE-RTDX, NE-RTD-P900, NE-RTD-P990, NE-RTD-P999,NE-RTDM-S, and NERTDM-U.
LR_Ethernet_Service Monitored TP (Uni-Dir) supports the following PM parameters:NE-QIB-A, NE-QIB-G, NEQIB-Y, and NE-QIB-R.
1655 Access Mulltiplexer (AMU) in the SDH/Ethernet Environment
The supported uni-directional (Uni-Dir) and bidirectional (Bi-Dir) PM parameters foreach monitored termination point (TP) of the 1655 Access Mulltiplexer (AMU) follow.Refer to“Summary of supported NEs” (p. 1-6)for the currently supported NE release.
VC11TTP (Uni-Dir) supports the following PM parameters: NE-ES, NE-SES, NE-UAS,and NE-BBE.
VC12TTP Monitored TP (Uni-Dir) supports the following PM parameters: NE-ES,NE-SES, NE-UAS, and NE-BBE.
VC3TTP Monitored TP (Uni-Dir) supports the following PM parameters: NE-ES, NE-SES,NE-UAS, and NE-BBE.
VC4TTP Monitored TP (Uni-Dir) supports the following PM parameters: NE-ES, NE-SES,NE-UAS, and NE-BBE.
AU4CTP Monitored TP (Uni-Dir) supports the following PM parameters: NE-ES,NE-SES, NE-UAS, and NE-BBE.
MS-TTP Monitored TP (Uni-Dir) supports the following PM parameters: NE-ES, NE-SES,NE-UAS, NE-BBE, MS1, MS4, MS16.
Ethernet (LAN/WAN/VCG) Monitored TP (Uni-Dir) supports the following PM parameters:NE-CKBR NE-CKBS, NE-PDE, NE-CBR, NE-CBS, NE-UPR, NE-UPS, NE-MPR,NE-MPS, NE-BPR, NE-BPS, NE-PCR, NE-PPR, NE-PPS, NE-EINF, NE-EONF,NE-EONCP
LR_Ethernet_CONG) Monitored TP (Uni-Dir) supports the following PM parameters:NE-EDBC-G0, NE-EDBC-Y0, NE-EDBC-G1, NE-EDBC-Y1, NE-EDBC-G2,NE-EDBC-Y2, NE-EDBC-G3, NE-EDBC-Y3, NE-EOCS-G2, NE-EOCS-Y2,NE-EOCS-G3, and NE-EOCS-Y3
Performance Monitoring Supported PM Parameters for NEs in the SDH/EthernetEnvironment
...................................................................................................................................................................................................................................
3-52 365-315-148R6.1SPIssue 1, October 2007

LR_Ethernet_HQ Monitored TP (Uni-Dir) supports the following PM parameters:NE-EINB-G2, NE-EINB-Y2, NE-EINB-G3, NE-EINB-Y3, NE-EINB-GI3,NE-EINBGI32, NE-EINF-G2, NEEINF- Y2, NE-EINF-G3, NEEINF- Y3,NE-EILS-GI3, NEEILS- GI32, NE-EISLS-GI3, and NE-EISLS-GI32.
LR_Ethernet_LQ Monitored TP (Uni-Dir) supports the following PM parameters:NE-EINB-G0, NE-EINB-Y0, NE-EINB-G1, NE-EINB-Y1, NE-EINF-G0,NE-EINF-Y0, NE-EINF-G1, and NE-EINF-Y1.
LR_Ethernet_RTD Monitored TP (Uni-Dir) supports the following PM parameters:NE-RTD-A, NERTD- M, NE-RTDX, NE-RTD-P900, NE-RTD-P990, NE-RTD-P999,NE-RTDM-S, and NERTDM-U.
LR_Ethernet_Service Monitored TP (Uni-Dir) supports the following PM parameters:NE-QIB-A, NE-QIB-G, NEQIB-Y, and NE-QIB-R.
E1 Path 2Mb (Uni-Dir) supports the following PM parameters: NE-ES, NE-SES,NE-UAS, and NE-BBE. In addition, for Egress (-E), the following are supported:NE-ES-E, NE-SES-E, NE-UAS-E, NE-BBE-E, and NE-FSC-E.
Performance Monitoring Supported PM Parameters for NEs in the SDH/EthernetEnvironment
...................................................................................................................................................................................................................................365-315-148R6.1SPIssue 1, October 2007
3-53

Supported PM Parameters for NEs in the SONET/EthernetEnvironment...................................................................................................................................................................................................................................
1675 Lambda Unite MultiService Switch (MSS) in the SONET/Ethernet Environment
The supported uni-directional (Uni-Dir) PM parameters for each monitored terminationpoint (TP) of the 1675 Lambda Unite MultiService Switch (MSS) follow. Refer to“Summary of supported NEs” (p. 1-6)for the currently supported NE release.
Section (RSTTP) Monitored TP (Uni-Dir) supports the following PM parameters:NE-LOSS, NE-SEFS, NE-CV, NE-ES, and NE-SES. The supported rates are OC-192,OC-48, OC-12, and OC-3.
Line (MSTTP) Monitored TP (Uni-Dir) supports the following PM parameters: NE-CV,NE-ES, NE-SES, NE-UAS, NE-FC, NE-AISS, NE-FECC (OC-192 only), FE-CV,FE-ES, FE-SES, FE-UAS, and FE-FC. The supported rates are OC-192, OC-48,OC-12, and OC-3.
STS Path Monitored TP (Uni-Dir) supports the following PM parameters: NE-CV,NE-ES, NE-SES, NE-UAS, NE-FC, FE-CV, FE-ES, FE-SES, FE-UAS, and FE-FC.The supported rates are STS-1, STS-3c, STS-12c, STS-48c, and STS-192c.
VT1.5 Path Monitored TP (Uni-Dir) supports the following PM parameters: NE-CV,NE-ES, NE-SES, NE-UAS, NE-FC, FE-CV, FE-ES, FE-SES, FE-UAS, FE-FC,NE-NPDE, NE-PPDE, NE-NPGE, NE-PPGE for R6.1 only.
DS3 Line (T3) Monitored TP (Uni-Dir) supports the following PM parameters: NE-LOSS,NE-CV, NE-ES, NE-ESA, NE-ESB, and NE-SES.
DS3 Path Monitored TP (Uni-Dir) supports the following PM parameters: NE-CV,NE-ES, NE-ESA, NE-ESB, NE-SES, NE-SEFS, NE-SAS, NE-UAS, NE-FC, NE-AISS,FE-CV, FE-ES, FE-ESA, FE-ESB, FE-SES, FE-SAS, FE-UAS, and FE-FC. In addition,for Egress (-E), the following are supported: NE-CV-E, NE-ES-E, NE-ESA-E,NE-ESB-E, NE-SES-E, NE-SEFS-E, NE-SAS-E, NE-UAS-E, NE-FC-E, NE-AISS-E,FE-CV-E, FE-ES-E, FE-ESA-E, FE-ESB-E, FE-SES-E, FE-SAS-E, FE-UAS-E, andFE-FC-E.
Data (LAN/WAN) supports the following PM parameters: NE-CBR, NE-CBS andNE-PDE.
Ethernet (LAN/WAN) Monitored TP (Uni-Dir) supports the following PM parameters:CBR, CBS, and PDE.
Performance Monitoring
...................................................................................................................................................................................................................................
3-54 365-315-148R6.1SPIssue 1, October 2007
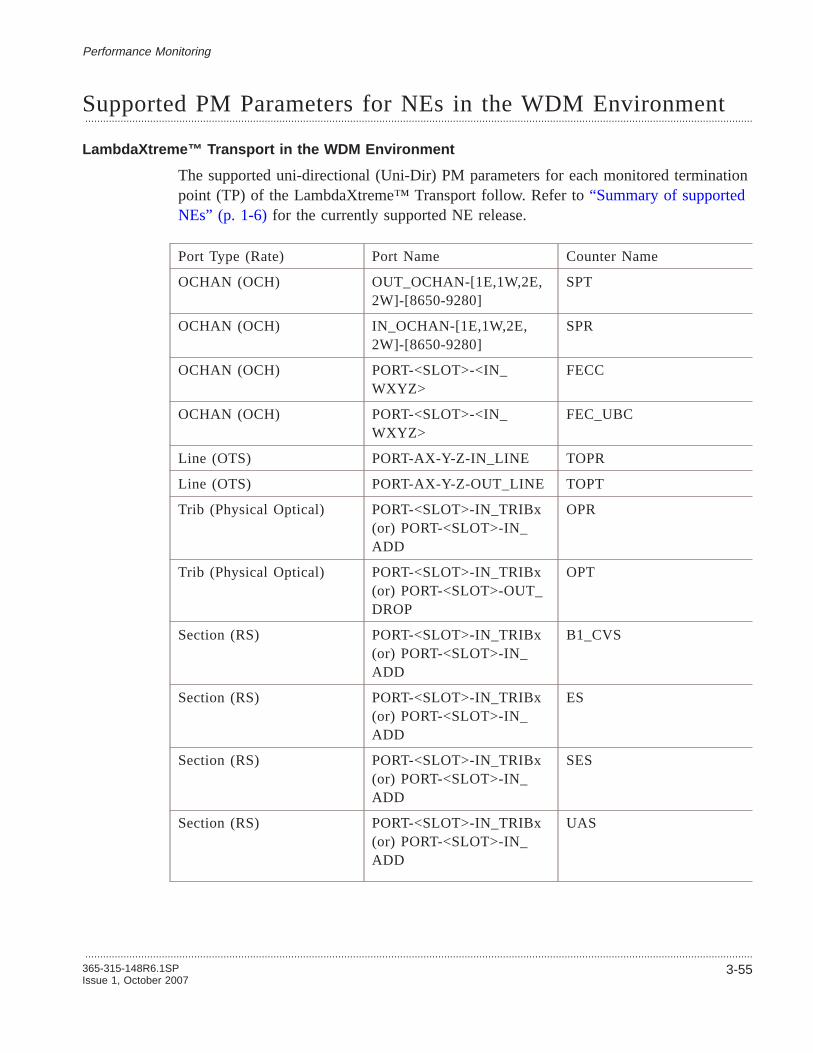
Supported PM Parameters for NEs in the WDM Environment...................................................................................................................................................................................................................................
LambdaXtreme™ Transport in the WDM Environment
The supported uni-directional (Uni-Dir) PM parameters for each monitored terminationpoint (TP) of the LambdaXtreme™ Transport follow. Refer to“Summary of supportedNEs” (p. 1-6)for the currently supported NE release.
Port Type (Rate) Port Name Counter Name
OCHAN (OCH) OUT_OCHAN-[1E,1W,2E,2W]-[8650-9280]
SPT
OCHAN (OCH) IN_OCHAN-[1E,1W,2E,2W]-[8650-9280]
SPR
OCHAN (OCH) PORT-<SLOT>-<IN_WXYZ>
FECC
OCHAN (OCH) PORT-<SLOT>-<IN_WXYZ>
FEC_UBC
Line (OTS) PORT-AX-Y-Z-IN_LINE TOPR
Line (OTS) PORT-AX-Y-Z-OUT_LINE TOPT
Trib (Physical Optical) PORT-<SLOT>-IN_TRIBx(or) PORT-<SLOT>-IN_ADD
OPR
Trib (Physical Optical) PORT-<SLOT>-IN_TRIBx(or) PORT-<SLOT>-OUT_DROP
OPT
Section (RS) PORT-<SLOT>-IN_TRIBx(or) PORT-<SLOT>-IN_ADD
B1_CVS
Section (RS) PORT-<SLOT>-IN_TRIBx(or) PORT-<SLOT>-IN_ADD
ES
Section (RS) PORT-<SLOT>-IN_TRIBx(or) PORT-<SLOT>-IN_ADD
SES
Section (RS) PORT-<SLOT>-IN_TRIBx(or) PORT-<SLOT>-IN_ADD
UAS
Performance Monitoring
...................................................................................................................................................................................................................................365-315-148R6.1SPIssue 1, October 2007
3-55

Section (RS) PORT-<SLOT>-IN_TRIBx(or) PORT-<SLOT>-IN_ADD
SEFS
Section (RS) PORT-<SLOT>-IN_TRIBx(or) PORT-<SLOT>-IN_ADD
LOSS
Sup (OTS) PORT-AX-Y-Z-IN_LINE SPT-SU
Sup (OTS) PORT-AX-Y-Z-IN_LINE CV
Sup (OTS) PORT-AX-Y-Z-IN_LINE ES
Sup (OTS) PORT-AX-Y-Z-IN_LINE SES
Sup (OTS) PORT-AX-Y-Z-IN_LINE SEFS
Sup (OTS) PORT-AX-Y-Z-IN_LINE LOSS
Metropolis® Enhanced Optical Networking (EON) in the WDM Environment
The supported uni-directional (Uni-Dir) PM parameters for each monitored terminationpoint (TP) of the Metropolis® Enhanced Optical Networking (EON) follow. Refer to“Summary of supported NEs” (p. 1-6)for the currently supported NE release.
Section/RS Ingress supports the following PM parameters: NE-CVS, NE-ES, NE-SES,and NE-SEFS. The supported rates are OC-192/STM-64, OC-48/STM-16,OC-12/STM-4, and OC-3/STM-1.
Section/RS Egress supports the following PM parameters: NE-CVS, NE-ESS,NE-SESS, and NE-SEFS. The supported rates are OC-192/STM-64, OC48/STM-16,OC-12/STM-4, and OC-3/STM-1.
Physical Optical Ingress supports the following PM parameter: OPR, in which the valueis in rangeor out of range.
Physical Optical Egress supports the following PM parameters: OPT and LBC, inwhich the value for OPT isin rangeor out of range.
OTS Ingress supports the following PM parameters: TOPR-OL, OPTI-OL, NE-CV,NE-ES, NE-SES, NE-UAS, SPR-SU, and LBC-LU.
OTS Egress supports the following PM Parameters: TOPT-OL, LBC-P1, LBC-P2,LBC-P3, LBC-P4, LBFC-P1, and LBFC-P2.
Optical Channel Ingress on OTU supports the following PM parameters: FEC-EC andFEC-UBC. The supported rate is: OC-192/STM-64 only for Drop and MUXOTU only.
Optical Channel from RP supports the following PM parameters: SPR-C and OSNR-C.
Performance Monitoring Supported PM Parameters for NEs in the WDMEnvironment
...................................................................................................................................................................................................................................
3-56 365-315-148R6.1SPIssue 1, October 2007

View a List of Performance Measurements Statistics...................................................................................................................................................................................................................................
When to use
Use this task to view the current PM storage limits.
Related information
See the following topics in this document:
• “The Performance Monitoring Feature” (p. 3-3)
• “Performance Monitoring Counters” (p. 3-11)
• “Supported PM Parameters for NEs in the SDH/Ethernet Environment” (p. 3-46)
• “Supported PM Parameters for NEs in the SONET/Ethernet Environment” (p. 3-54)
• “Supported PM Parameters for NEs in the WDM Environment” (p. 3-55)
Before you begin
Before you begin to view a list of performance measurements statistics, be aware thatthis task is intended for administrators.
Task
Complete the following step to view a list of performance measurement statistics.
...................................................................................................................................................................................................
1 Use the icons or the object links to follow this path:
• Performance Measurements > Performance Measurements Statistics
Result: The Performance statistics page is displayed.
E N D O F S T E P S...................................................................................................................................................................................................
Performance Monitoring
...................................................................................................................................................................................................................................365-315-148R6.1SPIssue 1, October 2007
3-57

View a List of PM-Capable Termination Points...................................................................................................................................................................................................................................
When to use
Use this task to view a list of PM-capable NE termination points.
Related information
See the following topics in this document:
• “The Performance Monitoring Feature” (p. 3-3)
• “Performance Monitoring Counters” (p. 3-11)
• “Supported PM Parameters for NEs in the SDH/Ethernet Environment” (p. 3-46)
• “Supported PM Parameters for NEs in the SONET/Ethernet Environment” (p. 3-54)
• “Supported PM Parameters for NEs in the WDM Environment” (p. 3-55)
• “Enable PM Data Collection” (p. 3-60)
• “Disable PM Data Collection” (p. 3-62)
Before you begin
This task does not have any preconditions.
Task
Complete the following steps to view a list of PM-capable NE termination points.
...................................................................................................................................................................................................
1 Use the icons or the object links to follow this path:
• Performance Measurements > Performance Measurement Points
Result: The search panel of the Performance Measurement Points page isdisplayed.
...................................................................................................................................................................................................
2 Select one or more fields in the search panel. Note that some fields, such asConnection name andGranularity require the population of other fields for thesearch to complete successfully.
• In the PM approach field, selectTP Based or Connection Based . SelectingTPBased will display Path Termination Points only. SelectingConnection Basedwill display all termination points (Path Termination Points and ConnectionTermination Points). Depending on thePM Approach selected, not all fields aredisplayed.
• In the Connection name field, enter the name of the connection that contains thePM-capable termination points or use the wildcard (*).
Performance Monitoring
...................................................................................................................................................................................................................................
3-58 365-315-148R6.1SPIssue 1, October 2007

• In the NE name field, enter the name of the NE that contains the PM-capabletermination points, or click on theNE name hyperlink, select the name, and clickOK.
• In the Connection rate field, select the connection rate of the PM-capabletermination points.
• In the Granularity field, select the PM data type (interval) of the PM-capabletermination points. Possible choices are15 Minute , 24 Hour , or 24 Hour BI(24-hour bidirectional PM data). This is a required field.
• In the Data collection from/to fields, enter the appropriate dates or select the datesusing the calendar icons.
...................................................................................................................................................................................................
3 Click the Search button.
Result: The list at the bottom of the Performance Measurement Points page ispopulated with a list of PM-enabled termination points that meet your searchcriteria.
E N D O F S T E P S...................................................................................................................................................................................................
Performance Monitoring View a List of PM-Capable Termination Points
...................................................................................................................................................................................................................................365-315-148R6.1SPIssue 1, October 2007
3-59

Enable PM Data Collection...................................................................................................................................................................................................................................
Purpose
Use this task to enable PM data collection on one or more NE termination points.
Related information
See the following topics in this document:
• “The Performance Monitoring Feature” (p. 3-3)
• “Performance Monitoring Counters” (p. 3-11)
• “Supported PM Parameters for NEs in the SDH/Ethernet Environment” (p. 3-46)
• “Supported PM Parameters for NEs in the SONET/Ethernet Environment” (p. 3-54)
• “Supported PM Parameters for NEs in the WDM Environment” (p. 3-55)
• “Clear PM Data Collection for Selected Termination Points” (p. 3-66)
Before you begin
Before you begin the Enable PM Data Collection task, step 1 requires you to completethe “View a List of PM-Capable Termination Points” (p. 3-58)task.
Task
Complete the following steps to enable PM data collection.
...................................................................................................................................................................................................
1 View a list of PM-capable NE termination points using the“View a List ofPM-Capable Termination Points” (p. 3-58)task.
...................................................................................................................................................................................................
2 In the Only ports with data collected field of the Performance Measurement Pointspage search panel, selectNo to display a list of all PM-capable NE termination points.
Result: A list of PM-capable NE termination points is displayed at the bottom ofthe Performance Measurement Points page.
...................................................................................................................................................................................................
3 Select one or more termination points that do not have PM data collection enabled.
...................................................................................................................................................................................................
4 To enable PM data collection on the selected termination point(s) immediately, selectStart PM from the Go menu, click theGo button, andRefresh the display.
Performance Monitoring
...................................................................................................................................................................................................................................
3-60 365-315-148R6.1SPIssue 1, October 2007

Result: PM data collection is enabled immediately.
...................................................................................................................................................................................................
5 After all PM data collection settings have been made, click theSubmit button.
Result: The PM data collection settings are applied to the selected NE terminationpoint(s).
E N D O F S T E P S...................................................................................................................................................................................................
Performance Monitoring Enable PM Data Collection
...................................................................................................................................................................................................................................365-315-148R6.1SPIssue 1, October 2007
3-61
Disable PM Data Collection...................................................................................................................................................................................................................................
Purpose
Use this task to disable PM data collection on one or more NE termination points.
Related information
See the following topics in this document:
• “The Performance Monitoring Feature” (p. 3-3)
• “Performance Monitoring Counters” (p. 3-11)
• “Supported PM Parameters for NEs in the SDH/Ethernet Environment” (p. 3-46)
• “Supported PM Parameters for NEs in the SONET/Ethernet Environment” (p. 3-54)
• “Supported PM Parameters for NEs in the WDM Environment” (p. 3-55)
• “Schedule Disable PM Data Collection” (p. 3-64)
• “Clear PM Data Collection for Selected Termination Points” (p. 3-66)
Before you begin
Before you begin the Disable PM Data Collection task, step 1 requires you to completethe “View a List of PM-Capable Termination Points” (p. 3-58)task.
Task
Complete the following steps to disable PM data collection.
...................................................................................................................................................................................................
1 View a list of PM-capable NE termination points using the“View a List ofPM-Capable Termination Points” (p. 3-58)task.
...................................................................................................................................................................................................
2 In the Only ports with data collected field of the Performance Measurement Pointspage search panel, selectNo to display a list of all PM-capable NE termination points.
Result: A list of PM-capable NE termination points is displayed at the bottom ofthe Performance Measurement Points page.
...................................................................................................................................................................................................
3 Select one or more termination points that do not have PM data collection enabled.
...................................................................................................................................................................................................
4 To disable PM data collection on the selected termination point(s) immediately, selectStop PM from the Go menu and click theGo button.
Performance Monitoring
...................................................................................................................................................................................................................................
3-62 365-315-148R6.1SPIssue 1, October 2007

Result: PM data collection is disabled immediately.
...................................................................................................................................................................................................
5 After all PM data collection settings have been made, click theSubmit button.
Result: The PM data collection settings are applied to the selected NE terminationpoint(s).
E N D O F S T E P S...................................................................................................................................................................................................
Performance Monitoring Disable PM Data Collection
...................................................................................................................................................................................................................................365-315-148R6.1SPIssue 1, October 2007
3-63
Schedule Disable PM Data Collection...................................................................................................................................................................................................................................
Purpose
Use this task to schedule disable PM data collection for a specific time period on oneor more NE termination points.
Related information
See the following topics in this document:
• “The Performance Monitoring Feature” (p. 3-3)
• “Performance Monitoring Counters” (p. 3-11)
• “Supported PM Parameters for NEs in the SDH/Ethernet Environment” (p. 3-46)
• “Supported PM Parameters for NEs in the SONET/Ethernet Environment” (p. 3-54)“Supported PM Parameters for NEs in the WDM Environment” (p. 3-55)
• “Disable PM Data Collection” (p. 3-62)
• “Clear PM Data Collection for Selected Termination Points” (p. 3-66)
Before you begin
Before you begin the Schedule Disable PM Data Collection task, step 1 requires you tocomplete the“View a List of PM-Capable Termination Points” (p. 3-58)task.
Task
Complete the following steps to schedule disable PM data collection.
...................................................................................................................................................................................................
1 View a list of PM-capable NE termination points using the“View a List ofPM-Capable Termination Points” (p. 3-58)task.
...................................................................................................................................................................................................
2 In the Monitored ports only field of the Performance Measurement Points page searchpanel, selectNo to display a list of all PM-capable NE termination points.
Result: A list of PM-capable NE termination points is displayed at the bottom ofthe Performance Measurement Points page.
...................................................................................................................................................................................................
3 To schedule the ending date/time of PM data collection for the selected terminationpoint(s), selectSchedule stop PM from the Go menu and click theGo button.
Performance Monitoring
...................................................................................................................................................................................................................................
3-64 365-315-148R6.1SPIssue 1, October 2007

Result: A pop-up window is displayed.
...................................................................................................................................................................................................
4 In the pop-up window, select the ending date/time for the scheduled PM data collectionand click theOK button.
Result: The management system returns to the Performance Measurement Pointspage.
...................................................................................................................................................................................................
5 After all PM data collection settings have been made, click theSubmit button.
Result: The PM data collection settings are applied to the selected NE terminationpoint(s).
E N D O F S T E P S...................................................................................................................................................................................................
Performance Monitoring Schedule Disable PM Data Collection
...................................................................................................................................................................................................................................365-315-148R6.1SPIssue 1, October 2007
3-65

Clear PM Data Collection for Selected Termination Points...................................................................................................................................................................................................................................
Purpose
Use this task to clear OMS PM start / stop times collection for selected terminationpoints.
Related information
See the following topics in this document:
• “The Performance Monitoring Feature” (p. 3-3)
• “Performance Monitoring Counters” (p. 3-11)
• “Supported PM Parameters for NEs in the SDH/Ethernet Environment” (p. 3-46)
• “Supported PM Parameters for NEs in the SONET/Ethernet Environment” (p. 3-54)“Supported PM Parameters for NEs in the WDM Environment” (p. 3-55)
• “Schedule Disable PM Data Collection” (p. 3-64)
Before you begin
Before you begin the Clear OMS PM Start / Stop Times Collection task, step 1requires you to complete the“View a List of PM-Capable Termination Points”(p. 3-58)task.
Task
Complete the following steps to clear OMS PM Start / Stop times collection forselected termination points.
...................................................................................................................................................................................................
1 View a list of PM-capable NE termination points using the“View a List ofPM-Capable Termination Points” (p. 3-58)task.
...................................................................................................................................................................................................
2 In the Monitored ports only field of the Performance Measurement Points page searchpanel, selectNo to display a list of all PM-capable NE termination points.
Result: A list of PM-capable NE termination points is displayed at the bottom ofthe Performance Measurement Points page.
...................................................................................................................................................................................................
3 Select one or more termination points that have both the starting and ending time fieldspopulated.
Performance Monitoring
...................................................................................................................................................................................................................................
3-66 365-315-148R6.1SPIssue 1, October 2007

...................................................................................................................................................................................................
4 To clear PM data collection for the selected termination point(s), selectClear OMSStart and Stop Times from the Go menu and click theGo button. SelectYes in thewindow to clear the PM.
Result: The PM data collection for the selected termination points is clearedimmediately.
E N D O F S T E P S...................................................................................................................................................................................................
Performance Monitoring Clear PM Data Collection for Selected Termination Points
...................................................................................................................................................................................................................................365-315-148R6.1SPIssue 1, October 2007
3-67

View the Current PM Measurements of a Termination Point...................................................................................................................................................................................................................................
Purpose
Use this task to view the current PM measurements of a selected NE termination pointthat has PM data collection enabled.
Related information
See the following topics in this document:
• “The Performance Monitoring Feature” (p. 3-3)
• “Performance Monitoring Counters” (p. 3-11)
• “Supported PM Parameters for NEs in the SDH/Ethernet Environment” (p. 3-46)
• “Supported PM Parameters for NEs in the SONET/Ethernet Environment” (p. 3-54)
• “Supported PM Parameters for NEs in the WDM Environment” (p. 3-55)
• “Enable PM Data Collection” (p. 3-60)
• “Disable PM Data Collection” (p. 3-62)
Before you begin
Before you begin to view the current PM measurements of an NE termination point,enable PM data collection on the termination point.
Step 1 of this task requires you to complete the“View a List of PM-CapableTermination Points” (p. 3-58)task.
Task
Complete the following steps to view the current PM measurements of a selected NEtermination point that has PM data collection enabled.
...................................................................................................................................................................................................
1 View a list of PM-capable NE termination points using the“View a List ofPM-Capable Termination Points” (p. 3-58)task.
...................................................................................................................................................................................................
2 In the Monitored ports only field of the Performance Measurement Points page searchpanel, selectYes to display a list of all PM-capable NE termination points that havePM data collection enabled.
Performance Monitoring
...................................................................................................................................................................................................................................
3-68 365-315-148R6.1SPIssue 1, October 2007

Result: A list of PM-capable NE termination points that have 15-minute or 24-hourPM data collection enabled is displayed at the bottom of the PerformanceMeasurement Points page.
...................................................................................................................................................................................................
3 Select a termination point from the displayed list.
...................................................................................................................................................................................................
4 From the Go menu, selectCurrent Measurements and click theGo button.
Result: The Current Measurements page is displayed, showing the currentmeasurement and threshold value of each PM parameter for the selectedtermination point.
E N D O F S T E P S...................................................................................................................................................................................................
Performance Monitoring View the Current PM Measurements of a TerminationPoint
...................................................................................................................................................................................................................................365-315-148R6.1SPIssue 1, October 2007
3-69

View the Monitored NE Layer Rate Report...................................................................................................................................................................................................................................
Purpose
Use this task to obtain information about monitored NE layer rates.
Related information
See the following topics in this document:
• “The Performance Monitoring Feature” (p. 3-3)
• “Performance Monitoring Counters” (p. 3-11)
• “Supported PM Parameters for NEs in the SDH/Ethernet Environment” (p. 3-46)
• “Supported PM Parameters for NEs in the SONET/Ethernet Environment” (p. 3-54)
• “Supported PM Parameters for NEs in the WDM Environment” (p. 3-55)
• “Enable/Disable NE Layer Rates” (p. 3-72)
Before you begin
This task does not have any preconditions.
Task
Complete the following to query PM data and view the monitored NE layer rates in areport.
...................................................................................................................................................................................................
1 Use the icons or the object links to follow this path:Performance Measurements >Monitored NE Layer Rate .
Result: The search panel of the Monitored NE Layer Rate page is displayed.
...................................................................................................................................................................................................
2 Select one or more fields in the search panel. Note that some fields, such asGranularity , require the population of other fields for the search to completesuccessfully.
• Select theNode Type from the drop-down list.
• In the NE name field, enter the name of the NE.
• In the NE Layer Rate field, select the NE Layer Rate from the drop-down list. Thisis a required field.
• In the Granularity field, select one or more of the PM data types (intervals).Possible choices are15 Minute , 24 Hour , or 24 Hour BI (24-hour bidirectional PMdata). This is a required field.
Performance Monitoring
...................................................................................................................................................................................................................................
3-70 365-315-148R6.1SPIssue 1, October 2007

• In the Collection Status field, select the status of the data collection. One or moreselection can be made. Possible choices are:Enabled (the management system iscollecting for this layer rate),Disabled (the management system is not collectingfor this layer rate),System Disabled (the management system attempted to collectfor the layer rate, but collection was unsuccessful for a number of periods;therefore, the management system has disabled the layer rate), orManuallyDisabled (the management system attempted to collect for the layer rate, but theuser manually disabled the collection).
• In the Last Collection Time field, enter the appropriate dates in theFrom andToareas for the last collection time.
• In the Sort area, select options from the drop-down lists, and then selectAscending or Descending for each sort.
...................................................................................................................................................................................................
3 Click the Search button.
Result: The list at the bottom of the Monitored NE Layer Rate page is populatedwith a list of NE layer rates that meet your search criteria.
E N D O F S T E P S...................................................................................................................................................................................................
Performance Monitoring View the Monitored NE Layer Rate Report
...................................................................................................................................................................................................................................365-315-148R6.1SPIssue 1, October 2007
3-71

Enable/Disable NE Layer Rates...................................................................................................................................................................................................................................
Purpose
Use this task to enable or disable NE layer rates. The type of disable status that appliesis selected in theCollection Status field on the Search panel of the Monitored NELayer Rate page.
Note : Disabling the collection for a rate stops retrieval of PM data for that rate on thatspecific NE. This collection can only be stopped using this screen during thedebugging of network performance issues related to data collection. To disable datacollection for a termination point, see“Schedule Disable PM Data Collection”(p. 3-64).
Related information
See the following topics in this document:
• “The Performance Monitoring Feature” (p. 3-3)
• “Performance Monitoring Counters” (p. 3-11)
• “Supported PM Parameters for NEs in the SDH/Ethernet Environment” (p. 3-46)
• “Supported PM Parameters for NEs in the SONET/Ethernet Environment” (p. 3-54)
• “Supported PM Parameters for NEs in the WDM Environment” (p. 3-55)
• “View the Monitored NE Layer Rate Report” (p. 3-70)
Before you begin
This task does not have any preconditions.
Task
Complete the following to enable or disable NE layer rate.
...................................................................................................................................................................................................
1 View a list of NE Layer Rates using the“View the Monitored NE Layer Rate Report”(p. 3-70)task.
Result: A report of NE layer rates is displayed at the bottom of the Monitored NELayer Rate page.
...................................................................................................................................................................................................
2 Click in the box to the left of the NE Layer Rate that you want to enable/disable.
...................................................................................................................................................................................................
3 From the Go menu, selectEnable or Disable as appropriate.
Performance Monitoring
...................................................................................................................................................................................................................................
3-72 365-315-148R6.1SPIssue 1, October 2007

Result: If you selectedEnable from the Go menu, the NE layer is activated.
If you selectedDisable from the Go menu, the retrieval of PM data for the specificNE selected is halted. The Disable method applied is the Disable method selectedin the Collection Status field on the Monitored NE Layer Rate search panel.
E N D O F S T E P S...................................................................................................................................................................................................
Performance Monitoring Enable/Disable NE Layer Rates
...................................................................................................................................................................................................................................365-315-148R6.1SPIssue 1, October 2007
3-73
Generate a PM Report...................................................................................................................................................................................................................................
Purpose
Use this task to obtain information about 15-minute and 24-hour PM data, from 1 to 4NE termination points, for a specific time period. Specifically, information can beobtained about 24-hour PM data collected for each NE termination point, uncollected24-hour PM data, and 15-minute PM data retrieved directly from each NE terminationpoint.
If periods are requested that are recent, and have not already been collected, reportgeneration may take a few minutes to complete.
Related information
See the following topics in this document:
• “The Performance Monitoring Feature” (p. 3-3)
• “Performance Monitoring Counters” (p. 3-11)
• “Supported PM Parameters for NEs in the SDH/Ethernet Environment” (p. 3-46)
• “Supported PM Parameters for NEs in the SONET/Ethernet Environment” (p. 3-54)
• “Supported PM Parameters for NEs in the WDM Environment” (p. 3-55)
• “Save a PM Report” (p. 3-76)
Before you begin
This task does not have any preconditions.
From the search criteria specified, the management system produces a report file,which is an ASCII file in Tab Separated Value (TSV) format. The filename of thegenerated report file is in this format:<ReportType>.tsv, which enables the file to beread into MicroSoft® Excel or Notepad. You may also view this report in HTMLformat.
The report file can be generated and/or saved to a location on the server; to save thePM Report, see the“Save a PM Report” (p. 3-76)task.
Task
Complete the following to query PM data and generate a formatted report file.
...................................................................................................................................................................................................
1 Use the icons or the object list to follow this path:Performance Measurements >Performance Measurement Points . The search panel of the PerformanceMeasurement Points page is displayed. Enter search criteria to display the desired listof PM-capable NE termination points. Click theSearch button. The list at the bottom
Performance Monitoring
...................................................................................................................................................................................................................................
3-74 365-315-148R6.1SPIssue 1, October 2007

of the Performance Measurement Points page is populated with a list of PM-enabledtermination points that meet your search criteria. From the Go menu, selectPerformance Measurement Report and click theGo button.
Result: The Performance Measurement Reports Query panel is displayed.
...................................................................................................................................................................................................
2 Click the calendar icon to the right of theFrom field to display a pop-up window, andselect the starting date/time of the report.
Result: The From field is populated with the starting date and time.
...................................................................................................................................................................................................
3 Click the calendar icon to the right of theTo field to display a pop-up window, andselect the ending date/time of the report.
Result: The To field is populated with the ending date and time.
...................................................................................................................................................................................................
4 Click the Submit button.
Result: The Performance Measurement Report Results panel is displayed with ahyperlink to the name of the resulting formatted report file.
...................................................................................................................................................................................................
5 The filename of the generated report file is in this format:<ReportType>.ts, whichenables the file to be read into MicroSoft® Excel or Notepad.
Result: The PM report file is displayed.
E N D O F S T E P S...................................................................................................................................................................................................
Performance Monitoring Generate a PM Report
...................................................................................................................................................................................................................................365-315-148R6.1SPIssue 1, October 2007
3-75

Save a PM Report...................................................................................................................................................................................................................................
Purpose
Use this task to save information that was obtained about 15-minute and 24-hour PMdata on the client server.
Related information
See the following topics in this document:
• “The Performance Monitoring Feature” (p. 3-3)
• “Performance Monitoring Counters” (p. 3-11)
• “Supported PM Parameters for NEs in the SDH/Ethernet Environment” (p. 3-46)
• “Supported PM Parameters for NEs in the SONET/Ethernet Environment” (p. 3-54)
• “Supported PM Parameters for NEs in the WDM Environment” (p. 3-55)
• “Generate a PM Report” (p. 3-74)
Before you begin
Before you begin the Save a PM Report task, step 1 of this task requires you tocomplete the“Generate a PM Report” (p. 3-74)task.
Task
Complete the following to save a PM report.
...................................................................................................................................................................................................
1 Complete all steps in the“Generate a PM Report” (p. 3-74)task.
...................................................................................................................................................................................................
2 To save the PM report to a location on the server, click the right mouse button on thehyperlink of the filename.
Result: A pop-window is displayed.
...................................................................................................................................................................................................
3 In the pop-up window, specify the folder and file name of the PM report file to besaved.
Result: The PM report file is saved.
E N D O F S T E P S...................................................................................................................................................................................................
Performance Monitoring
...................................................................................................................................................................................................................................
3-76 365-315-148R6.1SPIssue 1, October 2007

Polling Current Measurements...................................................................................................................................................................................................................................
Purpose
Use this task to select a port and display a periodically updating current measurementsscreen for each supported monitoring types. The user can select the length of time thepage will update for and the period between the updates.
Related Information
See the following topics in this document:
• “The Performance Monitoring Feature” (p. 3-3)
• “Performance Monitoring Counters” (p. 3-11)
• “Supported PM Parameters for NEs in the SDH/Ethernet Environment” (p. 3-46)
• “Supported PM Parameters for NEs in the SONET/Ethernet Environment” (p. 3-54)
• “Supported PM Parameters for NEs in the WDM Environment” (p. 3-55)
• “Generate a PM Report” (p. 3-74)
Before you begin
This task does not have any preconditions.
Task
Complete the following to query Polling Current Measurements and generate a report.
...................................................................................................................................................................................................
1 Use the icons or the object list to follow this path:Performance Measurements >Polling Current Measurements .
Result: The Polling Current Measurements Query panel is displayed.
...................................................................................................................................................................................................
2 Select theTotal Time from the drop-down list. The default value is 10 minutes.
...................................................................................................................................................................................................
3 Select thePolling Intervals from the drop-down list. The default value is 30 seconds.
...................................................................................................................................................................................................
4 In the Show differences field, selectYes or No to display the counter differences.
...................................................................................................................................................................................................
5 In the Counter to Dispay field, select the counter from the drop-down list. You canmultiple counters for this field. The default value is All.
Performance Monitoring
...................................................................................................................................................................................................................................365-315-148R6.1SPIssue 1, October 2007
3-77

...................................................................................................................................................................................................
6 Click the Submit button.
Result: The Current Measurements Results panel is displayed with details thatmatched the query.
E N D O F S T E P S...................................................................................................................................................................................................
Performance Monitoring Polling Current Measurements
...................................................................................................................................................................................................................................
3-78 365-315-148R6.1SPIssue 1, October 2007

4 4Profile Management
Overview...................................................................................................................................................................................................................................
Purpose
This chapter provides general information about Profile Management using LucentOMS and the tasks that can be performed to manage profiles in NEs and in themanagement system.
Contents
The Profile Management Feature 4-2
View a List of NE Profiles 4-3
View a List of Current Assignments for NE Profiles 4-4
View Resource Details of a Current Assignment for an NE Profile 4-5
Create an NE Profile 4-6
Modify an NE Profile 4-8
Delete an NE Profile 4-10
View the OMS NE Profile Template 4-12
Create an OMS NE Profile Template 4-14
Modify an OMS NE Profile Template 4-16
Delete an OMS NE Profile Template 4-18
Assign an OMS TCA Profile to an NE 4-20
Assign Threshold Profiles to Termination Points from PM Points Page 4-22
Enable an NE Profile 4-24
Disable an NE Profile 4-26
Assign an NE Profile to a Resource 4-28
...................................................................................................................................................................................................................................365-315-148R6.1SPIssue 1, October 2007
4-1

The Profile Management Feature...................................................................................................................................................................................................................................
NE Profile Management and NE Profile Assignment
NEs that support profiles allow the user to create numerous different profiles(configurations) for a resource (port, piece of equipment). These profiles can then belinked to a set of resources. When a profile changes after assignments, the profile ofthe resource is automatically updated in the NE.
The NE Profile Management feature allows the user to view, create, edit, or deletecurrent sets of profiles configured in an NE.
The NE Profile Assignments feature allows the user to view a summary of resourcesassigned to a specific profile.
Lucent OMS Profile Management
The Lucent OMS Profile Management feature allows the management system tocentrally manage a set of profiles for all NEs in the network. TCA and Alarm profilesare supported in this release.
Lucent OMS Profile Assignment to NEs
The Lucent OMS Profile Assignment to NEs feature downloads the TCA profilesstored in the management system to a specific NE or termination point.
There are three modes of operation for the Lucent OMS TCA profile assignment toNEs:
• Per node provisioning - TCA thresholds can be provisioned for layer rate on aper node basis. This is supported for Metropolis® DMX Access Multiplexer only inthis release.
• Per termination point provisioning - TCA thresholds can be provisionedindependently for each termination point. This is supported for Metropolis®Enhanced Optical Networking (EON), LambdaXtreme™ Transport, and CMISENEs in this release.
• Profile provisioning - TCA thresholds can be provisioned by creating a profile onthe NE and assigning to a termination point. This is supported for 1675 LambdaUnite MultiService Switch (MSS) in this release.
Connection Profiles
A connection profile defines the relationship between the roles ports play in aconnection and the alarm profile template that is assigned to the port during theprovisioning process. You cannot create connection profiles but it is possible to edit theconnection profile alarm templates and then downloaded to NEs.
Profile Management
...................................................................................................................................................................................................................................
4-2 365-315-148R6.1SPIssue 1, October 2007

View a List of NE Profiles...................................................................................................................................................................................................................................
When to use
Use this task to view the NE Profiles page, which provides a list of NE profiles
Related Information
See the following topics in this document:
• “View Resource Details of a Current Assignment for an NE Profile” (p. 4-5)
• “View a List of Current Assignments for NE Profiles” (p. 4-4)
• “Create an NE Profile” (p. 4-6)
• “Modify an NE Profile” (p. 4-8)
• “Delete an NE Profile” (p. 4-10)
Before you begin
This task does not have any preconditions.
Task
Complete the following steps to view a list of NE profiles.
...................................................................................................................................................................................................
1 Use the icons or the object links to follow this path:Profiles > NE Profiles .
Result: The NE Profiles page is displayed, which shows the Search for NE Profilespanel.
...................................................................................................................................................................................................
2 Enter the search criteria to view specific NE profiles and click theSearch button.
Result: The NE Profiles panel of the page is displayed.
E N D O F S T E P S...................................................................................................................................................................................................
Profile Management
...................................................................................................................................................................................................................................365-315-148R6.1SPIssue 1, October 2007
4-3

View a List of Current Assignments for NE Profiles...................................................................................................................................................................................................................................
When to use
Use this task to view a list of current assignments of NE Profiles.
Related Information
See the following topics in this document:
• “View a List of NE Profiles” (p. 4-3)
• “View Resource Details of a Current Assignment for an NE Profile” (p. 4-5)
• “Create an NE Profile” (p. 4-6)
• “Modify an NE Profile” (p. 4-8)
• “Delete an NE Profile” (p. 4-10)
Before you begin
This task does not have any preconditions.
Task
Complete the following steps to view a list of NE profiles.
...................................................................................................................................................................................................
1 Use the icons or the object links to follow this path:Profiles > NE Profiles .
Result: The NE Profiles page is displayed, which shows the Search for NE Profilespanel.
...................................................................................................................................................................................................
2 Enter the search criteria to view specific NE profiles and click theSearch button.
Result: The NE Profiles panel of the page is displayed.
...................................................................................................................................................................................................
3 Click the radio button next to the NE Profile in the search results table.
...................................................................................................................................................................................................
4 Select theCurrent Assignment option from the Go menu.
Result: The NE Profiles Assignment page is displayed.
E N D O F S T E P S...................................................................................................................................................................................................
Profile Management
...................................................................................................................................................................................................................................
4-4 365-315-148R6.1SPIssue 1, October 2007

View Resource Details of a Current Assignment for an NEProfile...................................................................................................................................................................................................................................
When to use
Use this task to view the resource details of current assignments of NE Profiles.
Related Information
See the following topics in this document:
• “Create an NE Profile” (p. 4-6)
• “Modify an NE Profile” (p. 4-8)
• “Delete an NE Profile” (p. 4-10)
• “View a List of NE Profiles” (p. 4-3)
• “View a List of Current Assignments for NE Profiles” (p. 4-4)
Before you begin
This task does not have any preconditions.
Task
Complete the following steps to view a list of current NE profile assignments.
...................................................................................................................................................................................................
1 Access the NE Profiles Assignment page as described in“View a List of CurrentAssignments for NE Profiles” (p. 4-4).
...................................................................................................................................................................................................
2 Click the radio button next to the NE Profile Assignment for which you want resourcedetails in the search results table.
...................................................................................................................................................................................................
3 Select theResource details option from the Go menu.
Result: The Resource Details page is displayed for the NE Profile Assignmentselected.
E N D O F S T E P S...................................................................................................................................................................................................
Profile Management
...................................................................................................................................................................................................................................365-315-148R6.1SPIssue 1, October 2007
4-5

Create an NE Profile...................................................................................................................................................................................................................................
When to use
Use this task to view the NE Profiles page, which allows you to create an NE profile.
Related Information
See the following topics in this document:
• “View Resource Details of a Current Assignment for an NE Profile” (p. 4-5)
• “View a List of Current Assignments for NE Profiles” (p. 4-4)
• “Modify an NE Profile” (p. 4-8)
• “Delete an NE Profile” (p. 4-10)
• “View a List of NE Profiles” (p. 4-3)
Before you begin
This task does not have any preconditions.
Task
Complete the following steps to create an NE profile.
...................................................................................................................................................................................................
1 Use the icons or the object links to follow this path:Profiles > NE Profiles .
Result: The NE Profiles page is displayed, which shows the Search for NE Profilespanel.
...................................................................................................................................................................................................
2 Click the New icon on the NE Profiles page.
Result: The New NE Profile page is displayed.
...................................................................................................................................................................................................
3 Select theProfile class . Options are:Alarm or TCA.
...................................................................................................................................................................................................
4 Select theNE name from the drop-down list.
...................................................................................................................................................................................................
5 Select theProfile group from the drop-down list.
...................................................................................................................................................................................................
6 Enter theProfile name .
Profile Management
...................................................................................................................................................................................................................................
4-6 365-315-148R6.1SPIssue 1, October 2007

...................................................................................................................................................................................................
7 Click on theSubmit button.
Result: The new NE profile is submitted to the management system.
E N D O F S T E P S...................................................................................................................................................................................................
Profile Management Create an NE Profile
...................................................................................................................................................................................................................................365-315-148R6.1SPIssue 1, October 2007
4-7

Modify an NE Profile...................................................................................................................................................................................................................................
When to use
Use this task to view the NE Profiles page, which allows you to modify an NE profile.
Related Information
See the following topics in this document:
• “View Resource Details of a Current Assignment for an NE Profile” (p. 4-5)
• “View a List of Current Assignments for NE Profiles” (p. 4-4)
• “Create an NE Profile” (p. 4-6)
• “Delete an NE Profile” (p. 4-10)
• “View a List of NE Profiles” (p. 4-3)
Before you begin
This task does not have any preconditions.
Task
Complete the following steps to modify an NE profile.
...................................................................................................................................................................................................
1 Use the icons or the object links to follow this path:Profiles > NE Profiles .
Result: The NE Profiles page is displayed, which shows the Search for NE Profilespanel.
...................................................................................................................................................................................................
2 Enter the search criteria for the specific NE profile that you want to modify and clickthe Search button.
Result: The NE Profile search table panel is displayed with data that meets yoursearch criteria.
...................................................................................................................................................................................................
3 Click the radio button next to the NE profile that you want to modify.
...................................................................................................................................................................................................
4 Select theModify options on the Go menu.
Result: The Modify NE Profile Details page is displayed.
...................................................................................................................................................................................................
5 Enter changing information in any of the editable fields.
Profile Management
...................................................................................................................................................................................................................................
4-8 365-315-148R6.1SPIssue 1, October 2007

Note: Be sure that values entered are within the required ranges.
...................................................................................................................................................................................................
6 Click the Submit button.
Result: The NE Profile is modified in the NE.
E N D O F S T E P S...................................................................................................................................................................................................
Profile Management Modify an NE Profile
...................................................................................................................................................................................................................................365-315-148R6.1SPIssue 1, October 2007
4-9

Delete an NE Profile...................................................................................................................................................................................................................................
When to use
Use this task to view the NE Profiles page, which allows you to delete an NE profile.
A delete operation only occurs if:
• The profile is not assigned to an object on the NE. (This can be checked using the“View a List of Current Assignments for NE Profiles” (p. 4-4)task.)
• The profile is not a default profile.
• The NE supports the delete operation.
Related Information
See the following topics in this document:
• “View Resource Details of a Current Assignment for an NE Profile” (p. 4-5)
• “View a List of Current Assignments for NE Profiles” (p. 4-4)
• “Create an NE Profile” (p. 4-6)
• “Modify an NE Profile” (p. 4-8)
• “View a List of NE Profiles” (p. 4-3)
Before you begin
This task does not have any preconditions.
Task
Complete the following steps to delete an NE profile.
...................................................................................................................................................................................................
1 Use the icons or the object links to follow this path:Profiles > NE Profiles .
Result: The NE Profiles page is displayed, which shows the Search for NE Profilespanel.
...................................................................................................................................................................................................
2 Enter the search criteria for the specific NE profile that you want to delete and clickthe Search button.
Result: The NE Profile search table panel is displayed with data that meets yoursearch criteria.
...................................................................................................................................................................................................
3 Click the radio button next to the NE profile that you want to delete.
Profile Management
...................................................................................................................................................................................................................................
4-10 365-315-148R6.1SPIssue 1, October 2007

...................................................................................................................................................................................................
4 Select theDelete option on the Go menu.
Result: The NE Profile is deleted from the NE.
E N D O F S T E P S...................................................................................................................................................................................................
Profile Management Delete an NE Profile
...................................................................................................................................................................................................................................365-315-148R6.1SPIssue 1, October 2007
4-11

View the OMS NE Profile Template...................................................................................................................................................................................................................................
When to use
Use this task to view the OMS NE Profile Templates page. By modifying this page,you are modifying the template. Factory and user-defined profile templates can beviewed.
A factory profile is preinstalled with the Lucent Optical Management System (OMS).The factory profile contains default values that are loaded on the NE at installation.Factory profiles cannot be edited or deleted.
User-defined profiles are created by expert operators using either factory oruser-defined templates as a prototype.
Related Information
See the following topics in this document:
• “Create an OMS NE Profile Template” (p. 4-14)
• “Modify an OMS NE Profile Template” (p. 4-16)
• “Delete an OMS NE Profile Template” (p. 4-18)
Before you begin
This task does not have any preconditions.
Task
Complete the following steps to view an OMS NE profile template.
...................................................................................................................................................................................................
1 Use the icons or the object links to follow this path:Profiles > NE Profile Templates .
Result: The NE Profile Templates page is displayed, which shows the Search forNE Profile Templates panel.
...................................................................................................................................................................................................
2 In the Profile User field, enter the profile user to search the Connection Profiletemplates and the Standard profile templates.
...................................................................................................................................................................................................
3 Enter the search criteria for the specific NE profile template that you want to view andclick the Search button.
Profile Management
...................................................................................................................................................................................................................................
4-12 365-315-148R6.1SPIssue 1, October 2007

Result: The NE Profile Template search table panel is displayed with data thatmeets your search criteria.
E N D O F S T E P S...................................................................................................................................................................................................
Profile Management View the OMS NE Profile Template
...................................................................................................................................................................................................................................365-315-148R6.1SPIssue 1, October 2007
4-13

Create an OMS NE Profile Template...................................................................................................................................................................................................................................
When to use
Use this task to create the OMS NE Profile Templates.
Related Information
See the following topics in this document:
• “View the OMS NE Profile Template” (p. 4-12)
• “Modify an OMS NE Profile Template” (p. 4-16)
• “Delete an OMS NE Profile Template” (p. 4-18)
Before you begin
You cannot create Factory profile templates. User-defined profile templates are createdby selecting an existing OMS NE profile template and copying it, giving the copiedprofile template a new profile name and a new set of values. The value of the ProfileUser is set to Standard. The Profile group value, however, must remain the same as inthe template that is copied.
Task
Complete the following steps to create an OMS NE profile template.
...................................................................................................................................................................................................
1 Use the icons or the object links to follow this path:Profiles > NE Profile Templates .
Result: The NE Profile Templates page is displayed, which shows the Search forNE Profile Templates panel.
...................................................................................................................................................................................................
2 Enter the search criteria for an OMS NE profile template similar to that which youwant to create and click theSearch button.
Result: The NE Profile Templates search table panel is displayed with data thatmeets your search criteria.
...................................................................................................................................................................................................
3 Click the radio button next to the OMS NE profile template similar to that which youwant to create.
...................................................................................................................................................................................................
4 Select theCopy option on the Go menu.
Profile Management
...................................................................................................................................................................................................................................
4-14 365-315-148R6.1SPIssue 1, October 2007

Result: The Modify NE Profile Template Details page is displayed.
...................................................................................................................................................................................................
5 Enter new information for the OMS NE profile template that you want to create in anyof the editable fields.
...................................................................................................................................................................................................
6 Click the Submit button.
Result: A new OMS NE Profile Template is created in the management system.
E N D O F S T E P S...................................................................................................................................................................................................
Profile Management Create an OMS NE Profile Template
...................................................................................................................................................................................................................................365-315-148R6.1SPIssue 1, October 2007
4-15

Modify an OMS NE Profile Template...................................................................................................................................................................................................................................
When to use
Use this task to view the OMS NE Profile Templates page, from which you canmodify an OMS NE profile template.
Related Information
See the following topics in this document:
• “Create an OMS NE Profile Template” (p. 4-14)
• “View the OMS NE Profile Template” (p. 4-12)
• “Delete an OMS NE Profile Template” (p. 4-18)
Before you begin
This task does not have any preconditions.
Task
Complete the following steps to modify an OMS NE profile template.
...................................................................................................................................................................................................
1 Use the icons or the object links to follow this path:Profiles > NE Profile Templates .
Result: The NE Profile Templates page is displayed, which shows the Search forNE Profile Templates panel.
...................................................................................................................................................................................................
2 Enter the search criteria for the specific OMS NE profile template that you want tomodify and click theSearch button.
Result: The NE Profile Templates search table panel is displayed with data thatmeets your search criteria.
...................................................................................................................................................................................................
3 Click the radio button next to the OMS NE profile template that you want to modify.
...................................................................................................................................................................................................
4 Select theModify option on the Go menu.
Result: The Modify NE Profile Template Details page is displayed.
...................................................................................................................................................................................................
5 Enter changing information in any of the editable fields.
Note: Be sure that values entered are within the required ranges.
Profile Management
...................................................................................................................................................................................................................................
4-16 365-315-148R6.1SPIssue 1, October 2007

...................................................................................................................................................................................................
6 Click the Submit button.
Result: The OMS NE Profile Template is modified in the management system.
E N D O F S T E P S...................................................................................................................................................................................................
Profile Management Modify an OMS NE Profile Template
...................................................................................................................................................................................................................................365-315-148R6.1SPIssue 1, October 2007
4-17

Delete an OMS NE Profile Template...................................................................................................................................................................................................................................
When to use
Use this task to delete an OMS NE Profile Template. You must have valid permissionsto delete OMS NE profile templates.
Deleting a OMS NE profile template only affects the management system profiles, anddoes not change the profiles stored on any NE in the network. To delete a profile froma network element, see“Delete an NE Profile” (p. 4-10).
Related Information
See the following topics in this document:
• “Create an OMS NE Profile Template” (p. 4-14)
• “Modify an OMS NE Profile Template” (p. 4-16)
• “View the OMS NE Profile Template” (p. 4-12)
Before you begin
This task does not have any preconditions.
Task
Complete the following steps to delete an OMS NE profile template.
...................................................................................................................................................................................................
1 Use the icons or the object links to follow this path:Profiles > NE Profile Templates .
Result: The NE Profile Templates page is displayed, which shows the Search forNE Profile Templates panel.
...................................................................................................................................................................................................
2 Enter the search criteria for the specific OMS NE profile template that you want todelete and click theSearch button.
Result: The NE Profile Templates search table panel is displayed with data thatmeets your search criteria.
...................................................................................................................................................................................................
3 Click the radio button next to the OMS NE profile template that you want to delete.
...................................................................................................................................................................................................
4 Select theDelete option on the Go menu.
Profile Management
...................................................................................................................................................................................................................................
4-18 365-315-148R6.1SPIssue 1, October 2007

Result: A confirmation box is displayed requesting verification before the OMS NEprofile template is deleted.
...................................................................................................................................................................................................
5 Click Yes.
Result: The OMS NE profile template is deleted from the management systemprofile templates. Profiles stored on any NE in the network are not affected.
E N D O F S T E P S...................................................................................................................................................................................................
Profile Management Delete an OMS NE Profile Template
...................................................................................................................................................................................................................................365-315-148R6.1SPIssue 1, October 2007
4-19

Assign an OMS TCA Profile to an NE...................................................................................................................................................................................................................................
When to use
Use this task to select an OMS TCA profile and assign it to an NE.
Related Information
See the following topics in this document:
• “Assign Threshold Profiles to Termination Points from PM Points Page ” (p. 4-22)
Before you begin
See“Lucent OMS Profile Assignment to NEs” (p. 4-2).
Task
Complete the following steps to assign an OMS TCA profile to an NE.
...................................................................................................................................................................................................
1 Use the icons or the object links to follow this path:Profiles > NE Profile Templates .
Result: The NE Profile Templates page is displayed, which shows the Search forNE Profile Templates panel.
...................................................................................................................................................................................................
2 Enter the search criteria for the specific OMS NE profile template that you want toassign to an NE.
Result: The NE Profile Templates search table panel is displayed with data thatmeets your search criteria.
...................................................................................................................................................................................................
3 Select the OMS NE profile templates that you want to assign to an NE. The selectedtemplates should have the same NE type and applied to the same NE release.
...................................................................................................................................................................................................
4 Select theApply to NE option on the Go menu.
Profile Management
...................................................................................................................................................................................................................................
4-20 365-315-148R6.1SPIssue 1, October 2007

Result: The Download to NE page is displayed. If the user has selected multipleselections option, the system checks whether all the selected NE Profile Templatesare applied to the same release of the NE and have a different Profile Group. If allchecks pass the system will perform the download. When the user attempts todownload an NE Profile Template to an NE and if the existing NE profile has thesame name, the system will overwrite the profile with the selected NE ProfileTemplate. When the Profile Template values marked as OFF then the ProfileTemplate will not be download to the NE. The Job Updates page displays amessage when an NE Profile Template is successfully downloaded.
...................................................................................................................................................................................................
5 In the Select NE Name panel, select theNE Name from the drop-down list. The itemsin the drop-down list are based on the NE type of the profile. Only one selection canbe chosen for this release.
...................................................................................................................................................................................................
6 Click Submit .
Result: The OMS NE profile templates are downloaded to the management systemand assigned to the selected NEs.
E N D O F S T E P S...................................................................................................................................................................................................
Profile Management Assign an OMS TCA Profile to an NE
...................................................................................................................................................................................................................................365-315-148R6.1SPIssue 1, October 2007
4-21

Assign Threshold Profiles to Termination Points from PMPoints Page...................................................................................................................................................................................................................................
When to use
Use this task to select termination points from the PM Points page, and then requestthat a specific TCA profile be assigned to the selected termination points.
Related Information
See the following topics in this document:
• “Assign an OMS TCA Profile to an NE” (p. 4-20)
Before you begin
See“Lucent OMS Profile Assignment to NEs” (p. 4-2).
A profile template must be applied to the NE before attempting to assign a port withthat profile.
Task
Complete the following steps to assign threshold profiles to TPs from the PM Pointspage.
...................................................................................................................................................................................................
1 View a list of PM-capable NE termination points using the“View a List ofPM-Capable Termination Points” (p. 3-58).
Result: A list of PM-capable NE termination points is displayed at the bottom ofthe Performance Measurement Points page with data that meets your search criteria.
...................................................................................................................................................................................................
2 Click the check boxes next to the port names to which you want to assign a thresholdprofiles.
...................................................................................................................................................................................................
3 Select theAssign Threshold option on the Go menu.
Result: The Set TCA Threshold Level from Profile Template page is displayed.
...................................................................................................................................................................................................
4 Select the Lucent Optical Management System (OMS)NE Profile Template from thedrop-down list. You can select multiple NEs of the same type and download.
...................................................................................................................................................................................................
5 Click the Submit button.
Profile Management
...................................................................................................................................................................................................................................
4-22 365-315-148R6.1SPIssue 1, October 2007

Result: The selected threshold profiles are assigned to termination points.
E N D O F S T E P S...................................................................................................................................................................................................
Profile Management Assign Threshold Profiles to Termination Points from PMPoints Page
...................................................................................................................................................................................................................................365-315-148R6.1SPIssue 1, October 2007
4-23

Enable an NE Profile...................................................................................................................................................................................................................................
When to use
Use this task to enable an NE profile.
Use this option with the WSM network element only.
Related Information
See the following topics in this document:
• “Assign Threshold Profiles to Termination Points from PM Points Page ” (p. 4-22)
Before you begin
See“Lucent OMS Profile Assignment to NEs” (p. 4-2).
Task
Complete the following steps to enable a profile on the WSM network elements.
...................................................................................................................................................................................................
1 Use the icons or the object links to follow this path:Profiles > NE Profiles .
Result: The NE Profile Templates page is displayed, which shows the Search forNE Profile Templates panel.
...................................................................................................................................................................................................
2 Select theAlarm button for Profile Class.
...................................................................................................................................................................................................
3 Select anSelect Metropolis® WSM from the NE type pull-down list.
Note that only WSM NEs will be displayed on the available list.
...................................................................................................................................................................................................
4 Select the NE by selecting one from the list in the Available list. Click the right arrow(>) button to add the NE the Selected window.
Result; The NE is displayed in theSelected window.
...................................................................................................................................................................................................
5 Select aProfile Group from the Profile Group list.
...................................................................................................................................................................................................
6 SelectSubmit .
Profile Management
...................................................................................................................................................................................................................................
4-24 365-315-148R6.1SPIssue 1, October 2007

Result: The NE Profiles table displays.
...................................................................................................................................................................................................
7 Select a row from the NE Profiles table.
...................................................................................................................................................................................................
8 Select theEnable option on the Go menu.
Result: The profile is enabled on the NE.
E N D O F S T E P S...................................................................................................................................................................................................
Profile Management Enable an NE Profile
...................................................................................................................................................................................................................................365-315-148R6.1SPIssue 1, October 2007
4-25

Disable an NE Profile...................................................................................................................................................................................................................................
When to use
Use this task to disable an NE profile.
Use this option with the WSM network element only.
Related Information
See the following topics in this document:
• “Assign Threshold Profiles to Termination Points from PM Points Page ” (p. 4-22)
Before you begin
See“Lucent OMS Profile Assignment to NEs” (p. 4-2).
Task
Complete the following steps to disable an NE profile.
...................................................................................................................................................................................................
1 Use the icons or the object links to follow this path:Profiles > NE Profiles .
Result: The NE Profile Templates page is displayed, which shows the Search forNE Profile Templates panel.
...................................................................................................................................................................................................
2 Select theAlarm button for Profile Class.
...................................................................................................................................................................................................
3 Select anSelect Metropolis® WSM from the NE pull-down list.
...................................................................................................................................................................................................
4 Select a WSM as the NE by selecting one from the list in the Available list. Click theright arrow (>) button to add the NE the Selected window.
Note that only WSM NEs will be displayed in the Available list.
Result; The NE is displayed in theSelected window.
...................................................................................................................................................................................................
5 Select aProfile Group from the Profile Group list.
...................................................................................................................................................................................................
6 SelectSubmit .
Profile Management
...................................................................................................................................................................................................................................
4-26 365-315-148R6.1SPIssue 1, October 2007

Result: The NE Profiles table displays.
...................................................................................................................................................................................................
7 Select a row from the NE Profiles table.
...................................................................................................................................................................................................
8 Select theDisable option on the Go menu.
Result: The profile is simply disabled on the NE.
E N D O F S T E P S...................................................................................................................................................................................................
Profile Management Disable an NE Profile
...................................................................................................................................................................................................................................365-315-148R6.1SPIssue 1, October 2007
4-27

Assign an NE Profile to a Resource...................................................................................................................................................................................................................................
When to use
Use this task to Assign an NE profile to a Resource.
Use this option with the DMX network element only.
Related Information
See the following topics in this document:
• “Assign Threshold Profiles to Termination Points from PM Points Page ” (p. 4-22)
Before you begin
There are no prerequisites for this task.
Task
Complete the following steps to assign an NE profile to a resource.
...................................................................................................................................................................................................
1 Use the icons or the object links to follow this path:Profiles > NE Profiles .
Result: The NE Profile Templates page is displayed, which shows the Search forNE Profile Templates panel.
...................................................................................................................................................................................................
2 Select theAlarm button for Profile Class.
...................................................................................................................................................................................................
3 Select anMetropolis® DMX from the NE pull-down list.
...................................................................................................................................................................................................
4 Select anNE from the list in the Available list. Click the right arrow (>) button to addthe NE the Selected window.
Result; The NE is displayed in theSelected window.
...................................................................................................................................................................................................
5 Select aProfile Group from the Profile Group list.
...................................................................................................................................................................................................
6 SelectSubmit .
Result: The NE Profiles table displays.
...................................................................................................................................................................................................
7 Select a row from the NE Profiles table.
Profile Management
...................................................................................................................................................................................................................................
4-28 365-315-148R6.1SPIssue 1, October 2007

...................................................................................................................................................................................................
8 SelectAssign to Resource from the Go menu.
Result: The Assign Profile to Resource dialog window displays the followinginformation:
• NE name:
• LTDMX-B NE type:
• Metropolis® DMX Profile name:
• DEFAULT Resource name:
...................................................................................................................................................................................................
9 Enter the resource name in the fieldResource Name and click submit.
Result: The resource is assigned with the selected alarm profile.
E N D O F S T E P S...................................................................................................................................................................................................
Profile Management Assign an NE Profile to a Resource
...................................................................................................................................................................................................................................365-315-148R6.1SPIssue 1, October 2007
4-29


Index
Numerics
24-hour PM data interval,3-7
1675 Lambda UniteMultiService Switch (MSS),3-54
.............................................................
A Alarm
filtering, 2-26
notification, 2-9
severity levels,2-9
Alarm colors
Equipment pages,2-11
for areas and aggregateicons, 2-10
for NE icons,2-10
Network Map and,2-14
severity levels and,2-9
Alarm holdoff, 2-6
Alarm List
Alarms page,2-16
repeat,2-37
view, 2-42
Alarm Log, 2-18
delete records,2-65
export records to a file ordevice,2-63
maximum number of recordsstored,2-18
retention period for records,2-19
view records,2-62
Alarms
acknowledge,2-37, 2-42
acknowledge and delete,2-44
count, 2-46
database synchronization of,2-8
delete,2-37
delete cleared,2-43
delete instantaneous,2-43
equipment,2-60
historic, 2-17
logging, 2-18
security,2-3
synchronization,2-58
view, 2-37
view cleared,2-46
view details,2-41
view raised,2-46
Alarms page,2-16
acknowledge alarms from,2-16
search criteria,2-16
view, 2-37, 2-43, 2-44
view alarm details,2-41
Alert
acknowledge,2-83
Assign an OMS TCA Profile toan NE, 4-20
Assign Threshold Profiles toTPs from PM Points,4-22
Audience,ix
intended,ix
.............................................................
C Cleared alarms
view current,2-46
Clearing
PM data collection,3-66
CMISE NEs,1-5
Colors of alarms
for area and aggregateicons, 2-10
for NE icons,2-10
on Equipment pages,2-11
severity levels and,2-9
to report status,2-4
Conventions
typographical,x
....................................................................................................................................................................................................................................365-315-148R6.1SPIssue 1, October 2007
IN-1
Create an NE Profile,4-6
Create an OMS NE ProfileTemplate,4-14
Current Measurements page,3-5
.............................................................
D Data collection
PM, 3-7
Database synchronization ofalarms,2-8
Delete an NE Profile,4-10
Delete an OMS NE ProfileTemplate,4-18
Documentation,xiii
font usage,x
glossary,xii
how to order,xiii
intended audience,ix
list of, xii
on CD-ROM, xii
online version,xii
.............................................................
E Enable/Disable NE Layer Rates
view PM report,3-72
Equipment
view alarm status,2-60
Equipment View,2-14
Event
acknowledge,2-88
Events
acknowledge,2-84
logging, 2-18
view, 2-84
.............................................................
F Fault Management
Fault Management LogsAdministration user task,2-63, 2-65
features,1-9
Filtering, 2-26
Font usage,x
.............................................................
G Glossary,xii
Green as an alarm color,2-10,2-11, 2-11
Grey as an alarm color,2-10,2-11
.............................................................
H Hardware
Sun platform for OMC-RANcut through,1-4
Help
online documentation,xiii
product help,xiii
screen help,xiii
search engine,xiii
task help,xiii
technical support help,xiii
Historic alarms,2-17
.............................................................
I Information products
font usage,x
glossary,xii
how to order,xiii
intended audience,ix
list of, xii
on CD-ROM, xii
online version,xii
Installation parameters,1-3
Instantaneous alarms
acknowledge and delete,2-44
Intended audience,ix
.............................................................
L LambdaXtreme™ Transport,3-55
Licenses
Metro Access TransportSystems (MATS),1-4
Light blue as an alarm color,2-10, 2-11
Logging
alarms,2-18
events,2-18
.............................................................
M Magenta as an alarm color,2-11
Management System forTransport (MST)
Lucent OMS functioning as,1-4
Metro Access TransportSystems (MATS)
license,1-4
Metropolis® Enhanced OpticalNetworking (EON),3-56
Modify an NE Profile,4-8
Modify an OMS NE ProfileTemplate,4-16
Monitored NE Layer Rate
view PM report,3-70
MSTSee: Management System
for Transport (MST)
Index
...................................................................................................................................................................................................................................
IN-2 365-315-148R6.1SPIssue 1, October 2007

.............................................................
N Native command languages,1-5
NE Profile Management
create an NE profile,4-6
delete an NE profile,4-10
modify an NE profile,4-8
view a list currentassignments for NEProfiles, 4-4
view a list of NE profiles,4-3
view resource details of acurrent assignment,4-5
Network elements (NEs)
1675 Lambda UniteMultiService Switch(MSS), 3-54
CMISE NEs,1-5
communication status of,2-14
high-level summary of thosesupported,1-5
LambdaXtreme™ Transport,3-55
Metropolis® EnhancedOptical Networking(EON), 3-56
native command languages,1-5
TL1 NEs, 1-5
Network Event Summary,2-20,2-46
alarm counts,2-20
alarm summary,2-20
Discrepancy Counts,2-22
display preferences for,2-24
latest events,2-24
refresh the page,2-47, 2-57
reset the new eventindicator, 2-49
Review Alarm Details,2-55
Root Cause Failure Counts,2-23
view alarm details,2-51,2-53
view Threshold CrossingAlerts, 2-81
Network Map,2-14
NOC Administrator,1-2
NOC Expert Operator,1-2
NOC Operator,1-2
.............................................................
O OMC-RAN, 1-4
OMS NE Profile Management
Assign an OMS TCA profileto an NE,4-20
Assign threshold profiles toTPs from PM Points,4-22
create an OMS NE profiletemplate,4-14
Delete an OMS NE profiletemplate,4-18
Modify an OMS NE profiletemplate,4-16
OMS Profile Management
view an OMS NE profiletemplate,4-12
OMS_NE_MATS license,1-4
On-line documentation,xii , xiii
On-line helpSee: Help
.............................................................
P Performance MeasurementsPoints page,3-5
Performance MeasurementsReport Results page,3-5
Performance MeasurementsReports Query page,3-5
Performance Monitoring
clear PM data collection forselected termination points,3-66
definition, 3-3
disable PM data collection,3-62
enable PM data collection,3-60
features,1-9
generate PM report,3-74
granularities for datacollection/reporting,3-7
save PM report,3-76
schedule disable PM datacollection, 3-64
view a list of performancemeasurements statistics,3-57
view current PMmeasurements oftermination point,3-68
view list of PM-capableTermination Points,3-58
PM, 3-3
Polling Current Measurements,3-77
Profile Assignment to NEs,OMS
definition, 4-2
Profile Assignment, NE
definition, 4-2
Profile Management
features,4-2
Index
...................................................................................................................................................................................................................................365-315-148R6.1SPIssue 1, October 2007
IN-3

Profile Management, NE
definition, 4-2
Profile Management, OMS
definition, 4-2
Protection Switch
Event, 2-88
Protection Switch Event (PSE)
processing,2-29
Protection Switch Event Logpage
description,2-31
view, 2-84
Purple as an alarm color,2-10
.............................................................
R Raised alarms
view current,2-46
Red as an alarm color,2-10,2-11
Repeat alarm list,2-37
Reporting
24-hour PM data interval,3-7
Reports
generate PM report,3-74
PM data,3-7
save PM report,3-76
Tab Separated Value (TSV)format, 3-7
Root cause failure
processing,2-32
Root Cause Failures
Acknowledge on RootCause Failures page,2-72
view from Network EventSummary page,2-55
Root Cause Failures page
acknowledge root causefailures from,2-35
Root cause failures page
description,2-35
Root Cause Failures page
search criteria,2-35
.............................................................
S SAFSee: Symptomatic alarm
filtering (SAF)
Scheduling
disable PM data collection,3-64
SDH operating environment ofthe management system,1-2
SDH transport structure
Lucent NEs and,1-5
Search feature
for help, xiii
Service Assurance
process overview,2-3
Software
Sun Solaris platform forOMC-RAN cut through,1-4
SONET operating environmentof the management system,1-2
SONET transport structure
Lucent NEs and,1-5
Sun platform,1-4
Symptomatic alarm filtering(SAF), 2-26
.............................................................
T Tab Separated Value (TSV)report format,3-7
Termination points (TPs)
PM parameters for,3-54,3-55, 3-56
Terminology,xii
Threshold Crossing
Alert, 2-83
Threshold Crossing Alert(TCA)
processing,2-27
Threshold Crossing Alert page
description,2-28
Threshold Crossing Alerts(TCAs), 3-3
Threshold Crossing details
view, 2-77
Time interval
24-hour PM data interval,3-7
TL1 NEs, 1-5
Transport structures
supported,1-5
Typographical conventions,x
.............................................................
U Uni-directional (Uni-Dir) PMparameters
1675 Lambda UniteMultiService Switch(MSS), 3-54
LambdaXtreme™ Transport,3-55
Metropolis® EnhancedOptical Networking(EON), 3-56
User Activity Log, 1-3
User role profiles
definition of, 1-2
factory, 1-2
Index
...................................................................................................................................................................................................................................
IN-4 365-315-148R6.1SPIssue 1, October 2007

user-defined,1-2
User tasks
Fault Management LogsAdministration,2-63, 2-65
Users
types of,1-2
.............................................................
V View an OMS NE ProfileTemplate,4-12
View Current Assignments forNE Profiles,4-4
View List of NE Profiles,4-3
View Resource Details
of current assignment for anNE profile, 4-5
.............................................................
W White as an alarm color,2-10,2-11
.............................................................
Y Yellow as an alarm color,2-10,2-11
Index
...................................................................................................................................................................................................................................365-315-148R6.1SPIssue 1, October 2007
IN-5