Optical Management System (OMS) - Nokia Online ...
228
Title page Optical Management System (OMS) Release 6.4 Service Assurance Guide 365-315-148R6.4 ISSUE 1 MARCH 2011
-
Upload
khangminh22 -
Category
Documents
-
view
0 -
download
0
Transcript of Optical Management System (OMS) - Nokia Online ...
Title page
Optical Management System (OMS)
Release 6.4
Service Assurance Guide
365-315-148R6.4
ISSUE 1
MARCH 2011

Legal notice
Legal notice
Alcatel, Lucent, Alcatel-Lucent and the Alcatel-Lucent logo are trademarks of Alcatel-Lucent. All other trademarks are the property of their respective
owners.
The information presented is subject to change without notice. Alcatel-Lucent assumes no responsibility for inaccuracies contained herein.
Copyright © 2011 Alcatel-Lucent. All rights reserved.
Notice
Every effort was made to ensure that the information in this document was complete and accurate at the time of printing. However, information is subject to
change.
Warranty
Alcatel-Lucent provides a limited warranty for this product. For more information, consult your local Alcatel-Lucent customer support team.
Ordering information
The ordering number for this document is 365-315-148R6.4. To order OMS information products, contact your local Alcatel-Lucent customer support team.
Technical support
For technical support, contact your local customer support team. You can reach them via the Web at the Alcatel-Lucent Customer Support web site
(http://www. alcatel-lucent.com/support) or the customer support telephone number listed at the Alcatel-Lucent Contact Us web site (http://www.alcatel-
lucent.com/contact).
Information product support
For questions or concerns about this or any other Alcatel-Lucent information product, please contact us at one of the following numbers: (888) 727 3615 (for
the continental United States), +1 (630) 713 5000 (for all countries).
Contents
About this document
Purpose ............................................................................................................................................................................................. ixix
Reason for revision ...................................................................................................................................................................... ixix
Intended audience ......................................................................................................................................................................... ixix
Safety information ........................................................................................................................................................................ ixix
How to use this information product ..................................................................................................................................... ixix
Conventions used ........................................................................................................................................................................... xx
Related documentation .............................................................................................................................................................. xiixii
How to order ................................................................................................................................................................................ xiiixiii
How to comment ........................................................................................................................................................................ xiiixiii
1 Service Assurance
Overview ...................................................................................................................................................................................... 1-11-1
Product Overview ..................................................................................................................................................................... 1-11-1
Supported Network Elements ............................................................................................................................................... 1-31-3
A Quick Look at Service Assurance .................................................................................................................................. 1-91-9
2 Fault Management
Overview ...................................................................................................................................................................................... 2-12-1
The Fault Management Feature ........................................................................................................................................... 2-32-3
Alarm Holdoff ............................................................................................................................................................................ 2-52-5
Database Synchronization of Alarms ................................................................................................................................ 2-62-6
Alarm Notification ................................................................................................................................................................... 2-72-7
Fault Management Pages ..................................................................................................................................................... 2-102-10
Related Fault Management Pages .................................................................................................................................... 2-122-12
....................................................................................................................................................................................................................................
365-315-148R6.4 Issue 1
March 2011
iii

Alarms Page ............................................................................................................................................................................. 2-132-13
Alarm Log ................................................................................................................................................................................. 2-152-15
Network Event Summary ................................................................................................................................................... 2-162-16
Alarm Filtering ........................................................................................................................................................................ 2-212-21
Threshold Crossing Alert (TCA) Processing ............................................................................................................... 2-222-22
Threshold Crossing Alert page .......................................................................................................................................... 2-222-22
Protection Switch Event Processing ............................................................................................................................... 2-232-23
Protection Switch Event Log Page ................................................................................................................................... 2-252-25
Root Cause Failure Processing .......................................................................................................................................... 2-252-25
Root Cause Failures Page .................................................................................................................................................... 2-272-27
View a List of Alarms on the Alarms Page ................................................................................................................... 2-302-30
View the Details of an Alarm on the Alarms Page ..................................................................................................... 2-342-34
Acknowledge Alarms on the Alarms Page .................................................................................................................... 2-352-35
Delete Instantaneous Alarms on the Alarms Page ...................................................................................................... 2-362-36
Acknowledge and Delete Alarms on the Alarms Page ............................................................................................. 2-372-37
View the Network Event Summary Page ...................................................................................................................... 2-392-39
Update Alarm Counts on the Network Event Summary Page ............................................................................... 2-402-40
Reset the New Event Indicator on the Network Event Summary Page .............................................................. 2-412-41
View the Details of Alarms from the Network Event Summary Page ................................................................ 2-422-42
View the Details of Equipment from the Network Event Summary Page ........................................................ 2-432-43
View the Details of Root Cause Failures from the Network Event Summary Page ...................................... 2-452-45
Update Root Cause Failure Counts on the Network Event Summary Page ..................................................... 2-472-47
Perform a Partial Database Synchronization for Alarms and Events .................................................................. 2-482-48
View the Alarm Status of an Equipment Component ............................................................................................... 2-502-50
View Alarm Log Records .................................................................................................................................................... 2-522-52
Export Alarm Log Records ................................................................................................................................................. 2-542-54
Delete Alarm Log Records .................................................................................................................................................. 2-562-56
Contents
....................................................................................................................................................................................................................................
....................................................................................................................................................................................................................................
iv 365-315-148R6.4 Issue 1
March 2011
View a List of Root Cause Failures on the Root Cause Failures Page ............................................................... 2-572-57
View the Details of a Root Cause Failure on the Root Cause Failure Page ...................................................... 2-612-61
Acknowledge Root Cause Failures on the Root Cause Failures Page ................................................................ 2-622-62
View Client Connections for a Root Cause ................................................................................................................. 2-632-63
View Services for a Root Cause ........................................................................................................................................ 2-642-64
View Affected Ports for a Root Cause ............................................................................................................................ 2-652-65
View Affected Ports on an NE for a Root Cause ........................................................................................................ 2-662-66
View a List of Threshold Crossing alerts ...................................................................................................................... 2-672-67
View the Details of Threshold Crossing Alerts from the Network Event Summary Page .......................... 2-712-71
Acknowledge a Threshold Crossing Alert ................................................................................................................... 2-722-72
View a List of Events on the Protection Switch Event Page .................................................................................. 2-732-73
Acknowledge a Protection Switch Event Log page ................................................................................................... 2-772-77
3 Performance Monitoring
Overview ...................................................................................................................................................................................... 3-13-1
The Performance Monitoring Feature ............................................................................................................................... 3-23-2
Performance Monitoring Pages ........................................................................................................................................... 3-33-3
PM Time Intervals and Data Viewing ............................................................................................................................... 3-53-5
PM Data Storage Behavior .................................................................................................................................................... 3-63-6
Performance Monitoring Counters ..................................................................................................................................... 3-83-8
Supported PM Parameters for NEs in the SDH/Ethernet Environment ............................................................. 3-473-47
Supported PM Parameters for NEs in the SONET/Ethernet Environment ....................................................... 3-563-56
Supported PM Parameters for NEs in the WDM Environment ............................................................................. 3-653-65
View a List of Performance Measurements Statistics ............................................................................................... 3-683-68
View a List of PM-Capable Termination Points ......................................................................................................... 3-693-69
Enable PM Data Collection ................................................................................................................................................ 3-713-71
Disable PM Data Collection ............................................................................................................................................... 3-733-73
Schedule Disable PM Data Collection ........................................................................................................................... 3-753-75
Contents
....................................................................................................................................................................................................................................
....................................................................................................................................................................................................................................
365-315-148R6.4 Issue 1
March 2011
v
Clear PM Data Collection for Selected Termination Points ................................................................................... 3-773-77
View the Current PM Measurements of a Termination Point ................................................................................ 3-793-79
View the History PM Measurements of a Termination Point ................................................................................. 3-813-81
View the Monitored NE Layer Rate Report ................................................................................................................. 3-833-83
Enable/Disable NE Layer Rates ........................................................................................................................................ 3-853-85
Generate a PM Report .......................................................................................................................................................... 3-873-87
Save a PM Report ................................................................................................................................................................... 3-893-89
Polling Current Measurements .......................................................................................................................................... 3-903-90
4 Profile Management
Overview ...................................................................................................................................................................................... 4-14-1
The Profile Management Feature ........................................................................................................................................ 4-24-2
View a List of NE Profiles ..................................................................................................................................................... 4-34-3
View a List of Current Assignments for NE Profiles ................................................................................................... 4-44-4
View Resource Details of a Current Assignment for an NE Profile ...................................................................... 4-54-5
Create an NE Profile ................................................................................................................................................................ 4-64-6
Modify an NE Profile .............................................................................................................................................................. 4-84-8
Delete an NE Profile ............................................................................................................................................................. 4-104-10
View the OMS NE Profile Template ............................................................................................................................... 4-124-12
Create an OMS NE Profile Template .............................................................................................................................. 4-134-13
Modify an OMS NE Profile Template ............................................................................................................................ 4-154-15
Delete an OMS NE Profile Template .............................................................................................................................. 4-174-17
Assign an OMS TCA Profile to an NE ........................................................................................................................... 4-194-19
Assign Threshold Profiles to Termination Points from PM Points Page .......................................................... 4-214-21
Enable an NE Profile ........................................................................................................................................................... 4-234-23
Disable an NE Profile .......................................................................................................................................................... 4-254-25
Assign an NE Profile to a Resource ................................................................................................................................ 4-274-27
Contents
....................................................................................................................................................................................................................................
....................................................................................................................................................................................................................................
vi 365-315-148R6.4 Issue 1
March 2011

Index
Contents
....................................................................................................................................................................................................................................
....................................................................................................................................................................................................................................
365-315-148R6.4 Issue 1
March 2011
vii

Contents
....................................................................................................................................................................................................................................
....................................................................................................................................................................................................................................
viii 365-315-148R6.4 Issue 1
March 2011
About this documentAbout this document
Purpose
This preface provides an overview of this information product, which is the Optical
Management System Service Assurance Guide.
The purpose of this OMS Service Assurance Guide is to explain to users how the OMS is
to be used to identify and isolate fault conditions and events in the network and to obtain
performance monitoring data.
Reason for revision
Issue 1 of this OMS Service Assurance Guide is a revised document that supports OMS
Release 6.4.
Intended audience
This OMS Service Assurance Guide is written primarily for operations personnel who use
and administer the OMS.
Safety information
This document does not contain any safety information or warnings because OMS is a
software product.
How to use this information product
In the broadest sense, this OMS Service Assurance Guide contains:
• Conceptual information, which is specific data related to the tasks
• Task information, which includes user tasks (that is, step-by-step instructions)
The conceptual information complements and enhances the step-by-step instructions that
are found in each task. Use the conceptual information to broaden your general
knowledge of the management system. It is best if you read all conceptual information
and have a good understanding of the concepts being presented before undertaking the
step-by-step instructions given in any task.
...................................................................................................................................................................................................................................
365-315-148R6.4 Issue 1
March 2011
ix
The task information is based on a user needs analysis that has been performed for each
management system user job; therefore, use the task information to get the job at hand
done quickly and with minimal system impact.
The conceptual and task information portions of the document have extensive hyperlinks.
Use these links to toggle between the two types of information presented so you can
access all pertinent information related to particular concepts and tasks.
This document can be used in its online versions (HTML/PDF) or in paper version (print
PDF). The online HTML document version has a search capability, a full table of contents
in the front matter of the document and a partial table of contents in each chapter, and an
index for each document and for the entire management system library. Use all of these
tools to help find information quickly. However, be aware that the index for each
document in the management system library and the index for the entire management
system library are the preferred search tools.
Important! This document contains information on the complete line of network
elements (NEs) that the OMS product supports. For a list of NEs that are supported in
Release 6.4 of the management system, refer to the Summary of Supported NEs that
is provided in Chapter 1 of this document.
In addition, this document contains information that is related to service packs (SPs)
or maintenance releases that the OMS product is to support in the near future. This
material may not yet be visible or operable on the management system servers and/or
GUI and has been added only as a convenience for our OMS customers. This material
is subject to change.
This document supports three hardware platforms on which OMS currently functions,
which are the OMS HP® PA-RISC Server Platform (often referred to as the Server
Platform), the OMS HP® Itanium® Server Platform (often referred to as the Server
Platform), and the OMS PC Platform (often referred to as the PC Platform). Because
the features that each platform supports vary, the variations of support are indicated in
the text of this document where appropriate. In addition, the document library is
offered on two CD-ROMs, depending on the platform on which OMS functions.
Refer to “Related documentation”, which is in this section of the document for details
regarding the two CD-ROMs that are available.
Conventions used
The conceptual information typically introduces each chapter or section of each chapter.
The information presented in this area varies according to the topic being
explained—sections, subsections, tables, figures, and screen captures can be commonly
found.
About this document
....................................................................................................................................................................................................................................
....................................................................................................................................................................................................................................
x 365-315-148R6.4 Issue 1
March 2011
The task information is presented as series of tasks that follows the conceptual
information. These tasks are typically presented in the following functional order,
depending on the nature of the subject being explained:
• View a List of . . .
• View the Details of . . .
• Add . . .
• Create . . .
• Modify . . .
• Delete . . .
Each task consists of sections that are called When to use, Before you begin, Related
information, and Task.
The intent of the When to use, Before you begin, and Related information sections is
self-explanatory—they explain when a task is to be used, what needs to be considered or
done before you begin the task, and any related information that you would need to know
while doing the task.
When a task does not have any conditions that must be considered before it is started, the
Before you begin section for that task states: This task does not have any preconditions.
Each Task section consists of any number of steps. The completion of all steps, which are
sequentially numbered, are required for the entire task to be completed successfully. In
some instances, a step might be prefaced with the wording Optional, which indicates that
the step can be skipped and the task can still be successfully completed. A task is
considered to be completed when all of its steps are completed and when the wording End
of Steps appears.
Many times, the management system affords the user with multiple ways to accomplish
the same task. In these instances, one task can present the user with several Methods of
how to accomplish the same set of steps successfully.
In addition, this OMS Service Assurance Guide relies on the following typographical
conventions to distinguish between user input and computer output.
• When describing the OMS software, fields in windows and field entries are identified
with this font.
• When describing the UNIX® environment, text and numbers that the user inputs to
the computer are identified with boldface type.
• In the UNIX® environment, text and numbers that the computer outputs to the user
are identified with monospace type.
This OMS Service Assurance Guide uses the following convention to indicate a path of
pages that should be navigated through to arrive at a destination page:
• Alarms and Events > Alarms
About this document
....................................................................................................................................................................................................................................
....................................................................................................................................................................................................................................
365-315-148R6.4 Issue 1
March 2011
xi
This same convention is also used to show a path through a series of menu items, for
example:
• Click the filtering tool, and select Node > Node Type.
Occasionally, a set of management system features is not supported for all NEs or for
both operating environments. This set of features is clearly marked to show these
exceptions.
Related documentation
This OMS Service Assurance Guide is part of a set of documents that supports the OMS.
An online version, in HTML format, of this document set is available on CD-ROM. The
OMS User Documentation CD-ROM (365-315-144R6.4) includes the full set of
documents listed below.
An online version, in HTML format, of this document set is provided as part of the OMS
software.
Documentation
The document set that supports the OMS is comprised of the following documents:
1. OMS Getting Started Guide 365-315-148R6.4, which instructs new users how to use
OMS. This document contains a glossary of terms.
2. OMS Network Element Management Guide (365-315-146R6.4), which instructs users
how to use OMS to provision and manage network elements.
3. OMS Ethernet Management Guide (365-315-147R6.4), which instructs users on how
to use the Ethernet Management feature to provision and manage Ethernet
connections in a network.
4. OMS Service Assurance Guide (365-315-148R6.4), which instructs users on how to
manage and interpret fault information collected from the network.
5. OMS Administration Guide (365-315-149R6.4), which instructs users on how to
administer and maintain OMS and the network.
6. OMS Connection Management Guide (365-315-150R6.4), which instructs users on
how to provision connections and manage connections in the OMS and the network.
About this document
....................................................................................................................................................................................................................................
....................................................................................................................................................................................................................................
xii 365-315-148R6.4 Issue 1
March 2011

Help products
OMS includes an extensive help system that is designed to consider the task the user is
performing and help the user successfully perform the task. The five help products
described in the following table can be accessed from the Help menu on the top
navigation bar of every page.
Help Product Help Menu
Item
Description
Task Help How do I ... Provides a list of tasks that can be performed from the
current page. Clicking a task in the list presents the actual
task. In addition, access is provided to the Index, which is
the preferred search tool for the help system.
Page Help About this
page
Describes the purpose of the page, the toolbar tools, and a
description of each field on the page. In addition, access is
provided to the Index, which is the preferred search tool
for the help system.
On-line
Document
Library
On-line docsPresents the library of user documents, in both HTML and
PDF formats. A search engine is included. Note: Access to
the index of each document is provided. The index for the
help system, which is the preferred search tool, is
accessed from How do I..., About this Page, or Technical
Support pages.
Technical
Support Help
Technical
Support
Provides technical support contact information. In
addition, access is provided to the Index, which is the
preferred search tool for the help system.
Product Help About OMS A pop-up window shows the version of the management
system, along with links to the copyright and the OMS
product pages. This page also contains information to
acknowledge the open source software that OMS System
uses.
How to order
The ordering number for this document is 365-315-148R6.4. To order OMS information
products, contact your local Alcatel-Lucent customer support team.
How to comment
To comment on this document, go to the Online Comment Form (http://infodoc.alcatel-
lucent.com/comments/enus/) or e-mail your comments to the Comments Hotline
About this document
....................................................................................................................................................................................................................................
....................................................................................................................................................................................................................................
365-315-148R6.4 Issue 1
March 2011
xiii

About this document
....................................................................................................................................................................................................................................
....................................................................................................................................................................................................................................
xiv 365-315-148R6.4 Issue 1
March 2011
1 1Service Assurance
Overview
Purpose
This chapter provides general information about the OMS product and service assurance,
which includes fault management and performance monitoring.
Contents
Product Overview 1-1
Supported Network Elements 1-3
A Quick Look at Service Assurance 1-9
Product Overview
Definition
OMS is an integrated, modular system that offers a range of network element (NE),
network connection, and service/order management functions. It links the management of
traditional network equipment with next-generation technology and offers distribution
options that can grow with network expansion. OMS controls service-restoration
properties within the network, and complements this service-quality management with its
own high-availability configurations.
OMS offers the benefits of fast service activation, state-of-the-art provisioning, reduced
operating and equipment costs, accurate record keeping, fault management, and fast
problem resolution. In addition, the management system can discover much of the
information about NEs and network connections, instead of requiring that information to
be entered manually, which minimizes network operator effort and reduces errors.
...................................................................................................................................................................................................................................
365-315-148R6.4 Issue 1
March 2011
1-1
About the software
OMS is run through an Internet browser-based Graphical User Interface (GUI)—it is a
weblication that runs through a browser. It supports the standard web features that a
browser offers, such as bookmarks, back, forward, reload, and print.
In addition, the management system provides standard machine-to-machine interfaces so
it can be easily integrated into the embedded operations environment of the service
provider.
Support for both the SONET/SDH operating environments
The management system supports both the Synchronous Optical Network (SONET) and
the Synchronous Digital Hierarchy (SDH) operating environments. The particular
operating environment to be used is controlled by an installation parameter; refer to the
OMS Administration Guide for details.
User role profiles
When a user account is created, it is assigned a user role profile, which restricts the tasks
the user login can perform. The management system offers these three predefined factory
user role profiles:
• NOC Administrator
• NOC Expert Operator
• NOC Operator
In addition, the management system allows the creation of a user-defined user role
profile, which is a user role profile that consists of a customized list of tasks that is
specific to the job responsibilities of the user.
Refer to the OMS Administration Guide for details.
Installation parameters
An installation parameter is a parameter that is set during installation of the management
system and may control the behavior of a feature.
Refer to the OMS Administration Guide for details.
User Activity Log
All provisioning changes done using the management system are logged in the User
Activity Log. For more information, see the OMS Provisioning Guide.
Although it is not stated as part of the results for every task in this document, you can
assume that all tasks that result in a management system weblication change are logged to
the User Activity Log.
Service Assurance Product Overview
....................................................................................................................................................................................................................................
....................................................................................................................................................................................................................................
1-2 365-315-148R6.4 Issue 1
March 2011
Supported Network Elements
The management system and its supported NEs
OMS supports Alcatel-Lucent's family of optical NEs. To accommodate the world of
optical transmission standards, these Alcatel-Lucent NEs operate using different transport
structures and they support different native command languages. Refer to “Summary of
supported NEs” (p. 1-4) for a list of the particular NEs and the releases of those NEs that
the management system supports.
Supported transport structures
Alcatel-Lucent's NEs are designed to operate in the Synchronous Digital Hierarchy
(SDH) operating environment, the Synchronous Optical Network (SONET) operating
environment, or both environments. The Mobility Aggregation and Transport System
(MATS) NE is an Ethernet NE that operates using Ethernet transport structure. Refer to
“Summary of supported NEs” (p. 1-4) for a list of the transport structure of each
supported NE.
Native command languages
Each NE supports a native command language that is used to control the NE at the
network-element-level via the Craft Interface Terminal (CIT).
The management system supports NEs that are controlled with the following three
different native command languages:
• TL1, which is Transaction Language 1
• CMISE, which is Common Management Information Service Element
• Simple Network Management Protocol (SNMP)/Command Line Interface (CLI)
Note: SNMP is generally used to retrieve information from the NE; CLI is generally
used for provisioning of the NE.
The management system uses the native command language of the NE to implement
some of its features; consequently, differences in management system behavior can be
attributed to one native command language or another, which is why this categorization is
significant. The management system also indirectly manages CBX-3500 NEs via a
TMF-814 interface to the management system of the CBX-3500 NEs called CBGX-EMS.
Therefore, throughout this document, references are made to TL1 NEs, CMISE NEs, or
SNMP/CLI NEs.
Refer to “Summary of supported NEs” (p. 1-4) for a list of the native command language
of each supported NE.
Service Assurance Supported Network Elements
....................................................................................................................................................................................................................................
....................................................................................................................................................................................................................................
365-315-148R6.4 Issue 1
March 2011
1-3
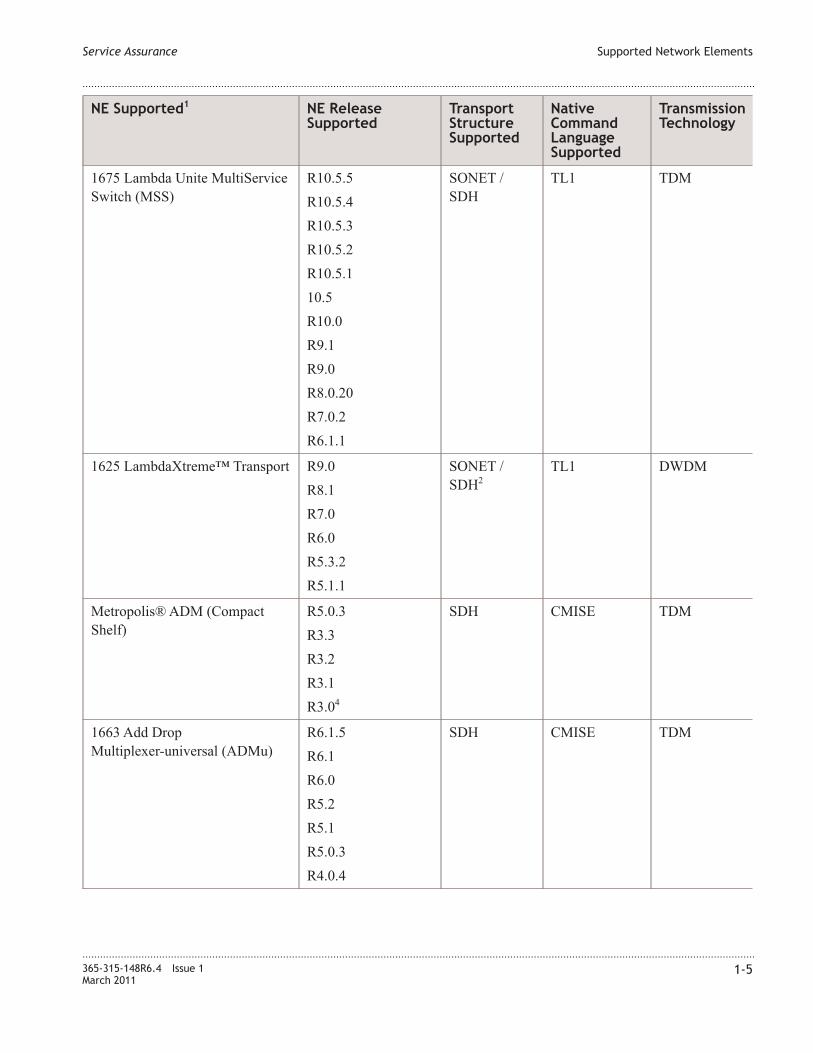
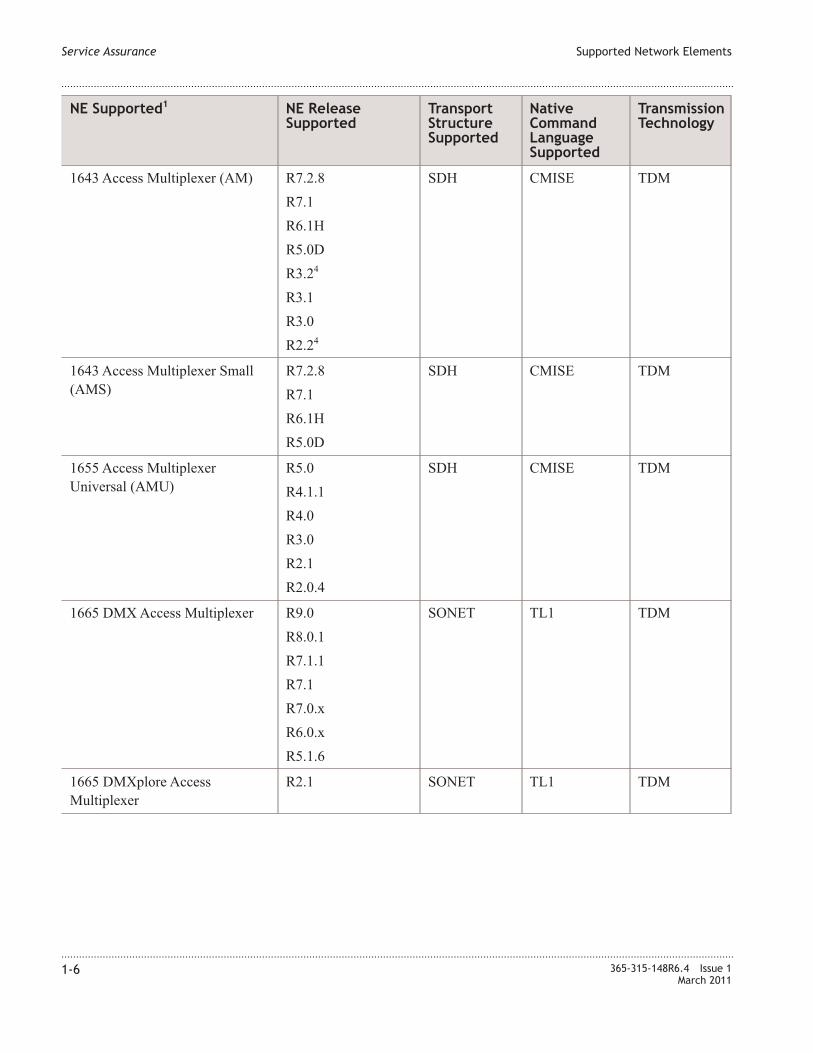
Summary of supported NEs
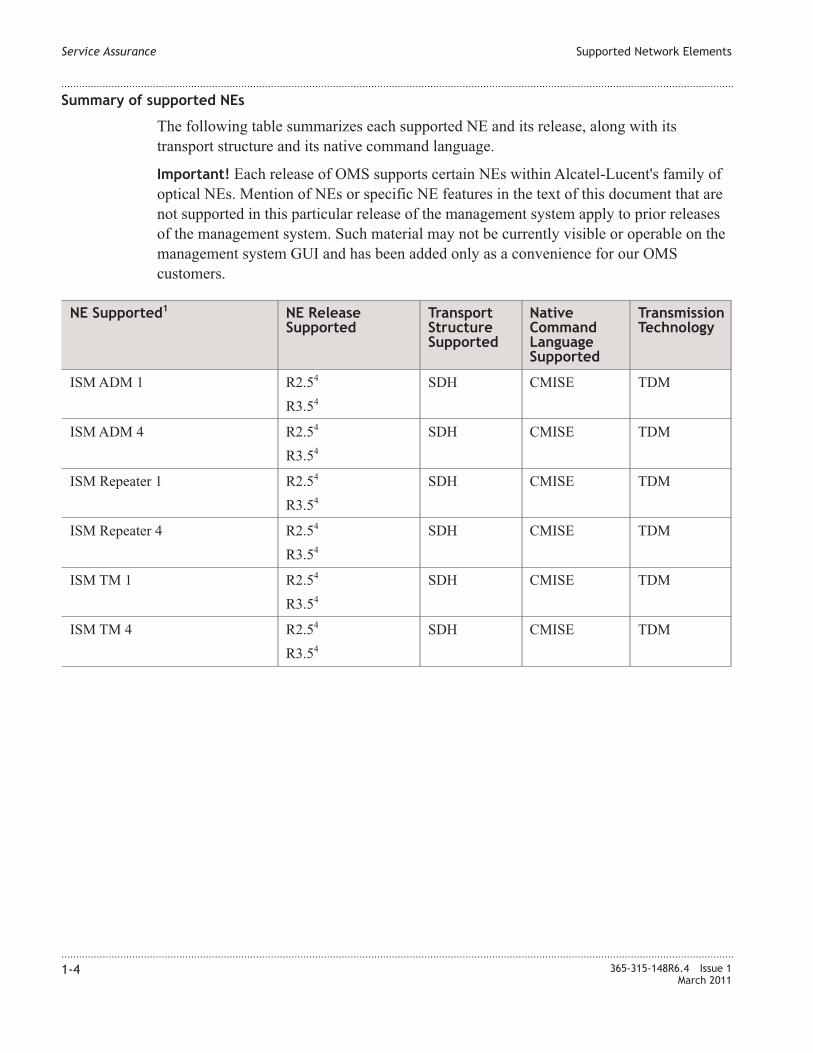
The following table summarizes each supported NE and its release, along with its
transport structure and its native command language.
Important! Each release of OMS supports certain NEs within Alcatel-Lucent's family of
optical NEs. Mention of NEs or specific NE features in the text of this document that are
not supported in this particular release of the management system apply to prior releases
of the management system. Such material may not be currently visible or operable on the
management system GUI and has been added only as a convenience for our OMS
customers.
NE Supported1
NE Release
Supported
Transport
Structure
Supported
Native
Command
Language
Supported
Transmission
Technology
ISM ADM 1 R2.54
R3.54
SDH CMISE TDM
ISM ADM 4 R2.54
R3.54
SDH CMISE TDM
ISM Repeater 1 R2.54
R3.54
SDH CMISE TDM
ISM Repeater 4 R2.54
R3.54
SDH CMISE TDM
ISM TM 1 R2.54
R3.54
SDH CMISE TDM
ISM TM 4 R2.54
R3.54
SDH CMISE TDM
Service Assurance Supported Network Elements
....................................................................................................................................................................................................................................
....................................................................................................................................................................................................................................
1-4 365-315-148R6.4 Issue 1
March 2011
NE Supported1
NE Release
Supported
Transport
Structure
Supported
Native
Command
Language
Supported
Transmission
Technology
1675 Lambda Unite MultiService
Switch (MSS)
R10.5.5
R10.5.4
R10.5.3
R10.5.2
R10.5.1
10.5
R10.0
R9.1
R9.0
R8.0.20
R7.0.2
R6.1.1
SONET /
SDH
TL1 TDM
1625 LambdaXtreme™ Transport R9.0
R8.1
R7.0
R6.0
R5.3.2
R5.1.1
SONET /
SDH2
TL1 DWDM
Metropolis® ADM (Compact
Shelf)
R5.0.3
R3.3
R3.2
R3.1
R3.04
SDH CMISE TDM
1663 Add Drop
Multiplexer-universal (ADMu)
R6.1.5
R6.1
R6.0
R5.2
R5.1
R5.0.3
R4.0.4
SDH CMISE TDM
Service Assurance Supported Network Elements
....................................................................................................................................................................................................................................
....................................................................................................................................................................................................................................
365-315-148R6.4 Issue 1
March 2011
1-5
NE Supported1
NE Release
Supported
Transport
Structure
Supported
Native
Command
Language
Supported
Transmission
Technology
1643 Access Multiplexer (AM) R7.2.8
R7.1
R6.1H
R5.0D
R3.24
R3.1
R3.0
R2.24
SDH CMISE TDM
1643 Access Multiplexer Small
(AMS)
R7.2.8
R7.1
R6.1H
R5.0D
SDH CMISE TDM
1655 Access Multiplexer
Universal (AMU)
R5.0
R4.1.1
R4.0
R3.0
R2.1
R2.0.4
SDH CMISE TDM
1665 DMX Access Multiplexer R9.0
R8.0.1
R7.1.1
R7.1
R7.0.x
R6.0.x
R5.1.6
SONET TL1 TDM
1665 DMXplore Access
Multiplexer
R2.1 SONET TL1 TDM
Service Assurance Supported Network Elements
....................................................................................................................................................................................................................................
....................................................................................................................................................................................................................................
1-6 365-315-148R6.4 Issue 1
March 2011

NE Supported1
NE Release
Supported
Transport
Structure
Supported
Native
Command
Language
Supported
Transmission
Technology
1665 DMXtend Access
Multiplexer
R9.0
R8.0.1
R5.1.1
R5.1
R5.0.x
R4.0.x
R3.1.x
SONET TL1 TDM
1694 Enhanced Optical
Networking (EON)
R8.8
R8.6.3
R8.4.1
SONET /
SDH2
TL1 DWDM
1695 Wavelength Services
Manager (WSM)
R6.0
R5.0
R4.5
R4.0
R3.0
SONET /
SDH2
TL1 DWDM
PHASE ADM 4/4 R5.04
SDH CMISE TDM
PHASE ADM 16/4 R5.04
SDH CMISE TDM
PHASE LR 4 R5.04
SDH CMISE TDM
PHASE LR 16 R5.04
SDH CMISE TDM
PHASE LXC 4/1 R5.04
SDH CMISE TDM
PHASE LXC 16/1 R5.04
SDH CMISE TDM
PHASE TM 4/4 R5.04
SDH CMISE TDM
PHASE TM 16/4 R5.04
SDH CMISE TDM
SLM-ADM-16 R5.04
SDH CMISE TDM
SLM MS Protected TM 4 R5.04
SDH CMISE TDM
SLM MS Protected TM 16 R5.04
SDH CMISE TDM
SLM Regenerator 4 R5.04
SDH CMISE TDM
SLM Regenerator 16 R5.04
SDH CMISE TDM
SLM Unprotected TM 4 R5.04
SDH CMISE TDM
SLM Unprotected TM 16 R5.04
SDH CMISE TDM
WaveStar® ADM 4/1 V5 R44
SDH CMISE TDM
Service Assurance Supported Network Elements
....................................................................................................................................................................................................................................
....................................................................................................................................................................................................................................
365-315-148R6.4 Issue 1
March 2011
1-7
NE Supported1
NE Release
Supported
Transport
Structure
Supported
Native
Command
Language
Supported
Transmission
Technology
WaveStar® ADM 16/1 R8.0.4
R7.0.1
R6.2.54
R6.1,
R6.04
SDH CMISE TDM
WaveStar® AM 1 R3.14
SDH CMISE TDM
WaveStar® Bandwidth Manager R4.1.63, 7
SONET TL1 TDM
WaveStar® DACS 4/4/1 R3.1.4
R3.04
SDH CMISE TDM
WaveStar® OLS 1.6T R11.0
R10.0
R9.07
R8.03, 7
R7.16, 7
R6.2.26, 7
SDH TL1 DWDM
WaveStar® TDM 10G (STM64) R5.0.5
R4.05
SDH TL1 TDM
1645 Access Multiplexer
Compact (AMC)
R9.1.1
R9.1.2
R9.0
R8.0
SDH CMISE TDM
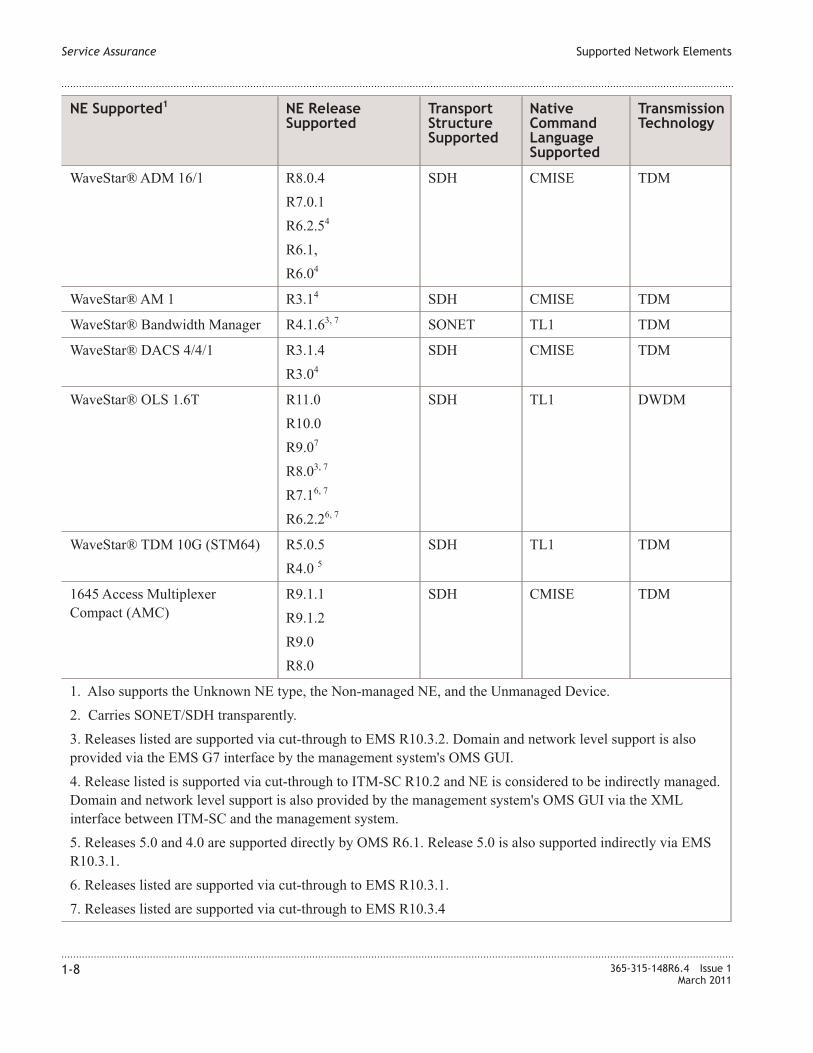
1. Also supports the Unknown NE type, the Non-managed NE, and the Unmanaged Device.
2. Carries SONET/SDH transparently.
3. Releases listed are supported via cut-through to EMS R10.3.2. Domain and network level support is also
provided via the EMS G7 interface by the management system's OMS GUI.
4. Release listed is supported via cut-through to ITM-SC R10.2 and NE is considered to be indirectly managed.
Domain and network level support is also provided by the management system's OMS GUI via the XML
interface between ITM-SC and the management system.
5. Releases 5.0 and 4.0 are supported directly by OMS R6.1. Release 5.0 is also supported indirectly via EMS
R10.3.1.
6. Releases listed are supported via cut-through to EMS R10.3.1.
7. Releases listed are supported via cut-through to EMS R10.3.4
Service Assurance Supported Network Elements
....................................................................................................................................................................................................................................
....................................................................................................................................................................................................................................
1-8 365-315-148R6.4 Issue 1
March 2011
A Quick Look at Service Assurance
Service Assurance definition
Service Assurance is a combination of management system features that affords the user
the capabilities of fault management and performance monitoring.
Fault Management features
A comprehensive set of Fault Management features allows users to monitor and track
alarms and transient condition events in the network. The management system receives
and processes the alarms on the network in real time, which enables a network operator to
locate and repair faults in the network. The following features can be used to monitor and
track alarms and events that occur in the network:
• Alarm synchronization
• Alarm and event logging
• Audible and visual notification of alarms and events
• Alarm List
• Network Event Summary (NES)
• Symptomatic Alarm Filtering (SAF)
• Threshold Crossing Alert (TCA)
• Protection Switch Event Log (PSE)
• TMN Integration Module (TIM) Alarms Northbound Interface. For more details about
this feature, refer to the OMS Administration Guide.
• Root Cause Failures (RCF)
Complete details about the Fault Management feature are provided in Chapter 2, “Fault
Management”.
Performance Monitoring features
Performance Monitoring facilitates the planning and implementation of proactive,
forward-looking network maintenance strategies by providing a centralized facility to
monitor network performance systematically, which is accomplished by non-intrusively
gathering in-service information about the state of the managed NEs. This process is
commonly referred to as performance monitoring (PM) data. The PM data that is
gathered can be used to track recurring traffic errors and service degradation at specific
points in the network, with the intention of identifying facilities that should be repaired or
upgraded to avoid possible interruption of service.
Performance Monitoring features enables the user to do the following:
• Enable the collection of PM data on termination points, which can include ports
• Enable or disable on-demand PM data collection for one or more NE ports
Service Assurance A Quick Look at Service Assurance
....................................................................................................................................................................................................................................
....................................................................................................................................................................................................................................
365-315-148R6.4 Issue 1
March 2011
1-9
• Display current PM parameter measurements for a selected NE port or signal
• Enable the scheduled collection of PM data for one or more NE ports for a specific
date/time period, or cancel the scheduled PM data collection on selected port or ports
• Generate and view a formatted report of PM data collected from one or more NE
ports that have PM data collection enabled
Complete details about the Performance Monitoring feature are provided in Chapter 3,
“Performance Monitoring”.
Profile Management features
Profile Management allows the user to create various configurations (profiles) for a
resource (ports and pieces of equipment) for NEs that are supported. These configurations
are then linked to a set of resources.
The Profile Management feature has the following parts:
• NE Profile Management
• NE Profile Assignment
Complete details about the Profile Management feature are provided in Chapter 4,
“Profile Management”.
Service Assurance A Quick Look at Service Assurance
....................................................................................................................................................................................................................................
....................................................................................................................................................................................................................................
1-10 365-315-148R6.4 Issue 1
March 2011
2 2Fault Management
Overview
Purpose
This chapter provides general information about monitoring alarms and fault conditions
in the managed network using the OMS and the tasks that can be performed to monitor
alarms and fault conditions.
Contents
The Fault Management Feature 2-3
Alarm Holdoff 2-5
Database Synchronization of Alarms 2-6
Alarm Notification 2-7
Fault Management Pages 2-10
Related Fault Management Pages 2-12
Alarms Page 2-13
Alarm Log 2-15
Network Event Summary 2-16
Alarm Filtering 2-21
Threshold Crossing Alert (TCA) Processing 2-22
Threshold Crossing Alert page 2-22
Protection Switch Event Processing 2-23
Protection Switch Event Log Page 2-25
Root Cause Failure Processing 2-25
Root Cause Failures Page 2-27
View a List of Alarms on the Alarms Page 2-30
...................................................................................................................................................................................................................................
365-315-148R6.4 Issue 1
March 2011
2-1

View the Details of an Alarm on the Alarms Page 2-34
Acknowledge Alarms on the Alarms Page 2-35
Delete Instantaneous Alarms on the Alarms Page 2-36
Acknowledge and Delete Alarms on the Alarms Page 2-37
View the Network Event Summary Page 2-39
Update Alarm Counts on the Network Event Summary Page 2-40
Reset the New Event Indicator on the Network Event Summary Page 2-41
View the Details of Alarms from the Network Event Summary Page 2-42
View the Details of Equipment from the Network Event Summary Page 2-43
View the Details of Root Cause Failures from the Network Event Summary
Page
2-45
Update Root Cause Failure Counts on the Network Event Summary Page 2-47
Perform a Partial Database Synchronization for Alarms and Events 2-48
View the Alarm Status of an Equipment Component 2-50
View Alarm Log Records 2-52
Export Alarm Log Records 2-54
Delete Alarm Log Records 2-56
View a List of Root Cause Failures on the Root Cause Failures Page 2-57
View the Details of a Root Cause Failure on the Root Cause Failure Page 2-61
Acknowledge Root Cause Failures on the Root Cause Failures Page 2-62
View Client Connections for a Root Cause 2-63
View Services for a Root Cause 2-64
View Affected Ports for a Root Cause 2-65
View Affected Ports on an NE for a Root Cause 2-66
View a List of Threshold Crossing alerts 2-67
View the Details of Threshold Crossing Alerts from the Network Event
Summary Page
2-71
Acknowledge a Threshold Crossing Alert 2-72
View a List of Events on the Protection Switch Event Page 2-73
Acknowledge a Protection Switch Event Log page 2-77
Fault Management Overview
....................................................................................................................................................................................................................................
....................................................................................................................................................................................................................................
2-2 365-315-148R6.4 Issue 1
March 2011
The Fault Management Feature
Fault Management definitions
Fault Management is a management system feature that enables users to monitor and
track events and transient events in the network. With the addition of the Fault
Management Correlation Logic (OMS_RCF) license, Fault Management enables users to
identify potential Root Cause Failures in the network and the network services that are
impacted by those failures.
Events tracked
The management system tracks the following two broad categories of events in a
network:
• An alarm, which is a visible or audible signal that indicates that an equipment or
transmission failure or a significant event/condition has occurred. Alarms are
categorized into multiple levels that identify their relative severity.
• A Threshold Crossing Alert (TCA) is a message that an NE issues if the value of a
performance monitoring (PM) parameter exceeds a set threshold value. An example of
a PM parameter for which a TCA can be issued if the threshold value is exceeded is
the Number of Errored Seconds.
• A Protection Switch Events (PSE) Log is generated when a protection switch occurs
in a network element and causes traffic to be switched between a worker and a
protection entity.
You will be able to use the Protection Switch Event log to acknowledge a PSE in
order to mark it as seen by a network operator.
Optical Management System will include the following protection switch event types:
• Equipment Protection Groups
• MS Protection Groups
• MS-SPRing Groups
• High Order (OCH, STS1, STS3c, AU3 and AU4) SNCP
• RPR Protection for Ethernet
Important! The management system stores a maximum of 300,000 historic alarms and
100,000 current alarms.
Process overview
In general, the management system processes and analyzes alarms generated from the
managed NEs. Alarms and events are first received in the management system; then, NE
alarms and events are pinpointed to the shelf, slot, physical port, or logical port level.
In addition, the management system generates and logs security alarms in order to track
such occurrences as the number of failed login attempts by an unauthorized user.
Fault Management The Fault Management Feature
....................................................................................................................................................................................................................................
....................................................................................................................................................................................................................................
365-315-148R6.4 Issue 1
March 2011
2-3
Alarm status
The management system informs users about the current alarm status and alerts them to a
new raised alarm through the following mechanisms:
• The use of color; see “Alarm Notification” (p. 2-7) for details.
• The use of audible signals; see “Audible notification” (p. 2-7) for details.
• Immediately available alarm details; see “Network Event Summary ” (p. 2-16) for
details.
• Current tallies of alarms; see “Network Event Summary ” (p. 2-16) for details.
Data “Chunking”
If a search request results in at least 150 data records, the search result data is “chunked”
(grouped) into sets of 150 data records. If the search request results in more than 150
records, the next set of 150 data records is “chunked” in the same manner. Links to each
set of the 150 records numbered sequentially from 1 to 3 are displayed at the bottom of
the table. The user can also click the Next or Previous links to display additional search
request data results in groups of 150 records.
Alarm Visibility within Domains
An alarm is visible to a user only if the object that the alarm is reported on is a member of
the user’s parent geographical domain or a member of any of the children belonging to
that domain.
The following table lists the alarm types that will be visible.
Alarm Types Description
NES These alarm types are visible in the NES and
contribute to the NES counters:
• OMS Platform Alarms
• Alarms on objects which are in the user’s
domain or sub-domain
Note: The network discrepancy events
counters are not filtered by domain.
Alarm List These alarm types are visible in the alarm list:
• OMS Platform Alarms
• Alarms on objects which are in the user’s
domain or sub-domain
Alarm Log All alarms are visible in the alarm log
independently of domain settings.
Fault Management The Fault Management Feature
....................................................................................................................................................................................................................................
....................................................................................................................................................................................................................................
2-4 365-315-148R6.4 Issue 1
March 2011
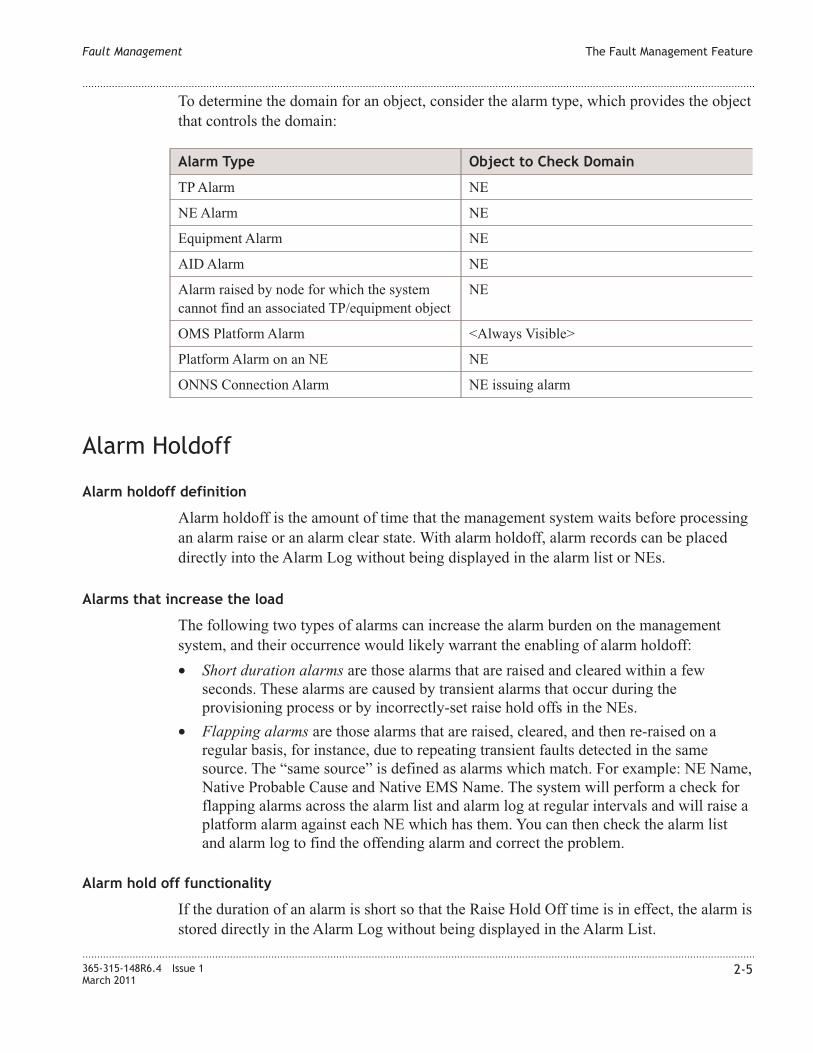
To determine the domain for an object, consider the alarm type, which provides the object
that controls the domain:
Alarm Type Object to Check Domain
TP Alarm NE
NE Alarm NE
Equipment Alarm NE
AID Alarm NE
Alarm raised by node for which the system
cannot find an associated TP/equipment object
NE
OMS Platform Alarm <Always Visible>
Platform Alarm on an NE NE
ONNS Connection Alarm NE issuing alarm
Alarm Holdoff
Alarm holdoff definition
Alarm holdoff is the amount of time that the management system waits before processing
an alarm raise or an alarm clear state. With alarm holdoff, alarm records can be placed
directly into the Alarm Log without being displayed in the alarm list or NEs.
Alarms that increase the load
The following two types of alarms can increase the alarm burden on the management
system, and their occurrence would likely warrant the enabling of alarm holdoff:
• Short duration alarms are those alarms that are raised and cleared within a few
seconds. These alarms are caused by transient alarms that occur during the
provisioning process or by incorrectly-set raise hold offs in the NEs.
• Flapping alarms are those alarms that are raised, cleared, and then re-raised on a
regular basis, for instance, due to repeating transient faults detected in the same
source. The “same source” is defined as alarms which match. For example: NE Name,
Native Probable Cause and Native EMS Name. The system will perform a check for
flapping alarms across the alarm list and alarm log at regular intervals and will raise a
platform alarm against each NE which has them. You can then check the alarm list
and alarm log to find the offending alarm and correct the problem.
Alarm hold off functionality
If the duration of an alarm is short so that the Raise Hold Off time is in effect, the alarm is
stored directly in the Alarm Log without being displayed in the Alarm List.
Fault Management The Fault Management Feature
....................................................................................................................................................................................................................................
....................................................................................................................................................................................................................................
365-315-148R6.4 Issue 1
March 2011
2-5
Note: If a short duration alarm is held off, it is not immediately stored in the Alarm Log.
The management system retrieves these alarms and places them in the Alarm Log,
periodically.
At regular intervals, the management system checks if any suppressed alarms have been
added to the Alarm Log since the last check occurred, and raises a platform alarm if it
finds any suppressed alarms.
The platform alarm generation is controlled by the system parameter FM_SUPPRESSED_
ALARMS_LOGGING. If the value of this parameter is set to ‘ENABLED’ then only
platform alarm is generated.
Alarm priorities
Alarms are assigned a priority based upon the alarm's probable cause. In the network
adaptor each priority is assigned to a different hold off time, lower priority alarms are
assigned a greater hold off time than higher priority alarms. This can result in higher
priority alarms overtaking lower priority alarms during processing, which will aid the
user in more rapid fault diagnosis.
Topology Based Alarm Filtering
For connections across large networks fault management is performed on a subset of the
alarms reported by the connection midpoints, rather than on all alarms types on every TP
connection. This results in the reduction of the number of alarms being processed without
reducing the quality of connection monitoring being performed.
OMS identifies important TP types in the network, based on topology, and then to provide
filtering of alarms at those points, based on the incoming alarm type. This feature is
controlled by a installation parameter (FM_TOPOLOGY_FILTERING) which can be
used to enable/disable it.
Database Synchronization of Alarms
Database synchronization of alarms definition
Database synchronization of alarms is the process of retrieving the current alarm status
from the network, and auditing and updating the management system view of the current
alarm status to match the current network view. The management system creates and
clears alarms in its view as necessary to become consistent with the current network
status.
Fault Management Alarm Holdoff
....................................................................................................................................................................................................................................
....................................................................................................................................................................................................................................
2-6 365-315-148R6.4 Issue 1
March 2011
Synchronization Types
The Application supports and uses Full Alarm synchronization which may be executed
automatically or manually. Synchronization of persistent raised TCAs is supported;
however transient TCAs or PSEs are not supported.
Automatic alarm synchronization
The management system automatically synchronizes alarms whenever communication
with an NE is reestablished or when an NE is added to the management system database.
Manual Synchronization
The Application provides the user with the ability to Full Alarm synchronization for all
raise notifications held in the OMS for a single NE with those actually held by the NE.
The database synchronization process can be initiated from the Initiate Database
Synchronization page of the management system.
Refer to the OMS Network Element Management Guide, Database Synchronization
section, for a further explanation of on-demand alarm synchronization.
Alarm Notification
Alarm notification methods
The management system notifies its users of any alarm messages through the following
methods:
• an audible indication
• severity levels represented in various colors
Audible notification
An audible alarm feature provides an audible indication of new alarms or transient
condition events on managed NEs. This feature can be enabled or disabled, and the
characteristics of the audible signal (the number of audible beeps) can be set through the
Preferences feature. For more details about setting user preferences, refer to the OMS
Getting Started Guide.
Alarm severity levels
The management system categorizes alarm messages by severity level for two standards:
the X.733 severity level standard and the Prompt/Deferred/Information (PDI) standard.
Alarm severity levels, combined with the use of color, provide the primary method to
notify management system users of alarm messages.
Fault Management Database Synchronization of Alarms
....................................................................................................................................................................................................................................
....................................................................................................................................................................................................................................
365-315-148R6.4 Issue 1
March 2011
2-7
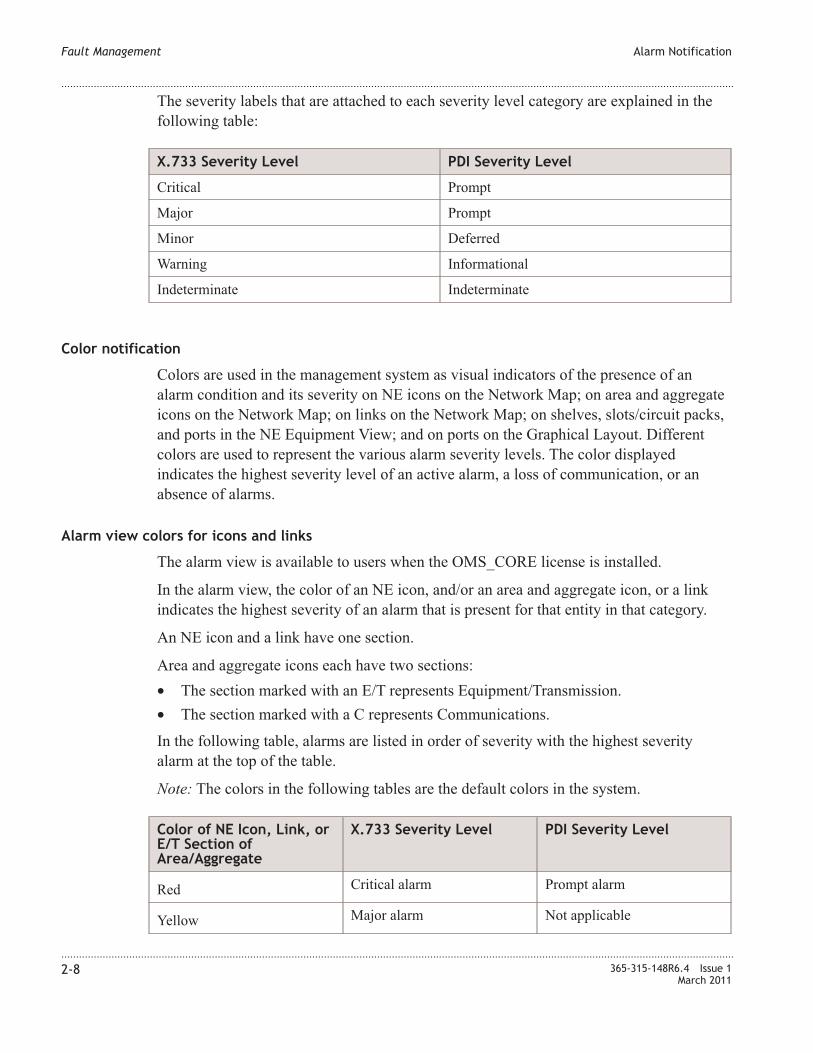
The severity labels that are attached to each severity level category are explained in the
following table:
X.733 Severity Level PDI Severity Level
Critical Prompt
Major Prompt
Minor Deferred
Warning Informational
Indeterminate Indeterminate
Color notification
Colors are used in the management system as visual indicators of the presence of an
alarm condition and its severity on NE icons on the Network Map; on area and aggregate
icons on the Network Map; on links on the Network Map; on shelves, slots/circuit packs,
and ports in the NE Equipment View; and on ports on the Graphical Layout. Different
colors are used to represent the various alarm severity levels. The color displayed
indicates the highest severity level of an active alarm, a loss of communication, or an
absence of alarms.
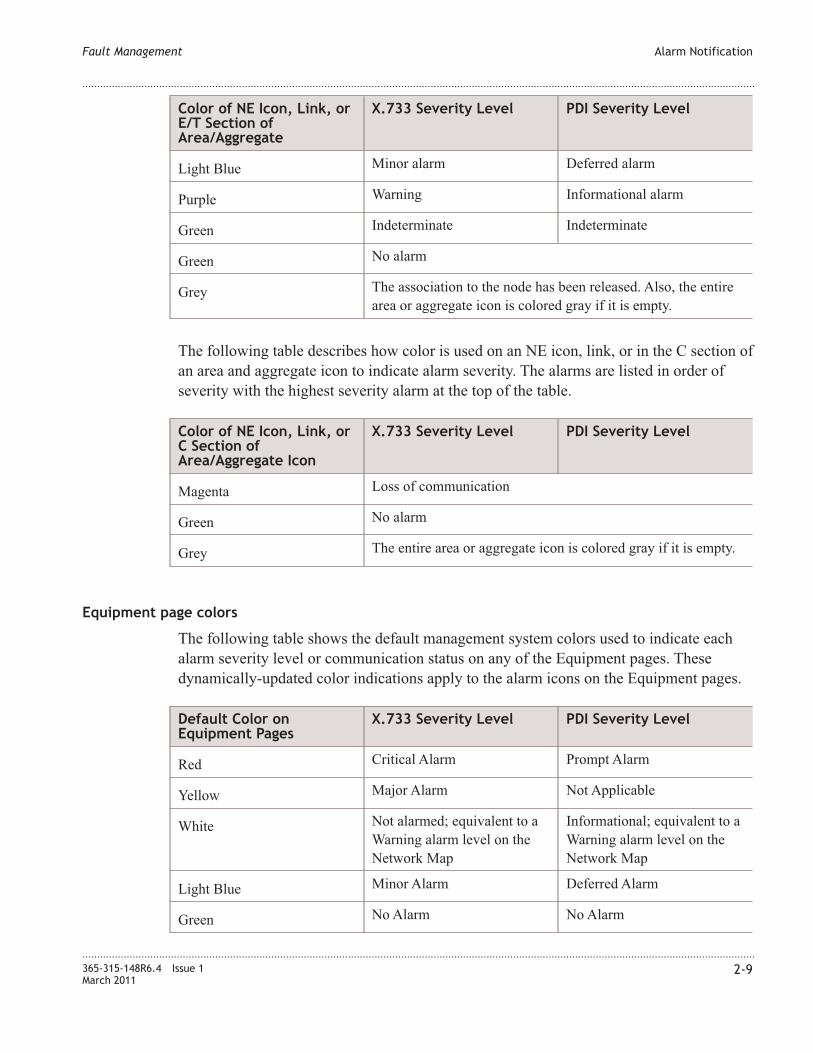
Alarm view colors for icons and links
The alarm view is available to users when the OMS_CORE license is installed.
In the alarm view, the color of an NE icon, and/or an area and aggregate icon, or a link
indicates the highest severity of an alarm that is present for that entity in that category.
An NE icon and a link have one section.
Area and aggregate icons each have two sections:
• The section marked with an E/T represents Equipment/Transmission.
• The section marked with a C represents Communications.
In the following table, alarms are listed in order of severity with the highest severity
alarm at the top of the table.
Note: The colors in the following tables are the default colors in the system.
Color of NE Icon, Link, or
E/T Section of
Area/Aggregate
X.733 Severity Level PDI Severity Level
RedCritical alarm Prompt alarm
YellowMajor alarm Not applicable
Fault Management Alarm Notification
....................................................................................................................................................................................................................................
....................................................................................................................................................................................................................................
2-8 365-315-148R6.4 Issue 1
March 2011
Color of NE Icon, Link, or
E/T Section of
Area/Aggregate
X.733 Severity Level PDI Severity Level
Light BlueMinor alarm Deferred alarm
PurpleWarning Informational alarm
GreenIndeterminate Indeterminate
GreenNo alarm
GreyThe association to the node has been released. Also, the entire
area or aggregate icon is colored gray if it is empty.
The following table describes how color is used on an NE icon, link, or in the C section of
an area and aggregate icon to indicate alarm severity. The alarms are listed in order of
severity with the highest severity alarm at the top of the table.
Color of NE Icon, Link, or
C Section of
Area/Aggregate Icon
X.733 Severity Level PDI Severity Level
MagentaLoss of communication
GreenNo alarm
GreyThe entire area or aggregate icon is colored gray if it is empty.
Equipment page colors
The following table shows the default management system colors used to indicate each
alarm severity level or communication status on any of the Equipment pages. These
dynamically-updated color indications apply to the alarm icons on the Equipment pages.
Default Color on
Equipment Pages
X.733 Severity Level PDI Severity Level
RedCritical Alarm Prompt Alarm
YellowMajor Alarm Not Applicable
WhiteNot alarmed; equivalent to a
Warning alarm level on the
Network Map
Informational; equivalent to a
Warning alarm level on the
Network Map
Light BlueMinor Alarm Deferred Alarm
GreenNo Alarm No Alarm
Fault Management Alarm Notification
....................................................................................................................................................................................................................................
....................................................................................................................................................................................................................................
365-315-148R6.4 Issue 1
March 2011
2-9

Fault Management Pages
Specifically designed pages
The pages of the management system that are specifically designed to present fault
management information are the following:
• Alarms page
• Alarm Log page
• Network Event Summary page
• Root Cause Failures page
• Protection Switch Event Log page
• Threshold Crossing Alert page
Alarms page
The Alarms page displays a complete, detailed listing of currently active alarms and
events, with related information about the status, source, probable cause, raise date and
time, clear date and time, ID of the user who acknowledged the alarm or event, and other
pertinent information. For more details, see the “Alarms Page” (p. 2-13) section.
Alarm Log page
The Alarm Log page displays historic information about alarms and events. For more
details, see the “Alarm Log” (p. 2-15) section.
Network Event Summary page
The Network Event Summary page displays a current tally of the total number of raised
alarms and Threshold Crossing Alerts (TCAs), total number of acknowledged raised
alarms and TCAs, and unacknowledged cleared alarms and TCAs, with a summary listing
of the most recently received raised and cleared alarms. The Network Event Summary
also displays the number of unacknowledged PSEs and a summary listing of the most
recently raised PSEs.
Note: Details about an alarm are immediately available on the Network Event Summary
page, which is also accessible from the Alarms page or the Graphical Layout page.
Additionally, counts are available for:
• total raised and unacknowledged inconsistent connections
• total raised uncorrelated cross connections
• root cause failures
Note that the settings of the user preferences control which counts are available.
For more details, see the “Network Event Summary ” (p. 2-16) section.
Fault Management Fault Management Pages
....................................................................................................................................................................................................................................
....................................................................................................................................................................................................................................
2-10 365-315-148R6.4 Issue 1
March 2011
Root Cause Failures Page
The Root Cause Failures page is displayed if the Fault Management Correlation Logic
(OMS_RCF) license is installed. This page enables users to view sorted and filtered lists
of potential root cause failures in the network.
You can use the Root Cause Failures page to:
• Search for failed services in the network and by using the hyperlink to the graphical
layout diagnose and repair the faults.
• Determine the impact of a failure by viewing a list of client connections and/or
services for connection root cause failures
• Determine the impact of a failure by viewing a list of affected ports for equipment
root causes.
• Acknowledge a root cause failure in order to mark it as seen by a network operator
For more details, see the “Root Cause Failures Page” (p. 2-11) and “Root Cause Failure
Processing” (p. 2-25)
Protection Switch Event Log page
The Protection Switch Event Log page displays a history of protection switch events
received by the system.
You can use the Protection Switch Event log to acknowledge a PSE (Protection Switch
Event) in order to mark it as seen by a network operator.
For more details, see the Protection Switch Event Log page and Protection Switch Event
Processing.
Threshold Crossing Alert page
The threshold crossing alert page displays Threshold Crossing Alerts. These alerts are
generated when a performance monitoring threshold is crossed (the traffic quality has
fallen below a preassigned quality level) for a termination point (TP).
For more details, see Threshold Crossing Alert (TCA) Processing and Threshold Crossing
Alert page.
Fault Management Fault Management Pages
....................................................................................................................................................................................................................................
....................................................................................................................................................................................................................................
365-315-148R6.4 Issue 1
March 2011
2-11
Related Fault Management Pages
Related pages
Along with the pages that are specifically designed to present fault management
information, the following other management system pages also interact with the pages
related to fault management:
• Network Map page
• Database Synchronizations page
• Equipment View page
• Network Elements page
• Graphical Layout page
Network Map page
On the Network Map, the icons for NEs, areas, and aggregates change color to indicate
the presence and severity of alarm conditions. For additional details about display of
alarm colors on Network Map icons, refer to “Alarm Notification” (p. 2-7).
Database Synchronizations page
On the Database Synchronizations page, one synchronization option offered is to
synchronize alarm and event information for selected NEs in the management system
database. For additional details about Database Synchronizations, refer to the OMS
Provisioning Guide.
Equipment View page
The Equipment View page displays the color of the highest severity level alarm present
on an equipment component. The equipment alarm LEDs display an aggregated alarm for
each equipment entity, which is represented by a color to reflect the highest severity
alarm. For example, if the color red is displayed for a slot/circuit pack, one or more
alarms are present for equipment entities within the slot/circuit pack (such as a physical or
logical port), and the highest alarm severity level is Critical or Prompt. For additional
details about alarm colors, refer to “Alarm Notification” (p. 2-7).
Network Elements page
On the Network Elements page, communication status is displayed by the change in the
color of an icon in the Comms status column of the Network Elements page. For
additional details about alarm colors, refer to “Alarm Notification” (p. 2-7).
Additionally, from the Network Elements page, an alarm synchronization can be
performed.
Fault Management Related Fault Management Pages
....................................................................................................................................................................................................................................
....................................................................................................................................................................................................................................
2-12 365-315-148R6.4 Issue 1
March 2011
Graphical Layout page
On the Graphical Layout page, port icons change color to indicate the presence and
severity of alarm conditions, and NEs change to color to indicate a loss of
communications. For additional details about the Graphical Layout, refer to the OMS
Connection Management Guide. For additional details about alarm colors, refer to
“Alarm Notification” (p. 2-7).
Alarms Page
Alarms Page Definition
The Alarms page is a multiple-panel page of the management system that enable users to
search alarms to receive a detailed list of equipment and management system-generated
alarms.
Panels of the Alarms Page
The Alarms Page consists of the following panels:
• The Search for alarms panel is used to search for and to sort alarms.
• The Alarms panel displays the results of the search criteria specified in the Search for
alarms panel. It consists of a multi-column table. Each row of the table is a separate
fault notification (alarm) or transient condition event. Each column of the table
contains the value of each attribute (detail) for each alarm or event displayed in the
list. To display the alarms panel, refer to the “View a List of Alarms on the Alarms
Page” (p. 2-30) task for instructions.
• The details panel displays the result of a request for details on a selected alarm that
appears in the Alarms panel. The alarm details are displayed in a two-column table
directly below the Alarms panel.
Alarms Page search criteria for filtering
By using the search criteria specified on the Search for alarms panel, the Alarms page can
be filtered to display only a specified listing of alarms and events. The display of alarms
and events on the Alarms page can be filtered by the following primary criteria: Severity,
Status, NE name, Probable cause, Source, Connection name, Connection Rate, Customer
name, Customer priority, and Correlation Status.
Important! The Customer priority field is displayed only if the NWC_CUS-
TOMER_PRIORITY installation parameter is set to ON.
Fault Management Related Fault Management Pages
....................................................................................................................................................................................................................................
....................................................................................................................................................................................................................................
365-315-148R6.4 Issue 1
March 2011
2-13
Additional search criteria include the alarm ID, the NA ID, the NA name, SA/NSA, the
raise date and time, the clear date and time, the acknowledge date and time,
acknowledged by, Repeat, acknowledge status, the alarm type, the group, the area, the
domain name, the ONNS domain, whether the alarm is associated with an RCF, the
broadcast group, and the connection aggregate.
You can save the existing set of Filters and Sorts using the option Save filter/sorts. This
option helps to save the Alarm List filter as a profile and apply the same filter criteria to
different Alarm List at a later date. The profile can be saved per user and individually
named by the user.
Alarm acknowledgement
Individual or multiple alarms can be acknowledged, acknowledged and deleted, or just
deleted directly from the Alarms page.
Refer to the “Acknowledge Alarms on the Alarms Page” (p. 2-35) task for instructions.
The deletion of alarms is only applicable for instantaneous alarms. Any attempts to delete
persistent alarms will fail. Refer to the “Delete Instantaneous Alarms on the Alarms Page”
(p. 2-36) task for instructions.
The acknowledgement and deletion of alarms acknowledge both persistent and
instantaneous alarms. Any persistent alarms in the cleared state are removed to the Alarm
Log. All instantaneous alarms that have just been acknowledged are deleted and are also
removed to the Alarm Log. In addition, instantaneous alarms over a certain age can be
automatically removed from the alarm list by using the FM_INST_DEL_AGE installation
parameter. The parameter reflects the age of the alarm to delete in days (0-31). If this
parameter is set to 0, this feature will be disabled.
Only persistent alarms in the raised acknowledge state remain. Refer to the
“Acknowledge and Delete Alarms on the Alarms Page” (p. 2-37) task for instructions.
Historic alarms acknowledgement and deletion
When a persistent raised or cleared alarm is acknowledged the system will automatically
acknowledge older instances of the alarm list on this object. When a transient alarm is
deleted, the system automatically deletes older instances of the alarm in the alarm list.
Fault Management Alarms Page
....................................................................................................................................................................................................................................
....................................................................................................................................................................................................................................
2-14 365-315-148R6.4 Issue 1
March 2011
Alarm Log
Alarm Log Definition
The Alarm Log is a log generated by the management system that contains records of all
alarms/events and standing conditions that were deleted or automatically removed from
the Alarm page.
Panels of the Alarm Log page
The Alarm Log page is divided into two panels:
• The Search for historic alarms panel is used to view alarm log records and to filter the
alarm log display. Refer to the “View Alarm Log Records” (p. 2-52) task for
instructions.
• The Historic Alarms panel displays the filtered data, which can be exported to a file or
a device, or it can be deleted. Refer to the “Export Alarm Log Records” (p. 2-54) and
“Delete Alarm Log Records” (p. 2-56) tasks for instructions.
Alarm Log search criteria for filtering
The Search for historic alarms panel of the Alarm Log enables the user to filter alarms by
specifying any of the following as primary search criteria: The alarm severity, the NE
name, the probable cause of the alarm, the alarm source, the correlation status, the
connection rate, and the connection name.
Additional search criteria include alarm ID, NA ID, NA name, SA/NSA, alarm type,
customer name, customer priority, dates and times for raises, clears, and raise
acknowledges, the user ID who acknowledged the alarm (make historic user), the time the
acknowledged alarm was deleted (make historic time), along with the category, group,
area, domain name, ONNS domain, broadcast group, and connection aggregate.
You can save the existing set of Filters and Sorts using the option Save filter/sorts. This
option helps to save the Alarm Logs filter as a profile and apply the same filter criteria to
different Alarm Log at a later date. The profile can be saved per user and individually
named by the user.
Important! The connection aggregate fields, filter and sort are displayed only if the
SYS.ONNS_ENABLED parameter is set to ON.
Maximum number of Alarm Log records stored
When the count of log records reaches 80% of the maximum number of log records
allowed, the management system will generate a platform alarm (ALARM-
S_LOG_SPACE_LOW). The log administrator should take action upon seeing this alarm
to reduce the number of records in the alarm log by deleting alarm log records after
exporting the records to file. Once the number of records falls below 80% the platform
Fault Management Alarm Log
....................................................................................................................................................................................................................................
....................................................................................................................................................................................................................................
365-315-148R6.4 Issue 1
March 2011
2-15
alarm (ALARMS_LOG_SPACE_LOW) is cleared. Should no action be taken to reduce
the number of records, upon reaching 100% of the maximum number of log records
allowed, the management system will automatically purge 10% of the oldest records and
will generate a transient platform alarm (ALARMS_LOG_PURGE). Should the log
administrators see this alarm being raised frequently they are advised to contact
Alcatel-Lucent for assistance in reducing the retention period for the log.
If the count of log records reaches the maximum allowed at any time, the management
system automatically purges log records, starting with the oldest log records first, until the
record count falls below the maximum count level.
Alarm Log installation parameters
Installation parameters control the maximum number of log records that the management
system stores and the period of time in which the management system retains Alarm Log
records. These installation parameters are documented in the OMS Administration Guide.
Network Event Summary
Network Event Summary page function
The Network Event Summary page is used to alert the user to significant network and
system events.
Note that if the user attempts to close the Network Event Summary (NES) window, a
warning will be displayed and the user will have to confirm the operation before the NES
is closed.
The following warning will be displayed:
Warning: Alarm Counts and Latest Events will no longer be shown
if you close this window
This prevents unintentional closure of the window, which would stop a user from being
informed of new events.
Panels of the Network Event Summary page
The alarm view of the Network Event Summary page is divided into the following panels:
• Alarm Counts that provide a current count of the number of faults which are raised,
and for which a clear has not yet been received; the total number of TCAs in the TCA
list which are Ack or Unack; the number of unacknowledged protection switch events
in the system, and the number of reroute notifications which are present in the alarm
list.
• Discrepancy Counts, which provides the discrepancy counts.
• Root Cause Failure Counts, which provides a current count of root cause failures.
Fault Management Alarm Log
....................................................................................................................................................................................................................................
....................................................................................................................................................................................................................................
2-16 365-315-148R6.4 Issue 1
March 2011

• Latest Events, which provides a view of the last 100 events in the users domain.
• Latest PSEs, which provides a view of the last 100 protection switch events in the
users domain.
Users can view the Network Event Summary page at any time.
Alarm Counts panel
The Alarm Counts panel displays the counts of each category of alarms currently raised
and/or cleared for network connections on the OMS management system. The connection
categories are:
• Faults
• TCAs
• PSEs
• Reroute, if configured
Totals for faults are divided into the following categories:
• Total Raised is the total number of faults that have been raised, but for which a clear
has not yet been received.
• Unackd raised is the total number of faults that are raised, but for which a clear has
not yet been received, and have not yet been acknowledged.
• Unackd cleared is the total number of faults that have received a clear, but have not
been transitioned to the Alarms Log because they have not been acknowledged.
Note: The Unackd cleared count is only visible depending on the alarm deletion
option.
Totals for Threshold Crossing Alerts (TCAs) are divided into the following categories:
• Total Raised is the total number of persistent TCAs that have been raised, but for
which a clear has not yet been received. In addition, this number includes the number
of instantaneous TCAs in the Alarms List.
• Unackd raised is the total number of persistent TCAs that are raised, but for which a
clear has not yet been received, and have not yet been acknowledged. In addition, this
number includes the number of instantaneous TCAs in the Alarms List.
• Unackd cleared is the total number of persistent TCAs that have received a clear, but
have not been transitioned to the Alarms Log because they have not been
acknowledged.
Note: The Unackd cleared count is only visible depending on the alarm deletion
option.
Acknowledged TCAs do not transition to the Alarms Log. They remain in the TCA
list but have a status of historic. For example, they become historic. In a similar way
as acknowledged instantaneous TCAs also become historic.
Totals for Protection Switch Events (PSE) are listed in the following category:
• Unackd raised is the total number of PSEs that have not yet been acknowledged.
Fault Management Network Event Summary
....................................................................................................................................................................................................................................
....................................................................................................................................................................................................................................
365-315-148R6.4 Issue 1
March 2011
2-17
The Reroute field is only displayed if the FM ONNS Reroute Display installation
parameter is set to display reroute notifications. For more details about the FM ONNS
Reroute Display installation parameter, refer to the OMS Administration Guide.
Totals for Reroute are divided into the following categories:
• Total raised is the total number of reroute notifications that are present in the alarm
list.
• Unack raised is the total number of reroute notifications that are present in the alarm
list and have not been acknowledged.
The system dynamically updates these counts, but, the user can manually refresh these
counts. The date and time of the last alarm and TCA counts update are displayed. If the
system receives a new alarm or TCA that has been raised but not yet acknowledged, a
new raise icon is displayed in the Unack raised column and the count is automatically
updated. If an alarm or TCA is cleared, a new clear icon is displayed in the Unack clear
column and the count is automatically updated.
The management system allows users to jump from any alarm count on the Alarm counts
panel of the Network Event Summary page (raised alarms/events, unacknowledged raised
alarms/events, unacknowledged cleared alarms/events) to the Threshold Crossing Alert
page. Because the Alarms page is filtered, it displays a detailed list of only those alarms
of that alarm count category. The user is also allowed to jump from the Protection Switch
Event panel to the Protection Switch Event Log page.
Discrepancy Counts Panel
The Discrepancy Counts panel displays the counts of transport discrepancies, ethernet
discrepancies, pre-plan restoration progress and counts of abnormal conditions on
network elements.
The Transport categories are:
• An uncorrelated connection, which occurs when a cross-connection is found on the
NE, but not in the management system.
• An ASTN uncorrelated connection, which occurs when a cross-connection created via
ONNS is found on the NE, but not in the management system.
• An ASTN disjointness connection, which occurs when the connection state is in-effect
and disjointness is maximal on the Permanent 1+1 protected connection control plane.
• An inconsistent connection, which occurs when a cross-connection associated with an
in-effect connection is disconnected or rearranged outside of the management system.
Totals for Inconsistent Connection event counters show current counts of the following:
• Total , which is the total number of all Inconsistent Connections in the management
system.
• Unacknowledged , which is the total number of all Inconsistent Connections in the
management system that are unacknowledged.
Fault Management Network Event Summary
....................................................................................................................................................................................................................................
....................................................................................................................................................................................................................................
2-18 365-315-148R6.4 Issue 1
March 2011
Totals for Uncorrelated Cross Connections only show current counts for Total Raised,
which is the total number of Uncorrelated Cross Connections in the management system.
The Ethernet categories are:
• An uncorrelated Ethernet service, which occurs when an Ethernet notification is not
correlated to an Ethernet service.
• An inconsistent Ethernet service , which occurs when an Ethernet service is modified
outside of the management system.
Totals for all inconsistent counters show the following:
• Total which is the total number of all Inconsistent Ethernet services in the
management system.
• Unacknowledged , which is the total number of all Inconsistent Ethernet services in
the management system that are unacknowledged.
Totals for all uncorrelated counters show the following:
• Total which is the total number of uncorrelated Ethernet services in the management
system.
• Unacknowledged , which is the total number of uncorrelated Ethernet services in the
management system that are unacknowledged.
The Restoration categories are:
• A Created restoration, which occurs when a preplan restoration order is created due to
alarm triggered restoration. The "Restoration" counters will only be available when
the system parameter ALARM_TRIGGERED_PREPLAN is enabled.
Total is the total number of restoration in-progress in the management system.
• Failed restorations, which occurs when an alarm triggered preplan restoration is in
the implementation failed state.
Total is the total number of restoration failed in the management system.
The NE categories are:
• Abnormal which provides the total number of network elements managed by the
system that have one or more abnormal conditions.
To open an appropriate filtered list, click a hyperlink from each count in the Discrepancy
Counts panel, The new event icon is removed once the counter is clicked to view the
corresponding list. A Refresh Discrepancy Counts button enables user to do an
on-demand refresh, which refreshes the counts and updates the date and time.
Root Cause Failure Counts panel
The Root Cause Failure Counts panel displays the counts of each category of root cause
failures currently raised and/or cleared on the OMS management system. Note that this
panel is only displayed if the OMS_RCF licence is present and the user has enabled the
Show panel preference for the Root Cause Failure Counts panel.
Fault Management Network Event Summary
....................................................................................................................................................................................................................................
....................................................................................................................................................................................................................................
365-315-148R6.4 Issue 1
March 2011
2-19
Root cause failure counts are calculated for the following categories:
• Service connections
• Infrastructure connections
• Physical
• Equipment
• Ports
• Internal NE
• No RCF
For each category of root cause failure the following counts are calculated:
• Total raised which is the total number of raised root cause failures in that category.
• Unacknowledged Raised which is the total number of raised root cause failures in
that category that have not been acknowledged by a network operator
• Unacknowledged Cleared which is the total number of cleared root cause failures in
that category that have not been acknowledged by a network operator.
Note this count is only visible depending on the alarm deletion option.
The system dynamically updates these counts; however, the user can manually refresh
these counts. Additionally, the following is true:
• If a new root cause failure is raised, a new raise icon is displayed in the Unack raised
column and the count is automatically updated.
• If a root cause failure is cleared, a new clear icon is displayed in the Unack clear
column and the count is automatically updated.
The management system allows users to jump from any count on the Root Cause Failure
Counts panel of the Network Event Summary page to the Root Cause Failure page.
Because the Root Cause Failure page is filtered, it displays a detailed list of root cause
failures in that root cause failure count category.
Latest events panel
The Latest events panel shows a dynamically updated list of the most recently received
alarms (including both raised and cleared alarms). Each row of the list provides details
about an alarm, including the Alarm ID, Alarm severity, NA name, NE name, Source,
Probable cause, Raise date and time, Clear date and time, and Alarm description, and
status. The most recently received raised or cleared alarm is displayed at the beginning of
the list, with the remaining alarms/events sorted in reverse chronological order by raise
time.
The Latest events panel provides links to the alarms and equipment pages.
Fault Management Network Event Summary
....................................................................................................................................................................................................................................
....................................................................................................................................................................................................................................
2-20 365-315-148R6.4 Issue 1
March 2011
The following behavior governs this panel:
• When a new instance of the NEs is opened, the panel will be empty.
• When an event is received by the system, it will be added to the top of the list. This
assumes no sorting has been applied. If sorting is applied, it will appear as appropriate
for the sort criteria.
• When the list reaches 100 entries, it is considered full. The 101 entry is added to the
top of the list, and the 100 entry, at the bottom of the list, is deleted.
Network Event Summary page appearance and behavior
The management system allows users to control the behavior of the Network Event
Summary page. From the My Network Preferences panel of the Preferences page, users
can control whether the Alarm counts panel, the Latest events panel, or all panels on the
page are always displayed, and whether one or all panels should automatically pop up and
be brought to the forefront of the screen display each time a new alarm or TCA occurs.
For details on and the associated tasks for user preferences, refer to the OMS Getting
Started Guide.
Alarm Filtering
SAF
For the SONET and SDH environments, the management system offers Symptomatic
Alarm Filtering (SAF) in order to remove selective alarm messages before they are
forwarded to the user for notification.
Specifically, SAF filters out a set of defined symptomatic alarms and standing condition
(SC) events. The filtering is based on a group of probable causes (condition types) of the
alarm and standing condition events received from all NEs.
For assistance with modifying SAF, contact Alcatel-Lucent's Global TSS.
Fault Management Network Event Summary
....................................................................................................................................................................................................................................
....................................................................................................................................................................................................................................
365-315-148R6.4 Issue 1
March 2011
2-21

Threshold Crossing Alert (TCA) Processing
Network Element Support
A threshold crossing alert is generated when a performance monitoring threshold is
crossed (the traffic quality has fallen below a preassigned quality level) for a termination
point (TP).
Threshold Crossing Alerts are raised based on a given granularity (15 minutes or 24
hours). Thresholds which are not based on a granularity are handled in the Alarms
requirements (e.g. Signal Degrade Thresholds).
A threshold crossing alert can be considered as transient or persistent.
OMS Support
OMS will display threshold crossing alerts to the user in the following places:
• A counter in the Network Event Summary (NES) page giving the number of active
threshold crossing alerts
• A Threshold Crossing Alert List, which shows a history of threshold crossing alerts
received by the system
Threshold Crossing Alert page
Threshold Crossing Alert page Definition
The Threshold Crossing Alert page shows current raised TCAs, current cleared TCAs,
current transient TCAs, acknowledged TCAs and historic TCAs.
The Threshold Crossing Alert page allows you to acknowledge a TCA in order to mark it
as seen by a network operator.
The Threshold Crossing Alert List can be opened from “Threshold Crossing Alerts” under
the Alarms and Events and from the TCA Counter in the NEs screen.
Fault Management Threshold Crossing Alert (TCA) Processing
....................................................................................................................................................................................................................................
....................................................................................................................................................................................................................................
2-22 365-315-148R6.4 Issue 1
March 2011
Protection Switch Event Processing
Network Element Support
A protection switch event is generated when a protection switch occurs in a network
element and causes traffic to be switched between a worker and protection entity.
OMS will include the following protection switch event types:
• Equipment Protection Groups
• MS Protection Groups
• MS-SPRing Groups
• High Order (OCH, STS1, STS3c, AU3 and AU4) SNCP
• RPR Protection for Ethernet
OMS Support
OMS displays threshold crossing alerts to the user in the following places:
• A counter in the Network Event Summary (NES) page giving the number of
unacknowledged protection switch events
• An entry in a latest Protection Switch Events list in the NES
• A Protection Switch Event log which shows a history of protection switch events
received by the system
Note: The data extraction tool will also be able to perform regular extraction of the
protection switch events for historical purposes.
Receiving Protection Switch Events from the Network
The following types of protection switch events are supported:
Type Parameter Name
Equipment FM_PSE_PROCESS_EQM
TDM MSP Switches FM_PSE_PROCESS_TDM_MSP
TDM MS-SPRing Switches FM_PSE_PROCESS_MSPRING
TDM High Order SNCP Switches FM_PSE_PROCESS_HO_TDM_SNCP
WDM High Order SNCP Switches FM_PSE_PROCESS_HO_WDM_SNCP
For each event, an installation parameter can be set so that the system should discard
these events and does not process them.
Fault Management Protection Switch Event Processing
....................................................................................................................................................................................................................................
....................................................................................................................................................................................................................................
365-315-148R6.4 Issue 1
March 2011
2-23

Synchronization
Events which occurred while the association to the Network Element was present are
displayed. If the OMS/NE association is lost and then recovered, no automatic or manual
PSE synchronization will be performed.
Connection Name
The associated connection name for a PSE is determined as follows:
• For an MSP, MS-SPRing, RPR or SNCP PSE: by using the standard alarm correlation
rules on the To Resource name and the PSE Rate
• For an Equipment PSE: Always empty
Note: For MS-SPRing protection groups, there is no connection name to display which is
associated with the entire group; therefore, the OMS will display the connection name of
the physical STM-N connection associated with the STM-N port.
Assignment of Protection Switch Event Identifier
A numeric identifier, known as the Protection Switch Event Identifier (PSE ID) is
assigned to each protection switch event. The identifiers will be assigned in sequence
starting from “0” and can act as a unique identifier for the event.
Assignment of Domain
Each protection switch event is assigned to the appropriate domain based on the domain
of the NE which contains the resources in the protection switch. If the NE’s domain is
changed, the domain associated with the protection switch will not be updated.
TP Aliases
The appropriate TP aliases are assigned to the following fields when the resource type is a
TP:
• Protected Resource: called Protected Resource Port User Label
• From Resource: called From Resource Port User Label
• To Resource: called To Resource Port User Label
If the value of the Port User Label changes in the future, the value assigned to the
event will not be updated.
Note: TP Aliasing is controlled by an installation parameter.
Fault Management Protection Switch Event Processing
....................................................................................................................................................................................................................................
....................................................................................................................................................................................................................................
2-24 365-315-148R6.4 Issue 1
March 2011
Protection Switch Event Log Page
Protection Switch Event Log Page Definition
The Protection Switch Event log page shows a history of protection switch events
received by the system.
You can use the Protection Switch Event log to acknowledge a PSE (Protection Switch
Event) in order to mark it as seen by a network operator. You can also view the Protection
Switch Event Log Records.
Root Cause Failure Processing
Domain Users
It is recommended that the Root Cause Failure functions be available to only Global
Domain users with permissions to manage all management system user domains.
Network Element Support
All network elements are supported.
OMS Support
OMS supports root cause failure counts, and a root cause failure page. OMS requires the
OMS_RCF licence to use this feature. It is suggested that only global domain users use
this feature since access to the Root Cause Failure feature is given as a role profile.
OMS will display root cause failures to the user in the following places:
• A counter in the Network Event Summary Screen (NES) giving the number of total
raised and unacknowledged root cause failures.
• An entry in the Root Cause Failure page, which allows you to search and display root
cause failures.
Root Cause Failure Creation
The Roots Cause Failure feature requires the OMS_RCF licence.
The Root cause failure feature provides a summary of the alarms correlated to each
resource (connection, equipment, port, subnetwork (correlated and uncorrelated) in the
network. By using this feature, you can view and then search for client connections and
services.
Fault Management Protection Switch Event Log Page
....................................................................................................................................................................................................................................
....................................................................................................................................................................................................................................
365-315-148R6.4 Issue 1
March 2011
2-25
This provides a network level view of the alarm state in the network. As an example, it is
possible to identify which circuits are impacted by alarms and then use the graphical
layout to identify the cause of the failure. It is also possible to understand the impact on
the network of those alarms by seeing which client services are being carried by an
alarmed circuit.
The Root Cause Failure feature associates an alarm issued by an entity in the network to a
root cause. The associated alarms are the following:
• TP alarms are associated with connection or port root cause failures as follows:
The values of Connection or location are set as follows:
– If the alarmed port correlates directly to a connection, a connection root cause
failure is created. The location of the root cause failure identifies if the root cause
is internal or external to the OMS management domain.
– If the alarmed port correlates indirectly to a connection through an uncataloged
connection, a port root cause failure is created. The NE name and port name are
used as the source of the root cause failure. The location of the root cause failure
identifies if the root cause is internal or external to the OMS management domain.
• Equipment alarms are associated with equipment root cause failures. The NE name
and equipment name are used as the source of the root cause failure.
• Subnetwork connection alarms are associated with a connection root cause failure.
The location for these root cause failures will always be internal.
Root Cause Retention
The management system retains all root causes until there are no longer any active alarms
correlated to the resource which created the root cause. This deletion can be caused by:
• Deletion of all alarms correlated to the resource
• The resource being changed so that it is no longer associated with an alarm
Internal / External Determination
Internal or External Alarms
For each alarmed resource in the network, the root cause failures will indicate if the
failure is internal or external. Note: for a given connection in the network two root cause
failures may be created, one root cause failure indicates all internal failures in the network
and one indicates all external failures in the network.
Root Causes Description
Fault Management Root Cause Failure Processing
....................................................................................................................................................................................................................................
....................................................................................................................................................................................................................................
2-26 365-315-148R6.4 Issue 1
March 2011
Port root causes Internal or External status depends on whether
the port is on the boundary of the network.
• If the alarm is raised on a boundary port,
the related root cause failures is external.
• If the alarm is raised on a non-boundary
port, the related root cause failures is
internal.
Equipment root causes All equipment root cause failures are
considered Internal.
Connection root causes Internal or external status depends on whether
the failure correlated to the connection,
occurred inside or outside the management
domain.
• Internal Alarms - An internal failure is one
that occurred inside the management
domain.
• An external failure is one that occurred
outside the management domain.
Subnetwork Connection root causes These RCFs are always internal.
Acknowledgement of Root Causes
All alarms that are correlated to the root cause are acknowledged. Each alarm is given an
acknowledgement time. No acknowledgement user information is retained.
Root Cause Failures Page
Root Cause Failures Page Definition
Domain Users
It is recommended that the Root Cause Failure functions be available to only Global
Domain users with permissions to manage all management system user domains.
The Root cause Failures Page shows a summary of the alarms correlated to each resource,
such as Connection, equipment, port, subnetwork (correlated and uncorrelated) in the
network.
Fault Management Root Cause Failure Processing
....................................................................................................................................................................................................................................
....................................................................................................................................................................................................................................
365-315-148R6.4 Issue 1
March 2011
2-27

Panels of the Root Cause Failures Page
The Root Cause Failures Page consists of the following panels:
• The Search for root cause failures panel is used to search for and to sort root cause
failures.
• The Root Cause Failures panel displays the results of the search criteria specified in
the Search for root cause failures panel. It consists of a multi-column table. Each row
of the table is a separate fault notification or transient condition. Each column of the
table contains the value of each attribute (detail) for each root cause failure displayed
in the list. To display the root cause failure panel, refer to the “View a List of Root
Cause Failures on the Root Cause Failures Page” (p. 2-57) task for instructions.
• The details panel displays the result of a request for details on a selected root cause
failure that appears in the Root Cause Failures panel. The root cause failure details are
displayed in a table directly below the Root Cause Failures panel.
Root Cause Failures Page search criteria for filtering
By using the search criteria specified on the Search for root cause failures panel, the Root
Cause Failures page can be filtered to display only a specified listing of root cause
failures. The display root cause failures on the Root Cause Failures page can be filtered
by the following primary criteria: Severity, Status, Group, Type, Overall state, OMS state,
Source, and Customer name.
Additional search criteria include the Connection rate, Protection type, the Acknowledge
status, Location, Precedence, Start time, ONNS domain and Domain name.
Root Cause Failure acknowledgement
Individual or multiple root cause failures can be acknowledged, directly from the Root
Cause Failures page. All alarms that are correlated to the root cause are acknowledged.
Each alarm is given an acknowledgement time. No acknowledgement user information is
retained.
Refer to the “Acknowledge Root Cause Failures on the Root Cause Failures Page”
(p. 2-62) task for instructions.
Client Connections
A list of direct and indirect Client Connections that are carried by the root cause can be
viewed from the Network Connections List page. A direct Client Connection rides
directly on top of a connection; as an example, a VC-12 is a direct client connection of a
VC-4. An indirect Client Connection rides on top of a connection at any layer; as an
example, a VC-12 is an indirect Client Connection on an MS. “View a List of Root Cause
Failures on the Root Cause Failures Page” (p. 2-57).
Refer to the OMS Connection Management Guide for additional information.
Fault Management Root Cause Failures Page
....................................................................................................................................................................................................................................
....................................................................................................................................................................................................................................
2-28 365-315-148R6.4 Issue 1
March 2011
Services
A list of services that are carried by the root cause can be viewed from the Network
Connections List page. The set of services for a root cause is the set of indirect client
connections for that root cause which are also services themselves. “View a List of Root
Cause Failures on the Root Cause Failures Page” (p. 2-57).
Refer to the OMS Connection Management Guide for additional information.
Important! Note that the set of services for a service does not include the service
connection.
View Impacted Services
A list of impacted services that are carried by a selected connection root cause can be
viewed from the Network Connection Lisp page. This option is only available for
connection root cause in group physical and infrastructure. The user can find all the
services carried by the infrastructure or physical connection that have an overall state of
failed.
Important! This option is only visible if the system parameter FM_RCF_OVERALL
is set to SHOW.
Fault Management Root Cause Failures Page
....................................................................................................................................................................................................................................
....................................................................................................................................................................................................................................
365-315-148R6.4 Issue 1
March 2011
2-29
View a List of Alarms on the Alarms Page
When to use
Use this task to view the Alarms page, which provides a detailed list of equipment and
management system-generated alarms that can be displayed for an area or NE.
Important! - Due to the limited granularity for 1694 Enhanced Optical Networking
(EON) alarms, the alarm group for a transmission alarm may indicate a worse situation
than what the alarm actually is. The user should be aware of this situation and check the
description for detailed information.
Related information
See the following topics in this document:
• “Alarms Page” (p. 2-13)
• “Database Synchronization of Alarms” (p. 2-6)
Before you begin
You are given five methods in which to access, and therefore view, the Alarms page. Use
Method 2, which accesses the Alarms page from the Network icon, and Method 3, which
accesses the Alarms page from the Network Elements icon, if you want to view the
Alarms page for a specific NE. Use Method 4, which accesses the Alarms page from the
menu bar of any page, if you want a filtered version of the page.
Task, Method 1: from the Alarms and Events Icon
Complete the following steps to view a list of alarms on the Alarms page.
...................................................................................................................................................................................................
1 Use the icons or the object links to follow this path: Alarms and Events > Alarms.
Result: The Alarms page is displayed, which shows the Search for Alarms panel.
...................................................................................................................................................................................................
2 If necessary, expand the search panel, by clicking the + icon next to More....
...................................................................................................................................................................................................
3 Enter the search criteria to view specific alarms or leave the search fields blank to view
all alarms and click the Search button.
Result: The Alarms panel of the Alarms page is displayed.
Fault Management View a List of Alarms on the Alarms Page
....................................................................................................................................................................................................................................
....................................................................................................................................................................................................................................
2-30 365-315-148R6.4 Issue 1
March 2011
E N D O F S T E P S...................................................................................................................................................................................................
Task, Method 2: from the Network Icon
From the Alarm View, complete the following steps to view a list of alarms on the Alarms
page.
...................................................................................................................................................................................................
1 Use the icons or the object links to follow this path: Network.
Result: The Network Map is displayed.
...................................................................................................................................................................................................
2 On the Network Map, position the mouse cursor on the area icon or NE icon (if the NE is
contained in an aggregate, you may have to expand the aggregate to display the NE on the
Network Map) and click the right mouse button.
Result: The node pop-up menu is displayed.
...................................................................................................................................................................................................
3 Select Alarm list from the node pop-up menu.
Result: The Alarms page is displayed for the selection made in Step 2.
...................................................................................................................................................................................................
4 If necessary, expand the Search panel, by clicking the + icon next to More....
...................................................................................................................................................................................................
5 Enter the search criteria to view specific alarms or leave the search fields blank to view
all alarms and click the Search button.
Result: The Alarms panel of the Alarms page is displayed.
Task, Method 3: from the Network Elements Icon
Complete the following steps to view a list of alarms on the Alarms page.
...................................................................................................................................................................................................
1 Use the icons or the object links to follow this path: Network Elements.
Result: The Network elements page is displayed.
...................................................................................................................................................................................................
2 Select an NE for which you wish to view alarms.
...................................................................................................................................................................................................
3 From the Go menu, select Alarm list and click the Go button.
Fault Management View a List of Alarms on the Alarms Page
....................................................................................................................................................................................................................................
....................................................................................................................................................................................................................................
365-315-148R6.4 Issue 1
March 2011
2-31
E N D O F S T E P S...................................................................................................................................................................................................

Result: The Alarms page is displayed for the selection made in Step 2.
...................................................................................................................................................................................................
4 If necessary, expand the Search panel, by clicking the + icon next to More....
...................................................................................................................................................................................................
5 Enter the search criteria to view specific alarms or leave the search fields blank to view
all alarms and click the Search button.
Result: The Alarms panel of the Alarms page is displayed.
Task, Method 4: from the Top Navigation Zone Menu Bar
Complete the following steps to view a list of alarms on the Alarms page.
...................................................................................................................................................................................................
1 In the top navigation zone of any page, click My Network tab.
Result: A submenu is displayed.
...................................................................................................................................................................................................
2 Select Network event summary.
Result: The Network Event Summary page is displayed.
...................................................................................................................................................................................................
3 In the Alarm Counts portion of the page, click the number shown in the Total Raised,
Unackd raised, or Unackd clear column.
Result: The Alarms page is displayed for your selection.
The Alarms page is filtered to show all alarms/events, all unacknowledged raised
alarms/events, or all unacknowledged cleared alarms/events, depending on the count
selected on the Network Event Summary page.
...................................................................................................................................................................................................
4 If necessary, expand the Search panel, by clicking the + icon next to More....
...................................................................................................................................................................................................
5 Enter the search criteria to view specific alarms or leave the search fields blank to view
all alarms and click the Search button.
Result: The Alarms panel of the Alarms page is displayed.
Fault Management View a List of Alarms on the Alarms Page
....................................................................................................................................................................................................................................
....................................................................................................................................................................................................................................
2-32 365-315-148R6.4 Issue 1
March 2011
E N D O F S T E P S...................................................................................................................................................................................................
E N D O F S T E P S...................................................................................................................................................................................................
Task, Method 5: from the Connections Icon
Complete the following steps to view a list of alarms on the Alarms page.
...................................................................................................................................................................................................
1 Use the icons or the object links to follow this path: Connections > Network
Connections.
Result: The Search for Network Connections panel is displayed.
...................................................................................................................................................................................................
2 Enter or select search criteria for the required connection and click the Search button.
Result: The Network Connections page is displayed.
...................................................................................................................................................................................................
3 Choose a connection from the list.
...................................................................................................................................................................................................
4 From the Go menu, select Graphical layout and click the Go button.
Result: The Graphical Layout page is displayed.
...................................................................................................................................................................................................
5 Position the mouse cursor over a port icon and click the right mouse button to display the
Port menu.
Result: The Port menu is displayed.
...................................................................................................................................................................................................
6 Choose Alarm list from the Port menu.
Result: The Alarms page is displayed for your selection in Step 3.
...................................................................................................................................................................................................
7 If necessary, expand the Search for Alarms panel; then, enter the search criteria to view
specific alarms or leave the search fields blank to view all alarms and click the Search
button.
Result: The Alarms panel of the Alarms page is displayed.
Fault Management View a List of Alarms on the Alarms Page
....................................................................................................................................................................................................................................
....................................................................................................................................................................................................................................
365-315-148R6.4 Issue 1
March 2011
2-33
E N D O F S T E P S...................................................................................................................................................................................................
View the Details of an Alarm on the Alarms Page
When to use
Use this task to view the details of an alarm on the Alarms page.
Important! - For 1694 Enhanced Optical Networking (EON), due to the limited
granularity for 1694 Enhanced Optical Networking (EON) alarms, the alarm group for a
transmission alarm may indicate a worse situation than what the alarm actually is. The
user should be aware of this situation and check the description for detailed information.
Related information
See the following topic in this document:
• Alarms page
Before you begin
There are no prerequisites before you begin.
Task
Complete the following steps to view the details of an alarm on the Alarms page.
...................................................................................................................................................................................................
1 Access the Alarms page using one of the methods described in the “View a List of Alarms
on the Alarms Page” (p. 2-30) task.
Result: The Alarms page is displayed.
...................................................................................................................................................................................................
2 To display additional details for a specific alarm, click the Details icon, which appears in
the row to the left the alarm.
Result: Additional alarm details are displayed below the Go menu in the Alarms
panel.
Fault Management View the Details of an Alarm on the Alarms Page
....................................................................................................................................................................................................................................
....................................................................................................................................................................................................................................
2-34 365-315-148R6.4 Issue 1
March 2011
E N D O F S T E P S...................................................................................................................................................................................................

Acknowledge Alarms on the Alarms Page
When to use
Use this task to acknowledge one or more raised or cleared alarms on the Alarms page.
Related information
See the following topics in this document:
• “Alarms Page” (p. 2-13)
• “Database Synchronization of Alarms” (p. 2-6)
Before you begin
This task does not have any preconditions.
Task
Complete the following steps to acknowledge one or more raised alarms on the Alarms
page.
...................................................................................................................................................................................................
1 Access the Alarms page using one of the methods described in the “View a List of Alarms
on the Alarms Page” (p. 2-30) task.
Result: The Alarms page is displayed.
...................................................................................................................................................................................................
2 Select one or more alarms on the Alarms page.
...................................................................................................................................................................................................
3 From the Go menu, select Acknowledge and click the Go button.
Result: The selected alarms are acknowledged.
When a user acknowledges an alarm, all previous instances of that alarm in the
current alarm list will be acknowledged.
The Acknowledge date & time field is updated for the acknowledged alarm(s). The
Acknowledged by field is updated with the user ID of the user who acknowledged the
alarm(s).
Fault Management Acknowledge Alarms on the Alarms Page
....................................................................................................................................................................................................................................
....................................................................................................................................................................................................................................
365-315-148R6.4 Issue 1
March 2011
2-35
E N D O F S T E P S...................................................................................................................................................................................................
Delete Instantaneous Alarms on the Alarms Page
When to use
Use this task to delete one or more instantaneous alarms on the Alarms page.
Related information
See the following topics in this document:
• “Alarms Page” (p. 2-13)
• “Database Synchronization of Alarms” (p. 2-6)
Before you begin
This task does not have any preconditions.
Task
Complete the following steps to delete one or more instantaneous alarms on the Alarms
page.
...................................................................................................................................................................................................
1 Access the Alarms page using one of the methods described in the “View a List of Alarms
on the Alarms Page” (p. 2-30) task.
Result: The Alarms page is displayed.
...................................................................................................................................................................................................
2 Select one or more instantaneous alarms to be deleted on the Alarms page.
...................................................................................................................................................................................................
3 From the Go menu, select Delete and click the Go button.
Result: A confirmation dialog box is displayed, asking if you are sure that you want to
delete the selected alarm(s).
...................................................................................................................................................................................................
4 Click the OK button.
Result: The selected instantaneous alarms are deleted.
When a user deletes an alarm, all previous instances of that alarm in the current alarm
list will be deleted.
Fault Management Delete Instantaneous Alarms on the Alarms Page
....................................................................................................................................................................................................................................
....................................................................................................................................................................................................................................
2-36 365-315-148R6.4 Issue 1
March 2011
E N D O F S T E P S...................................................................................................................................................................................................
Acknowledge and Delete Alarms on the Alarms Page
When to use
Use this task to acknowledge and delete alarms from the Alarms page in one step.
Both persistent and instantaneous alarms can be acknowledged. Only instantaneous
alarms can be deleted. When an instantaneous alarm is deleted, it is moved to the Alarm
Log.
Although enabled when any alarm is selected, an attempt to delete a persistent alarm will
fail. The Delete option will be grayed-out for a Service Domain user. This action will
display a confirmation dialog box. The user can select OK or Cancel regarding this action.
Related information
See the following topics in this document:
• “Alarms Page” (p. 2-13)
• “Database Synchronization of Alarms” (p. 2-6)
Before you begin
This task does not have any preconditions.
The FM Alarm Delete Option installation parameter specifies four options that are to be
used to delete persistent alarms. When the management system is installed, its default
setting is to delete acknowledged and unacknowledged alarms automatically. System
administrators can change this setting; refer to the OMS Administration Guide for details.
Task
Complete the following steps to acknowledge and delete alarms on the Alarms page.
...................................................................................................................................................................................................
1 Access the Alarms page using one of the methods described in the “View a List of Alarms
on the Alarms Page” (p. 2-30) task.
Result: The Alarms page is displayed.
...................................................................................................................................................................................................
2 Select one or more persistent or instantaneous alarms on the Alarms page.
...................................................................................................................................................................................................
3 From the Go menu, select Acknowledge & Delete and click the Go button.
Fault Management Acknowledge and Delete Alarms on the Alarms Page
....................................................................................................................................................................................................................................
....................................................................................................................................................................................................................................
365-315-148R6.4 Issue 1
March 2011
2-37

Result: A confirmation dialog box is displayed, asking if you are sure that you want to
acknowledge and delete the selected alarm(s).
...................................................................................................................................................................................................
4 Click the OK button.
Result: All alarms are acknowledged and the selected instantaneous alarms are
deleted from the Alarms page.
When a user acknowledges and deletes an alarm, all previous instances of that alarm
in the current alarm list will be deleted.
Only persistent alarms in a raised state that have been acknowledged remain on the
Alarms page after this action.
Fault Management Acknowledge and Delete Alarms on the Alarms Page
....................................................................................................................................................................................................................................
....................................................................................................................................................................................................................................
2-38 365-315-148R6.4 Issue 1
March 2011
E N D O F S T E P S...................................................................................................................................................................................................

View the Network Event Summary Page
When to use
Use this task to view the Network Event Summary page.
Related information
See the following topics in this document:
• “Network Event Summary ” (p. 2-16)
• “View a List of Alarms on the Alarms Page” (p. 2-30)
• “Update Alarm Counts on the Network Event Summary Page” (p. 2-40)
• “Reset the New Event Indicator on the Network Event Summary Page” (p. 2-41)
Before you begin
Before you begin to view the Network Event Summary page, access the Preferences page
and verify, on the My Network Preferences panel of the page, that the Show panel check
boxes for the Alarm summary (Alarm counts) and Latest raise and clear events check
boxes are both checked to make these Network Event Summary panels visible.
The Alarm summary (Alarm counts) and Latest raise and clear events functions are
always enabled, by default.
Task
Complete the following steps to view the Network Event Summary page.
...................................................................................................................................................................................................
1 In the menu bar of any window, click theMy Network tab.
Result: A submenu is displayed.
...................................................................................................................................................................................................
2 Select Network event summary.
Result: The Network Event Summary page is displayed.
Fault Management View the Network Event Summary Page
....................................................................................................................................................................................................................................
....................................................................................................................................................................................................................................
365-315-148R6.4 Issue 1
March 2011
2-39
E N D O F S T E P S...................................................................................................................................................................................................
Update Alarm Counts on the Network Event Summary Page
When to use
Use this task to update alarm counts the Network Event Summary page.
Related information
See the following topics in this document:
• “Network Event Summary ” (p. 2-16)
• “View a List of Alarms on the Alarms Page” (p. 2-30)
• “Reset the New Event Indicator on the Network Event Summary Page” (p. 2-41)
Before you begin
Before you begin to view the Network Event Summary page, access the Preferences page
and verify, on the My Network Preferences panel of the page, that the Show panel
checkboxes for the Alarm summary (Alarm counts) and Latest raise and clear events
checkboxes are both checked to make these Network Event Summary panels visible.
The Alarm summary (Alarm counts) and Latest raise and clear events functions are
always enabled, by default.
Task
Complete the following steps to update alarm counts on the Network Event Summary
page.
...................................................................................................................................................................................................
1 In the menu bar of any window, click the My Network tab.
Result: A submenu is displayed.
...................................................................................................................................................................................................
2 Select Network event summary.
Result: The Network Event Summary page is displayed.
...................................................................................................................................................................................................
3 In the Alarm Counts panel, click the Refresh alarms count button.
Result: The alarm counts are updated. The date and time of the update are displayed.
Fault Management Update Alarm Counts on the Network Event Summary Page
....................................................................................................................................................................................................................................
....................................................................................................................................................................................................................................
2-40 365-315-148R6.4 Issue 1
March 2011
E N D O F S T E P S...................................................................................................................................................................................................

Reset the New Event Indicator on the Network Event Summary
Page
When to use
Use this task to reset the new event indicator on the Network Event Summary page to
remove all new alarm icons from the Alarm Counts panel and to refresh the display.
Related information
See the following topics in this document:
• “Network Event Summary ” (p. 2-16)
• “View a List of Alarms on the Alarms Page” (p. 2-30)
• “Update Alarm Counts on the Network Event Summary Page” (p. 2-40)
Before you begin
Before you begin to view the Network Event Summary page, access the Preferences page
and verify, on the My Network Preferences panel of the page, that the Show panel
checkboxes for the Alarm summary (Alarm counts) and Latest raise and clear events
checkboxes are both checked to make these Network Event Summary panels visible.
The Alarm summary (Alarm counts) and Latest raise and clear events functions are
always enabled, by default.
Task
Complete the following steps to reset the new event indicator on the Network Event
Summary page.
...................................................................................................................................................................................................
1 In the menu bar of any window, click the My Network tab.
Result: A submenu is displayed.
...................................................................................................................................................................................................
2 Select Network event summary.
Result: The Network Event Summary page is displayed.
...................................................................................................................................................................................................
3 In the Alarm Counts panel, click the Reset new event indicator button.
Result: The new alarm raised and new alarm cleared icons are removed from the
Alarms Count panel and the display is refreshed.
Fault Management Reset the New Event Indicator on the Network Event
Summary Page
....................................................................................................................................................................................................................................
....................................................................................................................................................................................................................................
365-315-148R6.4 Issue 1
March 2011
2-41
E N D O F S T E P S...................................................................................................................................................................................................
View the Details of Alarms from the Network Event Summary
Page
When to use
Use this task to view alarm details from the Network Event Summary page.
Related information
See the following topics in this document:
• “Network Event Summary ” (p. 2-16)
• “View a List of Alarms on the Alarms Page” (p. 2-30)
• “Update Alarm Counts on the Network Event Summary Page” (p. 2-40)
Before you begin
Before you begin to view the Network Event Summary page, access the Preferences page
and verify, on the My Network Preferences panel of the page, that the Show panel
checkboxes for the Alarm summary (Alarm counts) and Latest raise and clear events
checkboxes are both checked to make these Network Event Summary panels visible.
The Alarm summary (Alarm counts) and Latest raise and clear events functions are
always enabled, by default.
In addition, adjust the counter refresh rate to 5 or 10 seconds.
Task
Complete the following steps to view alarm details from the Network Event Summary
page.
...................................................................................................................................................................................................
1 In the menu bar of any window, click the My Network tab.
Result: A submenu is displayed.
...................................................................................................................................................................................................
2 Select Network event summary.
Result: The Network Event Summary page is displayed.
...................................................................................................................................................................................................
3 In the Latest events panel, click the hyperlink for the Alarm ID.
Result: The Alarms page for the selected alarm is displayed.
Fault Management View the Details of Alarms from the Network Event
Summary Page
....................................................................................................................................................................................................................................
....................................................................................................................................................................................................................................
2-42 365-315-148R6.4 Issue 1
March 2011
E N D O F S T E P S...................................................................................................................................................................................................
View the Details of Equipment from the Network Event
Summary Page
When to use
Use this task to view equipment details from the Network Event Summary page.
Related information
See the following topics in this document:
• “Network Event Summary ” (p. 2-16)
• “View a List of Alarms on the Alarms Page” (p. 2-30)
• “Update Alarm Counts on the Network Event Summary Page” (p. 2-40)
Before you begin
Before you begin to view the Network Event Summary page, access the Preferences page
and verify, on the My Network Preferences panel of the page, that the Show panel
checkboxes for the Alarm summary (Alarm counts) and Latest raise and clear events
checkboxes are both checked to make these Network Event Summary panels visible.
The Alarm summary (Alarm counts) and Latest raise and clear events functions are
always enabled, by default.
In addition, adjust the counter refresh rate to 5 or 10 seconds.
Task
Complete the following steps to view equipment details from the Network Event
Summary page.
...................................................................................................................................................................................................
1 In the menu bar of any window, click the My Network tab.
Result: A submenu is displayed.
...................................................................................................................................................................................................
2 Select Network event summary.
Result: The Network Event Summary page is displayed.
...................................................................................................................................................................................................
3 In the Latest events panel, click the hyperlink for the NE name.
Fault Management View the Details of Equipment from the Network Event
Summary Page
....................................................................................................................................................................................................................................
....................................................................................................................................................................................................................................
365-315-148R6.4 Issue 1
March 2011
2-43

Result: The Equipment View page for the selected NE is displayed.
Note: The hyperlink may not be available for some alarms.
Fault Management View the Details of Equipment from the Network Event
Summary Page
....................................................................................................................................................................................................................................
....................................................................................................................................................................................................................................
2-44 365-315-148R6.4 Issue 1
March 2011
E N D O F S T E P S...................................................................................................................................................................................................

View the Details of Root Cause Failures from the Network
Event Summary Page
When to use
Use this task to view the details of a root cause failure from the Network Event Summary
page.
This is only available if the OMS_RCF licence is present.
Related information
See the following topics in this document:
• “Network Event Summary ” (p. 2-16)
• “Update Root Cause Failure Counts on the Network Event Summary Page” (p. 2-47)
Before you begin
Before you begin to view the Network Event Summary page, access the Preferences page
and verify, on the My Network Preferences panel of the page, that the Show panel
checkboxes for the Root Cause Failure Counts is checked to make these Network Event
Summary panels visible.
The feature Root Cause Failure can be used if the OMS_RCF licence is present.
In addition, adjust the counter refresh rate to 5 or 10 seconds.
Task
Complete the following steps to view root cause failure details from the Network Event
Summary page.
...................................................................................................................................................................................................
1 In the menu bar of any window, click the My Network tab.
Result: A submenu is displayed.
...................................................................................................................................................................................................
2 Select Network event summary.
Result: The Network Event Summary page is displayed.
...................................................................................................................................................................................................
3 In the Root Cause Failure Counts panel, click any hyperlink showing a count for Total or
Unacknowledged.
Fault Management View the Details of Root Cause Failures from the Network
Event Summary Page
....................................................................................................................................................................................................................................
....................................................................................................................................................................................................................................
365-315-148R6.4 Issue 1
March 2011
2-45

Result: The Root Cause Failure page is displayed, listing the root cause failures.
Fault Management View the Details of Root Cause Failures from the Network
Event Summary Page
....................................................................................................................................................................................................................................
....................................................................................................................................................................................................................................
2-46 365-315-148R6.4 Issue 1
March 2011
E N D O F S T E P S...................................................................................................................................................................................................
Update Root Cause Failure Counts on the Network Event
Summary Page
When to use
Use this task to update root cause failure counts on the Network Event Summary page.
Related information
See the following topics in this document:
• “Network Event Summary ” (p. 2-16)
• “View the Details of Root Cause Failures from the Network Event Summary Page”
(p. 2-45)
Before you begin
Before you begin to view the Network Event Summary page, access the Preferences page
and verify, on the My Network Preferences panel of the page, that the Show panel
checkboxes for the Root Cause Failure Counts is checked to make these Network Event
Summary panels visible.
The feature Root Cause Failure can be used if the OMS_RCF licence is present.
Task
Complete the following steps to update root cause failure counts on the Network Event
Summary page.
...................................................................................................................................................................................................
1 In the menu bar of any window, click the My Network tab.
Result: A submenu is displayed.
...................................................................................................................................................................................................
2 Select Network event summary.
Result: The Network Event Summary page is displayed.
...................................................................................................................................................................................................
3 In the root cause failure counts panel, click the Refresh alarms count button.
Result: The root cause failure counts are updated. The date and time of the update are
displayed.
Fault Management Update Root Cause Failure Counts on the Network Event
Summary Page
....................................................................................................................................................................................................................................
....................................................................................................................................................................................................................................
365-315-148R6.4 Issue 1
March 2011
2-47
E N D O F S T E P S...................................................................................................................................................................................................

Perform a Partial Database Synchronization for Alarms and
Events
When to use
Use this task to perform a partial database synchronization for alarms and events so the
management system database is synchronized with network alarm information.
Manual alarm synchronization is not routinely performed, but can be performed to ensure
that the latest information is available. For example, if an unusual event occurs in the
network, a manual alarm synchronization can be performed to ensure that the Alarms
database is synchronized.
Related information
See the following topic in this document:
• “Database Synchronization of Alarms” (p. 2-6)
Before you begin
This task does not have any preconditions.
Task
Complete the following step to perform a partial database synchronization for alarms and
events.
...................................................................................................................................................................................................
1 In the top navigation bar select My network > Job updates.
Result: The Job Updates page is displayed. This page allows you to monitor the status
of the task.
...................................................................................................................................................................................................
2 Do one of the following:
• Use the icons or the object links to follow this path: Network . The Network Map is
displayed. Right-click an NE icon. From the Node menu, select Session > Database
Synchronization.
• Use the icons or the object links to follow this path: Network Elements. The Network
Elements page is displayed. Click the radio button to the left of the NE for which you
wish to perform a database synchronization. From the Go menu, select Initiate
Database Synchronization, and click the Go button.
• Use the icons or the object links to follow this path: Tools > Database
Synchronizations.
Fault Management Perform a Partial Database Synchronization for Alarms and
Events
....................................................................................................................................................................................................................................
....................................................................................................................................................................................................................................
2-48 365-315-148R6.4 Issue 1
March 2011
Result: The Initiate Database Synchronization page is displayed.
A database synchronization does not synchronize transient alarms, transient Threshold
Crossing Alerts (TCAs) or Protection Switch Events (PSEs).
...................................................................................................................................................................................................
3 In the Database synchronization type field, select Fault - Alarm and Events.
...................................................................................................................................................................................................
4 In the Database synchronization scope field, make a selection to indicate with which
NE or group of NEs the management system should synchronize as follows:
• In the All NEs in network field, select the radio button.
• In the All NEs in following network adapter server field, select a network adapter
server from the NA name drop-down list.
• In the All NEs in following network communications group field, either enter the
NCG name, or click the NCG name hyperlink to display the Network
Communications Group Selection pop-up window. This window is used to select an
NCG from a list.
• In the The following NE: field, either enter the NE name, or click the NE name
hyperlink to display the Network Elements pop-up window. This window is used to
select an NE from a list.
...................................................................................................................................................................................................
5 Click the Submit button.
Result: The alarms and events synchronization is performed, and a confirmation is
issued in the Messages panel. The Job Updates page is displayed, and reports the
status of the alarm and events synchronization.
Fault Management Perform a Partial Database Synchronization for Alarms and
Events
....................................................................................................................................................................................................................................
....................................................................................................................................................................................................................................
365-315-148R6.4 Issue 1
March 2011
2-49
E N D O F S T E P S...................................................................................................................................................................................................
View the Alarm Status of an Equipment Component
Purpose
Use this task to display information about the alarm status of an equipment component.
Related information
See the following topic in this document:
• “Alarm Notification” (p. 2-7)
Before you begin
This task does not have any preconditions.
Task
Complete the following steps to view the alarm status of an equipment component.
...................................................................................................................................................................................................
1 Do one of the following:
• Select Network from the OMS home page. The Network Map is displayed. Position
the mouse cursor on the NE icon, click the right mouse button to display a pop-up
menu, and select Network Element > Equipment from the pop-up menu.
• Use the icons or the object links to follow this path: Network Elements. The Network
Elements page is displayed. Expand the Search for network elements panel. Enter
search criteria to display the required NE(s) and click the Search button. The NEs that
match the specified search criteria is displayed. Select the network element from the
Network Elements page listing. From the Go menu, select Equipment and click the
Go button.
Result: The Equipment page is displayed with the view of the selected equipment
component.
The alarm status of the equipment component is indicated by the color of the alarm
icon on the component, representing the highest severity alarm currently active.
...................................................................................................................................................................................................
2 To view the alarm status of an equipment component contained within a higher level of
component (for example, to view the alarm status of ports contained in a slot/circuit
pack), click the graphical representation of the component to drill down to the next
equipment component level.
Result: The next level of component is displayed.
Note: If the user jumps from the equipment view for the bay, shelf slot view, a filtered
list of all “equipment” alarms and “physical port” alarms on that bay, shelf, slot view
will be returned. Likewise, if the user jumps from the NE view, a filtered list of “all”
Fault Management View the Alarm Status of an Equipment Component
....................................................................................................................................................................................................................................
....................................................................................................................................................................................................................................
2-50 365-315-148R6.4 Issue 1
March 2011

alarms on that NE will be returned.
Fault Management View the Alarm Status of an Equipment Component
....................................................................................................................................................................................................................................
....................................................................................................................................................................................................................................
365-315-148R6.4 Issue 1
March 2011
2-51
E N D O F S T E P S...................................................................................................................................................................................................
View Alarm Log Records
When to use
Use this task to view specific historical alarm/event records in the alarm log.
Related information
See the following topics in this document:
• “Alarm Log” (p. 2-15)
• “Export Alarm Log Records” (p. 2-54)
• “Delete Alarm Log Records” (p. 2-56)
Before you begin
This task does not have any preconditions.
Task
Complete the following steps to view specific historical alarm/event records in the alarm
log.
...................................................................................................................................................................................................
1 Use the icons or the object links to follow this path:
• Logs > Alarm Log
Result: The Alarm Log page is displayed.
Note: A new Go Menu Action, “Alarm Log”, on the Graphical Layout GUI page
for any type of Network Connection provisioned. When the user jumps from the
Graphical Layout to the Alarm Log, OMS R6.4 shall filter the Alarm Log based
on the Connection Name associated with the Network Connection being displayed
on the Graphical Layout from which the jump is initiated.
...................................................................................................................................................................................................
2 Enter the search criteria necessary to display the specific alarm log information, and click
the Search button.
Result: The alarm log information that meets the search criteria is displayed in the list
at the bottom of the page.
...................................................................................................................................................................................................
3 To see detailed alarm log information for a specific log entry, click the Details icon on the
left side of the required alarm log record.
Fault Management View Alarm Log Records
....................................................................................................................................................................................................................................
....................................................................................................................................................................................................................................
2-52 365-315-148R6.4 Issue 1
March 2011

Result: The detailed alarm log information is displayed below the alarm log list.
Fault Management View Alarm Log Records
....................................................................................................................................................................................................................................
....................................................................................................................................................................................................................................
365-315-148R6.4 Issue 1
March 2011
2-53
E N D O F S T E P S...................................................................................................................................................................................................

Export Alarm Log Records
When to use
Use this task to export specific alarm log records to a file or a device.
Related information
See the following topics in this document:
• “Alarm Log” (p. 2-15)
• “View Alarm Log Records” (p. 2-52)
• “Delete Alarm Log Records” (p. 2-56)
Before you begin
Before you begin to export alarm log records, be aware that you must have the NOC
Administrator factory-defined user role profile or you must have the Fault Management
Logs Administration user task specified in your user-defined user role profile before you
can complete this task. Contact your system administrator or refer to the OMS
Administration Guide for more details on user role profiles.
Task
Complete the following steps to export specific alarm log records to a file or a device.
...................................................................................................................................................................................................
1 Use the icons or the object links to follow this path:
• Logs > Alarm Log
Result: The Alarm Log page is displayed.
...................................................................................................................................................................................................
2 Enter the search criteria necessary to display the specific alarm log information that is to
be deleted, and click the Search button.
Result: The alarm log information that meets the search criteria is displayed in the list
at the bottom of the page.
...................................................................................................................................................................................................
3 To export the Alarm Log records displayed to a file or a device, select Write Filtered
Selection to Device or Write Filtered Selection to File from the Go menu and click the
Go button.
Fault Management Export Alarm Log Records
....................................................................................................................................................................................................................................
....................................................................................................................................................................................................................................
2-54 365-315-148R6.4 Issue 1
March 2011

Result: A pop-up window is displayed that requires you to specify the name of the file
or device.
...................................................................................................................................................................................................
4 Enter the name of the file or the device and click Submit.
Result: The file is written to the specified file or device.
Fault Management Export Alarm Log Records
....................................................................................................................................................................................................................................
....................................................................................................................................................................................................................................
365-315-148R6.4 Issue 1
March 2011
2-55
E N D O F S T E P S...................................................................................................................................................................................................
Delete Alarm Log Records
When to use
Use this task to delete specific alarm log records.
This task can only be performed by a user with administrative privileges.
Related information
See the following topics in this document:
• “Alarm Log” (p. 2-15)
• “View Alarm Log Records” (p. 2-52)
• “Export Alarm Log Records” (p. 2-54)
Before you begin
Be aware that you must have the NOC Administrator factory-defined user role profile or
you must have the Fault Management Logs Administration user task specified in your
user-defined user role profile before you can complete this task. Contact your system
administrator or refer to the OMS Administration Guide for more details on user role
profiles.
Task
Complete the following steps to delete specific alarm log records.
...................................................................................................................................................................................................
1 To follow this path use the icons or the object links:
• Logs > Alarm Log
Result: The Alarm Log page is displayed.
...................................................................................................................................................................................................
2 Enter the search criteria necessary to display the specific alarm log information that is to
be deleted, and click the Search button.
Result: The alarm log information that meets the search criteria is displayed in the list
at the bottom of the page.
...................................................................................................................................................................................................
3 To delete the Alarm Log records displayed, select Delete all from the Go menu and click
the Go button.
Result: The Alarm Log records are deleted.
Fault Management Delete Alarm Log Records
....................................................................................................................................................................................................................................
....................................................................................................................................................................................................................................
2-56 365-315-148R6.4 Issue 1
March 2011
E N D O F S T E P S...................................................................................................................................................................................................
View a List of Root Cause Failures on the Root Cause Failures
Page
When to use
Use this task to search for potential root cause failures.
Related information
See the following topics in this document:
• “Root Cause Failures Page” (p. 2-11)
• “Root Cause Failure Processing” (p. 2-25)
Before you begin
Before you begin to view a list of root cause failures, be aware that the Root Cause
Failures page can be accessed from various locations within the management system;
therefore, this task includes methods with which to access the Root Cause Failures page.
Task, Method 1: from the Alarms and Events Icon
...................................................................................................................................................................................................
1 Use the icons or the object links to follow one of these paths:
Alarms and Events > Root Cause Failures
Result: The Search for failed equipment and facilities panel of the Root Cause
Failures page is displayed.
...................................................................................................................................................................................................
2 If necessary, expand the Search for failed equipment and facilities panel, by clicking the +
icon next to More....
...................................................................................................................................................................................................
3 Enter the search criteria to view specific root cause failures or leave the search fields
blank to view all root cause failures and click the Search button.
Result: The Root Cause Failures panel of the Root Cause Failures page is displayed.
Fault Management View a List of Root Cause Failures on the Root Cause
Failures Page
....................................................................................................................................................................................................................................
....................................................................................................................................................................................................................................
365-315-148R6.4 Issue 1
March 2011
2-57
E N D O F S T E P S...................................................................................................................................................................................................
Task, Method 2: from the Network Map
Complete the following steps to view a list of root cause failures from the Network Map.
...................................................................................................................................................................................................
1 Use the icons or the object links to follow one of these paths:
Network
Result: The Network Map is displayed.
...................................................................................................................................................................................................
2 If necessary expand the areas or aggregates. Right click on a network element, and select
Root cause failures.
Result: The Root Cause Failure page opens and a pre-filtered list of all equipment and
port root cause failures for the network element are displayed
...................................................................................................................................................................................................
3 If necessary expand the areas. Right click on a link between two network elements or
areas and select Root cause failures.
Result: The Root Cause Failure page opens and a pre-filtered list of all connection
root cause failures on the link, at the current network map rate filter, is displayed.
Task, Method 3: from a Graphical Layout Menu of a Specific Connection
Complete the following steps to view a list of root cause failures from a Graphical Layout
of a specific connection.
...................................................................................................................................................................................................
1 Use the icons or the object links to follow one of these paths:
Connections > Network Connections
Result: The Network Connections page is displayed.
...................................................................................................................................................................................................
2 If necessary, expand the Search for Network Connections panel, by clicking the + icon
next to More....
...................................................................................................................................................................................................
3 Enter the appropriate search criteria and click the Search button.
Fault Management View a List of Root Cause Failures on the Root Cause
Failures Page
....................................................................................................................................................................................................................................
....................................................................................................................................................................................................................................
2-58 365-315-148R6.4 Issue 1
March 2011
E N D O F S T E P S...................................................................................................................................................................................................
Result: The Network Connections panel of the Network Connections page is
displayed.
...................................................................................................................................................................................................
4 Select a particular connection by clicking the check box to the left of the connection.
...................................................................................................................................................................................................
5 From the Go menu, select Graphical layout.
Result: The graphical layout for the selected connection is displayed.
...................................................................................................................................................................................................
6 From the Go menu on the Graphical Layout page, select Root Cause Failures List.
Result: The Root Cause Failure List of the selected connection is displayed.
Task, Method 4: from a Specific Connection on the Network Connection List page
Complete the following steps to view a list of root cause failures from a specific
connection on the Network Connection List page.
...................................................................................................................................................................................................
1 Use the icons or the object links to follow one of these paths:
Connections > Network Connections
Result: The Network Connections page is displayed.
...................................................................................................................................................................................................
2 Enter the appropriate search criteria and click the Search button.
Result: The Network Connections panel of the Network Connections page is
displayed.
...................................................................................................................................................................................................
3 Select a particular connection by clicking the check box to the left of the connection.
...................................................................................................................................................................................................
4 From the Go menu, select Root Cause Failure.
Result: The Root Cause Failure List of the selected connection is displayed.
Fault Management View a List of Root Cause Failures on the Root Cause
Failures Page
....................................................................................................................................................................................................................................
....................................................................................................................................................................................................................................
365-315-148R6.4 Issue 1
March 2011
2-59
E N D O F S T E P S...................................................................................................................................................................................................
E N D O F S T E P S...................................................................................................................................................................................................
Task, Method 5: from the Network Elements page
Complete the following steps to view a list of root cause failures from a specific
connection on the Network Elements page.
...................................................................................................................................................................................................
1 Use the icons or the object links to follow one of these paths:
Connections > Network Elements
Result: The Network Elements page is displayed.
...................................................................................................................................................................................................
2 Enter the appropriate search criteria and click the Search button.
Result: The Network Elements panel of the Network Elements page is displayed.
...................................................................................................................................................................................................
3 Select a particular connection by clicking the check box to the left of the connection.
...................................................................................................................................................................................................
4 From the Go menu, select Root Cause Failure.
Result: The equipment and port root cause failures for the selected network element
are displayed.
Fault Management View a List of Root Cause Failures on the Root Cause
Failures Page
....................................................................................................................................................................................................................................
....................................................................................................................................................................................................................................
2-60 365-315-148R6.4 Issue 1
March 2011
E N D O F S T E P S...................................................................................................................................................................................................
View the Details of a Root Cause Failure on the Root Cause
Failure Page
When to use
Use this task to view the details of a root cause failure on the Root Cause Failure page.
Related information
See the following topic in this document:
• “Root Cause Failure Processing” (p. 2-25)
• “Root Cause Failures Page” (p. 2-11)
• “View a List of Root Cause Failures on the Root Cause Failures Page” (p. 2-57)
Before you begin
Step 1 requires you to complete the “View a List of Root Cause Failures on the Root
Cause Failures Page” (p. 2-57) task.
Task
Complete the following steps to view the details of a root cause failure on the Root Cause
Failure page.
...................................................................................................................................................................................................
1 Complete one of the methods in the “View a List of Root Cause Failures on the Root
Cause Failures Page” (p. 2-57) task.
...................................................................................................................................................................................................
2 To display additional details for a specific root cause failure, click the Details icon that
appears in the row to the left the root cause failure.
Result: Additional root cause failure details are displayed below the Go menu in the
Root Cause Failures panel.
Fault Management View the Details of a Root Cause Failure on the Root Cause
Failure Page
....................................................................................................................................................................................................................................
....................................................................................................................................................................................................................................
365-315-148R6.4 Issue 1
March 2011
2-61
E N D O F S T E P S...................................................................................................................................................................................................
Acknowledge Root Cause Failures on the Root Cause Failures
Page
When to use
Use this task to acknowledge one or more root cause failures on the Root Cause Failures
page.
Note: Acknowledging a root cause failure automatically acknowledges any related raised
or cleared alarms associated with the root cause.
Related information
See the following topics in this document:
• “Root Cause Failure Processing” (p. 2-25)
• “Root Cause Failures Page” (p. 2-11)
• “View a List of Root Cause Failures on the Root Cause Failures Page” (p. 2-57)
Before you begin
Acknowledgement is only possible on records that have not been acknowledged. In
addition, multiple records can be acknowledged during one acknowledgment iteration.
Task
Complete the following steps to acknowledge one or more root cause failures on the Root
Cause Failures page.
...................................................................................................................................................................................................
1 Complete one of the methods in the “View a List of Root Cause Failures on the Root
Cause Failures Page” (p. 2-57) task.
...................................................................................................................................................................................................
2 Select one or more root cause failures on the Root Cause Failures page.
...................................................................................................................................................................................................
3 From the Go menu, select Acknowledge and click the Go button.
Result: The selected root cause failures are acknowledged.
All alarms associated with the root cause failure are acknowledged. The user activity
log is updated with an entry indicating the number of alarms and root causes failures
acknowledged during the operation.
Fault Management Acknowledge Root Cause Failures on the Root Cause
Failures Page
....................................................................................................................................................................................................................................
....................................................................................................................................................................................................................................
2-62 365-315-148R6.4 Issue 1
March 2011
E N D O F S T E P S...................................................................................................................................................................................................
View Client Connections for a Root Cause
When to use
Use this task to view the direct client connections for a connection root cause failure.
Note this operation is not available for service connection root cause failures.
Related information
See the following topics in this document:
• “Root Cause Failure Processing” (p. 2-25)
• “Root Cause Failures Page” (p. 2-11)
• “View a List of Root Cause Failures on the Root Cause Failures Page” (p. 2-57)
Before you begin
This task does not have any preconditions.
Task: View a Client Connection from the Root Cause Failure page
Complete the following steps to view the client connections for a connection root cause
failure from the Root Cause Failures page.
...................................................................................................................................................................................................
1 Complete one of the methods in the “View a List of Root Cause Failures on the Root
Cause Failures Page” (p. 2-57) task.
...................................................................................................................................................................................................
2 Select an infrastructure connection root cause failure on the Root Cause Failures
page.
Note: An infrastructure connection root cause failure has type Connection and service
No.
...................................................................................................................................................................................................
3 From the Go menu, select View client connections and click the Go button.
Result: A new Client Connections page is opened displaying a pre-filtered list of the
client connections for the selected root cause failure.
Fault Management View Client Connections for a Root Cause
....................................................................................................................................................................................................................................
....................................................................................................................................................................................................................................
365-315-148R6.4 Issue 1
March 2011
2-63
E N D O F S T E P S...................................................................................................................................................................................................
View Services for a Root Cause
When to use
Use this task to view Services for a root cause.
Related information
See the following topics in this document:
• “Root Cause Failure Processing” (p. 2-25)
• “Root Cause Failures Page” (p. 2-11)
• “View a List of Root Cause Failures on the Root Cause Failures Page” (p. 2-57)
Before you begin
This task does not have any preconditions.
Task: View Services from the Root Cause Failures page
Compete the following steps to view the service connections for a connection root cause
failure from the Root Cause Failures page.
...................................................................................................................................................................................................
1 Complete one of the methods in the “View a List of Root Cause Failures on the Root
Cause Failures Page” (p. 2-57) task.
...................................................................................................................................................................................................
2 Select an infrastructure connection root cause failure on the Root Cause Failures
page.
Note: An infrastructure connection root cause failure has type "Connection" and service
"No".
...................................................................................................................................................................................................
3 From the Go menu, select View services and click the Go button.
Result: A new Service Connections page is opened displaying a pre-filtered list of the
services for the selected root cause failure.
Fault Management View Services for a Root Cause
....................................................................................................................................................................................................................................
....................................................................................................................................................................................................................................
2-64 365-315-148R6.4 Issue 1
March 2011
E N D O F S T E P S...................................................................................................................................................................................................
View Affected Ports for a Root Cause
When to use
Use this task to view the contained ports for an equipment root cause failure.
Related information
See the following topics in this document:
• “Root Cause Failure Processing” (p. 2-25)
• “Root Cause Failures Page” (p. 2-11)
• “View a List of Root Cause Failures on the Root Cause Failures Page” (p. 2-57)
Before you begin
This task does not have any preconditions.
Task: View Affected Ports for a Root Cause
Compete the following steps to view the contained ports for an equipment root cause
failure from the Root Cause Failures Page.
...................................................................................................................................................................................................
1 Complete one of the methods in the “View a List of Root Cause Failures on the Root
Cause Failures Page” (p. 2-57) task.
...................................................................................................................................................................................................
2 Select an equipment root cause failure on the Root Cause Failures page.
Note: An equipment root cause failure has type Equipment.
...................................................................................................................................................................................................
3 From the Go menu, select View affected ports and click the Go button.
Result: A new Ports page is opened displaying a pre-filtered list of the contained ports
for the selected root cause failure.
Fault Management View Affected Ports for a Root Cause
....................................................................................................................................................................................................................................
....................................................................................................................................................................................................................................
365-315-148R6.4 Issue 1
March 2011
2-65
E N D O F S T E P S...................................................................................................................................................................................................
View Affected Ports on an NE for a Root Cause
When to use
Use this task to view the port assignment for an port root cause failure.
Related information
See the following topics in this document:
• “Root Cause Failure Processing” (p. 2-25)
• “Root Cause Failures Page” (p. 2-11)
• “View a List of Root Cause Failures on the Root Cause Failures Page” (p. 2-57)
Before you begin
This task does not have any preconditions.
Task: View Affected Ports on NE for a Root Cause
Compete the following steps to view the port assignment for a port root cause failure
from the Root Cause Failures Page.
...................................................................................................................................................................................................
1 Complete one of the methods in the “View a List of Root Cause Failures on the Root
Cause Failures Page” (p. 2-57) task.
...................................................................................................................................................................................................
2 Select a port root cause failure on the Root Cause Failures page.
Note: A port root cause failure has type Port.
...................................................................................................................................................................................................
3 From the Go menu, select View affected ports on NEs and click the Go button.
Result: A new Assigned Port page is opened displaying a list of all assigned ports on
the NE.
Fault Management View Affected Ports on an NE for a Root Cause
....................................................................................................................................................................................................................................
....................................................................................................................................................................................................................................
2-66 365-315-148R6.4 Issue 1
March 2011
E N D O F S T E P S...................................................................................................................................................................................................
View a List of Threshold Crossing alerts
When to use
Use this task to view the Threshold Crossing Alert page, which provides a detailed list of
threshold crossing alerts that can be displayed for NE.
Related information
See the following topics in this document:
• Threshold Crossing Alerts (TCA) Processing
• Threshold Crossing Alert Page
• Acknowledge Threshold Crossing Alerts
Before you begin
You are given four methods in which to access, and therefore view, the View a List of
Threshold Crossing alerts. Use Method 2, which accesses the Alarms page from the menu
bar of any page, if you want a filtered version of the page.
You can also access the Threshold Crossing Alerts page from a port, or from a go list on
all network connections, server connections, client connections, and service connections.
Refer to the OMS Connection Management Guide and the Connections chapter of online
Help.
Task, Method 1: from the Alarms and Events Icon
Complete the following steps to view a list of events on the Threshold Crossing Alerts
page.
...................................................................................................................................................................................................
1 Use the icons or the object links to follow this path: Alarms and Events> Threshold
Crossing Alerts.
Result: The Alarms Threshold Crossing Alerts page is displayed, which shows the
Search for Alarms Threshold Crossing Alerts.
...................................................................................................................................................................................................
2 Enter the search criteria to view specific alerts or leave the search fields blank to view all
alerts and click the Search button.
Result: The Alarms Threshold Crossing Alerts panel of the Alarms Threshold
Crossing Alerts page is displayed.
Fault Management View a List of Threshold Crossing alerts
....................................................................................................................................................................................................................................
....................................................................................................................................................................................................................................
365-315-148R6.4 Issue 1
March 2011
2-67
E N D O F S T E P S...................................................................................................................................................................................................
Task, Method 2: from the Top Navigation Zone Menu Bar
Complete the following steps to view the Alarms Threshold Crossing Alerts page.
...................................................................................................................................................................................................
1 In the top navigation zone of any page, click the My Network tab.
Result: A submenu is displayed.
...................................................................................................................................................................................................
2 Select Network Event Summary.
Result: The Network Event Summary page is displayed.
...................................................................................................................................................................................................
3 In the TCA portion of the page, click the number shown in the Total Raised, Unackd
raised, or Unackd clear column.
Result: The Threshold Crossing Alerts page is displayed for your selection.
The Threshold Crossing Alerts page is filtered to show all alerts, all unacknowledged
raised alerts, or all unacknowledged cleared alerts, depending on the count selected on
the Network Event Summary page.
...................................................................................................................................................................................................
4 If necessary, expand the Search panel, by clicking the + icon next to More....
...................................................................................................................................................................................................
5 Enter the search criteria to view specific threshold crossing alerts or leave the search
fields blank to view all alarms and click the Search button.
Result: The Threshold Crossing Alerts panel of the Threshold Crossing Alerts page is
displayed.
Task, Method 3: from a node link on the Network Map page
Complete the following steps to view the Alarms Threshold Crossing Alerts page.
...................................................................................................................................................................................................
1 On the main EMS panel, click the Network icon.
Result: The Network Map is displayed.
...................................................................................................................................................................................................
2 Right-click on the actual link between two nodes on the Network Map.
Fault Management View a List of Threshold Crossing alerts
....................................................................................................................................................................................................................................
....................................................................................................................................................................................................................................
2-68 365-315-148R6.4 Issue 1
March 2011
E N D O F S T E P S...................................................................................................................................................................................................
Result: A drop menu is displayed, with Threshold Crossing Alerts as one of the
selections.
...................................................................................................................................................................................................
3 Select Threshold Crossing Alerts from the drop-down menu.
Result: The Threshold Crossing Alerts page is displayed.
...................................................................................................................................................................................................
4 If necessary, expand the Search panel, by clicking the + icon next to More....
...................................................................................................................................................................................................
5 Enter the search criteria to view specific threshold crossing alerts or leave the search
fields blank to view all alarms and click the Search button.
Result: The Threshold Crossing Alerts panel of the Threshold Crossing Alerts page is
displayed.
Task, Method 4: from a node on the Network Map page
Complete the following steps to view the Alarms Threshold Crossing Alerts page.
...................................................................................................................................................................................................
1 On the main EMS panel, click the Network icon.
Result: The Network Map is displayed.
...................................................................................................................................................................................................
2 Right-click on a node on the Network Map.
Result: A drop menu is displayed, with Threshold Crossing Alerts as one of the
selections.
...................................................................................................................................................................................................
3 Select Threshold Crossing Alerts from the drop-down menu.
Result: The Threshold Crossing Alerts page is displayed.
...................................................................................................................................................................................................
4 If necessary, expand the Search panel, by clicking the + icon next to More....
...................................................................................................................................................................................................
5 Enter the search criteria to view specific threshold crossing alerts or leave the search
fields blank to view all alarms and click the Search button.
Fault Management View a List of Threshold Crossing alerts
....................................................................................................................................................................................................................................
....................................................................................................................................................................................................................................
365-315-148R6.4 Issue 1
March 2011
2-69
E N D O F S T E P S...................................................................................................................................................................................................

Result: The Threshold Crossing Alerts panel of the Threshold Crossing Alerts page is
displayed.
Fault Management View a List of Threshold Crossing alerts
....................................................................................................................................................................................................................................
....................................................................................................................................................................................................................................
2-70 365-315-148R6.4 Issue 1
March 2011
E N D O F S T E P S...................................................................................................................................................................................................
View the Details of Threshold Crossing Alerts from the
Network Event Summary Page
When to use
Use this task to View the details of Threshold Crossing alerts.
Related information
See the following topics in this document:
• Threshold Crossing Alerts (TCA) Processing
• Threshold Crossing Alert Page
• Acknowledge Threshold Crossing Alerts
Before you begin
This task does not have any preconditions.
Task
Complete the following steps to view alarm details from the Network Event Summary
page.
...................................................................................................................................................................................................
1 In the menu bar of any window, click the My Network tab.
Result: A submenu is displayed.
...................................................................................................................................................................................................
2 Select Network event summary
Result: The Network Event Summary page is displayed.
...................................................................................................................................................................................................
3 In the TCA column, click the hyperlink for the Total raised or Unackd raised TCA.
Result: The Threshold Crossing Alert page is displayed.
...................................................................................................................................................................................................
4 To display additional details for a specific TCA, click the Details icon, which appears in
the row to the left of the TCA.
Result: Additional TCA details are displayed below the Go menu in the TCA panel.
Fault Management View the Details of Threshold Crossing Alerts from the
Network Event Summary Page
....................................................................................................................................................................................................................................
....................................................................................................................................................................................................................................
365-315-148R6.4 Issue 1
March 2011
2-71
E N D O F S T E P S...................................................................................................................................................................................................

Acknowledge a Threshold Crossing Alert
When to use
Use this task to acknowledge one or more a Threshold Crossing Alerts on the Threshold
Crossing Alert page.
Related information
See the following topics in this document:
• Threshold Crossing Alerts (TCA) Processing
• Threshold Crossing Alert Page
• Acknowledge Threshold Crossing Alerts
Before you begin
This task does not have any preconditions.
Task
Complete the following steps to acknowledge one or more events on the Threshold
Crossing Alerts page.
...................................................................................................................................................................................................
1 Access the Protection Switch Events page using one of the methods described in the
Threshold Crossing Alert page task.
Result: The Threshold Crossing Alerts page is displayed.
...................................................................................................................................................................................................
2 Select one or more alerts on the Threshold Crossing Alerts page.
...................................................................................................................................................................................................
3 From the Go menu, select Acknowledge and click the Go button.
Result: The selected threshold crossing alerts are acknowledged.
When a user acknowledges threshold crossing alert, all previous instances of that alert
in the current alert list will be acknowledged.
The Acknowledge date & time field is updated for the acknowledged alarm(s). The
Acknowledged by field is updated with the user ID of the user who acknowledged the
alarm(s).
Fault Management Acknowledge a Threshold Crossing Alert
....................................................................................................................................................................................................................................
....................................................................................................................................................................................................................................
2-72 365-315-148R6.4 Issue 1
March 2011
E N D O F S T E P S...................................................................................................................................................................................................
View a List of Events on the Protection Switch Event Page
When to use
Use this task to view the Protection Switch Event Page, which provides a detailed list of
equipment and management system-generated events that can be displayed for each PSE.
Related information
See the following topics in this document:
• Protection Switch Event Processing
• Protection Switch Event Log page
• Acknowledge Protection Switch Event Log page
Before you begin
You are given two methods in which to access, and therefore view, the Events on the
Protection Switch Event page.
Task, Method 1: from the Logs Icon
Complete the following steps to view a list of events on the Protection Switch Event page.
...................................................................................................................................................................................................
1 Use the icons or the object links to follow this path: Logs > Protection Switch Events.
Result: The Protection Switch Event page is displayed, which shows the Search for
Alarms Protection Switch Events panel.
...................................................................................................................................................................................................
2 Enter the search criteria to view specific events or leave the search fields blank to view all
events and click the Search button.
Result: The Protection Switch Event panel of the Protection Switch Event page is
displayed.
Task, Method 2: from the Top Navigation Zone Menu Bar
Complete the following steps to view the Protection Switch Events page.
...................................................................................................................................................................................................
1 In the top navigation zone of any page, click the My Network tab.
Fault Management View a List of Events on the Protection Switch Event Page
....................................................................................................................................................................................................................................
....................................................................................................................................................................................................................................
365-315-148R6.4 Issue 1
March 2011
2-73
E N D O F S T E P S...................................................................................................................................................................................................
Result: A submenu is displayed.
...................................................................................................................................................................................................
2 Select Network Event Summary.
Result: The Network Event Summary page is displayed.
...................................................................................................................................................................................................
3 In the PSEs column of the page, click the number shown in the Unackd raised row.
Result: The Protection Switch Events Log page is displayed for your selection.
The Protection Switch Events Log page is filtered to show all unacknowledged PSEs,
all events, all unacknowledged raised events, or all unacknowledged cleared events,
depending on the count selected on the Network Event Summary page.
...................................................................................................................................................................................................
4 If necessary, expand the Search panel, by clicking the + icon next to More....
...................................................................................................................................................................................................
5 Enter the search criteria to view specific Protection Switch Events or leave the search
fields blank to view all events and click the Search button.
Result: The Protection Switch Events Log panel of the Protection Switch Events Log
page is displayed.
Task, Method 3: from a node link on the Network Map page
Complete the following steps to view the Protection Switch Event page.
...................................................................................................................................................................................................
1 On the main EMS panel, click the Network icon.
Result: The Network Map is displayed.
...................................................................................................................................................................................................
2 Right-click on the actual link between 2 nodes on the Network Map.
Result: A drop menu is displayed, with Protection Switch Event as one of the
selections.
...................................................................................................................................................................................................
3 Select Protection Switch Event from the drop-down menu.
Fault Management View a List of Events on the Protection Switch Event Page
....................................................................................................................................................................................................................................
....................................................................................................................................................................................................................................
2-74 365-315-148R6.4 Issue 1
March 2011
E N D O F S T E P S...................................................................................................................................................................................................
Result: The Protection Switch Event page is displayed.
The Protection Switch Events page is filtered to show all unacknowledged PSEs, all
events, all unacknowledged raised events, or all unacknowledged cleared events,
depending on the count selected on the Network Event Summary page.
...................................................................................................................................................................................................
4 If necessary, expand the Search panel, by clicking the + icon next to More....
...................................................................................................................................................................................................
5 Enter the search criteria to view specific Protection Switch Events or leave the search
fields blank to view all alarms and click the Search button.
Result: The Protection Switch Events panel of the Protection Switch Events page is
displayed.
Task, Method 4: from a node on the Network Map page
Complete the following steps to view the Protection Switch Event page.
...................................................................................................................................................................................................
1 On the main EMS panel, click the Network icon.
Result: The Network Map is displayed.
...................................................................................................................................................................................................
2 Right-click on a node on the Network Map
Result: A drop menu is displayed, with Protection Switch Event as one of the
selections.
...................................................................................................................................................................................................
3 Select Protection Switch Event from the drop-down menu.
Result: The Protection Switch Event page is displayed.
The Protection Switch Events page is filtered to show all unacknowledged PSEs, all
events, all unacknowledged raised events, or all unacknowledged cleared events,
depending on the count selected on the Network Event Summary page.
...................................................................................................................................................................................................
4 If necessary, expand the Search panel, by clicking the + icon next to More....
...................................................................................................................................................................................................
5 Enter the search criteria to view specific Protection Switch Events or leave the search
fields blank to view all alarms and click the Search button.
Fault Management View a List of Events on the Protection Switch Event Page
....................................................................................................................................................................................................................................
....................................................................................................................................................................................................................................
365-315-148R6.4 Issue 1
March 2011
2-75
E N D O F S T E P S...................................................................................................................................................................................................

Result: The Protection Switch Events panel of the Protection Switch Events page is
displayed.
Fault Management View a List of Events on the Protection Switch Event Page
....................................................................................................................................................................................................................................
....................................................................................................................................................................................................................................
2-76 365-315-148R6.4 Issue 1
March 2011
E N D O F S T E P S...................................................................................................................................................................................................
Acknowledge a Protection Switch Event Log page
When to use
Use this task to acknowledge one or more protection switch events on the Protection
Switch Event page.
Related information
See the following topics in this document:
• Protection Switch Event Processing
• Protection Switch Event Log page
Before you begin
This task does not have any preconditions.
Task
Complete the following steps to acknowledge one or more Protection Switch events on
the Protection Switch Events Log page.
...................................................................................................................................................................................................
1 Access the Protection Switch Events page using one of the methods described in the View
a list of events on the Protection Switch Event page task.
Result: The Protection Switch Events page is displayed.
...................................................................................................................................................................................................
2 Select one or more events on the Protection Switch Events page.
...................................................................................................................................................................................................
3 From the Go menu, select Acknowledge and click the Go button.
Result: The selected events are acknowledged.
Please note that when a user acknowledges an event, all previous instances of that
event in the current event list will be acknowledged.
The Acknowledge date & time field is updated for the acknowledged event(s). The
Acknowledged by field is updated with the user ID of the user who acknowledged the
event(s).
Fault Management Acknowledge a Protection Switch Event Log page
....................................................................................................................................................................................................................................
....................................................................................................................................................................................................................................
365-315-148R6.4 Issue 1
March 2011
2-77
E N D O F S T E P S...................................................................................................................................................................................................

Fault Management Acknowledge a Protection Switch Event Log page
....................................................................................................................................................................................................................................
....................................................................................................................................................................................................................................
2-78 365-315-148R6.4 Issue 1
March 2011
3 3Performance Monitoring
Overview
Purpose
This chapter provides general information about the Performance Monitoring (PM)
feature, which is used to collect and view error and traffic statistics from network
elements in the managed network, and the tasks that can be performed to enable and use
the Performance Monitoring capabilities in the OMS.
Contents
The Performance Monitoring Feature 3-2
Performance Monitoring Pages 3-3
PM Time Intervals and Data Viewing 3-5
PM Data Storage Behavior 3-6
Performance Monitoring Counters 3-8
Supported PM Parameters for NEs in the SDH/Ethernet Environment 3-47
Supported PM Parameters for NEs in the SONET/Ethernet Environment 3-56
Supported PM Parameters for NEs in the WDM Environment 3-65
View a List of Performance Measurements Statistics 3-68
View a List of PM-Capable Termination Points 3-69
Enable PM Data Collection 3-71
Disable PM Data Collection 3-73
Schedule Disable PM Data Collection 3-75
Clear PM Data Collection for Selected Termination Points 3-77
View the Current PM Measurements of a Termination Point 3-79
View the History PM Measurements of a Termination Point 3-81
...................................................................................................................................................................................................................................
365-315-148R6.4 Issue 1
March 2011
3-1

View the Monitored NE Layer Rate Report 3-83
Enable/Disable NE Layer Rates 3-85
Generate a PM Report 3-87
Save a PM Report 3-89
Polling Current Measurements 3-90
The Performance Monitoring Feature
Performance Monitoring definition
The Performance Monitoring feature enables the user to precisely monitor the quality of
the end-to-end paths, be notified of performance degradation, and initiate corrective
action, if necessary.
Performance Monitoring provides management system users with network and
service-level error and traffic statistics for various network connection types. Reports can
be generated for monitored network connections to show the error rate count for network
connections, or the traffic carried and dropped for Ethernet connections.
Error and traffic performance data can be compared with the Service Level Agreement
(SLA) for each service.
TCAs
The management system receives and displays Threshold Crossing Alerts (TCAs) from
NE termination points (TPs) that are set to generate and process Performance Monitoring
(PM) data. TCAs are sent when the transmission error levels within an NE exceed
predefined threshold levels, or when the carried traffic levels exceed bandwidth-usage
thresholds.
Threshold settings
PM Threshold settings and Signal Degrade Threshold settings are accessed and specified
through Network Elements > NE Management Functions. Refer to the OMS Network
Element Management Guide for detailed information.
Performance Monitoring as a non-licensed feature
All Performance Monitoring features are available to users through the OMS_CORE
license, which includes those features that are available through the Performance
Measurements Statistics, Performance Measurement Points and Performance
Performance Monitoring Overview
....................................................................................................................................................................................................................................
....................................................................................................................................................................................................................................
3-2 365-315-148R6.4 Issue 1
March 2011
Measurement Reports object links. With the OMS_CORE license, the Performance Monitoring
and the Performance Monitoring (view-only) user tasks become available for user role profile use.
Operating Mode
The system operates in any one of these two modes which can be specified during
installation:
• TP Mode
• Bulk Mode
Important! You can change the operating mode of the system after installation, but
the system will loose all the stored PM data.
TP Mode
In TP mode, the system allows the user to specify a limited number of monitoring points
for which the OMS collects Performance Monitoring data. The TP mode is designed for
the collection of a small volume of 15 minutes data and a larger volume of 24 hour data.
Bulk Mode
In Bulk mode, the system attempts to collect data for all monitoring points which are
being monitored on each network element. Bulk Mode is designed for the collection of a
large volume of Performance Monitoring data. The user can collect 15 minutes and 24
hour PM data for all monitoring points in the network. If the user adds an NE to a system
for which Bulk Mode is not supported , the Performance Monitoring collection will not
be performed for that NE. This option will be available only with a licence and requires
additional hardware.
Performance Monitoring Pages
Specifically designed pages
The pages of the management system that are specifically designed to present
Performance Monitoring information are the following:
• “Performance Measurements Statistics page” (p. 3-4)
• “Performance Measurements Points page” (p. 3-4)
• “Current Measurements page” (p. 3-4)
• “History Measurements page” (p. 3-4)
• “Performance Measurements Reports Query page” (p. 3-4)
• “Performance Measurements Report Results page” (p. 3-4)
• “ Monitored NE Layer Rate page” (p. 3-4)
Performance Monitoring The Performance Monitoring Feature
....................................................................................................................................................................................................................................
....................................................................................................................................................................................................................................
365-315-148R6.4 Issue 1
March 2011
3-3
Performance Measurements Statistics page
The Performance Measurements Statistics page provides 15-minute and 24-hour
measurement data for monitored termination points (TPs) including counts for the
number of termination points monitored for 15-minute user-demand requests and 24-hour
data, and the 15-minute and 24-hour retention periods.
Refer to the “View a List of Performance Measurements Statistics” (p. 3-68) task for the
procedure to view this page.
Performance Measurements Points page
The Performance Measurement Points page enables users to display a list of
PM-capable termination points and/or termination points with PM data collection
enabled. Users can start and stop PM data collection on demand or schedule PM data
collection for a specific time period, obtain current PM measurements about a selected
termination point, and query PM-enabled termination points using specific criteria to
generate and view and/or save a PM report file. The system can display the current PM
counts with periodic update for an interval of time as specified. For example, update
every 30 seconds for 10 minutes.
Current Measurements page
The Current Measurements page enables users to display current PM parameter
measurements for a selected NE termination point.
History Measurements page
The History Measurements page enables users to display the historic PM parameter
measurements for a selected NE termination point.
Performance Measurements Reports Query page
The Performance Measurement Reports Query page enables users to specify report
criteria for up to four PM-enabled termination points for output to a PM report file.
Performance Measurements Report Results page
The Performance Measurement Report Results page enables users to view and/or save
the PM report file generated from criteria specified on the Performance Measurement
Reports Query page.
Monitored NE Layer Rate page
The Monitored NE Layer Rate page is intended to allow the user to view and modify the
behavior of the PM collection algorithm. During typical operating conditions, changes to
this page are not necessary.
Performance Monitoring Performance Monitoring Pages
....................................................................................................................................................................................................................................
....................................................................................................................................................................................................................................
3-4 365-315-148R6.4 Issue 1
March 2011
PM Time Intervals and Data Viewing
Granularities
The management system monitors and reports on PM data gathered from two time
intervals:
• 24-hour PM data
• 15-minute PM data (user on-demand request)
PM data reporting
The management system enables 15-minute (on-demand user request) and/or 24-hour PM
data collection for the following:
• PM data can be collected and stored in the management system from NE termination
points.
• PM data can be retrieved directly from each NE termination points in which the data
has not yet been collected.
The 24-hour PM data collected from NE termination points is stored in the management
system for 62 days. The 15-minute PM-data is stored in the management system for 14
days. The 62-day and the 14-day storage values are maximum values. These storage
values can be set to lower values by the user.
All PM data older than either time is automatically purged from the management system.
Refer to “PM Data Storage Behavior” (p. 3-6) for additional details.
PM data search criteria for filtering
The management system enables the following search criteria to be used to filter PM data
for its appearance in report format:
• Connection name
• NE name
• Connection rate
• Granularity
• Started/Stopped Ports Only
• Data collection from/to
Report file format, fields, and export
From the search criteria specified, the management system produces a report file, which
is an ASCII file in Tab Separated Value (tsv ) format. The .tsv file can be read into an
MicroSoft® Excel compatible file and saved as an .xls file in MicroSoft® Excel. The
filename of the generated report is in this format: <ReportType>.xls.
Performance Monitoring PM Time Intervals and Data Viewing
....................................................................................................................................................................................................................................
....................................................................................................................................................................................................................................
365-315-148R6.4 Issue 1
March 2011
3-5

Visually, the report file is a 211 column list; the first line of the report contains the column
titles, which are followed by data. The following data is included in the report file:
• Layer is the layer/connection rate, for example: MS16, VC4, OC-48 Section, or
STS-3c.
• NE Name is the name of the node.
• Connection Name is the name of the connection.
• TP Name is the access identifier (AID) or the termination point (TP)
• Period End Time (UTC) shows the end of the PM history binning period. For
15-minute PM data that is user-requested, a time of 9:05 indicates the end period from
09:00 until 09:15. For 24-hour PM data, a data of 20/05/03 means the end period from
midnight 19/05/03 until midnight 20/05/03. The data is in the format: DD/MM/YY
HH:MM.
• <Counter> Status is one of the following single characters: V representing VALID, U
representing UNAVAILABLE, or I representing INVALID. If the counter is not
applicable for a particular termination point/layer rate, a dash (-) is displayed in the
table cell.
• <Counter> Value is a number or text string that represents the value of the counter. If
the counter is not applicable for a particular termination point/layer rate, a dash (-) is
displayed in the table cell.
The ordering of parameters is alphabetical within the following groups, which are
displayed from left to right across the data report:
• NE for near-end counters
• FE for far-end counters
• Bi for bi-directional counters
• Ethernet & WDM Counters
PM Data Storage Behavior
Behavior in general
The management system supports the following:
• the display of 15-minute on-demand data if requested by the user
• 24-hour PM data
• background PM data collection
• storage of PM data
The functions to enable, collect, and report 15-minute and/or 24-hour PM data are the
same. The user can produce 15-minute reports on demand and retrieve all data that the
NE is able to store, which is approximately 8 hours of data. The user can select a
termination point for PM collection, or for the display of PM data, from a termination
Performance Monitoring PM Time Intervals and Data Viewing
....................................................................................................................................................................................................................................
....................................................................................................................................................................................................................................
3-6 365-315-148R6.4 Issue 1
March 2011
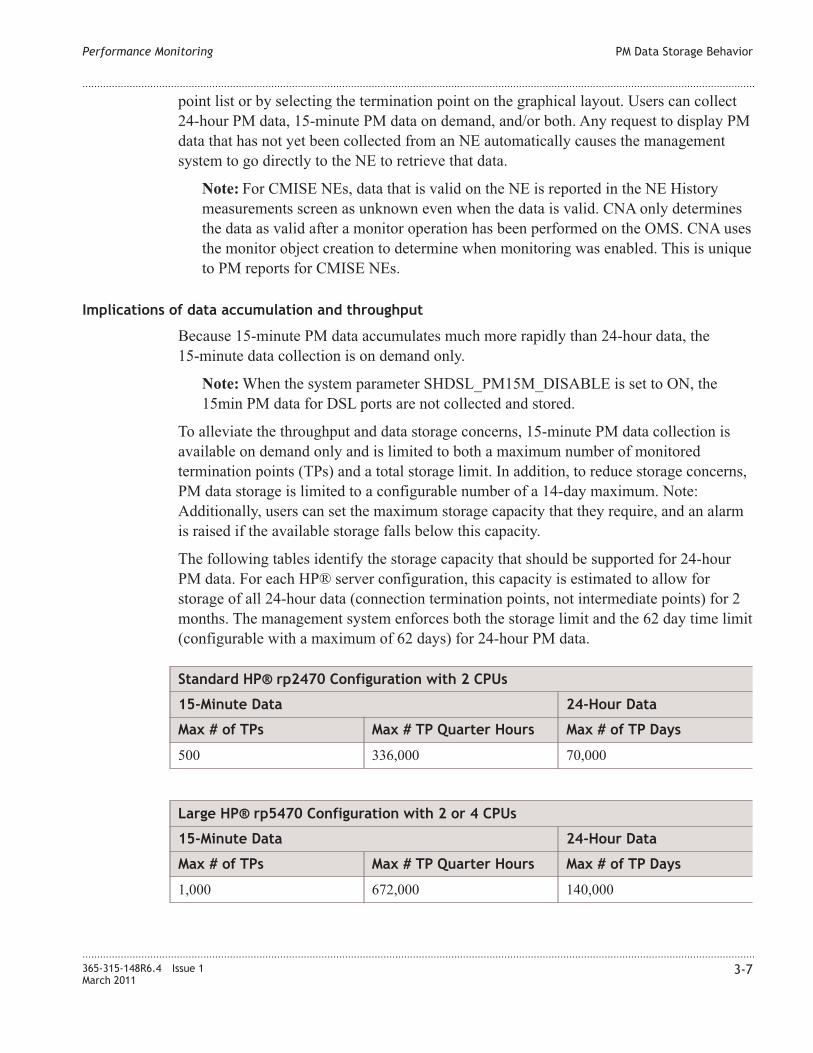
point list or by selecting the termination point on the graphical layout. Users can collect
24-hour PM data, 15-minute PM data on demand, and/or both. Any request to display PM
data that has not yet been collected from an NE automatically causes the management
system to go directly to the NE to retrieve that data.
Note: For CMISE NEs, data that is valid on the NE is reported in the NE History
measurements screen as unknown even when the data is valid. CNA only determines
the data as valid after a monitor operation has been performed on the OMS. CNA uses
the monitor object creation to determine when monitoring was enabled. This is unique
to PM reports for CMISE NEs.
Implications of data accumulation and throughput
Because 15-minute PM data accumulates much more rapidly than 24-hour data, the
15-minute data collection is on demand only.
Note: When the system parameter SHDSL_PM15M_DISABLE is set to ON, the
15min PM data for DSL ports are not collected and stored.
To alleviate the throughput and data storage concerns, 15-minute PM data collection is
available on demand only and is limited to both a maximum number of monitored
termination points (TPs) and a total storage limit. In addition, to reduce storage concerns,
PM data storage is limited to a configurable number of a 14-day maximum. Note:
Additionally, users can set the maximum storage capacity that they require, and an alarm
is raised if the available storage falls below this capacity.
The following tables identify the storage capacity that should be supported for 24-hour
PM data. For each HP® server configuration, this capacity is estimated to allow for
storage of all 24-hour data (connection termination points, not intermediate points) for 2
months. The management system enforces both the storage limit and the 62 day time limit
(configurable with a maximum of 62 days) for 24-hour PM data.
Standard HP® rp2470 Configuration with 2 CPUs
15-Minute Data 24-Hour Data
Max # of TPs Max # TP Quarter Hours Max # of TP Days
500 336,000 70,000
Large HP® rp5470 Configuration with 2 or 4 CPUs
15-Minute Data 24-Hour Data
Max # of TPs Max # TP Quarter Hours Max # of TP Days
1,000 672,000 140,000
Performance Monitoring PM Data Storage Behavior
....................................................................................................................................................................................................................................
....................................................................................................................................................................................................................................
365-315-148R6.4 Issue 1
March 2011
3-7
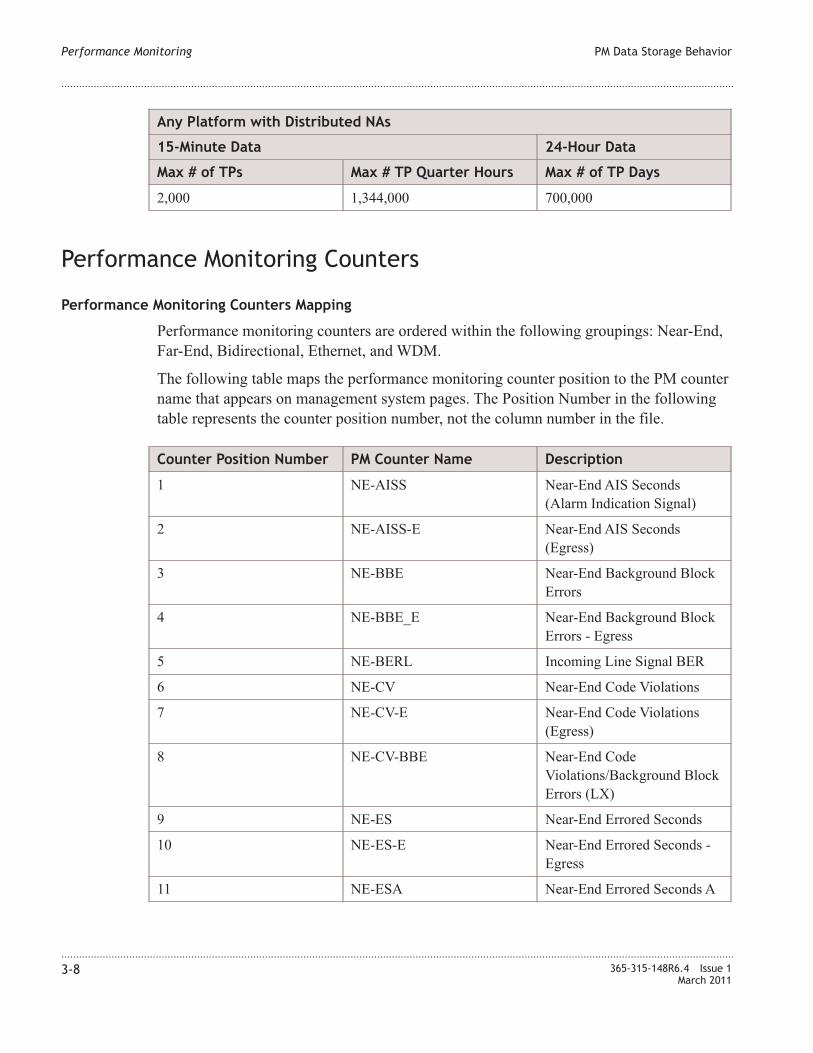
Any Platform with Distributed NAs
15-Minute Data 24-Hour Data
Max # of TPs Max # TP Quarter Hours Max # of TP Days
2,000 1,344,000 700,000
Performance Monitoring Counters
Performance Monitoring Counters Mapping
Performance monitoring counters are ordered within the following groupings: Near-End,
Far-End, Bidirectional, Ethernet, and WDM.
The following table maps the performance monitoring counter position to the PM counter
name that appears on management system pages. The Position Number in the following
table represents the counter position number, not the column number in the file.
Counter Position Number PM Counter Name Description
1 NE-AISS Near-End AIS Seconds
(Alarm Indication Signal)
2 NE-AISS-E Near-End AIS Seconds
(Egress)
3 NE-BBE Near-End Background Block
Errors
4 NE-BBE_E Near-End Background Block
Errors - Egress
5 NE-BERL Incoming Line Signal BER
6 NE-CV Near-End Code Violations
7 NE-CV-E Near-End Code Violations
(Egress)
8 NE-CV-BBE Near-End Code
Violations/Background Block
Errors (LX)
9 NE-ES Near-End Errored Seconds
10 NE-ES-E Near-End Errored Seconds -
Egress
11 NE-ESA Near-End Errored Seconds A
Performance Monitoring PM Data Storage Behavior
....................................................................................................................................................................................................................................
....................................................................................................................................................................................................................................
3-8 365-315-148R6.4 Issue 1
March 2011
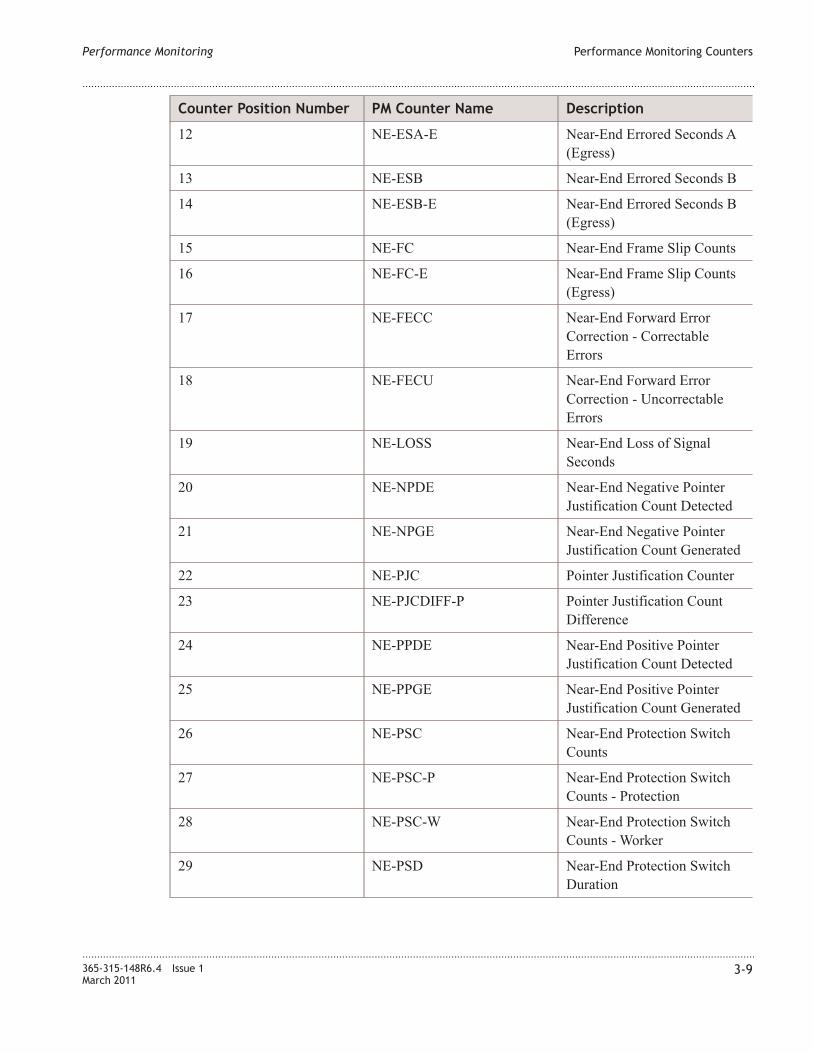
Counter Position Number PM Counter Name Description
12 NE-ESA-E Near-End Errored Seconds A
(Egress)
13 NE-ESB Near-End Errored Seconds B
14 NE-ESB-E Near-End Errored Seconds B
(Egress)
15 NE-FC Near-End Frame Slip Counts
16 NE-FC-E Near-End Frame Slip Counts
(Egress)
17 NE-FECC Near-End Forward Error
Correction - Correctable
Errors
18 NE-FECU Near-End Forward Error
Correction - Uncorrectable
Errors
19 NE-LOSS Near-End Loss of Signal
Seconds
20 NE-NPDE Near-End Negative Pointer
Justification Count Detected
21 NE-NPGE Near-End Negative Pointer
Justification Count Generated
22 NE-PJC Pointer Justification Counter
23 NE-PJCDIFF-P Pointer Justification Count
Difference
24 NE-PPDE Near-End Positive Pointer
Justification Count Detected
25 NE-PPGE Near-End Positive Pointer
Justification Count Generated
26 NE-PSC Near-End Protection Switch
Counts
27 NE-PSC-P Near-End Protection Switch
Counts - Protection
28 NE-PSC-W Near-End Protection Switch
Counts - Worker
29 NE-PSD Near-End Protection Switch
Duration
Performance Monitoring Performance Monitoring Counters
....................................................................................................................................................................................................................................
....................................................................................................................................................................................................................................
365-315-148R6.4 Issue 1
March 2011
3-9
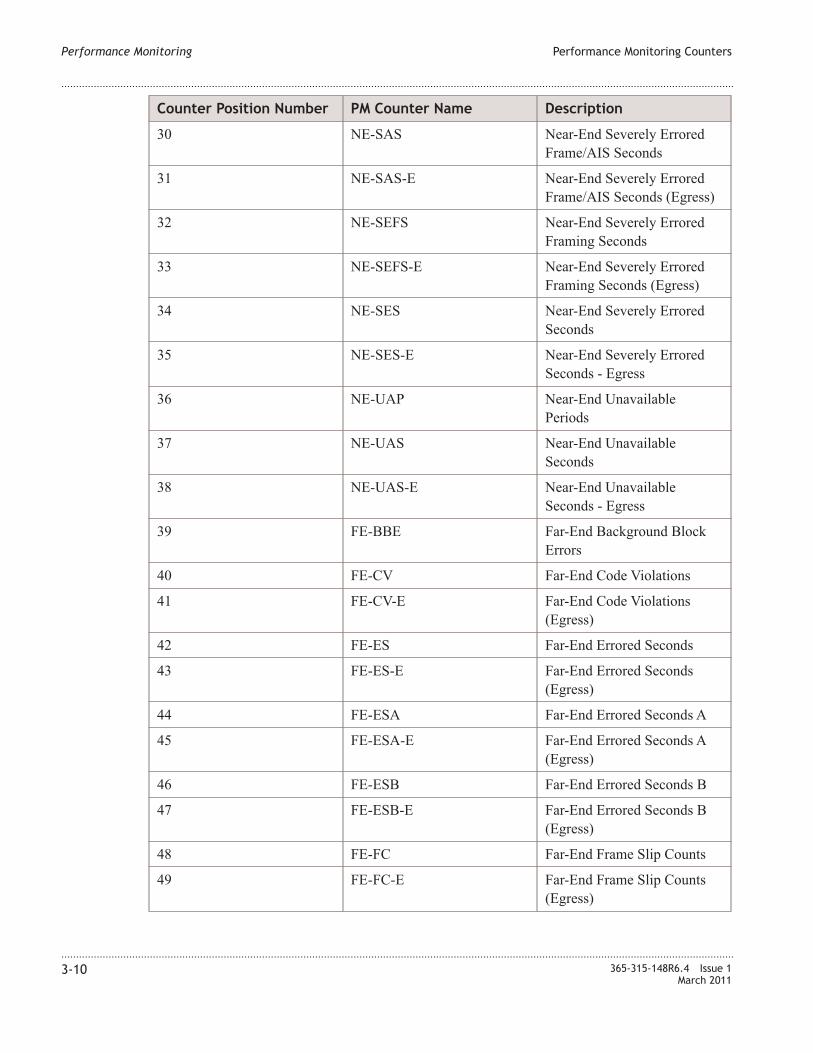
Counter Position Number PM Counter Name Description
30 NE-SAS Near-End Severely Errored
Frame/AIS Seconds
31 NE-SAS-E Near-End Severely Errored
Frame/AIS Seconds (Egress)
32 NE-SEFS Near-End Severely Errored
Framing Seconds
33 NE-SEFS-E Near-End Severely Errored
Framing Seconds (Egress)
34 NE-SES Near-End Severely Errored
Seconds
35 NE-SES-E Near-End Severely Errored
Seconds - Egress
36 NE-UAP Near-End Unavailable
Periods
37 NE-UAS Near-End Unavailable
Seconds
38 NE-UAS-E Near-End Unavailable
Seconds - Egress
39 FE-BBE Far-End Background Block
Errors
40 FE-CV Far-End Code Violations
41 FE-CV-E Far-End Code Violations
(Egress)
42 FE-ES Far-End Errored Seconds
43 FE-ES-E Far-End Errored Seconds
(Egress)
44 FE-ESA Far-End Errored Seconds A
45 FE-ESA-E Far-End Errored Seconds A
(Egress)
46 FE-ESB Far-End Errored Seconds B
47 FE-ESB-E Far-End Errored Seconds B
(Egress)
48 FE-FC Far-End Frame Slip Counts
49 FE-FC-E Far-End Frame Slip Counts
(Egress)
Performance Monitoring Performance Monitoring Counters
....................................................................................................................................................................................................................................
....................................................................................................................................................................................................................................
3-10 365-315-148R6.4 Issue 1
March 2011
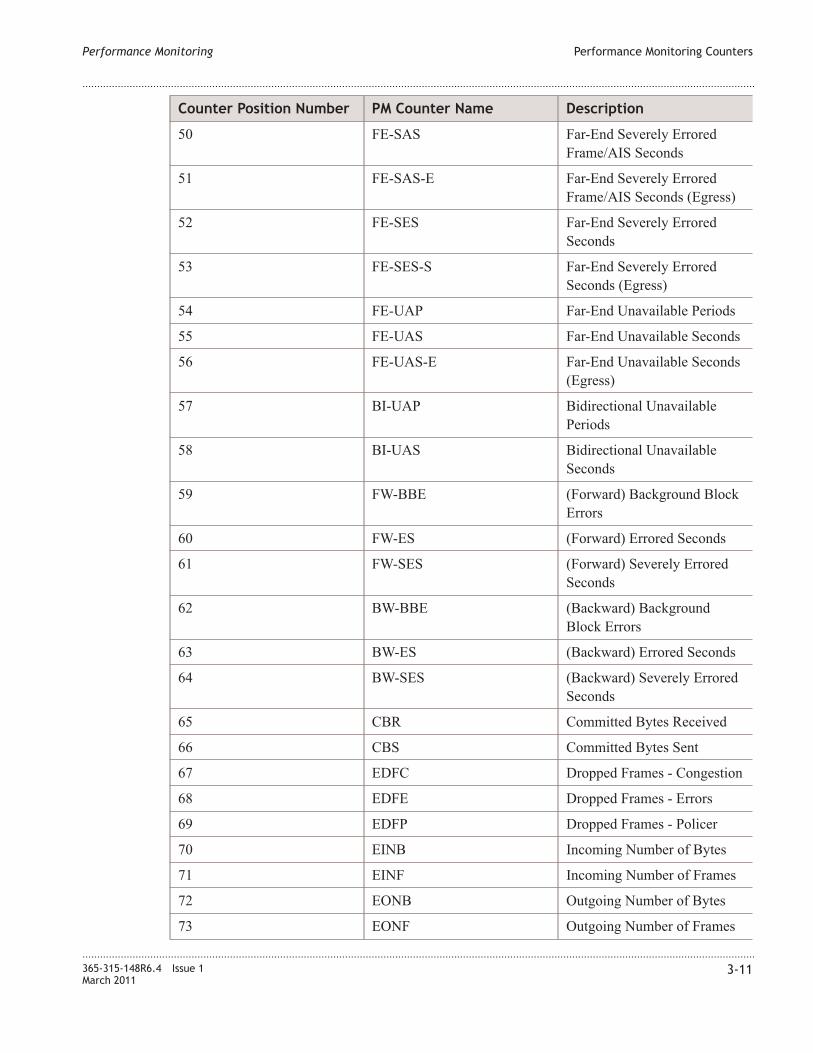
Counter Position Number PM Counter Name Description
50 FE-SAS Far-End Severely Errored
Frame/AIS Seconds
51 FE-SAS-E Far-End Severely Errored
Frame/AIS Seconds (Egress)
52 FE-SES Far-End Severely Errored
Seconds
53 FE-SES-S Far-End Severely Errored
Seconds (Egress)
54 FE-UAP Far-End Unavailable Periods
55 FE-UAS Far-End Unavailable Seconds
56 FE-UAS-E Far-End Unavailable Seconds
(Egress)
57 BI-UAP Bidirectional Unavailable
Periods
58 BI-UAS Bidirectional Unavailable
Seconds
59 FW-BBE (Forward) Background Block
Errors
60 FW-ES (Forward) Errored Seconds
61 FW-SES (Forward) Severely Errored
Seconds
62 BW-BBE (Backward) Background
Block Errors
63 BW-ES (Backward) Errored Seconds
64 BW-SES (Backward) Severely Errored
Seconds
65 CBR Committed Bytes Received
66 CBS Committed Bytes Sent
67 EDFC Dropped Frames - Congestion
68 EDFE Dropped Frames - Errors
69 EDFP Dropped Frames - Policer
70 EINB Incoming Number of Bytes
71 EINF Incoming Number of Frames
72 EONB Outgoing Number of Bytes
73 EONF Outgoing Number of Frames
Performance Monitoring Performance Monitoring Counters
....................................................................................................................................................................................................................................
....................................................................................................................................................................................................................................
365-315-148R6.4 Issue 1
March 2011
3-11
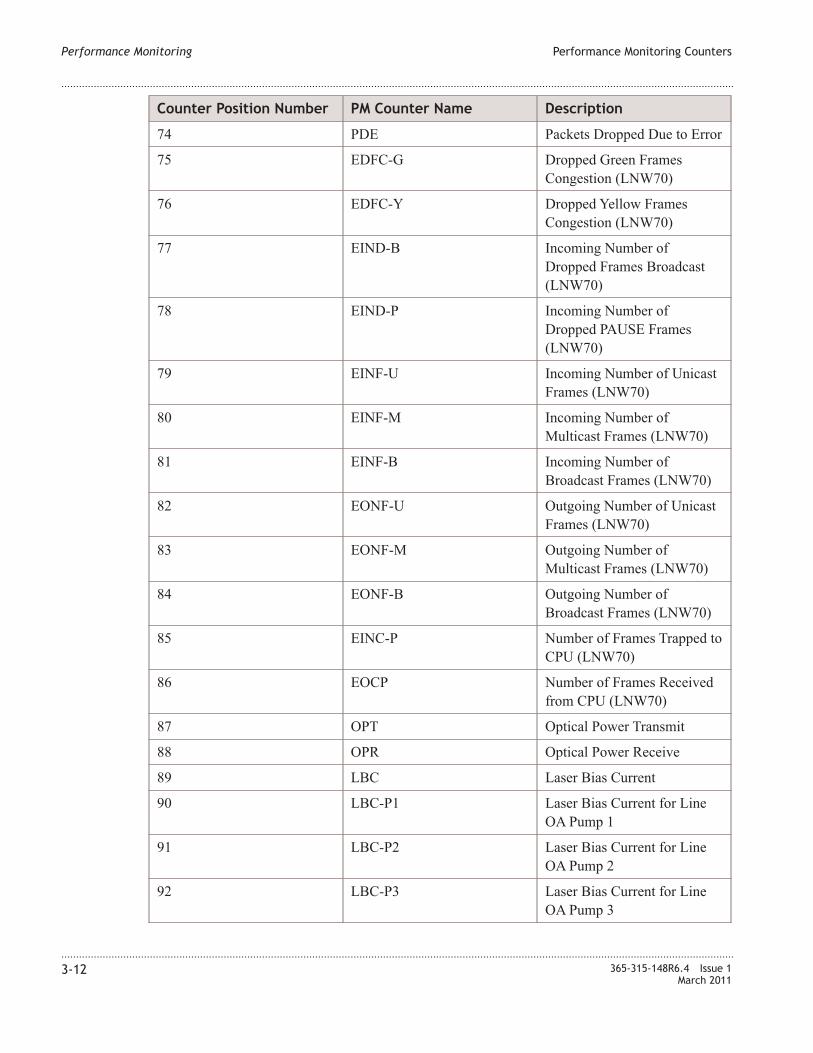
Counter Position Number PM Counter Name Description
74 PDE Packets Dropped Due to Error
75 EDFC-G Dropped Green Frames
Congestion (LNW70)
76 EDFC-Y Dropped Yellow Frames
Congestion (LNW70)
77 EIND-B Incoming Number of
Dropped Frames Broadcast
(LNW70)
78 EIND-P Incoming Number of
Dropped PAUSE Frames
(LNW70)
79 EINF-U Incoming Number of Unicast
Frames (LNW70)
80 EINF-M Incoming Number of
Multicast Frames (LNW70)
81 EINF-B Incoming Number of
Broadcast Frames (LNW70)
82 EONF-U Outgoing Number of Unicast
Frames (LNW70)
83 EONF-M Outgoing Number of
Multicast Frames (LNW70)
84 EONF-B Outgoing Number of
Broadcast Frames (LNW70)
85 EINC-P Number of Frames Trapped to
CPU (LNW70)
86 EOCP Number of Frames Received
from CPU (LNW70)
87 OPT Optical Power Transmit
88 OPR Optical Power Receive
89 LBC Laser Bias Current
90 LBC-P1 Laser Bias Current for Line
OA Pump 1
91 LBC-P2 Laser Bias Current for Line
OA Pump 2
92 LBC-P3 Laser Bias Current for Line
OA Pump 3
Performance Monitoring Performance Monitoring Counters
....................................................................................................................................................................................................................................
....................................................................................................................................................................................................................................
3-12 365-315-148R6.4 Issue 1
March 2011

Counter Position Number PM Counter Name Description
93 LBC-P4 Laser Bias Current for Line
OA Pump 4
94 LBFC-P1 Laser Backface Current for
Line OA Pump 1
95 LBFC-P2 Laser Backface Current for
Line OA Pump 2
96 LBC-SU Laser Bias Current - OC-3
Supervisory Signal Only
97 TOPR-OL Total Optical Power -
Received
98 TOPT-OL Total Optical Power -
Transmitted
99 OPTI-OL Optical Power Tilt - Optical
Line
100 SPT Signal Power Transmit -
Channel
101 SPR Signal Power Receive -
Channel
102 OSNR-C Optical Channel Signal to
Noise Ratio
103 SPR-SU Signal Power Receive - OC-3
Supervisory Signal Only
104 SPT-SU Signal Power Transmit -
OC-3 Supervisory Signal
Only
105 INTXWD Count of invalid transmission
words received
106 LOS Count of instances of signal
loss detected
107 LSYNC Count of instances of
synchronization loss detected
108 DSPERR Count of disparity errors
received
109 RFOVD Count of received overflow
frames dropped
110 TFOVD Count of transmit overflow
frames dropped
Performance Monitoring Performance Monitoring Counters
....................................................................................................................................................................................................................................
....................................................................................................................................................................................................................................
365-315-148R6.4 Issue 1
March 2011
3-13
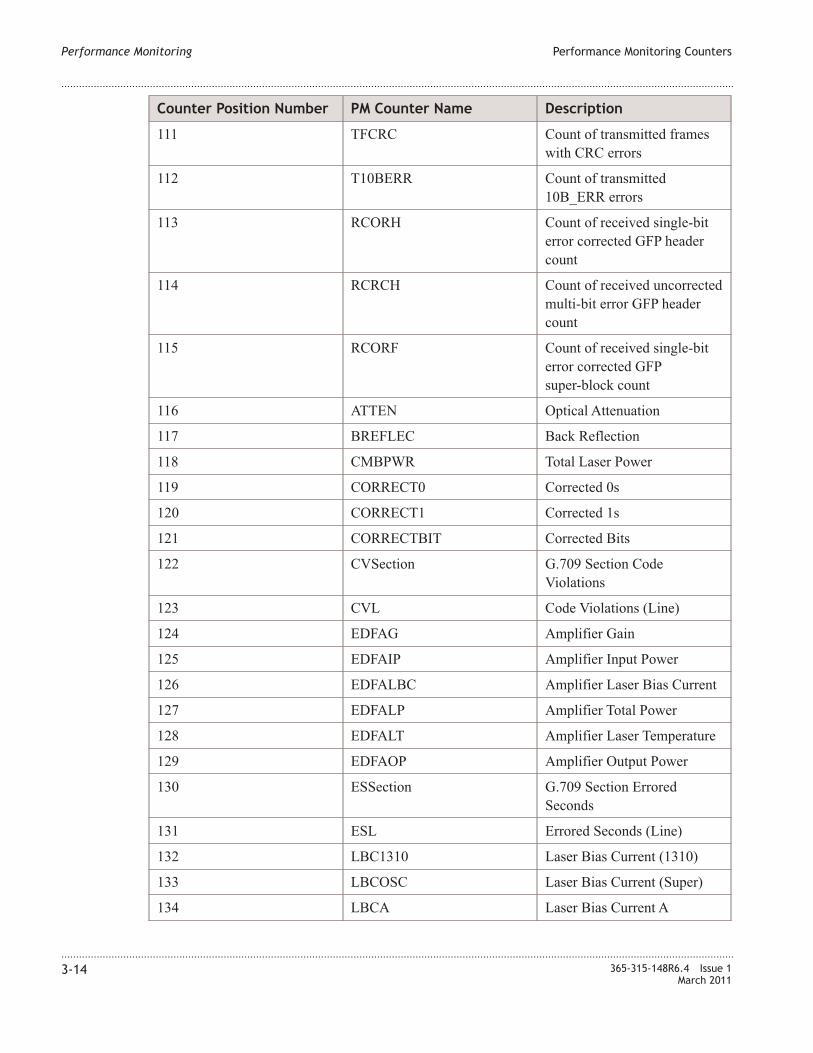
Counter Position Number PM Counter Name Description
111 TFCRC Count of transmitted frames
with CRC errors
112 T10BERR Count of transmitted
10B_ERR errors
113 RCORH Count of received single-bit
error corrected GFP header
count
114 RCRCH Count of received uncorrected
multi-bit error GFP header
count
115 RCORF Count of received single-bit
error corrected GFP
super-block count
116 ATTEN Optical Attenuation
117 BREFLEC Back Reflection
118 CMBPWR Total Laser Power
119 CORRECT0 Corrected 0s
120 CORRECT1 Corrected 1s
121 CORRECTBIT Corrected Bits
122 CVSection G.709 Section Code
Violations
123 CVL Code Violations (Line)
124 EDFAG Amplifier Gain
125 EDFAIP Amplifier Input Power
126 EDFALBC Amplifier Laser Bias Current
127 EDFALP Amplifier Total Power
128 EDFALT Amplifier Laser Temperature
129 EDFAOP Amplifier Output Power
130 ESSection G.709 Section Errored
Seconds
131 ESL Errored Seconds (Line)
132 LBC1310 Laser Bias Current (1310)
133 LBCOSC Laser Bias Current (Super)
134 LBCA Laser Bias Current A
Performance Monitoring Performance Monitoring Counters
....................................................................................................................................................................................................................................
....................................................................................................................................................................................................................................
3-14 365-315-148R6.4 Issue 1
March 2011
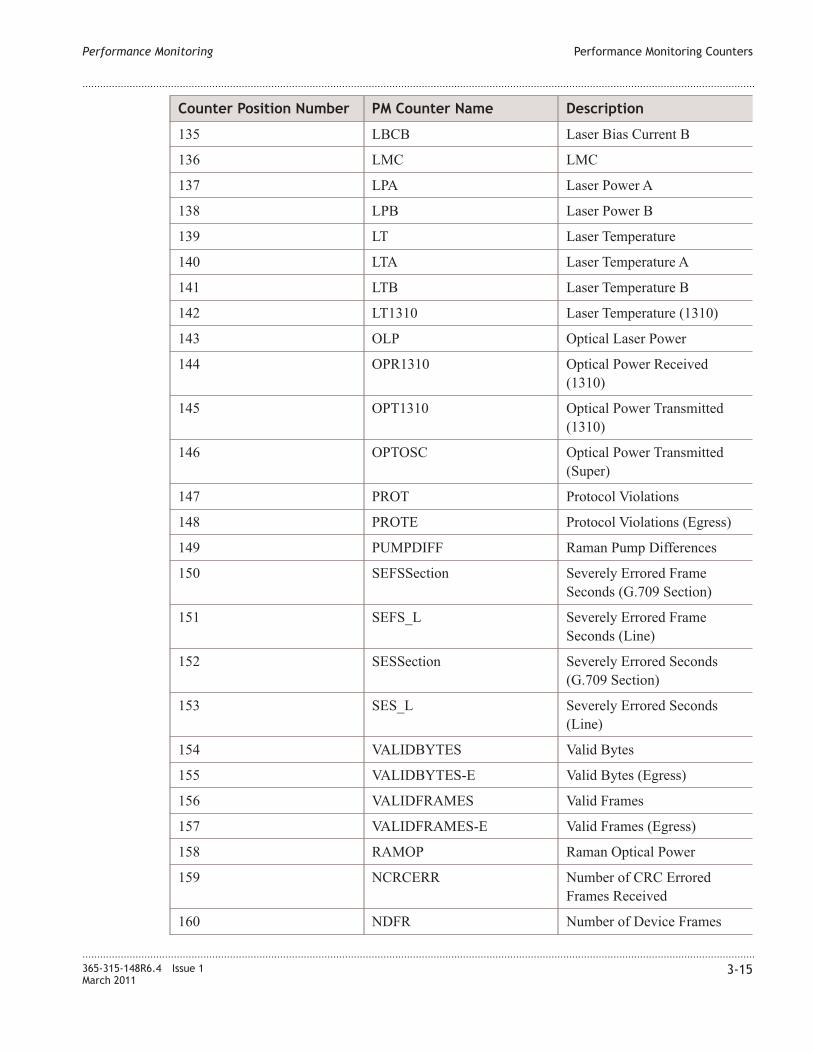
Counter Position Number PM Counter Name Description
135 LBCB Laser Bias Current B
136 LMC LMC
137 LPA Laser Power A
138 LPB Laser Power B
139 LT Laser Temperature
140 LTA Laser Temperature A
141 LTB Laser Temperature B
142 LT1310 Laser Temperature (1310)
143 OLP Optical Laser Power
144 OPR1310 Optical Power Received
(1310)
145 OPT1310 Optical Power Transmitted
(1310)
146 OPTOSC Optical Power Transmitted
(Super)
147 PROT Protocol Violations
148 PROTE Protocol Violations (Egress)
149 PUMPDIFF Raman Pump Differences
150 SEFSSection Severely Errored Frame
Seconds (G.709 Section)
151 SEFS_L Severely Errored Frame
Seconds (Line)
152 SESSection Severely Errored Seconds
(G.709 Section)
153 SES_L Severely Errored Seconds
(Line)
154 VALIDBYTES Valid Bytes
155 VALIDBYTES-E Valid Bytes (Egress)
156 VALIDFRAMES Valid Frames
157 VALIDFRAMES-E Valid Frames (Egress)
158 RAMOP Raman Optical Power
159 NCRCERR Number of CRC Errored
Frames Received
160 NDFR Number of Device Frames
Performance Monitoring Performance Monitoring Counters
....................................................................................................................................................................................................................................
....................................................................................................................................................................................................................................
365-315-148R6.4 Issue 1
March 2011
3-15
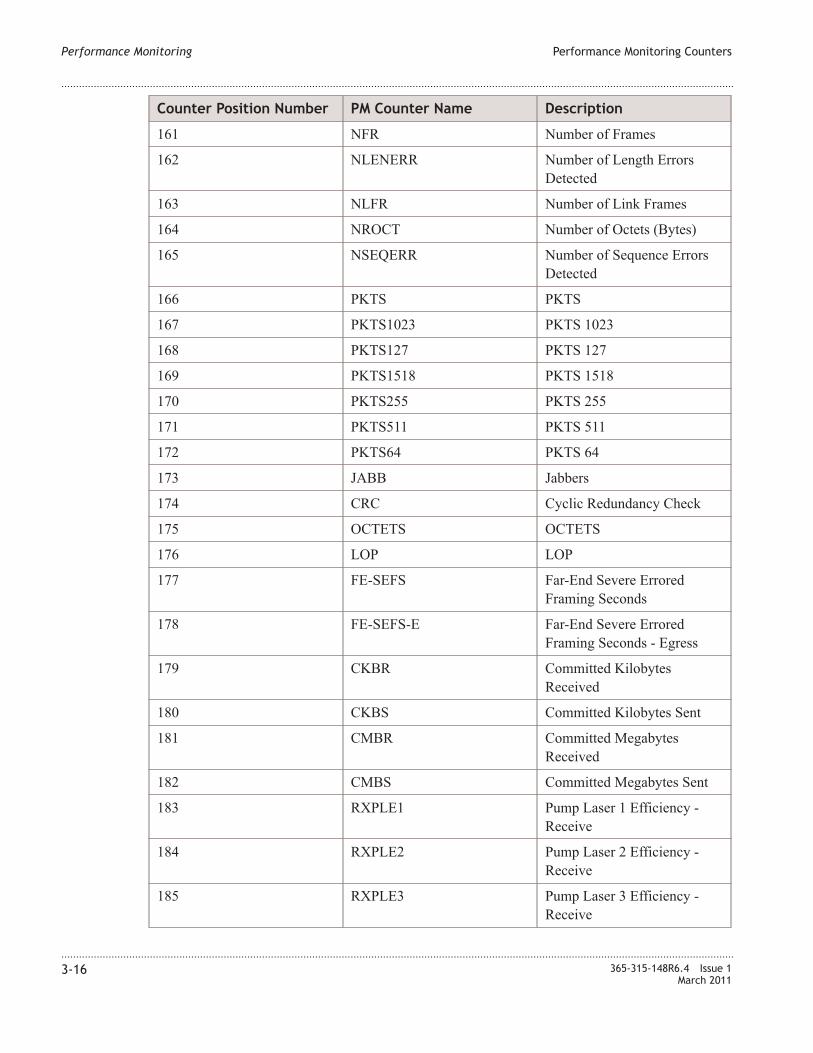
Counter Position Number PM Counter Name Description
161 NFR Number of Frames
162 NLENERR Number of Length Errors
Detected
163 NLFR Number of Link Frames
164 NROCT Number of Octets (Bytes)
165 NSEQERR Number of Sequence Errors
Detected
166 PKTS PKTS
167 PKTS1023 PKTS 1023
168 PKTS127 PKTS 127
169 PKTS1518 PKTS 1518
170 PKTS255 PKTS 255
171 PKTS511 PKTS 511
172 PKTS64 PKTS 64
173 JABB Jabbers
174 CRC Cyclic Redundancy Check
175 OCTETS OCTETS
176 LOP LOP
177 FE-SEFS Far-End Severe Errored
Framing Seconds
178 FE-SEFS-E Far-End Severe Errored
Framing Seconds - Egress
179 CKBR Committed Kilobytes
Received
180 CKBS Committed Kilobytes Sent
181 CMBR Committed Megabytes
Received
182 CMBS Committed Megabytes Sent
183 RXPLE1 Pump Laser 1 Efficiency -
Receive
184 RXPLE2 Pump Laser 2 Efficiency -
Receive
185 RXPLE3 Pump Laser 3 Efficiency -
Receive
Performance Monitoring Performance Monitoring Counters
....................................................................................................................................................................................................................................
....................................................................................................................................................................................................................................
3-16 365-315-148R6.4 Issue 1
March 2011
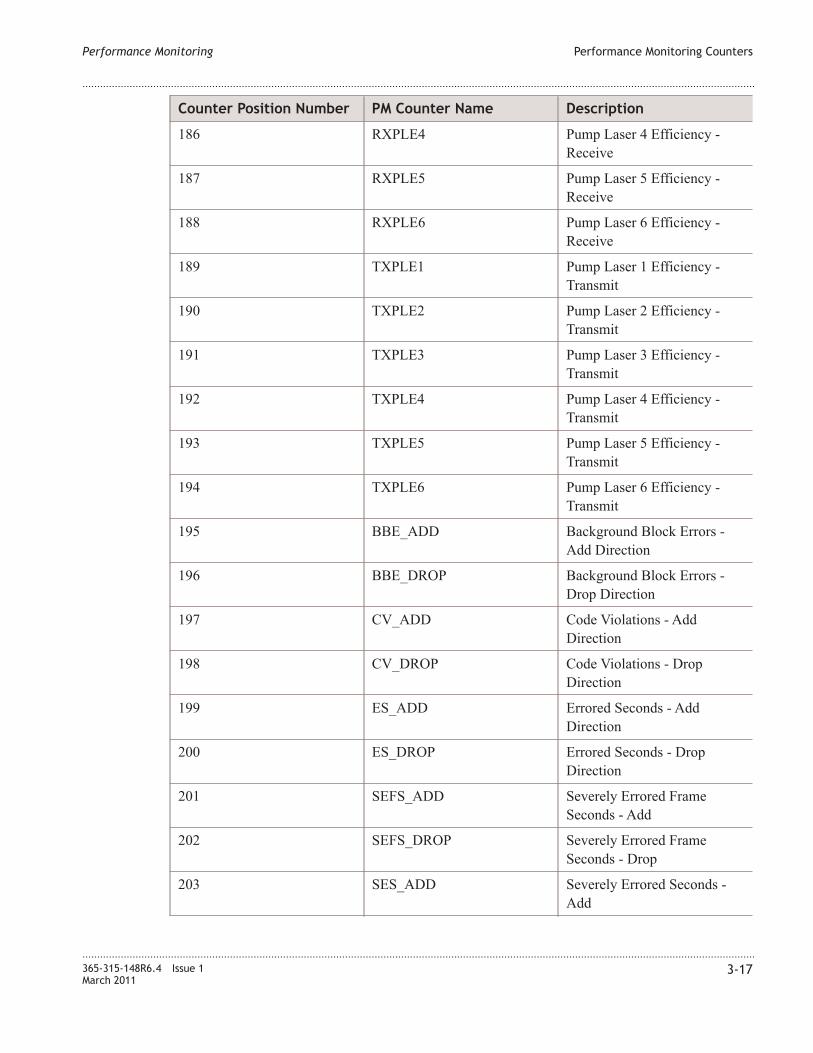
Counter Position Number PM Counter Name Description
186 RXPLE4 Pump Laser 4 Efficiency -
Receive
187 RXPLE5 Pump Laser 5 Efficiency -
Receive
188 RXPLE6 Pump Laser 6 Efficiency -
Receive
189 TXPLE1 Pump Laser 1 Efficiency -
Transmit
190 TXPLE2 Pump Laser 2 Efficiency -
Transmit
191 TXPLE3 Pump Laser 3 Efficiency -
Transmit
192 TXPLE4 Pump Laser 4 Efficiency -
Transmit
193 TXPLE5 Pump Laser 5 Efficiency -
Transmit
194 TXPLE6 Pump Laser 6 Efficiency -
Transmit
195 BBE_ADD Background Block Errors -
Add Direction
196 BBE_DROP Background Block Errors -
Drop Direction
197 CV_ADD Code Violations - Add
Direction
198 CV_DROP Code Violations - Drop
Direction
199 ES_ADD Errored Seconds - Add
Direction
200 ES_DROP Errored Seconds - Drop
Direction
201 SEFS_ADD Severely Errored Frame
Seconds - Add
202 SEFS_DROP Severely Errored Frame
Seconds - Drop
203 SES_ADD Severely Errored Seconds -
Add
Performance Monitoring Performance Monitoring Counters
....................................................................................................................................................................................................................................
....................................................................................................................................................................................................................................
365-315-148R6.4 Issue 1
March 2011
3-17
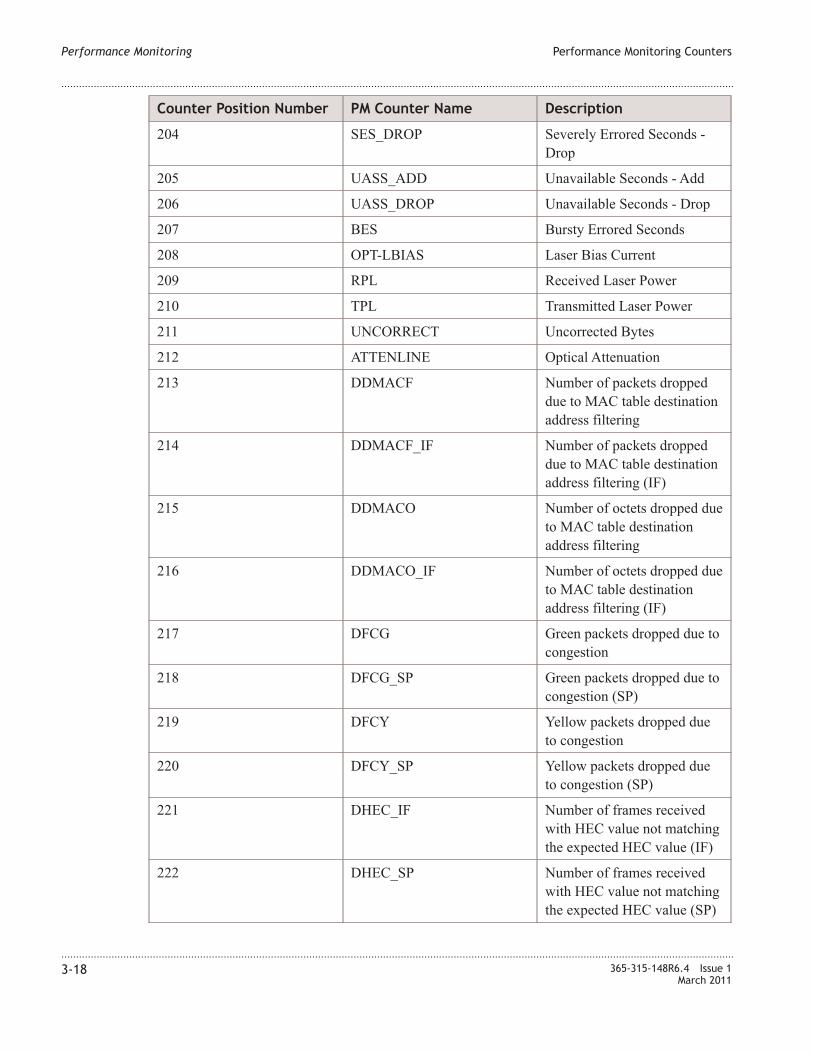
Counter Position Number PM Counter Name Description
204 SES_DROP Severely Errored Seconds -
Drop
205 UASS_ADD Unavailable Seconds - Add
206 UASS_DROP Unavailable Seconds - Drop
207 BES Bursty Errored Seconds
208 OPT-LBIAS Laser Bias Current
209 RPL Received Laser Power
210 TPL Transmitted Laser Power
211 UNCORRECT Uncorrected Bytes
212 ATTENLINE Optical Attenuation
213 DDMACF Number of packets dropped
due to MAC table destination
address filtering
214 DDMACF_IF Number of packets dropped
due to MAC table destination
address filtering (IF)
215 DDMACO Number of octets dropped due
to MAC table destination
address filtering
216 DDMACO_IF Number of octets dropped due
to MAC table destination
address filtering (IF)
217 DFCG Green packets dropped due to
congestion
218 DFCG_SP Green packets dropped due to
congestion (SP)
219 DFCY Yellow packets dropped due
to congestion
220 DFCY_SP Yellow packets dropped due
to congestion (SP)
221 DHEC_IF Number of frames received
with HEC value not matching
the expected HEC value (IF)
222 DHEC_SP Number of frames received
with HEC value not matching
the expected HEC value (SP)
Performance Monitoring Performance Monitoring Counters
....................................................................................................................................................................................................................................
....................................................................................................................................................................................................................................
3-18 365-315-148R6.4 Issue 1
March 2011
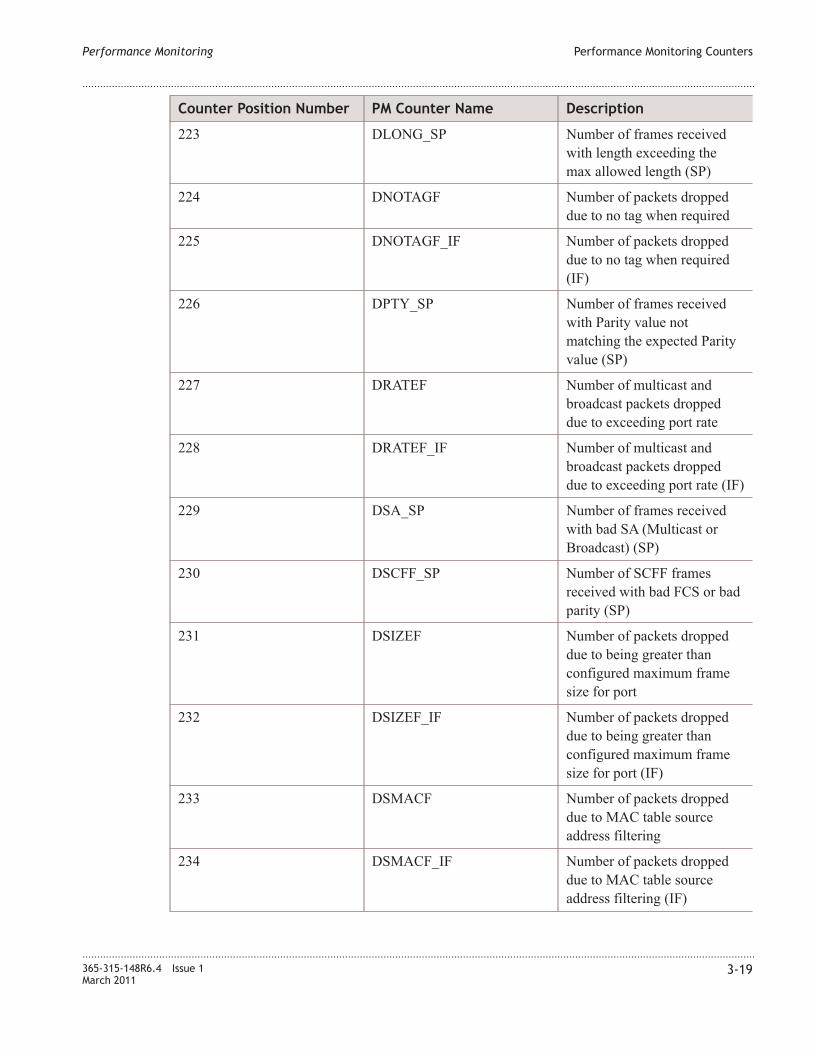
Counter Position Number PM Counter Name Description
223 DLONG_SP Number of frames received
with length exceeding the
max allowed length (SP)
224 DNOTAGF Number of packets dropped
due to no tag when required
225 DNOTAGF_IF Number of packets dropped
due to no tag when required
(IF)
226 DPTY_SP Number of frames received
with Parity value not
matching the expected Parity
value (SP)
227 DRATEF Number of multicast and
broadcast packets dropped
due to exceeding port rate
228 DRATEF_IF Number of multicast and
broadcast packets dropped
due to exceeding port rate (IF)
229 DSA_SP Number of frames received
with bad SA (Multicast or
Broadcast) (SP)
230 DSCFF_SP Number of SCFF frames
received with bad FCS or bad
parity (SP)
231 DSIZEF Number of packets dropped
due to being greater than
configured maximum frame
size for port
232 DSIZEF_IF Number of packets dropped
due to being greater than
configured maximum frame
size for port (IF)
233 DSMACF Number of packets dropped
due to MAC table source
address filtering
234 DSMACF_IF Number of packets dropped
due to MAC table source
address filtering (IF)
Performance Monitoring Performance Monitoring Counters
....................................................................................................................................................................................................................................
....................................................................................................................................................................................................................................
365-315-148R6.4 Issue 1
March 2011
3-19
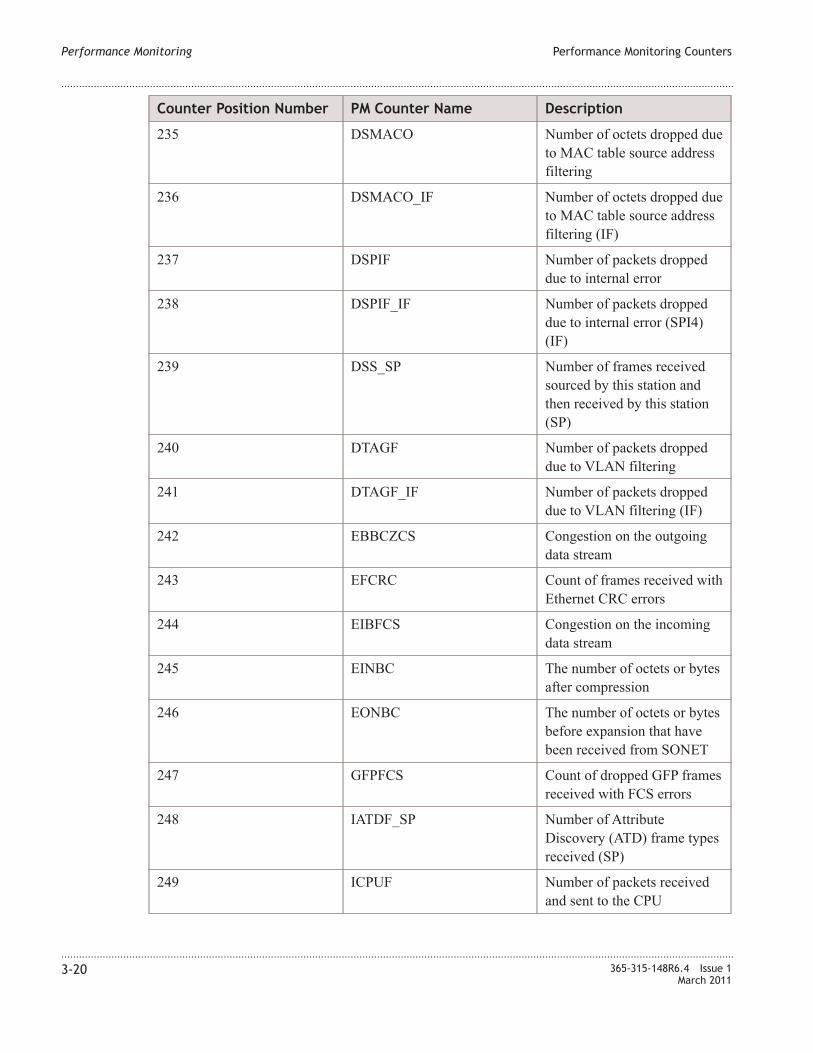
Counter Position Number PM Counter Name Description
235 DSMACO Number of octets dropped due
to MAC table source address
filtering
236 DSMACO_IF Number of octets dropped due
to MAC table source address
filtering (IF)
237 DSPIF Number of packets dropped
due to internal error
238 DSPIF_IF Number of packets dropped
due to internal error (SPI4)
(IF)
239 DSS_SP Number of frames received
sourced by this station and
then received by this station
(SP)
240 DTAGF Number of packets dropped
due to VLAN filtering
241 DTAGF_IF Number of packets dropped
due to VLAN filtering (IF)
242 EBBCZCS Congestion on the outgoing
data stream
243 EFCRC Count of frames received with
Ethernet CRC errors
244 EIBFCS Congestion on the incoming
data stream
245 EINBC The number of octets or bytes
after compression
246 EONBC The number of octets or bytes
before expansion that have
been received from SONET
247 GFPFCS Count of dropped GFP frames
received with FCS errors
248 IATDF_SP Number of Attribute
Discovery (ATD) frame types
received (SP)
249 ICPUF Number of packets received
and sent to the CPU
Performance Monitoring Performance Monitoring Counters
....................................................................................................................................................................................................................................
....................................................................................................................................................................................................................................
3-20 365-315-148R6.4 Issue 1
March 2011

Counter Position Number PM Counter Name Description
250 ICPUF_IF Number of packets received
and sent to the CPU (IF)
251 ICRCF_SP Number of checksum frames
received (SP)
252 ICTRF_SP Number of control frames
received (SP)
253 IECHOF_SP Number of echo frames
received. (OAM) (SP)
254 IFLSHF_SP Number of flush frames
received. (OAM) (SP)
255 IMCAF Number of Class A multicast
frames received with no error
256 IMCAF_IF Number of Class A multicast
frames received with no error
(IF)
257 IMCAF_SP Number of Class A multicast
frames received with no error
(SP)
258 IMCAO Number of Class A multicast
octets received with no error
259 IMCAO_IF Number of Class A multicast
octets received with no error
(IF)
260 IMCAO_SP Number of Class A multicast
octets received with no error
(SP)
261 IMCAREDF Number of Multicast packets
assigned to Class A and given
drop precedence of red
262 IMCAREDO Number of Multicast octets
assigned to Class A and given
drop precedence of red
263 IMCBEF Number of Class B multicast
frames received below EIR
with no error
264 IMCBEF_IF Number of Class B multicast
frames received below EIR
with no error (IF)
Performance Monitoring Performance Monitoring Counters
....................................................................................................................................................................................................................................
....................................................................................................................................................................................................................................
365-315-148R6.4 Issue 1
March 2011
3-21
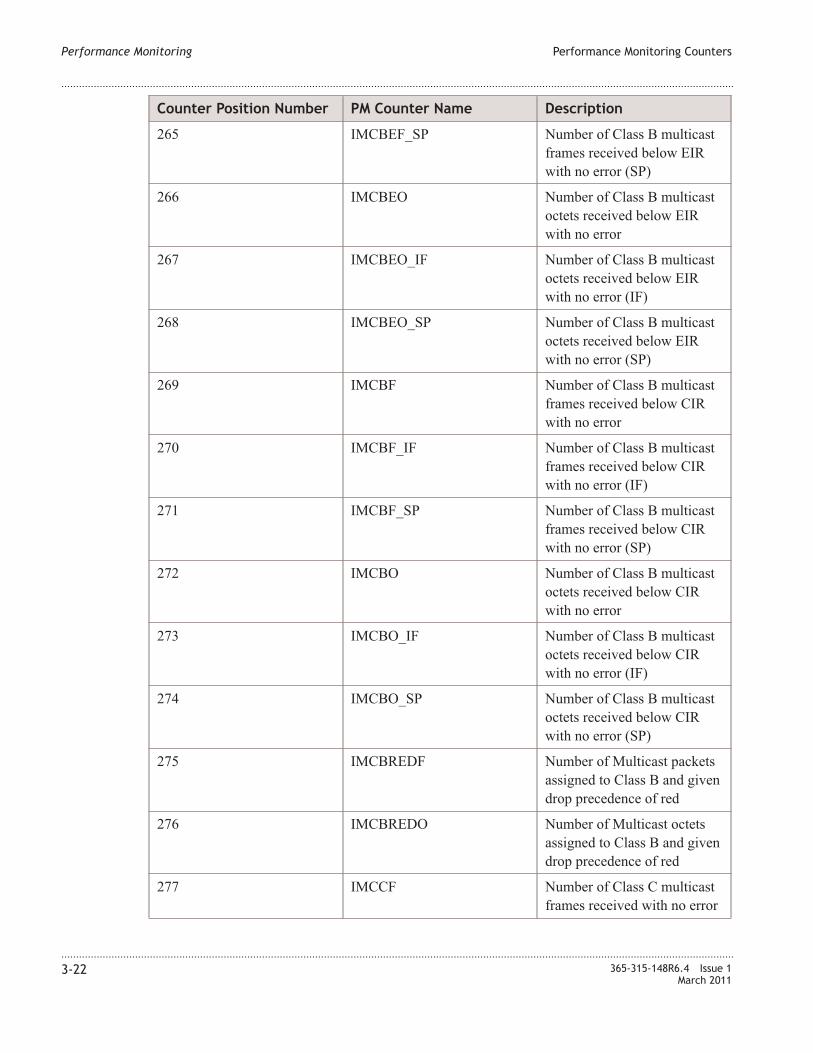
Counter Position Number PM Counter Name Description
265 IMCBEF_SP Number of Class B multicast
frames received below EIR
with no error (SP)
266 IMCBEO Number of Class B multicast
octets received below EIR
with no error
267 IMCBEO_IF Number of Class B multicast
octets received below EIR
with no error (IF)
268 IMCBEO_SP Number of Class B multicast
octets received below EIR
with no error (SP)
269 IMCBF Number of Class B multicast
frames received below CIR
with no error
270 IMCBF_IF Number of Class B multicast
frames received below CIR
with no error (IF)
271 IMCBF_SP Number of Class B multicast
frames received below CIR
with no error (SP)
272 IMCBO Number of Class B multicast
octets received below CIR
with no error
273 IMCBO_IF Number of Class B multicast
octets received below CIR
with no error (IF)
274 IMCBO_SP Number of Class B multicast
octets received below CIR
with no error (SP)
275 IMCBREDF Number of Multicast packets
assigned to Class B and given
drop precedence of red
276 IMCBREDO Number of Multicast octets
assigned to Class B and given
drop precedence of red
277 IMCCF Number of Class C multicast
frames received with no error
Performance Monitoring Performance Monitoring Counters
....................................................................................................................................................................................................................................
....................................................................................................................................................................................................................................
3-22 365-315-148R6.4 Issue 1
March 2011
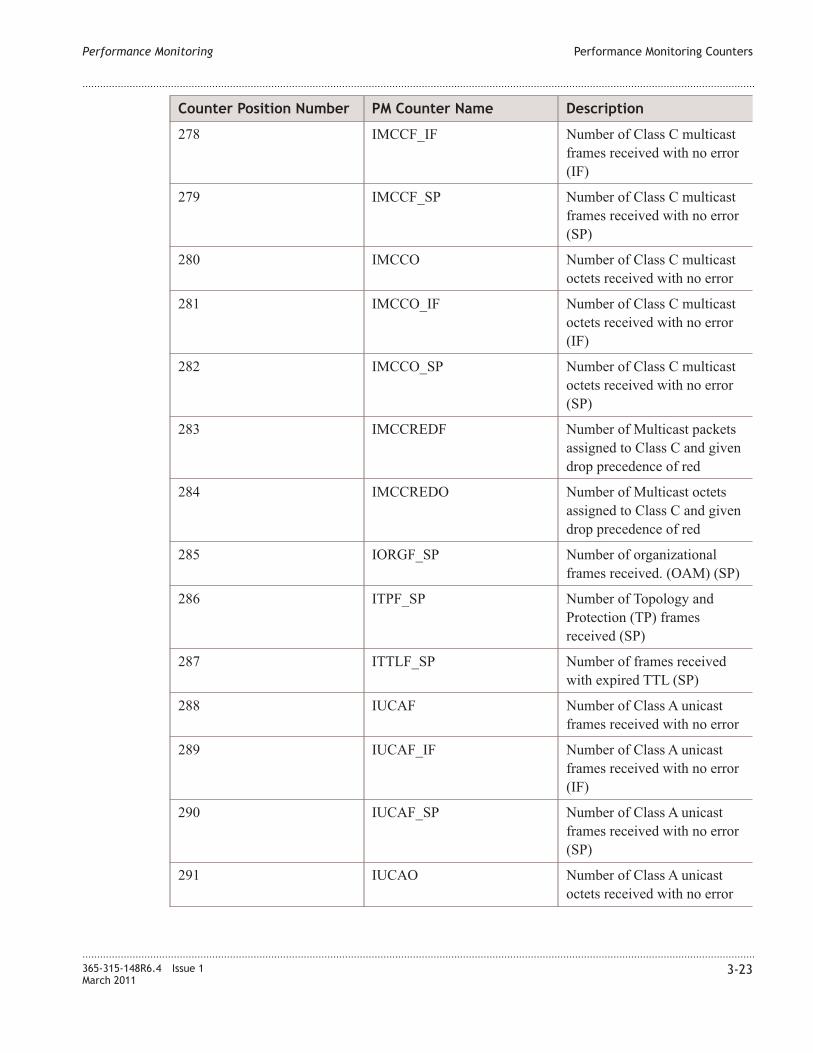
Counter Position Number PM Counter Name Description
278 IMCCF_IF Number of Class C multicast
frames received with no error
(IF)
279 IMCCF_SP Number of Class C multicast
frames received with no error
(SP)
280 IMCCO Number of Class C multicast
octets received with no error
281 IMCCO_IF Number of Class C multicast
octets received with no error
(IF)
282 IMCCO_SP Number of Class C multicast
octets received with no error
(SP)
283 IMCCREDF Number of Multicast packets
assigned to Class C and given
drop precedence of red
284 IMCCREDO Number of Multicast octets
assigned to Class C and given
drop precedence of red
285 IORGF_SP Number of organizational
frames received. (OAM) (SP)
286 ITPF_SP Number of Topology and
Protection (TP) frames
received (SP)
287 ITTLF_SP Number of frames received
with expired TTL (SP)
288 IUCAF Number of Class A unicast
frames received with no error
289 IUCAF_IF Number of Class A unicast
frames received with no error
(IF)
290 IUCAF_SP Number of Class A unicast
frames received with no error
(SP)
291 IUCAO Number of Class A unicast
octets received with no error
Performance Monitoring Performance Monitoring Counters
....................................................................................................................................................................................................................................
....................................................................................................................................................................................................................................
365-315-148R6.4 Issue 1
March 2011
3-23
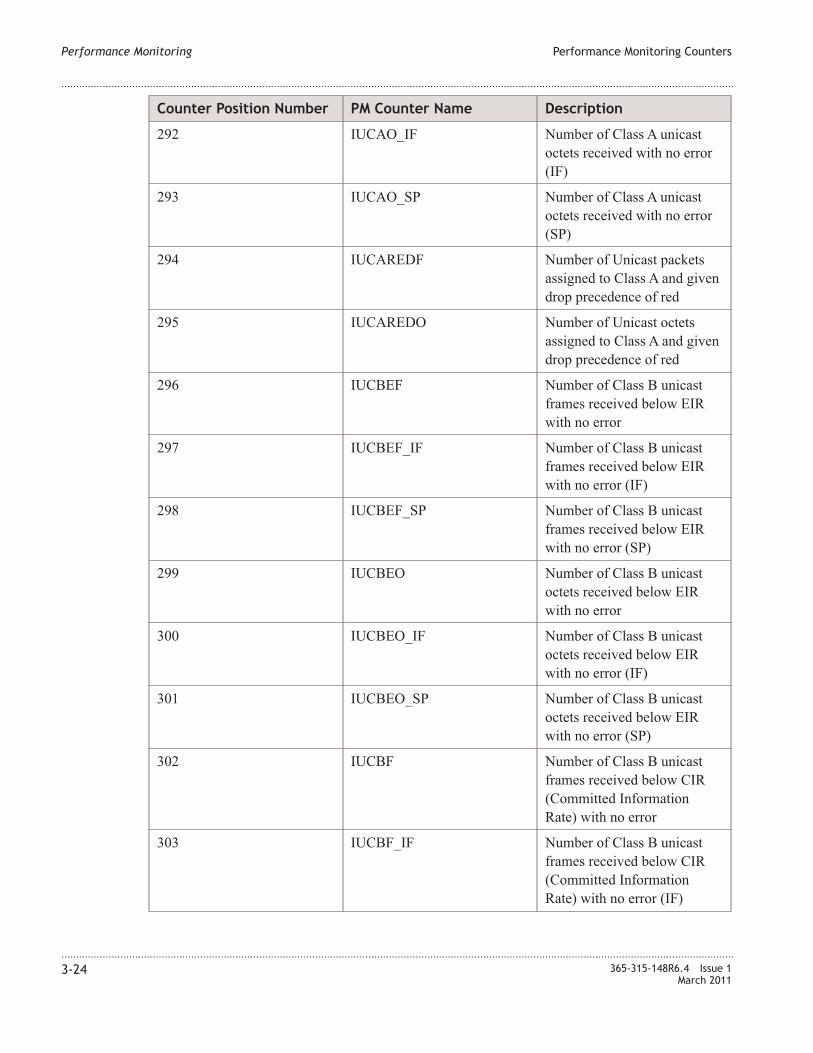
Counter Position Number PM Counter Name Description
292 IUCAO_IF Number of Class A unicast
octets received with no error
(IF)
293 IUCAO_SP Number of Class A unicast
octets received with no error
(SP)
294 IUCAREDF Number of Unicast packets
assigned to Class A and given
drop precedence of red
295 IUCAREDO Number of Unicast octets
assigned to Class A and given
drop precedence of red
296 IUCBEF Number of Class B unicast
frames received below EIR
with no error
297 IUCBEF_IF Number of Class B unicast
frames received below EIR
with no error (IF)
298 IUCBEF_SP Number of Class B unicast
frames received below EIR
with no error (SP)
299 IUCBEO Number of Class B unicast
octets received below EIR
with no error
300 IUCBEO_IF Number of Class B unicast
octets received below EIR
with no error (IF)
301 IUCBEO_SP Number of Class B unicast
octets received below EIR
with no error (SP)
302 IUCBF Number of Class B unicast
frames received below CIR
(Committed Information
Rate) with no error
303 IUCBF_IF Number of Class B unicast
frames received below CIR
(Committed Information
Rate) with no error (IF)
Performance Monitoring Performance Monitoring Counters
....................................................................................................................................................................................................................................
....................................................................................................................................................................................................................................
3-24 365-315-148R6.4 Issue 1
March 2011

Counter Position Number PM Counter Name Description
304 IUCBF_SP Number of Class B unicast
frames received below CIR
(Committed Information
Rate) with no error (SP)
305 IUCBO Number of Class B unicast
octets received below CIR
with no error
306 IUCBO_IF Number of Class B unicast
octets received below CIR
with no error (IF)
307 IUCBO_SP Number of Class B unicast
octets received below CIR
with no error (SP)
308 IUCBREDF Number of Unicast packets
assigned to Class B and given
drop precedence of red
309 IUCBREDO Number of Unicast octets
assigned to Class B and given
drop precedence of red
310 IUCCF Number of Class C unicast
frames received with no error
311 IUCCF_IF Number of Class C unicast
frames received with no error
(IF)
312 IUCCF_SP Number of Class C unicast
frames received with no error
(SP)
313 IUCCO Number of Class C unicast
octets received with no error
314 IUCCO_IF Number of Class C unicast
octets received with no error
(IF)
315 IUCCO_SP Number of Class C unicast
octets received with no error
(SP)
316 IUCCREDF Number of Unicast packets
assigned to Class C and given
drop precedence of red
Performance Monitoring Performance Monitoring Counters
....................................................................................................................................................................................................................................
....................................................................................................................................................................................................................................
365-315-148R6.4 Issue 1
March 2011
3-25

Counter Position Number PM Counter Name Description
317 IUCCREDO Number of Unicast octets
assigned to Class C and given
drop precedence of red
318 OATDF_SP Number of ATD frames
transmitted (SP)
319 OCPUF Packets originating from CPU
(management queue)
320 OCPUF_IF Packets originating from CPU
(management queue) (IF)
321 OCRCF_SP Number of checksum frames
transmitted (SP)
322 OCTRLF_SP Number of control frames
transmitted (SP)
323 OECHOF_SP Number of echo frames
transmitted. (OAM) (SP)
324 OFLSHF_SP Number of flush frames
transmitted. (OAM) (SP)
325 OMCAF Number of Class A multicast
frames transmitted with no
error
326 OMCAF_IF Number of Class A multicast
frames transmitted with no
error (IF)
327 OMCAF_SP Number of Class A multicast
frames transmitted with no
error (SP)
328 OMCAO Number of Class A multicast
octets transmitted with no
error
329 OMCAO_IF Number of Class A multicast
octets transmitted with no
error (IF)
330 OMCAO_SP Number of Class A multicast
octets transmitted with no
error (SP)
331 OMCBEF Number of Class B multicast
frames transmitted below
EIR, no error
Performance Monitoring Performance Monitoring Counters
....................................................................................................................................................................................................................................
....................................................................................................................................................................................................................................
3-26 365-315-148R6.4 Issue 1
March 2011
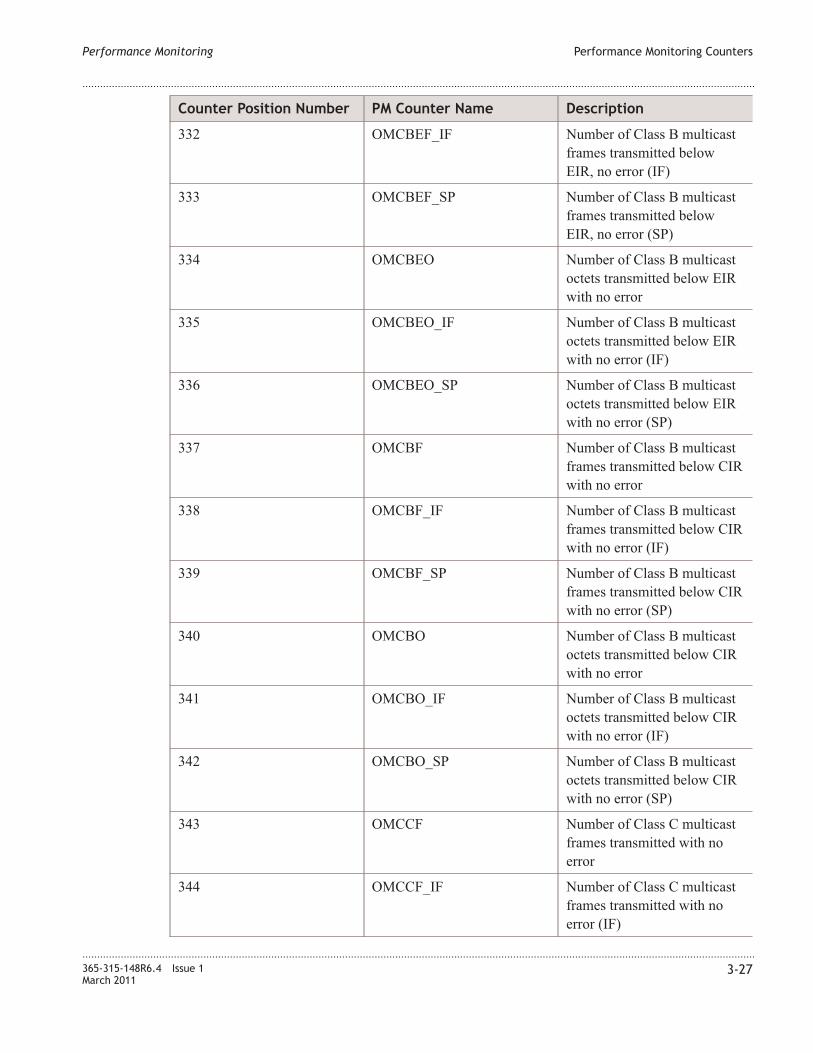
Counter Position Number PM Counter Name Description
332 OMCBEF_IF Number of Class B multicast
frames transmitted below
EIR, no error (IF)
333 OMCBEF_SP Number of Class B multicast
frames transmitted below
EIR, no error (SP)
334 OMCBEO Number of Class B multicast
octets transmitted below EIR
with no error
335 OMCBEO_IF Number of Class B multicast
octets transmitted below EIR
with no error (IF)
336 OMCBEO_SP Number of Class B multicast
octets transmitted below EIR
with no error (SP)
337 OMCBF Number of Class B multicast
frames transmitted below CIR
with no error
338 OMCBF_IF Number of Class B multicast
frames transmitted below CIR
with no error (IF)
339 OMCBF_SP Number of Class B multicast
frames transmitted below CIR
with no error (SP)
340 OMCBO Number of Class B multicast
octets transmitted below CIR
with no error
341 OMCBO_IF Number of Class B multicast
octets transmitted below CIR
with no error (IF)
342 OMCBO_SP Number of Class B multicast
octets transmitted below CIR
with no error (SP)
343 OMCCF Number of Class C multicast
frames transmitted with no
error
344 OMCCF_IF Number of Class C multicast
frames transmitted with no
error (IF)
Performance Monitoring Performance Monitoring Counters
....................................................................................................................................................................................................................................
....................................................................................................................................................................................................................................
365-315-148R6.4 Issue 1
March 2011
3-27
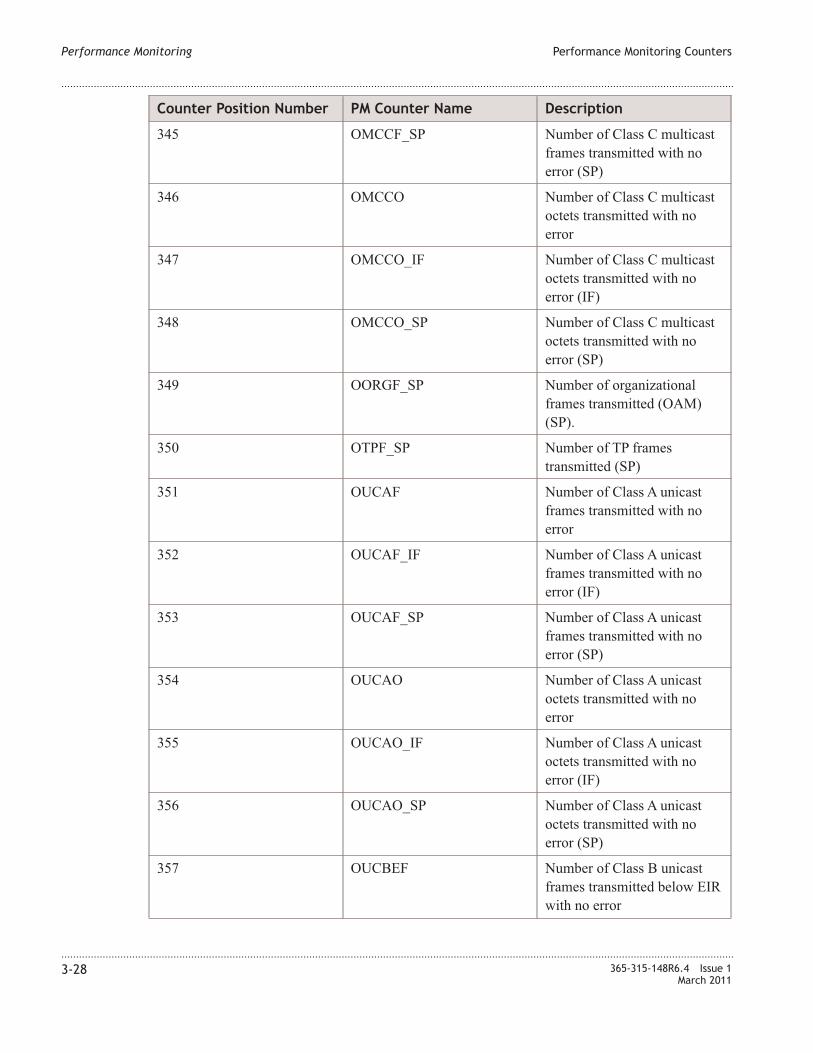
Counter Position Number PM Counter Name Description
345 OMCCF_SP Number of Class C multicast
frames transmitted with no
error (SP)
346 OMCCO Number of Class C multicast
octets transmitted with no
error
347 OMCCO_IF Number of Class C multicast
octets transmitted with no
error (IF)
348 OMCCO_SP Number of Class C multicast
octets transmitted with no
error (SP)
349 OORGF_SP Number of organizational
frames transmitted (OAM)
(SP).
350 OTPF_SP Number of TP frames
transmitted (SP)
351 OUCAF Number of Class A unicast
frames transmitted with no
error
352 OUCAF_IF Number of Class A unicast
frames transmitted with no
error (IF)
353 OUCAF_SP Number of Class A unicast
frames transmitted with no
error (SP)
354 OUCAO Number of Class A unicast
octets transmitted with no
error
355 OUCAO_IF Number of Class A unicast
octets transmitted with no
error (IF)
356 OUCAO_SP Number of Class A unicast
octets transmitted with no
error (SP)
357 OUCBEF Number of Class B unicast
frames transmitted below EIR
with no error
Performance Monitoring Performance Monitoring Counters
....................................................................................................................................................................................................................................
....................................................................................................................................................................................................................................
3-28 365-315-148R6.4 Issue 1
March 2011
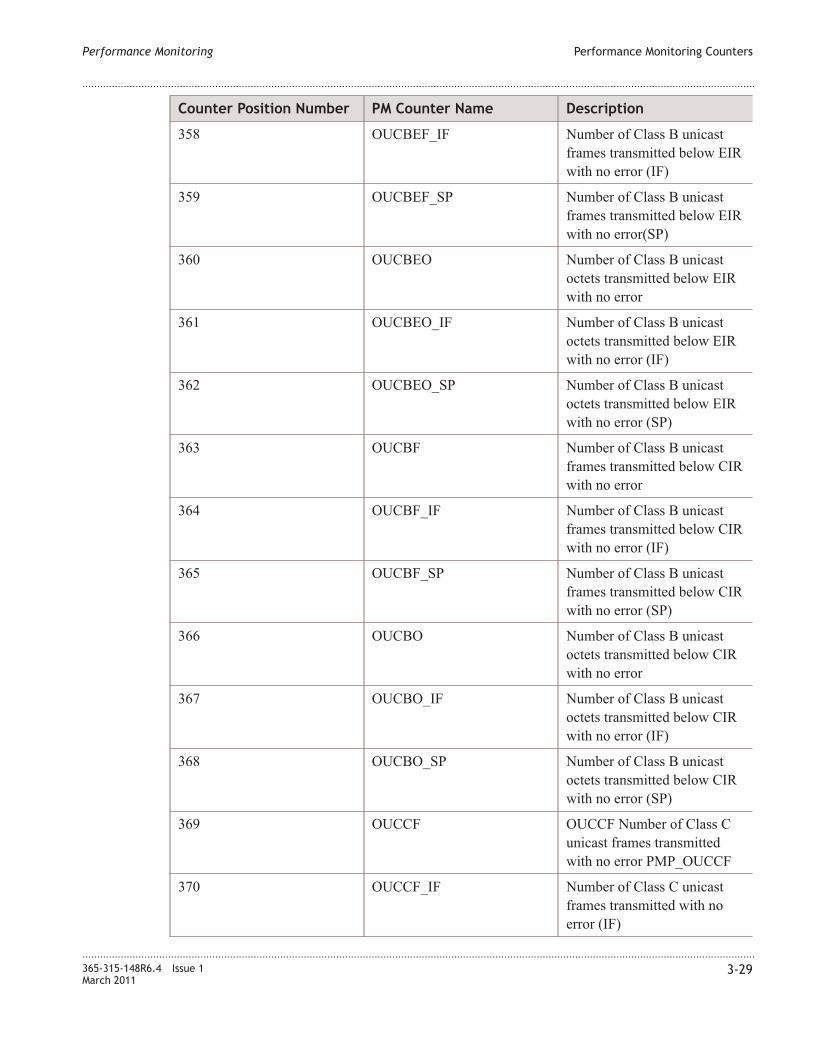
Counter Position Number PM Counter Name Description
358 OUCBEF_IF Number of Class B unicast
frames transmitted below EIR
with no error (IF)
359 OUCBEF_SP Number of Class B unicast
frames transmitted below EIR
with no error(SP)
360 OUCBEO Number of Class B unicast
octets transmitted below EIR
with no error
361 OUCBEO_IF Number of Class B unicast
octets transmitted below EIR
with no error (IF)
362 OUCBEO_SP Number of Class B unicast
octets transmitted below EIR
with no error (SP)
363 OUCBF Number of Class B unicast
frames transmitted below CIR
with no error
364 OUCBF_IF Number of Class B unicast
frames transmitted below CIR
with no error (IF)
365 OUCBF_SP Number of Class B unicast
frames transmitted below CIR
with no error (SP)
366 OUCBO Number of Class B unicast
octets transmitted below CIR
with no error
367 OUCBO_IF Number of Class B unicast
octets transmitted below CIR
with no error (IF)
368 OUCBO_SP Number of Class B unicast
octets transmitted below CIR
with no error (SP)
369 OUCCF OUCCF Number of Class C
unicast frames transmitted
with no error PMP_OUCCF
370 OUCCF_IF Number of Class C unicast
frames transmitted with no
error (IF)
Performance Monitoring Performance Monitoring Counters
....................................................................................................................................................................................................................................
....................................................................................................................................................................................................................................
365-315-148R6.4 Issue 1
March 2011
3-29
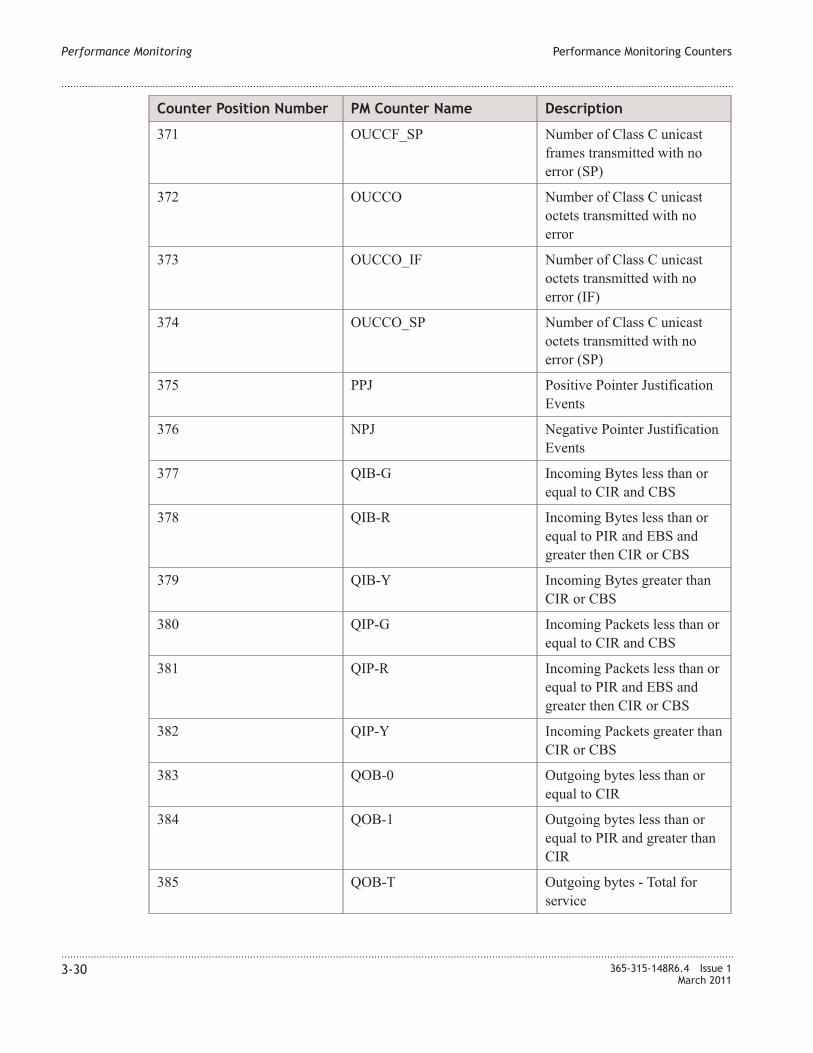
Counter Position Number PM Counter Name Description
371 OUCCF_SP Number of Class C unicast
frames transmitted with no
error (SP)
372 OUCCO Number of Class C unicast
octets transmitted with no
error
373 OUCCO_IF Number of Class C unicast
octets transmitted with no
error (IF)
374 OUCCO_SP Number of Class C unicast
octets transmitted with no
error (SP)
375 PPJ Positive Pointer Justification
Events
376 NPJ Negative Pointer Justification
Events
377 QIB-G Incoming Bytes less than or
equal to CIR and CBS
378 QIB-R Incoming Bytes less than or
equal to PIR and EBS and
greater then CIR or CBS
379 QIB-Y Incoming Bytes greater than
CIR or CBS
380 QIP-G Incoming Packets less than or
equal to CIR and CBS
381 QIP-R Incoming Packets less than or
equal to PIR and EBS and
greater then CIR or CBS
382 QIP-Y Incoming Packets greater than
CIR or CBS
383 QOB-0 Outgoing bytes less than or
equal to CIR
384 QOB-1 Outgoing bytes less than or
equal to PIR and greater than
CIR
385 QOB-T Outgoing bytes - Total for
service
Performance Monitoring Performance Monitoring Counters
....................................................................................................................................................................................................................................
....................................................................................................................................................................................................................................
3-30 365-315-148R6.4 Issue 1
March 2011
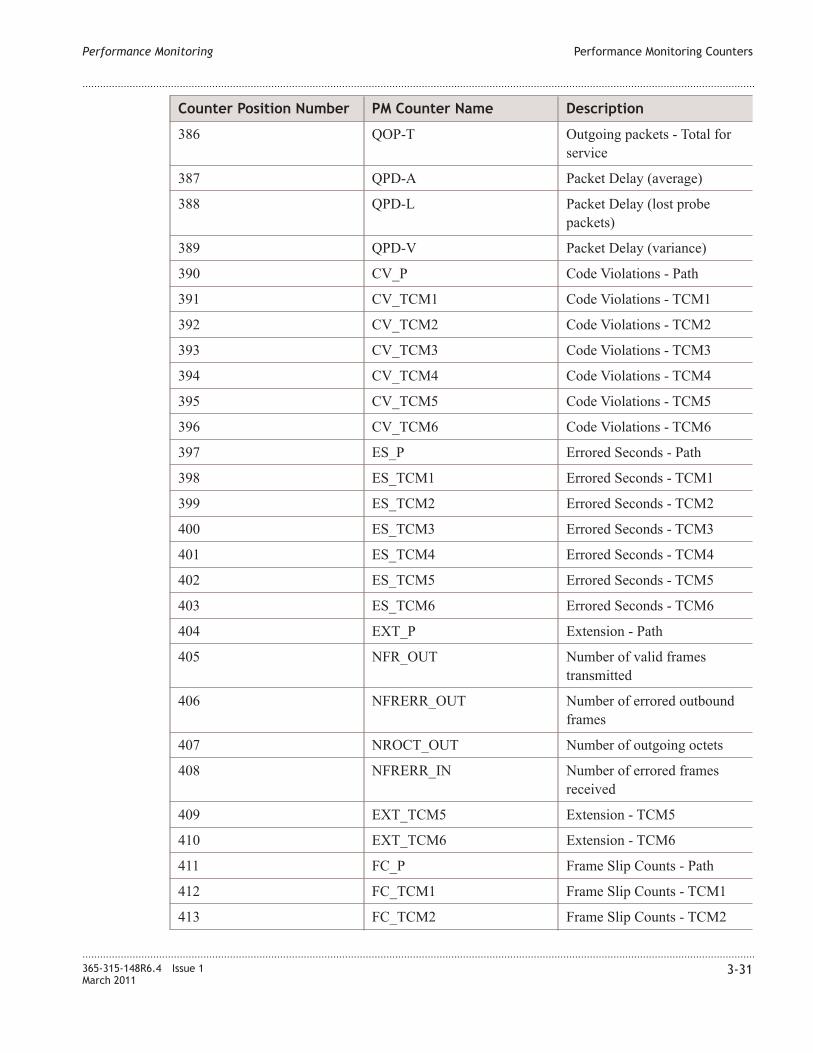
Counter Position Number PM Counter Name Description
386 QOP-T Outgoing packets - Total for
service
387 QPD-A Packet Delay (average)
388 QPD-L Packet Delay (lost probe
packets)
389 QPD-V Packet Delay (variance)
390 CV_P Code Violations - Path
391 CV_TCM1 Code Violations - TCM1
392 CV_TCM2 Code Violations - TCM2
393 CV_TCM3 Code Violations - TCM3
394 CV_TCM4 Code Violations - TCM4
395 CV_TCM5 Code Violations - TCM5
396 CV_TCM6 Code Violations - TCM6
397 ES_P Errored Seconds - Path
398 ES_TCM1 Errored Seconds - TCM1
399 ES_TCM2 Errored Seconds - TCM2
400 ES_TCM3 Errored Seconds - TCM3
401 ES_TCM4 Errored Seconds - TCM4
402 ES_TCM5 Errored Seconds - TCM5
403 ES_TCM6 Errored Seconds - TCM6
404 EXT_P Extension - Path
405 NFR_OUT Number of valid frames
transmitted
406 NFRERR_OUT Number of errored outbound
frames
407 NROCT_OUT Number of outgoing octets
408 NFRERR_IN Number of errored frames
received
409 EXT_TCM5 Extension - TCM5
410 EXT_TCM6 Extension - TCM6
411 FC_P Frame Slip Counts - Path
412 FC_TCM1 Frame Slip Counts - TCM1
413 FC_TCM2 Frame Slip Counts - TCM2
Performance Monitoring Performance Monitoring Counters
....................................................................................................................................................................................................................................
....................................................................................................................................................................................................................................
365-315-148R6.4 Issue 1
March 2011
3-31

Counter Position Number PM Counter Name Description
414 FC_TCM3 Frame Slip Counts - TCM3
415 FC_TCM4 Frame Slip Counts - TCM4
416 FC_TCM5 Frame Slip Counts - TCM5
417 FC_TCM6 Frame Slip Counts - TCM6
418 SES_P Severely Errored Seconds -
Path
419 SES_TCM1 Severely Errored Seconds -
TCM1
420 SES_TCM2 Severely Errored Seconds -
TCM2
421 SES_TCM3 Severely Errored Seconds -
TCM3
422 SES_TCM4 Severely Errored Seconds -
TCM4
423 SES_TCM5 Severely Errored Seconds -
TCM5
424 SES_TCM6 Severely Errored Seconds -
TCM6
425 UAS_P Unavailable Seconds - Path
426 UAS_TCM1 Unavailable Seconds - TCM1
427 UAS_TCM2 Unavailable Seconds - TCM2
428 UAS_TCM3 Unavailable Seconds - TCM3
429 UAS_TCM4 Unavailable Seconds - TCM4
430 UAS_TCM5 Unavailable Seconds - TCM5
431 UAS_TCM6 Unavailable Seconds - TCM6
432 BBER_ADD Background Block Errors
Ratio - Add
433 BBER_DROP Background Block Errors
Ratio - Drop
434 ESR_ADD Errored Seconds Ratio - Add
435 ESR_DROP Errored Seconds Ratio - Drop
436 SESR_ADD Severely Errored Seconds
Ratio - Add
437 SESR_DROP Severely Errored Seconds
Ratio - Drop
Performance Monitoring Performance Monitoring Counters
....................................................................................................................................................................................................................................
....................................................................................................................................................................................................................................
3-32 365-315-148R6.4 Issue 1
March 2011
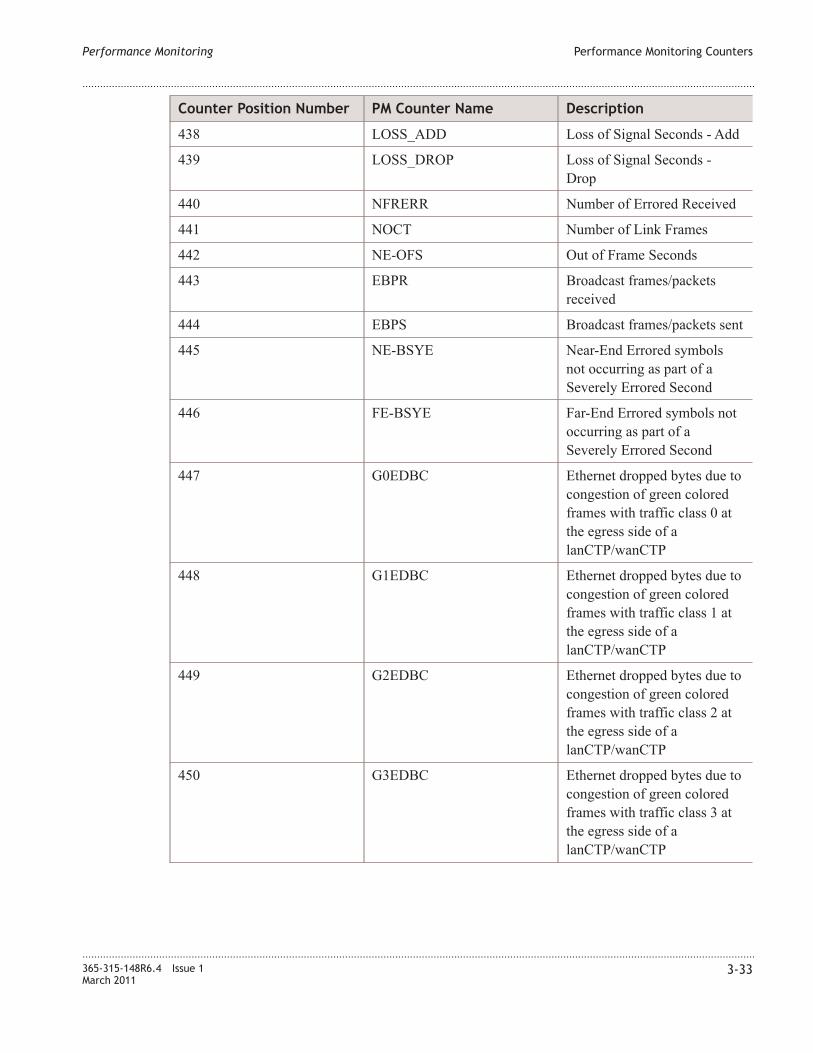
Counter Position Number PM Counter Name Description
438 LOSS_ADD Loss of Signal Seconds - Add
439 LOSS_DROP Loss of Signal Seconds -
Drop
440 NFRERR Number of Errored Received
441 NOCT Number of Link Frames
442 NE-OFS Out of Frame Seconds
443 EBPR Broadcast frames/packets
received
444 EBPS Broadcast frames/packets sent
445 NE-BSYE Near-End Errored symbols
not occurring as part of a
Severely Errored Second
446 FE-BSYE Far-End Errored symbols not
occurring as part of a
Severely Errored Second
447 G0EDBC Ethernet dropped bytes due to
congestion of green colored
frames with traffic class 0 at
the egress side of a
lanCTP/wanCTP
448 G1EDBC Ethernet dropped bytes due to
congestion of green colored
frames with traffic class 1 at
the egress side of a
lanCTP/wanCTP
449 G2EDBC Ethernet dropped bytes due to
congestion of green colored
frames with traffic class 2 at
the egress side of a
lanCTP/wanCTP
450 G3EDBC Ethernet dropped bytes due to
congestion of green colored
frames with traffic class 3 at
the egress side of a
lanCTP/wanCTP
Performance Monitoring Performance Monitoring Counters
....................................................................................................................................................................................................................................
....................................................................................................................................................................................................................................
365-315-148R6.4 Issue 1
March 2011
3-33

Counter Position Number PM Counter Name Description
451 Y0EDBC Ethernet dropped bytes due to
congestion of yellow colored
frames with traffic class 0 at
the egress side of a
lanCTP/wanCTP
452 Y1EDBC Ethernet dropped bytes due to
congestion of yellow colored
frames with traffic class 1 at
the egress side of a
lanCTP/wanCTP
453 Y2EDBC Ethernet dropped bytes due to
congestion of yellow colored
frames with traffic class 2 at
the egress side of a
lanCTP/wanCTP
454 Y3EDBC Ethernet dropped bytes due to
congestion of yellow colored
frames with traffic class 3 at
the egress side of a
lanCTP/wanCTP
455 EFDFO Ethernet forwarded discarded
frames due to overflow in
egress direction
456 I3gEILS Ethernet incoming loaded
seconds for incoming traffic
with class 3 or internal traffic
received by a
lanCTP/wanCTP
457 I32gEILS Ethernet incoming loaded
seconds for incoming traffic
with class 3 or class 2 or
internal traffic received by a
lanCTP/wanCTP
458 G0EINB Ethernet incoming number of
bytes of green colored frames
with traffic class 0 received
by a lanCTP/ wanCTP
Performance Monitoring Performance Monitoring Counters
....................................................................................................................................................................................................................................
....................................................................................................................................................................................................................................
3-34 365-315-148R6.4 Issue 1
March 2011

Counter Position Number PM Counter Name Description
459 G1EINB Ethernet incoming number of
bytes of green colored frames
with traffic class 1 received
by a lanCTP/ wanCTP
460 G2EINB Ethernet incoming number of
bytes of green colored frames
with traffic class 2 received
by a lanCTP/ wanCTP
461 G3EINB Ethernet incoming number of
bytes of green colored frames
with traffic class 3 received
by a lanCTP/ wanCTP
462 C3EIN Ethernet incoming number of
bytes of green colored frames
with traffic class 3 or internal
traffic received by a
lanCTP/wanCTP
463 C2EIN Ethernet incoming number of
bytes of green colored frames
with traffic class 3 or traffic
class 2 or internal traffic
received by a
lanCTP/wanCTP
464 Y1EINB Ethernet incoming number of
bytes of yellow colored
frames with traffic class 1
received by a lanCTP/
wanCTP
465 Y0EINB Ethernet incoming number of
bytes of yellow colored
frames with traffic class 0
received by a lanCTP/
wanCTP
466 Y2EINB Ethernet incoming number of
bytes of yellow colored
frames with traffic class 2
received by a lanCTP/
wanCTP
Performance Monitoring Performance Monitoring Counters
....................................................................................................................................................................................................................................
....................................................................................................................................................................................................................................
365-315-148R6.4 Issue 1
March 2011
3-35
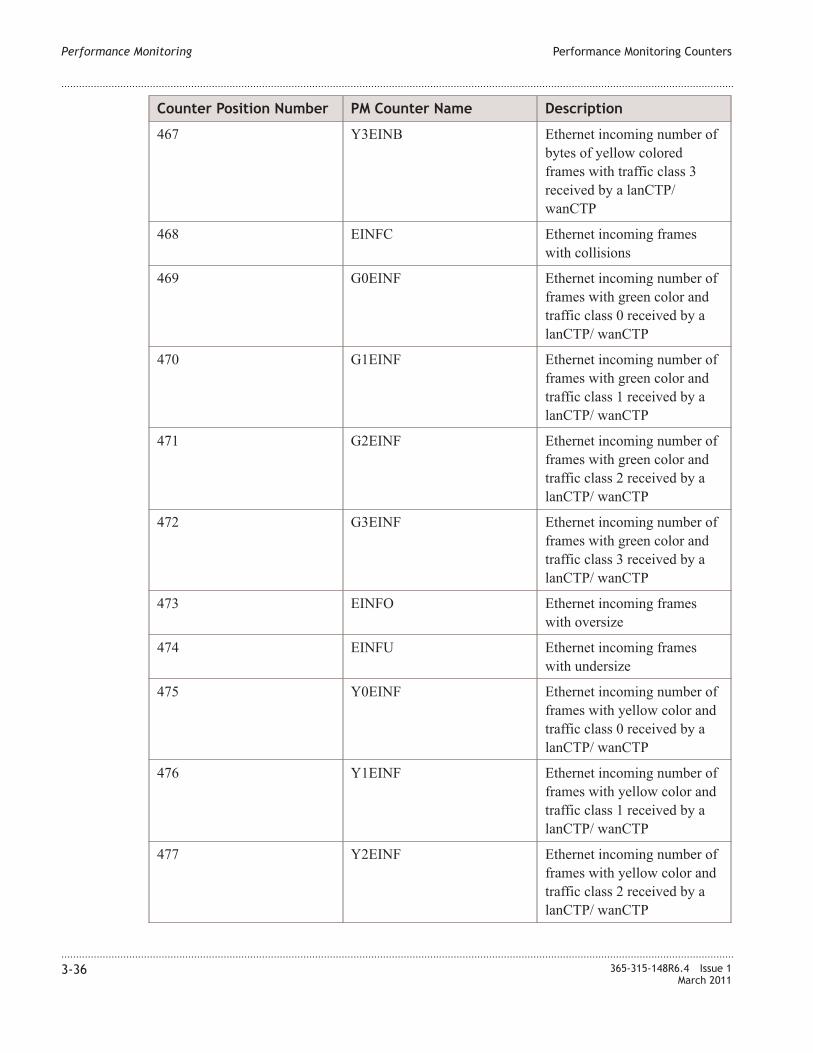
Counter Position Number PM Counter Name Description
467 Y3EINB Ethernet incoming number of
bytes of yellow colored
frames with traffic class 3
received by a lanCTP/
wanCTP
468 EINFC Ethernet incoming frames
with collisions
469 G0EINF Ethernet incoming number of
frames with green color and
traffic class 0 received by a
lanCTP/ wanCTP
470 G1EINF Ethernet incoming number of
frames with green color and
traffic class 1 received by a
lanCTP/ wanCTP
471 G2EINF Ethernet incoming number of
frames with green color and
traffic class 2 received by a
lanCTP/ wanCTP
472 G3EINF Ethernet incoming number of
frames with green color and
traffic class 3 received by a
lanCTP/ wanCTP
473 EINFO Ethernet incoming frames
with oversize
474 EINFU Ethernet incoming frames
with undersize
475 Y0EINF Ethernet incoming number of
frames with yellow color and
traffic class 0 received by a
lanCTP/ wanCTP
476 Y1EINF Ethernet incoming number of
frames with yellow color and
traffic class 1 received by a
lanCTP/ wanCTP
477 Y2EINF Ethernet incoming number of
frames with yellow color and
traffic class 2 received by a
lanCTP/ wanCTP
Performance Monitoring Performance Monitoring Counters
....................................................................................................................................................................................................................................
....................................................................................................................................................................................................................................
3-36 365-315-148R6.4 Issue 1
March 2011

Counter Position Number PM Counter Name Description
478 Y3EINF Ethernet incoming number of
frames with yellow color and
traffic class 3 received by a
lanCTP/ wanCTP
479 I3gEISLS Ethernet incoming severely
loaded seconds for incoming
traffic with class 3 or internal
traffic received by a
lanCTP/wanCTP
480 I32gEISLS Ethernet incoming severely
loaded seconds for incoming
traffic with class 3 or class 2
or internal traffic received by
a lanCTP/wanCTP
481 ENLD Count of ethernet layer1 link
down
482 G2EOCS Ethernet output congested
seconds for outgoing green
colored frames with class 2 at
the egress side of a
lanCTP/wanCTP
483 G3EOCS Ethernet output congested
seconds for outgoing green
colored frames with class 3 at
the egress side of a
lanCTP/wanCTP
484 Y2EOCS Ethernet output congested
seconds for outgoing green
colored frames with class 2 at
the egress side of a
lanCTP/wanCTP
485 Y3EOCS Ethernet output congested
seconds for outgoing green
colored frames with class 3 at
the egress side of a
lanCTP/wanCTP
486 EODFT Ethernet discarded frames due
to storage period on switch
exceeded
Performance Monitoring Performance Monitoring Counters
....................................................................................................................................................................................................................................
....................................................................................................................................................................................................................................
365-315-148R6.4 Issue 1
March 2011
3-37
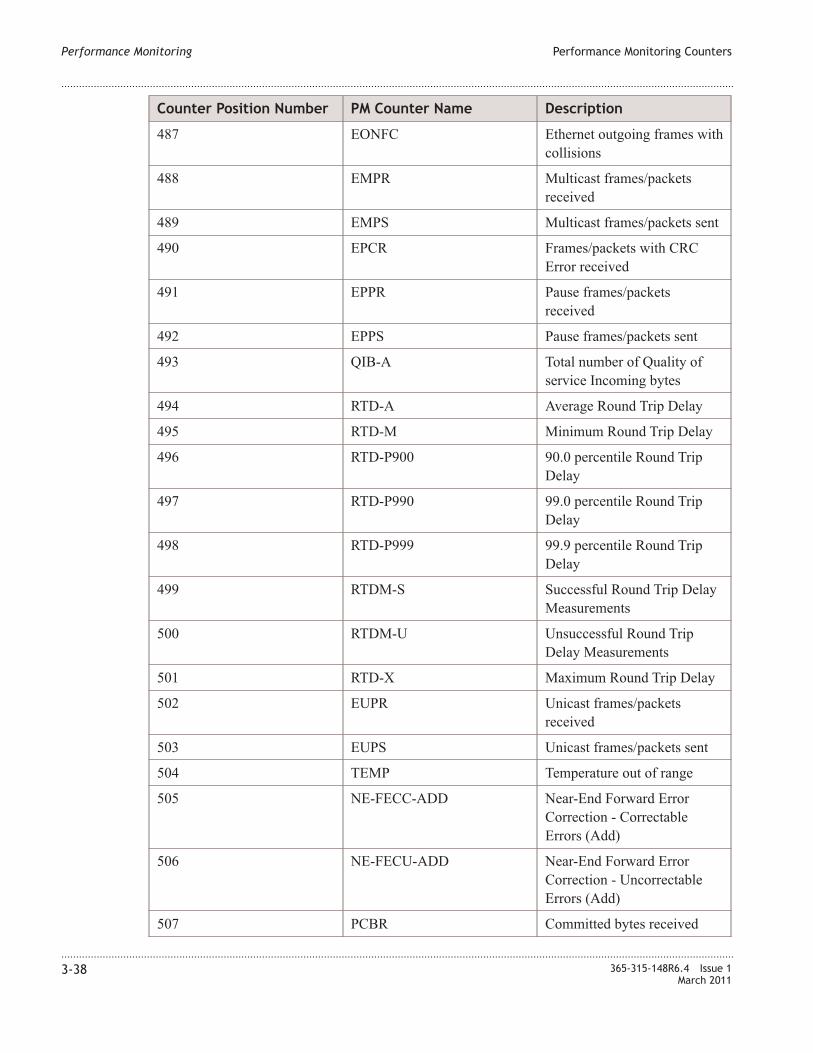
Counter Position Number PM Counter Name Description
487 EONFC Ethernet outgoing frames with
collisions
488 EMPR Multicast frames/packets
received
489 EMPS Multicast frames/packets sent
490 EPCR Frames/packets with CRC
Error received
491 EPPR Pause frames/packets
received
492 EPPS Pause frames/packets sent
493 QIB-A Total number of Quality of
service Incoming bytes
494 RTD-A Average Round Trip Delay
495 RTD-M Minimum Round Trip Delay
496 RTD-P900 90.0 percentile Round Trip
Delay
497 RTD-P990 99.0 percentile Round Trip
Delay
498 RTD-P999 99.9 percentile Round Trip
Delay
499 RTDM-S Successful Round Trip Delay
Measurements
500 RTDM-U Unsuccessful Round Trip
Delay Measurements
501 RTD-X Maximum Round Trip Delay
502 EUPR Unicast frames/packets
received
503 EUPS Unicast frames/packets sent
504 TEMP Temperature out of range
505 NE-FECC-ADD Near-End Forward Error
Correction - Correctable
Errors (Add)
506 NE-FECU-ADD Near-End Forward Error
Correction - Uncorrectable
Errors (Add)
507 PCBR Committed bytes received
Performance Monitoring Performance Monitoring Counters
....................................................................................................................................................................................................................................
....................................................................................................................................................................................................................................
3-38 365-315-148R6.4 Issue 1
March 2011
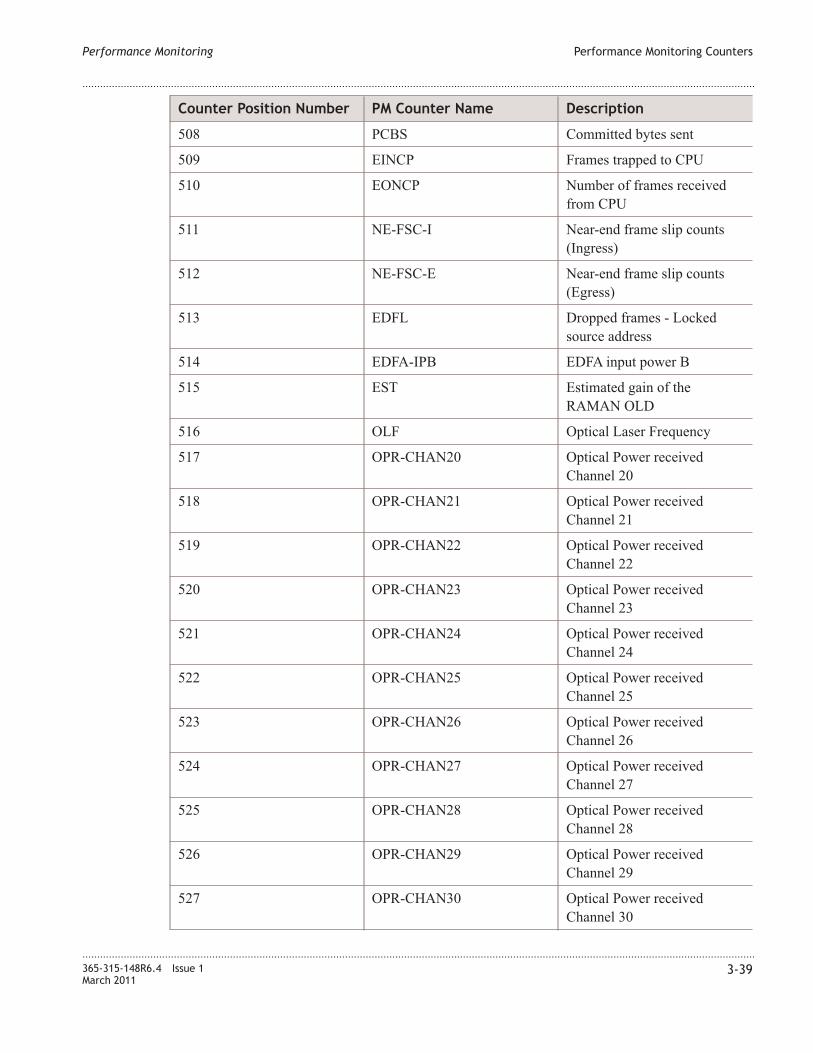
Counter Position Number PM Counter Name Description
508 PCBS Committed bytes sent
509 EINCP Frames trapped to CPU
510 EONCP Number of frames received
from CPU
511 NE-FSC-I Near-end frame slip counts
(Ingress)
512 NE-FSC-E Near-end frame slip counts
(Egress)
513 EDFL Dropped frames - Locked
source address
514 EDFA-IPB EDFA input power B
515 EST Estimated gain of the
RAMAN OLD
516 OLF Optical Laser Frequency
517 OPR-CHAN20 Optical Power received
Channel 20
518 OPR-CHAN21 Optical Power received
Channel 21
519 OPR-CHAN22 Optical Power received
Channel 22
520 OPR-CHAN23 Optical Power received
Channel 23
521 OPR-CHAN24 Optical Power received
Channel 24
522 OPR-CHAN25 Optical Power received
Channel 25
523 OPR-CHAN26 Optical Power received
Channel 26
524 OPR-CHAN27 Optical Power received
Channel 27
525 OPR-CHAN28 Optical Power received
Channel 28
526 OPR-CHAN29 Optical Power received
Channel 29
527 OPR-CHAN30 Optical Power received
Channel 30
Performance Monitoring Performance Monitoring Counters
....................................................................................................................................................................................................................................
....................................................................................................................................................................................................................................
365-315-148R6.4 Issue 1
March 2011
3-39

Counter Position Number PM Counter Name Description
528 OPR-CHAN31 Optical Power received
Channel 31
529 OPR-CHAN32 Optical Power received
Channel 32
530 OPR-CHAN33 Optical Power received
Channel 33
531 OPR-CHAN34 Optical Power received
Channel 34
532 OPR-CHAN35 Optical Power received
Channel 35
533 OPR-CHAN36 Optical Power received
Channel 36
534 OPR-CHAN37 Optical Power received
Channel 37
535 OPR-CHAN38 Optical Power received
Channel 38
536 OPR-CHAN39 Optical Power received
Channel 39
537 OPR-CHAN40 Optical Power received
Channel 40
538 OPR-CHAN41 Optical Power received
Channel 41
539 OPR-CHAN42 Optical Power received
Channel 42
540 OPR-CHAN43 Optical Power received
Channel 43
541 OPR-CHAN44 Optical Power received
Channel 44
542 OPR-CHAN45 Optical Power received
Channel 45
543 OPR-CHAN46 Optical Power received
Channel 46
544 OPR-CHAN47 Optical Power received
Channel 47
545 OPR-CHAN48 Optical Power received
Channel 48
Performance Monitoring Performance Monitoring Counters
....................................................................................................................................................................................................................................
....................................................................................................................................................................................................................................
3-40 365-315-148R6.4 Issue 1
March 2011
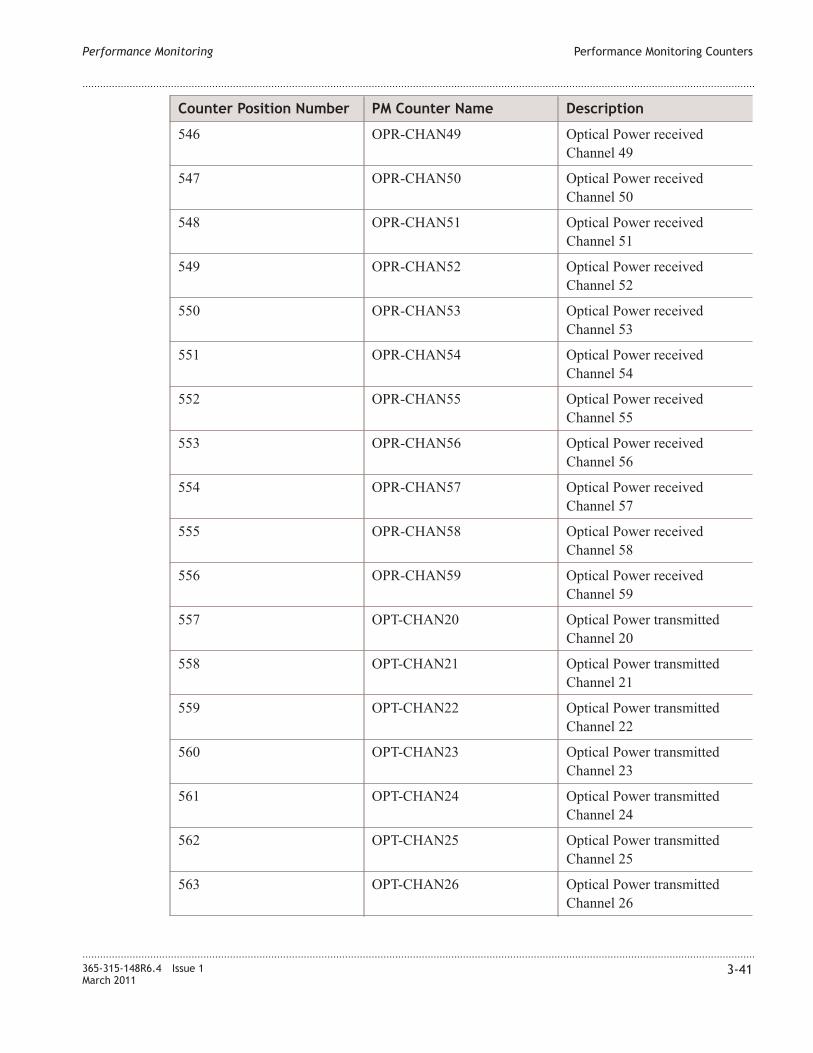
Counter Position Number PM Counter Name Description
546 OPR-CHAN49 Optical Power received
Channel 49
547 OPR-CHAN50 Optical Power received
Channel 50
548 OPR-CHAN51 Optical Power received
Channel 51
549 OPR-CHAN52 Optical Power received
Channel 52
550 OPR-CHAN53 Optical Power received
Channel 53
551 OPR-CHAN54 Optical Power received
Channel 54
552 OPR-CHAN55 Optical Power received
Channel 55
553 OPR-CHAN56 Optical Power received
Channel 56
554 OPR-CHAN57 Optical Power received
Channel 57
555 OPR-CHAN58 Optical Power received
Channel 58
556 OPR-CHAN59 Optical Power received
Channel 59
557 OPT-CHAN20 Optical Power transmitted
Channel 20
558 OPT-CHAN21 Optical Power transmitted
Channel 21
559 OPT-CHAN22 Optical Power transmitted
Channel 22
560 OPT-CHAN23 Optical Power transmitted
Channel 23
561 OPT-CHAN24 Optical Power transmitted
Channel 24
562 OPT-CHAN25 Optical Power transmitted
Channel 25
563 OPT-CHAN26 Optical Power transmitted
Channel 26
Performance Monitoring Performance Monitoring Counters
....................................................................................................................................................................................................................................
....................................................................................................................................................................................................................................
365-315-148R6.4 Issue 1
March 2011
3-41
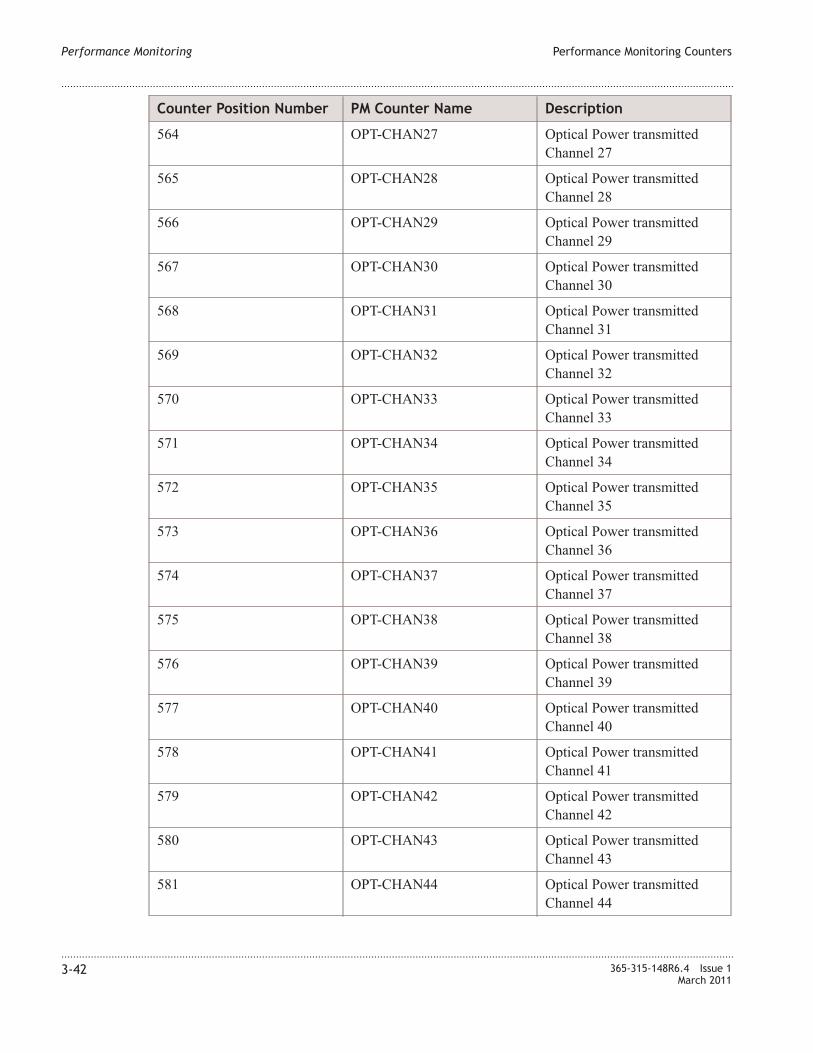
Counter Position Number PM Counter Name Description
564 OPT-CHAN27 Optical Power transmitted
Channel 27
565 OPT-CHAN28 Optical Power transmitted
Channel 28
566 OPT-CHAN29 Optical Power transmitted
Channel 29
567 OPT-CHAN30 Optical Power transmitted
Channel 30
568 OPT-CHAN31 Optical Power transmitted
Channel 31
569 OPT-CHAN32 Optical Power transmitted
Channel 32
570 OPT-CHAN33 Optical Power transmitted
Channel 33
571 OPT-CHAN34 Optical Power transmitted
Channel 34
572 OPT-CHAN35 Optical Power transmitted
Channel 35
573 OPT-CHAN36 Optical Power transmitted
Channel 36
574 OPT-CHAN37 Optical Power transmitted
Channel 37
575 OPT-CHAN38 Optical Power transmitted
Channel 38
576 OPT-CHAN39 Optical Power transmitted
Channel 39
577 OPT-CHAN40 Optical Power transmitted
Channel 40
578 OPT-CHAN41 Optical Power transmitted
Channel 41
579 OPT-CHAN42 Optical Power transmitted
Channel 42
580 OPT-CHAN43 Optical Power transmitted
Channel 43
581 OPT-CHAN44 Optical Power transmitted
Channel 44
Performance Monitoring Performance Monitoring Counters
....................................................................................................................................................................................................................................
....................................................................................................................................................................................................................................
3-42 365-315-148R6.4 Issue 1
March 2011
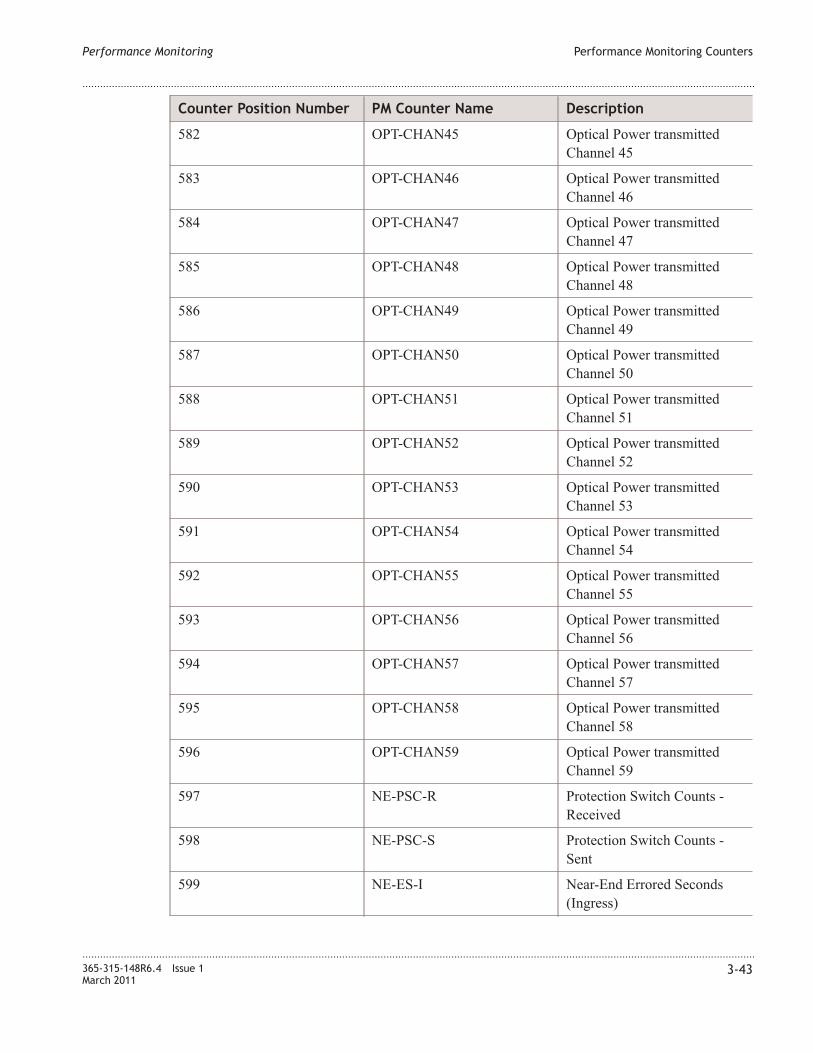
Counter Position Number PM Counter Name Description
582 OPT-CHAN45 Optical Power transmitted
Channel 45
583 OPT-CHAN46 Optical Power transmitted
Channel 46
584 OPT-CHAN47 Optical Power transmitted
Channel 47
585 OPT-CHAN48 Optical Power transmitted
Channel 48
586 OPT-CHAN49 Optical Power transmitted
Channel 49
587 OPT-CHAN50 Optical Power transmitted
Channel 50
588 OPT-CHAN51 Optical Power transmitted
Channel 51
589 OPT-CHAN52 Optical Power transmitted
Channel 52
590 OPT-CHAN53 Optical Power transmitted
Channel 53
591 OPT-CHAN54 Optical Power transmitted
Channel 54
592 OPT-CHAN55 Optical Power transmitted
Channel 55
593 OPT-CHAN56 Optical Power transmitted
Channel 56
594 OPT-CHAN57 Optical Power transmitted
Channel 57
595 OPT-CHAN58 Optical Power transmitted
Channel 58
596 OPT-CHAN59 Optical Power transmitted
Channel 59
597 NE-PSC-R Protection Switch Counts -
Received
598 NE-PSC-S Protection Switch Counts -
Sent
599 NE-ES-I Near-End Errored Seconds
(Ingress)
Performance Monitoring Performance Monitoring Counters
....................................................................................................................................................................................................................................
....................................................................................................................................................................................................................................
365-315-148R6.4 Issue 1
March 2011
3-43
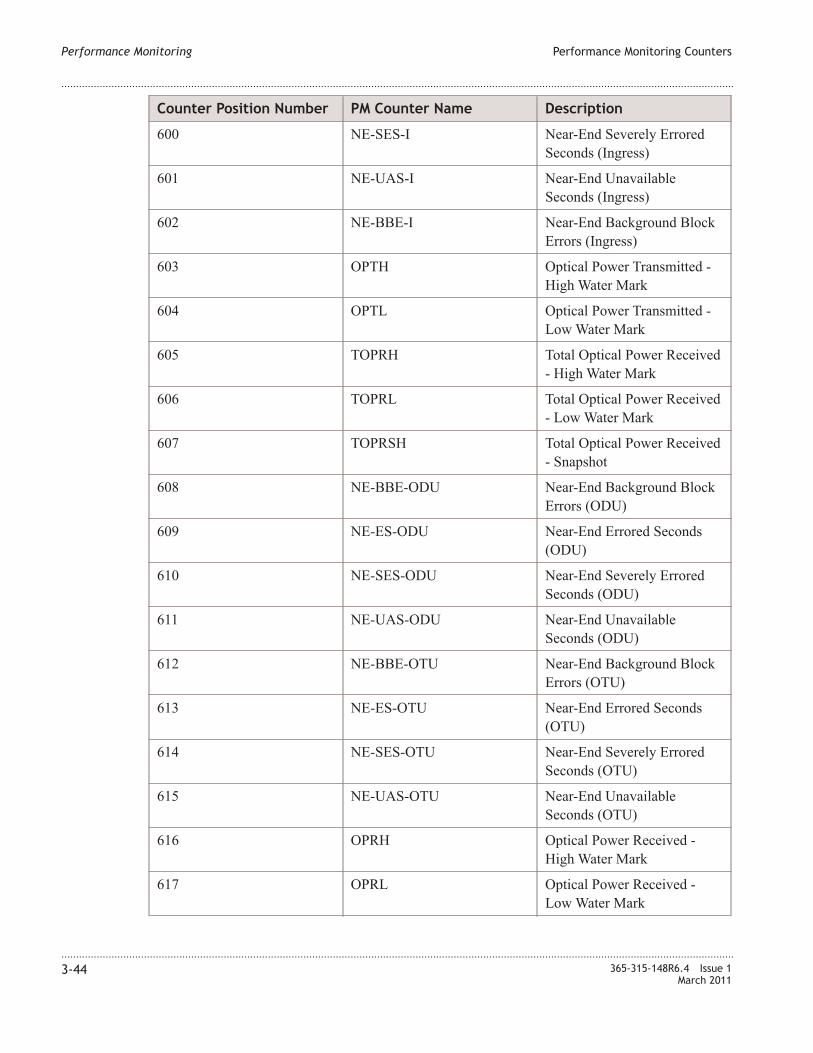
Counter Position Number PM Counter Name Description
600 NE-SES-I Near-End Severely Errored
Seconds (Ingress)
601 NE-UAS-I Near-End Unavailable
Seconds (Ingress)
602 NE-BBE-I Near-End Background Block
Errors (Ingress)
603 OPTH Optical Power Transmitted -
High Water Mark
604 OPTL Optical Power Transmitted -
Low Water Mark
605 TOPRH Total Optical Power Received
- High Water Mark
606 TOPRL Total Optical Power Received
- Low Water Mark
607 TOPRSH Total Optical Power Received
- Snapshot
608 NE-BBE-ODU Near-End Background Block
Errors (ODU)
609 NE-ES-ODU Near-End Errored Seconds
(ODU)
610 NE-SES-ODU Near-End Severely Errored
Seconds (ODU)
611 NE-UAS-ODU Near-End Unavailable
Seconds (ODU)
612 NE-BBE-OTU Near-End Background Block
Errors (OTU)
613 NE-ES-OTU Near-End Errored Seconds
(OTU)
614 NE-SES-OTU Near-End Severely Errored
Seconds (OTU)
615 NE-UAS-OTU Near-End Unavailable
Seconds (OTU)
616 OPRH Optical Power Received -
High Water Mark
617 OPRL Optical Power Received -
Low Water Mark
Performance Monitoring Performance Monitoring Counters
....................................................................................................................................................................................................................................
....................................................................................................................................................................................................................................
3-44 365-315-148R6.4 Issue 1
March 2011
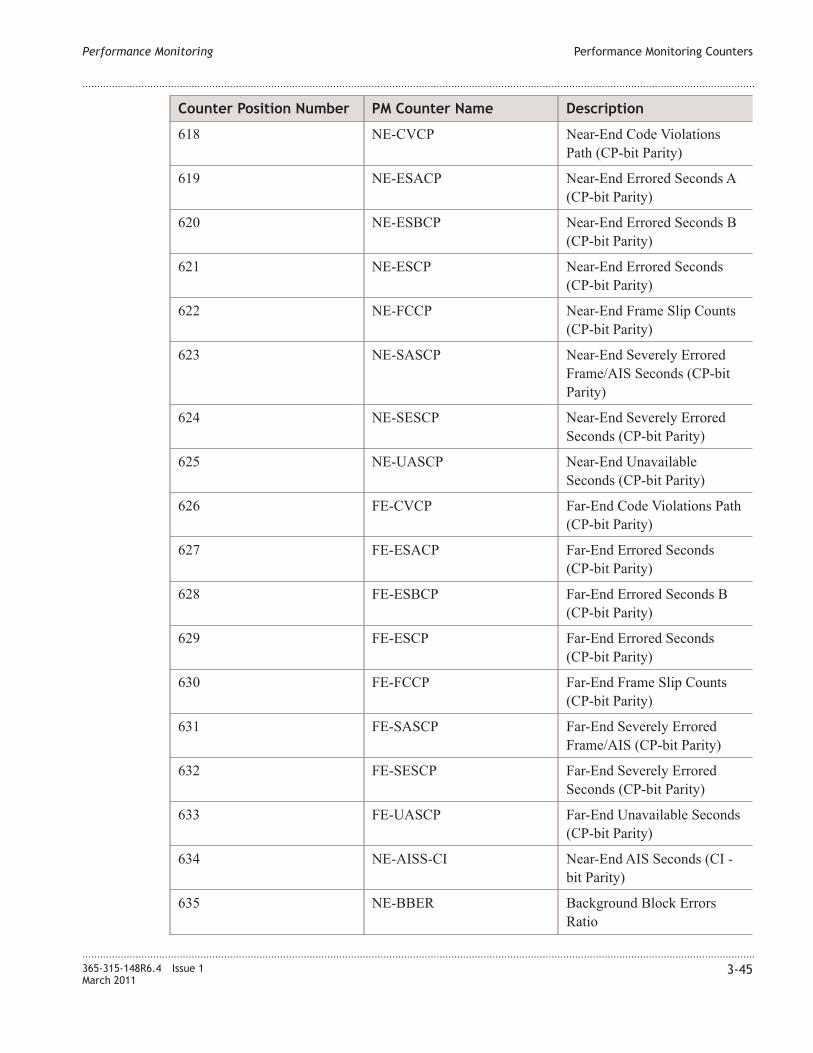
Counter Position Number PM Counter Name Description
618 NE-CVCP Near-End Code Violations
Path (CP-bit Parity)
619 NE-ESACP Near-End Errored Seconds A
(CP-bit Parity)
620 NE-ESBCP Near-End Errored Seconds B
(CP-bit Parity)
621 NE-ESCP Near-End Errored Seconds
(CP-bit Parity)
622 NE-FCCP Near-End Frame Slip Counts
(CP-bit Parity)
623 NE-SASCP Near-End Severely Errored
Frame/AIS Seconds (CP-bit
Parity)
624 NE-SESCP Near-End Severely Errored
Seconds (CP-bit Parity)
625 NE-UASCP Near-End Unavailable
Seconds (CP-bit Parity)
626 FE-CVCP Far-End Code Violations Path
(CP-bit Parity)
627 FE-ESACP Far-End Errored Seconds
(CP-bit Parity)
628 FE-ESBCP Far-End Errored Seconds B
(CP-bit Parity)
629 FE-ESCP Far-End Errored Seconds
(CP-bit Parity)
630 FE-FCCP Far-End Frame Slip Counts
(CP-bit Parity)
631 FE-SASCP Far-End Severely Errored
Frame/AIS (CP-bit Parity)
632 FE-SESCP Far-End Severely Errored
Seconds (CP-bit Parity)
633 FE-UASCP Far-End Unavailable Seconds
(CP-bit Parity)
634 NE-AISS-CI Near-End AIS Seconds (CI -
bit Parity)
635 NE-BBER Background Block Errors
Ratio
Performance Monitoring Performance Monitoring Counters
....................................................................................................................................................................................................................................
....................................................................................................................................................................................................................................
365-315-148R6.4 Issue 1
March 2011
3-45
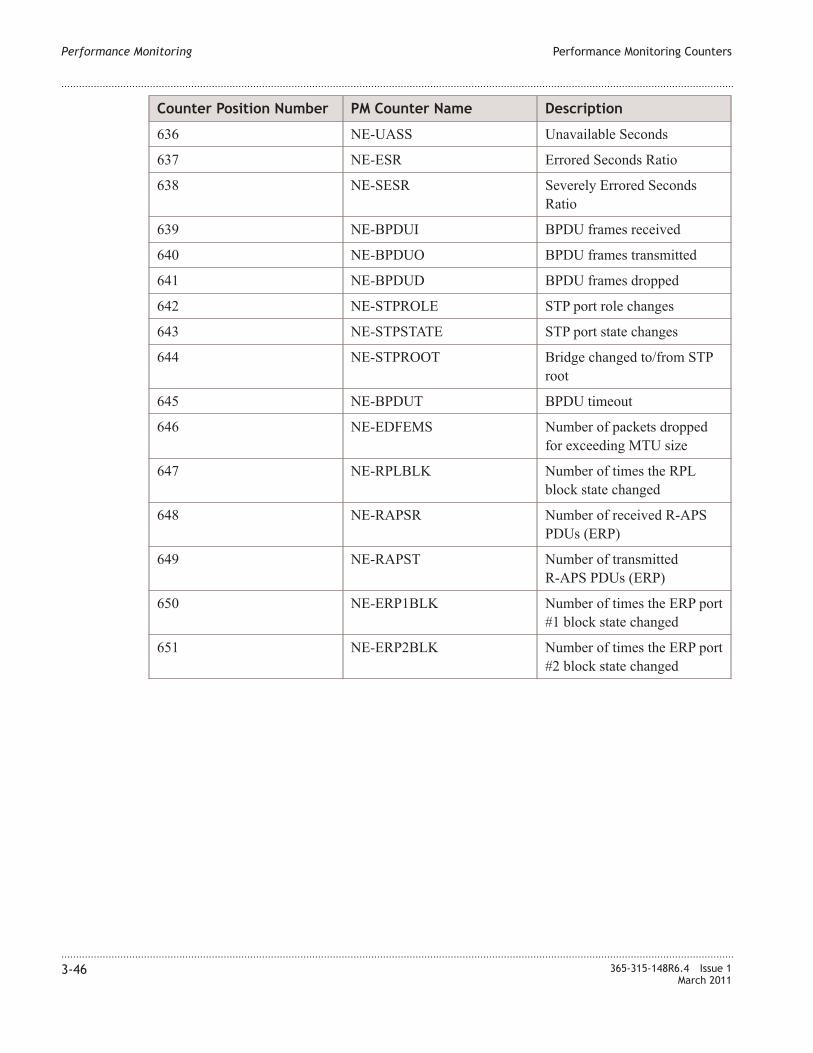
Counter Position Number PM Counter Name Description
636 NE-UASS Unavailable Seconds
637 NE-ESR Errored Seconds Ratio
638 NE-SESR Severely Errored Seconds
Ratio
639 NE-BPDUI BPDU frames received
640 NE-BPDUO BPDU frames transmitted
641 NE-BPDUD BPDU frames dropped
642 NE-STPROLE STP port role changes
643 NE-STPSTATE STP port state changes
644 NE-STPROOT Bridge changed to/from STP
root
645 NE-BPDUT BPDU timeout
646 NE-EDFEMS Number of packets dropped
for exceeding MTU size
647 NE-RPLBLK Number of times the RPL
block state changed
648 NE-RAPSR Number of received R-APS
PDUs (ERP)
649 NE-RAPST Number of transmitted
R-APS PDUs (ERP)
650 NE-ERP1BLK Number of times the ERP port
#1 block state changed
651 NE-ERP2BLK Number of times the ERP port
#2 block state changed
Performance Monitoring Performance Monitoring Counters
....................................................................................................................................................................................................................................
....................................................................................................................................................................................................................................
3-46 365-315-148R6.4 Issue 1
March 2011
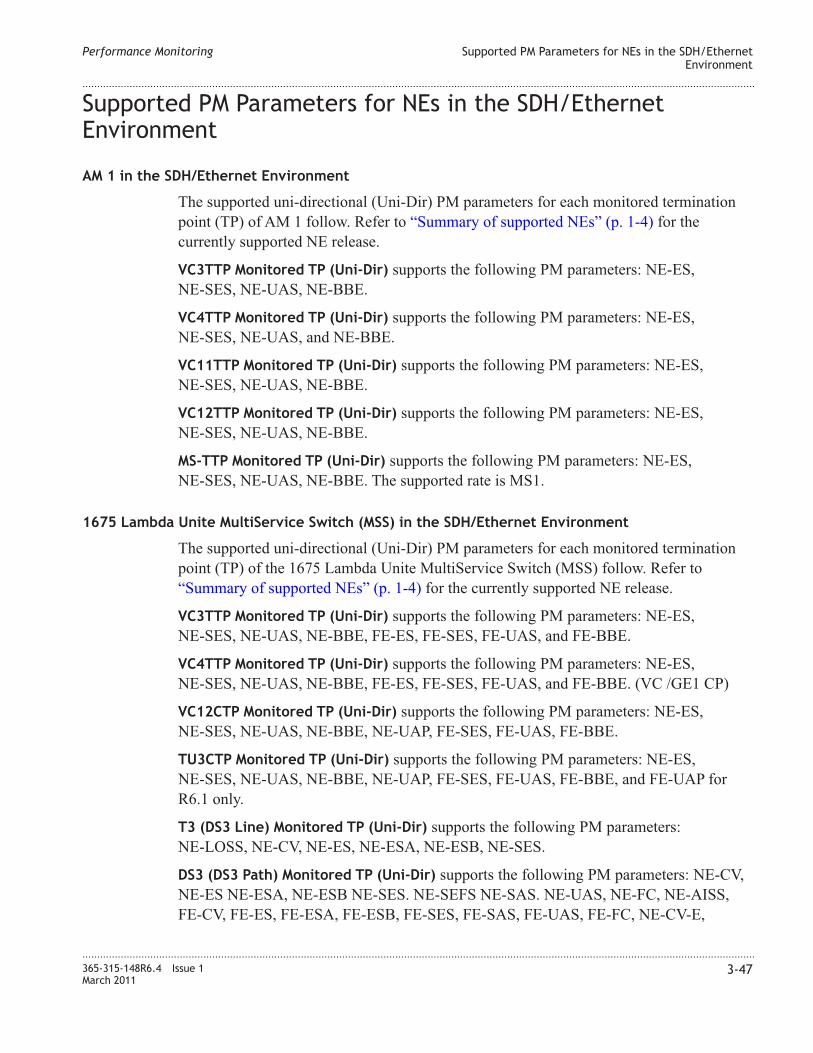
Supported PM Parameters for NEs in the SDH/Ethernet
Environment
AM 1 in the SDH/Ethernet Environment
The supported uni-directional (Uni-Dir) PM parameters for each monitored termination
point (TP) of AM 1 follow. Refer to “Summary of supported NEs” (p. 1-4) for the
currently supported NE release.
VC3TTP Monitored TP (Uni-Dir) supports the following PM parameters: NE-ES,
NE-SES, NE-UAS, NE-BBE.
VC4TTP Monitored TP (Uni-Dir) supports the following PM parameters: NE-ES,
NE-SES, NE-UAS, and NE-BBE.
VC11TTP Monitored TP (Uni-Dir) supports the following PM parameters: NE-ES,
NE-SES, NE-UAS, NE-BBE.
VC12TTP Monitored TP (Uni-Dir) supports the following PM parameters: NE-ES,
NE-SES, NE-UAS, NE-BBE.
MS-TTP Monitored TP (Uni-Dir) supports the following PM parameters: NE-ES,
NE-SES, NE-UAS, NE-BBE. The supported rate is MS1.
1675 Lambda Unite MultiService Switch (MSS) in the SDH/Ethernet Environment
The supported uni-directional (Uni-Dir) PM parameters for each monitored termination
point (TP) of the 1675 Lambda Unite MultiService Switch (MSS) follow. Refer to
“Summary of supported NEs” (p. 1-4) for the currently supported NE release.
VC3TTP Monitored TP (Uni-Dir) supports the following PM parameters: NE-ES,
NE-SES, NE-UAS, NE-BBE, FE-ES, FE-SES, FE-UAS, and FE-BBE.
VC4TTP Monitored TP (Uni-Dir) supports the following PM parameters: NE-ES,
NE-SES, NE-UAS, NE-BBE, FE-ES, FE-SES, FE-UAS, and FE-BBE. (VC /GE1 CP)
VC12CTP Monitored TP (Uni-Dir) supports the following PM parameters: NE-ES,
NE-SES, NE-UAS, NE-BBE, NE-UAP, FE-SES, FE-UAS, FE-BBE.
TU3CTP Monitored TP (Uni-Dir) supports the following PM parameters: NE-ES,
NE-SES, NE-UAS, NE-BBE, NE-UAP, FE-SES, FE-UAS, FE-BBE, and FE-UAP for
R6.1 only.
T3 (DS3 Line) Monitored TP (Uni-Dir) supports the following PM parameters:
NE-LOSS, NE-CV, NE-ES, NE-ESA, NE-ESB, NE-SES.
DS3 (DS3 Path) Monitored TP (Uni-Dir) supports the following PM parameters: NE-CV,
NE-ES NE-ESA, NE-ESB NE-SES. NE-SEFS NE-SAS. NE-UAS, NE-FC, NE-AISS,
FE-CV, FE-ES, FE-ESA, FE-ESB, FE-SES, FE-SAS, FE-UAS, FE-FC, NE-CV-E,
Performance Monitoring Supported PM Parameters for NEs in the SDH/Ethernet
Environment
....................................................................................................................................................................................................................................
....................................................................................................................................................................................................................................
365-315-148R6.4 Issue 1
March 2011
3-47
NE-ES-E, NE-ESA-E, NE-ESB-E, NE-SES-E, NE-SEFS-E, NE-SAS-E, NE-UAS-E,
NE-FC-E, NE-AISS-E, FE-CV-E, FE-ES-E FE-ESA-E, FE-ESB-E FE-SES-E, FE-SAS-E
FE-UAS-E, and FE-FC-E
AU3CTP Monitored TP (Uni-Dir) supports the following PM parameters: NE-ES,
NE-SES, NE-UAS, NE-BBE, FE-ES, FE-SES, FE-UAS, and FE-BBE.
AU4-4C CTP (VC4-4C) Monitored TP (Uni-Dir) supports the following PM parameters:
NE-ES, NE-SES, NE-UAS, NE-BBE, FE-ES, FE-SES, FE-UAS, FE-BBE, and FE-UAP.
AU4-16C CTP (VC4-16C) Monitored TP (Uni-Dir) supports, NE-ES, NE-SES, NE-UAS,
NE-BBE, FE-ES, FE-SES, FE-UAS, and FE-BBE.
AU4-64C CTP (VC4-64C) Monitored TP (Uni-Dir) supports the following PM parameters:
NE-ES, NE-SES, NE-UAS, NE-BBE, NE-UAP, FE-ES, FE-SES, FE-UAS, FE-BBE,
FE-UAP.
AU4-64C CTP (VC4-64C) Monitored TP (Uni-Dir) supports the following PM parameters:
NE-ES, NE-SES, NE-UAS, NE-BBE, NE-UAP, FE-ES, FE-SES, FE-UAS, FE-BBE,
FE-UAP.
Ethernet (LAN/WAN/VCG) Monitored TP (Uni-Dir) supports the following PM
parameters: CBR, CBS, and PDE (For GBE Card). NE-EINB, NE-EONB, NE-EINF,
NE-EONF, NE-EDFE, NE-EDFC (For 1GBE EPL and 10GBE EPL)
DS3 Line T3 (Uni-Dir) supports the following PM parameters: NE-LOSS, NE-CV,
NE-ES, NE-ESA, NE-ESB, and NE-SES.
DS3 Path (Uni-Dir) supports the following PM parameters: NE-CV, NE-ES, NE-ESA,
NE-ESB, NE-SES, NE-SEFS, NE-SAS, NE-UAS, NE-FC, NE-AISS, FE-CV, FE-ES,
FE-ESA, FE-ESB, FE-SES, FE-SAS, FE-UAS, FE-FC. In addition, for egress (-E) the
following are supported: NE-CV-E, NE-ES-E, NE-ESA-E, NE-ESB-E, NE-SES-E,
NE-SEFS-E, NE-SAS-E, NE-UAS-E, NE-FC-E, NE-AISS-E, FE-CV-E, FE-ES-E,
FE-ESA-E, FE-ESB-E, FE-SES-E, FE-SAS-E, FE-UAS-E, and FE-FC-E.
MS-TTP Monitored TP (Uni-Dir) supports the following PM parameters: NE-ES,
NE-SES, NE-UAS, NE-BBE, NE-FECC (for STM-64 and STM-256 only), FE-ES,
FE-SES, FE-UAS, and FE-BBE. The supported rates are MS1, MS4, MS16, MS64, and
MS256.
RS-TTP Monitored TP (Uni-Dir) supports the following PM parameters: NE-ES, NE-SES,
NE-UAS, and NE-BBE. The supported rates are RS1, RS4, RS16, RS64, and RS256.
ODU-TTP Monitored TP (Uni-Dir) supports the following PM parameters: NE-ES,
NE-SES, NE-UAS, and NE-BBE.
OTN Ports (OMS LR=OS) Monitored TP (Uni-Dir) supports the following PM parameters:
NE:LOSS, NE:FEC-EC.
Performance Monitoring Supported PM Parameters for NEs in the SDH/Ethernet
Environment
....................................................................................................................................................................................................................................
....................................................................................................................................................................................................................................
3-48 365-315-148R6.4 Issue 1
March 2011
1663 Add Drop Multiplex-universal (ADM-u) in the SDH/Ethernet Environment
The supported uni-directional (Uni-Dir) and bidirectional (Bi-Dir) PM parameters for
each monitored termination point (TP) of the 1663 Add Drop Multiplex-universal
(ADM-u) MSS follow. Refer to “Summary of supported NEs” (p. 1-4) for the currently
supported NE release.
VC12TTP (Uni-Dir) supports the following PM parameters: NE-ES, NE-SES, NE-UAS,
and NE-BBE.
VC12TTP (Uni-Dir) supports the following PM parameters: NE-ES, NE-SES, NE-UAS,
and NE-BBE.
VC12TTP (Bi-Dir) supports the following PM parameters: NE-ES, NE-SES, NE-BBE,
FE-ES, FE-SES, FE-BBE, BI-UAS, and BI-UAP.
VC11TTP (Uni-Dir) supports the following PM parameters: NE-ES, NE-SES, NE-UAS,
and NE-BBE.
VC11TTP (Bi-Dir) supports the following PM parameters: NE-ES, NE-SES, NE-BBE,
FE-ES, FE-SES, FE-BBE, BI-UAS, and BI-UAP.
VC3TTP Monitored TP (Uni-Dir) supports the following PM parameters: NE-ES,
NE-SES, NE-UAS, and NE-BBE.
VC3TTP Monitored TP (Bi-Dir) supports the following PM parameters: NE-ES, NE-SES,
NE-BBE, FE-ES, FE-SES, FE-BBE, BI-UAS, and BI-UAP.
VC4TTP Monitored TP (Uni-Dir) supports the following PM parameters: NE-ES,
NE-SES, NE-UAS, and NE-BBE.
VC4TTP Monitored TP (Bi-Dir) supports the following PM parameters: NE-ES, NE-SES,
NE-BBE, FE-ES, FE-SES, FE-BBE, BI-UAS, and BI-UAP.
TU12CTP Monitored TP (Uni-Dir) supports the following PM parameters: NE-ES,
NE-SES, NE-UAS, and NE-BBE.
TU12CTP Monitored TP (Bi-Dir) supports the following PM parameters: FW-ES,
FW-SES, FW-BBE, BW-ES, BW-SES, BW-BBE, BI-UAS, and BI-UAP.
TU3CTP Monitored TP (Uni-Dir) supports the following PM parameters: NE-ES,
NE-SES, NE-UAS, and NE-BBE.
TU3CTP Monitored TP (Bi-Dir) supports the following PM parameters: FW-ES, FW-SES,
FW-BBE, BW-ES, BW-SES, BW-BBE, BI-UAS, and BI-UAP.
AU4CTP Monitored TP (Uni-Dir) supports the following PM parameters: NE-ES,
NE-SES, NE-UAS, NE-BBE, NE-PPGE, and NE-NPGE.
AU4CTP Monitored TP (Bi-Dir) supports the following PM parameters: FW-ES, FW-SES,
FW-BBE, BW-ES, BW-SES, BW-BBE, BI-UAS, and BI-UAP.
Performance Monitoring Supported PM Parameters for NEs in the SDH/Ethernet
Environment
....................................................................................................................................................................................................................................
....................................................................................................................................................................................................................................
365-315-148R6.4 Issue 1
March 2011
3-49
AU4-4C CTP (VC4-4C) VC-4 (VC4TTP) Monitored TP (Uni-Dir) supports the following
PM parameters: NE-ES, NE-SES, NE-UAS, NE-BBE, NE-PPGE, and NE-NPGE.
AU4-4C CTP (VC4-4C) Monitored TP (Bi-Dir) supports the following PM parameters:
FW-ES, FW-SES, FW-BBE, BW-ES, BW-SES, BW-BBE, BI-UAS, and BI-UAP.
AU4-16C CTP (VC4-16C) Monitored TP (Uni-Dir) supports the following PM parameters:
NE-ES, NE-SES, NE-UAS, NE-BBE, NE-PPGE, and NE-NPGE.
AU4-16C CTP (VC4-16C) Monitored TP (Bi-Dir) supports the following PM parameters:
FW-ES, FW-SES, FW-BBE, BW-ES, BW-SES, BW-BBE, BI-UAS, and BI-UAP.
MS-TTP Monitored TP (Uni-Dir) supports the following PM parameters: NE-ES,
NE-SES, NE-UAS, NE-BBE, MS1, MS4, MS16, and MS64.
RS-TTP Monitored TP (Uni-Dir) supports the following PM parameters: NE-ES, NE-SES,
NE-UAS, and NE-BBE. The supported rates are RS1, RS4, RS16, and RS64.
E1 Path 2Mb (Uni-Dir) supports the following PM parameters: NE-ES, NE-SES,
NE-UAS, and NE-BBE. In addition, for Egress (-E), the following are supported:
NE-ES-E, NE-SES-E, NE-UAS-E, and NE-BBE-E.
Ethernet (LAN/WAN/VCG) Monitored TP (Uni-Dir) supports the following PM
parameters: NE-PDE, NE-CBR, NE-CBS, NE-UPR, NE-UPS, NE-MPR, NE-MPS,
NE-BPR, NE-BPS, NE-PCR, NE-PPR, NE-PPS, NE-EINF, NE-EONF, NE-EINCP,
NE-EONCP.
LR_Ethernet_CONG) Monitored TP (Uni-Dir) supports the following PM parameters:
NE-EDBC-G0, NE-EDBC-Y0, NE-EDBC-G1, NE-EDBC-Y1, NE-EDBC-G2,
NE-EDBC-Y2, NE-EDBC-G3, NE-EDBC-Y3, NE-EOCS-G2, NE-EOCS-Y2,
NE-EOCS-G3, NE-EOCS-Y3.
LR_Ethernet_HQ Monitored TP (Uni-Dir) supports the following PM parameters:
NE-EINB-G0, NE-EINB-Y0, NE-EINB-G1, NE-EINB-Y1, NE-EINF-G0, NE-EINF-Y0,
NE-EINF-G1, NE-EINF-Y1.
LR_Ethernet_LQ Monitored TP (Uni-Dir) supports the following PM parameters:
NE-EINB-G0, NE-EINB-Y0, NE-EINB-G1, NE-EINB-Y1, NE-EINF-G0, NE-EINF-Y0,
NE-EINF-G1, NE-EINF-Y1.
LR_Ethernet_OAM Monitored TP (Uni-Dir) supports the following PM parameters:
NE-BSYE, NE-ES, NE-SES, NE-UAS, FE-BSYE, FE-ES, FE-SES, FE-UAS.
LR_Ethernet_RTD Monitored TP (Uni-Dir) supports the following PM parameters:
NE-RTD-A, NERTD- M, NE-RTDX, NE-RTD-P900, NE-RTD-P990, NE-RTD-P999,
NE-RTDM-S, NERTDM- U.
LR_Ethernet_Service Monitored TP (Uni-Dir) supports the following PM parameters:
NE-QIB-A, NE-QIB-G, NEQIB- Y, NE-QIB-R.
Performance Monitoring Supported PM Parameters for NEs in the SDH/Ethernet
Environment
....................................................................................................................................................................................................................................
....................................................................................................................................................................................................................................
3-50 365-315-148R6.4 Issue 1
March 2011
1643 Access Multiplexer (AM) in the SDH/Ethernet Environment
The supported uni-directional (Uni-Dir) and bidirectional (Bi-Dir) PM parameters for
each monitored termination point (TP) of the 1643 Access Multiplexer Small (AMS)
MSS follow. Refer to “Summary of supported NEs” (p. 1-4) for the currently supported
NE release.
VC12TTP (Uni-Dir) supports the following PM parameters: NE-ES, NE-SES, NE-UAS,
and NE-BBE.
VC12TTP (Bi-Dir) supports the following PM parameters: NE-ES, NE-SES, NE-BBE,
FE-ES, FE-SES, FE-BBE, BI-UAS, and BI-UAP.
VC11TTP (Uni-Dir) supports the following PM parameters: NE-ES, NE-SES, NE-UAS,
and NE-BBE.
VC11TTP (Bi-Dir) supports the following PM parameters: NE-ES, NE-SES, NE-BBE,
FE-ES, FE-SES, FE-BBE, BI-UAS, and BI-UAP.
VC3TTP Monitored TP (Uni-Dir) supports the following PM parameters: NE-ES,
NE-SES, NE-UAS, and NE-BBE.
VC3TTP Monitored TP (Bi-Dir) supports the following PM parameters: NE-ES, NE-SES,
NE-BBE, FE-ES, FE-SES, FE-BBE, BI-UAS, and BI-UAP.
VC4TTP Monitored TP (Uni-Dir) supports the following PM parameters: NE-ES,
NE-SES, NE-UAS, and NE-BBE.
VC4TTP Monitored TP (Bi-Dir) supports the following PM parameters: NE-ES, NE-SES,
NE-BBE, FE-ES, FE-SES, FE-BBE, BI-UAS, and BI-UAP.
MS-TTP Monitored TP (Uni-Dir) supports the following PM parameters: NE-ES,
NE-SES, NE-UAS, NE-BBE, MS1, and MS4.
Ethernet (LAN/WAN/VCG) Monitored TP (Uni-Dir) supports the following PM
parameters: NE-CKBR, NE-CKBS, NE-PDE, NE-CBR, NE-CBS, NE-UPR, NE-UPS,
NE-MPR, NE-MPS, NE-BPR, NE-BPS, NE-PCR, NE-EINF, NE-EONF, NE-EONCP,
NEPPS, NE-ENLD, NE-EINFO, NE-EINFU, NE-EINFC, NEEONFC, NE-EFDFO, and
NEEODFT.
LR_Ethernet_HQ Monitored TP (Uni-Dir) supports the following PM parameters:
NE-EINB-G2, NE-EINB-Y2, NE-EINB-G3, NE-EINB-Y3, NE-EINB-GI3,
NE-EINBGI32, NE-EINF-G2, NEEINF- Y2, NE-EINF-G3, NEEINF- Y3, NE-EILS-GI3,
NEEILS- GI32, NE-EISLS-GI3, and NE-EISLS-GI323.
LR_Ethernet_LQ Monitored TP (Uni-Dir) supports the following PM parameters:
NE-EINB-G0, NE-EINB-Y0, NE-EINB-G1, NE-EINB-Y1, NE-EINF-G0, NE-EINF-Y0,
NE-EINF-G1, and NE-EINF-Y1.
Performance Monitoring Supported PM Parameters for NEs in the SDH/Ethernet
Environment
....................................................................................................................................................................................................................................
....................................................................................................................................................................................................................................
365-315-148R6.4 Issue 1
March 2011
3-51
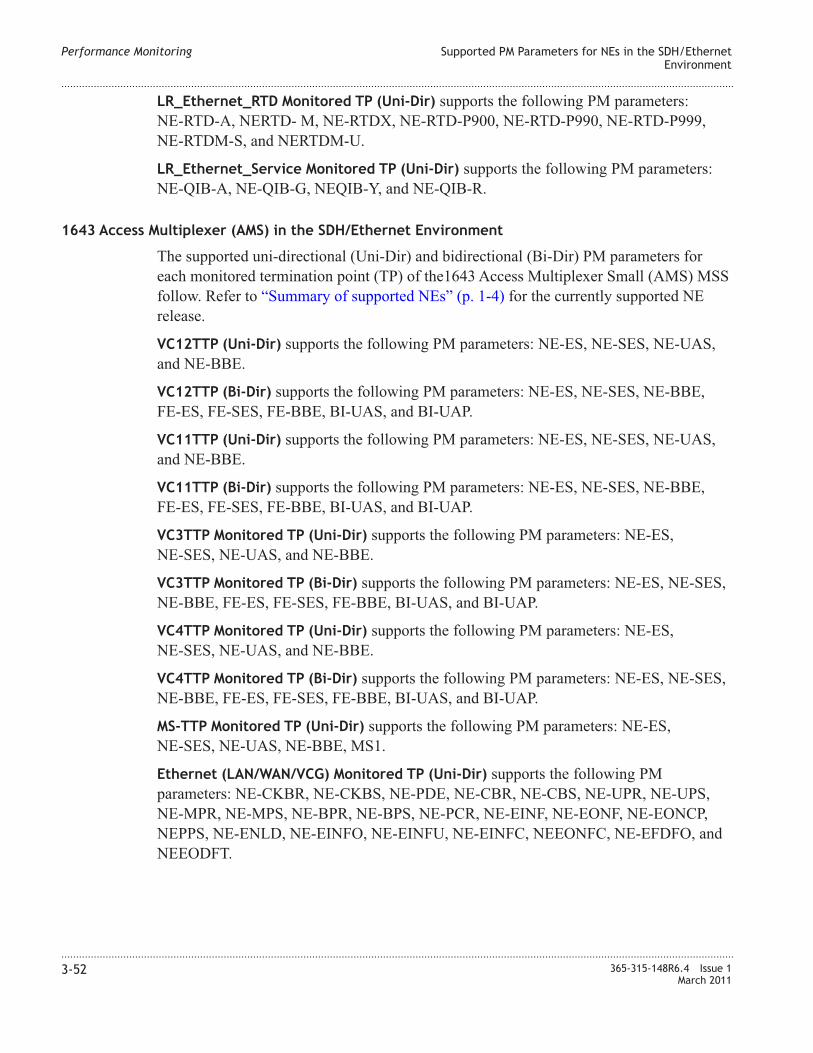
LR_Ethernet_RTD Monitored TP (Uni-Dir) supports the following PM parameters:
NE-RTD-A, NERTD- M, NE-RTDX, NE-RTD-P900, NE-RTD-P990, NE-RTD-P999,
NE-RTDM-S, and NERTDM-U.
LR_Ethernet_Service Monitored TP (Uni-Dir) supports the following PM parameters:
NE-QIB-A, NE-QIB-G, NEQIB-Y, and NE-QIB-R.
1643 Access Multiplexer (AMS) in the SDH/Ethernet Environment
The supported uni-directional (Uni-Dir) and bidirectional (Bi-Dir) PM parameters for
each monitored termination point (TP) of the1643 Access Multiplexer Small (AMS) MSS
follow. Refer to “Summary of supported NEs” (p. 1-4) for the currently supported NE
release.
VC12TTP (Uni-Dir) supports the following PM parameters: NE-ES, NE-SES, NE-UAS,
and NE-BBE.
VC12TTP (Bi-Dir) supports the following PM parameters: NE-ES, NE-SES, NE-BBE,
FE-ES, FE-SES, FE-BBE, BI-UAS, and BI-UAP.
VC11TTP (Uni-Dir) supports the following PM parameters: NE-ES, NE-SES, NE-UAS,
and NE-BBE.
VC11TTP (Bi-Dir) supports the following PM parameters: NE-ES, NE-SES, NE-BBE,
FE-ES, FE-SES, FE-BBE, BI-UAS, and BI-UAP.
VC3TTP Monitored TP (Uni-Dir) supports the following PM parameters: NE-ES,
NE-SES, NE-UAS, and NE-BBE.
VC3TTP Monitored TP (Bi-Dir) supports the following PM parameters: NE-ES, NE-SES,
NE-BBE, FE-ES, FE-SES, FE-BBE, BI-UAS, and BI-UAP.
VC4TTP Monitored TP (Uni-Dir) supports the following PM parameters: NE-ES,
NE-SES, NE-UAS, and NE-BBE.
VC4TTP Monitored TP (Bi-Dir) supports the following PM parameters: NE-ES, NE-SES,
NE-BBE, FE-ES, FE-SES, FE-BBE, BI-UAS, and BI-UAP.
MS-TTP Monitored TP (Uni-Dir) supports the following PM parameters: NE-ES,
NE-SES, NE-UAS, NE-BBE, MS1.
Ethernet (LAN/WAN/VCG) Monitored TP (Uni-Dir) supports the following PM
parameters: NE-CKBR, NE-CKBS, NE-PDE, NE-CBR, NE-CBS, NE-UPR, NE-UPS,
NE-MPR, NE-MPS, NE-BPR, NE-BPS, NE-PCR, NE-EINF, NE-EONF, NE-EONCP,
NEPPS, NE-ENLD, NE-EINFO, NE-EINFU, NE-EINFC, NEEONFC, NE-EFDFO, and
NEEODFT.
Performance Monitoring Supported PM Parameters for NEs in the SDH/Ethernet
Environment
....................................................................................................................................................................................................................................
....................................................................................................................................................................................................................................
3-52 365-315-148R6.4 Issue 1
March 2011
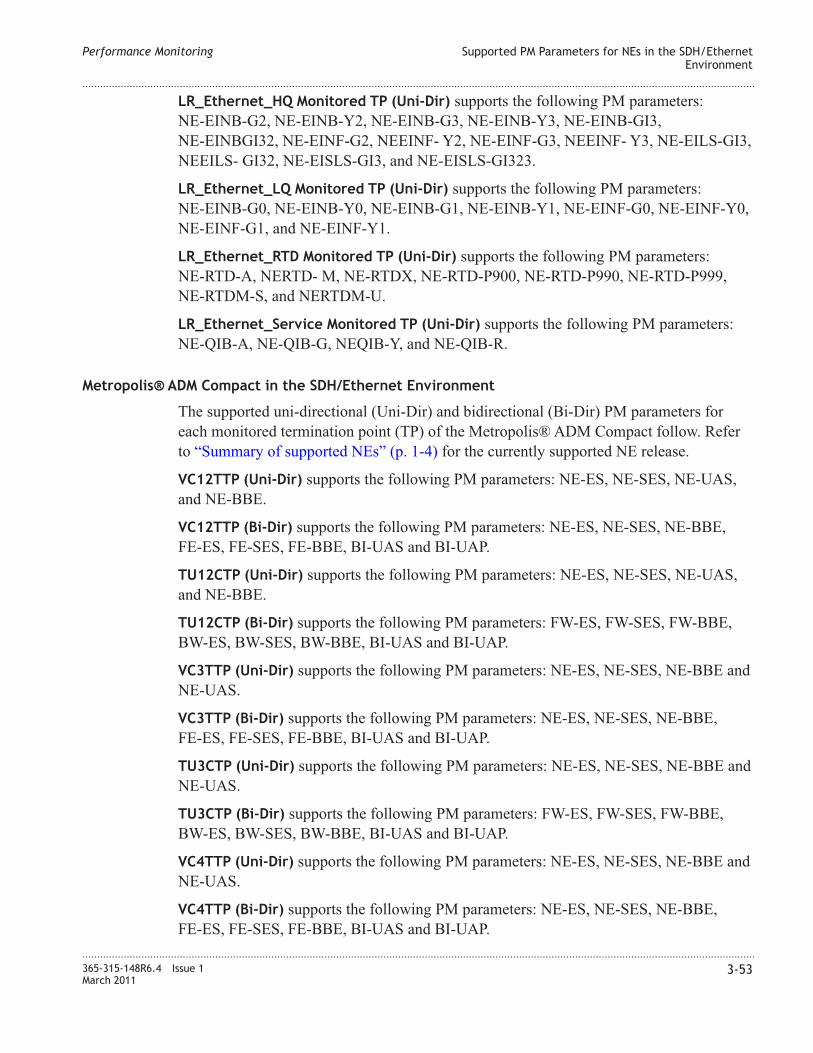
LR_Ethernet_HQ Monitored TP (Uni-Dir) supports the following PM parameters:
NE-EINB-G2, NE-EINB-Y2, NE-EINB-G3, NE-EINB-Y3, NE-EINB-GI3,
NE-EINBGI32, NE-EINF-G2, NEEINF- Y2, NE-EINF-G3, NEEINF- Y3, NE-EILS-GI3,
NEEILS- GI32, NE-EISLS-GI3, and NE-EISLS-GI323.
LR_Ethernet_LQ Monitored TP (Uni-Dir) supports the following PM parameters:
NE-EINB-G0, NE-EINB-Y0, NE-EINB-G1, NE-EINB-Y1, NE-EINF-G0, NE-EINF-Y0,
NE-EINF-G1, and NE-EINF-Y1.
LR_Ethernet_RTD Monitored TP (Uni-Dir) supports the following PM parameters:
NE-RTD-A, NERTD- M, NE-RTDX, NE-RTD-P900, NE-RTD-P990, NE-RTD-P999,
NE-RTDM-S, and NERTDM-U.
LR_Ethernet_Service Monitored TP (Uni-Dir) supports the following PM parameters:
NE-QIB-A, NE-QIB-G, NEQIB-Y, and NE-QIB-R.
Metropolis® ADM Compact in the SDH/Ethernet Environment
The supported uni-directional (Uni-Dir) and bidirectional (Bi-Dir) PM parameters for
each monitored termination point (TP) of the Metropolis® ADM Compact follow. Refer
to “Summary of supported NEs” (p. 1-4) for the currently supported NE release.
VC12TTP (Uni-Dir) supports the following PM parameters: NE-ES, NE-SES, NE-UAS,
and NE-BBE.
VC12TTP (Bi-Dir) supports the following PM parameters: NE-ES, NE-SES, NE-BBE,
FE-ES, FE-SES, FE-BBE, BI-UAS and BI-UAP.
TU12CTP (Uni-Dir) supports the following PM parameters: NE-ES, NE-SES, NE-UAS,
and NE-BBE.
TU12CTP (Bi-Dir) supports the following PM parameters: FW-ES, FW-SES, FW-BBE,
BW-ES, BW-SES, BW-BBE, BI-UAS and BI-UAP.
VC3TTP (Uni-Dir) supports the following PM parameters: NE-ES, NE-SES, NE-BBE and
NE-UAS.
VC3TTP (Bi-Dir) supports the following PM parameters: NE-ES, NE-SES, NE-BBE,
FE-ES, FE-SES, FE-BBE, BI-UAS and BI-UAP.
TU3CTP (Uni-Dir) supports the following PM parameters: NE-ES, NE-SES, NE-BBE and
NE-UAS.
TU3CTP (Bi-Dir) supports the following PM parameters: FW-ES, FW-SES, FW-BBE,
BW-ES, BW-SES, BW-BBE, BI-UAS and BI-UAP.
VC4TTP (Uni-Dir) supports the following PM parameters: NE-ES, NE-SES, NE-BBE and
NE-UAS.
VC4TTP (Bi-Dir) supports the following PM parameters: NE-ES, NE-SES, NE-BBE,
FE-ES, FE-SES, FE-BBE, BI-UAS and BI-UAP.
Performance Monitoring Supported PM Parameters for NEs in the SDH/Ethernet
Environment
....................................................................................................................................................................................................................................
....................................................................................................................................................................................................................................
365-315-148R6.4 Issue 1
March 2011
3-53
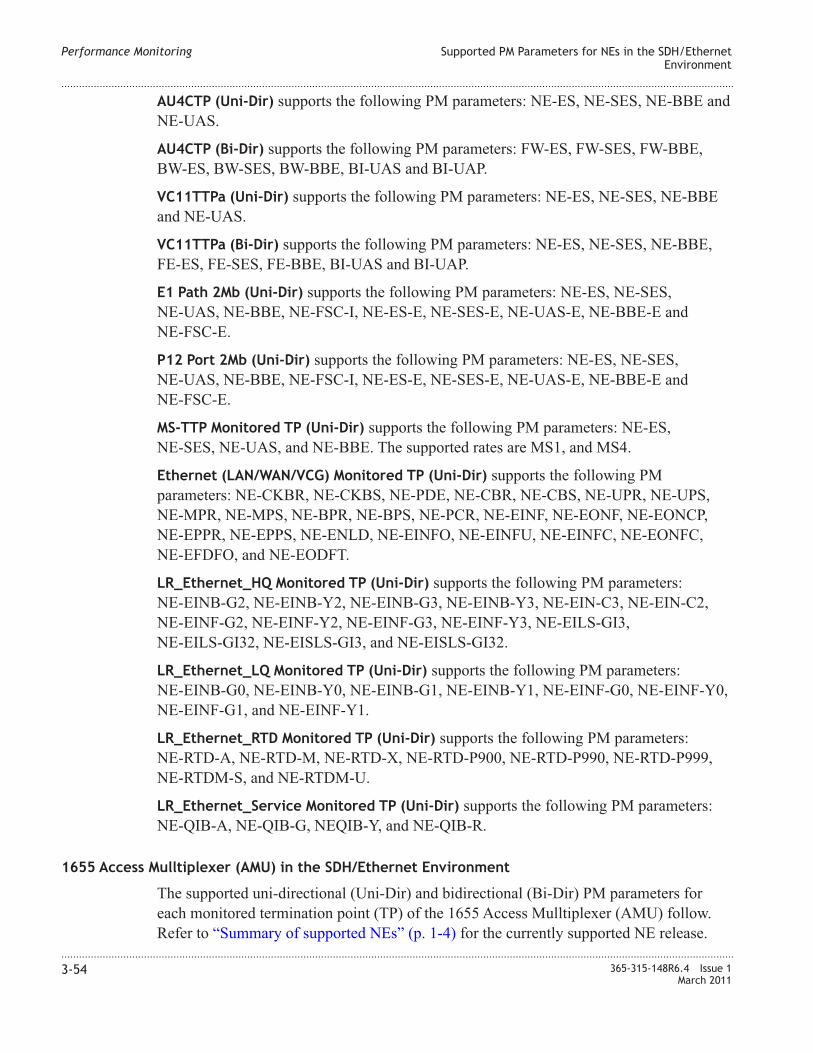
AU4CTP (Uni-Dir) supports the following PM parameters: NE-ES, NE-SES, NE-BBE and
NE-UAS.
AU4CTP (Bi-Dir) supports the following PM parameters: FW-ES, FW-SES, FW-BBE,
BW-ES, BW-SES, BW-BBE, BI-UAS and BI-UAP.
VC11TTPa (Uni-Dir) supports the following PM parameters: NE-ES, NE-SES, NE-BBE
and NE-UAS.
VC11TTPa (Bi-Dir) supports the following PM parameters: NE-ES, NE-SES, NE-BBE,
FE-ES, FE-SES, FE-BBE, BI-UAS and BI-UAP.
E1 Path 2Mb (Uni-Dir) supports the following PM parameters: NE-ES, NE-SES,
NE-UAS, NE-BBE, NE-FSC-I, NE-ES-E, NE-SES-E, NE-UAS-E, NE-BBE-E and
NE-FSC-E.
P12 Port 2Mb (Uni-Dir) supports the following PM parameters: NE-ES, NE-SES,
NE-UAS, NE-BBE, NE-FSC-I, NE-ES-E, NE-SES-E, NE-UAS-E, NE-BBE-E and
NE-FSC-E.
MS-TTP Monitored TP (Uni-Dir) supports the following PM parameters: NE-ES,
NE-SES, NE-UAS, and NE-BBE. The supported rates are MS1, and MS4.
Ethernet (LAN/WAN/VCG) Monitored TP (Uni-Dir) supports the following PM
parameters: NE-CKBR, NE-CKBS, NE-PDE, NE-CBR, NE-CBS, NE-UPR, NE-UPS,
NE-MPR, NE-MPS, NE-BPR, NE-BPS, NE-PCR, NE-EINF, NE-EONF, NE-EONCP,
NE-EPPR, NE-EPPS, NE-ENLD, NE-EINFO, NE-EINFU, NE-EINFC, NE-EONFC,
NE-EFDFO, and NE-EODFT.
LR_Ethernet_HQ Monitored TP (Uni-Dir) supports the following PM parameters:
NE-EINB-G2, NE-EINB-Y2, NE-EINB-G3, NE-EINB-Y3, NE-EIN-C3, NE-EIN-C2,
NE-EINF-G2, NE-EINF-Y2, NE-EINF-G3, NE-EINF-Y3, NE-EILS-GI3,
NE-EILS-GI32, NE-EISLS-GI3, and NE-EISLS-GI32.
LR_Ethernet_LQ Monitored TP (Uni-Dir) supports the following PM parameters:
NE-EINB-G0, NE-EINB-Y0, NE-EINB-G1, NE-EINB-Y1, NE-EINF-G0, NE-EINF-Y0,
NE-EINF-G1, and NE-EINF-Y1.
LR_Ethernet_RTD Monitored TP (Uni-Dir) supports the following PM parameters:
NE-RTD-A, NE-RTD-M, NE-RTD-X, NE-RTD-P900, NE-RTD-P990, NE-RTD-P999,
NE-RTDM-S, and NE-RTDM-U.
LR_Ethernet_Service Monitored TP (Uni-Dir) supports the following PM parameters:
NE-QIB-A, NE-QIB-G, NEQIB-Y, and NE-QIB-R.
1655 Access Mulltiplexer (AMU) in the SDH/Ethernet Environment
The supported uni-directional (Uni-Dir) and bidirectional (Bi-Dir) PM parameters for
each monitored termination point (TP) of the 1655 Access Mulltiplexer (AMU) follow.
Refer to “Summary of supported NEs” (p. 1-4) for the currently supported NE release.
Performance Monitoring Supported PM Parameters for NEs in the SDH/Ethernet
Environment
....................................................................................................................................................................................................................................
....................................................................................................................................................................................................................................
3-54 365-315-148R6.4 Issue 1
March 2011
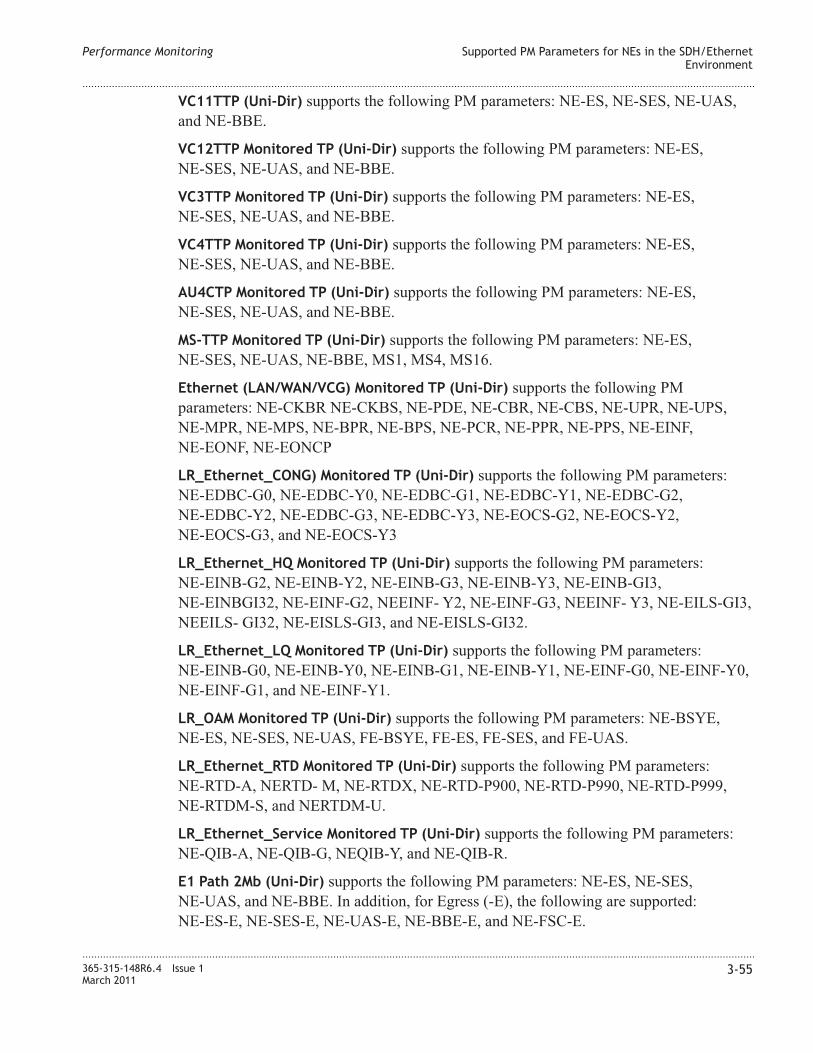
VC11TTP (Uni-Dir) supports the following PM parameters: NE-ES, NE-SES, NE-UAS,
and NE-BBE.
VC12TTP Monitored TP (Uni-Dir) supports the following PM parameters: NE-ES,
NE-SES, NE-UAS, and NE-BBE.
VC3TTP Monitored TP (Uni-Dir) supports the following PM parameters: NE-ES,
NE-SES, NE-UAS, and NE-BBE.
VC4TTP Monitored TP (Uni-Dir) supports the following PM parameters: NE-ES,
NE-SES, NE-UAS, and NE-BBE.
AU4CTP Monitored TP (Uni-Dir) supports the following PM parameters: NE-ES,
NE-SES, NE-UAS, and NE-BBE.
MS-TTP Monitored TP (Uni-Dir) supports the following PM parameters: NE-ES,
NE-SES, NE-UAS, NE-BBE, MS1, MS4, MS16.
Ethernet (LAN/WAN/VCG) Monitored TP (Uni-Dir) supports the following PM
parameters: NE-CKBR NE-CKBS, NE-PDE, NE-CBR, NE-CBS, NE-UPR, NE-UPS,
NE-MPR, NE-MPS, NE-BPR, NE-BPS, NE-PCR, NE-PPR, NE-PPS, NE-EINF,
NE-EONF, NE-EONCP
LR_Ethernet_CONG) Monitored TP (Uni-Dir) supports the following PM parameters:
NE-EDBC-G0, NE-EDBC-Y0, NE-EDBC-G1, NE-EDBC-Y1, NE-EDBC-G2,
NE-EDBC-Y2, NE-EDBC-G3, NE-EDBC-Y3, NE-EOCS-G2, NE-EOCS-Y2,
NE-EOCS-G3, and NE-EOCS-Y3
LR_Ethernet_HQ Monitored TP (Uni-Dir) supports the following PM parameters:
NE-EINB-G2, NE-EINB-Y2, NE-EINB-G3, NE-EINB-Y3, NE-EINB-GI3,
NE-EINBGI32, NE-EINF-G2, NEEINF- Y2, NE-EINF-G3, NEEINF- Y3, NE-EILS-GI3,
NEEILS- GI32, NE-EISLS-GI3, and NE-EISLS-GI32.
LR_Ethernet_LQ Monitored TP (Uni-Dir) supports the following PM parameters:
NE-EINB-G0, NE-EINB-Y0, NE-EINB-G1, NE-EINB-Y1, NE-EINF-G0, NE-EINF-Y0,
NE-EINF-G1, and NE-EINF-Y1.
LR_OAM Monitored TP (Uni-Dir) supports the following PM parameters: NE-BSYE,
NE-ES, NE-SES, NE-UAS, FE-BSYE, FE-ES, FE-SES, and FE-UAS.
LR_Ethernet_RTD Monitored TP (Uni-Dir) supports the following PM parameters:
NE-RTD-A, NERTD- M, NE-RTDX, NE-RTD-P900, NE-RTD-P990, NE-RTD-P999,
NE-RTDM-S, and NERTDM-U.
LR_Ethernet_Service Monitored TP (Uni-Dir) supports the following PM parameters:
NE-QIB-A, NE-QIB-G, NEQIB-Y, and NE-QIB-R.
E1 Path 2Mb (Uni-Dir) supports the following PM parameters: NE-ES, NE-SES,
NE-UAS, and NE-BBE. In addition, for Egress (-E), the following are supported:
NE-ES-E, NE-SES-E, NE-UAS-E, NE-BBE-E, and NE-FSC-E.
Performance Monitoring Supported PM Parameters for NEs in the SDH/Ethernet
Environment
....................................................................................................................................................................................................................................
....................................................................................................................................................................................................................................
365-315-148R6.4 Issue 1
March 2011
3-55
Supported PM Parameters for NEs in the SONET/Ethernet
Environment
1675 Lambda Unite MultiService Switch (MSS) in the SONET/Ethernet Environment
The supported uni-directional (Uni-Dir) PM parameters for each monitored termination
point (TP) of the 1675 Lambda Unite MultiService Switch (MSS) follow. Refer to
“Summary of supported NEs” (p. 1-4) for the currently supported NE release.
Section (RSTTP) Monitored TP (Uni-Dir) supports the following PM parameters:
NE-LOSS, NE-SEFS, NE-CV, NE-ES, and NE-SES. The supported rates are OC-768,
OC-192, OC-48, OC-12, and OC-3.
Line (MSTTP) Monitored TP (Uni-Dir) supports the following PM parameters: NE-CV,
NE-ES, NE-SES, NE-UAS, NE-FC, NE-AISS, NE-FECC (OC-192 only), FE-CV,
FE-ES, FE-SES, FE-UAS, and FE-FC. The supported rates are OC-192, OC-48, OC-12,
and OC-3.
STS Path Monitored TP (Uni-Dir) supports the following PM parameters: NE-CV,
NE-ES, NE-SES, NE-UAS, NE-FC, FE-CV, FE-ES, FE-SES, FE-UAS, and FE-FC. The
supported rates are STS-1, STS-3c, STS-12c, STS-192c, and STS-48c.
VT1.5 Path Monitored TP (Uni-Dir) supports the following PM parameters: NE-CV,
NE-ES, NE-SES, NE-UAS, NE-FC, FE-CV, FE-ES, FE-SES, FE-UAS, FE-FC,
NE-NPDE, NE-PPDE, NE-NPGE, NE-PPGE for R6.1 only.
DS1 Path Monitored TP (Uni-Dir) supports the following for TMUX Card, Egress (-E):
NE-CV-E, NE-ES-E, NE-SES-E, NE-UAS-E, NE-AISS-E, NE-SAS-E.
DS3 Line (T3) Monitored TP (Uni-Dir) supports the following PM parameters:
NE-LOSS, NE-CV, NE-ES, NE-ESA, NE-ESB, and NE-SES.
DS3 Path Monitored TP (Uni-Dir) supports the following PM parameters: NE-CV,
NE-ES, NE-ESA, NE-ESB, NE-SES, NE-SEFS, NE-SAS, NE-UAS, NE-FC, NE-AISS,
FE-CV, FE-ES, FE-ESA, FE-ESB, FE-SES, FE-SAS, FE-UAS, and FE-FC. In addition,
for Egress (-E), the following are supported: NE-CV-E, NE-ES-E, NE-ESA-E,
NE-ESB-E, NE-SES-E, NE-SEFS-E, NE-SAS-E, NE-UAS-E, NE-FC-E, NE-AISS-E,
FE-CV-E, FE-ES-E, FE-ESA-E, FE-ESB-E, FE-SES-E, FE-SAS-E, FE-UAS-E, and
FE-FC-E.
Data (LAN/WAN) supports the following PM parameters: NE-CBR, NE-CBS and
NE-PDE.
Ethernet (LAN/WAN) Monitored TP (Uni-Dir) supports the following PM parameters:
CBR, CBS, and PDE.
Performance Monitoring Supported PM Parameters for NEs in the SONET/Ethernet
Environment
....................................................................................................................................................................................................................................
....................................................................................................................................................................................................................................
3-56 365-315-148R6.4 Issue 1
March 2011
1665 DMX Access Multiplexer in the SONET/Ethernet Environment
The supported uni-directional (Uni-Dir) PM parameters for each monitored termination
point (TP) of the 1665 DMX Access Multiplexer follow. Refer to “Summary of supported
NEs” (p. 1-4) for the currently supported NE release.
Section (RSTTP) Monitored TP (Uni-Dir) supports the following PM parameters:
NE-SEFS, NE-CV, NE-ES, and NE-SES. The supported rates are OC-192, OC-48,
OC-12, and OC-3.
Line (MSTTP) Monitored TP (Uni-Dir) supports the following PM parameters: NE-CV,
NE-ES, NE-SES, NE-UAS, NE-FC, NE-PJCDIFF-P, NE-NPDE, NE-PPDE, NE-NPGE,
NE-PPGE, NE-PSC, NE-PSC-W, NE-PSC-P, NE-PSD, FE-CV, FE-ES, FE-SES,
FE-UAS, and FE-FC. The supported rates are OC-192, OC-48, OC-12, and OC-3. In
addition for LNW705, the following are supported: NE:CVS, NE:ESS, NE:SESS,
NE:SEFSS and the supported rates are: OC-48, OC12 and OC3.
STS Path Monitored TP (Uni-Dir) supports the following PM parameters: NE-CV,
NE-ES, NE-SES, NE-UAS, NE-FC, FE-CV, FE-ES, FE-SES, FE-UAS, and FE-FC. The
supported rates are STS-1, STS-3c, STS-12c, and STS-48c.
VT1.5 Path Monitored TP (Uni-Dir) supports the following PM parameters: NE-CV,
NE-ES, NE-SES, NE-UAS, NE-FC, FE-CV, FE-ES, FE-SES, FE-UAS, and FE-FC.
VC12 Path (Uni-Dir) supports the following PM parameters: NE-BBE, NE-ES, NE-SES,
NE-UAS, NE-FC, FE-BBE, FE-ES, FE-SES, FE-UAS, and FE-FC.
DS1 Line (T1) Monitored TP (Uni-Dir) supports the following PM parameters: NE-CV,
NE-ES, NE-SES, and FE-ES.
DS1 Path Monitored TP (Uni-Dir) supports the following PM parameters: NE-CV,
NE-ES, NE-SES, NE-UAS, NE-SAS, FE-CV, FE-ES, FE-SES, FE-UAS, and FE-SAS.
DS3 Line (T3) Monitored TP (Uni-Dir) supports the following PM parameters: NE-CV,
NE-ES, and NE-SES.
DS3 Path Monitored TP (Uni-Dir) supports the following PM parameters: NE-CV,
NE-ES, NE-SES, NE-SAS (renamed from OOF), NE-UAS, FE-CV, FE-ES, FE-SES,
FE-SAS, and FE-UAS.
E1 Line Monitored TP (Uni-Dir) supports the following PM parameters: NE-ES, and
NE-SES.
E1 Path Monitored TP (Uni-Dir) supports the following PM parameters: NE-BBE,
NE-ES, NE-SES, NE-UAS, FE-BBE, FE-ES, FE-SES, and FE-UAS.
EC-1 Line supports the following PM parameters: NE-CV, NE-ES, NE-SES, NE-UAS,
NE-FC, NE-PJCDIFF-P, NE-NPDE, NE-PPDE, NE-NPGE, NE-PPGE, FE-CV, FE-ES,
FE-SES, FE-UAS, and FE-FC.
Performance Monitoring Supported PM Parameters for NEs in the SONET/Ethernet
Environment
....................................................................................................................................................................................................................................
....................................................................................................................................................................................................................................
365-315-148R6.4 Issue 1
March 2011
3-57
Optical Transmission Section (OTS) Monitored TP (Uni-Dir) supports the following PM
parameters: NE-TOPRH, NE-TOPRL, and NE-TOPRSH.
Optical Channel (OCH) Monitored TP (Uni-Dir) supports the following PM parameters:
NE-OPT, NE-OPTH, and NE-OPTL.
Optical Channel Transport Unit (OTU2) Monitored TP (Uni-Dir) supports the following
PM parameters: NE-OPR, NE-OPRH, NE-OPRL, NE-OPT, NE-OPTH, NE-OPTL,
BBE-OTU, ES-OTU, FECC, SES-OTU, and UAS-OTU.
Optical Channel Data Unit (ODU2) Monitored TP (Uni-Dir) supports the following PM
parameters: BBE-ODU, ES-ODU, SES-ODU, and UAS-ODU.
Ethernet LNW70 (VCG/Data) Monitored TP (Uni-Dir)NE-EONF, NE-EINF, NE-EDFE,
NE-EINB, NE-EONB, NE-EDFC, NE-EDFCG, NE-EDFCY, NE-EINDB, NE-EINDP,
NE-EINFU, NE-EINFM, NE-EINFB, NE-EONFU, NE-EONFM, NE-EONFB,
NE-EINCP, NE-EOCP, NE-EDFL, NE-BPDUI, NE-BPDUO, NE-BPDUD,
NE-STPROOT, NE-STPSTATE, NE-STPROOT, and NE-BPDUT.
Ethernet LNW70 (LAG) Monitored TP (Uni-Dir) NE-EINDB and NE-EDFL.
Ethernet LNW73 (VCG) Monitored TP (Uni-Dir) NE-RCORH, NE-RCRCH, and
NE-RCORF.
Ethernet LNW73 (Data) Monitored TP (Uni-Dir) NE-INTXWD, NE-LOS, NE-LSYNC,
NE-DSPERR, NE-RFOVD, NE-TFOVD, NE-TFCRC, and NE-T10BERR.
Ethernet LNW73C (VCG) Monitored TP (Uni-Dir) NE-RCORH, NE-RCRCH, and
NE-RCORF.
Ethernet LNW73C (Data) Monitored TP (Uni-Dir) NE-INTXWD, NE-LOS,
NE-LSYNC, NE-DSPERR, NE-RFOVD, NE-TFOVD, NE-TFCRC, NE-T10BERR,
NE-EONB, NE-EINBC, NE-EONBC, NE-EBBCZCS, and NE-EIBFCS.
Ethernet LNW66 (VCG) Monitored TP (Uni-Dir) NE-EDFC, NE-EDFE, NE-EDFP,
NE-EINB, NE-EINF, NE-EONB, and NE-EONF.
Ethernet LNW66 (Data) Monitored TP (Uni-Dir) NE-EDFC, NE-EDFE, NE-EINB,
NE-EINF, NE-EONB, and NE-EONF.
Ethernet LNW67 (VCG) Monitored TP (Uni-Dir) NE-EDFC, NE-EDFE, NE-EDFP,
NE-EINB, NE-EINF, NE-EONB, and NE-EONF.
Ethernet LNW67 (Data) Monitored TP (Uni-Dir) NE-EDFC, NE-EDFE, NE-EINB,
NE-EINF, NE-EONB, and NE-EONF.
Ethernet LNW68 (VCG) Monitored TP (Uni-Dir) NE-EDFC, NE-EDFE, NE-EDFP,
NE-EINB, NE-EINF, NE-EONB, and NE-EONF.
Ethernet LNW68 (Data) Monitored TP (Uni-Dir) NE-EDFC, NE-EDFE, NE-EINB,
NE-EINF, NE-EONB, and NE-EONF.
Performance Monitoring Supported PM Parameters for NEs in the SONET/Ethernet
Environment
....................................................................................................................................................................................................................................
....................................................................................................................................................................................................................................
3-58 365-315-148R6.4 Issue 1
March 2011
Ethernet LNW74 (VCG/Data) Monitored TP (Uni-Dir) NE-EDFE, NE-EINB, NE-EINF,
NE-EONB, and NE-EONF.
Ethernet LNW63 (VCG) Monitored TP (Uni-Dir) NE-EDFC, NE-EDFE, NE-EDFP,
NE-EINB, NE-EINF, NE-EONB, NE-EONF, NE-EINDP, NE-EINFU, NE-EINFM,
NE-EINFB, NE-EONFU, NE-EONFM, NE-EONFB, NE-EFCRC, and NE-GFPFCS.
Ethernet LNW63 (Data) Monitored TP (Uni-Dir) NE-EDFC, NE-EDFE, NE-EDFP,
NE-EINB, NE-EINF, NE-EONB, NE-EONF, NE-EINDP, NE-EINFU, NE-EINFM,
NE-EINFB, NE-EONFU, NE-EONFM, NE-EONFB, and NE-EFCRC.
Ethernet LNW78 (LAN) Monitored TP (Uni-Dir) NE-IUCAF, NE-IUCAO, NE-IUCBF,
NE-IUCBO, NE-IUCBEF, NE-IUCBEO, NE-IUCCF, NE-IUCCO, NE-IMCAF,
NE-IMCAO, NE-IMCBF, NE-IMCBO, NE-IMCBEF, NE-IMCBEO, NE-IMCCF,
NE-IMCCO, NE-OUCAF, NE-OUCAO, NE-OUCBF, NE-OUCBO, NE-OUCBEF,
NE-OUCBEO, NE-OUCCF, NE-OUCCO, NE-OMCAF, NE-OMCAO, NE-OMCBF,
NE-OMCBO, NE-OMCBEF, NE-OMCBEO, NE-OMCCF, NE-OMCCO, NE-DRATEF,
NE-DTAGF, NE-DSPIF, NE-DSIZEF, NE-DNOTAGF, NE-DSMACF, NE-DSMACO,
NE-DFCG, NE-DFCY, NE-IUCAREDF, NE-IUCAREDO, NE-IUCBREDF,
NE-IUCBREDO, NE-IUCCREDF, NE-IUCCREDO, NE-IMCAREDF, NE-IMCAREDO,
NE-IMCBREDF, NE-IMCBREDO, NE-IMCCREDF, and NE-IMCCREDO.
Ethernet LNW78 (Even VCG Ports) Monitored TP (Uni-Dir) NE-ICTRF_SP,
NE-IECHOF_SP, NE-IFLSHF_SP, NE-IORGF_SP, NE-IATDF_SP, NE-ICRCF_SP,
NE-ITPF_SP, NE-OCTRLF_SP, NE-OECHOF_SP, NE-OFLSHF_SP, NE-OORGF_SP,
NE-OATDF_SP, NE-OCRCF_SP, NE-OTPF_SP, NE-ITTLF_SP, NE-DLONG_SP,
NE-DHEC_SP, NE-DSS_SP, NE-DSA_SP, NE-DPTY_SP, NE-DSCFF_SP,
NE-DFCG_SP, NE-DFCY_SP, NE-IUCAF_SP, NE-IUCAO_SP, NE-IUCBF_SP,
NE-IUCBO_SP, NE-IUCBEF_SP, NE-IUCBEO_SP, NE-IUCCF_SP, NE-IUCCO_SP,
NE-IMCAF_SP, NE-IMCAO_SP, NE-IMCBF_SP, NE-IMCBO_SP, NE-IMCBEF_SP,
NE-IMCBEO_SP, NE-IMCCF_SP, NE-IMCCO_SP, NE-OUCAF_SP, NE-OUCAO_SP,
NE-OUCBF_SP, NE-OUCBO_SP, NE-OUCBEF_SP, NE-OUCBEO_SP,
NE-OUCCF_SP, NE-OUCCO_SP, NE-OMCAF_SP, NE-OMCAO_SP, NE-OMCBF_SP,
NE-OMCBO_SP, NE-OMCBEF_SP, NE-OMCBEO_SP, NE-OMCCF_SP, and
NE-OMCCO_SP.
Ethernet LNW78 (Odd VCG Ports) Monitored TP (Uni-Dir) NE-IUCAF_IF,
NE-IUCAO_IF, NE-IUCBF_IF, NE-IUCBO_IF, NE-IUCBEF_IF, NE-IUCBEO_IF,
NE-IUCCF_IF, NE-IUCCO_IF, NE-IMCAF_IF, NE-IMCAO_IF, NE-IMCBF_IF,
NE-IMCBO_IF, NE-IMCBEF_IF, NE-IMCBEO_IF, NE-IMCCF_IF, NE-IMCCO_IF,
NE-OUCAF_IF, NE-OUCAO_IF, NE-OUCBF_IF, NE-OUCBO_IF, NE-OUCBEF_IF,
NE-OUCBEO_IF, NE-OUCCF_IF, NE-OUCCO_IF, NE-OMCAF_IF, NE-OMCAO_IF,
NE-OMCBF_IF, NE-OMCBO_IF, NE-OMCBEF_IF, NE-OMCBEO_IF,
Performance Monitoring Supported PM Parameters for NEs in the SONET/Ethernet
Environment
....................................................................................................................................................................................................................................
....................................................................................................................................................................................................................................
365-315-148R6.4 Issue 1
March 2011
3-59
NE-OMCCF_IF, NE-OMCCO_IF, NE-ICPUF_IF, NE-DRATEF_IF, NE-DTAGF_IF,
NE-DSPIF_IF, NE-DSIZEF_IF, NE-DNOTAGF_IF, NE-DSMACF_IF,
NE-DSMACO_IF, NE-DDMACF_IF, NE-DDMACO_IF, and NE-OCPUF_IF.
Ethernet LNW64 (VCG) Monitored TP (Uni-Dir) NE-EDFC, NE-EDFE, NE-GFPFCS,
NE-EINB, NE-EINF, NE-EONB, and NE-EONF.
Ethernet LNW64 (Data) Monitored TP (Uni-Dir) NE-EDFC, NE-EDFE, NE-EFCRC,
NE-EINB, NE-EINF, NE-EONB, NE-EONF, NE-EINDP, NE-EINFU, NE-EINFM,
NE-EINFB, NE-EONFU, NE-EONFM, and NE-EONFB.
Ethernet LNW170 (LAN/WAN) Monitored TP (Uni-Dir) supports the following PM
parameters: NE-QIB-G, NE-QIP-G, NE-QIB-Y, NE-QIP-Y, NE-QIB-R, NE-QIP-R,
NE-QOB-0, NE-QOB-1, NE-QOB-T, NE-QOP-T, NE-QPD-A, NE-QPD-V, and
NE-QPD-L.
Ethernet LNW170 (VCG/Data) Monitored TP (Uni-Dir) supports the following PM
parameters: NE-EONF, NE-EINF, NE-EDFE, NE-EINB, NE-EONB, NE-EDFC,
NE-EDFCG, NE-EDFCY, NE-EINDB, NE-EINDP, NE-EINFU, NE-EINFM,
NE-EINFB, NE-EONFU, NE-EONFM, NE-EONFB, NE-EINCP, NE-EOCP, NE-EDFL,
NE-BPDUI, NE-BPDUO, NE-BPDUD, NE-STPROOT, NE-STPSTATE, NE-STPROOT,
and NE-BPDUT.
Ethernet LNW170 (LAG) Monitored TP (Uni-Dir) supports the following PM parameters:
NE-EINDB, and NE-EDFL.
Ethernet LNW705 (VCG) Monitored TP (Uni-Dir) supports the following PM parameters:
NE-RCORH, NE-RCRCH, NE-RCORF, NE-EDFE, and NE-GFPFCS.
Ethernet LNW705 (Data) Monitored TP (Uni-Dir) supports the following PM
parameters: NE-INTXWD, NE-LOS, NE-LSYNC, NE-DSPERR, NE-RFOVD,
NE-TFOVD, NE-TFCRC, NE-T10BERR, NE-EDFE, NE-EINB, NE-EONB, NE-EINDP,
NE-EINFU, NE-EINFM, NE-EINFB, NE-EONFU, NE-EONFM, NE-EONFB,
NE-EFCRC, and NE-EDFC.
1665 DMXtend Access Multiplexer in the SONET/Ethernet Environment
The supported uni-directional (Uni-Dir) PM parameters for each monitored termination
point (TP) of the 1665 DMXtend Access Multiplexer) follow. Refer to “Summary of
supported NEs” (p. 1-4) for the currently supported NE release.
Section (RSTTP) Monitored TP (Uni-Dir) supports the following PM parameters:
NE-SEFS, NE-CV, NE-ES, and NE-SES. The supported rates are OC-48, OC-12, and
OC-3.
Line (MSTTP) Monitored TP (Uni-Dir) supports the following PM parameters: NE-CV,
NE-ES, NE-SES, NE-UAS, NE-FC, NE-PJCDIFF-P, NE-NPDE, NE-PPDE, NE-NPGE,
NE-PPGE, NE-PSC, FE-CV, FE-ES, FE-SES, FE-UAS, and FE-FC. The supported rates
Performance Monitoring Supported PM Parameters for NEs in the SONET/Ethernet
Environment
....................................................................................................................................................................................................................................
....................................................................................................................................................................................................................................
3-60 365-315-148R6.4 Issue 1
March 2011

are OC-48, OC-12, OC-192 and OC-3. In addition for LNW705, the following are
supported: NE-SEFS, NE-CVS, NE-ESS, NE-SESS, NE-SEFSS and the supported rates
are: OC-48, OC12 and OC3.
STS Path Monitored TP (Uni-Dir) supports the following PM parameters: NE-CV,
NE-ES, NE-SES, NE-UAS, NE-FC, FE-CV, FE-ES, FE-SES, FE-UAS, and FE-FC. The
supported rates are STS-1, STS-3c, STS-12c, and STS-48c.
VT1.5 Path Monitored TP (Uni-Dir) supports the following PM parameters: NE-CV,
NE-ES, NE-SES, NE-UAS, NE-FC, FE-CV, FE-ES, FE-SES, FE-UAS, and FE-FC.
VC12 Path (Uni-Dir) supports the following PM parameters: NE-BBE, NE-ES, NE-SES,
NE-UAS, NE-FC, FE-BBE, FE-ES, FE-SES, FE-UAS, and FE-FC.
DS1 Line (T1) Monitored TP (Uni-Dir)supports the following PM parameters: NE-CV,
NE-ES, NE-SES, and FE-ES.
DS1 Path Monitored TP (Uni-Dir) supports the following PM parameters: NE-CV,
NE-ES, NE-SES, NE-UAS, NE-SAS, FE-CV, FE-ES, FE-SES, FE-UAS, and FE-SAS.
DS3 Line (T3) Monitored TP (Uni-Dir) supports the following PM parameters: NE-CV,
NE-ES, and NE-SES.
DS3 Path Monitored TP (Uni-Dir) supports the following PM parameters: NE-CV,
NE-ES, NE-SES, NE-UAS, NE-SAS, FE-CV, FE-ES, FE-SES, FE-SAS, FE-SAS, and
FE-UAS.
E1 Line Monitored TP (Uni-Dir) supports the following PM parameters: NE-ES, and
NE-SES.
E1 Path Monitored TP (Uni-Dir) supports the following PM parameters: NE-BBE,
NE-ES, NE-SES, NE-UAS, FE-BBE, FE-ES, FE-SES, and FE-UAS.
EC-1 Line supports the following PM parameters: NE-CV, NE-ES, NE-SES, NE-UAS,
NE-FC, NE-PJCDIFF-P, NE-NPDE, NE-PPDE, NE-NPGE, NE-PPGE, FE-CV, FE-ES,
FE-SES, FE-UAS, and FE-FC.
Optical Transmission Section (OTS) Monitored TP (Uni-Dir) supports the following PM
parameters: NE-TOPRH, NE-TOPRL, and NE-TOPRSH.
Optical Channel (OCH) Monitored TP (Uni-Dir) supports the following PM parameters:
NE-OPT, NE-OPTH, and NE-OPTL.
Optical Channel Transport Unit (OTU2) Monitored TP (Uni-Dir) supports the following
PM parameters: NE-OPR, NE-OPRH, NE-OPRL, NE-OPT, NE-OPTH, NE-OPTL,
BBE-OTU, ES-OTU, FECC, SES-OTU, and UAS-OTU.
Optical Channel Data Unit (ODU2) Monitored TP (Uni-Dir) supports the following PM
parameters: BBE-ODU, ES-ODU, SES-ODU, and UAS-ODU.
Performance Monitoring Supported PM Parameters for NEs in the SONET/Ethernet
Environment
....................................................................................................................................................................................................................................
....................................................................................................................................................................................................................................
365-315-148R6.4 Issue 1
March 2011
3-61
Ethernet LNW70 (VCG/Data) Monitored TP (Uni-Dir) NE-EONF, NE-EINF, NE-EDFE,
NE-EINB, NE-EONB, NE-EDFC, NE-EDFCG, NE-EDFCY, NE-EINDB, NE-EINDP,
NE-EINFU, NE-EINFM, NE-EINFB, NE-EONFU, NE-EONFM, NE-EONFB,
NE-EINCP, NE-EOCP, and NE-EDFL.
Ethernet LNW70 (LAG) Monitored TP (Uni-Dir) NE-EINDB and NE-EDFL.
Ethernet LNW73 (VCG) Monitored TP (Uni-Dir) NE-RCORH, NE-RCRCH, and
NE-RCORF.
Ethernet LNW73 (Data) Monitored TP (Uni-Dir) NE-INTXWD, NE-LOS, NE-LSYNC,
NE-DSPERR, NE-RFOVD, NE-TFOVD, NE-TFCRC, and NE-T10BERR.
Ethernet LNW73C (VCG) Monitored TP (Uni-Dir) NE-RCORH, NE-RCRCH, and
NE-RCORF.
Ethernet LNW73C (Data) Monitored TP (Uni-Dir) NE-INTXWD,NE-LOS, NE-LSYNC,
NE-DSPERR, NE-RFOVD, NE-TFOVD, NE-TFCRC, NE-T10BERR, NE-EONB,
NE-EINBC, NE-EONBC, NE-EBBCZCS, and NE-EIBFCS.
Ethernet LNW66 (VCG) Monitored TP (Uni-Dir) NE-EDFC, NE-EDFE, NE-EDFP,
NE-EINB, NE-EINF, NE-EONB, and NE-EONF.
Ethernet LNW66 (Data) Monitored TP (Uni-Dir) NE-EDFC, NE-EDFE, NE-EINB,
NE-EINF, NE-EONB, and NE-EONF.
Ethernet LNW67 (VCG) Monitored TP (Uni-Dir) NE-EDFC, NE-EDFE, NE-EDFP,
NE-EINB, NE-EINF, NE-EONB, and NE-EONF.
Ethernet LNW67 (Data) Monitored TP (Uni-Dir) NE-EDFC, NE-EDFE, NE-EINB,
NE-EINF, NE-EONB, and NE-EONF.
Ethernet LNW68 (VCG) Monitored TP (Uni-Dir) NE-EDFC, NE-EDFE, NE-EDFP,
NE-EINB, NE-EINF, NE-EONB, and NE-EONF.
Ethernet LNW68 (Data) Monitored TP (Uni-Dir) NE-EDFC, NE-EDFE, NE-EINB,
NE-EINF, NE-EONB, and NE-EONF.
Ethernet LNW74 (VCG/Data) Monitored TP (Uni-Dir) NE-EDFE, NE-EINB, NE-EINF,
NE-EONB, and NE-EONF.
Ethernet LNW63 (VCG) Monitored TP (Uni-Dir) NE-EDFC, NE-EDFE, NE-EDFP,
NE-EINB, NE-EINF, NE-EONB, NE-EONF, NE-EINDP, NE-EINFU, NE-EINFM,
NE-EINFB, NE-EONFU, NE-EONFM, NE-EONFB, NE-EFCRC, and NE-GFPFCS.
Ethernet LNW63 (Data) Monitored TP (Uni-Dir) NE-EDFC, NE-EDFE, NE-EDFP,
NE-EINB, NE-EINF, NE-EONB, NE-EONF, NE-EINDP, NE-EINFU, NE-EINFM,
NE-EINFB, NE-EONFU, NE-EONFM, NE-EONFB, and NE-EFCRC.
Performance Monitoring Supported PM Parameters for NEs in the SONET/Ethernet
Environment
....................................................................................................................................................................................................................................
....................................................................................................................................................................................................................................
3-62 365-315-148R6.4 Issue 1
March 2011
Ethernet LNW78 (LAN) Monitored TP (Uni-Dir) NE-IUCAF, NE-IUCAO, NE-IUCBF,
NE-IUCBO, NE-IUCBEF, NE-IUCBEO, NE-IUCCF, NE-IUCCO, NE-IMCAF,
NE-IMCAO, NE-IMCBF, NE-IMCBO, NE-IMCBEF, NE-IMCBEO, NE-IMCCF,
NE-IMCCO, NE-OUCAF, NE-OUCAO, NE-OUCBF, NE-OUCBO, NE-OUCBEF,
NE-OUCBEO, NE-OUCCF, NE-OUCCO, NE-OMCAF, NE-OMCAO, NE-OMCBF,
NE-OMCBO, NE-OMCBEF, NE-OMCBEO, NE-OMCCF, NE-OMCCO, NE-DRATEF,
NE-DTAGF, NE-DSPIF, NE-DSIZEF, NE-DNOTAGF, NE-DSMACF, NE-DSMACO,
NE-DFCG, NE-DFCY, NE-IUCAREDF, NE-IUCAREDO, NE-IUCBREDF,
NE-IUCBREDO, NE-IUCCREDF, NE-IUCCREDO, NE-IMCAREDF, NE-IMCAREDO,
NE-IMCBREDF, NE-IMCBREDO, NE-IMCCREDF, and NE-IMCCREDO.
Ethernet LNW78 (Even VCG Ports) Monitored TP (Uni-Dir) NE-ICTRF_SP,
NE-IECHOF_SP, NE-IFLSHF_SP, NE-IORGF_SP, NE-IATDF_SP, NE-ICRCF_SP,
NE-ITPF_SP, NE-OCTRLF_SP, NE-OECHOF_SP, NE-OFLSHF_SP, NE-OORGF_SP,
NE-OATDF_SP, NE-OCRCF_SP, NE-OTPF_SP, NE-ITTLF_SP, NE-DLONG_SP,
NE-DHEC_SP, NE-DSS_SP, NE-DSA_SP, NE-DPTY_SP, NE-DSCFF_SP,
NE-DFCG_SP, NE-DFCY_SP, NE-IUCAF_SP, NE-IUCAO_SP, NE-IUCBF_SP,
NE-IUCBO_SP, NE-IUCBEF_SP, NE-IUCBEO_SP, NE-IUCCF_SP, NE-IUCCO_SP,
NE-IMCAF_SP, NE-IMCAO_SP, NE-IMCBF_SP, NE-IMCBO_SP, NE-IMCBEF_SP,
NE-IMCBEO_SP, NE-IMCCF_SP, NE-IMCCO_SP, NE-OUCAF_SP, NE-OUCAO_SP,
NE-OUCBF_SP, NE-OUCBO_SP, NE-OUCBEF_SP, NE-OUCBEO_SP,
NE-OUCCF_SP, NE-OUCCO_SP, NE-OMCAF_SP, NE-OMCAO_SP, NE-OMCBF_SP,
NE-OMCBO_SP, NE-OMCBEF_SP, NE-OMCBEO_SP, NE-OMCCF_SP, and
NE-OMCCO_SP.
Ethernet LNW78 (Odd VCG Ports) Monitored TP (Uni-Dir) NE-IUCAF_IF,
NE-IUCAO_IF, NE-IUCBF_IF, NE-IUCBO_IF, NE-IUCBEF_IF, NE-IUCBEO_IF,
NE-IUCCF_IF, NE-IUCCO_IF, NE-IMCAF_IF, NE-IMCAO_IF, NE-IMCBF_IF,
NE-IMCBO_IF, NE-IMCBEF_IF, NE-IMCBEO_IF, NE-IMCCF_IF, NE-IMCCO_IF,
NE-OUCAF_IF, NE-OUCAO_IF, NE-OUCBF_IF, NE-OUCBO_IF, NE-OUCBEF_IF,
NE-OUCBEO_IF, NE-OUCCF_IF, NE-OUCCO_IF, NE-OMCAF_IF, NE-OMCAO_IF,
NE-OMCBF_IF, NE-OMCBO_IF, NE-OMCBEF_IF, NE-OMCBEO_IF,
NE-OMCCF_IF, NE-OMCCO_IF, NE-ICPUF_IF, NE-DRATEF_IF, NE-DTAGF_IF,
NE-DSPIF_IF, NE-DSIZEF_IF, NE-DNOTAGF_IF, NE-DSMACF_IF,
NE-DSMACO_IF, NE-DDMACF_IF, NE-DDMACO_IF, and NE-OCPUF_IF.
Ethernet LNW64 (VCG) Monitored TP (Uni-Dir) NE-EDFC, NE-EDFE, NE-GFPFCS,
NE-EINB, NE-EINF, NE-EONB, and NE-EONF.
Ethernet LNW64 (Data) Monitored TP (Uni-Dir) NE-EDFC, NE-EDFE, NE-EFCRC,
NE-EINB, NE-EINF, NE-EONB, NE-EONF, NE-EINDP, NE-EINFU, NE-EINFM,
NE-EINFB, NE-EONFU, NE-EONFM, and NE-EONFB.
Performance Monitoring Supported PM Parameters for NEs in the SONET/Ethernet
Environment
....................................................................................................................................................................................................................................
....................................................................................................................................................................................................................................
365-315-148R6.4 Issue 1
March 2011
3-63
Ethernet LNW170 (LAN/WAN) Monitored TP (Uni-Dir) supports the following PM
parameters: NE-QIB-G, NE-QIP-G, NE-QIB-Y, NE-QIP-Y, NE-QIB-R, NE-QIP-R,
NE-QOB-0, NE-QOB-1, NE-QOB-T, NE-QOP-T, NE-QPD-A, NE-QPD-V, and
NE-QPD-L.
Ethernet LNW170 (VCG/Data) Monitored TP (Uni-Dir) supports the following PM
parameters: NE-EONF, NE-EINF, NE-EDFE, NE-EINB, NE-EONB, NE-EDFC,
NE-EDFCG, NE-EDFCY, NE-EINDB, NE-EINDP, NE-EINFU, NE-EINFM,
NE-EINFB, NE-EONFU, NE-EONFM, NE-EONFB, NE-EINCP, NE-EOCP, and
NE-EDFL.
Ethernet LNW170 (LAG) Monitored TP (Uni-Dir) supports the following PM parameters:
NE-EINDB, and NE-EDFL.
Ethernet LNW705 (VCG) Monitored TP (Uni-Dir) supports the following PM parameters:
NE-RCORH, NE-RCRCH, NE-RCORF, NE-EDFE, and NE-GFPFCS.
Ethernet LNW705 (Data) Monitored TP (Uni-Dir) supports the following PM
parameters: NE-INTXWD, NE-LOS, NE-LSYNC, NE-DSPERR, NE-RFOVD,
NE-TFOVD, NE-TFCRC, NE-T10BERR, NE-EDFE, NE-EINB, NE-EONB, NE-EINDP,
NE-EINFU, NE-EINFM, NE-EINFB, NE-EONFU, NE-EONFM, NE-EONFB,
NE-EFCRC, and NE-EDFC.
1671 Service Connect (SC) in the SONET/Ethernet Environment
The supported uni-directional (Uni-Dir) PM parameters for each monitored termination
point (TP) of the 1671 Service Connect (SC) follow. Refer to “Summary of supported
NEs” (p. 1-4) for the currently supported NE release.
Section Monitored TP (Uni-Dir) supports the following PM parameters: NE:CVS,
NE:ESS, NE:SESS, and NE:SEFS. The supported rates are: OC48, OC12, OC3 and EC1.
Line Monitored TP (Uni-Dir) supports the following PM parameters: NE:CVL, NE:ESL,
NE:SESL, NE:UASL, NE:FCL, FE:CVL, FE:ESL, FE:SESL, FE:UASL, and FE:FC-L.
The supported rates are: OC48, OC12, OC3, and EC1.
STS Path Monitored TP (Uni-Dir) supports the following PM parameters: NE:CVP,
NE:ESP, NE:SESP, NE:UASP, NE:FC-P, FE:CVP, FE:ESP, FE:SESP, FE:UASP, and
FE:FC-P. The supported rates are: STS-1, STS-3c, and STS-12c.
VT1.5 Path (VT1) Monitored TP (Uni-Dir) supports the following PM parameters:
NE:CVV, NE:ESV, NE:FC-V, NE:SESV, NE:UASV, FE:CVV, FE:ESV, FE:FC-V,
FE:SESV, and FE:UASV. The supported rates are: VT1.
DS1 Line (T1) Monitored TP (Uni-Dir) supports the following PM parameters: FE:ESL.
The supported rates are: T1.
Performance Monitoring Supported PM Parameters for NEs in the SONET/Ethernet
Environment
....................................................................................................................................................................................................................................
....................................................................................................................................................................................................................................
3-64 365-315-148R6.4 Issue 1
March 2011
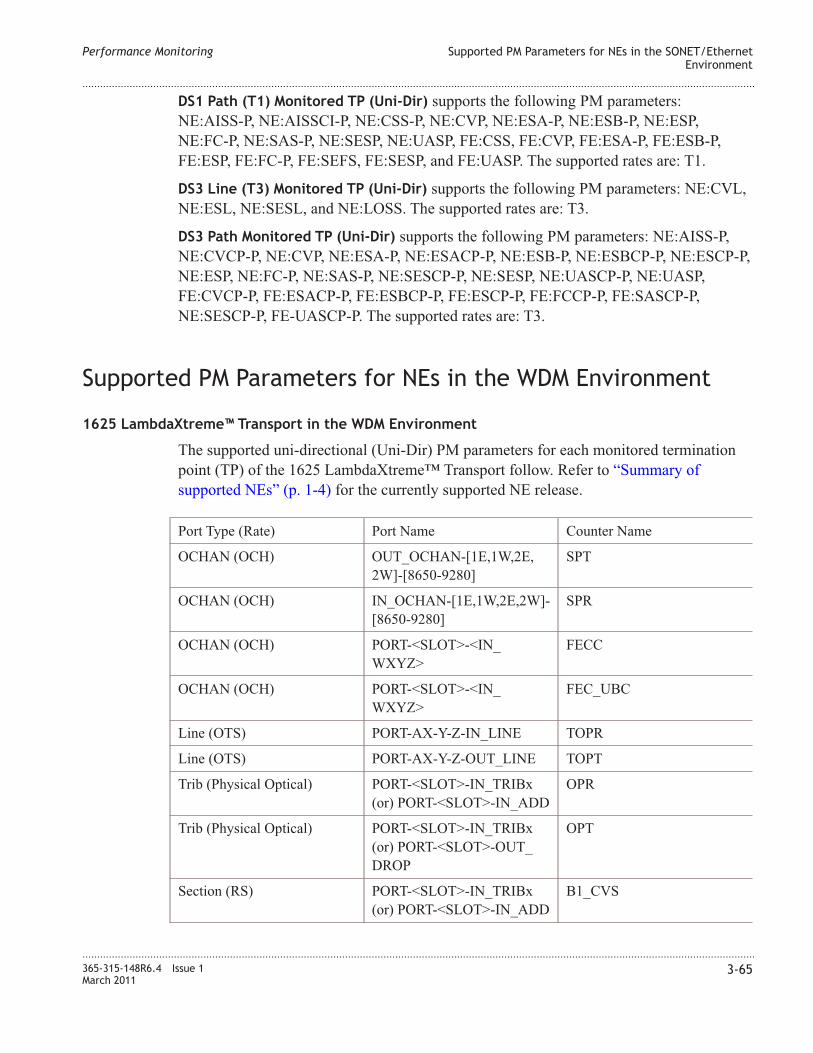
DS1 Path (T1) Monitored TP (Uni-Dir) supports the following PM parameters:
NE:AISS-P, NE:AISSCI-P, NE:CSS-P, NE:CVP, NE:ESA-P, NE:ESB-P, NE:ESP,
NE:FC-P, NE:SAS-P, NE:SESP, NE:UASP, FE:CSS, FE:CVP, FE:ESA-P, FE:ESB-P,
FE:ESP, FE:FC-P, FE:SEFS, FE:SESP, and FE:UASP. The supported rates are: T1.
DS3 Line (T3) Monitored TP (Uni-Dir) supports the following PM parameters: NE:CVL,
NE:ESL, NE:SESL, and NE:LOSS. The supported rates are: T3.
DS3 Path Monitored TP (Uni-Dir) supports the following PM parameters: NE:AISS-P,
NE:CVCP-P, NE:CVP, NE:ESA-P, NE:ESACP-P, NE:ESB-P, NE:ESBCP-P, NE:ESCP-P,
NE:ESP, NE:FC-P, NE:SAS-P, NE:SESCP-P, NE:SESP, NE:UASCP-P, NE:UASP,
FE:CVCP-P, FE:ESACP-P, FE:ESBCP-P, FE:ESCP-P, FE:FCCP-P, FE:SASCP-P,
NE:SESCP-P, FE-UASCP-P. The supported rates are: T3.
Supported PM Parameters for NEs in the WDM Environment
1625 LambdaXtreme™ Transport in the WDM Environment
The supported uni-directional (Uni-Dir) PM parameters for each monitored termination
point (TP) of the 1625 LambdaXtreme™ Transport follow. Refer to “Summary of
supported NEs” (p. 1-4) for the currently supported NE release.
Port Type (Rate) Port Name Counter Name
OCHAN (OCH) OUT_OCHAN-[1E,1W,2E,
2W]-[8650-9280]
SPT
OCHAN (OCH) IN_OCHAN-[1E,1W,2E,2W]-
[8650-9280]
SPR
OCHAN (OCH) PORT-<SLOT>-<IN_
WXYZ>
FECC
OCHAN (OCH) PORT-<SLOT>-<IN_
WXYZ>
FEC_UBC
Line (OTS) PORT-AX-Y-Z-IN_LINE TOPR
Line (OTS) PORT-AX-Y-Z-OUT_LINE TOPT
Trib (Physical Optical) PORT-<SLOT>-IN_TRIBx
(or) PORT-<SLOT>-IN_ADD
OPR
Trib (Physical Optical) PORT-<SLOT>-IN_TRIBx
(or) PORT-<SLOT>-OUT_
DROP
OPT
Section (RS) PORT-<SLOT>-IN_TRIBx
(or) PORT-<SLOT>-IN_ADD
B1_CVS
Performance Monitoring Supported PM Parameters for NEs in the SONET/Ethernet
Environment
....................................................................................................................................................................................................................................
....................................................................................................................................................................................................................................
365-315-148R6.4 Issue 1
March 2011
3-65

Section (RS) PORT-<SLOT>-IN_TRIBx
(or) PORT-<SLOT>-IN_ADD
ES
Section (RS) PORT-<SLOT>-IN_TRIBx
(or) PORT-<SLOT>-IN_ADD
SES
Section (RS) PORT-<SLOT>-IN_TRIBx
(or) PORT-<SLOT>-IN_ADD
UAS
Section (RS) PORT-<SLOT>-IN_TRIBx
(or) PORT-<SLOT>-IN_ADD
SEFS
Section (RS) PORT-<SLOT>-IN_TRIBx
(or) PORT-<SLOT>-IN_ADD
LOSS
Sup (OTS) PORT-AX-Y-Z-IN_LINE SPT-SU
Sup (OTS) PORT-AX-Y-Z-IN_LINE CV
Sup (OTS) PORT-AX-Y-Z-IN_LINE ES
Sup (OTS) PORT-AX-Y-Z-IN_LINE SES
Sup (OTS) PORT-AX-Y-Z-IN_LINE SEFS
Sup (OTS) PORT-AX-Y-Z-IN_LINE LOSS
1694 Enhanced Optical Networking (EON) in the WDM Environment
The supported uni-directional (Uni-Dir) PM parameters for each monitored termination
point (TP) of the 1694 Enhanced Optical Networking (EON) follow. Refer to “Summary
of supported NEs” (p. 1-4) for the currently supported NE release.
Section/RS Ingress supports the following PM parameters: NE-CVS, NE-ES, NE-SES,
and NE-SEFS. The supported rates are OC-192/STM-64, OC-48/STM-16,
OC-12/STM-4, and OC-3/STM-1.
Section/RS Egress supports the following PM parameters: NE-CVS, NE-ESS, NE-SESS,
and NE-SEFS. The supported rates are OC-192/STM-64, OC48/STM-16, OC-12/STM-4,
and OC-3/STM-1.
Physical Optical Ingress supports the following PM parameter: OPR, in which the value
is in range or out of range.
Physical Optical Egress supports the following PM parameters: OPT and LBC, in which
the value for OPT is in range or out of range.
OTS Ingress supports the following PM parameters: TOPR-OL, OPTI-OL, NE-CV,
NE-ES, NE-SES, NE-UAS, SPR-SU, and LBC-LU.
OTS Egress supports the following PM Parameters: TOPT-OL, LBC-P1, LBC-P2,
LBC-P3, LBC-P4, LBFC-P1, and LBFC-P2.
Performance Monitoring Supported PM Parameters for NEs in the WDM Environment
....................................................................................................................................................................................................................................
....................................................................................................................................................................................................................................
3-66 365-315-148R6.4 Issue 1
March 2011

Optical Channel Ingress on OTU supports the following PM parameters: FEC-EC and
FEC-UBC. The supported rate is: OC-192/STM-64 only for Drop and MUXOTU only.
Optical Channel from RP supports the following PM parameters: SPR-C and OSNR-C.
Performance Monitoring Supported PM Parameters for NEs in the WDM Environment
....................................................................................................................................................................................................................................
....................................................................................................................................................................................................................................
365-315-148R6.4 Issue 1
March 2011
3-67
View a List of Performance Measurements Statistics
When to use
Use this task to view the current PM storage limits.
Related information
See the following topics in this document:
• “The Performance Monitoring Feature” (p. 3-2)
• “Performance Monitoring Counters” (p. 3-8)
• “Supported PM Parameters for NEs in the SDH/Ethernet Environment” (p. 3-47)
• “Supported PM Parameters for NEs in the SONET/Ethernet Environment” (p. 3-56)
• “Supported PM Parameters for NEs in the WDM Environment” (p. 3-65)
Before you begin
Before you begin to view a list of performance measurements statistics, be aware that this
task is intended for administrators.
Task
Complete the following step to view a list of performance measurement statistics.
...................................................................................................................................................................................................
1 Use the icons or the object links to follow this path:
• Performance Measurements > Performance Measurements Statistics
Result: The Performance statistics page is displayed.
Performance Monitoring View a List of Performance Measurements Statistics
....................................................................................................................................................................................................................................
....................................................................................................................................................................................................................................
3-68 365-315-148R6.4 Issue 1
March 2011
E N D O F S T E P S...................................................................................................................................................................................................
View a List of PM-Capable Termination Points
When to use
Use this task to view a list of PM-capable NE termination points.
Related information
See the following topics in this document:
• “The Performance Monitoring Feature” (p. 3-2)
• “Performance Monitoring Counters” (p. 3-8)
• “Supported PM Parameters for NEs in the SDH/Ethernet Environment” (p. 3-47)
• “Supported PM Parameters for NEs in the SONET/Ethernet Environment” (p. 3-56)
• “Supported PM Parameters for NEs in the WDM Environment” (p. 3-65)
• “Enable PM Data Collection” (p. 3-71)
• “Disable PM Data Collection” (p. 3-73)
Before you begin
This task does not have any preconditions.
Task
Complete the following steps to view a list of PM-capable NE termination points.
...................................................................................................................................................................................................
1 Use the icons or the object links to follow this path:
• Performance Measurements > Performance Measurement Points
Result: The search panel of the Performance Measurement Points page is displayed.
...................................................................................................................................................................................................
2 Select one or more fields in the search panel. Note that some fields, such as Connection
name and Granularity require the population of other fields for the search to complete
successfully.
• In the Filter method field, select Port/NE resource based or Connection Based.
Selecting Port/NE resource based will display Path Termination Points only.
Selecting Connection Based will display all termination points (Path Termination
Points and Connection Termination Points). Fields are displayed depending on the
Filter method selected.
• In the Connection name field, enter the name of the connection that contains the
PM-capable termination points.
• In the NE name field, enter the name of the NE that contains the PM-capable
termination points, or click the NE name hyperlink, select the name, and click OK.
Performance Monitoring View a List of PM-Capable Termination Points
....................................................................................................................................................................................................................................
....................................................................................................................................................................................................................................
365-315-148R6.4 Issue 1
March 2011
3-69

• In the Monitoring rate field, select the monitoring rate of the PM-capable termination
points.
• In the Granularity field, select the PM data type (interval) of the PM-capable
termination points. Possible choices are 15 Minute , 24 Hour, or 24 Hour BI (24-hour
bidirectional PM data). This is a required field.
• In the Port field, enter the port number.
• In the Data collection from/to fields, enter the appropriate dates or select the dates
using the calendar icons.
...................................................................................................................................................................................................
3 Click the Search button.
Result: The list at the bottom of the Performance Measurement Points page is
populated with a list of PM-enabled termination points that meet your search criteria.
Performance Monitoring View a List of PM-Capable Termination Points
....................................................................................................................................................................................................................................
....................................................................................................................................................................................................................................
3-70 365-315-148R6.4 Issue 1
March 2011
E N D O F S T E P S...................................................................................................................................................................................................
Enable PM Data Collection
Purpose
Use this task to enable PM data collection on one or more NE termination points.
Related information
See the following topics in this document:
• “The Performance Monitoring Feature” (p. 3-2)
• “Performance Monitoring Counters” (p. 3-8)
• “Supported PM Parameters for NEs in the SDH/Ethernet Environment” (p. 3-47)
• “Supported PM Parameters for NEs in the SONET/Ethernet Environment” (p. 3-56)
• “Supported PM Parameters for NEs in the WDM Environment” (p. 3-65)
• “Clear PM Data Collection for Selected Termination Points” (p. 3-77)
Before you begin
Before you begin the Enable PM Data Collection task, step 1 requires you to complete the
“View a List of PM-Capable Termination Points” (p. 3-69) task.
Task
Complete the following steps to enable PM data collection.
...................................................................................................................................................................................................
1 View a list of PM-capable NE termination points using the “View a List of PM-Capable
Termination Points” (p. 3-69) task.
...................................................................................................................................................................................................
2 In the Only ports with data collected field of the Performance Measurement Points page
search panel, select No to display a list of all PM-capable NE termination points.
Result: A list of PM-capable NE termination points is displayed at the bottom of the
Performance Measurement Points page.
...................................................................................................................................................................................................
3 Select one or more termination points that do not have PM data collection enabled.
...................................................................................................................................................................................................
4 To enable PM data collection on the selected termination point(s) immediately, select
Start PM from the Go menu, click the Go button, and Refresh the display.
Performance Monitoring Enable PM Data Collection
....................................................................................................................................................................................................................................
....................................................................................................................................................................................................................................
365-315-148R6.4 Issue 1
March 2011
3-71
Result: PM data collection is enabled immediately.
...................................................................................................................................................................................................
5 After all PM data collection settings have been made, click the Submit button.
Result: The PM data collection settings are applied to the selected NE termination
point(s).
Note: The "Enable PM Data Collection" will NOT be applicable when the ports
selected are of Monitoring Rate=DSL, Granualrity=15 Minute and the system
parameter SHDSL_PM15M_DISABLE is set to ON. User can perform only
"Enable Monitoring" and not "Collection" for the DSL ports with 15 Minute
granularity.
Performance Monitoring Enable PM Data Collection
....................................................................................................................................................................................................................................
....................................................................................................................................................................................................................................
3-72 365-315-148R6.4 Issue 1
March 2011
E N D O F S T E P S...................................................................................................................................................................................................
Disable PM Data Collection
Purpose
Use this task to disable PM data collection on one or more NE termination points.
Related information
See the following topics in this document:
• “The Performance Monitoring Feature” (p. 3-2)
• “Performance Monitoring Counters” (p. 3-8)
• “Supported PM Parameters for NEs in the SDH/Ethernet Environment” (p. 3-47)
• “Supported PM Parameters for NEs in the SONET/Ethernet Environment” (p. 3-56)
• “Supported PM Parameters for NEs in the WDM Environment” (p. 3-65)
• “Schedule Disable PM Data Collection” (p. 3-75)
• “Clear PM Data Collection for Selected Termination Points” (p. 3-77)
Before you begin
Before you begin the Disable PM Data Collection task, step 1 requires you to complete
the “View a List of PM-Capable Termination Points” (p. 3-69) task.
Task
Complete the following steps to disable PM data collection.
...................................................................................................................................................................................................
1 View a list of PM-capable NE termination points using the “View a List of PM-Capable
Termination Points” (p. 3-69) task.
...................................................................................................................................................................................................
2 In the Only ports with data collected field of the Performance Measurement Points page
search panel, select No to display a list of all PM-capable NE termination points.
Result: A list of PM-capable NE termination points is displayed at the bottom of the
Performance Measurement Points page.
...................................................................................................................................................................................................
3 Select one or more termination points that do not have PM data collection enabled.
...................................................................................................................................................................................................
4 To disable PM data collection on the selected termination point(s) immediately, select
Stop PM from the Go menu and click the Go button.
Performance Monitoring Disable PM Data Collection
....................................................................................................................................................................................................................................
....................................................................................................................................................................................................................................
365-315-148R6.4 Issue 1
March 2011
3-73

Result: PM data collection is disabled immediately.
...................................................................................................................................................................................................
5 After all PM data collection settings have been made, click the Submit button.
Result: The PM data collection settings are applied to the selected NE termination
point(s).
Performance Monitoring Disable PM Data Collection
....................................................................................................................................................................................................................................
....................................................................................................................................................................................................................................
3-74 365-315-148R6.4 Issue 1
March 2011
E N D O F S T E P S...................................................................................................................................................................................................
Schedule Disable PM Data Collection
Purpose
Use this task to schedule disable PM data collection for a specific time period on one or
more NE termination points.
Related information
See the following topics in this document:
• “The Performance Monitoring Feature” (p. 3-2)
• “Performance Monitoring Counters” (p. 3-8)
• “Supported PM Parameters for NEs in the SDH/Ethernet Environment” (p. 3-47)
• “Supported PM Parameters for NEs in the SONET/Ethernet Environment” (p. 3-56)
“Supported PM Parameters for NEs in the WDM Environment” (p. 3-65)
• “Disable PM Data Collection” (p. 3-73)
• “Clear PM Data Collection for Selected Termination Points” (p. 3-77)
Before you begin
Before you begin the Schedule Disable PM Data Collection task, step 1 requires you to
complete the “View a List of PM-Capable Termination Points” (p. 3-69) task.
Task
Complete the following steps to schedule disable PM data collection.
...................................................................................................................................................................................................
1 View a list of PM-capable NE termination points using the “View a List of PM-Capable
Termination Points” (p. 3-69) task.
...................................................................................................................................................................................................
2 In the Monitored ports only field of the Performance Measurement Points page search
panel, select No to display a list of all PM-capable NE termination points.
Result: A list of PM-capable NE termination points is displayed at the bottom of the
Performance Measurement Points page.
...................................................................................................................................................................................................
3 To schedule the ending date/time of PM data collection for the selected termination
point(s), select Schedule stop PM from the Go menu and click the Go button.
Performance Monitoring Schedule Disable PM Data Collection
....................................................................................................................................................................................................................................
....................................................................................................................................................................................................................................
365-315-148R6.4 Issue 1
March 2011
3-75
Result: A pop-up window is displayed.
...................................................................................................................................................................................................
4 In the pop-up window, select the ending date/time for the scheduled PM data collection
and click the OK button.
Result: The management system returns to the Performance Measurement Points
page.
...................................................................................................................................................................................................
5 After all PM data collection settings have been made, click the Submit button.
Result: The PM data collection settings are applied to the selected NE termination
point(s).
Performance Monitoring Schedule Disable PM Data Collection
....................................................................................................................................................................................................................................
....................................................................................................................................................................................................................................
3-76 365-315-148R6.4 Issue 1
March 2011
E N D O F S T E P S...................................................................................................................................................................................................
Clear PM Data Collection for Selected Termination Points
Purpose
Use this task to clear OMS PM start / stop times collection for selected termination
points.
Related information
See the following topics in this document:
• “The Performance Monitoring Feature” (p. 3-2)
• “Performance Monitoring Counters” (p. 3-8)
• “Supported PM Parameters for NEs in the SDH/Ethernet Environment” (p. 3-47)
• “Supported PM Parameters for NEs in the SONET/Ethernet Environment” (p. 3-56)
“Supported PM Parameters for NEs in the WDM Environment” (p. 3-65)
• “Schedule Disable PM Data Collection” (p. 3-75)
Before you begin
Before you begin the Clear OMS PM Start / Stop Times Collection task, step 1 requires
you to complete the “View a List of PM-Capable Termination Points” (p. 3-69) task.
Task
Complete the following steps to clear OMS PM Start / Stop times collection for selected
termination points.
...................................................................................................................................................................................................
1 View a list of PM-capable NE termination points using the “View a List of PM-Capable
Termination Points” (p. 3-69) task.
...................................................................................................................................................................................................
2 In the Monitored ports only field of the Performance Measurement Points page search
panel, select No to display a list of all PM-capable NE termination points.
Result: A list of PM-capable NE termination points is displayed at the bottom of the
Performance Measurement Points page.
...................................................................................................................................................................................................
3 Select one or more termination points that have both the starting and ending time fields
populated.
Performance Monitoring Clear PM Data Collection for Selected Termination Points
....................................................................................................................................................................................................................................
....................................................................................................................................................................................................................................
365-315-148R6.4 Issue 1
March 2011
3-77
...................................................................................................................................................................................................
4 To clear PM data collection for the selected termination point(s), select Clear OMS Start
and Stop Times from the Go menu and click the Go button. Select Yes in the window to
clear the PM.
Result: The PM data collection for the selected termination points is cleared
immediately.
Performance Monitoring Clear PM Data Collection for Selected Termination Points
....................................................................................................................................................................................................................................
....................................................................................................................................................................................................................................
3-78 365-315-148R6.4 Issue 1
March 2011
E N D O F S T E P S...................................................................................................................................................................................................
View the Current PM Measurements of a Termination Point
Purpose
Use this task to view the current PM measurements of a selected NE termination point
that has PM data collection enabled.
Related information
See the following topics in this document:
• “The Performance Monitoring Feature” (p. 3-2)
• “Performance Monitoring Counters” (p. 3-8)
• “Supported PM Parameters for NEs in the SDH/Ethernet Environment” (p. 3-47)
• “Supported PM Parameters for NEs in the SONET/Ethernet Environment” (p. 3-56)
• “Supported PM Parameters for NEs in the WDM Environment” (p. 3-65)
• “Enable PM Data Collection” (p. 3-71)
• “Disable PM Data Collection” (p. 3-73)
Before you begin
Before you begin to view the current PM measurements of an NE termination point,
enable PM data collection on the termination point.
Step 1 of this task requires you to complete the “View a List of PM-Capable Termination
Points” (p. 3-69) task.
Task
Complete the following steps to view the current PM measurements of a selected NE
termination point that has PM data collection enabled.
...................................................................................................................................................................................................
1 View a list of PM-capable NE termination points using the “View a List of PM-Capable
Termination Points” (p. 3-69) task.
...................................................................................................................................................................................................
2 In the Monitored ports only field of the Performance Measurement Points page search
panel, select Yes to display a list of all PM-capable NE termination points that have PM
data collection enabled.
Performance Monitoring View the Current PM Measurements of a Termination Point
....................................................................................................................................................................................................................................
....................................................................................................................................................................................................................................
365-315-148R6.4 Issue 1
March 2011
3-79

Result: A list of PM-capable NE termination points that have 15-minute or 24-hour
PM data collection enabled is displayed at the bottom of the Performance
Measurement Points page.
...................................................................................................................................................................................................
3 Select a termination point from the displayed list.
...................................................................................................................................................................................................
4 From the Go menu, select Current Measurements and click the Go button.
Result: The Current Measurements page is displayed, showing the current
measurement and threshold value of each PM parameter for the selected termination
point.
Performance Monitoring View the Current PM Measurements of a Termination Point
....................................................................................................................................................................................................................................
....................................................................................................................................................................................................................................
3-80 365-315-148R6.4 Issue 1
March 2011
E N D O F S T E P S...................................................................................................................................................................................................
View the History PM Measurements of a Termination Point
Purpose
Use this task to view the history PM measurements of a selected NE termination point
that has PM data collection enabled.
Related information
See the following topics in this document:
• “The Performance Monitoring Feature” (p. 3-2)
• “Performance Monitoring Counters” (p. 3-8)
• “Supported PM Parameters for NEs in the SDH/Ethernet Environment” (p. 3-47)
• “Supported PM Parameters for NEs in the SONET/Ethernet Environment” (p. 3-56)
• “Supported PM Parameters for NEs in the WDM Environment” (p. 3-65)
• “Enable PM Data Collection” (p. 3-71)
• “Disable PM Data Collection” (p. 3-73)
Before you begin
Before you begin to view the historical PM measurements of an NE termination point,
enable PM data collection on the termination point.
Step 1 of this task requires you to complete the “View a List of PM-Capable Termination
Points” (p. 3-69) task.
Task
Complete the following steps to view the historical PM measurements of a selected NE
termination point that has PM data collection enabled.
...................................................................................................................................................................................................
1 View a list of PM-capable NE termination points using the “View a List of PM-Capable
Termination Points” (p. 3-69) task.
...................................................................................................................................................................................................
2 In the Only ports with data collected field of the Performance Measurement Points page
search panel, select Yes to display a list of all PM-capable NE termination points that
have PM data collection enabled.
Performance Monitoring View the History PM Measurements of a Termination Point
....................................................................................................................................................................................................................................
....................................................................................................................................................................................................................................
365-315-148R6.4 Issue 1
March 2011
3-81
Result: A list of PM-capable NE termination points that have 15-minute or 24-hour
PM data collection enabled is displayed at the bottom of the Performance
Measurement Points page.
...................................................................................................................................................................................................
3 Select a termination point from the displayed list.
...................................................................................................................................................................................................
4 From the Go menu, select NE History Measurements and click the Go button.
Result: The NE History Measurements page is displayed, showing the historical
measurement of each PM parameter for the selected termination point.
Performance Monitoring View the History PM Measurements of a Termination Point
....................................................................................................................................................................................................................................
....................................................................................................................................................................................................................................
3-82 365-315-148R6.4 Issue 1
March 2011
E N D O F S T E P S...................................................................................................................................................................................................
View the Monitored NE Layer Rate Report
Purpose
Use this task to obtain information about monitored NE layer rates.
Related information
See the following topics in this document:
• “The Performance Monitoring Feature” (p. 3-2)
• “Performance Monitoring Counters” (p. 3-8)
• “Supported PM Parameters for NEs in the SDH/Ethernet Environment” (p. 3-47)
• “Supported PM Parameters for NEs in the SONET/Ethernet Environment” (p. 3-56)
• “Supported PM Parameters for NEs in the WDM Environment” (p. 3-65)
• “Enable/Disable NE Layer Rates” (p. 3-85)
Before you begin
This task does not have any preconditions.
Task
Complete the following to query PM data and view the monitored NE layer rates in a
report.
...................................................................................................................................................................................................
1 Use the icons or the object links to follow this path: Performance Measurements >
Monitored NE Layer Rate.
Result: The search panel of the Monitored NE Layer Rate page is displayed.
...................................................................................................................................................................................................
2 Select one or more fields in the search panel. Note that some fields, such as Granularity,
require the population of other fields for the search to complete successfully.
• Select the Node Type from the drop-down list.
• In the NE name field, enter the name of the NE.
• In the NE Layer Rate field, select the NE Layer Rate from the drop-down list. This is
a required field.
• In the Granularity field, select one or more of the PM data types (intervals). Possible
choices are 15 Minute, 24 Hour, or 24 Hour BI (24-hour bidirectional PM data). This
is a required field.
Performance Monitoring View the Monitored NE Layer Rate Report
....................................................................................................................................................................................................................................
....................................................................................................................................................................................................................................
365-315-148R6.4 Issue 1
March 2011
3-83

• In the Collection Status field, select the status of the data collection. One or more
selection can be made. Possible choices are: Enabled(the management system is
collecting for this layer rate), Disabled (the management system is not collecting for
this layer rate), System Disabled (the management system attempted to collect for the
layer rate, but collection was unsuccessful for a number of periods; therefore, the
management system has disabled the layer rate), or Manually Disabled (the
management system attempted to collect for the layer rate, but the user manually
disabled the collection).
• In the Last Collection Time field, enter the appropriate dates in the From and To
areas for the last collection time.
• In the Sort area, select options from the drop-down lists, and then select Ascending or
Descending for each sort.
...................................................................................................................................................................................................
3 Click the Search button.
Result: The list at the bottom of the Monitored NE Layer Rate page is populated with
a list of NE layer rates that meet your search criteria.
Performance Monitoring View the Monitored NE Layer Rate Report
....................................................................................................................................................................................................................................
....................................................................................................................................................................................................................................
3-84 365-315-148R6.4 Issue 1
March 2011
E N D O F S T E P S...................................................................................................................................................................................................

Enable/Disable NE Layer Rates
Purpose
Use this task to enable or disable NE layer rates. The type of disable status that applies is
selected in the Collection Status field on the Search panel of the Monitored NE Layer
Rate page.
Note: Disabling the collection for a rate stops retrieval of PM data for that rate on that
specific NE. This collection can only be stopped using this screen during the debugging
of network performance issues related to data collection. To disable data collection for a
termination point, see “Schedule Disable PM Data Collection” (p. 3-75).
Related information
See the following topics in this document:
• “The Performance Monitoring Feature” (p. 3-2)
• “Performance Monitoring Counters” (p. 3-8)
• “Supported PM Parameters for NEs in the SDH/Ethernet Environment” (p. 3-47)
• “Supported PM Parameters for NEs in the SONET/Ethernet Environment” (p. 3-56)
• “Supported PM Parameters for NEs in the WDM Environment” (p. 3-65)
• “View the Monitored NE Layer Rate Report” (p. 3-83)
Before you begin
This task does not have any preconditions.
Task
Complete the following to enable or disable NE layer rate.
...................................................................................................................................................................................................
1 View a list of NE Layer Rates using the “View the Monitored NE Layer Rate Report”
(p. 3-83) task.
Result: A report of NE layer rates is displayed at the bottom of the Monitored NE
Layer Rate page.
...................................................................................................................................................................................................
2 Click in the box to the left of the NE Layer Rate that you want to enable/disable.
...................................................................................................................................................................................................
3 From the Go menu, select Enable or Disable as appropriate.
Performance Monitoring Enable/Disable NE Layer Rates
....................................................................................................................................................................................................................................
....................................................................................................................................................................................................................................
365-315-148R6.4 Issue 1
March 2011
3-85

Result: If you selected Enable from the Go menu, the NE layer is activated.
If you selected Disable from the Go menu, the retrieval of PM data for the specific
NE selected is halted. The Disable method applied is the Disable method selected in
the Collection Status field on the Monitored NE Layer Rate search panel.
Performance Monitoring Enable/Disable NE Layer Rates
....................................................................................................................................................................................................................................
....................................................................................................................................................................................................................................
3-86 365-315-148R6.4 Issue 1
March 2011
E N D O F S T E P S...................................................................................................................................................................................................
Generate a PM Report
Purpose
Use this task to obtain information about 15-minute and 24-hour PM data, from 1 to 4 NE
termination points, for a specific time period. Specifically, information can be obtained
about 24-hour PM data collected for each NE termination point, uncollected 24-hour PM
data, and 15-minute PM data retrieved directly from each NE termination point.
If periods are requested that are recent, and have not already been collected, report
generation may take a few minutes to complete.
Related information
See the following topics in this document:
• “The Performance Monitoring Feature” (p. 3-2)
• “Performance Monitoring Counters” (p. 3-8)
• “Supported PM Parameters for NEs in the SDH/Ethernet Environment” (p. 3-47)
• “Supported PM Parameters for NEs in the SONET/Ethernet Environment” (p. 3-56)
• “Supported PM Parameters for NEs in the WDM Environment” (p. 3-65)
• “Save a PM Report” (p. 3-89)
Before you begin
This task does not have any preconditions.
From the search criteria specified, the management system produces a report file, which
is an ASCII file in Tab Separated Value (TSV) format. The filename of the generated
report file is in this format: <ReportType>.tsv , which enables the file to be read into
MicroSoft® Excel or Notepad. You may also view this report in HTML format.
The report file can be generated and/or saved to a location on the server; to save the PM
Report, see the “Save a PM Report” (p. 3-89) task.
Task
Complete the following to query PM data and generate a formatted report file.
...................................................................................................................................................................................................
1 Use the icons or the object list to follow this path: Performance Measurements >
Performance Measurement Points. The search panel of the Performance Measurement
Points page is displayed. Enter search criteria to display the desired list of PM-capable
NE termination points. Click the Search button. The list at the bottom of the Performance
Performance Monitoring Generate a PM Report
....................................................................................................................................................................................................................................
....................................................................................................................................................................................................................................
365-315-148R6.4 Issue 1
March 2011
3-87

Measurement Points page is populated with a list of PM-enabled termination points that
meet your search criteria. From the Go menu, select Performance Measurement Report
and click the Go button.
Result: The Performance Measurement Reports Query panel is displayed.
...................................................................................................................................................................................................
2 Click the calendar icon to the right of the From field to display a pop-up window, and
select the starting date/time of the report.
Result: The From field is populated with the starting date and time.
...................................................................................................................................................................................................
3 Click the calendar icon to the right of the To field to display a pop-up window, and select
the ending date/time of the report.
Result: The To field is populated with the ending date and time.
...................................................................................................................................................................................................
4 Click the Submit button.
Result: The Performance Measurement Report Results panel is displayed with a
hyperlink to the name of the resulting formatted report file.
...................................................................................................................................................................................................
5 The filename of the generated report file is in this format: <ReportType>.ts, which
enables the file to be read into MicroSoft® Excel or Notepad.
Result: The PM report file is displayed.
Performance Monitoring Generate a PM Report
....................................................................................................................................................................................................................................
....................................................................................................................................................................................................................................
3-88 365-315-148R6.4 Issue 1
March 2011
E N D O F S T E P S...................................................................................................................................................................................................
Save a PM Report
Purpose
Use this task to save information that was obtained about 15-minute and 24-hour PM data
on the client server.
Related information
See the following topics in this document:
• “The Performance Monitoring Feature” (p. 3-2)
• “Performance Monitoring Counters” (p. 3-8)
• “Supported PM Parameters for NEs in the SDH/Ethernet Environment” (p. 3-47)
• “Supported PM Parameters for NEs in the SONET/Ethernet Environment” (p. 3-56)
• “Supported PM Parameters for NEs in the WDM Environment” (p. 3-65)
• “Generate a PM Report” (p. 3-87)
Before you begin
Before you begin the Save a PM Report task, step 1 of this task requires you to complete
the “Generate a PM Report” (p. 3-87) task.
Task
Complete the following to save a PM report.
...................................................................................................................................................................................................
1 Complete all steps in the “Generate a PM Report” (p. 3-87) task.
...................................................................................................................................................................................................
2 To save the PM report to a location on the server, click the right mouse button on the
hyperlink of the filename.
Result: A pop-window is displayed.
...................................................................................................................................................................................................
3 In the pop-up window, specify the folder and file name of the PM report file to be saved.
Result: The PM report file is saved.
Performance Monitoring Save a PM Report
....................................................................................................................................................................................................................................
....................................................................................................................................................................................................................................
365-315-148R6.4 Issue 1
March 2011
3-89
E N D O F S T E P S...................................................................................................................................................................................................
Polling Current Measurements
Purpose
Use this task to select a port and display a periodically updating current measurements
screen for each supported monitoring types. The user can select the length of time the
page will update for and the period between the updates.
Related Information
See the following topics in this document:
• “The Performance Monitoring Feature” (p. 3-2)
• “Performance Monitoring Counters” (p. 3-8)
• “Supported PM Parameters for NEs in the SDH/Ethernet Environment” (p. 3-47)
• “Supported PM Parameters for NEs in the SONET/Ethernet Environment” (p. 3-56)
• “Supported PM Parameters for NEs in the WDM Environment” (p. 3-65)
• “Generate a PM Report” (p. 3-87)
Before you begin
This task does not have any preconditions.
Task
Complete the following to query Polling Current Measurements and generate a report.
...................................................................................................................................................................................................
1 Use the icons or the object list to follow this path: Performance Measurements > Polling
Current Measurements.
Result: The Polling Current Measurements Query panel is displayed.
...................................................................................................................................................................................................
2 Select the Total Time from the drop-down list. The default value is 10 minutes.
...................................................................................................................................................................................................
3 Select the Polling Intervals from the drop-down list. The default value is 30 seconds.
...................................................................................................................................................................................................
4 In the Show differences field, select Yes or No to display the counter differences.
...................................................................................................................................................................................................
5 In the Counter to Dispayfield, select the counter from the drop-down list. You can
multiple counters for this field. The default value is All.
Performance Monitoring Polling Current Measurements
....................................................................................................................................................................................................................................
....................................................................................................................................................................................................................................
3-90 365-315-148R6.4 Issue 1
March 2011

...................................................................................................................................................................................................
6 Click the Submit button.
Result: The Current Measurements Results panel is displayed with details that
matched the query.
Performance Monitoring Polling Current Measurements
....................................................................................................................................................................................................................................
....................................................................................................................................................................................................................................
365-315-148R6.4 Issue 1
March 2011
3-91
E N D O F S T E P S...................................................................................................................................................................................................

Performance Monitoring Polling Current Measurements
....................................................................................................................................................................................................................................
....................................................................................................................................................................................................................................
3-92 365-315-148R6.4 Issue 1
March 2011

4 4Profile Management
Overview
Purpose
This chapter provides general information about Profile Management using OMS and the
tasks that can be performed to manage profiles in NEs and in the management system.
Contents
The Profile Management Feature 4-2
View a List of NE Profiles 4-3
View a List of Current Assignments for NE Profiles 4-4
View Resource Details of a Current Assignment for an NE Profile 4-5
Create an NE Profile 4-6
Modify an NE Profile 4-8
Delete an NE Profile 4-10
View the OMS NE Profile Template 4-12
Create an OMS NE Profile Template 4-13
Modify an OMS NE Profile Template 4-15
Delete an OMS NE Profile Template 4-17
Assign an OMS TCA Profile to an NE 4-19
Assign Threshold Profiles to Termination Points from PM Points Page 4-21
Enable an NE Profile 4-23
Disable an NE Profile 4-25
Assign an NE Profile to a Resource 4-27
...................................................................................................................................................................................................................................
365-315-148R6.4 Issue 1
March 2011
4-1
The Profile Management Feature
NE Profile Management and NE Profile Assignment
NEs that support profiles allow the user to create numerous different profiles
(configurations) for a resource (port, piece of equipment). These profiles can then be
linked to a set of resources. When a profile changes after assignments, the profile of the
resource is automatically updated in the NE.
The NE Profile Management feature allows the user to view, create, edit, or delete
current sets of profiles configured in an NE.
The NE Profile Assignments feature allows the user to view a summary of resources
assigned to a specific profile.
OMS Profile Management
The OMS Profile Management feature allows the management system to centrally
manage a set of profiles for all NEs in the network. TCA and Alarm profiles are supported
in this release.
OMS Profile Assignment to NEs
The OMS Profile Assignment to NEs feature downloads the TCA profiles stored in the
management system to a specific NE or termination point.
There are three modes of operation for the OMS TCA profile assignment to NEs:
• Per node provisioning - TCA thresholds can be provisioned for layer rate on a per
node basis. This is supported for 1665 DMX Access Multiplexer only in this release.
• Per termination point provisioning - TCA thresholds can be provisioned
independently for each termination point. This is supported for 1694 Enhanced
Optical Networking (EON), 1625 LambdaXtreme™ Transport, and CMISE NEs in
this release.
• Profile provisioning - TCA thresholds can be provisioned by creating a profile on the
NE and assigning to a termination point. This is supported for 1675 Lambda Unite
MultiService Switch (MSS) in this release.
Connection Profiles
A connection profile defines the relationship between the roles ports play in a connection
and the alarm profile template that is assigned to the port during the provisioning process.
You cannot create connection profiles but it is possible to edit the connection profile
alarm templates and then downloaded to NEs.
Profile Management The Profile Management Feature
....................................................................................................................................................................................................................................
....................................................................................................................................................................................................................................
4-2 365-315-148R6.4 Issue 1
March 2011
View a List of NE Profiles
When to use
Use this task to view the NE Profiles page, which provides a list of NE profiles
Related Information
See the following topics in this document:
• “View Resource Details of a Current Assignment for an NE Profile” (p. 4-5)
• “View a List of Current Assignments for NE Profiles” (p. 4-4)
• “Create an NE Profile” (p. 4-6)
• “Modify an NE Profile” (p. 4-8)
• “Delete an NE Profile” (p. 4-10)
Before you begin
This task does not have any preconditions.
Task
Complete the following steps to view a list of NE profiles.
...................................................................................................................................................................................................
1 Use the icons or the object links to follow this path: Profiles > NE Profiles.
Result: The NE Profiles page is displayed, which shows the Search for NE Profiles
panel.
...................................................................................................................................................................................................
2 Enter the search criteria to view specific NE profiles and click the Search button.
Result: The NE Profiles panel of the page is displayed.
Profile Management View a List of NE Profiles
....................................................................................................................................................................................................................................
....................................................................................................................................................................................................................................
365-315-148R6.4 Issue 1
March 2011
4-3
E N D O F S T E P S...................................................................................................................................................................................................
View a List of Current Assignments for NE Profiles
When to use
Use this task to view a list of current assignments of NE Profiles.
Related Information
See the following topics in this document:
• “View a List of NE Profiles” (p. 4-3)
• “View Resource Details of a Current Assignment for an NE Profile” (p. 4-5)
• “Create an NE Profile” (p. 4-6)
• “Modify an NE Profile” (p. 4-8)
• “Delete an NE Profile” (p. 4-10)
Before you begin
This task does not have any preconditions.
Task
Complete the following steps to view a list of NE profiles.
...................................................................................................................................................................................................
1 Use the icons or the object links to follow this path: Profiles > NE Profiles.
Result: The NE Profiles page is displayed, which shows the Search for NE Profiles
panel.
...................................................................................................................................................................................................
2 Enter the search criteria to view specific NE profiles and click the Search button.
Result: The NE Profiles panel of the page is displayed.
...................................................................................................................................................................................................
3 Click the radio button next to the NE Profile in the search results table.
...................................................................................................................................................................................................
4 Select the Current Assignment option from the Go menu.
Result: The NE Profiles Assignment page is displayed.
Profile Management View a List of Current Assignments for NE Profiles
....................................................................................................................................................................................................................................
....................................................................................................................................................................................................................................
4-4 365-315-148R6.4 Issue 1
March 2011
E N D O F S T E P S...................................................................................................................................................................................................
View Resource Details of a Current Assignment for an NE
Profile
When to use
Use this task to view the resource details of current assignments of NE Profiles.
Related Information
See the following topics in this document:
• “Create an NE Profile” (p. 4-6)
• “Modify an NE Profile” (p. 4-8)
• “Delete an NE Profile” (p. 4-10)
• “View a List of NE Profiles” (p. 4-3)
• “View a List of Current Assignments for NE Profiles” (p. 4-4)
Before you begin
This task does not have any preconditions.
Task
Complete the following steps to view a list of current NE profile assignments.
...................................................................................................................................................................................................
1 Access the NE Profiles Assignment page as described in “View a List of Current
Assignments for NE Profiles” (p. 4-4).
...................................................................................................................................................................................................
2 Click the radio button next to the NE Profile Assignment for which you want resource
details in the search results table.
...................................................................................................................................................................................................
3 Select the Resource details option from the Go menu.
Result: The Resource Details page is displayed for the NE Profile Assignment
selected.
Profile Management View Resource Details of a Current Assignment for an NE
Profile
....................................................................................................................................................................................................................................
....................................................................................................................................................................................................................................
365-315-148R6.4 Issue 1
March 2011
4-5
E N D O F S T E P S...................................................................................................................................................................................................

Create an NE Profile
When to use
Use this task to view the NE Profiles page, which allows you to create an NE profile.
Related Information
See the following topics in this document:
• “View Resource Details of a Current Assignment for an NE Profile” (p. 4-5)
• “View a List of Current Assignments for NE Profiles” (p. 4-4)
• “Modify an NE Profile” (p. 4-8)
• “Delete an NE Profile” (p. 4-10)
• “View a List of NE Profiles” (p. 4-3)
Before you begin
This task does not have any preconditions.
Task
Complete the following steps to create an NE profile.
...................................................................................................................................................................................................
1 Use the icons or the object links to follow this path: Profiles > NE Profiles.
Result: The NE Profiles page is displayed, which shows the Search for NE Profiles
panel.
...................................................................................................................................................................................................
2 Click the New icon on the NE Profiles page.
Result: The New NE Profile page is displayed.
...................................................................................................................................................................................................
3 Select the Profile class. Options are: Alarm or TCA.
...................................................................................................................................................................................................
4 Select the NE name from the drop-down list.
...................................................................................................................................................................................................
5 Select the Profile group from the drop-down list.
...................................................................................................................................................................................................
6 Enter the Profile name.
Profile Management Create an NE Profile
....................................................................................................................................................................................................................................
....................................................................................................................................................................................................................................
4-6 365-315-148R6.4 Issue 1
March 2011

...................................................................................................................................................................................................
7 Click the Submit button.
Result: The new NE profile is submitted to the management system.
Profile Management Create an NE Profile
....................................................................................................................................................................................................................................
....................................................................................................................................................................................................................................
365-315-148R6.4 Issue 1
March 2011
4-7
E N D O F S T E P S...................................................................................................................................................................................................
Modify an NE Profile
When to use
Use this task to view the NE Profiles page, which allows you to modify an NE profile.
Related Information
See the following topics in this document:
• “View Resource Details of a Current Assignment for an NE Profile” (p. 4-5)
• “View a List of Current Assignments for NE Profiles” (p. 4-4)
• “Create an NE Profile” (p. 4-6)
• “Delete an NE Profile” (p. 4-10)
• “View a List of NE Profiles” (p. 4-3)
Before you begin
This task does not have any preconditions.
Task
Complete the following steps to modify an NE profile.
...................................................................................................................................................................................................
1 Use the icons or the object links to follow this path: Profiles > NE Profiles.
Result: The NE Profiles page is displayed, which shows the Search for NE Profiles
panel.
...................................................................................................................................................................................................
2 Enter the search criteria for the specific NE profile that you want to modify and click the
Search button.
Result: The NE Profile search table panel is displayed with data that meets your
search criteria.
...................................................................................................................................................................................................
3 Click the radio button next to the NE profile that you want to modify.
...................................................................................................................................................................................................
4 Select the Modify options on the Go menu.
Result: The Modify NE Profile Details page is displayed.
...................................................................................................................................................................................................
5 Enter changing information in any of the editable fields.
Profile Management Modify an NE Profile
....................................................................................................................................................................................................................................
....................................................................................................................................................................................................................................
4-8 365-315-148R6.4 Issue 1
March 2011

Note: Be sure that values entered are within the required ranges.
...................................................................................................................................................................................................
6 Click the Submit button.
Result: The NE Profile is modified in the NE.
Profile Management Modify an NE Profile
....................................................................................................................................................................................................................................
....................................................................................................................................................................................................................................
365-315-148R6.4 Issue 1
March 2011
4-9
E N D O F S T E P S...................................................................................................................................................................................................
Delete an NE Profile
When to use
Use this task to view the NE Profiles page, which allows you to delete an NE profile.
A delete operation only occurs if:
• The profile is not assigned to an object on the NE. (This can be checked using the
“View a List of Current Assignments for NE Profiles” (p. 4-4) task.)
• The profile is not a default profile.
• The NE supports the delete operation.
Related Information
See the following topics in this document:
• “View Resource Details of a Current Assignment for an NE Profile” (p. 4-5)
• “View a List of Current Assignments for NE Profiles” (p. 4-4)
• “Create an NE Profile” (p. 4-6)
• “Modify an NE Profile” (p. 4-8)
• “View a List of NE Profiles” (p. 4-3)
Before you begin
This task does not have any preconditions.
Task
Complete the following steps to delete an NE profile.
...................................................................................................................................................................................................
1 Use the icons or the object links to follow this path: Profiles > NE Profiles.
Result: The NE Profiles page is displayed, which shows the Search for NE Profiles
panel.
...................................................................................................................................................................................................
2 Enter the search criteria for the specific NE profile that you want to delete and click the
Search button.
Result: The NE Profile search table panel is displayed with data that meets your
search criteria.
...................................................................................................................................................................................................
3 Click the radio button next to the NE profile that you want to delete.
Profile Management Delete an NE Profile
....................................................................................................................................................................................................................................
....................................................................................................................................................................................................................................
4-10 365-315-148R6.4 Issue 1
March 2011

...................................................................................................................................................................................................
4 Select the Delete option on the Go menu.
Result: The NE Profile is deleted from the NE.
Profile Management Delete an NE Profile
....................................................................................................................................................................................................................................
....................................................................................................................................................................................................................................
365-315-148R6.4 Issue 1
March 2011
4-11
E N D O F S T E P S...................................................................................................................................................................................................
View the OMS NE Profile Template
When to use
Use this task to view the OMS NE Profile Templates page. By modifying this page, you
are modifying the template. Factory and user-defined profile templates can be viewed.
A factory profile is preinstalled with the Optical Management System (OMS). The factory
profile contains default values that are loaded on the NE at installation. Factory profiles
cannot be edited or deleted.
User-defined profiles are created by expert operators using either factory or user-defined
templates as a prototype.
Related Information
See the following topics in this document:
• “Create an OMS NE Profile Template” (p. 4-13)
• “Modify an OMS NE Profile Template” (p. 4-15)
• “Delete an OMS NE Profile Template” (p. 4-17)
Before you begin
This task does not have any preconditions.
Task
Complete the following steps to view an OMS NE profile template.
...................................................................................................................................................................................................
1 Use the icons or the object links to follow this path: Profiles > NE Profile Templates.
Result: The NE Profile Templates page is displayed, which shows the Search for NE
Profile Templates panel.
...................................................................................................................................................................................................
2 In the Profile User field, enter the profile user to search the Connection Profile templates
and the Standard profile templates.
...................................................................................................................................................................................................
3 Enter the search criteria for the specific NE profile template that you want to view and
click the Search button.
Result: The NE Profile Template search table panel is displayed with data that meets
your search criteria.
Profile Management View the OMS NE Profile Template
....................................................................................................................................................................................................................................
....................................................................................................................................................................................................................................
4-12 365-315-148R6.4 Issue 1
March 2011
E N D O F S T E P S...................................................................................................................................................................................................
Create an OMS NE Profile Template
When to use
Use this task to create the OMS NE Profile Templates.
Related Information
See the following topics in this document:
• “View the OMS NE Profile Template” (p. 4-12)
• “Modify an OMS NE Profile Template” (p. 4-15)
• “Delete an OMS NE Profile Template” (p. 4-17)
Before you begin
You cannot create Factory profile templates. User-defined profile templates are created by
selecting an existing OMS NE profile template and copying it, giving the copied profile
template a new profile name and a new set of values. The value of the Profile User is set
to Standard. The Profile group value, however, must remain the same as in the template
that is copied.
Task
Complete the following steps to create an OMS NE profile template.
...................................................................................................................................................................................................
1 Use the icons or the object links to follow this path: Profiles > NE Profile Templates.
Result: The NE Profile Templates page is displayed, which shows the Search for NE
Profile Templates panel.
...................................................................................................................................................................................................
2 Enter the search criteria for an OMS NE profile template similar to that which you want
to create and click the Search button.
Result: The NE Profile Templates search table panel is displayed with data that meets
your search criteria.
...................................................................................................................................................................................................
3 Click the radio button next to the OMS NE profile template similar to that which you
want to create.
...................................................................................................................................................................................................
4 Select the Copy option on the Go menu.
Profile Management Create an OMS NE Profile Template
....................................................................................................................................................................................................................................
....................................................................................................................................................................................................................................
365-315-148R6.4 Issue 1
March 2011
4-13
Result: The Modify NE Profile Template Details page is displayed.
...................................................................................................................................................................................................
5 Enter new information for the OMS NE profile template that you want to create in any of
the editable fields.
...................................................................................................................................................................................................
6 Click the Submit button.
Result: A new OMS NE Profile Template is created in the management system.
Profile Management Create an OMS NE Profile Template
....................................................................................................................................................................................................................................
....................................................................................................................................................................................................................................
4-14 365-315-148R6.4 Issue 1
March 2011
E N D O F S T E P S...................................................................................................................................................................................................
Modify an OMS NE Profile Template
When to use
Use this task to view the OMS NE Profile Templates page, from which you can modify an
OMS NE profile template.
Related Information
See the following topics in this document:
• “Create an OMS NE Profile Template” (p. 4-13)
• “View the OMS NE Profile Template” (p. 4-12)
• “Delete an OMS NE Profile Template” (p. 4-17)
Before you begin
This task does not have any preconditions.
Task
Complete the following steps to modify an OMS NE profile template.
...................................................................................................................................................................................................
1 Use the icons or the object links to follow this path: Profiles > NE Profile Templates.
Result: The NE Profile Templates page is displayed, which shows the Search for NE
Profile Templates panel.
...................................................................................................................................................................................................
2 Enter the search criteria for the specific OMS NE profile template that you want to
modify and click the Search button.
Result: The NE Profile Templates search table panel is displayed with data that meets
your search criteria.
...................................................................................................................................................................................................
3 Click the radio button next to the OMS NE profile template that you want to modify.
...................................................................................................................................................................................................
4 Select the Modify option on the Go menu.
Result: The Modify NE Profile Template Details page is displayed.
...................................................................................................................................................................................................
5 Enter changing information in any of the editable fields.
Note: Be sure that values entered are within the required ranges.
Profile Management Modify an OMS NE Profile Template
....................................................................................................................................................................................................................................
....................................................................................................................................................................................................................................
365-315-148R6.4 Issue 1
March 2011
4-15

...................................................................................................................................................................................................
6 Click the Submit button.
Result: The OMS NE Profile Template is modified in the management system.
Profile Management Modify an OMS NE Profile Template
....................................................................................................................................................................................................................................
....................................................................................................................................................................................................................................
4-16 365-315-148R6.4 Issue 1
March 2011
E N D O F S T E P S...................................................................................................................................................................................................
Delete an OMS NE Profile Template
When to use
Use this task to delete an OMS NE Profile Template. You must have valid permissions to
delete OMS NE profile templates.
Deleting a OMS NE profile template only affects the management system profiles, and
does not change the profiles stored on any NE in the network. To delete a profile from a
network element, see “Delete an NE Profile” (p. 4-10).
Related Information
See the following topics in this document:
• “Create an OMS NE Profile Template” (p. 4-13)
• “Modify an OMS NE Profile Template” (p. 4-15)
• “View the OMS NE Profile Template” (p. 4-12)
Before you begin
This task does not have any preconditions.
Task
Complete the following steps to delete an OMS NE profile template.
...................................................................................................................................................................................................
1 Use the icons or the object links to follow this path: Profiles > NE Profile Templates.
Result: The NE Profile Templates page is displayed, which shows the Search for NE
Profile Templates panel.
...................................................................................................................................................................................................
2 Enter the search criteria for the specific OMS NE profile template that you want to delete
and click the Search button.
Result: The NE Profile Templates search table panel is displayed with data that meets
your search criteria.
...................................................................................................................................................................................................
3 Click the radio button next to the OMS NE profile template that you want to delete.
...................................................................................................................................................................................................
4 Select the Delete option on the Go menu.
Profile Management Delete an OMS NE Profile Template
....................................................................................................................................................................................................................................
....................................................................................................................................................................................................................................
365-315-148R6.4 Issue 1
March 2011
4-17

Result: A confirmation box is displayed requesting verification before the OMS NE
profile template is deleted.
...................................................................................................................................................................................................
5 Click Yes.
Result: The OMS NE profile template is deleted from the management system profile
templates. Profiles stored on any NE in the network are not affected.
Profile Management Delete an OMS NE Profile Template
....................................................................................................................................................................................................................................
....................................................................................................................................................................................................................................
4-18 365-315-148R6.4 Issue 1
March 2011
E N D O F S T E P S...................................................................................................................................................................................................
Assign an OMS TCA Profile to an NE
When to use
Use this task to select an OMS TCA profile and assign it to an NE.
Related Information
See the following topics in this document:
• “Assign Threshold Profiles to Termination Points from PM Points Page ” (p. 4-21)
Before you begin
See “OMS Profile Assignment to NEs” (p. 4-2).
Task
Complete the following steps to assign an OMS TCA profile to an NE.
...................................................................................................................................................................................................
1 Use the icons or the object links to follow this path: Profiles > NE Profile Templates.
Result: The NE Profile Templates page is displayed, which shows the Search for NE
Profile Templates panel.
...................................................................................................................................................................................................
2 Enter the search criteria for the specific OMS NE profile template that you want to assign
to an NE.
Result: The NE Profile Templates search table panel is displayed with data that meets
your search criteria.
...................................................................................................................................................................................................
3 Select the OMS NE profile templates that you want to assign to an NE. The selected
templates should have the same NE type and applied to the same NE release.
...................................................................................................................................................................................................
4 Select the Apply to NE option on the Go menu.
Profile Management Assign an OMS TCA Profile to an NE
....................................................................................................................................................................................................................................
....................................................................................................................................................................................................................................
365-315-148R6.4 Issue 1
March 2011
4-19
Result: The Download to NE page is displayed. If the user has selected multiple
selections option, the system checks whether all the selected NE Profile Templates are
applied to the same release of the NE and have a different Profile Group. If all checks
pass the system will perform the download. When the user attempts to download an
NE Profile Template to an NE and if the existing NE profile has the same name, the
system will overwrite the profile with the selected NE Profile Template. When the
Profile Template values marked as OFF then the Profile Template will not be
download to the NE. The Job Updates page displays a message when an NE Profile
Template is successfully downloaded.
...................................................................................................................................................................................................
5 In the Select NE Name panel, select the NE Name from the drop-down list. The items in
the drop-down list are based on the NE type of the profile. Only one selection can be
chosen for this release.
...................................................................................................................................................................................................
6 Click Submit.
Result: The OMS NE profile templates are downloaded to the management system
and assigned to the selected NEs.
Profile Management Assign an OMS TCA Profile to an NE
....................................................................................................................................................................................................................................
....................................................................................................................................................................................................................................
4-20 365-315-148R6.4 Issue 1
March 2011
E N D O F S T E P S...................................................................................................................................................................................................
Assign Threshold Profiles to Termination Points from PM Points
Page
When to use
Use this task to select termination points from the PM Points page, and then request that a
specific TCA profile be assigned to the selected termination points.
Related Information
See the following topics in this document:
• “Assign an OMS TCA Profile to an NE” (p. 4-19)
Before you begin
See “OMS Profile Assignment to NEs” (p. 4-2).
A profile template must be applied to the NE before attempting to assign a port with that
profile.
Task
Complete the following steps to assign threshold profiles to TPs from the PM Points
page.
...................................................................................................................................................................................................
1 View a list of PM-capable NE termination points using the “View a List of PM-Capable
Termination Points” (p. 3-69).
Result: A list of PM-capable NE termination points is displayed at the bottom of the
Performance Measurement Points page with data that meets your search criteria.
...................................................................................................................................................................................................
2 Click the check boxes next to the port names to which you want to assign a threshold
profiles.
...................................................................................................................................................................................................
3 Select the Assign Threshold option on the Go menu.
Result: The Set TCA Threshold Level from Profile Template page is displayed.
...................................................................................................................................................................................................
4 Select the Optical Management System (OMS) NE Profile Template from the drop-down
list. You can select multiple NEs of the same type and download.
...................................................................................................................................................................................................
5 Click the Submit button.
Profile Management Assign Threshold Profiles to Termination Points from PM
Points Page
....................................................................................................................................................................................................................................
....................................................................................................................................................................................................................................
365-315-148R6.4 Issue 1
March 2011
4-21

Result: The selected threshold profiles are assigned to termination points.
Profile Management Assign Threshold Profiles to Termination Points from PM
Points Page
....................................................................................................................................................................................................................................
....................................................................................................................................................................................................................................
4-22 365-315-148R6.4 Issue 1
March 2011
E N D O F S T E P S...................................................................................................................................................................................................
Enable an NE Profile
When to use
Use this task to enable an NE profile.
Use this option with the WSM network element only.
Related Information
See the following topics in this document:
• “Assign Threshold Profiles to Termination Points from PM Points Page ” (p. 4-21)
Before you begin
See “OMS Profile Assignment to NEs” (p. 4-2).
Task
Complete the following steps to enable a profile on the WSM network elements.
...................................................................................................................................................................................................
1 Use the icons or the object links to follow this path: Profiles > NE Profiles.
Result: The NE Profile Templates page is displayed, which shows the Search for NE
Profile Templates panel.
...................................................................................................................................................................................................
2 Select the Alarm button for Profile Class.
...................................................................................................................................................................................................
3 Select an Select Metropolis® WSM from the NE type pull-down list.
Note that only WSM NEs will be displayed on the available list.
...................................................................................................................................................................................................
4 Select the NE by selecting one from the list in the Available list. Click the right arrow (>)
button to add the NE the Selected window.
Result; The NE is displayed in the Selected window.
...................................................................................................................................................................................................
5 Select a Profile Group from the Profile Group list.
...................................................................................................................................................................................................
6 Select Submit.
Profile Management Enable an NE Profile
....................................................................................................................................................................................................................................
....................................................................................................................................................................................................................................
365-315-148R6.4 Issue 1
March 2011
4-23

Result: The NE Profiles table displays.
...................................................................................................................................................................................................
7 Select a row from the NE Profiles table.
...................................................................................................................................................................................................
8 Select the Enable option on the Go menu.
Result: The profile is enabled on the NE.
Profile Management Enable an NE Profile
....................................................................................................................................................................................................................................
....................................................................................................................................................................................................................................
4-24 365-315-148R6.4 Issue 1
March 2011
E N D O F S T E P S...................................................................................................................................................................................................
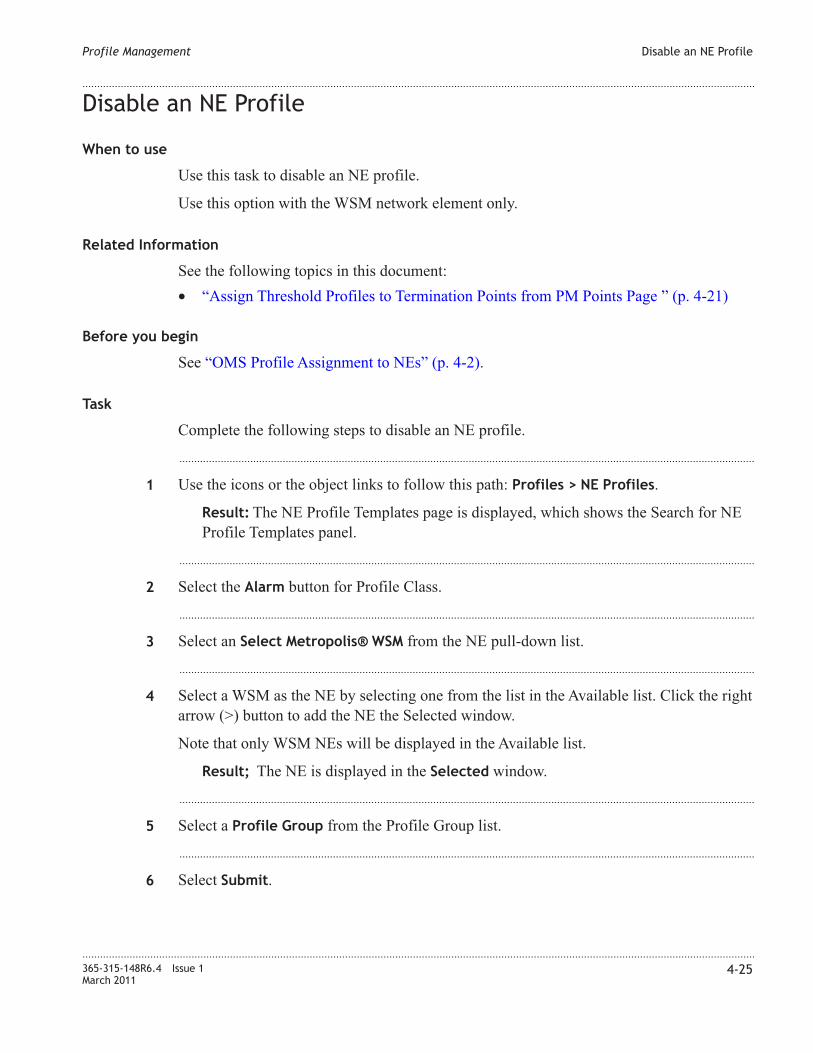
Disable an NE Profile
When to use
Use this task to disable an NE profile.
Use this option with the WSM network element only.
Related Information
See the following topics in this document:
• “Assign Threshold Profiles to Termination Points from PM Points Page ” (p. 4-21)
Before you begin
See “OMS Profile Assignment to NEs” (p. 4-2).
Task
Complete the following steps to disable an NE profile.
...................................................................................................................................................................................................
1 Use the icons or the object links to follow this path: Profiles > NE Profiles.
Result: The NE Profile Templates page is displayed, which shows the Search for NE
Profile Templates panel.
...................................................................................................................................................................................................
2 Select the Alarm button for Profile Class.
...................................................................................................................................................................................................
3 Select an Select Metropolis® WSM from the NE pull-down list.
...................................................................................................................................................................................................
4 Select a WSM as the NE by selecting one from the list in the Available list. Click the right
arrow (>) button to add the NE the Selected window.
Note that only WSM NEs will be displayed in the Available list.
Result; The NE is displayed in the Selected window.
...................................................................................................................................................................................................
5 Select a Profile Group from the Profile Group list.
...................................................................................................................................................................................................
6 Select Submit.
Profile Management Disable an NE Profile
....................................................................................................................................................................................................................................
....................................................................................................................................................................................................................................
365-315-148R6.4 Issue 1
March 2011
4-25

Result: The NE Profiles table displays.
...................................................................................................................................................................................................
7 Select a row from the NE Profiles table.
...................................................................................................................................................................................................
8 Select the Disable option on the Go menu.
Result: The profile is simply disabled on the NE.
Profile Management Disable an NE Profile
....................................................................................................................................................................................................................................
....................................................................................................................................................................................................................................
4-26 365-315-148R6.4 Issue 1
March 2011
E N D O F S T E P S...................................................................................................................................................................................................
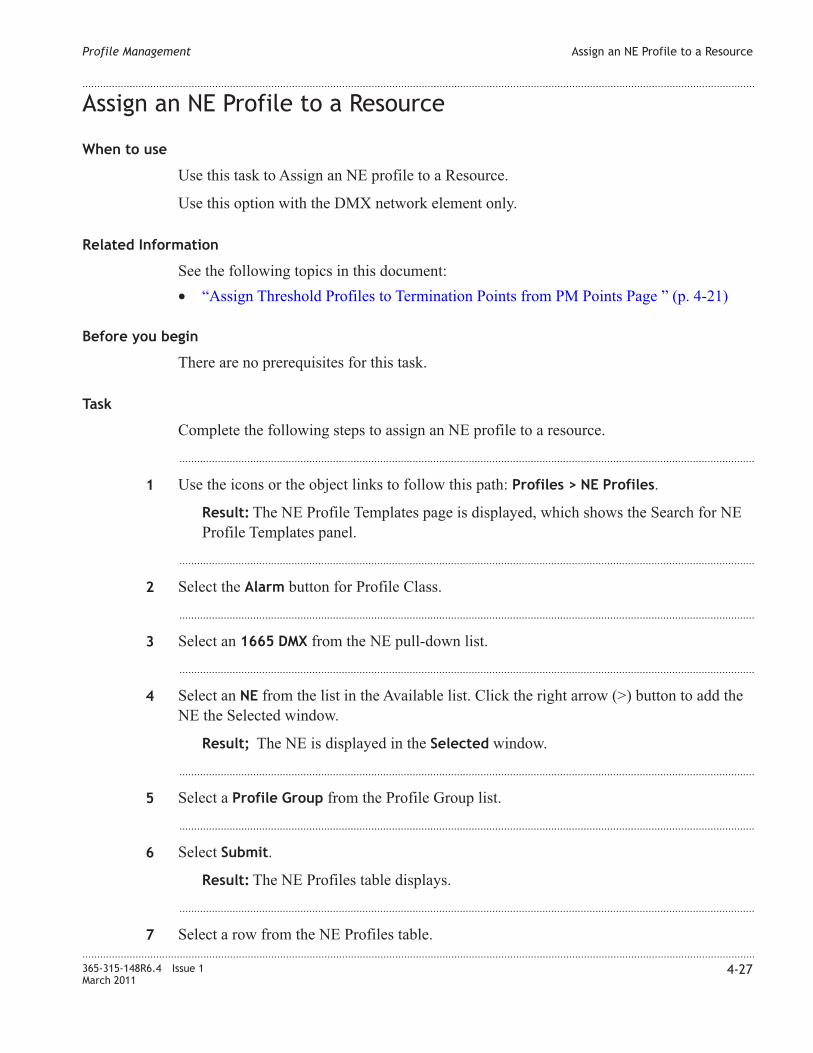
Assign an NE Profile to a Resource
When to use
Use this task to Assign an NE profile to a Resource.
Use this option with the DMX network element only.
Related Information
See the following topics in this document:
• “Assign Threshold Profiles to Termination Points from PM Points Page ” (p. 4-21)
Before you begin
There are no prerequisites for this task.
Task
Complete the following steps to assign an NE profile to a resource.
...................................................................................................................................................................................................
1 Use the icons or the object links to follow this path: Profiles > NE Profiles.
Result: The NE Profile Templates page is displayed, which shows the Search for NE
Profile Templates panel.
...................................................................................................................................................................................................
2 Select the Alarm button for Profile Class.
...................................................................................................................................................................................................
3 Select an 1665 DMX from the NE pull-down list.
...................................................................................................................................................................................................
4 Select an NE from the list in the Available list. Click the right arrow (>) button to add the
NE the Selected window.
Result; The NE is displayed in the Selected window.
...................................................................................................................................................................................................
5 Select a Profile Group from the Profile Group list.
...................................................................................................................................................................................................
6 Select Submit.
Result: The NE Profiles table displays.
...................................................................................................................................................................................................
7 Select a row from the NE Profiles table.
Profile Management Assign an NE Profile to a Resource
....................................................................................................................................................................................................................................
....................................................................................................................................................................................................................................
365-315-148R6.4 Issue 1
March 2011
4-27
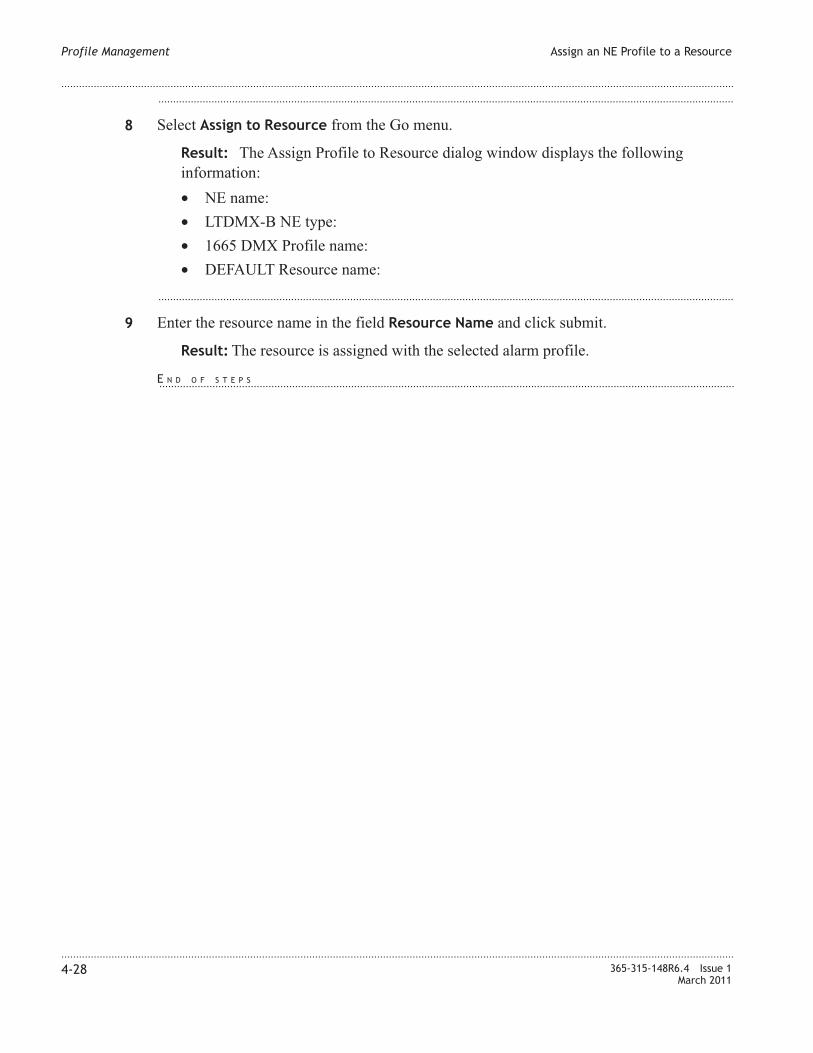
...................................................................................................................................................................................................
8 Select Assign to Resource from the Go menu.
Result: The Assign Profile to Resource dialog window displays the following
information:
• NE name:
• LTDMX-B NE type:
• 1665 DMX Profile name:
• DEFAULT Resource name:
...................................................................................................................................................................................................
9 Enter the resource name in the field Resource Name and click submit.
Result: The resource is assigned with the selected alarm profile.
Profile Management Assign an NE Profile to a Resource
....................................................................................................................................................................................................................................
....................................................................................................................................................................................................................................
4-28 365-315-148R6.4 Issue 1
March 2011
E N D O F S T E P S...................................................................................................................................................................................................
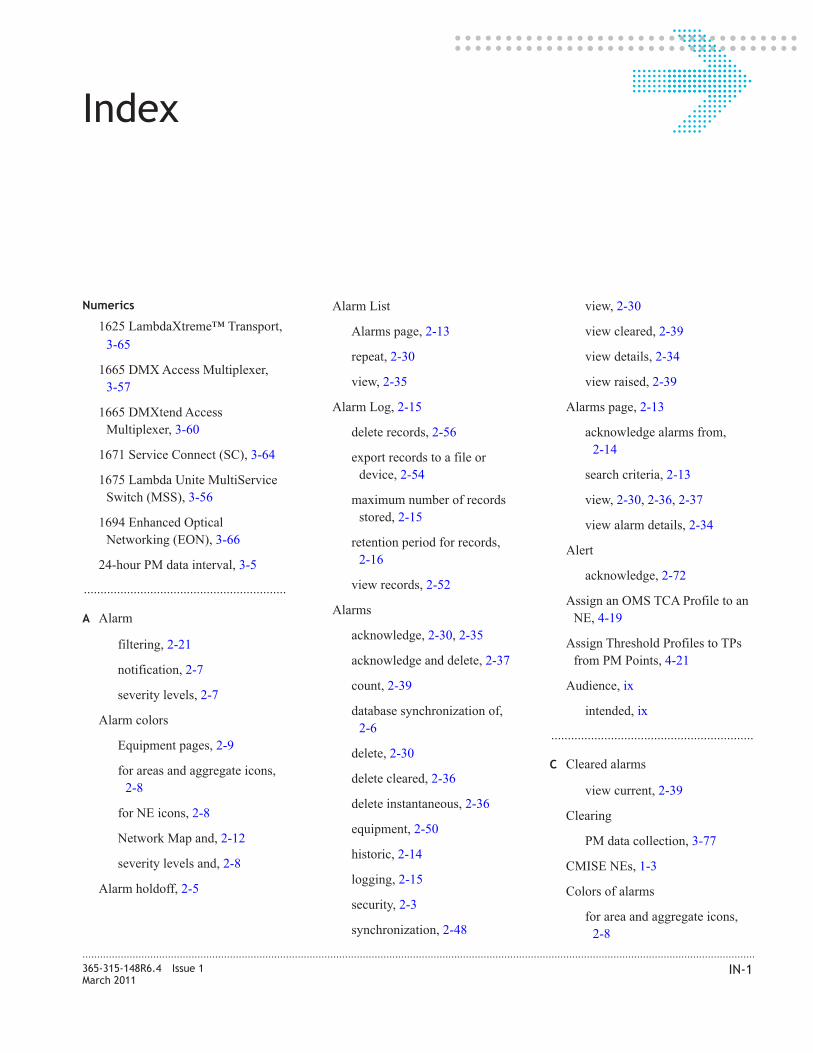
Index
Numerics
1625 LambdaXtreme™ Transport,
3-65
1665 DMX Access Multiplexer,
3-57
1665 DMXtend Access
Multiplexer, 3-60
1671 Service Connect (SC), 3-64
1675 Lambda Unite MultiService
Switch (MSS), 3-56
1694 Enhanced Optical
Networking (EON), 3-66
24-hour PM data interval, 3-5
.............................................................
A Alarm
filtering, 2-21
notification, 2-7
severity levels, 2-7
Alarm colors
Equipment pages, 2-9
for areas and aggregate icons,
2-8
for NE icons, 2-8
Network Map and, 2-12
severity levels and, 2-8
Alarm holdoff, 2-5
Alarm List
Alarms page, 2-13
repeat, 2-30
view, 2-35
Alarm Log, 2-15
delete records, 2-56
export records to a file or
device, 2-54
maximum number of records
stored, 2-15
retention period for records,
2-16
view records, 2-52
Alarms
acknowledge, 2-30, 2-35
acknowledge and delete, 2-37
count, 2-39
database synchronization of,
2-6
delete, 2-30
delete cleared, 2-36
delete instantaneous, 2-36
equipment, 2-50
historic, 2-14
logging, 2-15
security, 2-3
synchronization, 2-48
view, 2-30
view cleared, 2-39
view details, 2-34
view raised, 2-39
Alarms page, 2-13
acknowledge alarms from,
2-14
search criteria, 2-13
view, 2-30, 2-36, 2-37
view alarm details, 2-34
Alert
acknowledge, 2-72
Assign an OMS TCA Profile to an
NE, 4-19
Assign Threshold Profiles to TPs
from PM Points, 4-21
Audience, ix
intended, ix
.............................................................
C Cleared alarms
view current, 2-39
Clearing
PM data collection, 3-77
CMISE NEs, 1-3
Colors of alarms
for area and aggregate icons,
2-8
....................................................................................................................................................................................................................................
365-315-148R6.4 Issue 1
March 2011
IN-1
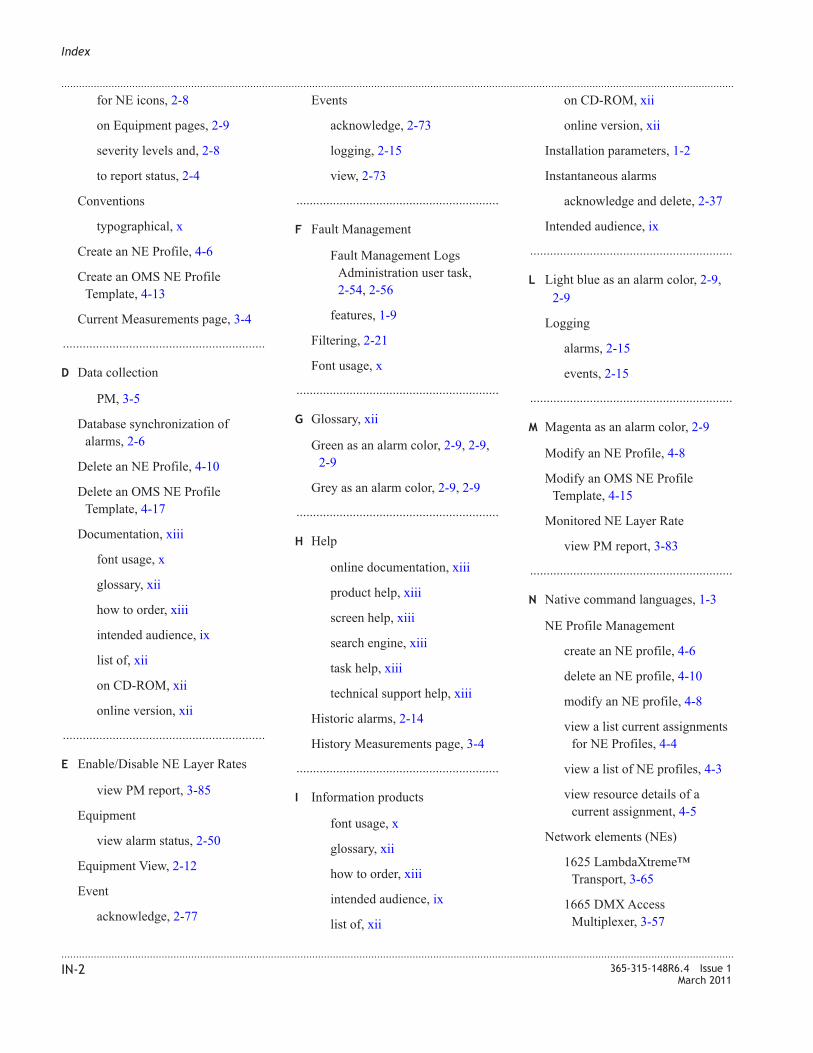
for NE icons, 2-8
on Equipment pages, 2-9
severity levels and, 2-8
to report status, 2-4
Conventions
typographical, x
Create an NE Profile, 4-6
Create an OMS NE Profile
Template, 4-13
Current Measurements page, 3-4
.............................................................
D Data collection
PM, 3-5
Database synchronization of
alarms, 2-6
Delete an NE Profile, 4-10
Delete an OMS NE Profile
Template, 4-17
Documentation, xiii
font usage, x
glossary, xii
how to order, xiii
intended audience, ix
list of, xii
on CD-ROM, xii
online version, xii
.............................................................
E Enable/Disable NE Layer Rates
view PM report, 3-85
Equipment
view alarm status, 2-50
Equipment View, 2-12
Event
acknowledge, 2-77
Events
acknowledge, 2-73
logging, 2-15
view, 2-73
.............................................................
F Fault Management
Fault Management Logs
Administration user task,
2-54, 2-56
features, 1-9
Filtering, 2-21
Font usage, x
.............................................................
G Glossary, xii
Green as an alarm color, 2-9, 2-9,
2-9
Grey as an alarm color, 2-9, 2-9
.............................................................
H Help
online documentation, xiii
product help, xiii
screen help, xiii
search engine, xiii
task help, xiii
technical support help, xiii
Historic alarms, 2-14
History Measurements page, 3-4
.............................................................
I Information products
font usage, x
glossary, xii
how to order, xiii
intended audience, ix
list of, xii
on CD-ROM, xii
online version, xii
Installation parameters, 1-2
Instantaneous alarms
acknowledge and delete, 2-37
Intended audience, ix
.............................................................
L Light blue as an alarm color, 2-9,
2-9
Logging
alarms, 2-15
events, 2-15
.............................................................
M Magenta as an alarm color, 2-9
Modify an NE Profile, 4-8
Modify an OMS NE Profile
Template, 4-15
Monitored NE Layer Rate
view PM report, 3-83
.............................................................
N Native command languages, 1-3
NE Profile Management
create an NE profile, 4-6
delete an NE profile, 4-10
modify an NE profile, 4-8
view a list current assignments
for NE Profiles, 4-4
view a list of NE profiles, 4-3
view resource details of a
current assignment, 4-5
Network elements (NEs)
1625 LambdaXtreme™
Transport, 3-65
1665 DMX Access
Multiplexer, 3-57
Index
....................................................................................................................................................................................................................................
....................................................................................................................................................................................................................................
IN-2 365-315-148R6.4 Issue 1
March 2011
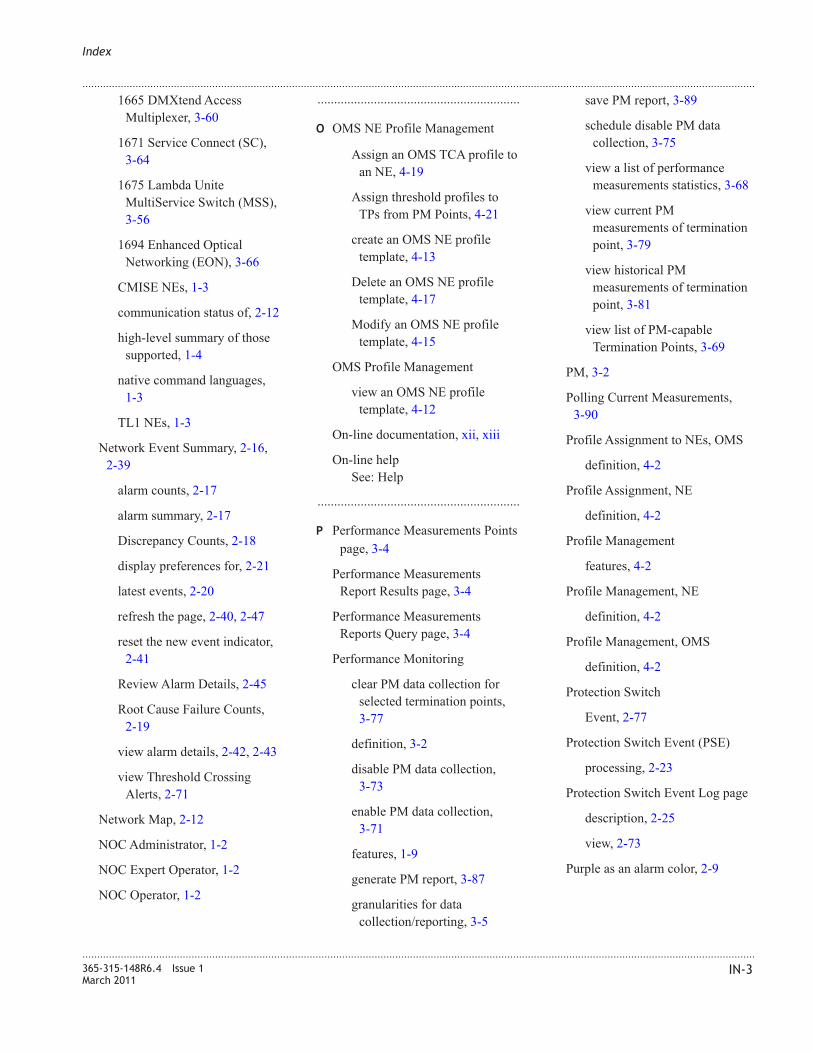
1665 DMXtend Access
Multiplexer, 3-60
1671 Service Connect (SC),
3-64
1675 Lambda Unite
MultiService Switch (MSS),
3-56
1694 Enhanced Optical
Networking (EON), 3-66
CMISE NEs, 1-3
communication status of, 2-12
high-level summary of those
supported, 1-4
native command languages,
1-3
TL1 NEs, 1-3
Network Event Summary, 2-16,
2-39
alarm counts, 2-17
alarm summary, 2-17
Discrepancy Counts, 2-18
display preferences for, 2-21
latest events, 2-20
refresh the page, 2-40, 2-47
reset the new event indicator,
2-41
Review Alarm Details, 2-45
Root Cause Failure Counts,
2-19
view alarm details, 2-42, 2-43
view Threshold Crossing
Alerts, 2-71
Network Map, 2-12
NOC Administrator, 1-2
NOC Expert Operator, 1-2
NOC Operator, 1-2
.............................................................
O OMS NE Profile Management
Assign an OMS TCA profile to
an NE, 4-19
Assign threshold profiles to
TPs from PM Points, 4-21
create an OMS NE profile
template, 4-13
Delete an OMS NE profile
template, 4-17
Modify an OMS NE profile
template, 4-15
OMS Profile Management
view an OMS NE profile
template, 4-12
On-line documentation, xii, xiii
On-line help
See: Help
.............................................................
P Performance Measurements Points
page, 3-4
Performance Measurements
Report Results page, 3-4
Performance Measurements
Reports Query page, 3-4
Performance Monitoring
clear PM data collection for
selected termination points,
3-77
definition, 3-2
disable PM data collection,
3-73
enable PM data collection,
3-71
features, 1-9
generate PM report, 3-87
granularities for data
collection/reporting, 3-5
save PM report, 3-89
schedule disable PM data
collection, 3-75
view a list of performance
measurements statistics, 3-68
view current PM
measurements of termination
point, 3-79
view historical PM
measurements of termination
point, 3-81
view list of PM-capable
Termination Points, 3-69
PM, 3-2
Polling Current Measurements,
3-90
Profile Assignment to NEs, OMS
definition, 4-2
Profile Assignment, NE
definition, 4-2
Profile Management
features, 4-2
Profile Management, NE
definition, 4-2
Profile Management, OMS
definition, 4-2
Protection Switch
Event, 2-77
Protection Switch Event (PSE)
processing, 2-23
Protection Switch Event Log page
description, 2-25
view, 2-73
Purple as an alarm color, 2-9
Index
....................................................................................................................................................................................................................................
....................................................................................................................................................................................................................................
365-315-148R6.4 Issue 1
March 2011
IN-3
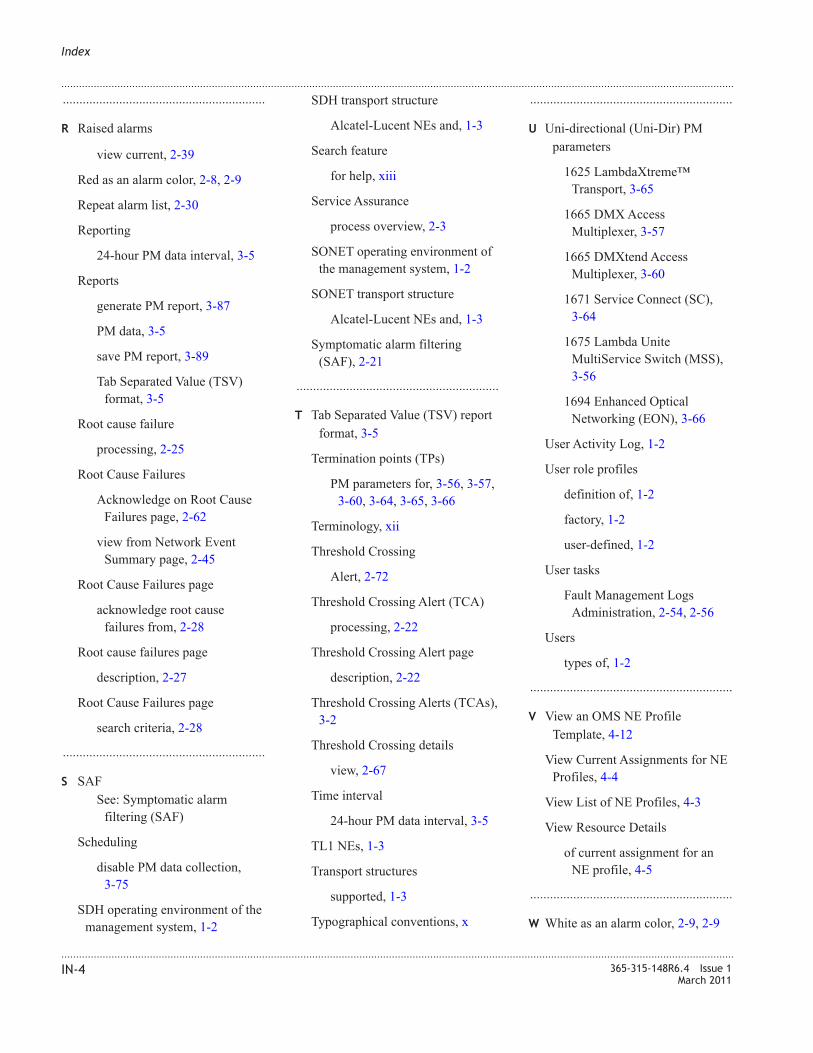
.............................................................
R Raised alarms
view current, 2-39
Red as an alarm color, 2-8, 2-9
Repeat alarm list, 2-30
Reporting
24-hour PM data interval, 3-5
Reports
generate PM report, 3-87
PM data, 3-5
save PM report, 3-89
Tab Separated Value (TSV)
format, 3-5
Root cause failure
processing, 2-25
Root Cause Failures
Acknowledge on Root Cause
Failures page, 2-62
view from Network Event
Summary page, 2-45
Root Cause Failures page
acknowledge root cause
failures from, 2-28
Root cause failures page
description, 2-27
Root Cause Failures page
search criteria, 2-28
.............................................................
S SAF
See: Symptomatic alarm
filtering (SAF)
Scheduling
disable PM data collection,
3-75
SDH operating environment of the
management system, 1-2
SDH transport structure
Alcatel-Lucent NEs and, 1-3
Search feature
for help, xiii
Service Assurance
process overview, 2-3
SONET operating environment of
the management system, 1-2
SONET transport structure
Alcatel-Lucent NEs and, 1-3
Symptomatic alarm filtering
(SAF), 2-21
.............................................................
T Tab Separated Value (TSV) report
format, 3-5
Termination points (TPs)
PM parameters for, 3-56, 3-57,
3-60, 3-64, 3-65, 3-66
Terminology, xii
Threshold Crossing
Alert, 2-72
Threshold Crossing Alert (TCA)
processing, 2-22
Threshold Crossing Alert page
description, 2-22
Threshold Crossing Alerts (TCAs),
3-2
Threshold Crossing details
view, 2-67
Time interval
24-hour PM data interval, 3-5
TL1 NEs, 1-3
Transport structures
supported, 1-3
Typographical conventions, x
.............................................................
U Uni-directional (Uni-Dir) PM
parameters
1625 LambdaXtreme™
Transport, 3-65
1665 DMX Access
Multiplexer, 3-57
1665 DMXtend Access
Multiplexer, 3-60
1671 Service Connect (SC),
3-64
1675 Lambda Unite
MultiService Switch (MSS),
3-56
1694 Enhanced Optical
Networking (EON), 3-66
User Activity Log, 1-2
User role profiles
definition of, 1-2
factory, 1-2
user-defined, 1-2
User tasks
Fault Management Logs
Administration, 2-54, 2-56
Users
types of, 1-2
.............................................................
V View an OMS NE Profile
Template, 4-12
View Current Assignments for NE
Profiles, 4-4
View List of NE Profiles, 4-3
View Resource Details
of current assignment for an
NE profile, 4-5
.............................................................
W White as an alarm color, 2-9, 2-9
Index
....................................................................................................................................................................................................................................
....................................................................................................................................................................................................................................
IN-4 365-315-148R6.4 Issue 1
March 2011

.............................................................
Y Yellow as an alarm color, 2-8, 2-9
Index
....................................................................................................................................................................................................................................
....................................................................................................................................................................................................................................
365-315-148R6.4 Issue 1
March 2011
IN-5

Index
....................................................................................................................................................................................................................................
....................................................................................................................................................................................................................................
IN-6 365-315-148R6.4 Issue 1
March 2011