'BDU #PPL - Mississippi University for Women
82
-
Upload
khangminh22 -
Category
Documents
-
view
3 -
download
0
Transcript of 'BDU #PPL - Mississippi University for Women


MISSISSIPPI UNIVERSITY FOR WOMEN Fact Book 2014-15Table of Contents
Organizational Chart.................................................................................................................................1MUW Vision, Mission, & Guiding Principles .........................................................................................2MUW Goals ................................................................................................................................................4MUW Profile ..............................................................................................................................................5EAC Report Card ......................................................................................................................................7
1. First-Time Student 1.1 First-Time Freshman Enrollment & Funnel Rates: Fall Terms................................................... 91.2 First-Time, Full-Time Bachelor’s Degree Seeking Freshman Headcount: Graph: Fall Terms... 101.3 First-Time, Full-Time Bachelor’s Degree Seeking Freshman Cohort Retention
& Graduation Rates ..................................................................................................................... 111.4 First-Time, Full-Time Bachelor’s Degree Seeking Freshman ACT & SAT Scores: Fall Terms 121.5 First-Time Transfer Enrollment & Funnel Rates: Fall Terms .................................................... 131.6 First-Time, Full-Time Bachelor’s Degree Seeking Transfer Headcount: Graph: Fall Terms..... 141.7 First-Time, Full-Time Bachelor’s Degree Seeking Transfer Cohort Retention
& Graduation Rates ..................................................................................................................... 15
2. Student Enrollment2.1 Unduplicated Headcount and FTE Enrollment: Fall Terms ........................................................ 162.2 Unduplicated Headcount and FTE Enrollment: Spring Terms.................................................... 172.3 Unduplicated Headcount and FTE Enrollment: Summer Terms................................................. 182.4 Duplicated Headcount by Campus: Fall Terms........................................................................... 192.5 Unduplicated Enrollment by Gender: Fall Terms ....................................................................... 202.6 Unduplicated Enrollment by Race/Ethnicity: Fall Terms ........................................................... 212.7 Unduplicated Enrollment by Race/Ethnicity, Gender and FT/PT Status: Fall Terms................. 222.8 Unduplicated Enrollment and Credit Hr. Production by FT/PT Status: Fall Terms.................... 232.9 Unduplicated Enrollment by Student Classification: Fall Terms ................................................ 242.10 Unduplicated Enrollment by Credit Hrs. and Student Classification: Fall 2014......................... 252.11 Fiscal Year Headcount and FTE Enrollment............................................................................... 262.12 Unduplicated Enrollment by Age Distribution and Student Classification: Fall Terms ............. 272.13 Unduplicated Enrollment by Non-traditional and Traditional Students: Fall Terms .................. 282.14 Residence Hall Student Enrollment: Fall Terms ......................................................................... 292.15 Unduplicated Enrollment by Residence Hall and Commuter Students: Fall Terms ................... 302.16 Unduplicated Enrollment by State of Residence: Fall Terms...................................................... 312.17 Unduplicated Enrollment by Country: Fall Terms ...................................................................... 322.18 Unduplicated Enrollment by MS County: Fall Terms................................................................. 332.19 Unduplicated Enrollment by IHL Official API: Spring 2015...................................................... 362.20 Unduplicated Enrollment by IHL Official API: Fall 2014.......................................................... 37

3. Program Enrollment & Degrees Awarded3.1 Unduplicated Enrollment by Major and Concentration: Fall Terms ........................................... 383.2 Unduplicated Enrollment by College: Fall Terms....................................................................... 413.3 Class Type Enrollment: Fall Terms............................................................................................. 423.4 Credit Hour Generation by College & Department: 3 Years....................................................... 433.5 Online Credit Hour Generation by College and Department: 3 Years ........................................ 453.6 Degrees Awarded by IHL Official API: AY 2014 ...................................................................... 473.7 Degrees Awarded by Major/Concentration, Race/Ethnicity and Gender: AY 2014................... 483.8 Degrees Awarded: Chart: AY 2014............................................................................................. 503.9 History of Degrees Awarded by CIP: 5 Years............................................................................. 513.10 History of Degrees Awarded by Major and Gender: 5 Years ..................................................... 523.11 Top Bachelor and Master Degrees Awarded in the Last 5 Years: Chart..................................... 543.12 Breakdown of Degrees Awarded: 5 Years .................................................................................. 553.13 History of Degrees Awarded by Level: Chart: 10 Years ............................................................ 56
4. Faculty4.1 Faculty Profile ............................................................................................................................. 574.2 Faculty Credit Hour Production by Course Level ....................................................................... 58
5. Revenues and Expenditures5.1 Summary of Budgeted E&G Revenues and Expenditures .......................................................... 595.2 2014-2015 E&G Revenues by Budget Entity: Chart................................................................... 605.3 2014-2015 E&G Expenditures by Budget Entity: Chart ............................................................. 615.4 Authorization of State Gen. Obligation Bonds for MUW FY 1995-2014................................... 625.5 Authorization of State Gen. Obligation Bonds for IHL FY 1995-2014 ...................................... 63
MUW Accreditation Information............................................................................................................. 64MUW Organizational Chart – Provost/Vice President for Academic Affairs ..................................... 71MUW Organizational Chart – Academic Units ...................................................................................... 72APPENDIX: Explanation of Terms ......................................................................................................... 73

University Organizational Chart
Board of Trustees
Commissioner of Higher Education
University President
Provost/Vice President for
Academic Affairs
Senior Vice President for
Administration/Chief Financial Officer
Vice President for Student Affairs
Chief Information Officer
Executive Director, Development and Alumni Relations
Executive Director, University Relations
Internal Audit University Counsel
Page 1 of 79

Vision
Mission
Revised August 15, 2013
Guiding Principles
Page 2 of 79

Approved by the Mississippi IHL Board on January 15, 2004
Page 3 of 79

Approved by the President in May of 2009
Page 4 of 79

MUW Profile
The W was listed 18th among the public Southern regional institutions in U.S. News & World Report, moving up from No. 20 last year, and is the only institution in the top 50 ranked with an in-state tuition of less than $6,000. For the third year in a row, The W has been ranked a top master's universities by Washington Monthly's College Rankings. The W is at No. 26 after appearing in Washington Monthly's rankings for the first time in 2010.
2,696 unduplicated students are enrolled at MUW for the Fall 2014 semester.
80 % are full-time students.81 % are female. 19 % are male.58 % are white.37 % are African-American.25 % are degree seeking new transfer students. 8 % are first-time, full-time bachelor’s degree seeking freshman students.
25.9 is the average age of a MUW student. 24.6 is the average age of a male student. 26.3 is the average age of a female student.62.6 % of MUW students are 24 years old or younger. 37.4 % of MUW students are 25 or older.
Student to Faculty FTE Ratio: The Student to Faculty FTE ratio is approximately 14 to 1.
MUW Employees
For the second year in a row, The W has been named one of the best colleges in the nation to work for, according to a survey by The Chronicle of Higher Education.
MUW has approximately 310 full-time employees.Approximately 71% of full-time employees are female.Approximately 29% of full-time employees are male.Approximately 18% of full-time employees are minorities.
MUW has approximately 115 part-time employees.
MUW is an affirmative action/equal opportunity institution.
Page 5 of 79

Student Fees: Academic Year 2014-2015
UndergraduateSemester Hour $235.00 (In-state)Semester Hour $640.00 (Out-of-state)
GraduateSemester Hour $313.50 (In-state)Semester Hour $853.50 (Out-of-state)
Grounds and BuildingsThe campus covers more than 114 acres within the historic district of central Columbus, MS. Twenty-three of more than 60 buildings are listed on the National Register of Historic Places.
Page 6 of 79

Mississippi University for WomenP.O. Box W 1613 • Columbus, MS 397011 877 462 8439www.muw.edu
This Institution University System AverageNumber Percent Number Percent
Student EnrollmentTotal Headcount Enrollment
UndergraduateGraduate & Professional
3,4873,223264
92.4%7.6%
11,8519,1642,687
77.3%22.7%
Total Full Time Equivalent (FTE) EnrollmentUndergraduateGraduate & Professional
2,5712,409162
93.7%6.3%
9,1197,5111,608
82.4%17.6%
New Undergraduate Students (Percent of Total Undergraduates)Entering FreshmenEntering Transfers MS Community CollegesEntering Transfers All Other Institutions
1,071206664201
33.2%6.4%20.6%6.2%
2,6021,382863357
28.4%15.1%9.4%3.9%
Undergraduate Enrollment in High Need DisciplinesScience, Technology, Engineering, Mathematics (STEM)Education (Including Non Teaching Areas)Nursing (All Undergraduate Levels)
117212998
3.6%6.6%31.0%
1,9561,212580
21.3%13.2%6.3%
Degrees AwardedUndergraduate Degrees per 100 Undergraduate FTE Enrollment 31.6 20.3Total Degrees Awarded
CertificateAssociateBaccalaureateGraduate and Professional
81704768882
0.0%5.8%84.2%10.0%
2,04078
1,462563
0.3%0.4%71.7%27.6%
Tuition and Financial AidUndergraduate Tuition (Fall and Spring terms) $5,316 $5,906Room (Double Occupancy) and Board (Average Meal Plan) $6,074 $6,761Total Undergraduate Scholarship and Financial Aid Dollars (in Millions)Average Financial Aid Award per Undergraduate StudentPercent of Undergraduate Students Receiving Financial AidPercent of Undergraduate Students Receiving Pell Grants
$11.2$5,350
84%49%
$34.3$6,147
78%54%
College ReadinessAverage ACT Score of Entering Freshmen, Fall 2012 22.0 22.3Students Enrolled in One or More Intermediate Courses, Fall 2012
Students Enrolled in intermediate math during first yearStudents Enrolled in intermediate English/reading during first yearStudents Enrolled in both math and English/reading during first year
123681540
55.3%12.2%32.5%
46625889119
55.4%19.1%25.5%
Fall 2010 intermediate math students completing math gateway course within 2 yearsFall 2010 intermediate English students completing English gateway course within 2 years
39.1%67.4%
39.7%62.0%
Student ProgressPercent of full time students completing 24 credit hours within one academic yearPercent of part time students completing 12 credit hours within one academic year
74.0%38.8%
70.5%44.3%
Percent of hours completed after one academic year, Fall 2012 through Summer 2013Entering FreshmenEntering Transfers – All InstitutionsAll Undergraduate Students
80.5%85.1%88.0%
85.6%84.3%88.7%
One Year Retention Rates for Entering Full Time Freshmen,Fall 2011 returning in Fall 2012 74% 77%
Student Graduation RatesFirst time, full time Freshman Cohort, Fall 2005 222 1,009
Cohort students graduating within 4 years (100% of normal time)Cohort students graduating within 6 years (150% of normal time)Cohort students graduating within 8 years (200% of normal time)
538789
23.9%39.2%40.1%
271502537
26.8%49.8%53.2%
Other University VariablesExternal Research Dollars – All Sources (in Millions), FY2012 13 $5.3 $42.9Student –Faculty Ratio, Fall 2012 14:1 17:1Percent of Full Time Instructional Faculty with Terminal Degree, Fall 2012 64.1% 77.2%
2012 13INSTITUTIONAL PROFILE
Page 7 of 79

Metric Explanations
Academic Year 2012 13 (AY2012 13) – The Institutional Profile is for the 2012 13 academic year and includes the Summer 2012, Fall 2012,and Spring 2013 terms. Some reporting terms may vary depending on the length of time for each metric.
University System Average – The university system average is based on eight institutions and includes the Medical Center with theUniversity of Mississippi in most instances. Figures including UMMC data are denoted with an asterisk (*).
Total Headcount Enrollment – Total headcount enrollment figures are unduplicated for the academic year. Academic level for enrollmentis based on the last term of attendance for the year. [Source: IHLMIS]
Total Full Time Equivalent (FTE) Enrollment – Total full time equivalent enrollment figures are based on undergraduate and graduatecredit hour activity over a 12 month period. Calculation uses a trailing summer in accordance with IPEDS. [Source: Federal IPEDS]
Entering Freshmen – Entering freshmen figures are based on an unduplicated count of entering freshmen at any point during the academicyear. [Source: IHLMIS]
Entering Transfers – Entering transfer figures are based on an unduplicated count of entering transfer students at any point during theacademic year from Mississippi’s community colleges and all other postsecondary institutions. [Source: IHLMIS]
Science, Technology, Engineering, Mathematics (STEM) Enrollment – STEM enrollment includes the number of undergraduate studentsmajoring in science, technology, engineering, and mathematics as defined by the National Science Foundation (NSF). A complete listing ofthe NSF STEM majors can be found at http://www.ice.gov/doclib/sevis/pdf/stem list.pdf [Source: IHLMIS]
Education (Including Non Teaching Areas) and Nursing Enrollment (All Undergraduate Levels) Enrollment Education enrollment includesthe number of undergraduate students majoring in any education discipline according to the 13 CIP code. This includes teaching and nonteaching education majors. Nursing enrollment includes the number of undergraduate students majoring in any nursing discipline.[Source: IHLMIS]
Undergraduate Degrees per 100 Undergraduate FTE Enrollment – Figures indicate the number of undergraduate degrees awarded per 100undergraduate FTE students. Undergraduate degrees include certificates, associates, and baccalaureate degrees. Undergraduate FTE isbased on an four year average of annual undergraduate FTE figures. [Source: Degrees – IHLMIS; Student FTE – Federal IPEDS]
Undergraduate Tuition, Room, and Board – Tuition figures represent undergraduate resident tuition for both the fall and spring terms.Room rates reflect double occupancy rates (most common) and Board rates reflect average meal plan. [Source: IHL Finance & Admin]
Financial Aid – Total undergraduate scholarship and financial aid figures include state, federal, institutional, and all other forms of financialaid known by the reporting institution. Average financial aid award per student is based on the total amount of financial aid divided by thenumber of eligible students. Percent of undergraduates receiving aid is based on institutional federal financial aid cohorts. [Source:Federal IPEDS]
Intermediate Enrollment – It should be noted that institutions have varying academic policies regarding intermediate enrollment.Intermediate enrollment includes the number of students taking one or more Intermediate courses. Figures are based on Fall 2011 dataand exclude the Academic Support Lab. Gateway courses for Mathematics include College Algebra, Elementary Statistics or equivalentcourses. Gateway courses for English include Composition, Writing, or equivalent courses. [Source: IHLMIS]
Student Progress – Full time status includes students taking 12 or more hours during the fall term while part time students includestudents taking less than 12 hours during the fall term. Students earning zero credit hours for the entire academic year were excluded fromthe metric since most were not enrolled for the entire academic year. [Source: IHLMIS]
Retention Rates – Retention rates reflect the percentage of first time, full time entering freshmen during the Fall 2011 term who return forthe Fall 2012 term. [Source: Federal IPEDS]
Graduate Rates – Graduation rates reflect the percentage of first time, full time freshmen during the Fall 2005 term who graduated at 4year (100% of normal time), 6 year (150% of normal time), and 8 year (200% of normal time) intervals. [Source: Federal IPEDS]
Student Faculty Ratio – Student faculty ratios are based on 12 month student FTE enrollment and FTE instructional faculty. [Source:Federal IPEDS]
Instructional Faculty with Terminal Degree – Figures represent the percentage of full time instructional faculty with a terminal or firstprofessional degree. Terminal degrees include master’s degrees in fine arts (M.F.A.), social work (M.S.W.) and library science (M.L.S.).[Source: IHLMIS]
2012 13INSTITUTIONAL PROFILE
Page 8 of 79

Fall 2010
Fall 2011
Fall 2012
Fall 2013
Fall 2014
5 Year #Change
5 Year %Change
6,095 5,698 4,970 5,793 9,036 2941 48%
22% 24% 31% 22% 8%
1,356 1,360 1,542 1,274 720 -636 -47%
42% 44% 44% 43% 94%
569 603 679 554 674 105 18%
35% 30% 28% 33% 36%
199 181 193 183 243 44 22%
Of those Enrolled
192 175 182 180 224 32 17%
0 0 3 1 1 1 100%
7 4 7 2 18 11 157%
0 1 1 0 0 0 0%
199 180 193 183 243 44 22%
**Starting Fall 2014, the definition of an applicant was changed to match IHL and IPEDS.
*Fall 2011 bachelor's cohort total changed from 176 to 175 after a student administratively withdrew from the university toward the end ofthe semester.
1.1 First-Time Freshman Enrollment & Funnel RatesFall 2010 - 2014
Conversion ratio from inquiry to application
Admit Rate from application to admit.
Yield rate from admission to enrollment
Inquiries
Applicants
First-time Part-time Other Degree Seeking
Total Degree Seeking Freshmen
Accepted
Enrolled
First-time Full-time Bachelor's Degree Seeking
First-time Part-time Bachelor's Degree Seeking
First-time Full-time Other Degree Seeking
0
200
400
600
800
1,000
1,200
1,400
1,600
Fall 2010 Fall 2011 Fall 2012 Fall 2013 Fall 2014
Applicants Accepted Enrolled
Page 9 of 79

222
198
212
239
210
192175 182 180
224
0
50
100
150
200
250
2005 2006 2007 2008 2009 2010 2011 2012 2013 2014
1.2 - First-time, Full-time Bachelor's Degree Seeking Freshman HeadcountFall 2005 - 2014
*In Fall 2006, our Pre-BSN, Pre-OT, and Pre-Engineering Students are included in the Other Degree Seeking Cohort instead of theBachelor's Degree Seeking Cohort. The Other Degree Seeking Cohorts includes ASN and Pre-ASN students for all ofthe fall semesters (2004-2013) included in the graph.
Page 10 of 79

Fall 2006 CohortEnrolled 198 131 66.16% 97 48.99% 89 44.95% 36 18.18% 21 10.61% 8 4.04% 5 2.53% 3 1.52%Graduated 0 0 0.00% 0 0.00% 2 1.01% 53 26.77% 70 35.35% 78 39.39% 80 40.40% 84 42.42% Total 198 131 66.16% 97 48.99% 91 45.96% 89 44.95% 91 45.96% 86 43.43% 85 42.93% 87 43.94%
Fall 2007 CohortEnrolled 212 145 68.40% 115 54.25% 105 49.53% 58 27.36% 24 11.32% 14 6.60% 9 4.25%Graduated 0 0 0.00% 0 0.00% 1 0.47% 46 21.70% 74 34.91% 83 39.15% 90 42.45% Total 212 145 68.40% 115 54.25% 106 50.00% 104 49.06% 98 46.23% 97 45.75% 99 46.70%
Fall 2008 CohortEnrolled 239 163 68.20% 122 51.05% 115 48.12% 54 22.59% 25 10.46% 6 2.51%Graduated 0 0 0.00% 0 0.00% 3 1.26% 54 22.59% 80 33.47% 98 41.00% Total 239 163 68.20% 122 51.05% 118 49.37% 108 45.19% 105 43.93% 104 43.51%
Fall 2009 CohortEnrolled 206 154 74.76% 126 61.17% 111 53.88% 50 24.27% 17 8.25%Graduated 0 0 0.00% 0 0.00% 1 0.49% 56 27.18% 89 43.20% Total 206 154 74.76% 126 61.17% 112 54.37% 106 51.46% 106 51.46%
Fall 2010 CohortEnrolled 192 144 75.00% 117 60.94% 107 55.73% 51 26.56%Graduated 0 0 0.00% 0 0.00% 0 0.00% 50 26.04% Total 192 144 75.00% 117 60.94% 107 55.73% 101 52.60%
Fall 2011 CohortEnrolled 174 128 73.56% 101 58.05% 93 53.45%Graduated 0 0 0.00% 0 0.00% 3 1.72% Total 174 128 73.56% 101 58.05% 96 55.17%
Fall 2012 CohortEnrolled 182 144 79.12% 107 58.79%Graduated 0 0 0.00% 0 0.00% Total 182 144 79.12% 107 58.79%
Fall 2013 CohortEnrolled 180 125 69.44%Graduated 0 0 0.00% Total 180 125 69.44%*Students receiving more than one degree are only counted once.**If a student receives an ASN degree, it is not reflected in this table.***Four students who are deceased were excluded from the Fall 2009 cohort.****One deceased student from the Fall 2006 cohort and one deceased student from the Fall 2011 cohort have been removed.
Fall 2020
Fall 2013 Fall 2014 Fall 2015 Fall 2016 Fall 2017 Fall 2018 Fall 2019 Fall 2020 Fall 2021
Fall 2019Fall 2015 Fall 2016 Fall 2017 Fall 2018Fall 2012
Fall 2016
Fall 2014 Fall 2015 Fall 2016 Fall 2017
Fall 2013 Fall 2015
Fall 2015 Fall 2016 Fall 2017 Fall 2018
Fall 2016 Fall 2017 Fall 2018 Fall 2019
Fall 2009 Fall 2010 Fall 2011 Fall 2012 Fall 2013
Fall 2008 Fall 2009 Fall 2010
Fall 2010 Fall 2011
1.3 - First-time Full-time Bachelor's Degree Seeking Freshman Cohort Retention & Graduation Rates
Fall 2012 Fall 2013 Fall 2014 Fall 2015
Fall 2006 Fall 2007 Fall 2008 Fall 2009 Fall 2010 Fall 2011 Fall 2012
Fall 2011
Fall 2013 Fall 2014
Fall 2007
Fall 2013 Fall 2014
Fall 2014
Fall 2011 Fall 2012 Fall 2013 Fall 2014 Fall 2015
Fall 2010 Fall 2011 Fall 2012 Fall 2013 Fall 2014
Fall 2008 Fall 2009 Fall 2012
Page 11 of 79

Fall 2010 - ACT Composite Math English Reading Science
Twenty-fifth percentile 19 17 19 19 19Fiftieth percentile 21 19 22 22 21Seventy-fifth percentile 24 22 26 27 24Average 21.96 20 22.83 23.07 21.29Minimum 14 14 12 12 13Maximum 34 32 36 36 34
Fall 2011 - ACT Composite Math English Reading Science
Twenty-fifth percentile 18 16 18 18 18Fiftieth percentile 21 19 21 22 20Seventy-fifth percentile 24 23 26 25 23Average 21.19 19.66 21.71 21.8 20.91Minimum 14 14 11 12 11Maximum 31 33 33 34 31
Fall 2012 - ACT Composite Math English Reading Science
Twenty-fifth percentile 19 17 20 19 19Fiftieth percentile 22 20 23 23 21Seventy-fifth percentile 25 23 27 28 24Average 22.18 19.95 23.03 23.58 21.51Minimum 13 13 10 11 13Maximum 31 30 35 36 33
Fall 2013 - ACT Composite Math English Reading ScienceTwenty-fifth percentile 18 17 18 18 18Fiftieth percentile 20 19 21 21 21Seventy-fifth percentile 24 22 25 26 23Average 21.08 19.42 21.63 22.15 20.61Minimum 14 13 9 11 11Maximum 31 29 35 36 30
Fall 2014 - ACT Composite Math English Reading Science ACT & ConvertedSAT Composite*
Converted SAT Composite SAT VERB SAT MATH
Twenty-fifth percentile 18 16 18 18 18 Twenty-fifth percentile 18 23 450 583Fiftieth percentile 20 18 20 21 20 Fiftieth percentile 21 24 475 620Seventy-fifth percentile 23 22 24 26 23 Seventy-fifth percentile 24 26 548 658Average 20.80 19.19 21.25 21.97 20.45 Average 21.25 24.10 493.33 617.33Minimum 13 14 12 11 9 Minimum 13 21 330 490Maximum 31 29 35 36 31 Maximum 31 30 720 730
*Includes both the ACT Composite Score and Converted SAT to ACT Composite Score
1.4 - First-time, Full-time Bachelor's Degree Seeking Freshman ACT & SAT ScoresFall 2010 - 2014
Fall 2014 ACT & SAT
18
19
20
21
22
23
24
2005 2006 2007 2008 2009 2010 2011 2012 2013 2014
ACT Average - 10 Year Trend
Composite Math
English Reading
Science
Page 12 of 79

Fall 2010
Fall 2011
Fall 2012
Fall 2013
Fall 2014
5 Year #Change
5 Year %Change
2,427 2,085 2,083 2,229 1,731 -696 -29%
54% 79% 83% 84% 62%
1,302 1,649 1,731 1,876 1,065 -237 -18%
46% 44% 47% 56% 93%
593 730 817 1,043 989 396 67%
71% 64% 67% 57% 67%
422 469 547 594 667 245 58%
Of those Enrolled
344 382 468 515 585*** 241 70%
32 41 36 35 33 1 3%
41 43 39 42 48 7 17%
5 3 4 2 1 -4 -80%
422 469 547 594 667 245 58%
Admit Rate from application to admit.
Yield rate from admission to enrollment
1.5 - First-time Transfer Enrollment & Funnel RatesFall 2010 - 2014
*Fall 2011 bachelor's cohort total changed from 346 to 344 after 2 students were administratively withdrew from the university toward the
Inquiries
Applicants
Accepted
Enrolled
First-time Full-time Bachelor's Degree Seeking
First-time Part-time Bachelor's Degree Seeking
First-time Full-time Other Degree Seeking
First-time Part-time Other Degree Seeking
Total Degree Seeking Transfers
Conversion ratio from inquiry to application
0
200
400
600
800
1,000
1,200
1,400
1,600
1,800
2,000
Fall 2010 Fall 2011 Fall 2012 Fall 2013 Fall 2014
Applicants
Accepted
Enrolled
Page 13 of 79
end of the semester.
**Starting Fall 2014, the definition of an applicant was changed to match IHL and IPEDS.
***One deceased student in the 2014 FTFT Bachelor's Degree Seeking Cohort was removed. This student is not included in the total.

237 237 226205
269
344
382
468
515
585
0
100
200
300
400
500
600
2005 2006 2007 2008 2009 2010 2011 2012 2013 2014
1.6 - First-time, Full-time Bachelor's Degree Seeking Transfer HeadcountFall 2005 - 2014
*In Fall 2006, our Pre-BSN, Pre-OT, and Pre-Engineering Students are included in the Other Degree Seeking Cohort instead of the Bachelor's Degree Seeking Cohort. The Other Degree Seeking Cohorts includes ASN and Pre-ASN students for all of the fall semesters (2004-2013) included in the graph.
Page 14 of 79

Fall 2006 CohortEnrolled 237 145 61.18% 98 41.35% 41 17.30% 12 5.06% 8 3.38% 4 1.69% 1 0.42% 2 0.84%
Graduated 5 2.11% 45 18.99% 98 41.35% 129 54.43% 133 56.12% 137 57.81% 141 59.49% 141 59.49%
Total 237 150 63.29% 143 60.34% 139 58.65% 141 59.49% 141 59.49% 141 59.49% 142 59.92% 143 60.34%
Fall 2007 CohortEnrolled 226 159 70.35% 98 43.36% 39 17.26% 18 7.96% 8 3.54% 5 2.21% 2 0.88%
Graduated 7 3.10% 60 26.55% 112 49.56% 134 59.29% 140 61.95% 148 65.49% 151 66.81%
Total 226 166 73.45% 158 69.91% 151 66.81% 152 67.26% 148 65.49% 153 67.70% 153 67.70%
Fall 2008 CohortEnrolled 205 137 66.83% 92 44.88% 41 20.00% 16 7.80% 6 2.93% 2 0.98%
Graduated 11 5.37% 46 22.44% 90 43.90% 110 53.66% 118 57.56% 122 59.51%
Total 205 148 72.20% 138 67.32% 131 63.90% 126 61.46% 124 60.49% 124 60.49%
Fall 2009 CohortEnrolled 269 169 62.83% 108 40.15% 44 16.36% 18 6.69% 7 2.60%
Graduated 0 25 9.29% 75 27.88% 137 50.93% 162 60.22% 171 63.57%
Total 269 194 72.12% 183 68.03% 181 67.29% 180 66.91% 178 66.17%
Fall 2010 CohortEnrolled 344 182 52.91% 104 30.23% 39 11.34% 8 2.33%
Graduated 64 18.60% 135 39.24% 194 56.40% 228 66.28%
Total 344 246 71.51% 239 69.48% 233 67.73% 236 68.60%
Fall 2011 CohortEnrolled 382 186 48.69% 91 23.82% 39 10.21%
Graduated 94 24.61% 177 46.34% 229 59.95%
Total 382 280 73.30% 268 70.16% 268 70.16%
Fall 2012 CohortEnrolled 468 185 39.53% 99 21.15%
Graduated 123 26.28% 218 46.58%
Total 468 308 65.81% 317 67.74%
Fall 2013 CohortEnrolled 515 176 34.17%
Graduated 223 43.30%
Total 515 399 77.48%*Students receiving more than one degree are only counted once.**If a student receives an ASN degree, it is not reflected in this table.***One deceased student from the 2008 cohort has been removed.****Fall 2006 Cohort numbers were adjusted because some ASN students were included in the table in prior fact books.*****Two administratively widthdrawn students were removed in the 2010 cohort.
Fall 2016
Fall 2012
1.7 - First-time Full-time Bachelor's Degree Seeking Transfer Cohort Retention & Graduation Rates
Fall 2013 Fall 2014 Fall 2015
Fall 2006 Fall 2007 Fall 2008
Fall 2008 Fall 2009 Fall 2010 Fall 2011 Fall 2012
Fall 2013 Fall 2014
Fall 2007 Fall 2008 Fall 2009 Fall 2010 Fall 2011 Fall 2012 Fall 2013 Fall 2014 Fall 2015
Fall 2009 Fall 2010 Fall 2011
Fall 2017
Fall 2015 Fall 2016 Fall 2017 Fall 2018
Fall 2014 Fall 2015 Fall 2016Fall 2009 Fall 2010 Fall 2011
Fall 2017 Fall 2018
Fall 2010 Fall 2011 Fall 2012 Fall 2013 Fall 2014
Fall 2014 Fall 2015
Fall 2012
Fall 2016 Fall 2017
Fall 2013
Fall 2019 Fall 2020
Fall 2011 Fall 2012 Fall 2013
Fall 2012 Fall 2013 Fall 2014 Fall 2015 Fall 2016
Fall 2018 Fall 2019
Fall 2018 Fall 2019 Fall 2020 Fall 2021Fall 2013 Fall 2014 Fall 2015 Fall 2016 Fall 2017
Page 15 of 79
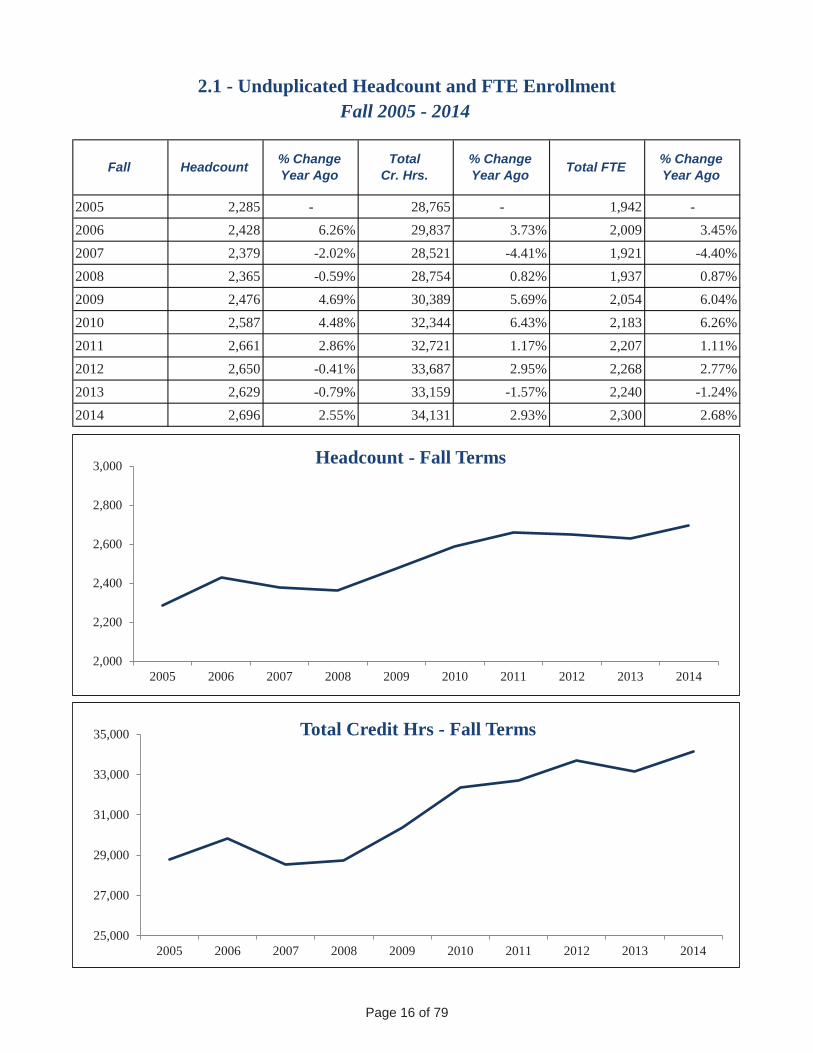
2005 2,285 - 28,765 - 1,942 -2006 2,428 6.26% 29,837 3.73% 2,009 3.45%2007 2,379 -2.02% 28,521 -4.41% 1,921 -4.40%2008 2,365 -0.59% 28,754 0.82% 1,937 0.87%2009 2,476 4.69% 30,389 5.69% 2,054 6.04%2010 2,587 4.48% 32,344 6.43% 2,183 6.26%2011 2,661 2.86% 32,721 1.17% 2,207 1.11%2012 2,650 -0.41% 33,687 2.95% 2,268 2.77%2013 2,629 -0.79% 33,159 -1.57% 2,240 -1.24%2014 2,696 2.55% 34,131 2.93% 2,300 2.68%
% ChangeYear AgoTotal FTE
2.1 - Unduplicated Headcount and FTE EnrollmentFall 2005 - 2014
HeadcountFall % ChangeYear Ago
TotalCr. Hrs.
% ChangeYear Ago
2,000
2,200
2,400
2,600
2,800
3,000
2005 2006 2007 2008 2009 2010 2011 2012 2013 2014
Headcount - Fall Terms
25,000
27,000
29,000
31,000
33,000
35,000
2005 2006 2007 2008 2009 2010 2011 2012 2013 2014
Total Credit Hrs - Fall Terms
Page 16 of 79

2.2 - Unduplicated Headcount and FTE EnrollmentSpring 2006 - 2015
2,000
2,200
2,400
2,600
2006 2007 2008 2009 2010 2011 2012 2013 2014 2015
Headcount - Spring Terms
25,000
27,000
29,000
31,000
33,000
35,000
2006 2007 2008 2009 2010 2011 2012 2013 2014 2015
Total Credit Hrs - Spring Terms
Page 17 of 79
2006 2,214 - 27,317 - 1,844 -
2007 2,276 2.80% 27,502 0.68% 1,852 0.43%
2008 2,197 -3.47% 26,671 -3.02% 1,797 -2.98%
2009 2,283 3.91% 27,284 2.30% 1,843 2.57%
2010 2,433 6.57% 28,846 5.72% 1,950 5.85%
2011 2,541 4.44% 31,008 7.49% 2,092 7.24%
2012 2,536 -0.20% 31,056 0.15% 2,095 0.17%
2013 2,596 2.37% 32,358 4.19% 2,180 4.05%
2014 2,507 -3.43% 30,992 -4.22% 2,093 -3.99%
2015 2,558 2.03% 31,908 2.96% 2,151 2.77%
% Change
Year AgoTotal FTEHeadcountSpring
% Change
Year Ago
Total
Cr. Hrs.
% Change
Year Ago

2005 1,107 - 7,286 - 504 -
2006 1,040 -6.05% 6,615 -9.21% 460 -8.81%
2007 1,084 4.23% 6,347 -4.05% 440 -4.24%
2008 1,040 -4.06% 6,310 -0.58% 439 -0.30%
2009 1,144 10.00% 7,650 21.24% 534 21.49%
2010 1,300 13.64% 10,070 31.63% 695 30.21%
2011 1,434 10.31% 12,188 21.03% 834 20.04%
2012 1,338 -6.69% 11,177 -8.30% 765 -8.27%
2013 1,245 -6.95% 10,085 -9.77% 692 -9.54%
2014 1,258 1.04% 11,375 12.79% 778 12.43%
*For summer 2005 to summer 2007, numbers are from the end of the semester as reported to IHL. IHL changed its reporting policy prior toAY 2008-09 so that summer files are now comprised of merged data from beginning of the semester archive dates for each part of term.
Summer 2005 - 20142.3 - Unduplicated Headcount and FTE Enrollment
Summer Headcount % Change Year Ago
Total Cr. Hrs.
% Change Year Ago Total FTE % Change
Year Ago
800
1,000
1,200
1,400
1,600
2005 2006 2007 2008 2009 2010 2011 2012 2013 2014
Headcount - Summer Terms
5,000
7,500
10,000
12,500
15,000
2005 2006 2007 2008 2009 2010 2011 2012 2013 2014
Total Credit Hours - Summer Terms
Page 18 of 79
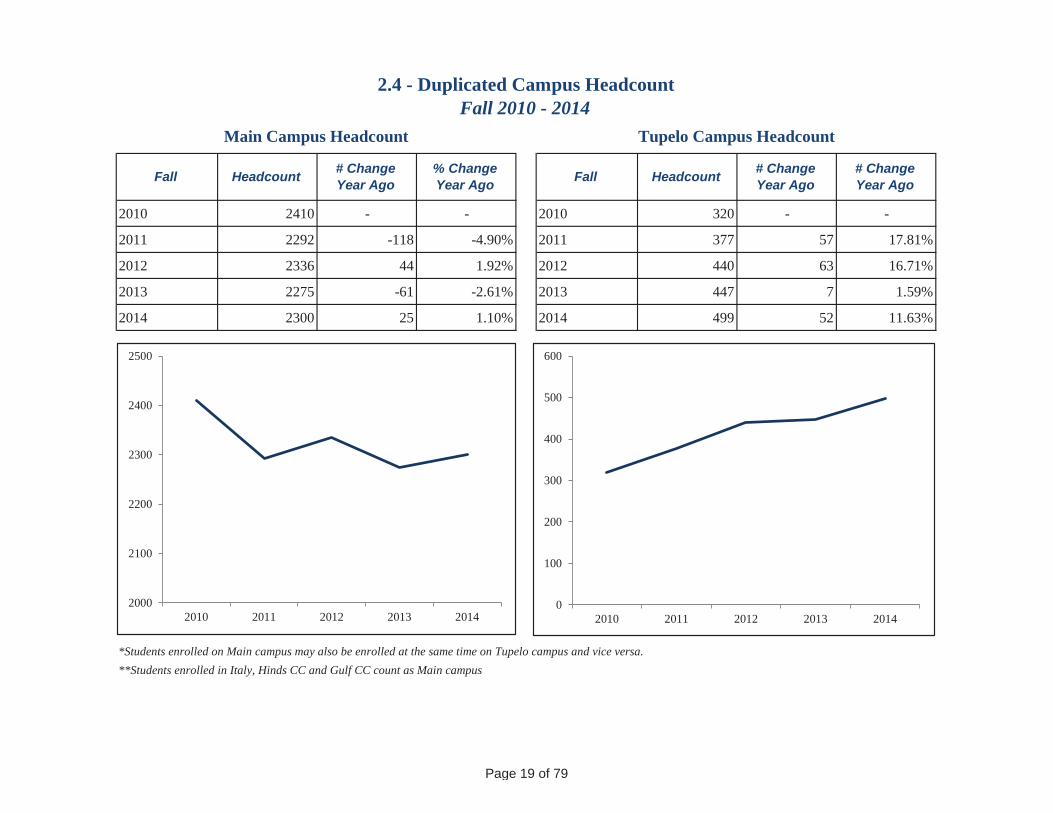
2010 2410 - - 2010 320 - -
2011 2292 -118 -4.90% 2011 377 57 17.81%
2012 2336 44 1.92% 2012 440 63 16.71%
2013 2275 -61 -2.61% 2013 447 7 1.59%
2014 2300 25 1.10% 2014 499 52 11.63%
*Students enrolled on Main campus may also be enrolled at the same time on Tupelo campus and vice versa. **Students enrolled in Italy, Hinds CC and Gulf CC count as Main campus
2.4 - Duplicated Campus HeadcountFall 2010 - 2014
Headcount # ChangeYear Ago
% ChangeYear AgoFall
Main Campus Headcount
Fall Headcount # ChangeYear Ago
# ChangeYear Ago
Tupelo Campus Headcount
2000
2100
2200
2300
2400
2500
2010 2011 2012 2013 20140
100
200
300
400
500
600
2010 2011 2012 2013 2014
Page 19 of 79

# % ofTotal
%Change
Year Ago# % of
Total
%Change
Year Ago#
%Change
Year Ago2005 1,936 84.7% - 349 15.3% - 2,285 -2006 2,060 84.8% 6.40% 368 15.2% 5.44% 2,428 6.26%2007 2,010 84.5% -2.43% 369 15.5% 0.27% 2,379 -2.02%2008 1,984 83.9% -1.29% 381 16.1% 3.25% 2,365 -0.59%2009 2,025 81.8% 2.07% 451 18.2% 18.37% 2,476 4.69%2010 2,133 82.5% 5.33% 454 17.5% 0.67% 2,587 4.48%2011 2,207 82.9% 3.47% 454 17.1% 0.00% 2,661 2.86%2012 2,203 83.1% -0.18% 447 16.9% -1.54% 2,650 -0.41%2013 2,154 81.9% -2.22% 475 18.1% 6.26% 2,629 -0.79%2014 2,192 81.3% 1.76% 504 18.7% 6.11% 2,696 2.55%
Fall
Total
2.5 - Unduplicated Enrollment by GenderFall 2005 - 2014
Female Male
1,700
1,800
1,900
2,000
2,100
2,200
2,300
2005 2006 2007 2008 2009 2010 2011 2012 2013 2014
Female Enrollment 10 Year Trend
200
300
400
500
600
2005 2006 2007 2008 2009 2010 2011 2012 2013 2014
Male Enrollment 10 Year Trend
Page 20 of 79

# % # % # % # % # %2005 1,514 66.2% 694 30.4% 77 3.4% 0 0.0% 2,285 100.0%
2006 1,562 64.3% 773 31.9% 93 3.8% 0 0.0% 2,428 100.0%
2007 1,501 63.1% 790 33.2% 88 3.7% 0 0.0% 2,379 100.0%
2008 1,421 60.1% 846 35.8% 98 4.1% 0 0.0% 2,365 100.0%
2009 1,459 58.9% 910 36.8% 107 4.3% 0 0.0% 2,476 100.0%
2010 1,503 58.1% 965 37.3% 110 4.3% 9 0.3% 2,587 100.0%
2011 1,550 58.2% 1,011 38.0% 100 3.8% 0 0.0% 2,661 100.0%
2012 1,557 58.7% 993 37.5% 100 3.8% 0 0.0% 2,650 100.0%
2013 1,536 58.4% 970 36.9% 123 4.7% 0 0.0% 2,629 100.0%
2014 1,573 58.4% 987 36.6% 136 5.0% 0 0.0% 2,696 100.0%
*Other students includes Hispanic/Latino, American Indian/Alaskan Native, Asian, Native Hawaiian/Pacific Islander, Multi-racial, and Non-resident Alien students.
2.6 - Unduplicated Enrollment by Race/EthnicityFall 2005 - 2014
White Black/African-American Other TotalDid Not Report
Fall
0
200
400
600
800
1,000
1,200
1,400
1,600
1,800
2005 2006 2007 2008 2009 2010 2011 2012 2013 2014
WhiteBlack/African-AmericanOther
Page 21 of 79

Female Male Total Female Male Total Female Male Total Female Male Total Female Male Total2010 630 83 713 50 23 73 955 214 1,169 6 3 9 1,641 323 1,9642011 667 85 752 44 21 65 998 204 1,202 0 0 0 1,709 310 2,0192012 677 91 768 61 9 70 1,042 213 1,255 0 0 0 1,780 313 2,0932013 647 90 737 68 24 92 1,001 216 1,217 0 0 0 1,716 330 2,0462014 688 103 791 77 27 104 1,024 230 1,254 0 0 0 1,789 360 2,149
Female Male Total Female Male Total Female Male Total Female Male Total Female Male Total2010 225 27 252 19 18 37 248 86 334 0 0 0 492 131 6232011 233 26 259 19 16 35 246 102 348 0 0 0 498 144 6422012 204 21 225 15 15 30 204 98 302 0 0 0 423 134 5572013 206 27 233 17 14 31 215 104 319 0 0 0 438 145 5832014 174 22 196 13 19 32 216 103 319 0 0 0 403 144 547
Female Male Total Female Male Total Female Male Total Female Male Total Female Male Total2010 855 110 965 69 41 110 1,203 300 1,503 6 3 9 2,133 454 2,5872011 900 111 1,011 63 37 100 1,244 306 1,550 0 0 0 2,207 454 2,6612012 881 112 993 76 24 100 1,246 311 1,557 0 0 0 2,203 447 2,6502013 853 117 970 85 38 123 1,216 320 1,536 0 0 0 2,154 475 2,6292014 862 125 987 90 46 136 1,240 333 1,573 0 0 0 2,192 504 2,696
*Other students includes Hispanic/Latino, American Indian/Alaskan Native, Asian, Native Hawaiian/Pacific Islander, Multi-racial, and Non-resident Alien students.
Part-Time TotalBlack/African American Other White
FallUniversity Total
Black/African American Other White Did Not Report
Fall
Part-Time
University Total
Did Not Report
Full-Time Total
2.7 - Unduplicated Enrollment by Race/Ethnicity, Gender, Full-time/Part-timeFall 2010 - 2014
Black/African American OtherFall White
Full-Time
Did Not Report
Page 22 of 79

Total Total
2005 1,668 73% 77 3% 1,745 447 20% 93 4% 540 2,285
2006 1,734 71% 71 3% 1,805 546 22% 77 3% 623 2,428
2007 1,662 70% 72 3% 1,734 560 24% 85 4% 645 2,379
2008 1,666 70% 62 3% 1,728 527 22% 110 5% 637 2,365
2009 1,758 71% 97 4% 1,855 514 21% 107 4% 621 2,476
2010 1,881 73% 83 3% 1,964 513 20% 110 4% 623 2,587
2011 1,937 73% 82 3% 2,019 541 20% 101 4% 642 2,661
2012 2,009 76% 84 3% 2,093 494 19% 63 2% 557 2,650
2013 1,945 74% 101 4% 2,046 484 18% 99 4% 583 2,629
2014 2,065 77% 84 3% 2,149 462 17% 85 3% 547 2,696
Total Total
2005 24,848 86% 1,008 4% 25,856 2,424 8% 485 2% 2,909 28,765
2006 25,541 86% 821 3% 26,362 3,110 10% 365 1% 3,475 29,837
2007 24,321 85% 777 3% 25,098 3,042 11% 381 1% 3,423 28,521
2008 24,514 85% 685 2% 25,199 3,011 10% 544 2% 3,555 28,754
2009 25,580 84% 1,131 4% 26,711 3,097 10% 581 2% 3,678 30,389
2010 27,599 85% 988 3% 28,587 3,149 10% 608 2% 3,757 32,344
2011 27,799 85% 975 3% 28,774 3,375 10% 572 2% 3,947 32,721
2012 29,386 87% 2,956 9% 32,342 976 3% 369 1% 1,345 33,687
2013 28,476 85% 1,184 4% 29,660 2,921 9% 578 2% 3,499 33,159
2014 30,053 88% 1,002 3% 31,055 2,582 8% 494 1% 3,076 34,131
Fall
HeadcountTotalFull-time Part-time
UG GRFall
UG GR
Credit Hours by Student LevelTotal
2.8 - Unduplicated Enrollment and Credit Hour Production by FT/PT StatusFall 2005 - 2014
Note 1: Part-time is defined as UG enrolled 11 Cr. hrs or less or GR enrolled 8 Cr. Hrs or less.Note 2: Full-time is defined as UG enrolled 12 Cr. Hrs or more or GR enrolled 9 Cr. Hrs or more.Note 3: FT and PT headcount and credit hours data are based on the IHL archive date, which is between day 10 and day 15 of enrollment each semester.
Full-time Part-timeUG GR UG GR
Page 23 of 79

Fall Freshman Sophomore Junior Senior Graduate Total
2005 531 339 494 751 170 2,2852006 606 356 483 835 148 2,4282007 593 301 533 795 157 2,3792008 575 296 479 843 172 2,3652009 554 344 509 865 204 2,4762010 509 337 598 950 193 2,5872011 489 305 644 1,040 183 2,6612012 500 303 686 1,014 147 2,6502013 473 345 656 955 200 2,6292014 549 414 647 917 169 2,696
2.9 - Unduplicated Enrollment by Student ClassificationFall 2005 - 2014
0
200
400
600
800
1000
1200
2005 2006 2007 2008 2009 2010 2011 2012 2013 2014
Student Clasification 10 year Trend
Freshman Sophomore Junior Senior Graduate
Page 24 of 79

HC FTE HC FTE HC FTE HC FTE HC FTE HC FTE1 3 0.2 1 0.1 0 0.0 10 0.7 0 0.0 14 0.9
2 0 0.0 0 0.0 0 0.0 4 0.5 0 0.0 4 0.5
3 95 19.0 6 1.2 6 1.2 25 5.0 5 1.3 137 27.7
4 2 0.5 0 0.0 1 0.3 7 1.9 5 1.7 15 4.3
5 0 0.0 1 0.3 0 0.0 2 0.7 0 0.0 3 1.0
6 90 36.0 11 4.4 21 8.4 73 29.2 69 34.5 264 112.5
7 2 0.9 0 0.0 1 0.5 11 5.1 3 1.8 17 8.3
8 0 0.0 0 0.0 0 0.0 4 2.1 3 2.0 7 4.1
9 11 6.6 6 3.6 5 3.0 37 22.2 6 4.5 65 39.9
10 5 3.3 6 4.0 3 2.0 5 3.3 15 12.5 34 25.2
11 0 0.0 1 0.7 4 2.9 3 2.2 1 0.9 9 6.8
12 51 40.8 56 44.8 158 126.4 197 157.6 21 21.0 483 390.6
13 86 74.5 50 43.3 68 58.9 73 63.3 40 43.3 317 283.4
14 44 41.1 17 15.9 24 22.4 38 35.5 0 0.0 123 114.8
15 66 66.0 158 158.0 248 248.0 225 225.0 1 1.3 698 698.3
16 33 35.2 34 36.3 37 39.5 90 96.0 0 0.0 194 206.9
17 36 40.8 19 21.5 19 21.5 18 20.4 0 0.0 92 104.3
18 21 25.2 29 34.8 33 39.6 64 76.8 0 0.0 147 176.4
19 4 5.1 15 19.0 17 21.5 20 25.3 0 0.0 56 70.9
20 0 0.0 2 2.7 1 1.3 5 6.7 0 0.0 8 10.7
21 0 0.0 2 2.8 0 0.0 4 5.6 0 0.0 6 8.4
22 0 0.0 0 0.0 1 1.5 1 1.5 0 0.0 2 2.9
23 0 0.0 0 0.0 0 0.0 1 1.5 0 0.0 1 1.5
Grand Total 549 395.3 414 393.4 647 598.9 917 788.1 169 124.7 2,696 2,300
Sophomore Junior Senior Graduate
2.10 - Unduplicated Enrollment by Credit Hours & Student ClassificationFall 2014
Sem.Hours Freshman
Class GrandTotal
Page 25 of 79

FY 2009 FY 2010 FY 2011 FY 2012 FY 2013 FY 2014# Changefrom 09
to 14
% Changefrom 09
to 14
Undergraduate Headcount 2,688 2,860 2,928 3,222 3,090 2,921 233 9%
Undergraduate FTE 1,987 2,151 2,370 2,379 2,409 2,368 381 19%
Graduate Headcount 279 306 271 261 228 286 7 3%
Graduate FTE 169 198 182 176 162 191 22 13%
Total Headcount 2,967 3,166 3,199 3,483 3,318 3,207 240 8%
Total FTE 2,156 2,349 2,552 2,555 2,571 2,559 403 19%
*Numbers are Taken from IPEDS Reporting.**FY is defined as July 1 - June 30.
2.11 - Fiscal Year Headcount and FTE EnrollmentFY 2009 - 2014
2,967 3,166 3,1993,483 3,318 3,207
2,156 2,349 2,552 2,555 2,571 2,559
FY 2009 FY 2010 FY 2011 FY 2012 FY 2013 FY 2014
Total Headcount vs Total FTE
Total Headcount Total FTE
Page 26 of 79

FA 13 FA 14 FA 13 FA 14 FA 13 FA 14 FA 13 FA 14 FA 13 FA 14 FA 13 FA 14
Under 18 149 183 0 0 0 0 0 0 0 0 149 183
18 and 19 257 286 77 69 9 9 1 0 0 0 344 364
20 and 21 37 55 115 150 231 252 152 145 1 1 536 603
22 to 24 7 5 58 65 141 121 335 305 42 41 583 537
25 to 29 7 10 41 42 90 87 181 168 48 39 367 346
30 to 34 5 1 10 25 51 59 106 101 34 32 206 218
35 to 39 1 1 22 23 42 47 69 66 33 28 167 165
40 to 49 2 1 18 30 68 58 74 88 23 19 185 196
50 to 64 6 6 4 10 22 14 28 34 19 9 79 73
65 and Over 2 1 0 0 2 0 9 10 0 0 13 11
Unknown 0 0 0 0 0 0 0 0 0 0 0 0
Total 473 549 345 414 656 647 955 917 200 169 2,629 2,696
FA 05 FA 06 FA 07 FA 08 FA 09 FA 10 FA 11 FA 12 FA 13 FA 14
Average Age 25.7 25.2 25.2 24.9 25.5 26.1 26.7 26.6 26.2 25.9
Average Age Men 25.5 24.7 23.4 23.3 23.6 23.9 25.6 25.6 25.2 24.6
Average Age Women 25.8 25.2 25.5 25.2 25.9 26.6 27.0 26.8 26.5 26.3
2.12 - Unduplicated Enrollment by Age Distribution and Student ClassificationFall 2013 vs Fall 2014
Freshman Sophomore Junior Senior Graduate TotalAge Group
Page 27 of 79

HC % HC % HC % HC % HC % HC %
2005 464 20.31% 357 15.62% 821 35.93% 1,281 56.06% 183 8.01% 1,464 64.07% 2,285
2006 459 18.90% 351 14.46% 810 33.36% 1,346 55.44% 272 11.20% 1,618 66.64% 2,428
2007 440 18.50% 347 14.59% 787 33.08% 1,294 54.39% 298 12.53% 1,592 66.92% 2,379
2008 400 16.91% 363 15.35% 763 32.26% 1,328 56.15% 274 11.59% 1,602 67.74% 2,365
2009 543 21.93% 354 14.30% 897 36.23% 1,312 52.99% 267 10.78% 1,579 63.77% 2,476
2010 652 25.20% 367 14.19% 1,019 39.39% 1,312 50.72% 256 9.90% 1,568 60.61% 2,587
2011 705 26.49% 396 14.88% 1,101 41.38% 1,314 49.38% 246 9.24% 1,560 58.62% 2,661
2012 760 28.68% 311 11.74% 1,071 40.42% 1,333 50.30% 246 9.28% 1,579 59.58% 2,650
2013 702 26.70% 315 11.98% 1,017 38.68% 1,344 51.13% 268 10.19% 1,612 61.32% 2,629
2014 754 27.97% 255 9.46% 1,009 37.43% 1,395 51.74% 292 10.83% 1,687 62.57% 2,696
*Non-traditional Students are defined as those who are at least 25 years of age.**HC = Headcount*** Part-time is defined as UG enrolled 11 Cr. hrs or less or GR enrolled 8 Cr. Hrs or less****Full-time is defined as UG enrolled 12 Cr. Hrs or more or GR enrolled 9 Cr. Hrs or more.
2.13 - Unduplicated Enrollment by Non-traditional and Traditional StudentsFall 2005 - 2014
TotalFull-Time Part-Time Full-Time Part-TimeTotal
TraditionalNon-traditional
FallTrad. &
Non-Trad. Total
Page 28 of 79

Residence Hall Fall 05 Fall 06 Fall 07 Fall 08 Fall 09 Fall 10 Fall 11 Fall 12 Fall 13 Fall 14
Callaway 116 94 88 100 102 89 92 107 107 110
Columbus 46 46 51 50 50 45 43 41 45 50
Frazier 0 0 0 0 0 0 0 0 0 0
Goen 35 0 0 0 0 0 0 0 0 0
Grossnickle 35 37 42 42 43 42 42 43 41 44
Hastings-Simmons 51 49 55 52 44 41 49 48 51 48
Jones 105 164 165 176 152 154 147 157 145 136
Kincannon 166 175 163 174 175 177 162 170 153 182
Total 554 565 564 594 566 548 535 566 542 570
Residence Hall Black Other White Total Men Women Total
Callaway 56 1 53 110 0 110 110
Columbus 20 2 28 50 50 0 50
Grossnickle 1 4 39 44 7 37 44
Hastings-Simmons 18 4 26 48 0 48 48
Jones 82 6 48 136 0 136 136
Kincannon 93 26 63 182 54 128 182
Total 270 43 257 570 111 459 570
Grossnickle
Hastings-Simmons
Jones
Kincannon
Total
2.14 - Residence Hall Student EnrollmentFall 2005 - 2014
Residence Hall Enrollment by Ethnicity and Gender: Fall 2014
Residence Hall
Callaway
Columbus
Page 29 of 79

# % # % # %
2005 554 24.25% 1,731 75.75% 2,285 100%
2006 565 23.27% 1,863 76.73% 2,428 100%
2007 564 23.71% 1,815 76.29% 2,379 100%
2008 594 25.12% 1,771 74.88% 2,365 100%
2009 566 22.86% 1,910 77.14% 2,476 100%
2010 548 21.18% 2,039 78.82% 2,587 100%
2011 535 20.11% 2,126 79.89% 2,661 100%
2012 566 21.36% 2,084 78.64% 2,650 100%
2013 542 20.62% 2,087 79.38% 2,629 100%
2014 570 21.14% 2,126 78.86% 2,696 100%
Commuter StudentsResidence Hall Students Total
2.15 - Unduplicated Enrollment by Residence Hall and Commuter StudentsFall 2005 - 2014
Fall
0
500
1,000
1,500
2,000
2,500
2005 2006 2007 2008 2009 2010 2011 2012 2013 2014
Residence Hall StudentsCommuter Students
Page 30 of 79

State 2010 2011 2012 2013 2014Alabama 144 135 124 139 145Alaska 1 0 1 0 0Arizona 0 0 1 2 1Arkansas 2 3 4 6 6California 2 3 3 5 4Colorado 0 1 3 3 1Delaware 0 1 1 2 2Florida 3 6 9 10 10Georgia 8 9 10 9 9Guam 0 0 0 0 0Hawaii 0 0 1 0 0Idaho 0 1 0 0 0Illinois 2 2 4 1 0Indiana 0 0 0 1 1Iowa 0 0 0 1 1Kansas 0 0 1 0 1Kentucky 2 2 0 0 1Louisiana 2 2 4 2 3Maine 0 0 0 0 0Maryland 3 3 2 2 3Massachusetts 0 1 1 0 0Michigan 1 2 1 1 0Mississippi 2,326 2,404 2,392 2,345 2,387Missouri 1 0 3 4 4Montana 0 0 0 0 1Nevada 1 0 0 0 0New York 2 1 1 4 3North Carolina 2 3 0 1 1Ohio 4 3 1 2 2Oklahoma 0 1 0 0 0Pennsylvania 2 2 1 2 2South Carolina 0 1 2 0 1Tennessee 31 30 40 36 39Texas 5 7 5 6 7U.S. Citizen Residing Outside of U.S. 1 0 0 0 0Vermont 0 0 1 0 0Virginia 0 2 2 1 1Washington 5 0 0 2 2Wisconsin 1 1 0 1 1
Total U.S. Enrollment 2,551 2,626 2,618 2,588 2,639
2.16 - Unduplicated Enrollment by State of ResidenceFall 2010 - 2014
Page 31 of 79

Country 2010 2011 2012 2013 2014
Belarus 1 0 0 0 0Bulgaria 1 0 0 0 0Cameroon 0 0 0 0 0Canada 1 0 1 1 1China 7 7 10 6 1France 1 0 0 0 0Georgia 1 1 1 0 0Germany 0 0 0 0 0Ghana 0 0 0 0 1Greece 0 1 1 0 0India 2 0 0 0 0Ireland 0 1 0 0 0Italy 3 2 0 0 0Japan 1 0 0 0 0Kenya 2 2 1 1 1Korea 0 0 0 1 1Nepal 7 11 11 21 41Nigeria 3 5 4 6 6Russia 0 0 0 0 0Rwanda 0 0 0 1 1Sri Lanka 0 0 1 2 2Trinidad and Tobago 1 0 0 0 0Turkey 0 1 0 0 0Uganda 0 0 0 1 1United Kingdom 1 1 0 0 0Uzbekistan 1 1 1 0 0Venezuela 1 0 0 1 1Vietnam 0 1 0 0 0Zambia 2 1 1 0 0
Foreign Students 36 35 32 41 57Countries Represented 17 13 10 10 11
2.17 - Unduplicated Enrollment by CountryFall 2010 - 2014
Page 32 of 79

County 2010 2011 2012 2013 2014
Adams 8 5 4 2 5
Alcorn 20 19 19 31 31
Amite 2 2 2 4 2
Attala 14 19 19 16 17
Benton 4 4 2 3 4
Bolivar 7 7 9 16 20
Calhoun 17 20 19 20 17
Carroll 3 2 8 7 5
Chickasaw 35 32 38 35 42
Choctaw 23 24 24 23 21
Claiborne 0 1 1 2 1
Clarke 5 7 8 12 9
Clay 128 113 105 101 94
Coahoma 10 13 11 12 13
Copiah 7 8 10 8 11
Covington 2 4 6 6 2
DeSoto 30 36 54 66 70
Forrest 14 11 13 11 5
Franklin 2 2 2 1 3
George 1 3 4 6 6
Greene 3 2 2 1 0
Grenada 12 12 14 12 14
Hancock 4 4 6 12 8
Harrison 22 27 34 31 29
Hinds 78 86 102 80 103
Holmes 12 13 10 11 8
Humphreys 2 2 1 2 3
Issaquena 2 1 1 1 2
Itawamba 31 36 28 30 31
Jackson 42 37 34 30 31
Jasper 8 7 5 5 5
2.18 - Unduplicated Enrollment by MS CountyFall 2010 - 2014
Page 33 of 79

County 2010 2011 2012 2013 2014
2.18 - Unduplicated Enrollment by MS CountyFall 2010 - 2014
Jefferson 0 1 2 4 0
Jefferson Davis 0 0 1 0 1
Jones 4 11 7 10 17
Kemper 8 7 7 5 6
Lafayette 17 24 22 22 18
Lamar 2 2 5 7 11
Lauderdale 34 54 52 61 72
Lawrence 2 3 6 4 5
Leake 6 8 12 12 10
Lee 109 120 116 117 131
Leflore 16 18 33 30 21
Lincoln 15 10 12 13 11
Lowndes 755 742 658 636 644
Madison 41 53 58 50 53
Marion 0 2 1 3 6
Marshall 10 7 10 18 18
Monroe 161 178 155 131 120
Montgomery 11 9 11 8 11
Neshoba 18 19 14 19 21
Newton 11 18 18 14 14
Noxubee 68 55 66 57 39
Oktibbeha 145 128 146 142 149
Panola 9 12 13 13 16
Pearl River 10 11 7 8 4
Perry 1 0 0 1 3
Pike 3 8 6 12 5
Pontotoc 27 26 31 32 42
Prentiss 20 14 18 22 14
Quitman 0 1 3 4 4
Rankin 59 77 72 61 74
Scott 7 9 9 4 5
Page 34 of 79

County 2010 2011 2012 2013 2014
2.18 - Unduplicated Enrollment by MS CountyFall 2010 - 2014
Sharkey 1 0 2 0 0
Simpson 2 2 4 4 5
Smith 2 3 5 6 5
Stone 1 4 1 7 8
Sunflower 18 18 19 20 18
Tallahatchie 2 4 6 3 0
Tate 9 14 12 12 19
Tippah 10 11 9 17 15
Tishomingo 7 10 10 5 11
Tunica 2 2 4 2 1
Union 11 20 21 23 21
Walthall 1 0 2 2 1
Warren 13 16 17 15 14
Washington 36 37 34 39 41
Wayne 3 4 3 3 3
Webster 22 18 24 17 16
Wilkinson 2 2 0 0 1
Winston 52 41 37 40 38
Yalobusha 4 3 4 3 3
Yazoo 11 9 12 10 10
Total MS Enrollment 2,326 2,404 2,392 2,345 2,387
# Represented 77 78 80 79 78
Page 35 of 79

182 667513801 Nursing 182 513801 Nursing 667
238 63260101 Biology 0 520101 Professional Studies 63090101 Communication 18230101 English 60 2500101 Fine Art 46 050207 Women's Leadership 2240101 General Studies 0540101 History 12 1309999 Interdisciplinary Studies 2 131205 Secondary Teacher Education 1220302 Legal Studies 11270101 Mathematics 0 23500901 Music 5 130301 Differentiated Instruction 1451001 Political Science 12 130401 Educational Leadership 0420101 Psychology 61 131004 Gifted Studies 4440401 Public Safety Administration 2 131315 Reading/Literacy 18450101 Social Sciences 5160905 Spanish - Teaching 2 13050207 Women's Studies 2 500506 Physical Theatre 13
23 74131302 Art Education 5 520208 Global Commerce 15500101 Fine Arts 18 131307 Health Education 36
510203 Speech Language Pathology 2320
500901 Music 20 Master of Science in Nursing 37513801 Family Nurse Clinician 37
909520301 Accounting 44 5260101 Biology 79 513818 Nursing Practice 5520201 Business Administration 164400501 Chemistry 10 290090101 Communication 24 Unclassified - Graduate 25120599 Culinary Arts 91 Undeclared - Degree Seeking 47120509 Culinary Science/Culinology 0 Undeclared - Non-Degree Seeking 218131202 Elementary Education 122190704 Family Studies 32 2558240101 General Studies 33309999 Interdisciplinary Studies 1 Certificate Programs310501 Kinesiology 86 Add-on Certificates220302 Legal Studies 19 Gifted Studies-Certification 7270101 Mathematics 15 Reading/Literacy Certificate 1400101 Physical Sciences 3512207 Public Health Education 101 Post Master's Certificates440401 Public Safety Administration 4 Family Nurse Practitioner 1450101 Social Sciences 8 Psychiatric Mental Health 2510203 Speech Language Pathology 73 Certificate Total 11
2.19 - Unduplicated Enrollment by IHL Official Academic Program Inventory (API)Spring 2015
Associate of Science Bachelor of Science in Nursing
Bachelor of Arts Bachelor of Technology
Bachelor of Science
Undeclared
Enrollment
Master of Arts
Master of Education
Master of Fine Arts
Master of ScienceBachelor of Fine Arts
Bachelor of Music
Doctor of Nursing Practice
Master of Arts in Teaching
Page 36 of 79

177 709513801 Nursing 177 513801 Nursing 709
262 68260101 Biology 0 520101 Professional Studies 68090101 Communication 19230101 English 66 0500101 Fine Art 55 131205 Secondary Teacher Education 0240101 General Studies 0540101 History 14 26309999 Interdisciplinary Studies 1 130301 Differentiated Instruction 0220302 Legal Studies 14 130401 Educational Leadership 9270101 Mathematics 4 131004 Gifted Studies 4500901 Music 5 131315 Reading/Literacy 13451001 Political Science 10420101 Psychology 67 13440401 Public Safety Administration 1 500506 Physical Theatre 13450101 Social Sciences 3160905 Spanish - Teaching 2 74050207 Women's Studies 1 520208 Global Commerce 13
131307 Health Education 3723 510203 Speech Language Pathology 24
131302 Art Education 3500101 Fine Arts 20 Master of Science in Nursing 38
513801 Family Nurse Clinician 3828
500901 Music 28 4513818 Nursing Practice 4
976520301 Accounting 51 284260101 Biology 82 Unclassified - Graduate 0520201 Business Administration 173 Undeclared - Degree Seeking 73400501 Chemistry 13 Undeclared - Non-Degree Seeking 211090101 Communication 20120599 Culinary Arts 103 2696120509 Culinary Science/Culinology 0131202 Elementary Education 127190704 Family Studies 36 Certificate Programs240101 General Studies 33309999 Interdisciplinary Studies 1 Add-on Certificates310501 Kinesiology 108 Gifted Studies-Certification 9220302 Legal Studies 17 Reading/Literacy Certificate 0270101 Mathematics 14400101 Physical Sciences 1 Post Master's Certificates512207 Public Health Education 111 Family Nurse Practitioner 2440401 Public Safety Administration 2 Psychiatric Mental Health 3450101 Social Sciences 9510203 Speech Language Pathology 75 Certificate Total 14
Bachelor of ScienceUndeclared
Enrollment
Master of Education
Master of Fine Arts
Master of Science
Bachelor of Fine Arts
Bachelor of MusicDoctor of Nursing Practice
Master of Arts in Teaching
2.20 - Unduplicated Enrollment by IHL Official Academic Program Inventory (API)Fall 2014
Associate of Science Bachelor of Science in Nursing
Bachelor of Arts Bachelor of Technology
Page 37 of 79

2010 2011 2012 2013 2014 5 Year 5 YearTotal Total Total Total Total # Change % Change
391 390 380 405 384 -7 -1.79%
Art Education 9 11 6 2 3 -6 -66.67%
Biology 63 75 72 68 81 18 28.57%
Biology - Teacher Certification 8 8 4 2 1 -7 -87.50%
Chemistry 10 10 15 13 13 3 30.00%
Communication 36 45 49 50 39 3 8.33%
English 32 27 28 22 19 -13 -40.63%
English - Creative Writing 10 16 17 24 25 15 150.00%
English - Teacher Certification 16 17 14 11 22 6 37.50%
Fine Art 3 5 41 32 35 32 1066.67%
Graphic Design 27 21 13 10 5 -22 -81.48%
History 14 15 14 16 8 -6 -42.86%
History - Public History 0 0 0 0 1 1 100.00%
History - Teacher Certification 17 7 5 8 5 -12 -70.59%
Interdisciplinary Studies 3 5 3 3 2 -1 -33.33%
Mathematics 14 9 6 10 12 -2 -14.29%
Mathematics - Pre-Engineering 0 0 0 1 0 0 100.00%
Mathematics - Teacher Cert 7 7 7 6 6 -1 -14.29%
Microbiology* 1 0 0 0 0 -1 -100.00%
Music 2 2 0 1 5 3 150.00%
Music Education 10 9 8 14 9 -1 -10.00%
Music Therapy 14 10 7 19 19 5 35.71%
Physical Science - Teacher Cert 0 3 2 1 1 1 100.00%
Physical Theatre - MFA 9 20 8 21 13 4 44.44%
Political Science 20 15 14 15 10 -10 -50.00%
Public Administration Cert 0 0 0 0 0 0 100.00%
Social Sciences 9 10 9 7 4 -5 -55.56%
Social Sciences - Teacher Cert 8 9 8 6 8 0 0.00%
Spanish 2 2 1 5 2 0 0.00%
Spanish - Teaching 5 3 2 0 0 -5 -100.00%
Studio Art 21 13 11 17 15 -6 -28.57%
Theatre 21 16 16 21 20 -1 -4.76%
Women's Studies 0 0 0 0 1 1 100.00%
3.1 - Unduplicated Enrollment by Major & ConcentrationFall 2010 - 2014
Arts & Sciences
Page 38 of 79

2010 2011 2012 2013 2014 5 Year 5 YearTotal Total Total Total Total # Change % Change
3.1 - Unduplicated Enrollment by Major & ConcentrationFall 2010 - 2014
391 448 414 415 442 51 13.04%
Accounting 44 51 48 54 51 7 15.91%
Business Admin - Entrepreneurship 8 11 9 5 10 2 25.00%
Business Admin - General Bus 93 101 88 76 86 -7 -7.53%
Business Admin - Management 26 30 30 23 30 4 15.38%
Business Admin - Marketing 17 19 25 34 17 0 0.00%
Business Admin - MIS 34 35 25 30 30 -4 -11.76%
Culinary Arts 96 86 84 99 103 7 7.29%
Global Commerce - MS 0 0 0 9 13 13 100.00%
Legal Studies 43 54 52 37 31 -12 -27.91%
Prof Studies - Cul Art - Main 0 0 0 0 2 2 100.00%
Prof Studies - Culin Art - Gulf 0 0 0 0 3 3 100.00%
Prof Studies - Culin Art - Hinds 0 0 0 0 3 3 100.00%
Prof Studies - Gen Business 18 38 14 12 23 5 27.78%
Prof Studies - Human Res 0 0 4 7 10 10 100.00%
Prof Studies - Legal Admin 0 1 5 7 9 9 100.00%
Prof Studies - Mgt Info Sys 5 17 17 17 16 11 220.00%
Pub-Safety Ad/FSM/Gen Bus 5 3 2 3 2 -3 -60.00%
Pub-Safety ad/FSM/Law & Gov 2 2 0 1 1 -1 -50.00%
Undeclared - Undergraduate (BT) 0 0 11 1 2 2 100.00%
667 623 593 591 554 -113 -16.94%
Differentiated Instruction - MEd 5 4 2 0 0 -5 -100.00%
Education - MAT 18 13 4 3 0 -18 -100.00%
Educational Leadership - MEd 16 13 11 15 9 -7 -43.75%
Elementary Education 239 209 185 156 127 -112 -46.86%
Exercise Sci-Physical Therapy 44 52 48 45 62 18 40.91%
Family Studies 42 38 32 29 36 -6 -14.29%
Family Studies - Teaching 1 0 0 0 0 -1 -100.00%
General Studies 91 77 49 42 33 -58 -63.74%
Gifted Studies - MEd 11 3 4 6 4 -7 -63.64%
Gifted Studies - Certification 9 11 9 9 9 0 0.00%
Health Education - MS 36 38 32 44 37 1 2.78%
Kinesiology - Teaching 19 13 10 9 11 -8 -42.11%
Kinesiology - Exercise Science 23 29 34 28 31 8 34.78%
Pre-Occupational Therapy 2 3 2 6 4 2 100.00%
Psychology 95 88 75 69 67 -28 -29.47%
Public Health Education 0 20 85 112 111 111 100.00%
Reading/Literacy - MEd 15 11 9 17 13 -2 -13.33%
Reading/Literacy Certificate 1 1 2 1 0 -1 -100.00%
Business and Professional Studies
Education & Human Sciences
Page 39 of 79

2010 2011 2012 2013 2014 5 Year 5 YearTotal Total Total Total Total # Change % Change
3.1 - Unduplicated Enrollment by Major & ConcentrationFall 2010 - 2014
3 7 5 1 0 -3 -100.00%
Unclassified - Graduate 3 7 5 1 0 -3 -100.00%
804 859 939 920 1,032 228 28.36%
Associate of Science Nursing 116 103 100 99 109 -7 -6.03%
Bachelor of Science Nursing 131 126 126 125 120 -11 -8.40%
Doctor of Nursing Practice 0 0 0 6 4 4 100.00%
Family Nurse Practioner - MSN 0 0 37 41 37 37 100.00%
Master of Science Nursing 41 37 0 0 0 -41 -100.00%
Nursing - BSN - Tupelo 201 284 398 397 439 238 118.41%
Post Masters Certificate Nursing 8 3 1 1 5 -3 -37.50%
Pre-Nursing ASN 69 76 54 37 68 -1 -1.45%
Pre-Nursing BSN 141 104 99 97 136 -5 -3.55%
Pre-Nursing BSN - Tupelo 6 18 16 22 14 8 133.33%
Psychiatric Mental Health - MSN 0 0 2 1 1 1 100.00%
Speech/Language Pathology 70 86 85 69 75 5 7.14%
Speech/Language Pathology - MS 21 22 21 25 24 3 14.29%
331 334 319 297 284 -47 -14.20%
Undeclared 331 334 319 297 284 -47 -14.20%
2,587 2,661 2,650 2,629 2,696 109 4.21%
* These prgrams are being phased out
University
University Total
Nursing & Speech Language Pathology
Graduate Unclassified
Page 40 of 79

#Students
% of Total
#Students
%of Total
#Students
%of Total
#Students
%of Total
#Students
%of Total
Arts & Sciences 391 15.11% 388 14.58% 380 14.34% 405 15.40% 384 14.24%
Business & Professional Studies 391 15.11% 448 16.84% 414 15.62% 415 15.79% 442 16.39%
Education & Human Sciences 667 25.78% 625 23.49% 593 22.38% 591 22.48% 554 20.55%
Nursing & Speech Language Pathology 804 31.09% 859 32.28% 939 35.43% 920 34.99% 1,032 38.28%
University 334 12.91% 341 12.81% 324 12.23% 298 11.34% 284 10.54%
Total 2,587 100.00% 2,661 100.00% 2,650 100.00% 2,629 100.00% 2,696 100.00%
College / School
3.2 - Unduplicated Enrollment by CollegeFall 2010 - 2014
Fall 2010 Fall 2011 Fall 2012 Fall 2013 Fall 2014
0%
5%
10%
15%
20%
25%
30%
35%
40%
45%
Arts & Sciences Business & Professional Studies Education & Human Sciences Nursing & Speech LanguagePathology
University
Percentage of Total Enrollment by College
Fall 2010 Fall 2011 Fall 2012 Fall 2013 Fall 2014
Page 41 of 79

Fall2005
Fall2006
Fall2007
Fall2008
Fall2009
Fall2010
Fall2011
Fall2012
Fall2013
Fall2014
Day Classes 2,082 2,150 2,102 2,047 2,025 1,967 1,855 1,771 1,766 1,773
Night Classes 1,071 929 873 769 755 635 510 422 343 325
Weekend Classes 112 51 107 74 57 46 67 86 84 60
On-line Classes 290 332 412 538 1,105 1,389 1,562 1,589 1,664 1,664
3.3 - Class Type EnrollmentFall 2005 - 2014
*Students may be enrolled in more than one class type, but headcount is unduplicated within class type.
Day Classes46%Night Classes
8%
Weekend Classes2%
On-line Classes44%
Class Type Enrollment PercentagesFall 2014
0
500
1,000
1,500
2,000
2,500
Fall2005
Fall2006
Fall2007
Fall2008
Fall2009
Fall2010
Fall2011
Fall2012
Fall2013
Fall2014
Day Classes
Night Classes
Weekend Classes
On-line Classes
Page 42 of 79

Program SU 11 FA 11 SP 12 AY 11-12Total SU 12 FA 12 SP 13 AY 12-13
Total SU 13 FA 13 SP 14 AY 13-14 Total
3 AY # Change
3 AY % Change SU 14 FA 14
College of Arts & Sciences
Art & Design 9 810 830 1,649 21 856 818 1,695 69 738 850 1,657 8 0.5% 90 741
Communication 357 759 682 1,798 246 871 785 1,902 192 881 805 1,878 80 4.4% 174 792
History, Political Science, & Geography 432 1,305 1,134 2,871 246 1,233 1,044 2,523 168 1,176 936 2,280 -591 -20.6% 156 1,113
Languages, Literature, & Philosophy 1,457 3,092 3,040 7,589 1,263 3,219 3,236 7,718 929 3,080 2,952 6,961 -628 -8.3% 910 3,109
Music & Theatre 122 905 724 1,751 108 878 931 1,917 0 0 0 0 -1,751 -100.0% 0 0
Music 0 0 0 0 0 0 0 0 30 598 581 1,209 - - 123 658
Science & Mathematics 520 3,770 3,293 7,583 431 3,542 3,277 7,250 404 3,677 3,221 7,302 -281 -3.7% 352 3,859
Theatre 0 0 0 0 0 0 0 0 48 590 403 1,041 - - 86 400
Arts & Sciences College Total 2,897 10,641 9,703 23,241 2,315 10,599 10,091 23,005 1,840 10,740 9,748 22,328 -913 -3.9% 1,891 10,672
College of Education & Human Sciences
Education 876 2,007 1,737 4,620 567 1,759 1,438 3,764 532 1,528 1,329 3,389 -1,231 -26.6% 298 1,396
Health & Kinesiology 474 2,033 2,003 4,510 458 2,219 2,470 5,147 614 2,371 2,519 5,504 994 22.0% 566 2,553
Health Education 120 231 282 633 129 198 201 528 153 255 237 645 12 1.9% 156 210
Psychology & Family Studies 421 1,797 1,912 4,130 388 1,596 1,768 3,752 295 1,444 1,514 3,253 -877 -21.2% 240 1,503
Education & Human Sciences College Total 1,891 6,068 5,934 13,893 1,542 5,772 5,877 13,191 1,594 5,598 5,599 12,791 -1,102 -7.9% 1,260 5,662
College of Nursing & Speech-Language Pathology
Associate of Science in Nursing 144 1,140 886 2,170 98 1,163 795 2,056 157 1,098 762 2,017 -153 -7.1% 192 1,208
Bachelor of Science in Nursing 3,657 5,918 5,773 15,348 4,664 7,428 7,443 19,535 4,175 7,361 7,300 18,836 3,488 22.7% 5,925 7,817
Graduate Nursing 372 509 595 1,476 261 492 646 1,399 311 603 643 1,557 81 5.5% 312 551
Nursing 370 250 149 769 364 176 159 699 360 187 193 740 -29 -3.8% 364 300
Speech/Language Pathology 94 934 738 1,766 83 947 816 1,846 111 958 762 1,831 65 3.7% 94 957
Nursing & Speech-Language Pathology College Total 4,637 8,751 8,141 21,529 5,470 10,206 9,859 25,535 5,114 10,207 9,660 24,981 3,452 16.0% 6,887 10,833
AY 2012, 2013, 2014 & Summer 2014, Fall 20143.4 - Credit Hour Generation by College & Department
Page 43 of 79

Program SU 11 FA 11 SP 12 AY 11-12Total SU 12 FA 12 SP 13 AY 12-13
Total SU 13 FA 13 SP 14 AY 13-14 Total
3 AY # Change
3 AY % Change SU 14 FA 14
AY 2012, 2013, 2014 & Summer 2014, Fall 20143.4 - Credit Hour Generation by College & Department
College of Business & Professional Studies
Business and Legal Studies 1,443 3,900 4,113 9,456 984 0 0 984 0 0 0 0 -9,456 -100.0% 0 0
Business 0 0 0 0 0 2,910 2,907 5,817 489 2,790 2,852 6,131 - - 494 3,135
Culinary Arts 264 938 932 2,134 171 867 946 1,984 168 969 979 2,116 -18 -0.8% 162 1,053
Legal Studies 0 0 0 0 0 606 504 1,110 78 450 426 954 - - 93 399
Business & Professional Studies Total 1,707 4,838 5,045 11,590 1,155 4,383 4,357 9,895 735 4,209 4,257 9,201 -2,389 -20.6% 749 4,587
University Classes and Honors
University Classes 135 706 532 1,373 105 632 559 1,296 140 657 447 1,244 -129 -9.4% 66 595
Honors 412 124 110 646 395 126 137 658 425 109 102 636 -10 -1.5% 290 110
Total University and Honors 547 830 642 2,019 500 758 696 1,954 565 766 549 1,880 -139 -6.9% 356 705
University Totals
Totals 11,679 31,128 29,465 72,272 10,982 31,718 30,880 73,580 9,848 31,520 29,813 71,181 -1,091 -1.5% 11,143 32,459
*ROTC Classes are excluded*Fall 2010 credit hours were adjusted by 554 credit hours to remove two duplicate courses and ROTC hours.*Fall 2010, Spring 2011, and Summer 2011 credit hours in Business and Professional Studies were adjusted to correct data errors that were found during data migration.*The following Departments have been created in the last three years: Business, Legal Studies, Music, and Theatre. Data does not exist to calculate a three year change.
Page 44 of 79
Program SU 11 FA 11 SP 12 AY 11-12Total SU 12 FA 12 SP 13 AY 12-13
Total SU 13 FA 13 SP 14 AY 13-14 Total
3 AY # Change
3 AY % Change SU 14 FA 14
College of Arts & Sciences
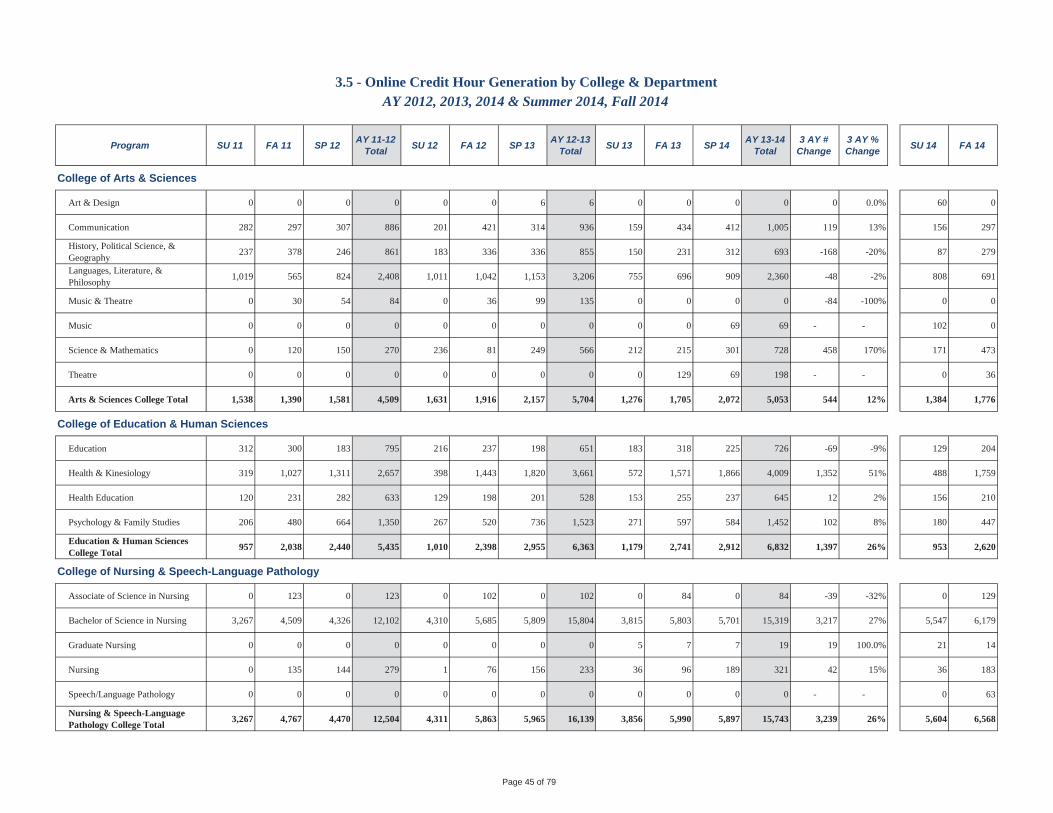
Art & Design 0 0 0 0 0 0 6 6 0 0 0 0 0 0.0% 60 0
Communication 282 297 307 886 201 421 314 936 159 434 412 1,005 119 13% 156 297
History, Political Science, & Geography 237 378 246 861 183 336 336 855 150 231 312 693 -168 -20% 87 279
Languages, Literature, & Philosophy 1,019 565 824 2,408 1,011 1,042 1,153 3,206 755 696 909 2,360 -48 -2% 808 691
Music & Theatre 0 30 54 84 0 36 99 135 0 0 0 0 -84 -100% 0 0
Music 0 0 0 0 0 0 0 0 0 0 69 69 - - 102 0
Science & Mathematics 0 120 150 270 236 81 249 566 212 215 301 728 458 170% 171 473
Theatre 0 0 0 0 0 0 0 0 0 129 69 198 - - 0 36
Arts & Sciences College Total 1,538 1,390 1,581 4,509 1,631 1,916 2,157 5,704 1,276 1,705 2,072 5,053 544 12% 1,384 1,776
College of Education & Human Sciences
Education 312 300 183 795 216 237 198 651 183 318 225 726 -69 -9% 129 204
Health & Kinesiology 319 1,027 1,311 2,657 398 1,443 1,820 3,661 572 1,571 1,866 4,009 1,352 51% 488 1,759
Health Education 120 231 282 633 129 198 201 528 153 255 237 645 12 2% 156 210
Psychology & Family Studies 206 480 664 1,350 267 520 736 1,523 271 597 584 1,452 102 8% 180 447
Education & Human Sciences College Total 957 2,038 2,440 5,435 1,010 2,398 2,955 6,363 1,179 2,741 2,912 6,832 1,397 26% 953 2,620
College of Nursing & Speech-Language Pathology
Associate of Science in Nursing 0 123 0 123 0 102 0 102 0 84 0 84 -39 -32% 0 129
Bachelor of Science in Nursing 3,267 4,509 4,326 12,102 4,310 5,685 5,809 15,804 3,815 5,803 5,701 15,319 3,217 27% 5,547 6,179
Graduate Nursing 0 0 0 0 0 0 0 0 5 7 7 19 19 100.0% 21 14
Nursing 0 135 144 279 1 76 156 233 36 96 189 321 42 15% 36 183
Speech/Language Pathology 0 0 0 0 0 0 0 0 0 0 0 0 - - 0 63
Nursing & Speech-Language Pathology College Total 3,267 4,767 4,470 12,504 4,311 5,863 5,965 16,139 3,856 5,990 5,897 15,743 3,239 26% 5,604 6,568
3.5 - Online Credit Hour Generation by College & DepartmentAY 2012, 2013, 2014 & Summer 2014, Fall 2014
Page 45 of 79

Program SU 11 FA 11 SP 12 AY 11-12Total SU 12 FA 12 SP 13 AY 12-13
Total SU 13 FA 13 SP 14 AY 13-14 Total
3 AY # Change
3 AY % Change SU 14 FA 14
3.5 - Online Credit Hour Generation by College & DepartmentAY 2012, 2013, 2014 & Summer 2014, Fall 2014
College of Business & Professional Studies
Business and Legal Studies 1,317 2,979 3,150 7,446 984 0 0 984 0 0 0 0 -7,446 -100% 0 0
Business 0 0 0 0 0 2,130 2,187 4,317 489 1,965 2,088 4,542 - - 450 2,238
Culinary Arts 96 156 129 381 81 162 171 414 99 126 105 330 -51 -13% 138 126
Legal Studies 0 0 0 0 0 393 339 732 72 291 300 663 - - 93 306
Business & Professional Studies Total 1,413 3,135 3,279 7,827 1,065 2,685 2,697 6,447 660 2,382 2,493 5,535 -2,292 -29% 681 2,670
University Classes and Honors
University Classes 117 168 321 606 87 228 300 615 81 207 171 459 -147 -24% 57 123
Honors 0 0 0 0 0 0 0 0 0 0 0 0 - - 0 0
Total University and Honors 117 168 321 606 87 228 300 615 81 207 171 459 -147 -24% 57 123
University Totals
Totals 7,292 11,498 12,091 30,881 8,104 13,090 14,074 35,268 7,052 13,025 13,545 33,622 2,741 9% 8,679 13,757
*ROTC Classes are excluded*Fall 2010, Spring 2011, and Summer 2011 credit hours in Business and Professional Studies were adjusted to correct data errors that were found during data migration.*The following Departments have been created in the last three years: Business, Legal Studies, Music, and Theatre. Data does not exist to calculate a three year change.
Page 46 of 79

Degrees Granted
Degrees Granted
Associate of Science 42 Bachelor of Science in Nursing 283513801 Nursing 42 513801 Nursing 283
Bachelor of Arts 57 Bachelor of Technology 7260101 Biology 0 520101 Professional Studies 7090101 Communications 4230101 English 18 Master of Arts in Teaching 1500101 Fine Arts 5 131205 Secondary Teacher Education 1240101 General Studies 1540101 History 4 Master of Education 8309999 Interdisciplinary Studies 1 130301 Differentiated Instruction 0220302 Legal Studies 2 130401 Educational Leadership 5270101 Mathematics 0 131004 Gifted Studies 1500901 Music 0 131315 Reading/Literacy 2451001 Political Science 3420101 Psychology 18 Master of Fine Arts 5440401 Public Safety Administration 0 500506 Physical Theatre 5450101 Social Sciences 0160905 Spanish 1 Master of Science 29050207 Women's Studies 0 520208 Global Commerce 0
131307 Health Education 17Bachelor of Fine Arts 13 510203 Speech Language Pathology 12
131302 Art Education 1500101 Fine Arts 12 Master of Science in Nursing 31
513801 Family Nurse Clinician 31Bachelor of Music 2
500901 Music 2 Doctor of Nursing Practice 5513818 Nursing Practice 5
Bachelor of Science 254520301 Accounting 10 Total Degrees Granted 737260101 Biology 16520201 Business Administration 33400501 Chemistry 0090101 Communications 4120599 Culinary Arts 21 Certificate Programs120509 Culinary Science/Culinology 0 Applied and Professional Ethics 0131202 Elementary Education 29 Public Administration 0190704 Family Studies 7 Teaching English as a Second Language 0240101 General Studies 39309999 Interdisciplinary Studies 1 Add-on Certificates* 0310501 Kinesiology 17 Gifted Studies-Certification 0220302 Legal Studies 15 Reading/Literacy Certificate 0270101 Mathematics 1400101 Physical Sciences 1 Post Master's Certificates 1512207 Public Health Education 33 Family Nurse Clinician 1440401 Public Safety Administration 1 Psychiatric Mental Health 0450101 Social Sciences 4510203 Speech Language Pathology 22 Certificate Total 1
*Awarded by the Mississippi Department of Education
3.6 - Degrees Awarded by IHL Official Academic Program Inventory (API)Academic Year 2014
Page 47 of 79

American Indian or Alaskan Native
Asian
Native Hawaiian or Pacific Islander
CIP Major/Concentration Female Female Female Male Female Male Female Male Female Female Male Female Male090101 Communications 3 1 3 1 8131302 Art Education 1 1160905 Spanish 1 1
English 1 1 1 4 7English - Creative Writing 1 1 3 4 9English-Teacher Certification 1 1 2
260101 Biology 2 3 2 1 7 1 16270101 Mathematics 1 1309999 Interdisciplinary Studies 1 1 2400101 Physical Science-Teacher Cert 1 1
Social Sciences 1 2 3Social Sciences - Teacher Cert 1 1
451001 Political Science 2 1 3Graphic Design 1 5 2 8Studio Art 1 2 1 4Theatre 4 1 5
500506 Physical Theatre 2 3 5500901 Music Education 2 2
History 2 1 3History-Teacher Certification 1 1
0 2 12 5 2 0 0 1 1 4 1 36 19 83120599 Culinary Arts 6 3 1 8 3 21220302 Legal Studies 10 1 6 17440401 Pub-Safety Ad/FSM/Gen Bus 1 1
Prof Studies - Gen Business 1 1Prof Studies - Human Res 1 1Prof Studies - Legal Admin 1 1Prof Studies - Mgt Info Sys 2 2 4Business Admin - General Bus 7 1 4 1 13Business Admin - Management 2 2 1 1 6Business Admin - Marketing 3 1 7 1 12Business Admin - MIS 1 1Business Admin - Entrepreneurship 1 1
520301 Accounting 1 2 1 4 2 100 1 36 7 2 0 0 0 0 0 1 31 11 89
Business & Prof.
Studies
Business and Professional Studies Total
3.7 - Degrees Awarded by Major/Concentration, Race/Ethnicity and GenderAcademic Year 2014
Grand Total
230101
450101
500101
Hispanic Multiple Race Non-Resident AlienBlack White
540101
520101
520201
Arts and Sciences Total
Arts &Sciences
Page 48 of 79

American Indian or Alaskan Native
Asian
Native Hawaiian or Pacific Islander
CIP Major/Concentration Female Female Female Male Female Male Female Male Female Female Male Female Male
3.7 - Degrees Awarded by Major/Concentration, Race/Ethnicity and GenderAcademic Year 2014
Grand Total
Hispanic Multiple Race Non-Resident AlienBlack White
130401 Educational Leadership 1 3 1 5131004 Gifted Studies 1 1131202 Elementary Education 8 21 29131205 Education 1 1131307 Health Education 9 2 1 5 17131315 Reading/Literacy 2 2190704 Family Studies 3 4 7240101 General Studies 21 1 13 5 40
Exercise Sci-Physical Therapy 3 1 4Kinesiology-Exercise Science 5 7 1 13
420101 Psychology 7 1 9 1 18512207 Public Health Education 25 2 5 1 33
0 0 83 4 0 0 2 0 0 1 0 70 10 170Speech/Language Pathology - Bachelor's 1 2 19 22Speech-Language Pathology - Master's 12 12Associate of Science Nursing 1 9 2 1 26 3 42Bachelor of Science Nursing 1 2 7 1 1 44 2 58Family Nurse Practitioner 1 2 1 23 4 31Nursing - BSN - Tupelo 1 88 2 1 116 17 225
513818 Nursing Practice - DNP 1 4 51 6 109 6 0 1 2 0 0 0 0 244 26 3951 9 240 22 4 1 4 1 1 5 2 381 66 737
Nursing and Speech Language PathologyGrand Total
Education & Human
Sciences
Education and Human Sciences Total
513801
510203
310501
Nursing & Speech
Language Pathology
Page 49 of 79
Koa'ki Meiru Guardian
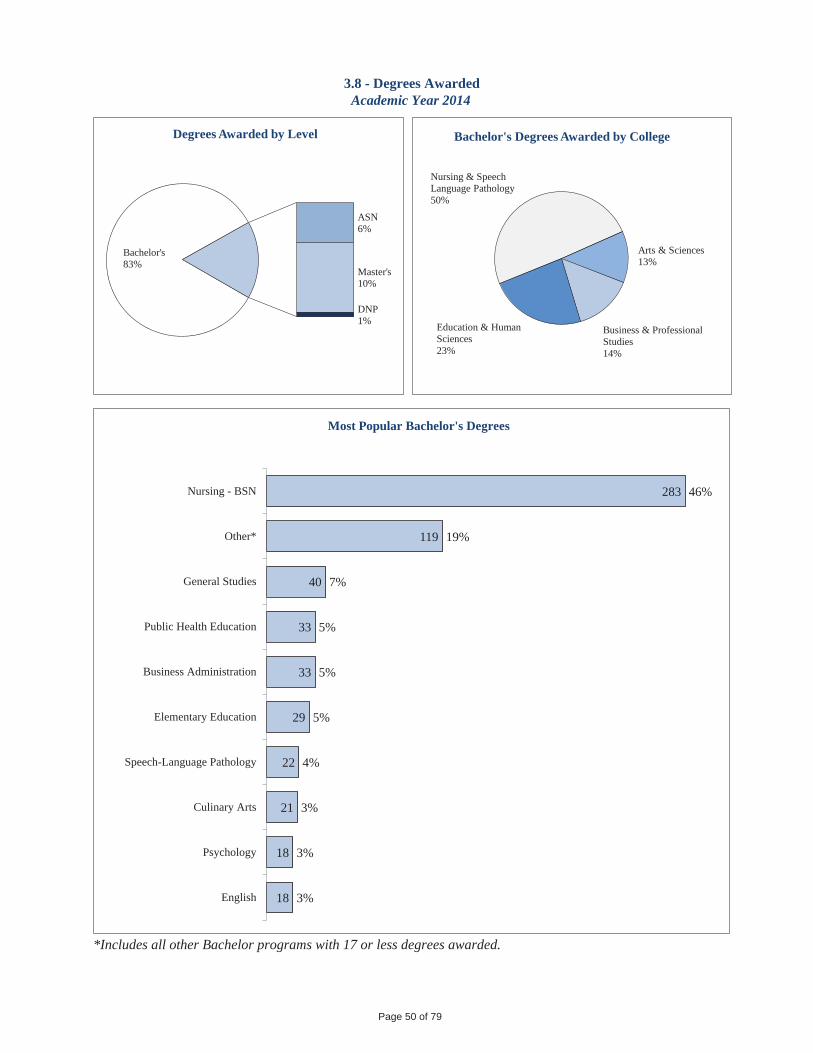
*Includes all other Bachelor programs with 17 or less degrees awarded.
3.8 - Degrees AwardedAcademic Year 2014
ASN6%
Bachelor's83%
Master's10%
DNP1%
Degrees Awarded by Level
Arts & Sciences13%
Business & Professional Studies14%
Education & Human Sciences23%
Nursing & Speech Language Pathology50%
Bachelor's Degrees Awarded by College
18
18
21
22
29
33
33
40
119
283
3%
3%
3%
4%
5%
5%
5%
7%
19%
46%
English
Psychology
Culinary Arts
Speech-Language Pathology
Elementary Education
Business Administration
Public Health Education
General Studies
Other*
Nursing - BSN
Most Popular Bachelor's Degrees
Page 50 of 79

Major CIP 2010 2011 2012 2013 2014 5 Year# Change
Year% Change
Art Education 131302 1 1 2 1 1 0 0%
Biology 260101 19 10 9 23 16 -3 -16%
Chemistry 400501 2 5 0 2 0 -2 -100%
Communications 090101 9 10 7 16 8 -1 -11%
English 230101 14 9 15 15 18 4 29%
Fine Arts 500101 17 14 9 15 17 0 0%
History 540101 2 8 8 2 4 2 100%
Interdisciplinary Studies 309999 0 0 1 0 2 2 100%
Mathematics 270101 0 2 3 3 1 1 100%
Microbiology 260503 4 2 1 0 0 -4 -100%
Music 500901 5 3 3 2 2 -3 -60%
Physical Sciences 400101 0 0 0 0 1 1 100%
Physical Theatre - Master's 500506 0 0 5 1 5 5 100%
Political Science 451001 3 1 1 6 3 0 0%
Social Sciences 450101 13 2 9 3 4 -9 -69%
Spanish 160905 2 3 2 1 1 -1 -50%
Arts & Sciences Total 91 70 75 90 83 -8 -9%
Accounting 520301 10 13 9 8 10 0 0%
Business Administration 520201 42 39 36 41 33 -9 -21%
Culinary Arts 120599 21 18 22 15 21 0 0%
Legal Studies 220302 10 9 16 19 17 7 70%
Professional Studies 520101 0 0 10 15 7 7 100%
Public Safety Administration 440401 0 0 2 0 1 1 100%
Business & Professional Studies Total 83 79 95 98 89 6 7%
Curriculum & Instruction - Master's 130301 2 0 0 0 0 -2 -100%
Differentiated Instruction - Master's 130301 0 2 4 1 0 0 0%
Educational Leadership - Master's 130401 10 8 7 7 5 -5 -50%
Elementary Education 131202 62 50 43 39 29 -33 -53%
Family Studies 190704 6 4 5 7 7 1 17%
General Studies 240101 48 50 43 45 40 -8 -17%
Gifted Studies - Master's 131004 4 6 4 4 1 -3 -75%
Health Education - Master's 131307 22 15 11 12 17 -5 -23%
Kinesiology 310501 14 21 14 16 17 3 21%
Psychology 420101 24 24 33 21 18 -6 -25%
Public Health Education 512207 0 0 0 13 33 33 100%
Reading/Literacy - Master's 131315 4 1 5 7 2 -2 -50%
Secondary Teacher Education - Master's 131205 1 9 6 4 1 0 0%
Education & Human Sciences Total 197 190 175 176 170 -27 -14%
Nursing - ASN 513801 51 54 48 47 42 -9 -18%
Nursing - BSN 513801 90 142 250 330 283 193 214%
Nursing - MSN 513801 35 40 41 37 31 -4 -11%
Doctor of Nursing Practice - DNP 513818 0 0 0 0 5 5 100%
Speech-Language Pathology - Bachelor's 510203 16 20 16 30 22 6 38%
Speech-Language Pathology - Master's 510203 10 12 10 9 12 2 20%
Nursing & Speech Language Pathology Total 202 268 365 453 395 193 96%
Grand Total 573 607 710 817 737 164 29%
3.9 - History of Degrees Awarded by CIPAY 2010-2014
Arts & Sciences
Education & Human
Sciences
Nursing & Speech
Language Pathology
Business & Prof. Studies
Page 51 of 79

Major CIP Men Women Men Women Men Women Men Women Men Women
Art Education 131302 1 1 2 1 1 6
Biology 260101 4 15 1 9 1 8 4 19 2 14 77
Chemistry 400501 2 4 1 2 9
Communications 090101 2 7 2 8 1 6 6 10 2 6 50
English 230101 2 12 1 8 1 14 2 13 6 12 71
Fine Arts 500101 4 13 1 13 4 5 2 13 6 11 72
History 540101 2 2 6 2 6 1 1 1 3 24
Interdisciplinary Studies 309999 1 2 3
Mathematics 270101 2 1 2 3 1 9
Microbiology 260503 4 2 1 7
Music 500901 5 3 1 2 2 2 15
Physical Sciences 400101 1 1
Physical Theatre - Master's 500506 2 3 1 3 2 11
Political Science 451001 2 1 1 1 2 4 1 2 14
Social Sciences 450101 9 4 1 1 2 7 1 2 2 2 31
Spanish 160905 2 3 2 1 1 9
Arts & Sciences Total 25 66 15 55 17 58 18 72 26 57 409
Curriculum & Instruction - Master's 130301 2 2
Differentiated Instruction - Master's 130301 2 4 1 7
Educational Leadership - Master's 130401 2 8 2 6 3 4 5 2 1 4 37
Elementary Education 131202 2 60 1 49 2 41 1 38 29 223
Family Studies 190704 6 4 5 7 7 29
General Studies 240101 6 42 4 46 4 39 4 41 5 35 226
Gifted Studies - Master's 131004 4 6 4 4 1 19
Kinesiology 310501 5 9 4 17 5 9 4 12 2 15 82
Health Education - Master's 131307 3 19 3 12 1 10 12 2 15 77
Psychology 420101 4 20 3 21 2 31 1 20 1 17 120
Public Health Education 512207 2 11 3 30 46
Reading/Literacy - Master's 131315 4 1 5 7 2 19
Secondary Teacher Education - Master's 131205 1 9 3 3 1 3 1 21
Education & Human Sciences Total 22 175 17 173 20 155 18 158 14 156 908
Arts &Sciences
Education & Human
Sciences
3.10 - History of Degrees Awarded by Major and GenderAY 2010 - 2014
2010 2012 20132011Total
2014
Page 52 of 79

Major CIP Men Women Men Women Men Women Men Women Men Women
3.10 - History of Degrees Awarded by Major and GenderAY 2010 - 2014
2010 2012 20132011Total
2014
Nursing - ASN 513801 6 45 3 51 4 44 4 43 5 37 242
Nursing - BSN 513801 14 76 21 121 25 225 33 297 23 260 1095
Nursing - MSN 513801 5 30 4 36 4 37 3 34 5 26 184
Nursing Practice - DNP 513818 5 5
Speech-Language Pathology - Bachelor's 510203 16 20 16 30 22 104
Speech-Language Pathology - Master's 510203 10 12 10 9 12 53
Nursing & Speech Language Pathology Total 25 177 28 240 33 332 40 413 33 362 1683
Accounting 520301 1 9 4 9 9 3 5 3 7 50
Business Administration 520201 10 32 7 32 6 30 7 34 7 26 191
Culinary Arts 120599 4 17 7 11 6 16 4 11 6 15 97
Legal Studies 220302 1 9 9 3 13 4 15 1 16 71
Professional Studies 520101 7 3 3 12 2 5 32
Public Safety Administration 440401 2 1 3
Business and Professional Studies Total 16 67 18 61 24 71 21 77 19 70 444
Grand Total 88 485 78 529 94 616 97 720 92 645 3444
Nursing & Speech
Language Pathology
Business & Prof. Studies
Page 53 of 79

* Includes Curriculum & Instruction
3.11 - Top Bachelor's & Graduate Degrees Awarded in the last 5 YearsAY 2010 - 2014
Top 10 Bachelor's Degrees in the Last 5 Years
1
5
9
11
19
19
21
37
53
77
184
Nursing - DNP
Differentiated Instruction*
Physical Theatre
Gifted Studies
Reading/Literacy
Secondary Teacher Education
Educational Leadership
Speech-Language Pathology
Health Education
Nursing - MSN
Graduate Degrees Awarded in the Last 5 Years
Nursing - BSN 1095 40%
2 General Studies 226 8%
3 Elementary Education 223 8%
4 Business Administration 191 7%
5 Psychology 120 4%
6 Speech-Language Pathology 104 4%
7 Culinary Arts 97 4%
8 Kinesiology 82 3%
9 Biology 77 3%
10 Fine Arts 72 3%
Page 54 of 79

2010 2011 2012 2013 2014
ASN 51 54 48 47 42 242 -9 -18%
Bachelor's 434 460 569 688 616 2,767 182 42%
Master's 88 93 93 82 74 430 -14 -16%
DNP - - - - 5 5 - -
Total 573 607 710 817 737 3,444 164 29%
3.12 - Breakdown of Degrees AwardedAY 2010 - 2014
Degrees GrantedDegree
5 Year#
Change
5 Year%
ChangeTotal
ASN7.03%
Bachelor's80.34%
Master's12.49%
DNP0.15%
Degrees Awarded: AY 2010 - 2014
Page 55 of 79

*Includes DNP Degrees
3.13 - History of Degrees Awarded by Academic LevelAY 2005 - 2014
64
81 7873
69
8893 93
82 79
10
20
30
40
50
60
70
80
90
100
2005 2006 2007 2008 2009 2010 2011 2012 2013 2014
Graduate Degrees Awarded*
3845
4740
33 51
5448 47
42
10
20
30
40
50
60
70
80
90
100
2005 2006 2007 2008 2009 2010 2011 2012 2013 2014
ASN Degrees Awarded
315355 363 356
406 434 460
569
688
616
200
300
400
500
600
700
800
2005 2006 2007 2008 2009 2010 2011 2012 2013 2014
Bachelor Degrees Awarded
417481 488 469
508573
607
710
817
737
300
400
500
600
700
800
900
2005 2006 2007 2008 2009 2010 2011 2012 2013 2014
Total Degrees Awarded
Page 56 of 79

Ft-Time Admin. Pt-Time Total Male Female Black White Other ACAD FISCAL2005 136 5 66 207 2005 50 86 4 127 5 110 262006 132 9 66 207 2006 49 83 6 122 4 106 262007 136 9 74 219 2007 49 87 6 121 9 109 272008 135 9 59 203 2008 48 87 5 122 8 110 252009 134 10 51 195 2009 51 83 5 120 9 111 232010 130 8 52 190 2010 48 82 7 116 7 106 242011 136 7 66 209 2011 50 86 7 123 6 109 272012 130 9 84 223 2012 47 83 4 120 6 100 302013 135 10 80 225 2013 49 86 7 121 7 105 302014 138 10 76 224 2014 47 91 6 125 7 108 30
Prof. Asso. Asst. Inst.2005 35 21 34 462006 30 16 35 512007 30 14 39 532008 28 17 39 512009 26 21 36 512010 27 20 34 492011 30 23 30 532012 33 18 31 482013 34 18 42 412014 34 24 35 45
Terminal SPEC. MSTR. BACH.2005 81 0 53 22006 74 0 56 22007 78 0 56 22008 76 0 56 32009 75 0 56 32010 76 0 52 22011 82 1 51 22012 83 1 46 02013 89 1 44 12014 93 0 43 2
4.1 - Faculty ProfileFall Sem. Number Fall Sem. F-T Fac by Sex F-T Fac by Race F-T Fac Contract
Fall Sem. Full-time Faculty by Rank
Fall Sem. Full-time Faculty by Degree
SOURCE: Office of Academic Affairs*The number of administrators with faculty status increased in Fall 2006 due to the EEOC re-classification of four deans and two other administrators.
Prof.25%
Asso.17%
Asst.25%Inst.
33%
Fall 2014Full-Time Faculty
by Rank
207 207
219
203 195
190
209
223 225 224
170
180
190
200
210
220
230
2005 2006 2007 2008 2009 2010 2011 2012 2013 2014
Fall Faculty Number
Page 57 of 79

Lower CH Upper CH Graduate CH Total CH
Terminal Degrees 8,603 5,617 1,567 15,787
Non-Terminal Degrees 6,821 8,820 92 15,733
TOTAL 15,424 14,437 1,659 31,520
Lower CH Upper CH Graduate CH Total CH
Terminal Degrees 9,282 7,083 1,309 17,674
Non-Terminal Degrees 7,065 7,621 99 14,785
TOTAL 16,347 14,704 1,408 32,459
Lower CH Upper CH Graduate CH Total CH
Full-time Faculty 12,456 12,556 1,565 26,577
Part-time Faculty 2,968 1,881 94 4,943
TOTAL 15,424 14,437 1,659 31,520
Lower CH Upper CH Graduate CH Total CH
Full-time Faculty 13,429 10,567 1,223 25,219
Part-time Faculty 2,918 4,137 185 7,240
TOTAL 16,347 14,704 1,408 32,459
*For this profile, both Full-time and Part-time faculty are included.
4.2 - Faculty Credit Hour Production by Course LevelFall 2013 & 2014
Fall 2013 Student Credit Hours by Faculty Terminal Degree Status
Fall 2014 Student Credit Hours by Faculty Terminal Degree Status
Fall 2013 Student Credit Hours by Faculty Full-time/Part-time Status
Fall 2014 Student Credit Hours by Faculty Full-time/Part-time Status
Page 58 of 79

18,019,223$ 49.97% 18,278,223$ 52.88%State Govt. Appropriations
General Support 13,905,996$ 38.57% 12,427,955$ 35.96%Washington 9,375$ 0.03% 9,375$ 0.03%Interest Funds 9,389$ 0.03% 9,389$ 0.03%MS Gov. School 157,500$ 0.44% 157,500$ 0.46%Education Enhancement Fund 2,408,500$ 6.68% 2,154,033$ 6.23%Capital Projects 422,981$ 1.17% 345,150$ 1.00%Funding for Efficiencies 236,365$ 0.66% 236,365$ 0.68%Geospatial Licenses 9,406$ 0.03% 9,406$ 0.03% Sub-Total 17,159,512$ 47.59% 15,349,173$ 44.41%
-$ 0.00% -$ 0.00%
17,159,512$ 47.59% 15,349,173$ 44.41%
Federal Grants and Contracts 45,000$ 0.12% 45,000$ 0.13%State Grants and Contracts 190,925$ 0.53% 190,925$ 0.55%Other Grants and Contracts 298,617$ 0.83% 173,379$ 0.50%
Sub-Total 534,542$ 1.48% 409,304$ 1.18%Sales and Services 230,100$ 0.64% 260,493$ 0.75%Other Sources 115,085$ 0.32% 268,073$ 0.78%
36,058,462$ 100.00% 34,565,266$ 100.00%
CURRENT FUND EXPENDITURESTotal Instructional Cost 14,293,474$ 39.64% 14,087,117$ 40.76%Research 14,288$ 0.04% 14,288$ 0.04%Public Service 300,134$ 0.83% 333,497$ 0.96%Academic Support 4,253,990$ 11.80% 3,776,725$ 10.93%Student Services 2,595,614$ 7.20% 2,510,408$ 7.26%Institutional Support 5,089,463$ 14.11% 4,842,143$ 14.01%Operations & Maintenance 4,965,183$ 13.77% 5,073,161$ 14.68%Scholarships & Fellowships 4,546,314$ 12.61% 3,927,925$ 11.36%Mandatory Transfers -$ 0.00% -$ 0.00%Non-Mandatory Transfers -$ 0.00% -$ 0.00%
TOTAL CURRENT EXPENDITURES 36,058,462$ 100.00% 34,565,266$ 100.00%
Tuition and Fees
5.1 - Summary of Budgeted E&G Revenues and Expenditures
2014-15 2013-14CURRENT FUND REVENUE
Local Govt. Appropriations
Total Govt. AppropriationsGrants and Contracts
TOTAL CURRENT REVENUE
SOURCE: MUW General Fund Budgets
Page 59 of 79

Tuition and Fees50.0%
State Appropriations47.6%
Grants and Contracts 1.5%
Sales and Services0.6%
Other0.3%
5.2 -MUW GENERAL FUND BUDGET PERCENT OF TOTAL E&G REVENUE BY BUDGET ENTITY
2014 - 15
Page 60 of 79

Total Instructional Cost40%
Institutional Support14%
Operations & Maintenance
14%
Scholarships & Fellowships12%
Academic Support12%
Student Services7%
Public Service1%
Research0%
5.3 - MUW General Fund BudgetPercent of Total E&G Expenditures by Budget Entity
2014 - 15
Page 61 of 79

$3.7
$4.0
$6.5
$3.3
$4.9
$0.6
$2.5
$3.8
$4.5
$8.0
$0.0 $0.0
$3.3
$1.0
$1.5
$5.0$5.3
$0.0
$5.1$4.9
$0.0
$1.0
$2.0
$3.0
$4.0
$5.0
$6.0
$7.0
$8.0
$9.0
1995 1996 1997 1998 1999 2000 2001 2002 2003 2004 2005 2006 2007 2008 2009 2010 2011 2012 2013 2014
Dol
lars
in M
illio
ns
Chart does not include MS Emergency Mgt. Agency disaster recovery funds.
5.4 - Authorization of State General Obligation Bonds for MUWFY 1994-95 through FY 2013-14
Page 62 of 79

$166.7
$159.2
$150.3 $150.3
$109.9
$101.0$94.7
$84.1
$67.7 $65.5
$13.8
$3.8
$-
$20.0
$40.0
$60.0
$80.0
$100.0
$120.0
$140.0
$160.0
$180.0
USM MSU JSU UM UMMC ASU DSU MVSU MUW MSU-AFVM
USM-GCRL
USM-Stennis
Dol
lars
in M
illio
ns
Chart does not include $35.6 million Ayers bonds divided between ASU, JSU, and MVSU.Chart does not include MUW's MS Emergency Mgt. Agency disaster recovery funds.
5.5 - Authorization of State General Obligation Bonds for IHL FY 1994-95 through FY 2013-14
Page 63 of 79

� �� � � � � �� � � �� �� � � � � � � � ���� � � � � � � �� �� � � � � � ��� �� �� �� � � �� � � � ! "
# $% % $% % $& & $ '( $) * +% $ ,- ./ + 0 / 1 *( 2 # ' 0 3 $ % 4 5 5 + * 6 $ , * 6 7 - , 8 * 9 / : , 8 * +( ;% % / 5 $ 4 , $ / ( / . < / = = * > *% 4( 6 9 5 8 / / =% < / 1 1 $% % $ / ( / ( < / = = * > *% , / 4 ? 4 + 6 6 * > + * *% 4 , , 8 * = *) * = % / .4% % / 5 $ 4 , *@ 7 4 5 5 4 = 4 : + * 4 , * @ 1 4% , * +% @ 4( 6 6 / 5 , / + 4 , *A < / ( , 4 5 , , 8 * <B C C DE E D B F B F GB H HI J I E K L M N O O PB Q L RI S F T K F IU VI W K L Q SU XI B S J D K Y Z Z Y Y[ \ Z ] ^ B S W K H H \ Z \[ O ^ ][ \ _ Z Z `B Sa Q I E L D B FE K bB Q L L R I K W W SI c D L K L D B F K L d e fg hi j k jl m l n n o p q j kl k jr i sl t o p n p ju p q ji v w x vy z { | } t ml t k o pl ~ ~ j o �l k j / ( ? 4% $( � � � �� $ ,% ( * � , + * 4 . . $ + 1 4 , $ / ( $% % 5 8 * 6 : = * 6 ./ + � � � �� � � ��� � �� � �� � � � � � � �� � � � � �� � � � � �� � � � � �� � � � �� � � � � � A < 4 + = 4 ¡ / ? * +- @ < 8 $ * .¢ ( ./ + 1 4 , $ / ( £ . . $ 5 * +@ $ % , 8 * 9 ; < 9 < £ < 5 4 1& : % = $ 4 $ % / ( A
¤ * = / ? $ % 4 , 4 7 = * / . 4 5 5 + * 6 $ , * 6 / + 4& & + / ) * 6 # ' 0 & + / > + 4 1 % A < / % ,% = $% , * 6 4 + * *% , $ 1 4 , *% 7 4% * 6 / ( , 8 * 7 *% , 6 4 , 4 4) 4 $ = 4 7 = * 4 , , 8 * , $ 1 * / . 5 / 1& $ = 4 , $ / ( A¥¦ ¦ § ¨ © ª « ¨ ©¬ § ® § ¯ ° ± ¯ ° ² ³ ´ ± µ « ¯ ¦ «¶ § ¥¦ ¦ § ¨ © ª « ¯ « ª µ ¥¦ ¦ § ¨ © ª « ª µ ®· ©¸ ¹ ¥¦ § µ ¸ ° º » ¨ ¼ ´ ª « ¨ ¶¥ ¦ ¦ § ¨ © ª « ª µ ® · © ¸ ½ ¯ ´ «¾ª ´ ª « ¿ ¨ À «¾ª ´ ª « Á ¨  ³ ª § ¨ ©Ã µ ´ « ª « ³ « ª µ ¯ Ä¥¦ « ª µ Å Ã µ « ¨ § ª °Á ¨ ² § « ´
¥ ¦ ¦ § ¨ © ª « ¯ « ª µ¥ ® ¨ µ ¦ ¸ ¥¦ « ª µ ¥ µ µ ³ ¯ Ä Æ ¨ ¨ ÇÈ ¨ ° ¼ ¨ § ´ É ª ² Ê ªË ¨ ¶ Ì ¨ ¯ ° Ž ¨ µ ® « É ¶ ¾ª ´ ª «
¥ ´ ´ ¦ ª ¯ « ¨ ¶ Ê ¦ ª ¨ µ ¦ ¨ª µ ¿ ³ § ´ ª µ ® Í �� Î �� � � � Ï � � Ð ��� �Ñ�� Ñ� �Ò Ó � Ô � � Õ � � � � � � ÕÖ× ØÙ Ú ÛÜ ÝÙ Þ ßà Ù � � à �Ü �Ø � � � Û Ý � �� � �à � Û Ú Û Ý �
Ü Û � � ÛÜ Ý � Ø ß Ø � �
�� � � � � �� � � � � � � ���
�� � �à � Û Ú Û Ý � Ü Û � � ÛÜ Ý �Ü �
� � � � Ù Ú ÛÜ Ý Û Ý Ø � � � Û Ý �
� � � Ø �
�× � � Ý � Ú Û Ú � Ú ÛÜ Ý � Ü � � Û � � à �ß à Ù � Ý Û Ý �� �Ü Ù � � Ü �
� � � � Úà à � � � � ß � � � �
� � � � � � � �
�� � � � � �� � � � � � � ���
� � � � � � � � � � � � �Ï � Í� � � � � � � � � � � � � � �
� � � �� � � �
� � � �� � � �
� � � �� � � �
� � � �� � � �
� � Р� � � � � � �
� � � � � �� �� � � � � � � �
! � � � �� � � �� �" � Ð �� � � � � �Ò � � � � Ï � # ��� � � � � � � � � ��� � � � $ � � �
� � Р� � � � � � �
� � � � � �� �� � � � � � � �
! � � � �� � � $ � � � �Ò � � �
� �� � �� � �� �� � � �� � � � � � � �� $ � �Ð �% � � � � � � � � $ &Ò � � � � � � � � � '�� � � � " � � � � � � � �� � �� � � �� � � � � � $ � � � � �� ��� " � � � � $ �� " � � �� � � � � $ �� � � � � �� � � � � � Ð � � �� ��� � Ð � � � �� �� � � � � � � �� � �� � � � � �� � �� � " � � $ � � Ð � �� � � � $ � � � � � �� �� � �� �
$ � � Ð Ï � # � �� Ï� � � ��( � � � �� Ï � # �
) � � � � � $
� � РР� � � � �� � � �� � �� �� � � � � � � � � �� � �� � � � �� � � �� � � � � � � ��� � � % �
" � � � � � � �� � � �� � � � � �
� � � ��
* �( � � �* � ' � � � � � � $ � �ÑÎ � �� � � � � � $Í� �� � �� �Í � �� � � � � � � $Î � � � � � � � $
� � � � �� � $ � � � � �
� � � � � �� �� � � � � � Ð �� �� � ÐÐ � Ð �� � � �
� � � Ò �� �� � ÐÐ � Ð �� � � �
� � � Ò �
Page 64 of 79

�� � � � � � � � �� � � � � � � � � � � � � � �� � �� � � � � � � � � � � �� � � � � � � � � � �� � �� � � � � � � � � � � � � �� � � � � � � � � � � � � � � � ��� � � � � � � ��� � � � � � � � � � � �� � � � � � � � � � � �� � � � ! � � � � � � �� � � � � �
� � � � � � � � � � � �� � � � � �� � � � � � � � � " � � #$ � � � � � � % � � & �' � � ( � � � !� � � � % � �� � � �
� � � % � � � & � � � � � �� � � � � � � � ) *+ , -. / 0 1 2 3 1 4 516 3) *+ � 1 4 4 /. 78 � 9 :�+ � 9 4 4 / 5 5 / 96 96
� 9 0 0 . ; / 1 <. � � * 5 /6 ;
� 3 � 8 1 < / 96 = � � � � >
�+ 7/ 5 5 / 5 5 / ? ? / � 6 5 < / <� < / 96 59 / ; -. * �. 1 *6 /6 ; � 9 1 * 3 9 � *� 5 <. . 5 = � �
� � >
� � �� � � � � � � � � � � � � �2 � )� � �� � � � � � � � � � � � � � � �
, ? * / 6 ;� @ � @
, ? * / 6 ;� @ � @
, ? * / 6 ;� @ � @
, ? * / 6 ;� @ � @
,� � 4 / < <. 38 96 < /6 � 9� 5/ 4 ? * 9� . 4 . 6 <? * 9 ; *. 5 5 *. ? 9 * <1 < 4 / 3� ? 9 /6 < 9 1 8 8 *. 3 / < 1 < / 96<. * 4= � �� @ � � � @ � >
,� � 4 / < 26 6 � 1 0
� 9 4 ? 0 / 16 8.!. ? 9 * < / 6
� 8 < 9 �. * 9 . 1 8 -: . 1 *
� 96 < /6 � /6 ;1 8 8 *. 3 / < 1 < / 96 9 *< - . 4 1" / 4 � 41 0 0 9 A . 3 � � @ : * 5+
, 1 4 . 1 5 1 � 9 � .# B� @ @ @ < 9 < 1 0
9 * � 9 < - < - . , � 16 3 7�
$ * 9 ; * 1 4 5,. . 1 � 9 � . 9 *96 . . . 9 * 1 0 0< - *. . 6 � * 5 / 6 ;? * 9 ; * 1 4 5
% <. 1 44 . 4 �. * 5 C% 3 1 : 5 9 * � 9 < -
, � 16 3 7�
$ * 9 ; * 1 4 5�� % <. 1 44 . 4 �. * 5 C
% 3 1 : 5 9 * � 9 < -? * 9 ; * 1 4 5
$ � � � � � � � � � � � � � � ) *+ , -. / 0 1 2 3 1 4 516 3) *+ D 9 -6 6 / . & / ' . A 1 * 3 16 .�+ � 9 4 4 / 5 5 / 96 96
� 9 0 0 . ; / 1 <.� � * 5 /6 ;
� 3 � 8 1 < / 96= � � � � >�+ 7/ 5 5 / 5 5 / ? ? / � 6 5 < / <� < / 96 59 / ; -. * �. 1 *6 /6 ;+ 9 1 * 3 9 � *� 5 <. . 5 = � �
� � >
� � �� � � � � � � � � � � � � �2 � )
� � �� � � � � � � � � � � � � � � �
, ? * / 6 ;� @ � @
, ? * / 6 ;� @ � @
, ? * / 6 ;� @ � @
, ? * / 6 ;� @ � @
,� � 4 / < <. 38 96 < /6 � 9� 5/ 4 ? * 9� . 4 . 6 <? * 9 ; *. 5 5 *. ? 9 * <1 < 4 / 3� ? 9 /6 < 9 1 8 8 *. 3 / < 1 < / 96<. * 4= � �� @ � � � @ � >
,� � 4 / < 26 6 � 1 0
� 9 4 ? 0 / 16 8.!. ? 9 * < / 6
� 8 < 9 �. * 9 . 1 8 -: . 1 *
� 96 < /6 � /6 ;1 8 8 *. 3 / < 1 < / 96 9 *< - . 4 1" / 4 � 41 0 0 9 A . 3 � @ : * 5+
, 1 4 . 1 5 1 � 9 � .,. . 1 � 9 � . 9 *
, � 16 3 7�
$ * 9 ; * 1 4 8 9 5 < 5
,. . 1 � 9 � . 9 *96 . . . 9 * 1 0 0< - *. . 6 � * 5 / 6 ;? * 9 ; * 1 4 5, 1 4 . 1 5 , �1 � 9 � .
, 1 4 . 1 5 , �1 � 9 � .
$ � � � � � � & � � � � � �� � & � � � � %(� � � � � �� � � % �
) *+ , -. / 0 1 2 3 1 4 516 3D 9 : � 9 A 6 5. 6 3
� 9� 6 8 / 0 96 2 8 1 3 . 4 / 82 8 8 *. 3 / < 1 < / 96 = � 2 2 > 9 < - . 2 4 . * / 8 16 , ? . . 8 - �
� 16 ; � 1 ; . � . 1 * /6 ;2 5 5 9 8 / 1 < / 96 = 2 , 2 >
� � �� � � � � � ) * + , ? * / 6 ;� @ � �
, ? * / 6 ;� @ � E ,� � 4 / < 26 6 � 1 0
� 9 4 ? 0 / 16 8.!. ? 9 * < / 6,. ? <. 4 �. * 9 . 1 8 - : . 1 *
� 96 < / 6 � / 6 ;1 8 8 *. 3 / < 1 < / 96 9 *< - . 4 1" / 4 � 41 0 0 9 A . 3 � , : * 5+# � � E B @ % <. 1 44 . 4 �. * 5 C
�� % 3 1 : 5
F F F F F F GHI JK KL L L M L N ML OPQ R R PQ SF F T FG G U GVW K KX X M Y YRP P R RPS Z [ \] ^ _ ` _ ab bc def g g
Page 65 of 79

�� � � � � � � � �� � � � � � � � � � � � � � �� � �� � � � � � � � � � � �� � � � � � � � � � �� � �� � � � � � � � � � � � � �� � � � � � � � � � � � � � � � ��� � � � � � � ��� � � � � � � � � � � �� � � � � � � � � � � �� � � � ! � � � � � � �� � � � � �
� � � � � � � � � � � �� � � � � �� � � � � � � � � " � � #$ � � � � � � % � � & �' � � ( � � � !� � � � % � �� � � �
� � � � � � � � � � � � � � � � � � � ) *+ , -. / 0 1 2 3 1 4 5
16 3) *+ 7 8 -6 6 /. ,� .
� / � . 9 1 * 3 16 .
�+ :/ 5 5 / 5 5 / ; ; /
� 6 5 < / <� < / 86 5 8 �
� / = -. * . 1 *6 / 6 = 8 1 * 3 8 �
� *� 5 <. . 5 > � � 8 1 * 3 ?
�+ 8 4 4 / 5 5 / 86 86
8 0 0. = / 1 <. � � * 5 / 6 =
� 3 � @ 1 < / 86 > � � ?
� � �� � � � � � � � � � � � � � � �
� � �� � � � � � �� � � � � � � � � � �
� � � � � � �! � � � " � � � � � � # �
,. ; <+ �$ A%� B � &
� 6 / < / 1 01 @ @ *. 3 / < 1 < / 86 / 6:1 C � B � �
� � � % � � �& � � � � � � � ��� � � � � � �
� � �� � � % � � � & � � � � � �� � � � � � � � � �� � � � � � � � � � � � �
) *+ , @ 8 < < � 8 0 0 / 5 86
16 3) *+ :1 * < C * 8 @ D
2 @ @ *. 3 / < 1 < / 86 8� 6 @ / 0 � 8 *
� 5 / 6 . 5 5 , @ - 8 8 0 5 16 3
' * 8 = * 1 4 5 > 2 , ' ?
� � �� � � ( �� � # " ) , ; * / 6 =� B � B , ; * / 6 =� B � B � 8 / 6 <. * / 4 *. ; 8 * <*. * � / *. 3+'. * / 8 3 / @*. ; 8 * < < 8 2 , '3 � . . + . *C <9 8C . 1 * 5+ 1 5 < 5. 0 �$*. ; 8 * < 5� , 4 / < <. 3B E$ - B$ B .
86 < / 6 � / 6 =1 @ @ *. 3 / < 1 < / 86 � 8 *< - . 4 1/1 0 0 8 9 . 3 % � B C * 50 � . & B - <. 1 44 . 4 ,. * 5 F - 3 1 C 5
� � � % � � � � � � � � �$ � � � �� � � % � � � $ � � � �� � $ � � � � 1 � � � � � � �
� � �� � � % � � � $ � � � �� � $ � � � � ( % � � � ��
) *+ 7 � 0 / 1 :8 * < C 1 D 8+ 1 � 1 < / 86 1 0 2 5 5 8 @ / 1 < / 86 8 �, @ - 8 8 0 5 8 � :� 5 / @> � 2 , :?
� � �� � � � � � � " � � !
� � � " � � �� # " )
� B � A , ; * / 6 =� B � A ,� , 4 / < 16 6 � 1 0
� / = -. * � 3 � @ 1 < / 862 * < 5 ) 1 < 1 ,. *+ / @. 5> � � 2 ) , ? *. ; 8 * <+ 86 < / 6 � / 6 =1 @ @ *. 3 / < 1 < / 86 � 8 *4 1/ 1 0 0 8 9 . 3 %� B C * 5
0 � - � A% /6 + 8 / @.86 ,. ; <. 4 ,. *
� 8 � . 1 @ - C . 1 *� <. 1 44 . 4 ,. * 5 F �3 1 C 5
� � � � � � ��� �� �� � � � � �� �� �� �� � � �� � � ��� � �� � � � � � � �� � � �� � � � � �� �� � ! " "
Page 66 of 79

�� � � � � � � � �� � � � � � � � � � � � � � �� � �� � � � � � � � � � � �� � � � � � � � � � �� � �� � � � � � � � � � � � � ��� � � � � � � � � � � � � � � ��� � � � � � � ��� � � � � � � � � � � �� � � � � � � � � � � �� � � � ! � � � � � � �� � � � � �
�� � � � � � � � � � �� � � � � �� � � � � � � � � " � � #$ � � � � � � % � � & �' � � ( � � � !� � � � % � �� � � �
� � � % � � � � � � � � �" � � � � � � �
� � �� � � % � � � " � � �� � � �
) * + , - . / 0 12 3 � + 4 / 5- + 67 8 8 5 0 / + 4 / 5- 5 �) 0 * 5 5 6 8 5 � 7 9 4+- : .2 8 / ;-< � 7 ) 7 . =
, , ,> - 8 + :> + 9 4 8� + 0 0 92 : / 4> 5 9 ; ) ? 9 / - ;� @ � �
) ? 9 / - ;� @ � �
)� � A / 4 +- - � + 6
� / ; *2 9 : � 0 + 4 / 5-7 9 4 8 . + 4 + )2 9 / 02 8< � 7 . ) = 92 ? 5 9 4>
� 5- 4 /- � / - ;+ 0 0 92 : / 4 + 4 / 5- � 5 9A +� + 6 6 5 , 2 : � @3 9 8
� � � � B ? + / :
� @ � � < /- 5 / 02 :+- - � + 6 6 3 5-C � 6 3 � =
� 42 + AA 2 A �2 9 8 � � �: + 3 / 8 / 4
� � � % � � �� � � � ! & � � � � � � � �� � � & � � � � � �
�2 8 62 3 � + 9 92 4 4 C> .> 7 A 2 9 / 0 +- � + 97 8 8 5 0 / + 4 / 5- < 7 � 7 = , , ,> + A 2 9 / 0 +- � + 9> 5 9 ; D
� � � � � � �� � � � � � � � � � � � � �
) ? 9 / - ;� @ � �
) ? 9 / - ;� @ � B ! - 42 9 / A 92 ? 5 9 42 2 93 4 * 92 2 3 2 + 9 8>
� 5- 4 /- � / - ;+ ? ? 9 5 + 6 � 5 9 A +�+ 6 6 5 , 2 : E 3 9 8
� � � � @ : � 2 5-5 9 �2 � 5 92 F+ 3
� 2 + 0 * 3 2 + 9
� 42 + AA 2 A �2 9 8 D � 4 5 �
� D � : + 3 8
� � � % � � �& � � � � � � � � " � � � �& � � � � � �
. 9> � 5 6 6 2 2 - G 9 5 ; * � + 4 / 5- + 6 � 5� - 0 / 65- " + A / 6 3#2 6 + 4 / 5- 8 < � � " # =
, , ,> - 0 � 9> 5 9 ; ) ? 9 / - ;� @ � H ) ? 9 / - ;� @ � I $ 3 ? / 0 + 6 6 3 - 5 / 8 / 4 / 892 % � / 92 : �� 4: 5 0� A 2 - 4 + 4 / 5-A � 8 4 �2 8� � A / 4 42 :2 2 93 � 3 9 8
� 5- 4 /- � / - ;+ ? ? 9 5 + 6 � 5 9 A +�+ 6 6 5 , 2 : � 3 9 8
� B � : � 2 5- 5 9
�2 � 5 92 7? 9 / 6 �2 + 0 * 3 2 + 9 2 � 02 ? 492 - 2 , + 6 3 2 + 9, *2 - �2 2 / 8 � � @ @� 5- 2 92 % � / 92 :&
� � " # 0 +- 82 - :
� � � 42 + AA 2 A �2 9 8 D � � �. + 3 8
� � � � � � ��� �� �� � � � � �� �� �� �� � � �� � � ��� � �� � � � � � � �� � � �� � � � � �� �� � ! " "
Page 67 of 79

�� � � � � � � � �� � � � � � � � � � � � � � �� � �� � � � � � � � � � � �� � � � � � � � � � �� � �� � � � � � � � � � � � � ��� � � � � � � � � � � � � � � ��� � � � � � � ��� � � � � � � � � � � �� � � � � � � � � � � �� � � � ! � � � � � � �� � � � � �
�� � � � � � � � � � �� � � � � �� � � � � � � � � " � � #$ � � � � � � % � � & �' � � ( � � � !� � � � % � �� � � �
� � � � � % � �� � � � � � � �� � � � � � ) *+ * , * - . -+ /- / � -+ 01 / 2
3 45 6 � 1 7 8 . . 9 � 6 : * , ; �5 <* = = * = = * > > *31 > - 4 , : 1 + , 8 �
� / � 0 - , * 8+ ) <3 � 2
�5 � - , * 8+ - .
8� + 0 * . � 8 4? 0 0 41 / * , - , * 8+*+ 1 - 0 ; 1 4
� / � 0 - , * 8+) � ? � 2��1 0 8 : *+ @ , ;1
8� + 0 * . � 8 4? 0 0 41 / * , - , * 8+
� 8 4 � / � 0 - , 8 4
41 > - 4 - , * 8+) ? � 2�5 6 > 1 0 * - . *� 1 /
4 8 �1 = = * 8+ - .? = = 8 0 * - , * 8+ =) 6 ? = 2A
� � �� � � � � �� � � � � � � �? � 3� � �� � � � � � � � �
6 > 4 * + @� B � �
! - . .� B � �
! - . .� B � C
"1 > 8 4 , =� � : * , ,1 /-+ + � - . . 95"1 > 8 4 , ==� � : * , ,1 /-+ + � - . . 9 , 8- / / 41 = = - 41 - =
� 8 4 * : > 4 8� 1 : 1 + ,5
6 ? 41 > 8 4 , ==� � : * , ,1 / - � 8� ,8+ 1 9 1 - 4 > 4 * 8 4 , 8
� ? � � * = * ,5
8+ , *+ � * + @- 0 0 41 / * , - , * 8+
8+ , *+ � * + @- 0 0 41 / * , - , * 8+
8+ , *+ � * + @- 0 0 41 / * , - , * 8+
� 8+ 1# � $ B B ) � - 4 *1 =
� - =1 / 8++ � : �1 4 8 �@ 4 - / � - ,1 = 2
� / - 9$� D ,1 - :: 1 : �1 4 =) *+ 0 . � /1 = <3 �,1 - : E ; 80 8+ / � 0 , =0 8+ 0� 4 41 + ,41 � * 1 E 2 F � / - 9 =
� ?
� � � � � � ��� �� �� � � � � �� �� �� �� � � �� � � ��� � �� � � � � � � �� � � �� � � � � �� �� � ! " "
Page 68 of 79

� � � � � �� � � � � � � � � � � � � � � � � � � �� �� � � � � � � � � � � � � � � � � � � � � �� � � � � � � � � � � � � � � � � � � �� � � � � �� � � � � � � � � � � � � �� � � � � � � � � � � � � � � �� � � � � � �� � �
� � � � �� � � � � � � �� � � � � � � � � � �� � � �� � � �� � � � � � � � � � � � � � � � � �� � � � �� � � � � � � � � � � � � � � � �� � � � � � � � � � � � � � � � � � �� � � � �� � � � � � � � � � � � � � � � � � � � � � � � �� � � � � � � �
� � � � � � � �� � � � � � �� � � � � � � � � � � � � � � �� � � � �� � � � � � � � ! " # ��
�� � � � �
� � � � �
� � � � � � � � � ��
� � �� � � � � � � �
�� � � � � � �� � �� � �� � � � � �
� � � � � �
�� � � � � � � � � ��
� � � ! � � �
" # ! � � �
$ % � � �
& � � � � � � � � '
�� � � � ( & � � �$ � � �
�� � � � � � � �� � � � � �� � � �
� � � � � ' ) *+ � � � , � �
- �. � � / � � (
� � � , � � ! � � �
01 21 3 4 56 7 8 59 :9 ; <=> 7 ? @ A 56 ; B 7 C D 5 E 5 @ ? D 59 6
F C1 G ? C H 0 7 ?6 I JK 7 C 5 @ ?6J : : 5 ?6 @ 7 E9 CL 7 ? D A= M A < 8 5 @ ? :
N OP @ ? D 59 6Q J J L M N R F S
T T TU V V W X Y Z [ U \ Z ] 2 P ^ K 5 D D 7 O ?6 56 5 D 5 ? :
C 7 _9 C D ` I a b I a c =8 P ^ K 5 D D 7 O ? C 7 8 _9 6 8 7D9 @9 6 O 5 D 59 6 8 = ` I a b I a cd ? D 5 9 6 ? : : < C 7 @9 ;6 5e 7 O
f 5 D A @9 6 O 5 D 59 6 8D A C9 P ; Ag I a b I a b
h E E 8 5 D 7 7 : 7 @ D C9 6 5 @
8 P ^ K 5 8 8 59 6 ?6 O
C 7 i 5 7 f
0 ? @ A 7 :9 C 8 = N : 7 K 76 D ? C <N O P @ ? D 59 6
F C1 G9 6 5 @ ? R 5 : 7 < I J 8 89 @ 5 ? D 5 9 6 E9 CB A 5 : O A9 9 O
N OP @ ? D 59 6j6 D 7 C6 ? D 59 6 ? :
Q J B N j S
T T TU V k Y l U \ Z ] 2 P ^ K 5 D D 7 O ?6 56 5 D 5 ? :
C 7 _9 C D ` I a b I a c =8 P ^ K 5 D D 7 O ? C 7 8 _9 6 8 7D9 @9 6 O 5 D 59 6 8 = m I a b I a cd ? D 5 9 6 ? : : < C 7 @9 ;6 5e 7 O
D A C9 P ; A c n a `
h E E 8 5 D 7 7 : 7 @ D C9 6 5 @
8 P ^ K 5 8 8 59 6 ?6 O
C 7 i 5 7 f
2 _ ?6 5 8 A 3 > 7 ? @ A 7 CB 7 C D 5 E 5 @ ? D 59 6
G 81 N C 56 6 L9 : :9 f ? < I JK 7 C 5 @ ?6B 9 P 6 @ 5 : 9 6 D A 7> 7 ? @ A 56 ; 9 E
o 9 C 7 5 ;6p ?6 ;P ? ; 7 8Q J B > o p S
T T T U V k q r s U \ Z ] t C ?6 D 7 O O 7 E 7 CK 76 D
E C9 K C 7 i 5 7 f ^ 7 @ ?P 8 7
9 E :9 f 76 C9 : :K 76 D 56
_ C9 ; C ?K
G ? 8 D 7 C 8 _ C9 ; C ?K 56N O P @ ? D 59 6 ? : p 7 ? O 7 C 8 A 5 _F C1 2 P 7 u9 : : < I 2 K 5 D A I N OP @ ? D 59 6 ? :
p 7 ? O 7 C 8 A 5 _B 9 6 8 D 5 DP 76 D
B 9 P 6 @ 5 : Q N p B B =C 7 _ C 7 8 76 D 56 ;J J 2 J = J 2 B F =d J N 2 M = d J 2 2 M ST T TU V V v V U \ Z ] 2 P ^ K 5 D D 7 O ?6 56 5 D 5 ? :
C 7 _9 C D= ` I a b I a c
d ? D 5 9 6 ? : : < C 7 @9 ;6 5e 7 O
D A C9 P ; A c n a `
h E E 8 5 D 7 7 : 7 @ D C9 6 5 @
8 P ^ K 5 8 8 59 6 ?6 O
C 7 i 5 7 f
G ? 8 D 7 C 8 _ C9 ; C ?K 56R 7 ? O 56 ; w p 5 D 7 C ? @ <
F C1 G9 6 5 @ ? R 5 : 7 < I j6 D 7 C6 ? D 59 6 ? :
R 7 ? O 56 ;J 8 8 9 @ 5 ? D 59 6Q j R J S
T T TU Z Y V [ l x ]U \ Z ] 2 P ^ K 5 D D 7 O ?6 56 5 D 5 ? :
C 7 _9 C D= ` I a b I a c
d ? D 5 9 6 ? : : < C 7 @9 ;6 5e 7 O
D A C9 P ; A c n a `
h E E 8 5 D 7 7 : 7 @ D C9 6 5 @
8 P ^ K 5 8 8 59 6 ?6 O
C 7 i 5 7 f
0 ? @ A 7 :9 C 8 = 2 9 @ 5 ? :
2 DP O 5 7 8 > 7 ? @ A 7 CB 7 C D 5 E 5 @ ? D 59 6
F C1 u9 6 ? D A ?6 L9 9 H 8 I d ? D 5 9 6 ? : B9 P 6 @ 5 :
E9 C 2 9 @ 5 ? : 2 DP O 5 7 8Q d B 2 2 S
T T TU v \ k l V s v q y [ l Y v U \ Z ] 2 P ^ K 5 D D 7 O ?6 56 5 D 5 ? :
C 7 _9 C D= ` I a b = a c = ?6 O
C 7 8 _9 6 8 7 8 D9
@ 9 6 O 5 D 59 6 8 = m I a b I a c z
` I a b I a c
d ? D 5 9 6 ? : : < C 7 @9 ;6 5e 7 O
D A C9 P ; A c n a `
h E E 8 5 D 7 7 : 7 @ D C9 6 5 @
8 P ^ K 5 8 8 59 6 ?6 O
C 7 i 5 7 f
� � � � � � ��� �� �� � � � � �� �� �� �� � � �� � � ��� � �� � � � � � � �� � � �� � � � � �� �� � ! " "
Page 69 of 79

�� � � � � � � � �
� � � � �
� � � � � � � �� �
� � �� � � � � � � � � � �
�� � � � � � � � � � �� � �� � � � � �
� � � � � � � �
�� � � � � � � � � � ��
� � � � �� � � � �
� � � �� � � � �
� � � � � � � �
� � � � � � � � � � !
�� � � � " � � � � � �
� � � � � �
�� � � � � � � � � � �
� � � � � �� � � �
� � � � � ! # � � $% � � � � � � & � �
' �( � � ) � � � "
� � � � & � � � � � �
* + , - . /0 1 2 3 45 6 / 7 2 - 8 7 9 -
: . + , - . 1 ; . 1 9 7 < 7 , + 9 70 5
= 1> ? /0 1 7 + * @ 5 5 . / / A B + 9 7 0 5 + / ;0 @ 5 , 7 /
0 < : . + , - . 1 2 0 <
45 6 / 7 2 - C B ; : 4 D
E E EF G H I J F K L M N @ O P 7 9 9 . Q +5 75 7 9 7 + /
1 . R0 1 93 S A T U A T V
B + 9 7 0 5 + / / W 1 . ,0 65 7
9 - 10 @ 6 - V Y T S
Z < < 2 7 9 . . / . , 9 10 5 7 ,
2 @ O P 7 2 2 70 5 +5 Q
1 . [ 7 . 8
* + , - . /0 1 2 3 \ + 9 - . P + 9 7 , 2
8 7 9 - : . + , - . 1
; . 1 9 7 < 7 , + 9 70 5
= 1> * 0 5 5 7 . Z R R .5 - . 7 P . 1 A B + 9 7 0 5 + / ;0 @ 5 , 7 /
<0 1 : . + , - . 1 2 0 <
\ + 9 - . P + 9 7 , 2C B ; : \ D
E E EF G H I ] F K L M ? 1 +5 9 . Q Q . < . 1P .5 9
< 10 P 1 . [ 7 . 8 O . , +@ 2 .
0 < /0 8 .5 10 / /P .5 9 75
R 10 6 1 +P
* + , - . /0 1 2 3 * 70 /0 6 W 8 7 9 -
: . + , - . 1 ; . 1 9 7 < 7 , + 9 70 5
= 1> = 7 0 5 5 . ^ 0 1 9 .5 O . 1 1 W A B + 9 7 0 5 + /
N , 7 .5 , . : . + , - . 1 2
_ 2 2 0 , 7 + 9 70 5C B N : _ D
E E EF G ` I a F K L M N @ O P 7 9 9 . Q +5 75 7 9 7 + /
1 . R 0 1 9 3 b A T U A T V 32 @ O P 7 9 9 . Q + 2 . , 0 5 Q
1 . R 0 1 9 3 b A T U A T b
B + 9 70 5 + / / W
1 . ,0 65 7X . Q 8 7 9 -
,0 5 Q 7 9 70 5 2 9 - 10 @ 6 -
c A T A T U
Z < < 2 7 9 . . / . , 9 10 5 7 ,
2 @ O P 7 2 2 70 5 +5 Q
1 . [ 7 . 8
\ + 2 9 . 1 2 75 ? 7 < 9 . Q
N 9@ Q 7 . 2
= 1> d0 W + / :0 W B + 9 70 5 + /
_ 2 20 , 7 + 9 7 0 5 0 <
? 7 < 9 . Q +5 Q : + / .5 9 . Q8 8 8> 5 + 6 ,> 0 1 6 N @ O P 7 9 9 . Q +5 75 7 9 7 + /
1 . R 0 1 9 3 S A T U A T T 32 @ O P 7 9 9 . Q + 1 . 2 R0 5 2 .
90 ,0 5 Q 7 9 70 5 2 3 S A T U AT V
B + 9 70 5 + / / W
1 . ,0 65 7X . Q 9 - 10 @ 6 -
V Y T S
Z < < 2 7 9 . . / . , 9 10 5 7 ,
2 @ O P 7 2 2 70 5 +5 Q
1 . [ 7 . 8
\ + 2 9 . 1 2 0 < _ 1 9 2 75
: . + , - 75 6
= 1> \0 5 7 , + d 7 / . W B ; _ : 4 8 8 8> 5 , + 9 .> 0 1 6 ^ + / /V Y T S
N @ O P 7 9 9 . Q +5 75 7 9 7 + /
1 . R 0 1 9 3 S A T U A T T 32 @ O P 7 9 9 . Q + 1 . 2 R0 5 2 .
90 ,0 5 Q 7 9 70 5 2 3 S A T U AT V
e0 8 .5 10 / /P .5 9
R 10 6 1 +P 3 <@ 1 9 - . 1Q . [ . /0 R P .5 9
1 . f@ 7 1 . Q
Z < < 2 7 9 . . / . , 9 10 5 7 ,
2 @ O P 7 2 2 70 5 +5 Q
1 . [ 7 . 8
g 5 0 0 5 2 7 9 . [ 7 2 7 9 2
� � � � � � ��� �� �� � � � � �� �� �� �� � � �� � � ��� � �� � � � � � � �� � � �� � � � � �� �� � ! " "
Page 70 of 79

Provost/Vice President for Academic AffairsProvost/Vice President for
Academic Affairs
Director, Gordy Honors College
Associate Vice President for
Academic Affairs
Registrar
Graduate Studies
Academic DeansDean, Library
Services
Director, Student Success Center Director, QEP
Director, Outreach and Innovation
Director, Center for Women’s Research
and Public Policy
Director, Sponsored Programs
Director, Center for Teaching and
Learning
Director, Governor’s School
Director of Honors and Study Abroad
10/1/14
Page 71 of 79

Academic Units
Provost, Vice President for Academic Affairs
Dean, Arts and Sciences
Chairs of Art and Design; Communication; History, Political
Science, and Geography; Languages, Literature, an d Philosophy; Music;
Sciences and Mathematics; and Theatre
Dean, Business and Professional Studies
Chairs of Business; Legal Studies; and Culinary Arts Institute
Dean, Education and Human Sciences
Chairs of Education; Psychology and Family Studies; and Health and Kinesiology
Dean, Nursing and Speech Language Pathology
Chairs of Associate Nursing; Baccalaureate Nursing; Graduate
Nursing; and Speech Language Pathology
Dean, Library Services
10/1/14
Page 72 of 79

Explanation of Terms
Academic Year is the year that begins with the first summer session and continues through the next spring session; for example, Academic Year 2014-2015 refers to Summer 2014, Fall 2014, and Spring 2015.
ACT is the American College Test, which is divided into four main sections: Mathematics, English, Reading, and Science Reasoning.
CIP Codes are the Classification of Instructional Program Codes that are updated every 10 years. We are currently operating under the 2010 CIP Codes. These six-digit codes are used to answer questions concerning program enrollments and completions on three of the IPEDS Surveys: Institutional Characteristics, Completions, and Enrollment.
Cohort refers to a specific population, which is studied over a period of time, such as a group of students who enrolled for the first time in the Fall of 2014.
EMAS is the Enrollment Management Action System software that is used by the Admissions Office.
Fiscal Year is the year that begins on July 1 and ends on June 30; for example, Fiscal Year 2014-2015 (FY 2015) extends from July 1, 2014 through June 30, 2015.
Full-time graduate student is one who is enrolled in 9 or more semester credit hours.
Full-time undergraduate student is one who is enrolled in 12 or more semester credit hours.
Graduate FTE (full-time equivalent) is calculated by dividing total graduate semester credit hours by 12.
Headcount as defined by IHL is the actual number of different individuals enrolled in credit courses. Headcount can be unduplicated or duplicated; a duplicated headcount duplicates students who take classes on more than one campus. According to IHL’s duplicated headcount definition, an undergraduate student who takes nine hours on main campus and three hours at Tupelo is counted as two part-time undergraduate students. In duplicated headcount, a student’s full-time/part-time status is determined by hours per campus not total hours taken.
IHL refers to the Board of Trustees of State Institutions of Higher Learning in Mississippi.
IPEDS is the Integrated Post-secondary Education Data System.
Page 73 of 79

Non-traditional student, as defined by IHL, refers to an undergraduate student who is 25 years of age or over.
Part-time graduate student is one who is enrolled in less than 9 semester credit hours.
Part-time undergraduate student is one who is enrolled in less than 12 semester credit hours.
Ranked faculty are full-time faculty positions including instructors, assistant professors, associate professors, and professors.
SREB (Southern Regional Education Board) States include: Alabama, Arkansas, Delaware, Florida, Georgia, Kentucky, Louisiana, Mississippi, Maryland, North Carolina, Oklahoma, South Carolina, Tennessee, Texas, Virginia, and West Virginia.
Student Level, as defined by IHLDefinitions Effective as of the Beginning of Summer 2001
Freshmen – Students who have completed less than 30 semester hours.
Sophomores – Students who have completed at least 30 semester hours, but fewer than 60 semester hours.
Juniors – Students who have completed at least 60 semester hours, but fewer than 90 semester hours.
Seniors – Students who have completed at least 90 semester hours, but have not completed all the requirements for the undergraduate degree for which she/he is currently enrolled.
Fifth Year Level – Student is at advanced undergraduate upper level in five-year programs (e.g. architecture and engineering) or students with a bachelor’s or higher degree who are taking additional undergraduate courses.
Master’s – Student is in a program or degree that usually covers one year and approximately 30 semester hours above the baccalaureate.
Specialist – Student is in a program or degree that usually covers one year and approximately 30-36 semester hours above the baccalaureate.
Doctoral – Student is in a program or degree that usually covers two years and approximately 60 semester hours above the master’s
Page 74 of 79

Unclassified Post-baccalaureate – Student is not a candidate for a Baccalaureate degree or other formal award, although taking graduate classes with other students. Includes but is not limited to “special” and other students taking first-professional or graduate courses, but who are not working toward a degree.
First Professional – Student is in the first year of a Year/Level 1 program or degree leading to the first level of professional training, as recognized by others in the profession. Examples: J.D., M.D., D.V.M. etc.
Total Operating Budget includes restricted, designated, and auxiliary funding.
Type of current registration as defined by IHL:
First-time Freshman – (First-time Freshman--(1) A student who has never attended a college or university; or (2) a student who has previously attended any college or university for the first time in the prior summer term; or (3) a recent high school graduate who graduated in May and enrolled the following Fall term (regardless of summer enrollment); or (4) a student who successfully completed the twelve hour Summer Developmental Program regardless of the institution attended; or (5) a student with advanced standing (AP, CLEP or college credits earned before high school graduation). As a general rule, recent high school graduates who enroll in the fall term after graduation should be counted as first-time freshmen, regardless of their academic activity between graduation and their fall enrollment. Students who skip the fall term and enter in the spring are still considered to be first-time freshmen if they have not attended another postsecondary institution. However, students who skip the fall and enroll in the spring with any prior coursework after high school are considered to be first-time transfers.Note: Starting with the Summer 2009 term, the 12-hour requirement for first-time freshmen has been omitted in order to meet IPEDS criteria. Prior to that time first-time entering freshmen could not have more than 12 hours.
Unusual Examples of First-time Freshman: A student completes the 9-week Summer Developmental Program at MSU and enrolls at MUW the following fall term. The student would be a first-time freshman at MUW. All Summer Developmental Program students are to be coded as first-time freshmen regardless of institution attended. A student graduates from Biloxi high school in May, earns 6 AP hours, takes 12 credit hours at Gulf Coast Community College the following summer, and enrolls at MUW the following fall. The student would be a first-time freshman at MUW.A student graduates from Biloxi high school in May, takes 9 credit hours at Gulf Coast Community College the following summer, and enrolls at MUW the following spring term (he or she skips the fall term to work). The student would be a first-time transfer at MUW.
Page 75 of 79

A student graduates from Tupelo high school in May, earns 15 AP hours, takes 15 credit hours at Northwest Community College the following summer, and enrolls at MUW the following fall. The student would be a first-time freshman at MUW (but have a sophomore academic level)
Returning Undergraduate Student – An undergraduate student who has registered at this institution during the preceding regular term and would not be classed as a first-time freshman.
Readmitted Student – An undergraduate student who previously attended this institution but did not attend this institution during the previous regular term.
First-Time Transfer Student --An undergraduate student entering the reporting institution for the first time who previously attended another postsecondary institution---exceptions include the first-time freshmen criteria outlined above. These students may or may not have transfer credit hours. Note: Starting with the Summer 2009 semester, the 12-hour requirement for first-time transfershas been omitted in order to meet IPEDS criteria. Prior to that time first-time transfers were required to have at least 12 hours from another institution.
Unusual Examples of First-time Transfers: A student attends Gulf Coast Community College as an entering freshman during the fall term and enrolls in 12 hours, but he or she is unable to complete the semester because of a medical hardship. When the student enrolls at MUW the following spring term, he or she is a first-time transfer student despite having no transferable hours (previously attended institution). A student graduates from Biloxi high school in May, takes 9 credit hours at Gulf Coast Community College the following summer, and enrolls at MUW the following spring term (he or she skips the fall term to work). The student would be a first-time transfer at MUW.
Returning or Transfer Graduate Students – A student who is enrolled for credit for work creditable toward a graduate degree, i.e., master’s, specialist, or doctorate and was previously registered as a graduate student at this institution or another institution.
First-Professional Student – A student who is enrolled for work creditable toward a first professional degree (law, dentistry, medicine)
Transient Student – A student who is regularly enrolled and in good standing at an institution other than the reporting institution and is taking a course or courses at the reporting institution which he/she intends to transfer to his/her regular institution.
High School Student Taking College Courses – A student who is still in high school but has special permission to take a college level course.
Page 76 of 79

Non-formula Students 21 and over - A student who is currently registered under provisions or original admission code of 6 on data element 4-112 which is for students who are at least age 21 and who do not meet admissions standards and who do not fall into the first five Original Admission Code categories.
First-time graduate student – A new graduate student. One who has not been registered previously as a graduate student.
Other – A student who is not classified in one of the preceding categories.
Summer Developmental Program Participant – A student enrolled in the Summer Developmental Program. Valid in summer term only.
Returning Post Baccalaureate - A student who has already earned his or her baccalaureate degree (from any institution) and is taking additional undergraduate or graduate courses to continue his or her education. This is typically a non-degree student who is not enrolled in an academic program. This may include faculty and staff taking courses for lifelong learning.
Unduplicated headcount figures count each individual student once regardless of the number of branch campus affiliations (Tupelo, Italy).
Undergraduate FTE (full-time equivalent) is calculated by dividing total undergraduate semester credit hours by 15.
University Abbreviations: ASU Alcorn State UniversityDSU Delta State UniversityJSU Jackson State UniversityMSU Mississippi State UniversityMUW Mississippi University for WomenMVSU Mississippi Valley State UniversityUM University of MississippiUMMC University of Mississippi Medical CenterUSM University of Southern Mississippi MSU-AFVM Mississippi State University’s Division of Agriculture, Forestry, and Veterinary MedicineUSM-GCRL University of Southern Mississippi’s Gulf Coast Research Laboratory USM-Stennis University of Southern Mississippi’s Stennis Space Center
Page 77 of 79