Adoption trend for mobile banking in Urban Bangladesh
75
MOBILE BANKING IN URBAN BANGLADESH: ADOPTION SCENARIO AND CURRENT TRENDS
Transcript of Adoption trend for mobile banking in Urban Bangladesh
MOBILE BANKING IN URBAN
BANGLADESH: ADOPTION SCENARIO
AND CURRENT TRENDS
i | P a g e
ACKNOWLEDGEMENT
We would like to acknowledge to Mr Mahbub Jeshan, manager of trade marketing at Bkash
and Mr Shahedul Islam, Head of logistics of Dutch Bangla Bank Limited for providing us
with invaluable industry insight for the completion of the report. Finally, we express our
heartfelt gratitude to those who have cooperated with us in taking the surveys and helped us
complete the report through their encouragement.
ii | P a g e
CONTENTS
Acknowledgement ................................................................................................................................... i
1 Introduction ..................................................................................................................................... 0
Background ............................................................................................................................. 0 1.1
Issues ....................................................................................................................................... 1 1.2
Research question ................................................................................................................... 1 1.3
Objectives ............................................................................................................................... 2 1.4
1.4.1 Broad objective ................................................................................................................... 2
1.4.2 Specific objectives .............................................................................................................. 2
Hypotheses .............................................................................................................................. 2 1.5
Rationale ................................................................................................................................. 3 1.6
Scope ....................................................................................................................................... 3 1.7
Limitations .............................................................................................................................. 4 1.8
Contribution of the research .................................................................................................... 4 1.9
2 Literature Review ............................................................................................................................ 5
Adoption process: Diffusion of innovation theory .................................................................. 7 2.1
3 Research type .................................................................................................................................. 8
4 Research Method: ........................................................................................................................... 9
Sample size determination ...................................................................................................... 9 4.1
Questionnaire Development .................................................................................................. 10 4.2
4.2.1 Questionnaire Design ........................................................................................................ 10
4.2.2 Questionnaire validity ....................................................................................................... 10
4.2.3 Questionnaire reliability .................................................................................................... 11
Data Collection ..................................................................................................................... 11 4.3
4.3.1 Primary DataCollection ..................................................................................................... 11
4.3.2 Secondary Data ................................................................................................................. 14
5 findings ......................................................................................................................................... 14
adoption scenario .................................................................................................................. 14 5.1
5.1.1 adoption summary ............................................................................................................. 14
5.1.2 Identification variables ...................................................................................................... 14
5.1.3 Interpretation ..................................................................................................................... 15
5.1.4 frequencies ........................................................................................................................ 15
5.1.5 Adopter profile .................................................................................................................. 15
sample statistics .................................................................................................................... 16 5.2
iii | P a g e
5.2.1 Sample demography .......................................................................................................... 16
5.2.2 Access to supporting technology ...................................................................................... 17
5.2.3 Decision sources ............................................................................................................... 19
mean analysis ........................................................................................................................ 20 5.3
similarity test ......................................................................................................................... 21 5.4
Regression Analysis .............................................................................................................. 21 5.5
Hypothesis Testing ................................................................................................................ 24 5.6
5.6.1 Specific Objective 1: To identify the relations between consumer adoption of mobile
banking and user characteristics.. ................................................................................................. 25
5.6.2 Specific Objective 2: To analyze the perception of m-banking adopters regarding the
technology ..................................................................................................................................... 33
5.6.3 Specific Objective 3: To provide a holistic view on the industry trends. ......................... 36
Qualitative finding: industry trend ........................................................................................ 39 5.7
5.7.1 Growth trend ..................................................................................................................... 39
5.7.2 Market Players: ................................................................................................................. 40
6 recommendations .......................................................................................................................... 41
7 conclusion ..................................................................................................................................... 42
8 appendix ........................................................................................................................................ 43
Notes ..................................................................................................................................... 43 8.1
bibliography .......................................................................................................................... 44 8.2
9 Bibliography ................................................................................................................................. 44
10 Annexure ....................................................................................................................................... 45
Annex 1: Reliability Test ...................................................................................................... 45 10.1
Annex 2: Descriptive test ...................................................................................................... 47 10.2
10.2.1 Frequency ...................................................................................................................... 47
Annx 3: Similarity test .......................................................................................................... 57 10.3
Annex 4: Regression analysis ............................................................................................... 60 10.4
Annex 5: Correlation ............................................................................................................. 61 10.5
Annex 6: Schema .................................................................................................................. 62 10.6
Annex 7: Questionnaire ........................................................................................................ 63 10.7
Annex 8: KII Findings ............................................................................................................ 1 10.8
iv | P a g e
EXECUTIVE SUMMARY
Electronic banking, internet banking, mobile banking, SMS banking these are the buzzwords
of the global financial world. Bangladesh, the 60th
ranked (in terms of Nominal GDP figure,
World Bank 2012) low income democracy in the South Asia, is no stranger to these
phenomena. Mobile banking services in emerging economies like Bangladesh has the
potential to bring the unbanked potential under the banking sector. Mobile banking is
basically the provision of banking and financial services, such as cash-in, cash out, merchant
payment, utility payment, salary disbursement, foreign remittance, government allowance
disbursement, ATM money withdrawal through mobile technology devices. It is usually
operated through a collaboration of commercial banks and mobile service providers. Mobile
banking operations in Bangladesh started in 2011 and currently there are two major mobile
banking service providers in Bangladesh: Dutch Bangla Bank mobile banking and bKash, a
concern of BRAC Bank. Apart from them, 15 other banks are providing this service on a
small scale. At present the number of mobile banking customers in the country has exceeded
five million and 95% of the market share belongs to bKash (80% almost) and DBBL.
To detect the adoption pattern, consumers were grouped into 5 major categories in the
adoption process: Innovator, Early adopter, Early majority, Late majority and Laggards. The
scope of this research was Dhaka city only. Convenience issue apart, the diversified
population in the capital city accounts for 40% of the total urban population of the country.
To ensure a balanced reach in all areas of the city, the users are classified into three
categories according to the geographic location of their residents: Central Dhaka, Newly
developed areas and Outskirts. Although the primary target market for m-banking is rural
Bangladesh but they have a lower access to IT enabled services. Since the initial target
market is not absolutely ready, urban market-having greater technological accessibility rate
can be an effective niche to popularize m-banking. Moreover the m-banking service
providers have their strong customer base already (of other services like ATM, e-banking,
regular banking etc.) in urban areas which will work as a primary determinant behind
introduction of m-banking here. There is no elaborative research paper online as on this
arena. Thus the issues like urban scenario of mobile banking option, current market forces
etc. needed vital attentions as to bridge the research gap.
A survey questionnaire was designed addressing several factors in the process and quota
based sampling was done to derive responses from different areas of the city. At 95%
confidence interval sample size was determined 384 but budget and time constraints allowed
196 responses. That adjusts our confidence interval at 91.12% for a 10% precision level.
Majority of the respondents were male, 25-31 years old, Graduate/Postgraduate, central
Dhaka residents, private service holders, low mid to mid income non-adopters of mobile
banking.
The dominant adopter group is early adopter in urban m-banking market. Innovators or
current adopters cover1/4th
of the potential market share. This suggests that the market is still
in its premature stage in Bangladesh and response generation will take a long time.
Demographic factors do not seem to have much impact on the adoption process, but access to
v | P a g e
supporting technology and literacy level of these technologies tends to affect the adoption. In
general, adopters have a negative user experience with m-banking and they still perceive it to
be a low safety technology. Majority of the banked customers complained about the time
consumption of traditional banking mode and the adopters perceive m-banking to be low
time-consuming. This advantage apart, m-banking has not yet been able to extend its
potential contributions to the market. This might be due to lack of motivated efforts by the
banks in this regard. Bkash apart, no other bank considers this section as a strategic business
unit and seem to be introducing the service only as a response to Bangladesh bank‟s green
banking policy.
Targeted value proposition, increased promotion, channel improvement, strategic alliance
with telecommunication companies have been recommended based on the evidences
extracted from international and local market case studies. With the proper utilization of the
consumer market understanding, the Banks are expected to augment their services in m-
banking section and benefit all the stakeholders immensely.
1 INTRODUCTION
BACKGROUND 1.1
Technology is changing the way that consumers connect with banks and with each other
presenting new opportunities for the previously unbanked. The sector is hopping from one
technology to the next to widen its access in a cost-effective and green way. Electronic
banking, internet banking, mobile banking, SMS banking these are the buzzwords of the
global financial world. Bangladesh, the 60th
ranked (in terms of Nominal GDP figure, World
Bank 2012) low income democracy in the South Asia, is no stranger to these phenomena.
Bangladesh has 4 State Owned Commercial Banks, 30 Private commercial banks, 4
specialized banks, 9 Foreign Commercial Banks and 4 non-scheduled banks 1under the
authority of its central bank, Bangladesh Bank, for serving the financial purposes of its
current population of 150,493,658( World bank, 2011). These 47 banks operate in 7772
branches spread countrywide. The banking sector has been experiencing rapid changes
because of numerous digitalization oriented initiatives encouraged by the govt. All banks
now are computerized at least at head office level. If we go at branch level only; 19%
branches of NCBs, 38% branches of PCBs and97 % branches of FCBs are computerized. An
ITRC survey found that overall computer density in the banking sector is 1.64. Majority of
banks is planning to introduce ICT for integration of banking services and new ICT based
banking services.
Foreign commercial banks are playing the pioneer role in introducing modern financial
products and services. Private Commercial Banks have started to follow the same pattern. On
the other hand Nationalized Commercial Banks and the Specialized Banks (SBs) could not
yet show notable performance regarding the issues. But due to the demands of the time, they
are now taking initiatives to launch modern and innovative products and services. Currently
most of the banks in Bangladesh are providing electronic products and services to their
Customers‟ .We cannot say they are completely following electronic way.
While banking sector is getting all electronic and carbon-free2, the penetration rate of
telecommunication has increased exponentially. In between 2003-2008, the number of mobile
subscribers increased by 97.8% in the region (UNESCAP Statistics Division, 2011). 60% of
the total population now has access to mobile phones. This one device has shaped the
economic and social condition of the country and its population by adding various layers to
its services. Communication, business, social cohesion etc. are some of the opportunities this
sector and its services have facilitated over the years. The total impact of mobile
1 Non- scheduled banks are those banks which are not registered under schedule of RBI act, 19
2 According to the carbon-finance unit of world bank, the general term is applied to investments in GHG
emission reduction projects.
1
communications on Gross Domestic Product (GDP) has been, and continues to be, substantial
and it accounted for 2.1% of GDP in 2004 that increased up to 6.2%of GDP in 2007.
Rapid growth of mobile phone users and wider range of the coverage of Mobile Network
Operators (MNOs) have made their delivery channel an important tool‐of‐the‐trade for
extending banking services to the unbanked/banked population. To avail of this opportunity,
the banking sector has, under its umbrella of electronic-banking, introduced a new dimension
of services; mobile banking. The country now has 17 banks providing the mobile-banking
facilities both for the banked and unbanked population for ease of transaction and financial
inclusion.
ISSUES 1.2
Although millions of dollars have been spent on building mobile banking systems, reports on
mobile banking show that potential users may not be using the systems, despite their
availability. This is a recurring issue particularly for the low income, developing countries.
Beneath its shiny features, mobile banking is plagued with trust and security concern. The
half or uneducated Bangladeshis , even today, use mobile mainly as a communication tool
and are not very aware and/or interested in its value added services3. The urban population
has better access to amenities that facilitate adoption of latest technologies. However, if we
consider the standard of the amenities available in Bangladesh, we will not find anything
encouraging. But the country, like any other country cannot avoid the changes that are
turning the world upside down. As Bangladesh is slowly entering the field of advanced
banking technologies with its limited resources, it is becoming more important to actually
investigate and evaluate the real opportunities the sector and its services have given its still
developing population. Also, the fact that, only 36.17% (17 among 47) of the Banks have
invested in this technology, makes it clearer that thorough analysis of the potential consumer
market is essential to eradicate the uncertainties ( whether they will adopt or refuse) involved
for further investments.
RESEARCH QUESTION 1.3
The questions that stem from the context set above are:
Is the already facilitated urban Bangladesh ready to adopt (and thus become
customers from potential consumers) the advanced mobile banking technology?
3 According to a survey conducted by BIDS in 2009 on awareness of ICT in rural Bangladesh, 68% of the
respondents, most of which are women, do have own mobile phone. All of them use mobile phone mainly for communicating with friends and family members, the other uses include listening songs, watching videos, capturing picture, etc. Majority of the respondents are neither aware of nor use other mobile phone value-added services, such as money transfer, mobile banking, bill pay, internet browsing, medical and agriculture services etc.
2
What is the nature of the usage pattern for existing customers of mobile banking?
What are the current trends in the sector in terms of growth and competition?
OBJECTIVES 1.4
1.4.1 BROAD OBJECTIVE
To find out the adoption pattern of m-banking in Urban Bangladesh and analyze its current
trend in the growing banking sector.
1.4.2 SPECIFIC OBJECTIVES
To identify the relationship between consumer adoption of m-banking and user
characteristics.
To analyze the perception of m-banking adopters regarding the technology.
To provide a holistic view on the industry trends.
HYPOTHESES 1.5
1. There is no relationship between age and consumer‟s adoption of m-banking.
2. There is no relationship between income and consumer‟s adoption of m-banking
3. There is no relationship between gender and consumer‟s adoption of m-banking.
4. There is no relationship between occupation and consumer‟s adoption of m-banking.
5. There is no relationship between educational qualification and consumer‟s adoption of
m-banking
6. There is no relationship between residence and consumer‟s adoption of mobile
banking.
7. There is no relationship between level of literacy about mobile functions in learning
m-banking and consumer‟s adoption of m-banking.
8. There is no relationship between the amount of money transacted and usage of m-
banking
9. Consumer‟s adoption of m-banking is not influenced by the views of social
networking websites.
10. Consumer‟s adoption of mobile banking is not influenced by the decision of family
members and peers.
11. Frequency of computer usage in personal life does not affect consumer adoption m-
banking.
12. Frequency of computer usage in professional life does not affect consumer adoption
of m-banking.
13. Frequency of internet usage in personal life does not affect consumer‟s adoption of m-
banking.
3
14. Frequency of internet usage in professional life does not affect consumer‟s adoption
of m-banking.
15. Mobile banking users do not perceive the use of mobile banking to be time
consuming.
16. Mobile banking users do not perceive the learning process of mobile banking to be
complex.
17. Mobile banking users do not perceive the use of mobile banking to be risky.
18. Mobile banking users do not perceive the use of mobile banking to be costly
19. Mobile banking users do not perceive the use of mobile banking to be inconvenient.
20. Mobile banking users do not perceive the use of mobile banking to be difficult
21. Usage of mobile banking remains same during the time of political turmoil.
22. Usage of mobile banking remains same during the time of natural disaster
23. Usage of mobile banking remains same during the time of share market crisis.
24. Majority of people does not follow offline/direct cash transaction as their dominant
form of payment
RATIONALE 1.6
Mobile banking has been introduced in Bangladesh targeting rural people exclusively, with a
view to providing financial services to the unbanked communities efficiently and at an
affordable cost. However these rural communities are yet dependent on NGO loans and
Micro Finance Institutions. Since the initial target market is not absolutely ready, urban
market-having greater technological accessibility rate can be an effective niche to popularize
m-banking. Moreover the m-banking service providers have their strong customer base
already (of other services like ATM, e-banking, regular banking etc.) in urban areas which
will work as a primary determinant behind introduction of m-banking here. Hence, the
initiation of this research took place. Urban people usually have a very busy schedule which
does not allow them to waste time via traditional banking procedures. Added to that many of
their demographic segments are early innovators of any new technological advancement
introduced. On the other hand, unlike rural villagers the amount of money transected is much
higher by urban customers, so need for secured money transfer and mitigation of perceived
risk etc. are vital to adoption of mobile banking here. In a nutshell, mobile banking in Urban
Bangladesh is going to be a potential inclusion. But there is no elaborative research paper
online as on this arena. Thus the issues like urban scenario of mobile banking option, current
market forces and future prospect etc. need vital attentions as to bridge the research gap.
SCOPE 1.7
The research has been conducted on the mobile users of Dhaka city. Convenience issue apart,
the diversified population in the capital city accounts for 40% of the total urban population of
4
the country. To ensure a balanced reach in all areas of the city, the users are classified into
three categories according to the geographic location of their residents.
1. Central Dhaka (Gulshan, Banani, Dhanmondi, Mohammadpur etc.)
2. Recently developed areas (Uttara sector 11, JoarShaharaetc.)
3. Outskirts (Keraniganj, Luter Char etc.)
LIMITATIONS 1.8
Though, the area of the research is extensive, there are some constraints which have limited
the scope of the research:
Time constraint is the key limitation in this research.
This is accompanied by financial constraints which will limit the scope of the
research.
The absence of sufficient secondary data in this field resulted in the reliance of
primary data for drawing suitable conclusions.
The consistent objectivity of the parameters is dependent on individual respondents‟
perceptions.
Some of the respondents were not interested towards the filling of the questionnaire
resulting in biased opinion which has affected the outcome.
CONTRIBUTION OF THE RESEARCH 1.9
All the key stakeholders with regard to m-banking service provision will be benefitted by this
report. Given our report has explored multiple dimension of m-banking adoption practices
and its most recent market dynamics, it will factor into constructive contribution for the
concerned stakeholders mentioned below:
1. Bangladesh Bank: Since Mobile banking works as the most effective tool as to
propel the financial inclusion of the unbanked population of the country, BB has
always put a special focus on it. It has been developing Policy report on m-banking
from 2010, published annually- where growth prospect and risk scenario of m-
banking is discussed under the paradigm of only Key informant interviews with m-
banking service providers and Mobile network operators. Since our report has covered
an analysis (with primary data collected from field level consumer survey) on the
adoption pattern of current m-banking subscribers, BB will definitely be helped by
this.
2. M-bankers: Though 26 banks have been provided with the license as to carry on m-
banking, only 17 have adopted the alternative financial service delivery line. Again,
out of these 17 banks only two have 95% market share though almost all of them have
started simultaneously, first mover advantage did not come into play in this sector.

5
Moreover, except the two leading m-bankers (i.e. Bkash and DBBL) other banks have
not been making any substantial growth in their customer base though the market is
growing in every month, 12-15% growth in every month of 2013. Hence we can say
that most of the market players of m-banking service have failed to understand the
market dynamics, customers‟ adoption practices and urban trend in subscribing to m-
banking. Our report will most definitely help them tap the urban market with better
understanding of the market behavior.
3. MNO: Mobile network Operators play a vital role behind m-banking. Right now we
have 6 mobile network operators in the country (Robi,GP, Banglalink, Airtel ,
Citycell and Teletalk). Till now they have been working as partners of m-bankers as
to provide the network platform of the service. Now that government has introduced
payment gateway system4, all these MNOs might start their own m-banking systems
whereby no external partnership will be needed. If that comes into being, these MNOs
can analyze the urban market scenario with particular focus to the consumers‟
technology diffusion process.
2 LITERATURE REVIEW
For the past two decades, the banking sector has chosen several new service channels based
on the progress of information technology to respond to the changes in customer preferences
and needs. E-baking, m-banking, Automated Teller Machines etc. are few of these new
dimensions attached to banking sector jargons off late. Owing to Increasing competition
from non-banks and changes in demographic and social trends (Lederer, 2001); banks have
acknowledged the value to differentiate themselves from other financial institutions through
these avenues of new service distribution channels (Daniel, 1999) which is often termed as
virtual Banking. For example, E-banking has been continuously growing as a new industry
during the last decade, and now all banking transactions can be completed through internet
applications (Smith, 2008). With the success of e-banking technologies, m-banking ideas
have started taking pace in recent years, and the availability of a wider network of service
delivery has led to increasing adoption among consumers. M-banking, hence, is the most
innovative and user friendly addition to the list of convenient banking.(Servon, 2008)
Mobile Banking is a financial transaction conducted by logging on to a bank's website using a
cell phone, such as viewing account balances, making transfers between accounts, or paying
bills. This can be conducted through the internet browser on the phone, through a program
downloaded from the bank, or by text-message (SMS) (Karim, 2008). Mobile banking is an
application of m-commerce which enables customers to access bank accounts through mobile
devices to conduct and complete bank-related transactions such as balancing cheques,
checking account statuses, transferring money and selling stocks (hoan, 2010)defined mobile
banking as an innovative method for accessing banking services via a channel whereby the 4 The service that automates the payment transaction between the shopper and merchant. It is usually a third-
party service that is actually a system of computer processes that process, verify, and accept or decline credit card transactions on behalf of the merchant through secure Internet connections ( Bangladesh Bank, 2013)
6
customer interacts with a bank using a mobile device. Across the developing countries,
millions of people rely on informal economic activity and local level networks to earn their
living. Most of these populations are from bottom of pyramid and they don‟t have access to
basic financial services/banks as access to them is costly and very limited. However, the
outstanding growth of mobile sector worldwide has created a unique opportunity to provide
social and financial services over the mobile network to those grass root level people. With
over 4 billion mobile cellular subscriptions worldwide, mobile network has the ability to
immediately offer mobile banking to 61% of the world population (Sultana, 2009).
In Bangladesh, Mobile banking has been introduced by Dutch Bangla Bank Limited in 2011.
With the combination of two most recent technological advancements – internet and mobile
phone, mobile banking (mobile data service) was enabled and now such wireless internet
based commercial transaction is being performed by several banks here, bringing about a
paradigm shift in technology acceptance of even bottom of the pyramid population.
Following several years of deliberations and ad hoc permissions on Mobile Financial
Services, the Department of Currency Management and Payment Systems of Banglades
h Bank issued “Guidelines on Mobile Financial Services (MFS) for the Banks” on 22 Sept
ember 2011 which were subsequently amended on 20 December 2011. These guidelines
state that only a bank‐led model will be permitted. For Bangladesh Bank this means
that a customer‟s account, termed "Mobile Account", will rest with the bank and will
be accessible through the customer‟s mobile device. This mobile account will be a non‐
chequing account classified separately from a standard banking account.
It is believed that m-banking will provide another new channel for banking services,
especially in Bangladesh; because here more than 60% people own mobile phones but only
13% people have a bank account. (Ahmad, Laukkanen and Lauronen, 2005). In a
survey(stratified, SS-200) done in 2008 across the capital city Dhaka , showed that only
45.6% people of age between 20 to 35 years are currently using mobile service (Smith, 2008).
Hence Strategic implications and customer perception of m-banking services needs to be
explored with a focus on the consumer value creation and a better understanding about the
customer-perceived value of m-banking services.
Some demographic variables have interrelations which might have influence on the adoption
of mobile banking. As Lee (2009) stated that the cognitive propensity of individuals to risk-
differs across culture. This means that the customers‟ acceptance of mobile banking may be
influenced by cultural differences. For instance, mobile internet service has been quite
popular in Japan (over 60 million users in 2003) especially for those young and single (i.e.,
unmarried) consumers (Scornavacca and Barnes, 2004) But In many technologically
developed countries like Norway, m-banking is yet to be popularized. Although millions of
dollars have been spent on building mobile banking systems, reports on mobile banking show
that potential users may not be using the systems, despite their availability. Mobile banking
adoption has become such inconsistent because many people argue that internet and other
technology based transaction is not safe, not practical and would lead to fraud. On the other
hand a lot of people think it safer, flexible in time and can be done anywhere and anytime
(Chowdhury&Ahmmad 2011). Mattila (2010) in his research found that most of mobile
7
banking users have average age ranges from 23 years to 34 years. Similarly, Cheah et.al
(2011) found the age range of most of the mobile banking users is 20-25. In earlier studies in
this regard have provided interesting observations like , Wu and Wang (2005), in a study on
middle class populations, found that cost had minimal significant impact on the adoption of
mobile banking while perceived risk, compatibility and perceived usefulness have significant
influences. On the other hand Karnani (2009) argues that cost plays important role in
choosing mobile banking. Rotchanakitumanuai and Speece (2003) investigated why
corporate customers do not accept mobile banking, which can assist banks to implement this
self-service technology more efficiently. Many Thai banks are currently implementing
mobile banking. Banks that offer service via this channel claim that it reduces costs and
makes them more competitive (Servon, 2008). However, many corporate customers are not
highly enthusiastic about mobile banking. The interviews with Thai firms suggested that
security of the Internet is a major factor inhibiting wider adoption. Those already using
Internet banking seem to have more confidence that the system is reliable, whereas non-users
are much more service conscious, and do not trust financial transactions made via Internet
channels.
In line with the analysis above we can conclude that Bangladesh has high potential in terms
popularizing m-banking as the main stream banking process. Given the need to continue
to advance financial inclusion we can say that fully developed Mobile Financial Service
operations can reduce barriers of physical access and cost and over time enable a much
higher proportion of the population to use basic formal sector deposit and payment services.
Access into the formal system might eventually lead to product innovations in
insurance, credit, pensions and government payments that reach many millions of
Bangladeshis. Entry to the formal financial sector can lead to greater financial intermediation
and contribute to growth. But the adoption status of Mobile banking technology will depend
on Factors such as perceived usefulness (PU), perceived ease of use (PEOU), relative
advantages (RA) and personal innovativeness (PI) (Cheah et.al 2011) of the local
demography.
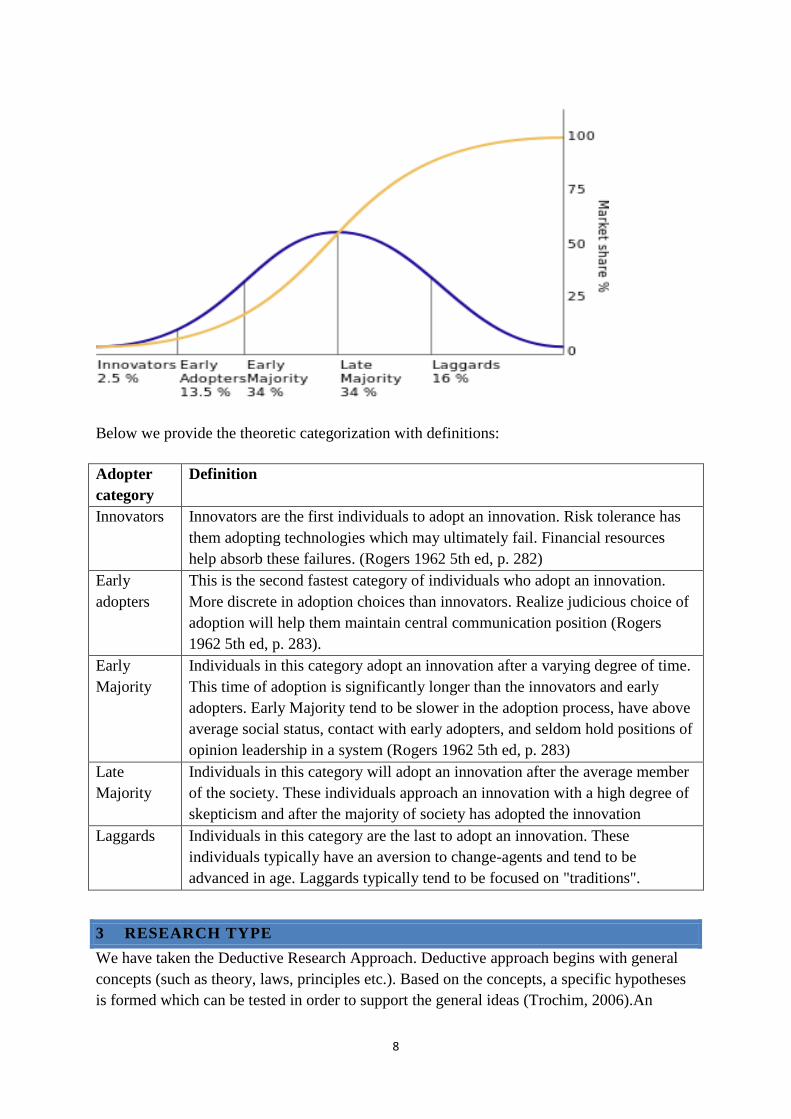
ADOPTION PROCESS: DIFFUSION OF 2.1
INNOVATION THEORY
In the book Diffusion of Innovations, Rogers suggests a total of five categories of adopters in
order to standardize the usage of adopter categories in diffusion research. The adoption of an
innovation follows an S curve when plotted over a length of time:
8
Below we provide the theoretic categorization with definitions:
Adopter
category
Definition
Innovators Innovators are the first individuals to adopt an innovation. Risk tolerance has
them adopting technologies which may ultimately fail. Financial resources
help absorb these failures. (Rogers 1962 5th ed, p. 282)
Early
adopters
This is the second fastest category of individuals who adopt an innovation.
More discrete in adoption choices than innovators. Realize judicious choice of
adoption will help them maintain central communication position (Rogers
1962 5th ed, p. 283).
Early
Majority
Individuals in this category adopt an innovation after a varying degree of time.
This time of adoption is significantly longer than the innovators and early
adopters. Early Majority tend to be slower in the adoption process, have above
average social status, contact with early adopters, and seldom hold positions of
opinion leadership in a system (Rogers 1962 5th ed, p. 283)
Late
Majority
Individuals in this category will adopt an innovation after the average member
of the society. These individuals approach an innovation with a high degree of
skepticism and after the majority of society has adopted the innovation
Laggards Individuals in this category are the last to adopt an innovation. These
individuals typically have an aversion to change-agents and tend to be
advanced in age. Laggards typically tend to be focused on "traditions".
3 RESEARCH TYPE
We have taken the Deductive Research Approach. Deductive approach begins with general
concepts (such as theory, laws, principles etc.). Based on the concepts, a specific hypotheses
is formed which can be tested in order to support the general ideas (Trochim, 2006).An
9
Inductive reasoning works the other way around, it works from observation (or observations)
toward generalizations and theories. Inductive can be seen as a theory developing through
interpreting collected data (Elo & Kyngas, 2008). We started off with the literature review
and formed hypotheses based on the current trends of mobile banking adoption in
Bangladesh. The existing research works explaining the demographic and social
characteristics of the mobile banking users were also taken into account from literature
review. Based on these we formed our research objectives and methodology
4 RESEARCH METHOD:
SAMPLE SIZE DETERMINATION 4.1
Formula:
Sample size: n = NZ2pq/ (NE
2 + Z
2pq)
Where, N= population size
Z = confidence level (ex. 95% confidence = 1.96),
E = range of possible random error
p = estimated proportion of success
q = 1 – p, or estimated proportion of failure
Population:
Number of urban mobile users= 22,226,408
The sample size will be determined at a confidence level of 95% (z-value=1.96). The desired
precision is ±5%. The value of p and q is determined as 0.5 as the population is thought of
being un-biased, resulting in equal chances of having positive and negative responses during
survey.
Hence,
n = NZ2pq/
(NE2 + Z
2pq)
=( 22,226,408 x 1.962 x 0.5 x 0.5)/
(22,226,408 x 0.052) + (1.96
2 x 0.5 x 0.5)
= 384
BD population:150,493,658
Urban population: 27% of total
population
Urban mobile penetration rate: 54.7%
of urban population
10
However, due to budget and time constraint, our survey was limited to 196 responses. That
adjusts our confidence interval at 91.12% for a 10% precision level.
QUESTIONNAIRE DEVELOPMENT 4.2
4.2.1 QUESTIONNAIRE DESIGN
Individual Questionnaire: Based on our cognitive understanding of the research topic
through secondary research and group study, we developed the questionnaire. Since our
survey respondents were to comprise urban population as majority, who usually maintain a
busy schedule; h/she would not get enough time to answer any descriptive question. We put
short multiple choice questions with ratings inscribed to most so that instead of random
answering, the respondents have to think and rate in a synchronized manner. Personal
questions like „household income‟ or „name of the bank respondent is having an account at‟
were put later in the questionnaire to ensure that it‟s not too early to have the real answer
before we establish a rapport with the test participant/respondent.
We have used a co-ordination schema of 2 parameters and 6 complex variables. The complex
variables were further expanded into 23 simple variables. The questions were formed in
accordance with the variables. Both likert scale and semantial scale format along with
multiple choice questions were designed in the questionnaire. The respondents were asked to
rate each of the variables relevant to the features of mobile banking on a scale of 1 – 5. The
questions were formed in a way so that a score of 1 on each of the questions denoted the
lowest value whereas a score of 5 denoted the highest. Both the co-ordination schema and
the questionnaire have been included in the appendix section.
KII Questionnaire: A short semi structured questionnaire was prepared for conducting Key
Informant interviews in Bkash and Dutch Bangla Bank Limited. Sensitive questions for the
company management were avoided. The questions specifically addressed the following
aspects to get a holistic scenario of the present scenario of mobile banking adoption in Urban
Bangladesh:
1. Characterization of mobile banking adoption in both rural (initial target) and urban
region at present.
2. Factors contributing to the growth of mobile banking usage in the urban regions.
3. Strengths and weaknesses towards the growth of mobile banking adoption in the
urban market.
4. Prospects of mobile banking in Urban Bangladesh in the coming years.
4.2.2 QUESTIONNAIRE VALIDITY
11
We have chosen face validity method to measure the validity of the variables for the research.
Face Validity implies that the items chosen to measure a variable are logically related to it.
From the literature reviews, we have logically chosen six complex variables to measure the
present mobile banking adoption scenario. The variables are demographic factors, access to
supporting technology, decision sources, impacts of social and natural events, innovation
characteristics and bridge of familiarity. All these variables are logically related to measure
consumer adoption of mobile banking. The service is considered to be effective if the
customers think it fulfills all their banking needs, it is secure, social environment supports the
use of mobile banking and the innovation characteristics are simple and convenient.
Under the 6 complex variables there are 23 simple variables to measure the consumer
adoption of mobile banking. Each of the questions designed are directly and logically related
to the objectives of our research. For example- to measure the influence of social norms on
his/her decision of mobile banking adoption we asked How much do you rely on family
members and peers when adopting new technologies? To measure the influence of
communication channels specifically the socialmedia we asked Influence of social
networking websites on you-and the respondents rated the statement on a scale of 1-5. All the
items chosen to ask the respondents are logically related to the simple variables, their
corresponding complex variable and lead to measure the mobile banking adoption scenario
among the urban consumers at present.
4.2.3 QUESTIONNAIRE RELIABILITY
If a measure, when applied repeatedly to the same object under constant conditions, produces
the same result each time, it is called reliable. There are few techniques to measure reliability.
Reliability test
The reliability of data was verified using both Alpha and Split Half Technique. The data was
found to be:
Reliability Statistics
Cronbach's Alpha N of Items
.701 25
A Cronbach‟s Alpha of 0.70 and above is considered to be reliable. Our Cronbach‟s Alpha
based on standardized items is 0.701, indicating the reliability of data.
DATA COLLECTION 4.3
4.3.1 PRIMARY DATACOLLECTION
Individual Survey: We have conducted 196 field individual surveys as to collect the
data. Urban development pattern has occurred in different parts of the city following
varied direction. From a broader spectrum we have divided the capital city with
12
regards to development trend, into 3 primary categories: 1. Central Dhaka 2. Out
Skirts 3.Recently Developed Areas. Depending on the development scenario (Road,
Infrastructure development, Socio economic change in the last decade etc.) adoption
of anything new will not be homogeneous in these areas. We used to quota sampling
to assign a fixed number of surveys for each of these locations thus ensuring
participation from among all the varied regions of the urban environment. Our survey
conduction was designed like this:
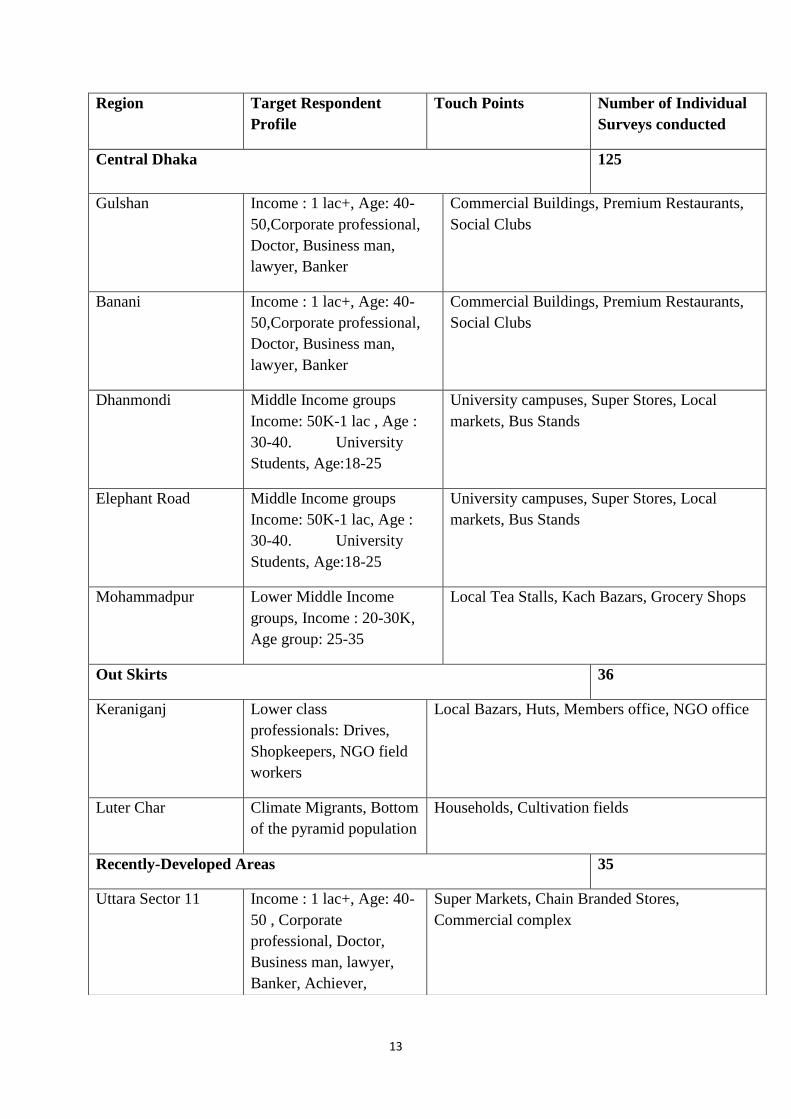
13
Region Target Respondent
Profile
Touch Points Number of Individual
Surveys conducted
Central Dhaka 125
Gulshan Income : 1 lac+, Age: 40-
50,Corporate professional,
Doctor, Business man,
lawyer, Banker
Commercial Buildings, Premium Restaurants,
Social Clubs
Banani Income : 1 lac+, Age: 40-
50,Corporate professional,
Doctor, Business man,
lawyer, Banker
Commercial Buildings, Premium Restaurants,
Social Clubs
Dhanmondi Middle Income groups
Income: 50K-1 lac , Age :
30-40. University
Students, Age:18-25
University campuses, Super Stores, Local
markets, Bus Stands
Elephant Road Middle Income groups
Income: 50K-1 lac, Age :
30-40. University
Students, Age:18-25
University campuses, Super Stores, Local
markets, Bus Stands
Mohammadpur Lower Middle Income
groups, Income : 20-30K,
Age group: 25-35
Local Tea Stalls, Kach Bazars, Grocery Shops
Out Skirts 36
Keraniganj Lower class
professionals: Drives,
Shopkeepers, NGO field
workers
Local Bazars, Huts, Members office, NGO office
Luter Char Climate Migrants, Bottom
of the pyramid population
Households, Cultivation fields
Recently-Developed Areas 35
Uttara Sector 11 Income : 1 lac+, Age: 40-
50 , Corporate
professional, Doctor,
Business man, lawyer,
Banker, Achiever,
Super Markets, Chain Branded Stores,
Commercial complex
14
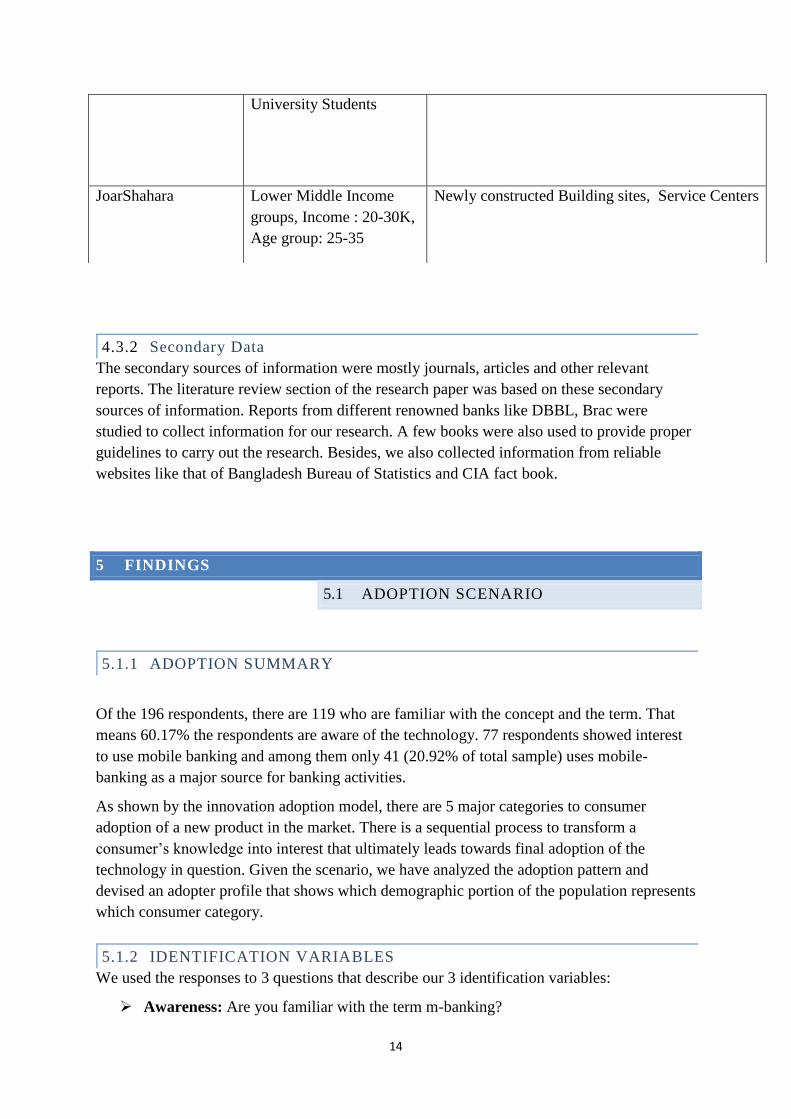
4.3.2 Secondary Data
The secondary sources of information were mostly journals, articles and other relevant
reports. The literature review section of the research paper was based on these secondary
sources of information. Reports from different renowned banks like DBBL, Brac were
studied to collect information for our research. A few books were also used to provide proper
guidelines to carry out the research. Besides, we also collected information from reliable
websites like that of Bangladesh Bureau of Statistics and CIA fact book.
5 FINDINGS
ADOPTION SCENARIO 5.1
5.1.1 ADOPTION SUMMARY
Of the 196 respondents, there are 119 who are familiar with the concept and the term. That
means 60.17% the respondents are aware of the technology. 77 respondents showed interest
to use mobile banking and among them only 41 (20.92% of total sample) uses mobile-
banking as a major source for banking activities.
As shown by the innovation adoption model, there are 5 major categories to consumer
adoption of a new product in the market. There is a sequential process to transform a
consumer‟s knowledge into interest that ultimately leads towards final adoption of the
technology in question. Given the scenario, we have analyzed the adoption pattern and
devised an adopter profile that shows which demographic portion of the population represents
which consumer category.
5.1.2 IDENTIFICATION VARIABLES
We used the responses to 3 questions that describe our 3 identification variables:
Awareness: Are you familiar with the term m-banking?
University Students
JoarShahara Lower Middle Income
groups, Income : 20-30K,
Age group: 25-35
Newly constructed Building sites, Service Centers
15
Interest: Would be interested in m-banking?
Adoption: Do you use m-banking as a major source for your banking activities?
5.1.3 INTERPRETATION
As the definitions suggest:
We label a consumer as an innovator if he/she has responded positively to all 3
components.
We label a consumer as an early adopter if he/she has awareness and interest but has
not adopted the technology yet. We also label the consumers early adopters who has
adopted but show a negative interest for their risk-aversion nature.
A consumer is labeled as early majority if despite the lack of awareness, shows a
quick response to awareness and is interested to use the technology in the future.
A late majority member has awareness, still has no interest, which is indicator to slow
response to adoption process.
A laggard has neither of the components and is the last group in the society to accept
a new trend.
5.1.4 FREQUENCIES
Category Frequency Percentage
Innovator 48 25.53%
Early adopter 71 37.7659%
Early majority 33 17.55%
Late majority 12 6.383%
Laggards 24 12.76%
We see that early adopters are dominant group in urban Bangladesh. And only 1/4th
of the
market has so far been penetrated by the m-banking providers. This shows the slow market
response towards the initiatives taken by the banks.
5.1.5 ADOPTER PROFILE
Adoption stage Profile
Innovator 25-38 age group, male, living in central Dhaka, Graduate and/or Postgraduate, higher
functionality with mobile, mid-income and with moderate transaction needs.
Early adopter Early adopters are dominant group in Urban Bangladesh. 18-31 age group, male, Central
Dhaka resident, Postgraduate, basic functionality of mobile, low mid to mid income
group, with low to moderate transaction needs.
Early majority 25-31 age bracket, male, Central Dhaka resident, Postgraduate, below 15000BDT
income, basic mobile functionality and with moderately higher transaction need.
Late majority Can be within any age group( no significant pattern for age is observed), male, central
Dhaka resident, mid-income, higher mobile functionality , Graduate, mid to higher
16
income group.
Laggard 39 to 45 years old, male, outskirts resident, Undergraduate , low income, low transaction
need and with very basic mobile functionality.
SAMPLE STATISTICS 5.2
5.2.1 SAMPLE DEMOGRAPHY
1. Age
The lowest age group is 18 to 24, that includes 17.6% of the respondents. The analysis shows
that dominant age group here is 25 to 31 (27.3% of the respondents) while only 9.1%
respondents are from 53 and higher age group.
Age distribution of adopters and non-adopters:
Clearly the non-adopters outnumber the adopters of m-banking in all age groups. 36.6% of
the adopters are in 25-31 age group, while similarity in frequency is shown by 32-38 and 39-
45 age group.
2. Gender:
69.4% of the total 196 respondents are male, whereas about 29.6% of the respondents are
female. There were also two missing values contributing to the remaining 1 percent of the
respondents.
Gender distribution of adopters and non-adopters:
Male are the dominant m-banking adopters. Among the 41 respondents who are adopters,
around 68.3% are male and around 31.7 % are female.
3. Occupation
Majority of our respondents were Private Service Holder which is about 21.4% of the total
respondents. The least number of respondents were housewives which comprises about 6.6%
of the total respondents. Teacher respondents were roughly around 15.8% whereas student
respondents were close around 14.3%
It can be clearly seen from the statistics above that among the 41 respondents who are the
adopters of mobile banking, about 36.6 % of the respondents are Private Service Holder and
the closest occupational group who are adopters are teachers who holds a handsome 24.4% of
17
the total respondents. The rest 39% of the adopters comprise of the remaining interviewed job
holder types such as Students (7.3%), Businessman (7.3%) and housewives being the least
with only 2.4% of the adopters.
Among the 141 respondents who were non-adopters, about 18.4% of the respondents were
private service holders, and the closest non-adopters‟ occupational group to the private
service holders are students who constitute about 17% of the total non-adopter group.
4. Residence:
61.2% of the total respondents are from central Dhaka. Among the 125 central Dhaka
residents, we find 21 as adopters, which is 16.8% of this segment. If we look into the 35
residents from newly developed regions in Dhaka, we can see that 20% of these respondents
are adopters and the adoption rate is slightly higher in outskirts (22.22% of the outskirts
residents).
5. Education:
The adopters outnumber the non-adopter in most of the educational level. Undergraduates are
mostly non adopters with 26.6%. Among the adopters, postgraduates dominate the list with
39.5% followed by graduates, undergraduates and HSC degree holders.
6. Income:
There is no clear distinction as to who dominates the lists in case of income earned. The
income range 15k-50k encomprises majority of the adopters and non-adopters with 45.7%
and 41.3% respectively. They are followed by the income range less than 15K with 31.4% for
the adopters and 34.9% for the non-adopters. Income range 50-100k follows suit with
respondents having an income of 100000 and above are both the lowest number of adopters
and non-adopters.
7. Transaction amount:
The adopters outnumber the non-adopter in most of the transaction level. People transacting
money in the range less than 5k are mainly adopters with 27%. The non-adopters in this
range make up 25% of the respondents. The range 5K-15K dominates among both adopters
and non-adopters with 32.4% and 26.7% respectively. The range 30-0 K and above 50K is
dominated by the non-adopters with 13.8% and 12.9% respectively. This shows that mainly
people with low to moderate transaction need adopt mobile-banking for their banking
activities.
5.2.2 ACCESS TO SUPPORTING TECHNOLOGY
18
1. Access to computer
a) Frequency of computer usage in professional life:
Among the 141 non-adopters, there is also a very high percentage (about 26.2%) of people
use computer in their professional lives and about 27% use very frequently. But it can also be
mentioned that among the non-adopters, about 20.6% of them cannot use computer in their
professional lives.
b) Frequency of computer usage in personal life:
Among the 196 respondents, about 22.4% respondents cannot use computer in their personal
lives whereas a high percentage of respondents (about 23%) use computer in their personal
lives frequently and about 25.5% use computer in their personal lives very frequently.
Among the 41 adopter respondents, around 31.7% respondents use computer frequently in
their personal lives and about 17.1% respondents use computer very frequently in their
personal lives. Only 14.6% of the respondents cannot use computer in their personal lives.
Among the 141 non-adopters, although about 22.7% of the respondents use computer in their
personal lives frequently and about 29.1% people very frequently, about 23.7% of the
respondents cannot use computer in their personal lives.
2. Access to internet
a) Frequency of internet usage in professional life:
Among the 196 respondents, about 23% respondents cannot use computer in their
professional lives whereas a high percentage of respondents (about 21.9%) use internet in
their professional lives frequently and about 24% use computer in their professional lives
very frequently.
Among the 41 adopters, around 26.8% respondents use internet frequently and 26.8% use
very frequently in their professional lives. A low percentage ( about 14.6%) of adopters
cannot use internet in their professional life.
b) Frequency of internet usage in personal life:
Among the 196 respondents, about 26.5% of the respondents replied that they cannot use
internet in their personal life. There is also a very high percentage of respondents, about
29.1% who use internet very frequently in their personal lives.
19
Among 41 adopter respondents, around 22% respondents use internet very frequently in their
personal lives and about 36.6% use internet frequently. There are also 19.5% adopter
respondents who cannot use internet in their personal lives.
Among the 141 non-adopters, although about 31.9% of the respondents use internet very
frequently in their personal lives, there are also 27.7% respondents who cannot use internet in
their personal lives.
3. Ability to use mobile functions
Among the 196 respondents, although about 35.7% of the respondents replied that they can
only make phone calls through their mobile device, a high 30.4% replied that they can use all
the functionalities of a mobile device.
From the 41 respondents who are adopters, about 73.3 % replied that they can use all the
functionalities of mobile phone whereas about 20% replied that they can use all the basics of
mobile devices.
Among the received responses of non-adopters, about 40% of them can only use phone calls
through their phone device and a merely 24.4% only can use all the functions of a mobile
phone.
5.2.3 DECISION SOURCES
1. Influence of social network
Among the 196 respondents, about 29.6% replied that they were not at all influenced by
social networks, whereas only 8.2% of the respondents replied that they are highly influenced
by social networks.
Among the 41 adopters of mobile banking, a low 9.8% replied that they are highly influenced
by mobile banking and a very high figure of 31.4% respondents replied that they are not
influenced by social networking sites.
From the 141 non-adopter responses, 30.5% of them are not at all influenced by social
networking sites whereas only a mere 8.5% are highly influenced by social networking sites
2. Influence of family and peer in decision making
Among the 196 respondents, around 30.1% replied that they are moderately influenced by
family and peer in decision making and about 18.4% who are highly influenced by family
and peers.
20
Among the 41 adopters, around 31.7 replied that they are indifferent to the influence of
family and peer in decision making and only a mere percentage of 12.2% replied that they are
not at all influenced by family and peers.
Among the 141 non-adopters, around 34.8% replied that they are moderately influenced by
peer and family in decision making and only 17.7% replied that they are highly influenced by
family and peers.
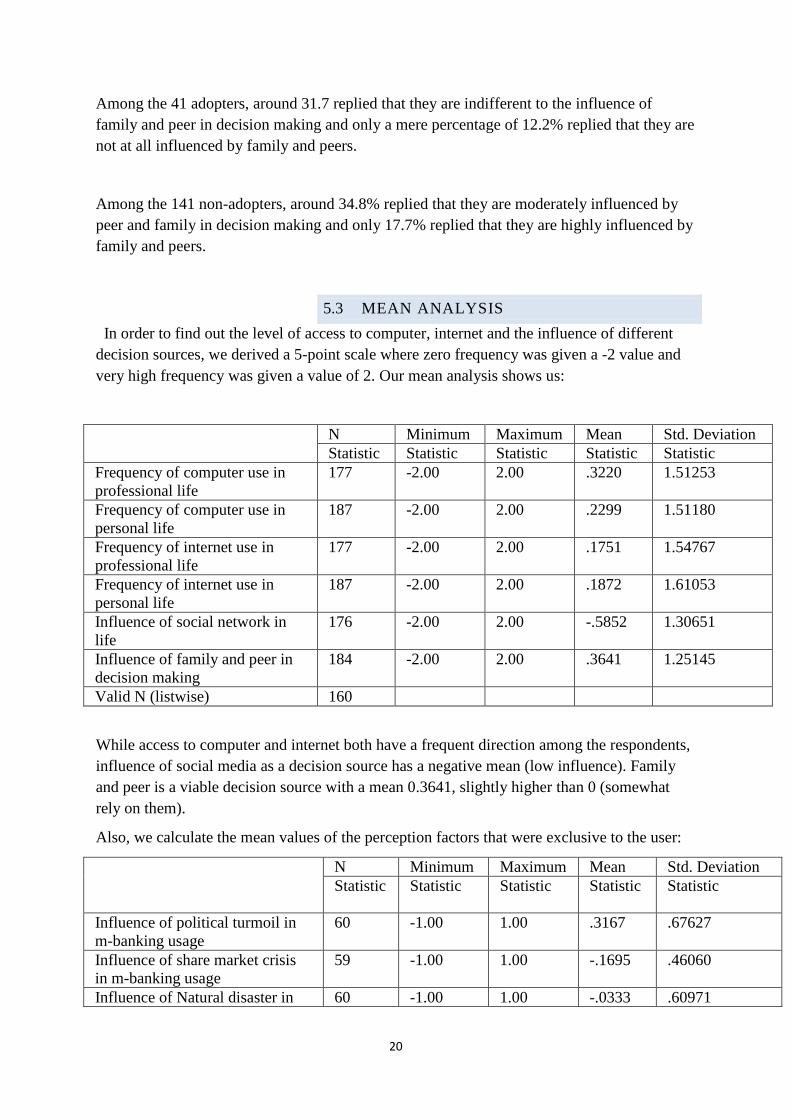
MEAN ANALYSIS 5.3
In order to find out the level of access to computer, internet and the influence of different
decision sources, we derived a 5-point scale where zero frequency was given a -2 value and
very high frequency was given a value of 2. Our mean analysis shows us:
N Minimum Maximum Mean Std. Deviation
Statistic Statistic Statistic Statistic Statistic
Frequency of computer use in
professional life
177 -2.00 2.00 .3220 1.51253
Frequency of computer use in
personal life
187 -2.00 2.00 .2299 1.51180
Frequency of internet use in
professional life
177 -2.00 2.00 .1751 1.54767
Frequency of internet use in
personal life
187 -2.00 2.00 .1872 1.61053
Influence of social network in
life
176 -2.00 2.00 -.5852 1.30651
Influence of family and peer in
decision making
184 -2.00 2.00 .3641 1.25145
Valid N (listwise) 160
While access to computer and internet both have a frequent direction among the respondents,
influence of social media as a decision source has a negative mean (low influence). Family
and peer is a viable decision source with a mean 0.3641, slightly higher than 0 (somewhat
rely on them).
Also, we calculate the mean values of the perception factors that were exclusive to the user:
N Minimum Maximum Mean Std. Deviation
Statistic Statistic Statistic Statistic Statistic
Influence of political turmoil in
m-banking usage
60 -1.00 1.00 .3167 .67627
Influence of share market crisis
in m-banking usage
59 -1.00 1.00 -.1695 .46060
Influence of Natural disaster in 60 -1.00 1.00 -.0333 .60971
21
m-banking usage
Time consumption in m-banking 89 -2.00 2.00 -.6966 1.13222
Compatability of mobile banking 92 -2.00 2.00 .5435 1.23514
Convenience of technology 93 -2.00 2.00 .7097 1.12849
Similarity with previous versions 90 -2.00 2.00 -.2444 1.12491
Safety in usage 90 -2.00 2.00 -.1000 1.26358
Cost associated with usage 89 -2.00 2.00 .6517 1.18802
Complexity of the technology 88 -2.00 2.00 -.2614 1.28201
Valid N (listwise) 51
It shows that, unlike political turmoil, no other social and natural events that we mentioned,
(natural disaster and share market crisis) increases the usage rate among the users. Users
perceive m-banking a low time consuming and low safety technology that has little similarity
with previous version (e-banking in this scenario). In general, the overall perception among
the users is somewhat negative.
SIMILARITY TEST 5.4
We performed independent sample t-test among the respondents to compare their mean
values over the access and decision factors and we saw that frequency of computer and
internet usage in professional and personal life, also the influence of social media and
primary social groups (family and friends) do not vary significantly among the adopters and
non-adopters.
We also conducted a gender-wise mean comparison for the perception issues among the
adopters. The mean values do not vary significantly between the groups. That means, be it
male or female, a typical m-banking adopter will reflect upon similar user experience of the
technology.
REGRESSION ANALYSIS 5.5
Linear Multiple Regression can be used to address a variety of research questions. Here we
used to determine how mobile banking adoption can be explained by our set of defined
variables.
Model Summary
Model R R Square Adjusted R
Square
Std. Error of
the Estimate
1 .569a .324 .189 .37725
Predictors: (Constant), Influence of family and peer in decision making, Frequency of
internet use in professional life, Gender, Monthly Transaction, Occupation, Residence,
22
Familiarity with the tern, Education, Influence of social network in life, Mobile actitivities,
Age, Income Range, Frequency of computer use in personal life, Frequency of internet use
in personal life, Frequency of computer use in professional life
Capital R is the simple correlation coefficient that tells us how strongly the multiple
independent variables are related to the dependent variable. R: the value of the co-efficient of
correlation for our case is +.569 which means that there‟s moderately a strong relationship in
the customer‟s adoption of mobile banking with the factors.
R2
: is the coefficient of determination. The R2 value indicates how much of the dependant
variable in this case the mobile banking adoption can be explained by the independent
variables (the factors). From the model summary R2 is 0.324 which implies that more than
30% of the overall adoption scenario can be explained by the factors determined for the
research.
Adjusted R2
: adjusted R2 gives the true dependency. As the number of variable increases,
the R value increases without showing true dependency. To mitigate the phenomenon
Adjusted R2
is used to show the true dependency. Here the model shows that the adjusted R2
is .189 which means that 18.9% of the time, the changes in dependant variable, in this case
the adoption of mobile banking can be explained by the changes in the independent variables.
ANOVA: It is the analysis of variance (the deviations in the dependent variable).
ANOVAa
Model Sum of
Squares
Df Mean
Square
F Sig.
1
Regression 5.120 15 .341 2.398 .007b
Residual 10.674 75 .142
Total 15.794 90
a. Dependent Variable: Mobile Banking user
b. Predictors: (Constant), Influence of family and peer in decision making, Frequency of
internet use in professional life, Gender, Monthly Transaction, Occupation, Residence,
Familiarity with the tern, Education, Influence of social network in life, Mobile activities,
Age, Income Range, Frequency of computer use in personal life, Frequency of internet use in
personal life, Frequency of computer use in professional life
23
Statistical significance
The F-ratio in the ANOVA table tests whether the overall regression model is a good fit
for the data. If the sig. value is less than .05 (.01,.0001, etc), then the variable is making a
significant unique contribution to the prediction of the dependent variable. If greater than
.05, then you can conclude that variable is not making significant unique contribution to
the prediction of your dependent variable. The table shows that the independent variables
statistically significantly predict the dependent variable, F(15, 75) = 2.398, p < .05 (i.e.,
the regression model is a good fit of the data).
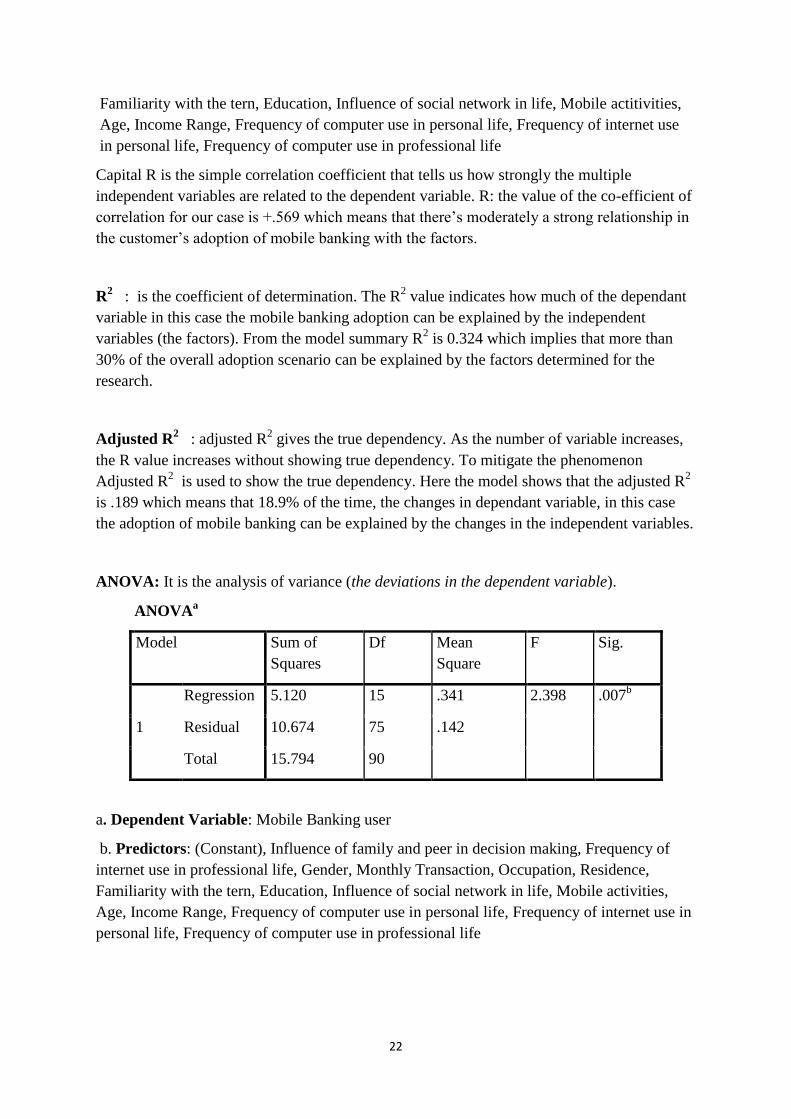
Coefficientsa
Model Unstandardized
Coefficients
Standardize
d
Coefficients
T Sig.
B Std. Error Beta
1
(Constant) 2.295 .310 7.406 .000
Age .008 .037 .032 .227 .821
Gender -.066 .094 -.072 -.699 .486
Occupation -.010 .020 -.057 -.516 .608
Residence -.108 .061 -.201 -1.785 .078
Education -.045 .051 -.110 -.885 .379
Income Range -.010 .069 -.021 -.143 .887
Monthly Transaction .038 .043 .117 .874 .385
Familiarity with the
tern .263 .097 .300 2.712 .008
Mobile actitivities -.282 .069 -.549 -4.065 .000
Frequency of
computer use in
professional life
-.071 .074 -.257 -.966 .337
Frequency of
computer use in
personal life
.076 .068 .274 1.114 .269
Frequency of internet
use in professional
life
.074 .074 .274 1.004 .319
Frequency of internet
use in personal life -.030 .064 -.115 -.462 .645
Influence of social
network in life .090 .043 .281 2.091 .040
Influence of family
and peer in decision
making
-.002 .033 -.005 -.055 .957
24
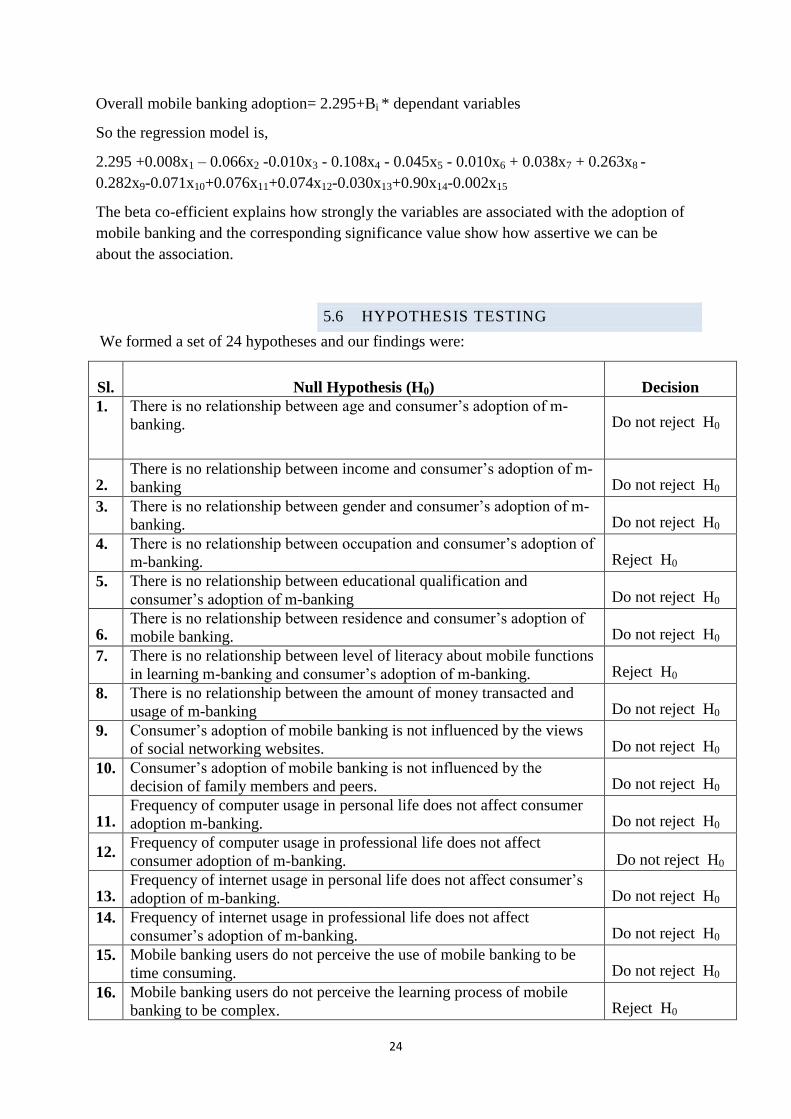
Overall mobile banking adoption= 2.295+Bi * dependant variables
So the regression model is,
2.295 +0.008x1 – 0.066x2 -0.010x3 - 0.108x4 - 0.045x5 - 0.010x6 + 0.038x7 + 0.263x8 -
0.282x9-0.071x10+0.076x11+0.074x12-0.030x13+0.90x14-0.002x15
The beta co-efficient explains how strongly the variables are associated with the adoption of
mobile banking and the corresponding significance value show how assertive we can be
about the association.
HYPOTHESIS TESTING 5.6
We formed a set of 24 hypotheses and our findings were:
Sl. Null Hypothesis (H0) Decision
1. There is no relationship between age and consumer‟s adoption of m-
banking. Do not reject H0
2. There is no relationship between income and consumer‟s adoption of m-
banking Do not reject H0
3. There is no relationship between gender and consumer‟s adoption of m-
banking. Do not reject H0
4. There is no relationship between occupation and consumer‟s adoption of
m-banking. Reject H0
5. There is no relationship between educational qualification and
consumer‟s adoption of m-banking Do not reject H0
6. There is no relationship between residence and consumer‟s adoption of
mobile banking. Do not reject H0
7. There is no relationship between level of literacy about mobile functions
in learning m-banking and consumer‟s adoption of m-banking. Reject H0
8. There is no relationship between the amount of money transacted and
usage of m-banking Do not reject H0
9. Consumer‟s adoption of mobile banking is not influenced by the views
of social networking websites. Do not reject H0
10. Consumer‟s adoption of mobile banking is not influenced by the
decision of family members and peers. Do not reject H0
11. Frequency of computer usage in personal life does not affect consumer
adoption m-banking. Do not reject H0
12. Frequency of computer usage in professional life does not affect
consumer adoption of m-banking. Do not reject H0
13. Frequency of internet usage in personal life does not affect consumer‟s
adoption of m-banking. Do not reject H0
14. Frequency of internet usage in professional life does not affect
consumer‟s adoption of m-banking. Do not reject H0
15. Mobile banking users do not perceive the use of mobile banking to be
time consuming. Do not reject H0
16. Mobile banking users do not perceive the learning process of mobile
banking to be complex. Reject H0
25
17. Mobile banking users do not perceive the use of mobile banking to be
risky. Reject H0
18. Mobile banking users do not perceive the use of mobile banking to be
costly Reject H0
19. Mobile banking users do not perceive the use of mobile banking to be
inconvenient. Reject H0
20. Mobile banking users do not perceive the use of mobile banking to be
difficult Reject H0
21. Usage of mobile banking remains same during the time of political
turmoil. Do not reject H0
22. Usage of mobile banking remains same during the time of natural
disaster Do not reject H0
23. Usage of mobile banking remains same during the time of share market
crisis. Do not reject H0
24. Majority of people does not follow offline/direct cash transaction as their
dominant form of payment Reject H0
We now describe the findings from these tests.
5.6.1 SPECIFIC OBJECTIVE 1: TO IDENTIFY THE RELATIONS BETWEEN
CONSUMER ADOPTION OF MOBILE BANKING AND USER
CHARACTERISTICS..
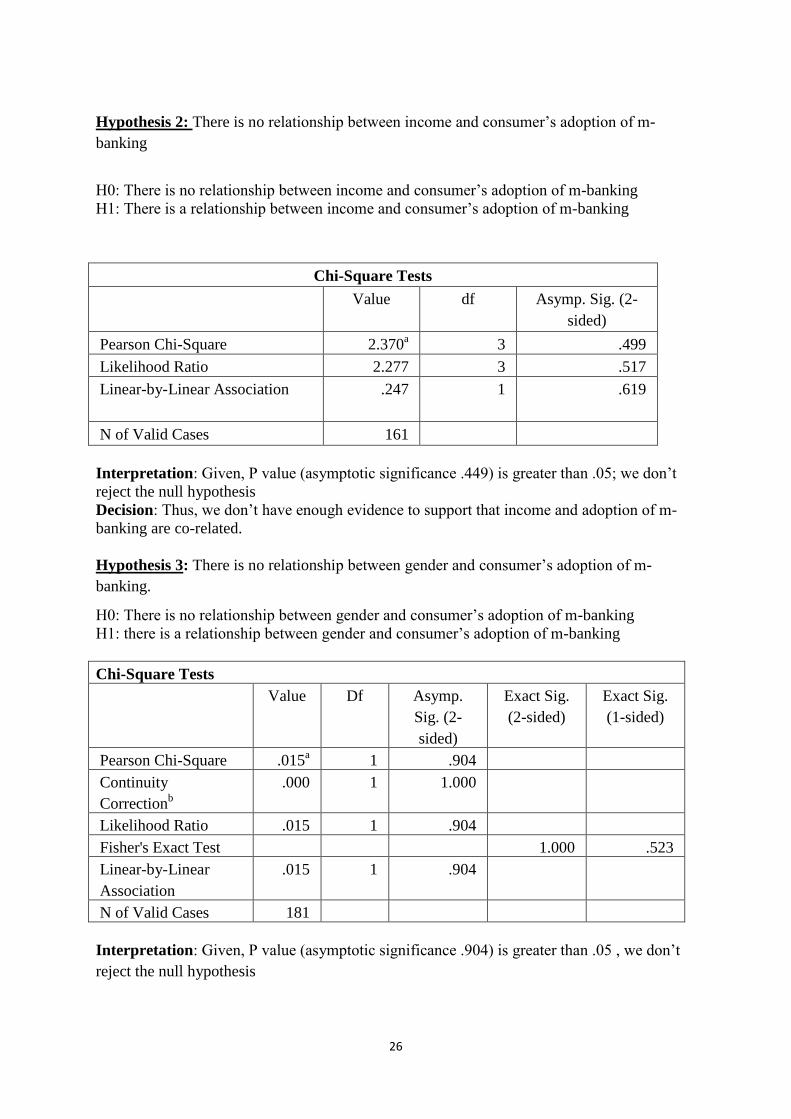
Hypothesis 1: There is no relationship between age and consumer‟s adoption of m-banking
H0: There is no relationship between age and consumer‟s adoption of m-banking
H1: There is a relationship between age and consumer‟s adoption of m-banking
Chi-Square Tests
Value Df Asymp. Sig. (2-sided)
Pearson Chi-Square 5.587a 5 .348
Likelihood Ratio 6.000 5 .306
Linear-by-Linear
Association
.654 1 .419
N of Valid Cases 176
Interpretation: Given, P value (asymptotic significance .348) is greater than .05 , we don‟t
reject the null hypothesis
Decision: Thus, we don‟t have enough evidence to support that age and adoption of m-
banking are co-related.
26
Hypothesis 2: There is no relationship between income and consumer‟s adoption of m-
banking
H0: There is no relationship between income and consumer‟s adoption of m-banking
H1: There is a relationship between income and consumer‟s adoption of m-banking
Chi-Square Tests
Value df Asymp. Sig. (2-
sided)
Pearson Chi-Square 2.370a 3 .499
Likelihood Ratio 2.277 3 .517
Linear-by-Linear Association .247 1 .619
N of Valid Cases 161
Interpretation: Given, P value (asymptotic significance .449) is greater than .05; we don‟t
reject the null hypothesis
Decision: Thus, we don‟t have enough evidence to support that income and adoption of m-
banking are co-related.
Hypothesis 3: There is no relationship between gender and consumer‟s adoption of m-
banking.
H0: There is no relationship between gender and consumer‟s adoption of m-banking
H1: there is a relationship between gender and consumer‟s adoption of m-banking
Chi-Square Tests
Value Df Asymp.
Sig. (2-
sided)
Exact Sig.
(2-sided)
Exact Sig.
(1-sided)
Pearson Chi-Square .015a 1 .904
Continuity
Correctionb
.000 1 1.000
Likelihood Ratio .015 1 .904
Fisher's Exact Test 1.000 .523
Linear-by-Linear
Association
.015 1 .904
N of Valid Cases 181
Interpretation: Given, P value (asymptotic significance .904) is greater than .05 , we don‟t
reject the null hypothesis
27
Decision: Thus we don‟t have strong evidence to support that Gender and adoption of m-
banking are co-related.
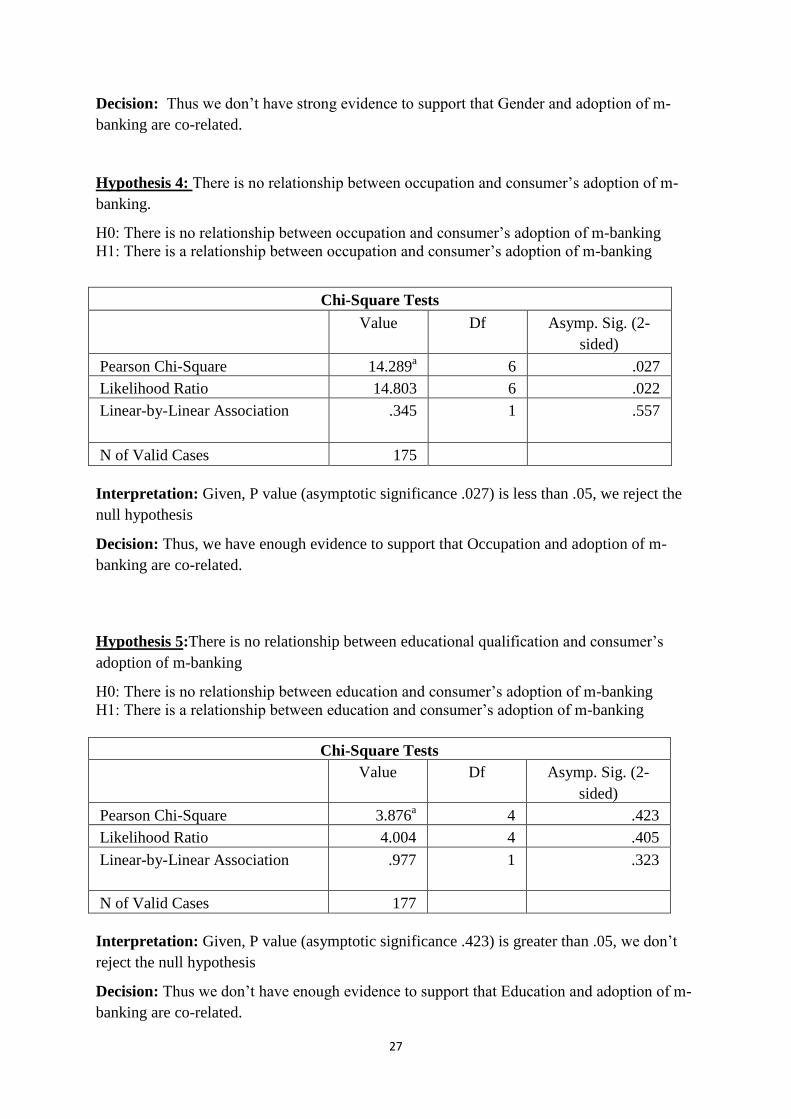
Hypothesis 4: There is no relationship between occupation and consumer‟s adoption of m-
banking.
H0: There is no relationship between occupation and consumer‟s adoption of m-banking
H1: There is a relationship between occupation and consumer‟s adoption of m-banking
Chi-Square Tests
Value Df Asymp. Sig. (2-
sided)
Pearson Chi-Square 14.289a 6 .027
Likelihood Ratio 14.803 6 .022
Linear-by-Linear Association .345 1 .557
N of Valid Cases 175
Interpretation: Given, P value (asymptotic significance .027) is less than .05, we reject the
null hypothesis
Decision: Thus, we have enough evidence to support that Occupation and adoption of m-
banking are co-related.
Hypothesis 5:There is no relationship between educational qualification and consumer‟s
adoption of m-banking
H0: There is no relationship between education and consumer‟s adoption of m-banking
H1: There is a relationship between education and consumer‟s adoption of m-banking
Chi-Square Tests
Value Df Asymp. Sig. (2-
sided)
Pearson Chi-Square 3.876a 4 .423
Likelihood Ratio 4.004 4 .405
Linear-by-Linear Association .977 1 .323
N of Valid Cases 177
Interpretation: Given, P value (asymptotic significance .423) is greater than .05, we don‟t
reject the null hypothesis
Decision: Thus we don‟t have enough evidence to support that Education and adoption of m-
banking are co-related.
28
Hypothesis 6: There is no relationship between residence and consumer‟s adoption of mobile
banking.
H0: There is no relationship between residence and consumer‟s adoption of m-banking
H1: There is a relationship between residence and consumer‟s adoption of m-banking
Chi-Square Tests
Value Df Asymp. Sig. (2-
sided)
Pearson Chi-Square .466a 2 .792
Likelihood Ratio .450 2 .798
Linear-by-Linear Association .409 1 .522
N of Valid Cases 171
Interpretation: Given, P value (asymptotic significance .792) is greater than .0, we don‟t
reject the null hypothesis
Decision: Thus we don‟t have enough evidence to support that Residence and adoption of m-
banking are co-related.
Hypothesis 7: There is no relationship between level of literacy about mobile functions in
learning m-banking and consumer‟s adoption of m-banking.
H0: There is no relationship between level of literacy about mobile functions in learning m-
banking and Consumer‟s adoption of m-banking
H1: There is a relationship between level of literacy about mobile functions in learning m-
banking and Consumer‟s adoption of m-banking
Chi-Square Tests
Value df Asymp. Sig. (2-
sided)
Pearson Chi-Square 14.765a 2 .001
Likelihood Ratio 14.444 2 .001
Linear-by-Linear Association 12.942 1 .000
N of Valid Cases 105
Interpretation: Given, P value (asymptotic significance .001) is less than .05, we reject the
null hypothesis
Decision: Thus, we have strong evidence to support that level of literacy about mobile
functions in learning m-banking and adoption of m-banking are co-related.
29
Hypothesis 8:There is no relationship between the amount of money transacted and usage of
m-banking
H0: there is no relationship between Amount of money transacted and Consumer‟s adoption
of m-banking
H1: there is a relationship between Amount of money transacted and Consumer‟s adoption of
m-banking
Chi-Square Tests
Value df Asymp. Sig. (2-
sided)
Pearson Chi-Square 2.970a 4 .563
Likelihood Ratio 3.295 4 .510
Linear-by-Linear Association 1.269 1 .260
N of Valid Cases 153
Interpretation: Given, P value (asymptotic significance .563) is greater than .05; we don‟t
reject the null hypothesis
Decision: Thus, we don‟t have enough evidence to support that Amount of money transacted
and adoption of m-banking are co-related.
Hypothesis 9: Consumer‟s adoption of mobile banking is not influenced by the views of
social networking websites.
Null Hypothesis (H0): Consumer‟s adoption of mobile banking is not influenced by the
views of social networking websites.
Alternate Hypothesis (H1): Consumer‟s adoption of mobile banking is influenced by the
views of social networking websites.
Correlationa
Mobile
Banking user
Influence of
social network
in life
Mobile Banking user Pearson Correlation 1 .013
Sig. (2-tailed) .865
Influence of social network
in life
Pearson Correlation .013 1
Sig. (2-tailed) .865
a. Listwise N=170

30
Interpretation: The variables are positively correlated with correlation coefficient of .013.
The calculated significance level for two tailed test is .86, showing that the correlation is not
significant.
Decision: We cannot reject the null hypothesis, i.e. we don‟t have enough evidence to prove
that consumer‟s adoption of mobile banking is influenced by the views of social networking
websites.
Hypothesis 10: Consumer‟s adoption of mobile banking is not influenced by the decision of
family members and peers
Null Hypothesis (H0): Consumer‟s adoption of mobile banking is not influenced by the
decision of family members and peers.
Alternate Hypothesis (H1):Consumer‟s adoption of mobile banking is influenced by the
decision of family members and peers.
Correlationsa
Mobile
Banking user
Influence of
family and peer
in decision
making
Mobile Banking user Pearson Correlation 1 .056
Sig. (2-tailed) .461
Influence of family and peer
in decision making
Pearson Correlation .056 1
Sig. (2-tailed) .461
a. Listwise N=176
Interpretation: The variables are positively correlated with correlation coefficient of .056.
The calculated significance level for two tailed test is .461, showing that the correlation is not
significant.
Decision: We cannot reject the null hypothesis, i.e. we do not have enough evidence to prove
that consumer‟s adoption of mobile banking is influenced by the decision of family members
and peers.
Hypothesis 11: Frequency of computer usage in personal life does not affect consumer
adoption m-banking.
Null Hypothesis (H0): Frequency of computer usage in personal life does not affect
consumer adoption m-banking.
Alternate Hypothesis (H1):Frequency of computer usage in personal life affects consumer
adoption m-banking.
31
Correlationsa
Mobile
Banking user
Frequency of
computer use
in personal life
Mobile Banking user Pearson Correlation 1 -.015
Sig. (2-tailed) .845
Frequency of computer use
in personal life
Pearson Correlation -.015 1
Sig. (2-tailed) .845
a. Listwise N=177
Interpretation:The variables are negatively correlated with correlation coefficient of .015.
The calculated significance level for two tailed test is .845, showing that the correlation is not
significant.
Decision: We cannot reject the null hypothesis, i.e. we do not have enough evidence to prove
that frequency of computer usage in personal life affects consumer adoption m-banking.
Hypothesis 12: Frequency of computer usage in professional life does not affect consumer
adoption of m-banking.
Null Hypothesis (H0): Frequency of computer usage in professional life does not affect
consumer adoption of m-banking.
Alternate Hypothesis (H1): Frequency of computer usage in professional life affects
consumer adoption of m-banking.
Correlationsa
Mobile
Banking user
Frequency of
computer use
in professional
life
Mobile Banking user Pearson Correlation 1 -.042
Sig. (2-tailed) .594
Frequency of computer use
in professional life
Pearson Correlation -.042 1
Sig. (2-tailed) .594
a. Listwise N=167
Interpretation:The variables are negatively correlated with correlation coefficient of .042.
The calculated significance level for two tailed test is .594, showing that the correlation is not
significant.
32
Decision: We cannot reject the null hypothesis, i.e. we do not have enough evidence to prove
that frequency of computer usage in professional life affects consumer adoption of m-
banking.
Hypothesis 13: Frequency of internet usage in personal life does not affect consumer‟s
adoption of m-banking.
Null Hypothesis (H0): Frequency of internet usage in personal life does not affect
consumer‟s adoption of m-banking
Alternate Hypothesis (H1): Frequency of internet usage in personal life affects consumer‟s
adoption of m-banking.
Interpretation:The variables are negatively correlated with correlation coefficient of .054.
The calculated significance level for two tailed test is .476, showing that the correlation is not
significant.
Decision:We cannot reject the null hypothesis, i.e. we do not have enough evidence to prove
that frequency of internet usage in personal life affects consumer adoption of m-banking.
Hypothesis 14: Frequency of internet usage in professional life does not affect consumer‟s
adoption of m-banking.
Null Hypothesis (H0): Frequency of internet usage in professional life does not affect
consumer‟s adoption of m-banking
Alternate Hypothesis (H1): Frequency of internet usage in professional life affects
consumer‟s adoption of m-banking
Correlationsa
Mobile
Banking user
Frequency of
internet use in
professional
Correlationsa
Mobile
Banking user
Frequency of
internet use in
personal life
Mobile Banking user Pearson Correlation 1 -.054
Sig. (2-tailed) .476
Frequency of internet use in
personal life
Pearson Correlation -.054 1
Sig. (2-tailed) .476
a. Listwise N=176
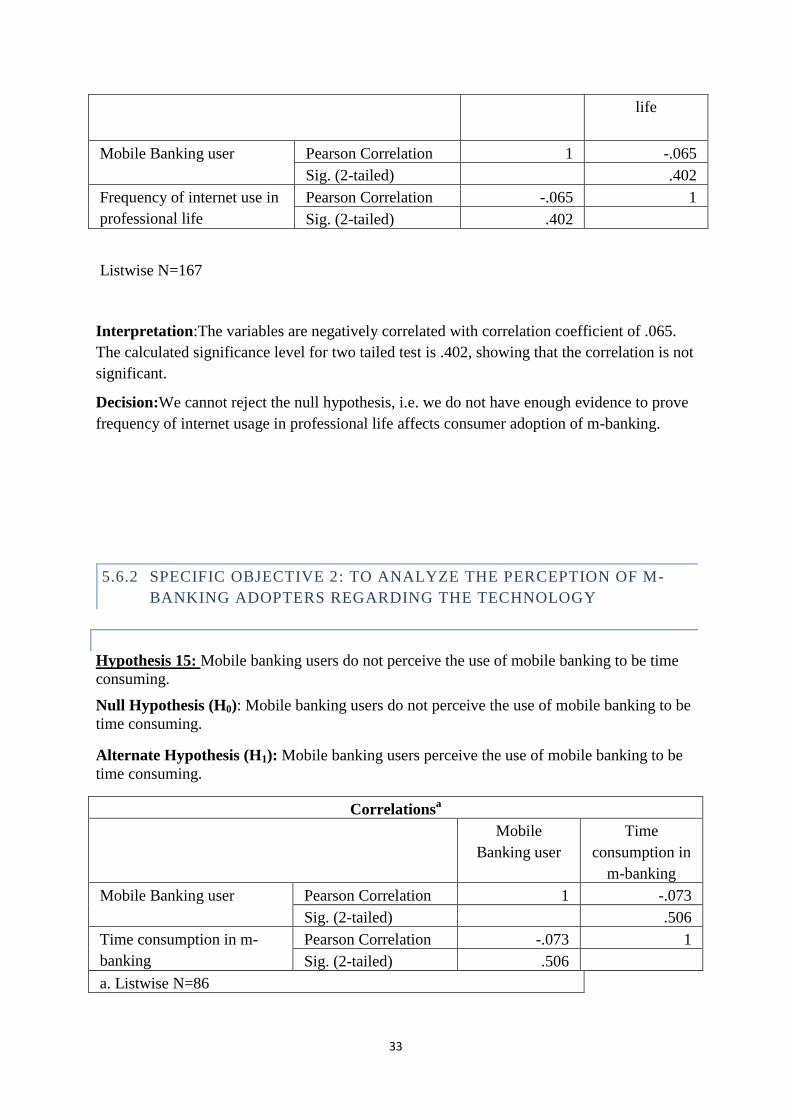
33
life
Mobile Banking user Pearson Correlation 1 -.065
Sig. (2-tailed) .402
Frequency of internet use in
professional life
Pearson Correlation -.065 1
Sig. (2-tailed) .402
Listwise N=167
Interpretation:The variables are negatively correlated with correlation coefficient of .065.
The calculated significance level for two tailed test is .402, showing that the correlation is not
significant.
Decision:We cannot reject the null hypothesis, i.e. we do not have enough evidence to prove
frequency of internet usage in professional life affects consumer adoption of m-banking.
5.6.2 SPECIFIC OBJECTIVE 2: TO ANALYZE THE PERCEPTION OF M-
BANKING ADOPTERS REGARDING THE TECHNOLOGY
Hypothesis 15: Mobile banking users do not perceive the use of mobile banking to be time
consuming.
Null Hypothesis (H0): Mobile banking users do not perceive the use of mobile banking to be
time consuming.
Alternate Hypothesis (H1): Mobile banking users perceive the use of mobile banking to be
time consuming.
Correlationsa
Mobile
Banking user
Time
consumption in
m-banking
Mobile Banking user Pearson Correlation 1 -.073
Sig. (2-tailed) .506
Time consumption in m-
banking
Pearson Correlation -.073 1
Sig. (2-tailed) .506
a. Listwise N=86
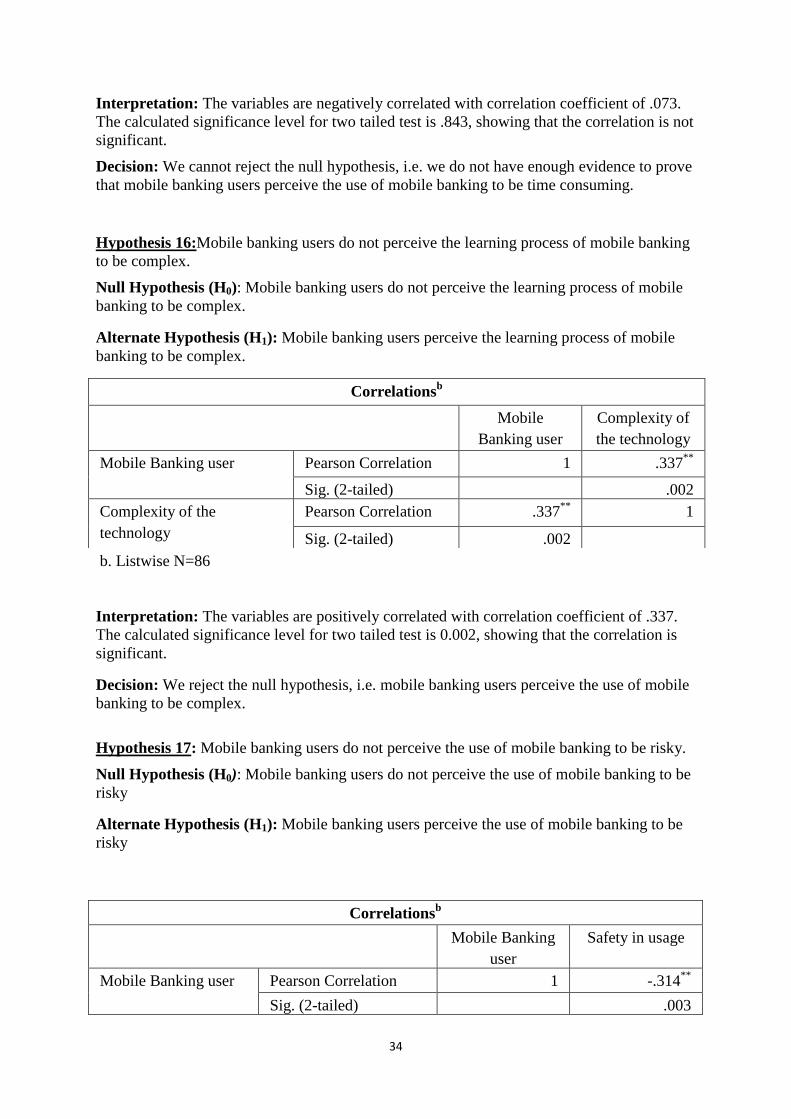
34
Interpretation: The variables are negatively correlated with correlation coefficient of .073.
The calculated significance level for two tailed test is .843, showing that the correlation is not
significant.
Decision: We cannot reject the null hypothesis, i.e. we do not have enough evidence to prove
that mobile banking users perceive the use of mobile banking to be time consuming.
Hypothesis 16:Mobile banking users do not perceive the learning process of mobile banking
to be complex.
Null Hypothesis (H0): Mobile banking users do not perceive the learning process of mobile
banking to be complex.
Alternate Hypothesis (H1): Mobile banking users perceive the learning process of mobile
banking to be complex.
b. Listwise N=86
Interpretation: The variables are positively correlated with correlation coefficient of .337.
The calculated significance level for two tailed test is 0.002, showing that the correlation is
significant.
Decision: We reject the null hypothesis, i.e. mobile banking users perceive the use of mobile
banking to be complex.
Hypothesis 17: Mobile banking users do not perceive the use of mobile banking to be risky.
Null Hypothesis (H0): Mobile banking users do not perceive the use of mobile banking to be
risky
Alternate Hypothesis (H1): Mobile banking users perceive the use of mobile banking to be
risky
Correlationsb
Mobile
Banking user
Complexity of
the technology
Mobile Banking user Pearson Correlation 1 .337**
Sig. (2-tailed) .002
Complexity of the
technology
Pearson Correlation .337**
1
Sig. (2-tailed) .002
Correlationsb
Mobile Banking
user
Safety in usage
Mobile Banking user Pearson Correlation 1 -.314**
Sig. (2-tailed) .003
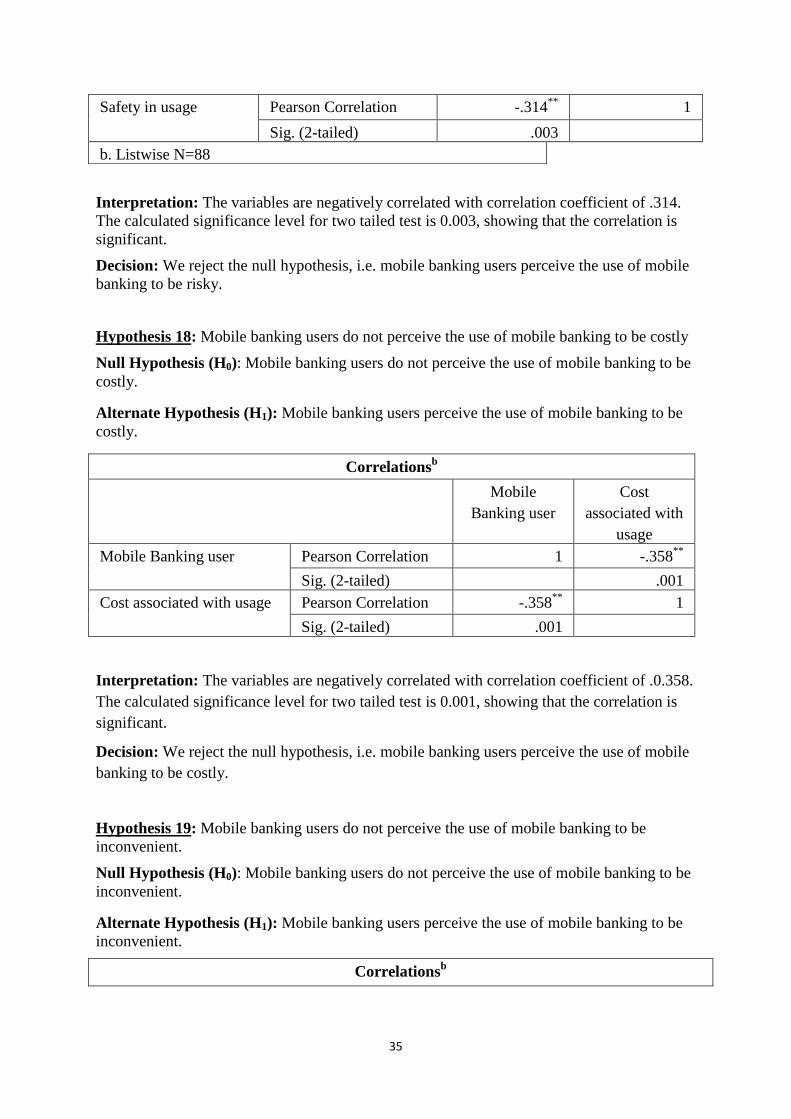
35
Interpretation: The variables are negatively correlated with correlation coefficient of .314.
The calculated significance level for two tailed test is 0.003, showing that the correlation is
significant.
Decision: We reject the null hypothesis, i.e. mobile banking users perceive the use of mobile
banking to be risky.
Hypothesis 18: Mobile banking users do not perceive the use of mobile banking to be costly
Null Hypothesis (H0): Mobile banking users do not perceive the use of mobile banking to be
costly.
Alternate Hypothesis (H1): Mobile banking users perceive the use of mobile banking to be
costly.
Correlationsb
Mobile
Banking user
Cost
associated with
usage
Mobile Banking user Pearson Correlation 1 -.358**
Sig. (2-tailed) .001
Cost associated with usage Pearson Correlation -.358**
1
Sig. (2-tailed) .001
Interpretation: The variables are negatively correlated with correlation coefficient of .0.358.
The calculated significance level for two tailed test is 0.001, showing that the correlation is
significant.
Decision: We reject the null hypothesis, i.e. mobile banking users perceive the use of mobile
banking to be costly.
Hypothesis 19: Mobile banking users do not perceive the use of mobile banking to be
inconvenient.
Null Hypothesis (H0): Mobile banking users do not perceive the use of mobile banking to be
inconvenient.
Alternate Hypothesis (H1): Mobile banking users perceive the use of mobile banking to be
inconvenient.
Correlationsb
Safety in usage Pearson Correlation -.314**
1
Sig. (2-tailed) .003
b. Listwise N=88
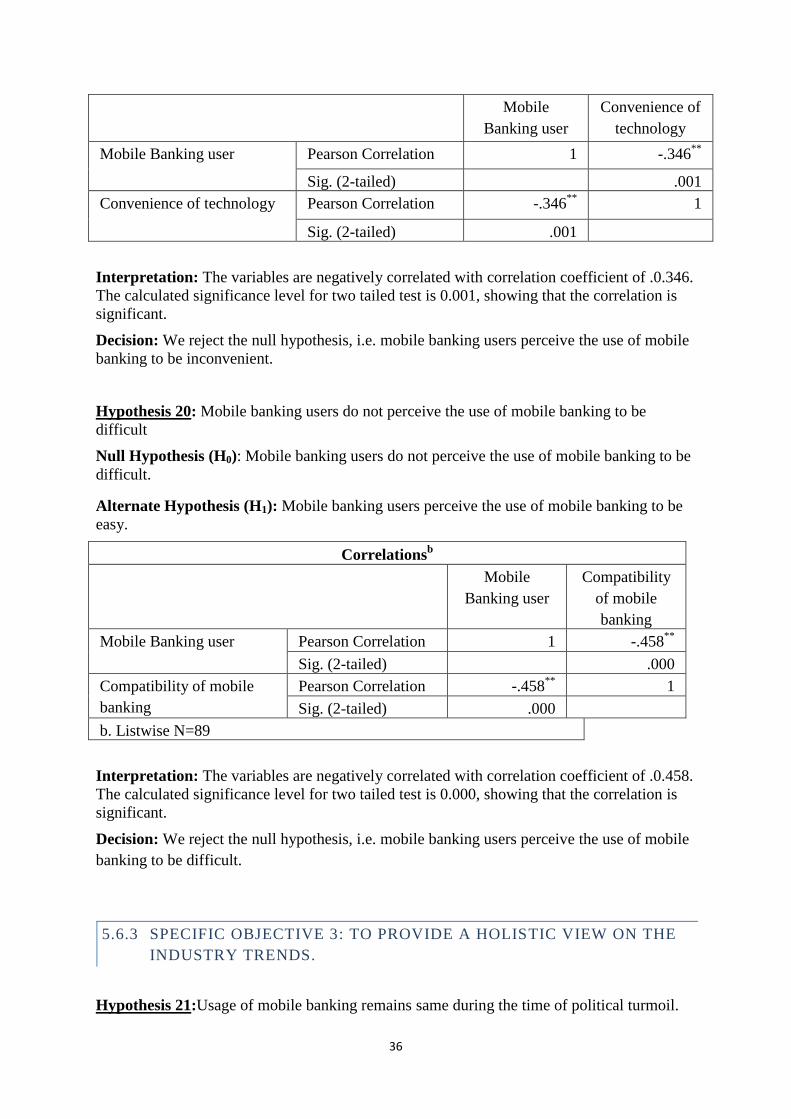
36
Mobile
Banking user
Convenience of
technology
Mobile Banking user Pearson Correlation 1 -.346**
Sig. (2-tailed) .001
Convenience of technology Pearson Correlation -.346**
1
Sig. (2-tailed) .001
Interpretation: The variables are negatively correlated with correlation coefficient of .0.346.
The calculated significance level for two tailed test is 0.001, showing that the correlation is
significant.
Decision: We reject the null hypothesis, i.e. mobile banking users perceive the use of mobile
banking to be inconvenient.
Hypothesis 20: Mobile banking users do not perceive the use of mobile banking to be
difficult
Null Hypothesis (H0): Mobile banking users do not perceive the use of mobile banking to be
difficult.
Alternate Hypothesis (H1): Mobile banking users perceive the use of mobile banking to be
easy.
Correlationsb
Mobile
Banking user
Compatibility
of mobile
banking
Mobile Banking user Pearson Correlation 1 -.458**
Sig. (2-tailed) .000
Compatibility of mobile
banking
Pearson Correlation -.458**
1
Sig. (2-tailed) .000
b. Listwise N=89
Interpretation: The variables are negatively correlated with correlation coefficient of .0.458.
The calculated significance level for two tailed test is 0.000, showing that the correlation is
significant.
Decision: We reject the null hypothesis, i.e. mobile banking users perceive the use of mobile
banking to be difficult.
5.6.3 SPECIFIC OBJECTIVE 3: TO PROVIDE A HOLISTIC VIEW ON THE
INDUSTRY TRENDS.
Hypothesis 21:Usage of mobile banking remains same during the time of political turmoil.
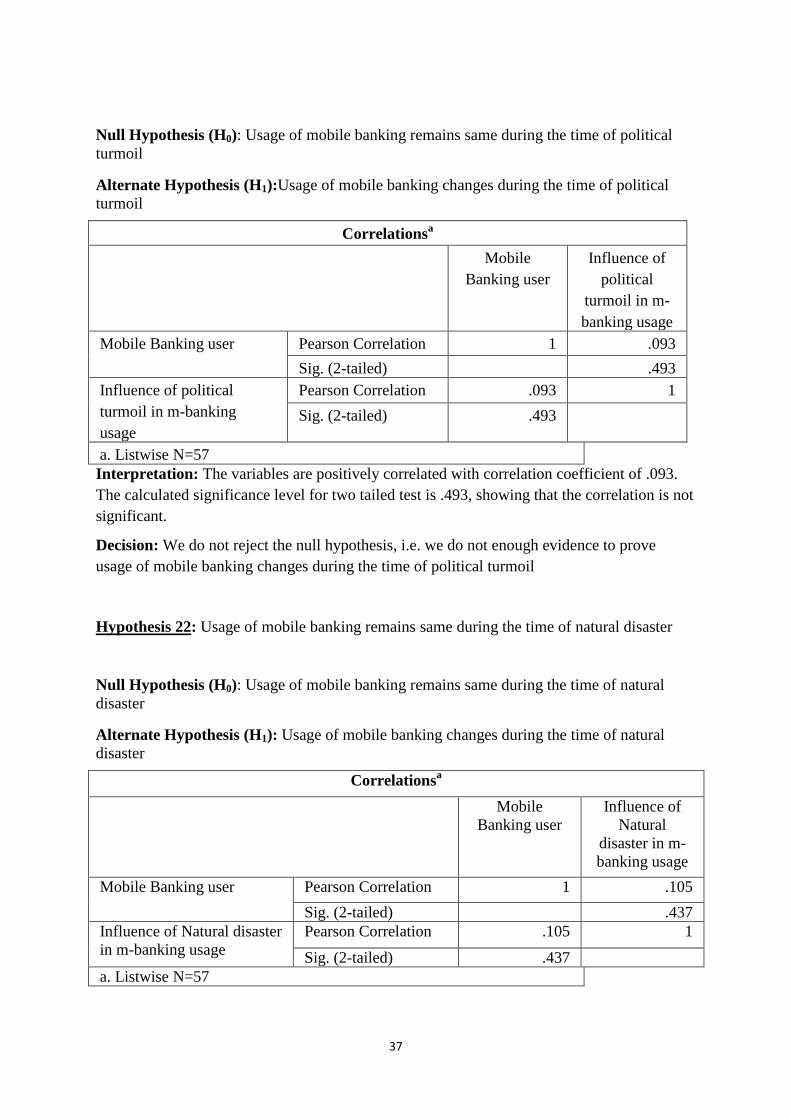
37
Null Hypothesis (H0): Usage of mobile banking remains same during the time of political
turmoil
Alternate Hypothesis (H1):Usage of mobile banking changes during the time of political
turmoil
Correlationsa
Mobile
Banking user
Influence of
political
turmoil in m-
banking usage
Mobile Banking user Pearson Correlation 1 .093
Sig. (2-tailed) .493
Influence of political
turmoil in m-banking
usage
Pearson Correlation .093 1
Sig. (2-tailed) .493
a. Listwise N=57
Interpretation: The variables are positively correlated with correlation coefficient of .093.
The calculated significance level for two tailed test is .493, showing that the correlation is not
significant.
Decision: We do not reject the null hypothesis, i.e. we do not enough evidence to prove
usage of mobile banking changes during the time of political turmoil
Hypothesis 22: Usage of mobile banking remains same during the time of natural disaster
Null Hypothesis (H0): Usage of mobile banking remains same during the time of natural
disaster
Alternate Hypothesis (H1): Usage of mobile banking changes during the time of natural
disaster
Correlationsa
Mobile
Banking user
Influence of
Natural
disaster in m-
banking usage
Mobile Banking user Pearson Correlation 1 .105
Sig. (2-tailed) .437
Influence of Natural disaster
in m-banking usage
Pearson Correlation .105 1
Sig. (2-tailed) .437
a. Listwise N=57
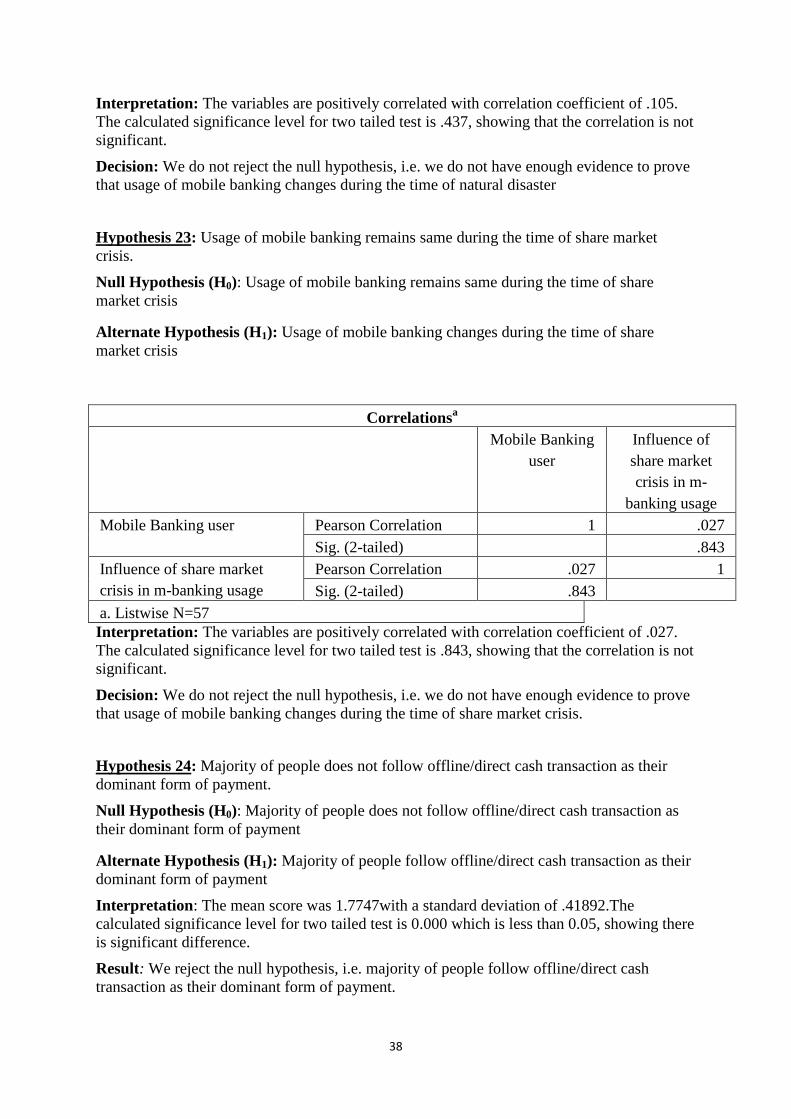
38
Interpretation: The variables are positively correlated with correlation coefficient of .105.
The calculated significance level for two tailed test is .437, showing that the correlation is not
significant.
Decision: We do not reject the null hypothesis, i.e. we do not have enough evidence to prove
that usage of mobile banking changes during the time of natural disaster
Hypothesis 23: Usage of mobile banking remains same during the time of share market
crisis.
Null Hypothesis (H0): Usage of mobile banking remains same during the time of share
market crisis
Alternate Hypothesis (H1): Usage of mobile banking changes during the time of share
market crisis
Correlationsa
Mobile Banking
user
Influence of
share market
crisis in m-
banking usage
Mobile Banking user Pearson Correlation 1 .027
Sig. (2-tailed) .843
Influence of share market
crisis in m-banking usage
Pearson Correlation .027 1
Sig. (2-tailed) .843
a. Listwise N=57
Interpretation: The variables are positively correlated with correlation coefficient of .027.
The calculated significance level for two tailed test is .843, showing that the correlation is not
significant.
Decision: We do not reject the null hypothesis, i.e. we do not have enough evidence to prove
that usage of mobile banking changes during the time of share market crisis.
Hypothesis 24: Majority of people does not follow offline/direct cash transaction as their
dominant form of payment.
Null Hypothesis (H0): Majority of people does not follow offline/direct cash transaction as
their dominant form of payment
Alternate Hypothesis (H1): Majority of people follow offline/direct cash transaction as their
dominant form of payment
Interpretation: The mean score was 1.7747with a standard deviation of .41892.The
calculated significance level for two tailed test is 0.000 which is less than 0.05, showing there
is significant difference.
Result: We reject the null hypothesis, i.e. majority of people follow offline/direct cash
transaction as their dominant form of payment.
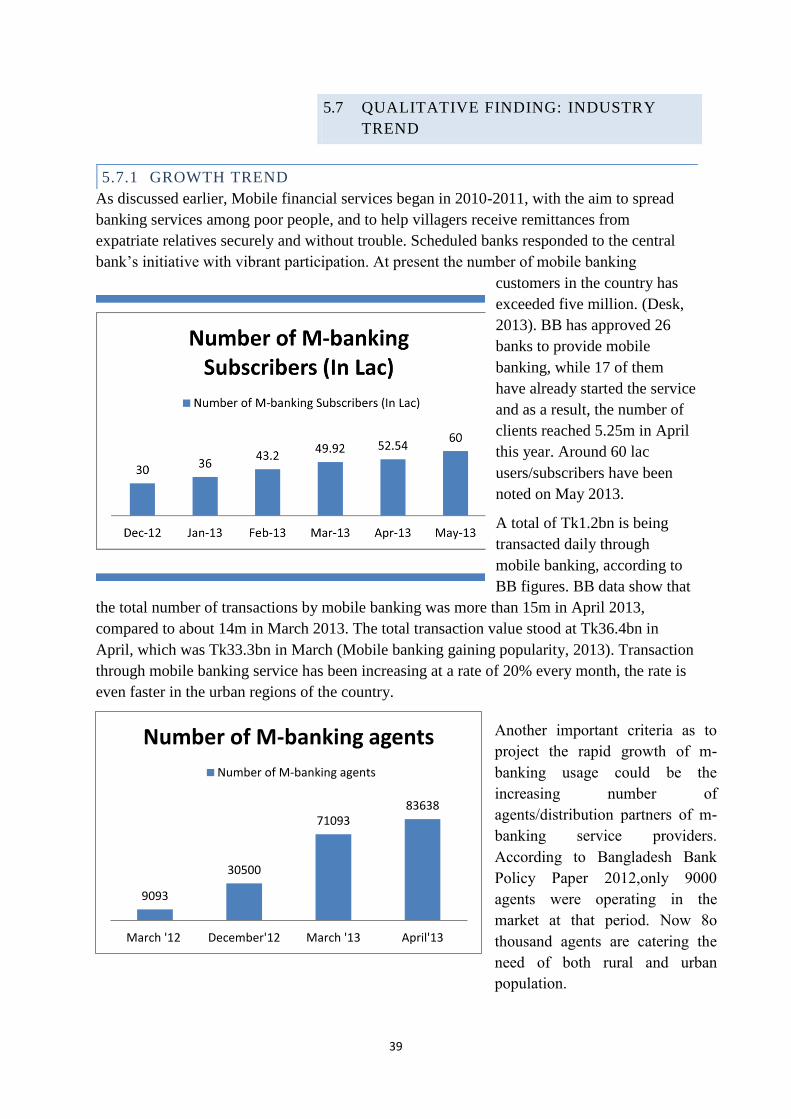
39
QUALITATIVE FINDING: INDUSTRY 5.7
TREND
5.7.1 GROWTH TREND
As discussed earlier, Mobile financial services began in 2010-2011, with the aim to spread
banking services among poor people, and to help villagers receive remittances from
expatriate relatives securely and without trouble. Scheduled banks responded to the central
bank‟s initiative with vibrant participation. At present the number of mobile banking
customers in the country has
exceeded five million. (Desk,
2013). BB has approved 26
banks to provide mobile
banking, while 17 of them
have already started the service
and as a result, the number of
clients reached 5.25m in April
this year. Around 60 lac
users/subscribers have been
noted on May 2013.
A total of Tk1.2bn is being
transacted daily through
mobile banking, according to
BB figures. BB data show that
the total number of transactions by mobile banking was more than 15m in April 2013,
compared to about 14m in March 2013. The total transaction value stood at Tk36.4bn in
April, which was Tk33.3bn in March (Mobile banking gaining popularity, 2013). Transaction
through mobile banking service has been increasing at a rate of 20% every month, the rate is
even faster in the urban regions of the country.
9093
30500
71093 83638
March '12 December'12 March '13 April'13
Number of M-banking agents
Number of M-banking agents
Another important criteria as to
project the rapid growth of m-
banking usage could be the
increasing number of
agents/distribution partners of m-
banking service providers.
According to Bangladesh Bank
Policy Paper 2012,only 9000
agents were operating in the
market at that period. Now 8o
thousand agents are catering the
need of both rural and urban
population.
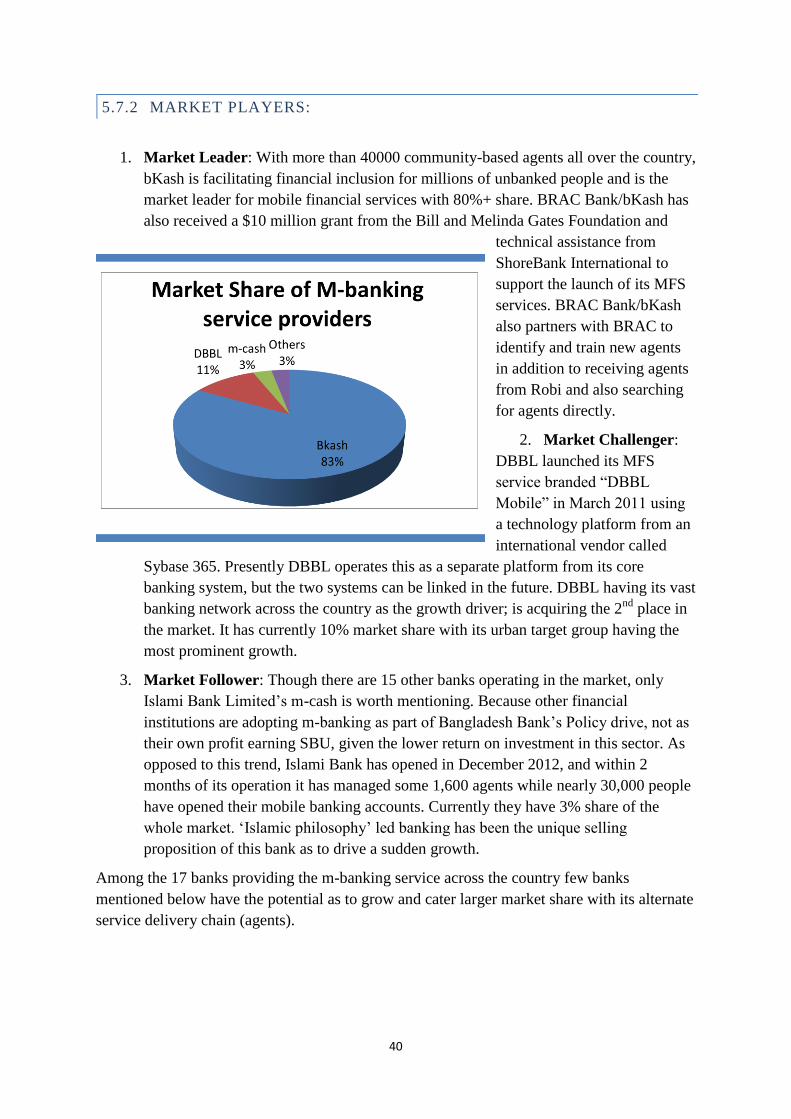
40
5.7.2 MARKET PLAYERS:
1. Market Leader: With more than 40000 community-based agents all over the country,
bKash is facilitating financial inclusion for millions of unbanked people and is the
market leader for mobile financial services with 80%+ share. BRAC Bank/bKash has
also received a $10 million grant from the Bill and Melinda Gates Foundation and
technical assistance from
ShoreBank International to
support the launch of its MFS
services. BRAC Bank/bKash
also partners with BRAC to
identify and train new agents
in addition to receiving agents
from Robi and also searching
for agents directly.
2. Market Challenger:
DBBL launched its MFS
service branded “DBBL
Mobile” in March 2011 using
a technology platform from an
international vendor called
Sybase 365. Presently DBBL operates this as a separate platform from its core
banking system, but the two systems can be linked in the future. DBBL having its vast
banking network across the country as the growth driver; is acquiring the 2nd
place in
the market. It has currently 10% market share with its urban target group having the
most prominent growth.
3. Market Follower: Though there are 15 other banks operating in the market, only
Islami Bank Limited‟s m-cash is worth mentioning. Because other financial
institutions are adopting m-banking as part of Bangladesh Bank‟s Policy drive, not as
their own profit earning SBU, given the lower return on investment in this sector. As
opposed to this trend, Islami Bank has opened in December 2012, and within 2
months of its operation it has managed some 1,600 agents while nearly 30,000 people
have opened their mobile banking accounts. Currently they have 3% share of the
whole market. „Islamic philosophy‟ led banking has been the unique selling
proposition of this bank as to drive a sudden growth.
Among the 17 banks providing the m-banking service across the country few banks
mentioned below have the potential as to grow and cater larger market share with its alternate
service delivery chain (agents).
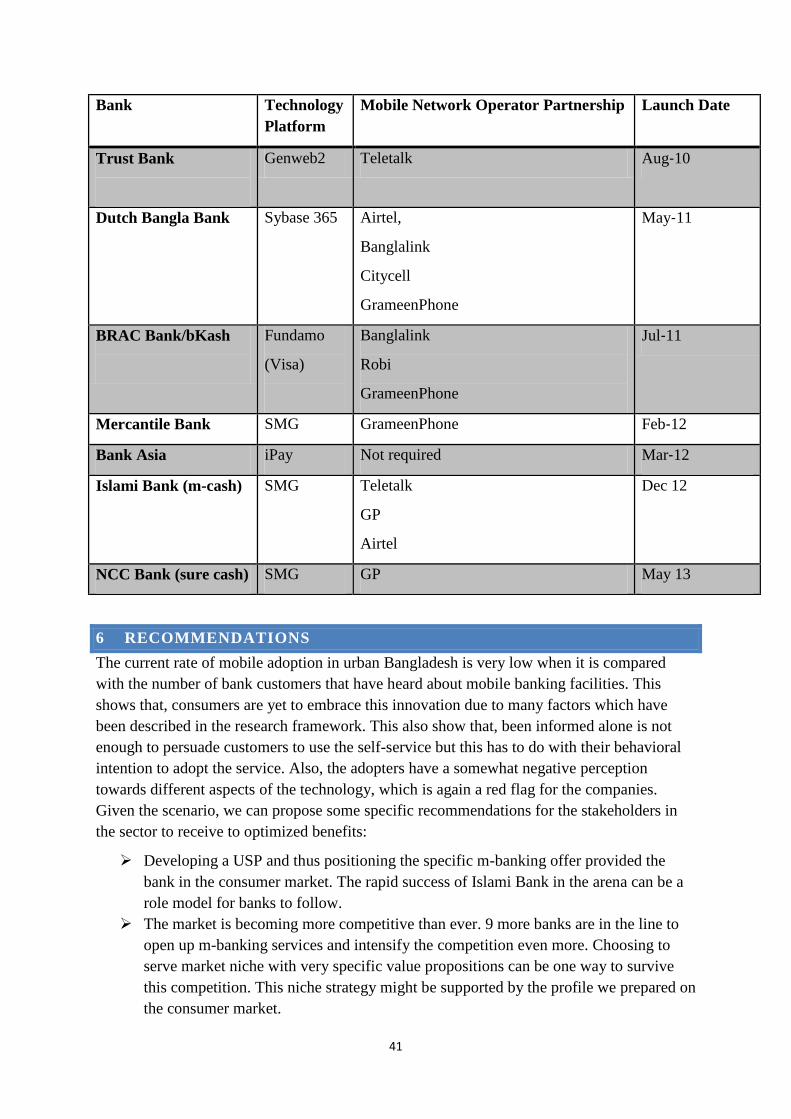
41
Bank Technology
Platform
Mobile Network Operator Partnership Launch Date
Trust Bank
Genweb2 Teletalk Aug‐10
Dutch Bangla Bank
Sybase 365 Airtel,
Banglalink
Citycell
GrameenPhone
May‐11
BRAC Bank/bKash
Fundamo
(Visa)
Banglalink
Robi
GrameenPhone
Jul‐11
Mercantile Bank SMG GrameenPhone Feb‐12
Bank Asia iPay Not required Mar‐12
Islami Bank (m-cash) SMG Teletalk
GP
Airtel
Dec 12
NCC Bank (sure cash) SMG GP May 13
6 RECOMMENDATIONS
The current rate of mobile adoption in urban Bangladesh is very low when it is compared
with the number of bank customers that have heard about mobile banking facilities. This
shows that, consumers are yet to embrace this innovation due to many factors which have
been described in the research framework. This also show that, been informed alone is not
enough to persuade customers to use the self-service but this has to do with their behavioral
intention to adopt the service. Also, the adopters have a somewhat negative perception
towards different aspects of the technology, which is again a red flag for the companies.
Given the scenario, we can propose some specific recommendations for the stakeholders in
the sector to receive to optimized benefits:
Developing a USP and thus positioning the specific m-banking offer provided the
bank in the consumer market. The rapid success of Islami Bank in the arena can be a
role model for banks to follow.
The market is becoming more competitive than ever. 9 more banks are in the line to
open up m-banking services and intensify the competition even more. Choosing to
serve market niche with very specific value propositions can be one way to survive
this competition. This niche strategy might be supported by the profile we prepared on
the consumer market.
42
Majority of the consumers in the market still perceive online banking as a higher
value product than mobile banking and m-banking mostly helps them with instant
money transactions (not all the banking activities). Widening the scope to utilize m-
banking and properly promoting the scope in the consumer market is also
recommended.
Banks need to reconsider their overall business strategy since they do not consider m-
banking section as a strategic business unit yet in most cases. This hampers the banks,
the market and is wastage of resources for no gain at all.
Nearly 40% of the respondents were not aware of the term and became clear about the
actual value proposition of a typical m-banking service while answering the questions.
This lack of awareness and proper product knowledge has to be removed through
intensive promotional efforts undertaken by the banks. Direct promotion channels
(personal promotion media) can be an excellent strategy to adapt that will ensure
maximum effective exposure.
Perceived level of safety with m-banking is negative. The security measures need to
be properly communicated so that this negative perception is reduced in the market.
The entire sector is in a green movement and the consumer segment has to be in
alignment with this movement too. Promoting green practices and incentivizing
adoption of greener banking activities can be considered by the banks.
Emphasizing on alternative value delivery channels (agents) can be a turnaround
strategy for the market followers.
Increasing strategic partnership with telecom companies can be another way to
increase flexibility of the service and thus become more market friendly.
7 CONCLUSION
It can be concluded that mobile banking in Bangladesh is only at its primitive stage
dominated by the private banks. The use of mobile banking is confined to a few consumer
segments. The risks associated with mobile banking are many, which the banks have to
model using sophisticated systems and extensive use of technology. The banks can focus on
strategic consumer groups to maximize its revenues from mobile banking. The experiences of
the global economies suggest that banks cannot avoid the m-banking phenomenon, but to
gain a competitive advantage, they must structure their business models to suit to local
conditions.
43
8 APPENDIX
NOTES 8.1
1. Mobile banking: Mobile banking is a system that allows customers of a financial
institution to conduct a number of financial transactions through a mobile device such
as a mobile phone or personal digital assistant.
2. Internet banking: Internet banking allows customers of a financial institution to
conduct financial transactions on a secure website operated by the institution, which
can be a retail or virtual bank, credit union or building society.
3. Electronic banking: The use of computers to carry out banking transactions such as
withdrawals through cash dispensers or transfer of funds at point of sale.
4. SMS banking: SMS banking is a type of mobile banking, a technology-enabled
service offering from banks to its customers, permitting them to operate selected
banking services over their mobile phones using SMS messaging.
5. Consumer adoption of technological innovations: Consumer adoption of
technological innovations is the process consumers uses to determine whether or not
to adopt innovation. This process is influenced by consumer characteristics, such as
personality traits and demographic or socioeconomic factors, the characteristics of the
new product, such as its relative advantage and complexity, and social influences,
such as opinion leaders.
6. Lickert scale: A Likert scale measures the extent to which a person agrees or
disagrees with the question. The most common scale is 1 to 5. Often the scale will be
1=strongly disagree, 2=disagree, 3=not sure,4=agree, and 5=strongly agree.
7. Semantics scale: Semantic differential is a type of a rating scale designed to measure
the connotative meaning of objects, events, and concepts. The connotations are used
to derive the attitude towards the given object, event or concept.
8. Linear multiple regression: Multiple linear regression attempts to model the
relationship between two or more explanatory variables and a response variable by
fitting a linear equation to observed data. Every value of the independent variable x is
associated with a value of the dependent variable y.
44
BIBLIOGRAPHY 8.2
9 BIBLIOGRAPHY
Rahman, S. S. (2011). Mobile Banking in Bangladesh. Unpublished Report, Daffodil
International University, Dhaka, Bangladesh.
Ondiege P. (2010). Mobile Banking in Africa: Taking the Bank to the People, Journal
of „Africa Economic Brief‟ , Vol. 1 Issue 8, p.1
Bangens,L. &Soderberg,B. (2008). Mobile Banking-Financial Service for the
Unbanked? Kista: Spider
Baten, M. A., Kamil, A. A. (2010). E-Banking of Economical Prospects in
Bangladesh. Journal of Internet Banking and Commerce, August 2010, vol. 15, no.2.
Retrieved March 19, 2012
Khatiwada, I., Pant, R., Karmacharya, H. (2010). Mobile Telephony and Mobile
Banking: Adoption, Issues and Potential Economic Impacts for Nepal. Nepal
Telecommunication Corporation. Retrieved March 19, 2012
Sultana, R. (2009). Mobile Banking: Overview of Regulatory Framework in
Emerging Markets. 4th Communication Policy Research, South Conference,
Negombo, Sri Lanka. Retrieved March 19, 2012
LaforetSylvie,LiXiaoyan, (2005), “Consumers‟ attitudes towards online and mobile
banking in China”, Volume 23 issue 5.
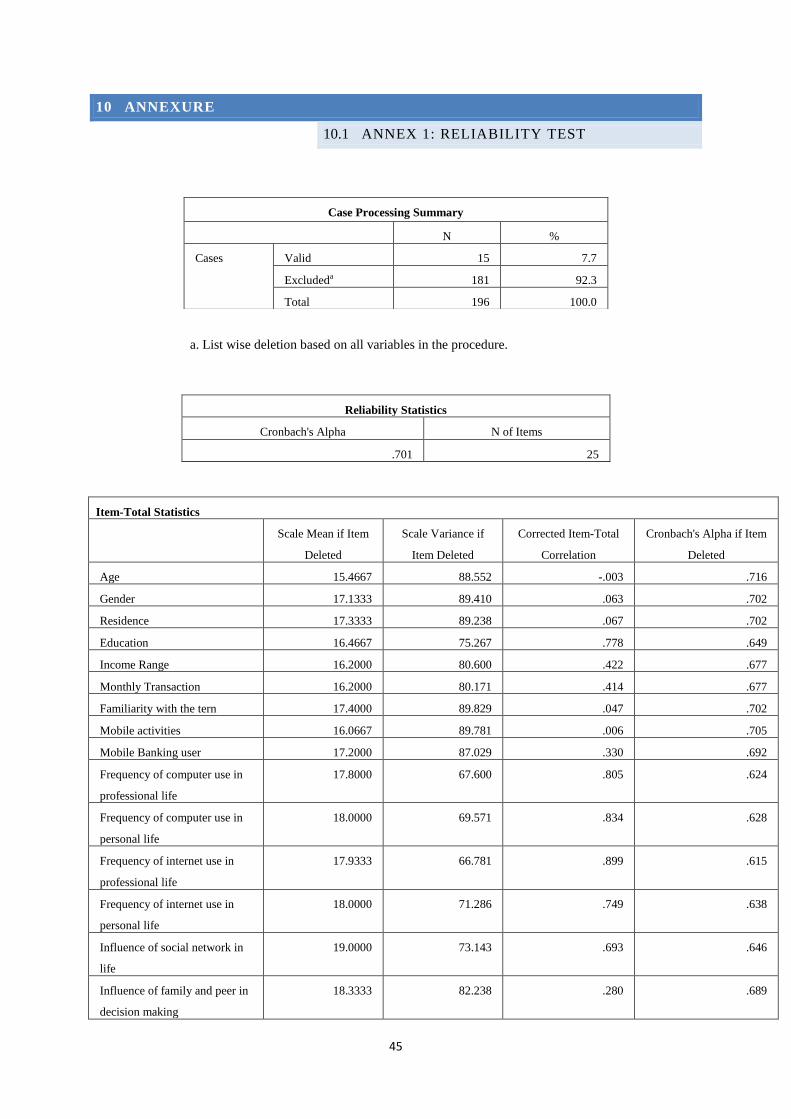
45
10 ANNEXURE
ANNEX 1: RELIABILITY TEST 10.1
a. List wise deletion based on all variables in the procedure.
Reliability Statistics
Cronbach's Alpha N of Items
.701 25
Item-Total Statistics
Scale Mean if Item
Deleted
Scale Variance if
Item Deleted
Corrected Item-Total
Correlation
Cronbach's Alpha if Item
Deleted
Age 15.4667 88.552 -.003 .716
Gender 17.1333 89.410 .063 .702
Residence 17.3333 89.238 .067 .702
Education 16.4667 75.267 .778 .649
Income Range 16.2000 80.600 .422 .677
Monthly Transaction 16.2000 80.171 .414 .677
Familiarity with the tern 17.4000 89.829 .047 .702
Mobile activities 16.0667 89.781 .006 .705
Mobile Banking user 17.2000 87.029 .330 .692
Frequency of computer use in
professional life
17.8000 67.600 .805 .624
Frequency of computer use in
personal life
18.0000 69.571 .834 .628
Frequency of internet use in
professional life
17.9333 66.781 .899 .615
Frequency of internet use in
personal life
18.0000 71.286 .749 .638
Influence of social network in
life
19.0000 73.143 .693 .646
Influence of family and peer in
decision making
18.3333 82.238 .280 .689
Case Processing Summary
N %
Cases Valid 15 7.7
Excludeda 181 92.3
Total 196 100.0
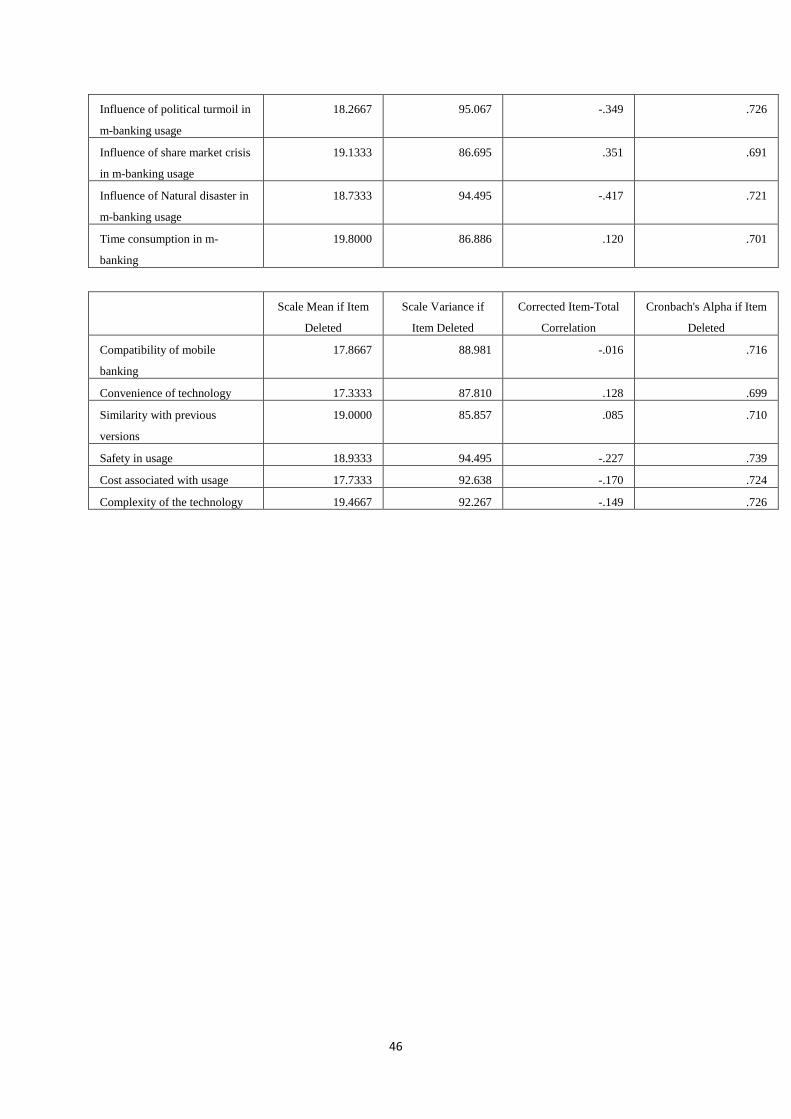
46
Influence of political turmoil in
m-banking usage
18.2667 95.067 -.349 .726
Influence of share market crisis
in m-banking usage
19.1333 86.695 .351 .691
Influence of Natural disaster in
m-banking usage
18.7333 94.495 -.417 .721
Time consumption in m-
banking
19.8000 86.886 .120 .701
Scale Mean if Item
Deleted
Scale Variance if
Item Deleted
Corrected Item-Total
Correlation
Cronbach's Alpha if Item
Deleted
Compatibility of mobile
banking
17.8667 88.981 -.016 .716
Convenience of technology 17.3333 87.810 .128 .699
Similarity with previous
versions
19.0000 85.857 .085 .710
Safety in usage 18.9333 94.495 -.227 .739
Cost associated with usage 17.7333 92.638 -.170 .724
Complexity of the technology 19.4667 92.267 -.149 .726
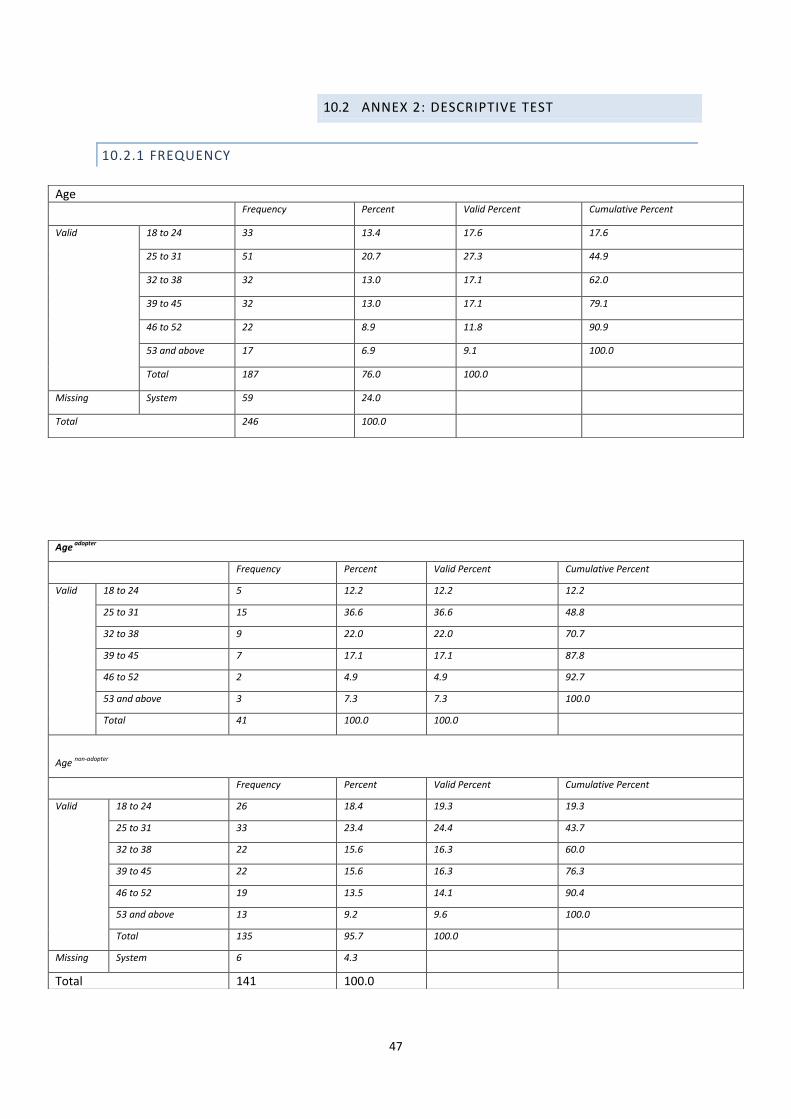
47
ANNEX 2: DESCRIPTIVE TEST 10.2
10.2.1 FREQUENCY
Age Frequency Percent Valid Percent Cumulative Percent
Valid 18 to 24 33 13.4 17.6 17.6
25 to 31 51 20.7 27.3 44.9
32 to 38 32 13.0 17.1 62.0
39 to 45 32 13.0 17.1 79.1
46 to 52 22 8.9 11.8 90.9
53 and above 17 6.9 9.1 100.0
Total 187 76.0 100.0
Missing System 59 24.0
Total 246 100.0
Age adopter
Frequency Percent Valid Percent Cumulative Percent
Valid 18 to 24 5 12.2 12.2 12.2
25 to 31 15 36.6 36.6 48.8
32 to 38 9 22.0 22.0 70.7
39 to 45 7 17.1 17.1 87.8
46 to 52 2 4.9 4.9 92.7
53 and above 3 7.3 7.3 100.0
Total 41 100.0 100.0
Age non-adopter
Frequency Percent Valid Percent Cumulative Percent
Valid 18 to 24 26 18.4 19.3 19.3
25 to 31 33 23.4 24.4 43.7
32 to 38 22 15.6 16.3 60.0
39 to 45 22 15.6 16.3 76.3
46 to 52 19 13.5 14.1 90.4
53 and above 13 9.2 9.6 100.0
Total 135 95.7 100.0
Missing System 6 4.3
Total 141 100.0

48
Occupation
Frequency Percent Valid Percent Cumulative Percent
Valid Student 28 14.3 15.1 15.1
Teacher 31 15.8 16.8 31.9
Private service holder 42 21.4 22.7 54.6
Businessman 26 13.3 14.1 68.6
Housewife 13 6.6 7.0 75.7
Government service holder 21 10.7 11.4 87.0
other 24 12.2 13.0 100.0
Total 185 94.4 100.0
Missing System 11 5.6
Total 196 100.0
Occupation non adopter
Frequency Percent Valid Percent Cumulative Percent
Valid Student 24 17.0 17.9 17.9
Teacher 16 11.3 11.9 29.9
Private service holder 26 18.4 19.4 49.3
Businessman 22 15.6 16.4 65.7
Housewife 12 8.5 9.0 74.6
Government service holder 18 12.8 13.4 88.1
other 16 11.3 11.9 100.0
Total 134 95.0 100.0
Missing System 7 5.0
Gender
Frequency Percent Valid Percent Cumulative Percent
Valid M 136 69.4 70.1 70.1
F 58 29.6 29.9 100.0
Total 194 99.0 100.0
Missing System 2 1.0
Total 196 100.0
Gender adopter
Frequency Percent Valid Percent Cumulative Percent
Valid M 28 68.3 68.3 68.3
F 13 31.7 31.7 100.0
Total 41 100.0 100.0
Gender non-adopter
Frequency Percent Valid Percent Cumulative Percent
Valid M 97 68.8 69.3 69.3
F 43 30.5 30.7 100.0
Total 140 99.3 100.0
Missing System 1 .7
Total 141 100.0
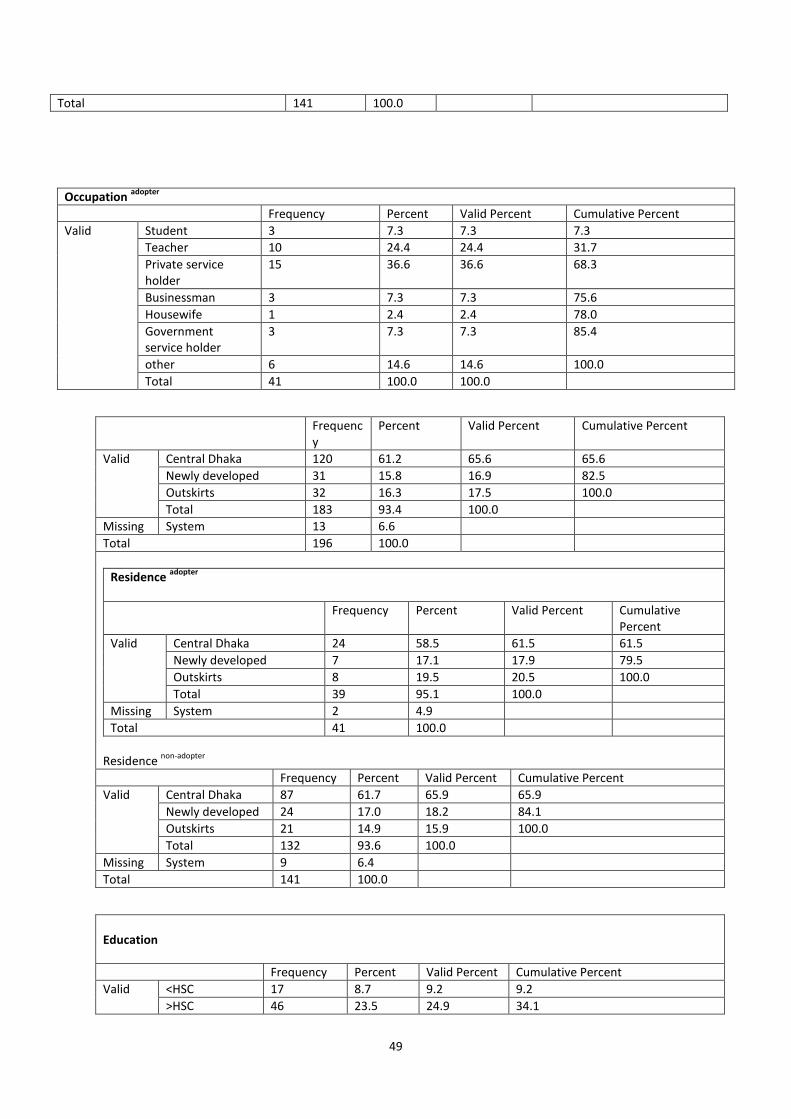
49
Total 141 100.0
Frequency
Percent Valid Percent Cumulative Percent
Valid Central Dhaka 120 61.2 65.6 65.6
Newly developed 31 15.8 16.9 82.5
Outskirts 32 16.3 17.5 100.0
Total 183 93.4 100.0
Missing System 13 6.6
Total 196 100.0
Residence adopter
Frequency Percent Valid Percent Cumulative Percent
Valid Central Dhaka 24 58.5 61.5 61.5
Newly developed 7 17.1 17.9 79.5
Outskirts 8 19.5 20.5 100.0
Total 39 95.1 100.0
Missing System 2 4.9
Total 41 100.0
Residence
non-adopter
Frequency Percent Valid Percent Cumulative Percent
Valid Central Dhaka 87 61.7 65.9 65.9
Newly developed 24 17.0 18.2 84.1
Outskirts 21 14.9 15.9 100.0
Total 132 93.6 100.0
Missing System 9 6.4
Total 141 100.0
Education
Frequency Percent Valid Percent Cumulative Percent
Valid <HSC 17 8.7 9.2 9.2
>HSC 46 23.5 24.9 34.1
Occupation adopter
Frequency Percent Valid Percent Cumulative Percent
Valid Student 3 7.3 7.3 7.3
Teacher 10 24.4 24.4 31.7
Private service holder
15 36.6 36.6 68.3
Businessman 3 7.3 7.3 75.6
Housewife 1 2.4 2.4 78.0
Government service holder
3 7.3 7.3 85.4
other 6 14.6 14.6 100.0
Total 41 100.0 100.0
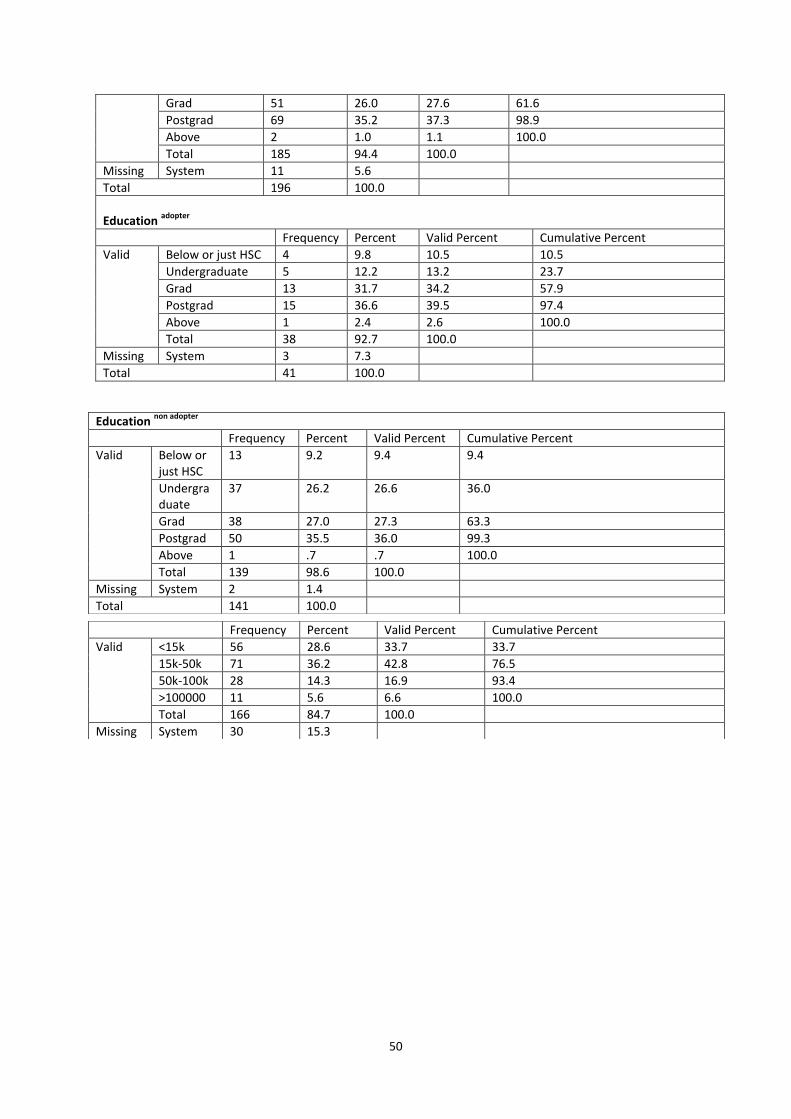
50
Grad 51 26.0 27.6 61.6
Postgrad 69 35.2 37.3 98.9
Above 2 1.0 1.1 100.0
Total 185 94.4 100.0
Missing System 11 5.6
Total 196 100.0
Education
adopter
Frequency Percent Valid Percent Cumulative Percent
Valid Below or just HSC 4 9.8 10.5 10.5
Undergraduate 5 12.2 13.2 23.7
Grad 13 31.7 34.2 57.9
Postgrad 15 36.6 39.5 97.4
Above 1 2.4 2.6 100.0
Total 38 92.7 100.0
Missing System 3 7.3
Total 41 100.0
Education non adopter
Frequency Percent Valid Percent Cumulative Percent
Valid Below or just HSC
13 9.2 9.4 9.4
Undergraduate
37 26.2 26.6 36.0
Grad 38 27.0 27.3 63.3
Postgrad 50 35.5 36.0 99.3
Above 1 .7 .7 100.0
Total 139 98.6 100.0
Missing System 2 1.4
Total 141 100.0
Frequency Percent Valid Percent Cumulative Percent
Valid <15k 56 28.6 33.7 33.7
15k-50k 71 36.2 42.8 76.5
50k-100k 28 14.3 16.9 93.4
>100000 11 5.6 6.6 100.0
Total 166 84.7 100.0
Missing System 30 15.3
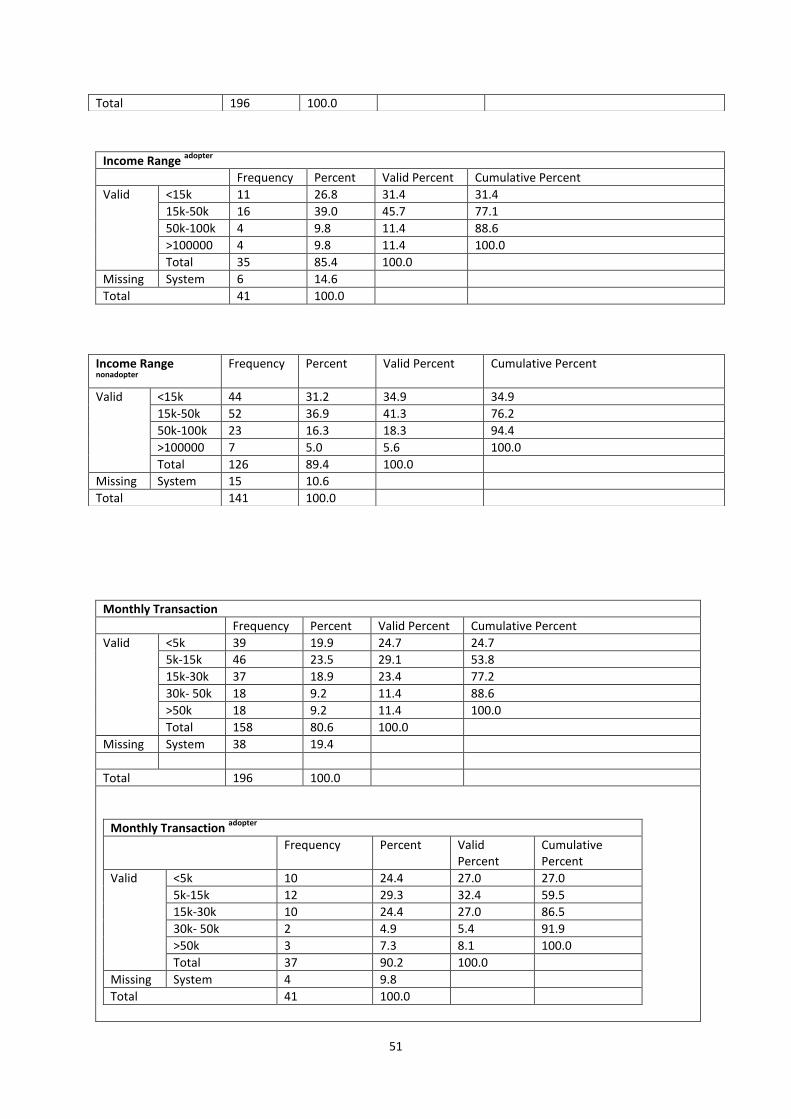
51
Income Range adopter
Frequency Percent Valid Percent Cumulative Percent
Valid <15k 11 26.8 31.4 31.4
15k-50k 16 39.0 45.7 77.1
50k-100k 4 9.8 11.4 88.6
>100000 4 9.8 11.4 100.0
Total 35 85.4 100.0
Missing System 6 14.6
Total 41 100.0
Monthly Transaction
Frequency Percent Valid Percent Cumulative Percent
Valid <5k 39 19.9 24.7 24.7
5k-15k 46 23.5 29.1 53.8
15k-30k 37 18.9 23.4 77.2
30k- 50k 18 9.2 11.4 88.6
>50k 18 9.2 11.4 100.0
Total 158 80.6 100.0
Missing System 38 19.4
Total 196 100.0
Monthly Transaction adopter
Frequency Percent Valid Percent
Cumulative Percent
Valid <5k 10 24.4 27.0 27.0
5k-15k 12 29.3 32.4 59.5
15k-30k 10 24.4 27.0 86.5
30k- 50k 2 4.9 5.4 91.9
>50k 3 7.3 8.1 100.0
Total 37 90.2 100.0
Missing System 4 9.8
Total 41 100.0
Total 196 100.0
Income Range nonadopter
Frequency Percent Valid Percent Cumulative Percent
Valid <15k 44 31.2 34.9 34.9
15k-50k 52 36.9 41.3 76.2
50k-100k 23 16.3 18.3 94.4
>100000 7 5.0 5.6 100.0
Total 126 89.4 100.0
Missing System 15 10.6
Total 141 100.0
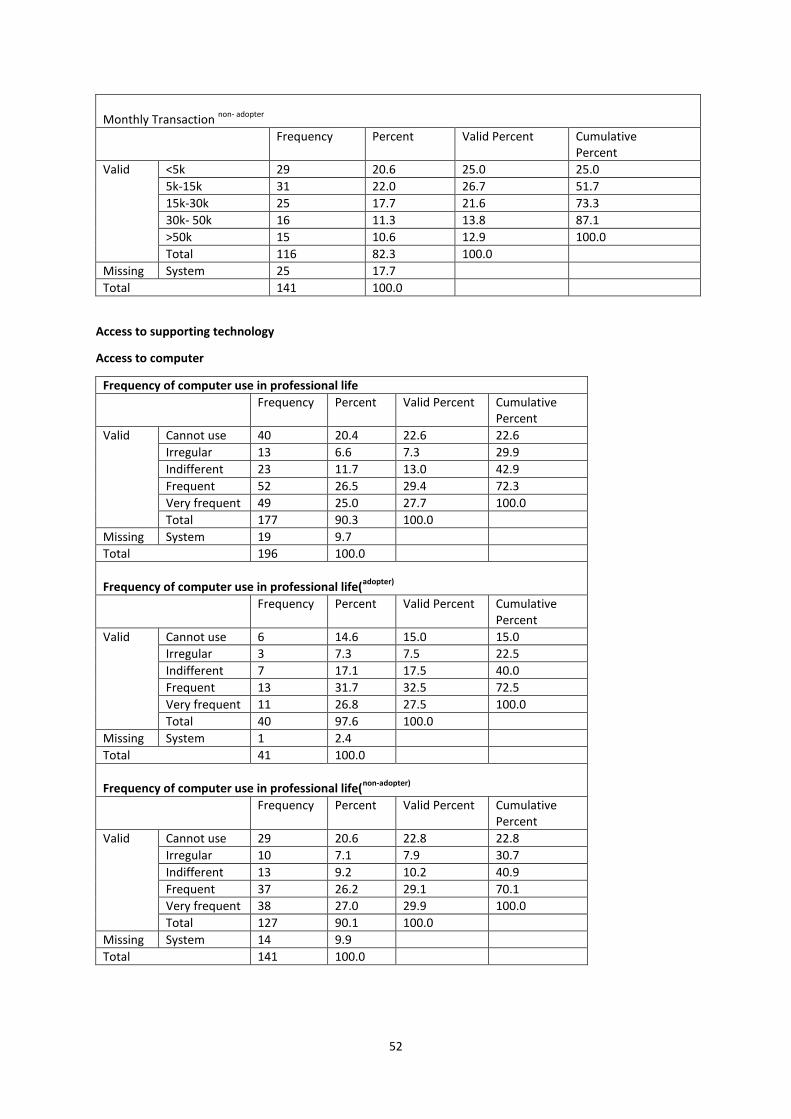
52
Monthly Transaction
non- adopter
Frequency Percent Valid Percent Cumulative Percent
Valid <5k 29 20.6 25.0 25.0
5k-15k 31 22.0 26.7 51.7
15k-30k 25 17.7 21.6 73.3
30k- 50k 16 11.3 13.8 87.1
>50k 15 10.6 12.9 100.0
Total 116 82.3 100.0
Missing System 25 17.7
Total 141 100.0
Access to supporting technology
Access to computer
Frequency of computer use in professional life
Frequency Percent Valid Percent Cumulative Percent
Valid Cannot use 40 20.4 22.6 22.6
Irregular 13 6.6 7.3 29.9
Indifferent 23 11.7 13.0 42.9
Frequent 52 26.5 29.4 72.3
Very frequent 49 25.0 27.7 100.0
Total 177 90.3 100.0
Missing System 19 9.7
Total 196 100.0
Frequency of computer use in professional life(
adopter)
Frequency Percent Valid Percent Cumulative Percent
Valid Cannot use 6 14.6 15.0 15.0
Irregular 3 7.3 7.5 22.5
Indifferent 7 17.1 17.5 40.0
Frequent 13 31.7 32.5 72.5
Very frequent 11 26.8 27.5 100.0
Total 40 97.6 100.0
Missing System 1 2.4
Total 41 100.0
Frequency of computer use in professional life(
non-adopter)
Frequency Percent Valid Percent Cumulative Percent
Valid Cannot use 29 20.6 22.8 22.8
Irregular 10 7.1 7.9 30.7
Indifferent 13 9.2 10.2 40.9
Frequent 37 26.2 29.1 70.1
Very frequent 38 27.0 29.9 100.0
Total 127 90.1 100.0
Missing System 14 9.9
Total 141 100.0
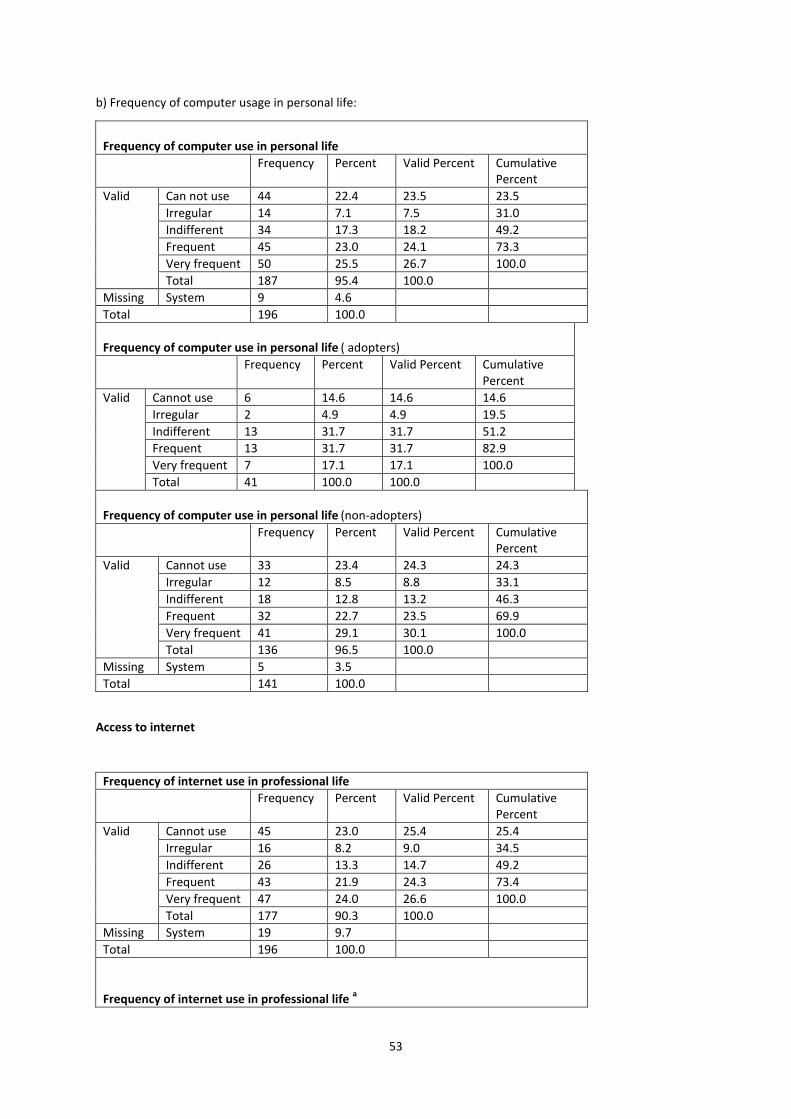
53
b) Frequency of computer usage in personal life:
Frequency of computer use in personal life
Frequency Percent Valid Percent Cumulative Percent
Valid Can not use 44 22.4 23.5 23.5
Irregular 14 7.1 7.5 31.0
Indifferent 34 17.3 18.2 49.2
Frequent 45 23.0 24.1 73.3
Very frequent 50 25.5 26.7 100.0
Total 187 95.4 100.0
Missing System 9 4.6
Total 196 100.0
Frequency of computer use in personal life
( adopters)
Frequency Percent Valid Percent Cumulative Percent
Valid Cannot use 6 14.6 14.6 14.6
Irregular 2 4.9 4.9 19.5
Indifferent 13 31.7 31.7 51.2
Frequent 13 31.7 31.7 82.9
Very frequent 7 17.1 17.1 100.0
Total 41 100.0 100.0
Frequency of computer use in personal life
(non-adopters)
Frequency Percent Valid Percent Cumulative Percent
Valid Cannot use 33 23.4 24.3 24.3
Irregular 12 8.5 8.8 33.1
Indifferent 18 12.8 13.2 46.3
Frequent 32 22.7 23.5 69.9
Very frequent 41 29.1 30.1 100.0
Total 136 96.5 100.0
Missing System 5 3.5
Total 141 100.0
Access to internet
Frequency of internet use in professional life
Frequency Percent Valid Percent Cumulative Percent
Valid Cannot use 45 23.0 25.4 25.4
Irregular 16 8.2 9.0 34.5
Indifferent 26 13.3 14.7 49.2
Frequent 43 21.9 24.3 73.4
Very frequent 47 24.0 26.6 100.0
Total 177 90.3 100.0
Missing System 19 9.7
Total 196 100.0
Frequency of internet use in professional life
a
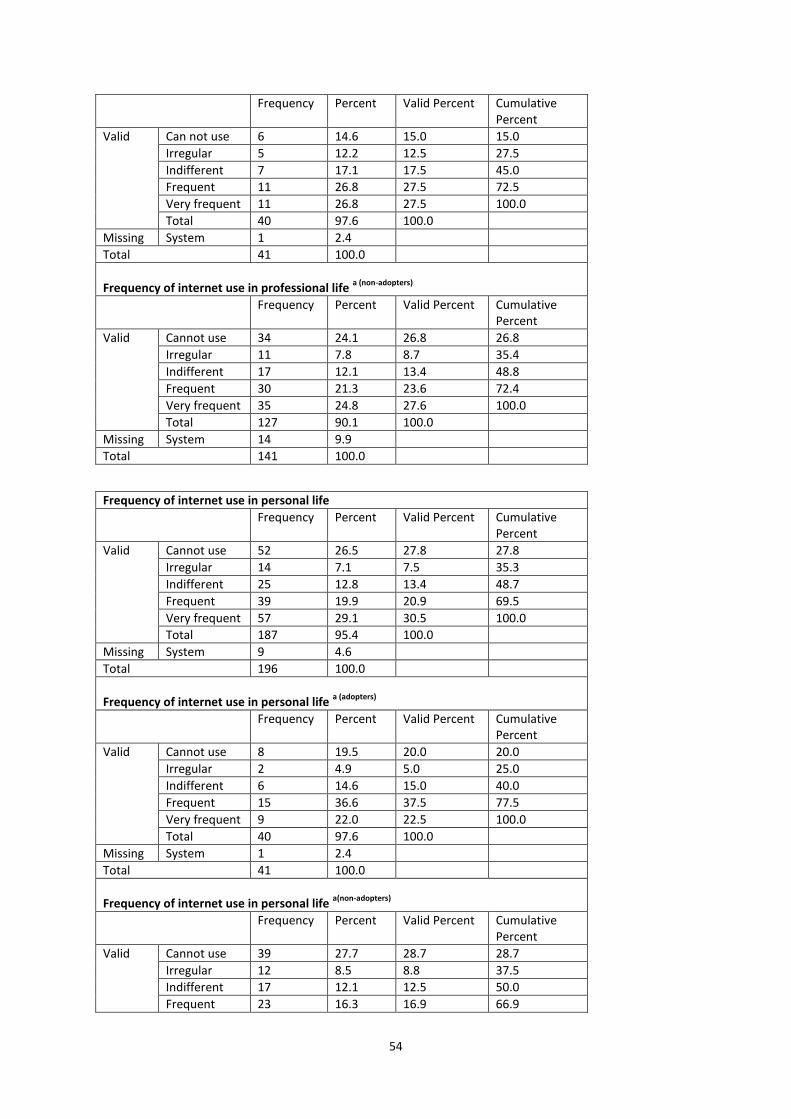
54
Frequency Percent Valid Percent Cumulative Percent
Valid Can not use 6 14.6 15.0 15.0
Irregular 5 12.2 12.5 27.5
Indifferent 7 17.1 17.5 45.0
Frequent 11 26.8 27.5 72.5
Very frequent 11 26.8 27.5 100.0
Total 40 97.6 100.0
Missing System 1 2.4
Total 41 100.0
Frequency of internet use in professional life
a (non-adopters)
Frequency Percent Valid Percent Cumulative Percent
Valid Cannot use 34 24.1 26.8 26.8
Irregular 11 7.8 8.7 35.4
Indifferent 17 12.1 13.4 48.8
Frequent 30 21.3 23.6 72.4
Very frequent 35 24.8 27.6 100.0
Total 127 90.1 100.0
Missing System 14 9.9
Total 141 100.0
Frequency of internet use in personal life
Frequency Percent Valid Percent Cumulative Percent
Valid Cannot use 52 26.5 27.8 27.8
Irregular 14 7.1 7.5 35.3
Indifferent 25 12.8 13.4 48.7
Frequent 39 19.9 20.9 69.5
Very frequent 57 29.1 30.5 100.0
Total 187 95.4 100.0
Missing System 9 4.6
Total 196 100.0
Frequency of internet use in personal life
a (adopters)
Frequency Percent Valid Percent Cumulative Percent
Valid Cannot use 8 19.5 20.0 20.0
Irregular 2 4.9 5.0 25.0
Indifferent 6 14.6 15.0 40.0
Frequent 15 36.6 37.5 77.5
Very frequent 9 22.0 22.5 100.0
Total 40 97.6 100.0
Missing System 1 2.4
Total 41 100.0
Frequency of internet use in personal life
a(non-adopters)
Frequency Percent Valid Percent Cumulative Percent
Valid Cannot use 39 27.7 28.7 28.7
Irregular 12 8.5 8.8 37.5
Indifferent 17 12.1 12.5 50.0
Frequent 23 16.3 16.9 66.9
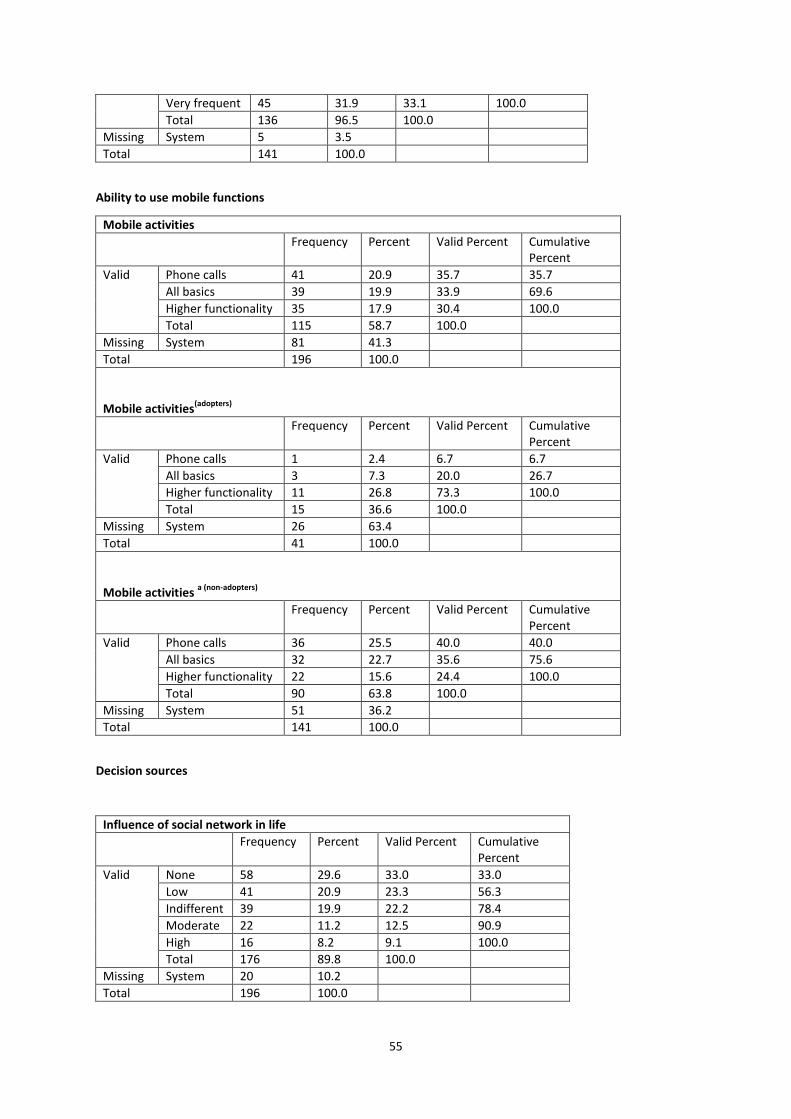
55
Very frequent 45 31.9 33.1 100.0
Total 136 96.5 100.0
Missing System 5 3.5
Total 141 100.0
Ability to use mobile functions
Mobile activities
Frequency Percent Valid Percent Cumulative Percent
Valid Phone calls 41 20.9 35.7 35.7
All basics 39 19.9 33.9 69.6
Higher functionality 35 17.9 30.4 100.0
Total 115 58.7 100.0
Missing System 81 41.3
Total 196 100.0
Mobile activities
(adopters)
Frequency Percent Valid Percent Cumulative Percent
Valid Phone calls 1 2.4 6.7 6.7
All basics 3 7.3 20.0 26.7
Higher functionality 11 26.8 73.3 100.0
Total 15 36.6 100.0
Missing System 26 63.4
Total 41 100.0
Mobile activities
a (non-adopters)
Frequency Percent Valid Percent Cumulative Percent
Valid Phone calls 36 25.5 40.0 40.0
All basics 32 22.7 35.6 75.6
Higher functionality 22 15.6 24.4 100.0
Total 90 63.8 100.0
Missing System 51 36.2
Total 141 100.0
Decision sources
Influence of social network in life
Frequency Percent Valid Percent Cumulative Percent
Valid None 58 29.6 33.0 33.0
Low 41 20.9 23.3 56.3
Indifferent 39 19.9 22.2 78.4
Moderate 22 11.2 12.5 90.9
High 16 8.2 9.1 100.0
Total 176 89.8 100.0
Missing System 20 10.2
Total 196 100.0
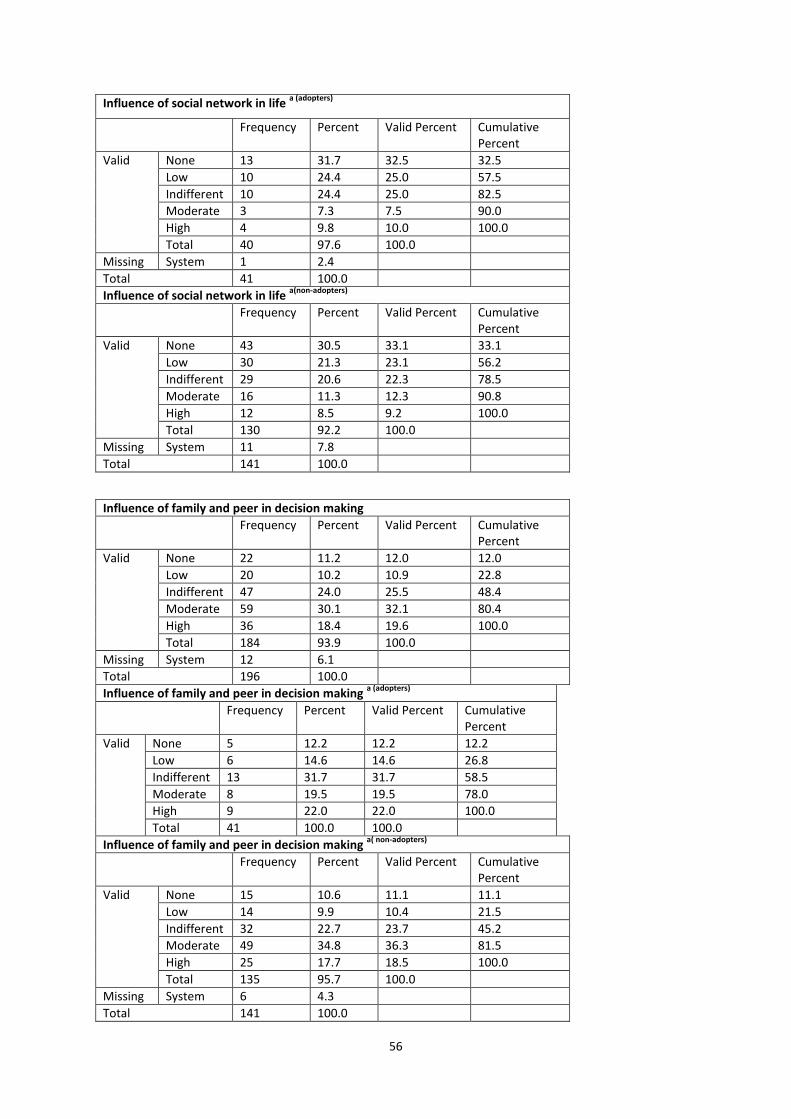
56
Influence of social network in life a (adopters)
Frequency Percent Valid Percent Cumulative Percent
Valid None 13 31.7 32.5 32.5
Low 10 24.4 25.0 57.5
Indifferent 10 24.4 25.0 82.5
Moderate 3 7.3 7.5 90.0
High 4 9.8 10.0 100.0
Total 40 97.6 100.0
Missing System 1 2.4
Total 41 100.0
Influence of social network in life a(non-adopters)
Frequency Percent Valid Percent Cumulative Percent
Valid None 43 30.5 33.1 33.1
Low 30 21.3 23.1 56.2
Indifferent 29 20.6 22.3 78.5
Moderate 16 11.3 12.3 90.8
High 12 8.5 9.2 100.0
Total 130 92.2 100.0
Missing System 11 7.8
Total 141 100.0
Influence of family and peer in decision making
Frequency Percent Valid Percent Cumulative Percent
Valid None 22 11.2 12.0 12.0
Low 20 10.2 10.9 22.8
Indifferent 47 24.0 25.5 48.4
Moderate 59 30.1 32.1 80.4
High 36 18.4 19.6 100.0
Total 184 93.9 100.0
Missing System 12 6.1
Total 196 100.0
Influence of family and peer in decision making a (adopters)
Frequency Percent Valid Percent Cumulative Percent
Valid None 5 12.2 12.2 12.2
Low 6 14.6 14.6 26.8
Indifferent 13 31.7 31.7 58.5
Moderate 8 19.5 19.5 78.0
High 9 22.0 22.0 100.0
Total 41 100.0 100.0
Influence of family and peer in decision making a( non-adopters)
Frequency Percent Valid Percent Cumulative Percent
Valid None 15 10.6 11.1 11.1
Low 14 9.9 10.4 21.5
Indifferent 32 22.7 23.7 45.2
Moderate 49 34.8 36.3 81.5
High 25 17.7 18.5 100.0
Total 135 95.7 100.0
Missing System 6 4.3
Total 141 100.0
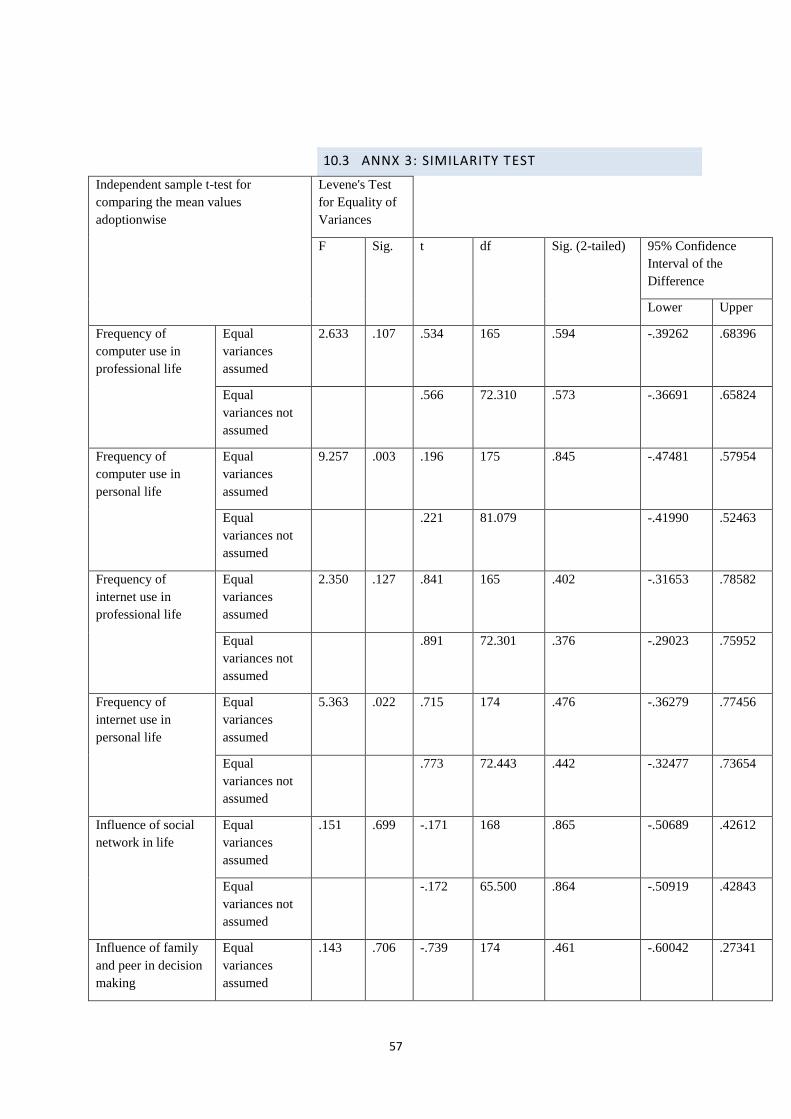
57
ANNX 3: SIMILARITY TEST 10.3
Independent sample t-test for
comparing the mean values
adoptionwise
Levene's Test
for Equality of
Variances
F Sig. t df Sig. (2-tailed) 95% Confidence
Interval of the
Difference
Lower Upper
Frequency of
computer use in
professional life
Equal
variances
assumed
2.633 .107 .534 165 .594 -.39262 .68396
Equal
variances not
assumed
.566 72.310 .573 -.36691 .65824
Frequency of
computer use in
personal life
Equal
variances
assumed
9.257 .003 .196 175 .845 -.47481 .57954
Equal
variances not
assumed
.221 81.079 .826 -.41990 .52463
Frequency of
internet use in
professional life
Equal
variances
assumed
2.350 .127 .841 165 .402 -.31653 .78582
Equal
variances not
assumed
.891 72.301 .376 -.29023 .75952
Frequency of
internet use in
personal life
Equal
variances
assumed
5.363 .022 .715 174 .476 -.36279 .77456
Equal
variances not
assumed
.773 72.443 .442 -.32477 .73654
Influence of social
network in life
Equal
variances
assumed
.151 .699 -.171 168 .865 -.50689 .42612
Equal
variances not
assumed
-.172 65.500 .864 -.50919 .42843
Influence of family
and peer in decision
making
Equal
variances
assumed
.143 .706 -.739 174 .461 -.60042 .27341
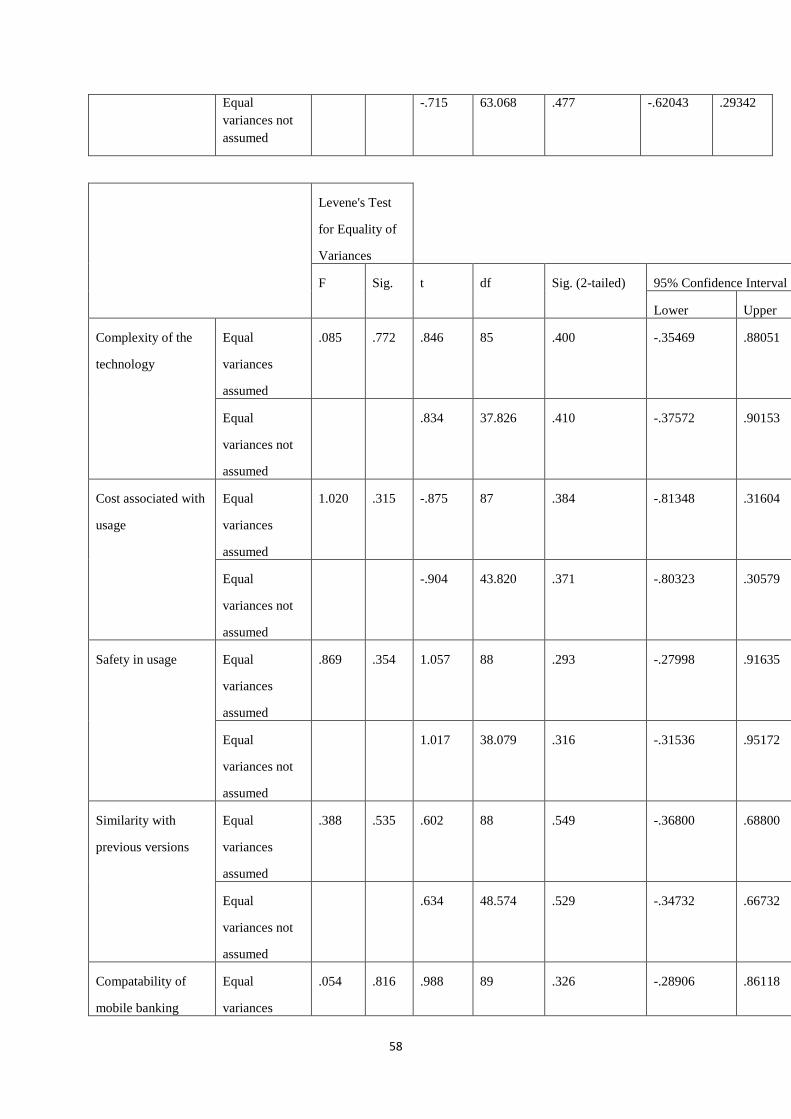
58
Equal
variances not
assumed
-.715 63.068 .477 -.62043 .29342
Levene's Test
for Equality of
Variances
F Sig. t df Sig. (2-tailed) 95% Confidence Interval of the Difference
Lower Upper
Complexity of the
technology
Equal
variances
assumed
.085 .772 .846 85 .400 -.35469 .88051
Equal
variances not
assumed
.834 37.826 .410 -.37572 .90153
Cost associated with
usage
Equal
variances
assumed
1.020 .315 -.875 87 .384 -.81348 .31604
Equal
variances not
assumed
-.904 43.820 .371 -.80323 .30579
Safety in usage Equal
variances
assumed
.869 .354 1.057 88 .293 -.27998 .91635
Equal
variances not
assumed
1.017 38.079 .316 -.31536 .95172
Similarity with
previous versions
Equal
variances
assumed
.388 .535 .602 88 .549 -.36800 .68800
Equal
variances not
assumed
.634 48.574 .529 -.34732 .66732
Compatability of
mobile banking
Equal
variances
.054 .816 .988 89 .326 -.28906 .86118
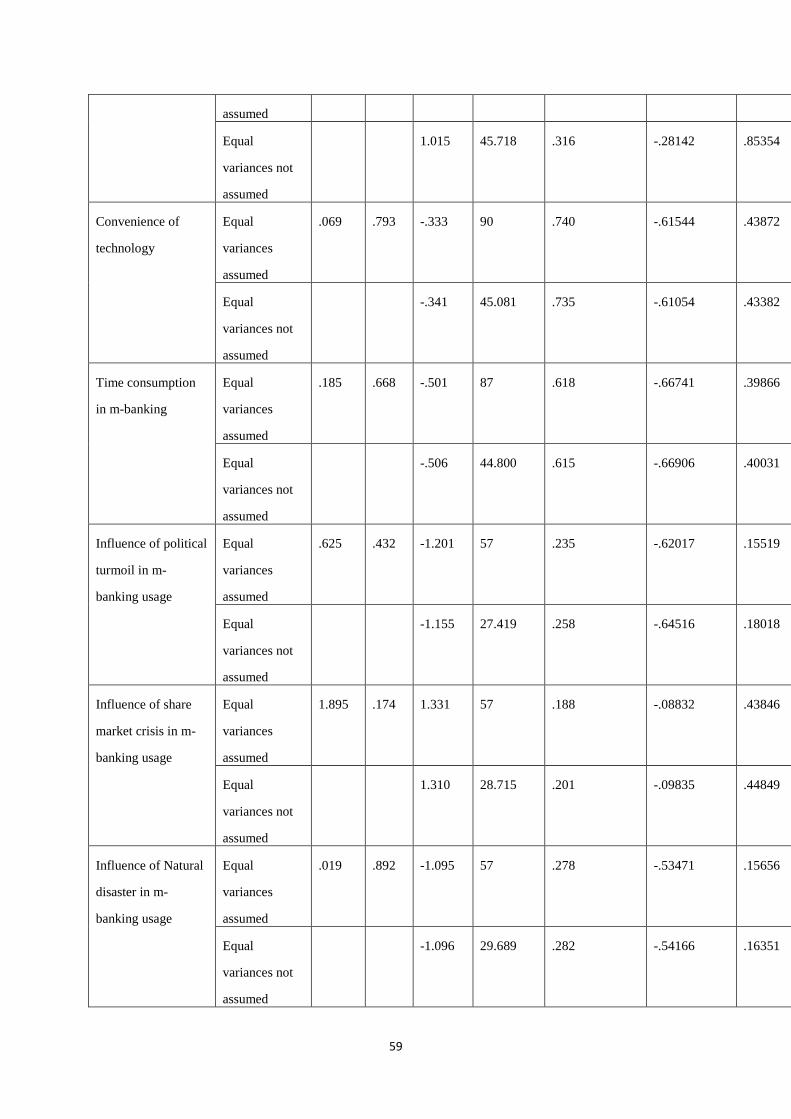
59
assumed
Equal
variances not
assumed
1.015 45.718 .316 -.28142 .85354
Convenience of
technology
Equal
variances
assumed
.069 .793 -.333 90 .740 -.61544 .43872
Equal
variances not
assumed
-.341 45.081 .735 -.61054 .43382
Time consumption
in m-banking
Equal
variances
assumed
.185 .668 -.501 87 .618 -.66741 .39866
Equal
variances not
assumed
-.506 44.800 .615 -.66906 .40031
Influence of political
turmoil in m-
banking usage
Equal
variances
assumed
.625 .432 -1.201 57 .235 -.62017 .15519
Equal
variances not
assumed
-1.155 27.419 .258 -.64516 .18018
Influence of share
market crisis in m-
banking usage
Equal
variances
assumed
1.895 .174 1.331 57 .188 -.08832 .43846
Equal
variances not
assumed
1.310 28.715 .201 -.09835 .44849
Influence of Natural
disaster in m-
banking usage
Equal
variances
assumed
.019 .892 -1.095 57 .278 -.53471 .15656
Equal
variances not
assumed
-1.096 29.689 .282 -.54166 .16351
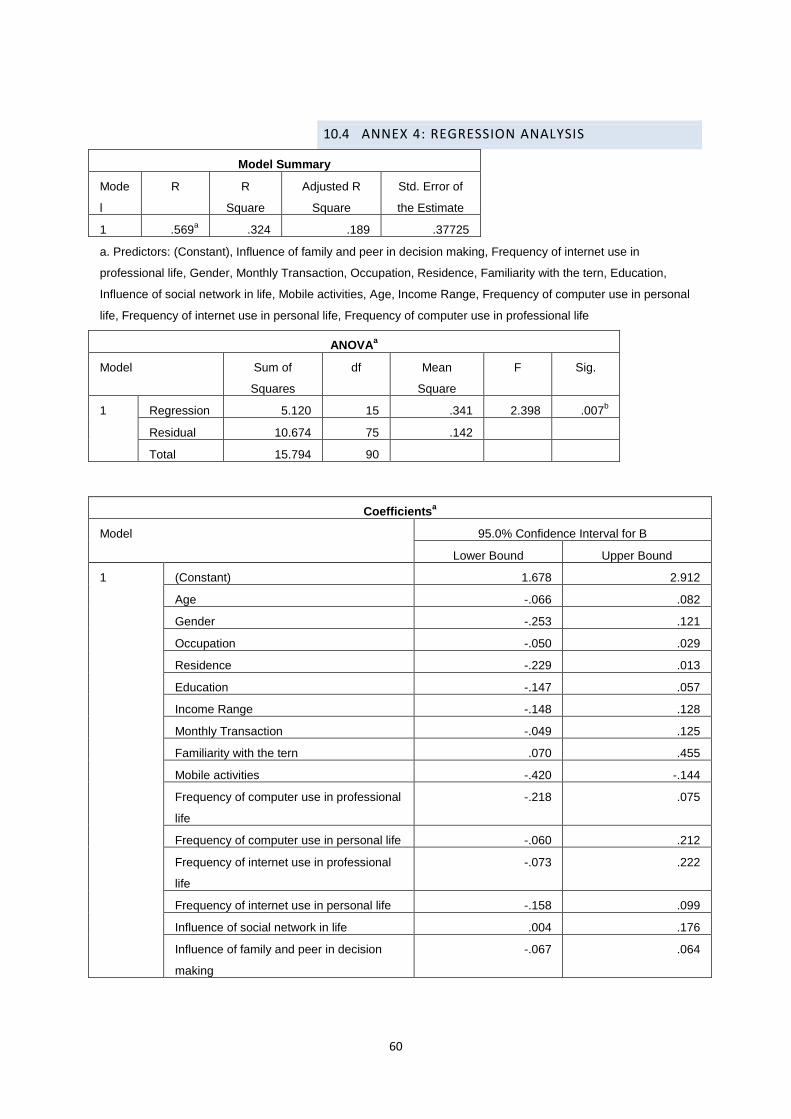
60
ANNEX 4: REGRESSION ANALYSIS 10.4
Model Summary
Mode
l
R R
Square
Adjusted R
Square
Std. Error of
the Estimate
1 .569a .324 .189 .37725
a. Predictors: (Constant), Influence of family and peer in decision making, Frequency of internet use in
professional life, Gender, Monthly Transaction, Occupation, Residence, Familiarity with the tern, Education,
Influence of social network in life, Mobile activities, Age, Income Range, Frequency of computer use in personal
life, Frequency of internet use in personal life, Frequency of computer use in professional life
ANOVAa
Model Sum of
Squares
df Mean
Square
F Sig.
1 Regression 5.120 15 .341 2.398 .007b
Residual 10.674 75 .142
Total 15.794 90
Coefficientsa
Model 95.0% Confidence Interval for B
Lower Bound Upper Bound
1 (Constant) 1.678 2.912
Age -.066 .082
Gender -.253 .121
Occupation -.050 .029
Residence -.229 .013
Education -.147 .057
Income Range -.148 .128
Monthly Transaction -.049 .125
Familiarity with the tern .070 .455
Mobile activities -.420 -.144
Frequency of computer use in professional
life
-.218 .075
Frequency of computer use in personal life -.060 .212
Frequency of internet use in professional
life
-.073 .222
Frequency of internet use in personal life -.158 .099
Influence of social network in life .004 .176
Influence of family and peer in decision
making
-.067 .064
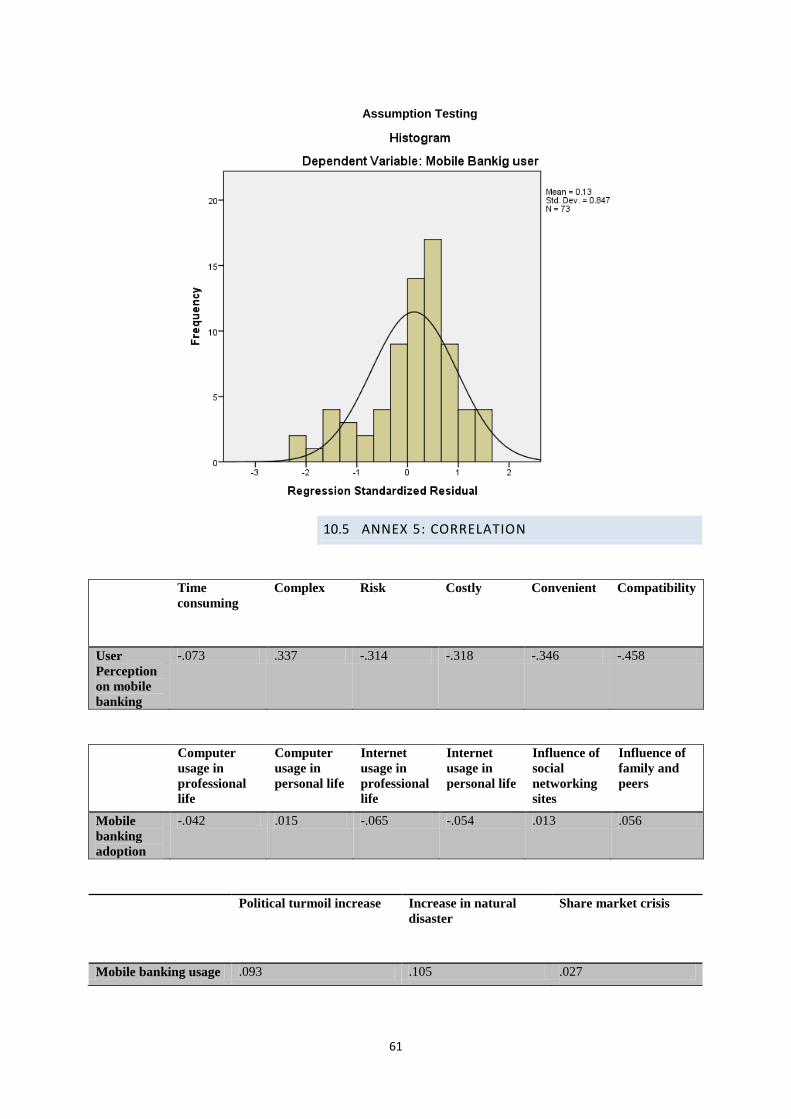
61
Assumption Testing
ANNEX 5: CORRELATION 10.5
Time
consuming
Complex Risk Costly Convenient Compatibility
User
Perception
on mobile
banking
-.073 .337 -.314 -.318 -.346 -.458
Computer
usage in
professional
life
Computer
usage in
personal life
Internet
usage in
professional
life
Internet
usage in
personal life
Influence of
social
networking
sites
Influence of
family and
peers
Mobile
banking
adoption
-.042 .015 -.065 -.054 .013 .056
Political turmoil increase Increase in natural
disaster
Share market crisis
Mobile banking usage .093 .105 .027
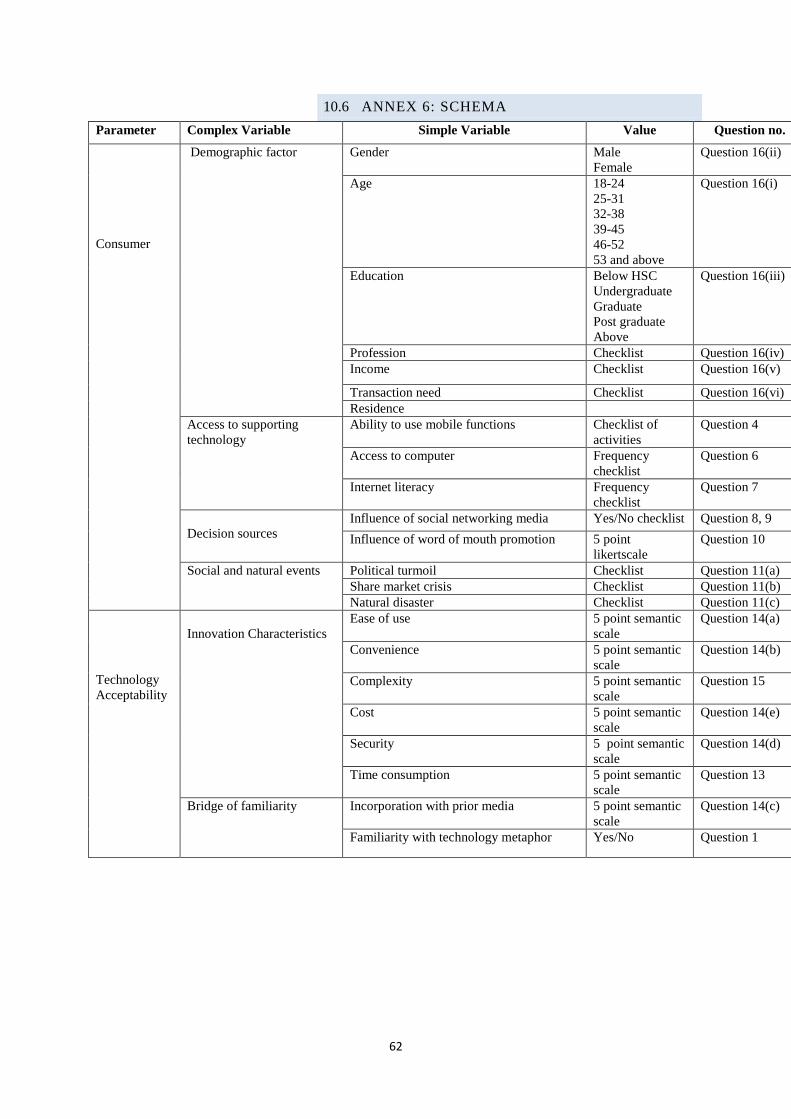
62
ANNEX 6: SCHEMA 10.6
Parameter Complex Variable Simple Variable Value Question no.
Consumer
Demographic factor Gender Male
Female
Question 16(ii)
Age 18-24
25-31
32-38
39-45
46-52
53 and above
Question 16(i)
Education Below HSC
Undergraduate
Graduate
Post graduate
Above
Question 16(iii)
Profession Checklist Question 16(iv)
Income Checklist Question 16(v)
Transaction need Checklist Question 16(vi) Question 16(iii)
Residence
Access to supporting
technology
Ability to use mobile functions Checklist of
activities
Question 4
Access to computer Frequency
checklist
Question 6
Internet literacy Frequency
checklist
Question 7
Decision sources
Influence of social networking media Yes/No checklist Question 8, 9
Influence of word of mouth promotion 5 point
likertscale
Question 10
Social and natural events Political turmoil Checklist Question 11(a)
Share market crisis Checklist Question 11(b)
Natural disaster Checklist Question 11(c)
Technology
Acceptability
Innovation Characteristics
Ease of use 5 point semantic
scale
Question 14(a)
Convenience 5 point semantic
scale
Question 14(b)
Complexity 5 point semantic
scale
Question 15
Cost 5 point semantic
scale
Question 14(e)
Security 5 point semantic
scale
Question 14(d)
Time consumption 5 point semantic
scale
Question 13
Bridge of familiarity Incorporation with prior media 5 point semantic
scale
Question 14(c)
Familiarity with technology metaphor Yes/No Question 1
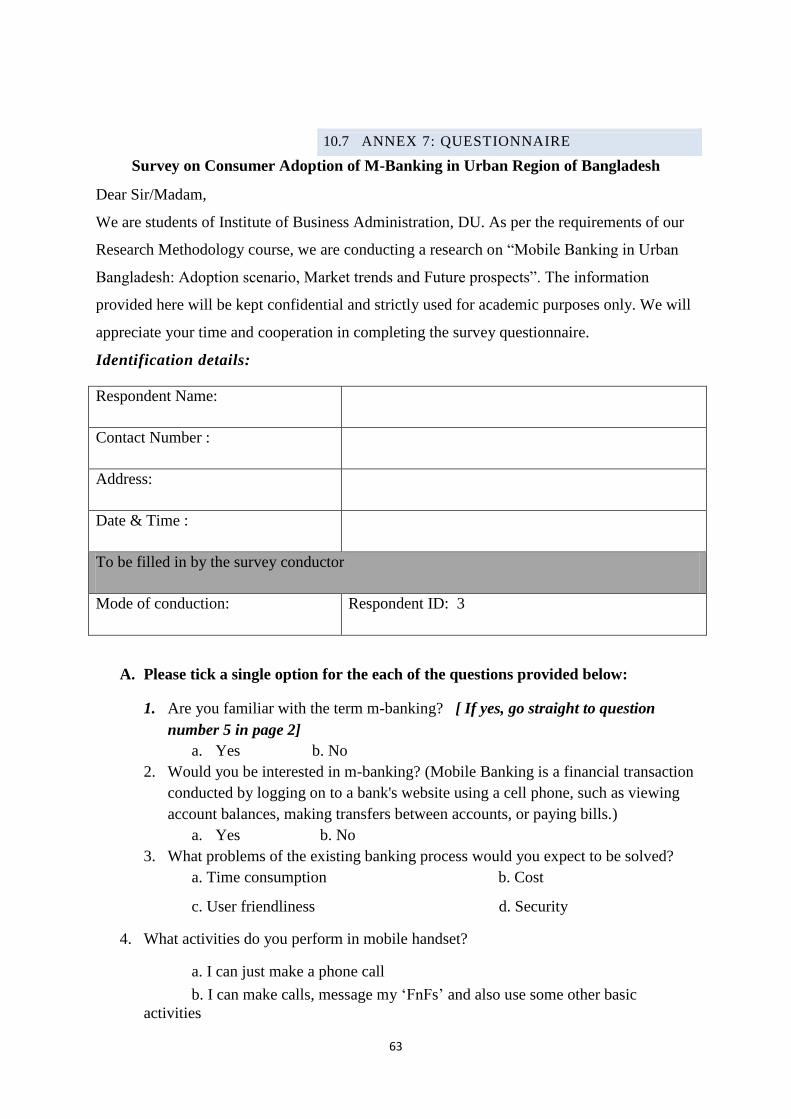
63
ANNEX 7: QUESTIONNAIRE 10.7
Survey on Consumer Adoption of M-Banking in Urban Region of Bangladesh
Dear Sir/Madam,
We are students of Institute of Business Administration, DU. As per the requirements of our
Research Methodology course, we are conducting a research on “Mobile Banking in Urban
Bangladesh: Adoption scenario, Market trends and Future prospects”. The information
provided here will be kept confidential and strictly used for academic purposes only. We will
appreciate your time and cooperation in completing the survey questionnaire.
Identification details:
Respondent Name:
Contact Number :
Address:
Date & Time :
To be filled in by the survey conductor
Mode of conduction: Respondent ID: 3
A. Please tick a single option for the each of the questions provided below:
1. Are you familiar with the term m-banking? [ If yes, go straight to question
number 5 in page 2]
a. Yes b. No
2. Would you be interested in m-banking? (Mobile Banking is a financial transaction
conducted by logging on to a bank's website using a cell phone, such as viewing
account balances, making transfers between accounts, or paying bills.)
a. Yes b. No
3. What problems of the existing banking process would you expect to be solved?
a. Time consumption b. Cost
c. User friendliness d. Security
4. What activities do you perform in mobile handset?
a. I can just make a phone call
b. I can make calls, message my „FnFs‟ and also use some other basic
activities
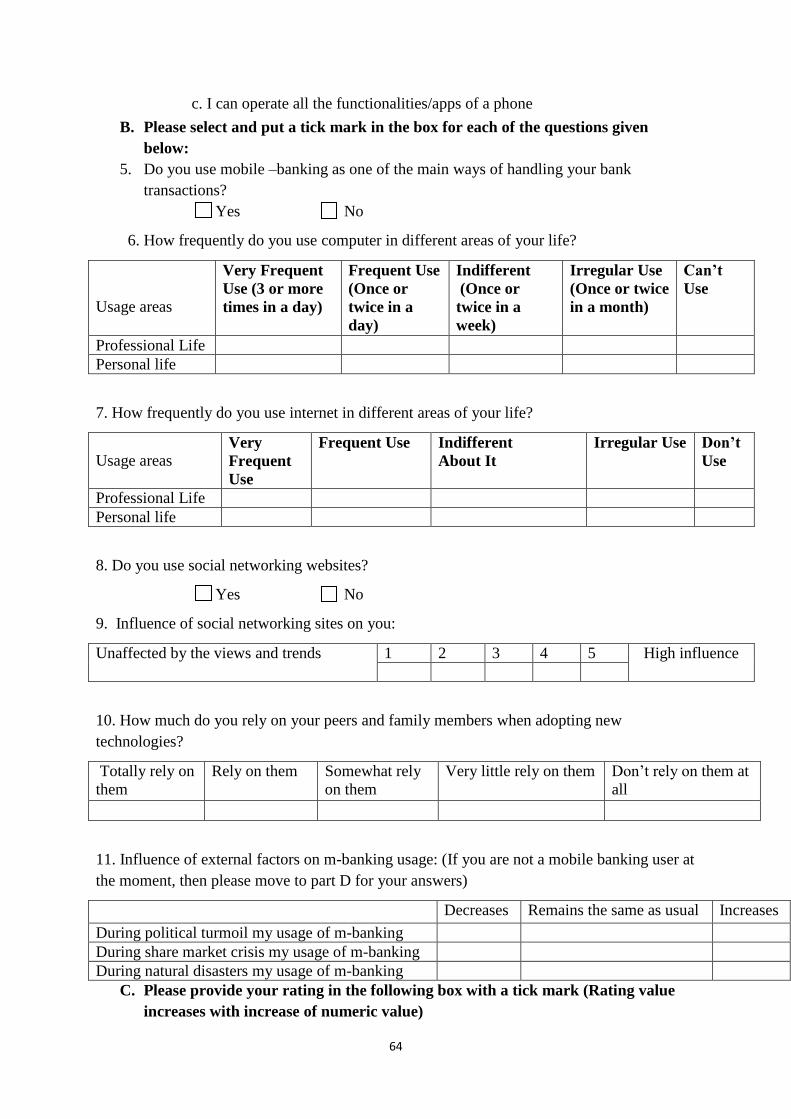
64
c. I can operate all the functionalities/apps of a phone
B. Please select and put a tick mark in the box for each of the questions given
below:
5. Do you use mobile –banking as one of the main ways of handling your bank
transactions?
Yes No
6. How frequently do you use computer in different areas of your life?
Usage areas
Very Frequent
Use (3 or more
times in a day)
Frequent Use
(Once or
twice in a
day)
Indifferent
(Once or
twice in a
week)
Irregular Use
(Once or twice
in a month)
Can’t
Use
Professional Life
Personal life
7. How frequently do you use internet in different areas of your life?
Usage areas Very
Frequent
Use
Frequent Use Indifferent
About It
Irregular Use
Don’t
Use
Professional Life
Personal life
8. Do you use social networking websites?
Yes No
9. Influence of social networking sites on you:
Unaffected by the views and trends 1 2 3 4 5 High influence
10. How much do you rely on your peers and family members when adopting new
technologies?
Totally rely on
them
Rely on them Somewhat rely
on them
Very little rely on them Don‟t rely on them at
all
11. Influence of external factors on m-banking usage: (If you are not a mobile banking user at
the moment, then please move to part D for your answers)
Decreases Remains the same as usual Increases
During political turmoil my usage of m-banking
During share market crisis my usage of m-banking
During natural disasters my usage of m-banking
C. Please provide your rating in the following box with a tick mark (Rating value
increases with increase of numeric value)
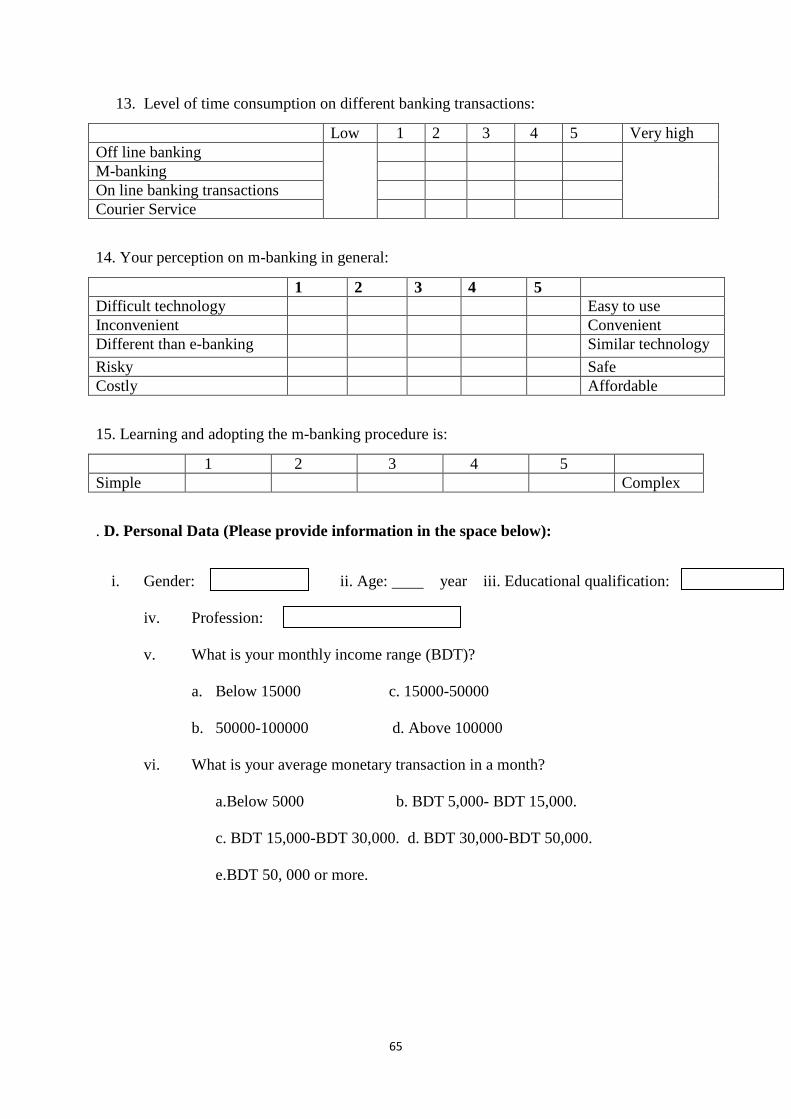
65
13. Level of time consumption on different banking transactions:
Low 1 2 3 4 5 Very high
Off line banking
M-banking
On line banking transactions
Courier Service
14. Your perception on m-banking in general:
1 2 3 4 5
Difficult technology Easy to use
Inconvenient Convenient
Different than e-banking Similar technology
Risky Safe
Costly Affordable
15. Learning and adopting the m-banking procedure is:
1 2 3 4 5
Simple Complex
. D. Personal Data (Please provide information in the space below):
i. Gender: I ii. Age: year iii. Educational qualification:
iv. Profession:
v. What is your monthly income range (BDT)?
a. Below 15000 c. 15000-50000
b. 50000-100000 d. Above 100000
vi. What is your average monetary transaction in a month?
a.Below 5000 b. BDT 5,000- BDT 15,000.
c. BDT 15,000-BDT 30,000. d. BDT 30,000-BDT 50,000.
e.BDT 50, 000 or more.
1 | P a g e
ANNEX 8: KII FINDINGS 10.8
1. Name of Interviewee : Mr. Mahbub Jeshan
2. Organization – bKash limited ( A BRAC Bank Company )
3. Designation – Manager, Trade Marketing , Sales and Distribution
4. Contact- 01720812527
Introduction to A New System :
To be straight forward, bKash is growing rapidly in Bangladesh, a country with 95 million
mobile phones as an unique medium for money transactions and deposit which will not
develop in developed countries in near future. Fundamentally bKash was designed for the
rural people to assure greater financial inclusion in their life. BKash oversees a network of
60,000 agents across the country who let people connect to its service like mom-and-pop
ATMs. In this way it gets around the overhead expenses that a traditional bank would have to
pay.
“So, a merchant who lives far from a bank can use his or her mobile phone to send virtual
money and go to a local agent to receive money. “- Simple and Convenient for any person
Other than its technical perfection , bKash ensures four core values to the consumer of bKash
M-Banking. They are- 1. Fast Service 2. Affordability 3. Security 4. Convenience. Even
bKash has options for foreign remittance transfer with the lowest fees/ service charge. bKash
has diversified in adding many values to its 60,000 agents in the nation.
Mobile Banking Adoption Scenario:
In rural market there is lack of adequate bank branches as well as lack of education/
awareness of mass people regarding accessing the formal banking channel. They find it
complicated & bureaucratic to avail traditional banking service. On the hand “M-Banking”
process is learned through the Word of Mouth, Popularity among referent people and opinion
leaders . These actors in rural society channel the advises , functionality and trust to others.
If we look into the city, we can also find its adoption scenario getting brighter everyday but
its initial TG was not urban population. As a result, there was less focus to aggressive
push/pull for bKash Limited. Nonetheless, urban population seems brighter with the value of
convenience and fast Service to people of all ages and career. Specially, the youth and the
SMEs might show a brilliant scenario of adopting bKash services in future.
Factors Contributing to the adoption process of M-Banking :
We can begin with the lack of availability of formal banking service all over the country
with most pressing reason for m-banking to flourish . As there is no single entity who
has presence in all 64 districts & in all 600 Thanas , there was always a mighty market
need to financial service which reaches the widest population. Here came the scenario of
2
mobile banking , where mobile penetration is in every level of upzilla, unions and all the
600 thanas.
Another contributing factor goes back to the lack of proper education of low income &
lower-middle class people to avail formal banking service. They are yet to get connected
with the system of traditional banking. And now with the presence of mobile banking, it
is tough for traditional banking services to make their presence as widely as bKash or m-
banking has made till now.
Then next reason is the high mobile penetration rate. As per Bangladesh Bank data only
16% Bangladeshi has bank account whereas mobile penetration rate is 60% . People
found it comfortable to do transactions through mobile than bank branches. As mobile
phone becomes a part of daily life hence majority people can adopt MFS operating
procedure very easily.
Lastly, but most importantly, flexibility and technological superiority of mobile financial
services is the factor that will continue to positively influence the m-banking scenario
with time and generations . Such an example of flexibility can be - Traditional Banking
services are only available up to 10 AM – 4 PM, 5 working days only. Whereas mobile
financial services can be availed 24 hours 7 days a week (24/7) all over the country. This
also is easy, secured, fast, and instant.
Obstacles for bKash or m-banking situation of Bangladesh :
One thing that comes with any product or service is proper awareness of its functionality and
presence. Consequently, lack of awareness of customers/ potential customers is the greatest
hurdled face for m-banking to increase its market share or the whole market. Non-
compliance issues are also major issue for urban population . The traditional banking services
are well established and aggressive in terms of promoting themselves. Amidst that, a proper
gourd, joint ventures and collaborative effort is needed to enhance the field of m-banking.If
anyone comes to join any bank which is providing the m-banking services they will be able to
understand about the unhealthy competition among companies and their policies. This is
discouraging new-entrants as well as present ones to diversify. Currently our and any bank‟s
greatest fear is fraudulent activities which is another obstacle which prevails from the
initiation of banking . If I need to give one solution than it would be increasing the market ,
which basically means increasing consumers of all kind under this umbrella as well as
increasing the collaborative effort to establish m-banking as regular banking method in
Bangladesh.
Market Competition and bKash :
Every organization is trying to compete with their own key strengths. Everyone is trying to
set up their sales & distribution channel, technology platform and partnership with mobile
network operators. As this is actually the foundation level for all mobile financial services. If
they are successful in it they need a great supple chain to include every district in
Bangladesh. Some of the new competitors or potential competitors are actually thinking of
niche market too. For now bKahs has created strong distribution Channel, state of the art
3
technology (partnership with Visa) and partnership with all major mobile network operators
to generate smooth system within the realm of m-banking.
Essential Checklist for M-banking Improvement:
Firstly, the idea of “e-money” should more wide spread in our country. This will be a
gateway to build trust upon the m-banking system. Not only that, the concept is also new
which says that more trial based activity or opportunity should be given to the consumers
before they switch to m-banking. The next important step to help m-banking is to develop the
whole eco-system of “e-money” as a alternative of physical cash. Unless or until banks and
financial institutes do that, we won‟t be able to see a sustainable m-banking system that
encompasses the majority. The first step for realizing any goal for now would need us( the m-
banking providers ) to introduce more value added services like “e-ticketing,”, “mobile top
up” , “foreign remittance disbursement” . They will be the extension of our core services. It
will primarily hold the initial market as well as build enough faith in others to bring them
under the blessing of Mobile Banking.