
REPORT ON TREND AND PROGRESS OF BANKING IN ...
239
Report on Trend and Progress of Banking in India for the year ended June 30, 2001 submitted to the Central Government in terms of Section 36(2) of the Banking Regulation Act, 1949 REPORT ON TREND AND PROGRESS OF BANKING IN INDIA 2000-01 RESERVE BANK OF INDIA
-
Upload
khangminh22 -
Category
Documents
-
view
1 -
download
0
Transcript of REPORT ON TREND AND PROGRESS OF BANKING IN ...

Report on Trend and Progress of Banking in India for the year ended
June 30, 2001 submitted to the Central Government in terms of
Section 36(2) of the Banking Regulation Act, 1949
REPORT ON TREND AND PROGRESSOF BANKING IN INDIA 2000-01
RESERVE BANK OF INDIA

Price: In India – Rs. 350 (inclusive of postage)Abroad – US $ 70 (inclusive of Registered Air Mail Book-Post charges)
Published by Deba Prasad Rath for the Reserve Bank of India, Mumbai 400 001 and printed by him atM/s. Alco Corporation, A-2/331, Shah & Nahar Industrial Estate, Lower Parel (W), Mumbai 400 013.

�»£�¸¸«¸ PHONE : 266-0868 / 266-1872 / 266-2644. û¾ÅƬ¸ FAX : 266-1784, �½¥¸½Æ¬¸ TELEX : 011-2318 / 011-2455

v
Sr. No. Particulars Page No.
Chapter I: Banking Developments and Perspectives
1 Policy Environment ................................................................................... 1
2 Commercial Banking System - Supervisory Initiatives during the Year ..... 6
3 Perspectives .............................................................................................. 21
Chapter II: Developments in Commercial Banking
1 Reserve Bank Standing Liquidity Facilities ............................................. 33
2 Assets and Liabilities Structure of Scheduled Commercial Banks ......... 37
3 Financial Performance of Scheduled Commercial Banks ........................ 48
4 Non-Performing Assets ............................................................................. 55
5 Capital to Risk-Weighted Assets Ratio (CRAR) ......................................... 60
6 Equity Capital and Subordinated Debt ...................................................... 61
7 Indian Banks’ Branches Abroad ................................................................ 63
8 Foreign Banks’ Branches in India ............................................................ 63
9 Regional Rural Banks ............................................................................... 63
10 Local Area Banks ...................................................................................... 65
11 Regional Spread of Banking ...................................................................... 65
12 Interest Rates of Scheduled Commercial Banks ...................................... 66
13 Diversification in Banks’ Operations ....................................................... 68
14 Developments in Retail Banking .............................................................. 69
15 Priority Sector Lending ............................................................................. 69
16 Supervisory Developments ........................................................................ 71
17 Frauds/Robberies ...................................................................................... 73
Chapter III: Developments in Co-operative Banking
1 Progress of the Co-operative banks .......................................................... 75
2 Health Status of Rural Co-operatives........................................................ 89
3 NABARD and its Role in Rural Credit ........................................................ 91
Chapter IV: Financial Institutions
1 Policy Developments Relating to Select All India Financial Institutions ...... 97
2 Financial Assets of Financial Institutions ............................................... 112
3 Term-Lending and Investment Institutions ............................................. 112
4 Reserve Bank Assistance to Financial Institutions................................. 117
5 Mutual Funds ............................................................................................ 118
Contents

vi
Chapter V: Non-Banking Financial Companies
1 Registration of NBFCs ............................................................................... 123
2 Supervision of NBFCs ................................................................................ 125
3 Policy Developments Relating to NBFCs ................................................... 126
4 Implementation of Recommendations of Task Force on NBFCs (1998) ......... 130
5 Business of the NBFC Sector .................................................................... 131
6 Region-wise Composition of Deposits held by NBFCs ............................... 132
7 Interest Rate and Maturity Pattern of Deposits with NBFCs .................... 133
8 Asset Profile of NBFCs ............................................................................... 133
9 Distribution of Assets of NBFCs according to Activity .............................. 135
10 Analysis of Borrowings by NBFCs .............................................................. 135
11 Net Owned Funds of NBFCs ....................................................................... 135
12 Income Expenditure Statement of NBFCs ................................................ 136
13 Capital Adequacy Ratio ............................................................................. 136
14 Other Developments ................................................................................. 136
List of Boxes
Box No. Particulars Page No.
I.1 Major Policy Measures Announced in the Mid-term
Review of Monetary and Credit Policy for the year 2001-02 ..................... 4
I.2 The New Basel Capital Accord .................................................................. 22
I.3 Corporate Debt Restructuring ................................................................... 25
I.4 Macroprudential Indicators ....................................................................... 30
II.1 Mergers and Acquisitions in Banking: International Experiences
and Indian Evidence.................................................................................. 51
II.2 Measurement of Operational Risk ............................................................ 62
II.3 Working Group on Internet Banking in India ........................................... 70
II.4 Advisory Group on Banking Supervision .................................................. 71
III.1 Recommendations of the Recent Committees on Co-operative Banks ......... 76
III.2 Urban Co-operative Banks- Recent Regulatory Measures ....................... 77
III.3 Major Differences between UCBs and SCBs in terms of Reserve
Requirements and Credit Deployment ..................................................... 80
III.4 Weak Urban Co-operative Banks .............................................................. 81
IV.1 Norms for Treatment of Restructured Accounts ....................................... 99
IV.2 Co-ordination Issues between Banks and Financial Institutions ........... 104
IV.3 Implementation Status of High Level CommitteeRecommendations on US-64 ..................................................................... 120

vii
IV.4 Corporate Positioning Committee-Unit Trust of India ............................. 122
V.1 Recommendations of the Expert Committee on Nidhis ............................... 129
V.2 Financial Companies Regulation Bill, 2000 ............................................. 130
List of Tables
Table No. Particulars Page No.
I.1 Nationalised Banks whose capitals were subscribed by the
Government of India out of Budget provisions/Banks
whose investments were written down/Banks whose capital
was returned to Government .................................................................... 26
II.1 Bank Group-wise Important Financial Indicators .................................... 34
II.2 Consolidated Balance Sheet of Scheduled Commercial Banks ................ 37
II.3 Consolidated Balance Sheet of Public Sector Banks ................................ 38
II.4 Consolidated Balance Sheet of Private Sector Banks .............................. 39
II.5 Consolidated Balance Sheet of Foreign Banks in India ........................... 40
II.6 Important Banking Indicators - Scheduled Commercial Banks ............... 41
II.7 Scheduled Commercial Banks’ Investments in Non-SLR
Securities Issued by the Non-financial Commercial Sector .................... 43
II.8 Sectoral Deployment of Gross Bank Credit by Major Sectors ................... 45
II.9 Industry-wise Deployment of Gross Bank Credit ...................................... 46
II.10 Lending to Sensitive Sectors .................................................................... 47
II.11 Changes in Share Prices of Banks ........................................................... 48
II.12 Turnover details of Bank Shares .............................................................. 48
II.13 Bank Group-wise Select Indicators of Financial Performance ................. 50
II.14 Off-Balance Sheet exposure of Scheduled Commercial Banks in India... 56
II.15 Gross and Net NPAs of Scheduled Commercial Banks
- Bank Group-wise ..................................................................................... 57
II.16 Classification of Loan Assets of Scheduled Commercial Banks............... 59
II.17 Distribution of Scheduled Commercial Banks by
Ratio of Net NPAs to Net Advances ............................................................ 60
II.18 Bank Group-wise Incremental Gross and Net NPAs ................................. 60
II.19 Bank Group-wise Incremental Ratio of Gross and Net NPAs .................... 61
II.20 Distribution of Scheduled Commercial Banks by CRAR ........................... 61
II.21 Important Banking Indicators of RRBs...................................................... 64
II.22 Purpose-wise Disbursements of Loans and Advances of RRBs ................. 65
II.23 Financial Performance of Regional Rural Banks ...................................... 66
II.24 Classification of Loan Assets of all RRBs .................................................. 67

viii
II.25 Prime Lending Rates and Interest Rates on Deposits
of Scheduled Commercial Banks .............................................................. 67
II.26 Bank Rate, Export Credit Rate and PLR .................................................... 68
III.1 Variations in Major Aggregates of Urban Co-operative Banks ................. 82
III.2 Gross Non-Performing Assets of Urban Co-operative Banks .................... 82
III.3 Composition of Liabilities and Assets of Scheduled Urban
Co-operative Banks ................................................................................... 83
III.4 Financial Performance of Scheduled Urban Co-operative Banks ............. 84
III.5 Composition of Liabilities and Assets of State Co-operative Banks......... 85
III.6 Financial Performance of State Co-operative Banks ............................... 86
III.7 Composition of Liabilities and Assets of Central Co-operative Banks ..... 87
III.8 Financial Performance of Central Co-operative Banks ............................ 88
III.9 Composition of Gross NPAs ....................................................................... 90
III.10 Frequency Distribution of StCBs, CCBs & SCARDBs
According to levels of Gross NPAs ............................................................. 90
III.11 Net Accretion to the Resources of NABARD .............................................. 91
III.12 NABARD’s Credit to State Co-operative Banks, State
Governments and Regional Rural Banks .................................................. 92
III.13 Deposits Mobilised under RIDF ................................................................. 93
III.14 Cumulative Sanctions and Disbursements .............................................. 94
III.15 Purpose-wise Amount Sanctioned under RIDF ......................................... 94
III.16 NABARD’s Interest Rate Structure on Term-Loan Refinance .................. 95
IV.1 Comparative Position of Banks and FIs with respect to Select Regulatory
Parameters ................................................................................................ 105
IV.2 Disbursements of Major Financial Institutions ....................................... 113
IV.3 Financial Performance of Select Financial Institutions .......................... 116
IV.4 Lending Rate Structure of Major Financial Institutions .......................... 117
IV.5 Resources Raised by Major FIs .................................................................. 117
IV.6 Asset Classification of Select Financial Institutions ............................... 118
IV.7 Capital Adequacy Ratio of Select Financial Institutions .......................... 118
IV.8 RBI Assistance to Financial Institutions ................................................. 119
IV.9 Resources Mobilised by Mutual Funds ...................................................... 119
V.1 Non-Banking Financial Entities Regulated by Reserve Bank .................. 125
V.2 Profile of the NBFC Sector ......................................................................... 132
V.3 Activity-wise Profile of Public Deposits of NBFCs ..................................... 133
V.4 Region-wise break-up of Public Deposits held byRegistered and Unregistered NBFCs ......................................................... 134

ix
V.5 Maturity Pattern of Deposits held by NBFCs ............................................. 134
V.6 Distribution of NBFC Deposits According to Rate of Interest ................... 135
V.7 Asset Profile of NBFCs ............................................................................... 136
V.8 Activity-wise Distribution of Asset of NBFCs ............................................ 137
V.9 Classification of Borrowing by NBFCs (excluding RNBCs) ......................... 137
V.10 Net Owned Funds vis-à-vis Public Deposits of NBFCs .............................. 138
V.11 Financial Performances of NBFCs ............................................................ 138
V.12 Distribution of Reporting NBFCs by CRAR ................................................ 139
List of Charts
Chart No. Particulars Page No.
II.1 Scheduled Banking Structure in India ..................................................... 32
II.2 Share of Bank Groups in Total Assets and Net Profit ............................... 33
II.3 Net Profit as percentage of Total Assets - Public Sector Banks ............... 49
II.4 Ratio of Net Profit to Total Assets ............................................................. 49
II.5 Ratio of Interest Income to Total Assets ................................................... 52
II.6 Ratio of Operating Expenses to Total Assets ............................................. 53
II.7 Ratio of Provisions and Contingencies to Total Assets ............................. 54
II.8 Ratio of Spread to Total Assets .................................................................. 54
II.9 Ratio of Off-Balance Sheet Items to Total Assets ..................................... 55
II.10 Bank Group-wise Ratio of Net NPAs to Net Advances ............................... 55
III.1 Organisational Structure of the Co-operative Credit Institutions ........... 75
III.2 Deployment of Priority Sector Advances by UCBs ..................................... 80
IV.1 Organisational Structure of Financial Institutions ................................. 98
IV.2 Share of Banks and Financial Institutions in Financial Assets .............. 113
IV.3 Financial Assistance by All-India Financial Institutions ........................ 113
IV.4(A) Liabilities of Financial Institutions ......................................................... 114
IV.4(B) Assets of Financial Institutions ............................................................... 114
IV.5(A) Sources of Funds ....................................................................................... 115
IV.5(B) Deployment of Funds ................................................................................. 115
V.1 Components of the Non-Banking Financial Sector .................................. 124
V.2 Activity-wise Profile of NBFCs ................................................................... 132
V.3 Region-wise break-up of Public Deposits held by
Registered and Unregistered NBFCs ......................................................... 135
V.4 Distribution of Interest Rate paid on Deposits by NBFCs ......................... 136

x
Annexure
Chronology of Major Policy Developments.................................................................. 141
List of Appendix Tables
Table No. Particulars Page No.
II.1 RBI Accommodation to Scheduled Commercial Banks ............................. 156
II.2 Issue of Certificates of Deposit by Scheduled Commercial Banks ........... 157
II.3 Viability Position of Sick/Weak Industrial Units ..................................... 158
II.4 Region/State-wise Credit-Deposit Ratio and Investment plus
Credit-Deposit Ratio of Scheduled Commercial Banks ............................ 159
II.5(A) Financial Performance of Scheduled Commercial Banks ........................ 160
II.5(B) Financial Performance of Public Sector Banks ........................................ 161
II.5(C) Financial Performance of Nationalised Banks ......................................... 162
II.5(D) Financial Performance of the State Bank Group ...................................... 163
II.5(E) Financial Performance of Old Private Sector Banks ................................ 164II.5(F) Financial Performance of New Private Sector Banks ............................... 165
II.5(G) Financial Performance of Foreign Banks in India ................................... 166
II.6(A) Select Financial Parameters of Public Sector Banks ............................... 167
II.6(B) Gross Profit/Loss as Percentage of Total Assets - Public Sector Banks ... 168
II.6(C) Net Profit/Loss as Percentage of Total Assets - Public Sector Banks ..... 169
II.6(D) Operating and Net Profits before and after Adjustment of Interest
on Recapitalisation Bonds - Nationalised Banks ...................................... 170
II.6(E) Interest Income as Percentage of Total Assets - Public Sector Banks ..... 171
II.6(F) Interest Expended as Percentage of Total Assets - Public Sector Banks .. 172
II.6(G) Net Interest Income (Spread) as Percentage of Total
Assets - Public Sector Banks .................................................................... 173
II.6(H) Provisions and Contingencies as Percentage of Total
Assets - Public Sector Banks .................................................................... 174
II.6(I) Operating Expenses as Percentage of Total Assets - Public Sector Banks ... 175
II.7(A) Select Financial Parameters of Private Sector Banks ............................. 176
II.7(B) Gross Profit/Loss as Percentage of Total Assets - Private Sector Banks ...... 177
II.7(C) Net Profit/ Loss as Percentage of Total Assets - Private Sector Banks ......... 178
II.7(D) Interest Income as Percentage of Total Assets - Private Sector Banks ... 179
II.7(E) Interest Expended as Percentage of Total Assets - Private Sector Banks ..... 180
II.7(F) Net Interest Income (Spread) as Percentage of
Total Assets - Private Sector Banks ......................................................... 181

xi
II.7(G) Provisions and Contingencies as Percentage of
Total Assets - Private Sector Banks ......................................................... 182
II.7(H) Operating Expenses as Percentage of Total Assets -Private Sector Banks ... 183
II.8(A) Select Financial Parameters of Foreign Banks in India .......................... 184
II.8(B) Gross Profit/Loss as Percentage of Total Assets - Foreign Banks in India ... 186
II.8(C) Net Profit/Loss as Percentage of Total Assets - Foreign Banks in India....... 187
II.8(D) Interest Income as Percentage of Total Assets - Foreign Banks in India ..... 188
II.8(E) Interest Expended as Percentage of Total
Assets - Foreign Banks in India ............................................................... 189
II.8(F) Net Interest Income (Spread) as Percentage of Total
Assets - Foreign Banks in India ............................................................... 190
II.8(G) Provisions and Contingencies as Percentage of
Total Assets - Foreign Banks in India ...................................................... 191
II.8(H) Operating Expenses as Percentage of Total
Assets - Foreign Banks in India ............................................................... 192
II.9(A) Non-Performing Assets as percentage ofTotal Assets - Public Sector Banks ........................................................... 193
II.9(B) Non-Performing Assets as percentage of
Advances - Public Sector Banks ................................................................ 194
II.9(C) Non-Performing Assets as percentage of
Total Assets - Private Sector Banks ......................................................... 195
II.9(D) Non-Performing Assets as percentage of
Advances - Private Sector Banks .............................................................. 196
II.9(E) Non-Performing Assets as percentage of Total Assets - Foreign Banks ........ 197
II.9(F) Non-Performing Assets as percentage of Advances - Foreign Banks ....... 198
II.10(A) Sector-wise Non-Performing Assets of Public Sector Banks .................... 199
II.10(B) Sector-wise Non-performing Assets of Private Sector Banks ................... 200
II.11(A) Capital Adequacy Ratio - Public Sector Banks .......................................... 201
II.11(B) Capital Adequacy Ratio - Private Sector Banks ........................................ 202
II.11(C) Capital Adequacy Ratio - Foreign Banks in India ..................................... 203
II.12 Bank Group and Population Group-wise Distribution of
Commercial Bank Branches in India ....................................................... 204
II.13 Region/State/Union Territory-wise Distribution of
Commercial Bank Branches ..................................................................... 205
II.14 Advances to the Priority Sectors by Public Sector Banks ......................... 206
II.15(A) Advances of Public Sector Banks to Agriculture and Weaker Section ..... 207
II.15(B) Non-Performing Assets in Advances to Weaker Section
under Priority Sector - Public Sector Banks ............................................. 208

xii
II.16 Advances to the Priority Sectors by Private Sector Banks ....................... 208
II.17(A) Advances of Private Sector Banks to Agriculture and Weaker Section ... 209
II.17(B) Non-Performing Assets in Advances to Weaker Sections
under Priority Sector - Private Sector Banks ........................................... 210
II.18 Advances to the Priority Sectors by Foreign Banks in India .................... 210
III.1 Progress of Co-operative Credit Movement in India ................................. 211
III.2 Recovery Performance of Rural Co-operative Banks ................................ 212
III.3 State-wise Sanctions and Disbursement under
Rural Infrastructure Development Fund (RIDF) ........................................ 213
III.4 Major Indicators of Financial Performance -
Scheduled Urban Co-operative Banks ...................................................... 214
IV.1(A) Financial Assets of Banks and Financial Institutions ............................. 217
IV.1(B) Total Financial Assets of Financial Institutions-Institution-wise........... 218
IV.2 Financial Assistance Sanctioned and Disbursed by Financial Institutions . 219
IV.3 Composition of Liabilities and Assets of Financial Institutions .............. 220
IV.4 Pattern of Sources and Deployment of Funds of
Term-Lending Institutions ....................................................................... 221
IV.5 Financial performance of IDBI, ICICI and IFCI ......................................... 222
IV.6 Selected Financial Parameters of Financial Institutions ........................ 223
IV.7 Call/Notice Money Market Operations of Financial Institutions ............ 224
IV.8 Resource Mobilisation by Mutual Funds ................................................... 225
In recent years, the banking industry hasbeen undergoing rapid changes, reflecting anumber of underlying developments. The mostsignif icant has been advances incommunication and information technology,which have accelerated and broadened thedissemination of financial information whilelowering the costs of many financial activities.A second key impetus for change has been theincreasing competition among a broad range ofdomestic and foreign institutions in providingbanking and related financial services. Third,financial activity has become larger relative tooverall economic activity in most economies.This has meant that any disruption of thefinancial markets or financial infrastructurehas broader economic ramifications than mighthave been the case previously.
1.2 These developments have manifoldconsequences for the institutional and systemicstructure of the financial sector in general andbanking in particular. Directly issued securitiesare replacing bank deposits as a vehicle forsavings. Markets for risk have emerged in whichexposures to specific market or credit risks canbe bought and sold separately from theunderlying financial assets. The businessprofi le of f inancial institutions is alsoundergoing change. The service traditionallyassociated with ‘banking’ is being offered byinstitutions not normally characterised asbanks, while banks have gradually made foraysinto non-banking activities. Mergers andtakeovers of smaller institutions have led to theemergence of transnational conglomerates,offering services ranging from traditionalcommercial banking to investment banking andinsurance.
1.3 With increasing globalisation and blurringof distinction between different segments offinancial intermediaries, there is a growingrecognition that safeguarding the health of thefinancial system is of paramount importance formaintaining f inancial stabil ity. Notsurprisingly, the financial sector especially thebanking sector in most emerging economies is
passing through a process of change and Indiais no exception. With the banking sector beingthe mainstay of financial intermediation inemerging economies, developing a sound andhealthy banking system through promotion ofprudent financial practices is viewed as a sinequa non for safeguarding financial stability. Thebanking sector accounts for over half of theassets of the financial sector and remainsdominant in India.
1.4 This Chapter provides an overview of thepolicy initiatives undertaken in the bankingsector during the year 2000-01 and a perspectivetowards developing a stable, healthy, robust andefficient banking system.
1. Policy Environment
Monetary and Credit Policy
1.5 The measures announced in the Monetaryand Credit Policy Statement of April 2001continued to focus on strengthening thefinancial system and improving the functioningof the various segments of financial marketsdriven primarily by four objectives:
(i) Deregulation of the operation ofinstitutions subject to appropriateguidelines, within the Reserve Bank’sregulatory ambit so as to enable themto evolve as efficient organisations ina competitive environment;
(ii) Tightening of the prudential normswithin institutions to limit and managerisk in an optimal manner and toimprove supervisory oversight so as toensure the protection of interests ofsmall deposits in the operations ofindividual institutions and stability ofthe system as a whole;
(iii) Increasing the transparency andimproving the market practices with aview to improving overall efficiency aswell as stability of markets; and
(iv) Enhancing the technological andinstitutional infrastructure for the
Banking Developments and Perspectives
Chapter I
2
Report on Trend and Progress of Banking in India, 2000-01
financial markets, especially the moneymarket with a view to, inter alia,increasing the effectiveness ofmonetary policy.
1.6 Important measures taken during the yearto strengthen the prudential and supervisorynorms and increase operational effectivenessof monetary policy are as follows:
(a) Liquidity Adjustment Facility
1.7 In April 2000, the Reserve Bank hadannounced a transition to a full-f ledgedLiquidity Adjustment Facility (LAF) in threeprogressive stages. The first stage involved thereplacement of the Additional CollateralisedLending Facility (ACLF) for banks and level IIliquidity support to Primary Dealers (PDs) byreverse repo auctions and the fixed rate repo byvariable rate repos, effective June 5, 2000. Thesecond stage envisaged replacement ofCollateralised Lending Facility (CLF) and Level Isupport to PDs by variable rate repo auctions. Afterextensive consultations with experts and marketparticipants, the policy statement of April 2001announced the decision to move over to the secondphase in graduated steps. For more effectivefunctioning of LAF, certain changes were effectedin the operating procedures. These includedrecasting of auction methods and periods, astrategy for smooth transition of call money marketto pure inter-bank market and a comprehensiveand coherent programme for rationalisation ofliquidity support available to the system. Certaincomplementary and associated measures inmoney and government securities markets werealso introduced so as to provide considerableoperational flexibility to the market participantsand facilitate further integration of money market.The second stage of LAF came into operation fromMay 8, 2001. The third stage envisages multipleauctions intra-day, which will become feasiblewith the proposed introduction of electronictransfers of funds and securities.
(i) Changes in Standing Liquidity Facilities andIntroduction of Back-Stop Facility
1.8 The standing liquidity facilities availablefrom the Reserve Bank have been split into twoparts, viz., (i) normal facility and (ii) back-stopfacility. Of the total limits of liquidity supportavailable to PDs and banks, the normal facilityconstitutes about two-thirds and back-stopfaciltity about one-third. The normal facility is
being provided at the Bank Rate. The back-stopfacility is being provided at a variable daily ratelinked to cut-off rates emerging in regular LAFauctions and in the absence of such rates, toNational Stock Exchange-Mumbai Inter-BankOffer Rate (NSE-MIBOR).
1.9 The limits to refinance of export credit havebeen fixed on the basis of total outstandingexport credit eligible instead of the incrementalexport credit eligible over a base date. Witheffect from the fortnight beginning May 5, 2001,scheduled commercial banks are being providedexport credit refinance to the extent of 15.0 percent of the outstanding export credit eligible forrefinance as at the end of the second precedingfortnight. The existing refinance limit as on May4, 2001, as per the old formula would, however,constitute the minimum limit available for abank up to March 31, 2002.
(ii) Changes in LAF Operating Procedures
1.10 The minimum bid size for LAF was reducedfrom Rs. 10 crore to Rs. 5 crore to add furtheroperational flexibility to the scheme and enableparticipation by small level operators. To providequick interest rate signals, when necessary, andto meet unexpected domestic or externaldevelopments, the Reserve Bank has an additionaloption to switch over to fixed rate repos. In additionto overnight repos, the Reserve Bank also has thediscretion to introduce longer-term repos up to 14days as and when required. Multiple price auctions(in place of the then existing uniform price auction)were introduced on an experimental basis for onemonth period during May 2001, and, on a reviewthe practice has since been continued.
(b) Complementary Measures for EfficientFunctioning of LAF
1.11 As a part of streamlining the LAF andimproving the transmission channel ofmonetary policy, the following complementaryand associated measures in respect of moneyand government securities markets wereannounced.
(i) Moving towards Pure Inter-bank Call MoneyMarket
1.12 As announced in the Mid-term Review ofOctober 2000, permission to corporates to routetheir call transactions through PDs wasterminated effective July 1, 2001. Access of othernon-bank institutions (viz., financial institutions,

3
Banking Developments and Perspectives
mutual funds and insurance companies) todirectly lend in call/notice money market wouldgradually be reduced in four stages. In the initialstage, effective from May 5, 2001, non-banks havebeen allowed to lend upto 85.0 per cent of theiraverage daily lendings in the call market during2000-01. From a date to be notified by the ReserveBank, after the on-set of the last stage, non-bankswould not be permitted to lend in call/noticemoney market.
(ii) Shortening of Minimum Maturity Period ofTerm Deposits
1.13 With a view to moving further towardsderegulation and providing opportunities fornon-banks to invest short-term surplus fundsin a more flexible manner, and to enable banksto have more flexibility in their Asset-LiabilityManagement (ALM), it was decided to reduce theminimum maturity period for wholesale termdeposits of Rs. 15 lakh and above to 7 days fromthe earlier 15 days maturity, at the discretionof individual banks.
(iii) Relaxation in Daily Minimum Cash ReserveRatio Maintenance Requirement
1.14 Effective from the fortnight beginningAugust 11, 2001, the maintenance of dailyminimum requirement of Cash Reserve Ratio(CRR) has been lowered from 65.0 per cent to50.0 per cent for the first seven days of thereporting fortnight while continuing with theminimum requirement of 65.0 per cent for therest of the fortnight.
(iv) Interest on Cash Balances Maintained with theReserve Bank under Cash Reserve Ratio
1.15 It was decided to align the interest ratepaid on CRR to the Bank Rate in two stages. Inthe first stage, with effect from the fortnightbeginning April 21, 2001, the interest paid oneligible balances was increased to 6.0 per cent.With effect from the fortnight begining November3, 2001 the interest paid on eligible cashbalances will be at Bank rate (i.e., 6.5 per cent).
(v) Exemption of Inter-bank Term Liability fromMinimum Cash Reserve Requirement
1.16 Effective from the fortnight beginningAugust 11, 2001, inter-bank term deposits/termborrowings liabilities of original maturity of 15days and above upto one year have been exemptfrom the prescription of minimum CRR
requirement of 3.0 per cent. Besides, marginalsaving on cost to banks, this measure isexpected to help in developing inter-bank termmoney market.
(vi) Change in Treasury Bills Auction
1.17 With effect from the week beginning May14, 2001, the auctions of 14-day and 182-dayTreasury Bills were discontinued and thenotified amount for the 91-day Treasury Billsauctions was increased to Rs. 250 crore fromRs. 100 crore. The notified amount in theauctions of 364 - day Treasury Bills continuesto remain at Rs. 750 crore.
(vii) T plus 1 Settlement for SGL SettledTransactions
1.18 In anticipation of a move towards aNegotiated Dealing System (NDS), to be directlyl inked to the sett lement system, al ltransactions settled through the Deliveryversus Payment (DVP) system of the ReserveBank were to be on T plus 1 basis with effectfrom June 2, 2001. Based on the feedbackreceived from market participants, it wasdecided to postpone the date for introduction ofT plus 1 settlement for SGL transactions inGovernment securities to make it coterminouswith the introduction of NDS.
(viii) Rationalisation of Interest Rates on ExportCredit
1.19 As regards the interest rate on exportcredit extended by banks, it was decided that aceiling rate in respect of all categories was tobe indicated, so that interest rate charged bythe banks can be lower than the prescribed rate.It was decided to link such ceiling rates to theprime lending rates (PLRs) of respective banksavailable to their other domestic borrowers. Theapplication of interest rates on export credit bybanks will be on the basis of the relevant PLRprescribed by the bank. With the ceiling rateon Foreign Currency Non-Resident (Banks)(FCNR (B)) deposits being changed to LondonInter-Bank Offer Rate (LIBOR) (instead of LIBORplus 0.5 percentage point), the ceiling rate onforeign currency loans for exports by banks wasrevised to LIBOR plus 1.0 percentage point, tomake this rate even more competitive. Witheffect from September 26, 2001, the ReserveBank announced a reduction in the ceiling ratefor export credit by 1.0 percentage point across

4
Report on Trend and Progress of Banking in India, 2000-01
the board for period upto March 31, 2002.Accordingly, the maximum rate that the bankcould charge to exporters was revised to 2.5percentage points below its PLR for pre-shipmentcredit upto 180 days and for post-shipment creditupto 90 days.
1.20 The salient features of the Mid-termReview are presented in Box I.1.
Government Securities Market
1.21 Several measures were taken tocontinue the momentum initiated by ReserveBank for developing the Government securitiesmarket. One of the important steps is settingup of the Clearing Corporation of India Ltd.(CCIL) with State Bank of India (SBI) as thechief promoter and five other banks andfinancial institutions as co-promoters. The CCILwill act as a central counter-party in thesettlement of al l trades in Government
securities, Treasury Bills, Repos and foreignexchange. The CCIL will facilitate clearing andsettlement of Government securities andforeign exchange transactions by reducing thecounter-party risk through multilateral nettingof transactions. CCIL will clear transactions inrepos and Government securities between itsmembers reported on the Negotiated DealingSystem (NDS) of the Reserve Bank and also therupee-U.S. dollar spot and forward deals. TheReserve Bank has already opened currentaccount and SGL account for CCIL and givenapproval for its membership to Indian FinancialNetwork (INFINET). CCIL is putting in place thehardware and software and has held manymeetings with banks for finalising operationalprocedures/modalities, changes to systems ofmember banks, etc. The first phase of the projectis expected to go live in November 2001,alongwith the expected commencement ofparallel run of NDS.
I. Monetary Measures
(1) The Bank Rate was reduced by 0.50 percentage pointfrom 7.0 per cent to 6.5 per cent with effect fromthe close of business on October 22, 2001.
(2) The Cash Reserve Ratio (CRR) was reduced by 200basis points to 5.50 per cent from 7.50 per cent ofnet demand and time liabilities (NDTL). Effectivefrom the fortnight beginning November 3, 2001,CRR would stand reduced to 5.75 per cent; andeffective fortnight beginning December 29, 2001,the CRR will be reduced further to 5.50 per cent ofNDTL. All the exemptions on the liabilities werewithdrawn except inter-bank liabilities, for thecomputation of NDTL (for the purpose ofmaintenance of CRR) with effect from fortnightbeginning November 3, 2001.
(3) With effect from the fortnight beginning November3, 2001, the interest paid on eligible cash balancesmaintained with the Reserve Bank would be at theBank Rate (i.e., 6.5 per cent).
II. Prudential Measures
(1) As a first step towards activating the CreditInformation Bureau (CIB), it was decided to initiatethe process of collection and dissemination of somerelevant information, within the existing legalframework. The Reserve Bank accordingly decidedto constitute a Group drawing representation fromCIB, Indian Banks’ Association (IBA), select banks
and FIs to examine the possibility of the CIBperforming the role of collecting and disseminatinginformation on the list of suit-filed accounts andthe list of defaulters, including willful defaulters,which is presently handled by the Reserve Bank.The Group will also examine the other aspects ofinformation collection and dissemination, such as,the extent, periodicity and coverage including thefeasibility of supplying such information on-line,to members in future and submit its Report withina month.
(2) In order to contain the risks arising out of non-SLR investment portfolio of banks and FIs, inparticular through the private placement route, itwas proposed to issue further prudentialguidelines to be observed by banks. Theseguidelines, inter alia, would cover: (i) the need forstrengthening of internal rating systems,periodically tracking the rating changes in respectof issuers; (ii) fixing of prudential limits, withseparate sub-limits for unrated, unquoted andprivately placed instruments; (iii) review by Boardon total investments/disinvestments, regulatorycompliance, rating changes in respect of issuersand non-performing investments; and (iv)disclosures in ‘Notes on Accounts’ regarding issuercomposition and non-performing investments. Itwas also proposed to constitute a Working Group,which would submit its report within a month, toevolve a framework for collecting and sharing bybanks/FIs of information on private placement of
Box I.1: Major Policy Measures Announced in the Mid-term Review ofMonetary and Credit Policy for the year 2001-02
Contd.

5
Banking Developments and Perspectives
debt with CIB as a convenor, and representatives,inter alia, of banks, FIs and the Reserve Bank.
(3) It was decided that banks should furnish thefollowing additional disclosures in the ‘Notes onAccounts’ in their balance sheets, from the yearending March 2002: (i) movement of provisions heldtowards NPAs and (ii) movement of provisions heldtowards depreciation on investments.
(4) Based on the feedback on the recommendations ofthe Working Group constituted by the Reserve Bankto evolve asset-liability management (ALM) guidelinesfor UCBs, guidelines will be issued to scheduledUCBs. In order to strengthen the supervisorymechanism, the Reserve Bank has since introducedoff-site monitoring system for scheduled UCBs.
(5) It was proposed to allow UCBs to grant loans toindividuals against security of shares, subject to thefollowing parameters:
(a) Loans against shares/debentures may be grantedto individuals to meet contingencies and personalneeds or for subscribing to rights or new issuesof shares/debentures or for purchase in thesecondary market. Loans against primary/collateral security of shares/debentures will belimited upto Rs.5 lakh, if the security is inphysical form, and upto Rs.10 lakh, if the securityis in demat form. Aggregate of all such loansshould be within the overall ceiling of 20.0 percent of the owned funds of the bank, and marginof 40.0 per cent should be maintained in all casesof such loans.
(b) It is essential that before accepting shares assecurity, UCBs should put in place a riskmanagement system. UCBs should also have AuditCommittee of their Boards of Directors and all theapproved loan proposals should be placed beforethe Audit Committee at least once in two months.Details of loans sanctioned should be reported tothe Board in the subsequent Board meeting. TheManagement and Audit Committees should ensurethat all loans against shares are made only to thoseindividuals who are not in any way connected withany stock-broking activity or stock-broking entity.
(c) UCBs which have outstanding loans to individualscan renew them upto permissible amounts beyondthe contracted date on merits, subject to the aboveconditions.
(d) UCBs should ensure that there is no directinvestment by them in either primary or secondarymarket under any circumstances.
(6) The time-frame for achieving the prescribed levelsof SLR holding by UCBs was altered as follows:
Table : Category of UCBs Minimum SLR holding ingovernment and other approved securities as per centof NDTL
Category of UCBs Minimum SLR holding in government andother approved securities as per cent of NDTL
Present Earlier Now NowProposed Proposed Proposed
for for forMarch March September
31, 2002 31, 2002 30,2002
Non-Scheduled UCBs
1. UCBs with NDTL 10.0 15.0 12.5 15.0of Rs.25 croreand above
2. UCBs with NDTL NiL 10.0 7.5 10.0of less thanRs.25 crore
Scheduled UCBs 15.0 20.0 17.5 20.0*
(7) Banks were given the freedom to change thecomposition of working capital by increasing the cashcredit component beyond 20 per cent, or to increasethe ‘loan component’ beyond 80 per cent, as the casemay be, for working capital limits of Rs.10 crore andabove, if they so desire. Banks are expected toappropriately price each of the two components ofworking capital finance, taking into account theimpact of such decisions on their cash and liquiditymanagement.
* It may be clarified that so far as scheduled UCBs areconcerned, with effect from April 1, 2003, the entireprescribed level of 25 per cent SLR holding has to beonly in government and other approved securities.
1.22 The Reserve Bank has commenced anintegrated project for complete automation ofthe operations of its Public Debt Office (PDO)which involves NDS and securities settlementsystems (SSS). NDS will be an interface betweenthe members (SGL account holders) and thePDO. NDS will facilitate electronic bidding in theprimary market in Goverment securities andsecondary market in Government datedsecurites, Treasury bills, Repos, call money,Notice/Term money, Commercial Paper,Certificates of Deposit, Interest Rate Swaps andForward Rate Agreements. The entire systemwill operate in a networked environment andINFINET wil l provide the backbone for
communication. The NDS fully integrated withthe computerised PDO and CCIL, will lead tohigher efficiency in trading, settlement andother improvements in services to investors inGovernment securities. In this regard, it hasbeen decided to closely coordinate the workrelating to NDS with the CCIL, and, in fact, placethe whole system within the overalltechnological and institutional infrastructurefor transactions in the financial sector, withwhich the Reserve Bank is intimatelyconcerned. The NDS software application hasbeen installed in LAN environment for testingand over 80 institutions have tested the softwareand given suggestions for improvements.
Contd.

6
Report on Trend and Progress of Banking in India, 2000-01
Subsequently, the system is being tested in WANenvironment with 5 market participantsconnected to the network.
2. Commercial Banking System-Supervisory Initiatives during theYear
Board for Financial Supervision
1.23 The members of the Board for FinancialSupervision (BFS) and its Sub-Committee(Audit) appointed initially continued till thereconstitution of the Central Board of theReserve Bank on November 27, 2000. Effectivefrom December 21, 2000, a new Board has beenformed comprising four Directors of CentralBoard of the Reserve Bank as members. The newBoard would function for a period of two years.The BFS has reconstituted the Sub-Committee(Audit) on January 10, 2001.
1.24 During the period July 2000 to June2001, the Board reviewed Inspection Reports of27 public sector banks, a consolidated Report ofLocal Head Offices (LHOs) of SBI, 26 privatesector banks, 50 foreign banks and six financialinstitutions. The Board also reviewed themonitoring relating to bank frauds and house-keeping in public sector banks, includingreconcil iation of entries in inter-branchaccounts, inter-bank accounts (including nostroaccounts) and balancing of the books of accounts.In addition, the Board reviewed the monitoringin respect of select al l-India f inancialinstitutions and NBFCs. Besides delineating thecourse of action to be pursued in respect ofinstitution-specific supervisory concerns, theBoard also provided guidance on severalregulatory and supervisory policy decisions.
1.25 The Board considered the Report of the“Informal Working Group on Supervision ofForeign Branches of Indian Banks”. It wasdecided that scrutiny of foreign branches ofIndian banks should be carried out by theReserve Bank once in three years. The basicresponsibility of inspection of their overseasbranches has been left to the parent banks. Thereport along with a draft copy of memorandumcontaining implementation guidelines has beenforwarded to the concerned banks. They havebeen advised to implement the reporting systemwith effect from April-June 2000 quarter. Thebanks with high percentage of NPA/ loss
making feature are being monitored on aquarterly basis.
1.26 In the course of implementing therecommendations of the Working Group onSupervision of Overseas Branches of IndianBanks, all Indian banks having foreign brancheswere advised regarding the personnel policiesto be followed in respect of officials posted tothese foreign branches. Banks were required,in the l ight of these guidelines, to takeadequate measures by amending their existingcontractual agreements governing overseaspost ings / staf f regulat ions / pensionregulations, in consultation with their ownlegal experts.
1.27 The supervisory rating exercise of banksin vogue since the inspection cycle of 1998-99was reviewed by a working group and on thebasis of its recommendations, a revised ratingmodel has been evolved which has reduced the,subjectivity elements.
1.28 A system of prompt corrective action (PCA)based on a pre-determined rule-based structuredearly intervention, has been proposed to beinstituted as part of the constant efforts toenhance the existing supervisory framework.Under the proposed PCA, a schedule of correctiveactions has been suggested based on threeparameters, namely, Captial to Risk-weightedAssets Ratio (CRAR), net NPAs and return onassets (RoA). Certain trigger points have beendetermined for the PCA framework under thethree parameters taking into account thepracticability of implementation of certainmeasures in the Indian context. For everytrigger point, a set of mandatory anddiscretionary actions has been proposed. Theseactions have been further divided into thosewhich would be recommended to theGovernment for implementation and thosewhich could be taken by the Reserve Bank. Acopy of the scheme was sent to all scheduledcommercial banks. Comments and suggestionsreceived from various banks had beenexamined. As some of the actions under PCAwill require approval on the part of Governmentof India, the proposed scheme has beenforwarded to the Government for their views.
1.29 The posit ion of reconcil iation ofoutstanding entries under inter-branchaccounts was submitted quarterly to the Board

7
Banking Developments and Perspectives
and based on the directions the position ismonitored on a continuing basis. There hasbeen considerable improvement in respect ofreconciliation of entries pertaining to the periodover six months.
Up-gradation of Off-site Monitoring andSurveillance Function
1.30 The off-site monitoring and surveillancesystem (OSMOS) was set up in 1995 with theprimary objective of analysing the financialcondit ion of banks in between on-siteexaminations. Banks are required to submit atotal of 14 off-site returns to Reserve Bank.These returns include 7 returns in the firsttranche that were introduced in March 1996,4 ALM returns comprising the second trancheintroduced in June 1999 and 2 annual returnsviz., balance sheet and bank profile statementsprepared on the basis of audited figures. Thelast off-site return, introduced in September2000, pertains to operations of domesticsubsidiaries of banks.
1.31 In view of the enhanced data processingrequirements, the increased number of users aswell as the need for more sophisticated analyticaltools, the Reserve Bank, with assistance fromDepartment for International Development of theUnited Kingdom, launched a project in 1999 forupgradation of its off-site monitoring andsurveillance function. The SystemsRequirements Analysis report was prepared byM/s PricewaterhouseCoopers, London and thework pertaining to development of software for theproject was out-sourced. The new OSMOS systemhaving a data-warehousing component wassuccessfully commissioned in January 2001. Thishas enhanced data storage, information retrievaland analytical capabilities.
Introduction of Half-Yearly Review for Public SectorBanks (PSBs)
1.32 Keeping in view, a long period of one yearbetween the availability of two audited financialstatements and with a view to getting timelyfeed-back about the financial position of thepublic sector banks, it was decided to introducea system of half-yearly review of accounts ofthese banks, with effect from the half year endedSeptember 30, 2001. The review would coveradvances, provision for non-performing assets(NPAs), investments, income and expenditureitems, etc., with the major thrust on
verification of income and expenditure itemsrather than on balance sheet items. All PSBsare required to submit half-yearly review/reportto the Reserve Bank in the format finalised inconsultation with the Securities and ExchangeBoard of India (SEBI), within a period of 60 daysfrom the close of the half year. Further, incompliance to clause 41 of the listing agreement,these review/reports are to be submitted byPSBs to the concerned Stock Exchange(s) wherethe PSBs shares have been listed.
Norms for the Statutory Central Auditors to beAppointed for the Private Sector Banks
1.33 There was no uniformity amongst privatesector banks in regard to the appointment oftheir statutory central auditors (SCAs).Considering the fast changes that are takingplace in the financial sector in general, and inthe field of banking in particular, as also use oflatest technology by some of the new privatesector banks in their day-to-day operationscoupled with the introduction of innovativeproducts, the issue of prescribing minimumeligibility standards for the audit firms beforeapproving their names as SCAs for Indianprivate sector banks was examined. Accordingly,with effect from 2001-02, the audit firmsrecommended by Indian private sector banks forappointment as their SCAs would have to satisfyprescribed standards relating, inter alia, tominimum standing, minimum number of fullt ime partners associated with the f irm,minimum number of chartered accountantsexclusively associated with the firm, number ofprofessional/audit staff as well as minimumstatutory central audit experience. With a viewto applying the prescribed minimum standards,Indian private sector banks have been classifiedinto two categories on the basis of their assetsize as on March 31 of the previous year, i.e.,banks with an asset size up to Rs. 5,000 croreand those with assets above Rs. 5,000 crore.
Strengthening the Banking System
Capital Adequacy
1.34 Effective from the year ended March 2000,stipulation on minimum CRAR of scheduledcommercial banks was increased by onepercentage point to 9 per cent.
1.35 In addition to the existing 100 per centrisk-weight for credit risk, banks are required

8
Report on Trend and Progress of Banking in India, 2000-01
to assign a risk-weight of 2.5 per cent to covermarket risk in respect of al l securit iesincluding securities outside the SLR from theyear ended March 2001.
1.36 The risk-weight of 100 per centprescribed on staff advances was reviewed in thelight of the safeguards available to the banks toeffect recovery. It was decided that banks needto assign 20 per cent risk-weight on all loansand advances granted to their staff, which arefully covered by superannuation benefits andmortgage of flat/house.
1.37 Deposits placed with NABARD/SIDBI inlieu of the shortfall in banks’ advances to thepriority sector vis-à-vis the prescribed targetwere assigned a 100 per cent risk-weight asthese deposits are in lieu of assets that carry asimilar risk-weight.
Provisioning Norms
1.38 With regard to provisioning for standardassets, i t was clari f ied that the generalprovision of 0.25 per cent on standard assetsshould be made on global portfolio basis, andnot on domestic advances alone.It wasannounced in October 2000, that the generalprovision on standard assets would be includedin tier II capital, together with other “generalprovisions/loss reserves”, up to a maximum of1.25 per cent of the total risk- weighted assets.While recognising the need to give autonomyto banks for the assessment of risks associatedwith their asset portfolios, it was emphasisedthat provisions in excess of the amountrequired could be made by banks, keeping inview their own risk perceptions.
Recovery Management
1.39 In pursuance of the announcement inthe Union Budget for 1999-2000, guidelineswere framed for the constitution of SettlementAdvisory Committees (SACs) for compromisesettlement of chronic NPAs of small sector whichwere valid till September 30, 2000. While bankswere required to take effective measures tostrengthen the credit appraisal and post-creditmonitoring to arrest the incidence of fresh NPAs,a more realistic approach was needed to reducethe stock of existing and chronic NPAs in allcategories. The guidelines were, therefore,modified in July 2000, which provided asimplif ied, non-discretionary and non-
discriminatory mechanism for recovery of NPAs.The revised guidelines, operative till March 31,2001, were subsequently extended upto June30, 2001 and for processing applications / cases,banks were given time up to September 30,2001. All public sector banks were required touniformly follow these guidelines, to maximiserecovery of NPAs within the stipulated time.
Exposure Norms
1.40 As a prudential measure intended forbetter risk management and avoidance ofconcentration of credit risks, banks wereadvised to fix limits on their exposure to i)individual borrowers and group borrowers inIndia, ii) specific industry or sectors, and iii)unsecured guarantees and unsecured advances.Besides, banks are also required to observecertain statutory and regulatory exposure limitsin respect of ‘advances against shares,debentures and bonds’ and ‘investments inshares, debentures and bonds’.
Credit Exposures to Individual/Group Borrowers
1.41 With effect from April 1, 2000, the ceilingon a bank’s exposure to an individual borrowerwas lowered to 20 per cent of the capital fundsfrom the existing limit of 25 per cent with a viewto moving closer to the international standardof 15 per cent in phases.Where the existing levelof exposure, as on October 31, 1999, was morethan 20 per cent, banks were expected to reducethe exposure to the 20 per cent limit over a two-year period, (i.e., by end-October 2001).
1.42 In April 2001, the Reserve Bankannounced fresh guidelines in respect of theconcept of ‘capital funds’, and measurement ofcredit exposure and the level of the exposurelimit. The exposure ceiling is to be computedin relation to total capital in India as definedunder capital adequacy standards (tier I and tierII), effective March 31, 2002. As in the case offunded exposure, non-fund based exposures arealso to be reckoned at hundred per cent (asagainst 50 per cent for non-fund based exposuresearlier) and in addition, banks should includeforward contracts in foreign exchange and otherderivative products like currency swaps andoptions at their replacement cost value indetermining the individual/group borrowersexposures, effective April 1, 2003. Banks wereadvised to reduce exposure to a single borrower
9
Banking Developments and Perspectives
to 15 per cent from the existing level of 20 percent of the bank’s capital funds with effect fromMarch 31, 2002. Similarly, group exposure wasto be brought down to 40 per cent of the capitalfunds from the existing 50 per cent with effectfrom March 31, 2002. In the case of financing ofinfrastructure projects, the group exposure limitis extendable by an additional 10 per cent, i.e.,up to 50 per cent.
1.43 Based on the recommendations of theStanding Technical Committee of RBI-SEBIofficials on banks’ financing of equities andinvestments in shares, banks’ exposure tocapital market was reviewed and guidelineswere issued on November 10, 2000. Within theoverall exposure to sensitive sectors, a bank’sexposure to the capital market by way ofinvestments in shares, convertible debenturesand units of equity-oriented mutual funds shouldnot exceed 5 per cent of outstanding domesticcredit (excluding inter-bank lending andadvances outside India) as on March 31 of theprevious year. As announced on November 10,2000, these guidelines were reviewed again bythe RBI-SEBI Technical Committee, in the lightof actual experience over six months, andrevised guidelines were issued on May 11, 2001.As per the guidelines, banks could acquireshares, debentures and units of mutual funds,etc., for direct investment in shares/debentures, etc., at their own risk and forgranting loans and advances to individuals andshare-broking entities for investment in capitalmarket on their own account. Shares/debentures may be assigned to banks byindividuals and corporates as collateral andadditional security for certain approved purposeswhich do not involve stock broking orinvestment in the capital market. Therefore,banks’ exposure to capital market in all formswas restricted to 5 per cent of total outstandingadvances (including commercial paper) as onMarch 31 of the previous year. The ceiling of 5per cent would cover (i) direct investments inequity shares and convertible bonds anddebentures; (ii) advances against shares toindividuals for investment in equity shares(including IPOs), bonds and debentures, unitsof equity-oriented mutual funds; and (iii)secured and unsecured advances to stockbrokers and guarantees issued on behalf ofstock brokers. A uniform margin of 40 per cent
was prescribed on all advances/financing ofIPOs/guarantees. A minimum cash margin of20 per cent (within the margin of 40 per cent)was prescribed in respect of guarantees issuedby banks.
1.44 In September 2001, the Reserve Bank,on an experimental basis, as recommended bythe RBI-SEBI Standing Technical Committeeand keeping in view circumstances prevailingin the equity markets, permitted banks toextend finance to stockbrokers for margintrading within the overall ceiling of 5 per centprescribed for exposure of banks to the capitalmarket. Banks could accordingly provide financeto brokers for margin trading in actively tradedscrips forming part of the NSE Nifty and the BSESensex, subject to certain guidelines. Theseguidelines will be valid for a period of 60 days(i.e. upto November 22, 2001) and will bereviewed in the light of actual experience.
1.45 With regard to the valuation anddisclosure requirements, equity shares in thebanks’ portfolios, whether held as primarysecurity or as collateral for advances orguarantees, or as investment, should be markedto market, preferably on a daily basis, but atleast on a weekly basis. Banks are required todisclose the total investments made in equityshares, convertible bonds and debentures, unitsof equity-oriented mutual funds and aggregateadvances against shares in the ‘Notes onAccounts’ to their balance sheets.
Credit Exposure to Industry or Certain Sectors
1.46 Apart from limiting the exposures toindividual or group of borrowers, the banks wereadvised to also consider fixing internal limitsfor aggregate commitments to specific sectors(e.g., textiles, jute, tea, etc.) so that theexposures are evenly spread over varioussectors. These limits could be fixed, by thebanks, having regard to the performance ofdifferent sectors and the risks perceived. Thebanks may review the limits so fixed at periodicintervals and revise, as necessary.
Underwriting of Bonds of Public SectorUndertakings
1.47 The banks were advised to formulatetheir own internal guidelines as approved bytheir Boards of Directors on investments in andunderwriting of PSU bonds, including norms to

10
Report on Trend and Progress of Banking in India, 2000-01
ensure that excessive investment in any singlePSU is avoided and that due attention is givento the maturity structure of such investments.Banks would also need to take into account thefact that such investments are subject to risk-weight and necessary depreciation is to be fullyprovided for. Further, such investments in PSUbonds including shares and debentures andsubscription to commercial papers of PSUsshould be reckoned for the purpose of arrivingat prudential norms of credit exposure for singleborrower and group of borrowers.
Asset Classification –“Past Due” Concept
1.48 Under the earlier guidelines, an assetwas classified as NPA if the amounts due in theaccount remained ‘past due’ for more than twoquarters. It was clarified on December 17, 1992that an amount should be considered ‘past due’when it remains outstanding for 30 days beyondthe due date. Due to the improvements in thepayment and settlement systems, recoveryclimate, upgradation of technology in thebanking system, etc., it was decided to dispensewith ‘past due’ concept, with effect from March31, 2001. Accordingly, effective that date, anadvance has to be classified as NPA, if interestand/or instalment of principal remain overduefor a period of more than 180 days in respect ofa term loan, and the account remains ‘out oforder’ for a period of more than 180 days, inrespect of an Overdraft/Cash Credit (OD/CC).With a view to moving towards international bestpracties and to ensure greater transparency, theintention to adopt the 90 day norm forrecognition of loan impairment from the yearending March 31, 2004 was announced in thestatement on Monetary and Credit Policy for theyear 2001-02.
Treatment of Restructured Accounts
1.49 The issue of restructuring creditfaci l it ies due to unexpected decline inanticipated cash flows, particularly in projectassistance has implications for assetclassification norms. It was felt that thesestipulations deter the banks from restructuringof standard and sub-standard loan assets, eventhough the modification of terms might notjeopardise the assurance of repayment of duesfrom the borrower. Accordingly, the norms werereviewed in the light of the international bestpractices and changes were effected in the
norms relating to restructuring/rescheduling/renegotiation of terms of the standard and sub-standard loan assets. The stages whererestructuring/rescheduling/renegotiation ofthe terms of loan agreement could take placeare: (i) before commencement of commercialproduction; ( i i ) after commencement ofcommercial production, but before the asset hasbeen classified as sub-standard; and (iii) aftercommencement of commercial production andthe asset has been classified as sub-standard.
1.50 A rescheduling of the instalments ofprincipal alone, at any of the aforesaid first twostages would not cause a standard asset to beclassified in the sub-standard category, providedthe loan/credit faci l ity is fully secured.Likewise, a rescheduling of interest elementwould not necessitate an asset to be downgradedif the element of interest, measured in presentvalue terms, is either written off or provision ismade to the extent of the sacrifice involved.
1.51 In the case of restructured sub-standardaccounts also, a sub-standard asset is eligiblefor continuation in the sub-standard categoryfor the specified period, provided the loan/creditfacility is fully secured. The rescheduling ofinterest element would render a sub-standardasset eligible for continuance of classificationin sub-standard category for the specified period.This is subject to the condition that the amountof sacrifice, if any, in the element of interest,measured in present value terms, is eitherwritten off or provision is made to the extent ofthe sacrifice involved. Even in cases where thesacrifice is by way of write off of the past interestdues, the asset should continue to be treatedas sub-standard.
1.52 The sub-standard assets would be eligibleto be upgraded to the standard category onlyafter the specified period, i.e., a period of oneyear after the date when first payment ofinterest or of principal, whichever is earlier,falls due, subject to satisfactory performanceduring the period. In case, however, thesatisfactory performance during the one-yearperiod is not evidenced, the asset classificationof the restructured account would be governedas per the applicable prudential norms withreference to the pre-restructuring paymentschedule. These changes in the norms wouldbe applicable only to the standard and sub-standard accounts which are subjected to

11
Banking Developments and Perspectives
restructuring/ rescheduling/renegotiation ofterms during the financial year 2000-01 andthereafter.
1.53 Banks should also disclose in theirpublished Annual Accounts, under the Notes onAccounts, certain information in respect ofrestructuring undertaken during the year. Thedisclosures include among others (a) the totalamount of loan assets subjected to restructuring;(b) the total amount of standard assets subjectedto restructuring; and (c) the amount of sub-standard assets subjected to restructuring.
Guidelines on Categorisation and Valuation ofBanks’ Investment Portfolio
1.54 The process of marking to market of theinvestment portfolio required bifurcation ofinvestments into ‘permanent’ and ‘current’categories. Banks have made substantialprogress in this respect. A number of banks havefully marked the portfolio to the market and theremaining have reached the prescribed level of75 per cent for approved securities.
1.55 Accordingly, the guidel ines onclassification and valuation of investments bybanks have been revised on the basis of therecommendations of an Informal Working Groupin order to bring them in consonance with thebest international practices. The revisedguidelines were made effective from September30, 2000. The banks are required to classifytheir entire investment portfolio, under threecategories viz., ‘held to maturity’, ‘available forsale’ and ‘held for trading’. In the balancesheet, the investments would continue to bedisclosed as per the existing six classificationsviz . , i ) Government securit ies, i i ) otherapproved securities, iii) shares, iv) debenturesand bonds, v) subsidiaries/ joint ventures, vi)others (commercial papers, mutual fund units,etc.).
1.56 The investments under the ‘available forsale’ and ‘held for trading’ categories should bemarked to market at yearly and monthlyintervals, respectively, or at more frequentintervals. The investments under the ‘held tomaturity’ category need not be marked tomarket, as in the case of ‘permanent’ securitiesat present. Such investments will not exceed25 per cent of the total investments.
1.57 The guidelines cover classification ofinvestments, shifting of investments among thethree categories, valuation of the investments,methodology for booking profit/ loss on sale ofinvestments and providing for depreciation. Therisk-weights assigned to the various securitiesat present, including those for ‘market risk’,remain unchanged.
1.58 Banks were advised to formulate aninvestment policy with the approval of theirBoard of Directors to take care of therequirements on classification, shifting andvaluation of investments under the revisedguidelines. The policy should adequately addressrisk-management aspects and ensure that theprocedures to be adopted by the banks under therevised guidelines are consistent, transparentand well documented to faci l itate easyverification by inspectors and statutory auditors.
Transfer of Profits to Reserve Funds
1.59 All scheduled commercial banksoperating in India (including foreign banks) arerequired to transfer not less than 25 per cent ofthe net profit (before appropriations) to theReserve Fund with effect from the year endingMarch 31, 2001. The transfer to the reservesmay be made ‘after adjustment/provisiontowards bonus to staff’.
Voluntary Retirement Scheme Expenditure -Accounting and Prudential Regulatory Treatment
1.60 Faced with the problem of surplusmanpower resources, several public sectorbanks introduced a voluntary retirementscheme (VRS) as a measure of cost reduction.The scheme brought to the fore certainaccounting issues relating to booking of VRSrelated expenditure such as ex-gratia paymentand other terminal benefits. Consequently, theaccounting treatment of VRS expenditure wasspecified in consultation with the Institute ofChartered Accountants of India (ICAI). Inparticular, the banks were advised that unlessexpensed in the same period, the entire ex-gratiaamount as a result of VRS could be treated asan extra-ordinary item and as DeferredRevenue Expenditure (DRE). Banks wereadvised that in view of the extra-ordinarynature of the event, VRS related DRE would notbe reduced from tier I capital. The position willstand regularised by the end of the accounting
12
Report on Trend and Progress of Banking in India, 2000-01
year in which the deferred expenses are totallywiped out. The banks are required to disclosein the balance sheet the accounting policiesfollowed in respect of VRS expenditure. Theperiod of deferment would be restricted to amaximum of 5 years including the year ofacceptance of VRS application by a bank.
Consolidated Supervision
1.61 The adoption of Basel Core Principles forEffective Banking Supervision requires adherenceto the principles of consolidated accounting andsupervision of the affairs of the bank’ssubsidiaries. With a view to moving towardsinternational best practices, banks were advisedon May 3, 2000, to voluntarily build in the risk-weighted components of their subsidiaries intotheir own balance sheet on notional basis, atpar with the risk-weights applicable to thebank’s own assets and earmark additionalcapital in their books, in phases, beginning fromthe year ending March, 2001. Furthermore, inorder to bring more transparency to the balancesheets, public sector banks were advised toannex the balance sheet in respect of each oftheir subsidiaries, to their own balance sheetsbeginning from the year ending March, 2001.The accounting year of the entities which arebanking subsidiaries, should normally becoterminous with that of the parent bank andthe date of the annual accounts of suchsubsidiaries, annexed to the parent’s balancesheet, should coincide with the date of annualaccounts of the parent. In respect of subsidiarieswhich may have an accounting year differentfrom that of the parent bank, the annualaccounts annexed should not relate to a dateearlier than six months prior to the date of theannual accounts of the parent bank.
Move towards Risk-based Supervision
1.62 In the Monetary and Credit Policy of April2000, the Reserve Bank had announced itsintention to move towards a risk-based approachto supervision of banks with the assistance ofinternational consultants. The switchover torisk-based supervision (RBS) from the currentCAMELS based approach wil l enhancesupervisory standards and practices inalignment with the international best practices.M/s. PricewaterHouse Coopers (PwC), UK, wereengaged as consultants to faci l itate thetransition to RBS under assistance from the
Department for International Development(DFID), UK.
1.63 The consultants submitted the finaldeliverables in May 2001. The RBS modelsuggested by them consists of (i) a formal riskassessment of a bank by producing a detailed riskprofile, (ii) developing a unique supervisory actionplan for each bank based on the risk profile, (iii)defining the scope and extent of supervision, and(iv) setting up quality assurance and enforcementfunctions to maintain objectivity and neutralityin application of supervisory standards. The projecthas entered the implementation phase from June2001 and a dedicated Project Implementation Grouphas been set up in the Reserve Bank to addressthe transitional and change management issuesfor switchover to RBS.
1.64 The RBS approach will involve allocationof supervisory resources in accordance with therisk profile of a bank. A high-risk bank will besubjected to enhanced supervisory focusthrough a shorter supervisory cycle and greateruse of various supervisory tools like targetedinspections, intensive off-site surveillance,structured meetings with the bankmanagement, etc. On the contrary, a low riskbank will be subjected to a longer supervisorycycle and use of fewer supervisory tools. Thus,the RBS approach will lead to an optimum useof supervisory resources by focusing them onthe targeted banks and the specific areas withinthe banks that pose the greatest risk to thesystem and to the supervisory objectives.
1.65 The implementation of RBS approach callsfor certain preparedness on the part ofcommercial banks like setting upcomprehensive risk management systems,switching to a risk-based audit system, upgradingthe management information and InformationTechnology-based systems, setting up dedicatedcompliance units and addressing issues relatedto HRD and skill development. A discussion paperon RBS giving a background of the approach, itsobjectives, the processes involved and thespecific bank level preparedness required forsuccessful implementation has been issued tothe banks and they will be involved in theswitchover through a consultative process. TheRBS approach is planned to be put in operationafter the pilot run in the last quarter of thefinancial year 2002- 03.

13
Banking Developments and Perspectives
Credit Information Bureau
1.66 With a view to developing an institutionalmechanism for sharing of information onborrowers/ potential borrowers among banksand f inancial institutions, the CreditInformation Bureau (India) Ltd. (CIBIL) has beenset up in August 2000 for collecting, processingand sharing credit information on the borrowersof credit institutions. In order to strengthen thelegal mechanism for making the functioning ofCIBIL effective, a draft master legislationcovering responsibilities of the Bureau, rightsand obligations of the member creditinstitutions, safeguarding of the privacy rights,is under preparation by the Government.
Report on Borrowal Accounts Classified asDoubtful or Loss and Suit-filed Accounts of Rs.1crore and above
1.67 A scheme has been put in place to collectand disseminate, amongst banks/ notified all-India FIs, the details about borrowers of banksand FIs with outstanding aggregating Rs. 1 croreand above which are classified as ‘doubtful’ or‘loss’ or where suits have been filed. So far,information up to the hal f-year endedSeptember 30, 2000 has been disseminated.The list of borrowal accounts against whichbanks and FIs have filed suits for recovery oftheir dues aggregating Rs. 1 crore and aboveas on March 31, 2001 is available on theReserve Bank website (www.rbi .org. in).Information on cases of wilful default withoutstanding balance of Rs. 25 lakh and aboveup to the quarter ended March 31, 2001, hasalso been furnished to the banks and notifiedall India FIs. The list of wilful defaulters of Rs.25 lakh and above against whom suits havebeen filed is published along with the list of suitfiled accounts of Rs. 1 crore and above and isalso available on the RBI website.
Guidelines for Entry of New Private Sector Banks
1.68 Following the recommendations of theWorking Group to review the licensing policy forsetting up new private sector banks, inconsultation with the Government of India,guidelines were issued in January 2001 forentry of new banks in the private sector. Theguidelines retained certain existing conditionson the entry of new banks such as promoters’capital share at 40 per cent, opening of newbranches, etc. The proposed bank needs to
observe the prescribed targets in respect ofpriority sector lending (40 per cent of net bankcredit) as applicable to other domestic banks.The major changes in the revised guidelinesare:
(i) The initial minimum paid up capital fora new bank should be Rs. 200 crore,which shall be increased to Rs. 300crore in subsequent three years aftercommencement of business.
(ii) The guidelines also enable a NBFC toconvert into a commercial bank, if itsatisfies the prescribed criteria of a)minimum net worth of Rs. 200 crore, b)a credit rating of not less than AAA (orits equivalent) in the previous year, c)capital adequacy of not less than 12 percent, and d) net NPAs not more than 5per cent.
(iii) A large industrial house should notpromote any new bank. Individualcompanies, directly or indirectlyconnected with large industrial housesmay however, be permitted toparticipate in the equity of a new privatesector bank up to a maximum of 10 percent, but would not have controllinginterest in the bank. The bank shall notextend any credit facilities to thepromoters and companies investing upto 10 per cent of the equity.
(iv) Preference would be given to promoterswith expertise of financing priorityareas and in setting up banksspecialising in the financing of ruraland agro-based industries.
1.69 The guidelines also prescribed March 31,2001 as the last date for receipt of applications.At the first stage, the applications werescreened by the Reserve Bank to ensure primafacie eligibility of the applicants. Thereafter, theapplications were referred to a high-levelAdvisory Committee (Chairman: Dr.I.G.Patel),which submitted its recommendations to theReserve Bank on June 29, 2001. Furtherdetailed information and analysis of theapplications, in the light of the AdvisoryCommittee’s recommendations is in progressand a decision to issue ‘in-principle’ approvalfor setting up of a private sector bank would betaken by the Reserve Bank.

14
Report on Trend and Progress of Banking in India, 2000-01
Supervisory Initiatives Relating to ForeignBranches of Indian Banks
1.70 A revised reporting system has beenintroduced for collecting data on foreignoperations of Indian banks from June 2000. Thenew reporting system is designed to captureadditional risks/information pertaining to (a)interest rate risks, (b) liquidity risks, (c) non-performing investments, (d) information onfrauds, and (e) detailed data on profitability.
Ownership Function
1.71 The Reserve Bank holds at presentshares in State Bank of India (SBI), NationalHousing Bank (NHB), InfrastructureDevelopment Finance Company (IDFC), DepositInsurance and Credit Guarantee Corporation(DICGC), NABARD, Bharatiya Reserve Bank NoteMudran Ltd. (BRBNML), Discount and FinanceHouse of India (DFHI) and Securities TradingCorporation of India (STCI). The Committee onBanking Sector Reforms (Chairman: M.Narasimham) 1998, was of the view thatappropriately, the Reserve Bank should not ownthe institutions it regulates. Furthermore, inJanuary 1999, the RBI Discussion Paper on‘Harmonising the Role and Operation ofDevelopment Financial Institutions and Banks’had suggested that the owership of financinginstitutions could ideally be delinked from theReserve Bank through transfer of suchownership to the Government. The ReserveBank accepted the recommendation for transferof ownership of its shares in SBI, NHB andNABARD to the Central Government. Given thecrucial importance and bearing of the issue, thematter has to be decided in consultation withthe Government of India. In respect of DICGC,Reserve Bank had already submitted proposal tothe Government for framing a new Act to make itconsistent with financial sector liberalisation. Inrespect of BRBNML, there is no intention to divestthe shareholding of the Reserve Bank at this stage,since the RBI is a captive customer and there areno regulatory implications. Currently, the ReserveBank holds only 10.50 per cent of the shares inDFHI and 14.40 per cent of the shares in STCI. Ithas decided to completely divest theseshareholdings in the current year.
Legal Reforms
1.72 The experience of the f inancialrestructuring process initiated since early-
1990s indicates that the success of financialsector reforms often hinges crucially onappropriate reforms of the underlying legalframework. Keeping this in view, important legalreforms initiated in the banking sector in therecent months include areas such as securitylaws, Negotiable Instruments Act, fraud onbanks and regulatory framework of banking. TheReserve Bank has forwarded itsrecommendations to the Central Governmentfor comprehensive amendments to the ReserveBank of India Act, 1934 and the BankingRegulation Act, 1949. In view of the increasinglevel and complexity of frauds in the bankingindustry, a Committee on legal aspects of bankfrauds has been constituted to define financialfrauds, lay down procedural laws, examine theprocess of investigation of bank frauds andprosecution of persons involved.
1.73 The Government of India constituted anExpert Committee (Chairman: Shri T. R.Andhyarujina) on legal reforms, which submittedits report in February 2000. As a follow upmeasure, the Government constituted a WorkingGroup on Asset Securitisation (Chairman: ShriS. H. Bhojani) in July 2000. This Working Grouphas submitted a draft Bill to the Government. Inorder to examine the vesting of powers with banksand financial institutions for taking possessionand sale of securities without intervention of thecourts and to draft a Bill for consideration,another Working Group was constituted by theGovernment in July 2000 (Chairman: Shri M. R.Umarji). The Working Group submitted its Reportto the Government alongwith the draft Bill inMay 2001.
New Capital Accord
1.74 The Basel Committee on BankingSupervision (BCBS) released the secondconsultative document on the proposed draftNew Capital Accord in January 2001 (Box I.2).The New Accord places greater emphasis onbanks’ own assessment of their risks incalculating their capital requirements. The newAccord will be effective from 2005. The feedbackreceived from a few banks on the same indicatedthat they would have to substantially upgradetheir existing MIS, risk management practicesand procedures and technical skills of the staff.Banks would, therefore, need to initiatenecessary steps to ensure that they are equippedto adopt the new Accord as and when approved.

15
Banking Developments and Perspectives
Interest Rate Policy
1.75 One of the main objectives of financialsector reforms has been to provide operationalflexibility to the banks. Deregulation of interestrates has been a major step in this direction. Amove was taken in October 1994 with theintroduction of the Prime Lending Rate (PLR) asthe minimum rate chargeable by banks to theirborrowers with credit limit above Rs.2 lakh.Thereafter, banks have been given autonomyto fix their own PLR and maximum spreadthereon. Currently, banks can determine theirown Prime Term Lending Rate (PTLR) and theyare also permitted to offer tenor linked PLRs.Effective April 19, 2001, commercial banks havebeen permitted to lend at rates below PLR toexporters and other creditworthy borrowersincluding public enterprises on the lines of atransparent and objective policy approved bytheir Boards.
Flexibility to Banks in Terms of Interest Rate onTerm Deposits
1.76 As the premature withdrawal of termdeposits may adversely impact the ALMfunctions of the banks, based oncommunications received from banks on thisissue, banks were given the freedom to exercisetheir discretion to disallow prematurewithdrawal of large deposits held by entitiesother than individuals and Hindu UndividedFamilies (HUF). Furthermore, renewal ofoverdue deposits at the rate of interestprevailing on the date of maturity would now beallowed only for an overdue period of 14 days. Incase the overdue period exceeds 14 days, thedeposits should be treated like fresh termdeposits and banks may prescribe their owninterest rate for the overdue period.
Interest Rate on FCNR (B) Deposits
1.77 Banks are free to accept FCNR (B)deposits for a maturity period of 1 to 3 yearsand offer fixed or floating rates. Till April 2001,floating rate deposits could be offered with aninterest reset period of six months, subject tothe ceiling of LIBOR/SWAP rates plus 50 basispoints for the corresponding maturity. Basedon the feedback received from the banks, itwas decided to revise the above cei l ingdownward to LIBOR/SWAP rates for thecorresponding maturity.
Restructuring of Weak Public Sector Banks
1.78 The recommendations of the WorkingGroup on restructuring weak public sectorbanks (Chairman: Shri M. S. Verma) wereexamined by the Reserve Bank and the ReserveBank’s views were conveyed to the Governmentin December 1999. The three areas which needto be considered in this context arerecapital isation, setting up of f inancialrestructuring authority and other measures.
(i) Recapitalisation
1.79 As a sequel to the recommendations ofthe Working Group, the Union Budget 2000–01announced that Government would considerrecapitalisation of weak banks to achieve theprescribed capital adequacy norms. Suchrecapitalisation, however, would be madesubject to a viable restructuring programme tobe drawn by the concerned banks that would beacceptable to both the Government of India andthe Reserve Bank. The Government of India didnot provide recapitalisation assistance to anyof the weak banks during 1999-2000 and 2000-01. While UCO Bank and United Bank of Indiahave maintained the prescribed CRAR of 9 percent as on March 31, 2001, Indian Bankcontinued to have negative net worth andnegative CRAR. In accordance with theGovernment’s directions, the three bankssubmitted restructuring plans for 2000-01 to2002-03. The recapitalisation requirements ofthe banks based on the plans and assessed by aHigh Level Committee appointed by theGovernment in December 2000 are currentlyunder consideration of Government of India.
(ii) Setting up of Financial Restructuring Authority
1.80 The Government of India had announcedthat Financial Restructuring Authority (FRA)comprising experts and professionals could alsobe set up for individual banks, if necessary, toturn around weak banks after due amendmentsare carried out in the Banking Companies(Acquisition and Transfer of Undertakings) Act,1970/1980. A draft of the proposed amendmentsto Banking Companies Act (Acquisition &Transfer of Undertakings) Act of 1970/1980 wasforwarded to Government in April 2000. TheGovernment has since introduced the BankingCompanies (Acquisit ion and Transfer ofUndertakings) Bill, 2000 in Parliament, which

16
Report on Trend and Progress of Banking in India, 2000-01
seeks to empower the Central Government tosupersede (based on the recommendations ofthe Reserve Bank) the Board of Directors of anynationalised bank and constitute the FinancialRestructuring Authority.
(iii) Other Measures
1.81 The three weak banks have implementedVRS and have achieved significant reduction ofexcess staff. The banks have taken steps torationalise their branch network and abolishZonal Offices. These banks are also takingvarious measures such as reduction of NPAs,lowering cost of deposits, increasing productivityand profitability for bringing about sustainedimprovement in their financial strength. TheReserve Bank and Government of India aremonitoring the progress achieved againstperformance targets fixed in consultation withthe banks in respect of all the above areas.
Frauds in Banks
1.82 During the year 2000-01, banks andfinancial institutions reported 50 cases of largevalue frauds (Rs. 1 crore and above) involvingRs.506.34 crore, as against 49 cases involvingRs.431.59 crore, during the previous year. Themajor factors which facilitated the perpetrationof frauds during the year included, amongothers, non-observance of the laid-downsystems and procedures by the bankfunctionaries, nexus or collusion of bank staffwith the borrowers/depositors, negligence onthe part of the dealing off icials/branchmanagers, commission of fraud by the bank staffthemselves, failure of internal control systemand inadequate appraisal of credit proposals andineffective supervision over advances.
1.83 Out of 50 cases of large value fraudsreported during the year, in 5 cases, bankofficials themselves perpetrated the frauds. Inas many as 10 cases, nexus or collusion of bankofficials with the fraudsters was observed. Inrespect of a few cases of fraud involving payorders reported by certain banks recently, nexusof a co-operative bank with the perpetrators ofthe fraud was also observed.
1.84 The Committee on Legal Aspects of BankFrauds (Chairman: Dr. N. L. Mitra) constitutedby the BFS submitted its Report in September2001. The terms of reference included chartingprocedural laws to deal with financial frauds,
examining the process of investigation of bankfrauds, providing suggestions to operationalisethe recommendations of previous Committeesrelating to legal aspects of bank frauds andexamining the role of Reserve Bank with regardto frauds reported by banks. The Reporthighlighted the limitations of the existing legalprovisions to deal with such cases in an effectivemanner and emphasised that efforts should bemade, both to prevent frauds and to deal firmlywith incidents of f inancial frauds. Itrecommended that financial institutions shoulddevelop, implement and monitor a Best PracticeCode (BPC). Citing cross-country examples, theCommittee categorised different types of fraudsand proposed legislative attention to deal withthe serious ones separately. It recommendedthat serious financial frauds should be treatedas criminal offence and the burden of proofshould be shifted on the accused to proveabsence of fraud. The Report also recommendedestablishment of Special Bureau, Court andprosecutors to deal with major frauds andprovided certain operational guidelines for theBureau, Court and the recovery of the defraudedamount. In order to facilitate the operation ofthe Bureau, it recommended the establishmentof a Statutory Fraud Committee under thechairmanship of the Reserve Bank nomineewith representation from other f inancialsupervisory authorities.
Technology in Banking
Payment and Settlement Systems
1.85 As part of restructuring of the bankingsector, special emphasis has been accorded toimprovements in payment and settlementsystems. Prominent among the measuresinitiated in these areas include introduction ofElectronic Funds Transfer (EFT), Real TimeGross Settlement System (RTGS), CentralisedFunds Management System (CFMS), the NDSand the Structured Financial MessagingSolution (SFMS). The SFMS would be thebackbone for all message-based communicationover the Indian Financial Network (INFINET).
Electronic Funds Transfer (EFT)
1.86 The EFT scheme enables transfer offunds within and across cities and betweenbranches of a bank and across banks. Thescheme, which is operated by the Reserve

17
Banking Developments and Perspectives
Bank is available for funds transfer acrossthirteen major cities in the country, as onSeptember 30, 2001. The facility is beingextended to two more centres. The scheme wasoriginal ly intended for small valuetransactions. However, with effect from October1, 2001, even large value transactions (as highas Rs. 2 crore) have also been permitted.
Real Time Gross Settlement System (RTGS)
1.87 The work on operationalisation of RTGSsystem continued during the year. The majorproject components completed during the yearincluded the finalisation of the design for RTGSsystem, issue of the tender for the developmentof the software, evaluation of the technicalcomponents of the bids received, site visits andevaluation of the commercial proposals. Theimplementation of RTGS is targeted to beaccomplished within 12 to 15 months of awardof the contract for software development andimplementation.
Centralised Funds Management System (CFMS)
1.88 The CFMS would enable the funds andtreasury managers of commercial banks toobtain the consolidated account-wise, centre-wise position of their balances with all the 17Deposit Accounts Departments (DAD) of theReserve Bank. The system has been testedprior to instal lat ion and phase-wiseimplementation commenced from November2001. The CFMS would enable better fundsmanagement by constituent current accountholders of the Reserve Bank.
Structured Financial Messaging Solution (SFMS)
1.89 At the base of all inter-bank messagetransfers using the INFINET is the SFMS. SFMSwould serve as a safe, secure communicationcarrier built with templates for transmissionof intra and inter-bank messages in fixedmessage formats, which would facil itate“Straight Through Processing”. SFMScomprises the central server in the form of ahub located at the Institute for Developmentand Research in Banking Technology (IDRBT),Hyderabad and individual bank gateways towhich the branches of the banks would beconnected with a provision for banks to havemultiple bank level gateways. The SFMS wouldprovide for all inter-bank transactions to bestored and switched at the central hub, while
intra-bank messages will be switched andstored by the bank gateway. Adequate securityin the form of smart card authentication apartfrom the Public Key Infrastructure (PKI) wouldbe an integral part of the SFMS. All these wouldresult in the security levels matching those ofinternational standards.
Working Group on Improvements in Monitoring ofClearing Systems
1.90 Following the recent developments in thebanking sector, a Working Group on‘Improvements in Monitoring of ClearingSystems’ was constituted by the Reserve Bankto examine the major issues pertaining tomanagement and operation of the ClearingHouses and make necessaryrecommendations. The Group submitted theReport in May 2001. The recommendations ofthe Group were discussed with a select groupof bankers and regulators. Based on thesediscussions, a roadmap has been drawn forimplementation of these recommendationswhich fall under the following major areas ofcontrol / monitoring viz., (a) monitoringpresentations by banks; (b) monitoring returnsby banks; (c) accounting of the clearingsettlements; (d) formation of an Internal Groupat each Regional Office of the Reserve Bank toreview the trends reported by the clearing houseand plan follow up action as deemed necessary;(e) formation of a central monitoring cell tomonitor the trends on a national basis and providewarning signals wherever necessary; and (f)implementation of MIS to serve as early warningsignals for better surveillance over the activitiesof the clearing member banks.
1.91 The recommendations which could beimplemented immediately are being taken upwith the four major metropolitan clearinghouses managed by the Reserve Bank. Actionon implementing these at the clearing housesmanaged by State Bank of India / other bankswould also be taken up concurrently.
Imaging of Instruments
1.92 A process of capturing the images of theinstruments as they are being processed wasintroduced during the year at the fourmetropolitan National Clearing Cells managedby the Reserve Bank. Imaging facilitates inquicker balancing during the cheque-

18
Report on Trend and Progress of Banking in India, 2000-01
processing cycle and also in reducing clearingreconciliation differences.
Electronic Clearing Services
1.93 Emphasis on widespread usage ofElectronic Clearing Service (ECS) is beingprescribed by the Reserve Bank to encouragenon-paper based funds movement. The primethrust areas forming part of this vital activityinclude the extension of ECS to more centres,inclusion of more customers under the ambitof the scheme and provision of a centralisedfacility for affording payments.
Indian Financial Network (INFINET)
1.94 The INFINET has been operational foralmost two years. Started as a closed user groupcommunication network for the banking sectorin India, the members of this network are thepublic sector banks. During the year 2000-01,the membership was opened up for other banksand f inancial institutions that need tocommunicate with one another.
Computerisation in Public Sector Banks
1.95 The progress in implementation of thedirective of the Central Vigilance Commission(CVC) on the need to computerise 70 per centof the banking business by public sector banksbefore January 1, 2001 revealed that as onDecember 31, 2000, 13 banks had achieved thedesired level. Figures as at end of March 2001,indicated that 23 banks have achieved thetarget, while two banks have computerisationlevels ranging between 60 per cent and 70 percent and two others were at a level below 60per cent.
Cheque Clearing
1.96 Magnetic Ink Character Recognition(MICR) based cheque-clearing accounts forabout 65 per cent of the value of chequesprocessed in the country. In addition, MagneticMedia Based Clearing Systems account for about10 per cent of the remaining value while claim-based processes cover the rest of clearing. It maybe pertinent to note that growth in chequevolumes has decelerated to 10 per cent in 2000-01 from 12 per cent during the previous year.This is reflective of general trends the worldover, indicating the migration towardselectronic funds transfer mechanisms.
Progress of the Committees Associated withDifferent Areas of Banking Supervision
Working Group on Consolidated Accounting
1.97 A multi-disciplinary Working Group hasbeen set up to look into the introduction ofconsol idated account ing and otherquant i tat ive methods for consol idatedsupervision of banks and bank groups. Therecommendations of the Group are expectedto be f inal ised shortly. The adoption ofconsolidated approach to supervision of bankswould also be in line with the requirementsre lat ing to Consol idated Superv is ionenunciated in the Core Principles of EffectiveBanking Supervision, put forth by the Bank forInternational Settlements.
Informal Group to Review Regulatory andSupervisory Arrangements
1.98 World over, f inancial innovations,technological development and blurring ofdistinction between financial institutions haveresulted in increasing integration of financialservices and markets. Technical advances havealso resulted in accelerated pace andcomplexities in financial products besides themanifold increase in volumes and turnover.Indian financial system is catching up fast withthese developments in the post-reform period.The regulatory regimes and supervisory systemsin the changing environment face newchallenges in safeguarding the integrity,efficiency, soundness and stability of thefinancial system. In India, the regulatory andsupervisory arrangements have been renderedcomplex in view of the existence of various typesof financial intermediaries with differentcharters. In the above background, an InformalGroup was constituted to prepare a Discussionpaper on regulatory and supervisoryarrangements in the financial sector. The paperwould include theoretical perspective,international practice and financial innovationsalong with its associated problems. It would alsocover the growing complexities of regulation andsupervision and the existing Indian position.
Internal Working Group on Control over Cost ofFunds in Public Sector Banks
1.99 As per the directions of BFS, an internalWorking Group was formed in August 2000 to

19
Banking Developments and Perspectives
undertake a study on control over cost of fundsin public sector banks. The Working Groupsubmitted its report along withrecommendations and the same was placedbefore the BFS in May 2001. The Board hasdirected to forward the study to banks and toconduct a high-level seminar on the issue soas to arrive at the best solutions.
Working Group on Non-SLR investments of Banks
1.100 A Working Group was constituted tostudy, inter alia, the methods of acquisition ofnon-SLR investments by banks. Subsequently,instructions were issued for classification andvaluation of investments in such securitiesheld by banks. Further, with a view to ensuringthat the investment by banks in non-ratedissues through private placement, both of theborrower customers and non-borrowercustomers, do not give rise to systemicconcerns, guidelines were issued in June 2001on measures to be taken by banks, includingguidelines on use of a suitable format ofdisclosure in respect of private placementissues. Banks and financial institutions wereadvised that effective October 2001, they wouldbe permited make fresh investments and holdbonds and debentures, privately placed andotherwise only in dematerial ised form.Outstanding investments should also beconverted into demat form by June 2002.
Working Group to Review Rating Model
1.101 A system of supervisory rating of banksoperating in India has been in vogue sinceinspection cycle of 1998-99. The objective ofintroducing the system of supervisory rating ofbanks is to summarise the performance ofindividual banks and also to assess theaggregate strength and soundness of thebanking system. The Indian banks are rated asper CAMELS model covering capital adequacy,asset quality, management, earnings, liquidityand systems and control, while the branches offoreign banks in India are rated as per CACSmodel covering capital adequacy, asset quality,compliance and systems. Each of thecomponents is rated on a scale of 1 to 100 marks,which are apportioned among various sub-parameters. The weighted average of the ratingof components is arrived at using respectiveweights assigned to each component reflecting
its importance. On the basis of weighted averageof the rating of components, composite rating isdetermined on a scale of A to D in the descendingorder of performance of banks.
1.102 Recently, a Working Group comprisingofficials of the Reserve Bank, scheduledcommercial banks, ICAI, and Credit Rating andInvestment Services India Limited (CRISIL)reviewed the rating models for bringing aboutimprovements. The purpose of this review wasto minimise the element of subjectivity incertain rating components and to make thecomposite rating more broad based. On the basisof the recommendations of the Group, a ratingmodel has been evolved.
Rural Credit, Housing Finance and Credit toSmall Scale Industries
Special Agricultural Credit Plans
1.103 The Reserve Bank has advised PSBs toprepare Special Agricultural Credit Plans (SACP)for increasing the credit flow to agriculture. Theplan prepared on annual basis indicate the self-set targets for disbursement to agriculture. Forthe financial year 2000-01, the disbursement toagriculture under this plan was Rs. 24,654 croreas against the projection of Rs. 25,893 crore. Forthe financial year 2001-02, the target fordisbursement has been set at Rs. 30,818 crore.
Small Scale Industries Sector
1.104 Commercial banks have been advised todispense with collateral requirements for thetiny sector for loans up to Rs.5 lakh. Similarly,to promote credit flow to small borrowers,composite loan limit for providing workingcapital and term loan through single window hasbeen increased from Rs.10 lakh to Rs.25 lakh.
Specialised SSI bank branches
1.105 Public sector banks have been advised tomake concerted efforts to operationalise at leastone specialised small scale industry (SSI)branch in every district and centres havingcluster of SSI units. The convenor of State LevelBankers Committee (SLBC) in each State hasbeen asked to monitor the progress in theoperationalisation of specialised SSI branches.As at the end of March 2001, there were 390specialised SSI bank branches in the country.
20
Report on Trend and Progress of Banking in India, 2000-01
Task Force to Study the Functioning of Co-operativeBanks and Suggest Measures for theirStrengthening
1.106 The Task Force to study the co-operativecredit system (Chairman: Shri Jagdish Capoor)submitted its Report in July 2000. Therecommendations were discussed in aconsultation meet organised by NABARD inDecember 2000 and in a Conference of ChiefMinisters held in August 2001. While consensuswas reached on several recommendations,divergent views were expressed by the States onthe proposed rehabilitation package, selectioncriteria for revitalisation and delayering of therural co-operative credit structure. TheGovernment of India, therefore, announced theformation of a Joint Committee under theChairmanship of the Minister of State for Financeto consider these issues.
Standing Advisory Committee for Small ScaleIndustries
1.107 A Standing Advisory Committee, underthe Chairmanship of a Deputy Governor wasconstituted in September 2000 to review the flowof institutional credit to the SSI sector. Theterms of reference of the Committee are to:
(a) review the flow of credit to the SSIsector and problems being faced by thissector in securing adequate credit;
(b) suggest improvements in the procedureof commercial banks and modificationin their policies as also those of theReserve Bank, to the extent desirable,in catering to the credit needs of theSSI sector;
(c) examine other related issues; and
(d) make recommendations which are relatedto or incidental to the above items.
Khadi & Village Industries Commission
1.108 A Consortium Scheme with the corpusof Rs.1,000 crore has been set up for the bankingsystem to provide finance to the Khadi and VillageIndustries Boards (KVIBs). As at the end ofSeptember 2001, an amount of Rs.437 crore wasoutstanding out of an amount of Rs.738 croredisbursed by the consortium under the scheme.
Relief Measures
1.109 In view of the devastating effect ofearthquake in the State of Gujarat in January
2001 resulting in widespread damage to theproperties and heavy loss of life, the ReserveBank announced a package of relief measuresfor the State. The loan classification status incase of borrowers affected by the earthquake isfrozen on an ‘as-is-where-is’ basis until March31, 2003. In regard to standard assets, nodemand for recovery would be made for two years,while in regard to loans not classified asstandard assets no penalties would be levied inthe event of non-receipt of repayments dueduring the next two years.
1.110 Notwithstanding the present loanclassification status, the affected small traders,small business, self-employed and small roadtransporters, etc., would be sanctioned freshloans up to Rs. 1 lakh for the purpose ofrestoration/rehabilitation of their business atinterest rates not exceeding PLR. Banks havealso been advised to grant loans up to Rs. 2 lakhat interest rate not exceeding PLR for repairs/reconstruction of houses/shops damaged by theearthquake. Loans for repair/construction ofhouses and shops and to small traders, smallbusiness, self-employed and small road transportoperators, etc., would be reckoned as prioritysector lending. In respect of agricultural loans,banks are not to recover principal or interestfrom the affected farmers for a period of two yearswith a provision for rescheduling up to 7 years.On the request from NHB, the Reserve Bank hassanctioned a long-term loan of Rs.1,000 croreat 6.0 per cent rate of interest per annumrepayable over 18 years ( inclusive ofmoratorium period of 3 years) solely for thepurpose of extending finance/refinance for thereconstruction of houses etc., in the earthquakeaffected areas of Gujarat.
1.111 The interest on additional limits wouldbe at PLR up to Rs. 10 lakh and at banks’discretion beyond Rs.10 lakh. The interest onrescheduled loans would be charged at 10 per centper annum at simple rate up to end-March 2003and thereafter at PLR. For purposes of interest rateon loans to affected borrowers, all banks woulduniformly apply PLR of the SBI. Relief/concessionsfor affected exporters include extending the periodof packing credit at concessive rate of interest upto360 days from date of advance, conversion ofoverdue packing credit into short-term loansrepayable in suitable instalments and relaxationin NPA classification norms.

21
Banking Developments and Perspectives
Housing Finance
1.112 Certain types of credit extended bycommercial banks for housing is now reckonedas priority sector. These include both direct andindirect housing finance. The types of directfinance which have been brought under theambit of priority sector include loans up to Rs. 5lakh in rural and semi-urban areas and up toRs. 10 lakh in urban and metropolitan areas forconstruction of houses granted to individuals.It also includes loans up to Rs. 50,000 for repairsto damaged houses by individuals. The types ofindirect housing finance which have been madepart of priority sector lending include assistancegiven to any governmental agency or forconstruction of houses or for slum clearance andrehabilitation of slum dwellers subject to aceil ing of Rs. 5 lakh per housing unit.Assistance given to a non-governmental agencyapproved by the NHB for the purpose of refinancefor construction of houses or for slum clearanceand rehabilitation of slum dwellers subject to aceiling of loan component of Rs. 5 lakh perhousing unit is also included in the scheme.Furthermore, subscription to bonds issued byNHB and Housing and Urban DevelopmentCorporation (HUDCO) exclusively for financingof housing, irrespective of the loan size perdwelling unit, would also be considered as loansto priority sector.
3. Perspectives
1.113 The banking sector has come intoincreased focus in recent years. The problemsin south-east Asian economies, therecessionary trends in the Japanese economy,the financial sector problems encountered inLatin American economies and more recently,in some central European economies haveprovided graphic evidence of how a weakbanking sector can undermine confidence inmacroeconomic policies. It is, therefore, nolonger possible for developing countries to delaythe introduction of structural reforms, stricterprudential and supervisory norms, greatertransparency and increased accountability notonly to ensure the stability of the financialsystem, but also to enhance competitiveness.Since the initiation of reform process in India,considerable attention has been devoted toimprove the efficiency and health of thebanking sector.
1.114 Towards this end, the recent policymeasures have continued to focus on structuralmeasures to strengthen the financial systemand to improve the functioning of the varioussegments of the financial markets. The UnionBudget for 2000-01 carried forward reform inpublic sector banking by announcing intentionfor a more diversified ownership for public sectorbanks, establishment of financial restructuringauthority, debt recovery tribunals, creditinformation bureaus and legislativeamendments to accord greater operationalflexibility to the Reserve Bank. At the sametime, several Expert Groups/Advisory Groupssubmitted their recommendations on variousfacets of the financial sector and various policymeasures were accordingly initiated.
1.115 In the light of positioning of appropriatemeasures towards safeguarding the health andstability of the banking sector, there are severalissues that need to be pro-actively addressed.These issues can be broadly categorised underthree major heads: (a) strengthening ofprudential norms; (b) redefining of the regulatoryrole of the Reserve Bank in order to make it moreefficient and purposeful; and, (c) introduction ofstructural changes in the system.
(a) Strengthening of Prudential Norms
Capital Adequacy
1.116 Imposition of minimum capital adequacyrequirements promotes prudent management ofcommercial banks. As at end-March 2001, outof 27 PSBs, as many as 25 had CRAR exceedingthe stipulated minimum of 9 per cent. Only twoPSBs had CRAR below the stipulated minimum,but they accounted for 4.3 per cent of total assetsof PSBs as at end-March 2001.
1.117 The Basel Committee on BankingSupervision (BCBS) had released its commentson the new Capital Accord in January 2001,which is expected to be more sensitive to thelevel of underlying economic risks. In additionto the minimum capital standard taking intoaccount the credit rating, the new norms giveemphasis on supervisory oversight of capitaladequacy at the level of an individual banktogether with market discipline and betterpublic disclosure. The range of options for capitalprovisioning would facilitate banks with varyingdegrees of sophistication to adopt appropriatemethods with supervisory validation (Box I.2).

22
Report on Trend and Progress of Banking in India, 2000-01
The structure and operations of banks have undergonea rapid transformation in recent years. Consequentupon the revolution in information technology and theassociated increase in competition, both at nationaland international levels, financial intermediaries havebecome increasingly global in geographical coverageand universal in their f inancial operations,encompassing a wide range of activities includingbanking, securities markets activities and insurance.In the face of widespread concerns about decliningprofitability of banks, especially in the ‘eighties, theBasel capital adequacy norms were enacted in 1988.
Although the Basel norms helped to arrest the erosionof banks’ capital ratios, concerns were raised regardingthe mere applicability of baseline capital ratios in thechanged environment of operations. The blurring ofboth functional as well as national divisions amongthe f inancial intermediaries, and the speed andcomplexity of adjustment made it difficult for regulatorsto keep up with the growing pace of change. Inparticular, the rule of ‘one-size-fits-all’ aspect of thecapital adequacy ratio was the subject of intense debateand recent banking crises only emphasised the pointthat baseline capital adequacy norms were not adequateto hedge against failures. In response to the same,the Basel Committee on Banking Supervision (BCBS)came out with the new Consultative Paper on CapitalAdequacy in June 1999 and invited suggestions fromthe policymakers, academia and other institutes allover the world by March 2000. After taking intoconsideration the manifold suggestions of the variousorganisations, the second Consultative Paper onCapital Adequacy was released in January 2001. Thenew rules will take effect by 2005.
The Accord rests on three pillars: the first pillar ofminimum capital requirement, the second pillar ofsupervisory review process and the third pillar ofmarket discipline. The first pillar sets out the minimumcapital requirements. The new framework maintainsboth the current definition of capital and the minimumrequirement of 8 per cent of capital to risk-weightedassets. The revised Accord will be extended on aconsolidation basis to holding companies of bankinggroups. The Accord stresses upon the improvementin the measurement of r isks. The credit r iskmeasurement methods have been made more elaboratethan those in the existing Accord. The new frameworkalso emphasises the measurement of operational risk.For measuring credit risk, two options have beenproposed. The first is the standardised approach andthe second is the internal rating based (IRB) approach.Under the standardised approach, the exist ingapproach for credit risk remains conceptually thesame, but the risk-weights have been enlarged toencompass exposures to a broad category of borrowerswith reference to the rating provided by ratingagencies. For example, for corporates, the existingAccord provides only a single uniform risk-weight of100 per cent, but the new Accord provides fourcategories-20 per cent, 50 per cent, 100 per cent and150 per cent, based on the rating of the corporate.Under the IRB approach, on the other hand, bankswill be allowed to use its internal estimates of theborrower’s creditworthiness to assess credit risk inthe portfolio subject to strict methodological anddisclosure standards.
Box I.2: The New Basel Capital Accord
The second pillar would seek to ensure that each bankhas sound internal processes in place to assess theadequacy of capital based on a thorough evaluationof i ts r isks. The new framework focuses on theimportance of bank management in developing aninternal capital assessment process and sett ingtargets for capital that are commensurate with thebanks part icu lar r isk pro f i l e and contro lenvironment. Supervisors would be responsible forevaluating how well the banks are assessing thecapital adequacy needs relative to their risks. Theinterna l processes would then be subjected tosuperv isory rev iew and intervent ion, whenappropriate.
The third pillar aims at bolstering market disciplinethrough enhanced disclosure by banks. Effectivedisclosure is essential to ensure that marketparticipants can better understand banks risk profileand the adequacy of their capital position. The newframework sets out disclosure requirements in severalareas, including the way in which banks calculatetheir capital adequacy and their risk assessmentmethods.
The new Accord, when implemented, is expected tohave far-reaching implications. The banks ever-increasing awareness of credit risk and the higherreliance on advanced risk management techniquescould lead to further consolidation through mergersand acquisit ions. I t is essential ly the emergingeconomies, which are st i l l encountering severalstructural issues, and where banks remain thedominant f inancial intermediaries, which mightencounter problems in implementation of thesestandards and therefore would require some flexibilityin their approach. First, the New Accord is quitecomplex in view of its sophistication and could, overthe next couple of years, shift scarce supervisoryresources away from direct supervision towardsimplementation of these specific proposals. Secondly,as a corollary of the earlier point, this complexity ofthe New Accord would demand enormous skill, whichdomestic banks may find hard to obtain. Thirdly,because of the increased flow of resources to capitalregulation, bank capital may be seen as a panacea forthe prevention of bank fai lure and supervisoryoversight in respect of other bank-specific parametersmight become common, more so in the belief thatadequate capital would keep banks insulated fromfailure. As observed in the second Consultative Paper,increased capital ratios should not be viewed as theonly option for addressing increased risks confrontingthe bank. Other methods for addressing risk, such asstrengthening risk management, applying judiciousexposure limits and improving internal controls shouldbe considered as well. Fourthly, increased relianceon external rating agencies could lead banks to loosentheir own credit rating models and place explicitresponsibility on supervisors to take such agenciesinto their regulatory fold.
References:Basel Committee on Banking Supervision (2001), ‘TheNew Basel Capital Accord ’ , Bank for InternationalSettlements, Switzerland.
Mayer, L. (2001), ‘The New Basel Capital Proposal’, BISReview No. 40.

23
Banking Developments and Perspectives
1.118 In its comments on the New Accord, theReserve Bank has underlined the need for thenew Accord to be initially applied tointernationally active banks (defined as bankswith cross-border banking business exceeding 15per cent of their total business). Secondly, theReserve Bank has observed that External CreditAssessment Institutions (ECAIs) should not beassigned the direct responsibility for assessingrisk of banking book assets. This view stems fromthe fact that in the recent past, the credit ratingagencies had resorted to sudden downgrading ofcertain countries, which experienced financialcrises, that exacerbated the tendency offinancial institutions for rapid withdrawal.Thirdly, the Reserve Bank has noted that risk-weighting of banks should be de-linked from thatof the sovereign in whose jurisdiction they areincorporated. Instead, preferential risk-weightsshould be assigned on the basis of theirunderlying strengths and creditworthiness. Asregards claims on corporates, the Reserve Bankhas proposed that while internationally activebanks may be required to follow the InternalRating Based (IRB) approach, a simplifiedstandardised approach may be evolved for otherbanks, whereby standardised risk-weightsranging from 20 to 150 per cent could be assignedon the basis of internal ratings of banks.
1.119 The new capital norms, whenimplemented, may demand a greater amount ofcapital for the banking system as a whole. Thecapital of the PSBs has increased in three ways:Government capital infusion, equity issues tothe public and retained earnings. TheGovernment’s total contribution of overRs.20,000 crore between 1992-93 and 1998-99,equivalent to an annual average of nearly 0.3per cent of GDP, has primarily been in the formof non-marketable Government bonds paying 10per cent. Equity issues by 12 PSBs till 2000-01have aggregated Rs.6,527crore, with the StateBank of India going to the market twice, in 1993and thereafter in 1996. The banks also raisedtier-II capital. In order to discourage issue oftier-II capital bonds to other banks, a ceiling of10 per cent of the investing banks’ total capitalhas been prescribed for its aggregateinvestments in the tier-II capital of banks.
Non-performing Assets
1.120 Non-performing assets have beensubstantially reduced since regulation was
tightened in 1993, but improvement hasrecently slowed down and the levels of NPAsremain high compared to internationalstandards. In 2001, the commercial bankingsystem’s gross NPA to gross advances ratio was11.4 per cent; net of provisions it was 6.2 percent. The public sector banks’ NPAs witnesseda decline in 2001, with the gross NPA to grossadvances ratio being 12.4 per cent, as comparedwith14.0 per cent in 1999-2000; net ofprovisions, the corresponding figures were 6.7per cent and 7.4 per cent, respectively.
1.121 An effective resolution of the problem ofNPAs is hampered on account of a sizeableoverhang component arising from infirmities inthe existing process of debt recovery, inadequatelegal provisions on foreclosure and bankruptcyand difficulties in the execution of court decrees.Any solution to the overhang problem of largemagnitude requires well-crafted medium to long-term actions, devoted to specific definition ofgoals and negotiation of the process rather thanad hoc approaches.
1.122 Needless to mention, a lasting solutionto the problem of NPAs can be achieved only withproper credit assessment and risk managementmechanisms. For instance, in a situation ofliquidity overhang, the enthusiasm of thebanking system to increase lending couldcompromise on asset quality, raising concernsabout adverse selection, and the potentialdanger of addition to the stock of NPAs. It is,therefore, necessary that the banking systemis equipped with prudential norms to minimise,if not completely avoid the problem.
1.123 As regards internal factors leading toNPAs, the onus for containing the same restswith the banks themselves. This wouldnecessitate organisational restructuring,improvement in managerial efficiency, skillupgradation for proper assessment ofcreditworthiness and a change in the attitudeof the banks towards legal action, which istraditionally viewed as a measure of the lastresort.
Prudential Norms for Loan Classification
1.124 With a view to moving towardsinternational best practice and to ensuregreater transparency, the Reserve Bank hasannounced the intention of moving towards thenorm of 90 days classification from the year

24
Report on Trend and Progress of Banking in India, 2000-01
ending March 31, 2004. Banks have beenadvised to incorporate a condition in the loanagreement for obtaining the consent of theborrowers to disclose their names in the eventof their becoming defaulters. Considering thathigher loan loss provisioning adds to the overallfinancial strength of the banks and the stabilityof the financial sector, banks are urged tovoluntarily set apart provisions much above theminimum prudential levels as a desirablepractice.
Legal Framework
1.125 The issue of NPAs is closely related to thestate of legal framework. The legal frameworksets standards of behaviour for marketparticipants, details about rights andresponsibilities of transacting parties, assuresthat completed transactions are legally bindingand provides regulators with the backing toenforce standards and ensure compliance andadherence to law.
1.126 At the policy level, there is the need forlegislation, which will make recovery processessmoother and legal action quicker. Banks havebeen provided with a menu of alternatives suchas Debt Recovery Tribunals (DRT), Lok Adalatsand Asset Reconstruction Companies. A CreditInformation Bureau has been established witha paid-up capital of Rs.25 crore, in order to co-ordinate sharing of information on the borrowersof credit institutions. The Reserve Bank hasalso provided indicative guidelines forcompromise settlement of chronic NPAs in thesmall-scale sector. Settlement AdvisoryCommittees have also been formed at regionaland head office levels. Another method whichhas been proposed is Corporate DebtRestructuring (CDR) (Box 1.3). Thesealternatives wil l create the enablingenvironment for the appropriate legal reforms,which are being addressed jointly by the ReserveBank and the Government of India.
Universal Banking
1.127 The policy regarding approach toUniversal Banking was enunciated in theannual monetary and credit policy Statementof April 2000. The salient operational andregulatory issues to be addressed by thefinancial institutions for conversion into auniversal bank were also communicated
through a circular in April 2001. These issuesrelate to, among others, reserve requirements,permissible activities, disposal of non-bankingassets, composition of the Board, prohibition onfloating charge of assets, nature of subsidiaries,restrictions on investments, connected lending,licensing, branch network, assets in India,formats of annual report, priority sector lendingand prudential norms. In the Mid-term reviewStatement of October 2001, the Reserve Bankhas stated that the applications received fromthe concerned institutions would be processedin the light of considerations outlined in RBI’scircular to FIs on approach to Universal Bankingin April 2001.
1.128 In processing a specific proposal, theoverwhelming consideration will be to meet thestrategic objectives of the concerned financialinstitution for meeting the varied needs ofdifferent categories of customers, while at thesame time ensuring healthy competition in thefinancial system through transparent andequitable regulatory framework applicable to allthe participants in banking business. It needsto be recognised that the movement towardsuniversal banking should foster stability andefficiency of the financial system, but by itselfit cannot provide a viable or sustainable solutionto the operational problems of individualinstitutions arising from low capitalisation,high level of NPAs, large asset–l iabil itymismatches, liquidity, etc. While taking aflexible view on each application, particularattention will be paid to the primary need toensure safety of public deposits, especially ofsmall depositors, and to promote the continuedstability of the financial system as a whole, andof the banking system in particular.
Recapitalisation
1.129 The experience of bank recapitalisationin several parts of the world has demonstratedthat the exercise of recapitalisation does notnecessarily prevent banks from getting intotrouble again. In fact, it often serves to distortthe incentive structure, erode discipline andreaffirm the faith of these institutions in the‘deep pockets’ of the Government.Recapitalisation of weak banks using publicmoney is also a costly and unsustainable option,in view of the increasing strains on theGovernment exchequer. Till 1999-2000, the
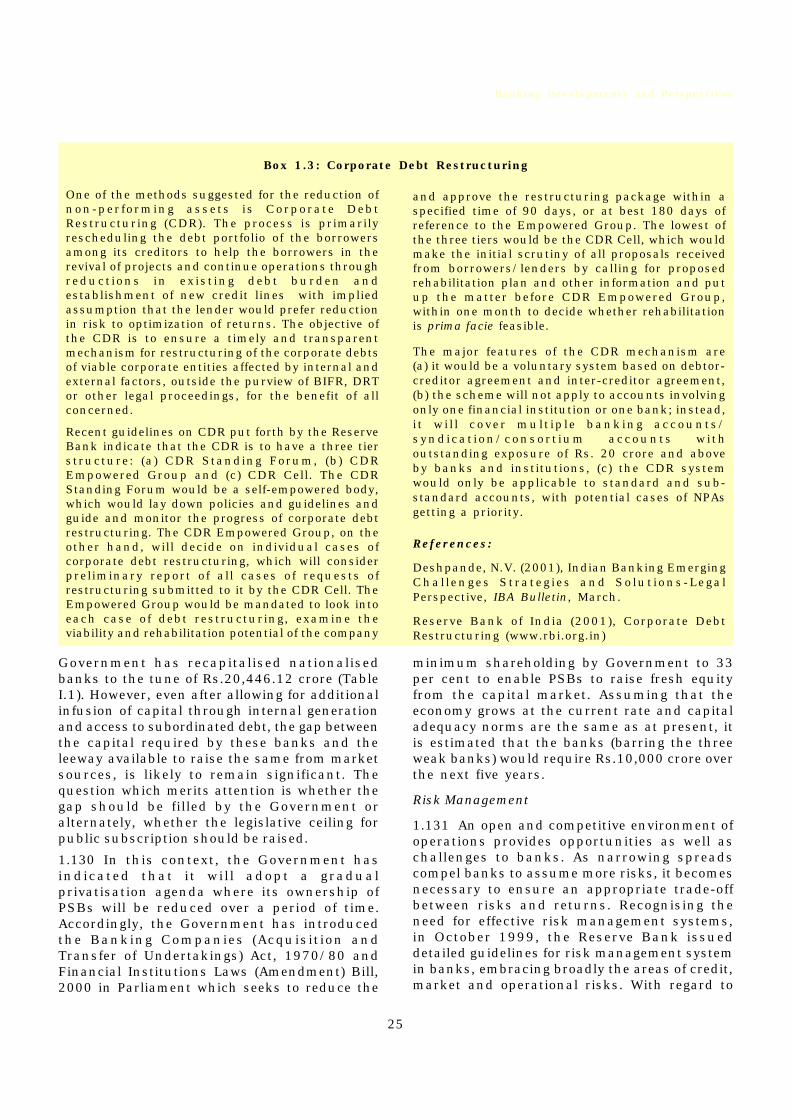
25
Banking Developments and Perspectives
One of the methods suggested for the reduction ofnon-performing assets is Corporate DebtRestructuring (CDR). The process is primarilyrescheduling the debt portfolio of the borrowersamong its creditors to help the borrowers in therevival of projects and continue operations throughreductions in exist ing debt burden andestablishment of new credit lines with impliedassumption that the lender would prefer reductionin risk to optimization of returns. The objective ofthe CDR is to ensure a timely and transparentmechanism for restructuring of the corporate debtsof viable corporate entities affected by internal andexternal factors, outside the purview of BIFR, DRTor other legal proceedings, for the benefit of allconcerned.
Recent guidelines on CDR put forth by the ReserveBank indicate that the CDR is to have a three tierstructure: (a) CDR Standing Forum, (b) CDREmpowered Group and (c) CDR Cell. The CDRStanding Forum would be a self-empowered body,which would lay down policies and guidelines andguide and monitor the progress of corporate debtrestructuring. The CDR Empowered Group, on theother hand, will decide on individual cases ofcorporate debt restructuring, which will considerpreliminary report of all cases of requests ofrestructuring submitted to it by the CDR Cell. TheEmpowered Group would be mandated to look intoeach case of debt restructuring, examine theviability and rehabilitation potential of the company
Box 1.3: Corporate Debt Restructuring
and approve the restructuring package within aspecified time of 90 days, or at best 180 days ofreference to the Empowered Group. The lowest ofthe three tiers would be the CDR Cell, which wouldmake the initial scrutiny of all proposals receivedfrom borrowers/lenders by calling for proposedrehabilitation plan and other information and putup the matter before CDR Empowered Group,within one month to decide whether rehabilitationis prima facie feasible.
The major features of the CDR mechanism are(a) it would be a voluntary system based on debtor-creditor agreement and inter-creditor agreement,(b) the scheme will not apply to accounts involvingonly one financial institution or one bank; instead,i t wi l l cover mult iple banking accounts/syndicat ion/consort ium accounts withoutstanding exposure of Rs. 20 crore and aboveby banks and institutions, (c) the CDR systemwould only be applicable to standard and sub-standard accounts, with potential cases of NPAsgetting a priority.
References:
Deshpande, N.V. (2001), Indian Banking EmergingChal lenges Strategies and Solut ions-LegalPerspective, IBA Bulletin, March.
Reserve Bank of India (2001), Corporate DebtRestructuring (www.rbi.org.in)
Government has recapitalised nationalisedbanks to the tune of Rs.20,446.12 crore (TableI.1). However, even after allowing for additionalinfusion of capital through internal generationand access to subordinated debt, the gap betweenthe capital required by these banks and theleeway available to raise the same from marketsources, is likely to remain significant. Thequestion which merits attention is whether thegap should be filled by the Government oralternately, whether the legislative ceiling forpublic subscription should be raised.
1.130 In this context, the Government hasindicated that it wil l adopt a gradualprivatisation agenda where its ownership ofPSBs will be reduced over a period of time.Accordingly, the Government has introducedthe Banking Companies (Acquisition andTransfer of Undertakings) Act, 1970/80 andFinancial Institutions Laws (Amendment) Bill,2000 in Parliament which seeks to reduce the
minimum shareholding by Government to 33per cent to enable PSBs to raise fresh equityfrom the capital market. Assuming that theeconomy grows at the current rate and capitaladequacy norms are the same as at present, itis estimated that the banks (barring the threeweak banks) would require Rs.10,000 crore overthe next five years.
Risk Management
1.131 An open and competitive environment ofoperations provides opportunities as well aschallenges to banks. As narrowing spreadscompel banks to assume more risks, it becomesnecessary to ensure an appropriate trade-offbetween risks and returns. Recognising theneed for effective risk management systems,in October 1999, the Reserve Bank issueddetailed guidelines for risk management systemin banks, embracing broadly the areas of credit,market and operational risks. With regard to

26
Report
on
T
ren
d
an
d
Pro
gre
ss of
Ban
kin
g
in
India
, 2
00
0-0
1
Table I.1: Nationalised Banks whose capitals were subscribed by the Government ofIndia out of Budget provisions/Banks whose investments were written down/Banks whose capital was returned to Government
(Rs.crore)
Sr. Name of the/ Capital subscribed/written down (*)/Capital Returned to Government (**)No.
Bank
2000- 1999- 1998-99 1997-98 1996-97 1995-96 1994-95 1993-94 Upto Total01 2000
Tier-I 1992-93
Feb. 1995 Dec. 1994 Tier-II
1 2 3 4 5 6 7 8 9 10 11 12 13 14
1. Allahabad Bank — — 532.00* 160.00 — 356.20 101.61 90.00 171.33
2. Syndicate Bank 942.62* — — 172.00 — 278.59 88.79 680.00 148.50
3. Bank ofMaharashtra 418.18* — — 80.00 94.61 239.58 — 150.00 182.08
4. Punjab andSind Bank 462.47* — 150.00 72.00 — 116.03 — 160.00 205.61
5. UCO Bank 200.00 350.00 54.00 110.00 235.56 279.96 — 535.00 492.00
6. United Bankof India 100.00 — 338.00 256.00 67.44 471.43 — 215.00 360.19
7. Andhra Bank 47.95** 243.37* — 165.00 — 75.72 108.60 — 150.00 89.00
8. Central Bankof India — — 500.00 — — 632.46 — 490.00 175.74
9. Vijaya Bank 297.07* — — 302.00 — — 62.31 — 65.00 125.72
10 Bank ofBaroda — — 381.00** — — — — 400.00 163.00
11. Canara Bank 507.10* 600.00 — — — — — 365.00 112.50
12. CorporationBank — — 30.00** — — — — 45.00 65.40
13. Bank of India — — 93.47** 1,369.91* — 848.38 348.22 635.00 455.00
14. Dena Bank — — — 136.29* — 6.11 72.28 130.00 145.63
15. Indian Bank 100.00 1,750.00 — — — 230.96 180.94 220.00 194.00
16. Indian OverseasBank — — 1,000.00* — — 258.60 132.74 705.00 357.00
17. Oriental Bank ofCommerce — — — — — — — 50.00 76.90
18. Punjab NationalBank — 138.33** — — — 425.43* — 415.00 165.00
19. Union Bankof India — — — — — — — 200.00 132.00
Capital Subscribed 400.00 2,700.00 1,509.00 850.00 473.33 3,889.21 924.58 5,700.00 4,000.00@ 20,446.12
Capital Written down 297.07 2,573.74 — 1,532.00 1,506.20 — 425.43 — 6,334.44
Capital Returned to Govt. 47.95 138.33 504.47 690.75
* Written down ** Capital Returned to Government
@ Including an amount of Rs. 183.40 crore towards capital subscription by the Government to the erstwhile New Bank of India.

27
Banking Developments and Perspectives
credit risk, it was suggested that banks shouldput in place the loan policy, approved by theBoard of Directors, covering the methodologiesfor measurement, monitoring and control ofcredit risk. The guidelines also require banksto evaluate portfolio on an on-going basis, ratherthan near about the balance sheet date. Asregards off-balance sheet exposures, the currentand potential credit exposures may be measuredon a daily basis. Banks have also been asked tofix a definite time-frame for moving over toduration and Value-at Risk (VaR) approaches formeasurement of interest rate risk.
Corporate Governance
1.132 Corporate governance acts a ‘copingmechanism’ in order to enable the participantsto reap the full benefits of reforms. Corporategovernance has as its backbone a set oftransparent relat ionships between aninst i tut ion’s management, i ts Board,shareholders and other stakeholders. It shouldtherefore take into account a number ofaspects such as enhancement of shareholder’svalue, protection of rights of shareholders,composition and role of Board of Directors,integrity of accounting practices and disclosurenorms and internal control system. As far asthe banking industry is concerned, corporategovernance relates to the manner in which thebusiness and affairs of individual banks aredirected and managed by their Board ofDirectors and senior management. It alsoprovides the structure through whichobjectives of the institution are set, thestrategy of attaining those objectives isdetermined and the performance of theinstitution is monitored.
1.133 The paper of the Basel Committee forBanking Supervision (BCBS) on the subjectenvisages certain strategies and techniquesbasic to sound corporate governance in banks.Basic elements of corporate governance arecapable and experienced Directors in the Board,efficient management, coherent strategy andbusiness plan and clear lines of responsibilityand accountabil ity. While the primaryresponsibility for good corporate governance inbanks rests with the Board of Directors, the rolesplayed by the Government, regulator, auditorsand banking industry associations are equallyimportant.
1.134 The Advisory Group on CorporateGovernance (Chairman: Dr. R.H.Patil) hadobserved that since most of the Indiancompanies belong to the East Asian insidermodel, where the promoters dominategovernance, it is essential to bring reformsquickly so as to make boards of corporates/banks/financial institutions/public sectorenterprises more professional and trulyautonomous. As the statutory framework forcorporate governance has already been providedin the Companies Act, the Group felt that it isdesirable to amend the Companies Act suitablyfor enforcing good governance practices in India.Contextually, the Advisory Group on BankingSupervision (Chairman: Shri M.S.Verma) hadalso made certain recommendations relating tocorporate governance in banks (Box II.4).
(b) Redefining the Regulatory Role of theReserve Bank
Regulation and Supervision
1.135 Prudential regulation and supervisionhave formed a critical component of thefinancial sector reform programme since itsinception, and India has adopted internationalprudential norms and practices with regard tocapital adequacy, income recognition,provisioning requirement and supervision.These norms have been progressively tightenedover the years, particularly against the backdropof the Asian crisis. Recently, the requiredcapital adequacy ratio has been increased to 9per cent, from 8 per cent, in the banking sector.The mark-to-market practice for valuation ofgovernment securities has been graduallyenhanced from 30 per cent in 1992-93 to 75 percent in 1999-2000 and subsequently, revisedguidelines for valuation and classification ofinvestments have been implemented to alignwith international best practices.
1.136 In the area of supervision, a full-fledgedinstitutional mechanism has been developedkeeping in view the needs of a strong and stablefinancial system. The system of off-sitesurveillance has been combined with periodicalon-site supervision for monitoring the risk profileof banks and their compliance with prudentialguidelines. The assessment had shown that mostof the Core Principles for Effective BankingSupervision are already provided in our existing
28
Report on Trend and Progress of Banking in India, 2000-01
legislation or current regulations and attempts areunderway to rectify the gaps between existingpractice and principles in areas where certainshortcomings exist.
1.137 Keeping in line with the emergingregulatory and supervisory standards atinternational level, the Reserve Bank hasinitiated some macro level monitoring techniquesto assess the true health of the supervisedinstitutions. The format of balance sheets ofcommercial banks have now been prescribed bythe Reserve Bank with disclosure standards onvital performance and growth indicators,provisions, net NPAs, staff productivity, etc.appended as ‘Notes to Accounts’. To bring in furthertransparency in the banks’ published accounts,the Reserve Bank has also advised the banks todisclose data on movement of NPAs and provisionsas well as lending to sensitive sectors. Theseproposed additional disclosure norms would bringthe disclosure standards almost on par with theinternational best practices.
1.138 The Reserve Bank has instituted amechanism for critical analysis of the balancesheet by the banks themselves and thepresentation of such analysis before their boardsto provide an internal assessment of the health ofthe bank. The analysis which is made availableto the Reserve Bank forms a supplement to thealready stabilised system of off-site monitoring ofbanks.
Co-operative Banking
1.139 The year under review witnessed anemergence of several challenges, especially in theurban co-operative banks (UCBs). This segmenthas been exposed to certain weaknesses that needto be remedied on an urgent basis. Apart from themultiple regulatory authorities involved in theirsupervision and inspection, the sheer numbersand their dispersed and local character, with adifferent niche clientele can affect the regularprogramming of inspections by supervisors. Inview of the above, supervision of UCBs often provesto be a challenging proposition for the ReserveBank. In this context, the Monetary and CreditPolicy of April 2001 has emphasised the creationof a separate apex supervisory authority which cantake over the entire inspection/supervisoryfunctions in relation to scheduled and non-scheduled UCBs with manpower and otherassistance to the new supervisory body, when
created. Greater co-ordination and informationsharing will also be required among regulators inview of the increasing integration of the varioussegments of the financial market and overlaps inthe areas of operation of different types of financialinstitutions.
International Financial Standards and Codes
1.140 Recent experiences that havedemonstrated the vulnerabilities of financialsystems to contagion from across national bordersand the close correlation of the risks faced byfinancial systems across countries, havehighlighted the necessity for greater homogeneityin the supervisory norms and practices of variouscountries and closer co-ordination betweencountries in terms of regulation of their financialsystems.
1.141 India, while supporting the need to observecertain minimum universally accepted standardsin areas relevant to the maintenance of stabilityin the international monetary system, hasadvocated a voluntary approach taking intoaccount the institutional framework, legalinfrastructure and stage of development of variouscountries. India’s approach to the process ofconvergence has been two-fold. At theinternational front, India has been closelyassociated with international bodies involved inthe process of setting standards and formulatingpractices for effective supervision of financialsystems and has sought to voice its opinion duringthe process of formulation of new standards. Thus,India has been closely associated with standardsetting bodies such as the Core Principles LiaisonGroup and Group on Joint Task Force on SecuritiesSettlement Systems constituted by the Committeeon Payment and Settlement Systems (CPSS) andInternational Commission of SecuritiesCommissions (IOSCO).
1.142 On the domestic front, the Reserve Bank,in consultation with the Government of India,set up a Standing Committee on InternationalFinancial Standards and Codes under theChairmanship of Dr. Y.V. Reddy, DeputyGovernor (and the Finance Secretary asAlternate Chairman) to guide the process ofconvergence to international financial standardsand codes. In the face of rapid changes in thebanking sector in the recent years, theCommittee envisaged a systematic approach toimplementation of international standards and

29
Banking Developments and Perspectives
codes consisting of recognition, identificationand recording of standards and codes in therelevant areas, followed by detailed assessmentof the present status of compliance,applicability, relevance and feasibility ofcompliance. Preparation of roadmaps andrecommendations of possible time-frame forconvergence to such standards as are relevant,applicable and feasible constitute the other stepsin the process. The next stage in the processinvolves making efforts for the widest possibledissemination of the expert opinion so as toinvolve public authorit ies and otherstakeholders and generate an informed debateto sensitise public opinion on the subject.
Macro-prudential Indicators and Micro-prudentialFramework
1.143 The health and stability of the econonmyhas traditionally been measured byMacroeconomic Indicators (MEIs). Financialsector supervisors have been using their ownset of Microprudential Indicators, based onCAMELS framework. Following the east-Asiancrisis, the interest in a combine of AggregatedMicroprudential Indicators (AMPIs) and MEIs hasincreased. Such indicators, referred to asMacroprudential indicators, are pointers of thehealth and soundness of financial systems andallow policymakers to gauge the extent ofvulnerability of a system or an institution tofinancial crises (Box I.4). The dual approachtakes cognizance of the fact that banking andfinancial institutions are greatly affected by thereal economic environment in which theyoperate. Macroprudential indicators allow forassessments to be based on objective measuresof financial soundness.
1.144 In view of the increasing competition anddiversification of operations in the Indianbanking sector as well as the increasingglobalisation of the financial sector, it wasdeemed fit to expand the supervisory approachto include identification and monitoring ofmacroprudential indicators. In October 2000, itwas decided to prepare a half-yearly financialstability review using macroprudential indicatorsfor internal circulation in the Reserve Bank andan inter-departmental group was constituted forthe purpose. A pilot review of macroprudentialindicators for the half-years ended March 2000
and September 2000 were prepared. The reviewfor March 2001 has subsequently been preparedand put up to the Board for Financial Supervision.
1.145 In order to orient the system to therequirements of the Indian banking sector, themicroprudential framework for supervision ofindividual institutions uses a set of indicatorsaimed at: (i) peer group analysis based on criticalf inancial ratios, and ( i i ) development ofsupervisory bank rating systems involvingassignment of rating based on the behaviour ofcertain indicators in relation to pre-specifiednorms/ benchmarks. The indicators used forboth these approaches are based on the CAMELSmodel, where the ‘S’ stands for systems andprocedures. A prompt corrective actionframework based on certain indicators likeCRAR, net NPAs and return on assets is alsoexpected to be operationalised in the nearfuture.
(c) Effecting Structural Changes in theSystem
Internal Controls
1.146 The experience reveals that theoperational rules and norms of banking have notkept pace with the developments taking placein the banking sector. The cumbersome loanand documentation procedures in banks, whichpartly arise from legislative and regulatoryrequirements, impinge on the eff icientfunctioning of the banking sector.
1.147 It is, therefore, very vital that theinternal controls which consist of a widespectrum of internal inspection and audit,submission of control returns by branches/controlling offices to higher level offices, visitsby controlling officials to the field level offices,risk management system, simplification ofdocumentation procedures and efficient inter-off ice communication channels, arestrengthened. The implementation of such acontrol system would necessitate revisions inthe ‘Operational Manuals’, audit procedures andbetter evaluation of clients. Some steps havealready been init iated in this direction.Besides, banks have been advised to constituteAudit Committees of the Boards to enable focusedattention by the Boards of the banks on internalcontrol systems.

30
Report on Trend and Progress of Banking in India, 2000-01
Aggregated Microprudential Indicators
Capital AdequacyAggregate capital ratios.Frequency distribution of capital ratios
Asset QualityLending InstitutionSectoral credit concentration.Foreign currency denominated lending.Non-performing loans and provisions.Loans to loss-making public sector entities.Risk Profile of Assets.Connected lending.Leverage Ratios.
Borrowing EntityDebt-equity ratios.Corporate profitability.Other indicators of corporate conditions.Household indebtedness.
Management SoundnessExpense Ratios.Earnings per employee.Growth in the number of financial institutions.
Earnings and ProfitabilityReturn on Assets.Return on Equity.Income and Expense ratios.Structural profitability indicators.
LiquidityCentral bank credit to financial institutions.Deposits in relation to monetary aggregates.Segmentation of inter-bank rates.Loans-to-deposits ratios.Maturity structure of assets and liabilities.Measures of secondary market liquidity.
Sensitivity to Market RiskForeign Exchange risk.Interest rate risk.Equity price risk.Commodity price risk.
Market based IndicatorsMarket prices of financial instruments, including equity.Indicators of excess yields.Credit Ratings.Sovereign yield spreads.
Source : Evans, O., A.M. Leone, M.Gill and P.Hilbers (2000), “MacroprudentialIndicators of Financial System Soundness”, IMF Occassional Paper, No.192.
Macroeconomic Indicators
Economic GrowthAggregate growth rates.Sectoral slumps.
Balance of PaymentsCurrent account deficit.Foreign exchange reserve adequacy.External debt (including maturity structure).Terms-of-trade.Composition and Maturity of capital flows.
InflationVolatility in inflation.
Interest and Exchange RatesVolatility in interest and exchange rates.Level of domestic real interest rates.Exchange rate sustainability.Exchange rate guarantees.
Lending and asset price boomsLending booms.Asset price booms.
Contagion EffectsFinancial market correlation.Trade spillovers.
Other factorsDirected lending and investment.Government recourse to banking system.Arrears in the economy.
Box I.4: Macroprudential Indicators
Information Technology
1.148 Information Technology and thecommunication Networking Systems haverevolutionalised the functioning of banks andother financial institutions the world over. In thehighly industrialised countries, access to financialentities is on an on-line basis. Banks as well as
other financial entities in India have only recentlyentered the world of information technology andcomputer networking. The introduction ofliberalisation measures in the banking sector andthe emergence of new private sector and foreignbanks equipped with latest technology, have ledto an increase in competition and a reduction in

31
Banking Developments and Perspectives
costs in the banking sector. Technologyupgradation is taking place in PSBs in a phasedmanner. Computerisation is increasingly beingapplied in day-to-day deposit and loan operations,but the pace at which it has moved so far, hasbeen somewhat limited. Moreover, there is a needfor computerisation in a large number of areas ofoperations of banks, with customer service as themain focus. Management information systemcould be further improved by using moderninformation technology methods. In the case ofmany industrial countries, due to advancementof information technology, virtual banking hasgained more prominence and in the days to come,banks have to hasten the process ofcomputerisation with a view to improvingcompetitiveness. There is evidence to show thatit has been possible for public sector and old privatebanks to improve their productivity and efficiencyover a period of time, through stepping up of ITinvestments. Increasing use of informationtechnology in finance is inevitable and it isexpected that more and more transactions willtake place across the Internet and the Web in thenear future. At the same time, strongersupervision, surveillance and regulation oftransactions conducted electronically or over theWeb would be required.
1.149 Strengthening of information technology incommercial banks would also be an importantprerequisite to implement an effective ALMsystem in banks. The database of banks has tocover all operations of branches for a detailedanalysis of assets and liabilities and for forecastingliquidity conditions under various scenarios. Thesuccess of ALM would hinge critically on theavailability of trained and skilled manpower. Theguidelines on risk management have placed theprimary responsibility of laying down riskparameters and establishing the riskmanagement and control system on the board ofdirectors. The responsibility of day-to-dayimplementation of the integrated riskmanagement has been assigned to riskmanagement committees or a committee of top
executives that reports to the board. The riskmanagement guidelines also require banks toconstitute a high level credit policy committee todeal with issues pertaining to credit sanction,disbursement and follow-up procedures and tomanage and control credit risk for the bank as awhole. The Reserve Bank has further asked banksto concurrently set up an independent credit riskmanagement department to enforce and monitorcompliance of the risk parameters and prudentiallimits set by the board/credit policy committee.
Deposit Insurance
1.150 In India, at present, the deposit insurancepremia is a flat rate, irrespective of the riskprofile of the financial entity. This creates amoral hazard problem in that depositors havelimited incentive to monitor the condition of thefinancial institution. This has raised the obviousquestion as to whether the premia should be risk-based which requires establishment of anagreeable basis of assessment of risk profile ofbanks. Various alternate choices such as FederalDeposit Insurance Corporation (FDIC) model ofsupervisory rating (CAMELS), risk-adjustedassets basis and options pricing model exist.There is also the question of whether the onusof monitoring the bank should fall on the DepositInsurance Corporation and whether it should beconferred legal status to take penal actionincluding liquidation. Another issue relates tothe size of deposit that is insured. Many of theseissues have been discussed in the Report onReforms in Deposit Insurance in India (1999).From the point of view of legal requirements,the scope of revision of the present depositinsurance setup will have to deal with a numberof statutory amendments. Several enactments,including the Bank Nationalisation Act and theState enactments on cooperatives presentdif f iculties for the Deposit InsuranceCorporation to act as a receiver/liquidator inthe case of failure of insured entity. Theseissues would also be addressed while adopting arevised deposit insurance scheme, which isbeing contemplated.

The scheduled banking structure in Indiaconsists of banks that are listed in the SecondSchedule of the Reserve Bank of India Act, 1934.These scheduled banks comprise commercialbanks, regional rural banks, urban co-operativebanks and state co-operative banks. As at end-March 2001, 100 commercial banks, 196regional rural banks, 51 urban co-operativebanks and 16 state co-operative banks wereoperative in India as scheduled banks (ChartII.1). This chapter discusses the operations andperformance of commercial banks (includingpublic sector, private sector and foreign banks),and regional rural banks in India for thefinancial year 2000-01.
2. 2 During the year 2000-01, the Indianbanking sector continued to respond to theemerging challenges of increased competitionand uncertainties. While the prudential andsupervisory norms are being brought inconformity with international best practices tofurther strengthen the stability of the bankingsystem, the ongoing reforms provide greateroperational flexibility to commercial banks. Intheir business strategy, commercial banksexhibited a greater emphasis on productdiversification, customer orientation, thrusttowards retail banking, adoption of informationtechnology for improved service, bettermanagement information systems and risk
Developments in Commercial Banking
Chapter II

management, and strategic mergers andacquisitions across bank groups. The majorpolicy measures pertaining to commercialbanks during the year are given in Annexure.The overall f inancial performance of thescheduled commercial banks (SCBs), excludingRRBs, during the year under review, however,was marked by a decline in net profits reflectinghigher operating expenses, a deceleration in‘other income’ and higher provisions andcontingencies. The increase in operatingexpenses was largely due to allocations forvoluntary retirement scheme (VRS). Among themajor financial parameters of the bankingsector, the growth in income during 2000-01 was14.9 per cent while that in expenditure was 16.7per cent. Growth in other income deceleratedto 8.8 per cent from 23.5 per cent in the previousyear while operating expenditures acceleratedto 23.9 per cent from 8.8 per cent, therebyaffecting the net profits of the banking sector(Table II.1).
2. 3 In the total assets of all SCBs, excludingRRBs, public sector banks (PSBs) continued tohave a dominant share of 79.5 per cent as atend-March 2001 with nationalised banksaccounting for 48.4 per cent and the State Bankof India (SBI) and its seven associate banksaccounting for 31.1 per cent. The share ofprivate sector banks in the total assets of SCBs
stood at 12.6 per cent, with that of old and newprivate banks being 6.5 per cent and 6.1 percent, respectively. Foreign banks accounted forthe remaining 7.9 per cent (Chart II.2).
1. Reserve Bank Standing LiquidityFacilities
2. 4 The Reserve Bank has been providingaccommodation to SCBs in the form of standingl iquid i ty fac i l i t ies on certa in spec i f icconsiderations. These comprise CollateralisedLending Facility (CLF), export credit refinanceto banks and liquidity support to PrimaryDealers (PDs). The Liquidity AdjustmentFacility (LAF), introduced since June 5, 2000,has emerged as an effective and flexibleinstrument for influencing liquidity on a day-to-day basis. It could be made more effectiveonly when it becomes the primary instrumentof liquidity adjustment and the standingliquidity facilities are gradually replaced withthe LAF. The replacement of these facilitieshas to be structured in stages over areasonable period so that the transition to LAFas the primary instrument does not cause anyserious operational problems for banks andPDs to adjust their asset-liability positionssmoothly.
2. 5 In the first stage, effective June 5, 2000,
33
Developments in Commercial Banking

34
Report
on
T
ren
d
an
d
Pro
gre
ss of
Ban
kin
g
in
India
, 2
00
0-0
1
Table II.1: Bank Group-wise Important Financial Indicators (Continued)
(Amount in Rs. crore)
Year Operating Net Income Interest Other Expenditure Interest Operating Provisions SpreadProfit Profit Income Income Expended Expenses & Contin- (NII)(3+11) (4-7) (5+6) (8+9+11)
Total Of whichgencies
Wage Bill
1 2 3 4 5 6 7 8 9 10 11 12
Scheduled Commercial Banks
1998-99 13,810.69 4,490.34 1,00,062.00 87,312.04 12,749.96 95,571.66 60,904.99 25,346.32 16,649.52 9,320.35 26,407.05
(1.45) (0.47) (10.52) (9.18) (1.34) (10.05) (6.41) (2.67) (1.75) (0.98) (2.78)
1999-2000 18,306.57 7,245.25 1,14,930.47 99,183.88 15,746.59 1,07,685.22 69,040.58 27,583.32 18,442.49 11,061.32 30,143.30
(1.66) (0.66) (10.40) (8.97) (1.42) (9.74) (6.25) (2.50) (1.67) (1.00) (2.73)
2000-01 19,747.04 6,424.10 1,32,078.24 1,14,951.13 17,127.11 1,25,654.14 78,151.87 34,179.33 23,205.53 13,322.94 36,799.26
(1.52) (0.50) (10.20) (8.88) (1.32) (9.70) (6.04) (2.64) (1.79) (1.03) (2.84)
Public Sector Banks
1998-99 10,560.79 3,253.85 78,850.36 69,417.42 9,432.94 75,596.51 47,839.75 20,449.82 14,839.66 7,306.94 21,577.67
(1.37) (0.42) (10.24) (9.01) (1.22) (9.82) (6.21) (2.66) (1.93) (0.95) (2.80)
1999-2000 13,042.29 5,116.18 90,911.01 79,413.68 11,497.33 85,794.83 55,374.47 22,494.25 16,394.67 7,926.11 24,039.21
(1.46) (0.57) (10.21) (8.92) (1.29) (9.63) (6.22) (2.53) (1.84) (0.89) (2.70)
2000-01 13,792.95 4,316.94 1,03,498.93 90,983.98 12,514.95 99,181.99 61,692.75 28,013.23 20,929.17 9,476.01 29,291.23
(1.34) (0.42) (10.05) (8.84) (1.22) (9.63) (5.99) (2.72) (2.03) (0.92) (2.84)
Nationalised Banks
1998-99 5,912.73 1,788.19 49,500.95 44,291.27 5,209.68 47,712.76 30,856.91 12,731.31 9,346.79 4,124.54 13,434.36
(1.22) (0.37) (10.22) (9.15) (1.08) (9.85) (6.37) (2.63) (1.93) (0.85) (2.77)
1999-2000 7,203.15 2,437.00 56,896.43 50,234.01 6,662.42 54,459.43 35,477.41 14,215.87 10,468.28 4,766.15 14,756.60
(1.30) (0.44) (10.27) (9.06) (1.20) (9.83) (6.40) (2.57) (1.89) (0.86) (2.66)
2000-01 8,053.33 2,095.09 64,126.52 56,967.11 7,159.41 62,031.43 38,789.64 17,283.55 13,142.78 5,958.24 18,177.47
(1.28) (0.33) (10.23) (9.09) (1.14) (9.90) (6.19) (2.76) (2.10) (0.95) (2.90)
State Bank Group
1998-99 4,648.06 1,465.66 29,349.41 25,126.15 4,223.26 27,883.75 16,982.84 7,718.51 5,492.87 3,182.40 8,143.31
(1.63) (0.51) (10.27) (8.79) (1.48) (9.76) (5.94) (2.70) (1.92) (1.11) (2.85)
1999-2000 5,839.14 2,679.18 34,014.58 29,179.67 4,834.91 31,335.40 19,897.06 8,278.38 5,926.39 3,159.96 9,282.61
(1.74) (0.80) (10.11) (8.67) (1.44) (9.32) (5.91) (2.46) (1.76) (0.94) (2.76)
2000-01 5,739.62 2,221.85 39,372.41 34,016.87 5,355.54 37,150.56 22,903.11 10,729.68 7,786.39 3,517.77 11,113.76
(1.42) (0.55) (9.77) (8.44) (1.33) (9.22) (5.68) (2.66) (1.93) (0.87) (2.76)

35
Develo
pm
en
ts in C
om
merc
ial B
an
kin
g
Table II.1: Bank Group-wise Important Financial Indicators (Concluded)
(Amount in Rs. crore)
Year Operating Net Income Interest Other Expenditure Interest Operating Provisions SpreadProfit Profit Income Income Expended Expenses & Contin- (NII)(3+11) (4-7) (5+6) (8+9+11)
Total Of whichgencies
Wage Bill
1 2 3 4 5 6 7 8 9 10 11 12
Old Private Sector Banks
1998-99 792.15 311.46 7,362.14 6,493.40 868.74 7,050.68 5,087.73 1,482.26 919.95 480.69 1,405.67
(1.21) (0.48) (11.24) (9.92) (1.33) (10.77) (7.77) (2.26) (1.41) (0.73) (2.15)
1999-2000 1,333.42 591.68 8,282.11 7,065.08 1,217.03 7,690.43 5,362.85 1,585.84 1,017.48 741.74 1,702.23
(1.82) (0.81) (11.33) (9.66) (1.66) (10.52) (7.33) (2.17) (1.39) (1.01) (2.33)
2000-01 1,479.97 522.84 9,091.21 8,052.11 1,039.10 8,568.37 5,931.92 1,679.32 1,037.49 957.13 2,120.19
(1.75) (0.62) (10.75) (9.52) (1.23) (10.13) (7.01) (1.98) (1.23) (1.13) (2.51)
New Private Sector Banks
1998-99 684.28 397.05 4,130.49 3,540.88 589.61 3,733.44 2,776.94 669.27 119.97 287.23 763.94
(1.78) (1.03) (10.72) (9.19) (1.53) (9.69) (7.21) (1.74) (0.31) (0.75) (1.98)
1999-2000 1,243.85 569.42 5,407.46 4,478.31 929.15 4,838.04 3,326.60 837.01 163.36 674.43 1,151.71
(2.11) (0.97) (9.18) (7.60) (1.58) (8.21) (5.64) (1.42) (0.28) (1.14) (1.95)
2000-01 1,368.97 639.41 7,504.26 6,444.25 1,060.01 6,864.85 4,759.12 1,376.17 248.85 729.56 1,685.13
(1.74) (0.81) (9.53) (8.18) (1.35) (8.71) (6.04) (1.75) (0.32) (0.93) (2.14)
Foreign Banks
1998-99 1,773.47 527.98 9,719.01 7,860.34 1,858.67 9,191.03 5,200.57 2,744.97 769.94 1,245.49 2,659.77
(2.32) (0.69) (12.69) (10.27) (2.43) (12.00) (6.79) (3.59) (1.01) (1.63) (3.47)
1999-2000 2,687.01 967.97 10,329.89 8,226.81 2,103.08 9,361.92 4,976.66 2,666.22 866.98 1,719.04 3,250.15
(3.24) (1.17) (12.47) (9.93) (2.54) (11.31) (6.01) (3.22) (1.05) (2.08) (3.92)
2000-01 3,105.15 944.91 11,983.84 9,470.79 2,513.05 11,038.93 5,768.08 3,110.61 990.02 2,160.24 3,702.71
(3.05) (0.93) (11.77) (9.30) (2.47) (10.84) (5.66) (3.05) (0.97) (2.12) (3.64)
Notes : 1. The numbers of scheduled commercial banks (excluding RRBs) in 1998-99, 1999-2000 and 2000-01 were 105, 101 and 100, respectively.2. The numbers of foreign banks in 1998-99, 1999-2000 and 2000-01 were 44, 42 and 42, respectively.3. The numbers of old private banks in 1998-99, 1999-2000 and 2000-01 were 25, 24 and 23, respectively.4. The numbers of new private banks in 1998-99, 1999-2000 and 2000-01 were 9, 8 and 8, respectively.5. Figures in brackets are percentages to Total Assets.6. NII - Net Interest Income.7. Scheduled commercial banks data for 1999-2000 are as reported in the balance sheets for 2000-01 and hence may not tally with those reported in the Report on Trend and
Progress of Banking in India 1999-2000, to the extent the figures for 1999-2000 have been revised by some banks.

36
Report on Trend and Progress of Banking in India, 2000-01
the Additional Collateralised Lending Facility(ACLF) to banks and Level II support to PDs werereplaced by variable rate repo auctions with thesame day settlement. Stage II envisagesreplacement of Collateralised Lending Facility(CLF) and Level I support to PDs by variable raterepo auctions. As this has to be achievedthrough various stages, a package of measureswas announced in the annual Policy Statementin April 2001 encompassing changes inoperating procedures of LAF, a strategy forsmooth transition of call money market to pureinter-bank market and a comprehensiveprogramme for rationalisation of liquiditysupport available to the system as also a set ofcomplementary measures in money andgovernment securities markets. In this stage,the total entitlement under standing liquidityfacilities (CLF and export credit refinance) wassplit into normal facility (constituting two-third)and the back-stop facility (constituting one-third) with effect from May 5, 2001. Whileliquidity under normal facility is available at theBank Rate, back-stop facility is provided at avariable daily rate linked to liquidity adjustmentfacility (LAF) operations/ National StockExchange (NSE) - Mumbai Inter-Bank Offer Rate(MIBOR).
2. 6 In order to further strengthen LAF, a pureinter-bank call/notice money market coupledwith the growth of a deep and liquid repo/reverserepo market for non-bank participants, wasenvisaged. Accordingly, effective May 5, 2001,non-banks are permitted to lend, up to 85 percent of their average daily lending during 2000-01 in a reporting fortnight.
2. 7 With full-fledged LAF and the gradualdiscontinuation of segmented standing facilitiesat pre-determined interest rates, the ReserveBank would gain greater flexibility in the dailyliquidity management.
Export Credit Refinance
2. 8 During 2000-01, the export creditrefinance limits of banks decreased fromRs.10,579 crore (30.6 per cent of outstandingexport credit eligible for refinance at Rs.34,576crore) as on March 24, 2000 to Rs.7,192 crore(18.5 per cent of outstanding export crediteligible for refinance at Rs.38,765 crore) as onMarch 23, 2001 (Appendix Table II.1). The
general trend in utilisation of export creditref inance by banks was, on an average,downward, except during August to November2000, when the utilisation ranged higherbetween 80 per cent and 96 per cent, owing totight liquidity conditions.
2. 9 Effective from the fortnight beginning May5, 2001, scheduled commercial banks areprovided export credit refinance to the extent of15.0 per cent of the outstanding export crediteligible for refinance as at the end of the secondpreceding fortnight. The existing refinance limitas on May 4, 2001 as per the old formula willconstitute the minimum limit available to abank up to March 31, 2002. During the periodApril-September 2001, it ranged between Rs.1,135 crore (12.4 per cent of the limits) and Rs.4,973 crore (69.8 per cent of the limits).Utilisation of this facility remained low onaccount of improvement in overall liquidityconditions during the period.
Collateralised Lending Facility
2. 10 The CLF limits of banks decreased fromRs.3,028 crore as on March 24, 2000 to Rs.657crore as on March 23, 2001. The daily averageutilisation of CLF ranged between Rs.171 crore(13.0 per cent of the limits) and Rs.487 crore(74.1 per cent of the limits). For the period April-October 2001, it ranged between Rs.45 crore (6.9per cent of the limits) and Rs.239 crore (36.4per cent of the limits).
Special Facilities
2. 11 In the wake of liquidity crisis faced by afew co-operative banks, the Reserve Bankannounced, as a temporary measure, a specialcollateralised liquidity facility for short periodsto co-operative banks. Five co-operative bankshad approached the Reserve Bank for specialliquidity facility during May 14 - June 13, 2001.An amount of Rs. 149.38 crore was sanctioned,out of which Rs. 45 crore was availed and repaid.A private sector bank approached the ReserveBank with a request for special liquidity supportfor a short period to tide over its temporaryliquidity mismatches. The Reserve Bank afteran assessment of the bank's overall assetsposition, extended a temporary and specialcollateralised credit facility of Rs.463.50 crorefor 81 days ending June 30, 2001.

37
Developments in Commercial Banking
2. Assets and Liabilities Structure ofScheduled Commercial Banks
2. 12 The assets and liabilities of SCBs areanalysed on the basis of two sources of data,viz., audited balance sheets of banks andreturns submitted by banks under Section42(2) of the Reserve Bank of India Act, 1934.As per the balance sheet data during the year2000-01, the assets of SCBs, excluding RRBs,increased by 17.1 per cent compared with agrowth of 16.3 per cent during 1999-2000. Theshares of investments and loans and advancesin total assets of SCBs were 38.0 per cent and40.6 per cent, respectively. During the yearunder review, the liability structure of SCBsunderwent marginal changes. On thel iabi l i t ies side, capital of SCBs in totalliabilities declined from 1.7 per cent at end-March 2000 to 1.5 per cent at end-March 2001,
and reserves and surplus declined marginallyfrom 3.9 per cent to 3.8 per cent. The share ofdeposits in total liabilities increased to 81.5 percent from 81.1 per cent over the year. Bankgroup-wise details of the consolidated balancesheets are presented in Tables II.2 to II.5. Asper Section 42(2) returns, the ratio of cash andbalances with RBI to aggregate deposits of SCBsdeclined to 6.8 per cent as on the last reportingFriday of March 2001, from 7.7 per cent in thecomparable period of the previous year, reflectingthe reduction in cash reserve ratio of banksduring the year (Table II.6).
Deposits
2. 13 The aggregate deposits of SCBs during2000-01(reported under Section 42(2) of theReserve Bank Act) registered a growth rate of18.4 per cent (Rs.1,49,274 crore) as compared
Table II.2: Consolidated Balance Sheet of Scheduled Commercial Banks
(Amount in Rs.crore)
As on March 31, 2000 As on March 31, 2001
Item Amount per cent Amount per centto total to total
1 2 3 4 5
Liabilities1. Capital 18,435.19 1.67 19,094.70 1.472. Reserves & Surplus 43,451.85 3.93 48,646.77 3.763. Deposits 8,96,695.70 81.11 10,55,233.47 81.49
3.1 Demand Deposits 1,28,490.43 11.62 1,39,685.99 10.793.2 Savings Bank Deposits 1,87,977.20 17.00 2,18,716.01 16.893.3 Term Deposits 5,80,228.07 52.49 6,96,831.47 53.81
4. Borrowings 45,140.85 4.08 55,421.01 4.285. Other Liabilities and Provisions 1,01,740.79 9.20 1,16,578.00 9.00
Total Liabilities 11,05,464.38 100.00 12,94,973.95 100.00
Assets1. Cash and balances with RBI 84,927.75 7.68 84,503.53 6.532. Balances with banks and
money at call and short notice 81,218.30 7.35 1,05,899.62 8.183. Investments 4,12,081.46 37.28 4,91,907.84 37.99
3.1 In Govt. Securities (a+b) 2,86,523.54 25.92 3,52,679.30 27.23a. In India 2,84,619.10 25.75 3,50,638.83 27.08b. Outside India 1,904.44 0.17 2,040.47 0.16
3.2 In other approved Securities 25,009.00 2.26 23,947.68 1.853.3 In non-approved Securities 1,00,548.92 9.10 1,15,280.86 8.90
4. Loans and Advances 4,44,124.64 40.18 5,25,682.94 40.594.1 Bills purchased & discounted 42,357.14 3.83 50,223.79 3.884.2 Cash Credit, Overdrafts, etc. 2,43,823.72 22.06 2,85,747.26 22.074.3 Term Loans 1,57,943.78 14.29 1,89,711.89 14.65
5. Fixed Assets 15,294.44 1.38 16,208.90 1.256. Other Assets 67,817.79 6.13 70,771.12 5.47
Total Assets 11,05,464.38 100.00 12,94,973.95 100.00
Source:Balance sheets of respective banks

38
Report
on
T
ren
d
an
d
Pro
gre
ss of
Ban
kin
g
in
India
, 2
00
0-0
1
Table II.3: Consolidated Balance Sheet of Public Sector Banks
Item Public Sector Banks Nationalised Banks State Bank Group
As on March 31, 2000 As on March 31, 2001 As on March 31, 2000 As on March 31, 2001 As on March 31, 2000 As on March 31, 2001
Amount per cent Amount per cent Amount per cent Amount per cent Amount per cent Amount per cent
to total to total to total to total to total to total
1 2 3 4 5 6 7 8 9 10 11 12 13
Liabilities
1. Capital 14,233.68 1.60 14,547.08 1.41 13,197.88 2.38 13,511.28 2.16 1,035.80 0.31 1,035.80 0.26
2. Reserves & Surplus 31,818.73 3.57 35,358.25 3.43 17,334.98 3.13 18,998.94 3.03 14,483.75 4.31 16,359.31 4.06
3. Deposits 7,37,280.53 82.78 8,59,376.33 83.45 4,80,992.51 86.79 5,47,258.83 87.30 2,56,288.02 76.19 3,12,117.50 77.47
3.1Demand Deposits 1,02,423.38 11.50 1,11,138.18 10.79 57,008.07 10.29 60,638.84 9.67 45,415.31 13.50 50,499.34 12.53
3.2Savings Bank
Deposits 1,71,129.96 19.22 1,96,906.73 19.12 1,15,932.31 20.92 1,33,047.88 21.22 55,197.65 16.41 63,858.85 15.85
3.3Term Deposits 4,63,727.19 52.07 5,51,331.42 53.54 3,08,052.13 55.58 3,53,572.11 56.40 1,55,675.06 46.28 1,97,759.31 49.09
4. Borrowings 19,425.33 2.18 20,084.40 1.95 8,864.93 1.60 8,679.36 1.38 10,560.40 3.14 11,405.04 2.83
5. Other Liabilities
and Provisions 87,841.78 9.86 1,00,403.53 9.75 33,815.42 6.10 38,443.71 6.13 54,026.36 16.06 61,959.82 15.38
Total Liabilities 8,90,600.05 100.00 10,29,769.59 100.00 5,54,205.72 100.00 6,26,892.12 100.00 3,36,394.33 100.00 4,02,877.47 100.00
Assets1. Cash and balances
with RBI 70,791.53 7.95 69,866.39 6.78 45,577.96 8.22 45,341.37 7.23 25,213.57 7.50 24,525.02 6.09
2. Balances with banks
and money at call and
short notice 64,807.92 7.28 82,851.54 8.05 32,892.16 5.94 35,958.21 5.74 31,915.76 9.49 46,893.33 11.64
3. Investments 3,33,192.09 37.41 3,94,107.33 38.27 2,12,123.51 38.28 2,36,915.01 37.79 1,21,068.58 35.99 1,57,192.32 39.02
3.1In Govt. Securities(a+b) 2,37,188.78 26.63 2,91,556.16 28.31 1,45,642.03 26.28 1,66,991.57 26.64 91,546.75 27.21 1,24,564.59 30.92a. In India 2,35,358.41 26.43 2,89,592.62 28.12 1,44,132.59 26.01 1,65,317.70 26.37 91,225.82 27.12 1,24,274.92 30.85b. Outside India 1,830.37 0.21 1,963.54 0.19 1,509.44 0.27 1,673.87 0.27 320.93 0.10 289.67 0.07
3.2In other approvedSecurities 23,521.23 2.64 22,318.71 2.17 15,966.52 2.88 15,065.56 2.40 7,554.71 2.25 7,253.15 1.80
3.3In non-approvedSecurities 72,482.08 8.14 80,232.46 7.79 50,514.96 9.11 54,857.88 8.75 21,967.12 6.53 25,374.58 6.30
4. Loans and Advances 3,54,071.19 39.76 4,14,627.96 40.26 2,24,818.43 40.57 2,64,237.43 42.15 1,29,252.76 38.42 1,50,390.53 37.334.1Bills purchased &
discounted 27,872.87 3.13 34,124.56 3.31 16,088.07 2.90 17,953.87 2.86 11,784.80 3.50 16,170.69 4.014.2Cash Credit,
Overdrafts, etc. 2,00,180.77 22.48 2,32,719.96 22.60 1,24,693.75 22.50 1,47,912.93 23.59 75,487.02 22.44 84,807.03 21.054.3Term Loans 1,26,017.55 14.15 1,47,783.44 14.35 84,036.61 15.16 98,370.63 15.69 41,980.94 12.48 49,412.81 12.26
5. Fixed Assets 10,019.73 1.13 10,456.26 1.02 7,126.45 1.29 7,411.10 1.18 2,893.28 0.86 3,045.16 0.766. Other Assets 57,717.59 6.48 57,860.11 5.62 31,667.21 5.71 37,029.00 5.91 26,050.38 7.74 20,831.11 5.17
Total Assets 8,90,600.05 100.00 10,29,769.59 100.00 5,54,205.72 100.00 6,26,892.12 100.00 3,36,394.33 100.00 4,02,877.47 100.00
Source:Balance sheets of respective banks
(Amount in Rs.crore)

39
Develo
pm
en
ts in C
om
merc
ial B
an
kin
g
Table II.4: Consolidated Balance Sheet of Private Sector Banks
Item All Private Banks Old Private Banks New Private Banks
As on March 31, 2000 As on March 31, 2001 As on March 31, 2000 As on March 31, 2001 As on March 31, 2000 As on March 31, 2001
Amount per cent Amount per cent Amount per cent Amount per cent Amount per cent Amount per cent
to total to total to total to total to total to total
1 2 3 4 5 6 7 8 9 10 11 12 13
Liabilities
1. Capital 1,796.68 1.36 1,877.63 1.15 546.84 0.75 603.91 0.71 1,249.84 2.12 1,273.72 1.62
2. Reserves & Surplus 5,958.65 4.51 6,999.27 4.28 3,369.73 4.61 3,948.28 4.67 2,588.92 4.39 3,050.99 3.87
3. Deposits 1,10,038.63 83.33 1,36,666.66 83.65 63,357.08 86.64 73,746.28 87.17 46,681.55 79.21 62,920.38 79.87
3.1 Demand Deposits 15,428.81 11.68 16,651.86 10.19 7,424.70 10.15 7,594.76 8.98 8,004.11 13.58 9,057.10 11.50
3.2 Savings Bank
Deposits 12,015.46 9.10 16,180.25 9.90 9,001.15 12.31 10,345.25 12.23 3,014.31 5.11 5,835.00 7.41
3.3 Term Deposits 82,594.36 62.55 1,03,834.55 63.55 46,931.23 64.18 55,806.27 65.96 35,663.13 60.52 48,028.28 60.97
4. Borrowings 6,863.13 5.20 8,519.00 5.21 1,821.22 2.49 1,942.23 2.30 5,041.91 8.56 6,576.77 8.35
5. Other Liabilities and
Provisions 7,396.75 5.60 9,317.77 5.70 4,028.07 5.51 4,363.92 5.16 3,368.68 5.72 4,953.85 6.29
Total Liabilities 1,32,053.84 100.00 1,63,380.33 100.00 73,122.94 100.00 84,604.62 100.00 58,930.90 100.00 78,775.71 100.00
Assets1. Cash and balances
with RBI 10,206.33 7.73 10,732.70 6.57 6,362.48 8.70 5,783.83 6.84 3,843.85 6.52 4,948.87 6.28
2. Balances with banks
and money at call and
short notice 10,280.91 7.79 12,571.98 7.69 4,941.59 6.76 6,157.93 7.28 5,339.32 9.06 6,414.05 8.14
3. Investments 49,225.58 37.28 62,037.05 37.97 25,712.37 35.16 30,007.96 35.47 23,513.21 39.90 32,029.09 40.66
3.1 In Govt. Securities
(a+b) 30,675.57 23.23 37,812.62 23.14 16,356.59 22.37 20,033.36 23.68 14,318.98 24.30 17,779.26 22.57
a. In India 30,601.50 23.17 37,736.69 23.10 16,282.52 22.27 19,957.43 23.59 14,318.98 24.30 17,779.26 22.57
b. Outside India 74.07 0.06 75.93 0.05 74.07 0.10 75.93 0.09 — — — —
3.2 In other approved
Securities 1,239.19 0.94 1,262.82 0.77 1,195.15 1.63 1,177.29 1.39 44.04 0.07 85.53 0.11
3.3 In non-approved
Securities 17,310.82 13.11 22,961.61 14.05 8,160.63 11.16 8,797.31 10.40 9,150.19 15.53 14,164.30 17.98
4. Loans and Advances 54,195.73 41.04 68,058.44 41.66 31,927.50 43.66 37,972.82 44.88 22,268.23 37.79 30,085.62 38.19
4.1 Bills purchased &
discounted 9,884.39 7.49 11,027.34 6.75 4,443.74 6.08 4,996.77 5.91 5,440.65 9.23 6,030.57 7.66
4.2 Cash Credit,
Overdrafts, etc. 28,446.37 21.54 34,922.64 21.38 17,320.19 23.69 19,950.57 23.58 11,126.18 18.88 14,972.07 19.01
4.3 Term Loans 15,864.97 12.01 22,108.46 13.53 10,163.57 13.90 13,025.48 15.40 5,701.40 9.67 9,082.98 11.53
5. Fixed Assets 2,972.01 2.25 3,469.07 2.12 1,333.35 1.82 1,433.73 1.69 1,638.66 2.78 2,035.34 2.58
6. Other Assets 5,173.28 3.92 6,511.09 3.99 2,845.65 3.89 3,248.35 3.84 2,327.63 3.95 3,262.74 4.14
Total Assets 1,32,053.84 100.00 1,63,380.33 100.00 73,122.94 100.00 84,604.62 100.00 58,930.90 100.00 78,775.71 100.00
Source: Balance sheets of respective banks
(Amount in Rs.crore)

40
Report on Trend and Progress of Banking in India, 2000-01
Table II.5: Consolidated Balance Sheet of Foreign Banks in India(Amount in Rs.crore)
As on March 31, 2000 As on March 31, 2001
Item Amount per cent Amount per centto total to total
1 2 3 4 5
Liabilities
1. Capital 2,404.83 2.90 2,669.99 2.62
2. Reserves & Surplus 5,674.47 6.85 6,289.25 6.18
3. Deposits 49,376.54 59.63 59,190.48 58.13
3.1 Demand Deposits 10,638.24 12.85 11,895.95 11.68
3.2 Savings Bank Deposits 4,831.78 5.83 5,629.03 5.53
3.3 Term Deposits 33,906.52 40.94 41,665.50 40.92
4. Borrowings 18,852.39 22.77 26,817.61 26.34
5. Other Liabilities and Provisions 6,502.26 7.85 6,856.70 6.73
Total Liabilities 82,810.49 100.00 1,01,824.03 100.00
Assets
1. Cash and balances with RBI 3,929.89 4.75 3,904.44 3.83
2. Balances with banks and
money at call and short notice 6,129.47 7.40 10,476.10 10.29
3. Investments 29,663.79 35.82 35,763.46 35.12
3.1 In Govt. Securities (a+b) 18,659.19 22.53 23,310.52 22.89
a. In India 18,659.19 22.53 23,309.52 22.89
b. Outside India — — 1.00 0.00
3.2 In other approved Securities 248.58 0.30 366.15 0.36
3.3 In non-approved Securities 10,756.02 12.99 12,086.79 11.87
4. Loans and Advances 35,857.72 43.30 42,996.54 42.23
4.1 Bills purchased & discounted 4,599.88 5.55 5,071.89 4.98
4.2 Cash Credit, Overdrafts, etc. 15,196.58 18.35 18,104.66 17.78
4.3 Term Loans 16,061.26 19.40 19,819.99 19.46
5. Fixed Assets 2,302.70 2.78 2,283.57 2.24
6. Other Assets 4,926.92 5.95 6,399.92 6.29
Total Assets 82,810.49 100.00 1,01,824.03 100.00
Source:Balance sheets of respective banks
with that of 13.9 per cent (Rs.99,319 crore) in1999-2000. This higher growth rate of depositsin 2000-01 can partly be attributable to theinflow of deposits (Rs. 25,662 crore) under theIndia Millennium Deposits (IMD) scheme. Thegrowth rate of deposits, excluding the IMD inflows,was 15.2 per cent. Both, demand and time depositsrecorded higher growth rates of 11.9 per cent and19.5 per cent, respectively, during 2000-01 as
compared with the growth of 8.5 per cent indemand deposits and 15.0 per cent in time depositsin the previous year (Table II.6).
2. 14 During 2001-02 so far, (up to October 19,2001), aggregate deposits recorded a growth rateof 9.0 per cent (Rs.86,682 crore) as comparedwith 9.5 per cent (Rs.77,160 crore) in thecorresponding period of the previous year.

41
Developments in Commercial Banking
Table II.6 : Important Banking Indicators - Scheduled Commercial Banks
(Amount in Rs.crore)
Variations during Variations duringItem March 26, March 24, March 23, Oct. 20, Oct. 19, the financial year April-October
1999 2000 2001 2000 2001* 1999- 2000 2000 2001*2000 -01*
over over over overMarch 26 March 24 March 24 March 23
1 2 3 4 5 6 7 8 9 10(3-2) (4-3) (5-3) (6-4)
1 Total Demand andTime Liabilities @ 8,20,443 9,48,358 11,33,480 10,26,448 12,09,149 1,27,915 1,85,122 78,090 75,669
2 Aggregate Deposits (a+b) 7,14,025 8,13,344 9,62,618 8,90,504 10,49,300 99,319 1,49,274 77,160 86,682(13.9) (18.4) (9.5) (9.0)
a. Demand Deposits 1,17,423 1,27,366 1,42,552 1,30,934 1,42,283 9,943 15,186 3,568 -269(8.5) (11.9) (2.8) (-0.2)
b. Time Deposits 5,96,602 6,85,978 8,20,066 7,59,570 9,07,017 89,376 1,34,088 73,592 86,951(15.0) (19.5) (10.7) (10.6)
2aCertificates of Deposit 3,717 1,227 771 1,695 N.A. -2,490 -456 468 —(-67.0) (-37.2) (38.1) —
2bAggregate Deposits (excl. 7,10,308 8,12,117 9,61,847 8,88,809 10,49,300 1,01,809 1,49,730 76,692 87,453Certificates of Deposit) (14.3) (18.4) (9.4) (9.1)
3 Borrowings from RBI 2,894 6,491 3,896 6,225 4,623 3,597 -2,595 -266 727(124.3) (-40.0) (-4.1) (18.7)
4 Liability to Banks 45,204 53,838 77,088 55,073 55,554 8,634 23,250 1,235 -21,534(19.1) (43.2) (2.3) (-27.9)
5 Bank Credit (a+b) 3,68,837 4,35,958 5,11,434 4,78,126 5,44,125 67,121 75,476 42,168 32,691(18.2) (17.3) (9.7) (6.4)
a. Food Credit 16,816 25,691 39,991 33,845 50,280 8,875 14,300 8,154 10,289(52.8) (55.7) (31.7) (25.7)
b. Non-food credit 3,52,021 4,10,267 4,71,443 4,44,281 4,93,845 58,246 61,176 34,014 22,402(16.5) (14.9) (8.3) (4.8)
6 Investments (a+b) 2,54,594 3,08,944 3,70,160 3,34,403 4,15,545 54,350 61,216 25,459 45,385(21.3) (19.8) (8.2) (12.3)
a. Govt. Securities 2,23,217 2,78,456 3,40,035 3,03,958 3,84,663 55,239 61,579 25,502 44,628(24.7) (22.1) (9.2) (13.1)
b. Other Approved Sec. 31,377 30,488 30,125 30,445 30,882 -889 -363 -43 757(-2.8) (-1.2) (-0.1) (2.5)
7 Cash Balances (a+b) 67,910 62,749 65,202 77,856 78,671 -5,161 2,453 15,107 13,469(-7.6) (3.9) (24.1) (20.7)
a. Cash in hand 4,362 5,330 5,658 5,826 6,967 968 328 496 1,309(22.2) (6.2) (9.3) (23.1)
b. Balances with RBI 63,548 57,419 59,544 72,030 71,704 -6,129 2,125 14,611 12,160(-9.6) (3.7) (25.4) (20.4)
Memorandum Items :
A Credit-Deposit (CD) Ratio 51.7 53.6 53.1 53.7 51.9B Incremental CD Ratio 38.7 67.6 50.6 54.7** 37.7 **C Reserve-Deposit Ratio 9.5 7.7 6.8 8.7 7.5D Investment/Deposit Ratio 35.7 38.0 38.5 37.6 39.6E Investment+Credit/Deposit
Ratio 87.3 91.6 91.6 91.2 91.5*
* Provisional. N.A. Not Available@ Excluding borrowings from RBI/IDBI/NABARD.** Over end-March.Notes: 1. Figures in brackets are percentage variations.
2. Incremental Credit deposit ratio is calculated as ratio of increase in credit to increase in deposits during the financial year.3. Constituent items may not add up to the totals due to rounding off.

42
Report on Trend and Progress of Banking in India, 2000-01
Certificates of Deposit
2. 15 The outstanding amount of Certificatesof Deposit (CDs) issued by scheduled commercialbanks declined from Rs.1,273 crore as on April21, 2000 to Rs.872 crore as on May 5, 2000.Consequent upon the reduction in theminimum maturity period of CDs to 15 days,with effect from May 3, 2000, CD market pickedup and the outstanding amount of CDs issuedby SCBs peaked to Rs.1,695 crore as on October20, 2000. However, as on October 5, 2001,outstanding amount of CDs declined to Rs.823crore.
2. 16 Reflecting the trends in other segmentsof money market, the typical discount rates (for3 months maturity) on CDs, which had declinedfrom 11.0 per cent as on April 7, 2000 to 8.5 percent as on June 16, 2000, started rising andranged between 10.0 per cent and 10.5 per centduring August - November 2000. Thereafter,reflecting easy liquidity condition, following IMDflows, the discount rates declined from 10.25 percent during the fortnight ended November 17,2000 to 8.5 per cent in the fortnight endedMarch 23, 2001 and the outstanding amount ofCDs declined gradually to Rs.771 crore as onMarch 23, 2001. The typical discount rate onCDs with a maturity of one year increased from10.25 per cent as on March 23, 2000 to 10.50per cent as on October 20, 2000 and remainedthere till March 23, 2001. Discount rates on CDsin general, which ranged between 6.3 - 14.1 percent as on October 20, 2000, ranged between5.5 - 11.0 per cent as on March 23, 2001(Appendix Table II.2). As on October 5, 2001,the discount rate on CDs ranged between 6.0per cent and 9.3 per cent.
Bank Credit
2. 17 During the year under review, creditextended by SCBs recorded a growth of 17.3 percent (Rs.75,476 crore), on top of the rise of 18.2per cent recorded in the previous year. Foodcredit showed an increase of 55.7 per centduring 2000-01 as compared with the increaseof 52.8 per cent during 1999-2000. Non-foodcredit increased by 14.9 per cent (Rs.61,176crore) in 2000-01 as compared with the rise of16.5 per cent in 1999-2000. The credit-depositratio in terms of outstandings, moved downmarginally to 53.1 per cent as on March 23, 2001
from 53.6 per cent as on March 24, 2000. Non-food credit adjusted for non-SLR investments ofbanks, including bills rediscounted withfinancial institutions, recorded a growth rateof 16.1 per cent to Rs.5,48,071 crore as at end-March 2001 on top of the growth of 17.8 per centin the previous year. The (adjusted) non-foodcredit-deposit ratio in terms of outstandings,was 56.9 per cent as at end-March 2001 ascompared with 58.1 per cent as at end-March2000 (Table II.6 and Table II.7).
2. 18 During 2001-02 (upto October 19, 2001)bank credit registered a lower growth of 6.4 percent (Rs. 32,691 crore) than that of 9.7 per cent(Rs.42,168 crore) in the comparable period of theprevious year. Food credit increased by 25.7 percent (Rs. 10,289 crore) as against an increaseof 31.7 per cent (Rs. 8,154 crore) recorded duringthe comparable period of 2000-01. Non-foodcredit growth at 4.8 per cent (Rs. 22,402 crore)was lower than that of 8.3 per cent (Rs. 34,014crore) during the same period of 2000-01.Growth in non-food credit adjusted for SCBs non-SLR investments was lower at Rs. 25,947 croreupto October 19, 2001 as compared with Rs.37,535 crore during the corresponding period ofthe previous year, showing a year-on-yeargrowth rate of 12.3 per cent as on October 19,2001 as against 19.3 per cent as on October 20,2000. Bank credit (adjusted)- deposit ratio, onthe basis of outstandings, was placed lower at59.5 per cent as on October 19, 2001 as against61.2 per cent on October 20, 2001.
Investment
2. 19 Investments of SCBs in government andother approved securities increased by 19.8 percent (Rs.61,216 crore) in 2000-01 as comparedto a rise of 21.3 per cent (Rs.54,350 crore) in1999-2000 (Table II.6). On an incremental basis,investment by SCBs in government and otherapproved securities was equal to 41.0 per centof their deposits during 2000-01. As on March23, 2001, SCBs were holding excess investmentof about Rs.1,06,000 crore in SLR eligiblesecurities over the statutory prescription of 25per cent. The investment-deposit ratio, on anoutstanding basis, increased to 38.5 per cent ason March 23, 2001 from 38.0 per cent as onMarch 24, 2000.
2.20 The investments of scheduled
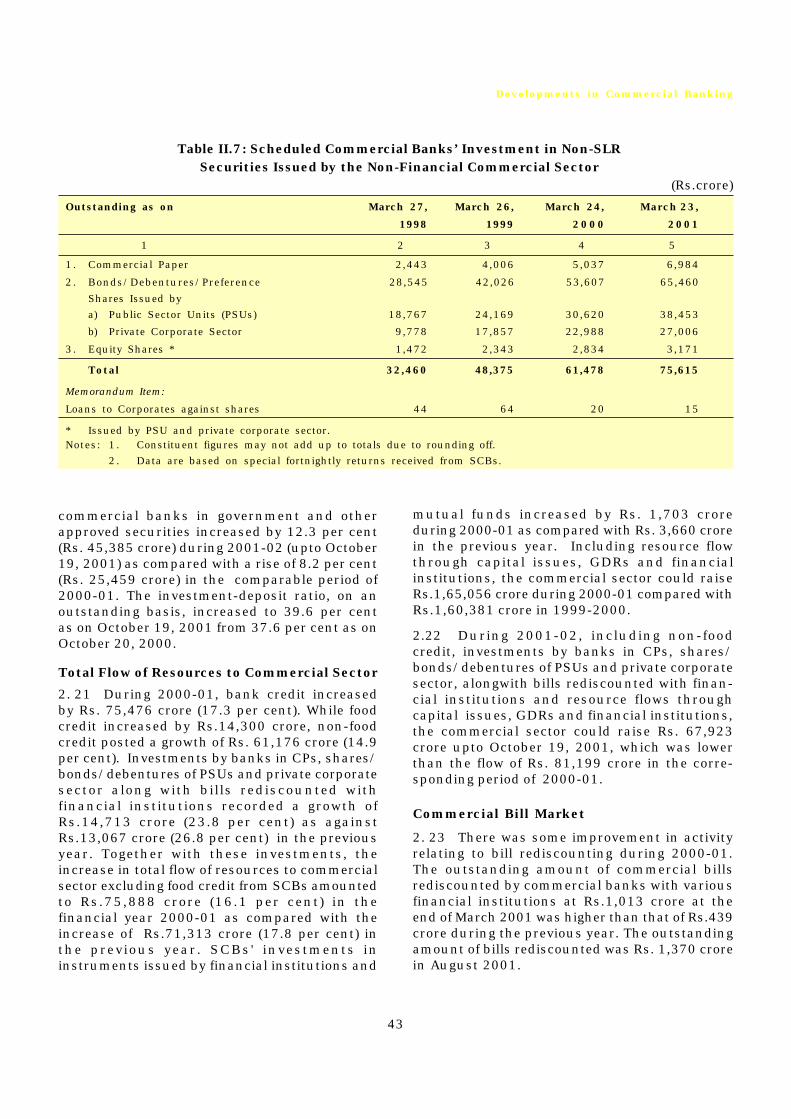
43
Developments in Commercial Banking
commercial banks in government and otherapproved securities increased by 12.3 per cent(Rs. 45,385 crore) during 2001-02 (upto October19, 2001) as compared with a rise of 8.2 per cent(Rs. 25,459 crore) in the comparable period of2000-01. The investment-deposit ratio, on anoutstanding basis, increased to 39.6 per centas on October 19, 2001 from 37.6 per cent as onOctober 20, 2000.
Total Flow of Resources to Commercial Sector
2. 21 During 2000-01, bank credit increasedby Rs. 75,476 crore (17.3 per cent). While foodcredit increased by Rs.14,300 crore, non-foodcredit posted a growth of Rs. 61,176 crore (14.9per cent). Investments by banks in CPs, shares/bonds/debentures of PSUs and private corporatesector along with bills rediscounted withfinancial institutions recorded a growth ofRs.14,713 crore (23.8 per cent) as againstRs.13,067 crore (26.8 per cent) in the previousyear. Together with these investments, theincrease in total flow of resources to commercialsector excluding food credit from SCBs amountedto Rs.75,888 crore (16.1 per cent) in thefinancial year 2000-01 as compared with theincrease of Rs.71,313 crore (17.8 per cent) inthe previous year. SCBs' investments ininstruments issued by financial institutions and
mutual funds increased by Rs. 1,703 croreduring 2000-01 as compared with Rs. 3,660 crorein the previous year. Including resource flowthrough capital issues, GDRs and financialinstitutions, the commercial sector could raiseRs.1,65,056 crore during 2000-01 compared withRs.1,60,381 crore in 1999-2000.
2.22 During 2001-02, including non-foodcredit, investments by banks in CPs, shares/bonds/debentures of PSUs and private corporatesector, alongwith bills rediscounted with finan-cial institutions and resource flows throughcapital issues, GDRs and financial institutions,the commercial sector could raise Rs. 67,923crore upto October 19, 2001, which was lowerthan the flow of Rs. 81,199 crore in the corre-sponding period of 2000-01.
Commercial Bill Market
2. 23 There was some improvement in activityrelating to bill rediscounting during 2000-01.The outstanding amount of commercial billsrediscounted by commercial banks with variousfinancial institutions at Rs.1,013 crore at theend of March 2001 was higher than that of Rs.439crore during the previous year. The outstandingamount of bills rediscounted was Rs. 1,370 crorein August 2001.
Table II.7: Scheduled Commercial Banks’ Investment in Non-SLRSecurities Issued by the Non-Financial Commercial Sector
(Rs.crore)
Outstanding as on March 27, March 26, March 24, March 23,
1998 1999 2000 2001
1 2 3 4 5
1. Commercial Paper 2,443 4,006 5,037 6,984
2. Bonds/Debentures/Preference 28,545 42,026 53,607 65,460
Shares Issued by
a) Public Sector Units (PSUs) 18,767 24,169 30,620 38,453
b) Private Corporate Sector 9,778 17,857 22,988 27,006
3. Equity Shares * 1,472 2,343 2,834 3,171
Total 32,460 48,375 61,478 75,615
Memorandum Item:
Loans to Corporates against shares 44 64 20 15
* Issued by PSU and private corporate sector.Notes: 1. Constituent figures may not add up to totals due to rounding off.
2. Data are based on special fortnightly returns received from SCBs.
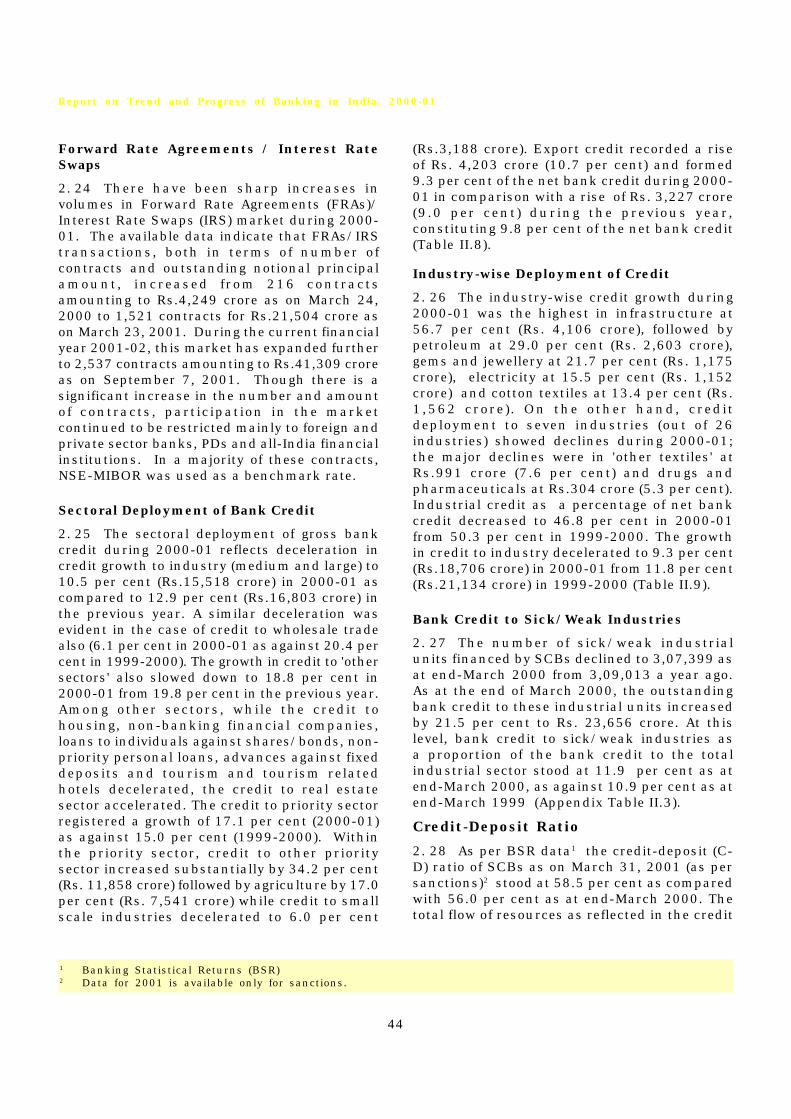
44
Report on Trend and Progress of Banking in India, 2000-01
Forward Rate Agreements / Interest RateSwaps
2. 24 There have been sharp increases involumes in Forward Rate Agreements (FRAs)/Interest Rate Swaps (IRS) market during 2000-01. The available data indicate that FRAs/IRStransactions, both in terms of number ofcontracts and outstanding notional principalamount, increased from 216 contractsamounting to Rs.4,249 crore as on March 24,2000 to 1,521 contracts for Rs.21,504 crore ason March 23, 2001. During the current financialyear 2001-02, this market has expanded furtherto 2,537 contracts amounting to Rs.41,309 croreas on September 7, 2001. Though there is asignificant increase in the number and amountof contracts, participation in the marketcontinued to be restricted mainly to foreign andprivate sector banks, PDs and all-India financialinstitutions. In a majority of these contracts,NSE-MIBOR was used as a benchmark rate.
Sectoral Deployment of Bank Credit
2. 25 The sectoral deployment of gross bankcredit during 2000-01 reflects deceleration incredit growth to industry (medium and large) to10.5 per cent (Rs.15,518 crore) in 2000-01 ascompared to 12.9 per cent (Rs.16,803 crore) inthe previous year. A similar deceleration wasevident in the case of credit to wholesale tradealso (6.1 per cent in 2000-01 as against 20.4 percent in 1999-2000). The growth in credit to 'othersectors' also slowed down to 18.8 per cent in2000-01 from 19.8 per cent in the previous year.Among other sectors, while the credit tohousing, non-banking financial companies,loans to individuals against shares/bonds, non-priority personal loans, advances against fixeddeposits and tourism and tourism relatedhotels decelerated, the credit to real estatesector accelerated. The credit to priority sectorregistered a growth of 17.1 per cent (2000-01)as against 15.0 per cent (1999-2000). Withinthe priority sector, credit to other prioritysector increased substantially by 34.2 per cent(Rs. 11,858 crore) followed by agriculture by 17.0per cent (Rs. 7,541 crore) while credit to smallscale industries decelerated to 6.0 per cent
(Rs.3,188 crore). Export credit recorded a riseof Rs. 4,203 crore (10.7 per cent) and formed9.3 per cent of the net bank credit during 2000-01 in comparison with a rise of Rs. 3,227 crore(9.0 per cent) during the previous year,constituting 9.8 per cent of the net bank credit(Table II.8).
Industry-wise Deployment of Credit
2. 26 The industry-wise credit growth during2000-01 was the highest in infrastructure at56.7 per cent (Rs. 4,106 crore), followed bypetroleum at 29.0 per cent (Rs. 2,603 crore),gems and jewellery at 21.7 per cent (Rs. 1,175crore), electricity at 15.5 per cent (Rs. 1,152crore) and cotton textiles at 13.4 per cent (Rs.1,562 crore) . On the other hand, creditdeployment to seven industries (out of 26industries) showed declines during 2000-01;the major declines were in 'other textiles' atRs.991 crore (7.6 per cent) and drugs andpharmaceuticals at Rs.304 crore (5.3 per cent).Industrial credit as a percentage of net bankcredit decreased to 46.8 per cent in 2000-01from 50.3 per cent in 1999-2000. The growthin credit to industry decelerated to 9.3 per cent(Rs.18,706 crore) in 2000-01 from 11.8 per cent(Rs.21,134 crore) in 1999-2000 (Table II.9).
Bank Credit to Sick/Weak Industries
2. 27 The number of sick/weak industrialunits financed by SCBs declined to 3,07,399 asat end-March 2000 from 3,09,013 a year ago.As at the end of March 2000, the outstandingbank credit to these industrial units increasedby 21.5 per cent to Rs. 23,656 crore. At thislevel, bank credit to sick/weak industries asa proportion of the bank credit to the totalindustrial sector stood at 11.9 per cent as atend-March 2000, as against 10.9 per cent as atend-March 1999 (Appendix Table II.3).
Credit-Deposit Ratio
2. 28 As per BSR data1 the credit-deposit (C-D) ratio of SCBs as on March 31, 2001 (as persanctions)2 stood at 58.5 per cent as comparedwith 56.0 per cent as at end-March 2000. Thetotal flow of resources as reflected in the credit
1 Banking Statistical Returns (BSR)2 Data for 2001 is available only for sanctions.

45
Developments in Commercial Banking
Table II.8 : Sectoral Deployment of Gross Bank Credit by Major Sectors
(Amount in Rs.crore)
Sectors Outstanding as on Variations during
March 26, March 24, March 23, July 28, July 27, Financial year April-July
1999 2000 2001 2000 2001 1999- 2000 2000 20012000 -01
1 2 3 4 5 6 7 8 9 10(3-2) (4-3) (5-3) (6-4)
I. Gross Bank Credit (1+2) 3,42,012 4,00,818 4,69,153 4,19,532 4,80,648 58,806 68,335 18,714 11,4951. Public Food Procurement
Credit 16,816 25,691 39,991 33,182 51,027 8,875 14,300 7,491 11,0362. Non-Food Gross Bank
Credit 3,25,196 3,75,127 4,29,162 3,86,350 4,29,621 49,931 54,035 11,223 459(A+B+C+D) [100.0] [100.0]
A. Priority Sectors 1,14,611 1,31,827 1,54,414 1,35,480 1,54,156 17,216 22,587 3,653 -258(34.5) (41.8)
(i) Agriculture 39,634 44,381 51,922 45,528 52,076 4,747 7,541 1,147 154(9.5) (14.0)
(ii) Small Scale Industries 48,483 52,814 56,002 52,040 53,241 4,331 3,188 -774 -2,761(8.7) (5.9)
(iii) Other Priority Sectors 26,494 34,632 46,490 37,912 48,839 8,138 11,858 3,280 2,349(16.3) (21.9)
B. Industry (Medium &Large) 1,30,516 1,47,319 1,62,837 1,52,626 1,60,175 16,803 15,518 5,307 -2,662
(33.7) (28.7) C.Wholesale Trade
(other than 13,965 16,818 17,845 17,006 16,567 2,853 1,027 188 -1,278food procurement) (5.7) (1.9)
D.Other Sectors 66,104 79,163 94,066 81,238 98,723 13,059 14,903 2,075 4,657of which : (26.2) (27.6)(i) Housing 11,404 14,100 16,143 14,237 17,891 2,696 2,043 137 1,748
(5.4) (3.8)(ii) Consumer durables 3,090 3,855 5,566 4,561 6,793 765 1,711 706 1,227
(1.5) (3.2)(iii) Non-banking financial 6,082 7,178 7,810 7,138 7,491 1,096 632 -40 -319
companies (2.2) (1.2)(iv) Loans to individuals 1,625 2,146 1,697 2,175 1,454 521 -449 29 -243
(1.0) (-0.8)(v) Real Estate Loans 1,625 1,644 1,766 1,596 1,912 19 122 -48 146
(0.0) (0.2)(vi) Other non-priority sector 12,289 15,409 18,064 15,101 18,415 3,120 2,655 -308 351
personal loans (6.2) (4.9)(vii) Advances against 15,106 18,876 19,942 19,126 19,383 3,770 1,066 250 -559
Fixed Deposits (7.6) (2.0)(viii) Tourism and tourism 612 900 996 1,048 1,473 288 96 148 477
related hotels (0.6) (0.2)II. Export Credit (included
under item I.2) 35,891 39,118 43,321 39,708 38,217 3,227 4,203 590 -5,104III.Net Bank Credit
(including inter-bankparticipation) 3,39,477 3,98,205 4,67,206 4,17,697 4,78,903 58,728 69,001 19,492 11,697
Memorandum Item :
Export Sector credit asper cent to NBC 10.6 9.8 9.3 9.5 8.0
Notes: 1. Data are provisional and relate to selected scheduled commercial banks (49 banks from March 2001 onwards)which account for about 90-95 per cent of bank credit of all scheduled commercial banks. Gross bank creditdata include bills rediscounted with RBI, IDBI, EXIM Bank, other approved financial institutions and inter-bank participations. Net bank credit data are exclusive of bills rediscounted with RBI, IDBI, EXIM Bankand other approved financial institutions.
2. Figures in brackets are percentage to variation in non-food gross bank credit.3. Data on priority sector does not include eligible investments and also differs from that published elsewhere
in the Report.
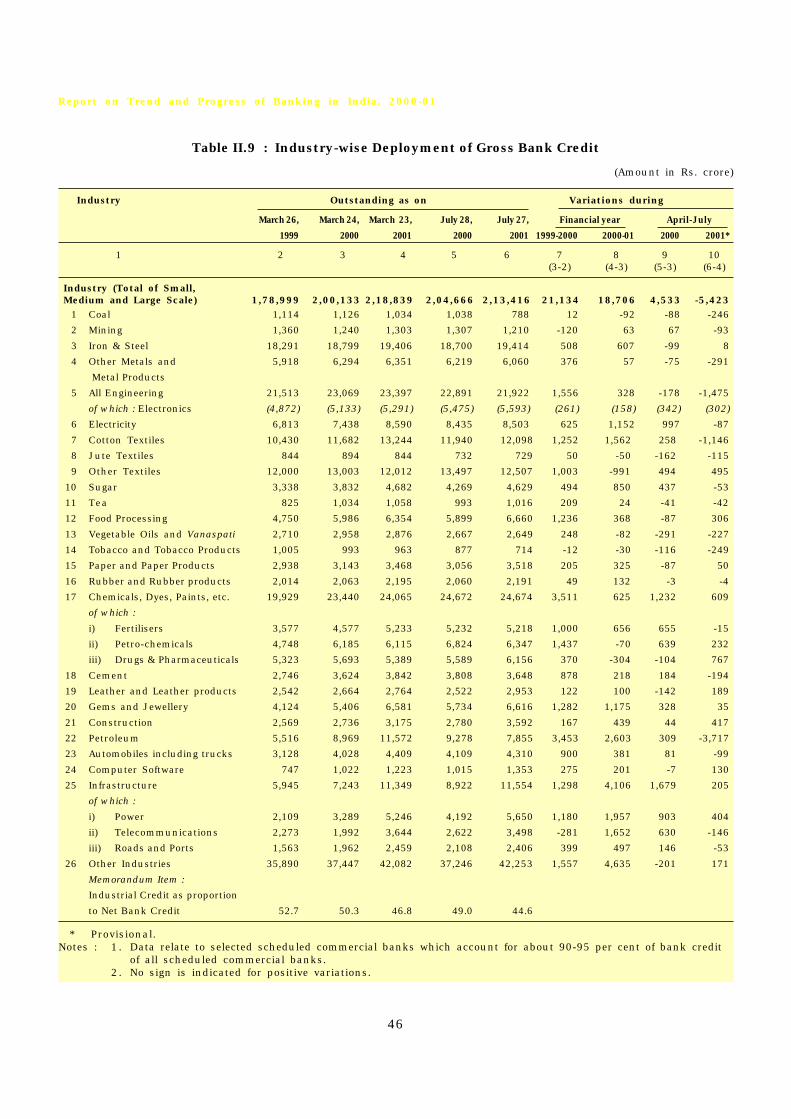
46
Report on Trend and Progress of Banking in India, 2000-01
Table II.9 : Industry-wise Deployment of Gross Bank Credit
(Amount in Rs. crore)
Industry Outstanding as on Variations during
March 26, March 24, March 23, July 28, July 27, Financial year April-July
1999 2000 2001 2000 2001 1999-2000 2000-01 2000 2001*
1 2 3 4 5 6 7 8 9 10(3-2) (4-3) (5-3) (6-4)
Industry (Total of Small,Medium and Large Scale) 1,78,999 2,00,133 2,18,839 2,04,666 2,13,416 21,134 18,706 4,533 -5,423
1 Coal 1,114 1,126 1,034 1,038 788 12 -92 -88 -246
2 Mining 1,360 1,240 1,303 1,307 1,210 -120 63 67 -93
3 Iron & Steel 18,291 18,799 19,406 18,700 19,414 508 607 -99 8
4 Other Metals and 5,918 6,294 6,351 6,219 6,060 376 57 -75 -291
Metal Products
5 All Engineering 21,513 23,069 23,397 22,891 21,922 1,556 328 -178 -1,475
of which : Electronics (4,872) (5,133) (5,291) (5,475) (5,593) (261) (158) (342) (302)
6 Electricity 6,813 7,438 8,590 8,435 8,503 625 1,152 997 -87
7 Cotton Textiles 10,430 11,682 13,244 11,940 12,098 1,252 1,562 258 -1,146
8 Jute Textiles 844 894 844 732 729 50 -50 -162 -115
9 Other Textiles 12,000 13,003 12,012 13,497 12,507 1,003 -991 494 495
10 Sugar 3,338 3,832 4,682 4,269 4,629 494 850 437 -53
11 Tea 825 1,034 1,058 993 1,016 209 24 -41 -42
12 Food Processing 4,750 5,986 6,354 5,899 6,660 1,236 368 -87 306
13 Vegetable Oils and Vanaspati 2,710 2,958 2,876 2,667 2,649 248 -82 -291 -227
14 Tobacco and Tobacco Products 1,005 993 963 877 714 -12 -30 -116 -249
15 Paper and Paper Products 2,938 3,143 3,468 3,056 3,518 205 325 -87 50
16 Rubber and Rubber products 2,014 2,063 2,195 2,060 2,191 49 132 -3 -4
17 Chemicals, Dyes, Paints, etc. 19,929 23,440 24,065 24,672 24,674 3,511 625 1,232 609
of which :
i) Fertilisers 3,577 4,577 5,233 5,232 5,218 1,000 656 655 -15
ii) Petro-chemicals 4,748 6,185 6,115 6,824 6,347 1,437 -70 639 232
iii) Drugs & Pharmaceuticals 5,323 5,693 5,389 5,589 6,156 370 -304 -104 767
18 Cement 2,746 3,624 3,842 3,808 3,648 878 218 184 -194
19 Leather and Leather products 2,542 2,664 2,764 2,522 2,953 122 100 -142 189
20 Gems and Jewellery 4,124 5,406 6,581 5,734 6,616 1,282 1,175 328 35
21 Construction 2,569 2,736 3,175 2,780 3,592 167 439 44 417
22 Petroleum 5,516 8,969 11,572 9,278 7,855 3,453 2,603 309 -3,717
23 Automobiles including trucks 3,128 4,028 4,409 4,109 4,310 900 381 81 -99
24 Computer Software 747 1,022 1,223 1,015 1,353 275 201 -7 130
25 Infrastructure 5,945 7,243 11,349 8,922 11,554 1,298 4,106 1,679 205
of which :
i) Power 2,109 3,289 5,246 4,192 5,650 1,180 1,957 903 404
ii) Telecommunications 2,273 1,992 3,644 2,622 3,498 -281 1,652 630 -146
iii) Roads and Ports 1,563 1,962 2,459 2,108 2,406 399 497 146 -53
26 Other Industries 35,890 37,447 42,082 37,246 42,253 1,557 4,635 -201 171
Memorandum Item :
Industrial Credit as proportion
to Net Bank Credit 52.7 50.3 46.8 49.0 44.6
* Provisional.Notes : 1. Data relate to selected scheduled commercial banks which account for about 90-95 per cent of bank credit
of all scheduled commercial banks.2. No sign is indicated for positive variations.

47
Developments in Commercial Banking
and investment to deposit (IC-D) ratio showedan increase (as per utilisation) for the northernand western regions as at end-March 2000. TheIC-D ratio was highest for the western region(78.6 per cent), followed by the southern (75.5per cent) and the northern (54.8 per cent)regions (Appendix Table II.4).
Lending to Sensitive Sectors
2. 29 The overall exposure of SCBs to thesensitive sector comprising capital market, realestate and commodities3 stood at Rs.22,318crore which was 4.3 per cent of total loans andadvances as at end-March 2001. Lending to thecommodities sector accounted for the largestshare of advances of banks within the sensitivesectors (42.0 per cent), followed by real estate(36.8 per cent) and the capital market (21.2 per
cent). New private sector banks had an exposureat 11.0 per cent, of their total loans andadvances to the sensitive sectors, followed byold private banks (7.7 per cent), nationalisedbanks (4.3 per cent), foreign banks (4.2 per cent)and the State Bank group (2.0 per cent) (TableII.10).
Stock Prices of Indian Banks
2. 30 As on March 31, 2001, there were 11public sector banks and 19 private sector bankslisted for trading on the National StockExchange. Movements in bank share prices aregiven in Table II.11. The share of bank scripsin the total turnover of NSE declined to 1.0 percent in 2000-01 from 3.7 per cent in 1999-2000(Table II.12).
Table II.10: Lending to Sensitive Sectors(As at end-March 2001)
(Rs. crore)
Bank-group Advances to Total
Capital Market Real Estate Commodities
1 2 3 4 5
1. Public Sector Banks 1,479.34 5,622.42 7,196.18 14,297.94
(0.36) (1.36) (1.74) (3.45)
Nationalised Banks 1,362.82 4,268.15 5,719.81 11,350.78
(0.52) (1.62) (2.16) (4.30)
State Bank Group 116.52 1,354.27 1,476.37 2,947.16
(0.08) (0.90) (0.98) (1.96)
2. Private Sector Banks 2,280.48 2,060.57 1,883.23 6,224.28
(3.35) (3.03) (2.77) (9.15)
Old Private Sector Banks 535.22 1,184.02 1,210.83 2,930.07
(1.41) (3.12) (3.19) (7.72)
New Private Sector Banks 1,745.26 876.55 672.40 3,294.21
(5.80) (2.91) (2.23) (10.95)
3. Foreign Banks in India 973.15 523.79 298.89 1,795.83
(2.26) (1.22) (0.70) (4.18)
Scheduled Commercial Banks 4,732.97 8,206.78 9,378.30 22,318.05(1+2+3) (0.90) (1.56) (1.78) (4.25)
Note: Figures in brackets are percentage to total loans and advances of the concerned bank-group.
3 Commodities include cash crops, edible oils, agricultural produce and other sensitive commodities.
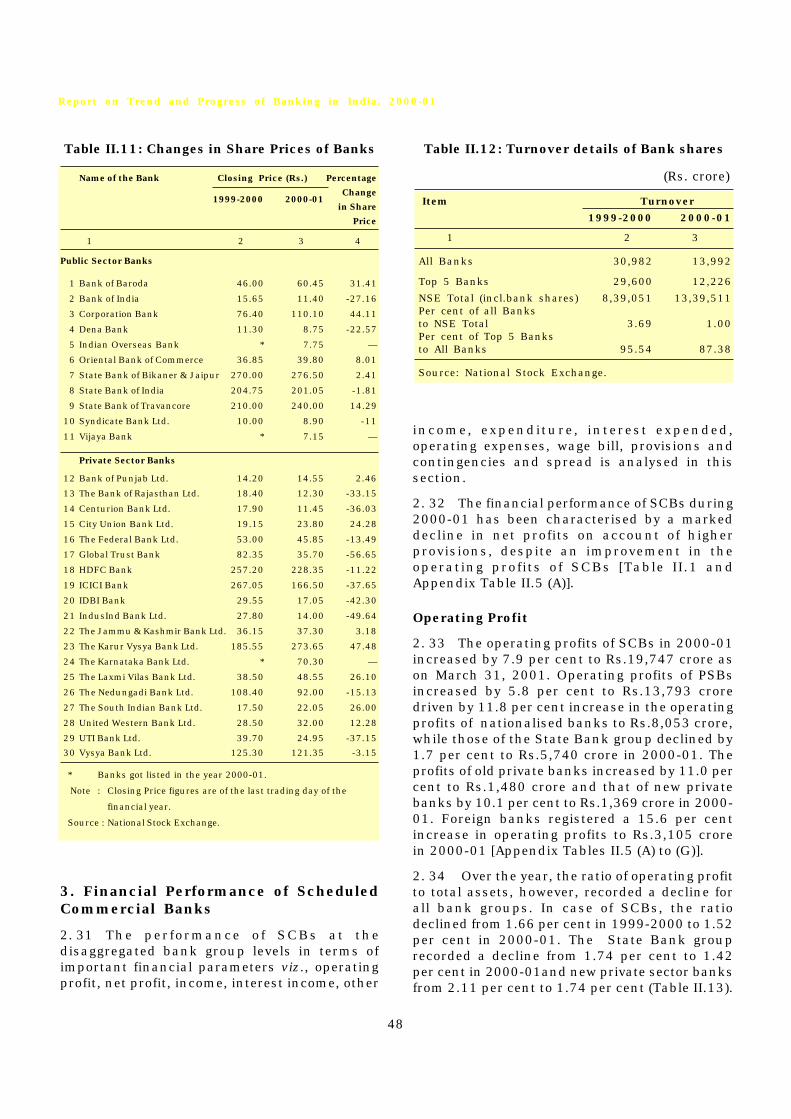
48
Report on Trend and Progress of Banking in India, 2000-01
Table II.11: Changes in Share Prices of Banks
Name of the Bank Closing Price (Rs.) Percentage
Change1999-2000 2000-01
in Share
Price
1 2 3 4
Public Sector Banks
1 Bank of Baroda 46.00 60.45 31.41
2 Bank of India 15.65 11.40 -27.16
3 Corporation Bank 76.40 110.10 44.11
4 Dena Bank 11.30 8.75 -22.57
5 Indian Overseas Bank * 7.75 —
6 Oriental Bank of Commerce 36.85 39.80 8.01
7 State Bank of Bikaner & Jaipur 270.00 276.50 2.41
8 State Bank of India 204.75 201.05 -1.81
9 State Bank of Travancore 210.00 240.00 14.29
10 Syndicate Bank Ltd. 10.00 8.90 -11
11 Vijaya Bank * 7.15 —
Private Sector Banks
12 Bank of Punjab Ltd. 14.20 14.55 2.46
13 The Bank of Rajasthan Ltd. 18.40 12.30 -33.15
14 Centurion Bank Ltd. 17.90 11.45 -36.03
15 City Union Bank Ltd. 19.15 23.80 24.28
16 The Federal Bank Ltd. 53.00 45.85 -13.49
17 Global Trust Bank 82.35 35.70 -56.65
18 HDFC Bank 257.20 228.35 -11.22
19 ICICI Bank 267.05 166.50 -37.65
20 IDBI Bank 29.55 17.05 -42.30
21 IndusInd Bank Ltd. 27.80 14.00 -49.64
22 The Jammu & Kashmir Bank Ltd. 36.15 37.30 3.18
23 The Karur Vysya Bank Ltd. 185.55 273.65 47.48
24 The Karnataka Bank Ltd. * 70.30 —
25 The Laxmi Vilas Bank Ltd. 38.50 48.55 26.10
26 The Nedungadi Bank Ltd. 108.40 92.00 -15.13
27 The South Indian Bank Ltd. 17.50 22.05 26.00
28 United Western Bank Ltd. 28.50 32.00 12.28
29 UTI Bank Ltd. 39.70 24.95 -37.15
30 Vysya Bank Ltd. 125.30 121.35 -3.15
* Banks got listed in the year 2000-01.
Note : Closing Price figures are of the last trading day of the
financial year.
Source : National Stock Exchange.
Table II.12: Turnover details of Bank shares
(Rs. crore)
Item Turnover
1999-2000 2000-01
1 2 3
All Banks 30,982 13,992
Top 5 Banks 29,600 12,226
NSE Total (incl.bank shares) 8,39,051 13,39,511Per cent of all Banksto NSE Total 3.69 1.00Per cent of Top 5 Banksto All Banks 95.54 87.38
Source: National Stock Exchange.
3. Financial Performance of ScheduledCommercial Banks
2. 31 The performance of SCBs at thedisaggregated bank group levels in terms ofimportant financial parameters viz., operatingprofit, net profit, income, interest income, other
income, expenditure, interest expended,operating expenses, wage bill, provisions andcontingencies and spread is analysed in thissection.
2. 32 The financial performance of SCBs during2000-01 has been characterised by a markeddecline in net profits on account of higherprovisions, despite an improvement in theoperating profits of SCBs [Table II.1 andAppendix Table II.5 (A)].
Operating Profit
2. 33 The operating profits of SCBs in 2000-01increased by 7.9 per cent to Rs.19,747 crore ason March 31, 2001. Operating profits of PSBsincreased by 5.8 per cent to Rs.13,793 croredriven by 11.8 per cent increase in the operatingprofits of nationalised banks to Rs.8,053 crore,while those of the State Bank group declined by1.7 per cent to Rs.5,740 crore in 2000-01. Theprofits of old private banks increased by 11.0 percent to Rs.1,480 crore and that of new privatebanks by 10.1 per cent to Rs.1,369 crore in 2000-01. Foreign banks registered a 15.6 per centincrease in operating profits to Rs.3,105 crorein 2000-01 [Appendix Tables II.5 (A) to (G)].
2. 34 Over the year, the ratio of operating profitto total assets, however, recorded a decline forall bank groups. In case of SCBs, the ratiodeclined from 1.66 per cent in 1999-2000 to 1.52per cent in 2000-01. The State Bank grouprecorded a decline from 1.74 per cent to 1.42per cent in 2000-01and new private sector banksfrom 2.11 per cent to 1.74 per cent (Table II.13).

49
Developments in Commercial Banking
Net Profit
2. 35 The net profits of SCBs declined by 11.3per cent to Rs.6,424 crore in 2000-01. Amongthe bank groups, only new private sector banksrecorded an increase of 12.3 per cent in netprofits. Net profit of public sector banks andforeign banks declined by 15.6 per cent and 2.4per cent, respectively [Appendix Tables II.5 (A)to (G)].
2. 36 The ratio of net profit to total assets ofSCBs declined from 0.66 per cent in 1999-2000to 0.50 per cent in 2000-01. In the case of PSBs,the ratio declined from 0.57 per cent to 0.42 percent and within that for the State Bank groupfrom 0.80 per cent to 0.55 per cent. The ratiofor individual PSBs excluding two loss makingbanks are furnished in Chart II.3. In the caseof private banks, for new banks, the ratiodeclined from 0.97 per cent to 0.81 per cent andfor the old banks from 0.81 per cent to 0.62 percent. In respect of foreign banks, the ratiodeclined from 1.17 per cent to 0.93 per cent(Table II.13 and Chart II.4).
2. 37 In order to shore up the profitabilityamidst increasing competition, particularlyprivate sector banks have resorted amongothers to mergers and acquisitions in the recentpast in consonance with the trends witnessedin developed as well as emerging marketeconomies (Box II.1).
Income
2. 38 The income of SCBs recorded an increaseof 14.9 per cent to Rs.1,32,078 crore in 2000-01. PSBs recorded an increase of 13.9 per centin their income to Rs.1,03,499 crore. The StateBank group and nationalised banks recorded a15.8 per cent and 12.7 per cent increases inincome, respectively. New and old private sectorbanks, respectively, recorded 38.8 per cent and9.8 per cent increase in income and foreignbanks income rose by 16.0 per cent [AppendixTables II.5(A) to (G)].
2. 39 With the higher increase in total assets(17.1 per cent) than in income (14.9 per cent)the ratio of income to total assets of SCBsdeclined from 10.40 per cent in 1999-2000 to10.20 per cent in 2000-01. There was a generaldecline in this ratio among bank groups during2000-01 excepting in case of the new privatesector banks where the ratio increased from9.18 per cent in 1999-2000 to 9.53 per cent in2000-01 (Table II.13).
Interest Income
2. 40 The interest income of SCBs increasedby 15.9 per cent to Rs.1,14,951 crore in 2000-01. Among the individual bank groups, newprivate sector banks recorded the highestincrease of 43.9 per cent followed by the StateBank group (16.6 per cent), foreign banks (15.1

50
Report
on
T
ren
d
an
d
Pro
gre
ss of
Ban
kin
g
in
India
, 2
00
0-0
1
Table II.13: Bank Group-wise Select Indicators of Financial Performance(As percentage of Total Assets)
Bank Group/ Operating Net Income Interest Other Expen- Interest Operating Provisions SpreadYear Profit Profit Income Income diture Expended Expenses and Cont-
Total of which ingencies Wage Bill
1 2 3 4 5 6 7 8 9 10 11 12
Scheduled Commercial Banks
1999-2000 1.66 0.66 10.40 8.97 1.42 9.74 6.25 2.50 1.67 1.00 2.73
2000-01 1.52 0.50 10.20 8.88 1.32 9.70 6.04 2.64 1.79 1.03 2.84
Public Sector Banks
1999-2000 1.46 0.57 10.21 8.92 1.29 9.63 6.22 2.53 1.84 0.89 2.70
2000-01 1.34 0.42 10.05 8.84 1.22 9.63 5.99 2.72 2.03 0.92 2.84
Nationalised Banks
1999-2000 1.30 0.44 10.27 9.06 1.20 9.83 6.40 2.57 1.89 0.86 2.66
2000-01 1.28 0.33 10.23 9.09 1.14 9.90 6.19 2.76 2.10 0.95 2.90
State Bank Group
1999-2000 1.74 0.80 10.11 8.67 1.44 9.32 5.91 2.46 1.76 0.94 2.76
2000-01 1.42 0.55 9.77 8.44 1.33 9.22 5.68 2.66 1.93 0.87 2.76
Old Private Sector Banks
1999-2000 1.82 0.81 11.33 9.66 1.66 10.52 7.33 2.17 1.39 1.01 2.33
2000-01 1.75 0.62 10.75 9.52 1.23 10.13 7.01 1.98 1.23 1.13 2.51
New Private Sector Banks
1999-2000 2.11 0.97 9.18 7.60 1.58 8.21 5.64 1.42 0.28 1.14 1.95
2000-01 1.74 0.81 9.53 8.18 1.35 8.71 6.04 1.75 0.32 0.93 2.14
Foreign Banks
1999-2000 3.24 1.17 12.47 9.93 2.54 11.31 6.01 3.22 1.05 2.08 3.92
2000-01 3.05 0.93 11.77 9.30 2.47 10.84 5.66 3.05 0.97 2.12 3.64

51
Developments in Commercial Banking
per cent), old private sector banks (14.0 per cent)and nationalised banks (13.4 per cent) [AppendixTables II.5(A) to (G)]. Among individual bankgroups, foreign banks had the highest proportionof interest earned on advances/bills in interestincome, whereas the proportion of interestincome from investments was highest in thecase of new private sector banks.
2. 41 The ratio of interest income to totalassets of SCBs declined from 8.97 per cent in
1999-2000 to 8.88 per cent in 2000-01. The ratiodeclined in respect of PSBs from 8.92 per centto 8.84 per cent, the State Bank group from8.67 per cent to 8.44 per cent, old private banksfrom 9.66 per cent to 9.52 per cent and foreignbanks from 9.93 per cent to 9.30 per cent (TableII.13). The ratio increased for nationalisedbanks from 9.06 per cent to 9.09 per cent andfor new private banks from 7.60 per cent to 8.18per cent (Chart II.5).
The banking system in many emerging economiesis fragmented in terms of the number and size ofinstitutions, ownership, profitability and competitivenessof banks, use of modern technology and other relatedstructural features. Very often, three or four largecommercial banks co-exist with a large number of smallerurban and rural banks, or under the influence of thepublic sector. In general, few commercial banks, evenlarger ones, are listed on the stock exchange. Profitabilityvaries widely, with some banks earning high returnsbut operating very inefficiently, and other bankscompeting fiercely for a narrow segment of the market.Likewise, while some commercial banks in the emergingeconomies are at the cutting edge of technology andfinancial innovation, many are still struggling with thebasic operations such as credit risk assessment andliquidity management. Finally, recent banking criseshave weakened banking systems in a number ofcountries, and banks in some countries remain on thebrink of insolvency.
In this context, bank mergers have beenconsidered as a possible avenue for improving thestructure and efficiency of the banking industry. It ispossible to categorise the motivations for bank mergersinto four viz . , cost benefits (economies of scale,organisational ef f iciency, funding costs and riskdiversification), revenue benefits (economies of scope,enhancing monopoly rents) , economic condit ions(mergers after crises or after the upswing of thebusiness cycle); and other motives (private managerialbenefits, defence against takeovers, etc.).
Cross-country experience of bank mergers issuggestive of significant cost and revenue benefits frombank consolidation. Market-driven consolidation is arelatively new phenomenon and has been mainly observedin Central European economies. In Hungary, for instance,some 40 institutions are presently competing in the retailand corporate markets. At the same time, Belgium’s KBCand ABN Amro merged their Hungarian operations toexploit market synergies. After the large number ofbankruptcies of private banks, in Poland and CzechRepublic the number of commercial banks declinedsignificantly, with no dominant bank in the corporatesector.
Box II.1: Mergers and Acquisitions in Banking: International Experiencesand Indian Evidence
In other economies and especially in Asia, government-led consolidation has gained credence, motivated bythe need to strengthen capital adequacy and thefinancial viability of many smaller banks affected bythe 1997-98 crisis. The clearest example of thisapproach is Malaysia’s Danamodal, a special purposeinstitution established with the twin objectives ofrecapi ta l is ing the banks and fac i l i ta t ingconsolidation and rationalisation of the bankingsystem. In Philippines, a range of incentives is beingoffered to the merging banks, including better accessto rediscount facil it ies and temporary relief fromcertain prudential requirements. In Indonesia, fourof the seven state banks existing before the crisiswere consol idated into a new state bank (BankMandiri). In addition, eight private banks that hadbeen taken over by the Indones ian BankRestructuring Agency (IBRA) were merged during2000 into a new institution.
In Lat in America, bank mergers arose as aresponse to inef f ic ient banking structures. InArgentina, bank consolidation has been driven largelyby the domestic and external financial liberalisationlaunched in the early 1990s, and the progressivet ightening of prudent ia l regulat ions. Bankconsolidation in Mexico, on the other hand, took placein response to the lack of capital after the 1995banking crisis.
In view of the global phenomenon of consolidationand convergence, the Report of the Committee onBanking Sector Reforms (Chairman: Shri.M.Narasimham) had suggested mergers among strongbanks, both in the public and private sectors and evenwith financial institutions and NBFCs. Thephenomenon of mergers in the banking sector is arelatively recent one in India. There was one mergerin the early nineties, i.e., New Bank of India withPunjab National Bank. There has been a spate ofmergers in the recent past, viz., 20th Century Financewith Centurion Bank, HDFC Bank with Times Bankand ICICI Bank with Bank of Madura. The table belowpresents the number of mergers in the banking sector inIndia over the last three years.
(Contd..)

52
Report on Trend and Progress of Banking in India, 2000-01
What is important is that the systems for internal controlsand risk management are put in place in order to takespeedy decisions for offering a wide range of productsthrough multiple delivery channels. In the ultimateanalysis, therefore, the success of consolidation effortswill depend on how effectively the banking industry isable to put in place firewalls against financial crises,while blending risks with returns.
References:
Hawkins, J. and P. Turner (1999), ‘Bank Restructuringin Practice: An Overview’, in Bank Restructuring inPractice , Bank for International Sett lements,Switzerland.
Reserve Bank of India, Annual Report 1999-2000,Mumbai.
Table: Mergers in Banking Sector in India: 1999 to 2001
Name of the Merging Name of the Date of Merger Post Merger Status
Entity Merged Entity (in per cent)
CRAR Net NPA Return on
Ratio Assets
20th Century Finance Centurion Bank January 1998 8.45* 4.67* 0.82*
Bareilly Corporation Bank Bank of Baroda June 1999 12.10 6.95 0.85
Sikkim Bank Union Bank of India December 1999 11.42 7.97 0.29
Times Bank HDFC Bank February 2000 12.19 1.01 1.84
Bank of Madura ICICI Bank March 2001 11.57** 2.19** 0.82**
* As at end-March 1999. ** As at end-March 2001. All other ratios are as at end-March 2000.
Other Income
2. 42 Other income of SCBs registered anincrease of 8.8 per cent to Rs.17,127 crore in2000-01. Among the bank groups, foreign banksrecorded the highest increase of 19.5 per centfollowed by new private sector banks (14.1 percent), the State Bank group (10.8 per cent) and
nationalised banks (7.5 per cent). On the otherhand, old private sector banks recorded adecline of 14.6 per cent to Rs.1,039 crore inother income in 2000-01[Appendix Tables II.5(A)to (G)].
2. 43 Commission, exchange and brokerageconstituted around 52.0 per cent of the otherincome of SCBs, with the proportion beinghighest in case of PSBs at 52.5 per cent. Therewas a decline in the ratio of other income tototal assets among all bank groups during 2000-01. The ratio of other income to total assets ofSCBs declined from 1.42 per cent in 1999-2000to 1.32 per cent in 2000-01. In the case of PSBs,the ratio declined from 1.29 per cent to 1.22 percent, the State Bank group from 1.44 per centto 1.33 per cent, nationalised banks from 1.20per cent to 1.14 per cent, old private sector banksfrom 1.66 per cent to 1.23 per cent, new privatebanks from 1.58 per cent to 1.35 per cent andfor foreign banks from 2.54 per cent to 2.47 percent (Table II.13).
Expenditure
2. 44 The expenditure of SCBs registered anincrease of 16.7 per cent to Rs.1,25,654 crorein 2000-01. Among the bank groups, new privatesector banks recorded the highest increase(41.9 per cent) to Rs.6,865 crore, followed by the

53
Developments in Commercial Banking
nationalised banks (21.6 per cent), foreignbanks (16.7 per cent) and old private sectorbanks (5.9 per cent) [Appendix Tables II.5(A) to(G)].
2. 49 The ratio of operating expenses to totalassets of SCBs increased from 2.50 per cent in1999-2000 to 2.64 per cent in 2000-01. The ratioincreased from 2.53 per cent to 2.72 per centin the case of PSBs, from 2.57 per cent to 2.76per cent for nationalised banks, from 2.46 percent to 2.66 per cent for the State Bank groupand from 1.42 per cent to 1.75 per cent for newprivate sector banks. The ratio declined from2.17 per cent in 1999-2000 to 1.98 per cent inrespect of old private sector banks and from 3.22per cent to 3.05 per cent for foreign banks (TableII.13 and Chart II.6).
Wage Bill
2. 50 The wage bill of SCBs increased by 25.8per cent to Rs.23,206 crore in 2000-01. Amongthe bank groups, new private sector banksshowed the highest increase (52.3 per cent)followed by the State Bank group (31.4 per cent),while old private banks recorded the lowestincrease of 2.0 per cent [Appendix Tables II.5(A)to (G)].
2. 51 The ratio of wage bill to total assetsincreased for all bank groups, excepting oldprivate sector banks and foreign banks. Theratio of wage bill to total assets of SCBs
State Bank group (18.6 per cent) to Rs.37,151crore, foreign banks (17.9 per cent) to Rs.11,039crore, nationalised banks (13.9 per cent) toRs.62,031 crore and old private sector banks(11.4 per cent) to Rs. 8,568 crore [AppendixTables II.5(A) to (G)].
2. 45 The ratio of expenditure to total assetsof SCBs declined marginally from 9.74 per centin 1999-2000 to 9.70 per cent in 2000-01. In thecase of PSBs, the ratio remained unchanged at9.63 per cent. For the State Bank group, the ratiofell from 9.32 per cent to 9.22 per cent, old privatesector banks from 10.52 per cent to 10.13 percent and for foreign banks from 11.31 per centto 10.84 per cent. For the nationalised banksand new private banks, the ratio increased from9.83 per cent to 9.90 per cent and from 8.21 percent to 8.71 per cent, respectively (Table II.13).
Interest Expended
2. 46 The interest expended by SCBs increasedby 13.2 per cent to Rs.78,152 crore in 2000-01.Among the bank groups, new private sectorbanks exhibited the highest increase of 43.1 percent and nationalised banks recorded the lowestincrease of 9.3 per cent [Appendix Tables II.5(A)to (G)]. The interest on deposits comprised asubstantial portion of interest expended,touching a high of 94.6 per cent for both PSBsand old private banks in 2000-01 and a low of63.4 per cent for foreign banks in 2000-01. Theforeign bank group had a relatively high shareof interest expended on borrowings from theReserve Bank at 29.6 per cent in 2000-01compared with 2.3 per cent for PSBs.
2. 47 The ratio of interest expended to totalassets of SCBs declined from 6.25 per cent in1999-2000 to 6.04 per cent in 2000-01. Thedecline in this ratio was seen in all the bankgroups during 1999-2000, except in the case ofnew private banks in whose case the ratioincreased from 5.64 per cent in 1999-2000 to6.04 per cent in 2000-01 (Table II.13).
Operating Expenses
2. 48 The operating expenses of SCBs showedan increase of 23.9 per cent to Rs.34,179 crorein 2000-01. Among the bank groups, the newprivate sector banks registered the highestpercentage increase (64.4 per cent), followed bythe State Bank group (29.6 per cent),
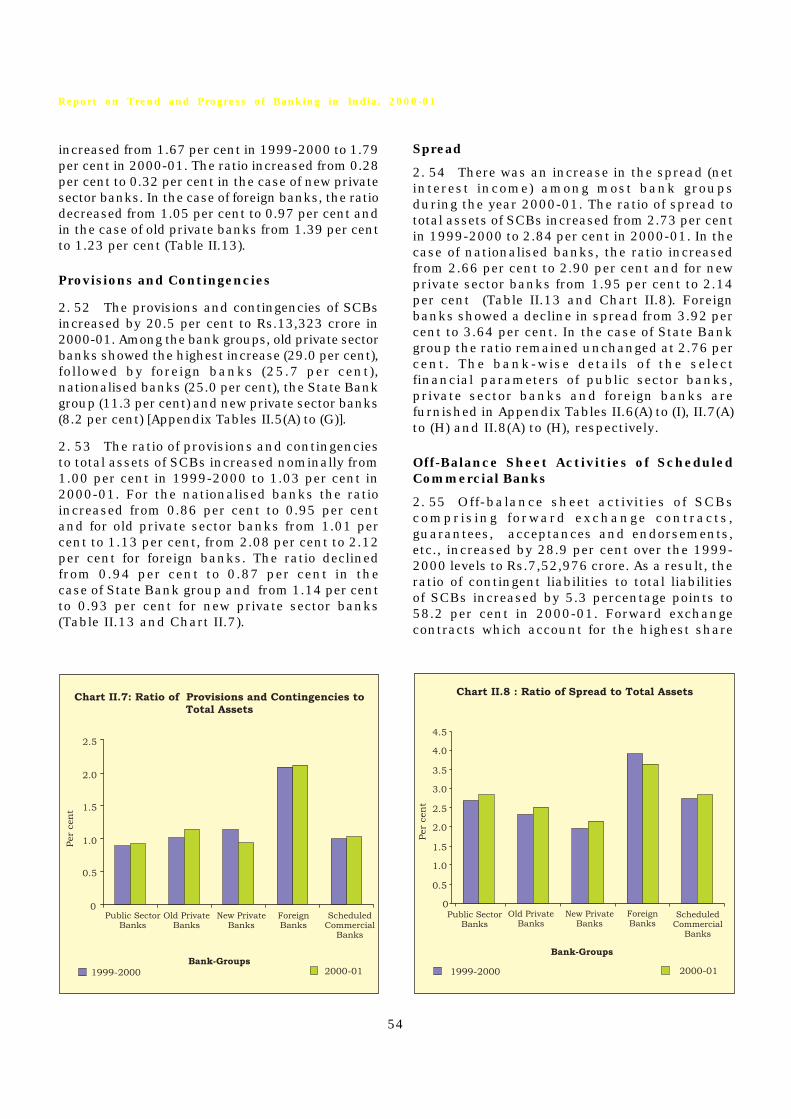
54
Report on Trend and Progress of Banking in India, 2000-01
increased from 1.67 per cent in 1999-2000 to 1.79per cent in 2000-01. The ratio increased from 0.28per cent to 0.32 per cent in the case of new privatesector banks. In the case of foreign banks, the ratiodecreased from 1.05 per cent to 0.97 per cent andin the case of old private banks from 1.39 per centto 1.23 per cent (Table II.13).
Provisions and Contingencies
2. 52 The provisions and contingencies of SCBsincreased by 20.5 per cent to Rs.13,323 crore in2000-01. Among the bank groups, old private sectorbanks showed the highest increase (29.0 per cent),followed by foreign banks (25.7 per cent),nationalised banks (25.0 per cent), the State Bankgroup (11.3 per cent) and new private sector banks(8.2 per cent) [Appendix Tables II.5(A) to (G)].
2. 53 The ratio of provisions and contingenciesto total assets of SCBs increased nominally from1.00 per cent in 1999-2000 to 1.03 per cent in2000-01. For the nationalised banks the ratioincreased from 0.86 per cent to 0.95 per centand for old private sector banks from 1.01 percent to 1.13 per cent, from 2.08 per cent to 2.12per cent for foreign banks. The ratio declinedfrom 0.94 per cent to 0.87 per cent in thecase of State Bank group and from 1.14 per centto 0.93 per cent for new private sector banks(Table II.13 and Chart II.7).
Spread
2. 54 There was an increase in the spread (netinterest income) among most bank groupsduring the year 2000-01. The ratio of spread tototal assets of SCBs increased from 2.73 per centin 1999-2000 to 2.84 per cent in 2000-01. In thecase of nationalised banks, the ratio increasedfrom 2.66 per cent to 2.90 per cent and for newprivate sector banks from 1.95 per cent to 2.14per cent (Table II.13 and Chart II.8). Foreignbanks showed a decline in spread from 3.92 percent to 3.64 per cent. In the case of State Bankgroup the ratio remained unchanged at 2.76 percent. The bank-wise details of the selectfinancial parameters of public sector banks,private sector banks and foreign banks arefurnished in Appendix Tables II.6(A) to (I), II.7(A)to (H) and II.8(A) to (H), respectively.
Off-Balance Sheet Activities of ScheduledCommercial Banks
2. 55 Off-balance sheet activities of SCBscomprising forward exchange contracts,guarantees, acceptances and endorsements,etc., increased by 28.9 per cent over the 1999-2000 levels to Rs.7,52,976 crore. As a result, theratio of contingent liabilities to total liabilitiesof SCBs increased by 5.3 percentage points to58.2 per cent in 2000-01. Forward exchangecontracts which account for the highest share

55
Developments in Commercial Banking
of contingent liabilities increased by 30.5 percent to Rs.5,53,597 crore in 2000-01. The shareof forward exchange contracts in total liabilitiesincreased by 4.4 percentage points over theprevious year to 42.8 per cent. Acceptances,endorsements, etc., increased by 37.6 per centto Rs.1,27,930 crore in 2000-01, taking itsshare in total liabilities up to 9.9 per cent (TableII.14). Among bank groups, nationalised banksrecorded the highest proportional increase incontingent liabilities (42.2 per cent), followed byforeign banks (31.2 per cent). Foreign bankscontinued to maintain the highest contingentliabilities both in absolute terms (Rs.3,71,807crore) and as a percentage of total liabilities(365.2 per cent) (Chart II.9).
4. Non-Performing Assets
2. 56 The gross non-performing assets (NPAs)of the SCBs increased to Rs.63,883 crore at end-March 2001, from Rs.60,408 crore a year ago.Net NPAs as at end-March 2001 amounted toRs.32,468 crore compared with Rs. 30,073 crore,as at end-March 2000 (Table II.15). Bank group-wise also, gross NPAs increased for PSBs, privatesector banks and foreign banks to Rs.54,773crore, Rs. 6,039 crore and Rs.3,071 crore,respectively, as at end-March 2001 over thelevels of Rs.53,033 crore, Rs.4,761 crore andRs.2,614 crore, respectively, at end-March 2000.
2. 57 The ratios of gross and net NPAs to totalassets as well as gross and net advances,however, declined for all bank groups other thanprivate sector banks. The ratio of gross NPAs tototal assets of SCBs declined from 5.5 per centin 1999-2000 to 4.9 per cent in 2000-01 whilethe ratio of net NPAs declined from 2.7 per centto 2.5 per cent. The ratio of gross NPAs to grossadvances declined from 12.7 per cent in 1999-2000 to 11.4 per cent in 2000-01. The ratio ofnet NPAs to net advances declined from 6.8 percent to 6.2 per cent over the year (Chart II.10).Bank-wise details of NPA ratios of PSBs andprivate sector banks are given in AppendixTables II.9(A) to (D). Sector-wise NPAs ofindividual public and private sector banks arepresented in Appendix Table II.10 (A) and (B).
Public Sector Banks
2. 58 The gross NPAs of PSBs as at end-March2001 at Rs.54,773 crore showed an increase of3.3 per cent over the year. The share of PSBs intotal NPAs of SCBs declined from 87.8 per centas at end-March 2000 to 85.7 per cent as at end-March 2001. The ratio of gross NPAs to totalassets of PSBs declined from 6.0 per cent to 5.3per cent during 2001 and that of net NPAs tototal assets from 2.9 per cent to 2.7 per cent.The ratio of gross NPAs to gross advancesdecreased from 14.0 per cent to 12.4 per cent
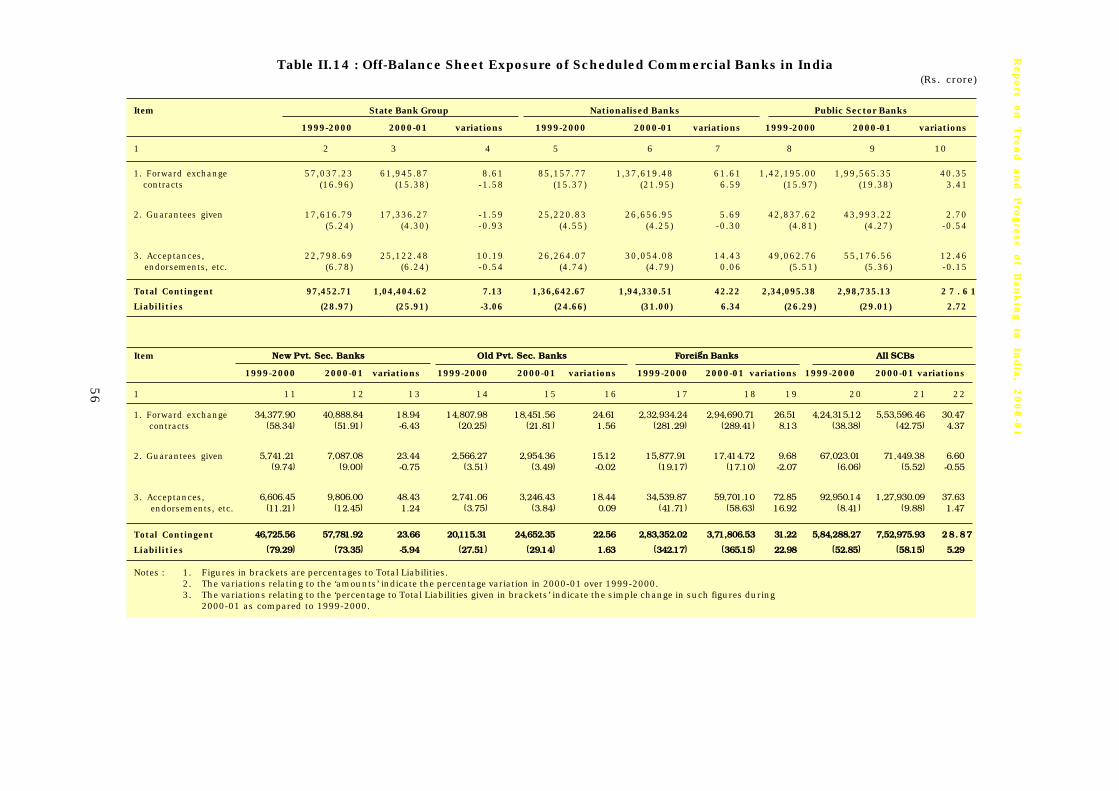
56
Report
on
T
ren
d
an
d
Pro
gre
ss of
Ban
kin
g
in
India
, 2
00
0-0
1
Table II.14 : Off-Balance Sheet Exposure of Scheduled Commercial Banks in India(Rs. crore)
Item State Bank Group Nationalised Banks Public Sector Banks
1999-2000 2000-01 variations 1999-2000 2000-01 variations 1999-2000 2000-01 variations
1 2 3 4 5 6 7 8 9 10
1. Forward exchange 57,037.23 61,945.87 8.61 85,157.77 1,37,619.48 61.61 1,42,195.00 1,99,565.35 40.35 contracts (16.96) (15.38) -1.58 (15.37) (21.95) 6.59 (15.97) (19.38) 3.41
2. Guarantees given 17,616.79 17,336.27 -1.59 25,220.83 26,656.95 5.69 42,837.62 43,993.22 2.70(5.24) (4.30) -0.93 (4.55) (4.25) -0.30 (4.81) (4.27) -0.54
3. Acceptances, 22,798.69 25,122.48 10.19 26,264.07 30,054.08 14.43 49,062.76 55,176.56 12.46 endorsements, etc. (6.78) (6.24) -0.54 (4.74) (4.79) 0.06 (5.51) (5.36) -0.15
Total Contingent 97,452.71 1,04,404.62 7.13 1,36,642.67 1,94,330.51 42.22 2,34,095.38 2,98,735.13 2 7 . 6 1
Liabilities (28.97) (25.91) -3.06 (24.66) (31.00) 6.34 (26.29) (29.01) 2.72
Item New Pvt. Sec. Banks Old Pvt. Sec. Banks Foreign Banks All SCBs
1999-2000 2000-01 variations 1999-2000 2000-01 variations 1999-2000 2000-01 variations 1999-2000 2000-01 variations
1 11 12 13 14 15 16 17 18 19 20 21 22
1. Forward exchange 34,377.90 40,888.84 18.94 14,807.98 18,451.56 24.61 2,32,934.24 2,94,690.71 26.51 4,24,315.12 5,53,596.46 30.47 contracts (58.34) (51.91) -6.43 (20.25) (21.81) 1.56 (281.29) (289.41) 8.13 (38.38) (42.75) 4.37
2. Guarantees given 5,741.21 7,087.08 23.44 2,566.27 2,954.36 15.12 15,877.91 17,414.72 9.68 67,023.01 71,449.38 6.60(9.74) (9.00) -0.75 (3.51) (3.49) -0.02 (19.17) (17.10) -2.07 (6.06) (5.52) -0.55
3. Acceptances, 6,606.45 9,806.00 48.43 2,741.06 3,246.43 18.44 34,539.87 59,701.10 72.85 92,950.14 1,27,930.09 37.63 endorsements, etc. (11.21) (12.45) 1.24 (3.75) (3.84) 0.09 (41.71) (58.63) 16.92 (8.41) (9.88) 1.47
Total Contingent 46,725.56 57,781.92 23.66 20,115.31 24,652.35 22.56 2,83,352.02 3,71,806.53 31.22 5,84,288.27 7,52,975.93 28.87
Liabilities (79.29) (73.35) -5.94 (27.51) (29.14) 1.63 (342.17) (365.15) 22.98 (52.85) (58.15) 5.29
Notes : 1. Figures in brackets are percentages to Total Liabilities.2. The variations relating to the ‘amounts’ indicate the percentage variation in 2000-01 over 1999-2000.3. The variations relating to the ‘percentage to Total Liabilities given in brackets’ indicate the simple change in such figures during
2000-01 as compared to 1999-2000.
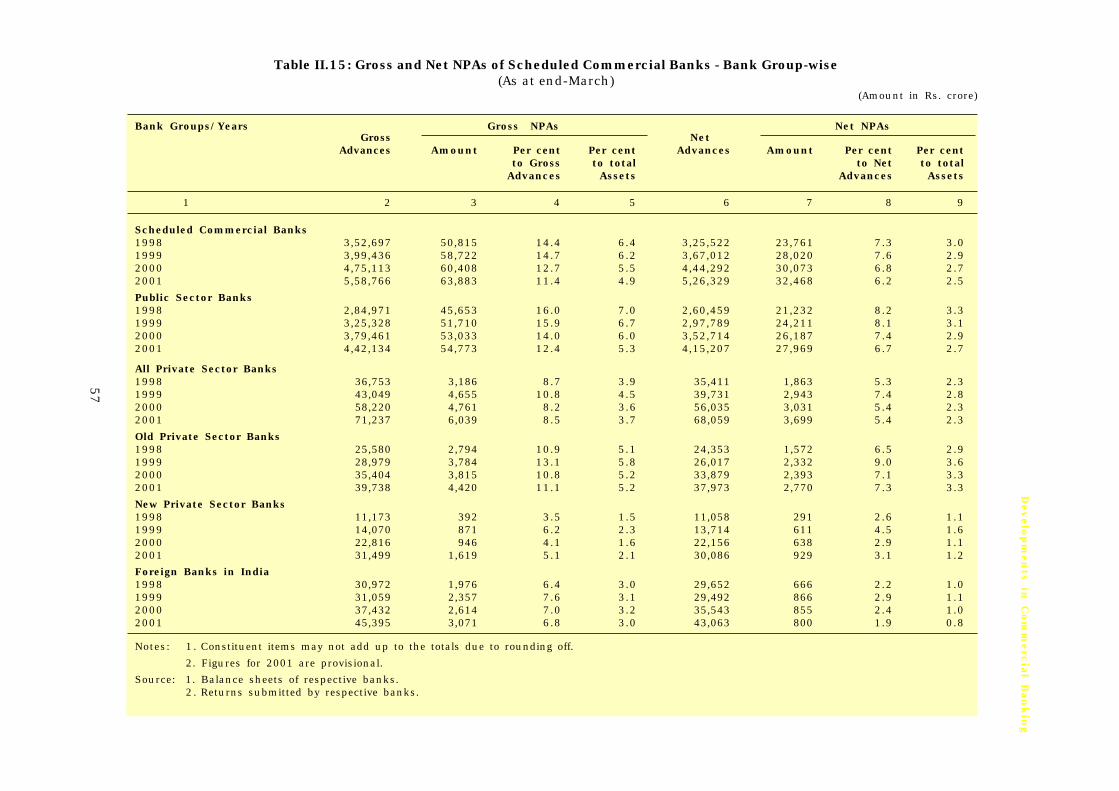
57
Develo
pm
en
ts in C
om
merc
ial B
an
kin
g
Table II.15: Gross and Net NPAs of Scheduled Commercial Banks - Bank Group-wise(As at end-March)
(Amount in Rs. crore)
Bank Groups/Years
Gross
Gross NPAsNet
Net NPAs
Advances Amount Per cent Per cent Advances Amount Per cent Per centto Gross to total to Net to total
Advances Assets Advances Assets
1 2 3 4 5 6 7 8 9
Scheduled Commercial Banks1998 3,52,697 50,815 14.4 6.4 3,25,522 23,761 7.3 3.01999 3,99,436 58,722 14.7 6.2 3,67,012 28,020 7.6 2.92000 4,75,113 60,408 12.7 5.5 4,44,292 30,073 6.8 2.72001 5,58,766 63,883 11.4 4.9 5,26,329 32,468 6.2 2.5
Public Sector Banks1998 2,84,971 45,653 16.0 7.0 2,60,459 21,232 8.2 3.31999 3,25,328 51,710 15.9 6.7 2,97,789 24,211 8.1 3.12000 3,79,461 53,033 14.0 6.0 3,52,714 26,187 7.4 2.92001 4,42,134 54,773 12.4 5.3 4,15,207 27,969 6.7 2.7
All Private Sector Banks1998 36,753 3,186 8.7 3.9 35,411 1,863 5.3 2.31999 43,049 4,655 10.8 4.5 39,731 2,943 7.4 2.82000 58,220 4,761 8.2 3.6 56,035 3,031 5.4 2.32001 71,237 6,039 8.5 3.7 68,059 3,699 5.4 2.3
Old Private Sector Banks1998 25,580 2,794 10.9 5.1 24,353 1,572 6.5 2.91999 28,979 3,784 13.1 5.8 26,017 2,332 9.0 3.62000 35,404 3,815 10.8 5.2 33,879 2,393 7.1 3.32001 39,738 4,420 11.1 5.2 37,973 2,770 7.3 3.3
New Private Sector Banks1998 11,173 392 3.5 1.5 11,058 291 2.6 1.11999 14,070 871 6.2 2.3 13,714 611 4.5 1.62000 22,816 946 4.1 1.6 22,156 638 2.9 1.12001 31,499 1,619 5.1 2.1 30,086 929 3.1 1.2
Foreign Banks in India1998 30,972 1,976 6.4 3.0 29,652 666 2.2 1.01999 31,059 2,357 7.6 3.1 29,492 866 2.9 1.12000 37,432 2,614 7.0 3.2 35,543 855 2.4 1.02001 45,395 3,071 6.8 3.0 43,063 800 1.9 0.8
Notes: 1. Constituent items may not add up to the totals due to rounding off.
2. Figures for 2001 are provisional.
Source: 1. Balance sheets of respective banks.2. Returns submitted by respective banks.
58
Report on Trend and Progress of Banking in India, 2000-01
and that of net NPAs to net advances from 7.4per cent to 6.7 per cent over the year. The declinein the NPAs ratios of PSBs was facilitated by therise in assets in standard category from 86.0 percent in 1999-2000 to 87.6 per cent in 2000-01(Table II.16). As at end-March 2001, 22 out ofthe 27 PSBs had net NPAs up to 10 per cent ofnet advances, while five banks had net NPAs inexcess of 10 per cent (Table II.17).
Private Sector Banks
2. 59 As at end-March 2001, the gross NPAs of allprivate sector banks stood at Rs.6,039 crore withan increase of 26.8 per cent during the year. Theprivate sector bank group witnessed an increasein the ratios of gross NPAs to total assets and grossNPAs to gross advances. The ratio of gross NPAs togross advances increased to 8.5 per cent and thatto total assets increased to 3.7 per cent. The ratioof net NPAs to net advances remained unchangedat 5.4 per cent as also the ratio of net NPAs to totalassets (2.3 per cent).
Old Private Sector Banks
2. 60 The gross NPAs of old private banksincreased by 15.9 per cent to Rs.4,420 crore asat end-March 2001 from Rs.3,815 crore as atend-March 2000, while net NPAs increased by15.8 per cent to Rs.2,770 crore from Rs.2,393crore during the same period. The ratio of grossNPAs to total assets remained unchanged at 5.2per cent for old private sector banks as also theratio of net NPAs to total assets at 3.3 per cent.The ratio of gross NPAs to gross advancesincreased from 10.8 per cent to 11.1 per centand that of net NPAs to net advances increasedfrom 7.1 per cent to 7.3 per cent. Out of the 23old private banks functioning as at end-March2001, 16 banks had net NPAs up to 10 per centof net advances, 4 banks had net NPAs between10 and 20 per cent of net advances and 3 bankshad net NPAs in excess of 20 per cent (Table II.17).
New Private Sector Banks
2. 61 Gross NPAs of new private sector banksincreased by 71.1 per cent to Rs.1,619 crore asat end-March 2001 from Rs.946 crore as at end-March 2000, while net NPAs increased by 45.6per cent to Rs.929 crore from Rs. 638 crore. Theratio of gross NPAs to total assets increased from1.6 per cent to 2.1 per cent. The ratio of gross
NPAs to gross advances increased from 4.1 percent to 5.1 per cent and the ratio of net NPAs tonet advances from 2.9 per cent to 3.1 per cent.All eight new private sector banks had net NPAswithin 10 per cent of net advances as at end-March 2001 (Table II.17).
Foreign Banks
2. 62 The gross NPAs of foreign banksincreased by 17.5 per cent to Rs.3,071 croreduring 2000-01, while net NPAs declined by 6.4per cent to Rs.800 crore. The ratios of bothgross and net NPAs to total assets declinedduring the year under review. The ratio of grossNPAs to gross advances declined from 7.0 percent to 6.8 per cent, and the ratio of net NPAsto net advances from 2.4 per cent to 1.9 percent. The proportion of standard assetsincreased to 93.1 per cent from 93.0 per centa year ago. Out of 42 foreign banks, 31 had netNPAs up to 10 per cent, 6 between 10 per centand 20 per cent and 5 had net NPAs in excessof 20 per cent (Table.II 17). Bank-wise detailsof NPAs of foreign banks are given in AppendixTables II.9 (E) and (F).
Incremental Non-Performing Assets
2. 63 The incremental gross NPAs, aspercentage of incremental gross advances andincremental total assets, increased for allbank groups during 2000-01, except for StateBank group. In absolute terms, theincremental gross NPAs was higher at Rs.3,475 crore in 2000-01 as compared toRs.1,686 crore in 1999-2000, whi leincremental net NPAs increased from Rs.2,053crore in 1999-2000 to Rs.2,394 crore in 2000-01 (Table II.18). As percentage of incrementaladvances, the incremental gross NPA ratio ofSCBs rose from 2.2 per cent in 1999-2000 to4.2 per cent in 2000-01, with the same forPSBs increasing from 2.4 per cent to 2.8 percent. In net terms, the incremental net NPAratio increased from 2.7 per cent in 1999-2000to 2.9 per cent in 2000-01 (Table II.19). As ratioto incremental assets, while the incrementalgross NPA for SCBs increased from 1.1 per centto 1.8 per cent in 2000-01; over the sameperiod, the incremental net NPA ratio hasremained unchanged at 1.3 per cent.

59
Develo
pm
en
ts in C
om
merc
ial B
an
kin
g
Standard Assets Sub-standard Assets Doubtful Assets Loss Assets Total NPAs TotalBank Groups/Years Advances
Amount per cent Amount per cent Amount per cent Amount per cent Amount per cent Amount
1 2 3 4 5 6 7 8 9 10 11 12
Scheduled Commercial Banks1998 3,01,881 85.6 17,428 4.9 27,146 7.7 6,242 1.8 50,815 14.4 3,52,6961999 3,40,714 85.3 19,928 5.0 31,350 7.8 7,444 1.9 58,722 14.7 3,99,4362000 4,14,917 87.2 19,594 4.1 33,688 7.1 7,558 1.6 60,840 12.8 4,75,7572001 4,94,716 88.6 18,206 3.3 37,756 6.8 8,001 1.4 63,963 11.4 5,58,679Public Sector Banks1998 2,39,318 84.0 14,463 5.1 25,819 9.1 5,371 1.9 45,653 16.0 2,84,9711999 2,73,618 84.1 16,033 4.9 29,252 9.0 6,425 2.0 51,710 15.9 3,25,3282000 3,26,783 86.0 16,361 4.3 30,535 8.0 6,398 1.7 53,294 14.0 3,80,0772001 3,87,360 87.6 14,745 3.3 33,485 7.6 6,544 1.5 54,774 12.4 4,42,134All Private Sector Banks1998 33,567 91.3 1,766 4.8 1,077 2.9 343 0.9 3,186 8.7 36,7531999 38,394 89.2 2,657 6.2 1,591 3.7 407 0.9 4,655 10.8 43,0492000 53,317 91.5 2,137 3.7 2,355 4.0 439 0.8 4,931 8.5 58,2482001 65,071 91.5 2,585 3.6 3,069 4.3 424 0.6 6,078 8.5 71,149Old Private Sector Banks1998 22,786 89.1 1,402 5.5 1,068 4.2 324 1.3 2,794 10.9 25,5801999 25,195 86.9 1,920 6.6 1,463 5.0 401 1.4 3,784 13.1 28,9792000 31,447 88.8 1,577 4.5 2,061 5.8 347 1.0 3,985 11.2 35,4322001 35,166 88.7 1,622 4.1 2,449 6.2 413 1.0 4,484 11.3 39,650New Private Sector Banks1998 10,781 96.5 365 3.3 9 0.1 19 0.2 392 3.5 11,1731999 13,199 93.8 737 5.2 128 0.9 6 0.0 871 6.2 14,0702000 21,870 95.9 560 2.5 294 1.3 92 0.4 946 4.1 22,8162001 29,905 94.9 963 3.1 620 2.0 11 0.0 1,594 5.1 31,499Foreign Banks in India1998 28,996 93.6 1,198 3.9 250 0.8 528 1.7 1,976 6.4 30,9721999 28,702 92.4 1,238 4.0 507 1.6 612 2.0 2,357 7.6 31,0592000 34,817 93.0 1,096 2.9 798 2.1 721 1.9 2,615 7.0 37,4322001 42,285 93.1 876 1.9 1,202 2.6 1,033 2.3 3,111 6.9 45,396
Notes: 1. Figures are provisional.2. NPAs consist of assets including (i) Sub-standard, (ii) Doubtful, and (iii) Loss Assets. An asset becomes (i) Sub-standard when it is
classified as NPA for a period not exceeding two years, (ii) Doubtful when it remains NPA for a period exceeding two years, and (iii)Loss, when loss is identified either by a bank or an internal or external auditors or under RBI inspection, but not written off.
3. Constituent items may not add up to the totals due to rounding off.4. The figures furnished in this table may not tally with the data given in table II.15 due to different sources of data collection
Source : 1. Returns submitted by respective banks.2. Balance sheets of respective banks
Table II.16 : Classification of Loan Assets of Scheduled Commercial Banks(As at end-March)
(Amount in Rs. crore)

60
Report on Trend and Progress of Banking in India, 2000-01
(No. of banks)
Net NPAs/Net Advances End-March
1997 1998 1999 2000 2001
Public Sector Banks 27 27 27 27 27
1. Upto 10 per cent 17 17 18 22 22
2. Above 10 and up to 20 per cent 9 9 8 5 5
3. Above 20 per cent 1 1 1 — —
Old Indian Private Sector Banks 25 25 25 24 23
1. Upto 10 per cent 22 21 17 18 16
2. Above 10 and up to 20 per cent 3 4 5 5 4
3. Above 20 per cent — — 3 1 3
New Indian Private Sector Banks 9 9 9 8 8
1. Upto 10 per cent 9 9 9 8 8
2. Above 10 and up to 20 per cent — — — — —
3. Above 20 per cent — — — — —
Foreign Banks in India @ 39 42 41 42 42
1. Upto 10 per cent 36 34 27 31 31
2. Above 10 and up to 20 per cent 1 6 11 7 6
3. Above 20 per cent 2 2 3 4 5
@ No. of banks having nil NPAs for 1997, 1998, 1999, 2000 and 2001 was 16, 14, 9, 8 and 6, respectively.
Table II.17: Distribution of Scheduled Commercial Banks by Ratio of Net NPAs to Net Advances
5. Capital to Risk-Weighted Assets Ratio(CRAR)
2. 64 As at end-March 2001, 23 out of the 27PSBs (consisting of eight banks in the StateBank group and 15 nationalised banks) hadcapital in excess of 10 per cent of risk-weightedassets. Among the remaining four nationalisedbanks, two had CRAR between 9 per cent and 10per cent, one had CRAR between 4 per cent and
9 per cent and one had negative CRAR (TableII. 20).
2. 65 Of the 23 old private banks, 16 banks hadCRAR in excess of 10 per cent, four had CRARbetween 9 and 10 per cent, one had CRARbetween 4 and 9 per cent while two had negativeCRAR. Thus, the number of old private bankshaving CRAR in excess of 10 per cent decreasedfrom 18 in the previous year to 16 in 2000-01.
(Rs. crore)
Bank Group Incremental Gross NPAs Incremental Net NPAs
1999-2000 2000-01 1999-2000 2000-01
1 2 3 4 5
Scheduled Commercial Banks 1,686.0 3,475.3 2,053.0 2,393.9
Public Sector Banks 1,322.6 1,739.8 1,975.9 1,781.2
Nationalised Banks 190.3 920.4 1,640.7 1,088.5
State Bank Group 1,132.2 819.4 335.2 692.7
Old Private Sector Banks 31.0 604.8 61.0 377.0
New Private Sector Banks 75.0 673.9 27.0 290.7
Foreign Banks 257.0 456.7 -11.0 -55.0
Table II.18: Bank Group-wise Incremental Gross and Net NPAs

61
Developments in Commercial Banking
Table II.19: Bank Group-wise Incremental Ratio of Gross and Net NPAs(Per cent)
Incremental Ratio of Gross NPAs to Incremental Ratio of Net NPAs to
Bank Group Gross Advances Total Assets Net Advances Total Assets
1999- 2000- 1999- 2000- 1999- 2000- 1999- 2000-2000 01 2000 01 2000 01 2000 01
1 2 3 4 5 6 7 8 9
Scheduled Commercial Banks 2.2 4.2 1.1 1.8 2.7 2.9 1.3 1.3
Public Sector Banks 2.4 2.8 1.1 1.3 3.6 2.9 1.6 1.3
Nationalised Banks 0.6 2.2 0.3 1.3 4.8 2.7 2.3 1.5
State Bank Group 5.3 3.8 2.2 1.2 1.6 3.2 0.7 1.0
Old Private Sector Banks 0.5 14.0 0.4 5.3 0.8 9.2 0.8 3.3
New Private Sector Banks 0.9 7.8 0.4 3.4 0.3 3.7 0.1 1.5
Foreign Banks in India 4.0 5.7 4.1 2.4 -0.2 -0.7 -0.2 -0.3
The number of new private sector banks havingCRAR in excess of 10 per cent continued toremain at seven in 2000-01 with one bankhaving CRAR between 9 per cent and 10 percent. The number of foreign banks having CRARabove 10 per cent increased to 38 from 37 inthe previous year (Table II.20). Bank-wisedetails of CRAR of individual bank groups aregiven in Appendix Tables II.11 (A) to (C).
2. 66 The measurement of operational risk hasemerged as an important aspect in thecalculation of capital as per the new capitaladequacy framework of the Basel Committee onBanking Supervision (BCBS). In the context of
increasing globalisation, enhanced use oftechnology, product innovations and growingcomplexity in operations, the Reserve Bankagrees, as a general principle, with the BaselCommittee's proposal to assign explicit capitalcharge for operational risk (Box II.2).
6. Equity Capital and Subordinated Debt
2. 67 Three banks viz., Andhra Bank, IndianOverseas Bank and Vijaya Bank raised capitalamounting to Rs.361.20 crore, through initialpublic offerings (IPO) in the market during the year2000-01. The Ganesh Bank of Kurundwad Ltd., was
Table II.20: Distribution of Scheduled Commercial Banks by CRAR
(No. of banks)
Capital Risk-weighted Assets Ratio (CRAR)
Bank-group 1999-2000 2000-01
Below Between Between Above Below Between Between Above4 4-9 9-10 10 4 4-9 9-10 10
per cent per cent per cent per cent per cent per cent per cent per cent
1 2 3 4 5 6 7 8 9
State Bank Group — — — 8 — — — 8
Nationalised Banks 1 — 4 14 1* 1 2 15
Old Private Sector Banks 2 2 2 18 2* 1 4 16
New Private Sector Banks — — 1 7 — — 1 7
Foreign Banks — — 5 37 — — 4 38
Total 3 2 12 84 3 2 11 84
* Negative

62
Report on Trend and Progress of Banking in India, 2000-01
granted permission to issue shares on rights basisfor Rs. 0.41 crore. The Vysya Bank Ltd., was grantedpermission to issue preferential shares to itsforeign collaborators amounting to Rs.42.49 crore.
2. 68 During 2000-01, eleven public sector banksraised subordinated debt to augment their capital.These are Bank of India (Rs.200 crore), Bank ofMaharashtra (Rs. 50 crore), Canara Bank (Rs. 300crore), Central Bank of India (Rs. 250 crore), Indian
Overseas Bank (Rs. 125 crore), Punjab and SindBank (Rs. 60 crore), Punjab National Bank (Rs. 240crore), Union Bank of India (Rs. 100 crore), UCOBank (Rs. 150 crore), United Bank of India (Rs.140 crore) and Bank of Baroda (Rs. 600 crore).
Return of Capital
2. 69 During 2000-01, Andhra Bank returned Rs.47.95 crore capital to the Government of India.
Operational risk, as defined by the Basel Committee is“the risk of direct or indirect loss resulting from inadequateor failed internal processes, people and systems or fromexternal events”. The definition excludes strategic andreputational risk, but includes legal risk. Operational riskscan broadly be classified in the following categories:
Information Technology Risk – System failure, internetvirus, inaccurate data, poor quality of communication, etc.
Human Resources Risk – Recruitment procedures,incompetent staff, holiday policy, etc.
Loss to Assets Risk – Risk that damages assets andinterrupts business. The damage could be due to fire,flood or earthquake.
Relationship Risk – Changes in regulatory requirements,claims, customer satisfaction, lawsuits, etc.
There are three approaches in the assessment of capitalrequirements for operational risk viz. Basic IndicatorApproach, Standardised Approach and Internal MeasurementApproach.
Under Basic Indicator Approach, operational risk capital isallocated using a single indicator as a proxy for aninstitution’s overall operational risk exposure. Gross incomeis proposed as the indicator, with each bank holding capitalfor operational risk equal to a fixed percentage, multipliedby its individual amount of gross income.
Under the Standardised Approach, bank’s activities aredivided into a number of standardised business units andbusiness lines, as given by the Bank for InternationalSettlements (BIS). Within each business line, regulatorsspecify a broad indicator that is intended to reflect thesize or volume of a bank’s activity in the area. Theindicator serves as a rough proxy for the amount ofoperational risk within each of these business lines.Within each business line, the required capital iscalculated by multiplying an indicator, such as grossincome or asset size of the business line, by a fixedpercentage. The total capital charge is the simple sum ofthe required capital across each business line.
In the case of Internal Measurement Approach, bank’sinternal loss data are used and the method to calculatethe required capital is uniformly set by supervisors. Banksactivities are categorised into number of business linesand a broad set of operational loss types is defined andapplied across business lines. Within each business line/loss type combination, the supervisor specifies anExposure Indicator (EI) - a proxy for the size of a particularbusiness line’s operational risk exposure. In addition toEI, for each business line/loss type combination, banks
Box II.2: Measurement of Operational Risk
measure, based on their internal loss data, a parameterrepresenting the probability of the occurrence of loss event(PE) as well as a parameter representing the loss giventhat event (LGE). Expected Loss (EL) is arrived at by themultiplication of EI, PE and LGE. Given the scaling factorr(i,j) (defined as the maximum amount of loss per holdingperiod within a certain confidence interval) for eachbusiness line (i) and risk type (j) this translates theexpected loss into capital charge as =Si Sj [g(i,j) * SEI (i,j)*PE (i,j) *LGE (i,j)].
Quantification of operational risk poses a majorcomputational challenge to policy makers. Modelingoperational risk in financial institutions is still in itsinfancy. But the process is likely to gather momentum inthe future. As it stands at present, several methods havebeen employed including appropriate statisticaldistributions to estimate operational VaR. However, unlikemarket risk, the operational VaR is not easily obtainable.The difficulty lies in identifying the right statisticaldistribution that determine the severity and the frequencyof a particular category of operational loss. In order toapproximate the severity of operational loss, methods,like Extreme Value Theory (EVT) and Monte Carlosimulation can be fruitfully employed to calculate theoperational VaR.
On the measurement of operational risk the Reserve Bankis of the view that “until a scientific method to measurethe operational risk across countries is evolved, the BaselCommittee should consider prescribing a lower capitalcharge of 15 per cent of the gross income or 10 per centof the current capital requirement to align capital to theunderlying risk profile. National supervisors may,however, be given discretion to prescribe higher capitalcharge towards operational risk in case of banks, whichmay be considered as ‘outliers’.
References:
Basel Committee on Banking Supervision, (1998),‘Operational Risk Management’, Bank for InternationalSettlements, Basel, September.
Basel Committee on Banking Supervision, (1999), ‘A NewCapital Adequacy Framework’, Bank for InternationalSettlements, Basel, June.
Basel Committee on Banking Supervision, (2001),‘Operational Risk: Consultative Document’, Bank forInternational Settlements, Basel, January.
Cruz M, Coleman R. & Salkin G. (1998): ‘Modeling andMeasuring Operational Risk’, The Journal of Risk, Vol. 1,No. 1.

63
Developments in Commercial Banking
Augmentation of Capital Funds - PrivateSector Banks
2. 70 Pursuant to the guidelines issued inJanuary 1993, the minimum capitalrequirement for setting up banks in the privatesector was prescribed at Rs. 100 crore. Uponreview of the position of the capital funds of oldprivate sector banks in 1998-99, it was indicatedthat old private sector banks having networth ofless than Rs. 50 crore were to attain the level ofRs. 50 crore by March 31, 2001. Accordingly,three old private sector banks having networthof less than Rs.50 crore, and 7 banks whosecapital funds ranged above Rs. 50 crore but lessthan Rs.100 crore were advised to prepare actionplans for augmenting capital funds to the levelof Rs.100 crore.
2. 71 The guidelines for entry of new banks inthe private sector were revised in January 2001,so as to make the issue of licenses selectiveand restrict to the applicants who can meet theprudential requirements and provide efficientcustomer service. The guidelines are given inChapter I.
7. Indian Banks' Branches Abroad
2. 72 Nine Indian banks (8 in public sector andone in the private sector) are operating branchesabroad. During the year 2000-01 the number ofIndian branches abroad stood at 94. The numberof representative offices of Indian banks abroadstood at 14. The number of wholly ownedsubsidiaries of Indian banks abroad and jointventures abroad stood at 15 and 5, respectively.
8. Foreign Banks' Branches in India
2. 73 Foreign banks are allowed to operate inIndia through branches. There are 41 foreignbanks from 21 countries operating in India with194 branches as on June 30, 2001. While 5banks have 10 or more branches, 17 are onebranch banks. Twelve foreign banks have 367ATMs located both at branches and off-sites. Thebranches of foreign banks are spread over 25centres in 16 States/Union Territories.Consequent upon acquisition of the issuedshare capital of ANZ Grindlays Bank Ltd. fromAustralia and New Zealand Banking Group,Australia by Standard Chartered Bank plc,London, the name of ANZ Grindlays Bank Ltd.,operating with 41 branches in India, has been
changed to Standard Chartered Grindlays Bank.Further, as a result of a global merger betweentwo Japanese banks viz., Sakura Bank andSumitomo Bank Ltd., Indian operations ofSakura Bank have been merged with SumitomoBank and the latter is operating in India as anew entity viz., Sumitomo Mitsui BankingCorporation since April 2001. As on June 30,2001, 24 banks from 12 countries hadrepresentative offices in India of which 22 werein Mumbai and one each in New Delhi andChennai.
9. Regional Rural Banks
Mobilisation and Deployment of Funds
2. 74 The outstanding deposits mobilised byRegional Rural Banks (RRBs) registered anincrease of 23.2 per cent to Rs.37,027 crore in2000-01 with demand deposits rising by 27.3per cent. The credit extended by RRBsincreased by 23.0 per cent to Rs.15,579 crorein 2000-01 and investments by 25.6 per cent toRs.7,546 crore. The credit-deposit ratio was at42.1 per cent in 2000-01, while investment-deposit ratio increased marginally to 20.4 percent (Table II.21).
Purpose-wise Disbursement of Loans andAdvances
2. 75 The loans and advances disbursed byRRBs for agriculture accounted for 47.5 per centof total advances as on March 31, 2000. The termloans for agriculture and allied activities atRs.3,339 crore accounted for 53.6 per cent ofagricultural advances while the share of croploans constituted 46.0 per cent. Non-agricultural advances viz., advances to ruralartisans, village and cottage industries, retailtrade and self-employed, etc., and othersaccounted for 52.5 per cent of total loans andadvances as at end-March 2000 (Table II.22).
Financial Performance of RRBs
2. 76 Of the 196 RRBs, the audited results for2000-01 are available for 192 banks. Theperformance of RRBs during 2000-01 isindicative of an improvement in profitability.The operating profits increased by 33.2 per centto Rs.715 crore and the net profits by 37.0 percent to Rs.589 crore (Table II.23). The ratio of

64
Report on Trend and Progress of Banking in India, 2000-01
Table II.21: Important Banking Indicators of RRBs
(Amount in Rs.crore)
Item March 26, March 24, March 24, Variations
1999 2000 2001 1999-2000 2000-2001
1 2 3 4 5 6(3-2) (4-3)
1 Liabilities to the Banking System 151 183 177 32 -6(21.2) (-3.3)
2 Liabilities to Others 26,319 31,306 38,696 4,987 7,390(18.9) (23.6)
2.1 Aggregate Deposits (a+b) 25,428 30,051 37,027 4,623 6,976(18.2) (23.2)
(a) Demand Deposits 4,688 5,105 6,499 417 1,394(8.9) (27.3)
(b) Time Deposits 20,740 24,946 30,528 4,206 5,582(20.3) (22.4)
2.2 Borrowings 8 52 24 44 -28(550.0) (-53.8)
2.3 Other Demand & Time Liabilities* 883 1,203 1,645 320 442
(36.2) (36.7)3 Assets with the Banking System 11,319 13,454 16,973 2,135 3,519
(18.9) (26.2)4 Bank Credit 11,016 12,663 15,579 1,647 2,916
(15.0) (23.0)5 Investments (a+b) 5,007 6,009 7,546 1,002 1,537
(20.0) (25.6)a.Government Securities 1,191 1,223 1,588 32 365
(2.7) (29.8)b. Other Approved Securities 3,816 4,786 5,958 970 1,172
(25.4) (24.5)6 Cash Balances 300 343 441 43 98
(14.3) (28.6)
Memorandum Items :a Cash Balance-Deposit Ratio 1.18 1.14 1.19b Credit-Deposit Ratio 43.32 42.14 42.07c Investment/Deposit Ratio 19.69 20.00 20.38d Investment+Credit/Deposit Ratio 63.01 62.13 62.45
* Includes Participation Certificates issued to others.
Note : Figures in brackets are percentage variations.
operating profits to total assets increased from1.27 per cent to 1.47 per cent and that for netprofits from 1.01 per cent to 1.21 per cent. Theincrease in profitability could be attributed torise in interest income coupled with loweroperating expenses.
Non-performing Assets
2. 77 The NPAs of RRBs declined considerablyduring 2000-01. The share of NPAs in totalassets of RRBs declined from 23.2 per cent as atend-March 2000 to 19.2 per cent as at end-
March 2001, largely due to an increase in theshare of assets in standard category from 76.8per cent in end-March 2000 to 80.8 per cent asat end-March 2001 (Table II.24).
Recapitalisation
2. 78 A total sum of Rs.2,188 crore has beeninfused as additional capital support to 187 out of196 RRBs through six phases of recapitalisationof the loss-making RRBs till January 2000. Out of187 RRBs, 158 RRBs have been fully recapitalisedand 29 RRBs partially. Further, while 7 RRBs are

65
Developments in Commercial Banking
(Rs. crore)
Purpose As at end-March
1999 2000*
1 2 3
1. Short term (crop loans) 2,240.00 2,864.74
2. Term loan for agriculture and
allied activities 3,159.00 3,339.14
3. Indirect Advances 61.00 23.00
I Total Agriculture (1 to 3) 5,460.00 6,226.88
(48.1) (47.5)
4. Rural artisans, village and
cottage industries 722.00 772.64
5. Other Industries 387.00 663.86
6. Retail trade and Self-employed, etc. 2,495.00 2,072.85
7. Other purposes 2,292.00 3,372.61
II Total Non-Agriculture (4 to 7) 5,896.00 6,881.96
(51.9) (52.5)
Total (I+II) 11,356.00 13,108.84(100.0) (100.0)
* Purpose-wise break-up in respect of 194 RRBs.
Note : Figures in brackets are percentages to the total.
Source: NABARD.
Table II.22: Purpose-wise Disbursements of Loans and Advances of RRBs
yet to be taken up for recapitalisation, 2 profit-making RRBs do not need any capital support.During the year 2000-01, recapitalisation exercisewas not taken up by the Government of India andno budgetary allocation has been made for theyear 2001-02.
10. Local Area Banks
2. 79 With a view to providing an institutionalmechanism for promoting rural and semi-urbansavings as well as provision of credit for viableeconomic activities in local areas, Local AreaBanks (LAB) were established in the private sector.The related guidelines were announced by theReserve Bank in 1996. The Reserve Bank hasgiven 'in-principle ' approval for setting up of sevenLABs in the private sector. Of these, licenses wereissued to five LABs, viz., (1) Coastal Local AreaBank Limited, Vijayawada in the districts of WestGodavari, Krishna and Guntur in Andhra Pradesh(2) Capital Local Area Bank Limited, Phagwara inthe districts of Kapurthala, Jalandhar andHoshiarpur in Punjab, (3) Krishna BhimaSamurdhi Local Area Bank Ltd., Mehboobnagar in
the districts of Raichur and Gulbarga in Karnatakaand Mehboobnagar district in Andhra Pradesh, (4)Vinayak Local Area Bank Ltd., Sikar in the districtsof Jhunjhunu, Sikar and Churu in Rajasthan and(5) South Gujarat Local Area Bank Ltd., Navsari inthe districts of Surat, Navsari and Bharuch inGujarat. These LABs have since commencedbanking business.
11. Regional Spread of Banking
2. 80 Banks were given freedom to open the newbranches and close unviable branches subject tothe stipulations laid down by the Reserve Bank.The total number of branches of commercial banksincreased to 65,800 as at end-June 2001 from65,556 as at end-June 2000. As at end-June 2001,rural branches accounted for the highest share(49.6 per cent) of branches of commercial banksin India, followed by semi-urban branches (22.1 percent), urban branches (15.5 per cent) andmetropolitan branches (12.8 per cent) (AppendixTable II.12). State-wise and region-wisedistribution of branches of commercial banks aregiven in Appendix Table II.13.

66
Report on Trend and Progress of Banking in India, 2000-01
Table II.23: Financial Performance of Regional Rural Banks(Rs. crore)
Item 1999-2000 2000-01 Variation
Loss Profit All Loss Profit Col. (7)Making Making RRBs Making Making RRBs over
[34] [162] [196] [25] [167] [192] Col. (4)
1 2 3 4 5 6 7 8
A. Income 463.97 3,694.21 4,158.18 381.57 4,374.74 4,756.31 598.13
(i+ii) (14.38)
i) Interest income 423.27 3,522.20 3,945.47 358.70 4,169.37 4,528.07 582.60
(14.77)
ii) Other income 40.70 172.01 212.71 22.87 205.37 228.24 15.53
(7.3)
B. Expenditure 577.52 3,150.69 3,728.21 451.07 3,716.20 4,167.27 439.06
(i+ii+iii) (11.78)
i) Interest expended 369.35 2,195.24 2,564.59 298.41 2,603.33 2,901.74 337.15
(13.15)
ii) Provisions and contingencies 11.59 95.40 106.99 15.94 110.45 126.39 19.40
(18.13)
iii) Operating expenses 196.58 860.05 1,056.63 136.72 1,002.42 1,139.14 82.51
of which : (7.81)
Wage Bill 176.18 739.42 915.60 122.24 860.28 982.52 66.92
(7.31)
C. Profit
i) Operating Profit/Loss -101.96 638.92 536.96 -53.56 768.99 715.43 178.47
(33.24)
ii) Net Profit/Loss -113.55 543.52 429.97 -69.50 658.54 589.04 159.07
(37.00)
D. Total Assets 6,233.52 36,191.42 42,424.94 5,086.75 43,482.66 48,569.41 6,144.47
(14.48)
E. Financial Ratios $
i) Operating Profit -1.64 1.77 1.27 -1.05 1.77 1.47 0.21
ii) Net Profit -1.82 1.50 1.01 -1.37 1.51 1.21 0.20
iii) Income 7.44 10.21 9.80 7.50 10.06 9.79 -0.01
iv) Interest income 6.79 9.73 9.30 7.05 9.59 9.32 0.02
v) Other Income 0.65 0.48 0.50 0.45 0.47 0.47 -0.03
vi) Expenditure 9.26 8.71 8.79 8.87 8.55 8.58 -0.21
vii) Interest expended 5.93 6.07 6.05 5.87 5.99 5.97 -0.07
viii) Operating expenses 3.15 2.38 2.49 2.69 2.31 2.35 -0.15
ix) Wage Bill 2.83 2.04 2.16 2.40 1.98 2.02 -0.14
x) Provisions and Contingencies 0.19 0.26 0.25 0.31 0.25 0.26 0.01
xi) Spread (Net Interest Income) 0.87 3.67 3.25 1.19 3.60 3.35 0.09
$ Ratios to Total Assets.
Note: Figures in brackets are percentage variations.
Source: NABARD.
12. Interest Rates of ScheduledCommercial Banks
Interest Rate Policy
2. 81 With progressive deregulation of interestrates, banks now have considerable flexibility
to decide their deposit and lending ratestructures and manage their assets andliabilities with greater efficiency. On the lendingside, banks are free to prescribe their ownlending rates including the Prime Lending Rate(PLR). On the deposit side, banks have been
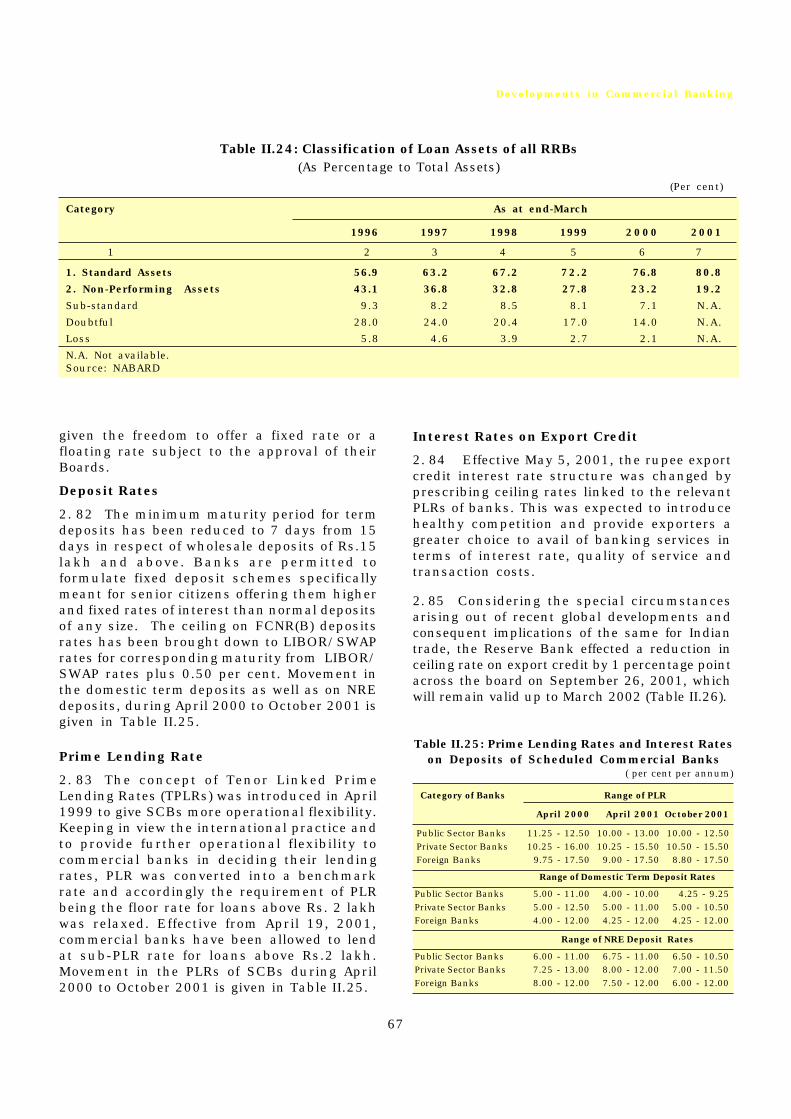
67
Developments in Commercial Banking
Category As at end-March
1996 1997 1998 1999 2000 2001
1 2 3 4 5 6 7
1. Standard Assets 56.9 63.2 67.2 72.2 76.8 80.8
2. Non-Performing Assets 43.1 36.8 32.8 27.8 23.2 19.2
Sub-standard 9.3 8.2 8.5 8.1 7.1 N.A.
Doubtful 28.0 24.0 20.4 17.0 14.0 N.A.
Loss 5.8 4.6 3.9 2.7 2.1 N.A.
N.A. Not available.Source: NABARD
Table II.24: Classification of Loan Assets of all RRBs(As Percentage to Total Assets)
(Per cent)
given the freedom to offer a fixed rate or afloating rate subject to the approval of theirBoards.
Deposit Rates
2. 82 The minimum maturity period for termdeposits has been reduced to 7 days from 15days in respect of wholesale deposits of Rs.15lakh and above. Banks are permitted toformulate fixed deposit schemes specificallymeant for senior citizens offering them higherand fixed rates of interest than normal depositsof any size. The ceiling on FCNR(B) depositsrates has been brought down to LIBOR/SWAPrates for corresponding maturity from LIBOR/SWAP rates plus 0.50 per cent. Movement inthe domestic term deposits as well as on NREdeposits, during April 2000 to October 2001 isgiven in Table II.25.
Prime Lending Rate
2. 83 The concept of Tenor Linked PrimeLending Rates (TPLRs) was introduced in April1999 to give SCBs more operational flexibility.Keeping in view the international practice andto provide further operational flexibility tocommercial banks in deciding their lendingrates, PLR was converted into a benchmarkrate and accordingly the requirement of PLRbeing the floor rate for loans above Rs. 2 lakhwas relaxed. Effective from April 19, 2001,commercial banks have been allowed to lendat sub-PLR rate for loans above Rs.2 lakh.Movement in the PLRs of SCBs during April2000 to October 2001 is given in Table II.25.
Interest Rates on Export Credit
2. 84 Effective May 5, 2001, the rupee exportcredit interest rate structure was changed byprescribing ceiling rates linked to the relevantPLRs of banks. This was expected to introducehealthy competition and provide exporters agreater choice to avail of banking services interms of interest rate, quality of service andtransaction costs.
2. 85 Considering the special circumstancesarising out of recent global developments andconsequent implications of the same for Indiantrade, the Reserve Bank effected a reduction inceiling rate on export credit by 1 percentage pointacross the board on September 26, 2001, whichwill remain valid up to March 2002 (Table II.26).
Category of Banks Range of PLR
April 2000 April 2001 October 2001
Public Sector Banks 11.25 - 12.50 10.00 - 13.00 10.00 - 12.50Private Sector Banks 10.25 - 16.00 10.25 - 15.50 10.50 - 15.50Foreign Banks 9.75 - 17.50 9.00 - 17.50 8.80 - 17.50
Range of Domestic Term Deposit Rates
Public Sector Banks 5.00 - 11.00 4.00 - 10.00 4.25 - 9.25Private Sector Banks 5.00 - 12.50 5.00 - 11.00 5.00 - 10.50Foreign Banks 4.00 - 12.00 4.25 - 12.00 4.25 - 12.00
Range of NRE Deposit Rates
Public Sector Banks 6.00 - 11.00 6.75 - 11.00 6.50 - 10.50Private Sector Banks 7.25 - 13.00 8.00 - 12.00 7.00 - 11.50Foreign Banks 8.00 - 12.00 7.50 - 12.00 6.00 - 12.00
Table II.25: Prime Lending Rates and Interest Rateson Deposits of Scheduled Commercial Banks
( per cent per annum)

68
Report on Trend and Progress of Banking in India, 2000-01
banks obtaining necessary clearance fromInsurance Regulatory and DevelopmentAuthority (IRDA).
Clearing Corporation
2. 87 A clearing corporation known as ClearingCorporation of India Ltd. (CCIL) for clearing andsettlement of government securities and foreignexchange transactions has been set up by SBI(chief promoter) and co-promoted by Bank ofBaroda, HDFC Bank, ICICI, IDBI, and LIC in April2001 with an authorised as well as paid-upcapital of Rs.50 crore. While SBI and the co-promoters are participating to the extent of 51per cent in the equity of the Corporation, thebalance 49 per cent equity will be contributedby other banks, financial institutions, primarydealers and mutual funds. SBI has beenpermitted to invest 26 per cent in the equity ofthe Corporation amounting to Rs.13 crorewhereas Bank of Baroda and HDFC Bank havebeen permitted to invest Rs.2.5 crore each.Permission has also been accorded to CentralBank of India to subscribe Rs.2 crore in theequity of CCIL, Rupees one crore each by PunjabNational Bank and Oriental Bank of Commerceand Rs.50 lakh each by Citibank, Bank of India,Canara Bank, Corporation Bank and UnionBank of India.
13. Diversification in Banks' Operations
Banks' entry into Insurance
2. 86 The Government of India Notificationspecifying insurance as a permissible form ofbusiness under Section 6(1)(0) of the BankingRegulation Act, 1949, was issued on August 3,2000. Based on the above, detailed guidelineswere issued by Reserve Bank on August 9, 2000.Since then, State Bank of India has beenpermitted to set up a life insurance subsidiaryon risk participation basis with 74 per centequity holding. Jammu & Kashmir Bank Ltd.,and Vysya Bank Ltd., have been accordedapproval to contribute 25 per cent and 49 percent, respectively, to the equity of insurancejoint ventures on risk participation basis.Punjab National Bank and Vijaya Bank werepermitted to make strategic investment to theextent of 15 per cent and 8 per cent,respectively, in the life and non-life insurancejoint venture and in a distribution and servicescompany. Citibank, American Express, StandardChartered Bank, HSBC, ABN-Amro, HDFC Bankand Deutsche Bank have been given ' inprinciple' approval to act as corporate agents ofinsurance companies for distribution ofinsurance products on fee basis. All theseapprovals have been granted subject to the
Table II.26: Bank Rate, Export Credit Rate and PLR(Per cent)
Bank Export Credit PLR
Rate Pre-shipment Post-shipment (Public SectorBanks)
Effective date Upto Beyond Upto 90 Beyond 90180 days 180 days days (Not days Upto
and Upto exceeding) 6 Months270 days
1 2 3 4 5 6 7
March 2, 1999 8.0 10.0 13.0 10.0 12.0 12.0 - 14.0
April 2, 2000 7.0 — — — — 11.25 - 12.5
July 22, 2000 8.0 — — — — —
February 17, 2001 7.5 — — — — 11.5 - 13.0
March 2, 2001 7.0 — — — — 10.0 - 13.0
May 5, 2001 — PLR minus 1.5 PLR plus 1.5 PLR minus 1.5 PLR plus 1.5 —
September 26, 2001 — PLR minus 2.5 PLR plus 0.5 PLR minus 2.5 PLR plus 0.5 10.0 - 12.5
October 23, 2001 6.5 — — — — —
— indicates no change.

69
Developments in Commercial Banking
14. Developments in Retail Banking
2. 88 The retail banking portfolio encompassesdeposit and asset-linked products as well asother financial services offered to individualsfor personal consumption. Retail banking isincreasingly viewed by banks as an attractivemarket segment with opportunities for growthwith profits. The products offered in the retailbanking segment are housing loans,consumption loans for purchase of durables, autoloans, credit cards and educational loans. Theloan values could typically range between Rs. 20thousand and Rs.100 lakh. The loans aregenerally for duration of 5 to 7 years withhousing loans granted for a longer duration of15 years. Credit card is another rapidly growingsub-segment of this product group.
2. 89 The growth in retail banking has beenfacilitated by growth in banking technology andautomation of banking processes to enableextension of reach and rationalisation of costs.ATMs have emerged as an alternative bankingchannel which facilitate low-cost transactionsvis-à-vis traditional branches. It also has theadvantage of reducing the branch traffic andenables banks with small networks to offset thetraditional disadvantages by increasing theirreach and spread. The increased use of ATMsby foreign banks and private sector banks hashelped these banks to compete with PSBs byenabling them to expand their reach and tocontain costs. The use of ATM technology isquite low in the case of PSBs and the old privatesector banks. Given the fact that the PSBs arein the process of rationalisation of staffstrength, introduction of ATMs would helpfacilitate improved customer service by thesebanks. Some of the factors which inhibit therapid growth of the ATMs are absence of a sharedpayments network, the high cost of ATM cardsand machines and poor telecommunicationinfrastructure.
Internet Banking in India - Guidelines
2. 90 Economic integration within and acrosscountries, deregulation, advances intelecommunications, and the growth of theInternet and wireless communication
technologies are dramatically changing thestructure and nature of financial services.Notwithstanding the rudimentary stage ofinternet banking in India, in order to promotesafety and soundness for e-banking activities,as a precautionary measure, the Reserve Bankconstituted a Working Group on InternetBanking and issued guidelines to the banks(Box II.3).
15. Priority Sector Lending
2. 91 Priority sector lending4 continued to bean important aspect of lending to agriculture,small scale industries, transport operators, etc.Bank group-wise credit extended to thesesectors is discussed below. Sector-wise break-up of priority sector advances of public sectorbanks are detailed in Appendix Table II.14.Bank-wise details of advances to agricultureand weaker sections as well as NPAs arisingout of advances to weaker sections are furnishedin Appendix Table II.15 (A) and (B).
Public Sector Banks
2. 92 The outstanding priority sector advancesof PSBs increased by 14.7 per cent toRs.1,46,546 crore as on the last reporting Fridayof March 2001. At this level, the advancesformed 43.0 per cent of the net bank credit (NBC)as on last reporting Friday of March 2001. Totalagricultural advances of PSBs increased by Rs.7,495 crore to Rs.53,685 crore as on the lastreporting Friday of March 2001 comprising 15.7per cent of NBC.
Private Sector Banks
2. 93 The total priority sector advances extendedby private sector banks as on the last reportingFriday of March 2001 amounted to Rs.21,550 crore(constituting 38.2 per cent of NBC) as comparedwith Rs.18,019 crore a year ago. The share ofsmall scale industries was the highest at 14.4 percent of NBC, followed by advances to 'other prioritysector' (14.2 per cent) and agriculture (9.6 per cent)(Appendix Table II.16). Bank-wise details ofadvances to priority sector, agriculture and weakersections as well as NPAs arising out of advances
4 The definition of priority sector lending has been expanded during the year to include inter alia, bank financeto agriculture through (i) non-banking financial companies and (ii) finance for distribution of inputs for activitiesallied to agriculture up to Rs. 15 lakh (raised from Rs 5 lakh).

70
Report on Trend and Progress of Banking in India, 2000-01
to weaker sections are furnished in AppendixTable II.17 (A) and (B).
Foreign Banks
2. 94 The foreign banks operating in Indiahave to allocate a target of 32 per cent of NBCfor the priority sector with sub-sectoral targetsof 10 per cent of NBC for SSI and 12 per cent ofNBC for exports. The foreign banks' lending tothe priority sector as on the last reporting Fridayof March 2001 constituted 34 per cent of NBC,with loans to exports (20.0 per cent of NBC)increasing to Rs. 6,863 crore in March 2001 fromRs.6,372 crore in March 2000 ( Appendix TableII.18)
Advances to Weaker Sections
2. 95 The total outstanding advances to weakersections provided by PSBs increased by Rs.3,660
crore over the level prevailing in March 2000 toRs. 24,805 crore (7.3 per cent of NBC) as on thelast reporting Friday of March 2001.
Differential Rate of Interest (DRI) Scheme
2. 96 The outstanding advances of PSBs underthe DRI scheme as at end-March 2001 formed0.12 per cent of the total advances as at end-March 2000.
Special Agricultural Credit Plans
2. 97 PSBs were advised to prepare SpecialAgricultural Credit Plans for increasing thecredit flow to agriculture on an annual basis.During 2000-01, the disbursements toagriculture under this Plan were Rs.24,654crore as against the projection of Rs.25,893crore. During 2001-02, the target fordisbursements has been set at Rs.30,818 crore.
With the growing spread of internet and the foraysbeing made by banks in the field of internet banking,the Reserve Bank of India had constituted a WorkingGroup to examine the different issues relating tointernet banking and recommend technology, security,legal and operational standards keeping in viewinternational best practices. The terms of referenceof the Working Group were related to the examinationof different aspects of internet banking from regulatoryand supervisory perspective and to recommendappropriate standards for adoption in India. In itsreport, the Working Group has classified the internetbanking products into 3 types, based on the levels ofaccess granted, which are detailed below:
Information only systems
General-purpose information l ike interest rates,branch locations, product features, FAQs, loan anddeposit calculations etc., are provided on the bank’swebsite. There exist facilities for downloading varioustypes of application forms. The communication isnormally done through e-mail. There is no interactionbetween the bank's application systems and thecustomer. No identification or authentication ofcustomers is done. In this case, the possibility of anyhacking or an unauthorised person getting into theproduction system of the bank through the internetdoes not exist.
Electronic Information Transfer System
These systems provide customer-specific informationin the form of account balances, transaction details,
Box II.3: Working Group on Internet Banking in India
statement of accounts, etc. The information is stilllargely of the 'read only' format. Identification andauthentication of the customer is through password.The information is fetched from the bank's applicationsystems either in batch mode or off-line. In this casealso, the application systems cannot be direct lyaccessed through the internet.
Fully Electronic Transactional System
These systems al low bi-direct ional transactionalcapabilities. Transactions can be submitted by thecustomers for on-line update. These systems requirehigh degree of security and control . In such anenvironment, web server and the application systemsare linked over secure infrastructure, which comprisethe basic requirements in terms of technology coveringcomputerisation, networking and security; inter-bankpayment gateway and legal infrastructure forintroduction of internet banking involving a fullyElectronic Transactional System.
The recommendations cover the risks associated withinternet banking, the technology and securitystandards for internet banking, legal issues relatingto this new type of activity and the regulatory andsupervisory concerns of the central bank. Therecommendations of the Group have been accepted andthe Reserve Bank has issued necessary guidelines tobanks for implementation in a phased manner.
Reference:
Reserve Bank of India (2001), 'Report of the WorkingGroup on Internet Banking in India' June.
71
Developments in Commercial Banking
Swarnjayanti Gram Swarozgar Yojana
2. 98 The Swarnjayanti Gram SwarozgarYojana (SGSY), a restructured povertyalleviation programme launched by theGovernment of India from April 1999, hassubsumed IRDP and its allied schemes viz.,Training of Rural Youth for Self Employment(TRYSEM), Development of Women and Childrenin Rural Areas (DWCRA), Supply of ImprovedToolkits to Rural Artisans (SITRA), Ganga KalyanYojana (GKY) and Million Wells Scheme (MWS).The scheme aims at establishing a largenumber of micro enterprises in the rural areasof the country. SGSY is a holistic programmecovering all aspects of self-employment such asorganisation of the poor into Self Help Groups,training, credit, technology, infrastructure andmarketing. During 2000-01, beneficiariesunder the scheme number about 10.3 lakh (asat end- March 2001). Bank credit to the tune ofRs. 1,44,510 lakh along with Governmentsubsidy amounting to Rs. 69,472 lakh weredisbursed.
Lead Bank Scheme
2. 99 As at end of March 31, 2001, Lead BankScheme covered 576 districts in the country.During November 2000, three new States viz.,Jharkhand, Uttaranchal and Chhattisgarh havebeen created by bifurcation of the existing statesof Bihar, Uttar Pradesh and Madhya Pradesh,respectively. Consequent upon creation of theabove states, the SLBC convenorship of all thesix states (new as well as existing) has beenassigned to some of the public sector banks bythe Central Government in consultation withthe Reserve Bank.
16. Supervisory Developments
2.100 The position of the Indian bankingsystem and its regulation and supervision vis-à-vis the principles laid down by the BaselCommittee on Banking Supervision wasassessed by the Advisory Group on BankingSupervision (Chairman: Shri M.S.Verma). TheGroup submitted its Report in May 2001. Themajor recommendations of the Group aredetailed in Box II.4.
Foreign Branches of Indian Banks
2.101 As part of new init iatives, newsupervisory reporting system called DSB-Oreturns was introduced from the quarter endedJune 2000, replacing the RALOO returns. TheDSB-O returns consists of a set of seven returnsshowing the quarter-wise data on assets andliabilities, off-balance sheet exposure, inter-branch and inter-bank reconciliation, structuralliquidity, problem credits and investments, largeexposures, country exposure, profitability andfrauds. The detailed analysis of DSB-O returnscarried out by the Reserve Bank brought to lightthe various parameters of the performance ofoverseas branches. The supervisory concernsthat emerged out of these analyses werecommunicated to the banks for necessarycorrective action. Based on the analyses of DSB-O returns as also reports on portfolio appraisalson the functioning of foreign branches, theReserve Bank held meetings with theindividual banks to discuss the performance oftheir foreign branches, problems faced by themand strategic plans for the near future. TheReserve Bank received quarterly reports from
The Advisory Group on Banking Supervision(Chairman: Shri M.S. Verma) sought to: (i) study thepresent status of applicability and relevance andcompliance in India of the relevant standards andcodes; (ii) study the feasibility of compliance and thetime-frame within which this can be achieved giventhe prevailing legal and institutional practices in India;(iii) compare the levels of adherence in India vis-à-visindustrialised countries and also emerging economiesparticularly to understand India's position and toprioritise actions on some of the more important codes
and standards; and (iv) chalk out a course of actionfor achieving the best practices.
The recommendations of the Group can broadly beclassi f ied under seven broad categories, viz . , ( i )Corporate Governance; (ii) Internal Control; (iii) RiskManagement; (iv) Loan Accounting; (v) Transparencyand disclosures; (vi) Financial Conglomerates; and(vii) Cross-border Banking Supervision.
With regard to the current status in India, the Group
Box II.4: Advisory Group on Banking Supervision
(Contd...)

72
Report on Trend and Progress of Banking in India, 2000-01
was of the view that, given the level of complexityand development of the Indian banking sector, thelevel of compliance with the standards and codes isof a high order. Wherever there are significant gaps,these can be remedied within a reasonable time-frameand, as such, are not causes for immediate concernprovided that necessary amendments to laws, whereverrequired, are put in place without delay.
Corporate Governance
Given the predominantly public sector character ofthe banking sector, the Group felt that the nature of abank's ownership should not be a crit ical factoraffecting the type and quality of corporate governance.The quality of corporate governance should be the samein all types of banking organisations, irrespective oftheir ownership.
In the short run, it needs to be ensured that thedirectors on the boards of banks are conversant withcomplex issues such as risk management that banksneed to tackle and that they are not over-committedelsewhere. While setting accountability standards forbank boards, the Group felt that there was a need forenhanced transparency and disclosures in respect ofvarious aspects of boards' constitution and functioning.
Management Information System (MIS)
The quality of MIS is an area of potential risk bothfrom the point of v iew of internal control andregulatory oversight. It would, therefore, be necessaryto strengthen the MIS and data collection machineryin banks to ensure integrity and reliability of data.This is also necessary for banks to move towards moresophisticated means of managing the risks inherentin their functioning.
Risk Management
The Group recommended greater orientation of thebanks' managements and their boards towards a betterunderstanding of risks and their management. Furthermore, in the view of the Group, it was desirable thatsome of the more capable and better-equipped bankscould take the lead in expediting the process oftransition from elementary levels of risk managementto levels of greater sophist ication and act asforerunners so that they could act as models for otherbanks to follow.
Loan Accounting
Over a period of time, the formulae-based system ofclassification of assets and provisioning will have togive way to a more real ist ic assessment of therealisability of assets, relying on a risk assessment-based system. However, a system of provisioning basedon risk assessment as regards the realisability of adebt and the value of collaterals can take root only ifthe present lacunae in the relevant legal provisions
and the system itself, which make it debtor-friendly,are removed.
Transparency and Disclosure
At present, all banks irrespective of their size, scopeand complexity of operations, are required to make thesame credit r isk disclosures. There is need forintroducing the concept of materiality in the matter ofdisclosures. Among other things, banks should beasked to disclose qualitative information on their creditrisk management and control policies and practicesin the Management's 'Notes to the balance sheet'. Banksshould also be advised to disclose information aboutsignificant concentrations of credit risk, businesssegment-wise general and speci f ic provisions,movement in provisions and cumulative provisionsheld against impaired assets. There is also need fordisclosures on transactions with affiliated and relatedparties and large shareholders.
Internal Control
Boards of most banks, particularly public sector bankswould need to undergo an attitudinal change towardsthe operational risks faced by banks, that they have abetter and f irmer say in the maintenance andimprovement of internal control systems in the banks.In-depth discussions on periodic reports on internalcontrols systems of banks between the managementand their boards should be institutionalised. TheReserve Bank may consider taking steps, so that on-site inspections are individualised and more bank-specific in its approach. The Reserve Bank may alsoconsider leveraging the findings/reports of the externalauditors of banks by even engaging them for specificarea audit/inspection of banks and utilise their reportsfor supervisory oversight as is done by some otherregulators.
Supervision of Conglomerates
The Reserve Bank should ensure that fitness, proprietyor other qualification tests can be applied to managersand directors of other unregulated entit ies in aconglomerate i f there is any possibi l i ty of theirexercising a material or controlling influence on theoperations of regulated entities. It would be desirableto put in place arrangements for applying fitness,qualification and propriety tests on all shareholderswith shareholdings beyond a specif ied threshold.Suitable legal provisions would need to be introducedin the Banking Regulation Act, in order to empowerthe Reserve Bank in this regard.
In order to ensure co-ordination amongst thesupervisors of the di f ferent entit ies in theconglomerate, introduction of the concept of 'primarysupervisor' may be considered. Designating one of thesupervisors as the primary supervisor wil lsubstantial ly improve much needed coordinationbetween different supervisors (regulators) and adds tothe scope and quality of the overall supervision of theconglomerate.
(Contd...)
(Contd...)
73
Developments in Commercial Banking
Cross-border Banking Supervision
Provision of unhindered and unqualified access toinformation to the home supervisor may be made acondition for permitting a bank to open offices abroad.Country-wise analyses will have to be made to ensurereciprocity between home and host supervisors insharing information on certain qualitative aspects ofthe business undertaken by branches and subsidiariesof banking organisations outside the jurisdiction oftheir respective home supervisors.
Effective supervision of f inancial conglomerates,which would become a part of the banking sector inthe near future, would require that supervisory
coordination is based on formal arrangements whichmay include appointment of separate coordinators and,where considered necessary, primary regulators, foreach group. The methods of supervision would haveto become increasingly r isk-based with greaterreliance on the Boards of banks themselves and theexternal auditors. Supervision which moves alongthis direction would pave the way for a healthy andsound banking system.
Reference:
Reserve Bank of India (2001), ‘Report of the AdvisoryGroup on Banking Supervision’, June
(Concld...)
the banks on the overseas sectors detailingchanges in the regulatory framework, pendingissues relating to both host country and homecountry supervision, business environmentand perception of new opportunities, credit andcontrol areas and compliance of audit/inspection. Significant developments werenoted and monitored.
17. Frauds/Robberies
2.102 During the calendar year 2000,commercial banks reported 3,072 cases offrauds involving an amount of Rs. 672.59 crore.
Eight cases of frauds involving an amount ofRs.1.59 crore were reported by the banks intheir overseas branches during the sameperiod. These cases were followed up with thebanks for necessary remedial measures andfixing staff accountability. During the year2000-01 (July-June), 48 Caution Advices wereissued to commercial banks/financialinstitutions in respect of firms/companiesobserved to have committed seriousirregularities in their borrowal accounts.During the year 2000-01, 94 cases of robberies/dacoities involving an amount of Rs. 3.44 crorewere reported by public sector banks.
Co-operative credit institutions occupyan important position in the financial systemof the economy in terms of their reach, volumeof operations and the purpose they serve. Ruralco-operative banks play a pivotal role in the ruralcredit delivery system with credit co-operativesforming almost 70 per cent of the rural creditoutlets. Rural co-operative banks account foraround 30 per cent of rural deposits and 44 percent of the outstanding loans and advances ofthe banking system for agriculture and ruraldevelopment. About 55 per cent of the short-termproduction loans for the agriculture sector comefrom co-operative credit institutions. Urbanco-operative banks (UCBs), on the other hand,aim at mobilisation of savings from the middle-and low-income urban groups and purvey credittowards the weaker sections. The majority ofcredit from UCBs is channelised towards prioritysector segments. The organisational structure ofco-operative credit institutions is given in Chart III.1.
Overview of the Recent Policy Measures onCo-operative Credit Institutions
3.2 In order to examine the functioning andthe constraints being faced by co-operativebanks and the rural credit system, a High PowerCommittee (HPC), a Task Force and an ExpertGroup were appointed in recent years. Theobjectives of setting up these Groups were todevise ways to improve the efficiency of thecredit co-operatives and to make the creditdelivery system of these credit institutionsviable. Notwithstanding certain differences intheir focus, the three Groups identified inter aliamany common constraints being faced bydifferent types of credit co-operatives and gaverecommendations to improve the co-operativecredit system (Box III.1). In line with therecommendations of these Groups, policychanges for the co-operative banks have beenframed with a view to improving the creditdelivery mechanism of co-operative banks andintroducing various prudential measures forstrengthening the financial health of theseinstitutions.
3.3 Major initiatives relating to co-operativecredit institutions and the rural credit systemundertaken since 2000-01 include the launchof a new tranche of Rural InfrastructureDevelopment Fund (RIDF), enhancement of thereach of the schemes relating to Kisan CreditCards (KCCs), Self-Help Groups (SHGs) and microcredit. There has also been significant changein the prudential and operational norms relatingto UCBs.
3.4 Introduced in 1998-99, KCCs have beenpopular among both farmers and bankers.Recently, the National Bank for Agriculture andRural Development (NABARD), in consultation withthe Reserve Bank, has dispensed with the floorlimit of Rs. 5,000 for the KCC. This would enablesmall and medium farmers to take advantage ofthe facility. The Union Budget 2001-02 proposedthe introduction of accident benefit scheme forKCCs holders. The Budget further proposed toaccelerate issue of KCCs by banks so as to bringall eligible farmers within its scope in the nextthree years, i.e., by March 31, 2004.
3.5 The RIDF has played an important rolein the development of rural infrastructure,especially in the context of projects relating toirrigation and rural connectivity. In order toreduce the gap between the amounts sanctionedand disbursed under RIDF, the interest ratecharged by NABARD on RIDF loans was reducedfrom 11.5 per cent to 10.5 per cent. A furtherallocation of Rs. 5,000 crore as net corpus ofRIDF-VII was announced in the Union Budget2001-02. It was proposed that during the currentyear, NABARD would link an additional 1 lakhSHGs to enable an additional 20 lakh familiesto access credit.
3.6 While NABARD has so far been extendingrefinance to the rural co-operative creditinstitutions, subject to certain conditions, thefacility has been extended to scheduled UCBsalso, against both farm and non-farm rural creditextended by these banks.
3.7 In the context of improving the health of theco-operative credit institutions, revised Entry Point
Developments in Co-operative Banking
Chapter III

Norms (EPNs) for UCBs were announced duringAugust 2000. With an aim to align the prudentialnorms applicable to the urban co-operative bankswith those prevailing for the commercial banks,UCBs have been advised to achieve capital to risk-weighted asset ratio (CRAR) at par with the levelsapplicable for commercial banks in a phasedmanner between 2002 and 2005.
3.8 In view of certain developments in theurban co-operative banking sector duringMarch 2001, the monetary and credit policy forthe first half of 2001-02 announced somereform measures relat ing to this sector(Box III.2). These measures included, inter alia,ban on lending by the UCBs to the equitymarket, limits on their access to borrowingsfrom call/notice money markets, ban on UCBsin keeping term deposits with other UCBs andrevision in the form in which UCBs canmaintain their Statutory Liquidity Ratio (SLR)
reserves. In response to representationsreceived from UCBs and their federations, theMid-term Review of October 2001 has proposedto allow UCBs to grant loans to individualsagainst security of shares, subject to certainconditions. The Policy also proposed to modifythe time-frame for achieving the prescribedlevels of SLR holding (Box I.1). The existingmajor di f ferences between UCBs andcommercial banks in terms of reserverequirements and funds deployment are givenin Box III.3.
1. Progress of the Co-operative Banks
(a) Urban Co-operative Banks
Licensing and Inspection
3.9 Licensing policy for UCBs was revised inAugust 2000, in consonance with therecommendations of the HPC. The thrust of the
75
Developments in Co-operative Banking

76
Report on Trend and Progress of Banking in India, 2000-01
new policy is on strong start-up capital,professionalisation of boards of managementand corporate governance. The revised EPNs arebased on population criterion. According to thenew norms, UCBs should have minimum capitalof Rs. 4 crore and membership of at least 3,000if the population of the place where the UCB is
being established is more than 10 lakh. Forpopulation between 5-10 lakh, the minimumshare capital and membership requirements areRs. 2 crore and 2,000, respectively. Forpopulation between 1-5 lakh the correspondingminimum requirements are Rs. 1 crore and1,500, respectively. For towns with population
Box III.1: Recommendations of the Recent Committees on Co-operative Banks
The objective of co-operative banking is to createenduring and sustainable financial institutions, whichremain responsive to the credit needs of the weakersections. Concerns have been expressed that thefinancial health of a large number of co-operative creditinstitutions is extremely fragile. Keeping in view theprimacy of the role of the credit co-operatives and theneed to review and improve the functioning of thecredit co-operatives, various groups and committeeshave been constituted from time to time. In the recentpast three such groups/committees were formed. In1999, a High Power Committee (Chairman: Shri. K.Madhava Rao) was appointed by the Reserve Bank tosuggest ways to strengthen the urban co-operative banksin the country. The HPC submitted its report in November1999. A Task Force (Chairman: Shri. Jagdish Capoor)was appointed by the Government of India to suggestmeasures to strengthen the co-operative credit system inthe country. The Task Force submitted its report in August2000. A Committee of Experts (Chairman: Professor V. S.Vyas) was formed by National Bank for Agriculture andRural Development (NABARD) on rural credit system,which submitted its report in July 2001. All theseCommittees/Groups emphasised the need to revitalise theco-operative credit system in the country.
Some of the common financial problems faced by theco-operative credit institutions, which have beenidentified by the HPC, the Task Force and the ExpertGroup, include the following:
● Low capital base,
● Inadequate loan appraisal systems and creditplanning,
● Poor recovery performance,
● Mounting overdues and non-performing assets(NPAs), and
● Low leve ls o f d ivers i f icat ion in businessoperations.
Since credit co-operatives constitute a major avenuefor flow of credit to the priority sector in general andrural sector in particular, deterioration in the financialhealth of these institutions hampers the effectivechannelisation of credit. The initiation of financialsector reforms has posed new challenges for the co-operative credit institutions. First, the reform measureshave substantial ly increased competit ion in thebanking sector. Second, the structural changes in theIndian banking sector since the 1990s have increased
the interdependence between financial institutionsespecially through inter-institutional exposures andpayments and settlement channels. Therefore, thedeterioration in the f inancial posit ion of the co-operative banks can get easily transmitted to othersegments of the financial sector, which might generatea systemic problem.
In light of their assessment of the co-operative creditsystem in the country, the HPC, the Task Force andthe Expert Group have come out with var ioussuggestions. Some of the important common pointsin their recommendations include the following:
● Functioning of co-operative credit institutionsshould be member-driven and democratic,
● In order to make the co-operative credit systemsustainable and the under ly ing inst i tut ionsviable, it is essential to introduce professionalismin the operations of these institutions, and theyneed to be run on the basis of sound businessprinciples. Co-operative banks need to deviseways to adapt to the new situation arising fromthe introduction of the financial reform processby making themselves more competitive,
● Regulation and supervision mechanisms of theco-operative credit institutions need revampingand streamlining. There is need to explorepossibilities to establish a suitable unified agencyto supervise the co-operative credit institutions,
● Prudent ia l norms are required for bothtransparency and healthy functioning of financialsystem. Compared to the commercial banks, thereach of such principles for the co-operative banksremains rather limited especially in the contextof rural co-operative credit institutions. Over time,co-operative credit system has to be brought underthe purview of these measures.
References :
Government of India (2000): Report of the Task Forceto Study the Cooperative Credit System and SuggestMeasures for its Strengthening, Mumbai (Chairman:Shri. Jagdish Capoor).National Bank for Agriculture and Rural Development(2001): Report of the Expert Group on Rural Credit,Mumbai (Chariman: Shri. V. S. Vyas).Reserve Bank of India (1999): Report of the High PowerCommittee on Urban Co-operative Banks , Mumbai(Chariman: Shri. K. Madhava Rao).

77
Developments in Co-operative Banking
less than 1 lakh, the corresponding minimumrequirements are Rs. 25 lakh and 500,respectively. The number of licensed UCBsincreased from 1,849 to 1,937 between end-March 2000 and end-March 2001. Between July2000 and June 2001, licenses under Section 22of the Banking Regulation (BR) Act, 1949 (AsApplicable to Co-operative Societies (AACS))were issued to 18 new banks and 17 existingunlicensed UCBs.
3.10 The Reserve Bank conducts on-siteinspection of the UCBs under Section 35 of theBR Act, 1949 (AACS). The periodicity ofinspection is one year for scheduled and weakUCBs. Well functioning non-scheduled UCBswould now be inspected once in three years andall other UCBs would be inspected once in twoyears. During 2000-01 (July-June), 877 UCBswere inspected as against 828 UCBs during theprevious year.
Box III.2: Urban Co-operative Banks - Recent Regulatory Measures
During March 2001, certain UCBs faced liquidity andinsolvency problems. A major factor behind theproblem had been non-adherence by these UCBs toprudential norms prescribed by the Reserve Bank,such as lending to stockbrokers, exceeding prudentialexposure to single party/group and the l imit onunsecured advances and failure to meet inter-bankpayment obligations. At the centre of the problem wasa multi-state scheduled UCB, which witnessed asudden withdrawal of deposits.
The Reserve Bank felt that in the interest of financialstabi l i ty , i t was important to take measures tostrengthen the regulatory framework for the co-operative sector. Issues such as removal of ‘dual’contro l o f the UCBs, lay ing down o f c lear-cutguide l ines for the i r management s t ructure ,enforcement o f further prudent ia l s tandards inrespect of access to uncollateralised funds, lendingby the UCBs against vo lat i le assets , e tc . , werecons idered in th is context . The Reserve Bankident i f i ed the fo l lowing areas for immediateregulatory response: (a) the extent of access of theUCBs to call/notice money markets, (b) the asset-liability management system of the UCBs, (c) inter-bank exposure of the UCBs in the form of depositsmaintained by one UCB with another and (d) themaintenance of SLR portfolio by the UCBs. In orderto address these issues, the Reserve Bank hasannounced a series of measures relating to UCBs inthe April 2001 monetary and credit policy statement.The salient features of these measures are givenbelow.
Lending to Stock Market: It is important to pointout that even before the policy changes were initiatedin April 2001, co-operative banks were not permittedto invest directly in stock markets nor to lend tostock brokers . They could , however , l end toindividuals against pledge of shares up to a certainlimit. Available information revealed that a few UCBsignored these guidelines and established a nexuswith certain stockbrokers in order to operate in thestock market. In order to prevent any possible misusein the future , Reserve Bank had put a stop onlending by UCBs d i rect ly or ind irect ly aga inst
security of stocks with immediate effect. UCBs werea lso adv ised to unwind ex is t ing lending tostockbrokers or direct investment in shares on thecontracted dates. In response to representationsreceived from UCBs and their federations, the October2001 Mid-term Review proposed to allow UCBs to grantloans to individuals against security of shares, subjectto certain conditions (Box I.1).
Access to Call/Notice Money Markets: In order toreduce the excessive reliance of some UCBs in thecall money market, i t was announced that theirborrowings in the call/notice money market on adaily basis should not exceed 2.0 per cent of theiraggregate deposits as at end-March of the previousfinancial year. The freedom to lend in the cal l/notice money market, however, continues.
Inter-UCB Term Deposits: As parking of funds byUCBs with other UCBs may pose a systemic risk, asa safety precaution, UCBs were advised not toincrease their term deposits with other UCBs. Theoutstanding deposits with other UCBs as on April19, 2001 have to be unwound before end of June2002. UCBs may maintain current account balancesat their discretion with other UCBs to meet their day-to-day clearing and remittance requirements.
Maintenance of SLR: UCBs are required to maintaintheir SLR equivalent to 25.0 per cent of net demandand time liabilities (NDTL). They can maintain it inthe form of investments in government and otherapproved securities or as deposits with StCBs/CCBs.In the April 2001 policy statement, it was announcedthat with effect from April 1, 2003 all scheduled UCBswould need to maintain their entire SLR assets of 25.0per cent of NDTL only in government and otherapproved securities and that compliance with CRRrequirements on par with scheduled commercial bankswould be prescribed in due course. All scheduled UCBsand non-scheduled UCBs with deposits of Rs. 25 croreand above now have to maintain investments ingovernment securities only in Subsidiary GeneralLedger (SGL) Accounts with Reserve Bank or inconstituent SGL Accounts with public sector banks,Primary Dealers (PDs), scheduled commercial banks,
(contd...)
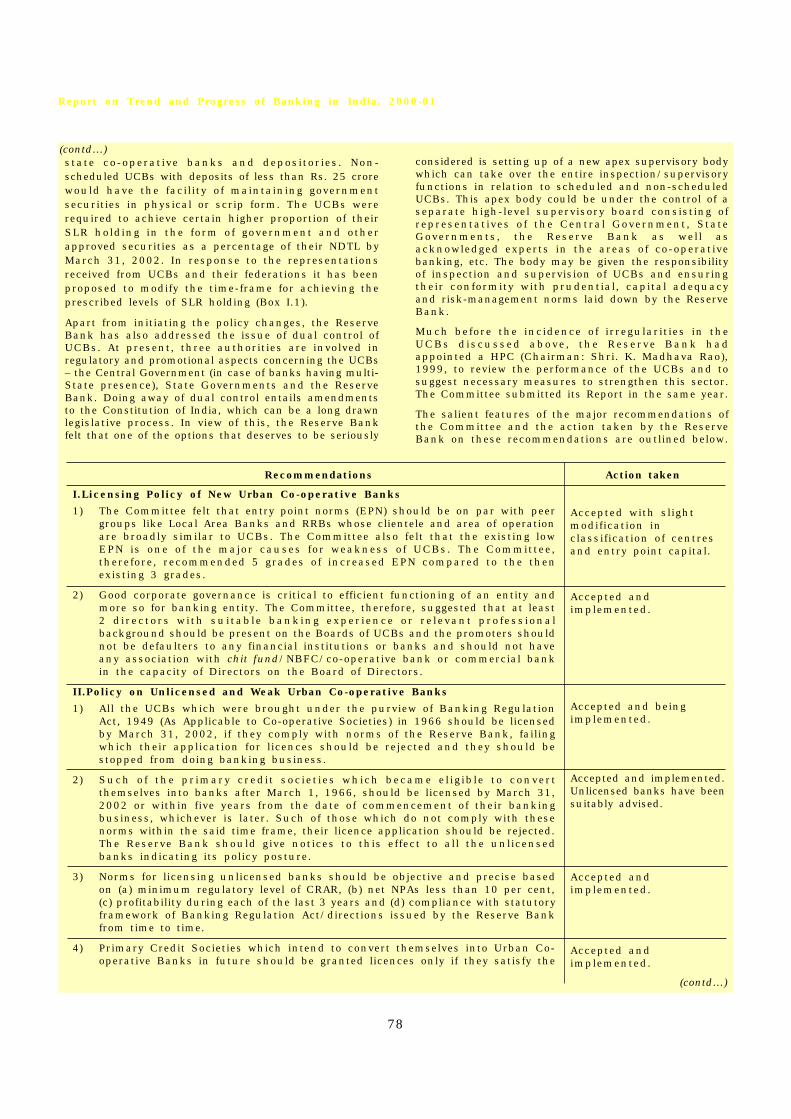
78
Report on Trend and Progress of Banking in India, 2000-01
I.Licensing Policy of New Urban Co-operative Banks
1) The Committee felt that entry point norms (EPN) should be on par with peergroups like Local Area Banks and RRBs whose clientele and area of operationare broadly similar to UCBs. The Committee also felt that the existing lowEPN is one of the major causes for weakness of UCBs. The Committee,therefore, recommended 5 grades of increased EPN compared to the thenexisting 3 grades.
2) Good corporate governance is critical to efficient functioning of an entity andmore so for banking entity. The Committee, therefore, suggested that at least2 directors with suitable banking exper ience or re levant professionalbackground should be present on the Boards of UCBs and the promoters shouldnot be defaulters to any financial institutions or banks and should not haveany association with chit fund/NBFC/co-operative bank or commercial bankin the capacity of Directors on the Board of Directors.
II.Policy on Unlicensed and Weak Urban Co-operative Banks
1) All the UCBs which were brought under the purview of Banking RegulationAct, 1949 (As Applicable to Co-operative Societies) in 1966 should be licensedby March 31, 2002, if they comply with norms of the Reserve Bank, failingwhich their application for licences should be rejected and they should bestopped from doing banking business.
2) Such of the primary credit societ ies which became el ig ible to convertthemselves into banks after March 1, 1966, should be licensed by March 31,2002 or within five years from the date of commencement of their bankingbusiness, whichever is later. Such of those which do not comply with thesenorms within the said time frame, their licence application should be rejected.The Reserve Bank should give notices to this effect to all the unlicensedbanks indicating its policy posture.
3) Norms for licensing unlicensed banks should be objective and precise basedon (a) minimum regulatory level of CRAR, (b) net NPAs less than 10 per cent,(c) profitability during each of the last 3 years and (d) compliance with statutoryframework of Banking Regulation Act/directions issued by the Reserve Bankfrom time to time.
4) Primary Credit Societies which intend to convert themselves into Urban Co-operative Banks in future should be granted licences only if they satisfy the
Recommendations Action taken
Accepted with slightmodification inclassification of centresand entry point capital.
Accepted andimplemented.
Accepted and beingimplemented.
Accepted and implemented.Unlicensed banks have beensuitably advised.
Accepted andimplemented.
Accepted andimplemented.
state co-operative banks and depositories. Non-scheduled UCBs with deposits of less than Rs. 25 crorewould have the facility of maintaining governmentsecurities in physical or scrip form. The UCBs wererequired to achieve certain higher proportion of theirSLR holding in the form of government and otherapproved securities as a percentage of their NDTL byMarch 31, 2002. In response to the representationsreceived from UCBs and their federations it has beenproposed to modify the time-frame for achieving theprescribed levels of SLR holding (Box I.1).
Apart from initiating the policy changes, the ReserveBank has also addressed the issue of dual control ofUCBs. At present, three authorities are involved inregulatory and promotional aspects concerning the UCBs– the Central Government (in case of banks having multi-State presence), State Governments and the ReserveBank. Doing away of dual control entails amendmentsto the Constitution of India, which can be a long drawnlegislative process. In view of this, the Reserve Bankfelt that one of the options that deserves to be seriously
considered is setting up of a new apex supervisory bodywhich can take over the entire inspection/supervisoryfunctions in relation to scheduled and non-scheduledUCBs. This apex body could be under the control of aseparate high-level supervisory board consisting ofrepresentatives of the Central Government, StateGovernments, the Reserve Bank as well asacknowledged experts in the areas of co-operativebanking, etc. The body may be given the responsibilityof inspection and supervision of UCBs and ensuringtheir conformity with prudential, capital adequacyand risk-management norms laid down by the ReserveBank.
Much before the incidence of irregularities in theUCBs discussed above, the Reserve Bank hadappointed a HPC (Chairman: Shri. K. Madhava Rao),1999, to review the performance of the UCBs and tosuggest necessary measures to strengthen this sector.The Committee submitted its Report in the same year.
The salient features of the major recommendations ofthe Committee and the action taken by the ReserveBank on these recommendations are outlined below.
(contd...)
(contd...)
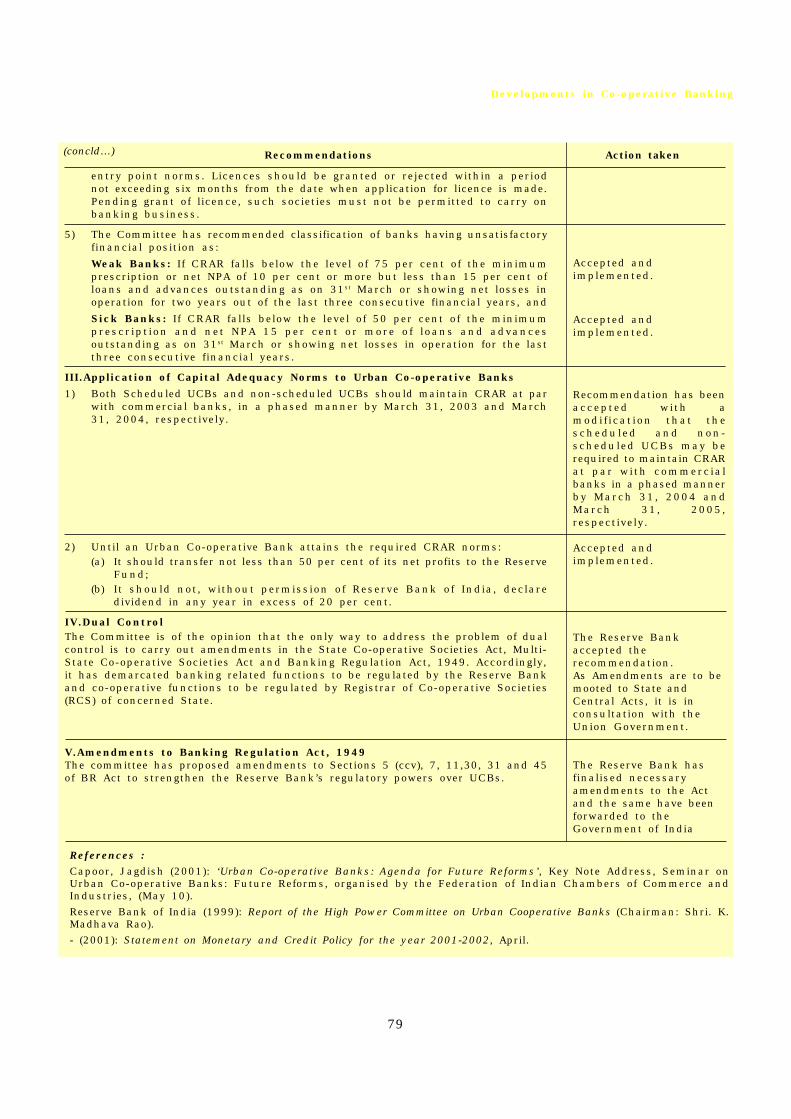
79
Developments in Co-operative Banking
entry point norms. Licences should be granted or rejected within a periodnot exceeding six months from the date when application for licence is made.Pending grant of licence, such societies must not be permitted to carry onbanking business.
5) The Committee has recommended classification of banks having unsatisfactoryfinancial position as:
Weak Banks: If CRAR falls below the level of 75 per cent of the minimumprescription or net NPA of 10 per cent or more but less than 15 per cent ofloans and advances outstanding as on 31st March or showing net losses inoperation for two years out of the last three consecutive financial years, and
Sick Banks: If CRAR falls below the level of 50 per cent of the minimumprescript ion and net NPA 15 per cent or more of loans and advancesoutstanding as on 31st March or showing net losses in operation for the lastthree consecutive financial years.
III.Application of Capital Adequacy Norms to Urban Co-operative Banks
1) Both Scheduled UCBs and non-scheduled UCBs should maintain CRAR at parwith commercial banks, in a phased manner by March 31, 2003 and March31, 2004, respectively.
2) Until an Urban Co-operative Bank attains the required CRAR norms:(a) It should transfer not less than 50 per cent of its net profits to the Reserve
Fund;(b) It should not, without permission of Reserve Bank of India, declare
dividend in any year in excess of 20 per cent.
IV.Dual ControlThe Committee is of the opinion that the only way to address the problem of dualcontrol is to carry out amendments in the State Co-operative Societies Act, Multi-State Co-operative Societies Act and Banking Regulation Act, 1949. Accordingly,it has demarcated banking related functions to be regulated by the Reserve Bankand co-operative functions to be regulated by Registrar of Co-operative Societies(RCS) of concerned State.
V.Amendments to Banking Regulation Act, 1949The committee has proposed amendments to Sections 5 (ccv), 7, 11,30, 31 and 45of BR Act to strengthen the Reserve Bank’s regulatory powers over UCBs.
Recommendations Action taken
Accepted andimplemented.
Accepted andimplemented.
Recommendation has beenaccepted with amodi f icat ion that thescheduled and non-scheduled UCBs may berequired to maintain CRARat par with commercia lbanks in a phased mannerby March 31, 2004 andMarch 31, 2005,respectively.
Accepted andimplemented.
The Reserve Bankaccepted therecommendation.As Amendments are to bemooted to State andCentral Acts, it is inconsultation with theUnion Government.
The Reserve Bank hasfinalised necessaryamendments to the Actand the same have beenforwarded to theGovernment of India
References :
Capoor, Jagdish (2001): ‘Urban Co-operative Banks: Agenda for Future Reforms’, Key Note Address, Seminar onUrban Co-operative Banks: Future Reforms, organised by the Federation of Indian Chambers of Commerce andIndustries, (May 10).
Reserve Bank of India (1999): Report of the High Power Committee on Urban Cooperative Banks (Chairman: Shri. K.Madhava Rao).
- (2001): Statement on Monetary and Credit Policy for the year 2001-2002, April.
(concld...)
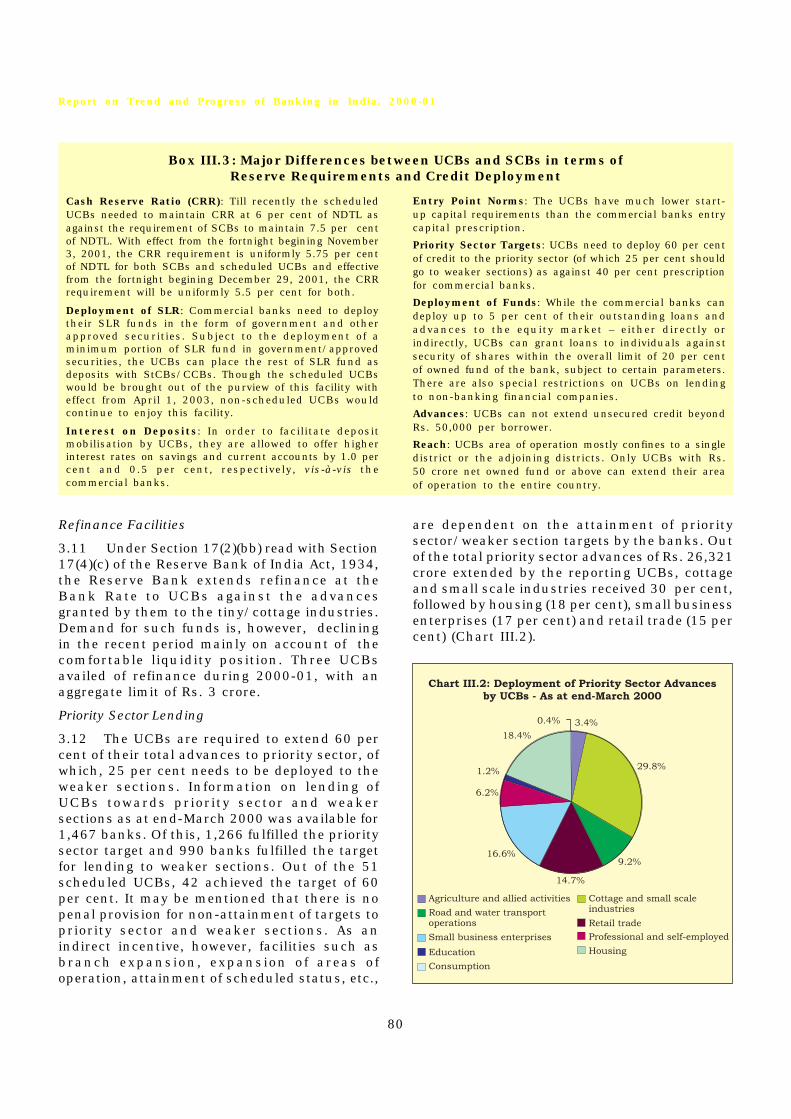
80
Report on Trend and Progress of Banking in India, 2000-01
Refinance Facilities
3.11 Under Section 17(2)(bb) read with Section17(4)(c) of the Reserve Bank of India Act, 1934,the Reserve Bank extends refinance at theBank Rate to UCBs against the advancesgranted by them to the tiny/cottage industries.Demand for such funds is, however, decliningin the recent period mainly on account of thecomfortable liquidity position. Three UCBsavailed of refinance during 2000-01, with anaggregate limit of Rs. 3 crore.
Priority Sector Lending
3.12 The UCBs are required to extend 60 percent of their total advances to priority sector, ofwhich, 25 per cent needs to be deployed to theweaker sections. Information on lending ofUCBs towards priority sector and weakersections as at end-March 2000 was available for1,467 banks. Of this, 1,266 fulfilled the prioritysector target and 990 banks fulfilled the targetfor lending to weaker sections. Out of the 51scheduled UCBs, 42 achieved the target of 60per cent. It may be mentioned that there is nopenal provision for non-attainment of targets topriority sector and weaker sections. As anindirect incentive, however, facilities such asbranch expansion, expansion of areas ofoperation, attainment of scheduled status, etc.,
are dependent on the attainment of prioritysector/weaker section targets by the banks. Outof the total priority sector advances of Rs. 26,321crore extended by the reporting UCBs, cottageand small scale industries received 30 per cent,followed by housing (18 per cent), small businessenterprises (17 per cent) and retail trade (15 percent) (Chart III.2).
Box III.3: Major Differences between UCBs and SCBs in terms ofReserve Requirements and Credit Deployment
Cash Reserve Ratio (CRR): Till recently the scheduledUCBs needed to maintain CRR at 6 per cent of NDTL asagainst the requirement of SCBs to maintain 7.5 per centof NDTL. With effect from the fortnight begining November3, 2001, the CRR requirement is uniformly 5.75 per centof NDTL for both SCBs and scheduled UCBs and effectivefrom the fortnight begining December 29, 2001, the CRRrequirement will be uniformly 5.5 per cent for both.
Deployment of SLR: Commercial banks need to deploytheir SLR funds in the form of government and otherapproved securities. Subject to the deployment of aminimum portion of SLR fund in government/approvedsecurities, the UCBs can place the rest of SLR fund asdeposits with StCBs/CCBs. Though the scheduled UCBswould be brought out of the purview of this facility witheffect from April 1, 2003, non-scheduled UCBs wouldcontinue to enjoy this facility.
Interest on Deposits: In order to facilitate depositmobilisation by UCBs, they are allowed to offer higherinterest rates on savings and current accounts by 1.0 percent and 0.5 per cent, respectively, vis-à-vis thecommercial banks.
Entry Point Norms: The UCBs have much lower start-up capital requirements than the commercial banks entrycapital prescription.
Priority Sector Targets: UCBs need to deploy 60 per centof credit to the priority sector (of which 25 per cent shouldgo to weaker sections) as against 40 per cent prescriptionfor commercial banks.
Deployment of Funds: While the commercial banks candeploy up to 5 per cent of their outstanding loans andadvances to the equity market – either directly orindirectly, UCBs can grant loans to individuals againstsecurity of shares within the overall limit of 20 per centof owned fund of the bank, subject to certain parameters.There are also special restrictions on UCBs on lendingto non-banking financial companies.
Advances: UCBs can not extend unsecured credit beyondRs. 50,000 per borrower.
Reach: UCBs area of operation mostly confines to a singledistrict or the adjoining districts. Only UCBs with Rs.50 crore net owned fund or above can extend their areaof operation to the entire country.

81
Developments in Co-operative Banking
Weak Banks
3.13 Based on certain parameters of theirperformance, UCBs are classified into weak andstrong banks (Box III.4). There were 261 weakbanks as at end-June 2001.
Liquidation
3.14 On account of fragile financial position,orders were issued for liquidation of 15 UCBsbetween July 2000 and June 2001. As at end-June 2001, 118 UCBs were under liquidation.
Complaints and Frauds
3.15 Between July 1, 2000 and June 30, 2001,1,476 complaints were received against UCBs.
Furthermore, 149 cases of frauds involving Rs.27 crore were reported. All the complaints andfraud cases were investigated or taken up withthe concerned banks and the Registrar of Co-operative Socieities (RCS), wherever required,for necessary action.
Financial Performance of UCBs
3.16 At the end of March 2001, the number ofUCBs stood at 2,084 including 90 salary earners’banks. The latest information on major bankingaggregates on UCBs is available up to end-December 2000, encompassing 1,826 reportingUCBs, i.e., around 88 per cent of the total.1 Theoutstanding deposits of UCBs increased by 27.6
1 The numbers of reporting UCBs vary from year to year. Furthermore, during the same financial year, the banksreporting in terms of various indicators such as financial performance, NPAs, etc., are also not uniform.
Box III.4: Weak Urban Co-operative Banks
One of the most important requirements for theresilience of a financial system relates to its ability toidentify early warning signals on the financial healthof the constituent financial institutions. Once theweakness is identified, prompt corrective action needsto be initiated to improve the conditions of the affectedinstitutions on the one hand and on the other,immediate steps need to be initiated to contain thespread of weakness to other constituents throughinter- institutional exposure and other kinds ofinterdependence. Keeping these issues in view, theReserve Bank identifies weakness among the UCBsduring the statutory inspection or on annual reviewof bank’s financial results. An UCB is classified asweak bank, if:● the bank’s own funds are eroded to the extent of
25 per cent or more by unprovided for bad anddoubtful debts and other bad assets or its overduesexceed 50 per cent of the outstanding loans andadvances; and
● the bank does not comply with the provisionson minimum share capital set out in Section 11(1)of the B.R. Act, 1949 (AACS), i.e., if the real orexchangeable value of the paid-up share capitaland reserves of the bank has fallen below Rs. 1lakh.
Once a bank is identified as weak, it is advised todraw up a time bound action plan for revival. As perexist ing pol icy, i f a weak bank (a) is underrehabilitation programme for more than five years or(b) under rehabilitation programme for more than twoyears but does not show any perceptible indication ofbecoming viable, or (c) the bank fails to satisfy Section11 (1) of the B.R. Act, 1949 (AACS), then steps shouldbe taken for either merger of such banks with strongerbanks or their liquidation, as the case may be.
The HPC on UCBs (Chairman: Shri. K. Madhava Rao)observed that the present system for identification of
weak UCBs does not capture the incipient sickness ofUCBs. The Committee felt that under the presentcriterion, by the time sickness of a bank is identified,the concerned UCB has already reached the point of“no return”. Based on parameters such as capitaladequacy, non-performing assets and profitability, theCommittee recommended that UCBs, which are notstrong, should be classified into two groups-weak andsick (Recommendation II.(5) in Box III.2). Pertinently,the HPC recommended that if an UCB exhibits evenone of the three symptoms laid down to identify a weakbank, it should be classified as weak. Further, if thecondition of the UCB deteriorates even further in termsof either NPA or prof itabi l i ty along with capitaladequacy, then the UCB should be classified as sickas the interests of the depositors are endangered.
The HPC recommended that the weak banks themselvesshould draw up their revival package with the aid ofexperts. The Reserve Bank and the RCS should monitorthe implementation of the programme. The Committeesuggested that the sick UCBs should be liquidated ina time bound manner because functioning of a largenumber of financially weak banks is detrimental toboth the growth of UCBs and the interests of thedepositors. The Committee recommended that once anUCB is declared sick it should be put under moratorium.During the period of moratorium, the UCB shouldeither be reconstituted or amalgamated with anotherUCB failing which its licence should be cancelled.
The recommendations of the HPC on classificationof f inancial ly f ragi le UCBs into weak and s ickcategories have been accepted by the Reserve Bankand would come into effect from March 2002. Althoughthe recommendation of the HPC on placing the sickbanks under morator ium/l iquidat ion have beenaccepted in principle, the decision to wind up theoperations would be based on the merits of each case.

82
Report on Trend and Progress of Banking in India, 2000-01
per cent as at end-December 2000, while loansoutstanding increased by 26.2 per cent andowned fund increased by 23.2 per cent. Ownedfund and deposits remained the major sourceof funds for UCBs. Borrowings by UCBs haveincreased by 8.9 per cent during the period. Asat end-December 2000, the credit-deposit ratiowas at 64.6 per cent (Table III.1).
3.17 Information on the financial performanceof UCBs relating to profits/losses during 1999-2000 are available for 1,747 banks, which roughlycover 84 per cent of the total UCBs. Of theseUCBs 1,499 banks registered profits while therest incurred losses. Information on NPAs, forthe year ended March 31, 2000, has been reportedby 1,866 UCBs. The gross NPAs of the reportingUCBs as a percentage of total advances decreasedmarginally from 12.2 per cent as at end-March1999 to 12.1 per cent by end-March 2000 (TableIII.2).
Scheduled UCBs
3.18 As on March 31, 2000, there were 51scheduled UCBs and this number remainedunchanged on March 31, 2001. Total depositsand advances of the scheduled UCBs as at end-March 2001 were Rs. 33,164 crore and Rs.21,511 crore, respectively (Table III.3).
3.19 Between end-March 2000 and end-March2001, deposits increased by 17.7 per cent andformed 76.1 per cent of the total liabilities ofthe scheduled UCBs. The share of otherliabilities in the total liabilities of the scheduledUCBs at 10.4 per cent as at end-March 2001,declined by 2.9 percentage points over the yearwhile net reserves increased by 3.0 per cent.
Table III.2: Gross Non-Performing Assetsof Urban Co-operative Banks
As on Number of Gross NPAs
March 31 Reporting Amount Per centUCBs (Rs. crore) to Total
Advances
1 2 3 4
1997 1,318 2,839.04 13.2
1998 1,474 3,305.98 11.7
1999 1,748 4,534.60 12.2
2000 1,866 5,589.00 12.1
Note: Figures are provisional.
3.20 During 2000-01 (April-March) the shareof loans and advances in total assets of thescheduled UCBs increased by nearly 3percentage points to 49.3 per cent while theshare of investments remained almostunchanged (Table III.3).
Financial Performance of the Scheduled UCBs
3.21 The total income of the scheduled UCBsincreased by 17.2 per cent during the financialyear 2000-01. Interest income contributed 93.3per cent of the total income of the scheduledUCBs (Table III.4).
3.22 The total expenditure of the scheduledUCBs increased sharply by 49.7 per cent in2000-01. While the share of interest expendedin total expenditure reduced considerably by 13percentage points to 58.0 per cent and that ofoperating expenses declined by 5 percentagepoints to 14.8 per cent, the share of provisionsand contingencies to total expenditure
Table III.1: Variations in Major Aggregates of Urban Co-operative Banks (Per cent)
Item Financial Year April-June
1998-99 1999-2000 2000-01 * 1999** 2000**
1 2 3 4 5 6
Owned Funds 22.3 27.2 23.2 5.8 5.1
Deposits 29.5 35.1 27.6 6.9 1.1
Borrowings 17.5 41.7 8.9 -6.0 -0.9
Loans Outstanding 23.0 34.4 26.2 4.1 0.2
C.D. Ratio@ 65.0 64.6 64.6 63.3 64.0
* December 2000 over December 1999.** June over March.@ As at the end of period.

83
Developments in Co-operative Banking
increased by 18 percentage points during theyear (Table III.4).
3.23 During 2000-01, operating profit of thescheduled UCBs increased by 4.7 per cent, whilenet profit turned out negative mainly becauseof a single scheduled UCB which had to make
provisioning to the tune of Rs. 1,255 crore.Number-wise, 48 out of the 51 scheduled UCBsmade net profit during the year. As a percentageof total assets, the operating profit of thescheduled UCBs declined from 1.8 per cent in1999-2000 to 1.6 per cent in 2000-01 while thenet profit declined from 0.8 per cent in 1999-2000 to a negative 2.1 per cent in 2000-01. Aspercentage of total assets, provisions andcontingencies, other income and interestexpended of the scheduled UCBs increasedduring 2000-01, interest income, operatingexpenses and wage bill declined. The netinterest income to assets, measured as thedifference between interest income and interestexpended as a proportion of total assets, declinedfrom 3.2 per cent in 1999-2000 to 2.8 per centin 2000-01 (Table III.4). Bank-wise details onthe major f inancial performances of thescheduled UCBs have been given in AppendixTable III.4.
(b) State Co-operative Banks
3.24 The growth in deposits of the StCBsduring 2000-01 at 10.6 per cent was lower than14.6 per cent registered during 1999-2000.Growth in loans outstanding also deceleratedfrom 17.4 per cent to 16.9 per cent. The CD ratioimproved from 87.0 per cent to 91.9 per cent(Appendix Table III.1). At the all-India level, therecovery performance of the StCBs as apercentage to demand during 1999-2000improved to 83 per cent from 81 per centregistered during the previous year. StCBs inGujarat, Haryana, Karnataka, Kerala, MadhyaPradesh, Punjab, Rajasthan, Sikkim, TamilNadu and Uttar Pradesh achieved recovery ratesof 90 per cent and above during 1999-2000(Appendix Table III.2).
3.25 The details of assets and liabilities ofStCBs are currently available as at end-March2000. Deposits accounted for 62.1 per cent of thetotal liabilities followed by borrowing, whichaccounted for 22.8 per cent as at end-March2000. On the asset side, loans and advancesaccounted for 54.0 per cent of the total assets ofStCBs, while investments formed 32.3 per cent(Table III.5).
Financial Performance of StCBs
3.26 The total income of StCBs during 1999-2000 (April-March) grew by 17.6 per cent and
Table III.3: Composition of Liabilities andAssets of Scheduled Urban Co-operative Banks
(Rs. crore)
Item As on March 31 of
2000 2001
1 2 3
Liabilities
1. Capital 362.65 442.02
(1.0) (1.0)
2. Reserves 2,780.46 4,591.16
(7.5) (10.5)
3. Deposits 28,181.95 33,164.18
(76.3) (76.1)
4. Borrowings 673.93 885.19
(1.8) (2.0)
5. Other Liabilities 4,922.82 4,525.07
(13.3) (10.4)
Total Liabilities 36,921.81 43,607.62
(100.0) (100.0)
Assets
1. Cash 2,116.93 2,252.60
(5.7) (5.2)
2. Balances with Banks 2,503.12 2,558.35
(6.8) (5.9)
3. Money at call and 435.86 347.30
short notice (1.2) (0.8)
4. Investments 9,691.42 11,482.08
(26.2) (26.3)
5. Loans and Advances 17,286.89 21,510.94
(46.8) (49.3)
6. Other Assets 4,887.59 5,456.35
(13.2) (12.5)
Total Assets 36,921.81 43,607.62
(100.0) (100.0)
Notes: 1. Figures in brackets are percentages to totalliabilities/assets
2. For details see notes to Appendix Table III.4.3. Components may not add-up to the aggregates
due to rounding off.Source:Balance sheet of respective banks

84
Report on Trend and Progress of Banking in India, 2000-01
Table III.4: Financial Performance of Scheduled Urban Co-operative Banks
(Amount in Rs.crore)
Item 1999-2000 2000-01 Variation ofCol. (3) over Col. (2)
Absolute Percentage
1 2 3 4 5
A. Income 4,228.26 4,954.33 726.07 17.17
(i+ii) (100.00) (100.00)
i) Interest Income 3,957.81 4,619.95 662.14 16.73
(93.60) (93.25)
ii) Other Income 270.45 334.38 63.93 23.64
(6.40) (6.75)
B. Expenditure 3,918.16 5,864.85 1,946.69 49.68
(i+ii+iii) (100.00) (100.00)
i) Interest Expended 2,794.76 3,399.13 604.37 21.63
(71.33) (57.96)
ii) Provisions and Contingencies 348.93 1,600.22 1,251.29 358.61
(8.91) (27.28)
iii) Operating Expenses 774.47 865.50 91.03 11.75
(19.77) (14.76)
of which : Wage Bill 449.82 498.22 48.40 10.76
(11.48) (8.50)
C. Profit
i ) Operating Profit 659.03 689.70 30.67 4.65
i i ) Net Profit 310.10 -910.52 -1,220.62 -393.62
D. Total Assets 36,921.81 43,607.62 6,685.81 18.11
E. Financial Ratios (per cent) @
i) Operating Profit 1.78 1.58 -0.20 —
ii) Net Profit 0.84 -2.09 -2.93 —
iii) Income 11.45 11.36 -0.09 —
iv) Interest Income 10.72 10.59 -0.13 —
v) Other Income 0.73 0.77 0.03 —
vi) Expenditure 10.61 13.45 2.84 —
vii) Interest Expended 7.57 7.79 0.23 —
viii) Operating Expenses 2.10 1.98 -0.11 —
ix) Wage Bill 1.22 1.14 -0.08 —
x) Provisions and Contingencies 0.95 3.67 2.72 —
xi) Spread (Net Interest Income) 3.15 2.80 -0.35 —
@ Ratios to Total Assets.
Notes: 1. For details see notes to Appendix Table III.4.2. Figures in brackets are percentage shares to the respective total.3. Components may not add-up to the aggregate figures due to rounding off.
Source: Balance sheet of respective banks.

85
Developments in Co-operative Banking
expenditure by 11.2 per cent. The operating profitof StCBs increased by 77.0 per cent as againsta 14.3 per cent decline in 1998-99. Interestincome forming about 95 per cent of the totalincome increased by 16 per cent during the yearwhile “other income” with the relative share of5.2 per cent increased by about 57 per cent. Onthe expenditure side, interest expenditureaccounted for 78.7 per cent of the totalexpenditure of StCBs. As against the previous
Table III.5: Composition of Liabilities andAssets of State Co-operative Banks
(Rs. crore)
Item As on March 31
1999 2000 (P)
1 2 3
Liabilities
1 Capital 583.59 636.25
(1.40) (1.34)
2 Reserves 3,950.76 4,267.00
(9.46) (8.97)
3 Deposits 25,788.13 29,556.63
(61.78) (62.12)
4 Borrowings 9,739.00 10,858.76
(23.33) (22.82)
5 Other Liabilities 1,679.31 2,260.47
(4.02) (4.75)
Total Liabilities 41,740.79 47,579.11
(100.00) (100.00)
Assets
1 Cash and
Bank Balance 2,297.46 2,663.21
(5.50) (5.60)
2 Investments 13,011.34 15,342.78
(31.17) (32.25)
3 Loans and
Advances 21,909.33 25,708.95
(52.49) (54.03)
4 Other Assets 4,523.22 3,864.17
(10.84) (8.12)
Total Assets 41,741.35 47,579.11
(100.00) (100.00)
P Provisional.
Note: Figures in brackets are percentages to totalliabilities/assets.
Source: NABARD.
year, while the share of interest expenditurein total expenditure declined, those of provisionsand contingencies and operating expensesincreased. Almost the entire increase in theamount of operating expenses was due to theincrease in wage bill (Table III.6).
3.27 As a proportion of assets, operating profitsof StCBs increased to 1.68 per cent in 1999-2000from 1.08 per cent in 1998-99. The spread (netinterest income as a ratio to total assets) ofStCBs increased by 0.46 percentage points to1.92 per cent in 1999-2000 over the previousyear. In net terms, StCBs reaped positive returnof 0.31 per cent to total assets in 1999-2000 asagainst a negative return of 0.26 per cent in1998-99. While non-interest expenditure ofStCBs as a percentage of assets increased it wasmore than offset by the larger fall in the ratio ofinterest expenditure to total assets. Thiscoupled with increase in both interest and non-interest income, resulted in improvement inthe profitability of StCBs during 1999-2000(Table III.6).
(c) Central Co-operative Banks
3.28 Deposits of the CCBs during 2000-01(April-March) increased by 6.2 per cent asagainst 18.8 per cent growth registered in theprevious year. The growth in borrowings by theCCBs decelerated from 14.0 per cent to 8.0per cent. The loans issued in 2000-01 declinedby 3.3 per cent as against a growth of 14.8 percent in 1999-2000 (Appendix Table III.1). Therecovery performance of the CCBs deterioratedalbeit marginally from 70 per cent as at end-March 1999 to 69 per cent as at end-March 2000.Notwithstanding the overall trend, recoveries byCCBs in Himachal Pradesh and Madhya Pradeshimproved significantly during 1999-2000. InHaryana, Kerala, Punjab, Rajasthan, Tamil Naduand West Bengal, CCBs recovered more than 70per cent of their demand in 1998-99 as well as1999-2000 (Appendix Table III.2).
3.29 The latest information on the detailsrelating to the assets and liabilities of CCBs areavailable up to end-March 2000. On the liabilityside, deposits accounted for about two-thirds ofthe total liabilities of CCBs while the share ofborrowings in total liabilities was over 17 percent. On the asset side, loans and advancesaccounted for 52.6 per cent of the total assets

86
Report on Trend and Progress of Banking in India, 2000-01
Table III.6: Financial Performance of State Co-operative Banks
(Rs. crore)
Item 1998-99 1999-2000 Variation of
Col. (3) over Col. (2)
Absolute Percentage
1 2 3 4 5
A. Income (i+ii) 4,194.28 4,932.72 738.44 17.61
(100.00) (100.00)
i) Interest Income 4,031.94 4,678.08 646.14 16.03
(96.13) (94.84)
ii) Other Income 162.34 254.64 92.30 56.86
(3.87) (5.16)
B. Expenditure (i+ii+iii) 4,301.87 4,785.05 483.18 11.23
(100.00) (100.00)
i) Interest Expended 3,424.19 3,765.37 341.18 9.96
(79.60) (78.69)
ii) Provisions and Contingencies 558.25 650.18 91.93 16.47
(12.98) (13.59)
iii) Operating Expenses 319.43 369.50 50.07 15.67
(7.43) (7.72)
of which: Wage Bill 237.63 286.23 48.60 20.45
(5.52) (5.98)
C. Profit
i ) Operating Profit 450.66 797.85 347.19 77.04
i i ) Net Profit -107.59 147.67 255.26 -237.25
D. Total Assets 41,741.35 47,579.11 5,837.76 13.99
E. Financial Ratios (per cent) @
i) Operating Profit 1.08 1.68 0.60 —
ii) Net Profit -0.26 0.31 0.57 —
iii) Income 10.05 10.37 0.32 —
iv) Interest Income 9.66 9.83 0.17 —
v) Other Income 0.39 0.54 0.15 —
vi) Expenditure 10.31 10.06 -0.25 —
vii) Interest Expended 8.20 7.91 -0.29 —
viii) Operating Expenses 0.77 0.78 0.01 —
ix) Wage Bill 0.57 0.60 0.03 —
x) Provisions and Contingencies 1.34 1.37 0.03 —
xi) Spread (Net Interest Income) 1.46 1.92 0.46 —
@ Ratios to total Assets.
Note : Figures in brackets are percentage shares to the respective total.
Source : NABARD.

87
Developments in Co-operative Banking
and investments for 26.8 per cent. During 1999-2000, loans and advances and investments byCCBs increased by 19.5 per cent and 11.8 percent, respectively. The cash and bank balancewhich increased significantly by 34.1 per centduring 1999-2000, accounted for 9.0 per cent ofthe total assets of CCBs (Table III.7).
Financial Performance of CCBs
3.30 The income and expenditure of CCBsduring 1999-2000 increased by 16.0 per cent and17.4 per cent, respectively. The slower growthin income relative to expenditure resulted in anet loss of Rs. 67 crore for CCBs in 1999-2000as against a net profit of Rs. 39 crore during theprevious year. A part of the increasedexpenditure during 1999-2000 was on accountof the 28.8 per cent increase in provisions andcontingencies. The operating profit of CCBsduring 1999-2000 increased by 18.6 per centover the previous year. Interest income ofCCBs accounted for 94.8 per cent of the totalincome. Interest expenditure accounted foralmost two-thirds of the total expenditure ofCCBs during the last two years. There was adecline in the share of operating expenditureby about two-percentage points in totalexpenditure and one percentage point increasein the share of provisions and contingencies(Table III.8).
3.31 As a percentage of total assets, the netprofit of CCBs shifted to a marginal net loss of0.08 per cent in 1999-2000 from a small netprofit of 0.05 per cent in 1998-99. The operatingprofit as a percentage of assets, increased to1.62 from 1.60 per cent. As a percentage ofassets both components of income- interestincome and other income - were lower in 1999-2000 than in 1998-99. Expenditure alsodeclined marginally between these two years.Compared to the previous year, the spread ofCCBs decreased by 0.07 percentage points in1999-2000 (Table III.8).
(d) Primary Agricultural Credit Societies
3.32 It is the PACS which deal directly withthe individual farmers, provide short- andmedium-term credit, supply agricultural inputs,distribute consumer articles and also arrangefor marketing of produce of its members througha co-operative marketing society. As at end-
March 1999, there were approximately 92,000PACS with membership of more than 10 crore.The number of borrowing members is, however,much lower at 4.4 crore i.e. borrowing membersconstitute around 43 per cent of the totalmembers. The high level of overdues faced bymany PACS makes a large portion of themembers ineligible for fresh borrowings. As atend-March 1999, deposits mobilised by PACS at
Table III.7: Composition of Liabilitiesand Assets of Central Co–operative Banks
(Rs. crore)
Item As on March 31
1999 2000 (P)
1 2 3
Liabilities
1 Capital 2,511.00 2,826.00
(3.49) (3.34)
2 Reserves 6,197.00 7,208.00
(8.62) (8.51)
3 Deposits 45,536.00 54,195.00
(63.35) (64.02)
4 Borrowings 12,773.00 14,661.00
(17.77) (17.32)
5 Other Liabilities 4,860.00 5,764.00
(6.76) (6.81)
Total Liabilities 71,877.00 84,654.00
(100.00) (100.00)
Assets
1 Cash and
Bank Balance 5,678.00 7,613.00
(7.90) (8.99)
2 Investments 20,285.00 22,677.00
(28.22) (26.79)
3 Loans and
Advances 37,272.00 44,528.00
(51.86) (52.60)
4 Other Assets 8,642.00 9,836.00
(12.02) (11.62)
Total Assets 71,877.00 84,654.00
(100.00) (100.00)
P Provisional.
Notes: 1. Figures in brackets are percentages to totalliabilities/assets.
2. Profit and Loss credit balance, if any, includedunder Reserve.
Source : NABARD.

88
Report on Trend and Progress of Banking in India, 2000-01
Rs. 7,035 crore increased by 7.9 per cent asagainst an increase of around 15 per centregistered during the previous year. Most of thePACS are dependent on the finance provided byCCBs. In case the CCBs are weak, the PACS
are starved of finance, which affects theexpansion of both the credit and non-creditfunctions of PACS. The outstanding borrowingsof the PACS as at end-March 1999 at Rs. 16,924crore, however, was lower by a percentage point
Table III.8: Financial Performance of Central Co-operative Banks
(Rs. crore)
Variation ofCol. (3) over Col. (2)
Item 1998-99 1999-2000 (P) Absolute Percentage
1 2 3 4 5
A. Income (i+ii) 7,949.92 9,221.04 1,271.12 15.99
(100.00) (100.00)
i) Interest Income 7,465.04 8,744.46 1,279.42 17.14
(93.90) (94.83)
ii) Other Income 484.88 476.58 -8.30 -1.71
(6.10) (5.17)
B. Expenditure (i+ii+iii) 7,910.64 9,288.41 1,377.77 17.42
(100.00) (100.00)
i) Interest Expended 5,226.92 6,171.80 944.88 18.08
(66.07) (66.45)
ii) Provisions and Contingencies 1,113.80 1,434.57 320.77 28.80
(14.08) (15.44)
iii) Operating Expenses 1,569.92 1,682.04 112.12 7.14
(19.85) (18.11)
of which: Wage Bill 1,173.97 1,306.70 132.73 11.31
(14.84) (14.07)
C. Profit
i ) Operating Profit 1,153.08 1,367.20 214.12 18.57
i i ) Net Profit 39.28 -67.37 -106.65 -271.51
D. Total Assets 71,877.20 84,654.13 12,776.93 17.78
E. Financial Ratios (per cent) @
i) Operating Profit 1.60 1.62 0.01 —
ii) Net Profit 0.05 -0.08 -0.13 —
iii) Income 11.06 10.89 -0.17 —
iv) Interest Income 10.39 10.33 -0.06 —
v) Other Income 0.67 0.56 -0.11 —
vi) Expenditure 11.01 10.97 -0.03 —
vii) Interest Expended 7.27 7.29 0.02 —
viii) Operating Expenses 2.18 1.99 -0.20 —
ix) Wage Bill 1.63 1.54 -0.09 —
x) Provisions and Contingencies 1.55 1.69 0.15 —
xi) Spread (Net Interest Income) 3.11 3.04 -0.07 —
@-Ratio to total Assets.
Note: Figures in brackets are percentage shares to the respective total.
Source : NABARD.

89
Developments in Co-operative Banking
over that at end-March 1998. The loansoutstanding for PACS increased by 16.1 per centto reach Rs. 21,108 crore as at end-March 1999.
(e) State Co-operative Agriculture and RuralDevelopment Banks
3.33 With the exception of PACS, depositsconstitute the most important source of fundingfor short-term rural co-operative creditinstitutions. Even for the PACS, depositsaccount for nearly one-third of its totalliabilities. Long-term rural co-operative banks,on the other hand, are predominantly dependenton borrowings for their financial resources.Previously, SCARDBs were not allowed to raisepublic deposits but subject to certain conditions,they raise long-term public deposits. Thescheme, however, has not been very popular asyet. As at end-March 2001, deposits mobilisedby SCARDBs at Rs. 483 crore increased by 26.4per cent over end-March 2000. Borrowing at Rs.13,117 crore increased by 6.0 per cent as against11.9 per cent increase registered during theprevious year (Appendix Table III.1).
3.34 On the asset side, loans extended by theSCARDBs as at end-March 2001 at Rs. 2,524crore increased marginally by 0.8 per cent overthe previous year. Loans outstanding of theSCARDBs at end-March 2001 at Rs. 12,375 croreincreased by 6.7 per cent, over the year ascompared with 11.1 per cent increase during theprevious year. During 1999-2000, out of the 18reporting SCARDBs, 9 registered profit and 9others were in loss. As on March 31 2000 theaccumulated losses of SCARDBs stood at Rs. 779crore, constituting 6.3 per cent of the total loansoutstanding.
(f) Primary Co-operative Agriculture andRural Development Banks
3.35 As at end-March 2001, deposi tsmobil ised by PCARDBs at Rs. 302 croreincreased by 36.7 per cent as against 30.8per cent registered as at end-March 2000. Asin the case of SCARDBs, PCARDBs are heavilydependant on borrowing as their source offunds. Borrowings by PCARDBs, as at end-March 2001 at Rs. 8,208 crore increased by7.2 per cent as against an increase of 12.0 percent in 1999-2000.
3.36 Loans extended by PCARDBs at Rs. 1,754crore during 2000-01, declined by 3.7 per cent
as against an increase of 7.7 per cent registeredduring 1999-2000. Loans outstanding as at end-March 2001 at Rs. 8,070 crore increased by 6.2per cent as against 11.5 per cent during the yearended March 2000. As at end-March 2000,accumulated losses of the PCARDBs stood at Rs.891 crore.
2. Health Status of Rural Co-operatives
Non-Performing Assets
3.37 The asset qual i ty and recoverymechanism of the rural co-operatives have acrucial bearing on the viability of the overallcredit system and in particular the viability ofco-operat ive banks. Given the f inancialconstraints faced by the rural co-operativebanks, the Reserve Bank allowed such banksproviding short-term credit to implement theprovisioning norms in a phased manner till1999-2000. From 1999-2000, however, co-operative banks are required to maintain ageneral provision of at least 0.25 per centagainst standard assets. As at end-March 2000,the aggregate NPAs of StCBs estimated at Rs.2,758 crore accounted for 10.7 per cent of thetotal outstanding loans. Out of the total NPAs,around 45 per cent are sub-standard assets, 50per cent are doubtful assets and 5 per cent areloss assets (Table III.9). During 1999-2000, outof the 29 StCBs, 4 banks had NPAs below 5 percent of outstanding loans and advances, 10banks reported NPAs between 5 to 15 per centand 8 StCBs reported NPAs higher than 30 percent (Table III.10).
3.38 For CCBs, NPAs as at end-March 2000 atRs. 7,543 crore accounted for 17.2 per cent ofthe total outstanding loans. Sub-standard,doubtful and loss assets comprised 49 per cent,39 per cent and 12 per cent, respectively, of thetotal NPAs. For the SCARDBs, aggregate NPAsat Rs. 2,157 crore accounted for 18.7 per cent oftheir outstanding loans at end-March 2000.Among the PCARDBs, NPAs at Rs. 1,519 crorewere at 20.0 per cent of loans outstanding atend-March 2000 (Table III.9).
3.39 Co-operative banks extend credit directlyto the ultimate borrowers as well as to institutionsat the different tiers of the co-operative bankingstructure. A need has been felt to work out amutually agreed system of recovery whereby theproceeds of the settlement as well as the cost of

90
Report on Trend and Progress of Banking in India, 2000-01
recovery/losses would be shared by variousconcerned tiers of co-operative banks.Consequently, NABARD, in consultation with theReserve Bank has framed guidelines for one-timesettlement of chronic NPAs/overdues of the co-operative banks. The guidelines would cover NPAsunder all loans and advances and would remainoperative up to end-March 2002.
Capital Adequacy
3.40 All commercial banks are required tomaintain a minimum CRAR of 9 per cent. Thesenorms have not as yet been extended to ruralco-operative banks. The Task Force on co-operative banks (Chairman: Shri. JagdishCapoor), however, felt that being an importantpart of the rural credit system, co-operativebanks should also conform to the CRARstandards set for commercial banks albeit in aphased manner. These proposals have not as yetbeen implemented. The latest informationshows that as at end-March 1999, among thereporting StCBs, 22.2 per cent had negativeCRAR, 14.8 per cent had positive but less than8 per cent CRAR and the remaining 63.0 per centhad CRAR of more than 8 per cent.
Compliance with Section 11(1) of B.R. Act, 1949(AACS) - Position as on March 31, 2001
3.41 In terms of Section 11(1) of B.R. Act, 1949(AACS), CCBs and non-scheduled StCBs shouldhave minimum share capital of Rs.1 lakh each.The number of banks not complying with thisprovision has increased, especially after theintroduction of prudential norms. As on March31, 2001, 139 CCBs and 6 StCBs have defaultedin complying with the above provision. Inrespect of a majority of these banks, the erosionin the value of their assets was larger than theirowned funds. To address this issue, NABARDimpressed upon the respective StateGovernments to init iate measures l ikeaugmenting share capital base of these banks,helping them in their recovery efforts, etc. Tomaintain uninterrupted flow of credit in thearea of operation of the defaulting CCBs,NABARD continued to sanction short-term creditlimits on behalf of such banks, subject to certainconditions. Furthermore, in case of first-timedefault, CCBs continued to obtain access to creditlimits from NABARD for 2000-01 subject tocertain conditions.
3.42 The Board of Supervision (for StCBs/CCBs and RRBs) set up in NABARD as aCommittee of its Board of Directors to givedirection and guidance to NABARD insupervision-related matters, has beenreviewing the financial health of the co-operative banks, based on the inspectionfindings on an ongoing basis. The Board ofSupervision (BoS) has been, inter alia,
Table III.9: Composition of Gross NPAs(As on March 31, 2000)
(Rs. crore)
Asset Quality StCBs CCBs SCARDBs PCARDBs
1 2 3 4 5
SubstandardAssets 1,247.82 3,723.33 1,210.85 867.91
Doubtful Assets 1,373.95 2,918.85 937.49 613.97
Loss Assets 136.51 901.25 8.45 36.99
Total NPAs 2,758.28 7,543.43 2,156.79 1,518.87
Percentage of 10.73 17.15 18.66 19.98NPAs to loans andadvances outstanding
Source: NABARD.
Table III.10: Frequency Distribution of StCBs,CCBs & SCARDBs according to levels of
Gross NPAs(As on March 31, 2000)
NPAs as percentage Agencyto Outstanding Loansand Advances StCBs CCBs SCARDBs
1 2 3 4
0-5 4 (14) 42 (11) 4* (22)
5-10 4 (14) 52 (14) 0 (0)
10-15 6 (21) 43 (12) 1 (6)
15-20 2 (7) 55 (15) 2 (11)
20-25 3 (11) 39 (11) 2 (11)
25-30 1 (4) 26 (7) 1 (6)
Above 30 8 (29) 110 (30) 8 (44)
Total number ofreporting banks 28(100) 367(100) 18(100)
Total number ofbanks 29 367 19
* Haryana and Punjab SCARDBs have reported nilNPAs.
Note : 1. Figures in brackets represent percentage tototal number of reporting banks.
2. Corresponding figures for PCARDBs are notavailable.
Source: NABARD.

91
Developments in Co-operative Banking
discussing the financial position of the weak co-operative banks particularly those which havehad a high level of erosion in their deposits. Asper the decisions of the BoS, various preventive,revival and punitive measures in respect of thebanks which are showing signs of weaknesshave been initiated.
3. NABARD and its Role in Rural Credit
3.43 NABARD has been playing a pivotal rolein the channelisation of bank credit to the ruralsector. NABARD provides ref inance andaugments resource base of the institutionsproviding credit to the rural sector. NABARD alsoundertakes supervision of the rural co-operativebanks.
3.44 The focus of policy initiatives by NABARDduring 2000-01 continued to aim ataugmentation and smoothening of the groundlevel rural credit flows. Certain reorientationwas introduced in the lending and refinancepolicies to capture the changing financialrequirements of the varied segments of therural economy. NABARD enhanced the coverageof rural credit institutions by bringing in areasof non-traditional agriculture and new venturesin non-farm activities under their purview.Steps were also taken to restructure theinstitutional rural credit system in line withrecommendations of the Task Force on the co-operative credit system, 2000.
Resources Mobilised by NABARD
3.45 The net accret ion to resources o fNABARD during 2000-01 has been Rs. 5,449crore as compared with Rs. 4,381 crore in theprevious year (Table III.11). Out of the totalnet accret ion dur ing 2000-01, majorcontributions were by the Rural InfrastructureDevelopment Fund (RIDF) deposits (34 percent), National Rural Credit (Long TermOperations (NRC (LTO)) (21 per cent), reservesand surplus (6 per cent) and market borrowingthrough bonds and debentures (27 per cent).Between 1999-2000 and 2000-01, contributionof the borrowings from the Reserve Bank tonet resource accretion increased from 5 percent to 13 per cent.
Refinance from NABARD
3.46 The total outstanding refinance byNABARD increased sharply by 21.4 per cent from
Rs. 6,151 crore as at the end-June 2000 to Rs.7,464 crore as at end-March 2001 (Table III.12).The largest increase during 2000-01 (July-March) was in refinance to StCBs, whichincreased by 28 per cent. As regards, the termstructure of refinance provided by NABARDduring 2000-01 (July-March), 88 per cent was ofshort-term in nature. Of the short-term creditlimit sanctioned by NABARD, that to StCBs wasRs. 7,169 crore, of which seasonal agriculturaloperations (SAO) accounted for Rs. 6,400 crore.Similarly, of Rs. 1,312 crore credit limitsanctioned to Regional Rural Banks (RRBs) forshort-term purposes, SAO accounted for Rs. 1,114crore. Refinance availed by the banks in theNorth-Eastern region continued to be low despitecertain relaxation extended by NABARD inrespect of refinance support to co-operative banksin that region. NABARD sanctioned long-termloans to 12 State Governments aggregating Rs.68 crore during 2000-01 (July-March) forcontribution to the share capital of co-operativecredit institutions. The Task Force constituted
Table III.11: Net Accretion to the Resourcesof NABARD
(Rs. crore)
April-March
Item 1999-2000 2000-011 2 3
1 Capital 0 0
2 Advance received from
Reserve Bank and Central
Government towards Capital 0 0
3 Reserves and Surplus 128 311
4 NRC(LTO) Fund 1,021 1,151
5 NRC (Stabilisations) Fund 151 51
6 Deposits 41 -28
7 Bonds and Debentures 509 1,472
8 Borrowings from
Government of India -86 -20
9 Borrowings from
Reserve Bank 235 716
10 Short-term Borrowings 203 -203
11 Foreign Currency Loans -18 -9
12 RIDF Deposits 1,817 1,826
13 Other Liabilities 380 182
Total 4,381 5,449
Source: NABARD.

92
Report on Trend and Progress of Banking in India, 2000-01
to study the co-operative credit system hadrecommended that co-operatives should be self-reliant and member driven. NABARD asked theState Governments to reduce their participationin the capital of the co-operatives and thusreduce borrowing from NABARD for contributingto the share capital of co-operatives.
Rural Infrastructure Development Fund
3.47 RIDF was set up with NABARD under theinitiative of the Central Government in 1995-96 to provide loans to State Governments forfinancing rural infrastructure projects. Sincethen, six tranches of allocations have been madetowards the Fund and the Union Budget2001-02 has enhanced the allocations under the
VII tranche of the Fund. The commercial banksmake contributions towards the Fund inaccordance with the shortfall in their prioritysector lending. Since 1999-2000 (RIDF-V),the scope has been widened to enableuti l isat ion of loans by Panchayati Rajinstitutions, self-help groups, non-governmentorganisations, etc.
3.48 As at end-March 2001, the total corpus ofthe fund under the tranches I to VI of the RIDFaggregated to Rs. 18,000 crore. A furtherallocation of Rs. 5,000 crore as corpus of RIDF-VII has been announced in the Union Budget2001-02. During 2000-01, deposits mobilisedunder RIDF increased by Rs. 2,654 crore and thetotal deposit mobilisation between 1995-96 and
Table III.12: NABARD’s Credit to State Co-operative Banks, State Governmentsand Regional Rural Banks
(Rs. crore)
1999-2000 (July-June) 2000-2001 (July-March)
Category Limits Drawals Repay- Out- Limits Drawals Repay- Out-ments Standings ments Standings
1 2 3 4 5 6 7 8 9
1 State Co-operative Banks
a Short-term 6,962.16 7,938.51 7,852.68 4,141.05 7,168.96 6,299.16 5,026.51 5,413.70
(1.70) (3.90) (12.30) (2.10) (2.97) (-20.65) (-35.99) (30.73)
b Medium-term 193.92 52.15 188.31 351.59 267.37 110.13 127.01 334.71
(-54.90) (-85.10) (46.00) (27.90) (37.88) (111.18) (-32.55) (-4.80)
Total (a+b) 7,156.08 7,990.66 8,040.99 4,492.64 7,436.33 6,409.29 5,153.52 5,748.41
(1.60) (0.00) (12.90) (-1.10) (3.92) (-19.79) (-35.91) (27.95)
2 State Government
Long-term 91.07 48.78 40.16 507.90 67.78 58.23 66.78 499.35
(39.40) (19.40) (-28.90) (1.70) (-25.57) (19.37) (66.28) (-1.68)
3 Regional Rural Banks
a Short-term 1,202.95 1,097.97 1,149.17 1,085.28 1,312.33 938.28 850.65 1,172.91
(-2.80) (-5.50) (17.50) (-4.50) (9.09) (-14.54) (-25.98) (8.07)
b Medium-term 7.53 5.58 41.23 65.02 11.03 10.15 31.72 43.45
(-84.20) (-87.20) (-4.40) (-35.40) (46.48) (81.90) (-23.07) (-33.17)
Total (a+b) 1,210.48 1,103.55 1,190.40 1,150.30 1,323.36 948.43 882.37 1,216.36
(-5.90) (-8.40) (16.60) (-7.00) (9.33) (-14.06) (-25.88) (5.74)
Grand Total 8,457.63 9,142.99 9,271.55 6,150.84 8,827.47 7,415.95 6,102.67 7,464.12
(1+2+3) (-2.00) (-1.00) (13.10) (-2.00) (4.37) (-18.89) (-34.18) (21.35)
Note : Figures in brackets are percentage change over previous year.Source : NABARD.

93
Developments in Co-operative Banking
2000-01 stood at Rs. 8,698 crore (Table III.13).The cumulative amounts sanctioned anddisbursed under the different tranches till end-March 2001 were at Rs. 18,545 crore and Rs.9,251 crore, respectively (Table III.14).
3.49 Between end-March 2000 and end-March2001, the ratio of funds disbursed to fundssanctioned under RIDF increased from 43.6 percent to 49.9 per cent while utilisation ratio(amount disbursed as a proportion of amountphased) increased from 59.4 per cent to 64.4per cent. Notwithstanding these improvements,the ratio of disbursement to sanction and toutilisation under RIDF is not very high. Variousfactors have been attributed to explain thissituation, which include high interest cost offunds allocated through RIDF, lack of matchingfunds with State Governments and otherprocedural hardships. NABARD has initiatedseveral measures to make the loans under RIDFmore attractive and to increase the reach ofsuch loans. The interest rate on RIDF loans hasbeen reduced from 12.0 per cent to 11.5 per centper annum and further to 10.5 per cent. Apartfrom State Governments, other institutions andgroups such as Panchayati Raj institutions cannow implement RIDF projects. The scope of theprojects eligible for RIDF loans has beenenlarged to include innovative projects such asinformation technology enabled services andnew activities such as system improvement andmini hydel under power sector, construction ofprimary school buildings, primary healthcentres, etc.
3.50 Purpose-wise utilisation of RIDF fundsindicates high concentration towards irrigation
and rural connectivity, which together accountfor around 80 per cent of the aggregate sanctionstill end-March 2001 (Table III.15). State-wisedistribution of RIDF funds reflects that as at end-March 2001, f ive States namely AndhraPradesh, Gujarat, Madhya Pradesh, Maharashtraand Uttar Pradesh taken together accounted foraround 50 per cent of both aggregate sanctionsand disbursements (Appendix Table III.3).
Policy Initiatives by NABARD
Kisan Credit Card
3.51 KCC scheme introduced in 1998-99 ispopular among both farmers and issuingbankers. Farmers have the flexibility to availof production credit and also avoid proceduraldelays in getting credit sanctioned. For bankers,the need for repeated processing of creditapplications is avoided. Against the target of 75lakh KCC to be issued by banks in 2000-01, co-operative banks and RRBs issued 63 lakh KCCsinvolving a credit limit of Rs. 10,812 crore.Cumulatively since 1998, 102 lakh KCCsinvolving credit limits of Rs. 15,660 crore as atthe end of March 2001 were issued. 27 PublicSector Banks had issued 36 lakh KCCs as atthe end-of March 2001, since the inception ofthe Scheme. For 2001-02, the Union Budget hasannounced a target of an additional 1 crore KCCsto be issued by the banking system comprisingall co-operative banks, RRBs and commercialbanks. Furthermore, to ensure that small andmedium farmers are not denied access to KCCfacility, NABARD, in consultation with theReserve Bank dispensed with the floor limit ofRs. 5,000 earlier suggested for coverage under
Table III.13: Deposits Mobilised under RIDF(Rs. crore)
Year RIDF-I RIDF-II RIDF-III RIDF-IV RIDF-V RIDF-VI Total
1 2 3 4 5 6 7 8
1995-96 350 — — — — — 350
1996-97 842 200 — — — — 1,042
1997-98 188 670 149 — — — 1,007
1998-99 140 500 498 200 — — 1,338
1999-2000 67 539 797 605 300 — 2,307
2000-01 — 161 412 440 850 790 2,654
Total 1,587 2,070 1,856 1,245 1,150 790 8,698
Source: NABARD.
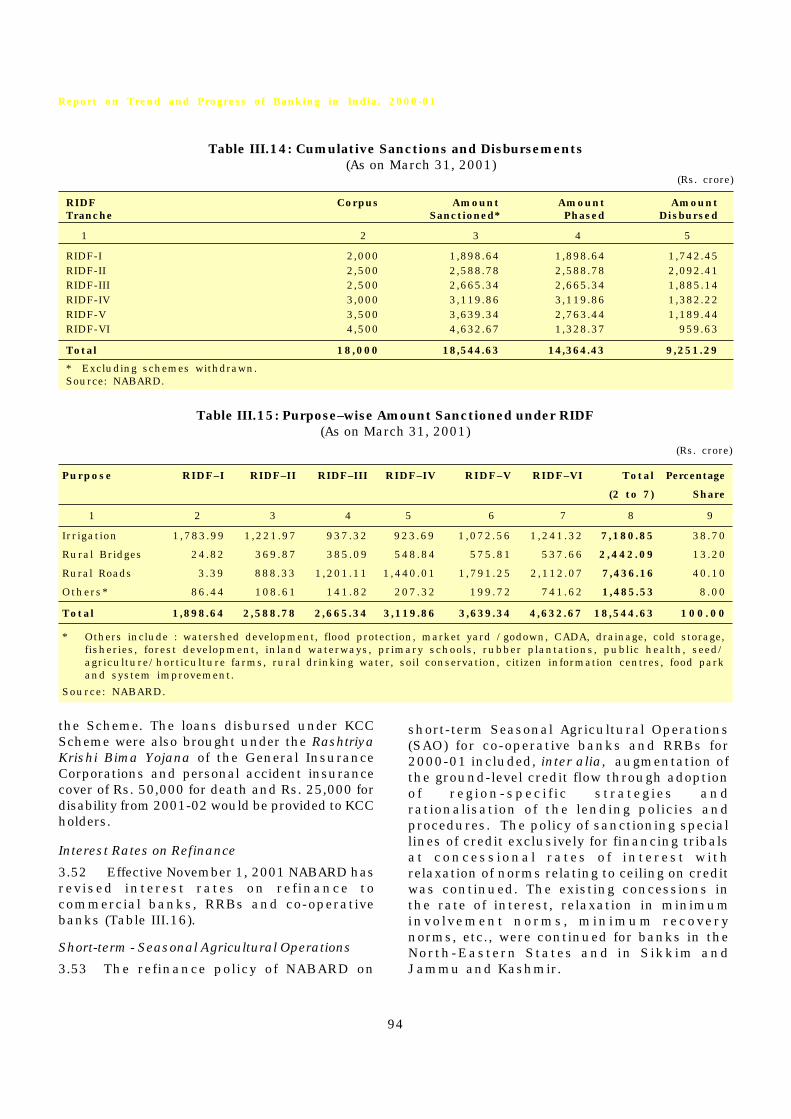
94
Report on Trend and Progress of Banking in India, 2000-01
short-term Seasonal Agricultural Operations(SAO) for co-operative banks and RRBs for2000-01 included, inter alia, augmentation ofthe ground-level credit flow through adoptionof reg ion-spec i f ic s trateg ies andrationalisation of the lending policies andprocedures. The policy of sanctioning speciallines of credit exclusively for financing tribalsat concess ional rates o f interest wi threlaxation of norms relating to ceiling on creditwas continued. The existing concessions inthe rate of interest, relaxation in minimuminvolvement norms, minimum recoverynorms, etc., were continued for banks in theNorth-Eastern States and in Sikkim andJammu and Kashmir.
the Scheme. The loans disbursed under KCCScheme were also brought under the RashtriyaKrishi Bima Yojana of the General InsuranceCorporations and personal accident insurancecover of Rs. 50,000 for death and Rs. 25,000 fordisability from 2001-02 would be provided to KCCholders.
Interest Rates on Refinance
3.52 Effective November 1, 2001 NABARD hasrevised interest rates on refinance tocommercial banks, RRBs and co-operativebanks (Table III.16).
Short-term - Seasonal Agricultural Operations
3.53 The refinance policy of NABARD on
Table III.14: Cumulative Sanctions and Disbursements (As on March 31, 2001)
(Rs. crore)
RIDF Corpus Amount Amount AmountTranche Sanctioned* Phased Disbursed
1 2 3 4 5
RIDF-I 2,000 1,898.64 1,898.64 1,742.45RIDF-II 2,500 2,588.78 2,588.78 2,092.41RIDF-III 2,500 2,665.34 2,665.34 1,885.14RIDF-IV 3,000 3,119.86 3,119.86 1,382.22RIDF-V 3,500 3,639.34 2,763.44 1,189.44RIDF-VI 4,500 4,632.67 1,328.37 959.63
Total 18,000 18,544.63 14,364.43 9,251.29
* Excluding schemes withdrawn.Source: NABARD.
Table III.15: Purpose–wise Amount Sanctioned under RIDF(As on March 31, 2001)
(Rs. crore)
Purpose RIDF–I RIDF–II RIDF–III RIDF–IV RIDF–V RIDF–VI Total Percentage
(2 to 7) Share
1 2 3 4 5 6 7 8 9
Irrigation 1,783.99 1,221.97 937.32 923.69 1,072.56 1,241.32 7,180.85 38.70
Rural Bridges 24.82 369.87 385.09 548.84 575.81 537.66 2,442.09 13.20
Rural Roads 3.39 888.33 1,201.11 1,440.01 1,791.25 2,112.07 7,436.16 40.10
Others* 86.44 108.61 141.82 207.32 199.72 741.62 1,485.53 8.00
Total 1,898.64 2,588.78 2,665.34 3,119.86 3,639.34 4,632.67 18,544.63 100.00
* Others include : watershed development, flood protection, market yard /godown, CADA, drainage, cold storage,fisheries, forest development, inland waterways, primary schools, rubber plantations, public health, seed/agriculture/horticulture farms, rural drinking water, soil conservation, citizen information centres, food parkand system improvement.
Source: NABARD.

95
Developments in Co-operative Banking
Short-term - Other than Seasonal AgriculturalOperations
3.54 With a view to boosting credit flow formarketing of crops and encouraging StCBs/CCBs to extend credit to farmers against thepledge of their agricultural produce, NABARDmodified the existing scheme for providingrefinance to StCBs/CCBs for f inancingmarketing of crops, by increasing quantum ofloans and reducing rate of interest on refinancefrom 10 per cent to 8.5 per cent. During 2000-01, NABARD opened a separate window ofrefinance for StCBs and scheduled commercialbanks for f inancing working capitalrequirements of State Handicrafts DevelopmentCorporations (SHnDCs). By supplementingbanks’ efforts in financing SHnDCs, NABARDaims at improving credit flow to handicrafts
sector especially to artisans and craftsmenoperating outside the co-operative fold.
Supervision
3.55 NABARD is the supervisory authority forStCBs, CCBs and certain other State-level co-operative institutions such as SCARDBs.Accordingly, NABARD undertakes periodic on-site inspection of these organisations and since1998-99 this has been supplemented by asystem of off-site surveillance. During 2000-01,NABARD inspected 175 co-operative banks - 11StCBs, 11 SCARDBs and 153 CCBs - and 11 apexinstitutions. Some of the deficiencies observedinclude high levels of NPAs and overdues, hightransaction costs, low margins, poor quality ofloan appraisals, inadequate internal checks andbalances, etc.
Table III.16: NABARD’s Interest Rate Structure on Term-Loan Refinance
(per cent per annum)
Rates Effective from
May 1, 2000 November 1, 2001
Loan Size Minor Purpose Minor PurposeIrrigation Other than Irrigation Other than
(MI*) MI@ (MI*) MI@
1 2 3 4 5
A. StCBs/ SCARDBsUpto Rs.25,000 7.0 7.0 7.0 7.0Rs.25,001 - Rs.2 lakh 8.5 9.0 8.0 9.0Above Rs.2 lakh 8.5 10.5 8.0 10.0
B. RRBsUpto Rs.25,000 7.5# 7.5# 7.5 7.5Rs.25,001 - Rs.2 lakh 8.5 9.0 8.0 9.0Above Rs.2 lakh 8.5 10.5 8.0 10.0
C. Commercial Banks/UCBsUpto Rs.25,000 8.5 8.5 8.0 8.0Rs.25,001 - Rs.2 lakh 8.5 9.5 8.0 9.0Above Rs.2 lakh 8.5 10.5 8.0 10.0
* Excludes MI under Swarnjayanti Gram Swarozgar Yojana for which rates shown under ‘others’ is applicable.@ Excludes MI/wasteland, SHGs, cold storage and storage of horticulture products under Government of India
capital investment subsidy scheme.# Effective July 1, 2001.Notes: (1) The rate of interest on refinance against loans extended to SHGs would be 7.0 per cent for co-operative
banks and 7.5 per cent for RRBs and commercial banks.(2) Rates of interest on refinance for financing cold storage and storage of horticulture produce under capital
investment subsidy scheme of the Government of India would be 8.5 per cent.(3) Rate of interest on refinance for rural housing finance for loans up to Rs. 50,000, Rs. 50,001 to Rs. 2 lakh
and above 2 lakh has been fixed at 8.5 per cent, 10.0 per cent and 10.5 per cent, respectively, effectiveNovember 1, 2001. Previously, the corresponding rates were 9.0 per cent, 10.5 per cent and 11.0 per cent,respectively.
(4) In respect of externally aided projects, the rate of interest as per provisions contained in the relative agreementwould apply.
Source: NABARD.
96
Report on Trend and Progress of Banking in India, 2000-01
Micro Finance Innovations
3.56 NABARD has been spearheading thepromotion and linkage of SHGs to the bankingsystems through refinance support, capacitybuilding of stakeholders and initiating otherproactive policies and systems. During 2000-01,1,70,680 SHGs were financed by banks including21,630 which received repeat finance, asagainst the target of 1,00,000 SHGs proposed inthe Union Budget, 2000-01. The cumulativenumber of SHGs credit-linked to the banksaggregated 2,63,825 out of which 2,13,213 wererefinanced by NABARD, as at end-March 2001.
3.57 The significant increase in the numberof SHGs linked during the year was possible dueto the active involvement of 1,030 NGOs, 314banks and many other agencies includingdevelopmental departments of different StateGovernments. The credit-linkage programmecovered 412 districts in 27 States and UnionTerritories. A notable feature of the same wasthat more than 90 per cent of the groups formedwere exclusively of women members.
3.58 NABARD continued to provide 100 percent refinance assistance to banks at aninterest rate of 7 per cent per annum forfinancing SHGs. During the year, an amount ofRs. 288 crore was disbursed to SHGs by variousbanking institutions against which refinancesupport by NABARD was to the tune of Rs. 251crore. Cumulatively, till end-March 2001, bankloans disbursed to SHGs aggregated Rs. 481 crorewhile NABARD refinance availed by banksaggregated Rs. 401 crore.
3.59 NABARD has also been providing grantson a selective basis to NGOs, primarily forpromoting and nurturing SHGs. NABARDsanctioned grant assistance of Rs. 2 crore to126 NGOs during 2000-01 for promotion and
l inkage of 20,033 SHGs. With this, thecumulative grant assistance sanctioned tillend-March 2001 for promotion and linkage ofSHGs aggregated Rs. 4.6 crore to 198 NGOs forpromoting 36,944 SHGs. Additionally, NABARDcontinued to provide financial and other typesof support for training of bank staff, NGOs andGovernment agencies engaged in the field ofmicro finance. During 2000-01, more than1,000 training and awareness programmeswere conducted or facilitated for training36,370 bank officials, NGOs and Governmentagencies.
3.60 As announced in the Union Budget 2000-01, a Micro Finance Development Fund (MFDF)has been constituted in NABARD with a start-up contribution of Rs. 100 crore comprising Rs.40 crore each from Reserve Bank and NABARDand balance Rs. 20 crore from select commercialbanks. This would be utilised for scaling up theSHG-linkage programme and supporting othermicro credit initiatives. Accordingly, both on-lending funds and capacity building supportwould be extended to eligible institutions fromthis Fund. Special emphasis will be provided forbuilding the capacities of the poor withparticular emphasis on vulnerable sectionsincluding women, scheduled tribes andscheduled castes.
Extension of Refinance Facilities toScheduled UCBs
3.61 In response to requests received forextending refinance facilities to UCBs andconsidering that UCBs are an importants egmen t o f t h e mu l t i - a g ency bank ingsystem, refinance facilities were extendedt o s c h e d u l e d U C B s b y N A B A R D f o rf i n a n c i n g b o t h f a r m a n d n o n - f a r mactivities in rural areas.
All-India financial institutions (FIs)1
constitute an important segment of the financialsystem, which cater to the medium, long-termfinancing and, of late, working capitalrequirements of varied sectors in the economy.In November 1994, the Board for FinancialSupervision (BFS) was constituted under theaegis of the Reserve Bank for comprehensiveand integrated regulation and supervision overthe commercial banks, FIs and non-bankingfinancial companies (NBFCs) under oneumbrella and the Reserve Bank of India (Boardfor Financial Supervision) Regulations wereframed. The BFS Regulation 5(1) specificallyprovides that the Board shall perform allfunctions and exercise the powers of supervisionand inspection in relation to different sectorsof the financial system such as bankingcompanies, FIs and NBFCs. In pursuance of theabove, select FIs2 have been brought under thesupervisory purview of the Reserve Bank. TheReserve Bank regulates and supervises theseinstitutions, keeping in view the need forenhancing the transparency in theirperformance and maintaining systemicstability. The supervision of all-India FIs by theReserve Bank is of recent origin. It may beemphasised that the scope and coverage of theFIs inspection are very limited unlike that ofNBFCs and are not as rigorous as that of banks.
4.2 FIs could be broadly categorised into all-India level financial institutions (AIFIs), state-level institutions and other institutions, withthe AIFIs being the most dominant in terms ofassets and range of operations (Chart IV.1). Theprogressive deregulation of financial markets,
the disintermediation pressures arisingtherefrom and the diversification in portfoliopreferences of investors have warranted growingsophistication and innovation in financialservices. These developments havenecessitated introduction of policy measures forgreater transparency in operations, bettermonitoring and more comprehensive regulation.In response to the same, the extant guidelinesin respect of prudential supervision andregulation of FIs have been reviewed and newguidelines have been introduced by the ReserveBank in various areas of operations of FIs.
4. 3 During the year 2000-01, financialassistance sanctioned and disbursed by AIFIsregistered an increase, though of a lower orderthan during the previous year. Sanctionsincreased by Rs. 16,437 crore (16.2 per cent),and disbursements by Rs. 4,934 crore (7.3 percent). During 1999-2000, sanctions hadincreased by 23.6 per cent and disbursementsby 20.1 per cent.
4. 4 Resource mobilisation3 by mutual fundsregistered a decl ine during 2000-01 ascompared with the previous year. Net resourcemobilisation by all mutual funds stood atRs.13,339 crore vis-à-vis Rs.19,953 croremobilised during 1999-2000.
1. Policy Developments Relating toSelect All India Financial Institutions
4.5 During the year 2000-01 (April-March),several policy initiatives were undertaken by theReserve Bank with regard to the regulation andsupervision of select all-India FIs. The chronology
1 Reserve Bank of India regulates and supervises only select All-India Financial Institutions and the same arecovered in this section, viz., Industrial Development Bank of India (IDBI), IFCI Ltd., ICICI Ltd., IndustrialInvestment Bank of India Ltd. (IIBI), Small Industries Development Bank of India (SIDBI), National Housing Bank(NHB), National Bank for Agriculture and Rural Development (NABARD), Export Import Bank of India (EXIMBank), Tourism Finance Corporation of India Ltd., (TFCI) and Infrastructure Development Finance Company Ltd.(IDFC). The Reserve Bank also calls for returns in respect of investment institutions viz., Unit Trust of India(UTI), Life Insurance Corporation of India (LIC) and General Insurance Corporation of India (GIC) and its erstwhilefour subsidiaries, but does not supervise or regulate these institutions.
2 These institutions are IDBI, ICICI Ltd., IFCI Ltd., IIBI Ltd., NABARD, NHB, EXIM Bank, TFCI, SIDBI and IDFC.
3 Net resource mobilisation equals inflows net of redemptions/repurchases.
Financial Institutions
Chapter IV

98
Report on Trend and Progress of Banking in India, 2000-01
of major policy measures pertaining to financialinstitutions is presented in Annexure. Thepol icy developments and review of theoperations of FIs are presented below.
Regulation of Financial Institutions
Prudential Norms relating to Income Recognition,Asset Classification, Provisioning and CapitalAdequacy
4.6 Select all-India FIs were advised on May5, 2000 that the provision for standard assetsneed not be netted from gross advances, but shownseparately as 'contingent provision againststandard assets' under 'other liabilities andprovisions' in the balance sheets. It was alsoindicated that the provision would not be eligiblefor inclusion in tier II capital and the provisionfor standard asset should not be reckoned forarriving at net NPAs. Subsequently, on October10, 2000, this stipulation was amended underwhich FIs were permitted to include the ‘generalprovision on standard assets’ in theirsupplementary (tier II) capital. It was alsostipulated that the provisions on standard assetsalong with other 'general provisions and lossreserves' should not exceed 1.25 per cent of thetotal risk-weighted assets. The comparitiveposition of FIs and banks with respect to selectregulatory parameters is given in Table IV.1.
Removal of ‘Past Due’ Concept
4.7 In view of the improvement in thepayment and settlement systems, the recoveryclimate, upgradation of technology in thefinancial system, etc., the Reserve Bank advisedFIs that the 'past due' concept (grace period of30 days) with regard to the definition of NPAs isdispensed with, effective from the year endedMarch 31, 2001. Accordingly, NPA should be anadvance where (i) interest remains overdue for aperiod of more than 180 days and/ or instalmentof principal remains overdue for a period of morethan 365 days in respect of a term loan; (ii) thebill remains overdue and unpaid for a period ofmore than 180 days in the case of bills purchasedand discounted; and (iii) any amount to be receivedremains overdue for a period of more than 180 daysin respect of other accounts.
Parity of NPA Norms for Banks and FIs
4.8 In order to bring parity in the NPA normsfor banks and FIs, it was clarified that an assetwould be treated as non-performing, if interestand/or instalment of principal remain overdue formore than 180 days with effect from the yearending March 31, 2002 as against the presentnorm of an overdue period of 365 days or more inrespect of principal and more than 180 days inrespect of interest.

99
Financial Institutions
Risk-Weight on Securities guaranteed by StateGovernments
4.9 The FIs were earlier required to assign100 per cent risk-weight on the investment inall the securities issued or guaranteed by theState Governments in case of default of interestor principal. Subsequently, FIs were advised onMay 30, 2000 that they would need to assign a100 per cent risk-weight only on those StateGovernment guaranteed securities which wereissued by the defaulting entities. It was alsoadvised that due regard should be paid to therecord of the particular State Government inhonouring its guarantees, while processing anyfurther request for loans to PSUs in that Stateon the strength of State Government guarantee.
Risk-weight for Market Risk in Investment Portfolioof non-Government Securities
4.10 In line with international best practices,some capital cushion needs to be provided formarket risk in addition to credit risk.Accordingly, FIs were required to assign a risk-weight of 2.5 per cent for market risk with effectfrom March 31, 2001 in respect of investmentsin all securities. This risk-weight would be inaddition to 20 per cent / 100 per cent risk-weightalready assigned for credit risk in non-government/non-approved securities.
Treatment of Restructured Accounts
4.11 The norms relating to restructuring /
rescheduling / re-negotiation of terms ofstandard and sub-standard loan assets, werereviewed in the light of international bestpractices and Bank for InternationalSettlements (BIS) guidelines, and revisedguidelines for FIs were issued on March 28, 2001.
4.12 In the context of restructuring ofaccounts, the stages at which restructuring /rescheduling /renegotiation of the terms of loanagreement could take place were identified as:
(a) prior to commencement of commercialproduction;
(b) after commencement of commercialproduction, but before the asset has beenclassified as sub-standard; and
(c) after commencement of commercialproduction and the asset has been classifiedas sub-standard.
4.13 The norms for treatment of the accounts,subjected to restructuring / rescheduling / re-negotiation of terms are detailed in Box IV.1.
Guidelines for Compromise Settlement of Dues ofBanks and FIs through Lok Adalats
4.14 To settle disputes involving smalleramounts through the forum of Lok Adalats, FIswere issued guidelines for implementation.These guidelines indicate the ceiling amountfor coverage of Lok Adalats upto Rs. 5 lakh,covering all NPA accounts, both suit filedand non-suit filed in the doubtful and loss
Box IV.1: Norms for Treatment of Restructured Accounts
(i) Treatment of Restructured Standard Accounts
a) Reschedul ing of instalments of pr incipalalone, at any of the first two stages would notcause a standard asset to be classified in thesub-standard category, provided the loan/credit facility is fully secured.
b) Rescheduling of interest element at any of thefirst two stages would not cause an asset tobe downgraded to sub-standard category,subject to the condition that the amount ofsacrifice, if any, in the element of interest,measured in present value (PV) terms, is eitherwritten off or provision is made to the extentof the sacrifice involved. For the purpose, thefuture interest due as per the original loanagreement in respect of an account should bediscounted to the present value at a rateappropriate to the risk category of the borrower(i.e., current PLR plus appropriate credit riskpremium for the borrower-category) and
compared with the present value of the duesexpected to be received under the restructuringpackage, discounted on the same basis.
c) In case there is a sacrifice involved in theamount of interest in present value terms, asat (b) above, the amount of sacrifice shouldeither be written off or provision made to theextent of sacrifice involved.
(ii) Treatment of Restructured Sub-standard Accounts
a) Rescheduling of the instalments of principalalone would render a sub-standard asseteligible to be continued in the sub-standardcategory for the specified period, provided theloan/credit facility is fully secured.
b) Reschedul ing o f interest e lement wouldrender a sub-standard asset eligible to becontinued to be classified in sub-standardcategory for the specified period subject to thecondition that the amount of sacrifice, if any,
(Contd.....)

100
Report on Trend and Progress of Banking in India, 2000-01
categories. Keeping in view certain essentialparameters, the settlement formula has been madeflexible and left to the discretion of the Board ofDirectors of FIs. The organisational arrangementscould be put in place in consultation with State /District/ Taluka level legal services authorities.
Disclosures in the Published Annual Report
4.15 In order to bring about uniformity in thedisclosure practices adopted by the FIs and with aview to improving the degree of transparency in
their affairs, FIs were advised to disclose certainimportant financial ratios/data with effect fromthe financial year 2000-01. Such disclosures wereto be made as part of the 'Notes on Accounts' to enablethe auditors to authenticate the information,notwithstanding the fact that the same informationmight be contained elsewhere in the publishedannual report. These disclosures pertain to capitalto risk-weighted assets ratio (CRAR)4, Core CRAR,supplementary CRAR, amount of subordinated debtraised/ outstanding as tier II capital, risk-weighted
in the element of interest, measured in PVterms, is either written off or provision ismade to the extent of the sacrifice involved.For the purpose, the future interest due asper the original loan agreement in respect ofan account should be discounted to thepresent value at a rate appropriate to the riskcategory of the borrower (i.e., current PLR plusappropriate credit r isk premium for theborrower-category) and compared with thepresent value of the dues expected to bereceived under the restructuring package,discounted on the same basis.
c) In case there is a sacrifice involved in theamount of interest in present value terms, asat (b) above, the amount of sacrifice shouldeither be written off or provision made to theextent of the sacrifice involved. Even in caseswhere the sacrifice is by way of write-off ofthe past interest dues, the asset shouldcontinue to be treated as sub-standard.
The sub-standard accounts at (a), (b) and (c) above,which have been subjected to restructuring, etc,whether in respect of principal, instalment or interestamount, by whatever modality, would be eligible tobe upgraded to the standard category only after thespecified period, i.e., a period of one year after thedate when first payment of interest or of principal,whichever is earlier, falls due, subject to satisfactoryperformance during the per iod. The amount ofprovision made earlier, net of the amount providedfor sacrifice in the interest amount in present valueterms as stated earlier, could also be reversed afterthe one-year period.
During this one-year period, the classification of thesub-standard asset would not deteriorate if the account
demonstrates satisfactory performance. However, iflack of satisfactory performance is evidenced duringthe one-year period, the asset classification of therestructured account would be governed as per theapplicable prudential norms with reference to the pre-restructuring payment schedule.
(i i i ) Restructuring of Doubtful/Loss Assets
The existing instructions relating to doubtful/lossassets which are subsequently classified, as sub-standard consequent to restructuring/ renegotiations/rescheduling will remain unchanged. Accordingly, thereversal of provisions made or amount written off tillthe asset becomes eligible to be classified as performingasset, will not be permitted as hitherto. Such sub-standard assets, i f subsequently subjected torestructuring/ renegotiations/ rescheduling, would begoverned by the above norms.
The foregoing norms for restructuring, etc., of standardand sub-standard assets are applicable, in supercessionof existing Reserve Bank norms, in respect of suchassets as long as these relate to restructuring/rescheduling / renegotiation of the loan agreementterms. FIs have the option to adopt the normssubsequent to date of issue of instruction, or earlierbut during the financial year 2000-01. All otherprudential guidelines relating to income recognition,asset classification and provisioning remain unaltered.
In addition to the existing disclosure requirements, asper Reserve Bank's guidelines, FIs have to separatelydisclose the total amount of those loans and the sub-standard assets, which have been subjected torestructuring, etc., in their published Annual Accounts.All standard and sub-standard accounts subjected torestructuring, etc., would continue to be eligible for freshfinancing of funding requirements, by lenders as pertheir normal policy parameters and eligibility criteria.
(.....Concld)
4 CRAR represents the amount of capital maintained in consonance with the risk-adjusted aggregate of funded and non-funded assets of a FI. The risk-adjusted asset is arrived at by multiplying each asset with its corresponding risk-weightin the case of funded assets. Conversion factors are assigned in case of non-funded assets apart from weights. CRARinclude core capital (tier-I) and supplementary capital (tier-II).
Core CRAR or tier-I capital includes paid-up capital, statutory reserves and other disclosed free reserves, if any.Balance if any of the special reserve created under Section 36 (1) (viii) of the Income Tax Act, 1961 is to be treated ascapital. Besides capital reserves, equity investment in subsidiaries, intangible assets, gap in provisioning and losses inthe current period and those brought forward from previous period will be deducted from tier-I capital. The core CRARshould not be less than 50 per cent of CRAR at any point of time.
Supplementary CRAR or tier-II capital includes undisclosed reserves and cumulative preference shares, revaluationreserves, general provisions and reserves, hybrid debt capital instruments, sub-ordinated debt. The supplementarycapital is limited to a maximum of 100 per cent of tier-I capital.

101
Financial Institutions
assets, share holding pattern, asset quality andcredit concentration, maturity pattern of rupee andforeign currency assets and liabilities, and detailson operating results. Besides, separate details onloan assets and sub-standard assets which havebeen subjected to restructuring, etc., would alsoneed to be disclosed. Furthermore, accountsrestructured under corporate debt restructuringsystem also should be disclosed by FIs in theirannual report as part of ‘notes on accounts’.
Excess of Provisions on Depreciation
4.16 FIs were advised on May 30, 2000 thatthe excess provision towards depreciation oninvestments in equity should be appropriated tothe 'Investment Fluctuation Reserve Account'(IFRA) instead of 'Capital Reserve Account'(CRA). This excess provision would be eligiblefor inclusion in tier II capital. The existingamount of such provisions held in CRA wouldalso stand transferred to IFRA. These amountsin IFRA could then be utilised to meet thedepreciation requirement on investments. Theextra provision needed in the event of adepreciation in the value of investments shouldhowever be debited to the profit and loss accountand if required, an equivalent amount may betransferred from the IFRA as a 'below the line'item after determining the profit for the year.
Raising of Resources by all-India FIs
4.17 In the context of progressivederegulation, introduction of Interest Rate Swaps(IRS)/ Floating Rate Agreements (FRA),introduction of Asset-Liability Management(ALM) system, shift in investors preferencetowards short-term instruments, etc., whichhave had a bearing on the resources raised byFIs, the guidelines for raising of resources byAIFIs were modified in June 2000. Under theguidelines, FIs need not seek the ReserveBank's issue-wise prior approval/ registrationfor raising resources through either public issueor private placement if (a) the minimummaturity period is 3 years, (b) where bonds havecall/ put or both options, the same is notexercisable before expiry of one year from dateof issue, (c) YTM offered at the time of issue ofbonds including instruments having call/putoptions, does not exceed 200 basis points overthat on government securities of equal residualmaturities, and (d) 'exit' option is not offeredprior to expiry of one year, from date of issue.
4.18 It was also stipulated that the outstandingtotal resources mobilised at any point of time byan individual FI including funds mobilised underthe 'umbrella limit' as prescribed by the ReserveBank should not exceed 10 times its net ownedfunds as per the latest audited balance sheet. FIswere advised that the limit fixed for raisingresources would be an enabling provision, andtheir requirements of resources along withmaturity structure and interest rate offeredthereon should be arrived on a realistic basis andderived, inter alia, from a sound system of ALM/risk management. In case of floating rate bonds,FIs would need to seek prior approval from theReserve Bank, with regard to 'reference rate'selected and the methods of floating ratedetermination. The same would not be requiredfor subsequent individual issues so long as theunderlying reference rate and method of floatingrate determination remain unchanged. FIs werealso advised to comply with the prudentialrequirements of other regulatory authoritiessuch as SEBI, etc., as hitherto.
4.19 A system of monthly reporting to theReserve Bank on raising of resources by FIs hasbeen introduced. The format of consolidatedreturn on raising of resources by way of moneymarket instruments and bonds was revised onDecember 5, 2000 to facilitate inclusion ofinformation on commercial paper and additionalinformation on short-term borrowings, whichhave been included under the one-time'umbrella limit'.
Rating for Public Deposits of FIs
4. 20 In order to improve the functionalefficiency of the market, the rating for the termdeposits accepted by FIs was made mandatory,effective November 1, 2000.
Repatriation of Global Depository Receipts (GDR)/American Depository Receipts (ADR) Proceeds
4. 21 Considering the fact that FIs, which areraising capital abroad for improving their capitalbase, have largely rupee-denominated assetsand that most of the risk limits are linked totheir capital, FIs were advised on July 20, 2000to repatriate the entire proceeds of GDRs / ADRssoon after the issue process was completed.
Classification and Valuation of Investments
4. 22 The FIs have been advised regarding

102
Report on Trend and Progress of Banking in India, 2000-01
classification and valuation of investments fromtime to time. In order to bring the existingpractice in consonance with the internationalpractice, revised guidelines effective from thehalf year ended March 31, 2001, were issued onNovember 9, 2000. These guidelines state that:
(a) FIs are required to classify entireinvestment portfolio as on March 31, 2001,under three categories viz., (i) Held to Maturity,(ii) Available for Sale and (iii) Held for Trading.Investments under (ii) and (iii) are to be markedto market as prescribed or at more frequentintervals, while those under 'Held to Maturity'need not be marked to market and should notexceed 25 per cent of total investments.
(b) Classif ication, valuation, shift ing ofinvestments among the three categories,methodology for booking profit/ loss on sale ofinvestments and provision for depreciationshould be in accordance with the newguidelines.
(c) Investments are to be classified as (i)Government securities (ii) other approvedsecurities (iii) shares (iv) debentures and bonds(v) subsidiaries / joint ventures and (vi) others(CPs, units of mutual funds, etc.).
4. 23 FIs were advised to formulate aninvestment policy with the approval of theirBoard of Directors tailored to the requirementsof classification, shifting and valuation ofinvestments under the revised guidelines. Thepolicy should also adequately address riskmanagement aspects and ensure that theprocedures being adopted by FIs are consistent,transparent and well-documented.
Supervision of Financial Institutions
On-site Inspection of FIs
4. 24 On-site inspection of FIs commencedsince 1995, with inspections being conductedevery alternate year. During the year 1999, itwas observed that the financial position ofcertain FIs was changing rapidly. Therefore, itwas decided that the inspection of all the FIswould be undertaken on an annual basis witheffect from March 31, 2001 with reference totheir balance sheet date from the accountingyear 2000-01 till the FIs could be systematicallydifferentiated as per the risk profile based onthe off-site surveil lance system and the
proposed supervisory rating system.Accordingly, the inspection of all 10 FIssupervised by the Reserve Bank is to be takenup during the inspection cycle 2001-02, withreference to the balance sheet date of the FIsfor accounting year 2000-01. During the year2000-01, inspection of nine FIs, which fell due,had been completed.
Off-site Monitoring / Information System
4. 25 As a part of the integrated supervisorystrategy, a Prudential Supervisory ReportingSystem (PSRS) for an on-going off-sitesurveillance was introduced in July 1999. Theprincipal objective of the process has been toobtain periodic information pertaining toprudential concerns of the Reserve Bank, withparticular reference to compliance with theprudential regulations prescribed for select FIssupervised by the Reserve Bank. An ancillaryobjective is to help build up the managementinformation system (MIS) within the FIs on theprudential parameters. The PSRS, patternedbroadly on lines of the off-site surveillancesystem comprises seven returns - threequarterly, two half yearly and two annual. Thereturns broadly cover assets and liabilities ofFIs, capital adequacy statement, operationalresults, asset quality, ownership andmanagement, large credit and l ist ofsubsidiaries and affiliates of the FIs.
Inspection Practices/ Procedures
4. 26 The Reserve Bank introduced changes inthe practices/procedures followed in conductingthe financial inspection of FIs since January24, 2001. The modified procedures comprise thefollowing: (a) the information requirements ofthe inspection team would be advised at least amonth prior to commencement of inspection toensure better time management and efficiencyof the examination process; and (b) before thecommencement of inspection, the managementof the FI would be requested to make apresentation to the inspection team on the FI'sperspective of its own risk exposures, themanner in which these risks were earlieraddressed and the future strategy thereon.
4. 27 During the inspection, the inspectionteam would meet with the internal and externalauditors to appreciate the scope of their workand the results of their audit. On completion ofinspection, the Principal Inspecting Officer,

103
Financial Institutions
along with his team members, as considerednecessary, would meet the Audit Committee asalso the chief executive officer (CEO) of the FIto discuss the major findings of the inspection.A system of discussing the provisioning-shortfall, owing to objective as well as subjectivefactors, by the inspection team with thestatutory/ external auditors in the presence ofthe management of the FIs, would also befollowed to enhance transparency and minimiseany element of subjectivity.
Other Developments
Co-ordination between Banks and
FIs on Issues of Common Interest
4. 28 With a view to securing more effectiveco-ordination between banks and FIs, whichjointly finance large-scale projects, on issuesof common interest, the Reserve Bank hadconvened an informal meeting of the Heads ofselect banks and FIs. Banks and FIs have sinceevolved ground rules for co-ordination on areasof mutual interest (Box IV. 2).
Valuation of Units of Mutual Funds
4. 29 FIs were advised in April 2000 to valuethe investments in mutual fund units at marketrates, as per stock exchange quotations, ifavailable. Otherwise, the latest net asset value(NAV) declared by the mutual fund in respect ofeach particular scheme should be used forvaluation. Subsequently, the guidelines forclassification and valuation of investments byFIs were revised with effect from March 31, 2001,so as to bring the norms in consonance withthe international best practices.
Interest Rate Surcharge on Import Finance
4. 30 In the context of developments in theforeign exchange markets and the overallmonetary and credit situation prevalent at thattime, with effect from May 2000, interest ratesurcharge of 50 per cent of the actual lendingrate on credit extended by FIs for imports, wasreintroduced as a temporary measure. Certainspecified categories of credit for import wereexempted from this levy. Subsequently, certaincategories of export-related imports were alsoexempted from this levy in November 2000.Subsequently, in January 2001, the interest ratesurcharge was withdrawn.
Interest on Overdue Export Bills
4. 31 The FIs were advised to charge interestat the rate of 25 per cent per annum (minimum)with effect from May 26, 2000 in respect ofoverdue export bills from the date the bills falldue for payment, and also to ensure that theexporters do not delay repatriation of exportproceeds beyond the due date.
Role of Brokers
4. 32 The FIs have been permitted toundertake transactions in securities amongthemselves or with banks and non-banks clientsthrough members of the National StockExchange (NSE) and OTCEI. Since November 22,2000, they have also been permitted toundertake transactions among themselves orwith non-bank clients through the members ofBombay Stock Exchange (BSE) directly, withoutengaging any brokers. In case any transactionin securities is not undertaken on NSE, OTCEIand BSE, the same should be undertakendirectly, without engaging any brokers.
Advances against Shares and Debentures
4. 33 In September 2000, the FIs wereinstructed that whenever the limits of advancesgranted to a borrower against the security ofshares / debentures exceed Rs. 10 lakh, itshould be ensured that the said shares/debentures are transferred in the name of theFI concerned. In this regard, SEBI amended theSEBI (Depositor ies and Part ic ipants)Regulations, 1996 to facil itate pledge ofdematerialised securities. In case of default bythe borrower, the FI could invoke the pledge,subject to the provis ions of the pledgedocuments, and the depository will register theFI as beneficial owner. Accordingly, FIs werepermitted to accept shares/ debentures heldin dematerialised form in addition to thephysical form.
Recovery of Dues in respect of NPAs
4. 34 In line with the guidelines issued topublic sector banks for recovery of dues relatingto NPAs, all Central Public financial Institutions(viz., IDBI, IFCI Ltd., IDFC Ltd., IIBI Ltd., TFCILtd., EXIM Bank, NABARD, SIDBI and NHB) wereadvised in July 2000 to implement the modifiedguidelines which provided a simplified, non-discretionary and non-discriminatory

104
Report on Trend and Progress of Banking in India, 2000-01
Box IV.2: Co-ordination Issues between Banks and Financial Institutions
In the context of transition of the banks and theall-India FIs from a regulated to a deregulated regime,the issue of effective co-ordination between banks andfinancial institutions has gained prominence. One ofthe common problems faced by banks and FIs in therecent years is the level of NPAs. In this context, ithas been increasingly recognised that one of thereasons for the rise in NPAs was lack of the requisiteco-ordination between banks and FIs, particularlywhere they are joint financiers of large value projects.
Such jointly financed projects also give rise to certainoperational issues which, can be better addressedthrough closer co-ordination between the two sets oflenders, viz., banks and FIs. Therefore, attention hasbeen focused on large projects jointly financed by banksand FIs, in order to eschew delays and facilitate bettersolutions to the common problems. In this regard,pursuant to the recommendations of the Working Groupon Harmonising the Role and Operations ofDevelopment Financial Institutions (DFIs) and Banks(Chairman: Shri. S.H. Khan), a Standing Co-ordinationCommittee was constituted in August 1999 under theaegis of IDBI, with representatives from select FIs andbanks. The Committee evolved certain ground rulesin the following areas for consideration and adoptionby banks and FIs.
1. Timeframe for Sanction of Facilities
a) In the cases where only two lenders are involved,any issue relating to sanction of facilities shouldbe resolved by mutual discussions between themwithin 60 days from the date of sanction by theLead.
b) In cases where more than two lenders wereinvolved, their agreement or disagreement forsanction of facilities must be conveyed by the Leadwithin 60 days from the date of receiving loanapplications, complete in all respects and by theother participating institutions within 60 days fromthe date of receipt of appraisal note from the Lead.
c) In cases of fresh loan proposals involving morethan two lenders, the sanction should be conveyedwithin a period of two months from the date ofthe appraisal note by the lenders which hadinitially agreed in-principle to participate in thefinancing and prima facie, rejection of the proposal,if any, should be conveyed within 30 days.
d) In case of accounts involving restructuring, thelead institutions should complete therestructuring process within three months fromthe date of receipt of complete proposal while the
other participating lenders should convey theirdecision within two months from the date ofreceipt of appraisal note.
2. Asset Classification across ConsortiumMembers
Normally banks and FIs may classify the accounts basedon their performance as per their books of accounts.In cases of restructured and consortium accounts, theclassification should be the same for all institutions/banks concerned.
3. Disciplining Borrowers - Change inManagement
The views of the majority of lenders in a consortium(say 70 per cent of total funded exposure), on aconsortium-specific basis, should be adopted in regardto changing the management of a defaulting borrowingunit. If 70 per cent majority of lenders (in terms oftheir funded exposures) agree to effect a change inthe management of the defaulting borrowal unit, or toconvert the loans to equity for subsequent off-loadingof the same to the highest bidder through auction,they should take such decisions on a consortium-specific basis. Such action should be taken in certainspeci f ic circumstances (e.g. where sickness wasinduced by the same promoters in several units) in atleast a few cases expeditiously in order to set adeterrent example in this regard.
4. Levy of Charges in Problem Accounts
While the consortium members should decide the rateof interest to be charged on borrowal accounts, thepenal interest or other punitive charges, if any, shouldnot exceed two percentage points above the contractedrate.
5. Group Approach for Borrowers
Normal funding requirements of the healthyperforming units belonging to a group should not behampered by adoption of group approach, unless thecompanies concerned are in defaulting list or thepromoters are non-co-operative.
6. Sharing of securities and cash flows
While it was agreed, in principle, to the propositionof the banks and FIs sharing securities and cash flowsin respect of consortium loans, it was felt that theexact modalities would need to be worked out.

105
Financial Institutions
Sr. Particulars Norms for BanksNo.
1 NPAs An asset shall be treated as a NPA when
(i) interest and/or instalment ofprincipal remain overdue for a periodof more than 180 days in respect of aterm loan;
(ii) the account remains out of order fora period of more than 180 days, inrespect of Overdraft/Cash Credit(OD/CC);
(iii) the bill remains overdue for a periodof more than 180 days in the case ofbills purchased and discounted;
(iv) interest and/or instalment of principalremains overdue for two harvestseasons; in respect of short-termagricultural loans for production andmarketing of seasonal agricultural cropssuch as paddy, wheat, oilseeds,sugarcane, etc.
(v) any amount to be received remainsoverdue for a period more than 180days in respect of other accounts;
The 90 day norm shall be adopted bybanks from the year ending March 31,2004.
Norms for FIs
An asset would be treated as NPA for thefollowing reasons:
(A) Record of recovery
(i) The change to 180 days for instalmentof principal/interest is applicable fromthe year ending March 31, 2002.
(ii) Not applicable.
(iii) A bi l l purchased/ discounted/rediscounted shall be treated as NPAif it remains overdue and unpaid for aperiod more than 180 days;
(iv) not applicable;
(v) Any other credit facil ity ( includingdeposits placed with the corporatesector or debentures subscribed forprivate placement basis) would need tobe treated as NPA, if any amount to bereceived in respect of that faci l i tyremain overdue for a period more than180 days.
(vi) Government guaranteed advances shallbe treated as NPAs only if concerned StateGovernment repudiates its guarantee.
The 90 day norm has not been madeapplicable to FIs.
(B) Time overrun
In case of the projects under implementation,an asset becomes NPA where the time overrunhas exceeded more than 50 per cent of thetime period initially contracted for completionof the project. Based on valid grounds,however, the Board of the FI can treat an assetas standard even if the time overrun has beenin excess of the above limit of 50 per cent andpass a resolution as what the permitted timeoverrun would be, but there can only be a onetime refixing of the time period of the project.
(C) Take over / OTS/Merger of units
(i) In case sick units (under nursingprogram or otherwise ) which are takenover by ‘standard’ category borrowers,the credit facilities extended to the
Table IV.1: Comparative Position of Banks and FIs withrespect to Select Regulatory Parameters (Contd.)

106
Report on Trend and Progress of Banking in India, 2000-01
2 Income AdvancesRecognition (i) The banks should not take to income
account, the interest on any NPA;
(ii) Interest on advances against termdeposits, National SavingsCertificates, Indira Vikas Patra, KisanVikas Patra, and Life policies may berecognised, provided adequate marginis available in the accounts;
(iii) If government guaranteed advancesbecome NPA, the interest on suchadvances should not be taken toincome account unless the interesthas been realised.
Investments
(i) Where interest/principal is inarrears, the banks should not reckonthe income on the securities.
(ii) Banks may book income on accrualbasis on securit ies of corporatebodies/public sector undertakings inrespect of which the payment ofinterest and repayment of principalhave been guaranteed by the CentralGovernment or a State Government,provided interest is serviced regularlyand as such is not in arrears.
(iii) Banks may book income fromdividend on shares of corporate bodieson accrual basis, provided dividend
transferee and the merged units arepermitted to be classified separately fornot more than three years from thedate of take over. Thereafter, theconduct of the faci l i t ies by thecombined entity determines the assetclassification.
(ii) In case of one time settlement (OTS)entered into between a FI and the newmanagement of a sick unit after itsmerger with a healthy unit, the assetsin respect of the merged (sick) unit arepermitted to be treated as standardwithout wait ing for the three yearperiod, if the payments are being madeas per the OTS scheme.
(iii) In case of reverse merger too, where asick unit takes over a healthy unit, therespective facilities of the two unitsare permitted to be classified separatelyfor a period of three years; thereafter,the performance of the combined entitydetermines the classification.
Advances(i) in respect of any NPA, the FI should not
take to interest income, fees or any othercharges unless actually realised.
(ii) Not applicable to FIs.
(iii) Same as in case of banks.
Investments
(i) Same as in case of banks.
(ii) Generally the same, except that the words‘public sector undertakings’ are notmentioned in case of FIs.
(iii) Same as in case of banks.
Sr. Particulars Norms for BanksNo.
Norms for FIs
Table IV.1: Comparative Position of Banks and FIs withrespect to Select Regulatory Parameters (Contd.)
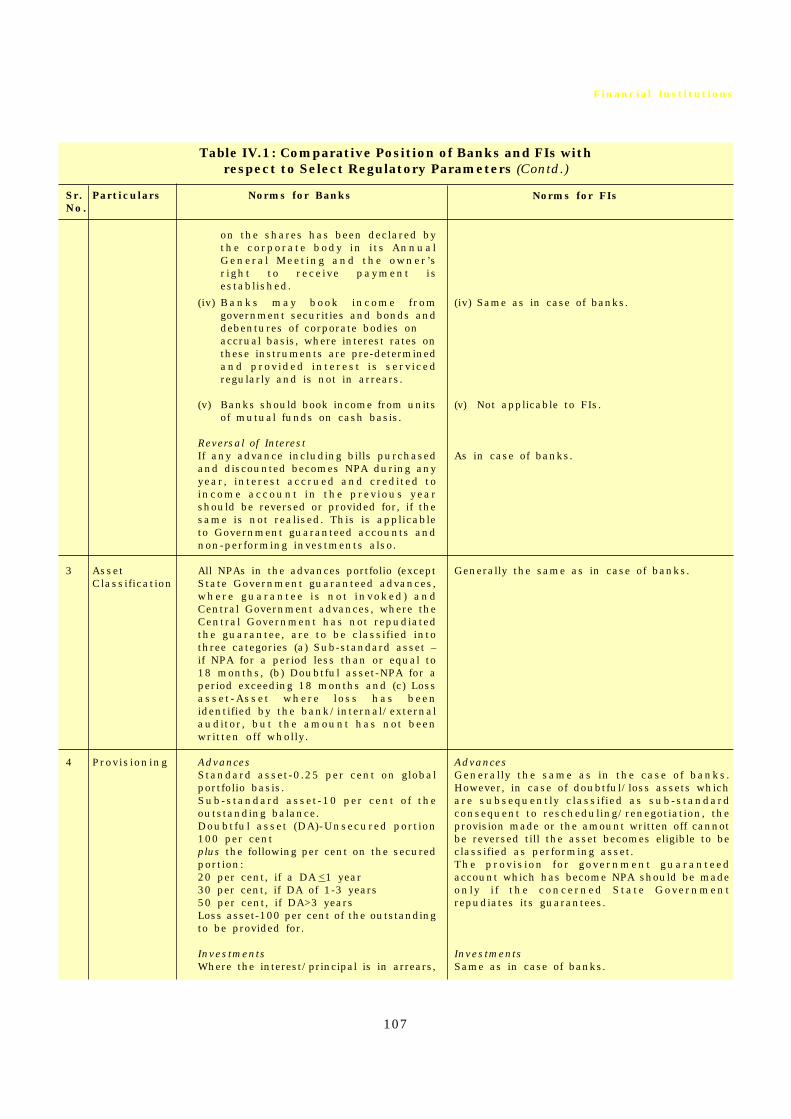
107
Financial Institutions
on the shares has been declared bythe corporate body in its AnnualGeneral Meeting and the owner ’sr ight to receive payment isestablished.
(iv) Banks may book income fromgovernment securities and bonds anddebentures of corporate bodies onaccrual basis, where interest rates onthese instruments are pre-determinedand provided interest is servicedregularly and is not in arrears.
(v) Banks should book income from unitsof mutual funds on cash basis.
Reversal of InterestIf any advance including bills purchasedand discounted becomes NPA during anyyear, interest accrued and credited toincome account in the previous yearshould be reversed or provided for, if thesame is not realised. This is applicableto Government guaranteed accounts andnon-performing investments also.
3 Asset All NPAs in the advances portfolio (exceptClassification State Government guaranteed advances,
where guarantee is not invoked) andCentral Government advances, where theCentral Government has not repudiatedthe guarantee, are to be classified intothree categories (a) Sub-standard asset –if NPA for a period less than or equal to18 months, (b) Doubtful asset-NPA for aperiod exceeding 18 months and (c) Lossasset-Asset where loss has beenidentified by the bank/internal/externalauditor, but the amount has not beenwritten off wholly.
4 Provisioning AdvancesStandard asset-0.25 per cent on globalportfolio basis.Sub-standard asset-10 per cent of theoutstanding balance.Doubtful asset (DA)-Unsecured portion100 per centplus the following per cent on the securedportion:20 per cent, if a DA <1 year30 per cent, if DA of 1-3 years50 per cent, if DA>3 yearsLoss asset-100 per cent of the outstandingto be provided for.
InvestmentsWhere the interest/principal is in arrears,
(iv) Same as in case of banks.
(v) Not applicable to FIs.
As in case of banks.
Generally the same as in case of banks.
AdvancesGenerally the same as in the case of banks.However, in case of doubtful/loss assets whichare subsequently classified as sub-standardconsequent to rescheduling/renegotiation, theprovision made or the amount written off cannotbe reversed till the asset becomes eligible to beclassified as performing asset.The provision for government guaranteedaccount which has become NPA should be madeonly i f the concerned State Governmentrepudiates its guarantees.
InvestmentsSame as in case of banks.
Sr. Particulars Norms for BanksNo.
Norms for FIs
Table IV.1: Comparative Position of Banks and FIs withrespect to Select Regulatory Parameters (Contd.)
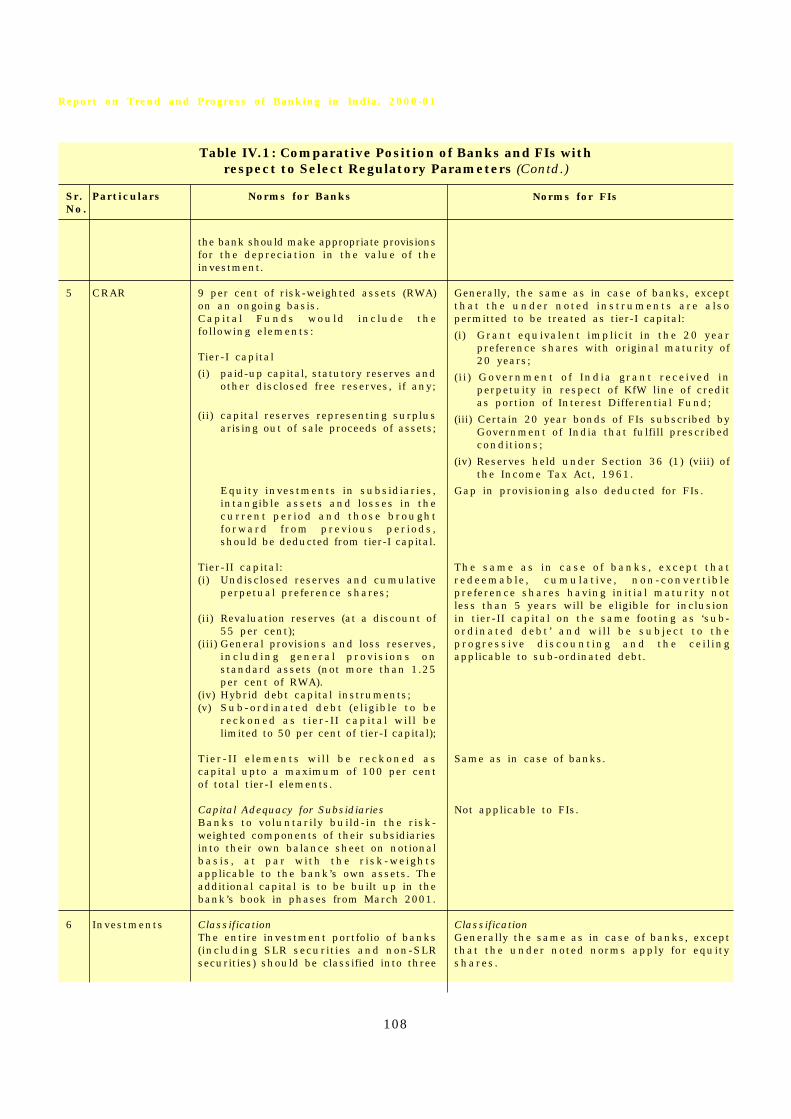
108
Report on Trend and Progress of Banking in India, 2000-01
the bank should make appropriate provisionsfor the depreciation in the value of theinvestment.
5 CRAR 9 per cent of risk-weighted assets (RWA)on an ongoing basis.Capital Funds would include thefollowing elements:
Tier-I capital
(i) paid-up capital, statutory reserves andother disclosed free reserves, if any;
(ii) capital reserves representing surplusarising out of sale proceeds of assets;
Equity investments in subsidiaries,intangible assets and losses in thecurrent period and those broughtforward from previous periods,should be deducted from tier-I capital.
Tier-II capital:(i) Undisclosed reserves and cumulative
perpetual preference shares;
(ii) Revaluation reserves (at a discount of55 per cent);
(iii) General provisions and loss reserves,including general provisions onstandard assets (not more than 1.25per cent of RWA).
(iv) Hybrid debt capital instruments;(v) Sub-ordinated debt (el igible to be
reckoned as tier-II capital wil l belimited to 50 per cent of tier-I capital);
Tier-I I e lements wil l be reckoned ascapital upto a maximum of 100 per centof total tier-I elements.
Capital Adequacy for SubsidiariesBanks to voluntarily build-in the risk-weighted components of their subsidiariesinto their own balance sheet on notionalbasis, at par with the r isk-weightsapplicable to the bank’s own assets. Theadditional capital is to be built up in thebank’s book in phases from March 2001.
6 Investments ClassificationThe entire investment portfolio of banks(including SLR securities and non-SLRsecurities) should be classified into three
Generally, the same as in case of banks, exceptthat the under noted instruments are alsopermitted to be treated as tier-I capital:
(i) Grant equivalent implicit in the 20 yearpreference shares with original maturity of20 years;
( i i ) Government of India grant received inperpetuity in respect of KfW line of creditas portion of Interest Differential Fund;
(iii) Certain 20 year bonds of FIs subscribed byGovernment of India that fulfill prescribedconditions;
(iv) Reserves held under Section 36 (1) (viii) ofthe Income Tax Act, 1961.
Gap in provisioning also deducted for FIs.
The same as in case of banks, except thatredeemable, cumulative, non-convert iblepreference shares having initial maturity notless than 5 years will be eligible for inclusionin tier-II capital on the same footing as ‘sub-ordinated debt ’ and wil l be subject to theprogressive discounting and the cei l ingapplicable to sub-ordinated debt.
Same as in case of banks.
Not applicable to FIs.
ClassificationGenerally the same as in case of banks, exceptthat the under noted norms apply for equityshares.
Sr. Particulars Norms for BanksNo.
Norms for FIs
Table IV.1: Comparative Position of Banks and FIs withrespect to Select Regulatory Parameters (Contd.)

109
Financial Institutions
categories, viz., Held to Maturity (HTM),Available for Sale (AFS) and Held forTrading (HFT) categories.Holding periodunder HFT not more than 90 days. Theinvestments under HTM should notexceed 25 per cent o f bank’s tota linvestments. Banks have the freedom todecide the extent of holdings under AFSand HFT categories.
ValuationHTM – not necessary, unless book valueis more than face value, in which casethe premium is to be amortised over theperiod remaining to maturity.AFS-annual or more frequent (netappreciation in each classification to beignored, net depreciation to be provided for).
HFT-monthly or more frequent (netappreciation and net depreciation can betaken to Profit and Loss account).
7 Exposure Norms The exposures to individual and groupborrowers are 20 per cent and 50 per centof the capital funds5, respectively; and60 per cent in case the exposure is oninfrastructure sector. The maximumexposure to (with ef fect from March2002)6:Individual borrowers-15 per cent ofcapital funds;Group borrowers-40 per cent of capitalfunds (can be exceeded by an additional10 per cent i f the exposure is forfinancing infrastructure projects alone).Components of exposure would comprise
Investments in equity shares as part of projectfinance are to be valued at cost for a period oftwo years after commencement of productionor five years after subscription, whichever isearl ier. In respect of other investments inequity shares, valuation may be done as permarket value which would be the market priceof the scrip as available from the trades/quoteson the s tock exchange . Those scr ips forwhich current quotation are not available orwhere the shares are not quoted on the stockexchanges, should be valued at break-up value(without considering revaluation reserves, ifany ) which is to be ascer ta ined f rom thecompany’s latest balance sheet (which shouldnot be more than one year prior to the date ofvaluation). In case the latest balance sheet isnot available, the shares are to be valued atrupee one per company.
Same as in case of banks, except (i) investmentexposure not reckoned for FIs, (ii) in respect ofterm loans, the exposure limit is reckoned onthe basis of undrawn commitments. In caseswhere disbursements are yet to commence,exposure l imit is reckoned on the basis ofsanctioned limit or the extent to which the FIshave entered into commitments with theborrowing companies in terms of agreements,as the case may be. In respect of all otherfacil it ies (other than term loans), exposurelimits shall continue to be reckoned on the basisof sanctioned limits or outstandings, whicheverare higher.
Sr. Particulars Norms for BanksNo.
Norms for FIs
Table IV.1: Comparative Position of Banks and FIs withrespect to Select Regulatory Parameters (Contd.)
5 Paid-up capital and free reserves as per latest published balance sheet.
6 The components of exposure are credit exposure (funded and non-funded credit limits) and investment exposure(underwriting and similar commitments). The sanctioned limits or outstandings, whichever is higher, shall bereckoned. In case of non-funded limits, only 50 per cent of such limits or outstandings, whichever is higher,may be taken into account.

110
Report on Trend and Progress of Banking in India, 2000-01
Sr. Particulars Norms for BanksNo.
Norms for FIs
Table IV.1: Comparative Position of Banks and FIs withrespect to Select Regulatory Parameters (Contd.)
100 per cent of funded and non-fundedexposure.With ef fect from Apri l 2003, forwardcontracts in foreign exchange and otherderivative products like currency swaps,options, etc., at their replacement costare to be included, while determiningexposure.Ceiling for investment in shares is 5 percent of bank’s total outstanding advancesas on March 31 of the previous year(including Commercial Paper).
8 Disclosure The fol lowing information is to beRequirements disclosed as ‘Notes on Accounts’ in the
balance sheet by public sector banks:
(i) Percentage shareholding of theGovernment of India;
(ii) Percentage of net NPA to netadvances;
(iii) Amount of provisions made towardsNPAs, depreciation in the value ofinvestment and income tax,separately;
(iv) capital adequacy ratio (tier-I and tier-II capital), separately;
(v) sub-ordinated debt raised as tier-IIcapital;
(vi) gross value of investments in andoutside India; aggregate ofprovisions for depreciation and netvalue of investments;
(vii ) interest income as percentage toaverage working funds;
(viii) non-interest income as percentageto average working fund;
(ix) Operating profit as percentage toaverage working fund;
(x) Return on Assets;
(xi) Business per employee;
(xii) Profit per employee;
(xi i i )Maturity pattern of loans andadvances;
(xiv) Maturity pattern of investments insecurities;
(xv) Foreign currency assets andliabilities;
(xvi) Movements in NPAs;
(xvii)Maturity pattern of deposits andborrowings;
(xviii)Lending to sensitive sectors.Additional disclosure in the ‘Notes onAccounts’ from the accounting year ended
Not applicable.
Generally the same as in case of banks, exceptthat items (i), (iii), (vi), (xi) and (xviii) are notapplicable to FIs.
i i i ) Same as banks. However, investmentsincludes only those items which are otherthan in the nature of an advance.
The undernoted additional disclosures havebeen prescribed for FIs.
(i) Risk-weighted assets-for on and off-balance sheet items separately;
(ii) The shareholding pattern as on the dateof the balance sheet;
(iii) Amount and percentage of net NPAs underprescribed asset classification categories;
(iv) Credit exposure as percentage to capitalfunds and as percentage to total assets,in respect of :
(a) the largest single borrower
(b) the largest borrower group
(c) the 10 largest single borrowers
(d) the 10 largest borrower groups
(v) Detai led disclosures on forward rateagreements and interest rate swaps.
(vi) Credit exposure to the five largest sectors/industries as percentage to total loan assets.

111
Financial Institutions
Sr. Particulars Norms for BanksNo.
Norms for FIs
Table IV.1: Comparative Position of Banks and FIs withrespect to Select Regulatory Parameters (Concld.)
mechanism for recovery of NPAs. Accordingly,notice was to be given by the FIs to eligibledefaulting borrowers to avail of the opportunity forone-time settlement of their outstanding dues byAugust 31, 2000 which was extended up toSeptember 30, 2000. The guidelines for settlementof the outstanding dues, which were initially to beoperational up to March 31, 2001, were later
extended up to June 30, 2001. All applicationsreceived by FIs up to June 30, 2001 were to beprocessed and decisions taken thereon at theearliest but not later than September 30, 2001.
Moving towards Pure Inter-bank Call Money Market
4. 35 At present, several non-bank FIs andmutual funds are permitted to lend directly in the
March 31, 2001(i) Treatment of restructured accounts;
(ii) Investment in shares etc:
(a) Investments in shares,(b) Investments in convertible
debentures, and,(c) units of equity oriented mutual
funds.Additional information in the ‘Notes onAccounts’ in the balance sheet from theaccounting year ending March 31, 2002:(i) Movement of provisions held
towards NPAs,(ii) Movement of provisions held
towards depreciation on invesments.
9 ALM Guidelines ALM guidelines were introduced for banksin February 1999. Banks were to ensurecoverage of 60 per cent of their liabilitiesand assets initially, and subsequentlycover 100 per cent of their business byApril 1, 2000.
The prudential norms prescribed are onlyfor negative liquidity mismatches in thefirst two time buckets (viz., 1-14 days and15-29 days) at 20 per cent each of thecash outflows in these time buckets.
10 Resource Not applicable for banks.Raising
ALM guidelines for FIs were issued in December1999 and implemented since April 2000. Theguidelines envisages preparation of periodicalLiquidity Gap Statement and Interest RateSensitivity statement in accordance with thedetailed prescriptions contained in the guidelines.
The prudential norms prescribed are only fornegative liquidity mismatches in the first twotime buckets (viz., 1-14 days and 15-29 days)at 10 per cent and 15 per cent of cash outflowsin these time buckets. The FIs are expected tofix their own prudential limits with the approvalof their Board/Asset Liability Committee (ALCO)for cumulative negative gaps. In the case ofinterest rate gaps, the Board/ALCO will haveto fix the prudential limits for each FI.
Regulation has been laid down regarding thetotal borrowing of the FI and the quantum ofresources they can raise through the umbrellalimit (i.e., term-money borrowings, certificateof deposits, term-deposits, inter-corporatedeposits and commercial paper). At present,their total borrowings are required to be withina cei l ing of 10 t imes of their NOF, whileborrowings through the aforesaid umbrella limitfor the said instruments are required to bewithin the ceiling of one time of their NOF.

112
Report on Trend and Progress of Banking in India, 2000-01
call/notice money market. Following therecommendations of the Committee on BankingSector Reforms (Chairman: Shri M.Narasimham),it was decided to move towards a pure inter-bank(including PDs) call/notice money market. Witha view to formulating a smooth phasing out ofthese institutions from the call/notice moneymarket, pursuant to the announcement in theMid-Term Review of October 2000, a TechnicalGroup, comprising representatives from ReserveBank, non-banks and banks was constituted. Inthe light of the recommendations of the Group andthe feedback received on the recommendations,the FIs participation in the call money marketwill be phased out in the following four stages:
a) In stage I, with effect from May 5, 2001 non-banks would be allowed to lend up to 85.0 per centof their average daily lending in call market during2000-01.
b) In stage II, with effect from the date ofoperationalisation of the Clearing Corporation,non-banks would be allowed to lend up to 70.0 percent of their average daily lending in call marketduring 2000-01.
c) In stage III, with effect from three monthsafter stage II, access of non-banks to call/noticemoney market would be equivalent to 40.0 percent of their average daily lending in call marketduring 2000-01.
d) In stage IV, with effect from three monthsafter stage III, access of non-banks to call/noticemoney market would be equivalent to 10.0 percent of their average daily lending in call marketduring 2000-01.
4. 36 From a date to be notified by the ReserveBank, after the on-set of stage IV, non-banks willnot be permitted to lend in call/notice money market.
4. 37 In view of the above, FIs were advised onApril 21, 2001 to submit a daily return in aprescribed format to facilitate monitoring oftheir operations in the call/notice moneymarket on a daily basis.
2. Financial Assets of FinancialInstitutions
4. 38 During 2000-01, the aggregate financialassets of banks and FIs grew by 14.4 per centcompared with the growth of 15.3 per centrecorded in the previous year [Appendix Table
IV.1(A)]. The financial assets of FIs grew at alower rate of 7.8 per cent in 2000-01 than 12.7per cent in 1999-2000 (and 15.1 per cent in1998-99). Consequently, the share of FIs in theaggregate financial assets of FIs and bankstaken together moved down from 36.1 per centin 1999-2000 to 34.0 per cent in 2000-01(Chart IV.2).
4.39 At the disaggregated level, the financialassets of all-India term lending institutionsrecorded a growth of 6.6 per cent in 2000-01 ascompared with 9.5 per cent in 1999-2000[Appendix Table IV.1(B)] . Among theseinstitutions, during 2000-01, the financialassets of NABARD recorded the highest growth(16.2 per cent) followed by ICICI (12.5 per cent).The financial assets of IDBI and IFCI declinedby 0.8 per cent and 3.0 per cent, respectively,in 2000-01. Among the investment institutions,the financial assets of all the three institutionswitnessed lower increase in 2000-01 than inthe previous year (Chart IV.3).
3. Term-Lending and InvestmentInstitutions
Financial Assistance
4. 40 During 2000-01, financial assistancesanctioned and disbursed by AIFIs stood atRs.1,17,667 crore and Rs.72,528 crore,respectively. Sanctions increased by 16.2 percent and disbursements by 7.3 per centrespectively, as compared with 23.6 per cent and20.1 per cent, respectively, during 1999-2000(Appendix Table IV.2 and Chart IV.3). All-Indiadevelopment banks’ (AIDBs) sanctions grew by16.7 per cent and disbursements by 9.2 per cent,during 2000-01. Special ised f inancialinstitutions (viz., IFCI Venture Capital FundsLtd., ICICI Venture and TFCI) witnessed amarginal decline in disbursements to Rs.254crore from Rs.260 crore even as their sanctionsincreased by 37.7 per cent to Rs.339 crore.Disbursements by investment institutions alsodeclined marginally to Rs.12,694 crore (fromRs.12,764 crore in 1999-2000), while theirsanctions increased by 13.2 per cent toRs.17,900 crore.
4. 41 Disbursements by ICICI witnessed asignificant increase both in 1999-2000 and2000-01 and accounted for 62.0 per cent of thedisbursements by three major f i n a n c i a l

113
Financial Institutions
institutions in 2000-01. The share ofdisbursements by IDBI, on the other hand,declined from 37.6 per cent in 1998-99 to 33.9per cent in 2000-01 (Table IV.2).
Trend in Assets and Liabilities of FinancialInstitutions
4. 42 During 2000-01, the total assets/liabilities of AIFIs showed a growth rate of 6.2
per cent as compared with 8.5 per cent in theprevious year (Appendix Table IV.3).
4. 43 The composition of liabilities displayeda movement away from borrowings and towardsdebt in the form of bonds and debentures anddeposits. External sources continued to be theimportant source of finance for FIs, constituting80.9 per cent of the total resource base, whilecapital and reserves constituted the remaining
Table IV.2: Disbursements of Major Financial Institutions
(Rs. crore)
Year / Institution 1998-99 1999-2000 2000-01 Percentage variation
(Provisional) (Provisional)
Amount Per Amount Per Amount Per Col. (4) Col. (6)cent cent cent over over
Share Share Share Col.(2) Col.(4)
1 2 3 4 5 6 7 8 9
Disbursements
i) IDBI 14,470.1 37.6 17,059.4 37.0 17,498.3 33.9 17.9 2.6
ii) ICICI 19,225.1 49.9 25,835.7 55.9 31,964.6 62.0 34.4 23.7
iii) IFCI 4,819.3 12.5 3,272.1 7.1 2,120.9 4.1 -32.1 -35.2
A. Total 38,514.5 100.0 46,167.2 100.0 51,583.8 100.0 19.9 11.7
(i+ii+iii)
B. AIFIs 56,296.0 67,594.1 72,528.2 20.1 7.3
C. A as per cent of B 68.4 68.3 71.1

114
Report on Trend and Progress of Banking in India, 2000-01
19.1 per cent. Funds raised through bonds anddebentures comprised 50.9 per cent of the totalliabilities as at end-March 2001 [Chart IV.4 (A)].
4. 44 Loans and advances constituted themajor item (72.9 per cent) on the asset sideof the balance sheet of FIs, and posted a growthof 7.5 per cent during the year ended March2001. While cash and bank balances increasedby 6.9 per cent, investments posted a rise of3.4 per cent as at the end of March 2001 [ChartIV.4 (B)].
Sources and Uses of Funds of FinancialInstitutions
4. 45 During 2000-01 (April-March), internalsources as a proportion of total sourcesconstituted 51.1 per cent as against 50.2 percent during the preceding year. The share ofexternal sources amounted to 29.5 per cent asagainst 27.1 per cent during 1999-2000. Theshare of 'other sources' of funds (which includesinterest/dividends received, etc.,) declined to19.4 per cent from 22.7 per cent (Appendix TableIV.4 and Chart IV.5(A)).
4. 46 On the uses side, fresh deployments asa proportion of total uses declined marginallyfrom 55.6 per cent during the year 1999-2000(April-March) to 55.1 per cent, while the shareof repayments of past borrowings increased from17.9 per cent to 18.5 per cent in 2000-01. The
share of 'other deployments', declined marginallyfrom 26.5 per cent in 1999-2000 to 26.4 per centin 2000-01, of which the interest paymentscomponent has also increased marginally from13.6 per cent in 1999-2000 to 13.9 per cent in2000-01 as evidenced from Appendix Table IV.5and Chart IV.5 (B).
Financial Performance of Select all-India FinancialInstitutions
4. 47 The profitability analysis of the 10 FIsindicates that the combined net profits of theseinstitutions registered a decline of 35.1 per centduring the year 2000-01. With incomeincreasing by 6.0 per cent and expenditure bymore than 12.0 per cent, net profits of FIsshowed a decline. The spread (net interestincome) of FIs as a ratio of total assets declinedfrom 1.69 per cent in 1999-2000 to 1.61 per centin 2000-01 (Table IV.3).
4. 48 Among the major financial institutions(IDBI, ICICI and IFCI), both IDBI and IFCIwitnessed a decline in their income during theyear 2000-01, reflecting primarily a fall ininterest income (in case of IDBI) and a sharpdrop in other income (in case of IFCI). However,the rise in expenditure was more pronouncedin case of all the three institutions, the largestincrease being in the case of ICICI, whichrecorded a rise of 20.7 per cent in 2000-01 dueprimarily to a rise in provisions. Consequently,

115
Financial Institutions
the net profits of IDBI and ICICI posted declinesduring the year 2000-01, while IFCI posted a netloss (Appendix Table IV.5).
4. 49 As a move towards greater disclosure, FIshave been advised to disclose, among otherparameters, certain operating ratios in theiraudited balance sheet from the year 2000-01(Appendix Table IV.6). These ratios reveal that,among the select financial institutions regulatedand supervised by the Reserve Bank, IFCI has anegative return on assets and net loss peremployee.
Prime Lending Rates of FIs
4. 50 There has been a general downwardmovement in interest rates over the periodJanuary 2001 to July 2001(Table IV.4). The long-term PLR (LTPLR) of IDBI declined from 14.0 percent in January 2001 to 13.5 per cent in July 2001,and that of ICICI from 13.0 per cent to 12.5 percent. The LTPLR of IFCI remained at 13.0 per centduring this period. The medium-term PLR (MTPLR)and short-term PLR (STPLR) of these institutionshave also recorded concomitant declines.
Resources Raised by Major FinancialInstitutions
4. 51 During the year 2000-01 (April-March), totalresources mobilised by three major all-India FIsby way of issue of bonds (both public issue of bonds/
debentures as well as private placements)aggregated Rs. 18,867 crore (Table IV.5). Thisamount was higher than Rs.16,312 crore raisedduring 1999-2000, but lower than Rs.29,037 croreraised during 1998-99. Of the total resourcesraised during the year 2000-01, Rs.14,806 crore(78.5 per cent) was raised through privateplacements, whereas the remaining amount wasraised through public issues. Institution-wise,ICICI raised the maximum amount of Rs.10,677crore (56.6 per cent of the total resources raised),whereas IDBI and IFCI raised Rs. 5,481 crore andRs. 2,709 crore, respectively. ICICI raised Rs. 7,776crore through private placements, whereas IFCImobilised the entire amount through the privateplacement route.
FIs' Money Market Operations
4. 52 FIs are allowed to participate in the call/notice money market as lenders (which iscurrently being phased out) and borrow the fundsby way of term money with the maturity range ofthree to six months within the umbrella limitprescribed for the individual FIs. Investmentinstitutions, viz., UTI, LIC and GIC are at presentallowed to participate in the call/notice moneymarket as lenders only.
4. 53 During the year 2000-01 (April-March),the average quarterly outstanding borrowing by

116
Report on Trend and Progress of Banking in India, 2000-01
Table IV.3 : Financial Performance of Select Financial Institutions*
(Rs. crore)
Item 1999–2000 2000–01 Variation of Col. (3)over Col. (2)
Absolute Percentage
1 2 3 4 5
A. Income 24,410.41 25,867.15 1,456.74 5.97
(i+ii) (100.00) (100.00)i) Interest Income 22,152.18 23,519.05 1,366.87 6.17
(90.75) (90.92)ii) Other Income 2,258.23 2,348.10 89.87 3.98
(9.25) (9.08)
B. Expenditure 21,147.73 23,748.09 2,600.36 12.30
(i+ii+iii) (100.00) (100.00)i) Interest Expended 18,244.60 19,567.24 1,322.64 7.25
(86.27) (82.40)ii) Provisions 686.64 1,578.77 892.13 129.93
(3.25) (6.65)iii) Other Expenses 2,216.49 2,602.08 385.59 17.40
(10.48) (10.96)of which : Wage Bill 362.27 476.35 114.08 31.49
(1.71) (2.01)
C. Profiti ) Operating Profit 3,949.32 3,697.83 -251.49 –6.37
i i ) Net Profit 3,262.68 2,119.06 -1,143.62 –35.05
D. Total Assets 2,32,043.02 2,46,518.00 14,474.98 6.24
E. Financial Ratios (per cent) @i) Operating Profit 1.71 1.50 -0.21 —
ii) Net Profit 1.41 0.86 -0.55 —iii) Income 10.52 10.49 -0.03 —iv) Interest Income 9.55 9.54 -0.01 —v) Other Income 0.97 0.95 -0.02 —
vi) Expenditure 9.11 9.63 0.52 —vii) Interest Expended 7.86 7.94 0.07 —
viii) Other Operating Expenses 0.96 1.06 0.10 —ix) Wage Bill 0.16 0.19 0.04 —x) Provisions and Contingencies 0.30 0.64 0.34 —
xi) Spread (Net Interest Income) 1.69 1.61 -0.08 —
@ Ratios to Total Assets.
* IDBI,ICICI,TFCI,EXIM Bank, NABARD,SIDBI,IDFC,IFCI, NHB and IIBI.
Notes: 1. Figures in brackets are percentage shares to the respective total.
2. NHB data is as on June 30, 2001.
way of term money in respect of select FIs stoodat Rs.1,091 crore as compared with Rs.465 croreduring the previous year. The cost of borrowingranged between 7.25 per cent and 11.95 per centas against 11.10 per cent and 11.25 per centper annum in the previous year. The maturityperiod ranged between 90 days to 184 days,roughly the same as during the previous year.
4. 54 The average quarterly lending of the
select FIs including investment institutions (viz.,UTI, LIC and GIC) in the call/ notice moneymarket during 2000-01 (April-March) amountedto Rs.4,374 crore as compared with Rs.3,996 croreduring the previous year. Institution-wise, thelargest lender in the call/ notice money marketduring 2000-01 (April-March) was UTI with anaverage daily lending at Rs.878 crore followed byLIC at Rs.811 crore (Appendix Table IV.7).

117
Financial Institutions
Asset Classification and Capital Adequacy ofFinancial Institutions
4. 55 The ratio of net NPA to net loan as onMarch 31, 2001, in respect of ICICI, SIDBI andEXIM Bank was below 10 per cent that of IFCI,IDBI, IIBI and TFCI ranged between 14.0 percent and 23.0 per cent (Table IV.6).
4. 56 In December 1998, the minimum CRAR
Table IV.5: Resources Raised by Major FIs
(Amount in Rs. crore)
ICICI IDBI IFCI Total
1998–99 1999–00 2000–01 1998–99 1999–00 2000–01 1998–99 1999–00 2000–01 1998–99 1999–00 2000–01
1 2 3 4 5 6 7 8 9 10 11 12 13
Public Issue of 3,064.4 2,574.9 2,900.8 4,342.0 2,073.5 1,161.0 – – – 7,406.4 4,648.4 4,061.8Bonds/Debentures (23.9) (37.6) (27.2) (34.2) (27.0) (21.2) (0.0) (0.0) (0.0) (25.5) (28.5) (21.5)
Private placement of 9,745.4 4,274.0 7,776.5 8,341.0 5,602.6 4,320.0 3,543.8 1,786.5 2,709.0 21,630.2 11,663.1 14,805.5Bonds/Debentures (76.1) (62.4) (72.8) (65.8) (73.0) (78.8) (100.0) (100.0) (100.0) (74.5) (71.5) (78.5)
Total 12,809.8 6,848.9 10,677.3 12,683.0 7,676.1 5,481.0 3,543.8 1,786.5 2,709.0 29,036.6 16,311.5 18,867.3
(100.0) (100.0) (100.0) (100.0) (100.0) (100.0) (100.0) (100.0) (100.0) (100.0) (100.0) (100.0)
Notes:1.Figures in brackets indicate percentage to total.
2.Data for 2000–01 are provisional.
Table IV.4: Lending Rate Structure of MajorFinancial Institutions
(per cent per annum)
PLR IDBI ICICI IFCI
1 2 3 4January 2001LTPLR 14.0 13.0 13.0MTPLR 13.0 13.0 —STPLR 12.5 13.0 12.5March 2001LTPLR 14.0 12.5 13.0MTPLR 13.0 12.5 —STPLR 12.5 12.5 12.5July 2001LTPLR 13.5 12.5 13.0MTPLR 12.5 12.5 —STPLR 12.0 12.5 12.5
Notes: 1. All interest rates are exclusive of interest tax unlessstated otherwise.
2. Interest rates indicated are the range/band whichincludes Prime Lending Rates also.
3. LTPLR: Long-term Prime Lending Rate (for term-loansexceeding 3 years) STPLR: Short-term Prime LendingRate (for term-loans below 3 years). In case of ICICI,the STPLR is of variable maturity with interest ratesreset annually. MTPLR: Medium-term Prime LendingRate (applicable for ICICI for loans with maturityexceeding 1 year).
to be achieved by FIs was enhanced from the thenexisting 8 per cent to 9 per cent, with effect fromthe year ending March 31, 2000. Judged thus,as at end-March 2001 all financial institutions(except IFCI) were well above the 9 per centbenchmark figure as evidenced from Table IV.7.The CRAR of IDBI, SIDBI, IIBI, NHB and TFCIwitnessed significant improvements. EXIMBank, NABARD, IFCI, ICICI and IDFC showed adecline in their CRAR as compared with theprevious year's position. The CRAR of IFCI was6.2 per cent which is lower than the requiredlevel of 9 per cent as at the end of March 2001.
4. Reserve Bank Assistance toFinancial Institutions
4. 57 During 2000-01 (July-June), no long-term assistance was sanctioned by the ReserveBank to any FI. The outstanding long-termborrowings by IDBI, SIDBI, EXIM Bank and IIBIunder NIC (LTO) Fund facility as at end-June2001 stood at Rs.4,222 crore. The outstandinglong-term borrowing by NHB from the NHC (LTO)Fund as at end-June 2001 stood at Rs.875 crore.
4. 58 Under Section 17(4A)/(4BB) of the ReserveBank of India Act, 1934, the Reserve Banksanctioned ad-hoc borrowing limits amounting toRs.161 crore to 13 State Financial Corporations(SFCs) during the year 2000-01, at the Bank Rateagainst ad-hoc bonds guaranteed by respectiveState Government/Union Territories. There wasno outstanding borrowing by SFCs as at end-June2001 (Table IV.8).

118
Report on Trend and Progress of Banking in India, 2000-01
Table IV.7: Capital Adequacy Ratio@ ofSelect Financial Institutions
Institution As at End-March
1998 1999 2000 2001
1 2 3 4 5
1. IDBI 13.7 12.7 14.5 15.8
2. ICICI 13.0 12.5 17.2 14.6
3. IFCI 11.6 8.4 8.8 6.2
4. SIDBI 30.3 26.9 27.8 28.1
5. IIBI 12.8 11.7 9.7 13.9
6. EXIM Bank 30.5 23.6 24.4 23.8
7. NABARD 52.5 53.3 44.4 38.5
8. IDFC - 235.5 119.7 85.5
9. NHB* 16.7 17.3 16.5 16.810. TFCI 16.4 15.4 16.2 18.6
@ As per cent of risk-weighted assets.* Relate to general fund.
Table IV.6: Asset Classification of Select Financial Institutions(As at end-March)
(Amount in Rs.crore)
Institution Standard Sub-standard Doubtful Loss Net Loans Net NPA/NetOutstanding # Loans (per cent)
2000 2001 2000 2001 2000 2001 2000 2001 2000 2001 2000 2001
1 2 3 4 5 6 7 8 9 10 11 12 13
IDBI 49,424 48,107 4,055 3,014 3,620 5,356 — — 57,099 56,477 13.4 14.8
ICICI 48,382 54,525 1,793 885 2,166 2,097 — — 52,341 57,507 7.6 5.2
IFCI 15,738 14,818 2,177 934 1,926 2,963 — — 19,841 18,715 20.7 20.8
SIDBI 14,613 13,934 115 61 82 113 — — 14,810 14,108 1.3 1.2
NABARD 29,031 35,771 833 — 218 — — — 30,082 35,771 3.5 —
NHB 3,668 N.A. — N.A. — N.A. — — 3,668 N.A. — N.A.
IIBI 3,286 2,108 380 201 278 424 — — 3,944 2,733 16.7 22.9
EXIM Bank 4,231 4,562 200 236 174 171 — — 4,605 4,969 8.1 8.2
IDFC 895 1,199 — — — — — — 895 1,199 — —TFCI 746 604 101 81 28 75 — — 875 760 14.7 20.5
N.A. Not available — Nil# Net of provisioning and write-offs.Notes: 1. NPA in any year is the aggregate of the amounts under sub-standard, doubtful and loss categories.
2. IDFC has been included since 1999.Source : Published balance sheet of respective institutions.
mutual funds (MFs) and to safeguard the interestsof the investors in mutual funds. Investmentnorms relating to mutual funds were liberalisedallowing them to invest in mortgage-backedsecurities of investment grade and above.Further, the open ended schemes were allowedto invest up to 5 per cent of their net asset valuein unlisted equity shares. The above twomeasures are expected to increase the funds tothe housing sector and venture capital industry.Eligibility criteria for overseas investment werechanged allowing apportionment of US$ 500million limit of overseas investments amongIndian MFs. The norms relating to code ofconduct, criteria for classification of NPAs andtheir disclosures, treatment of income accruedon NPAs and the provisions to be made,disclosure of NPAs in the half-yearly portfolioreports, were stipulated. The period for initialoffer of a scheme and despatch of certificates,standardisation of format, treatment ofunclaimed deposits and standards for trading bythe employees were tightened as well. Disclosureand transparency standards relating to AssetManagement Companies (AMCs) were alsotightened.
5. Mutual Funds
Policy Developments relating to Mutual Funds
4. 59 During 2000-01, several steps were takenby SEBI to impart flexibility to the operations of

119
Financial Institutions
Resource Mobilisation by Mutual Funds
4. 60 Net resource mobilisation by all mutualfunds registered a decline of 33.2 per cent toRs.13,339 crore from Rs.19,953 crore in theprevious year (Table IV.9). During 2000-01,public sector mutual funds raised Rs.1,623crore which was more than three times theamount of Rs.513 crore raised during theprevious year. The resource mobilisation by theprivate sector mutual funds at Rs.9,717 crorethough much higher than that by public sectormutual funds was lower by 34.7 per cent ascompared with Rs.14,892 crore mobilised duringthe previous year (Appendix Table IV.8).Resource mobilisation by UTI witnessed a sharpdecline of 56.0 per cent to Rs.1,999 crore during2000-01.
4. 61 As detailed in the previous year's Report,a High Level Committee (Chairman: Shri
Table IV.9 : Resources Mobilised by MutualFunds
(April-March)
(Rs. crore)
Mutual Funds 1997 1998 1999- 2000-98 -99(P) 2000 (P) -01(P)
1 2 3 4 5
I. Bank-sponsored(1 to 6) 236.89 -88.34 155.58 348.231. SBI MF 190.11 -71.79 477.60 351.882. Canbank MF 46.78 -16.55 -361.03 -5.413. Indian Bank MF .. .. .. ..4. BOI MF .. .. .. ..5. PNB MF .. .. 40.72 2.126. BOB MF .. .. -1.71 -0.36
II. FIs-sponsored(7 to 9) 203.39 546.81 357.41 1,274.51
7. GIC MF -19.20 -12.05 -206.28 -41.818. LIC MF 99.75 348.36 284.52 566.009. IDBI MF 122.84 210.50 279.17 750.32
III. Unit Trust 2,875.00 170.00 4,548.00 1,999.00of India (2,592.00) (1,300.00) (5,762.00) (1,201.00)
IV. Private Sector MFs 748.62 2,066.90 14,892.17 9,717.35
Total 4,063.90 2,695.37 19,953.16 13,339.09(I+II+III+IV)
P Provisional.. Nil or negligible
Notes 1. For UTI, the figures are gross value (with premium) of netsales under all domestic schemes and for other mutualfunds, figures represent net sales under all on-goingschemes.
2. Figures in brackets in case of UTI pertain to net sales atface value.
3. Data exclude amounts mobilised by off-shore funds andthrough roll-over schemes.
Source: UTI and respective mutual funds.
1 2
A. Long Term Credit [NIC(LTO)Fund]
1.IDBI 1,440.0
2.SIDBI 2,004.8
3.EXIM Bank 617.0
4.IIBI 160.0
Total of A 4,221.8
B. Long Term Credit [NHC(LTO)Fund]
1.NHB 875.0
Total of B 875.0
C. Medium/ short-term credit
1.IDBI —
2.SFCs —
Total of C —
D. Total
(A+B+C) 5,096.8
Type of AssistanceAmount
outstandingas on June
30, 2001
Table IV.8: RBI Assistance to Financial Institutions
(Rs. crore)
Deepak Parekh) was constituted by theGovernment in 1998 to review the objectives andworking of the US-64 scheme of UTI. Theprogress in implementation of therecommendations of the Committee ispresented in Box IV.3. Subsequently, aCommittee on ‘Corporate Posit ioning’(Chairman: Shri Y.H. Malegam) was appointed,which submitted its Report on October 31, 2001.The recommendations are given in Box IV.4.
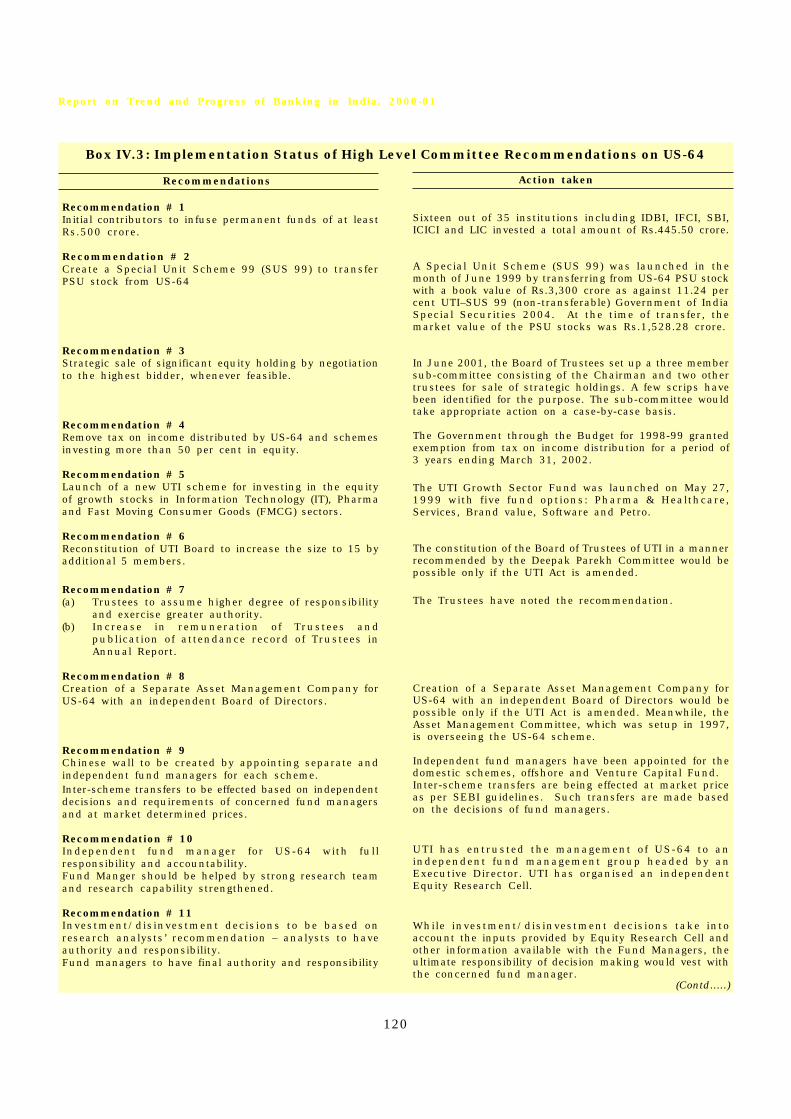
120
Report on Trend and Progress of Banking in India, 2000-01
Recommendations
Recommendation # 1Initial contributors to infuse permanent funds of at leastRs.500 crore.
Recommendation # 2Create a Special Unit Scheme 99 (SUS 99) to transferPSU stock from US-64
Recommendation # 3Strategic sale of significant equity holding by negotiationto the highest bidder, whenever feasible.
Recommendation # 4Remove tax on income distributed by US-64 and schemesinvesting more than 50 per cent in equity.
Recommendation # 5Launch of a new UTI scheme for investing in the equityof growth stocks in Information Technology (IT), Pharmaand Fast Moving Consumer Goods (FMCG) sectors.
Recommendation # 6Reconstitution of UTI Board to increase the size to 15 byadditional 5 members.
Recommendation # 7(a) Trustees to assume higher degree of responsibility
and exercise greater authority.(b) Increase in remuneration of Trustees and
publication of attendance record of Trustees inAnnual Report.
Recommendation # 8Creation of a Separate Asset Management Company forUS-64 with an independent Board of Directors.
Recommendation # 9Chinese wall to be created by appointing separate andindependent fund managers for each scheme.Inter-scheme transfers to be effected based on independentdecisions and requirements of concerned fund managersand at market determined prices.
Recommendation # 10Independent fund manager for US-64 with fullresponsibility and accountability.Fund Manger should be helped by strong research teamand research capability strengthened.
Recommendation # 11Investment/disinvestment decisions to be based onresearch analysts’ recommendation – analysts to haveauthority and responsibility.Fund managers to have final authority and responsibility
Action taken
Sixteen out of 35 institutions including IDBI, IFCI, SBI,ICICI and LIC invested a total amount of Rs.445.50 crore.
A Special Unit Scheme (SUS 99) was launched in themonth of June 1999 by transferring from US-64 PSU stockwith a book value of Rs.3,300 crore as against 11.24 percent UTI–SUS 99 (non-transferable) Government of IndiaSpecial Securities 2004. At the time of transfer, themarket value of the PSU stocks was Rs.1,528.28 crore.
In June 2001, the Board of Trustees set up a three membersub-committee consisting of the Chairman and two othertrustees for sale of strategic holdings. A few scrips havebeen identified for the purpose. The sub-committee wouldtake appropriate action on a case-by-case basis.
The Government through the Budget for 1998-99 grantedexemption from tax on income distribution for a period of3 years ending March 31, 2002.
The UTI Growth Sector Fund was launched on May 27,1999 with five fund options: Pharma & Healthcare,Services, Brand value, Software and Petro.
The constitution of the Board of Trustees of UTI in a mannerrecommended by the Deepak Parekh Committee would bepossible only if the UTI Act is amended.
The Trustees have noted the recommendation.
Creation of a Separate Asset Management Company forUS-64 with an independent Board of Directors would bepossible only if the UTI Act is amended. Meanwhile, theAsset Management Committee, which was setup in 1997,is overseeing the US-64 scheme.
Independent fund managers have been appointed for thedomestic schemes, offshore and Venture Capital Fund.Inter-scheme transfers are being effected at market priceas per SEBI guidelines. Such transfers are made basedon the decisions of fund managers.
UTI has entrusted the management of US-64 to anindependent fund management group headed by anExecutive Director. UTI has organised an independentEquity Research Cell.
While investment/disinvestment decisions take intoaccount the inputs provided by Equity Research Cell andother information available with the Fund Managers, theultimate responsibility of decision making would vest withthe concerned fund manager.
(Contd.....)
Box IV.3: Implementation Status of High Level Committee Recommendations on US-64
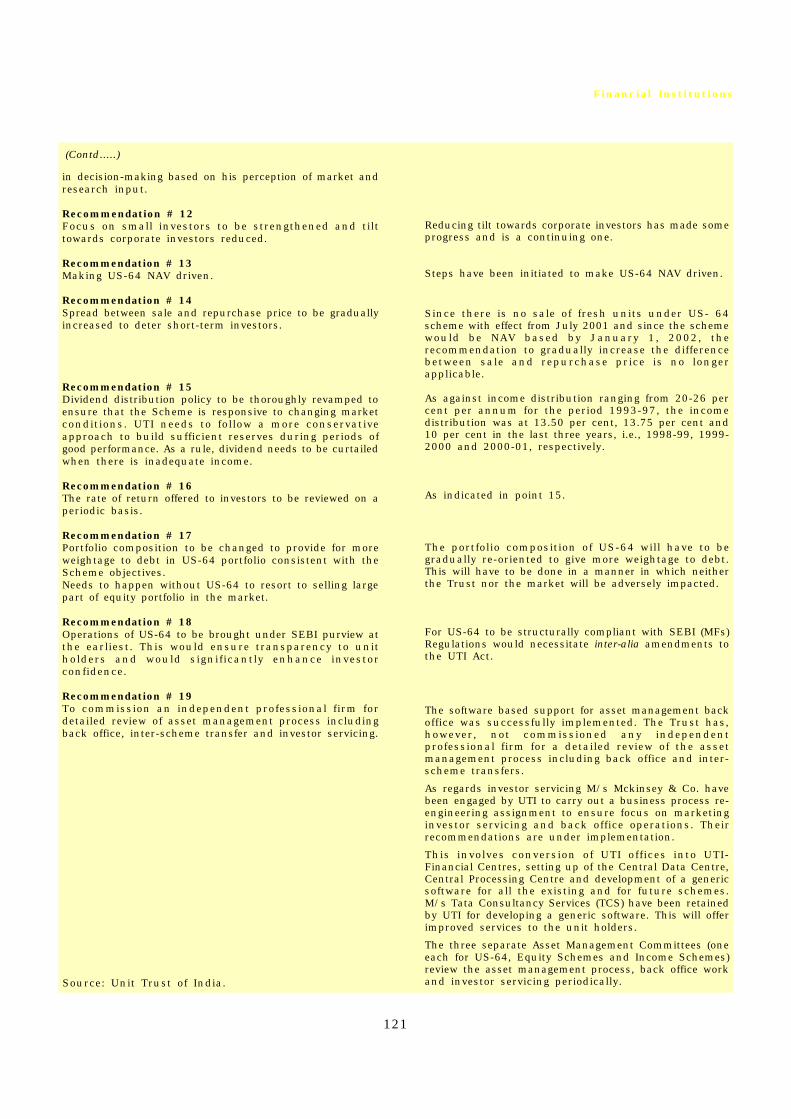
121
Financial Institutions
Reducing tilt towards corporate investors has made someprogress and is a continuing one.
Steps have been initiated to make US-64 NAV driven.
Since there is no sale of fresh units under US- 64scheme with effect from July 2001 and since the schemewould be NAV based by January 1, 2002, therecommendation to gradually increase the differencebetween sale and repurchase price is no longerapplicable.
As against income distribution ranging from 20-26 percent per annum for the period 1993-97, the incomedistribution was at 13.50 per cent, 13.75 per cent and10 per cent in the last three years, i.e., 1998-99, 1999-2000 and 2000-01, respectively.
As indicated in point 15.
The portfolio composition of US-64 will have to begradually re-oriented to give more weightage to debt.This will have to be done in a manner in which neitherthe Trust nor the market will be adversely impacted.
For US-64 to be structurally compliant with SEBI (MFs)Regulations would necessitate inter-alia amendments tothe UTI Act.
The software based support for asset management backoffice was successfully implemented. The Trust has,however, not commissioned any independentprofessional firm for a detailed review of the assetmanagement process including back office and inter-scheme transfers.
As regards investor servicing M/s Mckinsey & Co. havebeen engaged by UTI to carry out a business process re-engineering assignment to ensure focus on marketinginvestor servicing and back office operations. Theirrecommendations are under implementation.
This involves conversion of UTI offices into UTI-Financial Centres, setting up of the Central Data Centre,Central Processing Centre and development of a genericsoftware for all the existing and for future schemes.M/s Tata Consultancy Services (TCS) have been retainedby UTI for developing a generic software. This will offerimproved services to the unit holders.
The three separate Asset Management Committees (oneeach for US-64, Equity Schemes and Income Schemes)review the asset management process, back office workand investor servicing periodically.
(Contd.....)
Source: Unit Trust of India.
in decision-making based on his perception of market andresearch input.
Recommendation # 12Focus on small investors to be strengthened and tilttowards corporate investors reduced.
Recommendation # 13Making US-64 NAV driven.
Recommendation # 14Spread between sale and repurchase price to be graduallyincreased to deter short-term investors.
Recommendation # 15Dividend distribution policy to be thoroughly revamped toensure that the Scheme is responsive to changing marketconditions. UTI needs to follow a more conservativeapproach to build sufficient reserves during periods ofgood performance. As a rule, dividend needs to be curtailedwhen there is inadequate income.
Recommendation # 16The rate of return offered to investors to be reviewed on aperiodic basis.
Recommendation # 17Portfolio composition to be changed to provide for moreweightage to debt in US-64 portfolio consistent with theScheme objectives.Needs to happen without US-64 to resort to selling largepart of equity portfolio in the market.
Recommendation # 18Operations of US-64 to be brought under SEBI purview atthe earliest. This would ensure transparency to unitholders and would significantly enhance investorconfidence.
Recommendation # 19To commission an independent professional firm fordetailed review of asset management process includingback office, inter-scheme transfer and investor servicing.

122
Report on Trend and Progress of Banking in India, 2000-01
The Unit Trust of India (UTI) had constituted aCorporate Positioning Committee in July 2000 underthe Chairmanship of Shri Y.H. Malegam to review andenhance the competitive positioning of UTI and torecommend appropriate fol low-up action plansincluding amendments to the connected legislationfor enabling the UTI to fully meet with the MutualFund Regulations of SEBI.
The Committee submitted its report in October 2001and the major recommendations made by theCommittee are summarised below:
• The structure of UTI should be in line with SEBIRegulations as applicable to mutual funds.Accordingly, there should be (i) a Sponsor (ii) aTrustee Company and (iii) an Asset ManagementCompany (AMC).
• There should be a single Sponsor and there is aneed for a separate Sponsoring Company withinit ial shareholders being the SponsoringInstitutions. The Sponsoring Company shouldhave a capital of Rs.550 crore of which 40 percent would be held by the Sponsoring Institutionswith no individual institution holding more than25 per cent of the capital. The remaining 60 percent of the capital would be held by a strategicpartner. There should be 3 year ‘lock-in’ for thecapital to be held by the sponsoring institutions.
• A Trustee Company should be incorporated as awholly-owned subsidiary of the sponsoringcompany. The Trustee Company should have acapital of Rs.5 crore.
• UTI should convert itself into an AMC wherebythe infrastructure and organisation, presentlyforming part of US-64, would become theinfrastructure and organisation of UTI. The AMCwould issue bonds to US-64 in consideration ofthe transfer of the infrastructure.
• The AMC should have a capital of Rs.1,000 croreof which 40 per cent would be held by theSponsoring Company and 60 per cent would beoffered to the public.
• There should be a single AMC to manage all theschemes of the UTI and it would be entitled tocharge management fees to the different schemesin accordance with the Mutual Fund Regulations.
• US-64 be made NAV based before the restructuringis attempted. The provision should also be madefor the contingent l iabi l i ty, i f any, on theguaranteed price to individual unitholder ’sholdings upto 3,000 units.
• The provision should be made for the contingentliability in respect of assured return schemes. TheCommittee also made specific recommendations toreduce the gap between the present value of the futureliability and the value of assets under the schemes.
• The Development Reserve Fund, the corpus ofwhich includes contributions from each schemeeach year since 1984 should be transferred, freeof consideration to the AMC after valuing theinvestments of the Fund at their fair market value.
• The valuation should be made of UTI as a whole byan independent valuer and prospective strategicpartner should be invited to quote the value at whichUTI’s infrastructure and organisation should beconverted into the AMC. The valuation should takeinto account the goodwill attached to UTI arising outof its large unitholder base, its low operating costs asa percentage of investible funds and other relevantfactors. It should also take into account thecontingent liabilities arising out of the assured returnschemes after adjusting the balance available in theDevelopment Reserve Fund.
• The UTI Act should be repealed and replaced by anew enactment.
Box IV.4: Corporate Positioning Committee – Unit Trust of India

Non-banking f inancial companies(NBFCs) have been the subject of focussedattention during the nineties. In particular, therapid growth of NBFCs, especially in the nineties,has led to a gradual blurring of dividing linesbetween banks and NBFCs, with the exception ofthe exclusive privilege that commercial banksexercise in the issuance of cheques (Chart V.1).Simplified sanction procedures, orientationtowards customers, attractive rates of return ondeposits and flexibility and timeliness in meetingthe credit needs of specified sectors (likeequipment leasing and hire purchase), are someof the factors enhancing the attractiveness of thissector. The total regulated deposits1 of NBFCsaggregated Rs.17,390 crore, as at end of March1994, equivalent to 4.0 per cent of bank deposits.The quantum of regulated deposits grew more thanthree-fold and as at end-March 1997, at Rs.53,116crore constituted 7.9 per cent of bank deposits.
5. 2 In the year 1998, a new concept of publicdeposits meaning deposits received from publicincluding shareholders in the case of publiclimited companies and unsecured debentures/bonds other than those issued to companies,banks and financial institutions, was introducedfor the purpose of focussed supervision of NBFCsaccepting such deposits. The amount of suchpublic deposits held by NBFCs, which as at endof March 1998 was Rs.23,820 crore, declined toRs.19,341 crore as at end of March 2000.
5.3 Owing to certain disquietingdevelopments in the NBFC sector, the RBI Actwas amended in 1997, providing for acomprehensive regulatory framework for NBFCs.The RBI (Amendment) Act, 1997 provides forcompulsory registration with the Reserve Bankof all NBFCs, irrespective of their holding ofpublic deposits, for commencing and carrying on
business, minimum entry point norms,maintenance of a portion of deposits in liquidassets, creation of Reserve Fund and transferof 20 per cent of profit after tax annually to theFund. The Amendment Act also conferred powerson Reserve Bank to issue directions tocompanies and its auditors, prohibit depositacceptance and alienation of assets bycompanies and effect winding up of companies.
5. 4 Accordingly, the Reserve Bank issueddirections to companies on acceptance of publicdeposits, prudential norms l ike capitaladequacy, income recognition, assetclassification, provision for bad and doubtfuldebts, exposure norms and other measures tomonitor the financial solvency and reporting byNBFCs. Directions were also issued to auditorsto report non-compliance with the RBI Act andregulations to the Reserve Bank, Board ofDirectors and shareholders.
1. Registration of NBFCs
5.5 The registration is compulsory for allNBFCs, irrespective of their holding of publicdeposits. The types of NBFCs regulated by theReserve Bank are indicated in Table V.1. Theamended Act, which introduced comprehensivechanges in Chapter III-B, III-C and V, providesfor an entry point norm of Rs.25 lakh as theminimum net owned fund (NOF). Subsequently,for new NBFCs seeking registration with theReserve Bank to commence business on or afterApril 21, 1999, the requirement of minimumlevel of NOF was revised upwards to Rs.2 crore.No NBFC can commence or carry on business ofa financial institution including acceptance ofpublic deposit without obtaining a Certificateof Registration (CoR) from the Reserve Bank.
1 Regulated deposits are defined as receipt of money by way of deposit or loan or in any other form excludingamounts received as share capital, bank borrowings, institutional borrowings, chit subscription, borrowingsfrom registered money lenders and money received in ordinary course of business; further excluding certainother forms of deposits as specified in Non-Banking Financial Companies (Reserve Bank) Directions, 1977 likemoney received from Central or State Governments, foreign Government, financial institutions, companies andcertain other forms of deposits.
Non-Banking Financial Companies
Chapter V

124
Report on Trend and Progress of Banking in India, 2000-01

125
Non-Banking Financial Companies
Table V.1: Non-Banking Financial Entities Regulated by Reserve Bank
Non-Banking Financial Companies Principal Business
I. Non-Banking Financial Company In terms of the Section 45-I(f) read with Section 45-I(c)o f the RBI Act , 1934, as amended in 1997, theirprincipal business is that of receiving deposits or thatof a financial institution, such as lending, investmentin securi t ies , hire purchase f inance or equipmentleasing.
Equipment leasing company (EL) Equipment leasing or financing of such activity.
Hire purchase finance company (HP) Hire purchase transact ion or f inancing of suchtransactions.
Investment company (IC) Acquisition of securities and trading in such securitiesto earn a profit.
Loan company (LC) Providing f inance by making loans or advances, orotherwise for any activity other than its own; excludesEL/HP/Housing Finance Companies (HFCs).
Residuary non-banking company (RNBC) Company which receives deposits under any scheme orarrangement, by whatever name called, in one lump-sumor in instalments by way of contr ibut ions orsubscriptions or by sale of units or certificates or otherinstruments, or in any manner. These companies do notbelong to any of the categories as stated above.
II . Mutual benefit financial Any company which is notified by the Centralcompany (MBFC) i.e. Nidhi Company Government under Section 620A of the Companies Act
1956 (1 of 1956).
III. Mutual Benefit Company (MBC), i.e., A company which is working on the lines of a Nidhipotential Nidhi company company. However, it has not yet been so declared by
the Central Government, has minimum NOF of Rs.10lakh, has applied to the Reserve Bank for CoR and alsoto Department of Company Affairs (DCA) for declarationas nidhi company and has not contravened direction/regulation of Reserve Bank/DCA.
IV. Miscellaneous non-banking company Managing, conducting or supervising as a promoter,(MNBC), i.e., Chit Fund Company foreman or agent of any transaction or arrangement by
which the company enters into an agreement with aspecified number of subscribers that every one of themshall subscribe a certain sum in instalments over adefinite period and that every one of such subscribersshall in turn, as determined by lot or by auction or bytender or in such manner as may be provided for in thearrangement, be entitled to the prize amount.
5.6 The Reserve Bank received applicationsfor CoR from 36,505 NBFCs, of which, 13,815applications were approved and 18,355 wererejected, as at end-August 2001. Out of thetotal approvals of 13,815 applications, only 776companies have been permitted to acceptpublic deposits.
2. Supervision of NBFCs
5.7 The supervisory framework for NBFCs isbased on three criteria, viz., (a) the size of NBFC,(b) the type of activity performed, and (c) the
acceptance or otherwise of public deposits.Towards this end, a four-pronged supervisorystrategy comprising (a) on-site inspection basedon CAMELS (capital, assets, management,earnings, liquidity, systems and procedures)methodology, (b) computerised off-sitesurveillance through periodic control returns,(c) an effective market intelligence network, and(d) a system of submission of exception reportsby auditors of NBFCs, has been put in place. Theregulation and supervision is comprehensive forcompanies accepting or holding public depositsto ensure protection of interests of depositors.
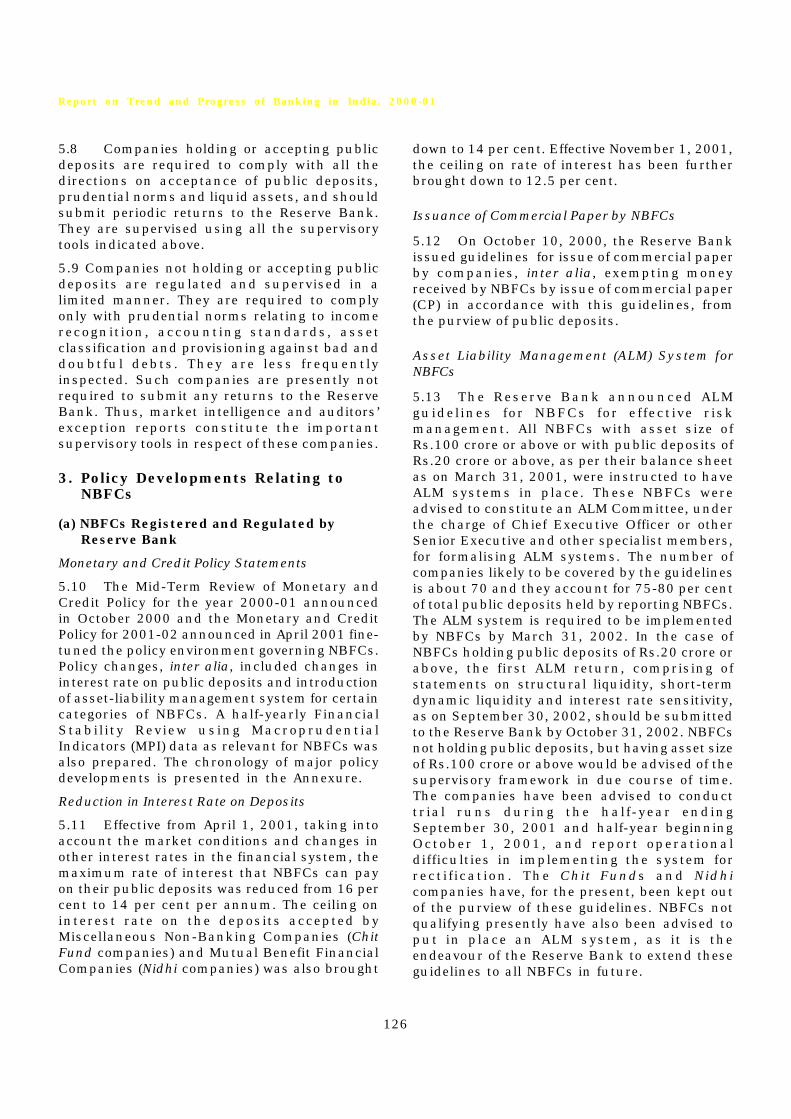
126
Report on Trend and Progress of Banking in India, 2000-01
5.8 Companies holding or accepting publicdeposits are required to comply with all thedirections on acceptance of public deposits,prudential norms and liquid assets, and shouldsubmit periodic returns to the Reserve Bank.They are supervised using all the supervisorytools indicated above.
5.9 Companies not holding or accepting publicdeposits are regulated and supervised in alimited manner. They are required to complyonly with prudential norms relating to incomerecognition, accounting standards, assetclassification and provisioning against bad anddoubtful debts. They are less frequentlyinspected. Such companies are presently notrequired to submit any returns to the ReserveBank. Thus, market intelligence and auditors’exception reports constitute the importantsupervisory tools in respect of these companies.
3. Policy Developments Relating toNBFCs
(a) NBFCs Registered and Regulated byReserve Bank
Monetary and Credit Policy Statements
5.10 The Mid-Term Review of Monetary andCredit Policy for the year 2000-01 announcedin October 2000 and the Monetary and CreditPolicy for 2001-02 announced in April 2001 fine-tuned the policy environment governing NBFCs.Policy changes, inter alia, included changes ininterest rate on public deposits and introductionof asset-liability management system for certaincategories of NBFCs. A half-yearly FinancialStabil ity Review using MacroprudentialIndicators (MPI) data as relevant for NBFCs wasalso prepared. The chronology of major policydevelopments is presented in the Annexure.
Reduction in Interest Rate on Deposits
5.11 Effective from April 1, 2001, taking intoaccount the market conditions and changes inother interest rates in the financial system, themaximum rate of interest that NBFCs can payon their public deposits was reduced from 16 percent to 14 per cent per annum. The ceiling oninterest rate on the deposits accepted byMiscellaneous Non-Banking Companies (ChitFund companies) and Mutual Benefit FinancialCompanies (Nidhi companies) was also brought
down to 14 per cent. Effective November 1, 2001,the ceiling on rate of interest has been furtherbrought down to 12.5 per cent.
Issuance of Commercial Paper by NBFCs
5.12 On October 10, 2000, the Reserve Bankissued guidelines for issue of commercial paperby companies, inter alia, exempting moneyreceived by NBFCs by issue of commercial paper(CP) in accordance with this guidelines, fromthe purview of public deposits.
Asset Liability Management (ALM) System forNBFCs
5.13 The Reserve Bank announced ALMguidelines for NBFCs for effective riskmanagement. All NBFCs with asset size ofRs.100 crore or above or with public deposits ofRs.20 crore or above, as per their balance sheetas on March 31, 2001, were instructed to haveALM systems in place. These NBFCs wereadvised to constitute an ALM Committee, underthe charge of Chief Executive Officer or otherSenior Executive and other specialist members,for formalising ALM systems. The number ofcompanies likely to be covered by the guidelinesis about 70 and they account for 75-80 per centof total public deposits held by reporting NBFCs.The ALM system is required to be implementedby NBFCs by March 31, 2002. In the case ofNBFCs holding public deposits of Rs.20 crore orabove, the first ALM return, comprising ofstatements on structural liquidity, short-termdynamic liquidity and interest rate sensitivity,as on September 30, 2002, should be submittedto the Reserve Bank by October 31, 2002. NBFCsnot holding public deposits, but having asset sizeof Rs.100 crore or above would be advised of thesupervisory framework in due course of time.The companies have been advised to conducttrial runs during the half-year endingSeptember 30, 2001 and half-year beginningOctober 1, 2001, and report operationaldifficulties in implementing the system forrecti f ication. The Chit Funds and Nidhicompanies have, for the present, been kept outof the purview of these guidelines. NBFCs notqualifying presently have also been advised toput in place an ALM system, as it is theendeavour of the Reserve Bank to extend theseguidelines to all NBFCs in future.

127
Non-Banking Financial Companies
Rationalisation of the Requirement of Introductionfor Depositors of NBFCs
5.14 To rationalise requirements ofintroduction for depositors stipulated earlier inJune 2000, it was clarified that requirement ofintroduction was for purpose of identification ofdepositors, so that deposits are not made infictitious names. NBFCs were advised to obtainand keep on record copies of identification ofdepositors, viz., passport, ration card, electionidentity card, identification by an existingdepositor, as proof of identity of the prospectivedepositors.
Entry of NBFCs into Insurance Business
5.15 Consequent upon issue of final guidelinesfor entry of NBFCs into insurance business inJune 2000, the Reserve Bank permitted fiveNBFCs to undertake insurance business as jointventure participants in insurance companies.Of these, while two NBFCs were grantedpermission to undertake both life and generalinsurance business, three NBFCs werepermitted to undertake only life insurancebusiness with risk participation. One companywas permitted both to engage in insuranceagency business as well as to make strategicinvestment in equity of insurance company upto10 per cent of its owned fund. Another companywas granted permission to conduct onlyinsurance agency business while a thirdcompany could only make strategic investmentin equity of insurance company.
Rationalisation of Returns Submitted by NBFCs
5.16 In order to improve the reporting ofsupervisory information and facilitate electronicprocessing, the formats of all returns prescribedin terms of Directions issued under RBI Act,submitted by the NBFCs and Chit Fundcompanies at quarterly, half-yearly and annualintervals were rationalised. Such a step was alsonecessitated by the twin concerns of the ReserveBank to take expeditious steps, wherevernecessary, as also to intensify off-sitemonitoring procedure of the deposit-taking/holding NBFCs. A monthly return on repaymentof deposits was prescribed for NBFCs holdingpublic deposits, whose applications for CoRunder Section 45-IA of RBI Act, 1934 wererejected or CoR was cancelled, if it was grantedearlier.
Focus on Large NBFCs with Public Depositexceeding Rs. 20 crore
5.17 For addressing supervisory concerns andfor picking up early warning signals ofdeterioration in financial health of companies(especial ly those holding a substantialquantum of public deposits), the quarterlyreturn for compiling monetary aggregates,call ing for information on asset-l iabil ityposition from NBFCs holding public deposits ofRs.20 crore and above, was expanded to includecertain critical supervisory information. Thereturn prescribes companies to furnishinformation on net owned fund, public deposits,NPA position, credit rating, cash flow, certainkey ratios, etc. This is expected to enable closermonitoring of large NBFCs holding publicdeposits of Rs.20 crore and above.
Residuary Non-Banking Companies (RNBCs)
5.18 RNBCs are a class of NBFCs whichcannot be classified as equipment leasing, hirepurchase, loan, investment, nidhi or chit fundcompanies, but which tap public savings byoperating various deposit schemes, akin torecurring deposit schemes of banks. Thedeposit acceptance act iv i t ies of thesecompanies are governed by the provisions ofResiduary Non-Banking Companies (ReserveBank) Directions, 1987. These directionsinclude provisions relating to the minimum(not less than 12 months) and maximum period(not exceeding 84 months) of deposits,prohibition from forfeiture of any part of thedeposit or interest payable thereon, disclosurerequirements in the application forms and theadvert isements sol ic i t ing deposits andperiodical returns and information to befurnished to the Reserve Bank.
5.19 In the absence of any linkage of deposits totheir NOF, to safeguard the depositors' interests,these companies have been directed to invest notless than 80 per cent of aggregate depositliabilities as per the investment pattern prescribedby the Reserve Bank, and to entrust thesesecurities to a public sector bank to be withdrawnonly for repayment of depositors. Subject tocompliance with the investment pattern, they caninvest 20 per cent of aggregate liabilities or tentimes its net owned fund, whichever is lower, ina manner decided by its Board of Directors.

128
Report on Trend and Progress of Banking in India, 2000-01
5.20 The RNBCs are the only class of NBFCswhich are enjoined to pay a minimum rate ofinterest on their deposits. The floor rate ofinterest for deposits are specified by theReserve Bank in terms of RNBC Directions,1987. There is no upper limit prescribed forRNBCs unlike other NBFCs, which can pay anyrate of interest subject to the maximum ceilingprescribed by the Reserve Bank. The floorinterest rate payable by RNBCs was reviseddownwards from 6 per cent to 4 per cent perannum (to be compounded annually) on dailydeposit schemes and from 8 per cent to 6 percent per annum (to be compounded annually)on other deposit schemes of higher duration orterm deposits. The provisions of prudentialnorms were extended to RNBCs, under theprovisions of the NBFC Prudential Norms (RB)Direct ions, 1998 and compliance withprudential norms is mandatory and aprerequisite for acceptance of deposits.
5.21 Monitoring and inspection of thesecompanies, from time to time, revealedcontinuance of many unsatisfactory features likenon-compliance with the core provisions of theDirections, forfeiture of the depositors' money onone pretext or the other, diversion of depositors'money to associate concerns and/or investmentin illiquid assets, violation of investmentrequirements/pattern, etc., thus jeopardising theinterests of depositors. The Reserve Bank wasissuing prohibitory orders on a case-by-casebasis restraining erring RNBCs from acceptingdeposits. Some of the ingenious promoters floatednew companies and started accepting depositsthrough new entities or shifted their area ofoperations to other States. The requirement ofcompulsory registration before commencingbusiness of RNBC and concerted action takenagainst such companies has curbed suchpractices to a large extent.
5.22 The Reserve Bank received 106applications for Certificate of Registration (CoR)from NBFCs which were functioning as RNBCsby accepting deposits under some scheme orarrangement. While 12 companies subsequentlyconverted themselves to NBFCs, applications of84 companies have been rejected. Ten NBFCsare still functioning as RNBCs, the total depositsof which amounted to nearly Rs. 11,000 crore,constituting about 57.0 per cent of the totaldeposits of all reporting NBFCs.
(b) NBFCs not Registered with the ReserveBank
Mutual Benefit Companies
5. 23 Mutual Benefit financial companies(Nidhis) are NBFCs notified under Section 620Aof the Companies Act, 1956 and primarilyregulated by Department of Company Affairs(DCA) under the directions / guidelines issuedby them under Section 637 A of the CompaniesAct, 1956. These companies are exempt fromthe core provisions of the RBI Act viz.,requirement of compulsory registration,maintenance of liquid assets and transfer ofprofits to Reserve Fund. These companies arealso exempted from the core provisions of NBFCdirections relating to acceptance of publicdeposits. Directions relating to ceiling oninterest rate, maintenance of register ofdeposits, furnishing receipt to depositors andsubmission of returns to Reserve Bank arehowever applicable to these companies.
5.24 The Government of India constituted anExpert Committee in March 2000 (Chairman:Shri P.Sabanayagam) to examine variousaspects of the functioning of the Nidhicompanies and suggest an appropriate policyframework for overall improvement of thesecompanies. This was done with a view tofacilitate their healthy functioning and restorethe confidence of the investing public. Thesalient features of the recommendations of theCommittee are detailed in Box V.1.
Miscellaneous Non-Banking Companies (MNBCs)
5.25 MNBCs are mainly engaged in the ChitFund business. The term 'deposit' as defined underSection 45 I(bb) of the Reserve Bank of India Act,1934 does not include subscription to Chit Funds.The Chit Fund companies have been exempted fromall the core provisions of Chapter IIIB of the RBIAct including registration. In terms ofMiscellaneous Non-Banking Companies (RB)Directions, the companies can accept depositsupto 25 per cent and 15 per cent of the NOF frompublic and shareholders, respectively, for a periodof 6 months to 36 months, but cannot acceptdeposits repayable on demand/notice.
5.26 The Reserve Bank only regulates thedeposits accepted by these companies, but itdoes not regulate their Chit Fund business,which is administered by the respective State
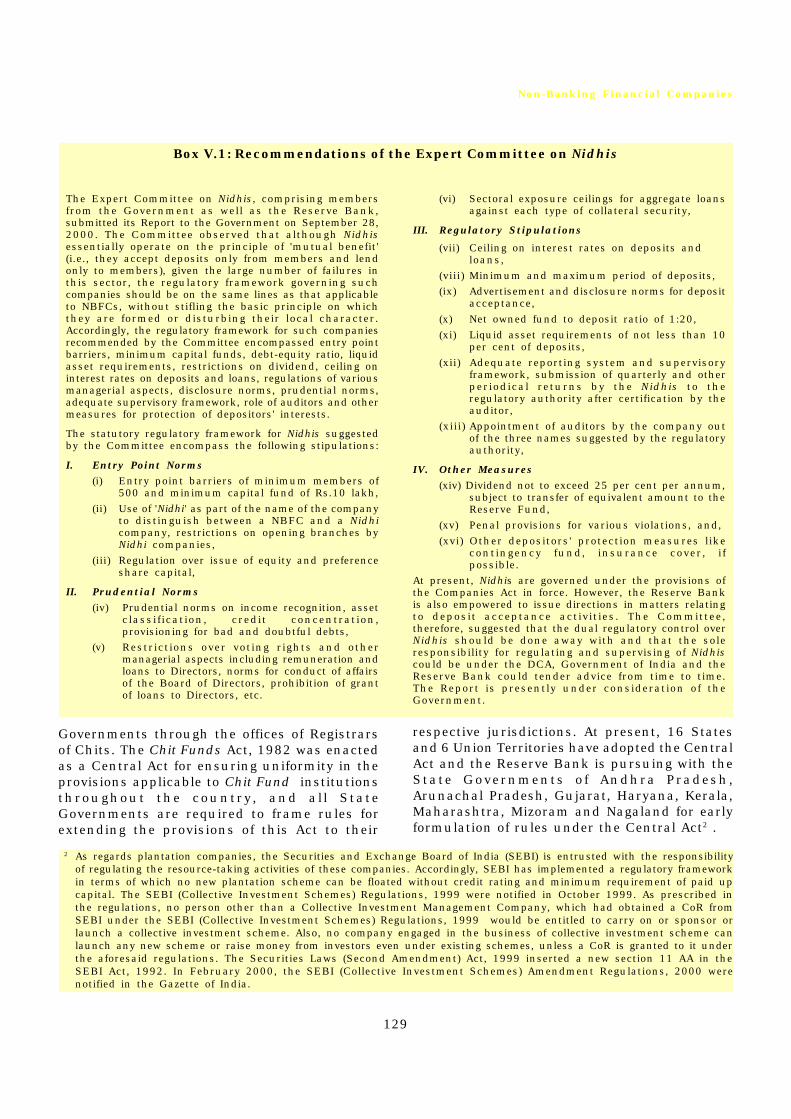
129
Non-Banking Financial Companies
Box V.1: Recommendations of the Expert Committee on Nidhis
The Expert Committee on Nidhis, comprising membersfrom the Government as well as the Reserve Bank,submitted its Report to the Government on September 28,2000. The Committee observed that although Nidhisessentially operate on the principle of 'mutual benefit'(i.e., they accept deposits only from members and lendonly to members), given the large number of failures inthis sector, the regulatory framework governing suchcompanies should be on the same lines as that applicableto NBFCs, without stifling the basic principle on whichthey are formed or disturbing their local character.Accordingly, the regulatory framework for such companiesrecommended by the Committee encompassed entry pointbarriers, minimum capital funds, debt-equity ratio, liquidasset requirements, restrictions on dividend, ceiling oninterest rates on deposits and loans, regulations of variousmanagerial aspects, disclosure norms, prudential norms,adequate supervisory framework, role of auditors and othermeasures for protection of depositors' interests.
The statutory regulatory framework for Nidhis suggestedby the Committee encompass the following stipulations:
I. Entry Point Norms(i) Entry point barriers of minimum members of
500 and minimum capital fund of Rs.10 lakh,
(ii) Use of 'Nidhi' as part of the name of the companyto distinguish between a NBFC and a Nidhicompany, restrictions on opening branches byNidhi companies,
(iii) Regulation over issue of equity and preferenceshare capital,
II. Prudential Norms(iv) Prudential norms on income recognition, asset
classification, credit concentration,provisioning for bad and doubtful debts,
(v) Restrictions over voting rights and othermanagerial aspects including remuneration andloans to Directors, norms for conduct of affairsof the Board of Directors, prohibition of grantof loans to Directors, etc.
(vi) Sectoral exposure ceilings for aggregate loansagainst each type of collateral security,
III. Regulatory Stipulations
(vii) Ceiling on interest rates on deposits andloans,
(viii) Minimum and maximum period of deposits,
(ix) Advertisement and disclosure norms for depositacceptance,
(x) Net owned fund to deposit ratio of 1:20,
(xi) Liquid asset requirements of not less than 10per cent of deposits,
(xii) Adequate reporting system and supervisoryframework, submission of quarterly and otherperiodical returns by the Nidhis to theregulatory authority after certification by theauditor,
(xiii) Appointment of auditors by the company outof the three names suggested by the regulatoryauthority,
IV. Other Measures(xiv) Dividend not to exceed 25 per cent per annum,
subject to transfer of equivalent amount to theReserve Fund,
(xv) Penal provisions for various violations, and,
(xvi) Other depositors' protection measures likecontingency fund, insurance cover, ifpossible.
At present, Nidhis are governed under the provisions ofthe Companies Act in force. However, the Reserve Bankis also empowered to issue directions in matters relatingto deposit acceptance activities. The Committee,therefore, suggested that the dual regulatory control overNidhis should be done away with and that the soleresponsibility for regulating and supervising of Nidhiscould be under the DCA, Government of India and theReserve Bank could tender advice from time to time.The Report is presently under consideration of theGovernment.
Governments through the offices of Registrarsof Chits. The Chit Funds Act, 1982 was enactedas a Central Act for ensuring uniformity in theprovisions applicable to Chit Fund institutionsthroughout the country, and all StateGovernments are required to frame rules forextending the provisions of this Act to their
respective jurisdictions. At present, 16 Statesand 6 Union Territories have adopted the CentralAct and the Reserve Bank is pursuing with theState Governments of Andhra Pradesh,Arunachal Pradesh, Gujarat, Haryana, Kerala,Maharashtra, Mizoram and Nagaland for earlyformulation of rules under the Central Act2 .
2 As regards plantation companies, the Securities and Exchange Board of India (SEBI) is entrusted with the responsibilityof regulating the resource-taking activities of these companies. Accordingly, SEBI has implemented a regulatory frameworkin terms of which no new plantation scheme can be floated without credit rating and minimum requirement of paid upcapital. The SEBI (Collective Investment Schemes) Regulations, 1999 were notified in October 1999. As prescribed inthe regulations, no person other than a Collective Investment Management Company, which had obtained a CoR fromSEBI under the SEBI (Collective Investment Schemes) Regulations, 1999 would be entitled to carry on or sponsor orlaunch a collective investment scheme. Also, no company engaged in the business of collective investment scheme canlaunch any new scheme or raise money from investors even under existing schemes, unless a CoR is granted to it underthe aforesaid regulations. The Securities Laws (Second Amendment) Act, 1999 inserted a new section 11 AA in theSEBI Act, 1992. In February 2000, the SEBI (Collective Investment Schemes) Amendment Regulations, 2000 werenotified in the Gazette of India.

130
Report on Trend and Progress of Banking in India, 2000-01
4. Implementation of Recommendationsof Task Force on NBFCs (1998)
Financial Companies Regulation Bill, 2000
5.27 The Task Force constituted by Governmentof India (Chairman: Shri C.M. Vasudev) to reviewthe regulatory and supervisory framework forNBFCs and unincorporated bodies and address theshortcomings in dealing with the investors'complaints submitted its report on October 28,1998. The recommendations, which have sincebeen accepted by the Government, can be stratifiedinto four broad strands, according to their statusof implementation, viz., recommendations which(a) were implemented with immediate effect (onDecember 18, 1998) by modifying the existingnotification/Directions; (b) required statutoryamendments, (c) required amendments to theDirections under the RBI Act, and (d) needed to beimplemented over a period of time through
administrative action. The Government of Indiaframed the Financial Companies RegulationBill, 2000 to implement the recommendationsrequiring statutory changes, as also consolidatethe law relating to NBFCs and unincorporatedbodies with a view to ensure depositor protection,(Box V.2).
State Acts for Protection of Interests of Depositors
5.28 The Task Force on NBFCs hadrecommended that State Governments shouldbe empowered to initiate penal action againstthose NBFCs which function illegally or acceptpublic deposits without any authorisation. Itemphasized that such legislation should beexpeditiously enacted. As a move towards thisprocess, Tamil Nadu Protection of InterestsDepositors (in Financial Establishments) Act,1997, which contains penal provisions forpromoters of f inancial establishments
Box V.2: Financial Companies Regulation Bill, 2000
The Government of India framed a new legislation toamend and consolidate the provisions contained inChapter III-B, III-C and V of the RBI Act, 1934 relatingto the regulat ion and supervis ion of f inancia lcompanies, hitherto known as non-banking financialcompanies (NBFCs). This included prohibit ion ofacceptance of deposits by unincorporated bodies andincorporating the recommendations of the Task Forceon NBFCs, which had made certain recommendationsto this effect. The salient features of the proposedlegislation, which are materially different from thecorresponding provis ions of RBI Act or are newprovisions are as follows:
I. Basic Stipulations
(i) The draft bill has been named as 'FinancialCompanies Regulations Bill, 2000'. All theNBFCs wi l l be known as FinancialCompanies instead of NBFCs.
(ii) The term 'public deposit' has been definedin the Bi l l for the f i rst t ime and thedef ini t ion would mean the same as atpresent in the NBFC Directions.
(i i i ) There would be a nine member AdvisoryCouncil for Financial Companies under theChairmanship of Deputy Governor, drawingon members from the representatives ofAssociations of Financial Companies andother experts in related areas to advise theReserve Bank.
(iv) NBFCs holding /accepting public deposits
would be prohibited from carrying on anynon-financial business without the priorapproval of the Reserve Bank and the non-financial business presently carried on bythem would have to be wound up ortransferred to a subsidiary within threeyears. Any other business or fee-basedactivity l ike insurance agency business,portfolio management, etc., would requireprior approval of the Reserve Bank.
II.Entry Point Norms
(v) The requirement of obtaining the CoR fromthe Reserve Bank would be compulsory foral l f inancia l companies, i rrespect ive o fwhether the companies accept publ icdeposits or not. However, the non-publicdeposit taking financial companies wouldrequire minimum owned fund of Rs.25 lakh,whereas the public deposit taking financialcompanies would require minimum netowned fund (NOF) of Rs.2 crore and aspeci f ic authorisat ion from the ReserveBank to accept public deposits.
(vi) There would be powers with the ReserveBank to (a) prescribe different capital fordifferent classes of financial companies, (b)raise the requirement of minimum ownedfund (entry norm) from Rs.25 lakh to Rs.200crore for new f inancia l companies notaccept ing publ ic deposits , (c ) ra ise the
(Contd...)

131
Non-Banking Financial Companies
minimum NOF (entry norm) from the presentceiling of Rs.2 crore to Rs.10 crore in thecase of new financial companies intendingto accept public deposits, and (d) raise theminimum NOF from the present level ofRs.25 lakh to Rs.2 crore for the existingf inancial companies accept ing publ icdeposits. However, sufficient time would beal lowed to such f inancial companies toattain the enhanced capital requirement.
(vii) The requirement of creation of reserve fundwould be applicable only to the financialcompanies accepting public deposits, asagainst the earlier requirement applicableto all NBFCs.
(viii) Unsecured deposi tors would have f i rstcharge on liquid assets and assets createdout of the deployment of the part of thereserve fund.
(ix) The financial companies would require priorapproval of the Reserve Bank for any changein the name, change in the management orchange in the location of the registeredoffice.
(x) Any sale of property in violation of orderfor prohibi t ion from al ienat ion of anyproperty or assets would be void and thatsuch order could be extended by the ReserveBank in tranches of one year each on eachoccasion upto a period of five years.
III.Regulatory and Supervisory Issues
(xi) The Reserve Bank would be empowered toappoint Special Officer(s) on a delinquentfinancial company and a duty has been caston such company to cooperate with suchSpecial Officer(s).
(xii ) The Company Law Board (CLB) wouldcontinue to be authority to adjudicate theclaims of depositors against the delinquentcompanies with powers to order in i t ia lpayment of a part of deposit, attach assetsof fraudulent financial company and appointRecovery Officer(s) for management of suchasset. The financial company would have
no recourse to the CLB to seek deferment ofthe depositors' dues.
(xii i ) The prohibitory provisions for unincorporatedbodies would continue in the FinancialCompanies Regulations Bill, but the role ofexercising the powers for enforcement ofthese provisions have been exclusivelyentrusted to State Governments, in additionto the powers under the respective State Lawsfor protecting the interests of investors infinancial establishments.
(xiv) There would be powers vested in the DistrictMagistrates to call for information and toproceed against delinquent unincorporatedbodies.
(xv) There would be a ban on the issue ofadvertisement for soliciting deposits by allunincorporated bodies, i rrespect ive o fwhether they are conduct ing f inancia lbusiness or not.
(xvi) Unauthorised deposit-taking by companies(a) whose applications for Certi f icate ofRegistration have been rejected, (b) whoseregistration has been cancelled, (c) whohave been prohibited from accepting publicdeposits would be a cognisable offence. Thesame would be the case for unregisteredf inancia l companies as wel l asunincorporated bodies.
(xvii) Powers would be vested with a police officerof the rank not below that o f theSuperintendent of Police of any State toorder invest igat ions into the a l legedviolations of requirement of registration byfinancial companies and prohibition fromacceptance of deposits by unincorporatedbodies.
(xviii) Penalt ies have been rat ional ised inaccordance with the severity of defaults,with the objective that the penalty shouldserve as a deterrent to others.
The Bill has been introduced in the Parliament in2000 and has since been referred to the StandingCommittee on Finance.
(...Concld.)
defaulting on repayment of deposits and interestpayments, and for attachment of assets ofdefaulters to ensure payment to depositors waspassed. It also provides for setting up of specialCourts to which the pending cases againstfinancial companies could be transferred. TheReserve Bank also advised State Governments/ Union Territories to enact such legislations.Eleven State Governments / Union Territorieshave since taken substantial steps in thisregard.
5. Business of the NBFC Sector
5.29 The broad profile of the NBFC sector for1998-99 and 1999-2000, based on theregulatory returns submitted by depositholding/accepting companies is presented inTable V.2. In view of the difference in thenumber of reporting companies in the twoyears, the data are not strictly comparable. Asat end-March 1999, the total outstanding publicdeposits of the 1,547 deposit holding companies

132
Report on Trend and Progress of Banking in India, 2000-01
Table V.2: Profile of the NBFC Sector(As at end-March)
(Amount in Rs. crore)
Item 1999 2000
NBFCs of which RNBCs NBFCs of which RNBCs
1 2 3 4 5
Number of reporting companies 1,547 11 1,005 9
Total Assets 47,048.50 11,080.50 51,324.26 11,317.31
Public Deposits 20,428.93 10,644.27 19,341.72 11,003.77
(52.1) (56.9)
Net Owned Funds 9,118.27 -666.39 6,222.89 -442.82
Notes: 1. Figures are provisional.2. Figures in brackets indicate percentages to total outstanding deposits of NBFCs.
(both registered and unregistered) aggregatedRs.20,429 crore, equivalent to 2.6 per cent ofthe outstanding deposits (Rs.7,71,129 crore) ofscheduled commercial banks (excluding RegionalRural Banks). In the case of 1,005 reportingcompanies, as at end-March 2000, the totalquantum of outstanding public deposits reportedby them was Rs.19,342 crore, equivalent to 2.2per cent of the aggregate deposits (Rs.8,96,696crore) of scheduled commercial banks.
5.30 The aggregate assets of the NBFC sectorincreased to Rs.51,324 crore as on March 31,2000, from Rs.47,049 crore, as on March 31, 1999.
5.31 The break-up of public deposits withinthe different categories of NBFCs is provided inTable V.3. Some of the companies haveconverted themselves into non deposit-holdingcompanies by repaying the deposits held bythem. At the disaggregated level, public depositswith the hire purchase companies and RNBCsincreased by 22.3 per cent and 3.4 per cent,respectively (Chart V.2).
6. Region-wise Composition of Depositsheld by NBFCs
5.32 The region-wise analysis is based on thenumber of deposit-holding/accepting NBFCsthat reported data to the Reserve Bank for theyears ending March 1999 and March 2000 (TableV.4 and Chart V.3). The NBFCs based in thesouthern region continued to account for asignificant share of the reporting NBFCs in bothyears although their share fell sharply from 23.7per cent of total public deposits at end-March1999, to 16.4 per cent at end-March 2000. Of
the NBFCs located in the southern region, themajor quantum of public deposits was held bythe NBFCs located in Chennai. The deposits ofNBFCs located in the western region declinedfrom 14.0 per cent at end-March 1999 to 12.6per cent at end-March 2000. The share ofdeposits of the NBFCs based in the northernregion to the total deposits of all NBFCs, recordedan increase from 2.4 per cent at March 1999 to2.7 per cent at March 2000, mainly due to anincrease in the share of public deposits held inNew Delhi. The share of deposits in the easternregion increased from 37.7 per cent of totaldeposits to 49.5 per cent mainly on account ofmobilisation of non-convertible debentures

133
Non-Banking Financial Companies
(NCDs) to the tune of Rs. 1,668 crore by oneGovernment-owned NBFC based in West Bengal.The public deposits reported by NBFCs in fourmetropolitan centres of Mumbai, New Delhi,Kolkata and Chennai accounted for Rs.14,403crore (70.5 per cent) and Rs.14,920 crore (77.1per cent), respectively, of the total deposits forthe years ending March 1999 and March 2000.
7. Interest Rate and Maturity Patternof Deposits with NBFCs
5.33 The maturity-wise analysis of depositsheld by NBFCs together with the interest raterange on the deposits is presented in TablesV.5 and V.6.
5.34 The broad trends indicate that NBFCs(other than RNBCs) had outstanding publicdeposits of Rs.9,785 crore as at end-March1999, which declined to Rs. 8,338 crore by end-March 2000. The decline of Rs.1,447 crore (14.8per cent) in public deposits was observed in 1-2 year, 2-3 year and 3-5 year maturities.However, the quantum of public deposits in thematurity bucket exceeding 5 years witnesseda significant jump, from Rs.168 crore at end-March 1999 to Rs.1,718 crore by end-March2000. This is mainly due to mobilisation of non-convertible debentures (NCDs) to the tune of
Rs. 1,668 crore by one Government-owned NBFCbased in West Bengal. In 1999, around 90 percent of the deposits were in the maturity bucketof 1-5 years, while as at end-March 2000, mostdeposits were in the maturity bucket '1-2 years','2-3 years' and 'exceeding 5 years'; the lastcategory comprising over one-fifth of the publicdeposits as at end-March 2000.
5.35 Interest rate-wise, there was a rise inthe quantum and percentage of deposits in theinterest rate range of 12-14 per cent. Thedeposits in this range increased from Rs. 2,337crore (23.9 per cent) in 1999 to Rs. 3,702 crore(44.4 per cent) (Chart V.4). Deposits withinterest rates of over 16 per cent declined fromRs. 3,645 crore to Rs. 1,144 crore, over the year.
8. Asset Profile of NBFCs
5.36 The information on the asset profile ofNBFCs (excluding RNBCs) based on reportingcompanies reveals that out of 1,536 companies,30 NBFCs with an asset size exceeding Rs.50crore accounted for 92 per cent of the totalassets. By end-March 2000, the number of suchcompanies increased to 66 and these accountedfor 91 per cent of the total assets of NBFC sector(Table V.7). Perceptible reduction in the numberof small companies was evidenced during the
Table V.3 : Activity–wise Profile of Public Deposits of NBFCs(As at end-March)
(Amount in Rs. crore)
Nature of Business Public Deposits Percentage Variation Col. (3) over Col. (2)
1999 2000
1 2 3 4
1. Equipment Leasing (EL) 1,172. 91 1,021.20 -12.9(5.7) (5.2)
2. Hire Purchase (HP) 3,339.78 4,083.54 22.3(16.3) (21.2)
3. Investment and Loan (IL) 4,455.80 2,517.46 -43.5(21.8) (13.0)
4. RNBCs 10,644.27 11,003.77 3.4(47.8) (56.9)
5. Other NBFCs* 816.17 715.75 -12.3(4.0) (3.7)
Total 20,428.93 19,341.72 -5.3(100.0) (100.0)
* includes Miscellaneous Non-Banking Companies, unregistered and unnotified Nidhis etc.Note: Figures in brackets indicate percentages to total.

134
Report on Trend and Progress of Banking in India, 2000-01
Table V.4: Region-wise break-up of Public Deposits held by Registeredand Unregistered NBFCs
(As at end-March)(Amount in Rs. crore)
1999 2000
Public Deposits Public Deposits
Region NBFCs NBFCs
No. Amount Per cent of which RNBCs No. Amount Per cent of which RNBCs
No. Amount Per cent No. Amount Per cent
1 2 3 4 5 6 7 8 9 10 11 12 13
Northern 204 484.07 2.4 — — — 251 529.04 2.7 — — —
North-Eastern 30 0.89 Neg. — — — 4 7.02 Neg. 1 5.55 0.1
Eastern 64 7,711.91 37.7 5 7,068.26 66.4 32 9,573.05 49.5 6 7,506.62 68.2
Central 244 4,533.94 22.2 4 3,574.73 33.6 124 3,623.41 18.7 2 3,491.64 31.7
Western 180 2,851.08 14.0 1 0.27 Neg. 86 2,441.17 12.6 — — —
Southern 825 4,847.04 23.7 1 1.01 Neg. 508 3,168.07 16.4 — — —
Total 1,547 20,428.93 100.0 11 10,644.27 100.0 1,005 19,341.76 100.0 9 11,003.81 100.0
Memorandum Items:
Mumbai 123 2,405.04 11.8 — — — 68 2,381.21 12.3 — — —
Chennai 408 3,843.13 18.8 — — — 340 2,577.56 13.3 — — —
Kolkata 38 7,702.53 37.7 5 7,068.26 66.4 28 9,508.53 49.2 5 7,446.67 67.5
New Delhi 90 452.17 2.2 — — — 122 452.65 2.3 — — —
Neg.- Negligible
Table V.5: Maturity Pattern of Deposits held by NBFCs @(As at end-March)
(Amount in Rs. crore)
Maturity Period Amount of Deposits Variation of Col. 2 over Col.3
1999 2000 Amount Per cent
1 2 3 4 5
Less than 1 year 1,694.59 1,323.45 -371.14 -21.9
(17.3) (15.9)1-2 years 2,904.34 1,615.94 -1,288.40 -44.4
(29.7) (19.4)2-3 years 2,895.80 2,462.48 -433.32 -15.0
(29.6) (29.5)3-5 years 2,122.16 1,218.45 -903.71 -42.6
(21.7) (14.6)
5 years and above 167.77 1,717.63 1,549.86 923.8
(1.7) (20.6)
Total 9,784.66 8,337.95 -1,446.71 -14.8
(100.0) (100.0)
@ On the basis of residual maturity of outstanding deposits (excluding RNBCs).Note:Figures in brackets are percentages to total.

135
Non-Banking Financial Companies
year 2000. The number of companies in theasset range of Rs.25 lakh to Rs.10 crore declinedfrom 1,442 in 1999 to 840 companies in 2000.
9. Distribution of Assets of NBFCs according to Activity
5.37 The major portion of the assets of NBFCs(excluding RNBCs) are in the form of hirepurchase and equipment leasing assets. Thesetwo portfolios constituted 42.9 per cent of thetotal assets of NBFCs as at end-March 2000. Theloans and inter-corporate deposit (ICD) portfoliosaccounted for 26.4 per cent of the assets of theNBFCs (Table V.8).
10. Analysis of Borrowings by NBFCs
5.38 The borrowings by NBFCs (excludingRNBCs) for the years ended March 1999 and2000 are presented in Table V.9. As evidentfrom the Table, total borrowings registered amarginal decline of 0.8 per cent, the decline ismore pronounced in inter-corporate borrowings(40.1 per cent) , money raised throughconvertible bonds or secured debentures (16.3per cent) and borrowings from financialinstitutions (10.4 per cent). Money raisedthrough commercial paper increased fromRs.465 crore to Rs.554 crore and borrowingsthrough other sources increased from Rs. 4,130crore to Rs. 6,480 crore (Chart V.5).
11. Net Owned Funds of NBFCs
5.39 Net owned fund (NOF) of NBFCs is theaggregate of paid-up capital and free reserves,netted by (i) the amount of accumulated balanceof loss, (ii) deferred revenue expenditure andother intangible assets, if any, and furtherreduced by investments in shares and loansand advances to (a) subsidiaries, (b) companiesin the same group and (c) other NBFCs, inexcess of 10 per cent of owned fund.
5.40 The data on NOF of NBFCs for the years1999 and 2000 presented in Table V.10, revealsthat the number of companies having NOF uptoRs. 25 lakh have declined from 736 as at end-March 1999 to 205 as at end-March 2000. Thisreduction, to an extent, is reflected in the declineof number of reporting companies by 540 duringthe same period.
Table V.6: Distribution of NBFC Deposits according to Rate of Interest @(As at end-March)
(Amount in Rs. crore)
Interest Range Amount of deposits Per cent to total deposits(per cent)
1999 2000 1999 2000
1 2 3 4 5
Upto10 52.38 22.96 0.5 0.310-12 87.49 588.50 0.9 7.112-14 2,336.67 3,702.08 23.9 44.414-16 3,662.74 2,880.79 37.4 34.6More than 16 3,645.38 1,143.62 37.3 13.6
Total 9,784.66 8,337.95 100.0 100.0
@ Excluding RNBCs.

136
Report on Trend and Progress of Banking in India, 2000-01
fund-based income, the decline in expenditurewas more pronounced, with the result that thenet profits of NBFCs increased by 14.2 per centfrom Rs.120 crore in 1998-99 to Rs.137 crore in1999-2000. The fee-based income of thereporting NBFCs has registered an increase ofRs. 213 crore (Table V.11).
13. Capital Adequacy Ratio
5.42 The capital adequacy norms were madeapplicable to NBFCs in 1998. The norms relatingto capital adequacy ratio (CAR) stipulate thatevery NBFC shall maintain a minimum capitalratio consisting of tier I and tier II capital thatshall not be less than (a) 10 per cent on or beforeMarch 31, 1998; and (b) 12 per cent on or beforeMarch 31, 1999, of its aggregate risk-weightedassets and of risk-adjusted value of off-balancesheet items. The total of tier II capital, at anypoint of time, shall not exceed 100 per cent oftier I capital. Table V.12 presents CAR of thereporting companies for the years ended March1999 and March 2000, respectively.
14. Other Developments
Role of BFS in Monitoring NBFCs
5.43 Considering the manifold growth of thenon-banking financial companies in the early
12. Income Expenditure Statement ofNBFCs
5.41 The profitability analysis of the NBFCsindicates that the net profits of theseinstitutions registered an increase during theyear 1999-2000. While income witnessed adecline of 0.6 per cent, largely due to a drop in
Table V.7: Asset Profile of NBFCs*(As at end-March)
Range of Assets No. of reporting Percentage(Rs. crore) companies Variation of Col.
(5) over Col. (4)1999 2000 1999 2000
1 2 3 4 5 6
1. Less than 0.25 736 82 30.15 7.86 -73.9
2. 0.25 - 0.50 319 95 49.15 36.36 -26.0
3. 0.50 - 2 332 397 307.41 434.32 41.3
4. 2 - 10 55 266 961.49 1,142.02 18.8
5. 10 - 50 64 90 1,701.31 1,921.11 12.9
6. 50 - 100 11 16 1,709.95 1,114.35 -34.8
7. 100 - 500 18 28 8,122.76 7,825.22 -3.7
8. Above 500 1 22 23,085.78 27,525.71 19.2
Total 1,536 996 35,968.00 40,006.95 11.2
* The 996 reporting NBFCs (excluding RNBCs) have been regrouped on the basis of their asset size as on end-March1999 and end-March 2000.
Assets(Rs. crore)

137
Non-Banking Financial Companies
Table V.8: Activity-wise Distribution of Assets of NBFCs @(As at end-March)
Activity Amount in Rs.crore Per cent
1999 2000 1999 2000
1 2 3 4 5
Loans & ICD 2,158.11 10,561.35 6.0 26.4
Investments 4,352.13 5,578.65 12.1 13.9
Hire Purchase 13,128.29 12,016.79 36.5 30.0
Equipment & Leasing 3,165.18 5,146.70 8.8 12.9
Bills 1,095.56 1,280.09 3.0 3.2
Other assets 12,068.73 5,423.37 33.6 13.6
Total 35,968.00 40,006.95 100.0 100.0
@ excluding RNBCs.The share under Loans & ICD has increased because of appropriate classification of assets in 2000, which wereearlier booked under the head ‘Other Assets’.
nineties and with a view to having an integratedapproach to the entire financial sector, thesupervision of NBFC sector was brought underthe jurisdiction of the Board for FinancialSupervision (BFS) with effect from July 1, 1995.
Since then, the BFS has been serving as animportant supervisory body for direction,formulation and overseeing the implementationof policy as well as supervision of NBFCs.Approval of BFS is obtained before any important
Table V.9: Classification of Borrowings by NBFCs (excluding RNBCs)(As at end-March)
(Amount in Rs. crore)
Item 1999 2000
1 2 3
Money borrowed from Central/State Government @ 2,739.59 2,603.60(12.1) (11.6)
Money borrowed from foreign sources* 624.18 601.32(2.8) (2.7)
Inter-corporate borrowings 3,076.48 1,842.74(13.6) [8.2)
Money raised by issue of convertible or secured debentures, 4,001.78 3,348.82including those subscribed by banks (17.7) (14.9)
Borrowings from banks 6,038.10 5,632.77(26.7) (25.1)
Borrowings from Financial Institutions 1,544.76 1,384.47(6.8) (6.1)
Commercial Paper 465.23 554.42(2.1) (2.5)
Others # 4,130.47 6,480.24(18.3) (28.9)
Total 22,620.59 22,448.38(100.0) (100.0)
@ Mainly by State-Government owned companies. * The amount received from foreign collaborators as well as from institutional investors (Asian Development Bank,
International Finance Corporation, etc.). The major amount is in infrastructure and leasing companies. # Includes security deposits from employees and caution money, allotment money, borrowings from mutual funds,
Directors, etc.Note:Figures in brackets are percentages to total.

138
Report on Trend and Progress of Banking in India, 2000-01
Table V.10: Net Owned Funds vis-à-vis Public Deposits of NBFCs @(As at end-March)
(Amount in Rs. crore)
Range of 1999 2000
NOFNo. of Net Public Public No. of Net Public PublicAmounts
reporting Owned Deposits Deposits reporting Owned Deposits Depositscompanies Fund as companies Fund as
multiple multipleof NOF of NOF
1 2 3 4 5 6 7 8 9
Upto 0.25 736 38.08 650.22 17.1 205 -215.15 394.78 -1.8
0.25 - 0.50 319 70.43 115.51 1.6 360 116.17 194.20 1.7
0.50 - 5.0 332 442.74 1,067.55 2.4 314 501.98 362.86 0.7
5 - 10 55 336.37 264.71 0.8 43 294.12 202.13 0.7
10 - 50 64 1,285.08 2,107.15 1.6 46 1,060.24 2,773.16 2.6
50 - 100 11 786.99 1,271.05 1.6 9 628.40 877.58 1.4
100 - 500 18 3,946.07 4,286.73 1.1 19 4,279.95 3,533.24 0.8
Above 1,000 1 1,120.83 21.74 0.02 — — — —
Total 1,536 8,026.59 9,784.66 1.2 996 6,665.71 8,337.95 1.3
@ Excluding RNBCs.Note:There were no reporting companies with NOF of above Rs.1,000 crore as at end-March 2000.
Table V.11: Financial Performance of NBFCs*
(Amount in Rs. crore)
Item 1998-99 1999-2000 Variation of Col. (3)over Col. (2)
1 2 3 4 5
Absolute Percentage
A. Income (i+ii) 6,809 6,770 -39 -0.6i) Fund 6,551 6,299 -252 -3.8i i ) Fee 258 471 213 82.6
B. Expenditure (i+ii+iii) 6,416 6,363 -53 -0.8i) Financial 4,355 3,687 -668 -15.3i i ) Operating 1,077 1,614 537 49.9ii i ) Other 984 1,062 78 7.9
C. Tax Provisions 273 270 -3 -1.1D. Net Profit 120 137 17 14.2E. Total Assets 35,968 40,007 4,039 11.2F. Financial Ratios @
i) Income 18.9 16.9 -2.0 —ii ) Fund Income 18.2 15.7 -2.5 —iii ) Fee Income 0.7 1.2 0.5 —iv) Expenditure 17.8 15.9 -1.9 —v) Financial Expenditure 12.1 9.2 -2.9 —vi) Operating Expenditure 3.0 4.0 1.0 —vii) Other Expenditure 2.7 2.7 -0.1 —viii)Tax Provisions 0.8 0.7 -0.1 —
ix) Net Profit 0.3 0.3 0.0 —
* excluding RNBCs.@ Ratios to Total Assets

139
Non-Banking Financial Companies
policy change and amendments in theregulatory framework of NBFCs are carried out.BFS also serves as an important forum fordeciding the course of action against problemcompanies and monitoring their status on anon-going basis. In addition to information noteson specific companies, quarterly reports on thestatus of large, weak and problem companies arediscussed in BFS meetings. Furthermore, half-yearly reports on the performance of the NBFCsector are also put up for information of BFS.
Close Monitoring of Errant NBFCs
5.44 The Reserve Bank continued to keep closesurveillance on large NBFCs, particularly thosewhich had difficulties in honouring commitmentsto depositors and against whom Company LawBoard (CLB) had issued orders for repayment ofdeposits. The implementation of CLB orders isbeing monitored by Regional Co-ordinationCommittees formed at Chennai, Kolkata, NewDelhi and Mumbai with representatives fromDepartment of Company Affairs and EconomicOffences Wing of State Governments.
Institutionalised Decision-making Mechanism
5.45 The Informal Advisory Group for NBFCsconstituted by the Reserve Bank in January1998 consists of representatives from theInstitute of Chartered Accountants of India,national level Associations of NBFCs, chiefexecutive officers of two large NBFCs, besides
the Reserve Bank. The Group meets atquarterly intervals to deliberate on regulatoryissues relating to NBFCs for aiding decision-making process, and serves as a usefulinstitutionalised framework for periodicalconsultation with various associations ofNBFCs. The term of the Group has beenextended to June 2002.
Developmental Aspects
5.46 The NBFCs are widely dispersed acrossthe country and their managements exhibitvaried degrees of professional ism.Furthermore, the depositors have varieddegrees of perceptions regarding safety of theirdeposits while making an investment decision.Therefore, a need was felt for educating thedepositors about the regulations of NBFCs, thepersonnel of NBFCs and their auditors abouttheir obligation to the regulator and thepersonnel of enforcement bodies like police andState Government departments about their rolein curbing unscrupulous activities. The TaskForce on NBFCs had also suggested that the StateGovernments should be increasingly involved incurbing the illegal and unauthorised deposittaking activit ies of the NBFCs andunincorporated bodies engaged in the financialbusiness. The Reserve Bank also receivedrequests from a number of State Governmentsfor conducting seminars/programmes for theircivil and police officials on various aspects oflegal and supervisory issues pertaining to
Table V.12: Distribution of Reporting NBFCs by CRAR(As at end-March)
CRAR 1999 2000Range
EL HP LC/IC RNBC Total EL HP LC/IC RNBC Total(per cent)
1 2 3 4 5 6 7 8 9 10 11
Less than 10 11 33 39 1 84 7 11 12 2 32
10-12 1 1 2 — 4 — — 1 — 1
12-15 1 7 10 — 18 1 3 3 — 7
15-20 7 27 15 1 50 3 31 8 — 42
20-30 10 71 37 — 118 12 52 16 1 81
Above 30 27 144 230 2 403 23 253 159 1 436
Total 57 283 333 4 677 46 350 199 4 599

140
Report on Trend and Progress of Banking in India, 2000-01
NBFCs. Accordingly, the Reserve Bank hasorganised focussed training programmes/seminars/workshops for personnel of NBFCsand enforcement agencies.
Publicity Campaign for NBFC Depositors
5.47 The elaborate publicity campaign foreducating depositors through advertisementswhich began in July 1998 continued throughthe year. The campaign has since been fine-tuned with a three-pronged strategy comprisingadvertisements in print media, spots onelectronic media and informal publicity throughseminars and press meets elucidating the stepstaken for ensuring protection of depositors’interests.
Committee for Redesigning Balance Sheet Formatfor NBFCs
5.48 The Committee for Redesigning ofFinancial Statements of Non-Banking FinancialCompanies (Chairman: Shri V.S.N.Murty),submitted its Report in September 1999. Itrecommended revised formats for balancesheets which essentially follows the existingformats prescribed under the Companies Act,with additional disclosures in respect ofmaturity profile of assets and liabilities, sector-wise concentration of assets and liabilities,details in respect of overdue loans and othercredits, non-performing assets and provisioningthereagainst, valuation of investments, etc., asschedules to the main balance sheet as well asthe formats for these additional schedules. Twosalient recommendations of the Committee viz.,uniform accounting year ending on March 31,and constitution of audit committees for NBFCs
having asset size of Rs.50 crore and above havebeen implemented. Other recommendations ofthe Committee are under the consideration ofthe Reserve Bank.
Asset Securitisation
5.49 The Government of India constituted anExpert Committee (Chairman: Shri T.R.Andhyarujina) for the purpose of formulatingspecific proposals to give effect to the suggestionsmade by the Committee on Banking SectorReforms (Chairman: Shri M. Narasimham)relating to changes needed in the legalframework. The Committee submitted its Reportin February 2000. As a fol low up, theGovernment of India constituted a WorkingGroup (Chairman: Shri S.H. Bhojani, with ShriM.R.Umarji as a member from the Reseve Bank)on asset securitisation in July 2000 to examinethe Expert Committee's recommendations forimplementation. The Working Group has drafteda Bill on asset securitisation and submitted thesame to the Government.
Foreclosure Laws
5.50 The Government of India constituted aWorking Group (Chairman: Shri M.R. Umarji) inJuly 2000 to examine the recommendations ofthe Andhyarujina Expert Working Group onForeclosure Laws regarding vesting of powerswith banks and financial institutions for takingpossession and sale of securities without theintervention of the courts and to draft a bill forconsideration of the Government. The WorkingGroup submitted its report to the Governmentalong with the draft Bill in May 2001.
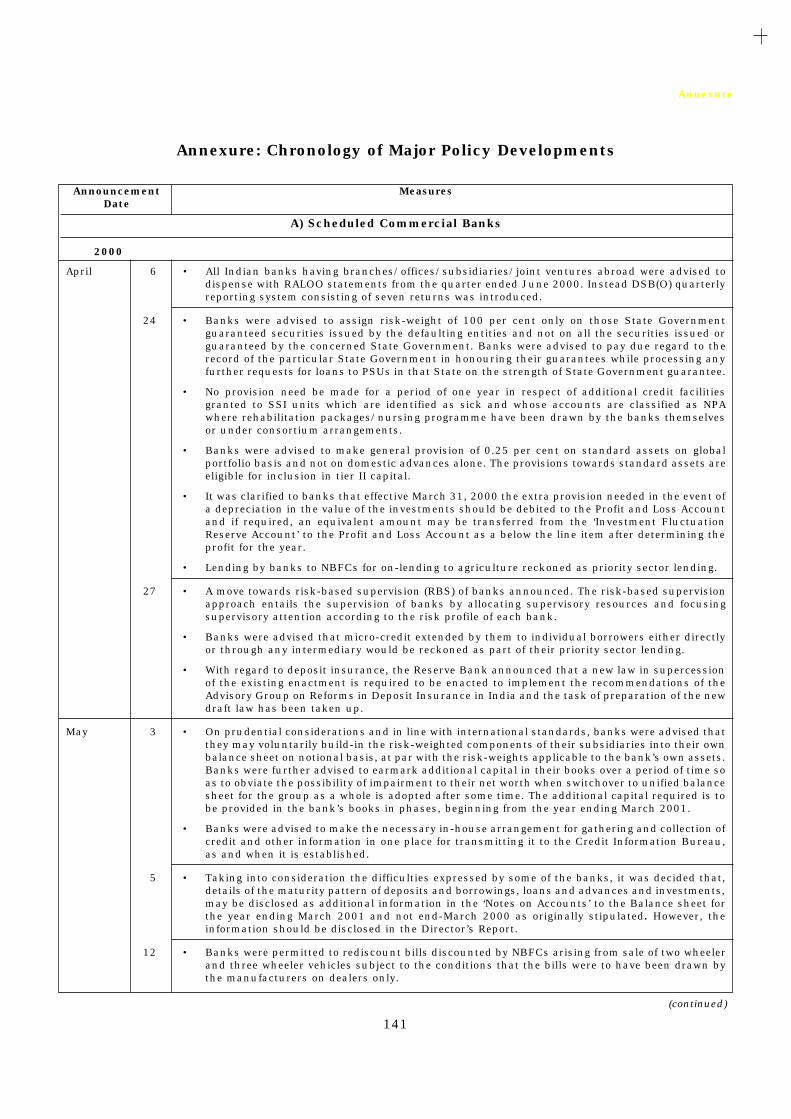
141
Annexure
A) Scheduled Commercial Banks
April 6 • All Indian banks having branches/offices/subsidiaries/joint ventures abroad were advised todispense with RALOO statements from the quarter ended June 2000. Instead DSB(O) quarterlyreporting system consisting of seven returns was introduced.
24 • Banks were advised to assign risk-weight of 100 per cent only on those State Governmentguaranteed securities issued by the defaulting entities and not on all the securities issued orguaranteed by the concerned State Government. Banks were advised to pay due regard to therecord of the particular State Government in honouring their guarantees while processing anyfurther requests for loans to PSUs in that State on the strength of State Government guarantee.
• No provision need be made for a period of one year in respect of additional credit facilitiesgranted to SSI units which are identified as sick and whose accounts are classified as NPAwhere rehabilitation packages/nursing programme have been drawn by the banks themselvesor under consortium arrangements.
• Banks were advised to make general provision of 0.25 per cent on standard assets on globalportfolio basis and not on domestic advances alone. The provisions towards standard assets areeligible for inclusion in tier II capital.
• It was clarified to banks that effective March 31, 2000 the extra provision needed in the event ofa depreciation in the value of the investments should be debited to the Profit and Loss Accountand if required, an equivalent amount may be transferred from the ‘Investment FluctuationReserve Account’ to the Profit and Loss Account as a below the line item after determining theprofit for the year.
• Lending by banks to NBFCs for on-lending to agriculture reckoned as priority sector lending.
27 • A move towards risk-based supervision (RBS) of banks announced. The risk-based supervisionapproach entails the supervision of banks by allocating supervisory resources and focusingsupervisory attention according to the risk profile of each bank.
• Banks were advised that micro-credit extended by them to individual borrowers either directlyor through any intermediary would be reckoned as part of their priority sector lending.
• With regard to deposit insurance, the Reserve Bank announced that a new law in supercessionof the existing enactment is required to be enacted to implement the recommendations of theAdvisory Group on Reforms in Deposit Insurance in India and the task of preparation of the newdraft law has been taken up.
May 3 • On prudential considerations and in line with international standards, banks were advised thatthey may voluntarily build-in the risk-weighted components of their subsidiaries into their ownbalance sheet on notional basis, at par with the risk-weights applicable to the bank’s own assets.Banks were further advised to earmark additional capital in their books over a period of time soas to obviate the possibility of impairment to their net worth when switchover to unified balancesheet for the group as a whole is adopted after some time. The additional capital required is tobe provided in the bank’s books in phases, beginning from the year ending March 2001.
• Banks were advised to make the necessary in-house arrangement for gathering and collection ofcredit and other information in one place for transmitting it to the Credit Information Bureau,as and when it is established.
5 • Taking into consideration the difficulties expressed by some of the banks, it was decided that,details of the maturity pattern of deposits and borrowings, loans and advances and investments,may be disclosed as additional information in the ‘Notes on Accounts’ to the Balance sheet forthe year ending March 2001 and not end-March 2000 as originally stipulated. However, theinformation should be disclosed in the Director’s Report.
12 • Banks were permitted to rediscount bills discounted by NBFCs arising from sale of two wheelerand three wheeler vehicles subject to the conditions that the bills were to have been drawn bythe manufacturers on dealers only.
Annexure: Chronology of Major Policy Developments
Announcement MeasuresDate
2000
(continued)
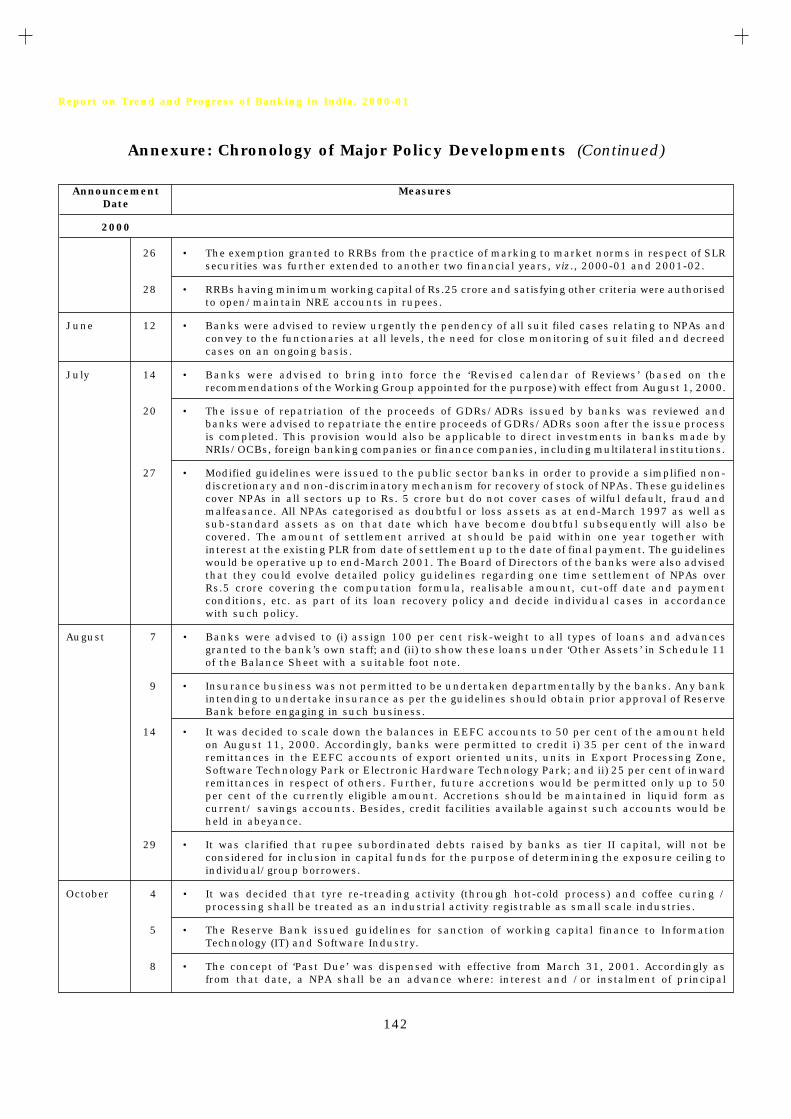
142
Report on Trend and Progress of Banking in India, 2000-01
Annexure: Chronology of Major Policy Developments (Continued)
Announcement MeasuresDate
2000
26 • The exemption granted to RRBs from the practice of marking to market norms in respect of SLRsecurities was further extended to another two financial years, viz., 2000-01 and 2001-02.
28 • RRBs having minimum working capital of Rs.25 crore and satisfying other criteria were authorisedto open/maintain NRE accounts in rupees.
June 12 • Banks were advised to review urgently the pendency of all suit filed cases relating to NPAs andconvey to the functionaries at all levels, the need for close monitoring of suit filed and decreedcases on an ongoing basis.
July 14 • Banks were advised to bring into force the ‘Revised calendar of Reviews’ (based on therecommendations of the Working Group appointed for the purpose) with effect from August 1, 2000.
20 • The issue of repatriation of the proceeds of GDRs/ADRs issued by banks was reviewed andbanks were advised to repatriate the entire proceeds of GDRs/ADRs soon after the issue processis completed. This provision would also be applicable to direct investments in banks made byNRIs/OCBs, foreign banking companies or finance companies, including multilateral institutions.
27 • Modified guidelines were issued to the public sector banks in order to provide a simplified non-discretionary and non-discriminatory mechanism for recovery of stock of NPAs. These guidelinescover NPAs in all sectors up to Rs. 5 crore but do not cover cases of wilful default, fraud andmalfeasance. All NPAs categorised as doubtful or loss assets as at end-March 1997 as well assub-standard assets as on that date which have become doubtful subsequently will also becovered. The amount of settlement arrived at should be paid within one year together withinterest at the existing PLR from date of settlement up to the date of final payment. The guidelineswould be operative up to end-March 2001. The Board of Directors of the banks were also advisedthat they could evolve detailed policy guidelines regarding one time settlement of NPAs overRs.5 crore covering the computation formula, realisable amount, cut-off date and paymentconditions, etc. as part of its loan recovery policy and decide individual cases in accordancewith such policy.
August 7 • Banks were advised to (i) assign 100 per cent risk-weight to all types of loans and advancesgranted to the bank’s own staff; and (ii) to show these loans under ‘Other Assets’ in Schedule 11of the Balance Sheet with a suitable foot note.
9 • Insurance business was not permitted to be undertaken departmentally by the banks. Any bankintending to undertake insurance as per the guidelines should obtain prior approval of ReserveBank before engaging in such business.
14 • It was decided to scale down the balances in EEFC accounts to 50 per cent of the amount heldon August 11, 2000. Accordingly, banks were permitted to credit i) 35 per cent of the inwardremittances in the EEFC accounts of export oriented units, units in Export Processing Zone,Software Technology Park or Electronic Hardware Technology Park; and ii) 25 per cent of inwardremittances in respect of others. Further, future accretions would be permitted only up to 50per cent of the currently eligible amount. Accretions should be maintained in liquid form ascurrent/ savings accounts. Besides, credit facilities available against such accounts would beheld in abeyance.
29 • It was clarified that rupee subordinated debts raised by banks as tier II capital, will not beconsidered for inclusion in capital funds for the purpose of determining the exposure ceiling toindividual/group borrowers.
October 4 • It was decided that tyre re-treading activity (through hot-cold process) and coffee curing /processing shall be treated as an industrial activity registrable as small scale industries.
5 • The Reserve Bank issued guidelines for sanction of working capital finance to InformationTechnology (IT) and Software Industry.
8 • The concept of ‘Past Due’ was dispensed with effective from March 31, 2001. Accordingly asfrom that date, a NPA shall be an advance where: interest and /or instalment of principal

143
Annexure
Annexure: Chronology of Major Policy Developments (Continued)
Announcement MeasuresDate
2000
remain overdue for a period of more than 180 days in respect of a Term Loan; (ii) the accountremains ‘Out of order’ for a period of more than 180 days, in respect of an Overdraft/CashCredit (OD/CC); (iii)the bill remains overdue for a period of more than 180 days, in the case ofbills purchased and discounted; (iv) interest and/or instalment of principal remains overdue fortwo harvest seasons but not exceeding two half years in the case of an advance granted foragricultural purposes; and (v) any amount to be received remains overdue for a period of morethan 180 days in respect of other accounts.
10 • General provision on standard assets was allowed to be included in tier II capital.
• In order to bring more transparency to the balance sheets of public sector banks and as afurther step towards consolidated supervision and to provide additional disclosures, it was decidedthat public sector banks should annex the balance sheet, Profit and Loss Account, Report of theBoard of Directors and the Report of the Auditors in respect of each of their subsidiaries to theirbalance sheet beginning from the year ending March 31, 2001.
• The concept of “past due” (grace period of 30 days) which was incorporated into the two quarterdelinquency norm on income recognition, asset classification and provisioning introduced inApril 1992, would be dispensed with, effective March 31, 2001.
• After a review of current practices regarding credit exposure limits vis-à-vis international bestpractices, it was decided to prepare a detailed Discussion Paper on the subject which was expectedto be finalised by December 2000. Based on the comments and suggestions on the issues, andfollowed by an interaction with banks, the Reserve Bank would take a final view on the approachthat should be adopted with a view to making it effective from end-March 2002.
• On a review of the August 14, 2000 measure relating to EEFC accounts, it was decided torestore fully the earlier entitlement of i) 70 per cent of the inward remittances in the EEFCaccounts of export oriented units, units in Export Processing Zone, Software Technology Park orElectronic Hardware Technology Park; and ii) 50 per cent of inward remittances in respect ofothers.
• To provide further operational autonomy, banks were given freedom to decide on charging penalinterest to borrowers and may formulate transparent policy for the same with the approval oftheir Boards.
• On a review of market conditions and with a view to providing flexibility to banks in prescribingmargins, the prescription of minimum margin of 15 per cent under selective credit control onfree sale sugar was withdrawn. Margins on free sale sugar would be decided by the banks basedon their commercial judgement.
• Public sector banks were advised to set monthly targets for issue of Kisan Credit Card to farmerborrowers within the yearly target fixed for the bank and draw action plan for achieving theoverall target.
• Restrictions on transferability period of CDs issued by banks were withdrawn.
16 • The Reserve Bank circulated the revised guidelines relating to categorisation and valuationof banks’ investment portfolio. The guidelines were effective from the half year endedSeptember 30, 2000.
• As regards the flow of credit to SSI sector, in the light of the decision of the Group of Ministers,the Reserve Bank advised banks to take the following measures, (i) Banks may, while sanctioning/renewing credit limits to their large corporate borrowers (i.e., borrowers who enjoy workingcapital limits of Rs.10 crore and above from the banking system), fix separate sub-limits, withinthe overall limits, specifically for meeting payment obligations in respect of purchases fromSSIs either on cash basis or bill basis, (ii) the size of such sub-limits, may be decided by bankstaking into account the projected purchases by corporate borrowers from the SSls during a yearin relation to their total purchase and other relevant factors, (iii) ensuring that sale proceeds/other receipts of the borrower are credited to this account on a pro rata basis.
• The categories of bank credit for imports exempted from the levy of interest rate surcharge are:

144
Report on Trend and Progress of Banking in India, 2000-01
Annexure: Chronology of Major Policy Developments (Continued)
Announcement MeasuresDate
2000
(i) Export packing credit provided at concessive rate of interest to meet the cost of importedinputs; (ii) Import of capital goods by bonafide borrower-importers under valid Licences issuedunder the Export Promotion Capital Goods Scheme (EPCG Scheme); (iii) all bonafide importsincluding import of capital goods by Export-Oriented Units (EOUs) and units in the ExportProcessing Zones (EPZs); (iv) all bonafide imports under Advance Licences granted for import of“Inputs” such as raw materials, intermediates, components, etc., by either the original holderor a transferee (if transferred under an endorsement of the Directorate General of Foreign Tradeenabling such transfer); (v) all bonafide imports against the credit under the Duty EntitlementPass Book (DEPB) Scheme contained in the EXIM Policy 1997-2002; (vi) Bulk Imports in respectof crude oil, petroleum products, fertilizers, edible oils and other essential commodities importedthrough Government Agencies; (vii) import of crude oil by private and joint sector refineries foractual use in their own refineries, (viii) All bonafide imports under duty free replenishmentcertificate (DFRC) scheme, GEM Replenishment License and Diamond Imprest –License; and(ix) All bonafide imports including import of capital goods by units under Electronic HardwareTechnology Park (EHTP), Software Hardware Technology Park (STP) and special Economic Zone(SEZ) schemes.
November 9 • A series of preventive measures were suggested by Reserve Bank to prevent frauds: (i) Whileopening deposit accounts, banks are required to obtain from customers their photograph andan introduction from an existing customer; (ii) Banks were advised to observe safeguards whileissuing Letters of Credit (LCs) to their customers enjoying credit facilities; and (iii) banks mustlay out clear instructions for their branch staff in respect of loan accounts where such non-funded facilities have become funded.
10 • As recommended by the RBI-SEBI Technical Committee it was decided that within the overallexposure to sensitive sectors, a bank’s exposure to capital market by way of investments inshares, convertible debentures and units of mutual funds (other than debts funds) throughprimary or secondary markets should not exceed 5 per cent of the bank’s total outstandingdomestic credit (excluding inter-bank lendings and advances outside India) as on March 31 ofthe previous year.
20 • It was decided that no provision need be made for a period of one year in respect of additionalcredit facilities granted to SSI units which are identified as sick, and where rehabilitationpackages/nursing programmes have been drawn by the banks themselves or under consortiumarrangements.
23 • The existing practice of banks submitting credit proposals above Rs. 1 crore to the ReserveBank for its prior approval under selective credit control has been discontinued. Banks havefreedom to sanction such credit proposals in terms of their individual loan policies.
December 11 • It was decided that loans to the software industry having credit limit upto Rs. one crore from thebanking system, will be eligible for inclusion under priority sector. However, small loans givento software professionals etc. upto Rs.5 lakh will continue to be covered and reported under theexisting category of “loans to professionals and self-employed”. Other advances to softwareindustry may be reported under a separate head “Software Industry” in the annual statementsof priority sector advances.
2001
January 3 • The guidelines for licensing of new banks in the private sector were revised indicating that: (i)initial minimum paid-up capital for the new bank shall be Rs.200 crore, to be raised to Rs.300crore within 3 years of commencement of business, (ii) the promoter’s contribution shall be aminimum of 40 per cent of the paid-up capital of the bank at any point of time, (iii) whileaugmenting the capital base to Rs.300 crore, the promoters will have to bring in additionalcapital, which would be at least 40 per cent of the fresh capital raised, (iv) NRI participation inthe primary equity of a new bank shall be to a maximum extent of 40 per cent, (v) the new bankshould not be promoted by a large industrial house. However, individual companies, directly or

145
Annexure
Annexure: Chronology of Major Policy Developments (Continued)
Announcement MeasuresDate
2001
indirectly connected with large industrial houses may be permitted to participate in the equityof a new private sector bank upto a maximum of 10 per cent but will not have controllinginterest in the bank, (vi) the proposed bank shall maintain arms length relationship with businessentities in the promoter group and the individual companies investing upto 10 per cent of theequity as stipulated above.
6 • Interest-rate surcharge of 50 per cent on bank finance was withdrawn.
18 • It was decided to consider the amounts held under the head “Building Fund” also as eligible tobe treated as part of free reserves, to be taken into account for calculating “Capital Funds” forthe purpose of determining exposure norms by urban co-operative banks.
29 • With regard to payment of balances in the accounts of the deceased customers to survivors/claimants, it was clarified that banks may call for succession certificate from legal heirs ofdeceased depositors if there are disputes and all legal heirs do not join in indemnifying the bankor in certain other exceptional cases where the bank has a reasonable doubt about thegenuineness of the claimant/s being the legal heir/s of the depositor.
February 2 • The Reserve Bank advised banks about the exemption granted by the Ministry of Home Affairsto all associations from provision of Foreign Contribution (Regulation) Act, 1976 to accept foreigncontributions, in cash or kind, to provide relief to earthquake victims without obtaining a formalapproval of the Central Government.
6 • In order to provide relief to the exporters, affected by earthquake of 2001 it was decided toextend the following concessions:
i) Extension of pre-shipment credit
In cases where shipment is likely to be delayed beyond the specified time due to the calamity,banks may, after satisfying themselves of the genuineness of the case, extend upto 180 days,pre-shipment credit granted for periods less than 180 days (based on the production cycle), atthe interest rate applicable for the period upto 180 days (10 per cent per annum) and for periodbeyond 180 days and upto 360 days, banks may charge concessional rate applicable for theperiod beyond 180 days and upto 270 days (13 per cent per annum). Extension of credit beyond360 days may also be considered, where necessary, on the basis of bank’s commercial judgementand discretion at the rate applicable for “ECNOS-Pre-shipment” and with the approval of thebank’s Board.
In case where the pre-shipment credit has been granted in foreign currency, extension beyond180 days may be allowed as per the actual cost of roll-over instead of applying 2 per cent overthe rate charged for the period upto 180 days as per extant instructions.
(ii) Conversion of dues into short-term loans
Banks may convert the overdue pre-shipment credit, wherever considered necessary, into ashort-term loan repayable within a reasonable period of time after taking into account thesettlement of ECGC claim, if any, in respect of guarantees taken by the bank. Penal interestwhich is now required to be decided by the banks should not be charged from the date ofadvance in case of non-shipment in such cases.
(iii) Application of asset classification norm
Banks need not classify as NPA the pre-shipment credit granted to exporters if period of credithas been extended in terms of paragraph (i) above or where the pre-shipment credit has beenconverted into short-term loan in terms of paragraph (ii) above. The advances will be treated asNPA if the interest and/or instalment of principal remains unpaid for 180 days after it hasbecome overdue taking into account the revised due dates fixed by the banks after extension ofthe period or conversion of the pre-shipment credit, as the case may be.

146
Report on Trend and Progress of Banking in India, 2000-01
Annexure: Chronology of Major Policy Developments (Continued)
Announcement MeasuresDate
2001
28 • Banks were advised to assign 20 per cent risk-weight on all loans and advances to staff whichwere fully covered by superannuation benefits and mortgage of flat/house and classify under‘Advances’ in Schedule 9 of the balance sheet all interest bearing loans and advances granted totheir staff. However, all non-interest bearing loans and advances to their own staff was to beincluded in “Others” under “Other Assets” in Schedule 11 of the balance sheet.
March 2 • The Reserve Bank of India granted ‘in principle’ approval to four entities (1) Bank of AmericaSecurities (India) Pvt. Ltd. 2) Bank of Baroda (subsidiary to be established) 3) HSBC PrimaryDealership (India) Pvt. Ltd. 4) Standard Chartered - UTI securities India Pvt. Ltd. to be accreditedas Primary Dealers in the Government Securities Market.
• With regard to the provision of credit to SSI sector, in line with the recommendations of the NayakCommittee, banks were advised to make further improvements towards: (a) delegation of adequatediscretionary powers to branch officials for sanction of credit facilities, (b) issuing acknowledgementsof loan proposals received, (c) providing technical expertise in branches, (d) providing credit to tinysector, (e) maintenance of loan application registers in a comprehensive manner, (f) referring proposalsliable for rejection/curtailment in the amount of finance to the next higher authority.
3 • Banks were advised to prepare action plan for issuing Kisan Credit Cards to all eligible borrowersin agricultural sector within next three years and to inform the Reserve Bank if targets arechanged in future.
22 • To keep a special watch on receipt and utilisation of foreign contribution received for providingrelief to the earthquake victims in Gujarat, commercial banks were directed to furnish a monthlyreport of receipt of foreign contributions by Associations/Organisations in India under ForeignContribution (Regulation) Act, 1976.
• It was clarified that all deposits placed with NABARD/SIDBI in lieu of shortfall in advances topriority sector vis-à-vis the prescribed target would attract 100 per cent risk-weight, since thesedeposits are in lieu of shortfall in assets which carry 100 per cent risk-weight.
28 • Public sector banks were instructed to (a) annex only the annual accounts and auditors’ reportof the subsidiaries to its balance sheet, (b) make available the Directors’ report in respect of thesubsidiaries on the website of parent bank, (c) continue the above procedure till the bank switchesover to the consolidated balance-sheet system. The accounting year of banking subsidiariesshould be coterminous with the parent bank and hence date of the annual accounts ofsubsidiaries, annexed to the parent’s balance sheet, should coincide with date of annual accountsof parent bank. For subsidiaries having accounting year different from the parent bank, theannual accounts annexed should not relate to a date earlier than six months prior to the date ofthe annual accounts of the parent bank.
30 • The classification and provisioning norms for restructured accounts in the standard and sub-standard category were reviewed and it was decided that on rescheduling, they could continueto be classified as standard and sub-standard, respectively, if the asset is fully secured and thesacrifice, if any in interest, is either written off or fully provided for.
April 10 • The operation of the guidelines for a simplified, non-discriminatory and non-discretionarymechanism for settlement of dues relating to NPAs with outstandings upto Rs.5 crore wasextended upto June 30, 2001.
19 • Banks allowed to offer loans or credit limits over Rs. 2 lakh at below-PLR interest rates toexporters or other credit-worthy borrowers including public enterprises on the lines of atransparent and objective policy approved by their respective boards. However, PLR would serveas ceiling interest rates for loans up to Rs. 2 lakh.
• Banks were permitted to formulate fixed deposit schemes specifically for senior citizens offeringhigher and fixed rates of interest as compared to normal deposits of any size.
• To facilitate better ALM, banks were given freedom to exercise discretion to disallow prematurewithdrawal of large deposits held by entities other than individuals and Hindu Undivided Families,

147
Annexure
Annexure: Chronology of Major Policy Developments (Continued)
Announcement MeasuresDate
2001
subject to informing the depositors in advance. The period of renewal of overdue term depositsat interest rate prevailing on date of maturity was made 14 days while for overdue period exceeding14 days banks were allowed to prescribe their own interest rate.
• In order to move towards international best practices and impart greater transparency, it wasdecided to introduce classification of loans as non-performing when interest and/or instalmentof principal remain overdue for a period of more than 90 days from the year ending March 31,2004. Banks were advised to make additional provisions from the year ending March 31, 2002to facilitate smooth transition.
• Effective from the year 2001-02, audit firms recommended by private sector banks forappointment as Statutory Central Auditors (SCAs) have to satisfy certain minimum standardslike minimum number of full time partners, number of chartered accountants exclusivelyassociated, number of professional audit staff, etc.
• The Reserve Bank announced a reduction in exposure limit for single borrower from the existing20.0 per cent to 15.0 per cent, effective from March 31, 2002; group exposure limit to 40.0 percent from the existing 50.0 per cent of capital funds, effective from March 31, 2002; for financinginfrastructure projects, the limit is extendable by another 10.0 per cent, i.e. upto 50.0 per cent.
• Banks were advised to incorporate a condition in the loan agreement for obtaining consent ofborrowers to disclose their names if they become defaulters.
• For greater transparency in the operation of borrowal accounts, banks were advised for bi-annual circulation of defaulters list of Rs. 1 crore and above in the doubtful or loss category.
• In pursuance of the Union Budget announcement, measures were taken to commence operationsof the Clearing Corporation, by June 2001, with State Bank of India as chief promoter and fiveother banks and FIs to facilitate clearing and settlement of money, government securities andforeign exchange transactions.
• It was decided to introduce an electronic Negotiated Dealing System (NDS) by June 2001 tofacilitate transparent electronic bidding in auctions and secondary market transactions on areal time basis.
• It was proposed while the current eligibility criteria for accredition as a SD would continue,the existing liquidity support from RBI will be discontinued.
• With effect from June 30, 2001, banks, FIs, PDs and SDs directed to make fresh investmentsand hold CP only in demateralised form. Outstanding investments in scrip form in the booksof these institutions should also be converted into dematerialised form by October 31, 2001.
20 • HSBC Primary Dealership India Private Limited granted final approval to operate as a PD ingovernment securities market, thereby increasing the number of PDs to sixteen.
May 2 • Considering that higher loan loss provisioning adds to the overall financial strength of the banksand stability of the financial sector, banks were urged to voluntarily set apart provisions muchabove the minimum prudential levels as a desirable practice
• Banks and Fls advised that all cases of willful defaults of Rs. 100 crore and above should bereviewed and suits filed, if not done earlier. If in such cases of willful defaults, there are instancesof cheating or fraud by the defaulting borrowers, banks should also file criminal cases.
• Guidelines were issued for compromise settlement of dues of banks and financial institutionsthrough Lok Adalats.
11 • Revised guidelines were issued on Bank Financing of Equities and Investments in Shares; (i) for makingdirect investment in shares/debentures etc. at bank’s own risk; (ii) for making loans and advances toindividuals and sharebroking entities for making investment in capital markets on own account. Here,the investment risk is that of the individual or stock-broking entities. Loans/advances by banks arenormally fixed in value and carry stipulated interest rate, and risk to banks could arise on account ofinadequacy of margining or the inability of borrowers to meet their repayment/interest obligations tobanks because of volatility in share prices or other related reasons, and (iii) shares/debentures may beassigned to banks by individuals and corporates as collateral and additional security for certain approvedpurposes which do not involve stockbroking or investment in capital market.

148
Report on Trend and Progress of Banking in India, 2000-01
Annexure: Chronology of Major Policy Developments (Continued)
Announcement MeasuresDate
2001
• The ceiling of 5 per cent prescribed for investment in shares will henceforth apply to totalexposure including both fund based and non-fund based, to capital market by a bank in allform. The ceiling will cover: direct investment by a bank in equity shares, convertible bonds anddebentures and units of equity oriented mutual funds; advances against shares to individualsfor investment in equity shares (including IPOs), bonds and debentures, units of equity-orientedmutual funds etc; secured and unsecured advances to stockbrokers and guarantees issued onbehalf of stockbrokers and market makers.
14 • Guidelines issued for bank financing of film production.
June 7 • Guidelines were issued in respect of investment in non-SLR securities regarding the duediligence to be undertaken, the disclosures to be obtained, and the credit risk analysis to bemade in regard to privately placed investments especially for unrated instruments.
14 • With a view to reduce divergences in assessment of NPAs by banks, statutory auditors andRBI Inspectors, user friendly guidelines defining and clarifying certain related issues inquestion-answer format were issued.
• The guidelines on internet banking were released.
August 23 • Based on extensive discussions that the Government of India and Reserve Bank had withbanks and financial institutions, the scheme of Corporate Debt Restructuring (CDR) wasfinalised. The objective of the CDR framework is to ensure a timely and transparent mechanismfor restructuring of the corporate debts of viable corporate entities affected by internal orexternal factors, outside the purview of BIFR, DRT and other legal proceedings, for the benefitof all concerned. CDR will apply only to multiple banking accounts/syndicates/consortiumaccounts with outstanding exposure of Rs. 20 crore and above with the banks and financialinstitutions.
September 22 • Based on the recommendations of the RBI-SEBI Technical Committee, on an experimentalbasis it was decided to permit banks to extend finance to stockbrokers for margin tradingwithin the overall ceiling of 5 per cent prescribed for exposure of banks to capital marketsubject to certain conditions. These guidelines will be valid for a period of 60 days (i.e. uptoNovember 22, 2001) and will be reviewed in the light of actual experience.
24 • A special financial package was drawn in consultation with the Government of India, for largevalue exports of select products, which are internationally competitive and have high valueaddition. The products eligible for export under special financial package are: (a)pharmaceuticals (including drugs, fine chemicals), (b) agro-chemicals (including inorganic andorganic chemicals), (c) transport equipment (including commercial vehicles, two and threewheelers, tractors, railway wagons, locomotives), (d) cement (including glass, glassware,ceramics and refractories), (e) iron and steel (including iron & steel bars/rods and primaryand semi-finished iron & steel), (f) electrical machinery (including transmission line towers,switch gear, transformers).
26 • A reduction in the ceiling rate for export credit by 1.0 percentage point across the board forperiod upto March 31, 2002 was announced. Accordingly, the maximum rate that the bankwould charge to exporters was revised to 2.5 percentage points below its PLR for pre-shipmentcredit upto 180 days and for post-shipment credit upto 90 days.
October 22 • It was decided that banks should furnish the following, additional disclosures in the ‘Noteson Accounts’ in their balance sheets, from the year ending March 2002: (i) movement orprovisions held towards NPAs and (ii) movement of provisions held towards depreciation oninvestments.
25 • Banks were given the freedom to change the composition of working capital by increasing thecash credit component beyond 20 per cent, or to increase the ‘loan component’ beyond 80 percent, as the case may be, for working capital limits of Rs. 10 crore and above, if they so desire.Banks are expected to appropriately price each of the two components of working capitalfinance, taking into account the impact of such decisions on their cash and liquiditymanagement.
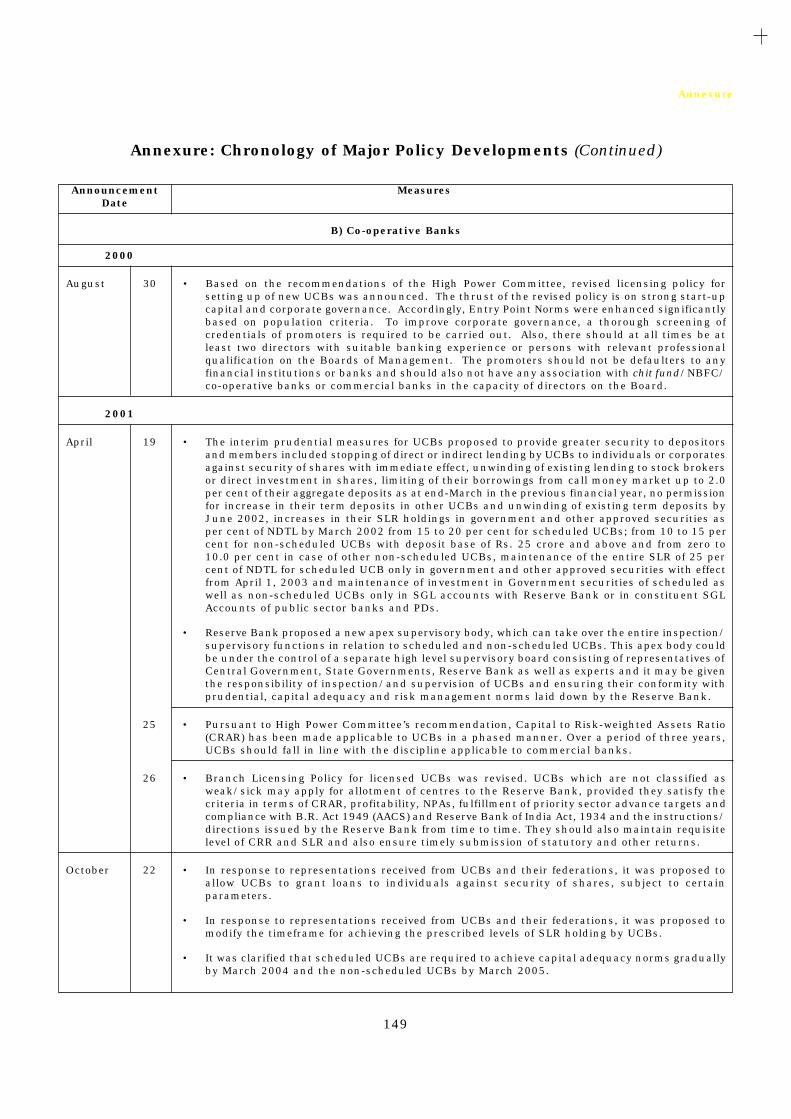
149
Annexure
Annexure: Chronology of Major Policy Developments (Continued)
Announcement MeasuresDate
B) Co-operative Banks
2000
August 30 • Based on the recommendations of the High Power Committee, revised licensing policy forsetting up of new UCBs was announced. The thrust of the revised policy is on strong start-upcapital and corporate governance. Accordingly, Entry Point Norms were enhanced significantlybased on population criteria. To improve corporate governance, a thorough screening ofcredentials of promoters is required to be carried out. Also, there should at all times be atleast two directors with suitable banking experience or persons with relevant professionalqualification on the Boards of Management. The promoters should not be defaulters to anyfinancial institutions or banks and should also not have any association with chit fund/NBFC/co-operative banks or commercial banks in the capacity of directors on the Board.
2001
April 19 • The interim prudential measures for UCBs proposed to provide greater security to depositorsand members included stopping of direct or indirect lending by UCBs to individuals or corporatesagainst security of shares with immediate effect, unwinding of existing lending to stock brokersor direct investment in shares, limiting of their borrowings from call money market up to 2.0per cent of their aggregate deposits as at end-March in the previous financial year, no permissionfor increase in their term deposits in other UCBs and unwinding of existing term deposits byJune 2002, increases in their SLR holdings in government and other approved securities asper cent of NDTL by March 2002 from 15 to 20 per cent for scheduled UCBs; from 10 to 15 percent for non-scheduled UCBs with deposit base of Rs. 25 crore and above and from zero to10.0 per cent in case of other non-scheduled UCBs, maintenance of the entire SLR of 25 percent of NDTL for scheduled UCB only in government and other approved securities with effectfrom April 1, 2003 and maintenance of investment in Government securities of scheduled aswell as non-scheduled UCBs only in SGL accounts with Reserve Bank or in constituent SGLAccounts of public sector banks and PDs.
• Reserve Bank proposed a new apex supervisory body, which can take over the entire inspection/supervisory functions in relation to scheduled and non-scheduled UCBs. This apex body couldbe under the control of a separate high level supervisory board consisting of representatives ofCentral Government, State Governments, Reserve Bank as well as experts and it may be giventhe responsibility of inspection/and supervision of UCBs and ensuring their conformity withprudential, capital adequacy and risk management norms laid down by the Reserve Bank.
25 • Pursuant to High Power Committee’s recommendation, Capital to Risk-weighted Assets Ratio(CRAR) has been made applicable to UCBs in a phased manner. Over a period of three years,UCBs should fall in line with the discipline applicable to commercial banks.
26 • Branch Licensing Policy for licensed UCBs was revised. UCBs which are not classified asweak/sick may apply for allotment of centres to the Reserve Bank, provided they satisfy thecriteria in terms of CRAR, profitability, NPAs, fulfillment of priority sector advance targets andcompliance with B.R. Act 1949 (AACS) and Reserve Bank of India Act, 1934 and the instructions/directions issued by the Reserve Bank from time to time. They should also maintain requisitelevel of CRR and SLR and also ensure timely submission of statutory and other returns.
October 22 • In response to representations received from UCBs and their federations, it was proposed toallow UCBs to grant loans to individuals against security of shares, subject to certainparameters.
• In response to representations received from UCBs and their federations, it was proposed tomodify the timeframe for achieving the prescribed levels of SLR holding by UCBs.
• It was clarified that scheduled UCBs are required to achieve capital adequacy norms graduallyby March 2004 and the non-scheduled UCBs by March 2005.

150
Report on Trend and Progress of Banking in India, 2000-01
Annexure: Chronology of Major Policy Developments (Continued)
Announcement MeasuresDate
C) Financial Institutions
2000
May 5 • It was clarified that in regard to the treatment of accounting of provision on Standard Assets, (i)the provision for Standard Asset need not be netted from gross advances, but shown separatelyas ‘Contingent Provisions against Standard Assets’ under ‘Other Liabilities and Provisions’ inthe balance sheet, (ii) the above provisions would not be eligible for inclusion in tier II capitaland (iii) provision for standard assets should not be reckoned for arriving at net NPAs.
25 • It was clarified that the interest rate surcharge of 50 per cent of the actual lending rate on creditfor imports, which was reintroduced as a temporary measure, with effect from May 26, 2000,would not be applicable to the following categories of credit for imports: (i) Export PackingCredit provided at concessive rate to meet the cost of imported inputs, (ii) import of capitalgoods by bonafide borrowers-importers under valid licences issued under the Export PromotionCapital Goods Scheme, (iii) all bonafide imports including import of capital goods by Export-Oriented Units and units in the Export Processing Zones, (iv) all bonafide imports under AdvanceLicenses granted for “Inputs” such as raw materials, intermediaries, components, etc., by eitherthe original holder or a transferee (of transferred under an endorsement of the DirectorateGeneral of Foreign Trade enabling such transfer), (v) all bonafide imports against the creditunder the Duty Entitlement Pass Book Scheme contained in the EXIM Policy 1997-2000, (vi)bulk imports in respect of crude oil, petroleum products, fertiliser, edible oils and other essentialcommodities imported through Government Agencies, and, (vii) import of crude oil by privateand joint sector refineries for actual use in their own refineries.
30 • It was advised that (i) FIs need to assign risk-weight of 100 per cent only on those State Governmentguaranteed securities which are issued by the defaulting entities and not on all the securities issuedor guaranteed by that State Government, and, (ii) the excess provision towards depreciation oninvestments should be appropriated to “Investment Fluctuation Reserve Account” instead of “CapitalReserve Account” and will be eligible for inclusion in tier II capital and the existing amount of excessprovision towards depreciation on investments held under “Capital Reserve Account” should standtransferred to “Investment Fluctuation Reserve Account”. The amount held under “InvestmentFluctuation Reserve Account” could be utilised to meet, in future, the depreciation requirement oninvestment.
June 21 • It was clarified that FIs need not seek Reserve Bank’s, issue-wise prior approval /registration forraising of resources by way of bonds (both public issue and private placement) subject to the fulfillmentof the following conditions: (i) the minimum maturity of the bond should be 3 years, (ii) in respectof bonds having call/put options, the same should not be exercisable before the expiry of one yearfrom the date of issue of bonds, (iii) the Yield to Maturity (YTM) offered, at the time of issue of bonds,should not exceed 200 basis points above the YTM on the Government of India securities of equalresidual maturities. The effective YTM on instruments having call/put options should also satisfythis requirement, (iv) no ‘exit’ option on the bonds will be offered before the end of one year, fromthe date of issue, (v) the outstandings of total resources mobilised at any point of time by an individualFI including funds mobilised under the ‘umbrella limit’ as prescribed by the Reserve Bank shouldnot exceed 10 times its net owned funds (NOF) as per the latest audited balance sheet, (vi) the limitfor raising resources is only an enabling provision, FIs are advised to arrive at their requirements ofresources along with maturity structure and the interest rate offered thereon on a realistic basis,derived, inter alia, from a sound system of ALM/Risk Management, (vii) in case of floating ratebonds, FIs should seek prior approval from Reserve Bank, in regard to ‘reference rate’ selected andthe methods of floating rate determination (the same is not required for subsequent individualissues as long as the underlying reference rate and methods of floating rate determination remainunchanged), (viii) FIs should take note to comply with the prudential requirements of other regulatoryauthorities, such as SEBI, etc., as hitherto, (ix) FIs are required to furnish monthly statements (tobe submitted on or before the 10th day of the following month) giving details on the resources raised.
July 20 • Considering the fact that FIs, which are raising capital abroad for improving their capital base,have largely Rupee-denominated assets and that most of the risk limits are linked to theircapital, FIs were advised to repatriate the entire proceeds of Global Depository Receipts (GDRs)/American Depository Receipts (ADRs) soon after the issue process has been completed.

151
Annexure
Annexure: Chronology of Major Policy Developments (Continued)
Announcement MeasuresDate
2000
28 • It was advised that the guidelines for recovery of dues relating to non-performing assets (NPAs)issued to public sector banks should also be uniformly implemented by Central Public FinancialInstitutions. The revised guidelines cover NPAs relating to all sectors including the small sector.
August 24 • The FIs were informed that the Rule 9 of the draft Ozone Rules 2000 prohibited expansion ofcapacity and establishment of new capacity based on Ozone Depleting Substances (ODS), and itwas expected that FIs were not extending finance for setting up of units consuming / producingthe specified ODS. The sectors covered in the phase out programme included, foam products,refrigerators and air conditioners, aerosol products, solvents in cleaning applications and fireextinguishers.
31 • The guidelines for Recovery of Dues Relating to NPAs were extended up to September 30, 2001for giving notice to eligible borrowers.
September 19 • As regards advances against shares and debentures, it was advised that (i) whenever the limitsof advances granted to a borrower against the security of shares/debentures exceed Rs.10 lakh,it should be ensured that the said shares/debentures are transferred in the FI’s name and (ii) inthe case of default by the borrower, the FI may invoke the pledge of dematerialised securities (asamended by SEBI (Depositories and Participants) Regulations, 1996, to facilitate the pledge ofsuch securities) subject to the provisions of the pledge document and on such invocation, thedepository will register the name of the FI as the beneficial owner of such securities.
October 10 • It was advised that in order to improve the functional efficiency of the market, rating would bemandatory for term deposits accepted by AIFIs.
11 • Due to improvements in the payment and settlement systems, the recovery climate, upgradationof technology in the banking system, etc., it was decided to dispense with ‘Past Due’ concept,effective March 31, 2001. Accordingly, it was clarified that a NPA shall be an advance where (a)interest remains overdue for a period of more than 180 days and /or instalment of principalremains overdue for a period of 365 days or more in respect of a term loan, (ii) the bill remainsoverdue and unpaid for a period of more than 180 days in the case of bills purchased anddiscounted, and (iii) any amount to be received remains overdue for a period of more than 180days in respect of other accounts.
• It was decided to allow financial institutions to include ‘General Provisions on Standard Assets’in tier II capital. However, the provision on standard assets together with other ‘General Provisionsand Loss Reserves’ should not exceed 1.25 per cent of the total risk-weighted assets.
November 9 • The guidelines on classification and valuation of investments by FIs were revised on the basis ofrecommendations of the Informal Group in the Reserve Bank so that they are in consonancewith the best international practices. The highlights of the revised guidelines are given below: (i)the revised guidelines will be effective from the half-year ended March 31, 2001, (ii) FIs arerequired to classify the entire investment portfolio as on March 31, 2001 under three categories,viz., ‘Held to Maturity’, ‘Available for Sale’ and ‘Held for Trading’ categories, (iii) the investmentswill be classified as (a) Government securities, (b) other approved securities, (c) shares, (d)debentures and bonds, (e) subsidiaries/joint ventures, (f) others (CPs, mutual fund units, etc),(iv) the investments under ‘Available for Sale’ and ‘Held for Trading’ categories should be markedto market as prescribed or at more frequent intervals, (v) the investments under Held to Maturitycategory need not be marked to market, (vi) classification of investments, shifting of investments,among the three categories, valuation of the investments, methodology for booking profit/losson sale of investments and providing for depreciation should be in accordance with the guidelinesof the Reserve Bank and (vii) the risk-weights assigned to the various securities at presentincluding those for ‘market risk’, would remain unchanged.
December 5 • Commercial Paper was added to the list of instruments under the ‘umbrella limit’ equivalent toone time NOF in the amended set of returns regarding raising of resources by all-India FIs.

152
Report on Trend and Progress of Banking in India, 2000-01
Annexure: Chronology of Major Policy Developments (Continued)
Announcement MeasuresDate
2001
January 24 • In line with the recommendations of the Informal Advisory Group on Regulation and Supervisionof FIs, it was decided that (i) the information requirement of the inspection team would beadvised to the FIs at least one month before the commencement of inspection to ensure bettertime management and efficiency of the examination process, (ii) before the commencement ofinspection, the management of the FI may be asked to make a presentation to the inspectionteam of the FI’s perspective on its own risk exposures, and the manner in which these riskswere addressed in the past and the future strategy of the FI in this regard and (iii) the inspectionteam should also meet the internal and external auditors to appreciate the scope of their workand the results of their audit. On conclusion of the inspection, the Principal Inspecting Officer,along with his team members as considered necessary, should meet the Audit Committee asalso the CEO of the FI to discuss the major findings of the inspection.
February 7 • In the context of transition of the banks and the all-India FIs from a regulated to a deregulatedregime, informal meetings of the Heads of select banks and the FIs, including the Chairman ofIBA convened by the Reserve Bank led to the emergence of the following seven issues (i)timeframe for sanction of facilities, (ii) asset classification across consortium members, (iii)disciplining borrowers-change in management, (iv) levy of charges in the problem accounts,(v) group approach to borrowers, (vi) sharing of securities and cash flows, and (vii) treatmentof restructured accounts for asset classification purpose. Ground Rules were framed for theabove issues. The Reserve Bank advised FIs to place the minutes indicating the agreed GroundRules before their Board of Directors for adoption and ensure implementation thereof thereafter.
10 • FIs were advised that the prescription of interest at 25 per cent per annum (minimum) inrespect of overdue export bills was withdrawn. The revision in the rate of interest would beapplicable not only to fresh advances but also to the existing advances for the remainingperiod.
March 23 • FIs were advised to disclose certain important financial ratios/data in their published annualaccounts with effect from the financial year 2000-01. Such disclosures were to be made aspart of ‘Notes on Accounts’ to enable the auditors to authenticate the information,notwithstanding the fact that such information might be contained elsewhere in the publishedannual report. These disclosures could be classified into four heads (i) Capital, (ii) Asset Qualityand Credit Concentration, (iii) Liquidity and (iv) Operating Results. Under (i), the disclosuresincluded (a) CRAR, core CRAR and supplementary CRAR, (b) amount of sub-ordinated debtraised and outstanding as tier II capital, (c) risk-weighted assets-separately for on- and off-balance sheet items and (d) the shareholding pattern as on the date of the balance sheet.Under (ii), the disclosures included, (a) percentage of net NPA to net loans and advances, (b)amount and percentage of net NPAs under the prescribed asset classification categories, (c)amount of provisions made during the year towards standard assets, NPAs, investments (otherthan those in the nature of an advance), income tax, (d) movement in net NPAs, (e) creditexposure as percentage of capital funds and as percentage of total assets, in respect of (e1)the largest single borrower, (e2) the largest borrower group, (e3) the 10 largest single borrowersand (e4) the 10 largest borrower groups and (f) credit exposures to the five largest industrialsectors as percentage of total loan assets. Under (iii) the disclosures included, (a) maturitypattern of Rupee assets and liabilities and (b) maturity pattern of foreign currency assets andliabilities. Under (iv), the disclosures included, (a) interest income as a percentage to averageworking funds, (b) non- interest income as a percentage to average working funds, (c) operatingprofit as a percentage of average working funds, (d) return on average assets and (e) net profitper employee.
• In addition, the following disclosures would also need to be made under the RBI guidelines, (a)the notional principal of swap agreements, (b) nature and terms of the swaps includinginformation on credit and market risk and the accounting policies adopted for recording theswaps, (c) quantification of the losses which would be incurred if the counterparties failed tofulfil their obligation under the agreements, (d) collateral required by the entity upon enteringinto swaps, (e) any concentration of credit risk arising from the swaps, and (f) the “fair” valueof the total swaps book.

153
Annexure
Annexure: Chronology of Major Policy Developments (Continued)
Announcement MeasuresDate
2001
28 • The Reserve Bank issued revised guidelines in respect of the norms relating to restructuring/rescheduling/renegotiation of loans on the standard and sub-standard loan assets.
April 18 • The period of operations of the guidelines issued in respect of Central Public Financialinstitutions for Recovery of Dues Relating to NPAs was extended finally upto June 30, 2001.The FIs were advised that all applications received upto June 30, 2001 should be processedand decisions taken thereof at the earliest, but not later than September 30, 2001.
26 • It was clarified that FIs would treat a credit facility as non-performing if interest and/orinstalment of principal remain overdue for more than 180 days with effect from the year endingMarch 31, 2002.
28 • The FIs were advised that for evolving a path for transition of a FI to a universal bank, severaloperational and regulatory issues would need to be addressed. In this context, the ReserveBank briefly enumerated some of the salient ones for information and guidance of the FIs.These included, reserve requirements, range of permissible activities, disposal of non-bankingassets, composition of the Board, prohibition of floating charge on assets, nature of subsidiaries,restrictions on investments, connected lending, licensing, branch network, assets in India,format of Annual Reports, managerial remuneration, deposit insurance, Authorised Dealer’slicence, priority sector lending and prudential norms.
May 2 • As a move towards compromise settlement of dues, financial institutions were advised to takerecourse to the forum of Lok Adalats to settle banking disputes involving smaller amounts(upto Rs.5 lakh).
June 20 • FIs were advised that (a) the concept of capital funds as defined under capital adequacy standardsfor determining exposure ceiling for the FI would include both tier I and tier II capital, (b) non-fund based exposures would be reckoned at 100 per cent value with effect from April 1, 2003, (c)forward contracts in foreign exchange and other derivative products like currency swaps, options,etc., will need to be taken at their replacement cost for determining individual/group borrowerexposure (methodology to be adopted by FIs for arriving at replacement cost of the derivatives tobe advised separately) and (d) the exposure ceiling in respect of single borrower was reducedfrom 20 per cent to 15 per cent of capital funds, effective March 31, 2002. Similarly, the groupexposure ceilings were also reduced to 40 per cent of capital funds, effective March 31, 2002. Incase of financing infrastructure projects, the borrower-group exposure ceiling was extendableby another 10 per cent (i.e., upto 50 per cent).
August 7 • A risk-weight of 20 per cent should be assigned to all such loans and advances granted by the FIs totheir own employees as are covered by superannuation benefits and mortgage of flats/houses. Allother loans and advances to own employees should, however, be subject to 100 per cent risk-weight.
25 • A three-tier structure of the Corporate Debt Restructuring (CDR) system, which is a non-statutory, voluntary mechanism, based on the debtor-creditor and inter-creditor agreements ,was envisaged to provide a transparent mechanism for restructuring of corporate debts ofviable corporate entities affected by internal and external factors, outside the purview of BIFR,DRT and other legal proceedings. The CDR system is to be applied only to multiple banking/syndicates/consortium accounts, in the standard and sub-standard category, with outstandingexposure of Rs.20 crore and above with the banks and FIs.
27 • It was clarified that the credit exposure norms are also applicable to refinancing institutions,excepting their refinancing portfolio. However, from the prudential perspective, it is expectedthat these institutions evolve their own exposure norms relating to the capital funds/regulatorycapital of the FI concerned with the approval of their respective Boards.
28 • As a corollary to the instructions of FIs to make fresh investment and hold CPs only indematerialised form with effect from June 30, 2001 and with a view to extend demat form ofholding to other investments such as bonds, debentures and equities, it was decided to permitthe FIs to make fresh investments and hold bonds, debentures, privately placed or otherwise,only in dematerialised form with effect from October 31, 2000. Outstanding investments in

154
Report on Trend and Progress of Banking in India, 2000-01
Annexure: Chronology of Major Policy Developments (Continued)
scrip form should also be converted into dematerialised form by June 30, 2002.
29 • Amended guidelines relating to Asset-Liability Management was issued to FIs covering time-buckets for slotting of the off-balance sheet items and treatment of securities in the tradingbook for interest rate sensitivity statement.
October 16 • A clarificatory circular was issued to FIs on classification and valuation of investments, basedon suggestions/queries received from various Fls. These include definitions of joint-ventures,treatment of preference shares, tenor of bonds/debentures deemed to be in the volume ofadvances, frequency of category, transfer of investment, eligible investments for ‘held tomaturity’ category, valuation of equity preference shares and ceilings, etc.
D) Non-Banking Financial Companies
2000
June 9 • The Reserve Bank issued guidelines for entry of NBFCs into insurance business. According tothe guidelines:
(i) Any NBFC registered with Reserve Bank, having net owned fund of Rs. 2 crore would bepermitted to undertake insurance business as agent of insurance companies on fee basis,without any risk participation.
(ii) All NBFCs registered with Reserve Bank which satisfy the eligibility criteria given below willbe permitted to set up a joint venture company for undertaking insurance business withrisk participation subject to safeguards:(a) the owned fund of NBFC should not be less thanRs. 500 crore, (b) the CRAR of the NBFC engaged in loan and investment activities holdingpublic deposits should not be less than 15 per cent and for other NBFCs at 12 per cent,irrespective of their holding public deposits, (c) the level of net non-performing assets shouldnot be more than 5 per cent of the total outstanding leased/hire purchase assets and advancestaken together, (d) the NBFC should have net profit for the last three consecutive years, (e)the track record of the performance of the subsidiaries, if any, of the concerned NBFCshould be satisfactory, and (f) regulatory compliance and servicing of public deposits, ifheld, should be satisfactory. The maximum equity contribution such NBFC can hold in ajoint venture company will normally be 50 per cent of the paid up capital of the insurancecompany. On a selective basis, the Reserve Bank may permit a higher equity contributionby a promoter NBFC initially pending divestment of equity within the prescribed period.
(iii) Registered NBFCs which are not eligible as joint venture participants can make investmentupto 10 per cent of its owned fund or Rs. 50 crore, whichever is lower, in equity of insurancecompanies subject to fulfilment of conditions viz., (a) CRAR of 15 per cent for loan andinvestment companies and 12 per cent for other companies, (b) net NPAs not more than 5per cent of total outstanding lease / hire purchase assets and advances, and (c) net profitfor the last three continuous years for entering into any form of insurance business.
(iv) NBFCs desirous of entering into any form of insurance business should obtain prior approvalof Reserve Bank.
30 • Provisioning norms in respect of lease and hire purchase assets were rationalised to encouragethe NBFCs to continue to provide asset creating facilities and lease / HP finance against secondhand assets.
• The instructions relating to introduction of depositors of NBFCs were rationalised. NBFCs mayobtain and keep on their records a copy of the passport, ration card, election ID card, identificationby an existing depositor, etc., as an evidence of identification of new depositors.
• Residuary Non-Banking Companies were permitted to make investment in the schemes of mutualfunds approved by the Securities and Exchange Board of India along with the schemes of UnitTrust of India. The floor ceiling on interest rates payable by these companies was also loweredby two percentage points.
Announcement MeasuresDate
2001
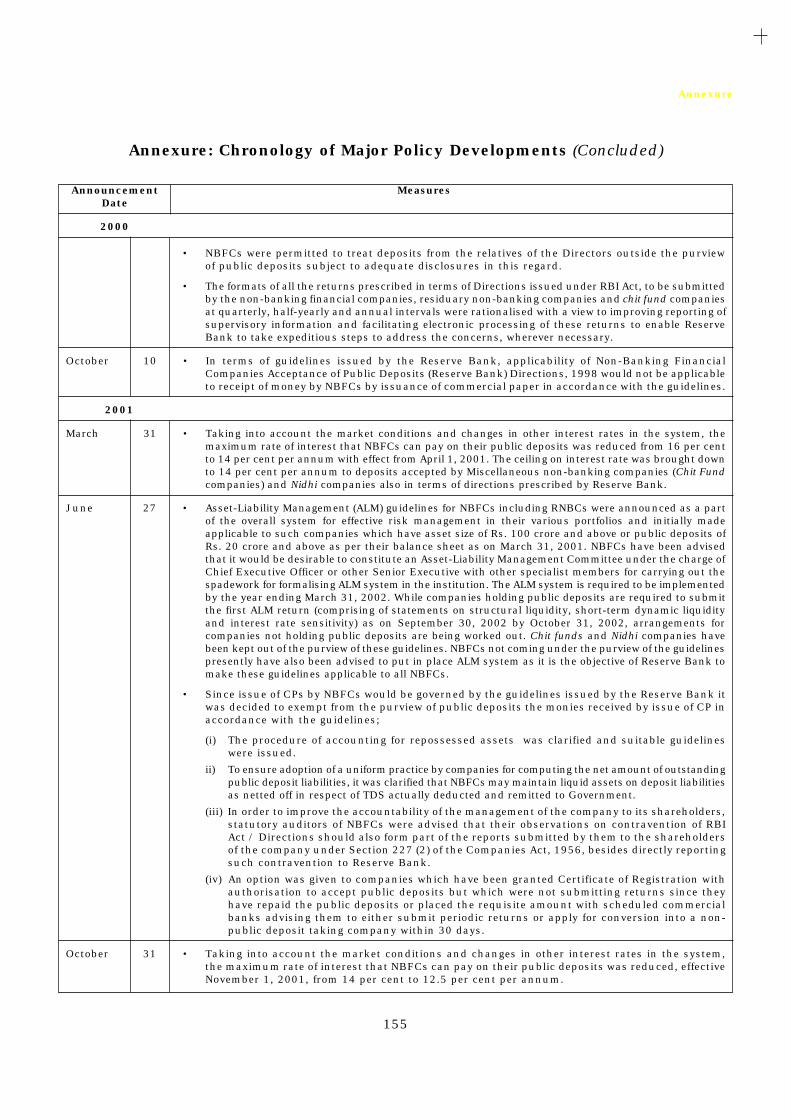
155
Annexure
Annexure: Chronology of Major Policy Developments (Concluded)
Announcement MeasuresDate
2000
• NBFCs were permitted to treat deposits from the relatives of the Directors outside the purviewof public deposits subject to adequate disclosures in this regard.
• The formats of all the returns prescribed in terms of Directions issued under RBI Act, to be submittedby the non-banking financial companies, residuary non-banking companies and chit fund companiesat quarterly, half-yearly and annual intervals were rationalised with a view to improving reporting ofsupervisory information and facilitating electronic processing of these returns to enable ReserveBank to take expeditious steps to address the concerns, wherever necessary.
October 10 • In terms of guidelines issued by the Reserve Bank, applicability of Non-Banking FinancialCompanies Acceptance of Public Deposits (Reserve Bank) Directions, 1998 would not be applicableto receipt of money by NBFCs by issuance of commercial paper in accordance with the guidelines.
2001
March 31 • Taking into account the market conditions and changes in other interest rates in the system, themaximum rate of interest that NBFCs can pay on their public deposits was reduced from 16 per centto 14 per cent per annum with effect from April 1, 2001. The ceiling on interest rate was brought downto 14 per cent per annum to deposits accepted by Miscellaneous non-banking companies (Chit Fundcompanies) and Nidhi companies also in terms of directions prescribed by Reserve Bank.
June 27 • Asset-Liability Management (ALM) guidelines for NBFCs including RNBCs were announced as a partof the overall system for effective risk management in their various portfolios and initially madeapplicable to such companies which have asset size of Rs. 100 crore and above or public deposits ofRs. 20 crore and above as per their balance sheet as on March 31, 2001. NBFCs have been advisedthat it would be desirable to constitute an Asset-Liability Management Committee under the charge ofChief Executive Officer or other Senior Executive with other specialist members for carrying out thespadework for formalising ALM system in the institution. The ALM system is required to be implementedby the year ending March 31, 2002. While companies holding public deposits are required to submitthe first ALM return (comprising of statements on structural liquidity, short-term dynamic liquidityand interest rate sensitivity) as on September 30, 2002 by October 31, 2002, arrangements forcompanies not holding public deposits are being worked out. Chit funds and Nidhi companies havebeen kept out of the purview of these guidelines. NBFCs not coming under the purview of the guidelinespresently have also been advised to put in place ALM system as it is the objective of Reserve Bank tomake these guidelines applicable to all NBFCs.
• Since issue of CPs by NBFCs would be governed by the guidelines issued by the Reserve Bank itwas decided to exempt from the purview of public deposits the monies received by issue of CP inaccordance with the guidelines;
(i) The procedure of accounting for repossessed assets was clarified and suitable guidelineswere issued.
ii) To ensure adoption of a uniform practice by companies for computing the net amount of outstandingpublic deposit liabilities, it was clarified that NBFCs may maintain liquid assets on deposit liabilitiesas netted off in respect of TDS actually deducted and remitted to Government.
(iii) In order to improve the accountability of the management of the company to its shareholders,statutory auditors of NBFCs were advised that their observations on contravention of RBIAct / Directions should also form part of the reports submitted by them to the shareholdersof the company under Section 227 (2) of the Companies Act, 1956, besides directly reportingsuch contravention to Reserve Bank.
(iv) An option was given to companies which have been granted Certificate of Registration withauthorisation to accept public deposits but which were not submitting returns since theyhave repaid the public deposits or placed the requisite amount with scheduled commercialbanks advising them to either submit periodic returns or apply for conversion into a non-public deposit taking company within 30 days.
October 31 • Taking into account the market conditions and changes in other interest rates in the system,the maximum rate of interest that NBFCs can pay on their public deposits was reduced, effectiveNovember 1, 2001, from 14 per cent to 12.5 per cent per annum.

156
Report on Trend and Progress of Banking in India, 2000-01
Appendix Table II.1 : RBI Accommodation to Scheduled Commercial Banks
(Rs.crore)
As on the Total Export Credit General Refinance/ Special Liquidity Totallast reporting Refinance Others* + Support Facility @ RefinanceFriday of
Limit Outstan- Limit Outstan- Limit Outstan- Limit Outstan-ding ding ding ding
1 2 3 4 5 6 7 8 9(2+4+6) (3+5+7)
1999
March 7,269.27 2,616.57 1,115.02 19.23 3,235.02 258.00 11,619.31 2,893.80
April 8,638.29 5,164.76 1,115.02 56.31 9,753.31 5,221.07
May 8,563.56 4,521.79 3,027.72 437.91 11,591.28 4,959.70
June 8,151.40 3,863.21 3,027.72 — 11,179.12 3,863.21
September 7,099.97 4,109.11 3,027.72 95.23 10,127.69 4,204.34
December 8,577.94 2,470.84 3,027.72 82.50 11,605.66 2,553.34
2000
March 10,579.06 6,291.49 3,027.72 199.47 13,606.78 6,490.96
April 11,277.89 4,609.33 3,027.72 458.95 14,305.61 5,068.28
May 12,162.70 9,734.24 3,027.72 607.22 15,190.42 10,341.46
June 11,273.12 8,489.59 1,713.69 223.02 12,986.81 8,712.61
September # 6,215.24 4,647.52 1,056.68 644.86 7,271.92 5,292.38
December 6,722.34 5,987.92 1,056.68 716.89 7,779.02 6,704.83
2001
March 7,192.11 3,252.24 1,056.68 639.58 8,248.79 3,891.82
April 7,350.13 4,710.86 1,520.18 1,132.14 8,870.31 5,843.00
May 9,324.90 4,624.89 1,519.77 147.16 10,844.67 4,772.05
June 9,221.07 3,553.02 1,519.77 63.01 10,740.84 3,616.03
July 9,256.04 5,734.56 1,056.27 703.15 10,312.31 6,437.71
August 9,187.10 3,359.12 1,056.27 89.30 10,243.37 3,448.42
September 9,144.62 4,042.33 1,056.27 109.99 10,200.89 4,152.32
* General Refinance facility was replaced by collateralised lending facility (CLF)/additional collateralised lending facility (ACLF)
effective April 21, 1999, ACLF was withdrawn with the introduction of liquidity adjustment facility (LAF), effective June 5,
2000.
@ Special Liquidity Facility which was introduced effective September 17, 1998 was available upto March 31, 1999.
# The export credit refinance and CLF limits were reduced by 50 per cent in two stages of 25 per cent each effective July 29,
2000 and August 12, 2000.
+ Others include CLF/ACLF etc.

157
Appendix
Appendix Table II.2 : Issue of Certificates of Deposit by ScheduledCommercial Banks
Fortnight Total Rate of Interest Fortnight Total Rate of Interestended Outstanding (Per cent) @ ended Outstanding (Per cent) @
(Rs. crore) (Rs. crore)
1 2 3 4 5 6
2000 2001
January 14 1,401 8.50 - 11.00 January 12 1,180 7.25 - 11.00
28 1,385 8.00 - 11.00 26 1,197 7.25 - 10.75
February 11 1,374 8.00 - 11.00 February 9 1,153 7.25 - 11.00
25 1,280 7.75 - 13.24 23 1,187 6.75 - 12.00
March 10 1,243 7.85 - 12.78 March 9 1,060 7.25 - 11.00
24 1,227 7.50 - 12.00 23 771 5.50 - 11.00
April 7 1,264 6.50 - 14.00 April 6 1,042 6.50 - 11.00
21 1,273 6.75 - 11.00 20 905 7.00 - 11.00
May 5 872 8.00 - 12.82 May 4 1,011 5.00 -10.80
19 945 8.00 - 11.70 18 935 6.30 - 11.50
June 2 933 8.00 - 11.16 June 01 960 6.80 - 10.50
16 974 5.50 - 13.35 15 979 5.00-10.00
30 1,041 8.00 - 15.70 29 921 6.80 - 10.25
July 14 1,129 5.50 -14.00 July 13 782 5.00 - 10.50
28 1,211 5.50 - 12.75 27 751 6.00 - 10.00
August 11 1,094 8.00 - 14.60 August 10 786 6.00 - 10.50
25 1,149 6.50 - 11.25 24 758 5.00 - 10.00
27 3,293 8.00 - 11.50 September 7 729 6.00 - 10.00
September 8 1,120 8.50 - 14.20 21 736 6.33 - 9.50
22 1,153 8.00 - 13.50 October 5* 823 6.00 - 9.30
October 6 1,364 5.00 - 12.80
20 1,695 6.30 - 14.06
November 3 1,660 7.50 - 11.35
17 1,626 8.50 - 12.28
December 1 1,344 8.00 - 11.00
15 1,303 7.75 - 11.00
29 1,135 7.78 - 10.50
* Provisional.
@ Effective interest rate range per annum.

158
Report o
n T
ren
d a
nd P
rogre
ss of B
an
kin
g in
India
, 20
00
-01
Appendix Table II.3 : Viability Position of Sick/Weak Industrial Units
(Amount in Rs. crore)
Type of SSI Sick Units Non–SSI Sick Units Non-SSI Weak Units Total
Industrial Units Number Amount Number Amount Number Amount Number Amount Outstanding Outstanding Outstanding Outstanding
March March March March March March March March March March March March March March March March1999 2000 1999 2000 1999 2000 1999 2000 1999 2000 1999 2000 1999 2000 1999 2000
1 2 3 4 5 6 7 8 9 10 11 12 13 14 15 16 17
1. Potentially 18,692 14,373 376.96 369.45 410 349 2,796.67 2,877.29 57 71 334.51 571.41 19,159 14,793 3,508.14 3,818.15
viable units (6.1) (4.7) (8.7) (8.0) (17.4) (12.7) (21.3) (17.2) (13.1) (16.8) (16.4) (24.9) (6.2) (4.8) (18.0) (16.1)
2. Non–viable 2,71,193 2,76,643 3,746.07 4,007.86 1,298 1563 4,263.96 5,648.54 237 217 516.36 658.20 2,72,728 2,78,423 8,526.39 10,314.60
units (88.6) (91.0) (86.8) (87.0) (55.1) (57.0) (32.5) (33.7) (54.5) (51.4) (25.4) (28.6) (88.3) (90.6) (43.8) (43.6)
3. Viability not 16,336 13,219 190.45 231.12 649 830 6,053.25 8,222.25 141 134 1,185.66 1,069.60 17,126 14,183 7,429.36 9,522.97
decided (5.3) (4.3) (4.4) (5.0) (27.5) (30.3) (46.2) (49.1) (32.4) (31.8) (58.2) (46.5) (5.5) (4.6) (38.2) (40.3)
4. Total 3,06,221 3,04,235 4,313.48 4,608.43 2,357 2,742 13,113.88 16,748.08 435 422 2,036.53 2,299.21 3,09,013 3,07,399 19,463.89 23,655.72
5. Units under 12,759 663 194.91 137.69 306 213 2,007.04 1,428.00 43 17 243.40 117.66 13,108 893 2,445.35 1,683.35
nursing Programme
5 as percentage of 1 68.3 4.6 51.7 37.3 74.6 61.0 71.8 49.6 75.4 23.9 72.8 20.6 68.4 6.0 69.7 44.1
Note : Figures in brackets are percentages to total.
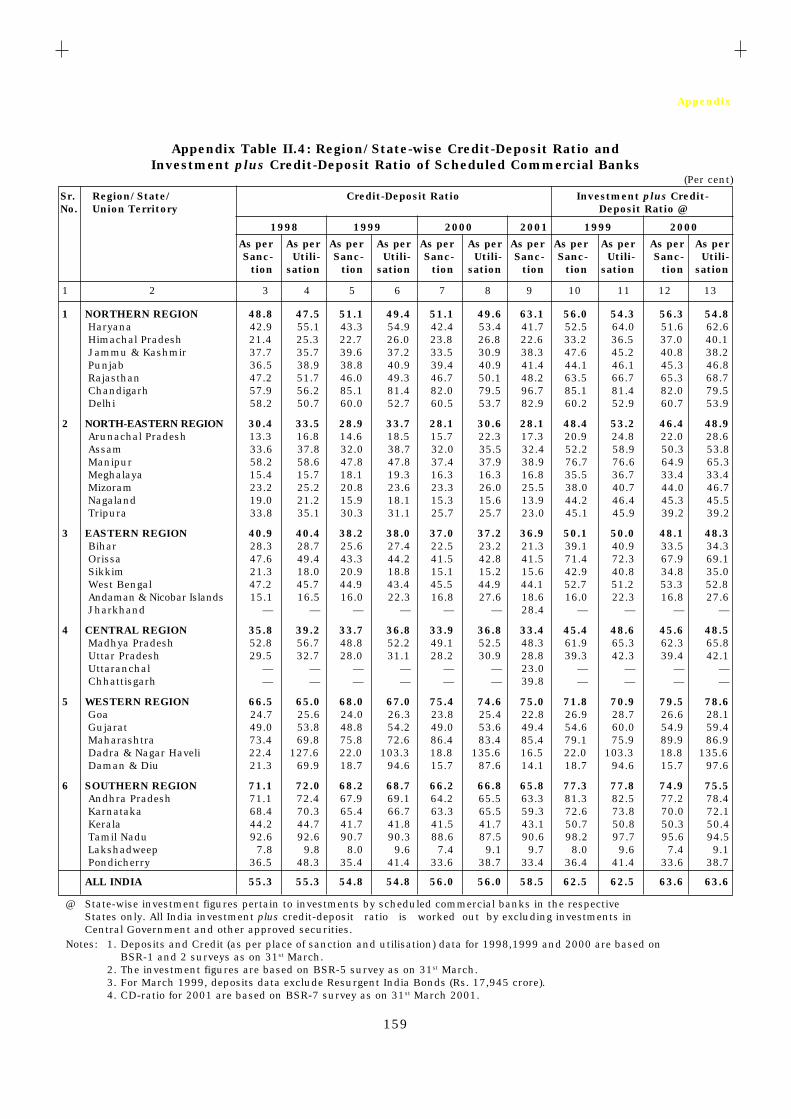
159
Appendix
Appendix Table II.4: Region/State-wise Credit-Deposit Ratio andInvestment plus Credit-Deposit Ratio of Scheduled Commercial Banks
(Per cent)
Sr. Region/State/ Credit-Deposit Ratio Investment plus Credit-No. Union Territory Deposit Ratio @
1998 1999 2000 2001 1999 2000
As per As per As per As per As per As per As per As per As per As per As perSanc- Utili- Sanc- Utili- Sanc- Utili- Sanc- Sanc- Utili- Sanc- Utili-
tion sation tion sation tion sation tion tion sation tion sation
1 2 3 4 5 6 7 8 9 10 11 12 13
1 NORTHERN REGION 48.8 47.5 51.1 49.4 51.1 49.6 63.1 56.0 54.3 56.3 54.8 Haryana 42.9 55.1 43.3 54.9 42.4 53.4 41.7 52.5 64.0 51.6 62.6 Himachal Pradesh 21.4 25.3 22.7 26.0 23.8 26.8 22.6 33.2 36.5 37.0 40.1 Jammu & Kashmir 37.7 35.7 39.6 37.2 33.5 30.9 38.3 47.6 45.2 40.8 38.2 Punjab 36.5 38.9 38.8 40.9 39.4 40.9 41.4 44.1 46.1 45.3 46.8 Rajasthan 47.2 51.7 46.0 49.3 46.7 50.1 48.2 63.5 66.7 65.3 68.7 Chandigarh 57.9 56.2 85.1 81.4 82.0 79.5 96.7 85.1 81.4 82.0 79.5 Delhi 58.2 50.7 60.0 52.7 60.5 53.7 82.9 60.2 52.9 60.7 53.9
2 NORTH-EASTERN REGION 30.4 33.5 28.9 33.7 28.1 30.6 28.1 48.4 53.2 46.4 48.9 Arunachal Pradesh 13.3 16.8 14.6 18.5 15.7 22.3 17.3 20.9 24.8 22.0 28.6 Assam 33.6 37.8 32.0 38.7 32.0 35.5 32.4 52.2 58.9 50.3 53.8 Manipur 58.2 58.6 47.8 47.8 37.4 37.9 38.9 76.7 76.6 64.9 65.3 Meghalaya 15.4 15.7 18.1 19.3 16.3 16.3 16.8 35.5 36.7 33.4 33.4 Mizoram 23.2 25.2 20.8 23.6 23.3 26.0 25.5 38.0 40.7 44.0 46.7 Nagaland 19.0 21.2 15.9 18.1 15.3 15.6 13.9 44.2 46.4 45.3 45.5 Tripura 33.8 35.1 30.3 31.1 25.7 25.7 23.0 45.1 45.9 39.2 39.2
3 EASTERN REGION 40.9 40.4 38.2 38.0 37.0 37.2 36.9 50.1 50.0 48.1 48.3 Bihar 28.3 28.7 25.6 27.4 22.5 23.2 21.3 39.1 40.9 33.5 34.3 Orissa 47.6 49.4 43.3 44.2 41.5 42.8 41.5 71.4 72.3 67.9 69.1 Sikkim 21.3 18.0 20.9 18.8 15.1 15.2 15.6 42.9 40.8 34.8 35.0 West Bengal 47.2 45.7 44.9 43.4 45.5 44.9 44.1 52.7 51.2 53.3 52.8 Andaman & Nicobar Islands 15.1 16.5 16.0 22.3 16.8 27.6 18.6 16.0 22.3 16.8 27.6 Jharkhand — — — — — — 28.4 — — — —
4 CENTRAL REGION 35.8 39.2 33.7 36.8 33.9 36.8 33.4 45.4 48.6 45.6 48.5 Madhya Pradesh 52.8 56.7 48.8 52.2 49.1 52.5 48.3 61.9 65.3 62.3 65.8 Uttar Pradesh 29.5 32.7 28.0 31.1 28.2 30.9 28.8 39.3 42.3 39.4 42.1 Uttaranchal — — — — — — 23.0 — — — — Chhattisgarh — — — — — — 39.8 — — — —
5 WESTERN REGION 66.5 65.0 68.0 67.0 75.4 74.6 75.0 71.8 70.9 79.5 78.6 Goa 24.7 25.6 24.0 26.3 23.8 25.4 22.8 26.9 28.7 26.6 28.1 Gujarat 49.0 53.8 48.8 54.2 49.0 53.6 49.4 54.6 60.0 54.9 59.4 Maharashtra 73.4 69.8 75.8 72.6 86.4 83.4 85.4 79.1 75.9 89.9 86.9 Dadra & Nagar Haveli 22.4 127.6 22.0 103.3 18.8 135.6 16.5 22.0 103.3 18.8 135.6 Daman & Diu 21.3 69.9 18.7 94.6 15.7 87.6 14.1 18.7 94.6 15.7 97.6
6 SOUTHERN REGION 71.1 72.0 68.2 68.7 66.2 66.8 65.8 77.3 77.8 74.9 75.5 Andhra Pradesh 71.1 72.4 67.9 69.1 64.2 65.5 63.3 81.3 82.5 77.2 78.4 Karnataka 68.4 70.3 65.4 66.7 63.3 65.5 59.3 72.6 73.8 70.0 72.1 Kerala 44.2 44.7 41.7 41.8 41.5 41.7 43.1 50.7 50.8 50.3 50.4 Tamil Nadu 92.6 92.6 90.7 90.3 88.6 87.5 90.6 98.2 97.7 95.6 94.5 Lakshadweep 7.8 9.8 8.0 9.6 7.4 9.1 9.7 8.0 9.6 7.4 9.1 Pondicherry 36.5 48.3 35.4 41.4 33.6 38.7 33.4 36.4 41.4 33.6 38.7
ALL INDIA 55.3 55.3 54.8 54.8 56.0 56.0 58.5 62.5 62.5 63.6 63.6
@ State-wise investment figures pertain to investments by scheduled commercial banks in the respectiveStates only. All India investment plus credit-deposit ratio is worked out by excluding investments inCentral Government and other approved securities.
Notes: 1. Deposits and Credit (as per place of sanction and utilisation) data for 1998,1999 and 2000 are based onBSR-1 and 2 surveys as on 31st March.
2. The investment figures are based on BSR-5 survey as on 31st March. 3. For March 1999, deposits data exclude Resurgent India Bonds (Rs. 17,945 crore). 4. CD-ratio for 2001 are based on BSR-7 survey as on 31st March 2001.

160
Report on Trend and Progress of Banking in India, 2000-01
Appendix Table II.5(A): Financial Performance of Scheduled Commercial Banks
(Amount in Rs.crore)
Item 1999-2000 2000-01 Variation of Col. (3) over Col.(2)
Absolute Percentage
1 2 3 4 5
A. Income 1,14,930.47 1,32,078.24 17,147.77 14.92
(i+ii) (100.00) (100.00)
i) Interest Income 99,183.88 1,14,951.13 15,767.25 15.90
(86.30) (87.03)
ii) Other Income 15,746.59 17,127.11 1,380.52 8.77
(13.70) (12.97)
B. Expenditure 1,07,685.22 1,25,654.14 17,968.92 16.69
(i+ii+iii) (100.00) (100.00)
i) Interest Expended 69,040.58 78,151.87 9,111.29 13.20
(64.11) (62.20)
ii) Provisions and Contingencies 11,061.32 13,322.94 2,261.62 20.45
(10.27) (10.60)
iii) Operating Expenses 27,583.32 34,179.33 6,596.01 23.91
(25.61) (27.20)
of which : Wage Bill 18,442.49 23,205.53 4,763.04 25.83
(17.13) (18.47)
C. Profit
i) Operating Profit 18,306.57 19,747.04 1,440.47 7.87
ii) Net Profit 7,245.25 6,424.10 -821.15 -11.31
D. Total Assets 11,05,464.38 12,94,973.95 1,89,509.57 17.14
E. Financial Ratios (per cent) @
i) Operating Profit 1.66 1.52 -0.14 —
ii) Net Profit 0.66 0.50 -0.16 —
iii) Income 10.40 10.20 -0.20 —
iv) Interest Income 8.97 8.88 -0.09 —
v) Other Income 1.42 1.32 -0.10 —
vi) Expenditure 9.74 9.70 -0.04 —
vii) Interest Expended 6.25 6.04 -0.21 —
viii) Operating Expenses 2.50 2.64 0.14 —
ix) Wage Bill 1.67 1.79 0.12 —
x) Provisions and Contingencies 1.00 1.03 0.03 —
xi) Spread (Net Interest Income) 2.73 2.84 0.11 —
@ Ratios to Total Assets.
Note : Figures in brackets are percentage to the respective total.

161
Appendix
Appendix Table II.5(B): Financial Performance of Public Sector Banks
(Amount in Rs.crore)
Item 1999-2000 2000-01 Variation of Col. (3) over Col.(2)
Absolute Percentage
1 2 3 4 5
A. Income 90,911.01 1,03,498.93 12,587.92 13.85
(i+ii) (100.00) (100.00)
i) Interest Income 79,413.68 90,983.98 11,570.30 14.57
(87.35) (87.91)
ii) Other Income 11,497.33 12,514.95 1,017.62 8.85
(12.65) (12.09)
B. Expenditure 85,794.83 99,181.99 13,387.16 15.60
(i+ii+iii) (100.00) (100.00)
i) Interest Expended 55,374.47 61,692.75 6,318.28 11.41
(64.54) (62.20)
ii) Provisions and Contingencies 7,926.11 9,476.01 1,549.90 19.55
(9.24) (9.55)
iii) Operating Expenses 22,494.25 28,013.23 5,518.98 24.54
(26.22) (28.24)
of which : Wage Bill 16,394.67 20,929.17 4,534.50 27.66
(19.11) (21.10)
C. Profit
i) Operating Profit 13,042.29 13,792.95 750.66 5.76
ii) Net Profit 5,116.18 4,316.94 -799.24 -15.62
D. Total Assets 8,90,600.05 10,29,769.59 1,39,169.54 15.63
E. Financial Ratios (per cent) @
i) Operating Profit 1.46 1.34 -0.12 —
ii) Net Profit 0.57 0.42 -0.15 —
iii) Income 10.21 10.05 -0.16 —
iv) Interest Income 8.92 8.84 -0.08 —
v) Other Income 1.29 1.22 -0.07 —
vi) Expenditure 9.63 9.63 0.00 —
vii) Interest Expended 6.22 5.99 -0.23 —
viii) Operating Expenses 2.53 2.72 0.19 —
ix) Wage Bill 1.84 2.03 0.19 —
x) Provisions and Contingencies 0.89 0.92 0.03 —
xi) Spread (Net Interest Income) 2.70 2.84 0.14 —
@ Ratios to Total Assets.
Note : Figures in brackets are percentage to the respective total.

162
Report on Trend and Progress of Banking in India, 2000-01
Appendix Table II.5(C): Financial Performance of Nationalised Banks
(Amount in Rs.crore)
Item 1999-2000 2000-01 Variation of Col. (3) over Col.(2)
Absolute Percentage
1 2 3 4 5
A. Income 56,896.43 64,126.52 7,230.09 12.71 (i+ii) (100.00) (100.00) i) Interest Income 50,234.01 56,967.11 6,733.10 13.40
(88.29) (88.84)ii) Other Income 6,662.42 7,159.41 496.99 7.46
(11.71) (11.16)B. Expenditure 54,459.43 62,031.43 7,572.00 13.90
(i+ii+iii) (100.00) (100.00)i) Interest Expended 35,477.41 38,789.64 3,312.23 9.34
(65.14) (62.53)ia) Interest on Recapitalisation 1,797.88 1,795.48
Bondsii) Provisions and Contingencies 4,766.15 5,958.24 1,192.09 25.01
(8.75) (9.61)iii) Operating Expenses 14,215.87 17,283.55 3,067.68 21.58
(26.10) (27.86)of which : Wage Bill 10,468.28 13,142.78 2,674.50 25.55
(19.22) (21.19)
C. Profiti) Operating Profit 7,203.15 8,053.33 850.18 11.80ia) Operating Profit exclusive of
income from recapitalisation bonds 5,405.27 6,257.85 852.58 15.77ii) Net Profit 2,437.00 2,095.09 -341.91 -14.03
iia) Net Profit exclusive of incomefrom recapitalisation bonds 639.12 299.61 -339.51 -53.12
D. Total Assets 5,54,205.72 6,26,892.12 72,686.40 13.12
E. Financial Ratios (per cent) @i) Operating Profit 1.30 1.28 -0.02 —
ia) Operating Profit exclusive of 0.98 1.00 0.02 —income from recapitalisation bonds
ii) Net Profit 0.44 0.33 -0.11 —iia) Net Profit exclusive of income 0.12 0.05 -0.07 —
from recapitalisation bondsiii) Income 10.27 10.23 -0.04 —iv) Interest Income 9.06 9.09 0.03 —v) Other Income 1.20 1.14 -0.06 —vi) Expenditure 9.83 9.90 0.07 —vii) Interest Expended 6.40 6.19 -0.21 —viii) Operating Expenses 2.57 2.76 0.19 —ix) Wage Bill 1.89 2.10 0.21 —x) Provisions and Contingencies 0.86 0.95 0.09 —xi) Spread (Net Interest Income) 2.66 2.90 0.24 —
xia) Spread exclusive of recapitalisation 2.34 2.61 0.27 —Bonds
@ Ratios to Total Assets.Note : Figures in brackets are percentage to the respective total.

163
Appendix
Appendix Table II.5(D): Financial Performance of the State Bank Group
(Amount in Rs.crore)
Item 1999-2000 2000-01 Variation of Col. (3) over Col.(2)
Absolute Percentage
1 2 3 4 5
A. Income 34,014.58 39,372.41 5,357.83 15.75
(i+ii) (100.00) (100.00)
i) Interest Income 29,179.67 34,016.87 4,837.20 16.58
(85.79) (86.40)
ii) Other Income 4,834.91 5,355.54 520.63 10.77
(14.21) (13.60)
B. Expenditure 31,335.40 37,150.56 5,815.16 18.56
(i+ii+iii) (100.00) (100.00)
i) Interest Expended 19,897.06 22,903.11 3,006.05 15.11
(63.50) (61.65)
ii) Provisions and Contingencies 3,159.96 3,517.77 357.81 11.32
(10.08) (9.47)
iii) Operating Expenses 8,278.38 10,729.68 2,451.30 29.61
(26.42) (28.88)
of which : Wage Bill 5,926.39 7,786.39 1,860.00 31.39
(18.91) (20.96)
C. Profit
i) Operating Profit 5,839.14 5,739.62 -99.52 -1.70
ii) Net Profit 2,679.18 2,221.85 -457.33 -17.07
D. Total Assets 3,36,394.33 4,02,877.47 66,483.14 19.76
E. Financial Ratios (per cent) @
i) Operating Profit 1.74 1.42 -0.32 —
ii) Net Profit 0.80 0.55 -0.25 —
iii) Income 10.11 9.77 -0.34 —
iv) Interest Income 8.67 8.44 -0.23 —
v) Other Income 1.44 1.33 -0.11 —
vi) Expenditure 9.32 9.22 -0.10 —
vii) Interest Expended 5.91 5.68 -0.23 —
viii) Operating Expenses 2.46 2.66 0.20 —
ix) Wage Bill 1.76 1.93 0.17 —
x) Provisions and Contingencies 0.94 0.87 -0.07 —
xi) Spread (Net Interest Income) 2.76 2.76 0.00 —
@ Ratios to Total Assets.
Note : Figures in brackets are percentage to the respective total.

164
Report on Trend and Progress of Banking in India, 2000-01
Appendix Table II.5(E) : Financial Performance of Old Private Sector Banks
(Amount in Rs.crore)
Item 1999-2000 2000-01 Variation of Col. (3) over Col.(2)
Absolute Percentage
1 2 3 4 5
A. Income 8,282.11 9,091.21 809.10 9.77
(i+ii) (100.00) (100.00)
i) Interest Income 7,065.08 8,052.11 987.03 13.97
(85.31) (88.57)
ii) Other Income 1,217.03 1,039.10 -177.93 -14.62
(14.69) (11.43)
B. Expenditure 7,690.43 8,568.37 877.94 11.42
(i+ii+iii) (100.00) (100.00)
i) Interest Expended 5,362.85 5,931.92 569.07 10.61
(69.73) (69.23)
ii) Provisions and Contingencies 741.74 957.13 215.39 29.04
(9.64) (11.17)
iii) Operating Expenses 1,585.84 1,679.32 93.48 5.89
(20.62) (19.60)
of which : Wage Bill 1,017.48 1,037.49 20.01 1.97
(13.23) (12.11)
C. Profit
i) Operating Profit 1,333.42 1,479.97 146.55 10.99
ii) Net Profit 591.68 522.84 -68.84 -11.63
D. Total Assets 73,122.94 84,604.62 11,481.68 15.70
E. Financial Ratios (per cent) @
i) Operating Profit 1.82 1.75 -0.07 —
ii) Net Profit 0.81 0.62 -0.19 —
iii) Income 11.33 10.75 -0.58 —
iv) Interest Income 9.66 9.52 -0.14 —
v) Other Income 1.66 1.23 -0.43 —
vi) Expenditure 10.52 10.13 -0.39 —
vii) Interest Expended 7.33 7.01 -0.32 —
viii) Operating Expenses 2.17 1.98 -0.19 —
ix) Wage Bill 1.39 1.23 -0.16 —
x) Provisions and Contingencies 1.01 1.13 0.12 —
xi) Spread (Net Interest Income) 2.33 2.51 0.18 —
@ Ratios to Total Assets.
Note : Figures in brackets are percentage to the respective total.
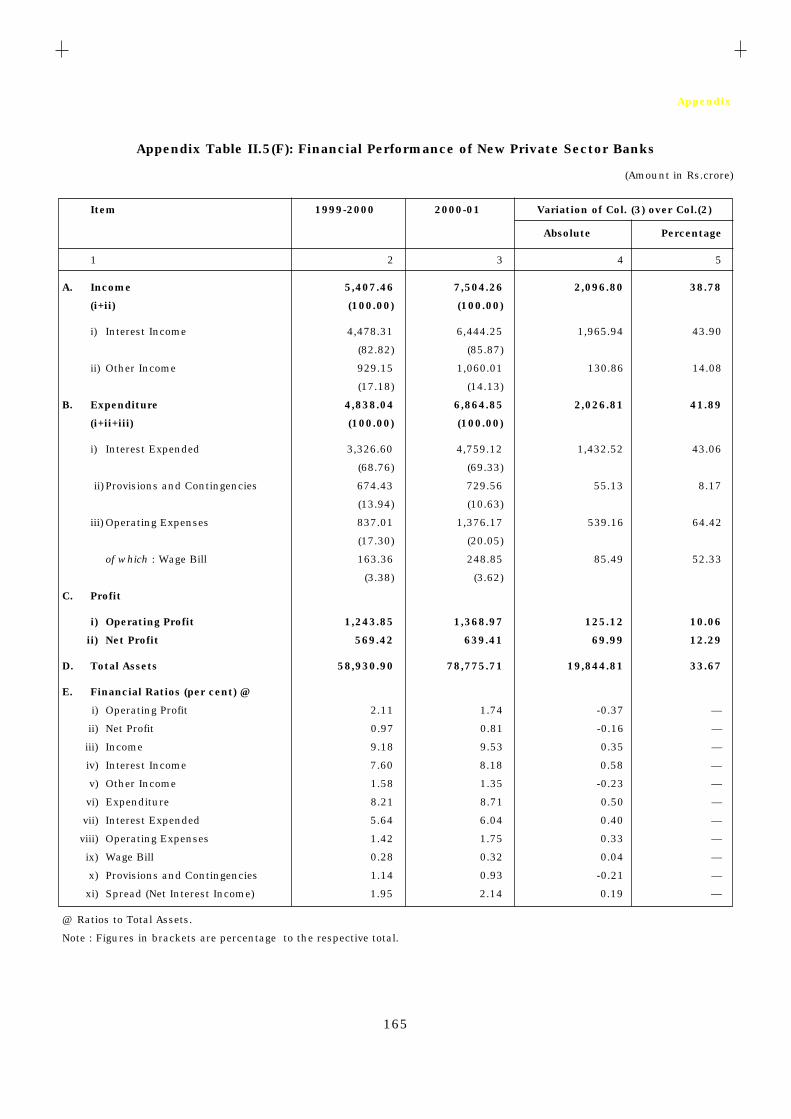
165
Appendix
Appendix Table II.5(F): Financial Performance of New Private Sector Banks
(Amount in Rs.crore)
Item 1999-2000 2000-01 Variation of Col. (3) over Col.(2)
Absolute Percentage
1 2 3 4 5
A. Income 5,407.46 7,504.26 2,096.80 38.78
(i+ii) (100.00) (100.00)
i) Interest Income 4,478.31 6,444.25 1,965.94 43.90
(82.82) (85.87)
ii) Other Income 929.15 1,060.01 130.86 14.08
(17.18) (14.13)
B. Expenditure 4,838.04 6,864.85 2,026.81 41.89
(i+ii+iii) (100.00) (100.00)
i) Interest Expended 3,326.60 4,759.12 1,432.52 43.06
(68.76) (69.33)
ii) Provisions and Contingencies 674.43 729.56 55.13 8.17
(13.94) (10.63)
iii) Operating Expenses 837.01 1,376.17 539.16 64.42
(17.30) (20.05)
of which : Wage Bill 163.36 248.85 85.49 52.33
(3.38) (3.62)
C. Profit
i) Operating Profit 1,243.85 1,368.97 125.12 10.06
ii) Net Profit 569.42 639.41 69.99 12.29
D. Total Assets 58,930.90 78,775.71 19,844.81 33.67
E. Financial Ratios (per cent) @
i) Operating Profit 2.11 1.74 -0.37 —
ii) Net Profit 0.97 0.81 -0.16 —
iii) Income 9.18 9.53 0.35 —
iv) Interest Income 7.60 8.18 0.58 —
v) Other Income 1.58 1.35 -0.23 —
vi) Expenditure 8.21 8.71 0.50 —
vii) Interest Expended 5.64 6.04 0.40 —
viii) Operating Expenses 1.42 1.75 0.33 —
ix) Wage Bill 0.28 0.32 0.04 —
x) Provisions and Contingencies 1.14 0.93 -0.21 —
xi) Spread (Net Interest Income) 1.95 2.14 0.19 —
@ Ratios to Total Assets.
Note : Figures in brackets are percentage to the respective total.

166
Report on Trend and Progress of Banking in India, 2000-01
Appendix Table II.5(G): Financial Performance of Foreign Banks in India
(Amount in Rs.crore)
Item 1999-2000 2000-01 Variation of Col. (3) over Col.(2)
Absolute Percentage
1 2 3 4 5
A. Income 10,329.89 11,983.84 1,653.95 16.01
(i+ii) (100.00) (100.00)
i) Interest Income 8,226.81 9,470.79 1,243.98 15.12
(79.64) (79.03)
ii) Other Income 2,103.08 2,513.05 409.97 19.49
(20.36) (20.97)
B. Expenditure 9,361.92 11,038.93 1,677.01 17.91
(i+ii+iii) (100.00) (100.00)
i) Interest Expended 4,976.66 5,768.08 791.42 15.90
(53.16) (52.25)
ii) Provisions and Contingencies 1,719.04 2,160.24 441.20 25.67
(18.36) (19.57)
iii) Operating Expenses 2,666.22 3,110.61 444.39 16.67
(28.48) (28.18)
of which : Wage Bill 866.98 990.02 123.04 14.19
(9.26) (8.97)
C. Profit
i) Operating Profit 2,687.01 3,105.15 418.14 15.56
ii) Net Profit 967.97 944.91 -23.06 -2.38
D. Total Assets 82,810.49 1,01,824.03 19,013.54 22.96
E. Financial Ratios (per cent) @
i) Operating Profit 3.24 3.05 -0.19 —
ii) Net Profit 1.17 0.93 -0.24 —
iii) Income 12.47 11.77 -0.70 —
iv) Interest Income 9.93 9.30 -0.63 —
v) Other Income 2.54 2.47 -0.07 —
vi) Expenditure 11.31 10.84 -0.47 —
vii) Interest Expended 6.01 5.66 -0.35 —
viii) Operating Expenses 3.22 3.05 -0.17 —
ix) Wage Bill 1.05 0.97 -0.08 —
x) Provisions and Contingencies 2.08 2.12 0.04 —
xi) Spread (Net Interest Income) 3.92 3.64 -0.28 —
@ Ratios to Total Assets.
Note : Figures in brackets are percentage to the respective total.

167
Appen
dix
Appendix Table II.6(A): Select Financial Parameters of Public Sector Banks(As on March 31, 2001)
(Per cent)
Sr. Name of the Bank CRAR Net NPAs/ Interest Non–Interest Operating Return Business ProfitNo.
Tier I Tier II Total
Net Income/ Income/ Profit/ on per perAdvances Working Working Working Assets employee employee
Fund Fund Fund
1 2 3 4 5 6 7 8 9 10 11 12
Nationalised Banks1 Allahabad Bank 6.70 3.80 10.50 11.23 9.77 1.15 1.26 0.18 129.00 0.192 Andhra Bank 9.76 3.64 13.40 2.95 10.66 1.16 1.41 0.59 153.62 0.953 Bank of Baroda 8.49 4.31 12.80 6.77 9.09 1.12 1.64 0.45 166.11 0.594 Bank of India 7.62 4.61 12.23 6.72 9.23 1.50 1.34 0.44 184.26 0.575 Bank of Maharashtra 6.39 4.25 10.64 7.41 10.41 1.36 1.46 0.24 164.77 0.326 Canara Bank 7.31 2.53 9.84 4.84 9.70 1.58 1.95 0.43 190.67 0.637 Central Bank of India 5.74 4.28 10.02 9.72 10.43 1.15 1.15 0.10 110.38 0.108 Corporation Bank 13.00 0.30 13.30 1.98 10.68 1.73 3.15 1.55 245.31 2.559 Dena Bank 4.38 3.35 7.73 18.37 9.69 1.10 0.38 0.00 207.00 0.00
10 Indian Bank Negative Nil Negative 10.06 8.58 1.29 0.25 Nil 136.00 Nil11 Indian Overseas Bank 5.81 4.43 10.24 7.01 9.47 1.03 1.04 0.38 141.40 0.4512 Oriental Bank of Commerce 11.45 0.36 11.81 3.60 10.60 1.00 2.00 0.80 263.20 1.5013 Punjab & Sind Bank 6.87 4.55 11.42 12.27 9.83 1.32 0.82 0.10 168.08 0.1314 Punjab National Bank 6.84 3.40 10.24 6.69 9.84 1.31 1.59 0.73 141.95 0.8015 Syndicate Bank 7.88 3.84 11.72 4.05 9.84 0.99 1.05 0.91 133.68 0.8116 UCO Bank 5.36 3.69 9.05 6.35 9.71 1.27 0.91 0.14 97.00 0.1217 Union Bank of India 6.19 4.67 10.86 6.87 10.49 0.88 1.44 0.40 183.23 0.5518 United Bank of India 7.00 3.40 10.40 10.50 10.07 0.86 0.71 0.10 120.00 0.1019 Vijaya Bank 8.04 3.46 11.50 6.23 10.34 1.19 1.36 0.53 122.83 0.53
State Bank Group20 State Bank of India 8.58 4.21 12.79 6.03 8.70 1.34 1.33 0.50 136.58 0.7021 State Bank of Bikaner & Jaipur 11.62 0.77 12.39 7.83 10.15 1.92 2.15 0.80 105.19 0.7722 State Bank of Hyderabad 9.56 2.72 12.28 7.82 9.23 1.57 2.44 0.82 165.00 1.1323 State Bank of Indore 9.12 3.61 12.73 5.91 9.89 2.27 2.91 0.89 126.00 2.6024 State Bank of Mysore 6.76 4.40 11.16 7.65 9.96 1.86 1.50 0.27 112.15 0.2625 State Bank of Patiala 10.69 1.68 12.37 4.92 10.76 1.36 3.19 1.12 143.45 1.2326 State Bank of Saurashtra 13.65 0.24 13.89 7.30 10.50 1.54 1.59 0.18 123.87 0.2127 State Bank of Travancore 7.73 4.06 11.79 7.75 10.18 1.50 1.78 0.67 157.32 0.85
Note : Figures reported in this table may not exactly tally with the data reported in Appendix Tables II.7 (B) to II.7 (I) due to conceptual differences.Source : Respective Balance Sheets.
(Amount in Rs. lakh)

168
Report on Trend and Progress of Banking in India, 2000-01
Appendix Table II.6(B): Gross Profit/Loss as Percentage of TotalAssets – Public Sector Banks
(Per cent)
Sr. No. Name of the Bank 1995-96 1996-97 1997-98 1998-99 1999-2000 2000-01
1 2 3 4 5 6 7 8
1 Allahabad Bank 0.83 1.40 1.56 1.34 1.28 1.21
2 Andhra Bank 0.89 1.06 1.68 1.35 1.83 1.22
3 Bank of Baroda 2.55 2.06 1.76 1.81 1.79 1.64
4 Bank of India 1.43 1.53 1.50 1.31 1.23 1.30
5 Bank of Maharashtra 0.85 1.18 1.16 1.11 1.52 1.26
6 Canara Bank 2.09 1.83 1.56 1.99 1.70 1.70
7 Central Bank of India 0.91 1.14 1.18 0.85 1.02 1.00
8 Corporation Bank 3.13 3.00 2.70 2.05 2.54 2.70
9 Dena Bank 1.76 2.00 2.23 1.46 1.36 0.38
10 Indian Bank -1.26 -0.81 -1.08 -0.76 0.10 0.23
11 Indian Overseas Bank 0.12 0.72 0.72 0.58 0.68 1.01
12 Oriental Bank of Commerce 2.62 2.60 2.28 2.06 2.06 1.97
13 Punjab & Sind Bank 0.12 0.75 1.11 0.86 0.83 0.77
14 Punjab National Bank 1.22 1.77 2.01 1.77 1.52 1.49
15 Syndicate Bank 0.64 0.56 0.70 0.77 1.03 1.05
16 UCO Bank -0.17 -0.45 0.08 0.18 0.75 0.78
17 Union Bank of India 1.52 1.52 1.36 0.99 1.12 1.31
18 United Bank of India -0.37 -0.51 1.13 0.27 0.43 0.64
19 Vijaya Bank 0.07 0.43 0.68 1.05 0.98 1.25
Nationalised Banks 1.14 1.26 1.33 1.22 1.30 1.28
20 State Bank of India 2.10 2.17 1.95 1.55 1.61 1.26
21 State Bank of Bikaner & Jaipur 1.71 1.93 2.30 1.58 1.91 1.94
22 State Bank of Hyderabad 2.46 2.43 2.70 2.07 2.65 2.44
23 State Bank of Indore 2.01 2.23 2.22 2.31 2.06 2.10
24 State Bank of Mysore 1.91 2.39 2.16 1.75 1.96 1.47
25 State Bank of Patiala 2.23 2.26 2.14 2.34 2.83 2.79
26 State Bank of Saurashtra 2.00 2.43 2.30 1.92 2.15 1.36
27 State Bank of Travancore 2.07 1.93 2.19 1.39 1.47 1.59
State Bank Group 2.10 2.18 2.03 1.63 1.74 1.42
Public Sector Banks 1.49 1.60 1.58 1.37 1.46 1.34

169
Appendix
Appendix Table II.6(C): Net Profit/Loss as Percentage of TotalAssets – Public Sector Banks
(Per cent)
Sr. No. Name of the Bank 1995-96 1996-97 1997-98 1998-99 1999-2000 2000-01
1 2 3 4 5 6 7 8
1 Allahabad Bank 0.05 0.49 0.85 0.77 0.35 0.18
2 Andhra Bank 0.16 0.43 0.82 0.78 0.76 0.59
3 Bank of Baroda 0.61 0.73 1.01 0.81 0.86 0.43
4 Bank of India 0.84 0.95 0.79 0.37 0.31 0.42
5 Bank of Maharashtra 0.16 0.54 0.53 0.43 0.59 0.24
6 Canara Bank 0.81 0.41 0.47 0.47 0.43 0.43
7 Central Bank of India -0.32 0.57 0.57 0.41 0.36 0.10
8 Corporation Bank 1.52 1.53 1.49 1.29 1.39 1.33
9 Dena Bank 0.63 0.75 0.86 0.74 0.37 -1.49
10 Indian Bank -7.52 -2.28 -1.55 -3.64 -1.81 -1.03
11 Indian Overseas Bank 0.02 0.58 0.53 0.23 0.15 0.38
12 Oriental Bank of Commerce 1.64 1.56 1.42 1.23 1.14 0.75
13 Punjab & Sind Bank -1.83 0.26 0.72 0.53 0.52 0.10
14 Punjab National Bank -0.30 0.68 1.20 0.80 0.75 0.73
15 Syndicate Bank 0.13 0.38 0.42 0.65 0.79 0.83
16 UCO Bank -1.53 -1.08 -0.52 -0.33 0.16 0.12
17 Union Bank of India 0.39 0.96 0.97 0.51 0.29 0.40
18 United Bank of India -2.16 -0.89 0.07 0.09 0.16 0.09
19 Vijaya Bank -3.47 0.24 0.25 0.27 0.41 0.50
Nationalised Banks -0.36 0.41 0.62 0.37 0.44 0.33
20 State Bank of India 0.58 0.86 1.04 0.46 0.78 0.51
21 State Bank of Bikaner & Jaipur 0.39 0.50 1.06 0.90 0.97 0.76
22 State Bank of Hyderabad 0.61 0.56 0.91 0.85 0.82 0.82
23 State Bank of Indore 0.39 0.49 0.68 0.63 0.72 0.78
24 State Bank of Mysore 0.54 0.74 0.86 0.49 0.58 0.27
25 State Bank of Patiala 0.63 0.68 1.47 0.93 1.06 1.12
26 State Bank of Saurashtra -4.94 2.20 2.43 0.40 1.18 0.16
27 State Bank of Travancore 0.39 0.52 0.69 0.40 0.53 0.67
State Bank Group 0.42 0.84 1.06 0.51 0.80 0.55
Public Sector Banks -0.07 0.57 0.77 0.42 0.57 0.42
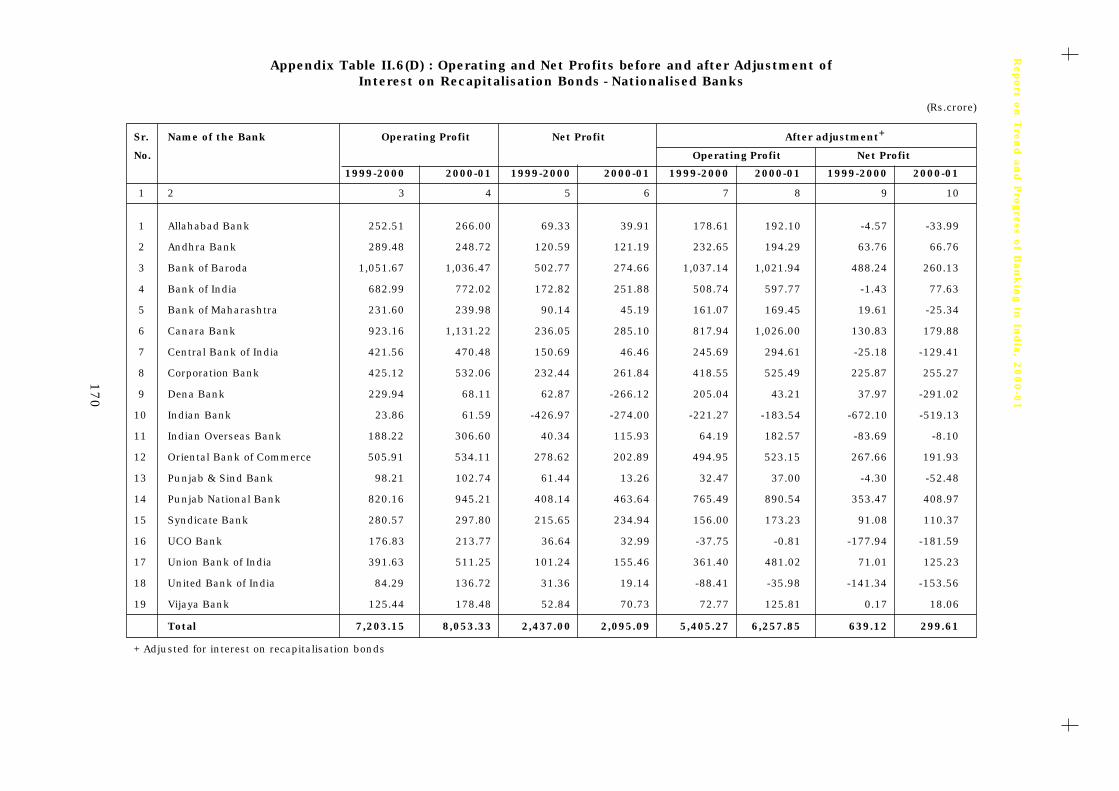
170
Report o
n T
ren
d a
nd P
rogre
ss of B
an
kin
g in
India
, 20
00
-01
Appendix Table II.6(D) : Operating and Net Profits before and after Adjustment ofInterest on Recapitalisation Bonds - Nationalised Banks
(Rs.crore)
Sr. Name of the Bank Operating Profit Net Profit After adjustment+
No. Operating Profit Net Profit
1999-2000 2000-01 1999-2000 2000-01 1999-2000 2000-01 1999-2000 2000-01
1 2 3 4 5 6 7 8 9 10
1 Allahabad Bank 252.51 266.00 69.33 39.91 178.61 192.10 -4.57 -33.99
2 Andhra Bank 289.48 248.72 120.59 121.19 232.65 194.29 63.76 66.76
3 Bank of Baroda 1,051.67 1,036.47 502.77 274.66 1,037.14 1,021.94 488.24 260.13
4 Bank of India 682.99 772.02 172.82 251.88 508.74 597.77 -1.43 77.63
5 Bank of Maharashtra 231.60 239.98 90.14 45.19 161.07 169.45 19.61 -25.34
6 Canara Bank 923.16 1,131.22 236.05 285.10 817.94 1,026.00 130.83 179.88
7 Central Bank of India 421.56 470.48 150.69 46.46 245.69 294.61 -25.18 -129.41
8 Corporation Bank 425.12 532.06 232.44 261.84 418.55 525.49 225.87 255.27
9 Dena Bank 229.94 68.11 62.87 -266.12 205.04 43.21 37.97 -291.02
10 Indian Bank 23.86 61.59 -426.97 -274.00 -221.27 -183.54 -672.10 -519.13
11 Indian Overseas Bank 188.22 306.60 40.34 115.93 64.19 182.57 -83.69 -8.10
12 Oriental Bank of Commerce 505.91 534.11 278.62 202.89 494.95 523.15 267.66 191.93
13 Punjab & Sind Bank 98.21 102.74 61.44 13.26 32.47 37.00 -4.30 -52.48
14 Punjab National Bank 820.16 945.21 408.14 463.64 765.49 890.54 353.47 408.97
15 Syndicate Bank 280.57 297.80 215.65 234.94 156.00 173.23 91.08 110.37
16 UCO Bank 176.83 213.77 36.64 32.99 -37.75 -0.81 -177.94 -181.59
17 Union Bank of India 391.63 511.25 101.24 155.46 361.40 481.02 71.01 125.23
18 United Bank of India 84.29 136.72 31.36 19.14 -88.41 -35.98 -141.34 -153.56
19 Vijaya Bank 125.44 178.48 52.84 70.73 72.77 125.81 0.17 18.06
Total 7,203.15 8,053.33 2,437.00 2,095.09 5,405.27 6,257.85 639.12 299.61
+ Adjusted for interest on recapitalisation bonds

171
Appendix
Appendix Table II.6(E): Interest Income as Percentage of TotalAssets – Public Sector Banks
(Per cent)
Sr. No. Name of the Bank 1995-96 1996-97 1997-98 1998-99 1999-2000 2000-01
1 2 3 4 5 6 7 8
1 Allahabad Bank 8.80 9.71 9.30 9.15 9.36 9.37
2 Andhra Bank 9.45 9.53 9.92 9.11 9.16 9.20
3 Bank of Baroda 10.22 9.99 9.10 9.23 8.83 9.09
4 Bank of India 8.74 9.26 8.49 8.51 8.51 8.93
5 Bank of Maharashtra 9.51 9.79 9.30 9.31 9.64 8.96
6 Canara Bank 9.37 9.57 8.87 9.68 8.91 8.46
7 Central Bank of India 9.28 9.59 9.31 9.29 9.06 9.03
8 Corporation Bank 9.64 10.11 9.16 9.04 9.57 9.16
9 Dena Bank 9.94 10.44 9.92 10.05 9.40 9.58
10 Indian Bank 8.46 9.18 7.53 7.60 8.07 7.88
11 Indian Overseas Bank 8.83 10.37 9.26 9.40 9.07 9.22
12 Oriental Bank of Commerce 9.75 10.82 9.86 9.97 10.02 10.19
13 Punjab & Sind Bank 9.04 9.64 9.35 9.30 9.50 9.23
14 Punjab National Bank 9.90 10.43 10.03 9.60 9.52 9.23
15 Syndicate Bank 8.79 9.12 8.69 9.45 8.97 9.89
16 UCO Bank 7.76 7.97 7.78 8.16 8.39 8.32
17 Union Bank of India 9.67 10.28 9.72 9.19 9.47 9.58
18 United Bank of India 7.69 7.82 9.19 8.44 8.70 8.99
19 Vijaya Bank 9.26 9.10 8.58 9.01 9.36 9.51
Nationalised Banks 9.22 9.65 9.09 9.15 9.06 9.09
20 State Bank of India 8.97 9.55 8.84 8.59 8.49 8.24
21 State Bank of Bikaner & Jaipur 9.21 9.05 9.98 9.42 8.95 9.14
22 State Bank of Hyderabad 9.93 10.13 9.74 9.30 9.56 9.23
23 State Bank of Indore 10.20 10.87 9.95 9.98 8.92 8.63
24 State Bank of Mysore 10.29 11.01 10.45 10.14 9.66 9.72
25 State Bank of Patiala 9.27 10.47 9.66 9.38 9.40 9.38
26 State Bank of Saurashtra 8.54 9.88 9.66 9.41 9.25 8.95
27 State Bank of Travancore 11.51 11.67 10.75 9.40 9.32 9.08
State Bank Group 9.17 9.75 9.11 8.79 8.67 8.44
Public Sector Banks 9.20 9.69 9.10 9.01 8.92 8.84

172
Report on Trend and Progress of Banking in India, 2000-01
Appendix Table II.6(F): Interest Expended as Percentage of TotalAssets – Public Sector Banks
(Per cent)
Sr. No. Name of the Bank 1995-96 1996-97 1997-98 1998-99 1999-2000 2000-01
1 2 3 4 5 6 7 8
1 Allahabad Bank 6.13 6.66 6.42 6.34 6.50 6.29
2 Andhra Bank 6.42 6.55 6.56 6.20 6.49 6.74
3 Bank of Baroda 6.54 6.78 6.19 6.22 5.98 6.03
4 Bank of India 5.86 6.25 5.72 5.90 6.19 6.15
5 Bank of Maharashtra 5.92 6.11 5.80 6.02 6.57 6.03
6 Canara Bank 6.03 6.39 6.37 6.51 6.27 5.62
7 Central Bank of India 6.13 6.42 6.20 6.32 6.09 5.96
8 Corporation Bank 5.90 6.24 5.70 6.55 6.84 6.21
9 Dena Bank 6.30 6.59 6.44 7.09 6.94 7.08
10 Indian Bank 7.94 8.47 6.95 6.68 6.45 6.05
11 Indian Overseas Bank 6.71 7.99 6.95 7.09 6.61 6.31
12 Oriental Bank of Commerce 5.95 6.93 6.48 6.87 7.11 7.27
13 Punjab & Sind Bank 6.88 7.04 6.72 6.91 7.15 6.72
14 Punjab National Bank 6.63 6.96 6.78 6.03 6.54 6.02
15 Syndicate Bank 5.60 5.95 5.84 6.51 5.94 6.01
16 UCO Bank 5.60 6.04 5.88 6.01 6.05 5.90
17 Union Bank of India 6.27 6.87 6.55 6.52 6.73 6.45
18 United Bank of India 5.98 6.28 6.45 6.44 6.59 6.60
19 Vijaya Bank 6.73 6.19 5.82 6.15 6.33 6.28
Nationalised Banks 6.30 6.68 6.30 6.37 6.40 6.19
20 State Bank of India 5.69 6.13 5.83 5.86 5.84 5.63
21 State Bank of Bikaner & Jaipur 5.67 5.72 6.30 6.19 5.95 5.85
22 State Bank of Hyderabad 6.21 6.44 6.13 5.77 6.21 5.90
23 State Bank of Indore 6.10 6.59 6.09 6.05 5.93 5.79
24 State Bank of Mysore 6.40 6.79 6.50 6.56 6.26 6.39
25 State Bank of Patiala 5.79 6.76 6.01 5.85 5.62 5.16
26 State Bank of Saurashtra 5.24 6.26 6.03 5.92 6.05 6.02
27 State Bank of Travancore 8.22 8.49 7.81 7.20 7.06 6.35
State Bank Group 5.82 6.27 5.97 5.94 5.91 5.68
Public Sector Banks 6.12 6.53 6.19 6.21 6.22 5.99

173
Appendix
Appendix Table II.6(G): Net Interest Income (Spread) as Percentage of TotalAssets – Public Sector Banks
(Per cent)
Sr. No. Name of the Bank 1995-96 1996-97 1997-98 1998-99 1999-2000 2000-01
1 2 3 4 5 6 7 8
1 Allahabad Bank 2.67 3.05 2.88 2.82 2.86 3.09
2 Andhra Bank 3.03 2.98 3.37 2.91 2.68 2.45
3 Bank of Baroda 3.68 3.21 2.91 3.01 2.85 3.06
4 Bank of India 2.88 3.00 2.77 2.61 2.33 2.78
5 Bank of Maharashtra 3.59 3.67 3.50 3.29 3.07 2.93
6 Canara Bank 3.33 3.19 2.49 3.17 2.64 2.83
7 Central Bank of India 3.15 3.17 3.11 2.97 2.96 3.07
8 Corporation Bank 3.74 3.87 3.46 2.49 2.73 2.95
9 Dena Bank 3.64 3.85 3.48 2.97 2.46 2.51
10 Indian Bank 0.52 0.71 0.57 0.92 1.61 1.84
11 Indian Overseas Bank 2.12 2.38 2.31 2.31 2.46 2.91
12 Oriental Bank of Commerce 3.80 3.89 3.38 3.10 2.90 2.92
13 Punjab & Sind Bank 2.15 2.60 2.63 2.38 2.35 2.51
14 Punjab National Bank 3.27 3.47 3.25 3.57 2.99 3.21
15 Syndicate Bank 3.20 3.17 2.85 2.94 3.04 3.87
16 UCO Bank 2.17 1.93 1.89 2.15 2.35 2.42
17 Union Bank of India 3.40 3.41 3.17 2.66 2.73 3.13
18 United Bank of India 1.71 1.54 2.74 2.00 2.10 2.39
19 Vijaya Bank 2.53 2.91 2.76 2.86 3.03 3.23
Nationalised Banks 2.92 2.97 2.78 2.77 2.66 2.90
20 State Bank of India 3.28 3.43 3.01 2.72 2.65 2.61
21 State Bank of Bikaner & Jaipur 3.53 3.32 3.68 3.23 3.00 3.29
22 State Bank of Hyderabad 3.72 3.69 3.61 3.53 3.35 3.33
23 State Bank of Indore 4.10 4.28 3.86 3.92 2.99 2.84
24 State Bank of Mysore 3.88 4.22 3.94 3.58 3.39 3.33
25 State Bank of Patiala 3.48 3.70 3.64 3.53 3.78 4.22
26 State Bank of Saurashtra 3.30 3.62 3.63 3.49 3.20 2.93
27 State Bank of Travancore 3.29 3.18 2.94 2.20 2.27 2.73
State Bank Group 3.34 3.48 3.14 2.85 2.76 2.76
Public Sector Banks 3.08 3.16 2.91 2.80 2.70 2.84
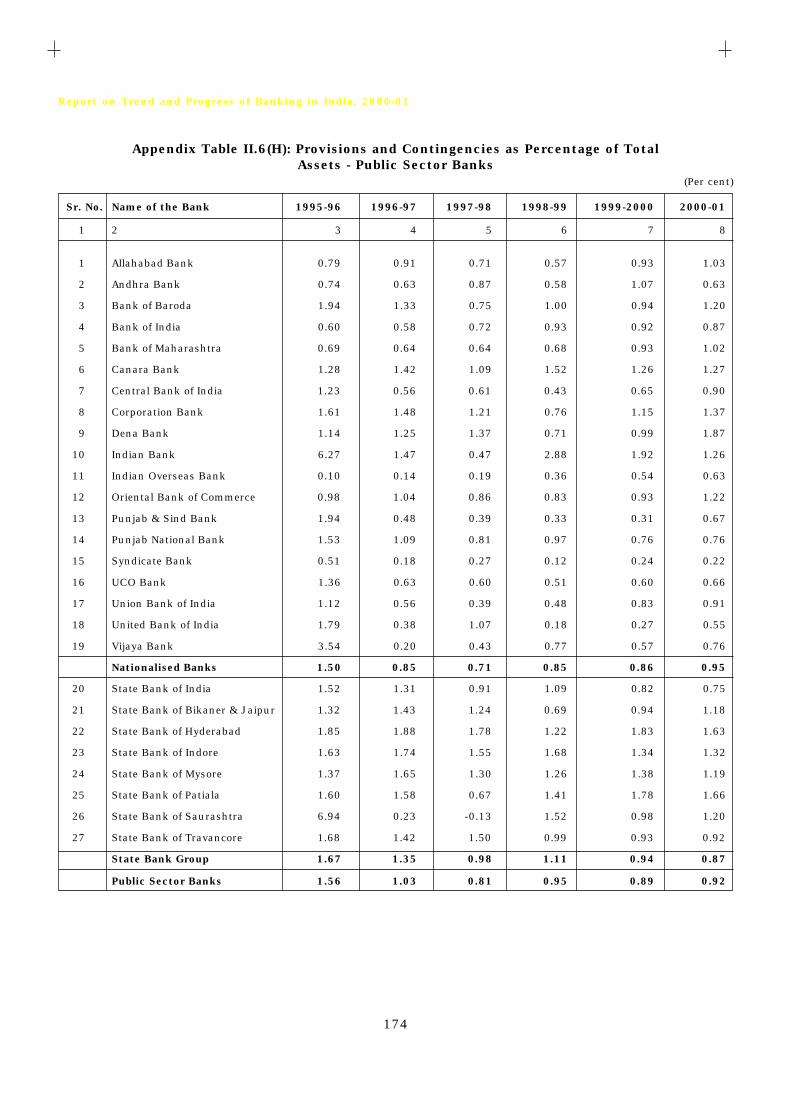
174
Report on Trend and Progress of Banking in India, 2000-01
Appendix Table II.6(H): Provisions and Contingencies as Percentage of TotalAssets - Public Sector Banks
(Per cent)
Sr. No. Name of the Bank 1995-96 1996-97 1997-98 1998-99 1999-2000 2000-01
1 2 3 4 5 6 7 8
1 Allahabad Bank 0.79 0.91 0.71 0.57 0.93 1.03
2 Andhra Bank 0.74 0.63 0.87 0.58 1.07 0.63
3 Bank of Baroda 1.94 1.33 0.75 1.00 0.94 1.20
4 Bank of India 0.60 0.58 0.72 0.93 0.92 0.87
5 Bank of Maharashtra 0.69 0.64 0.64 0.68 0.93 1.02
6 Canara Bank 1.28 1.42 1.09 1.52 1.26 1.27
7 Central Bank of India 1.23 0.56 0.61 0.43 0.65 0.90
8 Corporation Bank 1.61 1.48 1.21 0.76 1.15 1.37
9 Dena Bank 1.14 1.25 1.37 0.71 0.99 1.87
10 Indian Bank 6.27 1.47 0.47 2.88 1.92 1.26
11 Indian Overseas Bank 0.10 0.14 0.19 0.36 0.54 0.63
12 Oriental Bank of Commerce 0.98 1.04 0.86 0.83 0.93 1.22
13 Punjab & Sind Bank 1.94 0.48 0.39 0.33 0.31 0.67
14 Punjab National Bank 1.53 1.09 0.81 0.97 0.76 0.76
15 Syndicate Bank 0.51 0.18 0.27 0.12 0.24 0.22
16 UCO Bank 1.36 0.63 0.60 0.51 0.60 0.66
17 Union Bank of India 1.12 0.56 0.39 0.48 0.83 0.91
18 United Bank of India 1.79 0.38 1.07 0.18 0.27 0.55
19 Vijaya Bank 3.54 0.20 0.43 0.77 0.57 0.76
Nationalised Banks 1.50 0.85 0.71 0.85 0.86 0.95
20 State Bank of India 1.52 1.31 0.91 1.09 0.82 0.75
21 State Bank of Bikaner & Jaipur 1.32 1.43 1.24 0.69 0.94 1.18
22 State Bank of Hyderabad 1.85 1.88 1.78 1.22 1.83 1.63
23 State Bank of Indore 1.63 1.74 1.55 1.68 1.34 1.32
24 State Bank of Mysore 1.37 1.65 1.30 1.26 1.38 1.19
25 State Bank of Patiala 1.60 1.58 0.67 1.41 1.78 1.66
26 State Bank of Saurashtra 6.94 0.23 -0.13 1.52 0.98 1.20
27 State Bank of Travancore 1.68 1.42 1.50 0.99 0.93 0.92
State Bank Group 1.67 1.35 0.98 1.11 0.94 0.87
Public Sector Banks 1.56 1.03 0.81 0.95 0.89 0.92

175
Appendix
Appendix Table II.6(I): Operating Expenses as Percentage of TotalAssets – Public Sector Banks
(Per cent)
Sr. No. Name of the Bank 1995-96 1996-97 1997-98 1998-99 1999-2000 2000-01
1 2 3 4 5 6 7 8
1 Allahabad Bank 3.04 3.02 2.70 2.67 2.89 2.98
2 Andhra Bank 3.23 3.11 2.95 2.83 2.27 2.24
3 Bank of Baroda 2.53 2.37 2.34 2.31 2.22 2.54
4 Bank of India 2.72 2.77 2.52 2.37 2.51 2.93
5 Bank of Maharashtra 3.73 3.41 3.21 3.06 2.76 2.84
6 Canara Bank 2.74 2.63 2.34 2.56 2.48 2.51
7 Central Bank of India 3.40 3.19 3.05 3.11 3.00 3.06
8 Corporation Bank 2.20 2.23 2.05 1.81 1.81 1.73
9 Dena Bank 3.07 2.99 2.75 2.54 2.44 3.24
10 Indian Bank 2.86 2.80 2.67 2.61 2.68 2.79
11 Indian Overseas Bank 2.76 2.73 2.55 2.75 2.74 2.89
12 Oriental Bank of Commerce 2.14 2.19 2.03 1.97 1.74 1.94
13 Punjab & Sind Bank 3.06 3.06 2.80 2.57 2.82 2.98
14 Punjab National Bank 3.21 3.04 2.84 2.97 2.82 2.95
15 Syndicate Bank 3.47 3.50 3.29 3.41 3.13 3.81
16 UCO Bank 3.27 3.16 2.89 2.87 2.65 2.73
17 Union Bank of India 2.80 2.77 2.62 2.51 2.47 2.62
18 United Bank of India 2.99 2.81 2.58 2.40 2.39 2.52
19 Vijaya Bank 3.36 3.26 2.95 2.80 2.97 3.07
Nationalised Banks 2.93 2.85 2.65 2.63 2.57 2.76
20 State Bank of India 3.09 2.94 2.63 2.65 2.41 2.63
21 State Bank of Bikaner & Jaipur 3.46 2.97 3.29 3.24 2.85 3.08
22 State Bank of Hyderabad 3.05 2.81 2.52 2.90 2.42 2.46
23 State Bank of Indore 3.67 3.56 3.41 3.40 3.07 2.72
24 State Bank of Mysore 3.82 3.44 3.43 3.57 3.41 3.68
25 State Bank of Patiala 2.52 2.50 2.51 2.41 2.34 2.62
26 State Bank of Saurashtra 3.08 2.82 3.13 3.00 2.56 2.88
27 State Bank of Travancore 2.97 2.84 2.38 2.22 2.37 2.48
State Bank Group 3.10 2.94 2.68 2.70 2.46 2.66
Public Sector Banks 2.99 2.88 2.66 2.66 2.53 2.72

176
Report o
n T
ren
d a
nd P
rogre
ss of B
an
kin
g in
India
, 20
00
-01
Appendix Table II.7(A): Select Financial Parameters of Private Sector Banks(As on March 31, 2001)
Sr. Name of the Bank CRAR Net NPAs/ Interest Non- Operating Return Business ProfitNo. Tier I Tier II Total Net Income/ Interest Profit/ on per per
Advances Working Income/ Working Assets employee employeeFund Working Fund
Fund
1 2 3 4 5 6 7 8 9 10 11 12
Old Private Sector Banks 1 The Bank of Rajasthan Ltd. 8.91 1.66 10.57 7.65 10.44 1.33 1.36 0.74 123.55 0.75 2 The Benares State Bank Ltd. Negative N.A. Negative 23.70 8.88 1.52 -0.70 -1.19 100.13 -1.04 3 Bharat Overseas Bank Ltd. 12.48 1.95 14.43 4.14 10.22 1.66 2.37 1.14 233.00 1.67 4 The Catholic Syrian Bank Ltd. 4.47 1.61 6.08 9.99 10.49 1.62 1.63 0.38 125.42 0.37 5 City Union Bank Ltd. 13.26 0.33 13.59 8.20 10.49 1.64 2.81 1.21 167.35 1.58 6 Development Credit Bank Ltd. 10.69 0.59 11.28 6.12 11.28 1.41 1.86 0.87 429.39 2.35 7 Dhanalakshmi Bank Ltd. 7.33 2.36 9.69 11.34 10.52 1.54 1.01 0.40 184.28 0.52 8 The Federal Bank Ltd. 7.72 2.57 10.29 10.08 11.54 1.57 2.35 0.69 190.00 0.97 9 The Ganesh Bank of Kurundwad Ltd. 5.26 3.85 9.11 10.12 11.30 0.49 0.44 11.08 105.40 0.1610 The Jammu & Kashmir Bank Ltd. 14.33 3.11 17.44 2.45 10.51 0.79 2.66 1.32 212.00 2.5811 The Karnataka Bank Ltd. 11.06 0.31 11.37 6.93 10.89 1.49 2.27 0.73 210.28 1.1112 The Karur Vysya Bank Ltd. 15.12 0.44 15.56 4.73 11.69 1.37 2.80 1.70 192.00 2.5213 The Lakshmi Vilas Bank Ltd. 8.52 1.69 10.21 6.47 10.39 2.44 2.49 1.02 192.00 1.3814 Lord Krishna Bank Ltd. 8.60 4.30 12.90 12.92 10.09 1.72 1.24 0.41 226.00 0.6515 The Nainital Bank Ltd. 13.72 2.09 15.81 0.00 10.40 0.44 1.80 0.93 93.07 0.7916 The Nedungadi Bank Ltd. Negative Nil Negative 21.04 9.80 1.60 0.04 Negative 145.80 -4.1917 The Ratnakar Bank Ltd. 9.42 0.58 10.00 7.58 11.61 1.73 1.99 0.77 145.87 0.7518 The Sangli Bank Ltd. 8.37 3.10 11.47 6.64 11.05 1.04 1.31 0.40 74.58 0.3019 SBI Commercial & International Bank Ltd. 19.48 0.37 19.85 22.56 9.94 1.53 1.31 -6.50 706.37 -36.2020 The South Indian Bank Ltd. 8.36 2.81 11.17 7.10 11.55 1.55 2.29 0.89 171.00 1.1121 Tamilnad Mercantile Bank Ltd. 15.81 1.78 17.59 5.99 11.32 1.54 3.08 1.37 214.94 2.2922 The United Western Bank Ltd. 6.62 2.97 9.59 9.48 10.52 1.03 1.38 0.00 212.00 0.0023 The Vysya Bank Ltd. 8.44 3.61 12.05 4.77 10.54 1.47 1.36 0.37 199.59 0.63
New Private Sector Banks24 Bank of Punjab Ltd. 8.52 2.50 11.02 2.31 11.20 1.41 2.13 0.93 645.68 4.9425 Centurian Bank Ltd. 6.88 9.61 16.49 2.96 10.24 1.83 1.08 0.13 636.16 7.0426 Global Trust Bank 8.79 3.92 12.71 3.75 10.35 1.90 2.32 0.85 832.00 7.0027 HDFC Bank 8.69 2.40 11.09 0.45 3.89 1.43 2.83 1.62 643.00 8.6128 ICICI Bank 10.42 1.15 11.57 2.19 10.07 1.78 2.35 0.82 815.22 10.4529 IDBI Bank 7.89 3.83 11.72 5.24 10.89 1.41 1.39 0.41 684.67 2.5030 IndusInd Bank Ltd. 12.56 2.44 15.00 5.25 10.59 1.69 2.51 0.47 1,582.36 6.9831 UTI Bank Ltd. 5.84 3.16 9.00 3.43 10.07 1.85 1.50 0.80 959.00 7.27
N.A. : Not Applicable.Note : Figures reported in this table may not exactly tally with the data reported in Appendix Tables II.8 (B) to II.8 (H) due to conceptual differences.Source : Respective Balance Sheets.
(Amount in Rs.lakh)
(Per cent)

177
Appendix
Appendix Table II.7(B): Gross Profit/Loss as Percentage of TotalAssets - Private Sector Banks
(Per cent)
Sr. No. Name of the Bank 1995-96 1996-97 1997-98 1998-99 1999-2000 2000-01
1 2 3 4 5 6 7 8
1 The Bank of Rajasthan Ltd. 1.86 1.41 0.84 -0.30 0.46 1.33
2 The Benares State Bank Ltd. 0.33 0.98 1.07 -0.95 0.06 -0.70
3 Bharat Overseas Bank Ltd. 2.44 1.79 1.56 1.11 1.26 1.94
4 The Catholic Syrian Bank Ltd. 1.29 0.83 0.97 0.22 0.95 1.63
5 City Union Bank Ltd. 2.98 2.61 1.86 1.76 3.18 2.72
6 Development Credit Bank Ltd. 3.09 2.48 2.81 1.27 1.89 1.61
7 Dhanalakshmi Bank Ltd. 1.46 1.35 1.60 0.96 1.89 1.01
8 The Federal Bank Ltd. 1.59 1.20 1.27 0.61 1.78 2.12
9 The Ganesh Bank of Kurundwad Ltd. 1.35 1.34 0.80 0.54 0.81 0.42
10 The Jammu & Kashmir Bank Ltd. 2.81 2.19 2.89 2.29 2.20 2.14
11 The Karnataka Bank Ltd. 2.38 2.90 2.65 1.48 1.41 2.04
12 The Karur Vysya Bank Ltd. 2.83 2.99 3.29 1.98 2.91 2.61
13 The Lakshmi Vilas Bank Ltd. 2.15 1.70 1.70 1.29 2.40 2.30
14 Lord Krishna Bank Ltd. 2.69 2.24 1.59 1.06 1.41 1.08
15 The Nainital Bank Ltd. 0.93 1.51 1.50 1.90 1.69 1.67
16 The Nedungadi Bank Ltd. 1.09 1.67 1.95 0.99 1.51 0.03
17 The Ratnakar Bank Ltd. 0.97 1.04 1.40 1.10 1.46 1.75
18 The Sangli Bank Ltd. 1.09 1.09 2.46 0.99 1.14 1.08
19 SBI Commercial & International Bank Ltd. -0.33 1.08 2.27 2.33 3.19 1.31
20 The South Indian Bank Ltd. 1.83 0.92 0.98 0.98 1.80 2.05
21 Tamilnad Mercantile Bank Ltd. 3.96 4.19 3.32 2.42 2.36 2.78
22 The United Western Bank Ltd. 2.33 2.54 2.67 1.63 2.96 1.08
23 The Vysya Bank Ltd. 2.29 1.86 1.74 0.81 1.35 1.13
Old Private Sector Banks 2.10 1.89 1.97 1.21 1.82 1.75
24 Bank of Punjab Ltd. 2.89 2.45 2.78 1.97 1.69 1.73
25 Centurion Bank Ltd. 3.10 1.83 2.43 1.01 1.25 0.98
26 Global Trust Bank 2.78 3.92 3.49 2.01 3.29 2.12
27 HDFC Bank 2.98 3.52 3.62 2.90 2.21 2.44
28 ICICI Bank 2.48 3.80 3.06 1.78 1.88 1.47
29 IDBI Bank 0.73 1.09 1.30 1.13 1.85 1.40
30 IndusInd Bank Ltd. 3.50 3.51 4.00 1.79 2.39 2.00
31 UTI Bank Ltd. 2.34 1.95 1.72 1.74 1.74 1.23
New Private Sector Banks 2.77 2.98 2.86 1.78 2.11 1.74
Private Sector Banks 2.23 2.18 2.25 1.42 1.95 1.74

178
Report on Trend and Progress of Banking in India, 2000-01
Appendix Table II.7(C): Net Profit/Loss as Percentage of TotalAssets - Private Sector Banks
(Per cent)
Sr. No. Name of the Bank 1995-96 1996-97 1997-98 1998-99 1999-2000 2000-01
1 2 3 4 5 6 7 8
1 The Bank of Rajasthan Ltd. 1.50 0.10 -2.58 -1.84 0.30 0.74
2 The Benares State Bank Ltd. -3.21 0.21 0.13 -2.32 -0.54 -1.18
3 Bharat Overseas Bank Ltd. 1.17 1.06 0.87 0.74 0.06 0.94
4 The Catholic Syrian Bank Ltd. 0.02 0.24 0.36 0.02 0.25 0.38
5 City Union Bank Ltd. 1.32 1.23 1.00 0.87 1.30 1.17
6 Development Credit Bank Ltd. 2.34 1.77 1.67 0.90 0.87 0.76
7 Dhanalakshmi Bank Ltd. 0.57 0.65 0.71 0.28 0.71 0.40
8 The Federal Bank Ltd. 1.03 0.85 0.69 0.03 0.61 0.69
9 The Ganesh Bank of Kurundwad Ltd. 0.19 0.10 0.08 0.08 0.14 0.22
10 The Jammu & Kashmir Bank Ltd. 0.53 0.59 0.91 1.14 1.14 1.32
11 The Karnataka Bank Ltd. 1.11 1.41 1.51 0.87 0.71 0.68
12 The Karur Vysya Bank Ltd. 2.11 1.86 1.73 1.19 1.90 1.70
13 The Lakshmi Vilas Bank Ltd. 0.90 1.40 1.31 0.79 1.14 1.02
14 Lord Krishna Bank Ltd. 1.54 0.78 0.51 0.16 0.61 0.36
15 The Nainital Bank Ltd. 0.28 0.25 0.45 0.75 0.86 0.87
16 The Nedungadi Bank Ltd. 0.36 0.64 0.78 0.62 0.84 -3.57
17 The Ratnakar Bank Ltd. 0.58 0.73 0.91 0.78 0.70 0.67
18 The Sangli Bank Ltd. 0.36 0.50 0.35 0.34 0.34 0.38
19 SBI Commercial & International Bank Ltd. 3.23 1.17 2.22 1.64 1.70 -6.50
20 The South Indian Bank Ltd. 0.22 0.33 0.68 0.17 0.58 0.80
21 Tamilnad Mercantile Bank Ltd. 1.68 2.23 1.98 1.43 1.32 1.37
22 The United Western Bank Ltd. 0.75 0.94 1.13 0.95 1.16 0.05
23 The Vysya Bank Ltd. 2.01 1.10 1.14 0.40 0.50 0.38
Old Private Sector Banks 1.06 0.91 0.81 0.48 0.81 0.62
24 Bank of Punjab Ltd. 2.86 2.13 2.09 1.53 1.04 0.93
25 Centurion Bank Ltd. 2.71 1.25 1.27 0.69 0.66 0.12
26 Global Trust Bank 1.82 2.16 2.12 1.36 1.44 0.85
27 HDFC Bank 2.04 2.23 2.23 1.89 1.02 1.35
28 ICICI Bank 1.43 2.25 1.53 0.91 0.87 0.82
29 IDBI Bank 0.73 0.46 0.91 0.90 1.35 0.39
30 IndusInd Bank Ltd. 2.42 2.06 1.81 0.60 0.70 0.47
31 UTI Bank Ltd. 0.92 0.89 0.56 0.79 0.76 0.80
New Private Sector Banks 1.85 1.73 1.55 1.03 0.97 0.81
Private Sector Banks 1.21 1.13 1.04 0.68 0.88 0.71
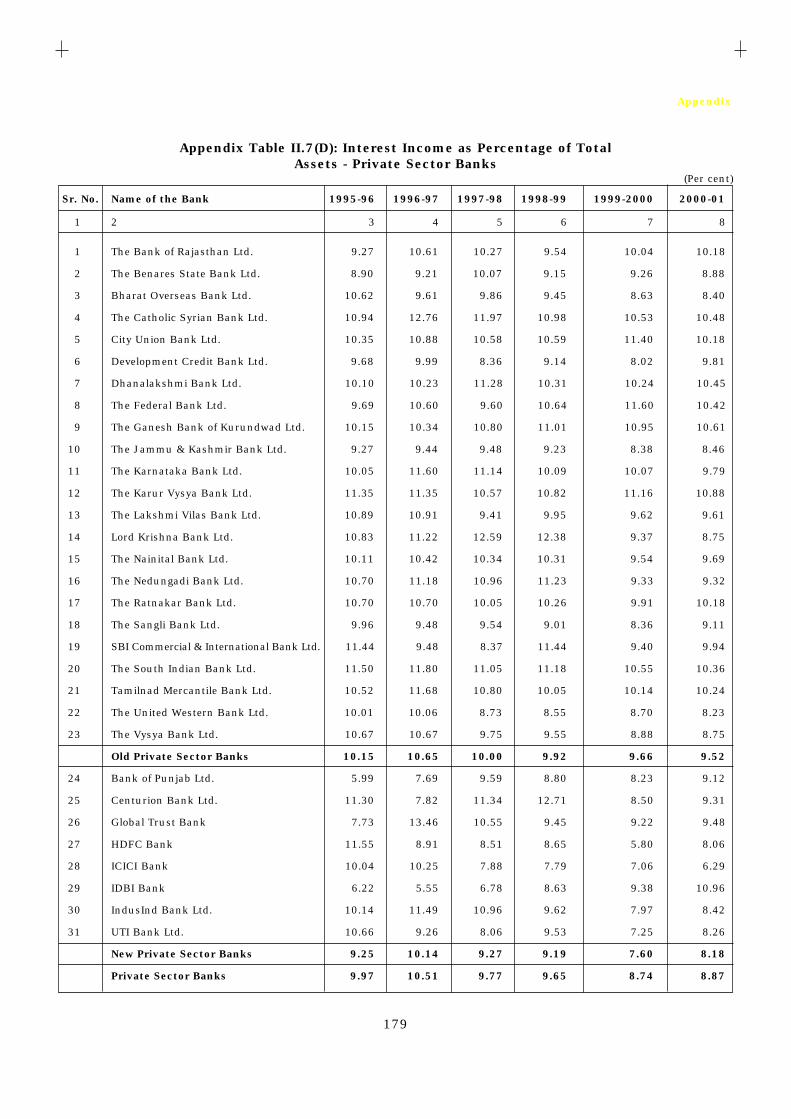
179
Appendix
Appendix Table II.7(D): Interest Income as Percentage of TotalAssets - Private Sector Banks
(Per cent)
Sr. No. Name of the Bank 1995-96 1996-97 1997-98 1998-99 1999-2000 2000-01
1 2 3 4 5 6 7 8
1 The Bank of Rajasthan Ltd. 9.27 10.61 10.27 9.54 10.04 10.18
2 The Benares State Bank Ltd. 8.90 9.21 10.07 9.15 9.26 8.88
3 Bharat Overseas Bank Ltd. 10.62 9.61 9.86 9.45 8.63 8.40
4 The Catholic Syrian Bank Ltd. 10.94 12.76 11.97 10.98 10.53 10.48
5 City Union Bank Ltd. 10.35 10.88 10.58 10.59 11.40 10.18
6 Development Credit Bank Ltd. 9.68 9.99 8.36 9.14 8.02 9.81
7 Dhanalakshmi Bank Ltd. 10.10 10.23 11.28 10.31 10.24 10.45
8 The Federal Bank Ltd. 9.69 10.60 9.60 10.64 11.60 10.42
9 The Ganesh Bank of Kurundwad Ltd. 10.15 10.34 10.80 11.01 10.95 10.61
10 The Jammu & Kashmir Bank Ltd. 9.27 9.44 9.48 9.23 8.38 8.46
11 The Karnataka Bank Ltd. 10.05 11.60 11.14 10.09 10.07 9.79
12 The Karur Vysya Bank Ltd. 11.35 11.35 10.57 10.82 11.16 10.88
13 The Lakshmi Vilas Bank Ltd. 10.89 10.91 9.41 9.95 9.62 9.61
14 Lord Krishna Bank Ltd. 10.83 11.22 12.59 12.38 9.37 8.75
15 The Nainital Bank Ltd. 10.11 10.42 10.34 10.31 9.54 9.69
16 The Nedungadi Bank Ltd. 10.70 11.18 10.96 11.23 9.33 9.32
17 The Ratnakar Bank Ltd. 10.70 10.70 10.05 10.26 9.91 10.18
18 The Sangli Bank Ltd. 9.96 9.48 9.54 9.01 8.36 9.11
19 SBI Commercial & International Bank Ltd. 11.44 9.48 8.37 11.44 9.40 9.94
20 The South Indian Bank Ltd. 11.50 11.80 11.05 11.18 10.55 10.36
21 Tamilnad Mercantile Bank Ltd. 10.52 11.68 10.80 10.05 10.14 10.24
22 The United Western Bank Ltd. 10.01 10.06 8.73 8.55 8.70 8.23
23 The Vysya Bank Ltd. 10.67 10.67 9.75 9.55 8.88 8.75
Old Private Sector Banks 10.15 10.65 10.00 9.92 9.66 9.52
24 Bank of Punjab Ltd. 5.99 7.69 9.59 8.80 8.23 9.12
25 Centurion Bank Ltd. 11.30 7.82 11.34 12.71 8.50 9.31
26 Global Trust Bank 7.73 13.46 10.55 9.45 9.22 9.48
27 HDFC Bank 11.55 8.91 8.51 8.65 5.80 8.06
28 ICICI Bank 10.04 10.25 7.88 7.79 7.06 6.29
29 IDBI Bank 6.22 5.55 6.78 8.63 9.38 10.96
30 IndusInd Bank Ltd. 10.14 11.49 10.96 9.62 7.97 8.42
31 UTI Bank Ltd. 10.66 9.26 8.06 9.53 7.25 8.26
New Private Sector Banks 9.25 10.14 9.27 9.19 7.60 8.18
Private Sector Banks 9.97 10.51 9.77 9.65 8.74 8.87
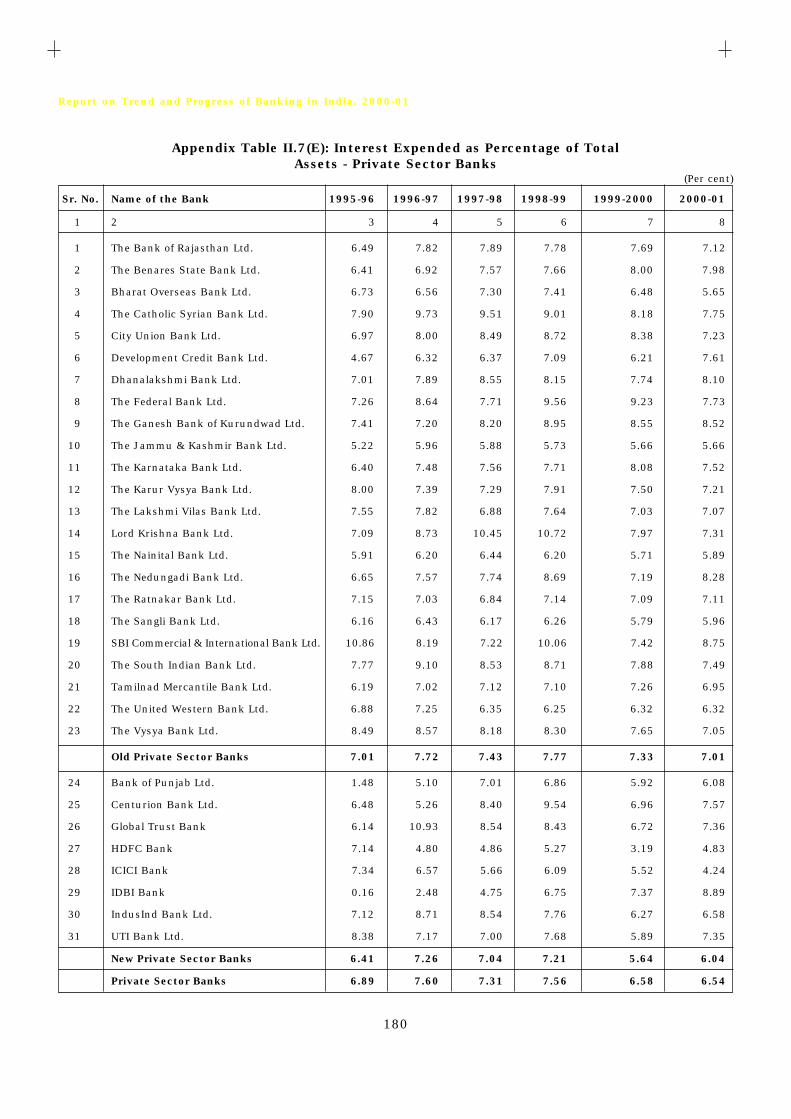
180
Report on Trend and Progress of Banking in India, 2000-01
Appendix Table II.7(E): Interest Expended as Percentage of TotalAssets - Private Sector Banks
(Per cent)
Sr. No. Name of the Bank 1995-96 1996-97 1997-98 1998-99 1999-2000 2000-01
1 2 3 4 5 6 7 8
1 The Bank of Rajasthan Ltd. 6.49 7.82 7.89 7.78 7.69 7.12
2 The Benares State Bank Ltd. 6.41 6.92 7.57 7.66 8.00 7.98
3 Bharat Overseas Bank Ltd. 6.73 6.56 7.30 7.41 6.48 5.65
4 The Catholic Syrian Bank Ltd. 7.90 9.73 9.51 9.01 8.18 7.75
5 City Union Bank Ltd. 6.97 8.00 8.49 8.72 8.38 7.23
6 Development Credit Bank Ltd. 4.67 6.32 6.37 7.09 6.21 7.61
7 Dhanalakshmi Bank Ltd. 7.01 7.89 8.55 8.15 7.74 8.10
8 The Federal Bank Ltd. 7.26 8.64 7.71 9.56 9.23 7.73
9 The Ganesh Bank of Kurundwad Ltd. 7.41 7.20 8.20 8.95 8.55 8.52
10 The Jammu & Kashmir Bank Ltd. 5.22 5.96 5.88 5.73 5.66 5.66
11 The Karnataka Bank Ltd. 6.40 7.48 7.56 7.71 8.08 7.52
12 The Karur Vysya Bank Ltd. 8.00 7.39 7.29 7.91 7.50 7.21
13 The Lakshmi Vilas Bank Ltd. 7.55 7.82 6.88 7.64 7.03 7.07
14 Lord Krishna Bank Ltd. 7.09 8.73 10.45 10.72 7.97 7.31
15 The Nainital Bank Ltd. 5.91 6.20 6.44 6.20 5.71 5.89
16 The Nedungadi Bank Ltd. 6.65 7.57 7.74 8.69 7.19 8.28
17 The Ratnakar Bank Ltd. 7.15 7.03 6.84 7.14 7.09 7.11
18 The Sangli Bank Ltd. 6.16 6.43 6.17 6.26 5.79 5.96
19 SBI Commercial & International Bank Ltd. 10.86 8.19 7.22 10.06 7.42 8.75
20 The South Indian Bank Ltd. 7.77 9.10 8.53 8.71 7.88 7.49
21 Tamilnad Mercantile Bank Ltd. 6.19 7.02 7.12 7.10 7.26 6.95
22 The United Western Bank Ltd. 6.88 7.25 6.35 6.25 6.32 6.32
23 The Vysya Bank Ltd. 8.49 8.57 8.18 8.30 7.65 7.05
Old Private Sector Banks 7.01 7.72 7.43 7.77 7.33 7.01
24 Bank of Punjab Ltd. 1.48 5.10 7.01 6.86 5.92 6.08
25 Centurion Bank Ltd. 6.48 5.26 8.40 9.54 6.96 7.57
26 Global Trust Bank 6.14 10.93 8.54 8.43 6.72 7.36
27 HDFC Bank 7.14 4.80 4.86 5.27 3.19 4.83
28 ICICI Bank 7.34 6.57 5.66 6.09 5.52 4.24
29 IDBI Bank 0.16 2.48 4.75 6.75 7.37 8.89
30 IndusInd Bank Ltd. 7.12 8.71 8.54 7.76 6.27 6.58
31 UTI Bank Ltd. 8.38 7.17 7.00 7.68 5.89 7.35
New Private Sector Banks 6.41 7.26 7.04 7.21 5.64 6.04
Private Sector Banks 6.89 7.60 7.31 7.56 6.58 6.54

181
Appendix
Appendix Table II.7(F): Net Interest Income (Spread) as Percentage of TotalAssets - Private Sector Banks
(Per cent)
Sr. No. Name of the Bank 1995-96 1996-97 1997-98 1998-99 1999-2000 2000-01
1 2 3 4 5 6 7 8
1 The Bank of Rajasthan Ltd. 2.78 2.80 2.38 1.76 2.35 3.06
2 The Benares State Bank Ltd. 2.48 2.29 2.50 1.49 1.26 0.90
3 Bharat Overseas Bank Ltd. 3.90 3.06 2.56 2.05 2.15 2.75
4 The Catholic Syrian Bank Ltd. 3.04 3.03 2.47 1.97 2.34 2.72
5 City Union Bank Ltd. 3.38 2.88 2.09 1.87 3.03 2.95
6 Development Credit Bank Ltd. 5.00 3.67 1.99 2.05 1.81 2.19
7 Dhanalakshmi Bank Ltd. 3.09 2.33 2.72 2.16 2.49 2.34
8 The Federal Bank Ltd. 2.43 1.95 1.89 1.09 2.37 2.69
9 The Ganesh Bank of Kurundwad Ltd. 2.74 3.14 2.60 2.06 2.40 2.09
10 The Jammu & Kashmir Bank Ltd. 4.05 3.48 3.60 3.49 2.71 2.81
11 The Karnataka Bank Ltd. 3.65 4.11 3.58 2.38 1.99 2.28
12 The Karur Vysya Bank Ltd. 3.35 3.96 3.28 2.91 3.66 3.67
13 The Lakshmi Vilas Bank Ltd. 3.34 3.09 2.53 2.31 2.59 2.55
14 Lord Krishna Bank Ltd. 3.75 2.49 2.14 1.66 1.41 1.44
15 The Nainital Bank Ltd. 4.19 4.21 3.90 4.11 3.83 3.80
16 The Nedungadi Bank Ltd. 4.05 3.62 3.23 2.54 2.14 1.04
17 The Ratnakar Bank Ltd. 3.55 3.67 3.21 3.12 2.82 3.07
18 The Sangli Bank Ltd. 3.80 3.05 3.37 2.75 2.57 3.14
19 SBI Commercial & International Bank Ltd. 0.58 1.29 1.15 1.38 1.98 1.19
20 The South Indian Bank Ltd. 3.73 2.70 2.52 2.46 2.66 2.87
21 Tamilnad Mercantile Bank Ltd. 4.33 4.65 3.68 2.96 2.88 3.29
22 The United Western Bank Ltd. 3.13 2.81 2.38 2.30 2.38 1.91
23 The Vysya Bank Ltd. 2.18 2.10 1.57 1.25 1.24 1.71
Old Private Sector Banks 3.14 2.93 2.57 2.15 2.33 2.51
24 Bank of Punjab Ltd. 4.51 2.59 2.58 1.95 2.31 3.04
25 Centurion Bank Ltd. 4.82 2.55 2.93 3.17 1.54 1.74
26 Global Trust Bank 1.58 2.53 2.02 1.02 2.50 2.11
27 HDFC Bank 4.41 4.11 3.65 3.38 2.60 3.24
28 ICICI Bank 2.70 3.68 2.23 1.70 1.54 2.05
29 IDBI Bank 6.05 3.07 2.03 1.87 2.02 2.07
30 IndusInd Bank Ltd. 3.02 2.79 2.43 1.86 1.70 1.84
31 UTI Bank Ltd. 2.28 2.09 1.05 1.86 1.36 0.91
New Private Sector Banks 2.84 2.88 2.23 1.98 1.95 2.14
Private Sector Banks 3.08 2.92 2.46 2.09 2.16 2.33

182
Report on Trend and Progress of Banking in India, 2000-01
Appendix Table II.7(G): Provisions and Contingencies as Percentage of TotalAssets - Private Sector Banks
(Per cent)
Sr. No. Name of the Bank 1995-96 1996-97 1997-98 1998-99 1999-2000 2000-01
1 2 3 4 5 6 7 8
1 The Bank of Rajasthan Ltd. 0.35 1.31 3.42 1.53 0.16 0.59
2 The Benares State Bank Ltd. 3.54 0.77 0.94 1.37 0.59 0.48
3 Bharat Overseas Bank Ltd. 1.27 0.73 0.69 0.37 1.20 1.01
4 The Catholic Syrian Bank Ltd. 1.26 0.59 0.61 0.20 0.70 1.25
5 City Union Bank Ltd. 1.67 1.39 0.86 0.89 1.88 1.55
6 Development Credit Bank Ltd. 0.75 0.71 1.15 0.37 1.02 0.86
7 Dhanalakshmi Bank Ltd. 0.90 0.70 0.89 0.68 1.18 0.61
8 The Federal Bank Ltd. 0.56 0.35 0.58 0.58 1.17 1.43
9 The Ganesh Bank of Kurundwad Ltd. 1.16 1.24 0.72 0.46 0.67 0.20
10 The Jammu & Kashmir Bank Ltd. 2.28 1.60 1.98 1.15 1.06 0.83
11 The Karnataka Bank Ltd. 1.27 1.50 1.14 0.61 0.70 1.36
12 The Karur Vysya Bank Ltd. 0.72 1.14 1.57 0.79 1.01 0.91
13 The Lakshmi Vilas Bank Ltd. 1.25 0.30 0.38 0.50 1.26 1.28
14 Lord Krishna Bank Ltd. 1.15 1.46 1.08 0.90 0.79 0.72
15 The Nainital Bank Ltd. 0.64 1.26 1.05 1.15 0.83 0.81
16 The Nedungadi Bank Ltd. 0.73 1.02 1.17 0.37 0.67 3.60
17 The Ratnakar Bank Ltd. 0.39 0.31 0.49 0.33 0.76 1.07
18 The Sangli Bank Ltd. 0.73 0.60 2.11 0.66 0.81 0.70
19 SBI Commercial & International Bank Ltd. -3.56 -0.09 0.04 0.69 1.48 7.81
20 The South Indian Bank Ltd. 1.60 0.60 0.30 0.81 1.23 1.26
21 Tamilnad Mercantile Bank Ltd. 2.27 1.96 1.34 0.99 1.04 1.41
22 The United Western Bank Ltd. 1.58 1.60 1.54 0.68 1.80 1.03
23 The Vysya Bank Ltd. 0.28 0.77 0.60 0.41 0.85 0.75
Old Private Sector Banks 1.04 0.98 1.16 0.73 1.01 1.13
24 Bank of Punjab Ltd. 0.03 0.32 0.69 0.44 0.65 0.80
25 Centurion Bank Ltd. 0.21 0.58 1.16 0.32 0.59 0.86
26 Global Trust Bank 0.96 1.75 1.37 0.65 1.85 1.27
27 HDFC Bank 0.93 1.29 1.39 1.01 1.19 1.10
28 ICICI Bank 1.05 1.55 1.53 0.88 1.01 0.65
29 IDBI Bank 0.00 0.63 0.39 0.23 0.50 1.00
30 IndusInd Bank Ltd. 1.08 1.45 2.19 1.19 1.69 1.53
31 UTI Bank Ltd. 1.42 1.06 1.16 0.95 0.98 0.43
New Private Sector Banks 0.92 1.24 1.32 0.75 1.14 0.93
Private Sector Banks 1.02 1.05 1.21 0.74 1.07 1.03

183
Appendix
Appendix Table II.7(H): Operating Expenses as Percentage of TotalAssets - Private Sector Banks
(Per cent)
Sr. No. Name of the Bank 1995-96 1996-97 1997-98 1998-99 1999-2000 2000-01
1 2 3 4 5 6 7 8
1 The Bank of Rajasthan Ltd. 2.23 2.64 2.87 3.25 3.23 3.04
2 The Benares State Bank Ltd. 3.77 3.32 3.26 3.48 2.87 3.13
3 Bharat Overseas Bank Ltd. 2.91 2.33 2.09 2.14 2.12 2.17
4 The Catholic Syrian Bank Ltd. 3.14 3.37 3.03 2.80 2.96 2.71
5 City Union Bank Ltd. 2.33 2.27 2.07 2.06 1.99 1.82
6 Development Credit Bank Ltd. 2.60 3.13 2.42 2.36 1.82 1.81
7 Dhanalakshmi Bank Ltd. 2.47 2.00 2.36 2.17 2.15 2.87
8 The Federal Bank Ltd. 2.41 2.06 1.88 1.88 2.33 1.98
9 The Ganesh Bank of Kurundwad Ltd. 2.65 2.63 2.69 2.41 2.19 2.14
10 The Jammu & Kashmir Bank Ltd. 1.98 1.99 1.75 1.78 1.51 1.30
11 The Karnataka Bank Ltd. 2.42 2.48 2.18 1.89 1.84 1.58
12 The Karur Vysya Bank Ltd. 2.86 2.66 2.59 2.24 2.29 2.33
13 The Lakshmi Vilas Bank Ltd. 3.53 3.45 2.95 3.08 2.78 2.50
14 Lord Krishna Bank Ltd. 2.09 1.77 2.22 2.33 1.82 1.85
15 The Nainital Bank Ltd. 3.80 3.19 2.86 2.69 2.67 2.54
16 The Nedungadi Bank Ltd. 4.54 3.56 3.06 2.85 2.68 2.53
17 The Ratnakar Bank Ltd. 3.27 3.41 2.90 2.90 3.23 2.84
18 The Sangli Bank Ltd. 3.86 3.32 3.08 3.03 2.80 2.92
19 SBI Commercial & International Bank Ltd. 1.35 1.29 0.95 1.25 1.14 1.42
20 The South Indian Bank Ltd. 3.05 2.71 2.39 2.51 2.53 2.21
21 Tamilnad Mercantile Bank Ltd. 2.62 2.86 2.38 2.25 2.14 1.90
22 The United Western Bank Ltd. 2.88 2.75 2.24 2.02 1.94 1.63
23 The Vysya Bank Ltd. 1.92 1.92 1.93 1.90 1.98 1.80
Old Private Sector Banks 2.60 2.52 2.31 2.26 2.17 1.98
24 Bank of Punjab Ltd. 2.67 2.30 2.47 1.99 2.07 2.45
25 Centurion Bank Ltd. 2.90 1.70 2.12 3.60 2.00 2.42
26 Global Trust Bank 1.25 2.01 1.88 1.82 1.64 1.73
27 HDFC Bank 2.79 2.32 2.22 2.04 1.46 1.98
28 ICICI Bank 2.37 2.27 1.76 1.19 1.27 1.69
29 IDBI Bank 7.38 2.74 1.52 1.59 1.39 2.09
30 IndusInd Bank Ltd. 1.46 1.58 1.51 1.41 1.13 1.19
31 UTI Bank Ltd. 1.52 1.55 1.25 1.30 0.98 1.20
New Private Sector Banks 1.89 1.94 1.76 1.74 1.42 1.75
Private Sector Banks 2.46 2.36 2.14 2.07 1.83 1.87
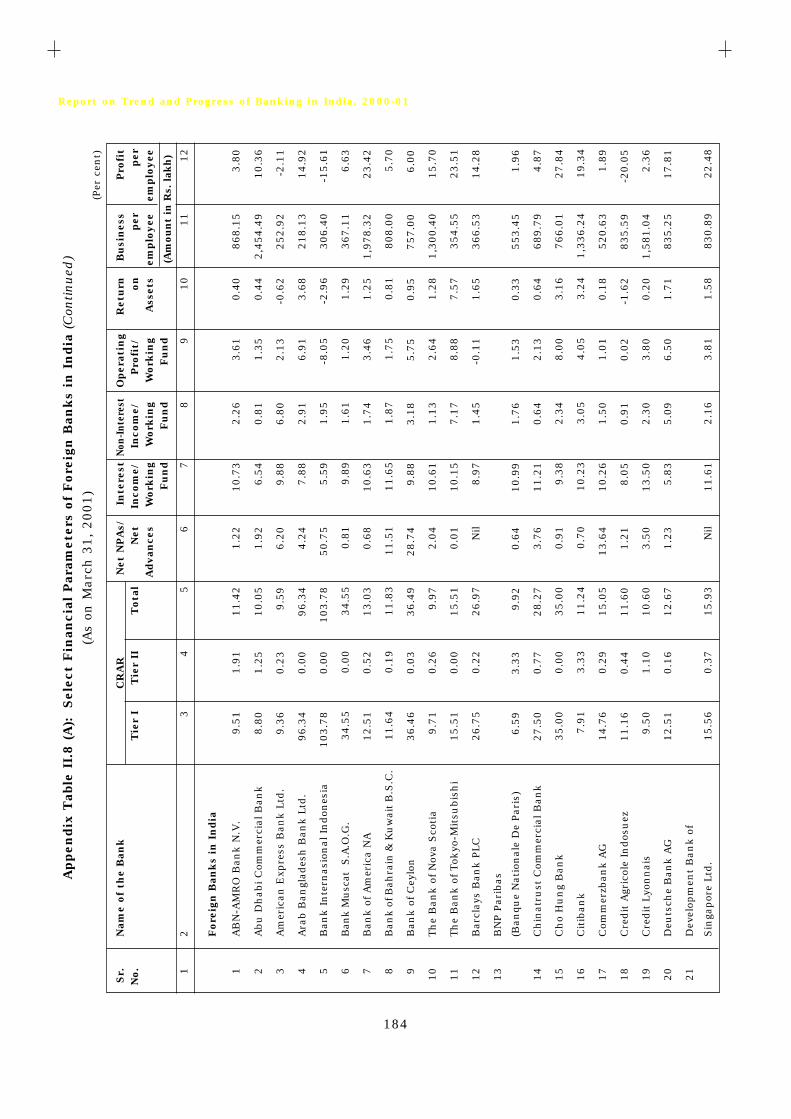
184
Report on Trend and Progress of Banking in India, 2000-01
Appen
dix
Tab
le I
I.8 (A
):
Sel
ect
Fin
anci
al P
aram
eter
s of
Fore
ign B
anks
in I
ndia
(C
onti
nu
ed)
(As
on M
arc
h 3
1,
2001)
Sr.
Nam
e of
the
Ban
kC
RA
RN
et N
PA
s/In
tere
stN
on-I
nter
est
Oper
atin
gR
eturn
Busi
nes
sPro
fit
No.
Tie
r I
Tie
r II
Tota
lN
etIn
com
e/In
com
e/Pro
fit/
on
per
per
Advan
ces
Work
ing
Work
ing
Work
ing
Ass
ets
emplo
yee
emplo
yee
Fund
Fund
Fund
12
34
56
78
910
11
12
Fore
ign
Ban
ks
in I
ndia
1A
BN
-AM
RO
Ban
k N
.V.
9.5
11.9
111.4
21.2
210.7
32.2
63.6
10.4
0868.1
53.8
0
2A
bu
Dh
abi C
omm
erci
al B
ank
8.8
01.2
510.0
51.9
26.5
40.8
11.3
50.4
42,4
54.4
910.3
6
3A
mer
ican
Exp
ress
Ban
k L
td.
9.3
60.2
39.5
96.2
09.8
86.8
02.1
3-0
.62
252.9
2-2
.11
4A
rab B
angl
ades
h B
ank L
td.
96.3
40.0
096.3
44.2
47.8
82.9
16.9
13.6
8218.1
314.9
2
5B
ank I
nte
rnas
ion
al I
ndon
esia
103.7
80.0
0103.7
850.7
55.5
91.9
5-8
.05
-2.9
6306.4
0-1
5.6
1
6B
ank M
usc
at S.A
.O.G
.34.5
50.0
034.5
50.8
19.8
91.6
11.2
01.2
9367.1
16.6
3
7B
ank o
f A
mer
ica
NA
12.5
10.5
213.0
30.6
810.6
31.7
43.4
61.2
51,9
78.3
223.4
2
8B
ank o
f Bah
rain
& K
uw
ait
B.S
.C.
11.6
40.1
911.8
311.5
111.6
51.8
71.7
50.8
1808.0
05.7
0
9B
ank o
f C
eylo
n36.4
60.0
336.4
928.7
49.8
83.1
85.7
50.9
5757.0
06.0
0
10
Th
e B
ank o
f N
ova
Sco
tia
9.7
10.2
69.9
72.0
410.6
11.1
32.6
41.2
81,3
00.4
015.7
0
11
Th
e B
ank o
f Tok
yo-M
itsu
bis
hi
15.5
10.0
015.5
10.0
110.1
57.1
78.8
87.5
7354.5
523.5
1
12
Bar
clay
s B
ank P
LC
26.7
50.2
226.9
7N
il8.9
71.4
5-0
.11
1.6
5366.5
314.2
8
13
BN
P P
arib
as
(Ban
que
Nat
ion
ale
De
Par
is)
6.5
93.3
39.9
20.6
410.9
91.7
61.5
30.3
3553.4
51.9
6
14
Ch
inat
rust
Com
mer
cial
Ban
k27.5
00.7
728.2
73.7
611.2
10.6
42.1
30.6
4689.7
94.8
7
15
Ch
o H
un
g B
ank
35.0
00.0
035.0
00.9
19.3
82.3
48.0
03.1
6766.0
127.8
4
16
Cit
iban
k7.9
13.3
311.2
40.7
010.2
33.0
54.0
53.2
41,3
36.2
419.3
4
17
Com
mer
zban
k A
G14.7
60.2
915.0
513.6
410.2
61.5
01.0
10.1
8520.6
31.8
9
18
Cre
dit
Agr
icol
e In
dos
uez
11.1
60.4
411.6
01.2
18.0
50.9
10.0
2-1
.62
835.5
9-2
0.0
5
19
Cre
dit
Lyo
nn
ais
9.5
01.1
010.6
03.5
013.5
02.3
03.8
00.2
01,5
81.0
42.3
6
20
Deu
tsch
e B
ank A
G12.5
10.1
612.6
71.2
35.8
35.0
96.5
01.7
1835.2
517.8
1
21
Dev
elop
men
t B
an
k o
f
Sin
gapor
e Ltd
.15.5
60.3
715.9
3N
il11.6
12.1
63.8
11.5
8830.8
922.4
8
(Am
ount
in R
s. lak
h)
(Per
cen
t)

185
Appen
dix
Appendix Table II.8(A): Select Financial Parameters of Foreign Banks in India (Concluded)
(As on March 31, 2001)
Sr. Name of the Bank CRAR Net NPAs/ Interest Non-Interest Operating Return Business ProfitNo.
Tier I Tier II TotalNet Income/ Income/ Profit/ on per per
Advances Working Working Working Assets employee employeeFund Fund Fund
1 2 3 4 5 6 7 8 9 10 11 12
22 Dresdner Bank AG 10.66 N.A. 10.66 29.45 8.72 -0.10 -2.42 -24.38 2,968.29 -413.99
23 HSBC Ltd. 8.63 3.74 12.37 0.99 9.27 2.78 3.18 1.29 528.67 6.62
24 ING Bank N.V. 15.00 0.00 15.00 5.94 6.31 3.37 -3.17 -3.96 409.54 -23.56
25 K.B.C.Bank N.V. 22.86 0.15 23.01 0.24 11.64 -0.09 0.68 0.30 910.59 4.29
26 Krung Thai Bank Public Co.Ltd. 148.75 0.24 148.99 0.00 9.57 1.08 5.00 2.21 174.86 9.88
27 Mashreq Bank psc 10.42 0.12 10.54 13.39 9.49 1.54 0.47 -3.10 574.51 -38.24
28 Morgan Guaranty Trust Co. of
New York 79.00 0.00 79.00 0.00 5.78 2.74 0.21 0.25 217.39 4.24
29 Oman International Bank S.A.O.G 12.82 1.39 14.21 37.11 7.71 2.10 0.00 0.00 938.40 0.00
30 Oversea-Chinese Banking
Corporation Ltd. 167.82 0.29 168.11 18.44 10.00 1.58 4.21 0.74 211.05 4.44
31 The Sanwa Bank Ltd. 34.91 0.00 34.91 9.61 8.38 1.39 1.95 0.27 825.68 2.23
32 The Siam Commercial Bank 33.05 0.18 33.23 39.18 8.43 1.30 -0.41 -2.28 941.20 -25.89
33 Societe Generale 13.28 0.65 13.93 7.27 8.02 2.30 0.65 0.04 475.50 0.30
34 Sonali Bank 88.14 0.00 88.14 4.21 5.30 12.41 8.54 5.87 66.83 5.77
35 Standard Chartered Bank 6.70 2.90 9.60 1.53 11.83 3.16 4.07 3.14 617.78 11.21
36 Standard Chartered Grindlays
Bank 6.90 5.62 12.52 0.41 10.11 1.63 2.58 2.67 442.72 2.85
37 State Bank of Mauritius Ltd. 30.55 0.23 30.78 18.93 9.77 1.70 4.12 1.05 1,292.10 14.10
38 The Sumitomo Bank Ltd. 19.24 0.16 19.40 16.76 10.20 0.87 0.72 Negative 1,189.13 -14.65
39 The Chase Manhattan Bank 43.77 0.02 43.79 0.00 10.87 16.93 13.56 6.66 93.91 30.06
40 The Fuji Bank Ltd. 18.21 0.17 18.38 3.24 10.51 1.19 1.60 -3.53 544.30 -25.01
41 The Sakura Bank Ltd. 16.07 0.14 16.21 1.03 11.28 0.84 3.26 -2.11 608.14 -14.83
42 The Toronto-Dominion Bank Ltd. 56.60 1.27 57.87 0.00 12.14 1.58 7.12 4.84 645.63 37.57
Notes : 1. Figures reported in this table may not exactly tally with the data reported in Appendix Tables II.9(B) to II.9(H) due to conceptual differences.
2. N.A. Not Applicable.
Source : Respective Balance Sheets.
(Amount in Rs. lakh)
(Per cent)

186
Report on Trend and Progress of Banking in India, 2000-01
Appendix Table II.8(B): Gross Profit/Loss as Percentage of TotalAssets – Foreign Banks in India
Sr. No. Name of the Bank 1995-96 1996-97 1997-98 1998-99 1999-2000 2000-01
1 2 3 4 5 6 7 8
1 ABN-AMRO Bank N.V. 3.30 4.51 4.13 3.68 3.05 3.502 Abu Dhabi Commercial Bank 4.03 0.68 2.57 2.43 2.50 1.353 American Express Bank Ltd. 3.11 5.07 3.49 1.79 2.74 1.814 Arab Bangladesh Bank Ltd. 2.82 0.62 3.35 6.15 6.08 7.095 Bank Internasional Indonesia -7.46 2.18 0.91 -6.39 -9.75 -6.896 Bank Muscat S.A.O.G. — — — -1.44 0.63 1.267 Bank of America N A 3.46 4.50 4.41 3.95 5.02 3.368 Bank of Bahrain and Kuwait B.S.C. 4.45 1.46 0.16 0.67 1.74 1.489 Bank of Ceylon 3.74 8.59 6.35 7.51 6.34 4.91
10 The Bank of Nova Scotia 2.58 4.88 3.65 4.44 3.11 2.1911 The Bank of Tokyo-Mitsubishi, Ltd. 6.11 6.22 2.64 -27.32 -2.92 9.2112 Barclays Bank PLC 5.39 1.71 3.87 2.00 -0.55 -0.0913 BNP Paribas
(Banque Nationale De Paris) 3.94 4.80 2.75 2.24 2.27 1.3614 Chinatrust Commercial Bank — 0.55 1.36 0.35 1.11 2.0315 Cho Hung Bank — 2.85 9.24 6.65 7.23 8.3816 Citibank 4.35 4.59 4.45 4.00 3.41 3.5617 Commerzbank -4.58 0.37 2.44 1.65 0.69 0.8118 Credit Agricole Indosuez 1.93 2.70 0.16 0.64 -0.14 0.0119 Credit Lyonnais 2.61 3.73 4.08 4.63 4.10 3.4920 Deutsche Bank AG 4.99 6.42 8.17 4.48 5.19 5.7221 Development Bank of
Singapore Ltd. 1.42 4.68 2.92 2.85 3.01 2.9322 Dresdner Bank AG -4.64 -0.55 2.34 2.02 1.74 -4.8423 HSBC Ltd. 4.25 3.27 3.40 1.96 2.41 2.9024 ING Bank Ltd. N.V. -1.06 4.08 3.11 1.17 6.44 -2.4425 K.B.C. Bank N.V. — — — -0.93 1.28 0.7926 Krung Thai Bank Public Co. Ltd. — 0.05 8.78 6.22 3.57 4.9427 Mashreq Bank psc 2.19 2.66 0.24 0.05 0.41 0.4128 Morgan Guaranty Trust Co. of
New York — — — -3.88 2.27 0.3429 Oman International Bank S.A.O.G. 4.47 4.25 1.82 0.04 -0.20 -0.0930 Oversea - Chinese Banking
Corporation Ltd. — -6.16 1.03 5.05 4.24 4.2231 The Sanwa Bank Ltd. 0.69 3.57 5.56 5.24 3.02 1.9532 The Siam Commercial Bank 0.60 4.33 6.30 5.13 5.09 -0.4333 Societe Generale 1.44 3.38 2.49 2.63 0.73 0.6034 Sonali Bank 12.45 7.37 10.48 12.89 4.11 5.8735 Standard Chartered Bank 2.53 1.68 2.63 1.09 3.45 3.1436 Standard Chartered
Grindlays Bank Ltd. 2.25 2.16 4.49 2.86 4.02 2.6737 State Bank of Mauritius Ltd. 8.44 6.79 7.10 3.21 3.79 3.8038 The Sumitomo Bank Ltd. — — 1.85 3.15 2.74 0.7039 The Chase Manhattan Bank -8.06 0.79 5.35 4.14 5.83 10.3240 The Fuji Bank Ltd. — -5.28 2.77 1.42 -0.25 1.6241 The Sakura Bank Ltd. 5.19 5.87 3.84 2.35 2.93 3.2642 The Toronto-Dominion Bank — — 7.08 7.69 6.15 9.95
Foreign Banks in India 3.35 3.62 3.91 2.32 3.24 3.05
All Scheduled Commercial Banks 1.69 1.82 1.84 1.45 1.66 1.52
(Per cent)

187
Appendix
Appendix Table II.8(C): Net Profit/Loss as Percentage of TotalAssets - Foreign Banks in India
Sr. No. Name of the Bank 1995-96 1996-97 1997-98 1998-99 1999-2000 2000-01
1 2 3 4 5 6 7 8
1 ABN-AMRO Bank N.V. 1.43 2.08 2.33 2.20 1.58 0.402 Abu Dhabi Commercial Bank 1.05 0.31 0.42 0.32 0.52 0.443 American Express Bank Ltd. 1.17 1.60 2.11 0.25 1.02 -0.624 Arab Bangladesh Bank Ltd. 2.82 0.49 1.70 3.15 2.80 3.505 Bank Internasional Indonesia -7.46 1.17 -3.58 -14.41 -8.10 -2.956 Bank Muscat S.A.O.G. — — — -1.44 0.45 1.057 Bank of America N A 3.10 1.80 2.58 1.99 2.70 1.258 Bank of Bahrain and Kuwait B.S.C. 1.60 0.64 -3.66 0.71 0.90 0.809 Bank of Ceylon 1.72 3.18 2.55 2.33 2.62 0.95
10 The Bank of Nova Scotia 0.58 -0.68 0.84 2.20 1.46 1.0611 The Bank of Tokyo-Mitsubishi, Ltd. 2.21 1.38 -25.85 -4.29 4.87 7.5712 Barclays Bank PLC 2.02 0.18 1.71 0.33 -2.10 1.3513 BNP Paribas
(Banque Nationale De Paris) 1.39 1.83 0.98 1.06 0.94 0.3314 Chinatrust Commercial Bank — 0.14 0.00 -0.26 0.25 0.6315 Cho Hung Bank — 1.41 5.01 3.68 0.50 3.1516 Citibank 2.02 0.57 1.10 0.92 1.44 1.4717 Commerzbank -4.60 0.18 -0.20 0.27 0.46 0.1418 Credit Agricole Indosuez 1.20 -0.28 -1.70 -0.64 -9.83 -1.6219 Credit Lyonnais 1.04 1.76 -0.59 1.74 1.58 0.1920 Deutsche Bank AG 1.15 2.08 3.58 1.11 1.10 1.7121 Development Bank of
Singapore Ltd. 0.77 2.36 0.97 1.31 1.44 1.5822 Dresdner Bank AG -4.64 -0.59 1.02 -1.57 -11.37 -24.3823 HSBC Ltd. 1.74 1.53 0.98 0.58 0.96 1.2924 ING Bank N.V. -1.14 2.82 2.04 0.03 -4.00 -3.9725 K.B.C. Bank N.V. — — — -0.93 0.58 0.3026 Krung Thai Bank Public Co. Ltd. — 0.03 5.90 4.31 0.26 2.2227 Mashreq Bank psc 1.32 0.52 -2.84 -2.73 -3.60 -3.1028 Morgan Guaranty Trust Co of
New York — — — -3.88 1.98 0.2529 Oman International Bank S.A.O.G. 1.30 2.01 -0.89 -2.85 -8.98 -4.4130 Oversea - Chinese Banking
Corporation Ltd. — -6.16 0.87 4.39 –0.26 0.7931 The Sanwa Bank Ltd. 0.16 1.42 1.16 1.02 0.14 0.2532 The Siam Commercial Bank 0.23 2.13 3.86 2.74 2.25 -2.2833 Societe Generale 0.56 1.46 1.09 -3.17 0.02 0.0434 Sonali Bank 5.59 3.31 5.44 6.69 2.14 3.0535 Standard Chartered Bank 2.43 0.77 1.04 0.04 1.81 1.5036 Standard Chartered
Grindlays Bank 0.77 1.03 2.27 1.49 1.58 0.7237 State Bank of Mauritius Ltd. 5.21 3.56 4.47 1.81 1.48 1.0538 The Sumitomo Bank Ltd. — — 1.02 1.56 0.25 -1.6939 The Chase Manhattan Bank -8.10 0.48 2.73 1.87 2.87 5.0640 The Fuji Bank Ltd. — -5.34 2.38 0.16 -2.85 -3.3041 The Sakura Bank Ltd. 2.43 2.97 0.20 -3.77 -0.77 -2.0742 The Toronto-Dominion Bank — — 3.07 3.48 2.90 4.84
Foreign Banks in India 1.58 1.19 0.97 0.69 1.17 0.93
All Scheduled Commercial Banks 0.16 0.67 0.82 0.47 0.66 0.50
(Per cent)

188
Report on Trend and Progress of Banking in India, 2000-01
Appendix Table II.8(D): Interest Income as Percentage of TotalAssets - Foreign Banks in India
Sr. No. Name of the Bank 1995-96 1996-97 1997-98 1998-99 1999-2000 2000-01
1 2 3 4 5 6 7 8
1 ABN-AMRO Bank N.V. 9.50 11.05 9.65 9.24 8.05 10.162 Abu Dhabi Commercial Bank 12.68 10.24 9.74 8.59 10.98 6.543 American Express Bank Ltd. 12.10 13.75 10.13 10.55 11.11 8.394 Arab Bangladesh Bank Ltd. 4.57 4.27 5.03 6.81 7.23 7.775 Bank Internasional Indonesia 0.10 11.75 17.85 12.84 9.87 5.166 Bank Muscat S.A.O.G. — — — 3.72 5.90 10.407 Bank of America N A 10.66 10.94 10.57 12.63 11.76 10.318 Bank of Bahrain and Kuwait B.S.C. 12.01 11.09 11.09 10.29 10.15 9.839 Bank of Ceylon 4.60 7.66 8.49 11.21 8.60 8.44
10 The Bank of Nova Scotia 13.13 11.92 9.68 11.40 8.07 8.7911 The Bank of Tokyo-Mitsubishi, Ltd. 12.17 13.79 12.32 10.23 13.02 10.5312 Barclays Bank PLC 20.13 12.56 16.23 12.15 11.20 7.3113 BNP Paribas
(Banque Nationale De Paris) 11.34 10.40 8.13 8.81 9.60 9.7514 Chinatrust Commercial Bank — 6.31 11.25 7.60 12.44 10.7015 Cho Hung Bank — 6.63 13.87 8.81 8.80 9.8616 Citibank 10.17 11.60 11.00 12.52 10.53 8.9917 Commerzbank 1.87 8.26 10.73 9.28 11.39 8.2118 Credit Agricole Indosuez 7.22 11.87 10.46 12.00 11.46 7.0219 Credit Lyonnais 13.26 13.90 12.43 13.82 13.22 12.3220 Deutsche Bank AG 11.31 10.60 12.36 9.72 10.13 9.7721 Development Bank of
Singapore Ltd. 7.11 13.55 8.89 11.69 8.34 8.9222 Dresdner Bank AG 4.27 14.81 10.24 12.66 11.10 17.4423 HSBC Ltd. 10.20 10.31 8.50 8.30 7.84 8.4724 ING Bank N.V. 3.97 8.32 8.54 10.48 16.88 4.8425 K.B.C. Bank N.V. — — — 0.99 7.50 13.3826 Krung Thai Bank Public Co. Ltd. — 1.53 12.75 7.92 9.20 9.4627 Mashreq Bank psc 9.14 14.80 13.13 10.78 9.90 8.3628 Morgan Guaranty Trust Co of
New York — — — 1.40 6.19 6.8029 Oman International Bank S.A.O.G. 12.30 12.53 11.69 8.53 8.39 6.3630 Oversea - Chinese Banking
Corporation Ltd. — 1.33 6.72 9.09 9.56 10.0031 The Sanwa Bank Ltd. 11.67 12.41 12.10 11.35 9.05 8.3832 The Siam Commercial Bank 3.73 7.00 14.41 12.46 11.37 8.7233 Societe Generale 11.54 15.10 11.97 14.51 9.94 7.3834 Sonali Bank 8.86 1.86 3.23 5.66 1.84 3.7135 Standard Chartered Bank 11.34 9.78 10.84 10.74 10.51 9.1336 Standard Chartered
Grindlays Bank 9.42 10.22 10.39 10.00 10.80 10.4837 State Bank of Mauritius Ltd. 10.97 8.69 8.37 7.50 8.08 9.0338 The Sumitomo Bank Ltd. — — 3.99 10.19 12.42 9.9839 The Chase Manhattan Bank 6.20 4.53 4.62 8.56 5.17 8.2740 The Fuji Bank Ltd. — 3.70 6.92 10.75 7.75 10.6441 The Sakura Bank Ltd. 9.96 12.20 12.23 13.59 12.65 11.2842 The Toronto-Dominion Bank — — 5.42 11.51 8.72 16.96
Foreign Banks in India 10.46 11.08 10.42 10.27 9.93 9.30
All Scheduled Commercial Banks 9.36 9.88 9.27 9.18 8.97 8.88
(Per cent)

189
Appendix
Appendix Table II.8(E): Interest Expended as Percentage of TotalAssets - Foreign Banks in India
Sr. No. Name of the Bank 1995-96 1996-97 1997-98 1998-99 1999-2000 2000-01
1 2 3 4 5 6 7 8
1 ABN-AMRO Bank N.V. 7.18 6.67 6.42 5.94 4.83 6.232 Abu Dhabi Commercial Bank 10.12 9.17 7.51 6.67 8.88 5.563 American Express Bank Ltd. 8.34 9.48 6.84 7.78 7.20 5.774 Arab Bangladesh Bank Ltd. 0.00 1.35 1.41 1.32 1.41 1.165 Bank Internasional Indonesia 0.00 6.48 12.42 10.09 7.10 2.356 Bank Muscat S.A.O.G. — — — 0.94 3.76 7.347 Bank of America N A 6.95 6.52 6.58 8.22 7.11 7.038 Bank of Bahrain and Kuwait B.S.C. 6.25 9.41 10.17 9.18 8.60 8.219 Bank of Ceylon 0.76 1.83 3.79 4.67 3.61 4.57
10 The Bank of Nova Scotia 11.97 7.61 6.83 8.16 5.48 6.5711 The Bank of Tokyo-Mitsubishi, Ltd. 7.18 7.28 8.28 6.59 6.68 4.3012 Barclays Bank PLC 15.97 10.33 13.45 8.57 8.83 5.7713 BNP Paribas
(Banque Nationale De Paris) 6.70 4.93 4.89 5.67 6.90 7.1414 Chinatrust Commercial Bank — 0.60 3.74 4.33 8.50 6.4815 Cho Hung Bank — 0.34 2.53 1.62 0.92 1.6516 Citibank 6.26 6.85 6.60 7.08 5.97 5.0317 Commerzbank 0.24 3.98 6.41 6.17 8.37 6.4018 Credit Agricole Indosuez 6.06 10.50 11.09 9.17 8.99 5.5619 Credit Lyonnais 11.50 13.15 8.54 10.20 9.70 9.2220 Deutsche Bank AG 6.55 4.76 5.66 4.79 5.12 4.6321 Development Bank of
Singapore Ltd. 4.54 7.31 6.94 8.68 5.02 6.0622 Dresdner Bank AG 3.28 12.20 7.58 8.51 5.51 11.1623 HSBC Ltd. 5.79 6.65 5.12 5.61 5.09 5.4424 ING Bank N.V. 4.30 4.43 6.74 6.91 10.66 3.3425 K.B.C. Bank — — — 0.00 4.53 10.1826 Krung Thai Bank Public Co. Ltd. — 0.00 5.54 0.44 1.41 1.1827 Mashreq Bank psc 5.17 8.41 7.95 8.43 7.67 7.2628 Morgan Guaranty Trust Co of
New York — — — 0.80 4.18 4.9329 Oman International Bank S.A.O.G. 7.76 8.06 10.34 9.09 8.85 6.8730 Oversea – Chinese Banking
Corporation Ltd. — 0.03 0.67 1.86 2.38 1.4031 The Sanwa Bank Ltd. 7.91 5.38 5.73 5.72 4.81 4.4932 The Siam Commercial Bank 0.18 2.07 7.82 6.12 5.75 6.9533 Societe Generale 9.55 11.47 9.50 11.73 8.85 6.0934 Sonali Bank 0.85 0.87 1.63 2.48 0.90 1.4235 Standard Chartered Bank 5.81 6.29 7.27 7.17 6.27 5.4036 Standard Chartered
Grindlays Bank 6.42 6.75 5.83 6.33 5.93 5.3737 State Bank of Mauritius Ltd. 1.12 1.18 1.91 4.72 4.96 5.9538 The Sumitomo Bank Ltd. — — 1.80 5.84 8.46 7.4439 The Chase Manhattan Bank 0.12 0.32 4.23 9.49 4.40 5.4840 The Fuji Bank Ltd. — 0.24 1.98 5.99 6.00 7.6541 The Sakura Bank Ltd. 4.25 4.41 4.77 6.78 6.29 7.0342 The Toronto-Dominion Bank — — 0.05 0.02 1.12 5.44
Foreign Banks in India 6.72 6.95 6.49 6.79 6.01 5.66
All Scheduled Commercial Banks 6.23 6.66 6.32 6.41 6.25 6.04
(Per cent)
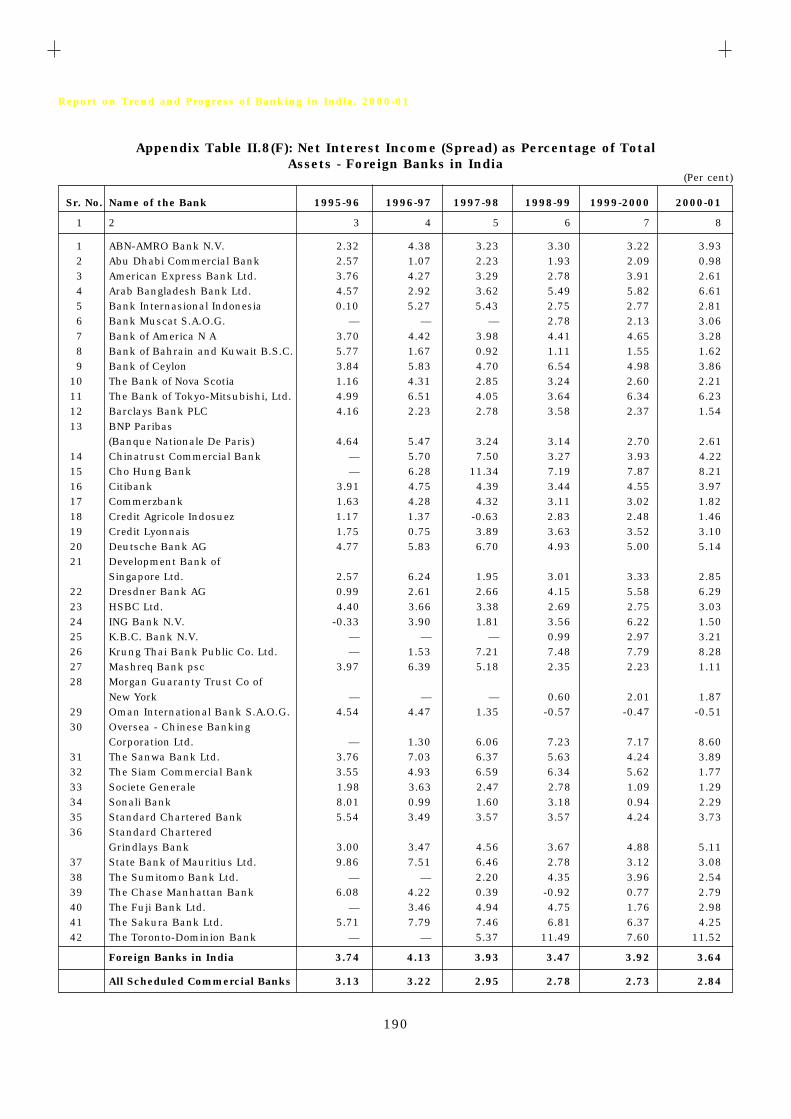
190
Report on Trend and Progress of Banking in India, 2000-01
Appendix Table II.8(F): Net Interest Income (Spread) as Percentage of TotalAssets - Foreign Banks in India
Sr. No. Name of the Bank 1995-96 1996-97 1997-98 1998-99 1999-2000 2000-01
1 2 3 4 5 6 7 8
1 ABN-AMRO Bank N.V. 2.32 4.38 3.23 3.30 3.22 3.932 Abu Dhabi Commercial Bank 2.57 1.07 2.23 1.93 2.09 0.983 American Express Bank Ltd. 3.76 4.27 3.29 2.78 3.91 2.614 Arab Bangladesh Bank Ltd. 4.57 2.92 3.62 5.49 5.82 6.615 Bank Internasional Indonesia 0.10 5.27 5.43 2.75 2.77 2.816 Bank Muscat S.A.O.G. — — — 2.78 2.13 3.067 Bank of America N A 3.70 4.42 3.98 4.41 4.65 3.288 Bank of Bahrain and Kuwait B.S.C. 5.77 1.67 0.92 1.11 1.55 1.629 Bank of Ceylon 3.84 5.83 4.70 6.54 4.98 3.86
10 The Bank of Nova Scotia 1.16 4.31 2.85 3.24 2.60 2.2111 The Bank of Tokyo-Mitsubishi, Ltd. 4.99 6.51 4.05 3.64 6.34 6.2312 Barclays Bank PLC 4.16 2.23 2.78 3.58 2.37 1.5413 BNP Paribas
(Banque Nationale De Paris) 4.64 5.47 3.24 3.14 2.70 2.6114 Chinatrust Commercial Bank — 5.70 7.50 3.27 3.93 4.2215 Cho Hung Bank — 6.28 11.34 7.19 7.87 8.2116 Citibank 3.91 4.75 4.39 3.44 4.55 3.9717 Commerzbank 1.63 4.28 4.32 3.11 3.02 1.8218 Credit Agricole Indosuez 1.17 1.37 -0.63 2.83 2.48 1.4619 Credit Lyonnais 1.75 0.75 3.89 3.63 3.52 3.1020 Deutsche Bank AG 4.77 5.83 6.70 4.93 5.00 5.1421 Development Bank of
Singapore Ltd. 2.57 6.24 1.95 3.01 3.33 2.8522 Dresdner Bank AG 0.99 2.61 2.66 4.15 5.58 6.2923 HSBC Ltd. 4.40 3.66 3.38 2.69 2.75 3.0324 ING Bank N.V. -0.33 3.90 1.81 3.56 6.22 1.5025 K.B.C. Bank N.V. — — — 0.99 2.97 3.2126 Krung Thai Bank Public Co. Ltd. — 1.53 7.21 7.48 7.79 8.2827 Mashreq Bank psc 3.97 6.39 5.18 2.35 2.23 1.1128 Morgan Guaranty Trust Co of
New York — — — 0.60 2.01 1.8729 Oman International Bank S.A.O.G. 4.54 4.47 1.35 -0.57 -0.47 -0.5130 Oversea - Chinese Banking
Corporation Ltd. — 1.30 6.06 7.23 7.17 8.6031 The Sanwa Bank Ltd. 3.76 7.03 6.37 5.63 4.24 3.8932 The Siam Commercial Bank 3.55 4.93 6.59 6.34 5.62 1.7733 Societe Generale 1.98 3.63 2.47 2.78 1.09 1.2934 Sonali Bank 8.01 0.99 1.60 3.18 0.94 2.2935 Standard Chartered Bank 5.54 3.49 3.57 3.57 4.24 3.7336 Standard Chartered
Grindlays Bank 3.00 3.47 4.56 3.67 4.88 5.1137 State Bank of Mauritius Ltd. 9.86 7.51 6.46 2.78 3.12 3.0838 The Sumitomo Bank Ltd. — — 2.20 4.35 3.96 2.5439 The Chase Manhattan Bank 6.08 4.22 0.39 -0.92 0.77 2.7940 The Fuji Bank Ltd. — 3.46 4.94 4.75 1.76 2.9841 The Sakura Bank Ltd. 5.71 7.79 7.46 6.81 6.37 4.2542 The Toronto-Dominion Bank — — 5.37 11.49 7.60 11.52
Foreign Banks in India 3.74 4.13 3.93 3.47 3.92 3.64
All Scheduled Commercial Banks 3.13 3.22 2.95 2.78 2.73 2.84
(Per cent)
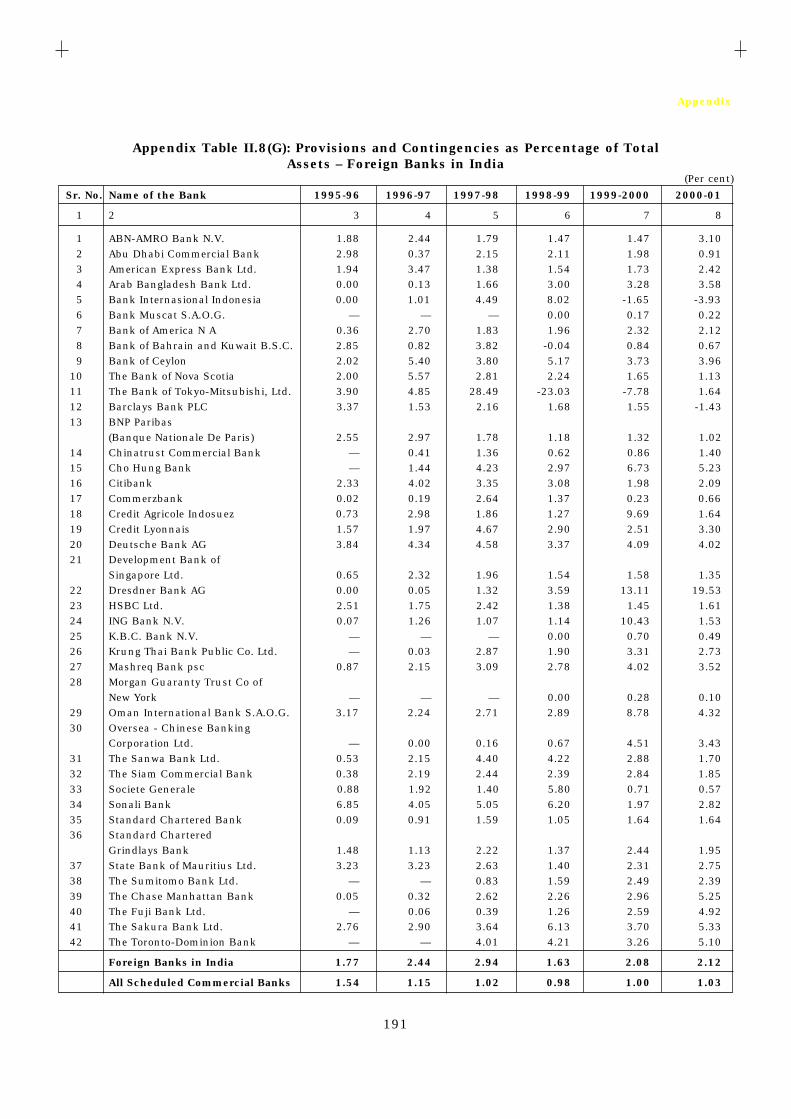
191
Appendix
Appendix Table II.8(G): Provisions and Contingencies as Percentage of TotalAssets – Foreign Banks in India
Sr. No. Name of the Bank 1995-96 1996-97 1997-98 1998-99 1999-2000 2000-01
1 2 3 4 5 6 7 8
1 ABN-AMRO Bank N.V. 1.88 2.44 1.79 1.47 1.47 3.102 Abu Dhabi Commercial Bank 2.98 0.37 2.15 2.11 1.98 0.913 American Express Bank Ltd. 1.94 3.47 1.38 1.54 1.73 2.424 Arab Bangladesh Bank Ltd. 0.00 0.13 1.66 3.00 3.28 3.585 Bank Internasional Indonesia 0.00 1.01 4.49 8.02 -1.65 -3.936 Bank Muscat S.A.O.G. — — — 0.00 0.17 0.227 Bank of America N A 0.36 2.70 1.83 1.96 2.32 2.128 Bank of Bahrain and Kuwait B.S.C. 2.85 0.82 3.82 -0.04 0.84 0.679 Bank of Ceylon 2.02 5.40 3.80 5.17 3.73 3.96
10 The Bank of Nova Scotia 2.00 5.57 2.81 2.24 1.65 1.1311 The Bank of Tokyo-Mitsubishi, Ltd. 3.90 4.85 28.49 -23.03 -7.78 1.6412 Barclays Bank PLC 3.37 1.53 2.16 1.68 1.55 -1.4313 BNP Paribas
(Banque Nationale De Paris) 2.55 2.97 1.78 1.18 1.32 1.0214 Chinatrust Commercial Bank — 0.41 1.36 0.62 0.86 1.4015 Cho Hung Bank — 1.44 4.23 2.97 6.73 5.2316 Citibank 2.33 4.02 3.35 3.08 1.98 2.0917 Commerzbank 0.02 0.19 2.64 1.37 0.23 0.6618 Credit Agricole Indosuez 0.73 2.98 1.86 1.27 9.69 1.6419 Credit Lyonnais 1.57 1.97 4.67 2.90 2.51 3.3020 Deutsche Bank AG 3.84 4.34 4.58 3.37 4.09 4.0221 Development Bank of
Singapore Ltd. 0.65 2.32 1.96 1.54 1.58 1.3522 Dresdner Bank AG 0.00 0.05 1.32 3.59 13.11 19.5323 HSBC Ltd. 2.51 1.75 2.42 1.38 1.45 1.6124 ING Bank N.V. 0.07 1.26 1.07 1.14 10.43 1.5325 K.B.C. Bank N.V. — — — 0.00 0.70 0.4926 Krung Thai Bank Public Co. Ltd. — 0.03 2.87 1.90 3.31 2.7327 Mashreq Bank psc 0.87 2.15 3.09 2.78 4.02 3.5228 Morgan Guaranty Trust Co of
New York — — — 0.00 0.28 0.1029 Oman International Bank S.A.O.G. 3.17 2.24 2.71 2.89 8.78 4.3230 Oversea - Chinese Banking
Corporation Ltd. — 0.00 0.16 0.67 4.51 3.4331 The Sanwa Bank Ltd. 0.53 2.15 4.40 4.22 2.88 1.7032 The Siam Commercial Bank 0.38 2.19 2.44 2.39 2.84 1.8533 Societe Generale 0.88 1.92 1.40 5.80 0.71 0.5734 Sonali Bank 6.85 4.05 5.05 6.20 1.97 2.8235 Standard Chartered Bank 0.09 0.91 1.59 1.05 1.64 1.6436 Standard Chartered
Grindlays Bank 1.48 1.13 2.22 1.37 2.44 1.9537 State Bank of Mauritius Ltd. 3.23 3.23 2.63 1.40 2.31 2.7538 The Sumitomo Bank Ltd. — — 0.83 1.59 2.49 2.3939 The Chase Manhattan Bank 0.05 0.32 2.62 2.26 2.96 5.2540 The Fuji Bank Ltd. — 0.06 0.39 1.26 2.59 4.9241 The Sakura Bank Ltd. 2.76 2.90 3.64 6.13 3.70 5.3342 The Toronto-Dominion Bank — — 4.01 4.21 3.26 5.10
Foreign Banks in India 1.77 2.44 2.94 1.63 2.08 2.12
All Scheduled Commercial Banks 1.54 1.15 1.02 0.98 1.00 1.03
(Per cent)

192
Report on Trend and Progress of Banking in India, 2000-01
Appendix Table II.8(H): Operating Expenses as Percentage of TotalAssets – Foreign Banks in India
Sr. No. Name of the Bank 1995-96 1996-97 1997-98 1998-99 1999-2000 2000-01
1 2 3 4 5 6 7 8
1 ABN-AMRO Bank N.V. 1.92 3.23 2.85 2.08 1.83 2.572 Abu Dhabi Commercial Bank 1.18 1.22 1.41 0.97 1.10 0.443 American Express Bank Ltd. 3.09 3.93 3.70 4.52 6.38 6.584 Arab Bangladesh Bank Ltd. 1.75 3.77 2.53 1.95 2.08 2.405 Bank Internasional Indonesia 7.56 4.34 6.81 12.25 15.03 11.496 Bank Muscat S.A.O.G. — — — 4.85 2.80 3.497 Bank of America N A 2.25 1.68 1.83 1.94 3.26 1.608 Bank of Bahrain and Kuwait B.S.C. 1.62 1.49 1.54 1.82 1.75 1.729 Bank of Ceylon 3.39 2.94 1.51 1.99 1.54 1.63
10 The Bank of Nova Scotia 1.59 1.56 1.46 1.55 1.43 0.9611 The Bank of Tokyo-Mitsubishi, Ltd. 1.06 1.34 2.21 33.47 14.70 4.4612 Barclays Bank PLC 3.43 3.71 6.52 3.60 3.67 2.8113 BNP Paribas
(Banque Nationale De Paris) 2.27 1.86 1.96 2.19 2.32 2.8214 Chinatrust Commercial Bank — 5.34 7.67 3.01 3.30 2.7915 Cho Hung Bank — 4.49 4.73 2.80 2.43 2.3016 Citibank 3.28 3.82 3.83 3.53 3.88 3.0917 Commerzbank 6.77 6.72 4.19 3.89 3.99 2.2118 Credit Agricole Indosuez 0.99 1.73 2.38 2.99 3.78 2.2719 Credit Lyonnais 1.40 1.80 2.32 1.80 2.07 1.7320 Deutsche Bank AG 3.65 3.05 3.38 3.42 3.89 3.9021 Development Bank of
Singapore Ltd. 2.36 4.12 2.78 2.18 1.70 1.5822 Dresdner Bank AG 5.50 5.23 3.44 5.19 5.21 10.9223 HSBC Ltd. 2.72 2.81 2.71 2.80 2.35 2.6624 ING Bank N.V. 2.15 2.67 3.13 4.41 6.82 6.5225 K.B.C. Bank N.V. — — — 1.59 2.58 2.3226 Krung Thai Bank Public Co. Ltd. — 2.16 6.08 5.00 4.65 4.4127 Mashreq Bank psc 1.07 2.80 4.30 3.53 3.39 2.0528 Morgan Guaranty Trust Co of
New York — — — 4.86 6.24 4.7629 Oman International Bank S.A.O.G. 2.22 1.86 1.92 1.54 1.25 1.3230 Oversea - Chinese Banking
Corporation — 7.51 7.21 5.80 5.33 5.9631 The Sanwa Bank Ltd. 1.35 1.42 1.68 2.00 2.41 3.3332 The Siam Commercial Bank 3.07 1.46 1.85 2.33 2.14 3.5433 Societe Generale 1.07 1.51 1.86 2.56 2.83 2.8134 Sonali Bank 3.93 3.65 4.98 5.77 3.28 5.1335 Standard Chartered Bank 5.15 4.38 4.11 5.11 3.29 3.0336 Standard Chartered
Grindlays Bank 2.74 3.19 2.72 2.60 2.89 4.1237 State Bank of Mauritius Ltd. 2.57 2.06 1.26 1.23 0.92 0.8438 The Sumitomo Bank, Ltd. — — 2.20 2.44 2.38 2.6839 The Chase Manhattan Bank 21.55 8.38 7.50 11.11 5.60 5.3640 The Fuji Bank, Ltd. — 8.94 3.08 3.98 2.63 2.5841 The Sakura Bank Ltd. 0.54 0.87 1.35 1.72 2.15 1.8342 The Toronto-Dominion Bank — — 7.97 4.34 2.59 3.78
Foreign Banks in India 2.77 3.00 2.97 3.59 3.22 3.05
All Scheduled Commercial Banks 2.94 2.85 2.63 2.67 2.50 2.64
(Per cent)

193
Appendix
Appendix Table II.9(A): Non-Performing Assets as percentage ofTotal Assests - Public Sector Banks
(Per cent)
Sr. Name of the Bank Gross NPAs/Total Assets Net NPAs/Total Assets
No. 1997-98 1998-99 1999-2000 2000-01 1997-98 1998-99 1999-2000 2000-01
1 2 3 4 5 6 7 8 9 10
Nationalised Banks 7.24 6.83 6.00 5.45 3.48 3.26 3.15 2.95
1 Allahabad Bank 9.63 8.72 8.59 8.26 5.67 4.98 5.09 4.87
2 Andhra Bank 3.70 3.90 2.89 2.31 1.02 1.67 1.23 1.07
3 Bank of Baroda 6.83 7.06 6.65 6.61 2.81 3.08 2.88 2.92
4 Bank of India 5.76 5.63 6.23 5.76 3.39 3.29 3.96 3.59
5 Bank of Maharashtra 6.65 5.87 4.71 4.60 2.97 2.95 2.43 2.61
6 Canara Bank 8.31 8.46 4.29 3.38 2.93 2.88 2.28 2.03
7 Central Bank of India 7.91 6.90 6.87 6.88 4.28 3.55 3.76 3.87
8 Corporation Bank 3.05 2.46 2.58 2.46 1.12 0.83 0.89 0.87
9 Dena Bank 6.32 5.78 8.31 10.77 3.58 3.40 5.83 7.15
10 Indian Bank 17.62 17.34 14.26 8.86 9.71 7.57 5.64 3.57
11 Indian Overseas Bank 5.86 5.89 5.88 5.39 2.53 3.02 3.21 3.03
12 Oriental Bank of Commerce 2.69 2.65 2.15 2.16 1.94 1.85 1.37 1.47
13 Punjab & Sind Bank 11.50 10.35 6.53 7.66 3.82 4.06 3.76 4.73
14 Punjab National Bank 6.15 6.11 5.78 5.45 3.84 3.66 3.54 2.95
15 Syndicate Bank 6.09 4.91 3.65 3.80 2.06 1.68 1.42 1.88
16 UCO Bank 9.58 8.27 7.01 4.70 3.79 3.45 2.90 2.40
17 Union Bank of India 4.64 4.68 5.37 5.28 3.06 3.15 3.32 3.08
18 United Bank of India 10.08 9.00 7.79 6.57 3.28 3.33 3.01 2.80
19 Vijaya Bank 5.65 4.95 4.43 4.17 2.93 2.26 2.42 2.50
State Bank Group 6.67 6.52 5.88 5.11 2.89 2.94 2.60 2.34
20 State Bank of India 6.38 6.32 5.83 5.03 2.50 2.65 2.40 2.17
21 State Bank of Bikaner
& Jaipur 5.43 6.60 6.20 5.16 3.14 4.01 3.64 2.95
22 State Bank of Hyderabad 9.09 7.00 6.03 5.86 4.74 3.55 2.86 3.03
23 State Bank of Indore 7.33 6.60 5.06 3.95 5.09 4.30 3.42 2.46
24 State Bank of Mysore 9.19 8.57 6.64 6.17 5.23 4.95 3.64 3.47
25 State Bank of Patiala 5.34 6.61 5.41 4.85 3.00 3.65 2.84 2.35
26 State Bank of Saurashtra 7.01 7.19 6.23 6.62 3.02 3.28 3.34 3.06
27 State Bank of Travancore 9.97 8.11 6.52 5.23 5.53 4.34 3.63 3.42
Public Sector Banks 7.03 6.71 5.95 5.32 3.27 3.14 2.94 2.72
Source: 1. Balance sheets of respective banks.
2. Returns received from respective banks.

194
Report on Trend and Progress of Banking in India, 2000-01
Appendix Table II.9(B): Non-Performing Assets as percentage ofAdvances - Public Sector Banks
(Per cent)
Sr. Name of the Bank Gross NPAs/Gross Advances Net NPAs/Net Advances
No. 1997-98 1998-99 1999-2000 2000-01 1997-98 1998-99 1999-2000 2000-01
1 2 3 4 5 6 7 8 9 10
Nationalised Banks 16.88 16.02 13.91 12.19 8.91 8.35 7.80 7.01
1 Allahabad Bank 23.18 20.09 19.07 17.66 15.09 12.54 12.17 11.21
2 Andhra Bank 9.86 9.42 7.85 6.13 2.92 4.26 3.47 2.95
3 Bank of Baroda 14.63 16.03 14.73 14.11 6.60 7.70 6.95 6.77
4 Bank of India 11.55 11.87 12.89 10.25 7.13 7.29 8.61 6.72
5 Bank of Maharashtra 17.39 15.97 12.65 12.35 8.59 8.72 6.97 7.41
6 Canara Bank 18.69 18.32 9.60 7.80 7.52 7.09 5.28 4.84
7 Central Bank of India 20.47 17.41 16.63 16.06 12.21 9.79 9.84 9.72
8 Corporation Bank 7.60 5.66 5.39 5.40 2.93 1.98 1.91 1.98
9 Dena Bank 13.73 12.37 18.17 25.31 8.28 7.67 13.81 18.29
10 Indian Bank 38.96 38.70 32.77 21.76 26.01 21.67 16.18 10.07
11 Indian Overseas Bank 13.38 13.32 13.18 11.81 6.26 7.30 7.65 7.01
12 Oriental Bank of Commerce 6.16 6.30 5.54 5.21 4.84 4.50 3.61 3.59
13 Punjab & Sind Bank 26.79 23.01 15.27 18.45 10.84 10.48 9.40 12.27
14 Punjab National Bank 14.50 14.12 13.19 11.71 9.60 8.96 8.52 6.69
15 Syndicate Bank 15.31 10.72 7.74 7.87 5.78 3.93 3.17 4.05
16 UCO Bank 24.04 22.55 18.79 11.71 11.14 10.83 8.75 6.35
17 Union Bank of India 11.18 12.41 12.27 11.20 7.66 8.70 7.97 6.86
18 United Bank of India 33.50 32.38 27.63 21.51 14.10 15.06 12.85 10.47
19 Vijaya Bank 15.21 13.65 11.52 10.00 7.50 6.72 6.62 6.22
State Bank Group 14.57 15.67 14.08 12.73 6.89 7.74 6.77 6.26
20 State Bank of India 14.14 15.56 14.25 12.93 6.07 7.18 6.41 6.03
21 State Bank of Bikaner
& Jaipur 11.73 16.11 16.18 12.91 7.13 10.45 10.14 7.83
22 State Bank of Hyderabad 18.96 15.94 14.18 14.08 10.88 8.78 7.30 7.83
23 State Bank of Indore 15.05 14.68 10.80 9.16 10.96 10.10 7.55 5.91
24 State Bank of Mysore 17.47 16.96 13.89 12.83 10.75 10.55 8.12 7.65
25 State Bank of Patiala 11.88 13.98 10.99 9.66 7.04 8.23 6.09 4.92
26 State Bank of Saurashtra 14.83 15.43 13.71 14.57 6.98 7.69 7.86 6.87
27 State Bank of Travancore 20.06 18.46 14.43 11.38 12.21 10.80 8.80 7.75
Public Sector Banks 16.02 15.89 13.98 12.39 8.15 8.13 7.42 6.74
Source: 1. Balance sheets of respective banks.
2. Returns received from respective banks.

195
Appendix
Appendix Table II.9(C): Non-Performing Assets as percentage of Total Assests - Private Sector Banks
(Per cent)
Sr. Name of the Bank Gross NPAs/Total Assets Net NPAs/Total Assets
No. 1997-98 1998-99 1999-2000 2000-01 1997-98 1998-99 1999-2000 2000-01
1 2 3 4 5 6 7 8 9 10
Old Private Sector Banks 5.06 5.78 5.22 5.22 2.84 3.56 3.27 3.27
1 The Bank of Rajasthan Ltd. 8.74 9.80 9.13 8.21 4.11 3.98 4.28 3.27
2 Bharat Overseas Bank Ltd. 3.57 2.38 5.07 3.28 1.80 1.38 2.72 1.83
3 City Union Bank Ltd. 5.75 5.92 6.54 7.01 3.78 3.75 3.62 3.94
4 Development Credit Bank Ltd. 3.04 2.74 3.70 4.16 2.12 2.07 2.88 3.19
5 The Ganesh Bank of Kurundwad Ltd. 5.59 6.50 6.94 6.77 3.25 3.75 5.19 4.84
6 The Karnataka Bank Ltd. 2.39 3.47 3.89 4.81 1.44 2.09 2.44 2.93
7 Lord Krishna Bank Ltd. 10.05 14.65 8.36 7.27 6.91 9.57 6.52 5.36
8 The Nainital Bank Ltd. 3.63 2.55 2.05 1.70 1.26 1.26 0.17 0.00
9 SBI Commercial &
International Bank Ltd. 8.86 14.21 10.76 15.48 2.97 9.28 7.27 10.00
10 Tamilnad Mercantile Bank Ltd. 4.70 4.55 4.63 4.80 2.29 2.24 2.34 2.58
11 The Benares State Bank Ltd. 7.44 10.10 8.71 7.35 5.11 6.99 5.70 4.80
12 The Catholic Syrian Bank Ltd. 9.34 8.16 7.05 6.31 5.50 6.08 4.88 4.22
13 The Dhanalakshmi Bank Ltd. 7.83 8.97 7.38 7.96 5.10 5.45 5.38 5.87
14 The Federal Bank Ltd. 4.02 5.94 6.45 7.28 2.83 3.94 4.54 5.55
15 The Jammu & Kashmir
Bank Ltd. 3.84 3.24 2.25 1.91 1.75 1.49 1.07 0.92
16 The Karur Vysya Bank Ltd. 1.88 3.16 3.06 3.88 0.85 2.00 1.81 2.52
17 The Lakshmi Vilas Bank Ltd. 4.64 4.70 4.18 5.62 2.74 3.25 2.67 3.66
18 The Nedungadi Bank Ltd. 6.50 7.13 8.36 12.62 4.97 6.07 7.21 9.45
19 The Ratnakar Bank Ltd. 4.71 4.81 4.85 4.72 3.11 3.25 3.27 3.12
20 The Sangli Bank Ltd. 7.76 6.46 5.18 4.70 3.07 2.86 2.41 2.20
21 The South Indian Bank Ltd. 5.09 8.29 5.90 4.93 2.93 5.12 3.92 3.36
22 The United Western Bank Ltd. 3.64 4.76 3.20 5.91 2.63 3.53 2.36 4.41
23 The Vysya Bank Ltd. 6.30 7.76 6.70 4.37 3.28 5.24 4.02 2.02
New Private Sector Banks 1.52 2.26 1.60 2.06 1.12 1.59 1.08 1.18
24 Bank of Punjab Ltd. 0.57 1.96 1.42 1.59 0.38 1.46 0.94 0.93
25 Centurion Bank Ltd. 0.13 3.28 2.67 2.68 0.10 2.03 1.37 1.21
26 Global Trust Bank 2.06 1.71 0.65 2.52 1.39 1.36 0.37 1.62
27 HDFC Bank 0.44 0.58 1.04 0.94 0.46 0.11 0.32 0.13
28 ICICI Bank 0.67 1.45 0.78 2.07 0.39 0.87 0.46 0.78
29 IDBI Bank 0.14 0.48 0.81 2.44 0.12 0.40 0.69 1.84
30 IndusInd Bank Ltd. 2.64 4.49 3.32 3.03 1.93 3.11 2.75 2.57
31 UTI Bank Ltd. 3.67 4.40 2.90 2.10 2.84 3.48 2.48 1.68
Private Sector Banks 3.93 4.48 3.61 3.70 2.29 2.83 2.30 2.26
Source: 1. Balance sheets of respective banks.2. Returns received from respective banks.

196
Report on Trend and Progress of Banking in India, 2000-01
Appendix Table II.9(D): Non-Performing Assets as percentage of Advances - Private Sector Banks
(Per cent)
Sr. Name of the Bank Gross NPAs/Gross Advances Net NPAs/Net Advances
No. 1997-98 1998-99 1999-2000 2000-01 1997-98 1998-99 1999-2000 2000-01
1 2 3 4 5 6 7 8 9 10
Old Private Sector Banks 10.92 13.06 10.78 11.12 6.46 8.96 7.06 7.30
1 The Bank of Rajasthan Ltd. 17.61 20.55 18.55 17.20 9.14 9.50 9.86 7.62
2 Bharat Overseas Bank Ltd. 8.36 7.08 11.29 7.58 4.40 4.23 6.39 4.38
3 City Union Bank Ltd. 11.03 12.02 12.40 13.69 7.54 7.96 7.25 8.18
4 Development Credit Bank Ltd. 7.03 6.25 7.40 7.84 5.02 4.79 5.86 6.12
5 The Ganesh Bank of Kurundwad Ltd. 10.20 11.60 12.49 13.63 6.18 7.03 9.94 10.12
6 The Karnataka Bank Ltd. 4.98 8.01 8.82 10.58 3.06 4.99 5.73 6.93
7 Lord Krishna Bank Ltd. 19.23 28.43 17.19 16.74 14.09 20.60 13.94 12.92
8 The Nainital Bank Ltd. 15.48 11.13 9.33 7.92 5.99 6.20 0.80 0.00
9 SBI Commercial &
International Bank Ltd. 20.39 30.02 19.38 31.00 7.89 21.89 13.97 22.56
10 Tamilnad Mercantile Bank Ltd. 10.42 10.88 10.80 10.58 5.37 5.67 5.77 5.99
11 The Benares State Bank Ltd. 22.02 37.91 33.36 32.21 16.85 29.71 24.70 23.70
12 The Catholic Syrian Bank Ltd. 17.74 19.01 16.99 14.24 11.27 14.88 12.41 9.99
13 The Dhanalakshmi Bank Ltd. 15.68 18.80 14.58 14.77 11.01 N.A. 11.08 11.31
14 The Federal Bank Ltd. 7.34 10.93 11.75 12.84 5.28 7.53 8.56 10.09
15 The Jammu & Kashmir
Bank Ltd. 9.40 7.90 6.53 4.97 4.57 3.79 3.21 2.46
16 The Karur Vysya Bank Ltd. 4.06 6.70 6.20 7.14 1.87 4.35 3.76 4.73
17 The Lakshmi Vilas Bank Ltd. 9.86 9.45 8.18 9.61 6.09 N.A. 5.37 6.46
18 The Nedungadi Bank Ltd. 11.97 14.16 17.83 24.06 9.41 12.30 15.79 20.65
19 The Ratnakar Bank Ltd. 10.00 11.11 12.37 11.03 6.84 7.80 8.71 7.58
20 The Sangli Bank Ltd. 20.83 16.87 14.95 13.21 9.43 8.26 7.56 6.61
21 The South Indian Bank Ltd. 10.25 16.76 12.50 10.12 6.35 11.06 8.67 7.10
22 The United Western Bank Ltd. 7.76 10.86 6.45 12.00 5.73 8.24 4.82 9.22
23 The Vysya Bank Ltd. 15.07 19.82 14.33 9.75 8.45 14.31 9.13 4.76
New Private Sector Banks 3.51 6.19 4.14 5.14 2.63 4.46 2.88 3.09
24 Bank of Punjab Ltd. 1.69 4.88 3.44 3.88 1.14 3.66 2.32 2.31
25 Centurion Bank Ltd. 0.24 7.32 7.28 7.48 0.38 4.67 3.87 3.52
26 Global Trust Bank 4.36 4.15 1.52 5.70 2.98 3.33 0.87 3.75
27 HDFC Bank 3.04 1.65 3.32 2.81 1.18 0.34 1.10 0.45
28 ICICI Bank 1.93 4.72 2.54 5.42 1.14 2.88 1.53 2.19
29 IDBI Bank 0.36 1.53 2.26 6.84 0.32 1.28 1.96 5.24
30 IndusInd Bank Ltd. 5.33 10.08 6.97 6.13 3.96 7.20 5.98 5.25
31 UTI Bank Ltd. 7.15 7.86 5.47 4.64 5.63 6.32 4.71 3.76
Private Sector Banks 8.67 10.81 8.17 8.48 5.26 7.41 5.41 5.44
N.A. : Not available.
Source: 1. Balance sheets of respective banks.2. Returns received from respective banks.

197
Appendix
Appendix Table II.9(E): Non-Performing Assets as percentage of Total Assests - Foreign Banks
(Per cent)
Sr. Name of the Bank Gross NPAs/Total Assets Net NPAs/Total Assets
No. 1997-98 1998-99 1999-2000 2000-01 1997-98 1998-99 1999-2000 2000-01
1 2 3 4 5 6 7 8 9 10
1 ABN-AMRO Bank N.V. 0.65 0.90 0.53 1.45 -0.01 0.23 0.16 0.622 Abu Dhabi Commercial Bank 3.82 3.03 2.99 1.17 2.19 1.21 0.75 0.273 American Express Bank Ltd. 0.61 1.91 2.41 4.59 -0.17 0.68 1.41 2.244 Standard Chartered
Grindlays Bank Ltd. 1.77 1.70 1.74 2.40 0.09 0.09 0.01 0.125 Arab Bangladesh Bank Ltd. 0.00 0.00 1.01 0.96 0.00 0.00 0.58 0.496 Bank Internasional Indonesia 0.00 23.84 24.94 24.56 0.00 4.08 7.63 6.427 Bank of America N A 0.03 0.10 1.51 1.33 0.00 0.00 1.21 0.448 Bank of Bahrain and
Kuwait B.S.C. 10.39 12.73 7.90 10.55 4.14 5.07 3.52 5.839 Bank of Ceylon 5.33 13.23 16.93 26.76 4.27 10.55 14.51 19.99
10 Bank Muscat S.A.O.G. — 0.00 0.42 0.54 — 0.00 0.35 0.3411 BNP Paribas 0.92 0.71 0.75 1.30 0.15 0.58 0.02 0.2512 Barclays Bank PLC 3.49 2.39 4.52 0.00 2.13 0.40 0.00 0.0013 The Chase Manhattan Bank 0.00 0.00 0.00 0.00 0.00 0.00 0.00 0.0014 Chinatrust Commercial Bank 0.00 2.53 2.55 2.79 0.00 2.53 2.19 2.1315 Cho Hung Bank 0.88 0.50 0.48 0.54 0.79 0.45 0.33 0.3816 Citibank 0.49 1.18 0.85 0.65 0.24 0.81 0.49 0.3417 Commerzbank 3.47 2.46 2.36 2.96 1.74 2.21 2.10 2.6018 Credit Agricole Indosuez 12.58 18.60 22.64 15.19 7.85 8.03 1.59 0.4619 Credit Lyonnais 5.19 1.04 3.03 3.64 1.56 0.14 1.61 1.7620 Deutsche Bank AG 1.56 2.15 4.90 3.29 0.81 0.48 2.02 0.4721 Dresdner Bank AG 6.47 11.64 12.77 39.62 5.35 6.44 7.01 9.1022 The Fuji Bank Ltd. 0.00 3.65 8.97 9.29 0.00 3.29 6.23 2.0023 HSBC Ltd. 2.95 2.75 3.48 2.82 0.52 0.27 0.35 0.3924 ING Bank N.V. 0.00 2.74 11.58 9.12 0.00 2.42 4.50 0.8625 K.B.C. Bank N.V. — 0.00 0.00 0.08 — 0.00 0.00 0.0426 Krung Thai Bank Public Co. Ltd. 0.00 0.00 0.00 0.00 0.00 0.00 0.00 0.0027 Mashreq Bank psc 17.73 23.22 18.68 12.67 9.23 10.39 7.17 2.9228 Morgan Guaranty
Trust Co.of New York — 0.00 0.00 0.00 — 0.00 0.00 0.0029 Oman International Bank
S.A.O.G. 28.88 36.01 38.94 45.09 11.89 16.94 11.14 7.1730 Oversea-Chinese
Banking Corporation Ltd. 0.00 0.00 7.07 7.70 0.00 0.00 4.79 3.7531 The Siam Commercial Bank 0.00 6.88 4.44 25.09 0.00 6.19 3.46 22.4232 Societe Generale 9.10 11.69 5.67 4.23 7.49 4.88 3.01 2.0733 Sonali Bank 0.42 0.38 0.23 0.33 0.03 N.A. 0.23 0.3334 Standard Chartered Bank 3.83 3.80 3.98 3.41 1.24 1.32 0.96 0.6435 State Bank of Mauritius Ltd. 1.30 8.19 5.65 9.52 0.20 6.31 5.09 8.2436 The Sumitomo Bank Ltd. 0.00 0.26 12.17 15.05 0.00 0.24 11.10 11.7037 The Bank of Nova Scotia 7.04 6.47 1.87 1.72 2.28 1.84 0.79 1.3438 The Bank of Tokyo-
Mitsubishi Ltd. 35.24 12.10 4.78 2.94 6.70 5.47 1.10 0.0039 Development Bank of
Singapore Ltd. 6.05 2.73 0.00 0.00 4.22 0.85 0.00 0.0040 The Sakura Bank Ltd. 4.31 14.14 17.48 11.06 3.34 7.68 9.40 0.6141 The Sanwa Bank Ltd. 2.47 10.62 16.04 10.37 2.47 6.29 12.24 5.8342 The Toronto-Domonion Bank 0.00 0.00 0.00 0.00 0.00 0.00 0.00 0.00
Foreign Banks in India 3.05 3.10 3.16 3.02 1.02 1.10 1.03 0.79
Source: 1. Balance sheets of respective banks.2. Returns received from respective banks.

198
Report on Trend and Progress of Banking in India, 2000-01
Appendix Table II.9(F): Non-Performing Assets as percentage of Advances - Foreign Banks
(Per cent)
Sr. Name of the Bank Gross NPAs/Gross Advances Net NPAs/Net Advances
No. 1997-98 1998-99 1999-2000 2000-01 1997-98 1998-99 1999-2000 2000-01
1 2 3 4 5 6 7 8 9 10
1 ABN-AMRO Bank N.V. 1.65 1.70 1.00 2.84 0.51 0.45 0.31 1.222 Abu Dhabi Commercial Bank 9.38 8.55 7.92 7.81 5.02 3.59 2.12 1.923 American Express Bank Ltd. 3.56 6.25 7.14 11.92 1.21 2.32 4.32 6.054 Standard Chartered
Grindlays Bank Ltd. 4.46 4.60 4.48 7.24 0.59 0.03 0.03 0.415 Arab Bangladesh Bank Ltd. Nil Nil 10.08 7.72 Nil Nil 5.78 4.096 Bank Internasional Indonesia Nil 40.74 75.70 79.80 Nil 10.53 48.85 50.757 Bank of America N A 0.06 0.19 2.33 2.03 0.17 Nil 1.88 0.688 Bank of Bahrain and
Kuwait B.S.C. 23.61 24.00 15.76 19.03 15.22 11.17 7.72 11.519 Bank of Ceylon 11.23 19.78 27.92 39.09 9.62 16.43 25.86 34.15
10 Bank Muscat S.A.O.G. — N.A. N.A. 1.26 — N.A. N.A. 0.8011 BNP Paribas 2.78 2.48 2.47 3.21 2.41 2.07 0.08 0.6412 Barclays Bank PLC 15.76 17.04 23.40 0.00 11.45 3.35 Nil 0.0013 The Chase Manhattan Bank Nil Nil Nil 0.00 Nil Nil Nil 0.0014 Chinatrust Commercial Bank Nil 5.69 5.58 4.86 Nil 5.74 4.83 3.7515 Cho Hung Bank 1.56 2.08 2.08 1.31 1.41 1.88 1.45 0.9116 Citibank 1.22 3.00 1.81 1.35 0.57 2.08 1.05 0.7117 Commerzbank 7.36 7.70 8.16 15.24 3.88 7.04 7.34 13.6418 Credit Agricole Indosuez 38.71 43.25 48.12 28.68 23.59 24.75 6.13 1.2119 Credit Lyonnais 10.44 2.67 7.38 6.89 3.38 0.37 4.07 3.4720 Deutsche Bank AG 2.96 5.59 12.02 8.07 0.48 1.31 5.33 1.2321 Dresdner Bank AG 17.19 25.45 25.15 57.97 12.33 16.16 16.57 24.0522 The Fuji Bank Ltd. Nil 6.65 14.17 13.47 Nil 6.02 10.28 3.2423 HSBC Ltd. 7.91 8.38 9.39 6.64 1.99 0.91 1.04 0.9624 ING Bank N.V. Nil 6.37 28.24 40.02 Nil 5.67 13.26 5.9425 K.B.C. Bank N.V. — Nil Nil 0.47 — N.A. Nil 0.2326 Krung Thai Bank Public Co. Ltd. Nil Nil Nil 0.00 Nil Nil Nil 0.0027 MashreqBank psc 34.49 38.01 40.17 40.18 22.08 21.55 20.48 13.4028 Morgan Guaranty
Trust Co.of New York — Nil Nil Nil — Nil Nil Nil29 Oman International Bank
S.A.O.G. 44.34 56.60 64.03 78.79 25.42 38.03 33.79 37.1230 Oversea-Chinese
Banking Corporation Ltd. Nil Nil 18.81 31.71 Nil Nil 12.74 18.4531 The Siam Commercial Bank Nil 11.55 6.54 41.60 Nil 10.51 5.17 39.1232 Societe Generale 16.88 24.50 15.14 13.80 14.24 11.94 8.66 7.2733 Sonali Bank 2.42 2.17 3.43 4.17 0.00 0.00 3.55 4.3534 Standard Chartered Bank 7.47 8.50 7.94 7.59 2.50 3.18 2.04 1.5335 State Bank of Mauritius Ltd. 2.46 13.53 8.63 18.39 1.79 10.76 8.06 16.1836 The Sumitomo Bank Ltd. Nil 0.39 17.60 20.57 Nil 0.36 16.34 16.7637 The Bank of Nova Scotia 10.68 9.25 2.69 2.61 2.80 2.80 1.16 2.0438 The Bank of Tokyo-
Mitsubishi Ltd. 43.41 25.47 9.88 5.15 15.20 13.45 2.46 0.0139 Development Bank of
Singapore Ltd. 12.70 13.83 Nil 0.00 9.19 4.78 Nil 0.0040 The Sakura Bank Ltd. 6.62 20.95 26.87 15.90 3.33 12.59 16.49 1.0341 The Sanwa Bank Ltd. 4.37 15.64 21.75 15.78 0.72 9.90 17.67 9.6142 The Toronto-Domonion Bank Nil Nil 0.00 0.00 Nil Nil Nil 0.00
Foreign Banks in India 6.38 7.59 6.99 6.76 2.25 2.94 2.41 1.86
N.A. : Not available.Source: 1. Balance sheets of respective banks.
2. Returns received from respective banks.

199
Appen
dix
Appendix Table II.10(A): Sector-wise Non-Performing Assets of Public Sector Banks( As on March 31, 2001)
(Amount in Rs. crore)
Sr. Name of the Banks Agriculture Small Scale Others Priority Sector Public Sector Non-Priority Sector Total
No. Amount Per cent Amount Per cent Amount Per cent Amount Per cent Amount Per cent Amount Per centto total to total to total to total to total to total
1 2 3 4 5 6 7 8 9 10 11 12 13 14 15(3+5+7) (9+11+1 3)
Nationalised Banks 4,357.21 13.21 6,536.22 19.82 4,334.46 13.14 15,227.89 46.17 498.09 1.51 17,257.44 52.32 32,983.42
1 Allahabad Bank 183.03 10.05 262.46 14.41 239.90 13.17 685.39 37.63 99.54 5.47 1,036.38 56.90 1,821.31
2 Andhra Bank 53.00 11.27 106.00 22.55 66.00 14.04 225.00 47.86 6.85 1.46 238.25 50.68 470.10
3 Bank of Baroda 652.56 16.69 731.72 18.71 364.13 9.31 1,748.41 44.72 0.08 0.00 2,161.57 55.28 3,910.06
4 Bank of India 438.79 13.78 497.67 15.63 349.09 10.96 1,285.55 40.38 26.73 0.84 1,871.56 58.78 3,183.84
5 Bank of Maharashtra 179.83 20.51 241.07 27.50 144.77 16.51 565.67 64.53 0.12 0.01 310.85 35.46 876.64
6 Canara Bank 366.17 16.56 703.63 31.83 264.70 11.97 1,334.50 60.37 68.55 3.10 807.50 36.53 2,210.55
7 Central Bank of India 346.78 10.66 737.71 22.68 499.11 15.34 1,583.60 48.68 26.96 0.83 1,642.77 50.50 3,253.33
8 Corporation Bank 66.97 13.82 86.40 17.82 70.46 14.54 223.83 46.18 10.77 2.22 250.14 51.60 484.74
9 Dena Bank 152.66 7.92 261.82 13.58 272.23 14.12 686.71 35.61 3.10 0.16 1,238.45 64.23 1,928.26
10 Indian Bank 227.54 11.22 401.84 19.82 179.96 8.88 809.34 39.92 18.10 0.89 1,199.97 59.19 2,027.41
11 Indian Overseas Bank 178.11 11.65 319.76 20.91 133.20 8.71 631.07 41.26 94.94 6.21 803.39 52.53 1,529.40
12 Oriental Bank of Commerce 106.66 18.21 85.06 14.52 130.62 22.30 322.34 55.03 0.07 0.01 263.36 44.96 585.77
13 Punjab & Sind Bank 85.23 8.31 216.86 21.13 99.11 9.66 401.20 39.10 23.45 2.29 601.50 58.62 1,026.15
14 Punjab National Bank 384.81 11.12 568.88 16.44 466.29 13.48 1,419.98 41.04 46.60 1.35 1,993.52 57.61 3,460.10
15 Syndicate Bank 156.75 14.63 245.41 22.90 158.99 14.84 561.15 52.37 12.08 1.13 498.25 46.50 1,071.48
16 UCO Bank 180.96 16.72 176.95 16.35 241.14 22.29 599.05 55.36 17.09 1.58 465.89 43.06 1,082.03
17 Union Bank of India 280.91 13.66 514.20 25.01 292.66 14.23 1,087.77 52.90 4.87 0.24 963.69 46.86 2,056.33
18 United Bank of India 211.09 14.96 242.99 17.22 260.61 18.47 714.69 50.65 38.19 2.71 658.12 46.64 1,411.00
19 Vijaya Bank 105.36 17.71 135.79 22.82 101.49 17.06 342.64 57.59 — — 252.28 42.41 594.92
State Bank Group 3,019.44 14.95 3,803.19 18.84 2,105.72 10.43 8,928.35 44.22 1,212.78 6.01 10,049.57 49.77 20,190.70
20 State Bank of India 2,351.18 15.20 2,898.42 18.73 1,626.72 10.51 6,876.32 44.44 1,090.40 7.05 7,506.26 48.51 15,472.98
21 State Bank of Bikaner & Jaipur 112.97 15.80 114.19 15.97 63.13 8.83 290.29 40.60 20.29 2.84 404.42 56.56 715.00
22 State Bank of Hyderabad 159.38 14.82 168.68 15.69 129.28 12.02 457.34 42.53 57.70 5.37 560.25 52.10 1,075.29
23 State Bank of Indore 62.34 19.17 55.00 16.91 61.77 19.00 179.11 55.08 1.66 0.51 144.42 44.41 325.19
24 State Bank of Mysore 96.20 16.56 127.58 21.96 51.44 8.85 275.22 47.37 — — 305.79 52.63 581.01
25 State Bank of Patiala 87.85 12.64 131.63 18.95 60.63 8.73 280.11 40.32 24.91 3.59 389.74 56.10 694.76
26 State Bank of Saurashtra 78.69 13.84 196.41 34.55 31.11 5.47 306.21 53.86 — — 262.33 46.14 568.54
27 State Bank of Travancore 70.83 9.35 111.28 14.68 81.64 10.77 263.75 34.80 17.82 2.35 476.36 62.85 757.93
Public Sector Banks 7,376.65 13.87 10,339.41 19.44 6,440.18 12.11 24,156.24 45.43 1,710.87 3.22 27,307.01 51.35 53,174.12
Note : Data is based on domestic operations of respective banks.Source : Based on off-site returns.

200
Report o
n T
ren
d a
nd P
rogre
ss of B
an
kin
g in
India
, 20
00
-01
Appendix Table II.10(B): Sector-wise Non-Performing Assets of Private Sector Banks( As on March 31, 2001)
(Amount in Rs. crore)
Sr. Name of the Banks Agriculture Small Scale Others Priority Sector Public Sector Non-Priority Sector Total
No. Amount Per cent Amount Per cent Amount Per cent Amount Per cent Amount Per cent Amount Per centto total to total to total to total to total to total
1 2 3 4 5 6 7 8 9 10 11 12 13 14 15 (3+5+7) (9+11+1 3)
Old Private Sector Banks 295.12 6.13 800.14 16.63 496.22 10.31 1,591.48 33.08 123.37 2.56 3,095.97 64.35 4,810.82
1 The Bank of Rajasthan Ltd. 18.90 5.30 27.11 7.60 22.04 6.18 68.05 19.08 — — 288.59 80.92 356.64
2 The Benaras State Bank Ltd. 1.28 1.53 16.83 20.18 6.48 7.77 24.59 29.49 — — 58.80 70.51 83.39
3 Bharat Overseas Bank Ltd. 2.46 2.93 10.86 12.93 1.76 2.10 15.08 17.96 — — 68.89 82.04 83.97
4 The Catholic Syrian Bank Ltd. 5.14 2.73 39.95 21.19 46.50 24.67 91.59 48.59 — — 96.91 51.41 188.50
5 City Union Bank Ltd. 6.55 5.14 30.70 24.10 8.55 6.71 45.80 35.95 — — 81.61 64.05 127.41
6 Development Credit Bank Ltd 5.90 3.58 43.68 26.47 30.13 18.26 79.71 48.30 — — 85.32 51.70 165.03
7 Dhanalakshmi Bank Ltd. 0.45 0.33 14.73 10.92 21.06 15.61 36.24 26.86 — — 98.66 73.14 134.90
8 The Federal Bank Ltd. 56.44 8.28 79.90 11.72 81.74 11.99 218.08 31.98 10.43 1.53 453.47 66.49 681.98
9 The Ganesh Bank of Kurundwad Ltd. 1.08 9.09 2.00 16.84 1.27 10.69 4.35 36.62 — — 7.53 63.38 11.88
10 The Jammu & Kashmir Bank Ltd. 13.89 5.70 66.43 27.27 46.01 18.89 126.33 51.86 — — 117.25 48.14 243.58
11 The Karnataka Bank Ltd. 39.49 9.70 73.54 18.07 24.26 5.96 137.29 33.74 0.04 0.01 269.62 66.25 406.95
12 The Karur Vysya Bank Ltd. 3.49 2.12 33.37 20.27 10.70 6.50 47.56 28.88 — — 117.10 71.12 164.66
13 The Lakshmi Vilas Bank Ltd. 6.72 4.57 28.86 19.65 8.52 5.80 44.10 30.02 — — 102.80 69.98 146.90
14 Lord Krishna Bank Ltd. 2.98 2.15 17.28 12.47 1.95 1.41 22.21 16.03 — — 116.35 83.97 138.56
15 The Nainital Bank Ltd. 1.69 17.02 4.74 47.73 1.79 18.03 8.22 82.78 — — 1.71 17.22 9.93
16 The Nedungadi Bank Ltd. 9.76 3.21 58.90 19.36 46.32 15.23 114.98 37.80 — — 189.19 62.20 304.17
17 The Ratnakar Bank Ltd. 2.18 7.75 6.81 24.22 4.36 15.50 13.35 47.48 — — 14.77 52.52 28.12
18 SBI Commercial & International Bank Ltd. — — 7.88 7.98 — — 7.88 7.98 — — 90.88 92.02 98.76
19 The Sangli Bank Ltd. 19.28 25.28 15.69 20.57 8.13 10.66 43.10 56.51 0.10 0.13 33.07 43.36 76.27
20 The South Indian Bank Ltd. 21.97 5.50 72.43 18.13 42.23 10.57 136.63 34.21 — — 262.77 65.79 399.40
21 Tamilnad Mercantile Bank Ltd. 7.89 4.48 52.93 30.07 15.56 8.84 76.38 43.39 — — 99.64 56.61 176.02
22 The United Western Bank Ltd. 15.29 4.50 24.88 7.33 28.39 8.36 68.56 20.19 — — 271.02 79.81 339.58
23 The Vysya Bank Ltd. 52.29 11.77 70.64 15.90 38.47 8.66 161.40 36.33 112.80 25.39 170.02 38.27 444.22
New Private Sector Banks 27.35 1.71 200.59 12.54 15.29 0.96 243.23 15.21 — — 1,356.29 84.79 1,599.52
24 Bank of Punjab Ltd. 0.86 1.45 14.87 25.05 0.68 1.15 16.41 27.64 — — 42.95 72.36 59.36
25 Centurion Bank Ltd. — — 0.49 0.32 — — 0.49 0.32 — — 154.09 99.68 154.58
26 Global Trust Bank 6.53 2.74 17.98 7.54 — — 24.51 10.28 — — 213.80 89.72 238.31
27 HDFC Bank — — 13.47 9.73 — — 13.47 9.73 — — 124.96 90.27 138.43
28 ICICI Bank 15.63 3.82 89.69 21.92 — — 105.32 25.73 — — 303.93 74.27 409.25
29 IDBI Bank — — — — — — — — — — 120.11 100.00 120.11
30 IndusInd Bank Ltd. 0.83 0.32 52.11 19.87 0.40 0.15 53.34 20.33 — — 208.97 79.67 262.31
31 UTI Bank Ltd. 3.50 1.61 11.98 5.52 14.21 6.54 29.69 13.67 — — 187.48 86.33 217.17
Private Sector Banks 322.47 5.03 1,000.73 15.61 511.51 7.98 1,834.71 28.62 123.37 1.92 4,452.26 69.45 6,410.34
Note: Data is based on domestic operations of respective banks.Source: Based on off-site returns.

201
Appendix
Appendix Table II.11(A): Capital Adequacy Ratio - Public Sector Banks
(Per cent)
Sr.No. Name of the Bank 1996-97 1997-98 1998-99 1999-2000 2000-01
1 2 3 4 5 6 7
Nationalised Banks
1 Allahabad Bank 11.00 11.64 10.38 11.51 10.50
2 Andhra Bank 12.05 12.37 11.02 13.36 13.40
3 Bank of Baroda 11.80 12.05 13.30 12.10 12.80
4 Bank of India 10.26 9.11 10.55 10.57 12.23
5 Bank of Maharashtra 9.07 10.90 9.76 11.66 10.64
6 Canara Bank 10.17 9.54 10.96 9.64 9.84
7 Central Bank of India 9.41 10.40 11.88 11.18 10.02
8 Corporation Bank 11.30 16.90 13.20 12.80 13.30
9 Dena Bank 10.81 11.88 11.14 11.63 7.73
10 Indian Bank -18.81 1.41 Negative Negative Negative
11 Indian Overseas Bank 10.07 9.34 10.15 9.15 10.24
12 Oriental Bank of Commerce 17.53 15.28 14.10 12.72 11.81
13 Punjab & Sind Bank 9.23 11.39 10.94 11.57 11.42
14 Punjab National Bank 9.15 8.81 10.79 10.31 10.24
15 Syndicate Bank 8.80 10.49 9.57 11.45 11.72
16 UCO Bank 3.16 9.07 9.63 9.15 9.05
17 Union Bank of India 10.53 10.86 10.09 11.42 10.86
18 United Bank of India 8.23 8.40 9.60 9.60 10.40
19 Vijaya Bank 11.53 10.30 10.00 10.61 11.50
State Bank Group
20 State Bank of India 12.17 14.58 12.51 11.49 12.79
21 State Bank of Bikaner & Jaipur 8.82 10.65 12.26 12.35 12.39
22 State Bank of Hyderabad 10.84 10.83 10.65 10.86 12.28
23 State Bank of Indore 9.31 9.83 12.35 11.26 12.73
24 State Bank of Mysore 10.80 11.61 10.23 11.50 11.16
25 State Bank of Patiala 11.25 13.24 12.47 12.60 12.37
26 State Bank of Saurashtra 12.14 18.14 14.35 14.48 13.89
27 State Bank of Travancore 8.17 11.48 10.27 11.09 11.79
Source : Balance sheets of respective banks.

202
Report on Trend and Progress of Banking in India, 2000-01
Appendix Table II.11(B): Capital Adequacy Ratio - Private Sector Banks
(Per cent)
Sr. No. Name of the Bank 1996-97 1997-98 1998-99 1999-2000 2000-01
1 2 3 4 5 6 7
Old Private Sector Banks
1 The Bank of Rajasthan Ltd. 10.13 5.54 0.83 5.73 10.57
2 The Benares State Bank Ltd. 2.99 4.12 Negative Negative Negative
3 Bharat Overseas Bank Ltd. 12.51 13.00 13.70 12.68 14.43
4 The Catholic Syrian Bank Ltd. 2.51 3.04 6.06 5.94 6.08
5 City Union Bank Ltd. 9.47 11.60 14.30 13.33 13.59
6 Development Credit Bank Ltd. 23.47 19.79 16.90 11.34 11.28
7 Dhanalakshmi Bank Ltd. 9.75 11.39 10.06 10.02 9.69
8 The Federal Bank Ltd. 9.22 9.43 10.32 11.33 10.29
9 The Ganesh Bank of Kurundwad Ltd. 8.00 8.04 8.26 9.14 9.11
10 The Jammu & Kashmir Bank Ltd. 15.58 20.48 24.48 18.82 17.44
11 The Karnataka Bank Ltd. 12.27 13.23 10.85 11.04 11.37
12 The Karur Vysya Bank Ltd. 12.76 14.47 14.53 15.16 15.56
13 The Lakshmi Vilas Bank Ltd. 10.64 10.35 9.64 10.45 10.21
14 Lord Krishna Bank Ltd. 5.40 8.35 11.85 11.25 12.90
15 The Nainital Bank Ltd. 9.86 9.46 13.81 15.11 15.81
16 The Nedungadi Bank Ltd. 11.97 12.85 10.24 9.04 Negative
17 The Ratnakar Bank Ltd. 9.85 10.41 9.72 11.56 10.00
18 The Sangli Bank Ltd. 8.03 10.98 11.58 12.13 11.47
19 SBI Commercial & International Bank Ltd. 30.59 27.69 28.90 24.32 19.85
20 The South Indian Bank Ltd. 8.27 9.40 10.40 10.41 11.17
21 Tamilnad Mercantile Bank Ltd. 15.65 19.11 18.40 18.02 17.59
22 The United Western Bank Ltd. 10.20 9.87 11.64 11.94 9.59
23 The Vysya Bank Ltd. 14.21 12.48 10.63 12.24 12.05
New Private Sector Banks
24 Bank of Punjab Ltd. 18.65 16.34 14.64 9.81 11.02
25 Centurion Bank Ltd. 27.00 20.00 8.45 15.62 16.49
26 Global Trust Bank 10.16 10.28 11.97 13.68 12.71
27 HDFC Bank 13.50 13.92 11.86 12.19 11.09
28 ICICI Bank 13.04 13.48 11.06 19.64 11.57
29 IDBI Bank 17.90 9.82 11.26 11.80 11.72
30 IndusInd Bank Ltd. 12.90 17.91 15.16 13.24 15.00
31 UTI Bank Ltd. 14.43 9.72 11.64 11.37 9.00
Source : Balance sheets of respective banks.
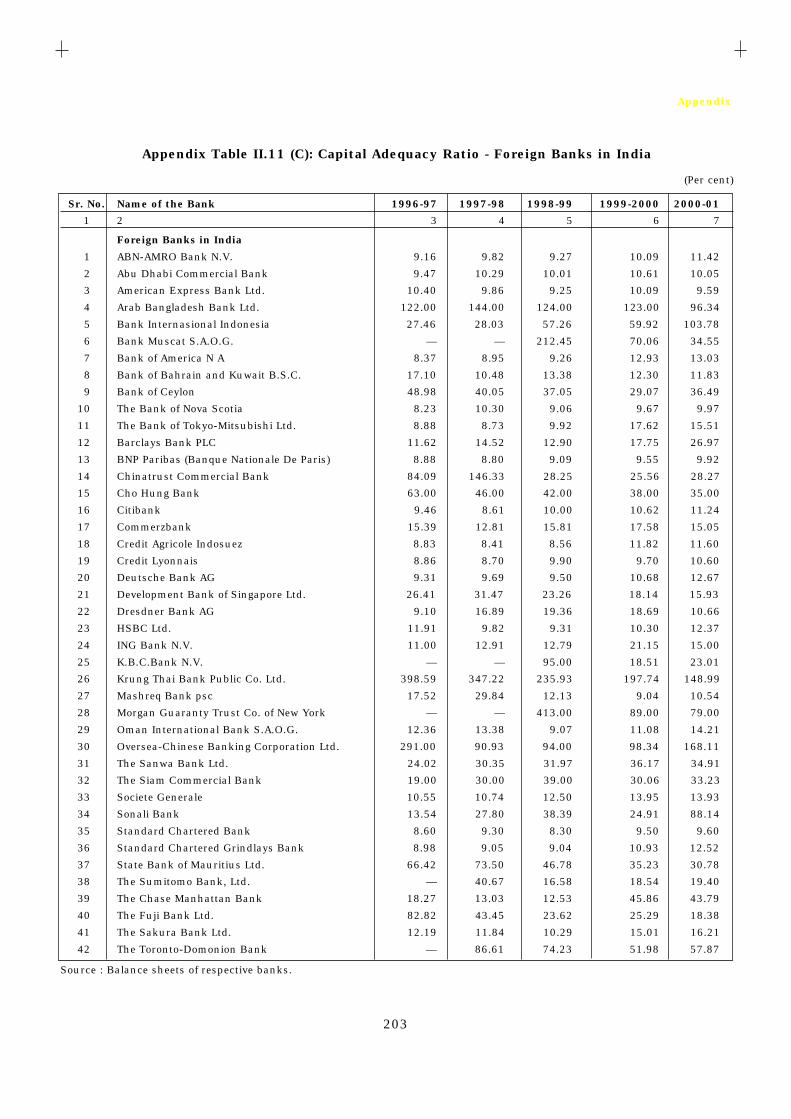
203
Appendix
Appendix Table II.11 (C): Capital Adequacy Ratio - Foreign Banks in India
(Per cent)
Sr. No. Name of the Bank 1996-97 1997-98 1998-99 1999-2000 2000-01
1 2 3 4 5 6 7
Foreign Banks in India
1 ABN-AMRO Bank N.V. 9.16 9.82 9.27 10.09 11.42
2 Abu Dhabi Commercial Bank 9.47 10.29 10.01 10.61 10.05
3 American Express Bank Ltd. 10.40 9.86 9.25 10.09 9.59
4 Arab Bangladesh Bank Ltd. 122.00 144.00 124.00 123.00 96.34
5 Bank Internasional Indonesia 27.46 28.03 57.26 59.92 103.78
6 Bank Muscat S.A.O.G. — — 212.45 70.06 34.55
7 Bank of America N A 8.37 8.95 9.26 12.93 13.03
8 Bank of Bahrain and Kuwait B.S.C. 17.10 10.48 13.38 12.30 11.83
9 Bank of Ceylon 48.98 40.05 37.05 29.07 36.49
10 The Bank of Nova Scotia 8.23 10.30 9.06 9.67 9.97
11 The Bank of Tokyo-Mitsubishi Ltd. 8.88 8.73 9.92 17.62 15.51
12 Barclays Bank PLC 11.62 14.52 12.90 17.75 26.97
13 BNP Paribas (Banque Nationale De Paris) 8.88 8.80 9.09 9.55 9.92
14 Chinatrust Commercial Bank 84.09 146.33 28.25 25.56 28.27
15 Cho Hung Bank 63.00 46.00 42.00 38.00 35.00
16 Citibank 9.46 8.61 10.00 10.62 11.24
17 Commerzbank 15.39 12.81 15.81 17.58 15.05
18 Credit Agricole Indosuez 8.83 8.41 8.56 11.82 11.60
19 Credit Lyonnais 8.86 8.70 9.90 9.70 10.60
20 Deutsche Bank AG 9.31 9.69 9.50 10.68 12.67
21 Development Bank of Singapore Ltd. 26.41 31.47 23.26 18.14 15.93
22 Dresdner Bank AG 9.10 16.89 19.36 18.69 10.66
23 HSBC Ltd. 11.91 9.82 9.31 10.30 12.37
24 ING Bank N.V. 11.00 12.91 12.79 21.15 15.00
25 K.B.C.Bank N.V. — — 95.00 18.51 23.01
26 Krung Thai Bank Public Co. Ltd. 398.59 347.22 235.93 197.74 148.99
27 Mashreq Bank psc 17.52 29.84 12.13 9.04 10.54
28 Morgan Guaranty Trust Co. of New York — — 413.00 89.00 79.00
29 Oman International Bank S.A.O.G. 12.36 13.38 9.07 11.08 14.21
30 Oversea-Chinese Banking Corporation Ltd. 291.00 90.93 94.00 98.34 168.11
31 The Sanwa Bank Ltd. 24.02 30.35 31.97 36.17 34.91
32 The Siam Commercial Bank 19.00 30.00 39.00 30.06 33.23
33 Societe Generale 10.55 10.74 12.50 13.95 13.93
34 Sonali Bank 13.54 27.80 38.39 24.91 88.14
35 Standard Chartered Bank 8.60 9.30 8.30 9.50 9.60
36 Standard Chartered Grindlays Bank 8.98 9.05 9.04 10.93 12.52
37 State Bank of Mauritius Ltd. 66.42 73.50 46.78 35.23 30.78
38 The Sumitomo Bank, Ltd. — 40.67 16.58 18.54 19.40
39 The Chase Manhattan Bank 18.27 13.03 12.53 45.86 43.79
40 The Fuji Bank Ltd. 82.82 43.45 23.62 25.29 18.38
41 The Sakura Bank Ltd. 12.19 11.84 10.29 15.01 16.21
42 The Toronto-Domonion Bank — 86.61 74.23 51.98 57.87
Source : Balance sheets of respective banks.

204
Report on Trend and Progress of Banking in India, 2000-01
Appendix Table II.12: Bank Group and Population Group-wise Distributionof Commercial Bank Branches in India
Number of Branches
Bank Group No. of As on June 30, 2000 @ As on June 30, 2001 @Banks#
Rural Semi- Urban Metropo- Total Rural Semi- Urban Metropo- Totalurban litan urban litan
1 2 3 4 5 6 7 8 9 10 11 12
1. State Bank of 1 4,110 2,432 1,406 985 8,933 4,111 2,433 1,408 990 8,942India (46.0) (27.2) (15.7) (11.0) (100.0) (46.0) (27.2) (15.7) (11.1) (100.0)
2. Associate 7 1,404 1,537 806 676 4,423 1,406 1,541 811 686 4,444Banks of SBI (31.7) (34.8) (18.2) (15.3) (100.0) (31.6) (34.7) (18.2) (15.4) (100.0)
3. Nationalised 19 13,867 6,828 6,384 5,489 32,568 13,866 6,842 6,419 5,508 32,635Banks (42.6) (21.0) (19.6) (16.9) (100.0) (42.5) (21.0) (19.7) (16.9) (100.0)
4. Indian Private 31 1,135 1,683 1,178 1,014 5,010 1,140 1,704 1,220 1,067 5,131Sector Banks (22.7) (33.6) (23.5) (20.2) (100.0) (22.2) (33.2) (23.8) (20.8) (100.0)
5. Foreign Banks 41 — 2 14 170 186 — 2 15 175 192in India — (1.1) (7.5) (91.4) (100.0) — (1.0) (7.8) (91.1) (100.0)
6. Regional 196 12,133 1,949 342 12 14,436 12,108 1,987 346 15 14,456Rural Banks (84.0) (13.5) (2.4) (0.1) (100.0) (83.8) (13.7) (2.4) (0.1) (100.0)
Total 295 32,649 14,431 10,130 8,346 65,556 32,631 14,509 10,219 8,441 65,800(49.8) (22.0) (15.5) (12.7) (100.0) (49.6) (22.1) (15.5) (12.8) (100.0)
# As on June 30, 2001.
@ Population group-wise classification of branches as per 1991 Census.— Negligible.
Notes: 1. Figures in brackets indicate percentage to total in each group.2. Bank branches exclude administrative offices.3. Data for June 2000 are revised.
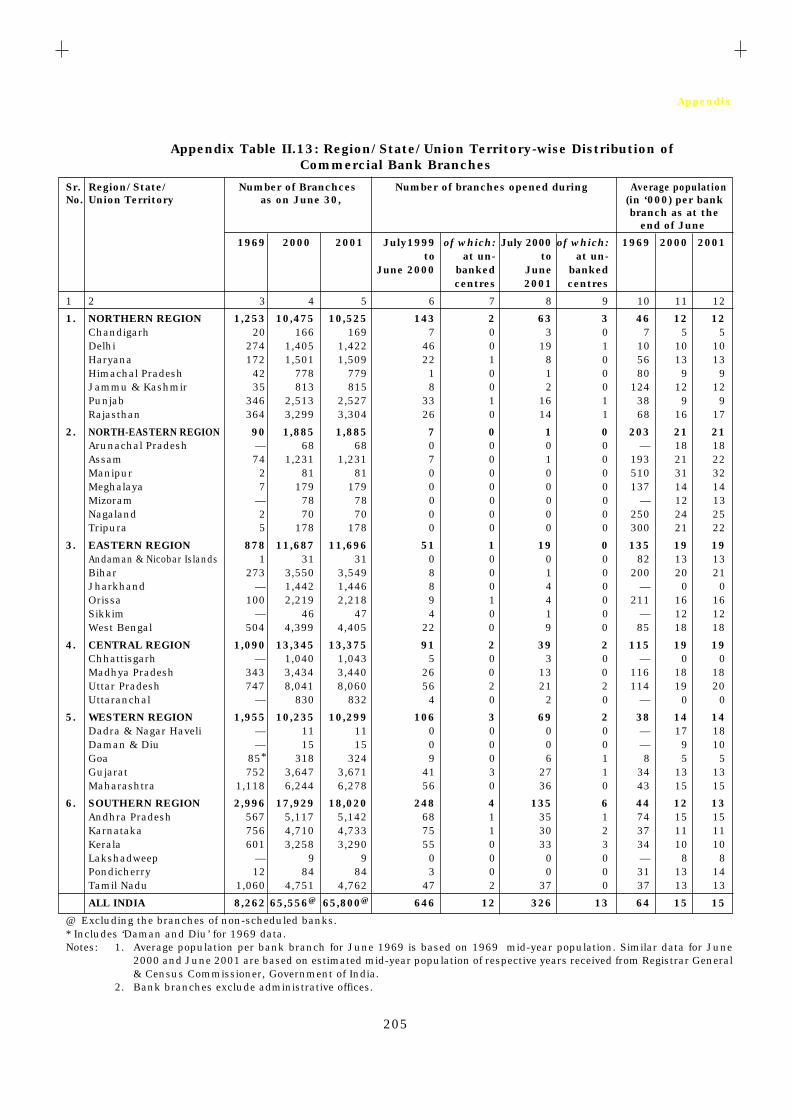
205
Appendix
Appendix Table II.13: Region/State/Union Territory-wise Distribution ofCommercial Bank Branches
Sr. Region/State/ Number of Branchces Number of branches opened during Average populationNo. Union Territory as on June 30, (in ‘000) per bank
branch as at theend of June
1969 2000 2001 July1999 of which: July 2000 of which: 1969 2000 2001 to at un- to at un-
June 2000 banked June banked centres 2001 centres
1 2 3 4 5 6 7 8 9 10 11 12
1. NORTHERN REGION 1,253 10,475 10,525 143 2 63 3 46 12 12Chandigarh 20 166 169 7 0 3 0 7 5 5Delhi 274 1,405 1,422 46 0 19 1 10 10 10Haryana 172 1,501 1,509 22 1 8 0 56 13 13Himachal Pradesh 42 778 779 1 0 1 0 80 9 9Jammu & Kashmir 35 813 815 8 0 2 0 124 12 12Punjab 346 2,513 2,527 33 1 16 1 38 9 9Rajasthan 364 3,299 3,304 26 0 14 1 68 16 17
2. NORTH-EASTERN REGION 90 1,885 1,885 7 0 1 0 203 21 21Arunachal Pradesh — 68 68 0 0 0 0 — 18 18Assam 74 1,231 1,231 7 0 1 0 193 21 22Manipur 2 81 81 0 0 0 0 510 31 32Meghalaya 7 179 179 0 0 0 0 137 14 14Mizoram — 78 78 0 0 0 0 — 12 13Nagaland 2 70 70 0 0 0 0 250 24 25Tripura 5 178 178 0 0 0 0 300 21 22
3. EASTERN REGION 878 11,687 11,696 51 1 19 0 135 19 19Andaman & Nicobar Islands 1 31 31 0 0 0 0 82 13 13Bihar 273 3,550 3,549 8 0 1 0 200 20 21Jharkhand — 1,442 1,446 8 0 4 0 — 0 0Orissa 100 2,219 2,218 9 1 4 0 211 16 16Sikkim — 46 47 4 0 1 0 — 12 12West Bengal 504 4,399 4,405 22 0 9 0 85 18 18
4. CENTRAL REGION 1,090 13,345 13,375 91 2 39 2 115 19 19Chhattisgarh — 1,040 1,043 5 0 3 0 — 0 0Madhya Pradesh 343 3,434 3,440 26 0 13 0 116 18 18Uttar Pradesh 747 8,041 8,060 56 2 21 2 114 19 20Uttaranchal — 830 832 4 0 2 0 — 0 0
5. WESTERN REGION 1,955 10,235 10,299 106 3 69 2 38 14 14Dadra & Nagar Haveli — 11 11 0 0 0 0 — 17 18Daman & Diu — 15 15 0 0 0 0 — 9 10Goa 85* 318 324 9 0 6 1 8 5 5Gujarat 752 3,647 3,671 41 3 27 1 34 13 13Maharashtra 1,118 6,244 6,278 56 0 36 0 43 15 15
6. SOUTHERN REGION 2,996 17,929 18,020 248 4 135 6 44 12 13Andhra Pradesh 567 5,117 5,142 68 1 35 1 74 15 15Karnataka 756 4,710 4,733 75 1 30 2 37 11 11Kerala 601 3,258 3,290 55 0 33 3 34 10 10Lakshadweep — 9 9 0 0 0 0 — 8 8Pondicherry 12 84 84 3 0 0 0 31 13 14Tamil Nadu 1,060 4,751 4,762 47 2 37 0 37 13 13
ALL INDIA 8,262 65,556@ 65,800@ 646 12 326 13 64 15 15
@ Excluding the branches of non-scheduled banks.* Includes ‘Daman and Diu’ for 1969 data.Notes: 1. Average population per bank branch for June 1969 is based on 1969 mid-year population. Similar data for June
2000 and June 2001 are based on estimated mid-year population of respective years received from Registrar General& Census Commissioner, Government of India.
2. Bank branches exclude administrative offices.
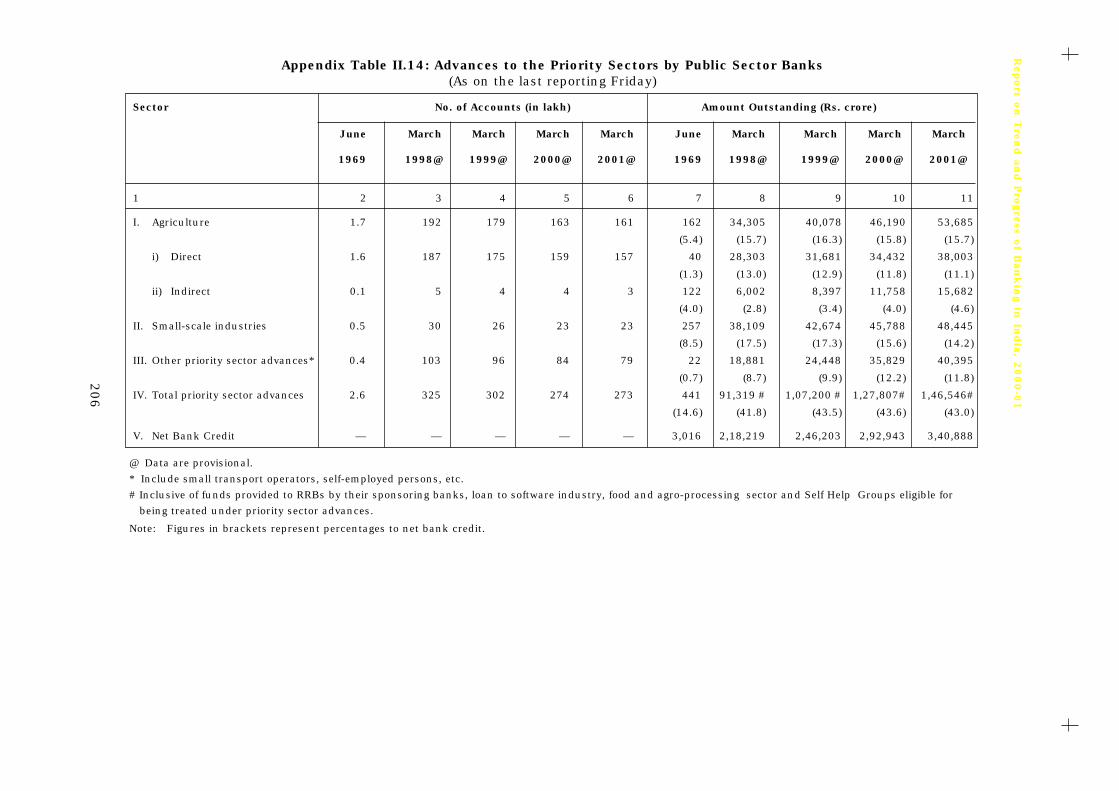
206
Report o
n T
ren
d a
nd P
rogre
ss of B
an
kin
g in
India
, 20
00
-01
Appendix Table II.14: Advances to the Priority Sectors by Public Sector Banks(As on the last reporting Friday)
Sector No. of Accounts (in lakh) Amount Outstanding (Rs. crore)
June March March March March June March March March March
1969 1998@ 1999@ 2000@ 2001@ 1969 1998@ 1999@ 2000@ 2001@
1 2 3 4 5 6 7 8 9 10 11
I. Agriculture 1.7 192 179 163 161 162 34,305 40,078 46,190 53,685
(5.4) (15.7) (16.3) (15.8) (15.7)
i) Direct 1.6 187 175 159 157 40 28,303 31,681 34,432 38,003
(1.3) (13.0) (12.9) (11.8) (11.1)
ii) Indirect 0.1 5 4 4 3 122 6,002 8,397 11,758 15,682
(4.0) (2.8) (3.4) (4.0) (4.6)
II. Small-scale industries 0.5 30 26 23 23 257 38,109 42,674 45,788 48,445
(8.5) (17.5) (17.3) (15.6) (14.2)
III. Other priority sector advances* 0.4 103 96 84 79 22 18,881 24,448 35,829 40,395
(0.7) (8.7) (9.9) (12.2) (11.8)
IV. Total priority sector advances 2.6 325 302 274 273 441 91,319 # 1,07,200 # 1,27,807# 1,46,546#
(14.6) (41.8) (43.5) (43.6) (43.0)
V. Net Bank Credit — — — — — 3,016 2,18,219 2,46,203 2,92,943 3,40,888
@ Data are provisional.
* Include small transport operators, self-employed persons, etc.
# Inclusive of funds provided to RRBs by their sponsoring banks, loan to software industry, food and agro-processing sector and Self Help Groups eligible for
being treated under priority sector advances.
Note: Figures in brackets represent percentages to net bank credit.

207
Appen
dix
Appendix Table II.15(A): Advances of Public Sector Banks to Agriculture and Weaker Sections(As on the last reporting Friday of March 2001)
(Amount in Rs. crore)
Sr. Name of the bank Direct agricultural Indirect agricultural Total agricultural Weaker Total Priority SectorNo. advances advances advances Sections advances
Amount Per cent to Amount Per cent to Amount Per cent to Amount Per cent to Amount Per cent toNBC NBC NBC NBC NBC
(Target- (Target- (Target- 18 per cent) 10 per cent) 40 per cent)
1 2 3 4 5 6 7 8 9 10 11 12
1 Allahabad Bank 978.98 10.32 615.00 6.49 1,593.98 14.82 610.04 6.43 4,192.40 44.21
2 Andhra Bank 911.41 13.67 137.48 2.06 1,048.89 15.73 782.90 11.74 2,774.02 41.60
3 Bank of Baroda 2,168.59 12.12 864.22 4.83 3,032.81 16.62 1,266.38 7.08 8,762.50 48.98
4 Bank of India 2,261.93 11.21 768.16 3.81 3,030.09 15.02 1,026.80 5.09 8,731.00 43.28
5 Bank of Maharashtra 722.70 10.75 95.56 1.42 818.26 12.17 394.32 5.86 2,763.44 41.09
6 Canara Bank 3,120.31 14.14 390.45 1.77 3,510.76 15.91 1,911.30 8.66 9,049.85 41.02
7 Central Bank of India 1,671.31 9.37 873.60 4.90 2,544.91 13.87 912.39 5.12 7,839.65 43.95
8 Corporation Bank 444.28 6.80 274.99 4.21 719.27 11.01 161.97 2.48 3,178.39 48.64
9 Dena Bank 614.60 8.51 544.39 7.54 1,158.99 13.01 263.14 3.64 3,163.73 43.80
10 Indian Bank 1,049.38 12.99 404.24 5.01 1,453.62 17.49 743.70 9.21 3,282.77 40.65
11 Indian Overseas Bank 1,238.00 14.52 371.00 4.35 1,609.00 18.87 1,060.00 12.43 4,209.00 49.35
12 Oriental Bank of Commerce 964.41 8.40 705.47 6.14 1,669.88 12.90 480.65 4.19 4,819.16 41.97
13 Punjab National Bank 2,837.47 10.44 1,012.17 3.73 3,849.64 14.17 2,399.93 8.83 12,110.88 44.57
14 Punjab & Sind Bank 463.19 9.49 386.80 7.92 849.99 13.99 268.95 5.51 2,276.81 46.63
15 Syndicate Bank 1,460.00 15.13 290.00 3.01 1,750.00 18.13 980.00 10.16 4,662.00 48.31
16 Union Bank of India 1,393.95 9.20 656.92 4.34 2,050.87 13.53 784.23 5.18 6,759.14 44.61
17 United Bank of India 547.00 8.57 218.00 3.42 765.00 11.99 390.00 6.11 2,400.00 37.61
18 UCO Bank 630.00 7.07 329.00 3.69 959.00 10.77 439.00 4.93 3,009.00 33.79
19 Vijaya Bank 604.53 12.61 146.92 3.06 751.45 15.67 350.61 7.31 2,046.68 42.68
20 State Bank of India 9,488.39 10.65 5,493.92 6.17 14,982.31 15.15 6,847.25 7.68 35,899.14 40.29
21 State Bank of Bikaner & Jaipur 584.77 11.72 233.99 4.69 818.76 16.22 383.36 7.68 2,309.27 46.27
22 State Bank of Hyderabad 942.81 14.12 271.49 4.07 1,214.30 18.19 495.65 7.42 2,914.30 43.65
23 State Bank of Indore 538.09 15.91 71.10 2.10 609.19 18.02 218.89 6.47 1,496.54 44.26
24 State Bank of Mysore 464.33 12.66 107.36 2.93 571.69 15.58 431.25 11.75 1,642.93 44.78
25 State Bank of Patiala 867.00 13.41 269.00 4.16 1,136.00 17.58 647.00 10.01 2,603.10 40.28
26 State Bank of Saurashtra 577.70 16.06 36.38 1.01 614.08 17.07 144.57 4.02 1,532.88 42.61
27 State Bank of Travancore 458.09 13.55 114.53 3.39 572.62 16.94 411.05 12.16 2,117.38 62.64
Total 38,003.22 11.15 15,682.14 4.60 53,685.36 15.65 24,805.33 7.28 1,46,545.96 42.99
Data are Provisional. NBC net bank credit.
Source: Data furnished by respective banks.

208
Report on Trend and Progress of Banking in India, 2000-01
Appendix Table II.16: Advances to the Priority Sectors byPrivate Sector Banks
(As on the last reporting Friday)(Amount in Rs. crore)
Sector March 1999 March 2000* March 2001*
Amount Percentage Amount Percentage Amount Percentageto Net bank to Net bank to Net bank
credit credit credit
1 2 3 4 5 6 7
I. Agriculture 3,257 9.5 4,239 9.1 5,394 9.6
II. Small-scale industries 6,451 18.9 7,313 15.7 8,158 14.4
III. Other priority sectors 4,447 13.0 6,467 13.9 7,998 14.2
Total (I+II+III) 14,155 41.4 18,019 38.7 21,550 38.2
* Provisional.
Appendix Table: II.15(B): Non-Performing Assets in Advances to Weaker Sectionunder Priority Sector - Public Sector Banks
(As on March 31, 2001)(Amount in Rs. crore)
Sr. Name of the Bank Advances to Weaker Section
No. Total of which NPAs
Amount Per cent
1 2 3 4 5
1 Allahabad Bank 644.36 111.86 17.362 Andhra Bank 692.03 135.93 19.643 Bank of Baroda 1,266.38 328.11 25.914 Bank of India 914.96 188.46 20.605 Bank of Maharashtra 414.52 108.78 26.246 Canara Bank 1,688.29 411.43 24.377 Central Bank of India 838.00 249.83 29.818 Corporation Bank 161.97 41.03 25.339 Dena Bank N.A. N.A. N.A.10 Indian Bank 683.44 155.55 22.7611 Indian Overseas Bank 1,074.71 112.40 10.4612 Oriental Bank of Commerce 480.65 15.70 3.2713 Punjab National Bank 2,427.30 360.20 14.8414 Punjab & Sind Bank 268.95 32.77 12.1815 Syndicate Bank 987.48 133.43 13.5116 Union Bank of India 784.30 272.15 34.7017 United Bank of India 450.00 202.00 44.8918 UCO Bank 476.09 229.45 48.1919 Vijaya Bank N.A. N.A. N.A.20 State Bank of India 7,791.00 2,144.00 27.5221 State Bank of Bikaner & Jaipur 406.78 50.21 12.3422 State Bank of Hyderabad 614.55 121.21 19.7223 State Bank of Indore 193.70 51.56 26.6224 State Bank of Mysore 431.25 64.00 14.8425 State Bank of Patiala 653.03 30.26 4.6326 State Bank of Saurashtra 144.57 10.23 7.0827 State Bank of Travancore 411.05 45.22 11.00
Total 24,899.36 5,605.77 22.51
Data are Provisional. N.A. Not Available.Source: Data furnished by respective banks.
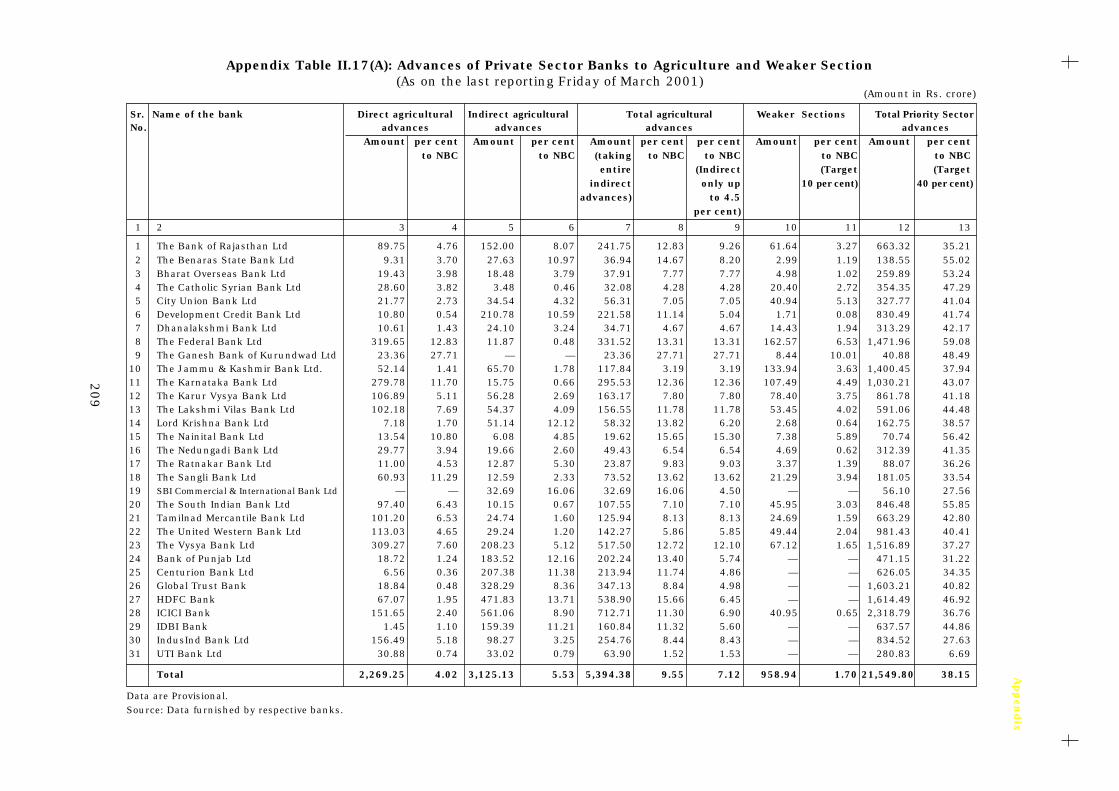
209
Appen
dix
Appendix Table II.17(A): Advances of Private Sector Banks to Agriculture and Weaker Section(As on the last reporting Friday of March 2001)
Sr. Name of the bank Direct agricultural Indirect agricultural Total agricultural Weaker Sections Total Priority SectorNo. advances advances advances advances
Amount per cent Amount per cent Amount per cent per cent Amount per cent Amount per centto NBC to NBC (taking to NBC to NBC to NBC to NBC
entire (Indirect (Target (Targetindirect only up 10 per cent) 40 per cent)
advances) to 4.5per cent)
1 2 3 4 5 6 7 8 9 10 11 12 13
1 The Bank of Rajasthan Ltd 89.75 4.76 152.00 8.07 241.75 12.83 9.26 61.64 3.27 663.32 35.212 The Benaras State Bank Ltd 9.31 3.70 27.63 10.97 36.94 14.67 8.20 2.99 1.19 138.55 55.023 Bharat Overseas Bank Ltd 19.43 3.98 18.48 3.79 37.91 7.77 7.77 4.98 1.02 259.89 53.244 The Catholic Syrian Bank Ltd 28.60 3.82 3.48 0.46 32.08 4.28 4.28 20.40 2.72 354.35 47.295 City Union Bank Ltd 21.77 2.73 34.54 4.32 56.31 7.05 7.05 40.94 5.13 327.77 41.046 Development Credit Bank Ltd 10.80 0.54 210.78 10.59 221.58 11.14 5.04 1.71 0.08 830.49 41.747 Dhanalakshmi Bank Ltd 10.61 1.43 24.10 3.24 34.71 4.67 4.67 14.43 1.94 313.29 42.178 The Federal Bank Ltd 319.65 12.83 11.87 0.48 331.52 13.31 13.31 162.57 6.53 1,471.96 59.089 The Ganesh Bank of Kurundwad Ltd 23.36 27.71 — — 23.36 27.71 27.71 8.44 10.01 40.88 48.49
10 The Jammu & Kashmir Bank Ltd. 52.14 1.41 65.70 1.78 117.84 3.19 3.19 133.94 3.63 1,400.45 37.9411 The Karnataka Bank Ltd 279.78 11.70 15.75 0.66 295.53 12.36 12.36 107.49 4.49 1,030.21 43.0712 The Karur Vysya Bank Ltd 106.89 5.11 56.28 2.69 163.17 7.80 7.80 78.40 3.75 861.78 41.1813 The Lakshmi Vilas Bank Ltd 102.18 7.69 54.37 4.09 156.55 11.78 11.78 53.45 4.02 591.06 44.4814 Lord Krishna Bank Ltd 7.18 1.70 51.14 12.12 58.32 13.82 6.20 2.68 0.64 162.75 38.5715 The Nainital Bank Ltd 13.54 10.80 6.08 4.85 19.62 15.65 15.30 7.38 5.89 70.74 56.4216 The Nedungadi Bank Ltd 29.77 3.94 19.66 2.60 49.43 6.54 6.54 4.69 0.62 312.39 41.3517 The Ratnakar Bank Ltd 11.00 4.53 12.87 5.30 23.87 9.83 9.03 3.37 1.39 88.07 36.2618 The Sangli Bank Ltd 60.93 11.29 12.59 2.33 73.52 13.62 13.62 21.29 3.94 181.05 33.5419 SBI Commercial & International Bank Ltd — — 32.69 16.06 32.69 16.06 4.50 — — 56.10 27.5620 The South Indian Bank Ltd 97.40 6.43 10.15 0.67 107.55 7.10 7.10 45.95 3.03 846.48 55.8521 Tamilnad Mercantile Bank Ltd 101.20 6.53 24.74 1.60 125.94 8.13 8.13 24.69 1.59 663.29 42.8022 The United Western Bank Ltd 113.03 4.65 29.24 1.20 142.27 5.86 5.85 49.44 2.04 981.43 40.4123 The Vysya Bank Ltd 309.27 7.60 208.23 5.12 517.50 12.72 12.10 67.12 1.65 1,516.89 37.2724 Bank of Punjab Ltd 18.72 1.24 183.52 12.16 202.24 13.40 5.74 — — 471.15 31.2225 Centurion Bank Ltd 6.56 0.36 207.38 11.38 213.94 11.74 4.86 — — 626.05 34.3526 Global Trust Bank 18.84 0.48 328.29 8.36 347.13 8.84 4.98 — — 1,603.21 40.8227 HDFC Bank 67.07 1.95 471.83 13.71 538.90 15.66 6.45 — — 1,614.49 46.9228 ICICI Bank 151.65 2.40 561.06 8.90 712.71 11.30 6.90 40.95 0.65 2,318.79 36.7629 IDBI Bank 1.45 1.10 159.39 11.21 160.84 11.32 5.60 — — 637.57 44.8630 IndusInd Bank Ltd 156.49 5.18 98.27 3.25 254.76 8.44 8.43 — — 834.52 27.6331 UTI Bank Ltd 30.88 0.74 33.02 0.79 63.90 1.52 1.53 — — 280.83 6.69
Total 2,269.25 4.02 3,125.13 5.53 5,394.38 9.55 7.12 958.94 1.70 21,549.80 38.15
Data are Provisional.Source: Data furnished by respective banks.
(Amount in Rs. crore)

210
Report on Trend and Progress of Banking in India, 2000-01
Appendix Table: II.17(B): Non-Performing Assets in Advances to Weaker Sectionsunder Priority Sector - Private Sector Banks
(As on March 31, 2001)
Sr. Name of the Bank Advances to Weaker Section
No. Total of which NPAs
Amount Per cent
1 2 3 4 5
1 The Bank of Rajasthan Ltd 60.16 18.49 30.732 The Benaras State Bank Ltd 2.99 2.84 94.983 Bharat Overseas Bank Ltd 4.98 0.84 16.874 The Catholic Syrian Bank Ltd 18.40 12.37 67.235 City Union Bank Ltd 40.84 2.95 7.226 Development Credit Bank Ltd 1.71 0.01 0.437 Dhanalakshmi Bank Ltd 14.43 0.46 3.198 The Federal Bank Ltd 162.57 29.84 18.369 The Ganesh Bank of Kurundwad Ltd 7.85 0.44 5.6110 The Jammu & Kashmir Bank Ltd. 133.94 41.51 30.9911 The Karnataka Bank Ltd 107.49 10.70 9.9512 The Karur Vysya Bank Ltd 78.40 2.01 2.5613 The Lakshmi Vilas Bank Ltd 53.45 1.68 3.1414 Lord Krishna Bank Ltd 2.78 0.45 16.1915 The Nainital Bank Ltd 7.38 0.88 11.9216 The Nedungadi Bank Ltd 4.69 2.28 48.6117 The Ratnakar Bank Ltd 3.34 0.51 15.2718 The Sangli Bank Ltd 21.29 5.29 24.8519 SBI Commercial & International Bank Ltd — — —20 The South Indian Bank Ltd 45.95 13.61 29.6221 Tamilnad Mercantile Bank Ltd 17.31 2.25 13.0022 The United Western Bank Ltd 49.71 6.27 12.6123 The Vysya Bank Ltd 67.13 20.06 29.8824 Bank of Punjab Ltd * * 10.0025 Centurion Bank Ltd — — —26 Global Trust Bank — — —27 HDFC Bank — — —28 ICICI Banking 40.95 11.13 27.1829 IDBI Bank 0.02 0.01 61.9030 IndusInd Bank Ltd — — —31 UTI Bank Ltd — — —
Total 947.77 186.88 19.72
Data are Provisional. — Nil* Advances to weaker sections were Rs. 40,000 of which, Rs. 4,000 were NPAsSource: Data furnished by respective banks.
(Amount in Rs. crore)
Appendix Table II.18 : Advances to the Priority Sectors by Foreign Banks in India (As on the last reporting Friday)
(Amount in Rs.crore)
March 1999 March 2000* March 2001*
Sector Amount Percentage Amount Percentage Amount Percentageto Net bank to Net bank to Net bank
credit credit credit
1 2 3 4 5 6 7
I. Export Credit 5,678 25.0 6,372 23.0 6,863 20.0
II. Small-scale industries 2,460 11.0 2,871 10.0 3,716 11.0
Total Priority Sector Advances 8,270 37.0 9,699 35.0 11,835 34.0
* Provisional.

211
Appendix
Appendix Table III.1: Progress of Co-operative Credit Movement in India
(Amount in Rs. crore, ratio in per cent)
Type of Item 1997-98 1998-99 1999-2000 2000-01Institution
1 2 3 4 5 6 7
1 Urban Number 1,502 1,590 1,784 1,826Co-operative Owned Funds 5,985 7,322 9,314 10,425Banks Deposits 40,692 52,681 71,189 80,009(UCBs) Borrowings 886 1,041 1,475 1,589
Working Capital 52,229 67,074 90,302 1,00,802Loans Outstanding 27,807 34,214 45,995 51,680C-D Ratio 68.3 64.9 64.6 64.6
2 State Number 28 29 29 29Co-operative Owned Funds 3,319 36,210 3,987 N.A.Banks Deposits 22,189 25,788 29,557 32,704(StCBs) Borrowings 8,558 9,739 10,859 11,619
Working Capital 34,647 39,268 43,937 N.A.Loans Issued 29,523 30,162 35,231 38,246Loans Outstanding 19,588 21,902 25,709 30,047Recovery Performance(as per cent to demand) 84 81 83 N.A.C-D Ratio 88.3 84.9 87.0 91.9
3 District Number 367 367 367 367
Central Owned Funds 6,223 7,139 8,470 N.A.Co-operative Deposits 36,628 45,612 54,195 57,574Banks Borrowings 11,547 12,857 14,660 15,836(CCBs) Working Capital 54,655 65,368 77,319 N.A.
Loans Issued 34,780 40,252 46,206 44,678Loans Outstanding 31,516 36,853 43,986 47,635Recovery Performance(as per cent to demand) 70 70 69 N.A.C-D Ratio 86.0 80.8 81.2 82.7
4 State Number 19 19@ 19@ 19@Co-operative Owned Funds 1,685 1,999 2,382 N.A.Agriculture Deposits 203 240 382 483and Rural Borrowings 9,772 11,051 12,371 13,117Development Working Capital 11,716 13,473 15,713 N.A.Banks Loans Issued 2,295 2,431 2,503 2,524(SCARDBs) Loans Outstanding 9,182 10,443 11,603 12,375
Recovery Performance(as per cent to demand) 61 62 62 N.A.
5 Primary Number 745 745 755* N.A.Co-operative Owned Funds 989 1,177 1,380 N.A.Agriculture Deposits 99 169 221 302and Rural Borrowings 5,888 6,834 7,657 8,208Development Working Capital 7,285 8,873 10,295 N.A.Banks Loans Issued 1,594 1,692 1,822 1,754(PCARDBs) Loans Outstanding 5,840 6,820 7,602 8,070
Recovery Performance(as per cent to demand) 55 60 58 N.A.
N.A. Not Available,@ Integrated structure in Andhra Pradesh and hence progress is included in short-term structure.* 4 PCARDBs in Orissa since liquidated.Note : Data for the year 1999-2000 and 2000-01 are provisional.Source : NABARD for Sr. Nos. 2 to 5.
Sr.No.

212
Report on Trend and Progress of Banking in India, 2000-01
Appendix Table III.2: Recovery Performance of Rural Co-operative Banks (As per cent of demand)
Sr. State/ Union TerritoryStCBs CCBs SCARDBs PCARDBs
No. 1998- 1999- 1998- 1999- 1998- 1999- 1998- 1999-99 2000(P) 99 2000(P) 99 2000(P) 99 2000(P)
1 2 3 4 5 6 7 8 9 10
1 Andaman & Nicobar 67 68 — — — — — —
2 Andhra Pradesh 69 68 72 64 — — — —
3 Arunachal Pradesh 22 27 — — — — — —
4 Assam 27 25 4 9 1 1 — —
5 Bihar 7 6 12 9 40 46 — —
6 Chandigarh 22 30 — — — — — —
7 Delhi 39 36 — — — — — —
8 Goa 68 73 — — — — — —
9 Gujarat 91 92 66 68 65 55 — —
10 Haryana 99 99 79 77 94 90 69 61
11 Himachal Pradesh 56 79 54 66 63 63 78 78
12 Jammu & Kashmir 39 23 27 27 37 44 — —
13 Karnataka 95 94 71 68 33 37 40 44
14 Kerala 88 91 84 80 94 96 74 72
15 Madhya Pradesh 96 99 60 67 42 59 60 64
16 Maharashtra 78 82 66 69 48 41 — —
17 Manipur 4 6 — — 6 6 — —
18 Meghalaya 41 42 — — — — — —
19 Mizoram 42 23 — — — — — —
20 Nagaland 4 29 — — — — — —
21 Orissa 91 84 48 44 7 4 23 15
22 Pondicherry 63 87 — — 41 35 — —
23 Punjab 99 99 89 90 100 100 83 80
24 Rajasthan 89 91 84 77 81 79 66 54
25 Sikkim — 100 — — — — — —
26 Tamil Nadu 95 100 78 78 53 49 48 47
27 Tripura 46 36 — — 34 14 — —
28 Uttar Pradesh 80 98 52 52 82 84 — —
29 West Bengal 78 76 76 73 64 62 59 57
All India 81 83 70 69 62 62 60 58
P Provisional.
— No banks in the State/Union Territory or not available.

213
Appen
dix
Appendix Table III.3: State-wise Sanctions and Disbursements underRural Infrastructure Development Fund (RIDF)
(As on March 31, 2001)
Sr. State RIDF-I RIDF-II RIDF-III RIDF-IV RIDF-V RIDF-VI (P) State Total
No. Sanctions Disburse- Sanctions Disburse- Sanctions Disburse- Sanctions Disburse- Sanctions Disburse- Sanctions Disburse- Sanctions Disburse-
ment ment ment ment ment ment ment
1 2 3 4 5 6 7 8 9 10 11 12 13 14 15 16
1 Andhra Pradesh 227 214 334 276 275 187 305 154 383 99 574 145 2,098 1,077
2 Arunachal Pradesh — — — — — — — — 25 12 89 22 114 34
3 Assam — — 63 61 16 13 65 11 196 84 50 — 390 170
4 Bihar 22 13 — — 62 5 119 — 101 — 44 — 348 17
5 Goa 7 7 — — — — 9 8 — — 19 — 35 15
6 Gujarat 151 145 130 108 161 126 136 63 254 106 555 141 1,386 689
7 Haryana 27 19 61 50 75 54 102 29 99 30 67 8 432 191
8 Himachal Pradesh 14 14 53 51 50 42 89 56 113 46 135 36 454 246
9 Jammu & Kashmir 6 6 8 1 36 16 106 49 111 38 162 34 428 144
10 Karnataka 173 157 172 158 172 142 179 108 176 44 303 12 1,175 621
11 Kerala 96 86 88 67 91 49 65 25 128 38 186 11 653 277
12 Madhya Pradesh 229 199 208 145 249 132 243 51 263 40 344 69 1,534 637
13 Maharashtra 187 170 232 203 254 227 302 188 350 192 439 92 1,764 1,071
14 Manipur 2 1 — — — — — — — — 8 — 10 1
15 Meghalaya 3 3 — — 8 5 9 5 35 11 30 3 87 28
16 Mizoram 2 2 — — — — — — 54 21 4 — 60 23
17 Nagaland 1 1 — — — — 1 — 17 10 61 5 80 16
18 Orissa 170 162 130 107 163 103 163 69 135 38 107 14 867 493
19 Punjab 61 61 63 62 89 83 116 48 103 74 237 49 667 376
20 Rajasthan 124 117 152 123 163 116 153 17 200 68 254 144 1,044 586
21 Sikkim — — — — — — 21 17 9 2 5 — 35 19
22 Tamil Nadu — — 247 218 195 159 177 114 256 114 264 48 1,139 653
23 Tripura — — — — — — 22 9 45 2 35 1 102 12
24 Uttar Pradesh 296 282 492 328 433 286 526 258 366 63 248 44 2,360 1,261
25 West Bengal 103 82 159 134 174 139 214 103 222 57 413 80 1,285 595
All India 1,899 1,742 2,589 2,092 2,665 1,885 3,120 1,382 3,639 1,189 4,633 960 18,545 9,251
P Provisional — Nil
Note : Sanctions and Disbursements for the three newly created states of Chhattishgarh, Jharkhand and Uttaranchal are not available separately from Madhya Pradesh, Bihar and UttarPradesh, respectively.
Source : NABARD
(Rs. crore)

214
Report on Trend and Progress of Banking in India, 2000-01
Appendix Table III.4: Major Indicators of FinancialPerformance-Scheduled Urban Co-operative Banks (Continued)
(As percentage of Total Assets)(Per cent)
Sr.
Operating Profit Net Profit Interest Income
No. Name of the Bank 1999-2000 2000-01 1999-2000 2000-01 1999-2000 2000-01
1 2 3 4 5 6 7 8
1 Abhyudaya Co-op Bank Ltd. 2.21 1.93 0.85 0.77 10.43 9.792 Ahmedabad Mercantile Co-op Bank Ltd. 3.58 3.37 1.05 0.90 12.21 11.473 Akola Janata Commercial Co-op Bank Ltd. 1.30 0.94 0.54 0.50 8.19 8.134 Akola Urban Co-op Bank Ltd. 1.30 1.32 0.73 0.93 12.66 12.525 Amanath Co-op Bank Ltd. 1.72 1.44 1.72 1.44 9.91 9.376 AP Mahesh Co-op Urban Bank Ltd. 1.80 1.63 1.57 1.29 11.87 11.347 Bassein Catholic Co-op Bank Ltd. 2.29 2.17 1.41 1.34 11.21 10.778 Bombay Mercantile Co-op Bank Ltd. # 0.51 -0.22 0.09 -0.22 7.11 7.819 Charminar Co-op Urban Bank Ltd. 0.62 0.40 0.62 0.40 15.37 15.78
10 Charotar Nagarik Sahakari Bank Ltd. 2.64 1.81 1.72 1.48 13.26 12.9911 Citizencredit Co-op Bank Ltd. 1.86 1.93 1.13 1.38 10.06 9.6812 Co-operative Bank of Ahmedabad 0.88 1.02 0.58 0.27 10.96 11.6813 Cosmos Co-op Urban Bank Ltd. 1.99 1.82 1.32 1.21 11.47 10.6414 Dombivli Nagarik Sahakari Bank Ltd. 2.23 1.98 1.06 1.01 10.22 10.2415 Goa Urban Co-op Bank Ltd. # 0.46 0.97 0.35 0.49 11.22 11.4416 Greater Bombay Co-op Bank Ltd. 2.97 2.15 2.71 1.17 10.55 10.4717 Ichalkaranji Janata Sahakari Bank Ltd. 0.92 1.05 0.68 0.69 10.56 10.4618 Jalgaon Janata Sahakari Bank Ltd. 1.24 0.74 0.79 0.41 10.16 10.2619 Janakalyan Sahakari Bank Ltd. 2.04 1.76 0.46 0.55 11.54 11.3020 Janalaxmi Co-op Bank Ltd. 2.91 1.31 1.92 0.26 17.29 15.4321 Janata Sahakari Bank Ltd. 0.96 1.04 0.83 0.49 9.10 9.3022 Kalupur Commercial Bank Ltd. 3.30 2.46 1.15 1.27 11.25 11.7923 Kalyan Janata Sahakari Bank Ltd. 2.79 2.06 1.67 1.13 10.78 9.1724 Kapol Co-op Bank Ltd. 2.26 1.31 1.74 0.34 11.32 12.8925 Karad Urban Co-op Bank Ltd. 1.26 1.37 0.52 0.76 11.04 11.4426 Khamgaon Urban Co-op Bank Ltd. 0.85 0.80 0.32 0.39 15.43 14.8127 Madhavpura Mercantile Co-op Bank Ltd. 2.86 1.27 1.10 -38.24 11.32 6.1628 Mahanagar Co-op Bank Ltd. 1.56 0.67 0.29 0.30 15.72 14.9829 Mandvi Co-op Bank Ltd. 1.09 1.11 0.46 0.56 12.27 9.8530 Mapusa Urban Co-op Bank Ltd. # 0.05 -3.74 0.05 -7.15 11.33 6.3631 Mehsana Urban Co-op Bank Ltd. 1.38 1.29 1.38 1.16 17.34 18.4832 Nagar Urban Co-op Bank Ltd. 0.84 0.63 0.84 0.63 14.48 12.7233 Nagpur Nagarik Sahakari Bank Ltd. 0.88 1.08 0.44 0.44 10.61 10.1534 Nasik Merchant’s Co-op Bank Ltd. 3.13 2.67 2.79 2.13 15.61 15.6435 New India Co-op Bank Ltd. 3.03 2.92 1.59 1.60 10.90 10.5436 North Kanara GSB Co-op Bank Ltd. 1.71 1.93 1.01 1.00 10.57 10.3137 Nutan Nagarik Sahakari Bank Ltd. 1.95 3.00 1.88 2.06 10.31 11.8238 Parsik Janata Sahakari Bank Ltd. 2.32 2.78 1.65 2.08 10.59 10.2239 Punjab & Maharashtra Co-op Bank Ltd. 1.54 1.64 1.27 1.37 11.47 10.8440 Rajkot Nagrik Sahakari Bank Ltd. 5.05 3.65 0.71 0.72 11.31 10.6941 Rupee Co-op Bank Ltd. 0.99 1.39 0.52 0.35 8.11 10.5642 Sangli Urban Co-op Bank Ltd. 0.45 1.54 0.41 1.40 10.25 10.7843 Saraswat Co-op Bank Ltd. 1.63 2.28 0.47 0.62 9.15 9.1244 Sardar Bhiladwalla PardiPeople’s Co-op Bank Ltd. 2.56 1.62 2.56 1.62 10.23 9.7145 Shamrao Vithal Co-op Bank Ltd. 1.89 2.23 1.10 1.17 10.94 10.9646 Shikshak Sahakari Bank Ltd. 1.43 0.93 0.49 0.40 8.39 7.7847 Surat People’s Co-op Bank Ltd. 2.43 2.51 1.27 0.76 11.33 10.0948 Thane Janata Sahakari Bank Ltd. 2.39 2.43 1.68 1.92 10.77 10.8249 The Bharat Co-op Bank (Mumbai) Ltd. 2.21 2.36 1.70 1.58 11.00 10.9750 Vasavi Co-operative Urban Bank Ltd. # 0.85 0.08 -7.26 0.08 16.13 16.6451 Visnagar Nagarik Sahakari Bank Ltd. 1.78 1.45 1.78 1.45 23.63 25.51
TOTAL 1.78 1.58 0.84 -2.09 10.72 10.59

215
Appendix
Appendix Table III.4: Major Indicators of FinancialPerformance-Scheduled Urban Co-operative Banks (Continued)
(As percentage of Total Assets)(Per cent)
Sr.Interest Expended Provision & Contingencies
No. Name of the Bank 1999-2000 2000-01 1999-2000 2000-01
1 2 3 4 5 6
1 Abhyudaya Co-op Bank Ltd. 5.82 5.72 1.36 1.152 Ahmedabad Mercantile Co-op Bank Ltd. 7.32 7.09 2.53 2.473 Akola Janata Commercial Co-op Bank Ltd. 8.48 8.30 0.76 0.444 Akola Urban Co-op Bank Ltd. 10.27 10.22 0.57 0.405 Amanath Co-op Bank Ltd. 6.35 6.44 0.00 0.006 AP Mahesh Co-op Urban Bank Ltd. 7.88 7.87 0.22 0.347 Bassein Catholic Co-op Bank Ltd. 7.81 7.38 0.87 0.838 Bombay Mercantile Co-op Bank Ltd.# 5.60 6.52 0.42 0.009 Charminar Co-op Urban Bank Ltd. 12.51 13.39 0.00 0.00
10 Charotar Nagarik Sahakari Bank Ltd. 9.80 9.85 0.92 0.3211 Citizencredit Co-op Bank Ltd. 6.13 5.94 0.72 0.5512 Co-operative Bank of Ahmedabad 8.08 8.97 0.29 0.7513 Cosmos Co-op Urban Bank Ltd. 8.02 7.78 0.67 0.6214 Dombivli Nagarik Sahakari Bank Ltd. 6.12 6.30 1.17 0.9715 Goa Urban Co-op Bank Ltd.# 8.97 7.65 0.11 0.4816 Greater Bombay Co-op Bank Ltd. 7.88 7.97 0.27 0.9817 Ichalkaranji Janata Sahakari Bank Ltd. 7.71 7.61 0.24 0.3618 Jalgaon Janata Sahakari Bank Ltd. 7.60 8.36 0.46 0.3319 Janakalyan Sahakari Bank Ltd. 7.80 7.99 1.59 1.2120 Janalaxmi Co-op Bank Ltd. 13.36 12.99 0.99 1.0521 Janata Sahakari Bank Ltd. 7.17 7.33 0.13 0.5522 Kalupur Commercial Bank Ltd. 7.77 8.91 2.15 1.1923 Kalyan Janata Sahakari Bank Ltd. 6.12 5.61 1.12 0.9324 Kapol Co-op Bank Ltd. 6.64 8.86 0.53 0.9725 Karad Urban Co-op Bank Ltd. 7.38 7.81 0.73 0.6126 Khamgaon Urban Co-op Bank Ltd. 12.89 12.59 0.52 0.4027 Madhavpura Mercantile Co-op Bank Ltd. 8.04 4.67 1.76 39.5128 Mahanagar Co-op Bank Ltd. 11.65 11.56 1.26 0.3729 Mandvi Co-op Bank Ltd. 8.30 6.77 0.64 0.5530 Mapusa Urban Co-op Bank Ltd.# 8.83 7.78 0.00 3.4131 Mehsana Urban Co-op Bank Ltd. 15.11 16.61 0.00 0.1332 Nagar Urban Co-op Bank Ltd. 11.32 10.76 0.00 0.0033 Nagpur Nagarik Sahakari Bank Ltd. 8.58 7.90 0.45 0.6434 Nasik Merchant’s Co-op Bank Ltd. 10.49 10.87 0.34 0.5435 New India Co-op Bank Ltd. 5.55 5.31 1.43 1.3236 North Kanara GSB Co-op Bank Ltd. 6.84 6.54 0.70 0.9337 Nutan Nagarik Sahakari Bank Ltd. 6.98 8.20 0.07 0.9438 Parsik Janata Sahakari Bank Ltd. 6.22 6.08 0.66 0.7039 Punjab & Maharashtra Co-op Bank Ltd. 7.62 7.31 0.27 0.2840 Rajkot Nagrik Sahakari Bank Ltd. 6.14 7.51 4.34 2.9341 Rupee Co-op Bank Ltd. 6.04 8.20 0.46 1.0442 Sangli Urban Co-op Bank Ltd. 7.92 7.58 0.04 0.1443 Saraswat Co-op Bank Ltd. 5.86 5.54 1.17 1.6644 Sardar Bhiladwalla Pardi People’s Co-op Bank Ltd. 6.04 6.52 0.00 0.0045 Shamrao Vithal Co-op Bank Ltd. 7.36 7.29 0.79 1.0646 Shikshak Sahakari Bank Ltd. 8.23 8.29 0.93 0.5247 Surat People’s Co-op Bank Ltd. 6.78 6.71 1.15 1.7548 Thane Janata Sahakari Bank Ltd. 6.80 6.79 0.71 0.5249 The Bharat Co-op Bank (Mumbai) Ltd. 6.55 6.21 0.51 0.7750 Vasavi Co-operative Urban Bank Ltd.# 13.46 14.73 8.11 0.0051 Visnagar Nagarik Sahakari Bank Ltd. 19.82 22.86 0.00 0.00
TOTAL 7.57 7.79 0.95 3.67

216
Report on Trend and Progress of Banking in India, 2000-01
Appendix Table III.4: Major Indicators of FinancialPerformance-Scheduled Urban Co-operative Banks (Concluded)
(As percentage of Total Assets)(Per cent)
Sr.
Operating Expenses Net Interest Income (Spread)
No. Name of the Bank 1999-2000 2000-01 1999-2000 2000-01
1 2 3 4 5 6
1 Abhyudaya Co-op Bank Ltd. 2.79 2.54 4.61 4.082 Ahmedabad Mercantile Co-op Bank Ltd.1.48 1.25 4.89 4.383 Akola Janata Commercial Co-op Bank Ltd. 5.94 6.09 -0.29 -0.174 Akola Urban Co-op Bank Ltd. 1.98 1.55 2.39 2.315 Amanath Co-op Bank Ltd. 2.08 1.79 3.56 2.936 AP Mahesh Co-op Urban Bank Ltd. 2.70 2.31 3.99 3.487 Bassein Catholic Co-op Bank Ltd. 1.81 1.84 3.40 3.398 Bombay Mercantile Co-op Bank Ltd.# 1.79 2.22 1.51 1.299 Charminar Co-op Urban Bank Ltd. 2.42 2.16 2.87 2.39
10 Charotar Nagarik Sahakari Bank Ltd. 1.16 1.59 3.46 3.1411 Citizencredit Co-op Bank Ltd. 2.37 2.08 3.93 3.7512 Co-operative Bank of Ahmedabad 2.50 2.53 2.88 2.7113 Cosmos Co-op Urban Bank Ltd. 1.79 1.59 3.45 2.8614 Dombivli Nagarik Sahakari Bank Ltd. 2.13 2.15 4.11 3.9415 Goa Urban Co-op Bank Ltd.# 2.54 3.01 2.25 3.7916 Greater Bombay Co-op Bank Ltd. 2.55 2.26 2.67 2.5017 Ichalkaranji Janata Sahakari Bank Ltd.2.43 2.30 2.85 2.8418 Jalgaon Janata Sahakari Bank Ltd. 2.57 2.47 2.56 1.9019 Janakalyan Sahakari Bank Ltd. 2.26 2.13 3.73 3.3120 Janalaxmi Co-op Bank Ltd. 1.27 1.39 3.93 2.4421 Janata Sahakari Bank Ltd. 2.03 1.69 1.93 1.9722 Kalupur Commercial Bank Ltd. 0.72 0.87 3.47 2.8723 Kalyan Janata Sahakari Bank Ltd. 2.14 1.79 4.66 3.5624 Kapol Co-op Bank Ltd. 3.06 3.39 4.67 4.0425 Karad Urban Co-op Bank Ltd. 2.78 3.32 3.67 3.6326 Khamgaon Urban Co-op Bank Ltd. 1.94 1.77 2.54 2.2227 Madhavpura Mercantile Co-op Bank Ltd.0.73 0.41 3.28 1.4928 Mahanagar Co-op Bank Ltd. 2.80 3.15 4.07 3.4229 Mandvi Co-op Bank Ltd. 3.64 2.91 3.97 3.0930 Mapusa Urban Co-op Bank Ltd.# 2.62 2.44 2.50 -1.4231 Mehsana Urban Co-op Bank Ltd. 0.97 0.73 2.23 1.8832 Nagar Urban Co-op Bank Ltd. 2.67 2.16 3.16 1.9633 Nagpur Nagarik Sahakari Bank Ltd. 2.02 1.98 2.03 2.2534 Nasik Merchant’s Co-op Bank Ltd. 2.08 2.21 5.12 4.7735 New India Co-op Bank Ltd. 3.32 3.69 5.36 5.2336 North Kanara GSB Co-op Bank Ltd. 2.34 2.14 3.73 3.7737 Nutan Nagarik Sahakari Bank Ltd. 1.72 2.29 3.33 3.6238 Parsik Janata Sahakari Bank Ltd. 2.26 2.11 4.38 4.1439 Punjab & Maharashtra Co-op Bank Ltd. 2.97 2.57 3.86 3.5340 Rajkot Nagrik Sahakari Bank Ltd. 1.07 1.11 5.17 3.1841 Rupee Co-op Bank Ltd. 1.34 1.52 2.06 2.3642 Sangli Urban Co-op Bank Ltd. 2.81 2.58 2.33 3.2043 Saraswat Co-op Bank Ltd. 2.89 2.70 3.30 3.5744 Sardar Bhiladwalla Pardi People’s Co-op Bank Ltd. 1.90 2.05 4.19 3.2045 Shamrao Vithal Co-op Bank Ltd. 2.47 2.48 3.58 3.6746 Shikshak Sahakari Bank Ltd. 2.18 1.48 0.16 -0.5147 Surat People’s Co-op Bank Ltd. 2.33 1.81 4.55 3.3748 Thane Janata Sahakari Bank Ltd. 2.44 2.28 3.96 4.0349 The Bharat Co-op Bank (Mumbai) Ltd. 3.11 2.78 4.45 4.7650 Vasavi Co-operative Urban Bank Ltd.# 1.97 2.07 2.68 1.9151 Visnagar Nagarik Sahakari Bank Ltd. 2.21 1.46 3.81 2.65
TOTAL 2.10 1.98 3.15 2.80
# Unaudited for 2000-01.Source: Balance sheet of respective banks.
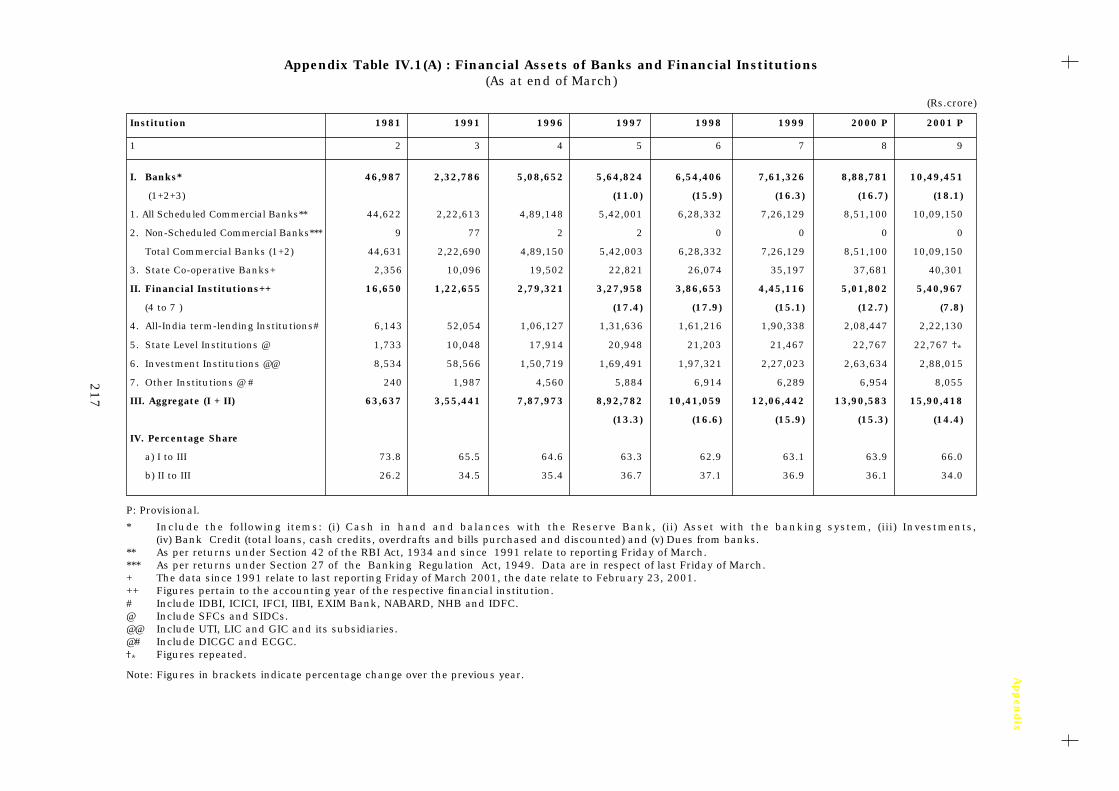
217
Appen
dix
Appendix Table IV.1(A) : Financial Assets of Banks and Financial Institutions(As at end of March)
(Rs.crore)
Institution 1981 1991 1996 1997 1998 1999 2000 P 2001 P
1 2 3 4 5 6 7 8 9
I. Banks* 46,987 2,32,786 5,08,652 5,64,824 6,54,406 7,61,326 8,88,781 10,49,451
(1+2+3) (11.0) (15.9) (16.3) (16.7) (18.1)
1. All Scheduled Commercial Banks** 44,622 2,22,613 4,89,148 5,42,001 6,28,332 7,26,129 8,51,100 10,09,150
2. Non-Scheduled Commercial Banks*** 9 77 2 2 0 0 0 0
Total Commercial Banks (1+2) 44,631 2,22,690 4,89,150 5,42,003 6,28,332 7,26,129 8,51,100 10,09,150
3. State Co-operative Banks+ 2,356 10,096 19,502 22,821 26,074 35,197 37,681 40,301
II. Financial Institutions++ 16,650 1,22,655 2,79,321 3,27,958 3,86,653 4,45,116 5,01,802 5,40,967
(4 to 7 ) (17.4) (17.9) (15.1) (12.7) (7.8)
4. All-India term-lending Institutions# 6,143 52,054 1,06,127 1,31,636 1,61,216 1,90,338 2,08,447 2,22,130
5. State Level Institutions @ 1,733 10,048 17,914 20,948 21,203 21,467 22,767 22,767 �*
6. Investment Institutions @@ 8,534 58,566 1,50,719 1,69,491 1,97,321 2,27,023 2,63,634 2,88,015
7. Other Institutions @ # 240 1,987 4,560 5,884 6,914 6,289 6,954 8,055
III. Aggregate (I + II) 63,637 3,55,441 7,87,973 8,92,782 10,41,059 12,06,442 13,90,583 15,90,418
(13.3) (16.6) (15.9) (15.3) (14.4)
IV. Percentage Share
a) I to III 73.8 65.5 64.6 63.3 62.9 63.1 63.9 66.0
b) II to III 26.2 34.5 35.4 36.7 37.1 36.9 36.1 34.0
P: Provisional.
* Include the following items: (i) Cash in hand and balances with the Reserve Bank, (ii) Asset with the banking system, (iii) Investments,(iv) Bank Credit (total loans, cash credits, overdrafts and bills purchased and discounted) and (v) Dues from banks.
** As per returns under Section 42 of the RBI Act, 1934 and since 1991 relate to reporting Friday of March.*** As per returns under Section 27 of the Banking Regulation Act, 1949. Data are in respect of last Friday of March.+ The data since 1991 relate to last reporting Friday of March 2001, the date relate to February 23, 2001.++ Figures pertain to the accounting year of the respective financial institution.# Include IDBI, ICICI, IFCI, IIBI, EXIM Bank, NABARD, NHB and IDFC.@ Include SFCs and SIDCs.@@ Include UTI, LIC and GIC and its subsidiaries.@# Include DICGC and ECGC.�* Figures repeated.
Note: Figures in brackets indicate percentage change over the previous year.

218
Report o
n T
ren
d a
nd P
rogre
ss of B
an
kin
g in
India
, 20
00
-01
Appendix Table IV.1(B): Total Financial Assets of Financial Institutions-Institution-wise( Rs. crore)
As at the end of MarchInstitutions
1980-81 1990-91 1995-96 1996-97 1997-98 1998-99 1999-2000 P 2000-01 P
1 2 3 4 5 6 7 8 9
A. All-India TermLending Institutions1. IDBI 3,099 22,701 43,791 47,925 58,614 66,136 70,693 70,132
(9.4) (22.3) (12.8) (6.9) (-0.8)2. NABARD @ 1,635 12,664 19,437 22,393 25,027 28,803 33,169 38,550
(15.2) (11.8) (15.1) (15.2) (16.2)3. ICICI 728 7,084 20,911 33,756 45,340 56,515 62,932 70,775
(61.4) (34.3) (24.6) (11.4) (12.5)4. IFCI 589 5,835 13,380 16,453 19,924 22,034 22,023 21,357
(23.0) (21.1) (10.6) (-0.05) (-3.0)5. EXIM Bank — 1,984 3,958 4,883 5,186 5,641 6,863 7,245
(23.4) (6.2) (8.8) (21.7) (5.6)6. IIBI 92 818 1,508 1,698 2,508 3,764 4,089 4,245
(12.6) (47.7) (50.1) (8.6) (3.8)7. NHB — 969 3,142 4,528 4,617 5,143 6,239 6,972
(44.1) (2.0) (11.4) (21.3) (11.7)8. IDFC 2,302 2,439 2,854
(6.0) (17.0)
Total of A 6,143 52,054 1,06,127 1,31,636 1,61,216 1,90,338 2,08,447 2,22,130(1 to 8) (24.0) (22.5) (18.1) (9.5) (6.6)
B. State Level Institutions
9. SFCs 1,074 6,412 10,575 12,210 12,555 10,275 P 10,467 P 10,467 @@(15.5) (2.8) (-18.2) (1.9)
10.SIDCs 660 3,637 7,339 8,738 8,648 11,192 12,300 12,300 @@(19.1) (-1.0) (29.4) (9.9)
Total of B 1,733 10,048 17,914 20,948 21,203 21,467 22,767 22,767(9 to 10) (16.9) (1.2) (1.2) (6.1)
C. Investment Institutions
11. LIC 6,815 29,040 75,291 90,599 1,08,847 1,31,780 1,55,766 1,74,457(20.3) (20.1) (21.1) (18.2) (12.0)
12. GIC and its subsidiaries 1,199 6,362 16,017 18,065 20,788 23,717 26,834 28,132(12.8) (15.1) (14.1) (13.1) (4.8)
13. UTI 521 23,164 59,411 60,827 67,686 71,526 81,034 85,426(2.4) (11.3) (5.7) (13.3) (5.4)
Total of C 8,534 58,566 1,50,719 1,69,491 1,97,321 2,27,023 2,63,634 2,88,015(11 to 13) (12.5) (16.4) (15.1) (16.1) (9.2)
D. Other Institutions
14. DICGC 200 1,744 4,005 5,251 6,138 5,251 5,607 6,412(31.1) (16.9) (-14.5) (6.8) (14.4)
15. ECGC 40 244 556 634 776 1,038 1,347 1,643(14.1) (22.4) (33.8) (29.8) (22.0)
Total of D 240 1,987 4,560 5,884 6,914 6,289 6,954 8,055(14 to 15) (29.0) (17.5) (-9.0) (10.6) (15.8)
Grand Total 16,650 1,22,655 2,79,321 3,27,958 3,86,653 4,45,116 5,01,802 5,40,967(A+B+C+D) (17.4) (17.9) (15.1) (12.7) (7.8)
P Provisional @ Data for 1980-81 pertain to ARDC as NABARD was formed only in 1982. @@ Repeated figures.Notes: 1. Data pertain to the accounting year of the respective financial institutions. For IFCI, the data for years upto 1992-93 are as at end-June and after that, the figures are as at
end-March due to a change in IFCI’s accounting year.2. Figures pertaining to NHB and UTI are as at end-June. All other figures are as at end-March.3. Figures in brackets indicate percentage change over the previous year.4. Figures in respect of investment institutions for 2001 are estimated and include investment, loans and advances, money market assets, deposits, cash in hand
and balances with banks and other assets, excluding fixed assets.

219
Appen
dix
Appendix Table IV.2: Financial Assistance Sanctioned and Disbursed by Financial Institutions(Year: April-March)
(Amount in Rs. crore)
Loans* Underwriting and Direct Subscription Others Total
Institution 1999-2000 2000-01 1999-2000 2000-01 1999-2000 2000-01 1999-2000 2000-01
S D S D S D S D S D S D S D S D S D
1 2 3 4 5 6 7 8 9 10 11 12 13 14 15 16 17 18 19
A. All IndiaDevelopmentBanks (1 to 5) 61,336.6 38,062.0 69,885.3 37,692.6 11,297.1 7,541.7 13,614.7 8,898.6 12,538.4 8,966.6 15,928.1 12,989.9 85,172.1 54,570.3 99,428.1 59,581.1 16.7 9.2
(81,815.8) (51,986.6) (97,032.2) (57,768.4)1. IDBI 21,890.8 13,388.3 22,370.3 12,450.4 2,743.9 1,710.2 4,683.2 3,484.9 2,331.8 1,960.9 1,657.6 1,563.0 26,966.5 17,059.4 28,711.1 17,498.3 6.5 2.6
(..) (..) (..) (..) (..) (..) (..) (..) (..) (..) (..) (..) (25,786.5) (16,036.5) (28,163.1) (16,936.6)2. IFCI 1,511.8 2,516.0 1,429.8 1,663.2 473.2 407.7 389.9 353.2 95.0 348.4 38.8 104.5 2,080.0 3,272.1 1,858.5 2,120.9 -10.6 -35.23. ICICI 26,886.8 14,917.1 34,908.6 16,915.5 7,845.2 5,119.5 7,668.2 4,209.4 8,790.8 5,799.1 13,515.2 10,839.7 43,522.8 25,835.7 56,092.0 31,964.6 28.9 23.74. SIDBI 10,261.2 6,960.2 10,819.9 6,440.7 .. .. .. .. 3.5 3.3 0.7 0.7 10,264.7 6,963.5 10,820.6 6,441.4 5.4 -7.5
(..) (..) (..) (..) (8,088.4) (5,402.7) (8,972.7) (5,190.4)5. IIBI 786.0 280.4 356.7 222.8 234.8 304.3 873.4 851.1 1,317.3 854.9 715.8 482.0 2,338.1 1,439.6 1,945.9 1,555.9 -16.8 8.1
B. SpecialisedFinancialInstitutions (6 to 8) 105.1 135.8 106.2 62.8 141.3 124.0 232.1 190.0 — — 1.0 0.8 246.4 259.8 339.3 253.6 37.7 -2.4
6. IVCF** 4.0 6.7 0.6 0.6 4.1 5.2 2.2 1.9 — — 1.0 0.8 8.1 11.9 3.8 3.3 -53.1 -72.37. ICICI Venture 18.7 17.4 .. 1.5 137.2 118.8 229.9 188.1 — — — — 155.9 136.2 229.9 189.6 47.5 39.28. TFCI 82.4 111.7 105.6 60.7 — — — — — — — — 82.4 111.7 105.6 60.7 28.2 -45.7
C. InvestmentInstitutions (9 to 11) 1,084.4 380.9 3,794.2 324.5 13,421.5 11,090.6 13,523.1 11,796.5 1,306.2 1,292.6 582.6 572.5 15,812.2 12,764.0 17,899.9 12,693.5 13.2 -0.6
9. LIC 872.0 306.0 3,674.4 284.5 5,953.4 5,328.4 7,192.8 6,810.5 .. .. — — 6,825.5 5,634.3 10,867.2 7,095.0 59.2 25.910. UTI — — — — 6,737.2 5,069.9 5,964.3 4,591.9 107.8 92.2 8.0 8.0 6,845.0 5,162.1 5,972.3 4,599.9 -12.7 -10.911. GIC 212.4 74.9 119.8 40.0 730.9 692.3 366.0 394.1 1,198.4 1,200.4 574.6 564.5 2,141.7 1,967.6 1,060.4 998.6 -50.5 -49.2
D. Total Assistanceby All-IndiaFinancialInstitutions(A+B+C) 62,526.1 38,578.7 73,785.7 38,079.9 24,859.9 18,756.3 27,369.9 20,885.1 13,844.6 10,259.2 16,511.7 13,563.2 1,01,230.7 67,594.1 1,17,667.3 72,528.2 16.2 7.3
(97,874.4) (65,010.4) (1,15,271.4) (70,715.5)
E.State-levelInstitutions(12 and 13) .. .. .. .. .. .. .. .. .. .. .. .. 4,043.4 3,583.8 .. .. .. ..12.SFCs 2,169.5 1,636.8 2,720.4 1,841.4 .. .. .. .. 225.7 205.8 177.3 139.2 2,395.2 1,842.6 2,897.7 1,980.6 21.0 7.513.SIDCs .. .. .. .. .. .. .. .. .. .. .. .. 1,648.2 1,741.2 .. .. .. ..
F.Total Assistanceby All-FinancialInstitutions .. .. .. .. .. .. .. .. .. .. .. .. 1,05,274.1 71,177.9 .. .. .. .. (D+E) (1,01,917.8) (68,594.2) (..) (..) (..) (..)
S Sanctions D Disbursements .. Not available — Nil* Loans include Rupee loans, foreign currency loans and guarantees.** IFCI Venture Capital Funds Ltd. (erstwhile RCTC).Notes: 1. Data for 2000-01 are provisional for all institutions.
2. Data adjusted for inter-institutional flows are indicated in brackets. This involves adjustment in regard to IDBI/SIDBI’s refinanceto SFCs and SIDCs seed capital as also loans to and subscriptions to shares and bonds of financial institutions.
3. Other items (Col. 10 to 13) include leasing in case of IDBI, line of credit leasing and personal finance for ICICI, unsecured short-term loans/Depositsand public sector bonds by GIC.
4. TDICI Ltd. has been renamed as ICICI Venture Funds Management Company Ltd. with effect from October 8, 1998.Source: IDBI and Respective financial institution.
Percentagevariation over
1999-2000
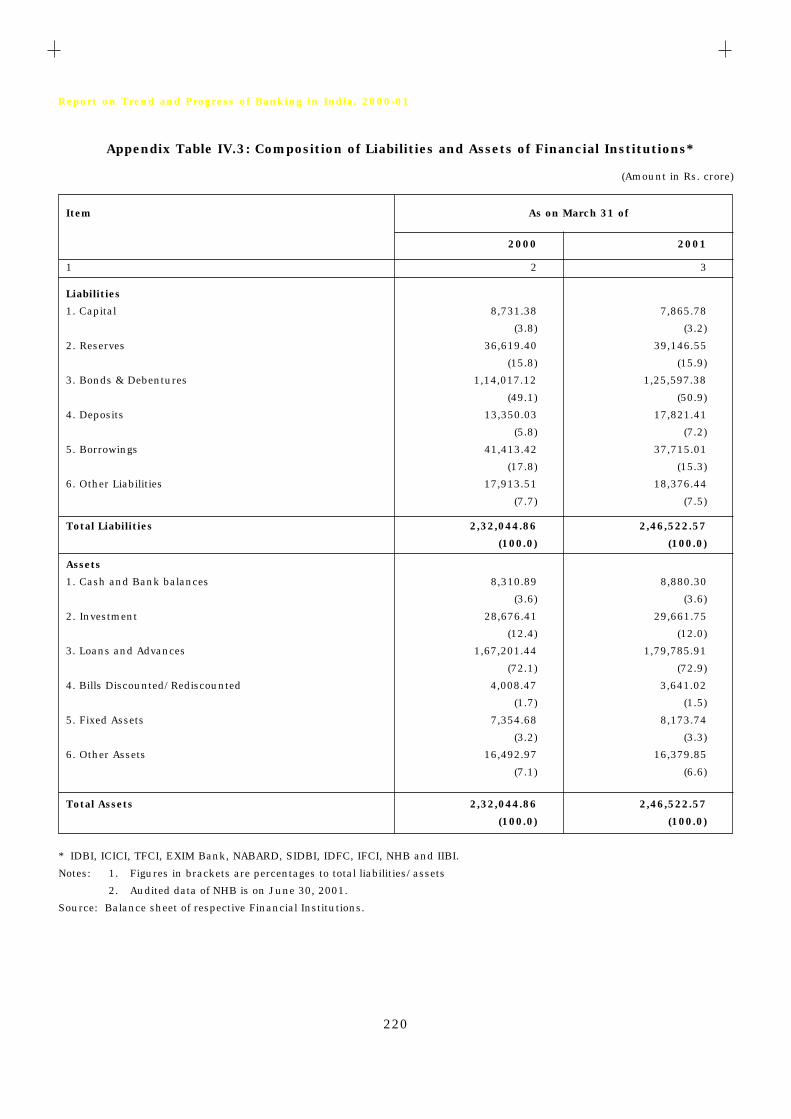
220
Report on Trend and Progress of Banking in India, 2000-01
Appendix Table IV.3: Composition of Liabilities and Assets of Financial Institutions*
(Amount in Rs. crore)
Item As on March 31 of
2000 2001
1 2 3
Liabilities
1. Capital 8,731.38 7,865.78
(3.8) (3.2)
2. Reserves 36,619.40 39,146.55
(15.8) (15.9)
3. Bonds & Debentures 1,14,017.12 1,25,597.38
(49.1) (50.9)
4. Deposits 13,350.03 17,821.41
(5.8) (7.2)
5. Borrowings 41,413.42 37,715.01
(17.8) (15.3)
6. Other Liabilities 17,913.51 18,376.44
(7.7) (7.5)
Total Liabilities 2,32,044.86 2,46,522.57
(100.0) (100.0)
Assets
1. Cash and Bank balances 8,310.89 8,880.30
(3.6) (3.6)
2. Investment 28,676.41 29,661.75
(12.4) (12.0)
3. Loans and Advances 1,67,201.44 1,79,785.91
(72.1) (72.9)
4. Bills Discounted/Rediscounted 4,008.47 3,641.02
(1.7) (1.5)
5. Fixed Assets 7,354.68 8,173.74
(3.2) (3.3)
6. Other Assets 16,492.97 16,379.85
(7.1) (6.6)
Total Assets 2,32,044.86 2,46,522.57
(100.0) (100.0)
* IDBI, ICICI, TFCI, EXIM Bank, NABARD, SIDBI, IDFC, IFCI, NHB and IIBI.
Notes: 1. Figures in brackets are percentages to total liabilities/assets
2. Audited data of NHB is on June 30, 2001.
Source: Balance sheet of respective Financial Institutions.

221
Appen
dix
Appendix Table IV.4: Pattern of Sources and Deployment of Funds of Term-Lending Institutions
1999-2000 2000-01 Quarter ended Quarter ended
Amo- Per- Amo- Per- Amo- Per- Amo- Per- Amo- Per Amo- Per- Amo- Per- Amo- Per- Amo- Per- Amo- Per-unt cent unt cent unt cent unt cent unt cent unt cent unt cent unt cent unt cent unt cent
1 2 3 4 5 6 7 8 9 10 11 12 13 14 15 16 17 18 19 20 21
Sources of Funds
(i) Internal 11,104 52.5 15,737 46.2 11,905 40.6 24,490 59.1 63,236 50.2 12,868 50.6 19,112 56.7 10,718 40.9 24,859 53.2 67,557 51.1
(ii) External 4,776 22.5 11,721 34.4 9,237 31.5 8,396 20.3 34,130 27.1 6,537 25.7 8,189 24.3 9,187 35.0 15,013 32.0 38,926 29.5
(iii)Other sources 5,284 25.0 6,618 19.4 8,165 27.9 8,551 20.6 28,618 22.7 6,025 23.7 6,393 19.0 6,317 24.1 6,899 14.8 25,634 19.4
Total Sources of
Funds (i+ii+iii) 21,164 100.0 34,076 100.0 29,307 100.0 41,437 100.0 1,25,984 100.0 25,430 100.0 33,694 100.0 26,222 100.0 46,771 100.0 1,32,117 100.0
Deployment of Funds
(i) Fresh Deployments 11,147 52.7 18,124 53.2 16,290 55.6 24,491 59.1 70,052 55.6 12,814 50.4 18,836 55.9 12,903 49.2 28,308 60.5 72,861 55.1
(ii) Repayment of
past borrowings 3,676 17.3 8,213 24.1 4,854 16.6 5,796 14.0 22,539 17.9 3,456 13.6 8,498 25.2 3,983 15.2 8,523 18.2 24,460 18.5
(iii)Other
Deployments 6,341 30.0 7,739 22.7 8,163 27.8 11,150 26.9 33,393 26.5 9,160 36.0 6,360 18.9 9,336 35.6 9,940 21.3 34,796 26.4
of which :
Interest Payments 4,253 20.1 4,393 12.9 4,002 13.7 4,499 10.9 17,147 13.6 4,614 18.1 4,774 14.2 4,174 15.9 4,785 10.2 18,347 13.9
Total Deployment
of Funds (i+ii+iii) 21,164 100.0 34,076 100.0 29,307 100.0 41,437 100.0 1,25,984 100.0 25,430 100.0 33,694 100.0 26,222 100.0 46,771 100.0 1,32,117 100.0
Note: Term-Lending institutions comprise of IDBI, ICICI, IFCI, IIBI, EXIM Bank, NABARD, SIDBI, IDFC and NHB.
Jun-1999 Sep-1999 Dec-1999 March-2000 Total(April-March)
Jun-2000 Sep-2000
Sources/Deploymentof Funds Dec-2000 March-2001
Total(April-March)
(Amount in Rs. crore)

222
Report o
n T
ren
d a
nd P
rogre
ss of B
an
kin
g in
India
, 20
00
-01
Appendix Table IV.5: Financial Performance of IDBI, ICICI and IFCI
ItemIDBI ICICI IFCI
1999-2000 2000-01 Variation 1999-2000 2000-01 Variation 1999-2000 2000-01 Variation
1 2 3 4 5 6 7 8 9 10 11 12 13
A. Income 7,859.62 7,834.77 -24.85 -0.32 8,466.39 9,298.05 831.66 9.82 2,899.76 2,890.39 -9.37 -0.32
(i+ii) (100.00) (100.00) (100.00) (100.00) (100.00) (100.00)
i) Interest Income 6,224.51 6,191.38 -33.13 -0.53 8,117.43 8,836.17 718.74 8.85 2,843.38 2,879.93 36.55 1.29
(79.20) (79.02) (95.88) (95.03) (98.06) (99.64)
ii) Other Income 1,635.11 1,643.39 8.28 0.51 348.96 461.88 112.92 32.36 56.38 10.46 -45.92 -81.45
(20.80) (20.98) (4.12) (4.97) (1.94) (0.36)
B. Expenditure 6,912.62 7,143.80 231.18 3.34 7,260.64 8,760.78 1,500.14 20.66 2,840.39 3,152.32 311.93 10.98
(i+ii+iii) (100.00) (100.00) (100.00) (100.00) (100.00) (100.00)
i) Interest Expended 6,370.00 6,594.91 224.91 3.53 5,785.23 6,376.78 591.55 10.23 2,535.74 2,520.09 -15.65 -0.62
(92.15) (92.32) (79.68) (72.79) (89.27) (79.94)
ii) Provisions 80.00 43.00 -37.00 -46.25 244.00 918.90 674.90 276.60 178.40 495.90 317.50 177.97
(1.16) (0.60) (3.36) (10.49) (6.28) (15.73)
iii) Other Expenses 462.62 505.89 43.27 9.35 1,231.41 1,465.10 233.69 18.98 126.25 136.33 10.08 7.98
(6.69) (7.08) (16.96) (16.72) (4.44) (4.32)
of which : Wage Bill 74.04 84.32 10.28 13.88 72.84 99.04 26.20 35.97 32.68 53.44 20.76 63.53
(1.07) (1.18) (1.00) (1.13) (1.15) (1.70)
C. Profit
i) Operating Profit 1,027.00 733.97 -293.03 -28.53 1,449.75 1,456.17 6.42 0.44 237.77 233.97 -3.80 -1.60
ii) Net Profit 947.00 690.97 -256.03 -27.04 1,205.75 537.27 -668.48 -55.44 59.37 -261.93 -321.30 -541.18
D. Total Assets 72,285.43 71,783.41 -502.02 -0.69 65,389.56 73,413.73 8,024.17 12.27 23,371.17 22,778.81 -592.36 -2.53
E. Financial Ratios (per cent) @
i) Operating Profit 1.42 1.02 -0.40 — 2.22 1.98 -0.24 — 1.02 1.03 0.01 —
ii) Net Profit 1.31 0.96 -0.35 — 1.84 0.73 -1.11 — 0.25 -1.15 -1.40 —
iii) Income 10.87 10.91 0.04 — 12.95 12.67 -0.28 — 12.41 12.69 0.28 —
iv) Interest Income 8.61 8.63 0.02 — 12.41 12.04 -0.37 — 12.17 12.64 0.47 —
v) Other Income 2.26 2.29 0.03 — 0.53 0.63 0.10 — 0.24 0.05 -0.19 —
vi) Expenditure 9.56 9.95 0.39 — 11.10 11.93 0.83 — 12.15 13.84 1.69 —
vii) Interest Expended 8.81 9.19 0.38 — 8.85 8.69 -0.16 — 10.85 11.06 0.21 —
viii) Other Expenses 0.64 0.70 0.06 — 1.88 2.00 0.12 — 0.54 0.60 0.06 —
ix) Wage Bill 0.10 0.12 0.02 — 0.11 0.13 0.02 — 0.14 0.23 0.09 —
x) Provisions and Contingencies 0.11 0.06 -0.05 — 0.37 1.25 0.88 — 0.76 2.18 1.42 —
xi) Spread (Net Interest Income) -0.20 -0.56 -0.36 — 3.57 3.35 -0.22 — 1.32 1.58 0.26 —
@ Ratios to Total Assets.
Note: Figures in brackets are percentage shares to the respective total.
PercentageAbsolute PercentageAbsolute PercentageAbsolute
(Amount in Rs. crore)

223
Appen
dix
Appendix Table IV.6: Selected Financial Parameters of Financial Institutions(As on March 31, 2001)
(Per cent)
Sr. Core Supplem- CRAR Net NPAs/ Interest Non-Interest Operating Return Net ProfitNo. Financial Institutions CRAR entary Net Loan Income/ Income/ Profit/ on per
CRAR Advances average average average average employeeWorking Working Working assets (Rs. crore)
Funds Funds Funds
1 2 3 4 5 6 7 8 9 10 11
1 EXIM Bank 23.67 0.16 23.83 1.86 9.36 0.27 2.91 2.14 1.00
2 ICICI 9.60 5.00 14.60 5.20 11.63 2.50 3.16 0.85 0.50
3 IDBI 12.20 3.63 15.83 14.82 9.88 2.36 2.38 0.96 0.24
4 IDFC 57.46 28.02 85.48 0.00 10.59 1.22 6.43 5.26 1.35
5 IFCI 3.48 2.74 6.22 21.90 11.39 0.85 -1.17 -1.15 -0.32
6 IIBI 8.90 4.38 13.28 14.69 14.10 0.40 2.73 2.6 0.40
7 NABARD 37.26 1.25 38.51 0.0002 8.59 0.02 4.61 3.87 0.25
8 NHB* 16.91 Nil 16.91 0.00 9.69 0.21 1.71 1.59 1.46
9 SIDBI 28.12 0.00 28.12 1.23 10.69 0.20 4.09 2.84 0.55
10 TFCI** 18.60 0.00 18.60 20.60 13.64 1.73 3.40 1.36 0.47
* Audited data of NHB is as on June 30, 2001.
** Provisional.
Source : Respective Balance Sheets.

224
Report on Trend and Progress of Banking in India, 2000-01
Appendix Table IV.7 : Call/Notice Money MarketOperations of Financial Institutions
(Rs.crore)
Institution Quartterly Average Quarterly Average Outstanding Borrowings Daily Lending
1999-2000 2000-01 1999-2000 2000-01
1 2 3 4 5
A. Term Lending 465 1,091 2,779 2,552Institutions
1. IDBI 0 4 740 502
2. ICICI 263 828 517 352
3. IFCI 131 193 204 176
4. IIBI(IRBI) 0 6 112 94
5. EXIM BANK 0 0 189 134
6. NABARD 71 60 190 315
7. NHB 0 0 0 18
8. SIDBI 0 0 346 453
9. TFCI 0 0 0 100
10. IDFC 0 0 481 408
B. InvestmentInstitutions — — 1,217 1,822
11. UTI — — 344 878
12. LIC — — 751 811
13. GIC — — 122 133
Total (A+B) 465 1,091 3,996 4,374
C. Rate of Interest(per cent per annum)Highest 11.25 11.95 28.00 28.00Lowest 11.10 7.25 0.25 0.25
Maturity Period 90-183 90-184 1-14 1-14(No. of days)
Note: Outstanding borrowing refer to term-money borrowing.

225
Appen
dix
Appendix Table IV.8 : Resource Mobilisation by Mutual Funds
(Rs. crore)
Public Sector Mutual Funds
Sponsored by
Bank FIs Total Unit Total (2+3) Trust of (4+5)
India
1 2 3 4 5 6 7 8
1993-94 148.1 238.6 386.7 9,297.0 9,683.7 1,559.5 11,243.2
(2) (2) (4) (1) (5) (5) (10)
1994-95 765.5 576.3 1,341.8 8,611.0 9,952.8 1,321.8 11,274.6
(6) (3) (9) (1) (10) (10) (20)
1995-96 113.3 234.8 348.1 -6,314.0 -5,965.9 133.0 -5,832.9
(4) (3) (7) (1) (8) (11) (19)
1996-97 5.9 136.9 142.8 -3,043.0# -2,900.2 863.6 -2,036.6
(3) (2) (5) (1) (6) (17) (23)1997-98 236.9 203.4 440.3 2,875.0 3,315.3 748.6 4,063.9
(2) (3) (5) (1) (6) (15) (21)
1998-99 P -88.3 546.8 458.5 170.0 628.5 2,066.9 2,695.4
(2) (3) (5) (1) (6) (16) (22)
1999-2000 P 155.6 357.4 513.0 4,548.0 5,061.0 14,892.2 19,953.2
(5) (3) (8) (1) (9) (20) (29)
2000-01 P 348.2 1,274.5 1,622.7 1,999.0 3,621.7 9,717.4 13,339.1
(4) (3) (7) (1) (8) (22) (30)
P Provisional.
# Exclude re-investment sales.
Notes: 1. For UTI, the figures are gross value (with premium) of net sales under all domestic schemes and for other mutual funds, figures represent net sales underall on-going schemes.
2. Data exclude amount mobilised by off-shore funds and through roll-over schemes.
3. Data in parentheses relates to the number of mutual funds which have mobilised resources during the year. The actual number of funds in operation maybe greater than this number.
Source : UTI and respective Mutual Funds.
Year(April-March)
PrivateSectorMutualFunds
GrandTotal(6+7)

xiii
AACS – As Applicable to Co-operativeSocieties
ACLF – Additional CollateralisedLending Facility
ADR – American Depository Receipts
AIDB – All India Development Bank
AIFI – All India Financial Institution
ALM – Asset-Liability Management
AMC – Asset-Management Committee
AMPI – Aggregated MicroprudentialIndicator
ARF – Automatic Refinance Facility
ATM – Automated Teller Machine
BCBS – Basel Committee on BankingSupervision
BFS – Board for Financial Supervision
BIS – Bank for InternationalSettlements
BPC – Best Practice Code
BR Act – Banking Regulation Act
BRBNML – Bharatiya Reserve Bank NoteMudran Ltd.
BSE – Bombay Stock Exchange
CACS – Capital Adequacy, Asset Quality,Compliance and Systems
CAMELS – Capital Adequacy, AssetQuality, Management, Earnings,Liquidity and Systems
CAR – Capital Adequacy Ratio
CC – Cash Credit
CCB – Central Co-operative Bank
CCIL – Clearing Corporation of IndiaLtd.
CD – Certificates of Deposit
C-D Ratio – Credit-Deposit Ratio
CDR – Corporate Debt Restructuring
CEO – Chief Executive Officer
CFMS – Centralised Funds ManagementSystem
CIB – Credit Information Bureau
CLB – Company Law Board
CLF – Collateralised Lending Facility
CoR – Certificate of Registration
CP – Commercial Paper
CPSS – Committee on Payment andSettlement Systems
CRA – Capital Reserve Account
CRAR – Capital to Risk-Weighted AssetsRatio
CRISIL – Credit Rating and InvestmentServices of India Ltd.
CRR – Cash Reserve Ratio
CVC – Central Vigilance Commission
DAD – Deposit Accounts Department
DCA – Department of Company Affairs
DFHI – Discount and Finance House ofIndia
DFID – Department for InternationalDevelopment
DFI – Development FinancialInstitution
DICGC – Deposit Insurance and CreditGuarantee Corporation
DRE – Deferred Revenue Expenditure
DRI – Differential Rate of Interest
DRT – Debt Recovery Tribunal
DvP Delivery versus Payment
DWCRA – Development of Women andChildren in Rural Areas
ECAI – External Credit AssessmentInstitutions
ECS – Electronic Clearing Service
EL – Equipment Leasing
EPN – Entry Point Norms
FAQ – Frequently Asked Question
FBC – Foreign Branches Cell
FCNR – Foreign Currency Non-Resident
FDIC – Federal Deposit InsuranceCorporation
FII – Foreign Institutional Investor
FI – Financial Institution
List of Abbreviations

xiv
FRA – Forward Rate Agreement/Financial Restructuring Authority
GDP – Gross Domestic Product
GDR – Global Depository Receipt
GIC – General Insurance Corporation
GKY – Ganga Kalyan Yojana
GLC – General Line of Credit
HDFC – Housing Development FinanceCorporation
HPC – High Power Committee
HUDCO – Housing and UrbanDevelopment Corporation
HUF – Hindu Undivided Family
IC – Investment Company
ICAI – Institute of CharteredAccountants of India
ICD – Inter-Corporate Deposit
IC-D – Investment plus Credit toDeposit
IDBI – Industrial Development Bank ofIndia
IDFC – Infrastructure DevelopmentFinance Company
IDRBT – Institute for Development andResearch in Banking Technology
IFCI – Industrial Finance Corporationof India
IFRA – Investment Fluctuation ReserveAccount
IIBI – Industrial Investment Bank ofIndia
IMD – India Millennium Deposits
INFINET – Indian Financial Network
IOSCO – International Organisation ofSecurities Commissions
IPO – Initial Public Offering
IRB – Internal Rating Based
IRDA – Insurance Regulatory andDevelopment Authority
IRDP – Integrated Rural DevelopmentProgramme
IRS – Interest Rates Swaps
KCC – Kisan Credit Cards
KVIB – Khadi and Village IndustriesBoard
LAB – Local Area Bank
LAF – Liquidity Adjustment Facility
LC – Loan Company/Letter of Credit
LHO – Local Head Office
LIBOR – London Inter-Bank Offer Rate
LIC – Life Insurance Corporation ofIndia
LTO – Long-Term Operation
LTPLR – Long-Term Prime Lending Rate
MBFC – Mutual Benefit FinancialCompany
MBS – Mortgage Backed Securities
MEI – Macroeconomic Indicator
MFDF – Micro Finance DevelopmentFund
MF – Mutual Fund
MIBOR – Mumbai Inter-Bank Offer Rate
MICR – Magnetic Ink CharacterRecognition
MIS – Management InformationSystem
MNBC – Miscellaneous Non-BankingCompany
MTPLR – Medium-Term Prime LendingRate
MWS – Million Wells Scheme
NABARD – National Bank for Agricultureand Rural Development
NAV – Net Asset Value
NBC – Net Bank Credit
NBFC – Non-Banking Financial Company
NCD – Non-Convertible Debenture
NDS – Negotiated Dealing System
NDTL – Net Demand and Time Liabilities
NGO – Non-Government Organisation
NHB – National Housing Bank
NOF – Net Owned Fund
NPA – Non-Performing Asset
NSE – National Stock Exchange
OD – Overdraft

xv
ODS – Ozone Depleting Substances
OSMOS – Off-Site Monitoring andSurveillance System
OTCEI – Over the Counter Exchange ofIndia
PACS – Primary Agricultural CreditSociety
PCA – Prompt Corrective Action
PCARDB – Primary Co-operative Agricultureand Rural Development Bank
PDO – Public Debt Office
PD – Primary Dealer
PLR – Prime Lending Rate
PSB – Public Sector Bank
PSRS – Prudential SupervisoryReporting System
PSU – Public Sector Undertaking
PTLR – Prime Term Lending Rate
QIB – Qualified Institutional Buyer
RALOO – Return on Assets and Liabilitiesof Overseas Offices
RBS – Risk-Based Supervision
RCS – Registrar of Co-operativeSocieties
RIDF – Rural InfrastructureDevelopment Fund
RKBY – Rashtriya Krishi Bima Yojana
RNBC – Residuary Non-BankingCompany
RoA – Return on Asset
RRB – Regional Rural Bank
RTGS – Real-Time Gross Settlement
SAC – Settlement Advisory Committee
SACP – Special Agricultural Credit Plan
SAO – Seasonal Agricultural Operation
SBI – State Bank of India
SCA – Statutory Central Auditor
SCARDB – State Co-operative Agriculturaland Rural Development Bank
SCB – Scheduled Commercial Bank
SEBI – Securities and Exchange Boardof India
SFC – State Financial Corporation
SFMS – Structured Financial MessagingSystem
SGL – Subsidiary General Ledger
SGSY – Swarnajayanti Gram SwarojgarYojana
SHG – Self Help Group
SHnDC – State Handicrafts DevelopmentCorporation
SIDBI – Small Industries DevelopmentBank of India
SITRA – Supply of Improved Toolkits toRural Artisans
SLBC – State-Level Bankers Committee
SLR – Statutory Liquidity Ratio
SSI – Small-Scale Industry
StCB – State Co-operative Bank
STCI – Securities Trading Corporationof India
STPLR – Short-Term Prime Lending Rate
TFCI – Tourism Finance Corporation ofIndia
TRYSEM – Training of Rural Youth for SelfEmployment
UCB – Urban Co-operative Bank
UIB – Unincorporated Body
UTI – Unit Trust of India
VaR – Value at Risk
VRS – Voluntary Retirement Scheme
YTM – Yield to Maturity