An Exploratory Survey on SOA Knowledge, Adoption and Trend in the Italian Industry
11
Copyright: © 2012 IEEE. Personal use of this material is permitted. Permission from IEEE must be obtained for all other uses, in any current or future media, including reprinting/republishing this material for advertising or promotional purposes, creating new collective works, for resale or redistribution to servers or lists, or reuse of any copyrighted component of this work in other works. An Exploratory Survey on SOA Knowledge, Adoption and Trend in the Italian Industry Maurizio Leotta, Filippo Ricca, Marina Ribaudo, Gianna Reggio, Egidio Astesiano, Tullio Vernazza Abstract: The main aim of this work is investigating the level of knowledge and diffusion of SOA (Service Oriented Architecture) in the Italian industry. We are also interested to understand what is the trend of SOA (positive or negative?) and what are the methods, technologies and tools really used in the industry. We carried out a personal opinion survey receiving 159 answers by Italian software professionals in two different rounds (2008 and 2011). The data were collected with the help of self-administered Internet questionnaires. The findings suggest that SOA is a relevant phenomenon in the Italian industry, it is well- known (and used enough) and the same is true for its key components (Web services and RESTFul services). On the contrary, orchestration languages and UDDI seem little known and used. Currently, the adoption of SOA is medium with a perceived trend that is more stable than positive (but surely not negative). Digital Object Identifier (DOI): http://dx.doi.org/10.1109/WSE.2012.6320528
-
Upload
independent -
Category
Documents
-
view
2 -
download
0
Transcript of An Exploratory Survey on SOA Knowledge, Adoption and Trend in the Italian Industry

Copyright:
© 2012 IEEE. Personal use of this material is permitted. Permission from IEEE must be obtained for all
other uses, in any current or future media, including reprinting/republishing this material for advertising or
promotional purposes, creating new collective works, for resale or redistribution to servers or lists, or
reuse of any copyrighted component of this work in other works.
An Exploratory Survey on SOA Knowledge, Adoption
and Trend in the Italian Industry
Maurizio Leotta, Filippo Ricca, Marina Ribaudo, Gianna Reggio, Egidio Astesiano, Tullio Vernazza
Abstract:
The main aim of this work is investigating the level of knowledge and diffusion of SOA
(Service Oriented Architecture) in the Italian industry. We are also interested to understand
what is the trend of SOA (positive or negative?) and what are the methods, technologies and
tools really used in the industry.
We carried out a personal opinion survey receiving 159 answers by Italian software
professionals in two different rounds (2008 and 2011). The data were collected with the help
of self-administered Internet questionnaires.
The findings suggest that SOA is a relevant phenomenon in the Italian industry, it is well-
known (and used enough) and the same is true for its key components (Web services and
RESTFul services). On the contrary, orchestration languages and UDDI seem little known
and used. Currently, the adoption of SOA is medium with a perceived trend that is more
stable than positive (but surely not negative).
Digital Object Identifier (DOI):
http://dx.doi.org/10.1109/WSE.2012.6320528
An Exploratory Survey on SOA Knowledge, Adoption and Trendin the Italian Industry
Maurizio Leotta, Filippo Ricca, Marina Ribaudo, Gianna Reggio, Egidio Astesiano, Tullio VernazzaDipartimento interscuola di Informatica, Bioingegneria, Robotica e Ingegneria dei Sistemi (DIBRIS)
Universita di Genova, Italy{maurizio.leotta|filippo.ricca|marina.ribaudo|gianna.reggio|egidio.astesiano|tullio.vernazza}@unige.it
Abstract— The main aim of this work is investigating thelevel of knowledge and diffusion of SOA (Service OrientedArchitecture) in the Italian industry. We are also interested tounderstand what is the trend of SOA (positive or negative?)and what are the methods, technologies and tools really usedin the industry.
We carried out a personal opinion survey receiving 159answers by Italian software professionals in two differentrounds (2008 and 2011). The data were collected with the helpof self-administered Internet questionnaires.
The findings suggest that SOA is a relevant phenomenon inthe Italian industry, it is well-known (and used enough) andthe same is true for its key components (Web services andRESTFul services). On the contrary, orchestration languagesand UDDI seem little known and used. Currently, the adoptionof SOA is medium with a perceived trend that is more stablethan positive (but surely not negative).
Keywords-SOA, Web services, REST, Personal Opinion Sur-vey, Level of Adoption, Trend of Pervasiveness.
I. INTRODUCTION
Service Oriented Architecture (SOA) is an architecturalstyle for the development and management of softwaresystems. Applications based on SOA employ services astheir basic computational entities [4].
Key to the SOA approach is the ability to compose exist-ing services into more complex ones; these compositions areusually built with orchestration languages (e.g., BPEL [1]).Another core SOA standard is UDDI1, a mechanism toregister and locate Web services. Main claimed benefits ofSOA are the following: more flexible IT systems that canbe adapted to change faster, integration of new and existingapplications, speed in custom applications development andreduced cost of maintaining applications [4].
We are interested in SOA for research, didactic andcollaboration purposes with the local industry (we are look-ing for project partners). In general, the industry can helpus to understand: (1) whether SOA can be considered apromising research field and (2) whether it deserves (more)space in the current university courses. Moreover, given thatwe are also interested in methods, technologies and toolsused for developing SOA systems and for migrating legacysystems towards SOA [14], the industry can help us to
1 http://www.oasis-open.org/committees/uddi-spec/
understand which of them are really used and with whichresults / problems. In addition, we need real applicationsto experiment available prototype tools / techniques andour proposals (e.g., [9], [10], [11]). On the other hand, wecan help the industry to adopt best practices in softwaredevelopment and migration towards SOA, discovering andintroducing new technologies in the development processand producing qualified personnel with the proper expertise.
For reaching this reciprocal exchange, we need to knowmore about industry. For this purpose, we designed anexploratory survey (preliminary results presented as a posterin [12]) and carried out it in two different rounds (2008 and2011), by interviewing key people from Italian companiesto understand how many professionals know SOA and therelated technologies (e.g., BPEL, Web and REST [17] ser-vices), what is the level of adoption (or diffusion) achievedby SOA and what is the perceived trend of SOA in the Italianindustry.
The survey is the most common method of gatheringinformation. It can be administered in several ways [7]: self-administered questionnaires (usually mail but increasinglyInternet), telephone surveys and one-to-one interviews. Weselected the first option, putting on-line a questionnaire andinviting people to answer, because an Internet survey isgenerally the most cost-effective interview method [23] evenif it presents well-known limitations / problems [20].
After looking through the related literature (Section V),the survey has been conducted through the following foursteps: (1) Web-based questionnaire development; (2) ques-tionnaire diffusion by means of several mailing lists and Webgroups; (3) survey execution, by collecting answers; and (4)analysis of results and packaging.
Overall, we received 40 fully completed questionnaires inthe first round (2008) and 119 in the second one (2011).
The paper is organized as follows: Section II describes thesurvey definition, design and planning. Results are reportedin Section III, and discussed in Section IV, together withthreats to validity. Section V discusses the related literature,while Section VI concludes the paper and outlines directionsfor future work.
II. STUDY DEFINITION, DESIGN, AND PROCEDURE
The survey has been carried out two times: during 2008(first round) and during the end of 2011 (second round).For this reason, this work can be considered a longitudinalstudy2. The main aim of this work is to investigate to whatextent and how Italian companies know/adopt SOA and howthey perceive the trend of SOA. We are also interested inunderstanding which methods, technologies and tools arereally used in the industry for developing SOA systems andfor migrating legacy systems towards SOA.
To implement this survey, we: (i) used the same frame-work of [21], [22] (based on [6]), (ii) followed as much aspossible the suggestions given in [7] and (iii) adopted anon-line questionnaire to collect information.
The goals of the survey are four:
1) Research: understanding whether or not SOA can beconsidered a promising research field;
2) Education: evaluating whether and which SOA meth-ods/technologies/tools have to be integrated in univer-sity courses;
3) Collaboration purposes: finding new opportunities forcollaboration with the industry to experiment ourproposals. In particular, we are interested in migrationstrategies towards SOA;
4) Dissemination: using the results of this survey to pro-vide the Italian industry with interesting informationabout market and technological trends.
The perspective is mainly of software engineering re-searchers, interested in understanding how much and howSOA is known and applied in industry, but the results couldbe also useful as guidelines for IT professionals often forcedto take decisions without sufficient information. The contextconsists of a sample of Italian professionals3 working incompanies having different sizes (e.g., small, medium andlarge4) and belonging to different domains (in prevalence ITcompanies and consultancy).
A. Research Questions
Given the above goals the survey aimed at addressing thefollowing research questions:
RQ1: What is the knowledge and the usage of SOA inthe Italian industry? We are interested in evaluating andidentifying how many professionals know SOA and which
2 The essential feature of a longitudinal survey is that it provides repeatedobservations over time on a set of variables for the set of persons belongingto the survey [3].
3 We cannot compute exactly this number due to the “partial” adoptedanonymity policy. We received 40 questionnaire in the first execution (2008)and 119 in the second one (2011). Surely 11 professionals answered to boththe executions (in these 11 cases the professionals reported their personaldetails), but they could be more.
4 According to Recommendation 2003/361/EC:micro: < 10; small: 10-50; medium: 51-250; large: > 500.
are the related technologies really used (i.e., BPEL, Webservices, REST). We would like to understand which arethe most common methods, technologies and tools used(or followed) for the creation of new systems and for themigration of existing systems towards SOA.
RQ2: What is the level of adoption of SOA in the Italianindustry? We are interested in evaluating the level ofadoption/diffusion achieved by SOA in the Italian industry.This information is essential to infer the relevance of SOA.
RQ3: What is the trend of pervasiveness of SOA in theItalian industry? We are interested in evaluating the trendof pervasiveness of SOA for the future (positive, stableor negative?). This information become interesting whencompared with the results of RQ2. For example, it may beinteresting to conduct research about SOA and teach SOAeven if the adoption is not widespread while the trend ispositive.
B. Target Population and Sample Identification
The target population is the set of individuals to whomthe survey applies. In our case the population consistsof Italian software professionals (e.g., project managers,architects, developers). Our sample consists of: (1) profes-sionals working in companies of the IT field; their skillsare related to the production, maintenance or managementof software systems (the larger part); (2) professionals whowork in companies that do not directly belong to the ITfield (a smaller part) but that use information systems tocarry out and support the company’s business activities; (3)professionals who work for public agencies, governmententerprise or performing other kinds of activities (remainderof the sample).
The sample was obtained in two ways: (1) by conve-nience, i.e., relying on the network contacts of our researchgroup and (2) by sending invitation messages on mailinglists and Web groups concerning software engineering. Inparticular, we have used some lists available at the university(such as former students or people who have participated inprevious surveys about other topics) and some professionalgroups (e.g., LinkedIn). We opted for non-probabilistic sam-pling methods even if we know all the problems of this sam-pling (e.g., the risk of using a sample not representative ofthe target population) [7] because this survey is exploratoryand because we thought that the target population was hardto identify and of limited availability.
In total, we received 159 complete responses to oursurvey. Unfortunately, we do not know exactly: (1) thenumber of involved Italian professionals in both rounds ofthe survey — the reason is explained in footnote 3 — and(2) how many people have been reached by our invitationmessages and advertisements, so we cannot calculate theresponse rate. The same problem is present also in othersoftware engineering surveys (e.g., in [13]).

ID Kinda 2011 only Questionb
1.1 ME Do you know the Web service technology? [Yes (with experience), Yes (no experience), No]cd
1.2 ME YES Do you know REST and the RESTful Web services? [Yes (with experience), Yes (no experience), No]d
1.3 ME Do you know SOA (Service Oriented Architecture)? [Yes (with experience), Yes (no experience), No]cd
2.1 ME YES Which of the following definitions do you consider more appropriate for SOA?[SoaML [2], Sensoria [24], WS Glossary [5]]
2.2 ME YES Do you know orchestration languages (e.g., BPEL - Business Process Execution Language)?[Yes (with experience), Yes (no experience), No]d
2.3 ME Do you know methods/technologies/tools for the development of SOA-based systems?[Yes (with experience), Yes (no experience), No]cd
3.1 OP Please, listing methods/technologies/tools for the development of SOA-based systems used in your company4.1 ME Is there personnel with expertise/experience on methods, technologies or tools for the development/realization of SOA
systems in the company where you are working? [Yes, No, Don’t know]4.2 ME YES Is there personnel with expertise/experience on methods, technologies or tools for the migration of legacy systems towards
SOA in the company where you are working? [Yes, No, Don’t know]4.3 ME YES How do you assess the level of adoption of SOA in the IT field? [High, Medium, Low]e
4.4 ME YES How do you assess the trend of pervasiveness of SOA in the IT field (over the last 2/3 years and for the next future)?[Positive, Stable, Negative]
5.1 OP YES In your opinion, what is gradually replacing SOA (if any)?6.1 NE / OP What is your current profession? [IT Manager, Project Manager, SW Architect, SW Developer, Other]6.2 ME / OP What is your degree? [Bachelor Degree, Master Degree, PhD, High-school, Other]6.3 OP Please, specify Year of graduation6.4 ME Is your degree IT specific (Information Technology)? [Yes, No]6.5 ME / OP What is the type of the company you work for?
[IT, non-IT, Other (e.g., public administrations and companies with an IT department)]6.6 OP What is the number of employees (full and part-time) of your company?6.7 OP What is the number of employees (full and part-time) of your business units?6.8 ME / OP What is the main business activity of your company?
[IT Service Provider and Telecom, SW Development, Consultancy, Public Administration, Other]
a “ME” means mutually exclusive multiple-choice question, “NE” means non-exclusive multiple-choice question, “OP” means open questionb Predefined choices of the answers are given in italic.c In 2008 execution, only [Yes, No]d Yes (with experience) = used personally in at least a project, Yes (no experience) = known but no personal experiencee As reported in the questionnaire: High (≈ > 70%), Medium (≈ 30% − 70%), Low (≈ < 30%)
Table IQUESTIONNAIRE.
C. Data Collection
Data were collected in 2008 by means of an emailquestionnaire and in 2011 through the creation of an online questionnaire.
The use of a web-based tool simplifies and speeds thecompletion of the questionnaire by professionals with clearadvantages in terms of the number of responses obtained [6].
In the second execution, the questionnaire has been devel-oped using a service offered by Google Doc5. The serviceallows one to create and publish an on-line questionnaire.It can handle several types of answers such as: check-boxes, grid, drop-down lists with options, multiple choice,paragraph text (for long answers). Once the questionnaireis created and published on-line a URL linking to the
5 http://www.google.com/google-d-s/forms/
questionnaire is provided; it can be sent to the participantswho can easily access and compile the questionnaire. Theresponses of the questionnaire are automatically collected ina spreadsheet.
D. Validity
A pilot study was performed before the first execution ofthe survey (i) to tune the questionnaire and (ii) to reducethe ambiguities contained in the questions. Two industrialIT professionals carefully read all the documentation andprovided their judgement on the questionnaire. Followingthe suggestions of the two contacted professionals, minorchanges to the questionnaire were made. After this pilotstudy we concluded that the survey was well suited forIT professionals and that the questions were clear enough.Finally, the final set of questions was agreed.

E. Questionnaire Design
The questionnaire is organized into two high-level sec-tions. The first section contains a series of questions de-signed to assess the knowledge of SOA and getting infor-mation about the adoption in the industry and the trend ofpervasiveness of SOA. The second section contains ques-tions designed to get information about the professionalsparticipating to the survey.
In the on-line questionnaire, the first section is dividedinto several Web pages, while the second section consistsof a single page; each page contains one or more questions.This division was necessary to create different paths to com-plete the questionnaire depending on the type of responsegiven by the professionals. The complete list of (mandatory)questions is shown in Table I. The identifier of each questionis created juxtaposing page-number, “.” and the questionnumber. The questionnaire contains both multiple choicequestions (mutually exclusive and non-exclusive) and open-ended (see column “Kind” in Table I). The total number ofquestions to compile is variable depending on the responsesgiven by the professional completing the questionnaire.
To harvest more answers, we decided that the question-naire should take no longer than approximately 10 minutesto complete (long questionnaires get less response than shortquestionnaires [23]) and we designed it accordingly.
We have chosen to force the professionals to answerall the (mandatory) questions in the questionnaire usinga special option provided by the Google service; in thisway it was possible to get all the questionnaires filled outcorrectly. The only optional questions (not shown in Table I)concern first name, last name and email; so we allowedthe professionals to complete the questionnaire anonymously(some studies have shown that response rate is affected bythe anonymity policy of a study [23]).
The questionnaire was introduced with a brief motivationstatement about the purpose of our research (as suggestedin [7]) and we added a sentence to clarify that all the col-lected information had to be considered highly confidential.All the participants were informed that: “Data collected willbe used only for research purposes and they will be revealedonly in aggregated form” 6 (as it is done in this paper).
F. Survey Execution
The first execution of the survey was put on-line since15th of July 2008 until the 15th of September 2008 (2months). The second execution of the survey was put on-linesince 15th of November 2011 until the 31st of December2011 (about 1 month and half). Approximately every 15days, we sent to our contacts, mailing lists and groupson LinkedIn a reminder to participate to the survey. Theprocedure followed to prepare, administer, and collect the
6 In conformity with privacy Italian law: “D.lgs. n. 196/2003”.
questionnaire data is made up of the following five mainsteps:
1) Preparation and Design of the Questionnaire. Startingfrom similar questionnaires and tailoring them to ourobjectives, an initial set of questions was agreedamong us.
2) Pilot Study. A pilot study was performed before theexecution phase as explained in Section II-D.
3) On-line Deployment. Once the questionnaire was re-fined after the pilot study, it was deployed on-line byusing Google Doc as explained in Section II-C.
4) Monitoring. During the data capture phase, our re-search unit monitored the progress of the questionnairesubmission. Some people reporting difficulties aboutthe questions asked us for clarifications.
5) Data Analysis. After questionnaires have been col-lected, analyses were performed with the aim ofanswering the research questions. Given the natureof this survey, that is mainly descriptive (it describessome conditions or factors found in a population interms of its frequency and impact [7]) and exploratory,we applied quite exclusively descriptive statistics andshowed our findings by means of charts.
III. RESULTS
In the following, we first present some information aboutthe background of the respondents and the characteristicsof the sampled companies, then some results from the twoexecutions of the survey. When possible, we will comparethe results between the two executions (common questionsare indicated in Table I with a blank in the column “2011only”). It is important to highlight that for space reasons notall the results presented in this paper can be shown by meansof a chart. For the interested reader, a complete report of thesurvey containing other charts and analyses is available athttp://softeng.disi.unige.it/TR/SurveySOA2011.pdf
A. Respondents’ Background and Characteristics of theSampled Companies
For what concerns the respondents’ role in the company(Q6.1), 51% of the respondents of the 2008 sample aredevelopers or software architects while 39% stated that theyhave a technical-coordination role, i.e., project managementand IT management. The remaining ones (10% in total)are: IT technicians, marketing/sales employees and CEOs.Similarly in 2011: 45% of the respondents are developersor software architects, 31% are project managers and ITmanagers. Also in this case we have a portion of respondents(24%) that does not belong to these categories.
We have information about the kind of company inwhich the respondents work (Q6.5). The distributions areapproximately the same in the two executions of the survey:75% IT companies, 15% non-IT and 10% other (public
administrations and companies with an IT department belongto this category).
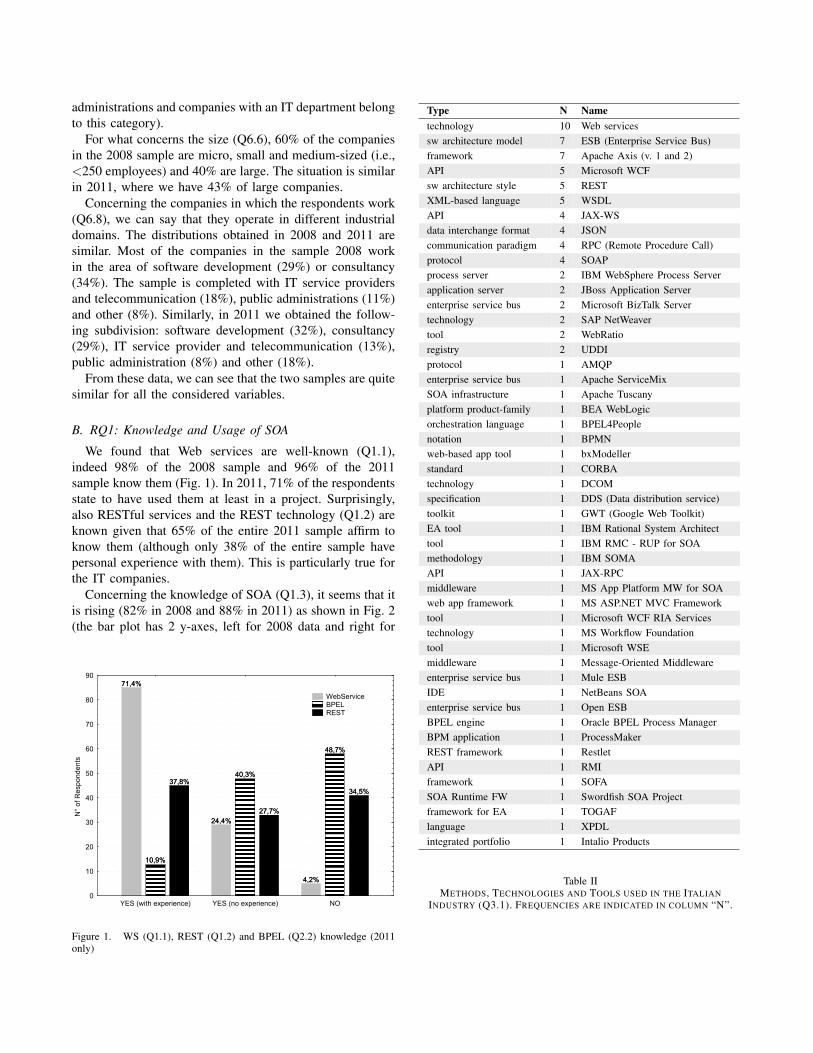
For what concerns the size (Q6.6), 60% of the companiesin the 2008 sample are micro, small and medium-sized (i.e.,<250 employees) and 40% are large. The situation is similarin 2011, where we have 43% of large companies.
Concerning the companies in which the respondents work(Q6.8), we can say that they operate in different industrialdomains. The distributions obtained in 2008 and 2011 aresimilar. Most of the companies in the sample 2008 workin the area of software development (29%) or consultancy(34%). The sample is completed with IT service providersand telecommunication (18%), public administrations (11%)and other (8%). Similarly, in 2011 we obtained the follow-ing subdivision: software development (32%), consultancy(29%), IT service provider and telecommunication (13%),public administration (8%) and other (18%).
From these data, we can see that the two samples are quitesimilar for all the considered variables.
B. RQ1: Knowledge and Usage of SOA
We found that Web services are well-known (Q1.1),indeed 98% of the 2008 sample and 96% of the 2011sample know them (Fig. 1). In 2011, 71% of the respondentsstate to have used them at least in a project. Surprisingly,also RESTful services and the REST technology (Q1.2) areknown given that 65% of the entire 2011 sample affirm toknow them (although only 38% of the entire sample havepersonal experience with them). This is particularly true forthe IT companies.
Concerning the knowledge of SOA (Q1.3), it seems that itis rising (82% in 2008 and 88% in 2011) as shown in Fig. 2(the bar plot has 2 y-axes, left for 2008 data and right for
71,4%
24,4%
4,2%
10,9%
40,3%
48,7%
37,8%
27,7%
34,5%
YES (with experience) YES (no experience) NO0
10
20
30
40
50
60
70
80
90
N°
of R
espo
nden
ts
71,4%
24,4%
4,2%
10,9%
40,3%
48,7%
37,8%
27,7%
34,5%
WebServiceBPELREST
Figure 1. WS (Q1.1), REST (Q1.2) and BPEL (Q2.2) knowledge (2011only)
Type N Nametechnology 10 Web servicessw architecture model 7 ESB (Enterprise Service Bus)framework 7 Apache Axis (v. 1 and 2)API 5 Microsoft WCFsw architecture style 5 RESTXML-based language 5 WSDLAPI 4 JAX-WSdata interchange format 4 JSONcommunication paradigm 4 RPC (Remote Procedure Call)protocol 4 SOAPprocess server 2 IBM WebSphere Process Serverapplication server 2 JBoss Application Serverenterprise service bus 2 Microsoft BizTalk Servertechnology 2 SAP NetWeavertool 2 WebRatioregistry 2 UDDIprotocol 1 AMQPenterprise service bus 1 Apache ServiceMixSOA infrastructure 1 Apache Tuscanyplatform product-family 1 BEA WebLogicorchestration language 1 BPEL4Peoplenotation 1 BPMNweb-based app tool 1 bxModellerstandard 1 CORBAtechnology 1 DCOMspecification 1 DDS (Data distribution service)toolkit 1 GWT (Google Web Toolkit)EA tool 1 IBM Rational System Architecttool 1 IBM RMC - RUP for SOAmethodology 1 IBM SOMAAPI 1 JAX-RPCmiddleware 1 MS App Platform MW for SOAweb app framework 1 MS ASP.NET MVC Frameworktool 1 Microsoft WCF RIA Servicestechnology 1 MS Workflow Foundationtool 1 Microsoft WSEmiddleware 1 Message-Oriented Middlewareenterprise service bus 1 Mule ESBIDE 1 NetBeans SOAenterprise service bus 1 Open ESBBPEL engine 1 Oracle BPEL Process ManagerBPM application 1 ProcessMakerREST framework 1 RestletAPI 1 RMIframework 1 SOFASOA Runtime FW 1 Swordfish SOA Projectframework for EA 1 TOGAFlanguage 1 XPDLintegrated portfolio 1 Intalio Products
Table IIMETHODS, TECHNOLOGIES AND TOOLS USED IN THE ITALIAN
INDUSTRY (Q3.1). FREQUENCIES ARE INDICATED IN COLUMN “N”.

82,5%
17,5%
88,2%
11,8%
YES NO0
5
10
15
20
25
30
35
N°
of R
espo
nden
ts
0
20
40
60
80
10082,5%
17,5%
88,2%
11,8%
2008 (L)2011 (R)
Figure 2. Q1.3: Do you know SOA (Service Oriented Architecture)?
2011; for the 2011 execution YES = YES (with experience)+ YES (no experience)). SOA is better known and used inlarge companies than in smaller ones. This is more evident inthe 2011 sample where SOA scores approximately 7 pointsmore (92% YES vs. 85% YES) in large companies than inmedium, small and micro companies.
The respondents interpret SOA applications (Q2.1) as“Applications employing services as their basic compu-tational entities ...” [24] in 63% of the cases while themore concrete option (i.e., a set of communicating Webservices) [5] and the more abstract one (i.e., an architec-tural paradigm for defining how people, organizations andsystems provide and use services to achieve results) [2]are chosen, respectively, in 29% and 8% of the cases. Itis interesting to note that micro companies and IT providers
64,8%
12,4%
22,9%
45,7%
25,7%28,6%
YES Don't Know NO0
10
20
30
40
50
60
70
N°
of R
espo
nden
ts
64,8%
12,4%
22,9%
45,7%
25,7%28,6%
SOA Experience (L)Migration Experience towards SOA (R)
Figure 3. SOA (Q4.1) and Migration (Q4.2) Experience (2011 only)
have in proportion a more concrete vision of SOA (i.e., SOA= Web services) than the other categories.
Conversely, BPEL (Fig. 1) and in general the orchestrationlanguages (Q2.2) are not so used in the industry (only 11%of the sample use them), even if a large proportion of oursample known its existence (51% in total). Orchestrationlanguages are better known and used in large companiesthan in smaller ones.
Also for methods/technologies and SOA tools (Q2.3) theknowledge seems rising (68% in 2008 vs. 79% in 2011)even if there is a decrease of their personal usage (37%in 2008 vs. 33% in 2011). Partitioning the data aboutthe size, it appears that in 2008 the knowledge of SOAmethods/technologies/tools in large companies (54% YESand 46% NO) was smaller with respect to medium/smalland micro companies (74% YES and 26% NO). This is nomore true in the 2011 sample, where the knowledge of SOAmethods/technologies/tools in large companies (85% YESand 15% NO) is greater with respect to medium/small andmicro companies (73% YES and 27% NO). Table II lists theSOA methods/technologies/tools really used by our sample.The most frequent are: Web services (10), Enterprise ServiceBus (7), Axis (7), WCF (5), REST (5) and WSDL (5).
Fig. 3 summarizes the answers to Q4.1 (SOA experiencein the company of the respondent) and Q4.2 (migrationexperience towards SOA in the company of the respondent)for the 2011 sample. Also in this case, as for the personalknowledge (Q2.3), the percentage is increased in the 2011sample (61% in 2008 vs. 65% in 2011). Concerning theexperience to migrate legacy systems towards SOA (Q4.2),we cannot compare these results with the sample 2008 (thequestion was absent in the first execution, see Table I), butwe can affirm that is quite high (46%). This result in notcompletely in line with what we obtained in [21] whereonly three projects out of 40 dealt with a migration towardsSOA. Looking more in detail to the data, it appears thatin the 2011 sample the companies in the area of softwaredevelopment are the more experienced both in SOA andin migration towards SOA. In addition, micro companieshave few experience in migration towards SOA (65% of therespondents working in a micro company answered NO atQ4.2).
C. RQ2: Level of Adoption of SOA
Fig. 4 summarizes the SOA level of adoption in the ITfield of our sample partitioned by company size. Overall,the adoption of SOA is medium/low given that 48% and43% of the sample has indicated, respectively, as Mediumand Low the SOA diffusion and only 9% has indicatedit as High. Looking at Fig. 4, it appears that respondentsworking in micro and small companies are in proportionthe more negative about SOA adoption, while the others(medium+large) are more positive.

11,7%
3,9%
1,0%
8,7%
14,6%
6,8%5,8%
2,9%
16,5%
23,3%
4,9%
Low Medium High0
2
4
6
8
10
12
14
16
18
20
22
24
N°
of R
espo
nden
ts
11,7%
3,9%
1,0%
8,7%
14,6%
6,8%5,8%
2,9%
16,5%
23,3%
4,9%
Micro companiesSmall companiesMedium companiesLarge companies
Figure 4. Q4.3: How do you assess the level of adoption of SOA in the IT field? (2011 only)
2,9%
12,6%
1,0%
10,7%11,7%
1,0%
10,7%
2,9%1,9%
21,4%
23,3%
Positive Stable Negative0
2
4
6
8
10
12
14
16
18
20
22
24
26
N°
of R
espo
nden
ts
2,9%
12,6%
1,0%
10,7%11,7%
1,0%
10,7%
2,9%1,9%
21,4%
23,3% Micro companiesSmall companiesMedium companiesLarge companies
Figure 5. Q4.4: How do you assess the trend of pervasiveness of SOA in the IT field (over the last 2/3 years and for the next future)? (2011 only)
D. RQ3: Trend of Pervasiveness of SOA
Overall, our sample estimates as stable/positive the trendof pervasiveness of SOA; 51% of the complete sample optedfor Stable, 45% for Positive and only 4% for Negative.Looking more in detail the data and partitioning for company
size (see Fig. 5), we discover that respondents workingin large companies always opted for Positive and Stable(precisely 21% Positive and 23% Stable). The more scepticalabout a positive trend of SOA are the respondents workingin micro companies (13% Stable, 3% Positive and 1%Negative).

IV. DISCUSSION
We found that SOA and its key technological componentssuch as, e.g., Web services and RESTful web services arewell-known in the Italian industry (RQ1). SOA is knownby a relevant proportion of the respondents (respectively,82% of the sample in 2008 and 88% in 2011) andamong them a fairly good number has personal experiencewith it. In the Italian companies, IT professionals haveexpertise/experience on methods, technologies and tools forthe realization of SOA systems (65% in 2011) and the sameis true for migrating legacy systems towards SOA (46% in2011). Instead, the low knowledge (only 51% of the sampleknow it) and low usage (only 11% of the sample use it)of orchestration languages (e.g., BPEL) deserve a deeperinvestigation to understand the motivation (future work).
Currently, the adoption of SOA (RQ2) is medium (low)with a trend (RQ3) that is more stable than positive (butsurely not negative). This result, confirmed also by thecomparison between the two survey rounds, is unexpectedgiven that “the cloud” — a logical hosting environmentfor services — is growing exponentially (this is also truein Italy, see [18]). It seems that SOA goes forward slowlyin the Italian industry, as whether one or more obstacleswould limit its diffusion/usage. Also this aspect deservesmore empirical studies and specific surveys.
With the data collected so far we can only speculate apossible reason of this finding: it could be found in the longlist of standards, frameworks and tools used to implementSOA solutions and rarely shared in the IT community thatwe have summarized in Table II. They are really too manyand so different from each other to trouble even the moreexperienced professional.
When we analysed the SOA knowledge, adoptionand trend of companies as a function of their size, wediscovered that large companies have more knowledge,expertise and experience about SOA than medium, smalland micro ones. The same is true for migration towardsSOA. This seems reasonable given that, very often: (i) largecompanies have more money for research purposes, trainingand tools (usually software licence are very expensive inthe SOA context), (ii) SOA is used for large softwaresystems in which large companies are often involved and(iii) migration projects are very complex and usually theyneed expensive budgets. The large companies are also themore positive about the SOA level of adoption and trend.This could be a direct consequence of the fact that largecompanies are more involved in large-sized projects whereSOA is more useful and in migration projects towards SOAthan the other companies.
The evidence-based answers we provided to the researchquestions hold a value in themselves as important knowledgeassets in the software engineering field. In addition, if con-firmed, they will bring important implications in the practiceof both software development and education/training.
A. Threats to Validity
In our opinion the main threats to validity of this studyare the following: (1) non-probabilistic sampling method,(2) possible self-exclusion from participants not interestedin SOA and (3) a non-completely shared definition of SOA.
We opted for non-probabilistic sampling method, even ifwe know all the problems of this sampling, for two reasons.First, this survey is exploratory. Second, we thought thatthe target population was hard to identify (in particularrespondents with expertise in migration towards SOA) and oflimited availability (this is often true in software engineeringsurveys).
Our goal was to obtain responses from professionalsinvolved in software development and management but notnecessarily adopting SOA in their companies. Unfortunately,we cannot exclude that some participants could have lostinterest in the survey when they realized it was related toSOA. We think that this threat could affect the percentage ofrespondents who declared interest in SOA and underpinningtechnologies. In particular, it is possible that the percentagesof knowledge/usage of SOA (and beneath technologies)obtained from our sample is over-amplified with respect tothe real values of the target population.
Another possible threat concerns the definition of SOAthat could be interpreted in different ways. This threat couldhave biased the obtained findings. We tried to limit this threatinserting the question Q2.1 to understand which meaningthe respondents assigned to the word SOA. Moreover, wecomputed all the percentages categorizing for the threepossible answers to Q2.1 obtaining similar outcomes as forthe complete dataset.
V. RELATED WORK
First, we have considered SOA surveys carried out by re-search and advisory firms and presented as technical reports.Generally, these works are focused on understanding whatis the SOA level of adoption in the industry and what willbe its trend in the near future. Second, we have searched forempirical studies about SOA surfing the scientific literature.We found two recent technical reports and we will presentthem from the most to the less recent.
The Wolfgang Martin Team publishes from several yearsa report7 on the adoption of SOA in Germany, Austria andSwitzerland. In the 2010 version [15] emerges that the usageof SOA is increased in the last years. Indeed, the portions ofthe sample that have deployed SOA, that have planned to use
7 http://www.soa-check.eu

SOA and that not use SOA are respectively: 63%-31%-6%in 2010, 47%-37%-16% in 2009, 36%-48%-16% in 2008and 31%-42%-27% in 2007. The report clearly highlightsthat SOA, in the German market, is now well known and inprogress of adoption. Hence, SOA seems more widespreadin Germany than in Italy.
In 2008, Gartner [19] analysed in detail the SOA adoptionworldwide; the initial sample is constituted of more than 200large companies from Europe, North America and Asia. Itreported8 that: “According to the survey, 53 percent of therespondents were already using SOA in some part of theirorganizations. Another 25 percent were not using it but hadplans to do so in the next 12 months; and 16 percent hadno plans to use SOA at all.”
Now, we will present two empirical studies about SOAthat we have considered closer to our.
Differently from us Razavian et al. [16] have carriedout a survey focused on the migration towards SOA. Thework points out the differences between SOA migrationapproaches defined in academia and those used in industry.The authors conducted an industrial survey (by means of in-terviews) in seven leading SOA solution provider companiesand they found that all the companies focused on the sameSOA migration approach. Usually, scientific approaches takea reverse engineering perspective while industrial practition-ers prefer forward engineering strategies (e.g., where legacycode is not transformed but used as a reference). This workhighlights the importance of the techniques for migratinglegacy systems towards SOA.
In their empirical exploratory study, Kokko et al. [8]investigated, by mean of interviews, the SOA adoptionin nine Finnish organizations. The major obstacles to theSOA diffusion as testified by the interviewed organizationswere: internal resistance to learning new things, absence ofbusiness process models and the immaturity of the SOAtools compared to traditional approaches (we can speculatethat this last aspect is also present in Italy). Differentlyfrom us, the authors focus on the SOA adoption process,especially describing and analysing how the adoption began,what the experiences were, and how the adoption processevolved.
VI. CONCLUSIONS AND FUTURE WORK
In this paper we presented some results from a surveyperformed to investigate knowledge, adoption and trend ofSOA in the Italian industry.
The main findings of this survey can be thus summarized.SOA is a relevant phenomenon in the Italian industry. Itis well-known and used. The same is true for its keycomponents such as Web services and RESTFul services.On the contrary, orchestration languages, UDDI and SOA
8 http://www.gartner.com/it/page.jsp?id=790717
analysis and development methods seem less known andused.
These results suggest that in Italy SOA is interpreted in amore simplistic way with respect to the definitions reportedin scientific books (i.e., without the concepts of orches-tration/choreography and registry). Currently, the adoptionof SOA is medium (low) with a perceived trend, overthe last 2/3 years and for the next future, that is morestable than positive. The evident widespread knowledge ofSOA emerging from our survey, but also the results aboutadoption/trend and its immature usage, deserves attentionfrom industries and universities.
As future work we would like to compare the state ofknowledge and adoption of SOA in Italian companies to thesituation in other countries replicating this study in othernations. Moreover, we planned next year to execute a thirdround of this survey inserting in the questionnaire morespecific and “deep” questions (e.g., to reveal the reasonsof the reduced usage of UDDI and BPEL).
REFERENCES
[1] Web Services Business Process Execution Language, v. 2.0.Standard, OASIS, 2007.
[2] Service Oriented Architecture Modeling Language (SoaML).Technical report, Object Management Group, OMG, 2009.
[3] N. Buck and J. Ermisch. Assessment of Longitudinal SurveyDesigns. Report prepared for New Zealand Treasury, 1995.
[4] T. Erl. SOA Principles of Service Design. Prentice Hall, 2007.
[5] H. Haas and A. Brown. Web Services Glossary. Technicalreport, W3C Working Group Note, World Wide Web Consor-tium(W3C), 2004.
[6] A. Jedlitschka, M. Ciolkowski, C. Denger, B. Freimut, andA. Schlichting. Relevant Information Sources for SuccessfulTechnology Transfer: A Survey Using Inspections as anExample. In Proceedings of 1st International Symposiumon Empirical Software Engineering and Measurement (ESEM2007), pages 31–40. IEEE Computer Society, 2007.
[7] B. A. Kitchenham and S. L. Pfleeger. Personal opinionsurveys. In F. Shull, J. Singer, and D. I. K. Sjoberg, editors,Guide to Advanced Empirical Software Engineering, pages63–92. Springer London, 2008.
[8] T. Kokko, J. Antikainen, and T. Systa. Adopting SOA -Experiences from Nine Finnish Organizations. In Proceedingsof 13th European Conference on Software Maintenance andReengineering (CSMR 2009), pages 129–138. IEEE, 2009.
[9] M. Leotta, G. Reggio, F. Ricca, and E. Astesiano. Towardsa Lightweight Model Driven Method for Developing SOASystems Using Existing Assets. In Proceedings of 14thInternational Symposium on Web Systems Evolution (WSE2012 co-located with ICSM 2012), page (to appear). IEEE.

[10] M. Leotta, G. Reggio, F. Ricca, and E. Astesiano. BuildingVECM-based Systems with a Model Driven Approach: anExperience Report. In Proceedings of 1st InternationalWorkshop on Experiences and Empirical Studies in SoftwareModeling (EESSMod 2011 co-located with MODELS 2011),volume 785, pages 38–47. CEUR Workshop Proceedings,2011.
[11] M. Leotta, F. Ricca, G. Reggio, and E. Astesiano. Com-paring the Maintainability of two Alternative Architecturesof a Postal System: SOA vs. non-SOA. In Proceedingsof 15th European Conference on Software Maintenance andReengineering (CSMR 2011), pages 317–320. IEEE, 2011.
[12] M. Leotta, F. Ricca, M. Ribaudo, G. Reggio, E. Astesiano,and T. Vernazza. SOA Adoption in the Italian Industry. InProceedings of 34th International Conference on SoftwareEngineering (ICSE 2012), pages 1441–1442. IEEE, 2012.
[13] T. C. Lethbridge. A Survey of the Relevance of ComputerScience and Software Engineering Education. In Proceedingsof the 11th Conference on Software Engineering Educationand Training (CSEET 1998), pages 56–66, Washington, DC,USA, 1998. IEEE.
[14] A. Marchetto and F. Ricca. From objects to services: towarda stepwise migration approach for Java applications. Inter-national Journal on Software Tools for Technology Transfer(STTT), 11:427–440, 2009.
[15] W. Martin. SOA Check 2010. Technical report, WolfgangMartin Team.
[16] M. Razavian and P. Lago. A Survey of SOA Migration inIndustry. In G. Kappel, Z. Maamar, and H. Motahari-Nezhad,
editors, Service-Oriented Computing, volume 7084 of LectureNotes in Computer Science, pages 618–626. Springer Berlin/ Heidelberg, 2011.
[17] L. Richardson and S. Ruby. RESTful web services. O’ReillySeries. O’Reilly, 2007.
[18] N. Sfondrini and G. Motta. Cloud Computing: a survey. InAICA 2011 National Congress, 2011.
[19] D. Sholle. SOA User Survey: Adoption Trends and Charac-teristics. Technical report, Gartner, 2008.
[20] J. Singer, M. Storey, and D. Damian. Selecting EmpiricalMethods for Software Engineering Research. In F. Shulland Singer, editors, Guide to Advanced Empirical SoftwareEngineering, pages 285–311. Springer, 2008.
[21] M. Torchiano, M. Di Penta, F. Ricca, A. De Lucia, andF. Lanubile. Migration of information systems in the Italianindustry: A state of the practice survey. Inf. Softw. Technol.,53:71–86, January 2011.
[22] M. Torchiano, F. Tomassetti, A. Tiso, F. Ricca, and G. Reggio.Maturity of Software Modelling and Model Driven Engineer-ing: a Survey in the Italian Industry. In Proceedings of the16th International Conference on Evaluation & Assessment inSoftware Engineering (EASE 2012), page (to appear), 2012.
[23] D. S. Walonick. Survival Statistics. StatPac, Inc., 1997.
[24] M. Wirsing, L. Bocchi, J. L. Fiadeiro, S. Gilmore, M. Hoelzl,N. Koch, P. Mayer, R. Pugliese, and A. Schroeder. Sensoria:Engineering for Service-Oriented Overlay Computers. MITPress, 2008.