Guanylate cyclase activating proteins, guanylate cyclase and disease
Upload
khangminh22Category
view
3download
0
ARTICLE
ADAR and hnRNPC deficiency synergize in activatingendogenous dsRNA-induced type I IFN responsesAnna-Maria Herzner1, Zia Khan2, Eric L. Van Nostrand3, Sara Chan4, Trinna Cuellar5, Ronald Chen2, Ximo Pechuan-Jorge1,Laszlo Komuves4, Margaret Solon4, Zora Modrusan6, Benjamin Haley5, Gene W. Yeo3, Timothy W. Behrens2, and Matthew L. Albert1
Cytosolic double-stranded RNA (dsRNA) initiates type I IFN responses. Endogenous retroelements, notably Alu elements,constitute a source of dsRNA. Adenosine-to-inosine (A-to-I) editing by ADAR induces mismatches in dsRNA and preventsrecognition by MDA5 and autoinflammation. To identify additional endogenous dsRNA checkpoints, we conducted acandidate screen in THP-1 monocytes and found that hnRNPC and ADAR deficiency resulted in synergistic induction of MDA5-dependent IFN responses. RNA-seq analysis demonstrated dysregulation of Alu-containing introns in hnRNPC-deficient cells viautilization of unmasked cryptic splice sites, including introns containing ADAR-dependent A-to-I editing clusters. Theseputative MDA5 ligands showed reduced editing in the absence of ADAR, providing a plausible mechanism for the combinedeffects of hnRNPC and ADAR. This study contributes to our understanding of the control of repetitive element–inducedautoinflammation and suggests that patients with hnRNPC-mutated tumors might maximally benefit from ADAR inhibition-based immunotherapy.
IntroductionCytosolic double-stranded RNA (dsRNA) is a hallmark of viralinfection, serving as a trigger for retinoic acid-inducible gene I(RIG-I)–like receptors and the subsequent induction of an anti-viral type I IFN response (Schlee and Hartmann, 2016). Endog-enous dsRNA may also engage cytosolic sensors (Schlee andHartmann, 2016), posing an inflammatory threat to homeosta-sis and acting as a potential driver of autoinflammatory diseases,including interferonopathies (Davidson et al., 2018). One well-characterized safeguard is the double-stranded RNA-specificadenosine deaminase (ADAR, also known as ADAR1). Notably,patients harboring pathological variants of ADAR suffer fromAicardi-Goutières syndrome, with evidence of high levels ofcirculating IFNs, IFN-stimulated genes (ISGs), and severe en-cephalopathy (Fisher and Beal, 2017; Frassinelli et al., 2021).Gene deletion or enzymatic mutants of ADAR in mice lead toembryonic lethality at about embryonic day 9.5 or 11.5, respec-tively, a phenotype that can be rescued by deficiency in theRIG-I–like helicase melanoma differentiation-associated protein5 (MDA5; Pestal et al., 2015; Liddicoat et al., 2015). These studieshave led to a model whereby ADAR is responsible for editingadenosine-to-inosine (A-to-I) within dsRNA stretches of RNA,
rendering it inert to MDA5 sensing (Pestal et al., 2015; Liddicoatet al., 2015). Complementing these genetic studies, ADAR in-activation in tumors has been shown to effectively enhancecheckpoint blockade by boosting MDA5-dependent immuneresponses (Ishizuka et al., 2019). In addition, ADAR inactivationhas been suggested to act in a cell-intrinsic manner, regulatingtumor cell growth through activation of IFN-induced, dsRNA-activated protein kinase (Gannon et al., 2018; Liu et al., 2019).Indeed, ADAR inhibitors are being considered for use in cancerimmunotherapy (Ishizuka et al., 2019). Checkpoint inhibitorshave been widely successful but require a high immune infil-tration for optimal efficacy (Cogdill et al., 2017). One strategy toovercome this requirement constitutes intratumoral innateimmune activation. This can be achieved by engaging cytosolicreceptor ligands and has been validated as a means to increaseimmune cell infiltration in tumors (Iurescia et al., 2018). Oneinherent problem with this strategy is the narrow therapeuticindex, as both tumor and host cells express cytosolic nucleic acidsensors. This is being addressed by targeting agonists to tumors.An alternative strategy might be the identification of factorsthat are dysregulated in tumor cells, which can be exploited to
.............................................................................................................................................................................1Department of Cancer Immunology, Genentech, South San Francisco, CA; 2Department of Human Genetics, Genentech, South San Francisco, CA; 3Department of Cellularand Molecular Medicine, Stem Cell Program and the Institute for Genomic Medicine, University of California, San Diego, La Jolla, CA; 4Department of Pathology, Genentech,South San Francisco, CA; 5Department of Molecular Biology, Genentech, South San Francisco, CA; 6Department of Microchemistry, Proteomics & Lipidomics and NextGeneration Sequencing, Genentech, South San Francisco, CA.
Correspondence to Anna-Maria Herzner: [email protected]; Matthew L. Albert: [email protected]; A.-M. Herzner’s present address isBoehringer Ingelheim, Biberach an der Riβ, Germany; T. Cuellar’s present address is Gotham Therapeutics, New York, NY; R. Chen’s and T.W. Behrens’s present address isMaze Therapeutics, South San Francisco, CA; M.L. Albert’s present address is insitro, South San Francisco, CA.
© 2021 Genentech, Inc. This article is available under a Creative Commons License (Attribution 4.0 International, as described at https://creativecommons.org/licenses/by/4.0/).
Rockefeller University Press https://doi.org/10.1084/jem.20201833 1 of 23
J. Exp. Med. 2021 Vol. 218 No. 9 e20201833
Dow
nloaded from http://rupress.org/jem
/article-pdf/218/9/e20201833/1420257/jem_20201833.pdf by C
alif San Diego (Biom
) user on 28 July 2021

enhance the activity of endogenous ligands for nucleic acidsensors.
Approximately 90–95% of reported ADAR editing sites inhuman cells are found in Alu element–derived RNA (Bahn et al.,2015; Franzen et al., 2018; Giacopuzzi et al., 2018; Quinones-Valdez et al., 2019). The Alu retrotransposon has uniquelyemerged in primates and has the highest copy number of alltransposable elements—estimated to be >106 elements thatconstitute an estimated 11% of the human genome (Deininger,2011). The abundance of Alu elements prompted us to hy-pothesize the presence of additional RNA-binding proteins asbeing involved in preventing Alu-derived dsRNA recognitionand sterile inflammation.
In this study, we identified heterogeneous nuclear ribonu-cleoprotein C (hnRNPC) as an important splicing regulatorworking together with ADAR by suppressing cytosolic access ofAlu-element–derived dsRNA.
ResultsTargeting hnRNPC and ADAR by CRISPR/Cas9 synergisticallyactivates MDA5To discover previously uncharacterized host factors that preventdsRNA recognition, we used available enhanced cross-linkingand immunoprecipitation (eCLIP) data to identify Alu elementRNA-binding proteins (Alu-RBPs; Van Nostrand et al., 2016;Hung et al., 2015). Enrichment at Alu elements was determinedby the mapping of eCLIP and input reads to 186 families of RNA(e.g., ribosomal RNAs, transfer RNAs, and noncoding RNAs),including several families of repetitive elements such as Alu orL1 (large interspersed nuclear element 1), separately in sense andantisense orientation (Van Nostrand et al., 2020a; Van Nostrandet al., 2020b). For this analysis, we used fold enrichment ineCLIP over input samples and relative information content(fraction of family-specific eCLIP reads of all eCLIP reads, mul-tiplied by the log-fold enrichment) to select 17 Alu-RBP candi-dates for a targeted screen (Fig. S1, A and B).
In establishing a screening strategy, we selected the mye-loid cell line THP-1 for its robust MDA5-dependent responseto transfected polyinosinic:polycytidylic acid (pI:C; data notshown) and its weak IFN response to ADAR inactivation (datanot shown), which suggested a putative alternate mechanismfor regulation of dsRNA-induced sterile inflammation. To limittechnical artifacts resulting from CRISPR/Cas9 DNA damage,which can result in STING activation (Li and Chen, 2018), wegenerated Cas9-transgenic STING-deficient THP-1 cells (re-ferred to as THP-1 cells unless otherwise indicated). As ourpreliminary Alu-RBP screens achieved only weak ISG signals(data not shown), we conducted a modifier screen, evaluatingthe combination of Alu-RBP and ADAR targeting. Endogenousinduction of ISGs was measured after 5 d (Fig. 1 A). Histone-lysine N-methyltransferase SETDB1 targeting, which increasesdsRNA expression by epigenetically de-repressing endogenousretrovirus- and large interspersed nuclear element–derivedRNA, was used as a positive control (Cuellar et al., 2017). Of the17 Alu-RBPs and four controls targeted, only hnRNPC showed astrong induction of ISGs, measured by the up-regulation of
interferon α-inducible protein 27 (IFI27), mitochondrial, IFN-induced protein with tetratricopeptide repeats 1 (IFIT1), andIFIT2 relative to ADAR singly targeting (Fig. 1 B; and Fig. S1, Cand D).
Independent experiments using one of the hnRNPC-targetingguide RNAs (gRNAs) in the screen and a distinct ADAR gRNAshowed successful targeting of hnRNPC and ADAR, as well asup-regulation of ADAR protein upon hnRNPC deficiency (Fig. S1E). Furthermore, we observed modest ISG regulation by singlegene deletion but found a statistically significant synergisticeffect of the combined deficiency compared with the combinedeffects of individual deficiencies (Fig. 1 C; hnRNPC × two-wayANOVA P values for interaction between ADAR targeting andhnRNPC targeting). We confirmed the synergistic ISG inductionin (i) the parental WT Cas9-transgenic cell line; (ii) a WT single-cell clone; and (iii) an independent STING-deficient THP-1 line(Fig. S2, A–C). Notably, the synergistic ISG induction was de-pendent on MDA5 expression and showed no reduction uponRIG-I inactivation (Fig. 1, D and E). We also confirmed a modestinduction of ISGs in primary monocytes when hnRNPC wastargeted; however, results were variable and were dominated bya strong response to ADAR deficiency. As a result, we coulddetect an additive (but not synergistic) effect of combinedhnRNPC and ADAR targeting in two of four donors (Fig. S2 D).Furthermore, a previous study had described ISG induction inthe breast cancer cell line MCF-7 targeted by hnRNPC RNAinterference, which could be mildly enhanced by ADAR tar-geting (Wu et al., 2018). In our hands, targeting either geneusing CRISPR/Cas9 led to ISG induction, with stronger ISGinduction following ADAR targeting and the combined defi-ciency resulting in a robust additive effect (Fig. S2 E).
To exclude up-regulation of the dsRNA-sensing ma-chinery as the cause for synergistic ISG induction, we assessedpI:C–mediated MDA5 activation in the presence or absence ofhnRNPC. To exclude possible confounding effects of RIG-I,we generated RIG-I–deficient cells and targeted hnRNPC.On day 4, we transfected low-dose pI:C for 24 h. Notably, wedid not observe synergistic ISG induction (Fig. 1 F; hnRNPCtargeting × pI:C interaction two-way ANOVA P values >0.05).We therefore concluded that synergistic ISG induction wasdue to changes in the abundance of endogenous dsRNA ligandsand not a result of altered baseline activity of the MDA5 pathway.These screening and confirmation studies identified hnRNPCas a novel RNA-binding protein (RBP) responsible for controlof endogenous dsRNA, which in some conditions compensatedfor ADAR deficiency.
To assess the global impact of hnRNPC and ADAR deficiency,we performed RNA sequencing (RNA-seq) using THP-1 cells,evaluated 3, 4, and 5 d after nucleofection (Fig. 2 A). As a positivecontrol, we included recombinant IFN-α for 24 h (Fig. 2 A).We confirmed modest up-regulation of IFN-α–induced genesin singly deficient cells and robust induction in combinedhnRNPC+ADAR–targeted cells, with increasing differential ex-pression over the 3-d time course (Fig. 2 B and Data S1). Todetermine if these IFN-α genes were synergistically inducedin the double knockout, we again assessed a statistical inter-action between hnRNPC and ADAR targeting for these 158 ISGs
Herzner et al. Journal of Experimental Medicine 2 of 23
Type I IFN synergy of ADAR and hnRNPC deficiency https://doi.org/10.1084/jem.20201833
Dow
nloaded from http://rupress.org/jem
/article-pdf/218/9/e20201833/1420257/jem_20201833.pdf by C
alif San Diego (Biom
) user on 28 July 2021
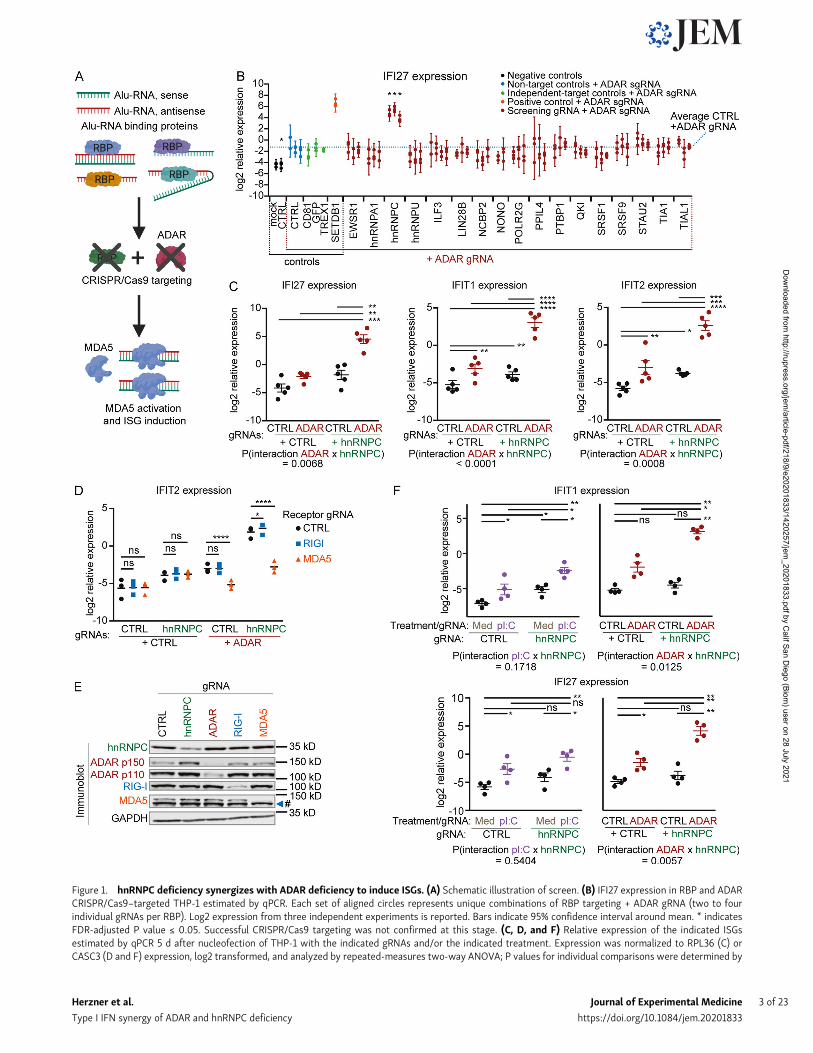
Figure 1. hnRNPC deficiency synergizes with ADAR deficiency to induce ISGs. (A) Schematic illustration of screen. (B) IFI27 expression in RBP and ADARCRISPR/Cas9–targeted THP-1 estimated by qPCR. Each set of aligned circles represents unique combinations of RBP targeting + ADAR gRNA (two to fourindividual gRNAs per RBP). Log2 expression from three independent experiments is reported. Bars indicate 95% confidence interval around mean. * indicatesFDR-adjusted P value ≤ 0.05. Successful CRISPR/Cas9 targeting was not confirmed at this stage. (C, D, and F) Relative expression of the indicated ISGsestimated by qPCR 5 d after nucleofection of THP-1 with the indicated gRNAs and/or the indicated treatment. Expression was normalized to RPL36 (C) orCASC3 (D and F) expression, log2 transformed, and analyzed by repeated-measures two-way ANOVA; P values for individual comparisons were determined by
Herzner et al. Journal of Experimental Medicine 3 of 23
Type I IFN synergy of ADAR and hnRNPC deficiency https://doi.org/10.1084/jem.20201833
Dow
nloaded from http://rupress.org/jem
/article-pdf/218/9/e20201833/1420257/jem_20201833.pdf by C
alif San Diego (Biom
) user on 28 July 2021

by factorial design analysis and found statistically significantinteractions for 0, 87, or 147 on day 3, 4, or 5, respectively (falsediscovery rate [FDR]-adjusted P[interaction] ≤ 0.05; Fig. 2 C andData S2). Using this RNA-seq dataset, it was possible to explorehow hnRNPC could prevent ISG induction.
hnRNPC suppresses the incorporation of Alu-containingintronic RNAhnRNPC had been shown to bind U-rich regions in antisenseAlu-RNA, in turn masking cryptic splice sites and preventing
incorporation of intronic Alu-RNA into mature transcripts(Zarnack et al., 2013). Furthermore, a recent study showedthat hnRNPC deletion in human breast cancer cell lines led tosplicing errors and RIG-I–dependent ISG production that wasdue to exposure of dsRNA-containing intronic products of thenonsense-mediated decay (NMD) machinery (Wu et al., 2018).Using the LeafCutter computational package as an annotation-independent differential splicing discovery tool (Li et al., 2017),we could indeed confirm widespread dysregulated splicing.Moreover, LeafCutter-defined splicing clusters (schematic
Sidak’s (C and F) or Bonferroni’s (D) post hoc test. *, P ≤ 0.05; **, P ≤ 0.01; ***, P ≤ 0.001; ****, P ≤ 0.0001. Individual symbols are replicates from five (C), three(D), or four (F) independent experiments; mean (D) or mean ± SEM is depicted (C and F). P values for interaction between ADAR and hnRNPC targeting (C andF) or hnRNPC targeting and pI:C treatment (F) are indicated. Cells were nucleofected with three gRNAs per condition in the indicated combinations, targetinghnRNPC, ADAR, RIG-I, or MDA5. (E)Western immunoblot of THP-1 as in D, nucleofected with hnRNPC, ADAR, RIG-I, or MDA5 gRNAs for 4 d. One representativeof three experiments. # indicates a nonspecific protein band detected by MDA5 antibody. CTRL, nontarget control; Med, medium; sgRNA, single-guide RNA.
Figure 2. RNA-seq analysis of gene expression confirms global ISG induction. (A) Schematic illustration of RNA-seq experimental design: THP-1 wasnucleofected with gRNAs on day 0, and cells were harvested on days 3, 4, and 5. In addition, nontarget gRNA nucleofected cells were treated with IFN-α on day3–4 for 24 h. (B) Differential expression analysis of RNA-seq data of THP-1 on day 3–5; comparisons are indicated. IFN-regulated genes are indicated (foldchange ≥ 2 and FDR-adjusted P value ≤ 0.05). Only genes differentially regulated in the specific comparisons are displayed; all else are indicated by two-dimensional–density plotting. Correlation coefficient R between IFN-α–regulated genes in IFN-α–treated and ADAR+hnRNPC gRNA nucleofected cells on day5: 0.889. (C) Heatmap of expression of IFN-regulated genes, displayed as fold-change relative to nontarget control (CTRL), ordered by fold-change in IFN-α–treatedcells. Top IFN-α–induced genes are indicated. Dark gray annotation bars indicate significant ADAR × hnRNPC interaction (FDR-adjusted P value ≤ 0.05) in factorialanalysis on days 3, 4, and 5 each. (B and C) Data are from three independent replicates.
Herzner et al. Journal of Experimental Medicine 4 of 23
Type I IFN synergy of ADAR and hnRNPC deficiency https://doi.org/10.1084/jem.20201833
Dow
nloaded from http://rupress.org/jem
/article-pdf/218/9/e20201833/1420257/jem_20201833.pdf by C
alif San Diego (Biom
) user on 28 July 2021

representation in Fig. S3, A and B), which contain splice sitesthat map to Alu elements, were enriched among differentiallyspliced clusters (Fig. 3 A). Furthermore, splice sites from sig-nificantly regulated splice clusters and in close proximity (≤50bp) of hnRNPC CLIP peaks from the ENCODE database (https://www.encodeproject.org/) as well as from the above-mentionedprevious study (Zarnack et al., 2013) showed increased relativeuse upon hnRNPC deficiency (Fig. 3 B; and Fig. S3 C, schematicillustration). We confirmed splicing dysregulation for severaltranscripts by quantitative PCR (qPCR) in both THP-1 andMCF-7 (Fig. 3, C and D).
Strikingly, ∼27% of expressed genes overlapped with at leastone differentially regulated splicing cluster in hnRNPC defi-ciency (FDR-adjusted P value ≤ 0.01). Genes overlapping withhighly regulated splicing clusters (FDR-adjusted P value ≤ 0.001)showed a shift toward decreased expression upon hnRNPC de-ficiency (Fig. 3 E). These findings are consistent with the en-gagement of NMD in differentially spliced genes (Attig et al.,2016). It was previously described that NMD in hnRNPC singledeficient cells primarily affects genes with small inclusions ofAlu sequences. To confirm NMD targeting, we targeted UPF1, anRNA helicase essential for functional NMD (Fig. 3 F; Kim andMaquat, 2019).Wemeasured the expression of SMG5, which is atypical target of NMD during the steady state (Yepiskoposyanet al., 2011), as well as four genes that showed reduced expres-sion in hnRNPC in the RNA-seq and evidence of inclusion ofsmall Alu exons by qPCR (Fig. 3, G and H). While we couldconfirm decreased expression of all four genes with Alu in-clusions, overall, UPF1 targeting had modest effects on theexpression of SMG5 and of three of the four putative hnRNPC-knockout–induced NMD targets (Fig. 3, G and H). However, inall cases a trend toward increased expression could be con-firmed, indicating contribution of NMD in transcript regulationduring hnRNPC expression.
While exploring potential sources of dsRNA introduced byhnRNPC deletion, we manually inspected differentially splicedclusters and found expression of long intron fragments thatcould be incorporated into mature RNAs, as highlighted by arepresentative example in RBM17 (Fig. 4 A). We hypothesizedthat the intronic sequences incorporated into mature transcriptscould result in the inclusion of inverted repeat-Alu elements as asource of dsRNA. Therefore, we quantified the expression ofintronic sequences, as estimated by RNA-seq read counts map-ping to intronic regions. To avoid errors in annotation, we de-rived introns from dominantly expressed transcripts that wereannotated within APPRIS (Annotation of Principal and Alter-native Splice Isoforms), a well-curated resource (Fig. S2 D;Rodriguez et al., 2013). Differential expression analysis of RNAderived from these APPRIS-annotated intronic regions con-firmed increased abundance of Alu-containing introns as de-scribed earlier (Wu et al., 2018; Attig et al., 2016; Fig. 4 B andData S3). We found that this regulation was invariant in ADAR-expressing and ADAR-deficient cells, and excluding a role foran IFN feedback loop, we demonstrated no enrichment for Alu-containing introns in IFN-α–treated cells (Fig. 4 B).
It was important to consider two possible mechanisms thatmight account for these observations: higher intron expression
could be due to increased incorporation into mRNAs; alterna-tively, it may simply be a reflection of changes in the tran-scription of the respective gene. Comparing intron regulationwith expression changes of respective genes confirmed thathnRNPC deletion results in increased intron RNA abundancein the absence of up-regulated gene expression, indicating in-creased incorporation of intronic RNA into transcripts (Fig. 5, Aand B). By contrast, for most up-regulated introns in IFN-α–treated cells, the respective genes were induced to a similardegree, indicating comparable levels of intron incorporationinto differentially regulated transcripts (Fig. 5, C and D).ADAR+hnRNPC double-deficient cells showed a mixed pattern.About half of the differentially expressed introns were regu-lated in a manner that was independent of gene expression, andthese introns contained Alu sequences and overlapped withdifferentially regulated splicing clusters and therefore werelikely targets for cis-regulation by hnRNPC (Fig. 5, E and F).The remaining set of dysregulated introns showed an expres-sion pattern similar to that of their respective genes and wereinterpreted as being due to the observed differential tran-scription and likely a result of MDA5 activation. These datadefinitively established dysregulated splicing in hnRNPC-deficient cells as the determinant of increased expression of Alu-containing introns. See Data S4 for further information aboutFig. 5, A, C, and E.
A-to-I editing cluster-rich RNAs show increased abundance inhnRNPC-deficient cellsThe most popular model for preventing MDA5 activation sug-gests a dominant role for the introduction of mismatches inendogenous dsRNA by ADAR-mediated A-to-I editing (Liddicoatet al., 2016). We thus sought to identify stretches of clusteredediting in intronic regions up-regulated in hnRNPC-deficientcells. Indeed, while assessing differentially expressed introns,we observed multiple A-to-I editing clusters in a subset of in-trons, indicating extensive dsRNA formation (Fig. 6, A–C).However, we hypothesized that Alu-containing introns didnot comprehensively capture all RNAs containing editingclusters that are differentially expressed in an hnRNPC-deficient state. To discover editing-cluster–rich regions (ECRs)in a transcriptome-wide manner, we employed the SAILORpipeline, which identifies adenosine-to-guanosine transitions(the result of reverse transcription of inosine bases) in RNA-seqdata (Deffit et al., 2017). To remove singleton editing events, weestablished a filter to capture clusters of multiple edits (five ormore), with “cluster” defined by their location within 50 bp ofeach other (Fig. 6 D). We validated the selected editing sites bycomparing editing in WT and ADAR-deficient cells as well asIFN-α–treated (ADAR up-regulated) cells (Fig. 6, E–G). Interest-ingly, hnRNPC deficiency could lead to both slightly increasedand decreased editing in a subset of editing sites. Furthermore,ADAR deficiency combined with hnRNPC reduced editing rel-ative to hnRNPC single deficiency (Fig. 6, H and I). Using allsamples as a basis for editing cluster discovery, we found that57% of the editing clusters were localized to introns, with theremaining mostly shared between 39 untranslated regions (UTRs;18%) and unannotated regions (23%; Fig. 6 J). Of the intergenic
Herzner et al. Journal of Experimental Medicine 5 of 23
Type I IFN synergy of ADAR and hnRNPC deficiency https://doi.org/10.1084/jem.20201833
Dow
nloaded from http://rupress.org/jem
/article-pdf/218/9/e20201833/1420257/jem_20201833.pdf by C
alif San Diego (Biom
) user on 28 July 2021
Figure 3. Differential splicing and effects of NMD in hnRNPC deficiency. (A) Differential splicing between nontarget control (CTRL) and hnRNPC gRNAnucleofected THP-1 was analyzed as indicated in Materials and methods. Displayed is the relative number of differentially spliced clusters as a function of theFDR-adjusted P value cutoff. Clusters were stratified by the mapping of at least one splice site to one Alu element (red, Alu); no site mapping to Alu, but at leastone site mapping to any other RepeatMasker element (blue, non-Alu RE); or no site mapping to any RepeatMasker element (black, no RE). Fractions ofdifferentially regulated splice clusters relative to all clusters for each cutoff are indicated above the bars. (B) Relative use of splice sites within significantlyregulated splice clusters (P ≤ 0.001), stratified by distance to the next CLIP peak as discovered by the ENCODE project or Zarnack et al. (2013). White barsindicate 25–75 percentile ranges; red line indicates median. P value for Wilcoxon’s rank sum test is indicated. Percentages indicate fractions of CLIP clusters
Herzner et al. Journal of Experimental Medicine 6 of 23
Type I IFN synergy of ADAR and hnRNPC deficiency https://doi.org/10.1084/jem.20201833
Dow
nloaded from http://rupress.org/jem
/article-pdf/218/9/e20201833/1420257/jem_20201833.pdf by C
alif San Diego (Biom
) user on 28 July 2021

clusters, the majority were downstream of a 39 UTR (58.0%≤5,000-bp distance, 66.8% ≤10,000-bp distance from the end ofannotated 39 UTR) and are likely within read-through or alter-natively spliced unannotated 39 UTRs (Fig. S3, E and F).
Direct quantification of editing cluster expression was chal-lenging, sincemanywere localized to Alu elements that often ledto multi-mapping RNA-seq reads. To circumvent this problem,we defined ECRs, grouping editing clusters <2,000 bp apart and
that have ≤50-nt distance to splice junctions contained within significantly regulated splice clusters as defined above. (A and B) Data are from three inde-pendent experiments. (C and D) Confirmation of splice events in THP-1 (C) and MCF-7 (D). To achieve specificity, one primer was designed to match uniqueexonic sequences, and the second primer was designed to span the splice site with 1–4 nt matching the exon end. Individual symbols are replicates from three(C) or five (D) independent experiments. Missing circles, none detected. Data were normalized to CASC3 expression. (E) Log2 fold-change expression of genesupon hnRNPC deficiency on day 3–5, stratified by their genomic overlap with the location of a differentially regulated splice cluster (P ≤ 0.001). Data are fromthree independent experiments. (F) Western blot of CTRL or UPF1 gRNA-targeted cells. One representative of three experiments. WT and UPF1-targetedsamples are from the same blot; irrelevant lanes were removed. IB, immunoblot. (G) Relative expression of SMG5 in CTRL or UPF1 gRNA-targeted THP-1.Expression was normalized to CASC3. Individual symbols are replicates from three independent experiments; mean ± SEM is depicted. (H) Expression of aselection of Alu-exon–containing transcripts that are down-regulated upon hnRNPC deficiency. Expression was normalized to CASC3 expression, log2transformed, and analyzed by repeated-measures two-way ANOVA, and P values for individual comparisons were determined using Sidak’s post hoc test.Individual symbols are replicates from three independent experiments; mean ± SEM is depicted. *, P ≤ 0.05; **, P ≤ 0.01; ***, P ≤ 0.001. Probes were designedto not span the intron containing the Alu-exon. Closed circles, nontarget control gRNA; open circles, UPF1 gRNA.
Figure 4. Dysregulation of introns in hnRNPC-deficient THP-1. (A) Raw coverage of RNA-seq reads and splice junctions estimated from split reads at theRBM17 locus (+ strand is shown only); analysis shown for cells 4 d after nucleofection with nontarget control (top) or hnRNPC gRNA (bottom). Canonical splicejunctions shown in light blue, hnRNPC deficiency–dependent splice junctions in dark blue. One representative of three. (B) Differential expression analysis ofintronic regions either of cells treated with recombinant IFN-α for 24 h (bottom) or nucleofected with control gRNA (CTRL), hnRNPC gRNA, ADAR gRNA, orboth ADAR and hnRNPC gRNA for 3–5 d as indicated in Materials and methods. Comparisons are indicated (as in Fig. 2 B); data are from three independentexperiments. 2D, two-dimensional.
Herzner et al. Journal of Experimental Medicine 7 of 23
Type I IFN synergy of ADAR and hnRNPC deficiency https://doi.org/10.1084/jem.20201833
Dow
nloaded from http://rupress.org/jem
/article-pdf/218/9/e20201833/1420257/jem_20201833.pdf by C
alif San Diego (Biom
) user on 28 July 2021

Figure 5. Splicing-dependent intron dysregulation is independent of gene expression. (A, C, and E) Heatmap of expression of differentially regulatedintrons (left, fold change ≥4, FDR-adjusted P value ≤ 0.01 in any per-day pairwise comparison) and their respective genes (right) in nontarget control (CTRL)
Herzner et al. Journal of Experimental Medicine 8 of 23
Type I IFN synergy of ADAR and hnRNPC deficiency https://doi.org/10.1084/jem.20201833
Dow
nloaded from http://rupress.org/jem
/article-pdf/218/9/e20201833/1420257/jem_20201833.pdf by C
alif San Diego (Biom
) user on 28 July 2021
including 1,000 bp upstream and downstream of the clustergroup (strategy depicted in Fig. 7 A). The abundance of multipleintronic and intergenic ECRs was increased in hnRNPC-depletedcompared with WT cells, irrespective of ADAR status (Fig. 7 B).These results indicated widespread dysregulation of dsRNAsupon hnRNPC deficiency, while IFN-α treatment as controlregulated few ECRs (Fig. 7 C and Data S5). Synergistic ISG in-duction in ADAR+hnRNPC–deficient cells must depend on boththe impaired function of hnRNPC and ADAR. We thereforequantified editing in ECRs and found that, indeed, editing wasreduced in ECRs after targeting ADAR, with slightly increasedediting upon hnRNPC targeting (Fig. 7 D). Conversely, averageediting of ECRs was increased in IFN-α–treated cells, consistentwith increased expression of the ISG ADAR. Importantly, ECRsthat were differentially regulated upon hnRNPC deficiency showedreduced editing in ADAR-deficient cells, rendering them putativeMDA5 ligands (Fig. 7 E and Data S6).
While many transcripts with small Alu inclusions were tar-geted by NMD, Attig et al. (2016) indicated that expression oftranscripts with long intron inclusions, such as those containingECRs in hnRNPC-deficient cells, was barely affected. Therefore,we quantified ECR expression in UPF1-targeted cells by qPCR.We confirmed up-regulation in hnRNPC-targeted cells as indi-cated by RNA-seq but did not observe major effects of UPF1targeting on ECR expression (Fig. 8 A). Furthermore, we mea-sured ISG expression in cells targeted for hnRNPC, ADAR, and/orUPF1. Unexpectedly, we found that UPF1 targeting led to signif-icant reduction of ISG expression in ADAR singly deficient cells,leading to comparable reduction of ISG expression in ADAR/hnRNPC doubly deficient cells (Fig. 8 B). When including onlyADAR-targeted samples into the analysis (Fig. 8 B, red circles),we could not detect any statistical interaction between hnRNPCand UPF-1 targeting, indicating that NMD does not meaningfullyaffect the expression of ECRs relevant for ISG induction.
These analyses indicate a role for hnRNPC in suppressingexpression of multiple potential MDA5 ligands that are presentwithin introns, alternatively spliced or elongated 39 UTRs, andcan be rendered highly immunogenic upon ADAR deficiency.
A-to-I editing cluster-rich RNAs gain access to the cytosolIn general, retained introns do not gain access to the cytosol(Fazal et al., 2019), and Alu-rich, long noncoding RNAs are morelikely to be localized to the nucleus (Lubelsky and Ulitsky, 2018).Nevertheless, a recent study found that Alu-containing intronsin hnRNPC-deficient cells were unique in their ability to accu-mulate in the cytosol (Attig et al., 2016). Therefore, we aimed totest which ECRs might gain access to the cytosol. Cellular frac-tionation and enrichment of cytosolic RNAwas confirmed by theseparation of nuclear long noncoding and mitochondrial RNAs
from housekeeping mRNAs (Fig. 9 A and Data S7). Using MA-LAT1 (nuclear), MT-ND1 (mitochondria), and ACTB (cytosolic)RNAs as reference RNAs for the respective subcellular com-partments, we found that multiple ECRs, which are dysregulatedin hnRNPC-deficient cells, showed greater access to the cytosolcompared with MALAT1 (Fig. 9 B, Fig. S4 A, and Data S8). Weaimed to confirm cytosolic presence by BaseScope in situ hy-bridization (ISH). Due to the repetitive nature of ECRs, we werelimited in the ECRs we could target. We detected higher ex-pression in hnRNPC deficiency as well as the presence of ex-tranuclear ECRs in a subset of cells, confirming that ECRs areable to be released into the cytosol (Fig. 9 C and Fig. S4 B). To testwhether cytosolic putative ligands are comparable to previouslydescribed inverted-repeat Alu element (irAlus), which havebeen described as being able to activate MDA5 filament forma-tion (Ahmad et al., 2018), we identified long paired stretches in asubset of highly up-regulated, likely cytosolic ECRs. We deter-mined their total length, number of mismatches, and length oflongest uninterrupted dsRNA, the latter likely constituting thefilament formation seed. We found that several of the ECRsharbored paired stretches with very similar properties (length>300 nt, mismatched nucleotide fraction <0.2, and/or longestuninterrupted dsRNA stretch ≥37 bp) as the previously de-scribed MDA5 stimulatory irAlus (Fig. 9 D).
As only unedited endogenous dsRNAs are believed to activateMDA5, we estimated differential editing of putative ligands inADAR deficiency. Importantly, the set of putative MDA5 ligandscontained multiple editing clusters and showed reduced editingin ADAR-deficient cells, mean of absolute reduction, 12.2%;mean of relative reduction, 53.4% (Fig. 9 B). Furthermore, in-dividual sites within ECRs showed much stronger reduction inediting, especially those with high editing frequencies in ADARWT cells (Fig. 10). We conclude that hnRNPC protects the hostcell fromMDA5 ligands that might otherwise have access to thecytosol, establishing a second line of endogenous defense forinverted repeat Alu elements.
DiscussionIn this study, we demonstrated that ADAR and hnRNPC coop-eratively prevent autoinflammatory activation of MDA5 by en-dogenous dsRNA stretches. While ADAR marks endogenousdsRNA structures by editing As-to-Is, thereby reducing their“double strandedness” (Liddicoat et al., 2016), hnRNPC limitsMDA5 access to dsRNA derived from introns or intergenic regions’neighboring genes by preventing cryptic splice site usage (illus-trated in Fig. S5). Upon hnRNPC deficiency, ADAR partiallycompensates for the higher abundance by A-to-I editing, but upondeficiency of both RBPs, an excess of unedited dsRNA-containing
and hnRNPC gRNA nucleofected cells (A), untreated and IFN-α–treated cells (C), or nontarget control, ADAR gRNA, or ADAR and hnRNPC gRNA doublynucleofected cells (E). Introns or exonic counts aggregated at the gene level are shown as average log2 (fold change) from three independent experiments,relative to average expression in CTRL nucleofected cells across all days. Data were clustered by correlation. Annotations left of heatmaps indicate correlationcluster (left), overlap of intron with differentially regulated splicing cluster (as in Fig. 3 A; center), or overlap with an Alu element, no Alu but another repetitiveelement, or no element (right). (B, D, and F) Stacked histograms of the difference between the log2-transformed fold change (log2FC) of introns and thecorresponding genes as in A, C, and E on days 3–5 as indicated (B and F) or after 24 h of treatment (D). Bar coloring corresponds to annotations in A, C, and E,respectively. logFC, log fold change.
Herzner et al. Journal of Experimental Medicine 9 of 23
Type I IFN synergy of ADAR and hnRNPC deficiency https://doi.org/10.1084/jem.20201833
Dow
nloaded from http://rupress.org/jem
/article-pdf/218/9/e20201833/1420257/jem_20201833.pdf by C
alif San Diego (Biom
) user on 28 July 2021
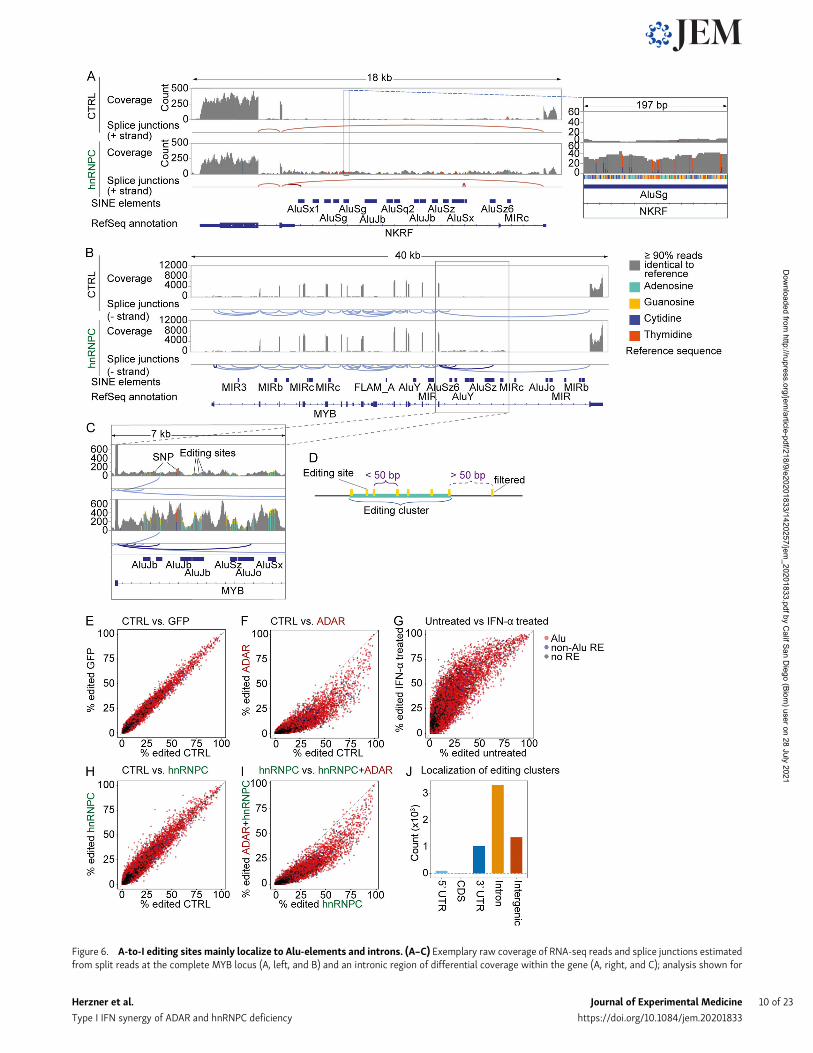
Figure 6. A-to-I editing sites mainly localize to Alu-elements and introns. (A–C) Exemplary raw coverage of RNA-seq reads and splice junctions estimatedfrom split reads at the complete MYB locus (A, left, and B) and an intronic region of differential coverage within the gene (A, right, and C); analysis shown for
Herzner et al. Journal of Experimental Medicine 10 of 23
Type I IFN synergy of ADAR and hnRNPC deficiency https://doi.org/10.1084/jem.20201833
Dow
nloaded from http://rupress.org/jem
/article-pdf/218/9/e20201833/1420257/jem_20201833.pdf by C
alif San Diego (Biom
) user on 28 July 2021

transcripts in the cytosol leads to synergistic ISG induction. Wedemonstrated that these dsRNA-containing transcripts origi-nated from retained introns or intergenic RNAs. Their intergeniclocalization suggested that they are independently expressed andmay also be derived from elongated 39 UTRs or alternative 39UTRs. With respect to the latter class of transcripts, hnRNPC hasbeen described as suppressing the use of distal polyadenylationsites (Gruber et al., 2016) as well as the exonization of intergenicAlu elements, which may result in alternative 39 UTR usage(Tajnik et al., 2015).
A recent study reported that hnRNPC deficiency inducedtype I IFN responses in breast cancer cells. These findings in-dicated a role for RIG-I activation by transcripts that weresubject to NMD (Wu et al., 2018). While transcripts with exon-ized Alu elements in hnRNPC-deficient cells have been shown tobe subjected to NMD (Attig et al., 2016), the study did notdemonstrate a role for MDA5 (Wu et al., 2018). In our studies,the synergistic ISG response was independent of RIG-I, indi-cating the possibility that two distinct cellular sensors are able torecognize hnRNPC-regulated endogenous ligands. Furthermore,in contrast with the previous study, UPF1 targeting did not affectISG expression in hnRNPC singly deficient cells. To our surprise,ISG responses following ADAR deficiency were strongly reducedby UPF1 depletion, which also impacted the ISG response toADAR/hnRNPC combined deficiency. To our knowledge, the UPF1dependency of the response to ADAR deficiency has not been pre-viously described and should be followed up in further studies. Itremains unclearwhetherNMD is required forMDA5 ligand activityor whether UPF1 plays a more direct role in MDA5 signaling by, forexample, protein–protein interactions. Due to this finding, we couldnot fully disambiguate the role of NMD in hnRNPC/ADAR defi-ciency. Nonetheless, the lack of increased ECR expression suggestedlikely resistance to NMD for the identified putative MDA5 ligands.This conclusion is in accordance with a previous study that de-scribed that long introns incorporated during hnRNPC deficiencyare not subject to NMD (Attig et al., 2016).
Differences in cytosolic RNA receptor expression could ex-plain differences observed in our study and the study by Wuet al. (2018). We could not exclude, however, activation of fur-ther dsRNA receptors or a possible hierarchy to the response, asRIG-I is expressed in THP-1, indicating that the RIG-I–activatingcapacity of NMD-processed hnRNPC-dependent ligands may besubordinate to the more dominant response induced by MDA5being engaged by long, unprocessed, unedited Alu-containingdsRNAs. An additional caveat that challenges direct comparisonis the technical aspects of genetic perturbation: RNAi inWu et al.(2018) versus CRISPR/Cas9 targeting in our study, with the latterresulting in more limited off-target effects (Smith et al., 2017).
While we aimed to identify the exact nature of the hnRNPC-limited MDA5 ligands, we faced multiple technical challenges(promiscuous binding of MDA5 to any RNA, mapping challengesfor repetitive elements, byproducts in in vitro–generated li-gands, and failed cross-linking of MDA5 and its target RNA ineCLIP-like experiments). In fact, the optimal endogenous RNAligand(s) are still ill-defined. A recent study showing that anediting-insensitive MDA5 mutant can protect irAlu elementRNA in vitro was a first step into discovering and characterizingendogenousMDA5 ligands (Ahmad et al., 2018; Mehdipour et al.,2020). However, the true nature of the MDA5 recognition motifremains controversial. While in vitro experiments and crystalstructure studies suggest perfect dsRNA longer than 300 bp is aprerequisite for MDA5 activation (Peisley et al., 2011, 2012; Wuet al., 2013), endogenous RNA ligands with these features havenot been formally identified. Using acridine orange staining, onestudy suggested that the main stimulatory components duringviral infection are high molecular weight, complex, or evenbranched RNA structures that are most effective at activatingMDA5 during viral infections (Pichlmair et al., 2009). A morerecent study suggests that even 300-bp inverted repeat Alu el-ement RNA hairpins, including several mismatches, could acti-vate MDA5 in vitro, which was inhibited by in vitro ADARediting (Ahmad et al., 2018). These ligands could be identified byan in vitro MDA5 filament formation and RNase protection as-say. This study was recently supported by another study thatsimilarly confirmed irAlu RNAs as ligands for WT MDA5 byin vitro RNase protection (Mehdipour et al., 2020). The numberof protected irAlu RNAs could be increased upon treatment withthe DNA-methyltransferase inhibitor 5-aza-29-deoxycytidineand/or ADAR deficiency. The increase in irAlu protection byMDA5 upon 5-aza-29-deoxycytidine treatment was due to anincrease in Alu expression driven by demethylated orphanCpG islands, independent of neighboring gene expression. De-repressed irAlu expression led to ISG induction and sensitiza-tion of cancer cells to ADAR targeting (Mehdipour et al., 2020).Our data strongly support Alu elements as the main sourceof potential endogenous MDA5 ligands, since they form themajority of dysregulated MDA5 ligands in hnRNPC deficiency.Independent of hnRNPC targeting, a recent study describedspliceosome inhibition in triple-negative breast cancer withMYC-driven hyperactivated transcriptional activity. Similarto the results found in hnRNPC-deficient cells, spliceosome tar-geting led to release of intronic dsRNA such as irAlus into thecytosol and ISG induction (Bowling et al., 2021).
Our work sheds important light on the regulation of sterileinflammation during malignant transformation. Regarding theregulation of RNA processing, including splicing and 39 UTR end
cells 4 d after nucleofection with nontarget control (top) or hnRNPC gRNA (bottom). Data shown are from one representative of three independent ex-periments. Regular splice junctions shown in light red (A) or light blue (B and C); hnRNPC deficiency–dependent splice junctions in dark red (A) or dark blue (Band C). Bars are average coverage, gray, <10% reads differ from the reference sequence; colored bars indicate ≥10% of reads differ from reference. Green, A;orange, G; red, T; blue, C. Note that nongray bars are highlighted; columns widths are therefore not to scale. One representative of three. Note that NKRF isencoded on the (−) strand, causing A-to-I editing to appear as T-to-C transition. (D) Schematic illustration of editing cluster definition and editing clusters.Editing sites with distances 50 bp or lower were clustered; sites with longer distances were excluded from final selection. (E–I) Inosine frequencies at individualA-to-I editing sites in cells nucleofected with nontarget control gRNA (CTRL) or targeting GFP, ADAR, and/or hnRNPC, as indicated. Data are from threeindependent experiments. (J) Localization of editing clusters as defined in D.
Herzner et al. Journal of Experimental Medicine 11 of 23
Type I IFN synergy of ADAR and hnRNPC deficiency https://doi.org/10.1084/jem.20201833
Dow
nloaded from http://rupress.org/jem
/article-pdf/218/9/e20201833/1420257/jem_20201833.pdf by C
alif San Diego (Biom
) user on 28 July 2021

Figure 7. A-to-I editing cluster–containing RNAs are dysregulated in hnRNPC–deficient THP-1. (A) Schematic illustration of ECR definition. (B and C)Differential expression analysis of ECRs as defined in A on day 3, 4, and 5 after nucleofection as indicated in the Materials and methods; comparisons are
Herzner et al. Journal of Experimental Medicine 12 of 23
Type I IFN synergy of ADAR and hnRNPC deficiency https://doi.org/10.1084/jem.20201833
Dow
nloaded from http://rupress.org/jem
/article-pdf/218/9/e20201833/1420257/jem_20201833.pdf by C
alif San Diego (Biom
) user on 28 July 2021

processing, it is often dysregulated in tumor cells (Obeng et al.,2019). In several studies, this phenomenon has been linked tohnRNPC expression levels. Interestingly, it has been shown thathnRNPC is overexpressed in lung, colon, hepatocellular, and oralsquamous cell carcinoma and glioblastoma (Sun et al., 2007;Park et al., 2012; Sebestyen et al., 2016; Huang et al., 2020; Guoet al., 2021), with lower expression associated with better
survival (Tremblay et al., 2016; Huang et al., 2020; Guo et al.,2021). Some mechanisms by which hnRNPCmight be implicatedin malignant transformation have been described, includingdifferential c-myc translation, BRCA1 splicing, and regulation ofPDCD4 expression (Kim et al., 2003; Park et al., 2012; Ananthaet al., 2013). Our data indicate that increased hnRNPC expres-sion may also be a way of escaping the activation of innate
indicated. The size of the circles indicates the number of clusters per cluster group; the colors indicate the localization of the clusters contained in the groups.(D) Difference of average editing for days 3–5 in ADAR or hnRNPC gRNA nucleofected or IFN-α–treated THP-1, compared with respective nontarget controlnucleofected cells. ECRs expressed at ≥4 rpkm across all conditions were considered for analysis. (E) Average percent editing of all ECRs on days 3, 4, and 5 inhnRNPC singly and ADAR+hnRNPC doubly targeted cells. Shown are ECRs that were up-regulated on day 4 in hnRNPC-deficient cells. Colors are as in B; size ofthe circles indicates the number of clusters contained within the ECRs. Lines connect values for individual ECRs between hnRNPC- and hnRNPC+ADAR–targeted cells. (B–E) Data are from three independent experiments. CTRL, nontarget control; 2D, two-dimensional.
Figure 8. UPF1 deficiency only mildly affects ECR expression and reduces ISG expression upon ADAR deficiency. (A and B) Expression of a selection ofECRs (A) or ISGs (B) in THP-1 nucleofected with ADAR, hnRNPC, and/or UPF1 gRNA for 5 d. Expression was normalized to CASC3 expression, log2-transformed,and analyzed by repeated-measures two-way ANOVA and P values for comparisons between CTRL and UPF1 gRNA nucleofected cells determined using Sidak’spost hoc test. *, P ≤ 0.05; **, P ≤ 0.01; ***, P ≤ 0.001; ****, P ≤ 0.0001. Individual symbols are replicates from three independent experiments. CTRL, nontargetcontrol; 2D, two-dimensional.
Herzner et al. Journal of Experimental Medicine 13 of 23
Type I IFN synergy of ADAR and hnRNPC deficiency https://doi.org/10.1084/jem.20201833
Dow
nloaded from http://rupress.org/jem
/article-pdf/218/9/e20201833/1420257/jem_20201833.pdf by C
alif San Diego (Biom
) user on 28 July 2021
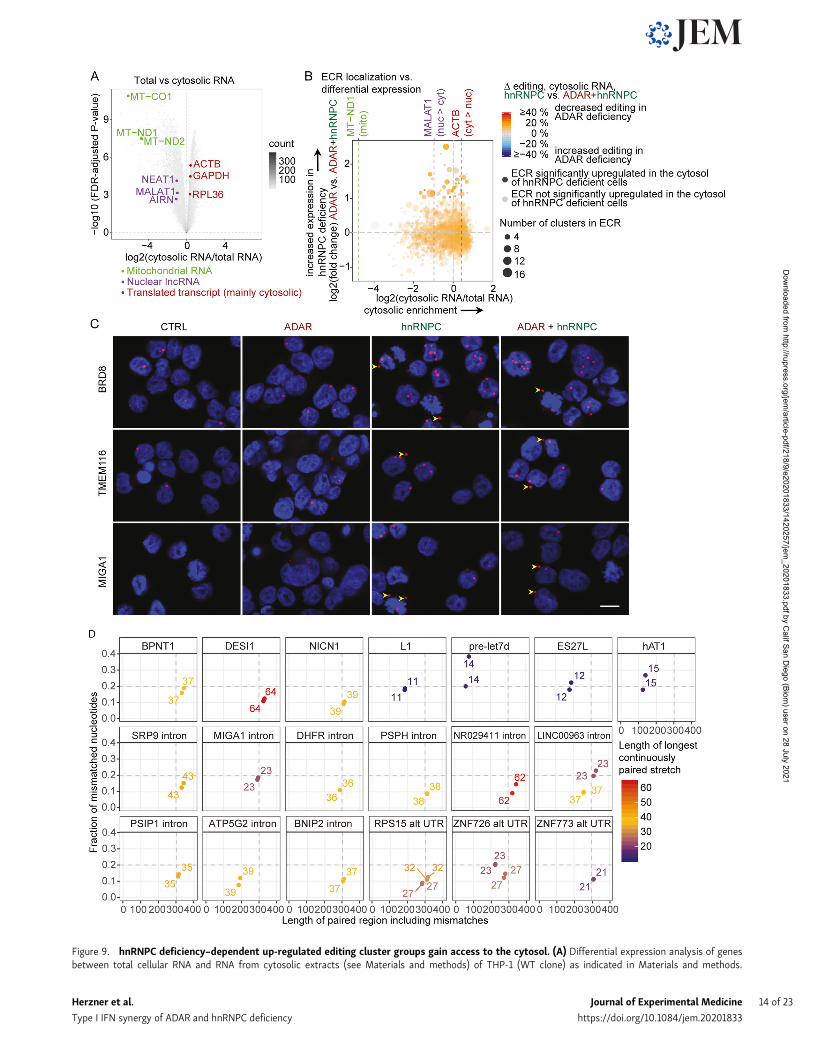
Figure 9. hnRNPC deficiency–dependent up-regulated editing cluster groups gain access to the cytosol. (A) Differential expression analysis of genesbetween total cellular RNA and RNA from cytosolic extracts (see Materials and methods) of THP-1 (WT clone) as indicated in Materials and methods.
Herzner et al. Journal of Experimental Medicine 14 of 23
Type I IFN synergy of ADAR and hnRNPC deficiency https://doi.org/10.1084/jem.20201833
Dow
nloaded from http://rupress.org/jem
/article-pdf/218/9/e20201833/1420257/jem_20201833.pdf by C
alif San Diego (Biom
) user on 28 July 2021

immune receptors under conditions of transcriptional stressduring increased proliferation. In many cancers, splicing isdysregulated; therefore, hnRNPC may be overexpressed tocompensate and prevent the access of dsRNA to the cytosol(Sveen et al., 2016). In light of the active development of ADARinhibitors, low hnRNPC expression could serve as a predictivebiomarker. Importantly, the sensitization for ADAR deficiencyby hnRNPC deficiency was particularly pronounced in trans-formed cells but not in primary cells, suggesting a putativetherapeutic window that could be exploited for systemic use of
ADAR inhibitors. As an alternative strategy, our work also el-evates tumor-specific targeting of hnRNPC as a means to en-hance cancer immunotherapy.
Materials and methodsCRISPR targeting of cell linesTo generate protein-deficient cells, Cas9-transgenic THP-1or MCF-7 cells were nucleofected with hybridized CRISPRRNA (crRNA)+trans-activating crRNAs (referred to as gRNA)
Mitochondrially encoded genes (green), nuclear lncRNAs (purple), and expressed housekeeping mRNAs are highlighted; all else are displayed as 2D-densityplot. (B) Four-way plot of log2 (fold-change) expression of A-to-I ECRs. y axis: expression in ADAR gRNA singly versus ADAR+hnRNPC gRNA doubly nucle-ofected cells on day 4 after nucleofection. x axis: log2 (fold change) between total RNA and RNA from cytosolic extracts. Purple lines indicate values for MT-ND1, MALAT1, and ACTB RNAs as in A. Circle color indicates the average reduction in editing in hnRNPC single versus hnRNPC+ADAR double-deficiency asdifference of the average percent editing across all editing sites within each cluster group. Average of two samples per condition. Transparency indicatessignificant up-regulation in hnRNPC+ADAR over ADAR gRNA nucleofected cells; size of circles indicates number of clusters per cluster group. (A and B) Dataare from three independent experiments. (C) BaseScope analysis (red) of select ECRs in THP-1 with the indicated deficiencies. Arrowheads point to cytosolictranscripts. Nuclei were stained with DAPI (blue). Images are details of images in Fig. S4 B, which are representatives of three images each from two in-dependent experiments. Scale bar, 10 µm. (D) Comparison of previously described MDA5 ligands (BPNT1, DESI1, and NICN1) and negative controls (hAT1, L1,pre-let7d, and ES27L) to putative MDA5 ligands within ECRs by indicating length, including mismatches of each strand of the dsRNA stretch, fraction ofmismatched nucleotides, and length of the longest uninterrupted dsRNA stretch within putative MDA5 ligands. CTRL, nontarget control; cyt, cytosolic; 2D, two-dimensional; lncRNA, long noncoding RNA; mito, mitochondrially encoded; nuc, nuclear.
Figure 10. Editing reduction at individual sites in cytosolic-enriched RNA in ADAR deficiency. (A–C) Average high-confidence raw counts (n = 2) ofadenosines (green) and guanosines (= A-to-I edits, orange) at all high-confidence editing sites in exemplary ECRs located to introns in BRD8 (A), MIGA1 (B), orPSPH (C). Shown are data from cytosolic RNA extracts of cas9-transgenic WT THP-1. Deficiencies are indicated. Data are from two independent experiments.A, adenosine; CTRL, nontarget control; G, guanosine.
Herzner et al. Journal of Experimental Medicine 15 of 23
Type I IFN synergy of ADAR and hnRNPC deficiency https://doi.org/10.1084/jem.20201833
Dow
nloaded from http://rupress.org/jem
/article-pdf/218/9/e20201833/1420257/jem_20201833.pdf by C
alif San Diego (Biom
) user on 28 July 2021
as described before (Cuellar et al., 2017). Briefly, 2 d before nu-cleofection, THP-1 was centrifuged (350 g, 5 min, room tem-perature [RT]), and the pellet was resuspended in RPMI at adensity of 0.5e6 cells/ml or confluent MCF-7 split 1:2. For nu-cleofection, gRNAs were freshly annealed by mixing 100 µMcrRNA and 100 µM transactivating crRNA in nuclease-free du-plex buffer (IDT), heating to 95°C for 3 min and then cooling to4°C over the course of 10 min in a PCR cycler. All RPMI recoverymedium was incubated at 37°C and 5% CO2 for at least 30 min.For MCF-7, gRNAs (3 µl hnRNPC gRNA or control and 1.5 µlADAR gRNA or control) were mixed and incubated with 1.5 µlrecombinant V3 Cas9 protein (IDT) at RT for 10 min, then placedon ice until use. 2e6 THP-1 or MCF-7 per reaction was precipi-tated for 5 min at 350 rcf and RT, resuspended in PBS, andprecipitated again. Then, cells were resuspended in 20 µl P4primary cell buffer including supplement (Lonza; THP-1) or SGCell Line buffer including supplement (Lonza; MCF-7). gRNAs(THP-1) or ribonucleoparticles (MCF-7) targeting different geneswere nucleofected simultaneously; 2 µl per well of each gRNA(THP-1) or 6 µl premixed ribonucleoparticles (MCF-7) was pi-petted into 16–well-strip cuvettes (Lonza), and 20 µl cells wasadded and carefully mixed. After 5-min incubation at RT, cellswere nucleofected using the Lonza 4D-Nucleofector X unit withprotocol CM138 (THP-1) or CM137 (MCF-7). For recovery im-mediately after nucleofection, 100 µl medium was added to thecuvette wells, and the suspension was added to 70 µl medium ina U-bottom 96-well plate. From here, cells were transferred to1 ml medium per nucleofection and incubated at 37°C and 5% CO2
for 3–5 d (THP-1) or 4 d (MCF-7) until harvest for analysis. Forgeneration of STING-deficient single-cell clones, cells were sor-ted with a FACSAria Fusion cell sorter 1 d after nucleofection ofgRNAs. The WT THP-1 clone used in Fig. 9, A and B; Fig. 10; Fig.S2 B; and Fig. S4 A, as well as the WT clone used for BaseScopestaining (Fig. 9 C and Fig. S4 B) were generated in parallel bylimiting dilution. crRNA sequences are listed in Table S2.
If double-deficiencies were induced in an experiment, singledeficiencies were achieved by substituting one of the gRNAs withnontarget control (CTRL). These CTRL additions are implied in thetext when mentioning only one gRNA or a single deficiency. Ac-cordingly, targeting gRNAswere substituted for nontargeting controlsin triple-targeting experiments. Exact conditions are listed in Table S3.STING-deficient clones were checked for deficiency phenotypically(DNA transfection and lack of IFN-β secretion) and by Western blot.
pI:C transfectionOn day 4 after nucleofection, THP-1 cells were counted, spundown, and concentrated to 1e6 cells/ml, and 5e5 cells per wellwere seeded in 24 wells without media change. For pI:C trans-fection, per well 0.8 µl TransIT-LT1 (Mirus Bio) was added to99.2 µl Opti-MEM and incubated for 5 min at RT. 400 ng (0.4 µl)pI:C was added to 99.6 µl Opti-MEM, mixed with the TransITLT1/Opti-MEM mix, incubated 20 min, mixed again, and addedto the cells. Cells were harvested for qPCR analysis after 24 h.
CRISPR targeting of primary monocytes/macrophagesBuffy coats were purchased from Vitalant. Leucosep tubes(Greiner Bio-One; 50 ml) were filled with 15 ml Ficoll-Paque
PREMIUM and centrifuged for 1 min at 1,000 g. Buffy coatswere diluted 1:1 with PBS and layered on top of the Leucosepmembrane. The gradients were centrifuged for 15 min at 800 rcfand RT, without breaks. The white blood cell layer was aspiratedand washed with PBS (centrifugation at 400 rcf, 4°C, 7 min). Redblood cells were lysed for 5 min at RT in ACK red blood cell lysisbuffer (163 mM ammonium chloride, 1 mM potassium bicar-bonate, and 0.1 mM EDTA, pH 7.4) and washed two or threetimes with PBS (centrifugation at 400 rcf, 4°C, 5 min). Cells wereresuspended in MACS buffer (PBS with 0.5% BSA and 2 mMEDTA) and counted. Monocytes were then isolated according toprotocol using the Pan Monocyte Isolation Kit, Human (MiltenyiBiotec). Isolated monocytes were frozen in FCS/10% DMSO forlater processing. Cells were resuspended in macrophage-CSFmedium (DMEM, high glucose, 10% FBS, 1 × Glutamax [Gibco], 1%Penicillin/Streptomycin, and 10 ng/ml human recombinant M-CSF[VWR]) and incubated for recovery overnight. Then, the cells weredetached using Trypsin/EDTA and nucleofected as described inCRISPR targeting of THP-1 cells with the following changes: Perreaction, 3 µl annealed gRNA was complexed with 2 µl TrueCutCas9 Protein V2 (Invitrogen) by incubating 10 min at RT beforenucleofection, 106 cells were nucleofected per reaction, protocolCM137 and P3 primary cell buffer including supplement (Lonza)was used, and cells were nucleofected directly after being added tothe gRNA/Cas9 complexes. Cells were resuspended in M-CSF me-dium at 106 cells/ml and used for analysis 5 d after nucleofection.
RNA preparation and qPCR analysisFor RNA preparation from THP-1, cells were precipitated (350 g,5 min, RT) and prepared using the RNeasy Mini Kit (Qiagen)according to the manufacturer’s instructions, including therecommended on-column DNase digest. For RNA preparationfrom primary monocytes/macrophages, cells were detachedusing Trypsin/EDTA and prepared using the Qiagen AllPrepDNA/RNAMini Kit. RNAwas either directly employed for cDNAsynthesis or, to ensure proper detection of secondary-structure-rich RNA, mixed with water for cDNA synthesis, heated to 95°Cfor 30 s to denature secondary structures, and cooled to 4°C;then, cDNAwas synthesized using the iScript cDNA synthesis kitaccording to the manufacturer’s instructions. cDNA was thendiluted 1:20, and Taqman qPCR was performed with the fol-lowing reactions per well: 5 µl TaqMan Universal PCR MasterMix, 2.5 µl water, 0.5 µl Thermo Fisher Scientific TaqMan GeneExpression Assay (FAM-MGB), and 2 µl diluted cDNA. SYBRgreen qPCR was performed using 5 µl SYBR Select Mastermix,0.3 µl primer-mix (10 µM each), 2.7 µl water, and 2 µl dilutedcDNA per well. qPCRwas performed using a QuantStudio5 usingthe standard protocol (40 cycles) and relative expression usingRPL36 (Fig. 1 C; and Fig. S2, A–C) or CASC3 (all other figures) ashousekeeping gene was determined using the comparative cyclethreshold (ΔΔCt) method. Thermo Fisher Scientific qPCR assaysused in this study were CASC3: Hs00201226_m1, CXCL10:Hs00171042_m1, IFI27: Hs01086373_g1, IFIT1: Hs03027069_s1,IFIT2: Hs00533665_m1, IFNB1: Hs01077958_s1, RPL36: Hs03006033_g1, NUCKS1: Hs01068055_g1, MFSD1: Hs00224178_m1, IARS2:Hs01058378_m1, and EIF3D: Hs01044815_m1. SYBR green primersare listed in Table S4.
Herzner et al. Journal of Experimental Medicine 16 of 23
Type I IFN synergy of ADAR and hnRNPC deficiency https://doi.org/10.1084/jem.20201833
Dow
nloaded from http://rupress.org/jem
/article-pdf/218/9/e20201833/1420257/jem_20201833.pdf by C
alif San Diego (Biom
) user on 28 July 2021
Statistical analysisRNA levels were measured in technical duplicates. The averageof the duplicates was log2-transformed and used as one biolog-ical replicate. Biological replicates were derived from experimentsconducted on separate days or from separate blood donors. If notstated otherwise, three or more of these log-transformed biolog-ical replicates were used as a basis for statistical analysis usingPrism 7. For the screen, repeated-measures one-way ANOVA us-ing the results within each biological replicate as repeated mea-sures was conducted, including Geisser-Greenhouse correction.For pairwise hypothesis testing, Benjamini and Hochberg FDRcorrection was used. For all other qPCR experiments, repeated-measures two-way ANOVA was conducted using the resultswithin each biological replicate as repeated measures. For Fig. 1,C and F; Fig. 3 H; Fig. 8; and Fig. S2, A–C and E, pairwise com-parisons were corrected using Sidak’s method, and all possiblecomparisons were included if not indicated otherwise. ForFig. 1 D, Bonferroni correction was used, and for each hnRNPC/ADAR deficiency combination, RIG-I and MDA5 deficiency werecompared only to nontarget control.
Western blotCells were washed with PBS and lysed with RIPA (Sigma) in-cluding 1× HALT protease inhibitor (Life Technologies) for30 min on ice. Lysates were then cleared by centrifugation at20,000 rcf for 10 min at 4°C, and protein concentrations weredetermined using the Pierce BCA Protein Assay Kit (ThermoFisher Scientific). 10–20 µg of protein was separated on a 12–4%Bis-Tris or 20–4% Tris-Glycine polyacrylamide gel. Proteinswere transferred to nitrocellulose membranes by standard wettransfer and then briefly washed in Tris-buffered saline (TBS)and blocked in 3% nonfat dry milk (Bio-Rad) in TBS for 1–2 h.The membranes were then washed and incubated with primaryantibodies (listed below) in 1% nonfat dry milk in TBS + 0.1%Tween 20 (TBS-T) under shaking at 4°C overnight. Membraneswere washed with TBS-T and incubated with secondary anti-bodies for 1–2 h. Membranes were washed 2× with TBS-T and 2×with TBS, and then fluorescence was detected using a Li-COROdyssey Fc instrument. Primary antibodies were anti-ADAR:Cell Signaling Technologies 14175; anti-hnRNPC: abcam ab10294;anti-GAPDH: Cell Signaling Technologies 5174; anti–RIG-I:Adipogen AG-20B-0009-C100; anti-MDA5: Enzo Life SciencesALX-210-935-C100; and anti-UPF1: abcam ab109363; secondaryantibodies were Li-COR goat–anti-rabbit IgG or goat–anti-mouseIgG, IRDye 680 RD or IRDye 800 CW conjugates.
Cell fractionationCells were fractionated as described in Baghirova et al. (2015)with the following modifications: cells were collected fromsuspension, precipitated by centrifugation (350 rcf, 4°C, 5 min),washed with ice-cold PBS, precipitated (350 rcf, 4°C, 5 min), andlysed with lysis buffer A supplemented with 1× HALT proteaseinhibitor as well as 0.5 U/µl RNase inhibitor (Applied Biosystems)and an increased digitonin concentration (300 µg/ml) for 10 minon an end-over-end rotator. Nuclei were precipitated by centrif-ugation (2,000 rcf, for 10 min at 48°C), and RNA was extractedfrom the supernatant using a standard RNeasy Mini Kit (Qiagen).
BaseScope stainingA Cas9-transgenic THP-1 WT clone was nucleofected with GFPgRNA and sorted for GFP-negative cells. Cells were nucleofectedas indicated in CRISPR-targeting of cell lines, with nontargetcontrol gRNA, ADAR gRNA, and/or hnRNPC gRNA and grownfor 4 d. Cells were centrifuged for 5 min at 350 rcf and RT, mediawere removed, and cells were resuspended in PBS. Cells werecentrifuged again, PBS was carefully removed, and cells wereresuspended in RNase-free 10% Neutral Buffered Formalin andincubated for 30 min at 37°C. Cells were precipitated again andresuspended in RNase-free, ice-cold 70% ethanol to obtain a cellconcentration of 1e6/ml and stored at 4°C until used (max 1 mo).Samples were processed with Shandon Cytofunnel (ThermoFisher Scientific; Cat. No. 1102548) and centrifuged at 800 rcf for10 min, and the slides were removed from the cytoprep kit.Slides were air-dried for 20 min at RT and dehydrated in 50%,70%, and 100% ethanol in preparation for staining.
Automated proceduresAutomated cytospin BaseScope ISH is a modified single Base-Scope ISH protocol from Advanced Cell Diagnostics (ACD)BaseScope LS Detection Protocol User Manual (323600 USM),performed using a Leica Bond-RX system. Pretreatment stepswere adjusted to maintain an optimal sensitivity versus mor-phology for cytospin samples. The developed fluorescent ISHprocedure was modified from ACD protocol in the amplificationand detection steps. Samples were tested for RNA quality with aBA-Hs-PPIB probe before running with target probes, andbacteria gene DapB probe was used as a negative probe forprocedure control.
Sample pretreatmentAfter cytospin, slides were removed from 100% EtOH and driedfor 30 min in an oven at 37°C. Slides were then labeled withmodified *ACD2.5 Red RevB as staining protocol (without Amp7,Amp8, and counterstaining steps) and inserted into the Bond RXslide rack trays to be processed. The “frozen slide delay” wasselected as preparation protocol to accommodate the overnightdelay run. Antigen retrieval was conducted with *ACD HIER15 min with ER2 at 88°C, followed by the peroxide quenchingstep in the same protocol. HIER with Protease step was omittedto avoid overdigestion of the sample, which could lead to anonspecific background in DapB-negative control probe.
Fluorescent BaseScope ISH procedureThe ACD 1-min hybridization protocol for hybridization step(ACD; 323600 USM) was selected. Fluorescent cytospin ISHprocedure is a modified staining protocol of the single chro-mogenic BaseScope LS reagent kit (Cat. No. 323600). Followingsample pretreatment, hybridization and amplification stepswere done according to the ACD BaseScope LS Detection Rea-gent User Manual (323600 USM) from Amp 1 to Amp 6 steps.Probes were hybridized for 2 h at 42°C. Slides were washedwith 1X Bond wash buffer (Leica 10X concentrate; AR9590) at42°C three times (0, 1, and 5min) followed by eight washes with1X Bond wash buffer, 0 min each. Samples were processed onlyto the end of the Amplification 6 step (*ACD Amp 6) followed by
Herzner et al. Journal of Experimental Medicine 17 of 23
Type I IFN synergy of ADAR and hnRNPC deficiency https://doi.org/10.1084/jem.20201833
Dow
nloaded from http://rupress.org/jem
/article-pdf/218/9/e20201833/1420257/jem_20201833.pdf by C
alif San Diego (Biom
) user on 28 July 2021

washes. ISH detection was completed using Opal-570 (Perkin-Elmer; Cat. No. FP1488001KT; (1:1,500) in 1X amplificationbuffer (PerkinElmer; NEL794001KT) 1 and 10 min each at RT.Slides were washed with 1X Bond wash solution three times, 0 mineach, followed by additional five times, 1 min each, at RT. Slideswere counterstained with Spectral DAPI (PerkinElmer; FP1490),and counterstain was performed for 5 min at RT. Excess DAPI wasrinsed off by five washes with deionized water. Finally, the slideswere coverslipped with Prolong Gold antifade reagent (Life Tech-nology; Cat No. P36930). BaseScope probes are listed in Table S5.
ImagingSingle optical sections were acquired by sequential scanning ona LEICA Sp8 confocal microscope (controlled by LAS X version3.55 software), using an HC PL APO CS2 40×/1.30 oil objective,with 1.5 zoom. The images are 1,024 × 1,024 pixels (pixel size,0.189 × 0.189 μm), 194 × 194 μm physical size. The pinhole sizewas set to 1 Airy Unit (65.3 µm), resulting in 1.22-µm-thick opticalsections.
To detect DAPI signal, a 405-nm diode laser was used with20% output. The photomultiplier tube detector settings were430–480-nm detector windowwith the gain set to 550 and the offsetto −1. To detect the OPAL-570 signal, a 552-nm diode laser was usedwith 15% output. The photomultiplier tube settings were 570–620-nm detector window, with the gain set to 800 and the offset to −5.
Lookup tables were set to blue for DAPI and red for OPAL-570 dye.
All images were acquired under identical settings on thesame day. The images shown are the original captures exportedas TIFF files; no postacquisition modifications of any kind wereapplied to them.
RNA-seq and alignmentThe concentration of RNA was determined using NanoDrop8000 (Thermo Fisher Scientific), and the integrity of RNA wasassessed by Bioanalyzer 2100 using the Analyzer EukaryoteTotal RNA Nano Chip (Agilent). Libraries were prepared usingthe TruSeq Stranded Total RNA Library Prep Kit with Ribo-ZeroGold kit (Illumina). The libraries were multiplexed and se-quenced on Illumina HiSeq4000 (Illumina). An average of >130million paired-end 100–bp reads for RNA-seq study 1 and >85million paired-end 150-bp reads for RNA-seq study 2 wasobtained per sample. Reads were aligned to GrCH37 v13using STAR (V2.5.4a) with the basic two-pass mode allow-ing for a maximum number of multiple alignments of 1,000and 999 mismatches per read (–outFilterMultimapNmax 1000–outFilterMismatchNmax 999) but 10% mismatches per read pairusing –outFilterMismatchNoverReadLmax 0.1 to increase thedetection of A-to-I editing sites. In addition, we allowed intronsto be 20–1,000,000 nt and a 1,000,000-nt distance between readpair mates. BAM files were sorted using samtools sort, and a baiindex was generated using samtools index.
LeafCutter splicing analysis and mapping toRepeatMasker elementsThe LeafCutter pipeline (version 0.2.7) for differentialsplicing was applied according to the Differential Splicing
documentation hnRNPC-targeted versus WT samples, usingthe unsorted BAM files of all nine samples per treatment,independent of the incubation time (3, 4, or 5 d) as an input.To estimate the involvement of Alu splice sites to differentialsplicing, we mapped all intron ends as indicators of splicesites to GrCH37/hg19 RepeatMasker annotations using R Ge-nomicRanges::mapToTranscripts. Splicing clusters were thenstratified based upon the mapping of at least one splice site toan Alu element (Alu), no splice site mapping to an Alu but anysplice site mapping to any other RepeatMasker element (non-Alu RE), or no splice site mapping to any RepeatMasker element(no RE).
Differential relative use of splice sites and iClip overlap withsplice sitesAfter significantly regulated splicing clusters (adjusted P value ≤0.001) were selected, intronends as equivalent to splice siteswere quantified using the “_perind_numers.counts” output ofthe LeafCutter analysis. Intron counts were aggregated by ge-nomic intron starts and ends separately, as an indicator forsplice site use. Then, the relative use of splice sites was deter-mined per splicing cluster by normalizing the count of eachintronend (both intron starts and ends) to the total counts ofeach cluster (for illustration, see Fig. S3 C). Processed iCLIPclusters from Zarnack et al. (2013) were downloaded from theArrayExpress accession no. E-MTAB-1371, and hnRNPC_iCLIP_all_clusters.bed was used. The bed file was imported to R asGRanges object, and a distance of maximum 50 nt of intronendsto iCLIP clusters was determined using GRanges::findOverlapswith the option maxgap = 50.
Differential expression analysisAligned reads were summarized to gene level using the R Rsu-bread package featureCounts function in paired end mode (is-PairedEnd = TRUE) based on the GrCH37 gencode V19 GTFannotation, using the default exons as features for counting andgenes as meta-features (GTF.featureType=“exon” and GTF.attr-Type=“gene_id”). We only allowed uniquely mapping reads bysetting the read-quality filter to 255 (minMQS = 255).
To quantify introns and ECRs, we first extracted intronranges from APPRIS annotation based on https://davetang.org/muse/2013/01/18/defining-genomic-regions/ from the GrCH37gencode V19 GTF file using awk to filter for APPRIS-annotatedtranscripts (awk ’BEGIN’{OFS=“\t”;} /appris/ {print}’). Exonswere extracted from the APPRIS-annotated transcripts into bedformat using awk (’BEGIN{OFS=“\t”;} $3==”exon” {print $1,$4-1,$5,$10,$3}’) and sorted using bedtools2 sortBed, and over-lapping exons were merged with bedtools2 mergeBed. Next,unique genes of APPRIS-annotated transcripts were extractedusing awk as described above, and their annotations were ex-tracted from the original GTF file and sorted, and the mergedAPPRIS-annotated exons were subtracted from genes using bed-tools2 subtractBed to yield introns delineated from APPRIS-annotated transcripts, saved in bed format for later quantification.
To define ECRs, A-to-I editing clusters were defined as de-scribed in Detection of A-to-I editing. For quantification, ECRswere quantified rather than editing clusters, to avoid quantification
Herzner et al. Journal of Experimental Medicine 18 of 23
Type I IFN synergy of ADAR and hnRNPC deficiency https://doi.org/10.1084/jem.20201833
Dow
nloaded from http://rupress.org/jem
/article-pdf/218/9/e20201833/1420257/jem_20201833.pdf by C
alif San Diego (Biom
) user on 28 July 2021

errors due to multimapping reads. Therefore, 1,000 bp wereadded to each cluster on both the 39 and 59 UTR ends, and theseregions were merged using bedtools2 mergeBed, requiring at least1-bp overlap. Reads mapping to intron and ECR features werecounted using the R Rsubread package featureCounts function afterconverting bed files to SAF format, as described for gene quantifi-cation, not using the meta-feature flag. Low expressed genes werefiltered before voom/limma differential expression analysis. Forstudy 1, pairwise comparisons, all samples were included into thedesign matrix, treating each triplicate of samples as independentconditions. Gene, intron, and ECR counts were normalized to totalgenecounts corrected by edgeR normalization factors (calcNorm-Factors in default modus). The average log cpm filter cutoffs (acrossall samples)were 0.5 for gene counts, 1 for intron counts, and 4.5 forECRs. Counts were transformed using the standard voom functionand fit to a linear model using vmfit. Pairwise contrasts were fitwith eBayes and differential expression analysis tables created us-ing topTable with standard FDR-adjusted P value applied. Featureswere consideredmeaningfully regulated if they showed an absolutepositive log2 (fold change) ≥1 and an FDR-corrected P value ≤0.05, ifnot specified otherwise.
For the generation of heatmaps and volcano plots, intronswere checked for their overlapwith RepeatMasker elements andassigned to genes applying bedtools intersect with flags -loj -a onbed files. Overlaps with RepeatMasker elements were priori-tized in the following way: If an intron was overlapping with atleast one Alu element, irrespective of other RepeatMasker ele-ments, it was designated overlapping with an Alu; if any otherRepeatMasker element but no Alu element overlapped, it wasdesignated overlapping with a non-Alu RE. To estimate whetheran intron overlapped with a differentially regulated splicingcluster, the most 39 and 59 UTR end of any intron within a splicingcluster was extracted from the LeafCutter_ds_effect_sizes.TXT fileto define the region the cluster was spanning and the associatedadjusted P value from the LeafCutter_ds_cluster_significance.TXT file, both generated by the LeafCutter pipeline. Then,introns and splicing cluster overlaps were discovered using RGenomicRanges::mapToTranscripts.
Factorial designInteraction between factor 1 (CTRL, hnRNPC) and factor 2(CTRL, ADAR) in study 1 was estimated by 2 × 2 factorial designas described in the limma users’ guide as classic interactionmodel. For this, samples from day 5 were selected that werenucleofected with 2 × CTRL, CTRL+hnRNPC gRNA (hnRNPCsingle deficiency), CTRL + ADAR gRNA (ADAR single defi-ciency), or hnRNPC+ADAR gRNA (ADAR and hnRNPC combineddeficiency). Genes induced by IFN-α (log2[fold change] ≥1 andFDR-adjusted P value ≤ 0.05) were selected, counts were nor-malized using voomWithQualityWeights using the original li-brary sizes, and lmfit and eBayes were applied and topTablewith option coef = 4 was used to extract FDR-adjusted P valuesfor interaction between factor 1 and factor 2.
Single-nucleotide polymorphism (SNP) detectionTo be able to exclude SNPs as false-positive A-to-I editing sites,we subjected the STING-deficient Cas9 transgenic THP-1 clone
to whole-genome sequencing: DNA was isolated using theGentra Puregene Blood Kit (Qiagen). The concentration of DNAwas determined using NanoDrop 8000 (Thermo Fisher Scien-tific). Library was prepared using the TruSeq DNA Nano Kit(Illumina) and sequenced on Illumina HiSeq2500 to generate∼200 million paired-end 75-bp reads. Reads were trimmed usingtrimmomatic in paired-end mode with flags -phred33 ILLUMI-NACLIP:TruSeq3-SE.fa:2:30:10 LEADING:3 TRAILING:3 SLI-DINGWINDOW:4:15 MINLEN:36. Paired reads were thenaligned to hg19 using bwa mem with flag -M, and the outputSAM file was converted to BAM format using samtools view, theBAM file was sorted using samtools sort, PCR duplicates weremarked using Picard tools, an index was generated using sam-tools index, a sequence dictionary was generated using Picardtools, and variants were detected using GATK UnifiedGenotyper.Then, variants were filtered for SNPs using bcftools view withflags -v snps -Oz, and bedops convert2bed was used to convertthe vcf output to a bed file, which was cut to bed3 as a filteringinput for the SAILOR pipeline in A-to-I editing analysis.
A-to-I editing analysisTo discover A-to-I editing sites, we used the SAILOR pipeline(version 1.0.4) described before (Deffit et al., 2017), using thedefault settings except reverse_stranded_library: true, single_end: false and min_variant_coverage: 10. We used the bed3 filegenerated in SNP detection to exclude genomic SNPs. Followingdiscovery, editing sites were subjected to several filtering steps.First, each site was required to have all of the following qualitiesin at least one ADAR WT sample: passing of the SAILOR-setfilter, a minimum SAILOR-score of 0.5, minimum coverage of10 (any nucleotide), minimum editing frequency of 0.05, andmaximum editing frequency of 0.95. Editing sites were assignedto clusters using the clusterMaker function of the R bumphunterpackage, with a maximum distance of 50 between sites withinone cluster (maxGap = 50). Since editing sites missing in thefinal per-sample SAILOR output could be filtered due to lowexpression or lack of editing, base-specific counts per editingsite were extracted again from SAILOR-generated BAM filessorted by strand, filtered for PCR duplicates and for other filtersemployed by the SAILOR pipeline (*.sorted.rmdup.readfilter-ed.bam). These were fed into samtools mpileup with flags -B-d10000000 -t DPR,INFO/DPR,DP4 -uf, using the -l flag with abed annotation of the primary selection of editing sites. INFO/DPR counts were used to calculate the editing frequency. T and Ccounts for sense or A and G counts for antisense reads, respec-tively, were considered sequencing errors and were addedto reference counts. Sites were filtered once more. First, notavailable values for read counts and frequency were set to 0.Then, for a site to be retained, the following was required: allsamples ≥0.05 editing frequency, two samples ≥10% editingfrequency, all samples ≥10 read counts. This was required forthe three samples of at least one treatment. Finally, editing siteswere clustered again, and only sites that were part of a clusterwith at least five sites were retained as the final selection ofediting sites.
For the mapping of editing sites to repetitive elements,University of California, Santa Cruz GrCH37/hg19 RepeatMasker
Herzner et al. Journal of Experimental Medicine 19 of 23
Type I IFN synergy of ADAR and hnRNPC deficiency https://doi.org/10.1084/jem.20201833
Dow
nloaded from http://rupress.org/jem
/article-pdf/218/9/e20201833/1420257/jem_20201833.pdf by C
alif San Diego (Biom
) user on 28 July 2021

annotations were used and mapped using bedtools intersectwith the -loj flag. If a site mapped to Alu, irrespective of itsmapping to another RepeatMasker element, it was consideredmapping to Alu. If it was mapping to any other RepeatMaskerelement, it was labeled mapping to a non-Alu RE (RepeatMaskerelement). If it was not mapping to any RepeatMasker element(output “.”), it was labeled non-RE. For plotting, editing siteswith ≥10 read counts for all samples in a comparison were se-lected. Average editing per site per treatment was calculated assum(edit counts)/sum(read counts) across all samples of eachtreatment, irrespective of treatment time (days 3, 4, and 5).Average editing per ECR was calculated as sum(edit counts)/sum(read counts) across all editing sites and all three samplesof each treatment, in a day-wise manner. Only high-qualitympileup INFO/DPR edit and read counts (see SAMtools docu-mentation) were used.
To enable mapping of editing clusters to genic elements, 39UTR, 59 UTR, coding sequence (CDS), exon, intron, and whole-gene tracks were downloaded from the University of California,Santa Cruz table browser using the GrCH37/hg19 assembly,Gencode Genes V19 tracks, and the Basic table. Editing clusterswere then mapped to genomic regions using bedtools intersectwith -loj -a flags. In case of mapping to multiple features,mapping was prioritized as follows: CDS > 39 UTR > 59 UTR >exon > intron > gene > no intersect (“intergenic”). To determinethe distance between editing clusters and upstream 39 UTRs, bedfiles were imported to R as GenomicRanges, and the nearestupstream 39 UTR of each intergenic editing cluster was retrievedby using GenomicGanges::follow in a strand-dependent mannerand determining the distance between the UTRs and editingclusters with GenomicRanges::distance.
Characterization of secondary structuresSequences for L1, preLet7b, hAT2, and ES27L hairpins weredownloaded from Ahmad et al. (2018), and NICN1, BPNT1, DESI1irAlu, and ECR sequences were extracted from hg19 usingsamtools faidx. From sequences of RNAs encoded on the (−)−strand, reverse complement of the sequence was generated.Sequences as DNA sequences were input into viennaRNAv.2.4.13 RNAfold, and secondary structures were plotted usingviennaRNA v.2.4.13 RNAplot. Long dsRNA stretches from con-trols or dsRNA stretches from ECRs >250 nt, as well as thelongest dsRNA stretch within the structure, were manually de-termined from the plot. The respective dot-bracket structureannotation was extracted from the RNAfold output. (number of“.” within dot-bracket structure)/(length of dot-bracket struc-ture) determined the fraction of mismatched nucleotides.
Online supplemental materialFig. S1 contains eCLIP AluRNA enrichment as well as supportingmaterial for Fig. 1 B (IFIT1/IFIT2 expression) and Fig. 1 C(Western immunoblot). Fig. S2 shows ISG expression inhnRNPC- and ADAR-deficient cells in further cell lines as wellas primary monocytes. Fig. S3 illustrates differential splicinganalysis, intron expression analysis, and examples of intergenicediting clusters. Fig. S4 shows further plots comparing locali-zation and dysregulation of ECRs upon hnRNPC deficiency as
well as full micrographs of BaseScope analysis in Fig. 9 C. Fig. S5provides a schematic illustration of the proposed model. Table S1shows references for Fig. S1, A and B. Table S2 contains crRNAsequences. Table S3 lists the exact gRNAs used for each figure.Table S4 details SYBR green primers, and Table S5 shows Base-Scope probes used in this study. Supplementary data contain tablesincluding column descriptions used to plot RNA-seq–based figures:Data S1, Fig. 2 B (differential gene expression); Data S2, Fig. 2 C (ISGexpression); Data S3, Fig. 4 B (differential intron expression); DataS4, Fig. 5, A, C, and E (normalized expression of introns and re-spective genes); Data S5, Fig. 7, B and C (differential ECR expres-sion); Data S6, Fig. 7 E (average editing in ECRs); Data S7, Fig. 9 A(differential gene expression cytosol versus total RNA); and Data S8,Fig. 9 B and Fig. S4 A (ECR expression cytosol versus total RNA andADAR versus ADAR+hnRNPC–deficient cells).
Data availabilitySequencing data and raw counts are available under Gene Ex-pression Omnibus accession number GSE176012. Results fromanalyses supporting the findings of this study are availablewithin the paper and its supplementary information files. Codeis available through the corresponding author A.-M. Herznerupon request.
AcknowledgmentsWe thank Tom Wu for help with establishing computationaltools; Brian Yee, Haiyin Chen, Melanie Huntley, and ArthurWuster for consultations about computational analyses; JamesZiai and Jonas Doerr for help with establishing BaseScopestaining and imaging; Rosa Barreira, Sean Cullen, and JeremieDecalf for helping with optimizing the figures; and Ira Mellmanfor critically reading the manuscript.
G.W. Yeo was funded by the National Human Genome Re-search Institute ENCODE Project, contracts U54HG007005 andU41HG009889. E.L. Van Nostrand is a Merck Fellow of the Da-mon Runyon Cancer Research Foundation (DRG-2172-13) and issupported by a National Human Genome Research Institute K99grant (HG009530).
Author contributions: A.-M. Herzner, T. Cuellar, R. Chen, S.Chan, and L. Komuves planned and conducted experiments. A.-M. Herzner, Z. Khan, E.L. Van Nostrand, and X. Pechuan-Jorgeconducted or contributed to computational analyses. Z. Mod-rusan participated in the conduction of the RNA-seq. B. Haley,M. Solon, G.W. Yeo, T.W. Behrens, and M.L. Albert criticallyhelped plan experiments and computational analyses. A.-M.Herzner and M.L. Albert wrote the manuscript. All authorscritically read the manuscript.
Disclosures: A. Herzner reported being an employee of Gen-entech/Roche (USA), and that the research was financed byGenentech/Roche (USA). A. Herzner is presently an employee ofBoehringer Ingelheim (Germany). Z. Khan reported being anemployee of Genentech/Roche. E.L. Van Nostrand reportedpersonal fees from Eclipse BioInnovations outside the submittedwork. E.L. Van Nostrand is co-founder, member of the Board ofDirectors, on the SAB, equity holder, and a paid consultant for
Herzner et al. Journal of Experimental Medicine 20 of 23
Type I IFN synergy of ADAR and hnRNPC deficiency https://doi.org/10.1084/jem.20201833
Dow
nloaded from http://rupress.org/jem
/article-pdf/218/9/e20201833/1420257/jem_20201833.pdf by C
alif San Diego (Biom
) user on 28 July 2021

Eclipse BioInnovations. E.L. Van Nostrand’s interests have beenreviewed and approved by the University of California, SanDiego in accordance with its conflict of interest policies. T.Cuellar reported being an employee of Genentech/Roche (USA).T. Cuellar is currently an employee of Gotham Therapeutics.X. Pechuan-Jorge reported being a Genentech employee. L.Komuves reported being an employee and stockholder ofGenentech, a member of the Roche Group. B. Haley reportedbeing an employee of Genentech/Roche. G.W. Yeo is co-founder,member of the Board of Directors, on the scientific advisoryboard, equity holder, and paid consultant for Locanabio andEclipse BioInnovations. G.W. Yeo is a visiting professor at theNational University of Singapore. G.W. Yeo9s interest(s) havebeen reviewed and approved by the University of California, SanDiego, in accordance with its conflict of interest policies.
Submitted: 24 August 2020Revised: 11 September 2020Accepted: 24 June 2021
ReferencesAhmad, S., X. Mu, F. Yang, E. Greenwald, J.W. Park, E. Jacob, C.-Z. Zhang, and
S. Hur. 2018. Breaching Self-Tolerance to Alu Duplex RNA UnderliesMDA5-Mediated Inflammation. Cell. 172:797–810.e13. https://doi.org/10.1016/j.cell.2017.12.016
Anantha, R.W., A.L. Alcivar, J. Ma, H. Cai, S. Simhadri, J. Ule, J. Konig, and B.Xia. 2013. Requirement of heterogeneous nuclear ribonucleoprotein Cfor BRCA gene expression and homologous recombination. PLoS One. 8:e61368. https://doi.org/10.1371/journal.pone.0061368
Astaldi Ricotti, G.C.B., M. Bestagno, A. Cerino, C. Negri, R. Caporali, F. Co-bianchi, M. Longhi, and C. Maurizio Montecucco. 1989. Antibodies tohnRNP core protein A1 in connective tissue diseases. J. Cell. Biochem. 40:43–47. https://doi.org/10.1002/jcb.240400105
Attig, J., I. Ruiz de Los Mozos, N. Haberman, Z. Wang, W. Emmett, K. Zar-nack, J. Konig, and J. Ule. 2016. Splicing repression allows the gradualemergence of new Alu-exons in primate evolution. eLife. 5:e19545.https://doi.org/10.7554/eLife.19545
Baghirova, S., B.G. Hughes, M.J. Hendzel, and R. Schulz. 2015. Sequentialfractionation and isolation of subcellular proteins from tissue or cul-tured cells. MethodsX. 2:440–445. https://doi.org/10.1016/j.mex.2015.11.001
Bahn, J.H., J. Ahn, X. Lin, Q. Zhang, J.-H. Lee, M. Civelek, and X. Xiao. 2015.Genomic analysis of ADAR1 binding and its involvement in multipleRNA processing pathways. Nat. Commun. 6:6355. https://doi.org/10.1038/ncomms7355
Bowling, E.A., J.H. Wang, F. Gong, W. Wu, N.J. Neill, I.S. Kim, S. Tyagi, M.Orellana, S.J. Kurley, R. Dominguez-Vidaña, et al. 2021. Spliceosome-targeted therapies trigger an antiviral immune response in triple-negative breast cancer. Cell. 184:384–403.e21. https://doi.org/10.1016/j.cell.2020.12.031
Chen, L.L., J.N. DeCerbo, and G.G. Carmichael. 2008. Alu element-mediatedgene silencing. EMBO J. 27:1694–1705. https://doi.org/10.1038/emboj.2008.94
Cogdill, A.P., M.C. Andrews, and J.A. Wargo. 2017. Hallmarks of response toimmune checkpoint blockade. Br. J. Cancer. 117:1–7. https://doi.org/10.1038/bjc.2017.136
Cuellar, T.L., A.-M. Herzner, X. Zhang, Y. Goyal, C. Watanabe, B.A. Friedman,V. Janakiraman, S. Durinck, J. Stinson, D. Arnott, et al. 2017. Silencing ofretrotransposons by SETDB1 inhibits the interferon response in acutemyeloid leukemia. J. Cell Biol. 216:3535–3549. https://doi.org/10.1083/jcb.201612160
Davidson, S., A. Steiner, C.R. Harapas, and S.L. Masters. 2018. An Update onAutoinflammatory Diseases: Interferonopathies. Curr. Rheumatol. Rep.20:38. https://doi.org/10.1007/s11926-018-0748-y
Deffit, S.N., B.A. Yee, A.C. Manning, S. Rajendren, P. Vadlamani, E.C.Wheeler, A. Domissy, M.C. Washburn, G.W. Yeo, and H.A. Hundley.2017. The C. elegans neural editome reveals an ADAR target mRNA
required for proper chemotaxis. eLife. 6:e28625. https://doi.org/10.7554/eLife.28625
Deininger, P. 2011. Alu elements: know the SINEs. Genome Biol. 12:236.https://doi.org/10.1186/gb-2011-12-12-236
Donev, R., R. Horton, S. Beck, T. Doneva, R. Vatcheva, W.R. Bowen, and D.Sheer. 2003. Recruitment of heterogeneous nuclear ribonucleopro-tein A1 in vivo to the LMP/TAP region of the major histocompati-bility complex. J. Biol. Chem. 278:5214–5226. https://doi.org/10.1074/jbc.M206621200
Donev, R., A. Newall, J. Thome, and D. Sheer. 2007. A role for SC35 andhnRNPA1 in the determination of amyloid precursor protein isoforms.Mol. Psychiatry. 12:681–690. https://doi.org/10.1038/sj.mp.4001971
Fazal, F.M., S. Han, K.R. Parker, P. Kaewsapsak, J. Xu, A.N. Boettiger, H.Y.Chang, and A.Y. Ting. 2019. Atlas of Subcellular RNA Localization Re-vealed by APEX-Seq. Cell. 178:473–490.e26. https://doi.org/10.1016/j.cell.2019.05.027
Fisher, A.J., and P.A. Beal. 2017. Effects of Aicardi-Goutières syndrome mu-tations predicted from ADAR-RNA structures. RNA Biol. 14:164–170.https://doi.org/10.1080/15476286.2016.1267097
Franzen, O., R. Ermel, K. Sukhavasi, R. Jain, A. Jain, C. Betsholtz, C. Gian-narelli, J.C. Kovacic, A. Ruusalepp, J. Skogsberg, et al. 2018. Globalanalysis of A-to-I RNA editing reveals association with common diseasevariants. PeerJ. 6:e4466. https://doi.org/10.7717/peerj.4466
Frassinelli, L., S. Galardi, S.A. Ciafrè, and A. Michienzi. 2021. RNA Editing inInterferonopathies. Methods Mol. Biol. 2181:269–286. https://doi.org/10.1007/978-1-0716-0787-9_16
Freund, E.C., A.L. Sapiro, Q. Li, S. Linder, J.J. Moresco, J.R. Yates III, and J.B.Li. 2020. Unbiased Identification of trans Regulators of ADAR and A-to-I RNA Editing. Cell Rep. 31:107656. https://doi.org/10.1016/j.celrep.2020.107656
Gal-Mark, N., S. Schwartz, O. Ram, E. Eyras, and G. Ast. 2009. The pivotalroles of TIA proteins in 59 splice-site selection of alu exons and acrossevolution. PLoS Genet. 5:e1000717. https://doi.org/10.1371/journal.pgen.1000717
Gannon, H.S., T. Zou, M.K. Kiessling, G.F. Gao, D. Cai, P.S. Choi, A.P. Ivan, I.Buchumenski, A.C. Berger, J.T. Goldstein, et al. 2018. Identification ofADAR1 adenosine deaminase dependency in a subset of cancer cells.Nat. Commun. 9:5450. https://doi.org/10.1038/s41467-018-07824-4
Giacopuzzi, E., M. Gennarelli, C. Sacco, A. Filippini, J. Mingardi, C. Magri, andA. Barbon. 2018. Genome-wide analysis of consistently RNA edited sitesin human blood reveals interactions with mRNA processing genes andsuggests correlations with cell types and biological variables. BMC Ge-nomics. 19:963. https://doi.org/10.1186/s12864-018-5364-8
Gruber, A.J., R. Schmidt, A.R. Gruber, G. Martin, S. Ghosh, M. Belmadani, W.Keller, and M. Zavolan. 2016. A comprehensive analysis of 39 end se-quencing data sets reveals novel polyadenylation signals and the repressiverole of heterogeneous ribonucleoprotein C on cleavage and polyadenyla-tion. Genome Res. 26:1145–1159. https://doi.org/10.1101/gr.202432.115
Guo,W., Q. Huai, G. Zhang, L. Guo, P. Song, X. Xue, F. Tan, Q. Xue, S. Gao, andJ. He. 2021. Elevated Heterogeneous Nuclear Ribonucleoprotein C Ex-pression Correlates With Poor Prognosis in Patients With SurgicallyResected Lung Adenocarcinoma. Front. Oncol. 10:598437. https://doi.org/10.3389/fonc.2020.598437
Heegaard, N.H.H., M.R. Larsen, T. Muncrief, A. Wiik, and P. Roepstorff.2000. Heterogeneous nuclear ribonucleoproteins C1/C2 identified asautoantigens by biochemical and mass spectrometric methods. ArthritisRes. 2:407–414. https://doi.org/10.1186/ar119
Howard, J.M., H. Lin, A.J. Wallace, G. Kim, J.M. Draper, M. Haeussler, S.Katzman,M. Toloue, Y. Liu, and J.R. Sanford. 2018. HNRNPA1 promotesrecognition of splice site decoys by U2AF2 in vivo. Genome Res. 28:689–698. https://doi.org/10.1101/gr.229062.117
Huang, G.Z., Q.Q. Wu, Z.N. Zheng, T.R. Shao, Y.C. Chen, W.-S. Zeng, and X.Z.Lv. 2020. M6A-related bioinformatics analysis reveals that HNRNPCfacilitates progression of OSCC via EMT. Aging (Albany NY). 12:11667–11684. https://doi.org/10.18632/aging.103333
Hung, T., G.A. Pratt, B. Sundararaman, M.J. Townsend, C. Chaivorapol, T.Bhangale, R.R. Graham, W. Ortmann, L.A. Criswell, G.W. Yeo, and T.W.Behrens. 2015. The Ro60 autoantigen binds endogenous retroelementsand regulates inflammatory gene expression. Science. 350:455–459.https://doi.org/10.1126/science.aac7442
Ishizuka, J.J., R.T. Manguso, C.K. Cheruiyot, K. Bi, A. Panda, A. Ira-cheta-Vellve, B.C. Miller, P.P. Du, K.B. Yates, J. Dubrot, et al. 2019.Loss of ADAR1 in tumours overcomes resistance to immune check-point blockade. Nature. 565:43–48. https://doi.org/10.1038/s41586-018-0768-9
Herzner et al. Journal of Experimental Medicine 21 of 23
Type I IFN synergy of ADAR and hnRNPC deficiency https://doi.org/10.1084/jem.20201833
Dow
nloaded from http://rupress.org/jem
/article-pdf/218/9/e20201833/1420257/jem_20201833.pdf by C
alif San Diego (Biom
) user on 28 July 2021

Iurescia, S., D. Fioretti, and M. Rinaldi. 2018. Targeting Cytosolic NucleicAcid-Sensing Pathways for Cancer Immunotherapies. Front. Immunol. 9:711. https://doi.org/10.3389/fimmu.2018.00711
Jimenez-Boj, E., N. Kedersha, M. Tohidast-Akrad, F.M. Karlhofer, G.Stummvoll, C. Zimmermann, W. Ulrich, S. Guiducci, E. Hoefler, M.Aringer, et al. 2008. Autoantibodies to the translational suppressorsT cell intracytoplasmic antigen 1 and T cell intracytoplasmic antigen 1-related protein in patients with rheumatic diseases: increased preva-lence in systemic lupus erythematosus and systemic sclerosis andcorrelationwith clinical features. Arthritis Rheum. 58:1226–1236. https://doi.org/10.1002/art.23435
Jourdy, Y., A. Janin, M. Fretigny, A. Lienhart, C. Negrier, D. Bozon, and C.Vinciguerra. 2018. Reccurrent F8 Intronic Deletion Found in Mild He-mophilia A Causes Alu Exonization. Am. J. Hum. Genet. 102:199–206.https://doi.org/10.1016/j.ajhg.2017.12.010
Katsuyama, T., H. Li, D. Comte, G.C. Tsokos, and V.R. Moulton. 2019. Splicingfactor SRSF1 controls T cell hyperactivity and systemic autoimmunity.J. Clin. Invest. 129:5411–5423. https://doi.org/10.1172/JCI127949
Kim, Y.K.I., and L.E. Maquat. 2019. UPFront and center in RNA decay: UPF1 innonsense-mediated mRNA decay and beyond. RNA. 25:407–422. https://doi.org/10.1261/rna.070136.118
Kim, J.H., K.Y. Paek, K. Choi, T.-D. Kim, B. Hahm, K.-T. Kim, and S.K. Jang.2003. Heterogeneous nuclear ribonucleoprotein C modulates transla-tion of c-myc mRNA in a cell cycle phase-dependent manner. Mol. Cell.Biol. 23:708–720. https://doi.org/10.1128/MCB.23.2.708-720.2003
Lee, S.M., F.D. Dunnavant, H. Jang, J. Zunt, and M.C. Levin. 2006. Auto-antibodies that recognize functional domains of hnRNPA1 implicatemolecular mimicry in the pathogenesis of neurological disease. Neuro-sci. Lett. 401:188–193. https://doi.org/10.1016/j.neulet.2006.03.016
Levin, M.C., S. Lee, L.A. Gardner, Y. Shin, J.N. Douglas, and H. Salapa. 2017.Autoantibodies to heterogeneous nuclear ribonuclear protein A1(hnRNPA1) cause altered ‘ribostasis’ and neurodegeneration; the legacy ofHAM/TSP as a model of progressive multiple sclerosis. J. Neuroimmunol.304:56–62. https://doi.org/10.1016/j.jneuroim.2016.07.005
Li, T., and Z.J. Chen. 2018. The cGAS-cGAMP-STING pathway connects DNAdamage to inflammation, senescence, and cancer. J. Exp. Med. 215:1287–1299. https://doi.org/10.1084/jem.20180139
Li, X., C.X. Liu, W. Xue, Y. Zhang, S. Jiang, Q.F. Yin, J. Wei, R.W. Yao, L. Yang,and L.L. Chen. 2017. Coordinated circRNA Biogenesis and Function withNF90/NF110 in Viral Infection.Mol. Cell. 67:214–227.e7. https://doi.org/10.1016/j.molcel.2017.05.023
Li, Y.I., D.A. Knowles, J. Humphrey, A.N. Barbeira, S.P. Dickinson, H.K. Im,and J.K. Pritchard. 2018. Annotation-free quantification of RNA splicingusing LeafCutter. Nat. Genet. 50:151–158. https://doi.org/10.1038/s41588-017-0004-9
Liddicoat, B.J., R. Piskol, A.M. Chalk, G. Ramaswami,M. Higuchi, J.C. Hartner,J.B. Li, P.H. Seeburg, and C.R. Walkley. 2015. RNA editing by ADAR1prevents MDA5 sensing of endogenous dsRNA as nonself. Science. 349:1115–1120. https://doi.org/10.1126/science.aac7049
Liddicoat, B.J., A.M. Chalk, and C.R. Walkley. 2016. ADAR1, inosine and theimmune sensing system: distinguishing self from non-self. Wiley In-terdiscip. Rev. RNA. 7:157–172. https://doi.org/10.1002/wrna.1322
Liu, H., J. Golji, L.K. Brodeur, F.S. Chung, J.T. Chen, R.S. deBeaumont, C.P.Bullock, M.D. Jones, G. Kerr, L. Li, et al. 2019. Tumor-derived IFNtriggers chronic pathway agonism and sensitivity to ADAR loss. Nat.Med. 25:95–102. https://doi.org/10.1038/s41591-018-0302-5
Lubelsky, Y., and I. Ulitsky. 2018. Sequences enriched in Alu repeats drivenuclear localization of long RNAs in human cells. Nature. 555:107–111.https://doi.org/10.1038/nature25757
Mehdipour, P., S.A. Marhon, I. Ettayebi, A. Chakravarthy, A. Hosseini, Y. Wang,F.A. de Castro, H. Loo Yau, C. Ishak, S. Abelson, et al. 2020. Epigenetictherapy induces transcription of inverted SINEs and ADAR1 dependency.Nature. 588:169–173. https://doi.org/10.1038/s41586-020-2844-1
Moulton, V.R., A.R. Gillooly, and G.C. Tsokos. 2014. Ubiquitination regulatesexpression of the serine/arginine-rich splicing factor 1 (SRSF1) innormal and systemic lupus erythematosus (SLE) T cells. J. Biol. Chem.289:4126–4134. https://doi.org/10.1074/jbc.M113.518662
Obeng, E.A., C. Stewart, and O. Abdel-Wahab. 2019. Altered RNA processingin cancer pathogenesis and therapy. Cancer Discov. 9:1493–1510. https://doi.org/10.1158/2159-8290.CD-19-0399
Park, Y.M., S.J. Hwang, K. Masuda, K.-M. Choi, M.-R. Jeong, D.-H. Nam,M. Gorospe, and H.H. Kim. 2012. Heterogeneous nuclear ribonu-cleoprotein C1/C2 controls the metastatic potential of glioblastomaby regulating PDCD4. Mol. Cell. Biol. 32:4237–4244. https://doi.org/10.1128/MCB.00443-12
Pastor, T., and F. Pagani. 2011. Interaction of hnRNPA1/A2 and DAZAP1 with anAlu-derived intronic splicing enhancer regulates ATM aberrant splicing.PLoS One. 6:e23349. https://doi.org/10.1371/journal.pone.0023349
Peisley, A., C. Lin, B.Wu,M. Orme-Johnson,M. Liu, T.Walz, and S. Hur. 2011.Cooperative assembly and dynamic disassembly of MDA5 filaments forviral dsRNA recognition. Proc. Natl. Acad. Sci. USA. 108:21010–21015.https://doi.org/10.1073/pnas.1113651108
Peisley, A., M.H. Jo, C. Lin, B. Wu, M. Orme-Johnson, T. Walz, S. Hohng, andS. Hur. 2012. Kinetic mechanism for viral dsRNA length discriminationby MDA5 filaments. Proc. Natl. Acad. Sci. USA. 109:E3340–E3349.https://doi.org/10.1073/pnas.1208618109
Pestal, K., C.C. Funk, J.M. Snyder, N.D. Price, P.M. Treuting, and D.B. Stetson. 2015.Isoforms of RNA-Editing Enzyme ADAR1 Independently Control NucleicAcid Sensor MDA5-Driven Autoimmunity and Multi-organ Development.Immunity. 43:933–944. https://doi.org/10.1016/j.immuni.2015.11.001
Pichlmair, A., O. Schulz, C.P. Tan, J. Rehwinkel, H. Kato, O. Takeuchi, S.Akira, M. Way, G. Schiavo, and C. Reis e Sousa. 2009. Activation ofMDA5 requires higher-order RNA structures generated during virusinfection. J. Virol. 83:10761–10769. https://doi.org/10.1128/JVI.00770-09
Quinones-Valdez, G., S.S. Tran, H.I. Jun, J.H. Bahn, E.W. Yang, L. Zhan, A.Brümmer, X. Wei, E.L. Van Nostrand, G.A. Pratt, et al. 2019. Regulationof RNA editing by RNA-binding proteins in human cells. Commun. Biol.2:19. https://doi.org/10.1038/s42003-018-0271-8
Rodriguez, J.M., P. Maietta, I. Ezkurdia, A. Pietrelli, J.J. Wesselink, G. Lopez,A. Valencia, and M.L. Tress. 2013. APPRIS: annotation of principal andalternative splice isoforms. Nucleic Acids Res. 41:D110–D117. https://doi.org/10.1093/nar/gks1058
Schlee, M., and G. Hartmann. 2016. Discriminating self from non-self innucleic acid sensing. Nat. Rev. Immunol. 16:566–580. https://doi.org/10.1038/nri.2016.78
Sebestyen, E., B. Singh, B. Miñana, A. Pagès, F. Mateo, M.A. Pujana, J.Valcarcel, and E. Eyras. 2016. Large-scale analysis of genome andtranscriptome alterations in multiple tumors unveils novel cancer-relevant splicing networks. Genome Res. 26:732–744. https://doi.org/10.1101/gr.199935.115
Smith, I., P.G. Greenside, T. Natoli, D.L. Lahr, D. Wadden, I. Tirosh, R. Nar-ayan, D.E. Root, T.R. Golub, A. Subramanian, and J.G. Doench. 2017.Evaluation of RNAi and CRISPR technologies by large-scale gene ex-pression profiling in the Connectivity Map. PLoS Biol. 15:e2003213.https://doi.org/10.1371/journal.pbio.2003213
Sun, W., B. Xing, Y. Sun, X. Du, M. Lu, C. Hao, Z. Lu, W. Mi, S. Wu, H. Wei,et al. 2007. Proteome analysis of hepatocellular carcinoma by two-dimensional difference gel electrophoresis: novel protein markers inhepatocellular carcinoma tissues. Mol. Cell. Proteomics. 6:1798–1808.https://doi.org/10.1074/mcp.M600449-MCP200
Sveen, A., S. Kilpinen, A. Ruusulehto, R.A. Lothe, and R.I. Skotheim. 2016. AberrantRNA splicing in cancer; expression changes and driver mutations of splicingfactor genes. Oncogene. 35:2413–2427. https://doi.org/10.1038/onc.2015.318
Tajnik, M., A. Vigilante, S. Braun, H. Hanel, N.M. Luscombe, J. Ule, K.Zarnack, and J. Konig. 2015. Intergenic Alu exonisation facilitatesthe evolution of tissue-specific transcript ends. Nucleic Acids Res.43:10492–10505. https://doi.org/10.1093/nar/gkv956
Tremblay, M.P., V.E.S. Armero, A. Allaire, S. Boudreault, C. Martenon-Bro-deur,M. Durand, E. Lapointe, P. Thibault, M. Tremblay-Letourneau, J.P.Perreault, et al. 2016. Global profiling of alternative RNA splicing eventsprovides insights into molecular differences between various types ofhepatocellular carcinoma. BMC Genomics. 17:683. https://doi.org/10.1186/s12864-016-3029-z
Van Nostrand, E.L., G.A. Pratt, A.A. Shishkin, C. Gelboin-Burkhart, M.Y.Fang, B. Sundararaman, S.M. Blue, T.B. Nguyen, C. Surka, K. Elkins,et al. 2016. Robust transcriptome-wide discovery of RNA-bindingprotein binding sites with enhanced CLIP (eCLIP). Nat. Methods. 13:508–514. https://doi.org/10.1038/nmeth.3810
Van Nostrand, E.L., P. Freese, G.A. Pratt, X. Wang, X. Wei, R. Xiao, S.M. Blue,J.Y. Chen, N.A.L. Cody, D. Dominguez, et al. 2020a. A large-scalebinding and functional map of human RNA-binding proteins. Nature.583:711–719. https://doi.org/10.1038/s41586-020-2077-3
Van Nostrand, E.L., G.A. Pratt, B.A. Yee, E.C. Wheeler, S.M. Blue, J. Mueller, S.S.Park, K.E. Garcia, C. Gelboin-Burkhart, T.B. Nguyen, et al. 2020b. Principlesof RNAprocessing fromanalysis of enhancedCLIPmaps for 150RNAbindingproteins. Genome Biol. 21:90. https://doi.org/10.1186/s13059-020-01982-9
Vencovsky, J., D., Stanek, J. Kafkova, and I. Raska. 1997. Heterogenous nuclearRNP C1 and C2 core proteins are targets for an autoantibody found inthe serum of a patient with systemic sclerosis and psoriatic arthritis.Arthritis Rheum. 40:2172–2177. https://doi.org/10.1002/art.1780401211
Herzner et al. Journal of Experimental Medicine 22 of 23
Type I IFN synergy of ADAR and hnRNPC deficiency https://doi.org/10.1084/jem.20201833
Dow
nloaded from http://rupress.org/jem
/article-pdf/218/9/e20201833/1420257/jem_20201833.pdf by C
alif San Diego (Biom
) user on 28 July 2021

Vordenbaumen, S., A. Lueking, P. Budde, H.D. Zucht, H. Goehler, R. Brinks, R.Fischer-Betz, J. Richter, E. Bleck, J. Detert, et al. 2016. Sequential high-content profiling of the IgG-autoantibody repertoire reveals novel an-tigens in rheumatoid arthritis. Arthritis Res. Ther. 18:235. https://doi.org/10.1186/s13075-016-1135-6
Wu, B., A. Peisley, C. Richards, H. Yao, X. Zeng, C. Lin, F. Chu, T. Walz, and S.Hur. 2013. Structural basis for dsRNA recognition, filament formation,and antiviral signal activation by MDA5. Cell. 152:276–289. https://doi.org/10.1016/j.cell.2012.11.048
Wu, Y., W. Zhao, Y. Liu, X. Tan, X. Li, Q. Zou, Z. Xiao, H. Xu, Y. Wang, and X.Yang. 2018. Function of HNRNPC in breast cancer cells by controlling
the dsRNA-induced interferon response. EMBO J. 37:e99017. https://doi.org/10.15252/embj.201899017
Yepiskoposyan, H., F. Aeschimann, D. Nilsson, M. Okoniewski, and O.Mühlemann. 2011. Autoregulation of the nonsense-mediated mRNAdecay pathway in human cells. RNA. 17:2108–2118. https://doi.org/10.1261/rna.030247.111
Zarnack, K., J. Konig, M. Tajnik, I. Martincorena, S. Eustermann, I. Stevant,A. Reyes, S. Anders, N.M. Luscombe, and J. Ule. 2013. Direct competi-tion between hnRNP C and U2AF65 protects the transcriptome from theexonization of Alu elements. Cell. 152:453–466. https://doi.org/10.1016/j.cell.2012.12.023
Herzner et al. Journal of Experimental Medicine 23 of 23
Type I IFN synergy of ADAR and hnRNPC deficiency https://doi.org/10.1084/jem.20201833
Dow
nloaded from http://rupress.org/jem
/article-pdf/218/9/e20201833/1420257/jem_20201833.pdf by C
alif San Diego (Biom
) user on 28 July 2021

Supplemental material
Herzner et al. Journal of Experimental Medicine S1
Type I IFN synergy of ADAR and hnRNPC deficiency https://doi.org/10.1084/jem.20201833
Dow
nloaded from http://rupress.org/jem
/article-pdf/218/9/e20201833/1420257/jem_20201833.pdf by C
alif San Diego (Biom
) user on 28 July 2021

Figure S1. Selection of screen candidates and IFIT1/2 expression in screen. (A and B) Fold enrichment (A) and relative information content (B) of Alu-element RNA for 150 eCLIP targets in alphabetical order. The targets selected for the screen are opaque and labeled. Colors indicate RNA strand: red, Alu RNAin sense orientation; dark blue, Alu RNA in antisense orientation. Shapes indicate cell line: circles, HepG2; triangles, K562. Asterisks marking the labels indicateliterature showing functional interaction of the target with Alu RNA (orange), antibodies recognizing the target in autoimmunity (light blue), or the targetplaying a functional role in autoimmune disease (black). References are listed in Table S1. (C and D) IFIT1 (C) and IFIT2 (D) expression in THP-1 as in Fig. 1 B.Each set of aligned circles represents unique combinations of RBP targeting + ADAR gRNA (two to four individual gRNAs per RBP). Black, no ADAR targeting;blue, ADAR targeting+nontarget controls; green, ADAR targeting+non–RBP-negative controls; orange, ADAR-targeting + SETDB1 targeting–positive control;red, ADAR targeting+RBP targeting. Dotted blue line indicates average IFIT1 (C) or IFIT2 (D) expression across all ADAR+nontarget gRNA nucleofected samples.Log2 expression from three independent experiments is reported. Bars indicate 95% confidence intervals around mean. Successful CRISPR/Cas9 targeting wasnot confirmed at this stage. (E) Protein detection in THP-1 byWestern blot as indicated in Fig. 1 C. One representative out of three experiments. gRNAs: C, Non-target control; H2/H3 hnRNPC gRNA #2 (used in Fig. 2 C); and #3, A, ADAR gRNA. CTRL, nontarget control; sgRNA, single-guide RNA.
Herzner et al. Journal of Experimental Medicine S2
Type I IFN synergy of ADAR and hnRNPC deficiency https://doi.org/10.1084/jem.20201833
Dow
nloaded from http://rupress.org/jem
/article-pdf/218/9/e20201833/1420257/jem_20201833.pdf by C
alif San Diego (Biom
) user on 28 July 2021

Figure S2. Validation studies in further cell lines and primary cells. (A–E) Cells were nucleofected as in Fig. 1 C (A–C) or nucleofected with ribonu-cleoparticles with recombinant Cas9 and the indicated gRNAs (D and E), and normalized expression of the indicated genes on day 5 (A–C and E) or day 4 (D) isreported. Parental polyclonal WT Cas9-transgenic THP-1 cell line (A), a WT clone (B), a distinct STING-deficient clone (C), or MCF-7 (E) was used. Expressionwas normalized to RPL36 expression (A–C) or CASC3 expression (D and E), log2-transformed, and then analyzed by repeated-measures two-way ANOVA and Pvalues for individual comparisons determined by Tukey’s post hoc test. *, P ≤ 0.05; **, P ≤ 0.01; ***, P ≤ 0.001 (A–C and E). Individual symbols are replicatesfrom four independent experiments each; mean ± SEM is depicted. (D) Relative expression of the indicated genes in monocytes/early macrophages from fourindependent healthy donors 5 d after nucleofection of the indicated gRNAs. Data are displayed as donor-wise z-scores of log2-transformed relative expression;colors indicate individual donors. CTRL, nontarget control; hnC, hnRNPC.
Herzner et al. Journal of Experimental Medicine S3
Type I IFN synergy of ADAR and hnRNPC deficiency https://doi.org/10.1084/jem.20201833
Dow
nloaded from http://rupress.org/jem
/article-pdf/218/9/e20201833/1420257/jem_20201833.pdf by C
alif San Diego (Biom
) user on 28 July 2021

Figure S3. Alu-containing introns are dysregulated upon hnRNPC deficiency and examples of intergenic annotated editing clusters. (A) Examples ofsplicing clusters as defined by LeafCutter. Excised introns are deduced from split RNA-seq reads. Introns sharing ends (~splice sites, circles) are clustered, andclusters containing only one intron are excluded (as shown right). Alternatively spliced transcripts can result in one (left) or multiple (center) splice clusters.Adapted from Li et al. (2017). (B) Differential splicing is deduced from differential relative counts of excised introns. Both clusters in this example are dif-ferentially spliced. (C) Schematic illustration of relative splice site use quantification. Splice site use was estimated by aggregating intron counts sharing thesame intron end; relative counts per cluster were calculated, and fold change between nontarget control and hnRNPC gRNA nucleofected THP-1 was de-termined. (D) Schematic illustration of differential expression analysis of intronic regions. Exons of APPRIS-annotated transcripts were merged and subtractedfrom the respective genes to yield intronic regions. RNA-seq reads mapping to these introns were subjected to intron-wise differential expression analysis.(E and F) Exemplary raw coverage of RNA-seq reads and splice junctions estimated from split reads at the PNPLA3 locus (E) and the ANKRD36C locus (F).Analysis shown for cells 4 d after nucleofection with nontarget control (E and F). RefSeq annotation is shown below. Bars are average coverage; gray: <10%reads differ from the reference sequence; colored bars indicate ≥10% of reads differ from reference. Green, adenosine; yellow, guanosine; blue, cytidine;orange, thymidine. Note that the gene in F is transcribed in (−)−strand direction: A-to-I editing appears as C-to-T transition. One representative of three. CTRL,nontarget control; k.o., knockout.
Herzner et al. Journal of Experimental Medicine S4
Type I IFN synergy of ADAR and hnRNPC deficiency https://doi.org/10.1084/jem.20201833
Dow
nloaded from http://rupress.org/jem
/article-pdf/218/9/e20201833/1420257/jem_20201833.pdf by C
alif San Diego (Biom
) user on 28 July 2021

Figure S4. hnRNPC deficiency–dependent up-regulated ECRs gain access to the cytosol, continued. (A) Four-way plot of log2 (fold-change) expressionof A-to-I editing cluster groups in THP-1. x axis: log2 (fold change) between total RNA and RNA from cytosolic extracts in the second RNA-seq study. Data arefrom two independent experiments. y axis: expression in ADAR singly versus ADAR+hnRNPC doubly nucleofected cells on day 3, 4, and 5 after nucleofection inthe first RNA-seq study. Data are from three independent experiments. Colored lines indicate values for MT-ND1 (mitochondrial), MALAT1 (nuclear), and ACTB(cytosolic) RNAs as in Fig. 9 B. Circle color indicates the average reduction in editing in hnRNPC single versus hnRNPC+ADAR double deficiency as difference ofthe average percent editing across all editing sites within each cluster group. Average of three (y axis) or two (x axis) samples per condition. Transparencyindicates significant up-regulation in hnRNPC+ADAR gRNA over ADAR gRNA nucleofected cells; size of circles indicates number of clusters per cluster group.(B) BaseScope staining of select ECRs (red) in THP-1 with the indicated deficiencies. Nuclei were stained with DAPI (blue). Red rectangles represent selectedimage details shown in Fig. 9 C. Each field of view is representative of six fields of views from two separate experiments. DapB, bacterial gene, negative control.Scale bar, 20 µm. CTRL, nontarget control; cyt, cytosolic; mito, mitochondrially encoded; nuc, nuclear.
Herzner et al. Journal of Experimental Medicine S5
Type I IFN synergy of ADAR and hnRNPC deficiency https://doi.org/10.1084/jem.20201833
Dow
nloaded from http://rupress.org/jem
/article-pdf/218/9/e20201833/1420257/jem_20201833.pdf by C
alif San Diego (Biom
) user on 28 July 2021
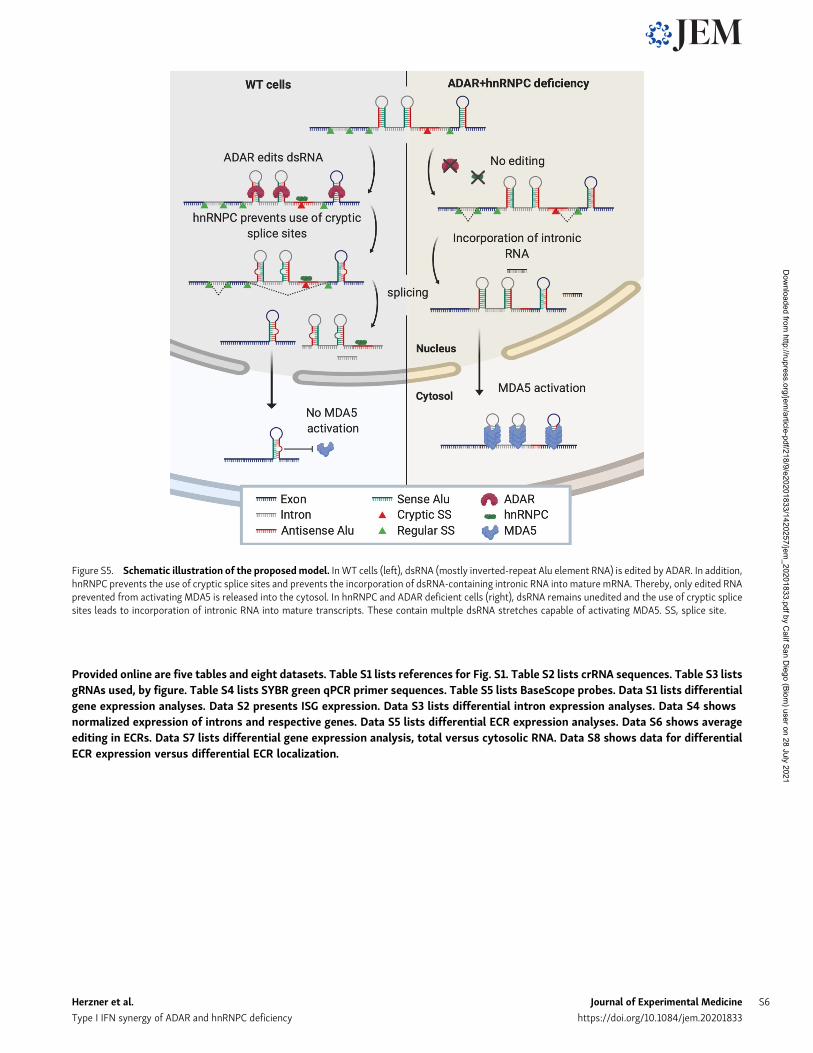
Provided online are five tables and eight datasets. Table S1 lists references for Fig. S1. Table S2 lists crRNA sequences. Table S3 listsgRNAs used, by figure. Table S4 lists SYBR green qPCR primer sequences. Table S5 lists BaseScope probes. Data S1 lists differentialgene expression analyses. Data S2 presents ISG expression. Data S3 lists differential intron expression analyses. Data S4 showsnormalized expression of introns and respective genes. Data S5 lists differential ECR expression analyses. Data S6 shows averageediting in ECRs. Data S7 lists differential gene expression analysis, total versus cytosolic RNA. Data S8 shows data for differentialECR expression versus differential ECR localization.
Figure S5. Schematic illustration of the proposedmodel. InWT cells (left), dsRNA (mostly inverted-repeat Alu element RNA) is edited by ADAR. In addition,hnRNPC prevents the use of cryptic splice sites and prevents the incorporation of dsRNA-containing intronic RNA into mature mRNA. Thereby, only edited RNAprevented from activating MDA5 is released into the cytosol. In hnRNPC and ADAR deficient cells (right), dsRNA remains unedited and the use of cryptic splicesites leads to incorporation of intronic RNA into mature transcripts. These contain multple dsRNA stretches capable of activating MDA5. SS, splice site.
Herzner et al. Journal of Experimental Medicine S6
Type I IFN synergy of ADAR and hnRNPC deficiency https://doi.org/10.1084/jem.20201833
Dow
nloaded from http://rupress.org/jem
/article-pdf/218/9/e20201833/1420257/jem_20201833.pdf by C
alif San Diego (Biom
) user on 28 July 2021
Copyright © 2022 FDOKUMEN