Adaptive comb filtering for harmonic signal enhancement
15
1124 IEEE TRANSACTIONS ON ACOUSl'ICS. SPEECH, AND SIGNAL PROCESSIKG, VOI.. ASSP-34, NO. 5, OCTOBER 1986 Adaptive Comb Filtering for Harmonic Signal Enhancement Abstract-A new algorithm is presented for adaptive comb filtering and parametric spectral estimation of harmonic signals with additive white noise. The algorithm is composed of two cascaded parts. The first estimates the fundamental frequency and enhances the harmonic com- ponent in the input, and the second estimates the harmonic amplitudes and phases. Performance analysis provides new results for the asymp- totic Cramer-Rao bound (CRB) on the parameters of harmonic signals with additive white noise. Results of simulations indicate that the vari- ances of the estimates are of the same order of magnitude as the CRB for sufficiently large data sets, and illustrate the performance in en- hancing noisy artificial periodic signals. S I. INTRODUCTION IGNALS that consist of a sum of sine waves whose frequenciesareintegralmultiples of thelowestfre- quency (so-called fundamental) are said to be harmonic. Many physical signals are approximately harmonic. Ex- amplesincludevoicedspeechandotherbiologicalsig- nals, musical waveforms, helicopter and boat sound waves, and outputs of nonlinear systems excited by a sin- usoidal input. To filter noise corrupted harmonic signals whose parameters are unknown and possibly time vary- ing, it is desirable to apply adaptive filtering. Most exist- ing adaptive filters (forinstance,in [l] and [a]) do not accountforthespecialstructure of the harmonicspec- trum, thus, their performance is not likely to be optimal for such signals. In Section I1 of this paper, we develop a new adaptive algorithm,speciallydesigned to enhanceharmonicsig- nals measured with additive white noise. It can also be used as an adaptive notch filter for eliminating harmonic interference from a measurement broad-band process. The parameters of the harmonic signal, such as the fundamen- tal frequency, and the harmonic amplitudes and phases, are assumed unknown and are estimated by the algorithm. The proposed algorithm is of recursive prediction error (RPE) or recursive maximum likelihood (RML) type (see [3] and [4]) and uses several nonstandard features to im- prove its performance. ManuscriptreceivedFebruary 5, 1985;reviscdMarch29,1986.The work of A. Nehorai was supported in part by the National Science Foun- dation under Grant DCI-860435 1. A. Nehorai was with Systems Control Technology, Inc., Palo Alto, CA 94304. He is nowwiththeDepartment of ElectricalEngineering, Yale University, New Haven, CT 06520-2157. B. Porat is with the Department of Electrical Engineering, Technion- Israel Institute of Technology, Haifa 32000, Israel. IEEE Log Number 8609626. The filter appearing in the algorithm consists of a cas- cade of second-order infinite impulse response (IIR) sec- tions, and has a comb-type frequency response. These second-order sections are parametrized by a single vari- able: the estimated fundamental frequency of the har- monic signal. This yields an estimation algorithm for the fundamental frequency which is more efficient and accu- rate than others (for example, [l] and [2]) which view the sinusoidal frequencies as independent. In addition, simi- larly to [SI, special constraints are imposed on the filter coefficients, giving arbitrarily narrow-band-pass filters for each harmonic. This improves the performance in com- parison to other comb filters of finite impulse response (FIR) type (for example, [6] and [7]), which typically re- quire a large number of coefficients to obtain narrow pass- bands. The harmonic amplitudes and phases are estimated separately, conditioned on the estimated fundamental fre- quency.Thealgorithm is computationally efficient; the number of operations it requires per time sample is pro- portional to the squared number of the filtered harmonics. Section I11 is devoted to performance analysis of the algorithm. We first derive the Cramer-Rao bound (CRB) for estimating the parameters of harmonic signal embed- ded in white noise, Then results of Monte Carlo simula- tions are presented, indicating that the variances of pa- rameter estimates are of the same order of magnitude as the CRB for a sufficiently large number of data, but the algorithm is not fully efficient in general. The algorithm is alsotested against periodic signals with an infinite num- ber of harmonics. The results demonstrate the applicabil- ity of the algorithm to the filtering of artificial periodic waveforms, such as square waves, saw-tooth, triangular waves, and others. Section 1V summarizes the paper. 11. THE ADAPTIVE COMB FILTER This section derives the proposed adaptive comb filter (ACF) for harmonic signal enhancement and spectral es- timation. The subsections below consider the following subjects: I) the special model and parameterization of the harmonic signal with additive white noise, and a general description of the algorithm; 2) the error regression and gradient; 3) the recursive algorithm for estimating the fundamental frequency and enhancing the harmonic sig- nal; and 4) the recursive algorithm for estimating the am- plitudes and phases of the harmonic components. 0096-3518/86/1000-1124$01.00 @ 1986 IEEE
Transcript of Adaptive comb filtering for harmonic signal enhancement

1124 IEEE TRANSACTIONS ON ACOUSl'ICS. SPEECH, AND SIGNAL PROCESSIKG, VOI.. ASSP-34, N O . 5 , OCTOBER 1986
Adaptive Comb Filtering for Harmonic Signal Enhancement
Abstract-A new algorithm is presented for adaptive comb filtering and parametric spectral estimation of harmonic signals with additive white noise. The algorithm is composed of two cascaded parts. The first estimates the fundamental frequency and enhances the harmonic com- ponent in the input, and the second estimates the harmonic amplitudes and phases. Performance analysis provides new results for the asymp- totic Cramer-Rao bound (CRB) on the parameters of harmonic signals with additive white noise. Results of simulations indicate that the vari- ances of the estimates are of the same order of magnitude as the CRB for sufficiently large data sets, and illustrate the performance in en- hancing noisy artificial periodic signals.
S I. INTRODUCTION
IGNALS that consist of a sum of sine waves whose frequencies are integral multiples of the lowest fre-
quency (so-called fundamental) are said to be harmonic. Many physical signals are approximately harmonic. Ex- amples include voiced speech and other biological sig- nals, musical waveforms, helicopter and boat sound waves, and outputs of nonlinear systems excited by a sin- usoidal input. To filter noise corrupted harmonic signals whose parameters are unknown and possibly time vary- ing, it is desirable to apply adaptive filtering. Most exist- ing adaptive filters (for instance, in [l] and [ a ] ) do not account for the special structure o f the harmonic spec- trum, thus, their performance is not likely to be optimal for such signals.
In Section I1 of this paper, we develop a new adaptive algorithm, specially designed to enhance harmonic sig- nals measured with additive white noise. It can also be used as an adaptive notch filter for eliminating harmonic interference from a measurement broad-band process. The parameters of the harmonic signal, such as the fundamen- tal frequency, and the harmonic amplitudes and phases, are assumed unknown and are estimated by the algorithm. The proposed algorithm is of recursive prediction error (RPE) or recursive maximum likelihood (RML) type (see [3 ] and [4]) and uses several nonstandard features to im- prove its performance.
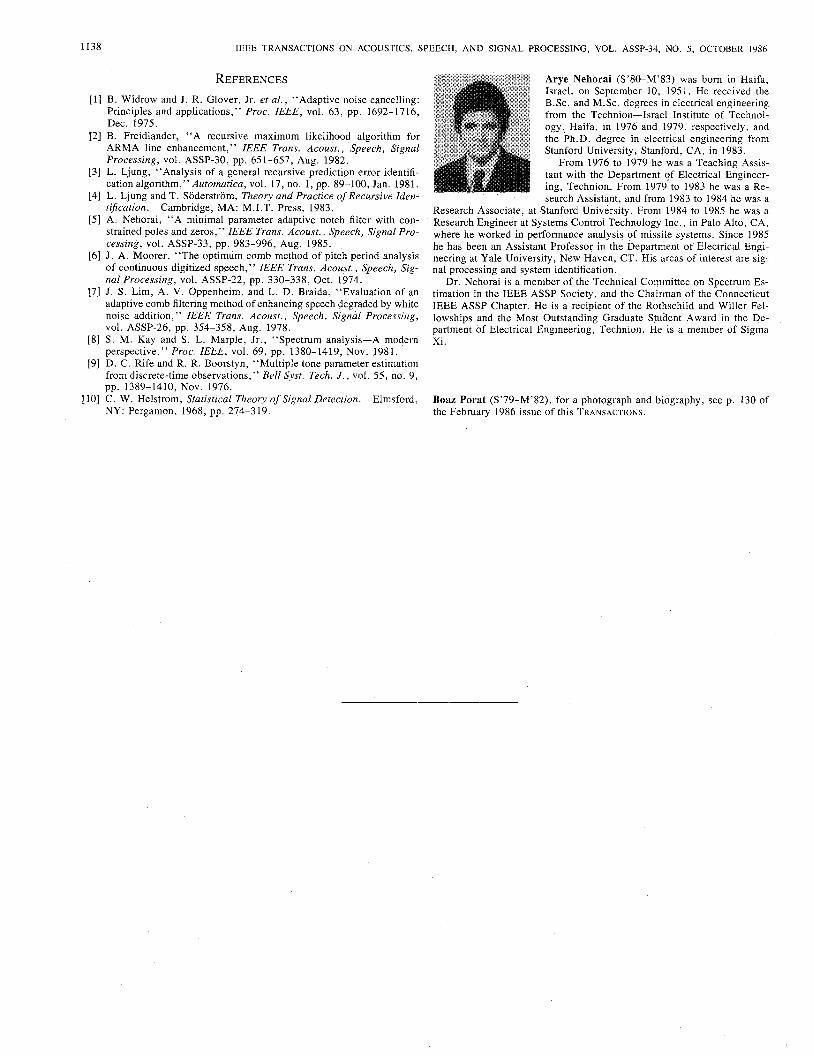
Manuscript received February 5 , 1985; reviscd March 29, 1986. The work of A. Nehorai was supported in part by the National Science Foun- dation under Grant DCI-860435 1.
A. Nehorai was with Systems Control Technology, Inc., Palo Alto, CA 94304. He is now with the Department of Electrical Engineering, Yale University, New Haven, CT 06520-2157.
B. Porat is with the Department of Electrical Engineering, Technion- Israel Institute of Technology, Haifa 32000, Israel.
IEEE Log Number 8609626.
The filter appearing in the algorithm consists of a cas- cade of second-order infinite impulse response (IIR) sec- tions, and has a comb-type frequency response. These second-order sections are parametrized by a single vari- able: the estimated fundamental frequency of the har- monic signal. This yields an estimation algorithm for the fundamental frequency which is more efficient and accu- rate than others (for example, [l] and [2]) which view the sinusoidal frequencies as independent. In addition, simi- larly to [SI, special constraints are imposed on the filter coefficients, giving arbitrarily narrow-band-pass filters for each harmonic. This improves the performance in com- parison to other comb filters of finite impulse response (FIR) type (for example, [6] and [7]), which typically re- quire a large number of coefficients to obtain narrow pass- bands. The harmonic amplitudes and phases are estimated separately, conditioned on the estimated fundamental fre- quency. The algorithm is computationally efficient; the number of operations it requires per time sample is pro- portional to the squared number of the filtered harmonics.
Section I11 is devoted to performance analysis of the algorithm. We first derive the Cramer-Rao bound (CRB) for estimating the parameters of harmonic signal embed- ded in white noise, Then results of Monte Carlo simula- tions are presented, indicating that the variances of pa- rameter estimates are of the same order of magnitude as the CRB for a sufficiently large number of data, but the algorithm is not fully efficient in general. The algorithm is also tested against periodic signals with an infinite num- ber of harmonics. The results demonstrate the applicabil- ity of the algorithm to the filtering of artificial periodic waveforms, such as square waves, saw-tooth, triangular waves, and others. Section 1V summarizes the paper.
11. THE ADAPTIVE COMB FILTER
This section derives the proposed adaptive comb filter (ACF) for harmonic signal enhancement and spectral es- timation. The subsections below consider the following subjects: I ) the special model and parameterization of the harmonic signal with additive white noise, and a general description of the algorithm; 2) the error regression and gradient; 3) the recursive algorithm for estimating the fundamental frequency and enhancing the harmonic sig- nal; and 4) the recursive algorithm for estimating the am- plitudes and phases of the harmonic components.
0096-3518/86/1000-1124$01.00 @ 1986 IEEE

NEHORAI AND PORAT: ADAPTIVE COMB FILTERING 1125
x ( t ) in our special case, the zeros of A ( q - ' ) are at integral mul- tiples of the fundamental frequency, this polynomial can be-written as W E Wo't)
Y ( t ) __j RLS 3 ACF n
A(q-') = (1 + akq-' + q-2) (5a) Fig. 1. Block diagram of the proposed algorithm. k = 1
where A . The Model
(IIk = -2 COS ko,. (5b) Let x ( t ) be the harmonic signal whose parameters are
to be estimated. Thus, Due to the summetry of A(q- ') n
X ( t ) = c ck Sin (kw,t + 4 k ) (1) k = 1
where w, is the fundamental frequency, and ck and c $ ~ are the amplitude and phase of the kth harmonic component of x ( t ) , respectively. The number n is the assumed num- ber of harmonics in x ( t ) . In cases where the actual signal consists of an infinite number of harmonics, we truncate the infinite sum at n harmonics where n is chosen so that the energy in the remaining harmonics is sufficiently small. The remaining harmonics will be considered as part of the, noise, cf. (2) below.
The white noise corrupted measurement at time t is as- sumed to be
Y ( 0 = + u (t) n
= C ck sin (kw,t + &) + u(t ) (2) k = l
where u ( t ) is a zero-mean white noise with variance u2 , We assume that the parameter vector
e = c1 - . cn, 4' . - 4~~ (3)
is unknown. A maximum likelihood estimation of 0 would require a nonlinear algorithm of dimension 2n + 1. To simplify this situation, we shall divide our algorithm into two cascaded parts, as is illustrated in Fig. 1 . As shown in the figure, the first part of the algorithm is the recursive prediction error adaptive comb filter, which estimates the fundamental frequency w, and enhances the harmonic component x ( t ) of y ( t ) . Based on these results, the am- plitudes { Ck} and phases { &} are estimated (after param- eter transformation, see later) using a linear recursive least squares (RLS) algorithm.
Let us discuss the whitening filter of y ( t ) . For this we recall that for n sine waves (not necessarily harmonics) with additive white noise, y ( t ) can be shown to satisfy the relationship [SI
4 - l ) Y ( t ) = A(q--]) u( t ) (4) where A(q-') is the 2nth-order polynomial in the unit de- lay operator q-', whose zeros are on the unit circle at the sine wave frequencies. We should stress that since the nulls of A(q-') are at the sine wave frequencies, it does not follow from (4) that y ( t ) = u (t) . Also note that A(q-') has 2n poles at the origin which are not important for the present discussion as they are cancelled out in (4). Since
A(q-') = 1 + qq- ' + - - - + anqWn
+ . . . + a l q - 2 n + l + q-? (6)
The whitening filter of y (t) is required to be stable, and its output has to be u (t) when excited by y ( t ) . By inspec- tion, we find from (4) that the whitening filter can be ap- proximated by
n
This function satisfies the stability requirements when p < 1 . It is characterized by 2n zeros on the unit circle at {e i j k o n , 1 I k 4 n) and 2n poles having the same phase angles at the zeros and their radii are all p , that is, the poles are at (pe'jkoO, 1 5 k I n]. The parameter p is chosen by the user; typical values are 0.95-0.995.
From (4), ( 3 , and (7), we observe that the error signal
4 = w q - 9 Y (t) (8)
approximates the noise u ( t ) when p is sufficiently close to one.
Note that H(q-') can be used as a notch filter for elim- inating harmonic disturbance added to a desired broad- band process. The reverse operation of extracting the har- monic signal x ( t ) from the noisy measurement y ( t) is ob- tained by
where K is the zero frequency gain of H(q- ' ) . One of the main advantages of our algorithm can be
observed already at this point by noting that the whitening filter H(q- ' ) is modeled by a single parameter, namely, the fundamental frequency of x@). This leads to a com- putationally efficient algorithm for estimating w,, as is discussed in the sequel.
B. f i e Error Regression and Gradient The proposed algorithm uses the model (7), (8) and ad-
justs the estimate of w, so as to minimize the cost function

1126 IEEE TRANSACTIONS ON ACOUSTICS, SPEECH, AND SIGNAL PROCESSING, VOL. ASSP-34, NO. 5, OCTOBER 1986
N
v, = c E 2 ( t ) r = 1
where N is the number of data samples.
expression. Let To compute the error ~ ( t ) we need to find its regression
a = [al - * a,] T (1 1) and let H be the Hankel matrix
where superscript T denotes transpose. From (7) and (8) 1 one obtains the difference equation
E ( t ) = y (t) + y (t - 2n) - p2"c(t - 212) - (p'(t>a (12) H = [ ~ . . : - : : : : ~ 1 j. (20) . . . . . where . . . .
1 p]' * - . P m - 1
CP(~) [ ' ~ l ( t ) + * * ~ n ( t ) l ' (13a) Assume that { X i , 1 5 i 5 m} are all distinct. Then and
i = n.
The gradient of ~ ( t ) with respect to u, can be found as follows. Let
The derivatives -aE(t)/aai can be shown to be given by (see also [5] )
sew Pi ( 0 aai A ( P ~ - * )
_- - ___ -
= 'PFi (t), A (15) i.e., -&(t)/aai are filtered versions of {pi (t)}.
use the relationship To compute the derivatives aai/au, in (14), we shall
where { X i , 1 5 i 5 2n) are the zeros of the polynomial z Z n ~ ( z - ' ) , namely,
h2k- = eikuo = e-jkmo , 1 5 k 5 n. (17)
The expression in the right-hand side of (16) can be com- puted using the following lemma proven in Appendix A.
Lemma I : Let P(z) be a polynomial of order m in z , viz.,
P(2) = z m + plzm-' + * - - + pm
= (Z - X,)(Z - X,) * * (Z - X m ) . (18)
Let V be the Vandemonde matrix
We now apply the results of lemma 1 to our case. Due to the symmetry of the polynomial A(q-') , we only need to consider the derivatives of the n first coefficients. Using (20) and (21), we get
- - I;;; 1 = - [OiHIV (22)
- . I . - ah 2n
where [0 i 7?] is an n X 2n matrix whose n leftmost col- umns are zero and
The matrix 7 in (22) is similar to (19), but here m = 2n and X i are given in (17). Now let
Then

NEHORAI AND PORAT: ADAPTIVE COMB FILTERING 1127
n
n
= 2 k sin kio, k = 1
(n ,+ 1) cos i l 2 1 (2n + l)iw, sin [i(n + l)wO] - - -
2 sin2 (?) sin (2) Combining (22)-(24), we now have
I= I 1
or
where a, = 1. Thus, $(t) can be computed by first eval- uating the sequence { x i } in (25), then computing { aai/ aoo) by (27), and finally,
where
v = [V, * vny
n - 1
C. The Adaptive Algorithm for 2(t) and Go@) With the results above, we can now apply the general
RML or RPE approach to our case. The resulting recur- sions of the algorithm for enhancing the harmonic signal and estimating the fundamental frequency are summa- rized below. Note that in each recursion, the latest avail- able estimates of a, and A(q-') replace their value in the expressions of the previous subsection. The explanations of the algorithm and its special features are discussed be- low.
1) The RPE Adaptive Comb Filter: Design Variables: n , X(l) , X,, y(l), r ( l ) , p ( l ) , pot
Initialization: G,(O), pi(0) = pFi(0) = 0, i = 1 , * - ,
Nominal Values:
n = number of band-pass filters
X(l) = 0.45 - 0.65, X, = 0.98, y(1) = 1 , r(1) z
P ( W ) .
n , y ( - i ) = 0, i = 1, * - , 2n.
Ey2(t)/100
p(1) = 0.8, po = 0.98, p ( ~ ) = 0.95 - 0.995 (see also
comments below).
Main Loop:
G0(t) = Go(t -

1128 IEEE TRANSACTIONS ON ACOUSTICS, SPEECH, AND SIGNAL PROCESSING, VOL. ASSP-34, NO. 5, OCTOBER 1986
sin [i(n + 1) &,(t)]
2 sin2 (T) i&,(t) f i ( t ) =
i - I
Vi(t + 1) = c dl@) ai-&)
p(t + 1) =' [p& + 1) * p,(t + l)lT
V F Q + 1) = [PFl(f + 1) * P F n O + 1>IT
V(t + 1) = [V,(t + 1) * * * V,(t + l)lT
$(t + 1) = pgt + 1) V(t + 1)
X ( t + 1) = X,X(t) + (1 - X,)
y(t + 1) = y(t)/[y(t) + + 1)1
I = O
sin (y)
r ( t + 1) = r ( t ) + y(t + 1)[g2(t + 1) - r(t)] (30s)
P( t + 1) = POP@) + (1 - Po) P(W). (300
We now discuss some of the special features which were used to improve the performance of the algorithm. Some of these features were used also in the algorithm of [SI, and therefore, they are discussed only briefly.
2) Time-Varying Pole Moduli: The recursion (30q) for the pole moduli yields a time-varying p(t) instead of a constant value of the pole moduli. Note that p(t) grows exponentially from p(1) to p(m) with a time constant To = 1/( 1 - p,). Thus, at the beginning of the data process- ing, the notches of the estimated whitening filter are wide and they become narrower as time goes on. This improves the sensitivity of the algorithm to the presence of har- monics and increases its convergence rate. To see this, note that when the initial conditions of the algorithm are poor, and if the notches are too narrow, the input har- monics are likely to appear at the flat part of the estimated whitening filter transfer function. In such cases, the gra- dient of the algorithm vanishes and the algorithm may not converge to the desired transfer function.
The nominal initial value p(1) = 0.8 was chosen as the smallest value of pole modulus which still has significant effect on the notch bandwidths. The value of p ( m ) is cho- sen as a tradeoff between accurate asymptotic perfor- mance ( p ( m ) as close as possible to one) and robustness as well as tracking capability of time-varying frequencies (smaller values of p(00)) . 3) Updating the Gain and Tracking Time-Varying Pa-
rameters: The recursion (30r) for the gain y(t) and the related recursions (30q) and (30s) are adapted from [4] for stationary signals. Equation (30q) of updating X ( t ) in- fluences the cost function at the transient phase and im- proves the convergence rate of the algorithm. The above
nominal values of X( 1) and X, were found to yield the best results in our simulation experiments. For SNR = 0 dB, it was useful to take X(1) = 0.45 and for SNR 2 4 dB X(1) = 0.65.
With the above recursions and for stationary signals, the resulting step size y(t)/r (t) asymptotically approxi- mates the inverse second derivative of the cost function evaluated at &,(t - 1). For this reason, the algorithm can be viewed as a recursive Gauss-Newton type.
To allow tracking of time-varying parameters, it is common to choose y ( t ) = yo, where yo is a small positive number. This corresponds to an exponentially weighted cost function characterized by time constant lly, (see [4]).
4) Stability Monitoring: The analysis of [3] and [4] shows that for RPE algorithms, one must check at each time update whether the current parameter estimates cor- respond to a stable filter. Otherwise, the parameter esti- mates must be projected back into the stable model set. However, in our case, the estimated whitening filter H(q-') is stable by construction, and therefore, stability monitoring is not needed.
5) Estimating the Number of Harmonics: For practical cases where the number of harmonics n is unknown, we note that n can be estimated as follows. Apply the algo- rithm given above and the cascaded algorithm of Section 11-D-1 with an overestimated number of harmonics based on prior information on n. Then n can be estimated on line using the number of harmonics yielding significant amplitudes, i.e., larger than some predetermined thresh- old. The use of an underestimated n usually adds a dis- tortion to the filtered signal. The faster the spectrum en- velope of x ( t ) decreases, the smaller the distortion will be. The use of an overestimated n usually adds some noise to the output.
6) A Modified Version: The algorithm above directly estimates the fundamental frequency of x (t). Another ver- sion of the algorithm first estimates the coefficient a1 [see (5b)l and then the fundamental frequency can be evalu- ated using the relationship a, = cos-' ( -cu1/2). This modified version was found to be more robust than the original algorithm, especially when most of the energy is concentrated in the first harmonic of x ( t ) . (See the ex- amples bf the next section.) This result can be explained heuristically by the fact that in such cases, the error gra- dient tends to be more linear with respect to al than with respkct to w, (consider, for instance, the special case of a single sine wave). The modified algorithm is obtained by

NEHORAI AND PORAT: ADAPTIVE COMB FILTERING 1129
multiplying +(t) by
dG,(t) 1 -= d&,(t) 2 sin G,(t)
7) Convergence Analysis: The convergence of RPE- type algorithms has been analyzed in [3] and [4]. The proof that the assumptions of this analysis hold for our case is 'technical, and we omit its detail. Among the re- sults of the canvergence analysis, we briefly mention that in the model complete case (i.e., when the model is con- sistent with the data) and white Gaussian noise, the pa- rameter estimates are asymptotically unbiased, normally distributed, and achieve the Cramer-Rao bound (i.e., sta- tistically efficient).
Finally, we note that the initialization r (1 ) = Ey2(t)/ 100 is only an approximation implicitly based on recom- mendations in [4, p. 2991. As noted in [4], in practice, it is common to take r(1) = 1/C where C is a large number. As C becomes' larger, the value of c3,(0) becomes only marginalfy important.
D. Estimating the Harmonic Amplitudes and Phases In some applications, it i s desired to estimate the am-
plitudes and'phases of the harmonic components in a$$- tion to the fundamental frequency. The algqrithm below is suggested for this purpose.
To derive the algorithm, we shall first assume that w, is known, and apply proper transformation to, the desired parameters. We have
/ I
n
y ( t ) = C ck sin (kw,t + &) + u ( t ) k = 1
n
= x ( g k COS kW,t + hk Sin k0,t) + U(t) (32) k = 1
where
gk = ck sin (334
hk = ck COS &. (33b)
This can be written as
y ( t ) = [sin w,t * - sin nwot,
cos w,t - - - cos nw,t] q + u(t) (34a)
where
= [SI * * g n , hl * (34b)
Equation (34a) implies that if w, were known, an RLS algorithm could be used to estimate the sequences { g k } and (hk} . Then the desired amplitudes { Ck} and phases { &} could be found by a simple transformation from rect- angular to polar coordinates. Since the fundamental fre- quency w, is unknown, we can replace it by its estimate obtained from the algorithm of Section II-C. This proce- dure is summarized below.
I ) The RLS Algorithm for the Harmonic Amplitude and Phase Estimation:
Initialization: C(0) = 0, P(0) = (l0O/SNR)Z2,. Main Loop:
r(t) = [sin Got * * - sin n&t, cos Got - * * cos nij,t]
(354
e(t) = a( t ) - r*(t) C(t - 1 ) (35b)
(35c) C(t) = $(t - 1) + P(t) c(t) e(t). (354
In the above algorithm, the variable X(t) is updated sim- ilarly to the algorithm in (30). The amplitudes and phages can'be evaluated by
(35f)
In the next section, we will show that the expected rel- ative error of 2, is significantly smaller than those of the amplitudes and phases when obtained by a maximum like- lihood estimator. This implies that by replacing w, by its estimate &,, the accuracy of the amplitude and phase es- timates is not expected to deteriorate significantly.
To improve the estimation accuracy of this procedure, it is also useful to replace the raw data y ( t ) by the filtered data a ( t ) [see (35b)l. Here it should be noted that the noise in a ( t ) is colored, which may cause some bias in the es- timates of the amplitudes and phases. However, since this noise is much smaller than in the raw data y ( t ) , the overall accuracy of this procedure is still better than if y ( t ) were used.
The initialization P(0) = (100/SNR) Z 2 n , where ZZn is the 2n X 2n identity matrix, is only an approximation based on recommendations in [4, p. 2991. In practice it is common to take P(0) = C ZZn where C is a large number
2) Amount of Computations: The overall algorithm for adaptive estimation of the harmonic signal parameters re- quires a number of operations proportional to n2 per time sample. Most of the computation load is taken by the computation of A(q- ' , t ) in (~OC), computation of the gra- dient vector V ( t + 1) in (301), and updating the RLS gain vector P(t) c(t) in (35c, d). To save computations, the algorithm (35) of amplitude and phase estimation does not have to be implemented when only c3, and R(t) are needed.
(see r41).
111. PERFORMANCE EVALUATION In this section we evaluate the performance of the pro-
posed algorithm by several Monte Carlo simulation runs, and make comparisons to the Cramer-Rao bound (CRB). Then we illustrate .the convergence of the algorithm for signals with a large number of harmonics. Finally, we

1130 IEEE TRANSACTIONS ON ACOUSTICS, SPEECH, AND SlGNAL PROCESSING, VOL. ASSP-34, NO. 5 , OCTOBER 1986
illustrate the algorithm’s performance for artificial signals with an infinite number of harmonics.
A . The Asymptotic CRB for Harmonic Signals Asymptotic formulas for the Cramer-Rao bounds of the
parameters in the model (1) are derived in Appendix B. These formulas are valid when N, the number of data samples, satisfies N >> l/uO. The main results of Ap- pendix B are summarized as follows:
f r n
quency f , = 0.08, and u(t) is a zero mean unit variance white Gaussian noise. The harmonic amplitudes {ck) were chosen to yield both the desired signal-to-noise ratio given by SNR(dB) = 10 log ( X i Z l C ~ I 2 o 2 ) and the de- sired spectrum. To make the examples as close as possi- ble to practical situations, the spectrum envelope was chosen such that its decrease in gain was -6 dB per oc- tave, or harmonic powers proportional to 114’. This type
phases are unknown and amplitudes are known or not
phases are known and amplitudes are known or not
20 N
Var (&) 2 - in all cases (36c)
fundamental frequency is unknown and amplitudes are known or not
Var (&) I fundamental frequency is known and amplitudes are known or not
where n
y = C k2Ci. (360
Remarks: Note the quantity y /2a2 = E t = , k2Ci/202 appearing in the CRB of the fundamental frequency, is not the SNR, but an “enhanced SNR,” in which the var- ious harmonics are weighted both by their energies and by their relative frequencies. In particular, higher fre- quency harmonics have larger enhancement than low-fre- quency harmonics.
It is of interest to note that the results (36a) and (36b) can also be written as
k = 1
f 12 I
Var (Go) I I SNR w:ffN3 3
SNR w&N3
where SNR = X,”= Ci / (202) and the “effective band- width” = E;=, k2C$Z,“=, C:. The factor 1/(SNR w$f) appears also in the CRB on time delay estimation (see e.g., [IO]).
B. Monte Carlo Simulations The following examples illustrate the bias and variance
of the estimated parameters, compared to the CRB. The input data were
5
y(t) = c C, sin 2~0.08kt + u(t), (37)
i.e., the number of harmonics n = 5 , fundamental fre-
k = 1
of envelope is often used to model the voiced speech spec- trum envelope generated by the vocal tract.
The algorithm was applied, using a DEC VAX com- puter with double precision arithmetic, to estimate the pa- rameters of the signal (37) with design variables p ( ] ) = 0.8, po = 0.98, p(m) = 0.96, and X, = 0.98. For SNR = 0 dB, we used X ( l ) = 0.45 and for larger SNR’s values X(1) = 0.65. As was explained earlier, since in this case the number of harmonics is relatively small (n = 5 ) , and most of the energy of x(t) is contained in its first har- monic, it was was useful to update the parameter & 1 rather
phases are unknown and amplitudes are known or not
phases are known and amplitudes are known or not
than &. This was found to improve the robustness of the algorithm.
The algorithm was tested under different data lengths and signal-to-noise ratios. Each of the statistics below was computed from 100 independent Monte Carlo experi- ments. The parameter estimates G l ( t ) were set to values such thatL(0) was equal to 0.05 at the beginning of each experiment.
Table I summarizes the resulting sample statistics of the normalized fundamental frequency estimates for the sig- nals in (37). In the simulations, we encountered some re- alizations which gave outlier performance, i.e., the esti- mates were not close to the typical behavior. Out of 100

1131 NEHORAI AND PORAT: ADAPTIVE COMB FILTERING
TABLE I STATISTICAL RESULTS FOR THE FUNDAMENTAL FREQUENCY ESTIMATE OF
THE SIGNAL (37)
fo
N SNR Standard (Samples) (dB) Bias X10-6 Deviation XlO-’ CRB XlO-’
200 0 -98.7(7) 42.3 10.5
16 8 -26.0(3) 14.3 4.20
1.20 5.05 1.67 500 0 -22.6(6) 14.4 2.67
8 0.40(3) 2.03 1.06 16 -0.99 0.78 0.42
TABLE 11 STATISTICAL RESULTS FOR THE AMPLITUDE ESTIMATES OF THE SIGNAL (37)
C1 c2 c3 c4 c5
N SNR Standard Standard Standard Standard Standard (Samples) (dB) True Bias Deviation True Bias Deviation True Bias Deviation True Bias Deviation True Bias Deviation CRB
200 0 1.17 -0.08 0.15 0.58 -0.13 0.13 ’ 0.39 0.13 0.10 0.29 -0.14 0.09 0.23 -0.08 0.08 0.1 8 2.94 -0.13 0.32 1.47 -0.12 0.24 0.98 -0.15 0.19 0.73 -0.13 0.17 0.59 -0.15 0.15 0.1
16 7.38, -0.06 0.22 3.69 -0.07 0.18 2.46 -0.05 0.18 1.84 -0.07 0.21 1.48 -0.09 0.19 0.1 500 0 1.17 -0.04 0.10 0.58 -0.05 0.09 0.39 -0.04 0.09 0.29 -0.06 0.08 0.23 -0.04 0.07 0.063
8 2.94 -0.02 0.08 1.47 -0.02 0.08 0.98 -0.03 0.07 0.73 -0.04 0.08 0.59 -0.04 0.08 0.063 16 7.38 -0.02 0.12 3.69 -0.02 0.11 2.46 -0.02 0.11 1.84 -0.03 0.11 1.48 -0.03 0.10 0.063
TABLE 111 STATISTICAL RESULTS FOR THE PHASE ESTIMATES OF THE SIGNAL (37)
61 $2 63 64 45
Standard Standard Standard Standard Standard N SNR Bias Deviation CRB Bias Deviation CRB Bias Deviation CRB Bias Deviation CRB Bias Deviation CRB
(Samples) (dB) x ~ O - ~ x10- l x10-l X10-2 x10-l x10-l x ~ O - ~ x1O-I x10-’ x ~ O - ~ ~ 1 0 - ’ x10- l x ~ O - ~ x10- ’ x10-‘
200 0 6.79 4.48 1.08 9.84 7.64 2.16 -0.21 9.04 3.25 4.80 9.21 4.33 8.26 8.66 5.42 8 -0.02 1.25 0.43 0.56 2.88 0.86 0.88 , 4.49 1.29 7.61 5.42 1.72 21.3 6.21 2.15
16 -0.81 0.56 0.17 -1.66 0.11 0.34 -3.29 0.17 0.51 -3.66 0.21 0.69 1.94 2.42 0.86 500 0 0.62 2.42 0.68 2.99 4.29 1.37 2.22 6.33 2.05 -5.16 7.27 2.74 2.56 8.70 3.42
8 0.09 0.51 0.27 0.56 1.05 0.55 0.06 1.45 0.82 -0.40 2.01 1.09 -1.23 2.71 1.36 16 0.34 0.25 0.11 0.65 0.47 0.22 -0.17 0.65 0.33 0.17 0.78 0.43 0.32 0.97 0.54
experiments in each frequency estimate, the number of outliers is indicated in parentheses in the table. These cases were eliminated from the statistical computations. This is justified by the fact that the Cramer-Rao bound is derived under small error assumption. The decision on outlier was based on an arbitrary threshold of 0.0015 in the error of the fundamental frequency estimates. The number of cases in which this happened decreased with the data length and signal-to-noise ratio.
Table I presents also the CRB of the fundamental fre- quency for the above examples. The ratio of the actual standard deviation to the CRB appears to decrease as N increases, at least for high SNR’s. However, this ratio is not close to one, so the estimates are not fully efficient. We applied significance tests to the bias (using the “t” statistic) and found that w, is unbiased with confidence level 0.95, in all cases except for N = 200 and SNR = 0 dB. The CRB was computed using (36a).
Using the estimates of the fundamental frequency, the second part of the algorithm was used to estimate the har- monic amplitudes and phases for the same signals above. Table I1 presents the resulting sample statistics for the amplitude estimates. The results of the table show that the amplitude estimates have a negative bias. This bias be- comes larger for the higher frequency harmonics whose power in these examples is relatively small. The negative bias is due to the error in the fundamental frequency es- timates, which tends to attenuate the sine wave ampli- tudes. However, the bias decreases with the data length and signal-to-noise ratio.
Table I11 presents the sample statistics of the phase es- timates for the above signals, and the CRB computed by the square root of (36d). Similarly to the previous esti- mates, we observe that the standard deviations of the phases decrease with the data length and the signal-to- noise ratio, but they do not approach the CRB in general.

1132 IEEE TRANSACTIONS ON ACOUSTICS, SPEECH, AND SIGNAL PROCESSING, VOL. ASSP-34, NO. 5, OCTOBER 1986
. 1 L -2 . 3
4 . 5 Normalized Frequency
.085 1 I
,060 1 .055 t .05Ou- '
0 . 500. 1000. 15:O. 2000. Tlme (samples) i , ( t j
.o . 1 .2 .3 . 4 .5 Normalized Frequency
-60. -
-70.
- 8 0 , I.-----. .o . 1 .2 .3 . 4 . 5
I 1
Normalized Frequency
" I v.
. o . I .2 .3 . 4 .5 Normalized Frequency
Fig. 2. Estimation results for harmonic signal with additive white noise. n = 5 , SNR = 0 dB. (a) Power spectral density of the noise-free har- monic signal. (bj Power spectral density of the measurement. (cj The fundamental frequency estimate. (dj Transfer function of the convergent comb filter at f = 2000. (e) Power spectral density of the algorithm's output.
Application of significance tests confirmed that the phase estimates were unbiased with confidence level 0.95 for all cases, except for N = 200 and SNR = 8 dB, where 3, was biased.
C. Convergence Examples The following examples demonstrate the convergence
of the algorithm by two simulation runs for signals with a different number of harmonics.
Fig. 2(a)-(e) presents the results for the signal with five harmonics and fundamental frequency f, = 6 and SNR = 0 dB. The harmonic amplitudes decrease by 6 dB/oc- tave. Fig. 2(a) and (b) depicts the power spectral density of the noise-free signal x( t ) and the noisy measurement y( t ) , respectively. The algorithm was applied with initial conditionfo(0) = 0.05 and design variables as described above in the Monte Carlo simulations, except that p(00) was set to 0.99. This larger value was chosen to achieve

NEHORAI AND PORAT: ADAPTIVE COMB FILTERING 1133
higher reduction of noise. Fig. 2(c) shows the fundamen- tal frequency estimate of the algorithm versus time. We note that for larger signal-to-noise ratios, the convergence was usually faster and smoother. Fig. 2(d) illustrates the magnitude of the corresponding comb filter transfer func- tion after convergence given by
G(ej., t) = 1 - t 2 ( e i w , t ) / ~ ( t ) (38)
at t = 2000, and where t ) is the estimated whit- ening filter of the measurement, and K(t) its zero fre- quency gain. At t = 2000, the bias in the fundamental frequency was 8.00 X Fig. 2(e) depicts the power spectral density of the filtered output R(t) after conver- gence. This figure was drawn by applying FFT to the last 1024 data points of R(t) from t = 977 to t = 2000.
The next example illustrates the ability of the algorithm to filter noisy signals with a relatively large number of harmonics. For this purpose, the harmonic signal was with 20 harmonics, fundamental frequency & and SNR = 0 dB. Similarly to the above example, the harmonic ampli- tudes were adjusled to yield a spectrum envelope of -6 dB/octave. The algorithm was run with the same design variables as before and initial condition A,(O) = 0.015. Since, in this example, the number of harmonics was rel- atively large, the algorithm that updates ;,(t) was used. The results are presented in Fig. 3. The bias in the fun- damental frequency estimate was -2.5 1 X at t = 2000.
The result of the last example is interesting as it dem- onstrates that the algorithm is applicable for signals with a large number of harmonics and large orders of A ( q - ’ ) and A(pq- ’ ) . This is remarkable in comparison to the be- havior of most existing system identification algorithms whose usual largest possible order is between 5-10 for these types of SNR conditions and unknown input. The reason for this good behavior of the algorithm is our use of a single parameter model in the algorithm for estimat- ing the fundamental frequency.
The power spectral densities of Figs. 2(b) and 3(b) may lead one to think that FFT can be used to estimatef, eas- ily, as they clearly show the harmonic distribution of the signal. However, this is only because&, was chosen to be a submultiple of the number of FFT points (X, = &) in this simulation. In practice, usuallyf, does not satisfy this condition and then the “leakage” between the FFT bins makes it prohibitive to estimate L), especially in low SNR’s. Moreover, the FFT is a batch method, which can- not be applied adaptively in contrast to the proposed al- gorithm.
D. Enhancement of Periodic Signals As mentioned in Section 11, the proposed adaptive comb
filter is also useful for enhancement of periodic signals with an infinite number of harmonics by truncating the low-energy high-frequency harmonics. This is illustrated by the following example.
This example is of a triangular wave whose period is 12 samples and additive white noise with SNR = 0 dB. The modified algorithm that updates &,(t) was applied
with five passbands, design variables p ( 1 ) = 0.8, po = 0.98, p ( a ) = 0.995, X ( l ) = 0.45, X, = 0.98, and &,(O) = -27r cos 0.05. The above relatively large value of p( - ) was chosen to achieve high reduction of noise. Fig. 4(a)- (c), respectively, shows the original triangular wave sig- nal, the noisy measurement, and the algorithm filtered output after convergence, from t = 1900 to t = 2000. At t = 2000, the fundamental frequency bias was 1.75 X
We have also .applied the algorithm to filter a square wave signal plus white noise. The resulting filtered signal was slightly worse than in the triangular wave. This is explained by the fact that the spectrum envelope of a square wave decreases by 6 dB/octave, while that of a triangular wave decreases by 12 dB/octave. Thus, the truncation of higher harmonics causes larger distortion in the square wave than in the triangular wave. We omit the results due to space limitation.
Signals such as the above square wave and triangular wave which have so-called symmetric half-wave (i.e., x(t) = -x(t - T/2) where T is the period) are characterized by zero odd indexed harmonics. When it is a priori known that the harmonic component of the input is of this type, it is desirable to apply a special comb filter with only even index passbands. The algorithm of Section I1 can be easily modified for such applications.
IV. CONCLUSION In this paper, we have presented a new adaptive algo-
rithm for harmonic signal enhancement and parametric spectral estimation. Its computational efficiency advan- tage stems from the separation of the solution into two cascaded parts, as is illustrated in Fig. 1. The first part enhances the harmonic signals and estimates its funda- mental frequency. The second part estimates the har- monic amplitudes and phases. In this way, the nonlinear part of the algorithm involves only one parameter-the signal fundamental frequency. This enables the algorithm to work with significantly larger order ARMA polyno- mials than in general system identification schemes. An- other improvement compared to general RPE algorithms is the stability of the filter. Thus, stability monitoring, which is usually necessary for general RPE algorithms, is not needed in our scheme. Simulation results indicate that, for sufficiently large data sets, the variances of the esti- mated parameters are generally of the same order of mag- nitude as the Cramer-Rao bound, but the algorithm is not fully statistically efficient in general.
Other variants of the algorithm presented in this paper can be derived. For example, instead of using constant bandwidth passbands, one can use so-called constant-Q passbands, i.e., let the bandwidth of each passband be proportional to its central frequency. Another possibility is to include only certain harmonics, say, the odd ones, based on a priori information about the signal.
The ubiquity of harmonic signals both in nature and in artificial environments suggests a wide variety of poten- tial applications of the proposed algorithm. These include enhancement of noisy biological signals, such as voiced

1134 IEEE TRANSACTIONS ON ACOUSTICS, SPEECH, AND SIGNAL PROCESSING, VOL. ASSP-34, NO. 5 , OCTOBER 1986
r
n -
1
-. .o . 1 .2 . 3 . 4 .5 .@ . 1 .2 .3 . 4
Normalized Frequency .5
Normalized Frequency (a) (b)
::::I , , , , 1 500. 1000. 1520. 2000. .o . 1 .2 .3 . 4 . 5
-50.
Time (samples) f , ( t) Normalized Frequency
V .
.o Normalized Frequency . 1 .2 . 3 . 4 .5
(e) Fig. 3. Estimation results for harmonic signal with additive white noise.
n = 20: SNR = 0 dB.
speech and heart wave forms. Another important appli- cation is tracking of propeller-engine vehicles, for in- stance, submarines and helicopters. The alternative use, as an adaptive harmonic notch filter, is useful for har- monic noise cancellation. This may be used, for example, to reduce the noise in helicopter cockpit communication. Other applications are when there is a need to estimate artificial harmonic signal parameters in the presence of
noise, e.g., to estimate a radar’s modulated pulse repeti- tive frequency by a passive radar. Further research has to be carried out to investigate the performance in such ap- plications.
Our analysis has provided new results for the CRB of the parameter estimates of harmonic signals in additive white noise. One interesting result is that the power of each harmonic appearing in the CRB of the fundamental

NEHORAI AND PORAT: ADAPTIVE COMB FILTERING
- 3 . 1900.
Time (samples) 1950. 2000.
(a)
3 . I
2.
1.
0.
- 1.
-2.
-3.
-4 . ' I 1900. 1920. 1940. 1960. 1980. 2000.
Time (samples)
3.
2. i I
-3.1 1900. 1950. 2000.
Time (samples) (c)
Fig. 4. Enhancement results for triangular wave with additive white noise. n = 5, SNR = 0 dB. (a) The noise-free signal. (b) The noisy measure- ment. (c) The filtered output.
frequency estimate is multiplied by its squared relative frequency. Thus, higher frequency harmonics have en- hanced SNR in the CRB. This mathematical result gives a new explanation to a known physical phenomenon by which high-frequency, harmonics in speech are important to its intelligibility although their energy is usually rela-
1135
tively low. Clearly this is due to the fact that the high- frequency harmonics yield more information on the fun- damental frequency. The CRB results of this paper are general and potenfially useful in evaluating the perfor- mance of other harmonic spectral estimation algorithms.
An interesting topic of further research is the evaluation of the optimal values of p,, p( l ) , p ( m ) , X ( l ) , and X,. This subject is currently being investigated.
APPENDIX A PROOF OF LEMMA 1
Introduce the polynomials k
Pk(z) = pizk-i O I k S W Z (All i = O
where po = 1. Note that P,(z) = P(z) and that
Hence, m- I
m - 1
= zPm-l(z) - X? - c p i x y i = l
= ZP, - l(2) + p m = P(z). (A3)
Dividing both sides by ( z - X,) we have
(A51 This can also be written
where I/ and H were defined in (19) and (20), respec- tively. Next, note from (1 8) that
Hence, substituting z = X1, X2, * + , X, we get

1136 IEEE TRANSACTIONS ON ACOUSTICS, SPEECH, AND SIGNAL PROCESSING, VOL. ASSP-34, NO, 5, OCTOBER 1986
L o 1 ( 4
where the nonzero entry at the right-hand side appears at its kth row. Hence,
V T ..
= -diag II (A, - A,>; 1 I k I m ( i + k i = 1
(A9)
Premultiplying by (VT)-’ and making use of (A6), we obtain the desired expression (2 1).
APPENDIX B THE ASYMPTOTIC CRAMER-RAO BOUND FOR THE
PARAMETERS OF HARMONIC SIGNALS IN WHITE NOISE The Cramer-Rao is a general lower bound on the error
covariance of unbiased estimators. This appendix derives the asymptotic Cramer-Rao bound for the parameter es- timates of harmonic signals in additive white noise.
The assumed model is as in (1) parameterized by 8 de- fined in (2). To derive the CRB for this model, we will first derive the corresponding bound for the alternative model (32) parameterized by
8 = [w,, g1 * g,, h, . * - h,lT (B1)
where { g k } and {hk} were defined in (33a) and (33b), re- spectively. The desired CRB for (1) and 0 will then be evaluated using the relationship between the two models.
Under the above model, the joint probability density of the measurements { y(1) y ( N ) } is
From (B2) the general expression for the ( k , Z)th element of the Fisher information matrix is
The CRB for 8 is given by the inverse of J . It should be noted that an expression similar to (B3) was used in [9] for multiple sine waves with independent frequencies using complex signal formulation.
Let O(x) denote a quantity that is asymptotically linear in x, i.e., such that
Also let O( 1) denote a bounded quantity. Then we have for all kw, such that ko,/27r is not an integer and N >> 1 /w,
N
E ti sin kw,t = O(Ni); i = 0, 1 , 2, . * 0-35) t = 1
N
2 t i cos kw,t = O(Ni) i = 0, 1, 2 * - . (B6) t = I
Assume further that w, and n in (1) are such that kw,/2n is noninteger for all 1 I k 5 2n. (Note that this and the above assumption on kw, are always satisfied for a finite number of harmonics which are sampled at a rate larger than the Nyquist rate.) Then it can be shown that
Hence, the Fisher information matrix for the transformed parameter vector 8 of (Bl) can be written as
1 J = - ( J
2 2 1 + J 2 )

NEHORAI AND PORAT: ADAPTIVE COMB FILTERING
where
1137
In our case, from (33) these derivatives are
where
The matrix J;' can be easily computed to yield -
where 6kl is the Kronecker delta function. Substituting (B23) and (B21) into (B22), we obtain, after straightfor- ward but lengthy computations, the result
(B 16)
(B17a) CRB(@ = 2u2
(B17b)
j l i 0
yN2 IN (B17c)
1
Now from (B15) we get where
J-' = 2u2[J;' - J&.p + J7'J2J;'J*J;1 - * ]
(B 19) u = [ l , 2 * * nIT (B25a)
provided the infinite sum coverages. From (B16) and (B18), we have for sufficiently large N
Hence, for large N , J;'J2J;' is negligible compared to 5; Similarly, we can prove for the rest of the terms in (B19); hence, for large enough N , the CRB for 8 is
CRB@ = 2 ~ ~ 5 ; ' (B21)
where J;' was given in (B18). To evaluate now the CRB for the original parameter
vector 8 in (3), we will use the following general rela- tionship:
T
CRB(8) = E] CRB($) [$] (B22)
D = diag (l/C:}. (B25b)
The Cramer-Rao bounds on the fundamental frequency w,, the amplitudes (ck} , and phases (4k}) can now be found from the diagonal entries in (B24) as summarized in (36).
The structure of CRB(0) implies that the asymptotic CRB of w; and (4R) are independent of whether the am- plitudes are known or unknown, and vice versa. From (B24) we can also find that the asymptotic CRB of o, given the phases is
Using a similar notation we also find that
CRB (4(w0) = 202 D. N (B27) where the (k , Z)th entry of [a19la8] is aOk/a8, .
1138 IEEE TRANSACTIONS ON ACOUSTICS, SPEECH, AND SIGNAL PROCESSING, VOL. ASP-34, NO. 5 , OCTOBER 1936
r11
131
141
151
181
191
REFERENCES B . Widrow and J . R. Glover, Jr. et al., “Adaptive noise cancelling: Principles and applications,” Proc. IEEE, vol. 63, pp. 1692-1716, Dec. 1975. B. Freidlander, “A recursive maximum likelihood algorithm for ARMA line enhancement,” IEEE Trans. Acoust., Speech, Signal Processing, vol. ASSP-30, pp. 651-657, Aug. 1982. L. Ljung, “Analysis of a general recursive prediction error identifi- cation algorithm,” Autornatica, vol. 17, no. 1, pp. 89-100, Jan. 1981. L. Ljung and T. Soderstrom, T h e o v and Practice of Recursive Iden- tljication. Cambridge, MA: M.I.T. Press, 1983. A. Nehorai, “A minimal parameter adaptive notch filter with con- strained poles and zeros,” IEEE Trans. Acoust., Speech, Signal Pro- cessing, vol. ASSP-33, pp. 983-996, Aug. 1985. J . A. Moorer, “The optimum comb method of pitch period analysis of continuous digitized speech,” IEEE Trans. Acoust., Speech, Sig- nal Processing, vol. ASSP-22, pp. 330-338, Oct. 1974. J . S. Lim, A. V. Oppenheim, and L. D. Braida, “Evaluation of an adaptive comb filtering method of enhancing speech degraded by white noise addition,” IEEE Trans. Acoust., Speech, Signal Processing,
S. M. Kay and S. L. Marple, Jr., “Spectrum analysis-A modem perspective,” Proc. IEEE, vol. 69, pp. 1380-1419, Nov. 1981. D. C. Rife and R. R. Boorstyn, “Multiple tone parameter estimation from discrete-time observations,” Bell Syst. Tech. J . , vol. 55, no. 9,
C. W. Helstrom, Sfatistical Theory of Signal Detection. Elmsford, NY: Pergamon, 1968, pp. 274-319.
V O ~ . ASSP-26, pp. 354-358, Aug. 1978.
pp. 1389-1410, NOV. 1976. Boaz Porat (S’79-M’82), for a photograph and biography, see p. 130 of the February 1986 issue of this TRANSACTIONS.