adaption and evaluation of transversal leaf spring suspension ...
82
ADAPTION AND EVALUATION OF TRANSVERSAL LEAF SPRING SUSPENSION DESIGN FOR A LIGHTWEIGHT VEHICLE USING ADAMS/CAR FLORIAN CHRIST Master Thesis in Vehicle Engineering Vehicle Dynamics Aeronautical and Vehicle Engineering Royal Institute of Technology TRITA-AVE 2015:09 ISSN 1651-7660
-
Upload
khangminh22 -
Category
Documents
-
view
1 -
download
0
Transcript of adaption and evaluation of transversal leaf spring suspension ...

ADAPTION AND EVALUATION OF
TRANSVERSAL LEAF SPRING SUSPENSION DESIGN
FOR A LIGHTWEIGHT VEHICLE USING ADAMS/CAR
FLORIAN CHRIST
Master Thesis in Vehicle Engineering
Vehicle Dynamics
Aeronautical and Vehicle Engineering
Royal Institute of Technology TRITA-AVE 2015:09
ISSN 1651-7660

ii
Adaption and Evaluation of Transversal Leaf Spring Suspension Design for a Lightweight Vehicle using Adams/Car
FLORIAN CHRIST
© Florian Christ, 2015.
Vehicle Dynamics
Department of Aeronautical and Vehicle Engineering
Kungliga Tekniska Högskolan
SE-100 44 Stockholm
Sweden

iii
Abstract
This investigation deals with the suspension of a lightweight medium-class vehicle for
four passengers with a curb weight of 1000 kg. The suspension layout consists of a
transversal leaf spring and is supported by an active air spring which is included in the
damper. The lower control arms are replaced by the leaf spring ends. Active ride height
control is introduced to compensate for different vehicle load states. Active steering is
applied using electric linear actuators with steer-by wire design. Besides intense use of
light material the inquiry should investigate whether elimination of suspension parts or a
lighter component is concordant with the stability demands of the vehicle. The
investigation is based on simulations obtained with MSC Software ADAMS/Car and
Matlab. The suspension is modeled in Adams/Car and has to proof it's compliance in
normal driving conditions and under extreme forces. Evaluation criteria are suspension
kinematics and compliance such as camber, caster and toe change during wheel travel in
different load states. Also the leaf spring deflection, anti-dive and anti-squat measures
and brake force distribution are investigated. Based on a simplified version of the leaf
spring suspension design a full vehicle model is created. The comparison between the
suspension models evaluates the same basic suspension parameters to ensure the
compliance. Additionally roll rate and understeer gradient are investigated. It can be
shown that the vehicle equipped with transversal leaf spring instead of lower control
arms fulfils the set kinematics and compliance requirements. Road holding performance
is assured for normal driving conditions on public roads.
Keywords: Transversal leaf spring, composite leaf spring, wheel guiding leaf spring,
lightweight suspension design, MegaCityVehicle, Simulation, MSC Adams, kinematics
and compliance

iv

v
Acknowledgements This thesis was performed at the Department of Aeronautical and Vehicle Engineering at
KTH, the Royal Institute of Technology in Stockholm, Sweden. I’m in dept of the whole
Division of Vehicle Dynamics, its staff and their facilities for making my stay as
comfortable as possible.
In particular I’d like to thank my supervisor and mentor Lars Drugge, Associate
Professor at Vehicle Dynamics, who always had an open ear for my questions, problems
and ideas. I appreciated the very helpful comments, his personal motivation and the
procreative environment he provided me for doing the thesis. I acknowledge the
technical input from Sigvard Zetterström, research engineer at KTH Vehicle Dynamics,
without his basic ideas of the suspension design this report would not have been
possible. I extend my thanks to Daniel Wanner, PhD student at the Division of Vehicle
Dynamics, whose support with guidance and configuring software has been of great
value.
The thesis is inspired of the SåNätt Project driven by Volvo Car Corporation and many
partners in Swedish automotive industry. I feel very grateful for the interest of the
project group and am very proud and honored to be able to contribute to the project.
I’m much obliged to my colleagues at KTH, my teammates from KTHracing, and friends
I made in Sweden for their support and motivation and the great company they gave me
during my labor.
Finally I’d like to thank Jessica and my family who all made this possible with their
generous love, mental support and funding.

vi

vii
CONTENTS Abstract ................................................................................................................... iii
Acknowledgements ................................................................................................. v
Contents ................................................................................................................. vii
1. Introduction ................................................................................................... 1
1.1 Outline ............................................................................................................................ 2
1.2 Traditional Suspension Layout .................................................................................... 2
1.3 Proposed Vehicle Layout ............................................................................................. 4
1.4 Lightweight Construction ............................................................................................ 5
1.5 Comparison of Suspension Components .................................................................. 8
1.6 Suspension Requirements ............................................................................................ 9
1.6.1 Normal Use ......................................................................................................... 10
1.6.2 Extensive Use ..................................................................................................... 11
2. Methodology ................................................................................................ 13
2.1 Proposed Suspension Layout ................................................................................... 13
2.1.1 Proposed Suspension Weight ........................................................................... 15
2.1.2 Spring Characteristics ........................................................................................ 19
2.1.3 Dampers .............................................................................................................. 23
2.1.4 Anti-Roll-Bar Stiffness ...................................................................................... 24
2.1.5 Camber ................................................................................................................ 26
2.1.6 Caster ................................................................................................................... 26
2.1.7 Toe ....................................................................................................................... 26
2.1.8 Roll Center .......................................................................................................... 27
2.1.9 Anti-Dive and Anti-Squat ................................................................................. 28
2.1.10 Steering ................................................................................................................ 30
2.1.11 Wheels .................................................................................................................. 32
2.1.12 Brakes ................................................................................................................... 33
2.2 Models .......................................................................................................................... 35
2.2.1 FEM Leaf Spring Model ................................................................................... 35
2.2.2 Adams Suspension Model ................................................................................. 38
2.2.3 Description of Vehicle Model .......................................................................... 38
2.2.4 Leaf Spring in Adams ........................................................................................ 39
2.2.5 Gas Spring in Adams ......................................................................................... 40
2.2.6 Front Suspension ............................................................................................... 41
2.2.7 Rear Suspension ................................................................................................. 41
2.2.8 Steering ................................................................................................................ 42

viii
2.2.9 Tires...................................................................................................................... 42
3. Kinematics & Compliance ........................................................................... 43
3.1 Eigenfrequencies ........................................................................................................ 44
3.2 Hub Forces .................................................................................................................. 44
3.3 Anti Roll Bar Forces .................................................................................................. 46
3.4 Shock Absorber Ratio ................................................................................................ 47
3.5 Camber Angle ............................................................................................................. 48
3.6 Caster Angle ................................................................................................................ 49
3.7 Toe ................................................................................................................................ 50
3.8 Roll Center Height ..................................................................................................... 51
3.9 Anti-Lift, Anti-Dive and Anti-Squat........................................................................ 53
3.10 Normal Driving Compliance .................................................................................... 54
3.10.1 Drive and Brake Steer........................................................................................ 54
3.10.2 Bump Steer .......................................................................................................... 55
3.11 Abuse Compliance ..................................................................................................... 56
3.12 Summary ...................................................................................................................... 58
4. Full Vehicle Simulation ................................................................................ 60
4.1 Modifications of Suspension for Full Vehicle Investigation ................................ 60
4.1.1 Simplified Version for Front and Rear Suspension ...................................... 60
4.1.2 Spring Parameters and Hub Forces ................................................................. 61
4.1.3 Anti Roll Bar Forces .......................................................................................... 62
4.1.4 Camber, Caster and Toe Angles ...................................................................... 62
4.1.5 Track Width ........................................................................................................ 64
4.2 Maneuvers & Results ................................................................................................. 66
4.2.1 Constant Radius Circle Test ............................................................................. 66
4.2.2 Handling Diagram .............................................................................................. 66
4.2.3 Roll Angle ............................................................................................................ 67
4.2.4 ISO Lane Change ............................................................................................... 68
5. Conclusion ................................................................................................... 69
References ............................................................................................................... 70
Appendix - Vehicle Specification ........................................................................... 72

CHAPTER 1 INTRODUCTION
1
1. INTRODUCTION Today’s cars are judged in several aspects such as fuel economy, comfort, ride behavior, handling or safety. To further decrease fuel consumption and emissions actual vehicles are equipped with many additional parts compared to 30 years ago. Those can be sophisticated engines and exhaust treatment, high power generators/starters, batteries/capacitors, extra flywheels (mechanical KERS-system), and other small motors and powered electronics, which add weight besides their benefit. Also the increase of comfort equipment such as automatic gearboxes, climate control, powered windows, electric seat adjustment, seat heating, and many more contribute to increasing tare weights of modern vehicles. The same applies for safety equipment such as for instance air- and windowbags, ABS or ESP.
The mentioned developments are mainly for comfort and emission reasons which lead to a contradiction: Lightweight construction is applied but the weight advantage is mostly overcompensated with other equipment leading to the fact that cars get heavier even though the core of the vehicle is lightened [1], see also figure 1. When adding mass to the vehicle the chassis, engine power and brake system need to be adapted which itself adds again more weight. As result of more equipment installed over the last decades many car manufacturers investigate the broad use of lightweight materials to decrease the vehicle’s weight [2]. These attempts are usually widely orientated and include every single part of the vehicle. The use of aluminum profiles and castings could establish considerable weight savings in suspension and chassis parts, by use of glass fiber the bonnets, body panels and lids were lightened. Last but not least space age technology was introduced to passenger cars starting with carbon fiber roofs and is continuing with complete composite hybrid chassis.
Figure 1: Averaged curb weight of vehicles in the past separated by country of production [1].
The advantages of a lightweight vehicle are mainly that during acceleration and quasi static driving less power is needed to overcome driving forces enabling for smaller and lighter engines. On the opposite during deceleration the brakes are used to a smaller extent and therefore can be smaller and lighter as well. The same applies for all other parts in the suspension and chassis where less weight leads to decreased thicknesses and finally savings in material and weight. The main goal to decrease the amount of energy needed for daily driving opens the traditionally combustion engine driven vehicle for introduction of electric drivetrains where the battery capacity at the moment is a limiter

CHAPTER 1 INTRODUCTION
2
for mileage per charge. With lighter vehicles the same amount of energy serves for a larger range and both emissions and money can be saved.
The suspension layout has a major role to fulfill road holding and dynamic requirements. Throughout the past century a rapid development has happened for mass produced road vehicles. Inventions of front and rear suspension such as the McPherson strut (Ford, 1949) or multilink axles (Mercedes Benz, 1982) contributed to better ride quality and increased the complexity. Between a live axle and a multilink suspension a large increase of comfort is detectable.
As a logical consequence also the suspension of lightweight vehicles should be optimized regarding its weight properties. This could be done in several ways:
- use of new materials such as aluminum, glass and carbon fiber
- redesign of the suspension layout by decreasing the amount of parts.
In this thesis a combination of both is proposed to decrease the suspension weight.
1.1 Outline
With this investigation the following expectations are connected:
Describing a new suspension layout, its geometry and expected advantages, disadvantages and research bullets. This includes definition of vehicle data such as desired spring/damping values and geometrical requirements. Included are also the calculation and estimation of cornering, braking and acceleration forces. Several values have to be adapted for the proper vehicle adjustments (spring ratio, leaf spring stiffness, gas spring parameters, anti-roll bar (ARB) stiffness, steering ratio, bushing parameters, damping curves, etc.).
The general process of designing and building leaf springs from composite material is discussed using finite element method. To justify the use of lightweight materials and design some investigations about the amount of parts and corresponding weights are performed. As reference so called tare-down data for vehicles in the same class are used. Subsequently estimations of the weight of the proposed suspension are made.
The ensuing simulations show the geometrical suspension layout for wheel travel between -65 mm and +65 mm. Parameters such as camber, toe or caster change are monitored and compared to universal compliance values from a vehicle manufacturer. Also track width, roll center height, and hub forces (from leaf spring, gas spring and stabilizer) are evaluated and the deflection of the leaf spring is shown. The eigenfrequencies of the vehicle are calculated as well. Also the compliances of front and rear axle under different driving conditions (acceleration, bump, braking) and under abuse (longitudinal, lateral and vertical) are shown.
The simulation of the full vehicle shows the behavior for standard maneuvers such as lane changes or constant radius cornering.
1.2 Traditional Suspension Layout
Today’s medium-class vehicles have with reservations mostly highly integrated individual suspension layouts. Front wheel drive vehicles often have a McPherson strut installed at the front while the rear axle has a multilink layout, see figures 2 and 3. Rear wheel drive vehicles have options for the front suspension between McPherson (small and medium-class vehicles) or double wishbone as well as multilink, or a combination of both (mainly upper middle and luxury class). Even though light materials as aluminum or magnesium were introduced, the suspension in general is rather heavy. From tare-down data is

CHAPTER 1 INTRODUCTION
3
known that this kind of suspension weights about 250 kg including approximately 88 kg of tires, see also chapter 1.5.
For reasons of NVH often a subframe is used that connects the suspension parts to the chassis. Also the function of carrying the engine, the gearbox, steering rack, stabilizers or the final gear differential is often integrated into this subframe. Road disturbances and vibrations are reduced due to the fact that the frame is connected with bushings both to the chassis and the suspension links.
Figure 2: Common front axle layout McPherson (left, [3]) and Multilink (right, [4])
Figure 3: Rear axle design with K-frame and multilink layout [3].
Passenger vehicles usually have a mechanical steering system with steering column, steering rack and pinion, where power steering assist is electrically or hydraulically supported. This layout has been proofed for the last decades and is approved by today’s laws: The steering of a vehicle requires a mechanical connection between steering wheel and tires. Advanced steering systems have an override function so that small steer angles can be introduced by an electric actuator for active stability control that is according to legislation.
Passenger vehicles are usually equipped with coil springs that have progressive spring rates. The shock absorbers are usually oil filled dampers that have different parameters for compression and rebound. As the dampers have to compensate the vehicles weight during compression the damper rate is usually higher for expansion than compression.

CHAPTER 1 INTRODUCTION
4
1.3 Proposed Vehicle Layout
The study is performed on a passenger vehicle with the parameters shown in table 1. The proposed vehicle is in the same size range as for instance a Volvo S40/V50 (2007) or Audi A3 Sportback (8V, 2012), Volkswagen Jetta (VI, 2012), and is just slightly smaller than a Volvo V60 (2012), BMW 3-Series (F30, 2012) or Mercedes C-Class. It is designed to transport up to five adult passengers and personal luggage.
The vehicle follows a traditional front engine - front wheel drive layout leaving open whether the car will later be equipped with either traditional petrol engine or battery electric drivetrain. Different degrees of hybridization are possible as well. The undercarriage and suspension layout leaves enough room for introducing for instance all-/rear wheel drive or an electric rear axle. The vehicle is equipped with x-by wire technology for driving, steering and braking and can possibly be upgraded with 4 wheel steering if necessary. The layout with 2 front seats, 2-3 rear seats and trunk behind allows vehicle shape of limousine, station wagon and van.
Table 1: Proposed outline dimensions of the investigated vehicle.
Length 4600 mm Wheelbase 2700 mm
Width 1750 mm Track width 1520 mm
Height 1350 mm
As the vehicle is postulated to have a curb weight of just 1000 kg including a 75 kg driver, weight savings of more than 40-45 % compared to competitors in the same class are required. A total load capacity of 450 kg is postulated. Traditional vehicles have a revenue load of approximately 35-40 % of their curb weight, while the proposed vehicle has to tolerate 45 % due to the low tare weight. The postulated weight should be achieved by both lightweight construction and the use of light materials. In table 2 the weight and weight distribution for the project are pre-defined according to the vehicle description in figure 4. The tire size, steering ratio and maximal velocity are pre-defined in table 3.
Table 2: Proposed weight and its distribution of the investigated vehicle, respective the resulting values for the center of gravity.
Tare Laden
Total weight / [kg] 1000 1450
Weight on front axle / [kg] 580 680
Weight on rear axle / [kg] 420 770
Center of gravity height / [mm] 550 600
Load distribution Front/Rear / [%] 58/42 47/53
f / [mm] 1134 1433.7
b / [mm] 1566 1266.3
λ 0.42 0.531
κ 0.204 0.222

CHAPTER 1
Figure 4: Description of the vehicle dimensions
Table 3: Additional parameters of the proposed vehicle.
Rim Size
Tire rolling radius
Steering Ratio
Max. velocity
In figure 5 the used vehicle coordinate system is described. It follows the European SI System, meaning the x axis Derived from this, positive wheel travel is related to compression while negative wheel travel represents expansion or rebound.
Figure 5: Description of the used c
1.4 Lightweight
It is difficult to find a unique a lightweight structure these bullets should be fulfilled to a great extent:
• Removing all parts that are not necessary f
• Optimizing the structure along
• Use of light materials.
• Replace heavy and bulky parts
Investigating today’s mediumoptimized for not only ensure comfortable during driving but rather more for cost, weight and space efficiency. From live axles with leaf springs to multilink suspension with adaptive ride control over tof automotive development has increased the complexity of the suspension quite a lot. On the other hand best ride comfort and use of grip is the result of fast development and benefit for today’s road vehicles.
escription of the vehicle dimensions.
: Additional parameters of the proposed vehicle.
16”
Tire rolling radius rWheel =326 mm (205/60 R16)
rWheel= 321,5 mm (215/55 R16)
Steering Ratio 14 °/°
Max. velocity 160 km/h
the used vehicle coordinate system is described. It follows the European SI System, meaning the x axis points in driving direction while the z axis directs to the sky.
positive wheel travel is related to compression while negative wheel travel represents expansion or rebound.
of the used coordinate system.
Lightweight Construction
unique definition for “Lightweight Design”, but in order to obtain a lightweight structure these bullets should be fulfilled to a great extent:
emoving all parts that are not necessary for the intended use
Optimizing the structure along the expected maximum load path.
e of light materials.
Replace heavy and bulky parts with simpler and lighter parts.
medium-class cars it is obvious that suspension parts are very optimized for not only ensure comfortable and safe ride behavior and taking up the loads during driving but rather more for cost, weight and space efficiency. From live axles with leaf springs to multilink suspension with adaptive ride control over tof automotive development has increased the complexity of the suspension quite a lot. On the other hand best ride comfort and use of grip is the result of fast development and benefit for today’s road vehicles.
INTRODUCTION
5
the used vehicle coordinate system is described. It follows the European SI points in driving direction while the z axis directs to the sky.
positive wheel travel is related to compression while negative wheel
definition for “Lightweight Design”, but in order to obtain
or the intended use.
the expected maximum load path.
cars it is obvious that suspension parts are very much and safe ride behavior and taking up the loads
during driving but rather more for cost, weight and space efficiency. From live axles with leaf springs to multilink suspension with adaptive ride control over the past 50 years of automotive development has increased the complexity of the suspension quite a lot. On the other hand best ride comfort and use of grip is the result of fast development

CHAPTER 1 INTRODUCTION
6
When designing an uncompromising lightweight vehicle one has to deal with a tradeoff of ride comfort, comfort in general, safety, vehicle durability versus obviously weight and following cost or complexity. Naturally a vehicle that is lightened by 30 % may not offer the same ride quality and NVH as one might be used to it in today’s vehicles. The whole investigation allows and requires thinking outside the box, reconsidering today’s standards and also developments.
On the other hand through optimized design and use of light materials modern vehicles are already rather light, as can be seen in table 5. Some of the car manufacturers have widely introduced the use of light materials such as aluminum and use more and more compounds of different materials that are bonded with glue instead of welded steel panels. After premium car manufacturers started to build aluminum chassis in combination with steel in their luxury class, more and more lower class vehicles use aluminum for their chassis, engines and suspension parts. The amount of aluminum in medium-class vehicles by 2020 is expected to reach 200 kg [5], which is four times the amount of what was used in 1990 and no end of the trend is visible. Audi and BMW put a lot of effort to update their steel foundries to modern aluminum casting houses [6]. The effort pays off: With a mix of seamless drawn profiles, sheet material and casted nodes the almost complete aluminum chassis of the Mercedes SL weights a total of only 254 kg; saving 110 kg (reduction by 30%) compared to the predecessor [7]. Thanks to very consequent lightweight construction of the Tesla Model S and the use of all-aluminum for the body the chassis weight could be reduced by 50% according to George Blankenship, Tesla Motors Vice President [8].
Launching the i3 by the end of 2013, BMW was the first OEM that mass produces a chassis complete made from carbon fiber reinforced plastic material [9] for end product consumers. This is a quite radical and – up to now – unique attempt to increase efficiency of battery electric vehicles considering crash safety, reparability, production costs, recyclability, durability and many more.
The body and body panels are often mentioned when it comes to lightweight construction and materials, but in fact all parts of the vehicle are affected: seats, air conditioning, suspension, wheels, dashboard, steering system and so on.
As the weight of hybrid or battery electric vehicles is raised dramatically due to additional batteries, wires, generators, motors and cooling systems, and all these components are rather new and not optimized yet regarding their weight, the rest of the vehicle has to be rather light. Even though the chassis and suspension is made all out of aluminum the before mentioned Tesla Model S has a heavy tare weight of 2100 kg (250 kg more than a comparable Audi A6).
From the developments that are currently ongoing it is quite clear that in future a lot of effort will be paid for reducing the vehicles tare weight. Promisingly there is not a golden path to follow: Depending on personal demands and financial background, a customer can expect a broad variety of cars manufactured with one of the upcoming techniques (aluminum, compounds, and (reinforced) composites).
This is supported by the attempt of three different technical universities in Germany that launch their own battery electric mega city vehicle: The MUTE of TU Munich with an all aluminum chassis and CRP crash absorbers [10], the InEco of TU Dresden with high strength steel and carbon fiber composites [11], and the StreetScooter of RWTH Aachen with the same hybrid steel frame/CFRP construction [12].
One way to reduce mechanical or hydraulic connections between vehicles components is the x-by-wire technology applied for driving, braking and steering. In the latter for instance a mechanical steering column is replaced by an electric sensor and actuator

CHAPTER 1 INTRODUCTION
7
wherefrom weight savings can be expected. Steering actuators in the required size range regarding force, speed and stroke weight about 5 kg. Since the steering column of for instance a BMW 3-series (model F30) weights in total already more than 5 kg and the steering rack including electric servo motor itself 16 kg [13], there is sufficient potential for weight savings, even though the force feedback system for the steering wheel is not respected yet.
For saving weight the vehicle has to be treated as a whole: The use of lightweight material in the chassis does not necessarily reduce the curb weight when other heavy equipment is used for the vehicle. This applies for suspension, tires, equipment and powertrain as well. Volkswagen claims 40 % weight saving for the XL1 prototype compared to an average compact class diesel vehicle; the savings for the individual parts are presented in table 4. Noticeable is that the weight savings in the area chassis and suspension are a lot more promising than for instance in the area electric equipment of drivetrain. While in the latter about 20 % of the weight can be saved, which is already a very good value and possibly not only accounted by lightweight construction but also by the streamline shape of the chassis and small tires, more than 50 % weight saving in chassis and suspension are achieved [14]. This supports that there is room for wide optimization possibilities in suspension design both with lightweight construction and use of light materials.
Table 4: Weight savings or Volkswagen XL1 compared to an average medium-class diesel vehicle [14].
Average / kg VW XL1 / kg Savings
Chassis 477 230 52%
Equipment and Electrics 237 185 22%
Powertrain 277 227 18%
Suspension 315 153 51%
The best weight saving method is the cut out of parts which may not be absolutely necessary. Of course this must not be applied for safety devices but it could be a possibility for comfort equipment.

CHAPTER 1 INTRODUCTION
8
1.5 Comparison of Suspension Components
Four lower middle and medium-class cars were chosen and their average weights of suspension components are listed in table 5. Also the standard deviation and deviation from average are presented to compare the different manufacturers. The vehicle weights are obtained from A2Mac1 Autoreverse Teardown database [15]. It can be concluded that the part weights of suspension components are about in the same range for different car manufacturers. The corresponding standard deviations on “system” level are rather low. Deviations In the subgroups may result from different suspension geometries which are not respected in this investigation.
Table 5: Components for modern suspension of four medium-class vehicles. The values for average weight and standard deviation are presented [15].
Level Average /
kg
Standard Deviation /
kg
PLUS / kg
MINUS / kg
Vehicle 1477.4 97.2 164.6 -74.3
Suspension System 214.8 14.5 23.88 -15.14
Shock Absorbers 27.3 4.9 7.3 -5.2
Front 15.3 3.4 3.8 -3.9
Damper Front 7.18 1.30 1.852 -1.495
Strut Assembly Front 3.30 0.93 1.601 -0.670
Coil Spring Front 2.05 0.38 0.491 -0.424
Suspension Support 1.62 1.44 0.415 -0.331
Misc 1.15 - - -
Rear 11.8 2.4 4.0 -2.2
Damper rear 2.81 0.38 0.628 -0.296
Strut Assembly 2.16 0.51 0.864 -0.362
Coil Spring Rear 4.66 0.92 0.902 -1.532
Strut Stopper 0.13 0.09 0.141 -0.076
Insolating Rubber Spring System
0.57 0.09 0.144 -0.085
Upper Coil Spring Tower 1.53 1.29 0.989 -0.989
Axles 103.1 9.4 11.8 -13.6
Front Axle 43.4 10.8 16.10 -10.96
K-Frame incl. Reinforcement
14.02 6.66 12.536 -3.836
Arm Suspension System 7.82 2.07 2.662 -2.053
Lower Arm 7.23 1.48 1.979 -1.462
Upper Arm 2.37 0.00 -1.170 -1.170
StabilizerBar System 4.30 0.13 0.186 -0.175
Complete Steering Knuckle 14.52 2.45 3.421 -2.426
Steering Knuckle 11.26 2.68 -2.096 -5.135
Hub & Bearing 3.26 0.28 0.347 -0.437

CHAPTER 1 INTRODUCTION
9
Level
Average / kg
Standard Deviation /
kg
PLUS / kg
MINUS / kg
Rear Axle 59.7 3.9 5.762 -4.341
Axle 19.52 1.85 2.130 -2.472
K-Frame Reinforcements 1.43 0.71 0.030 -0.016
Arm Suspension System 12.78 1.38 1.686 -1.879
Upper Transversal Arms 4.23 0.84 -0.222 -1.907
Lower Transversal Arms 6.92 0.64 -0.299 -1.930
Rear Control Arm 2.18 1.17 0.381 -0.705
Steering Knuckle 14.01 4.70 4.538 -6.299
Bearing 2.58 0.59 1.015 -0.942
Casing 5.74 0.86 1.433 -0.796
StabilizerBar System 2.98 1.41 2.422 -0.935
Wheels incl. Caps 84.4 5.3 4.844 -8.758
Wheels 83.35 9.78 4.900 -8.577
Rims 39.34 5.83 9.220 -5.348
Tires 44.02 3.95 4.006 -4.370
Steering System 23.8 1.59 3.26 -2.22
Rack and Pinon Steering 23.8 1.6 3.26 -2.22
Steering Column 7.20 1.39 2.19 -1.27
Steering Bar 10.79 11.90 3.90 -1.89
el. Power Steering Box 5.01 5.33 3.35 -1.34
Brake System 46.5 3.889 4.846 -4.936
Front Brakes 29.0 2.7 2.65 -3.98
Brake Disks 15.91 1.42 1.65 -2.05
Brake Calipers incl. Pads 13.10 1.32 1.40 -2.16
Rear Brakes 17.5 4.3 6.76 -6.59
Brake Disks 8.5 2.4 4.04 -3.34
Brake Calipers incl. Pads 7.32 1.46 2.16 -2.08
Hand Brake System 1.69 1.15 1.77 -0.57
The weights are taken for comparison and get thoroughly evaluated in section 2.1.1.
1.6 Suspension Requirements
From literature [16] and expertise certain measurable requirements for the vehicle behavior are known. Large databases for good ride behavior and ride comfort exist at every car manufacturer, where successful design examples are evaluated. When designing a new vehicle from the scratch there are certain main requirements to the vehicle in general and the handling in special that need to be fulfilled in order to suit the manufacturer’s goals. Before designing the vehicle the demands are formulated in a measurable way. In the following chapter the ride demands for normal and extensive use based on engineering knowledge and according to a car manufacturer for normal use and mistreatment are defined.

CHAPTER 1 INTRODUCTION
10
1.6.1 Normal Use
For the investigated vehicle it is important to show that the suspension layout fulfils the requirements regarding handling, comfort and safety. During normal driving conditions maximal accelerations of 1 g are assumed. The expected range of suspension travel is assumed to vary by ±65 mm from leveling height. The basic requirements for the proposed vehicle are stated in table 6. These are mainly static values describing the roll center height for each axle, the allowed amount of steer angle change, caster and camber angle change, roll center migration and so forth during suspension travel.
Table 6: Geometrical requirements to the front and rear suspension.
Complete Vehicle
Roll stiffness deg/s/m² 0.3
Steering ratio steering wheel angle/wheel angle
14
Weight distribution f/r 58/42
Wheel base mm 2700
Track width mm 1520
Centre of gravity mm tare: 550 laden: 600
Individual Axle Front Rear
Vertical eigenfrequencyy Hz 1.3 1.5
Unbalance lever mm max 50
Caster angle deg 6
Camber compensation deg/m 28 28
Roll centre height mm 70 80
Roll centre height migration mm/mm -1.7 -1.7
Bump understeer deg/m 8 1
Antidive N/N 0.1 0.1
Antilift N/N 0.1 0.35
Shock absorber ratio mm/mm 0.7 0.7
Lateral force understeer, 0 mm deg/kN 0.1 0.05
Drive force steer deg/kN 0 0.1
Brake force steer deg/kN 0 0.2
Longitudinal stiffness wheel center
N/mm 250 250
Longitudinal stiffness ground N/mm min 100 200
Additionally to the static definition of wheel alignment between vehicle and road surface the observance of some dynamic factors is postulated: Roll angle, lateral acceleration and yaw moment of the vehicle as function of lateral acceleration as well as the eigenfrequencies of sprung and unsprung mass. The considered parameters are shown in table 7.

CHAPTER 1 INTRODUCTION
11
Table 7: Evaluation and comparison parameters
Eigenfrequencies Toe
Hub forces Roll center height
Anti roll bar forces Roll stiffness
Shock absorber ratio Antidive and antisquat
Camber angle Normal driving compliance
Caster angle Abuse compliance
Furthermore there are subjective measures that are hard to define at the start of the project due to the unknown interaction and cooperation of different subsystems. This includes for instance ride feeling, comfort perception, ease of dynamic handling, desired degree of feedback, and well-being inside the vehicle general. The latter ones are not considered in this report since no prototype of a complete vehicle is attained.
1.6.2 Extensive Use
Besides the mentioned criteria for road holding under normal use, further requirements have to be fulfilled by the suspension. This includes:
• Crash safety,
• Transfer of maximal brake forces into the chassis,
• Resistance against drop and wheel impacts (longitudinal & lateral), and
• Compliance during all possible wheel movement.
The suspension has to withstand the occurring loads without collateral damage. It is tolerated that the wheels are misaligned and that the leaf spring deflects more than during normal use. No parts are allowed to contact other parts or collapse; and no service must be required for drivability after the incident. The loads are orientated on the laden state and correspond to for instance a curb impact, sudden obstacle or going off road with higher speeds. Since the wheel is closer to the wheel arch at maximum bump, the tests in longitudinal and lateral direction are performed during that condition.
Extensive loads during abuse are defined as stated in table 8. As the values are dependent on the tolerated load, the absolute numbers for the rear axle are higher due to more mass on the rear axle allowed during fully laden state.
Table 8: Extensive loads on suspension during excessive use and abuse
Maximum load on wheel / leaf spring in 3 dimensions
Direction x y z
Corresponds Stuck wheel Lateral curb contact
Sudden obstacle / Vehicle drop
Free wheel / Jump
Load [g] 3.25 2.5 3.50 12.5
Direct component
Sprung mass (quarter car)
Sprung mass (quarter car)
Sprung mass (quarter car)
Unsprung mass (quarter car)
Load front [kN] 6.70 5.15 7.21 -1.53
Load rear [kN] 12.43 9.56 13.39 -1.34
Applied at Wheel center Tire patch Wheel center Wheel center
Wheel position Bump maximum Bump maximum Leveling height Leveling height

CHAPTER 1 INTRODUCTION
12
During emergency braking a front brake rod prevents the leaf spring from deflecting under longitudinal load. This part is only compressed and does not take any bending moments. The maximum force is within the range of 4500 N, hence a rather small composite rod can do the job. A 10x8 mm composite tube has a compressive strength of 200-300 MPa, hence it can withstand more than 5500 N in compression (while over 12 kN in tension) and weighs 13 g for a length of 355 mm. A well designed aluminum end cap with tap and two eye bolts add on not more considerable weight either. Hence the brake rod weight can be treated as fairly low to its importance during emergency braking.
Above that the design of the brake rods as push rods prevents the wheels from intruding the safety cell during crash as the wheels are getting pushed outwards.
At the rear the brake forces are somewhat lower (<2500 N) hence a stiff static connection of the leaf spring to the chassis as in the front is not required. Also crash safety plays a minor role at the rear. The most extreme longitudinal load at the rear occurs during abuse of the vehicle, see table 8. In order to cope with the values of maximum load in longitudinal direction some mechanical limitation or bumpstop is required to prevent the tires from touching the wheel arches. A rather extreme but very lightweight solution would be steel strings that limit the leaf spring deflection longitudinally when exceeding a certain deflection envelope.

CHAPTER 2 MODELS
13
2. METHODOLOGY
2.1 Proposed Suspension Layout
The suspension layouts at front and rear axle are the same regarding design, components and mounting points. Instead of attaching the suspension to a subframe it is directly connected to the U-shaped chassis (1), see figure 6 and 6. Also the leaf spring has the same mounting points and characteristics at the individual axles.
Figure 6: Proposed front suspension layout side view, Image courtesy of Sigvard Zetterström.
The principle layout is similar to a double wishbone suspension with a
transversal mounted leaf spring instead of lower control arms: The wheel carrier is connected to a transversal mounted leaf spring (2) on the lower end and an A-arm on the upper joint. The lower control joint bends around the chassis mounts (3) and the lower knuckle joint moves not orbital but rather ellipsoidal. The damper (5) acts on the upper A-arm. An active air spring (6) is integrated in the damper top to balance out different load conditions of the vehicle and maintain constant force on the leaf spring.
Figure 7: Proposed front suspension layout top view, Image courtesy of Sigvard Zetterström.

CHAPTER 2 MODELS
14
The components of the suspension design are listed in table 9.
Table 9: List of parts of the proposed suspension layout.
1 Suspension frame 7 Steering actuator
2 Leaf spring 8 Knuckle
3 Leaf spring mount 9 Brake / Brake disk
4 Upper A-arm 10 Brake rod
5 Damper 11 Hub
6 Integrated air spring 12 Wheel
By using the same spring (characteristics and shape) on front and rear axle the manufacturing cost for the composite leaf spring could be decreased and simplicity of the vehicle increased. Dependent on the vehicles load state the air spring covers excessive loads. Keeping the ride height constant, the deflection of the leaf spring and wheel alignment distortion due to a flexible lower control arm is reduced to a minimum. A load sensitive ride height control is integrated which in this case use the dampers that include an air spring. At the top of the damper a small reservoir controls the air spring pressure depending on the vehicles load condition. It follows that also the misalignment of the wheels in comparison with a classic double wishbone suspension is kept at a minimum through low suspension travel. Some differences between front and rear axle do exist:
At the front axle the connecting joints of the leaf spring (2) and upper A-arm (4) to the knuckle (8) are spherical so that steering movement is possible. The steer angle is introduced via tie rods. These are either connected to a classic rack and pinion steering system or are replaced by two electric actuators (7). Both systems have its advantages regarding safety, speed, reliability, energy consumption and weight. Main advantage of the steer-by wire concept is the lacking mechanical connection between the steering wheel and knuckle, hence considerable weight savings are achieved.
To cope with the brake forces and for crash safety on the front a pushrod (10) is integrated on each side. This rod connects the outer leaf spring end to the chassis and transfers mainly longitudinal forces. Bushings reduce vibrations transferred into the chassis. By that during emergency braking or abuse (driving too fast over a curb) the leaf spring is protected from bending rearwards. If the vehicle is involved in a straight front impact the wheels are pushed outwards of the vehicle to prevent intrusion into the safety cell.
The suspension at the rear axle can be kept very simple if only front wheel steering is applied: By using a rotational joint connecting the wheel carrier both on lower leaf spring end and upper A-arm there is no need for tie rods, which decreases further the amount of parts, installation space and weight. Depending on the leaf spring design, the brake rods are unnecessary since the rear braking forces are fairly low. The occurring longitudinal forces can be absorbed by the upper A-arm bushings and leaf spring mount. In order to cope with the requirements set for durability and strength a limitation for the longitudinal leaf spring deflection could be necessary to be installed. A rather simple and lightweight solution would be steel strings that prevent the leaf spring from bending more than 5 % for- or rearwards.
If the simulation results show that anti-roll bars are required to limit vehicle roll during curving, ARB can be introduced and attached to the damper mounts on the A-arm.

CHAPTER 2 MODELS
15
Another attempt to achieve anti-roll function could be an active control of the air springs, where a bulky stabilizer can be avoided.
2.1.1 Proposed Suspension Weight
As postulated in the introduction the investigated vehicle should be about 30% lighter than the average of the present competitors. This can be achieved with intense design change and use of lightweight material. By that the whole suspension weight including all four wheels compared to the tare vehicle weight can be reduced from about 20% to 15%.
One key feature of the investigated suspension design is the transversal leaf spring. Introducing a single new part allows cutting the lower A-arms, strut assembly, coil springs and some other peripheral parts. As method to evaluate realistic weight savings the corresponding lightest part of the suspension component list (see table 5) was taken. Eventually some parts were lightened even more to an extent that seemed realistic with the use of new material and radical lightweight design. The assumed total of the final suspension component weights are shown in table 10. Added weight such as e.g leaf spring mounts are considered later in table 16.
Table 10: Weight of suspension components with the current design and estimated weight savings [15].
In table 11 the omitted and lightened components belonging to the category shock absorbers are displayed. Here the coil springs, spring mounts and insulation are cut out due to the changed design. Dampers and struts are lightened according to the decreased vehicle weight. In total 59 % weight savings are prospected.
LevelAverage /
kg
Standard
Deviatipon
/ kg
Lightest
Part in
Compariso
n / kg
New Part
Weight /
kg
Savings
compared
to Average
/ %
1477.4 97.2 1403.0 1000 32%
285.1 18.5 267.3 162.8 43%
214.8 14.5 199.6 122.6 43%
27.3 4.9 22.1 11.1 59%
15.29 3.36 11.36 6.29 59%
11.83 2.37 9.68 4.82 59%
103.1 9.4 89.5 32.8 68%
43.39 10.75 32.43 17.45 60%
59.72 3.90 55.38 15.40 74%
84.4 5.3 75.6 60.7 28%
83.35 9.8 74.78 59.65 28%
23.8 1.6 21.6 13.4 44%
23.77 1.59 21.55 13.37 44%
46.5 3.9 41.577 26.816 42%
29.01 2.71 25.03 26.82 8%
17.50 4.30 10.91 8.36 52%
Suspension + Steering + Brakes
Front
Rear
Suspension System
Vehicle
Shock Absorbers
Wheels
Axles
Front Axle
Rear Axle
Wheels incl. Caps
Front Brakes
Rear Brakes
Braking System
Rack and Pinon Steering
Steering System

CHAPTER 2 MODELS
16
Table 11: Component weight of shock absorbers and coil springs at front and rear [15].
In table 12 the axle components and the corresponding weight savings are displayed, where the subframes, lower control arms and stabilizer systems are dispended. The knuckles are lightened due to design and material optimization possibilities. Lower decrease of weight is assumed for bearings, where the use of standard components seems most appropriate. A total weight cut of 60 % to an average medium-class vehicle is expected.
Table 12: Component weight of axles at front and rear [15].
Average / kg
Lightest Part
in
Comparison
/ kg
Savings to
originally
Lightest Part
/ %
New Part
Weight / kg
Savings
compared to
Average / %
27.3 22.1 11.1 59%
15.29 11.36 6.29 59%
7.18 5.68 30% 3.98 45%
3.30 2.63 30% 1.84 44%
2.05 1.62 Saved 0 100%
1.62 0.45 10% 0.41 75%
1.15 1.15 Saved 0.00 100%
11.83 9.68 4.82 59%
2.81 2.52 -40% 3.52 -25%
2.16 1.80 30% 1.26 42%
4.66 3.12 Saved 0 100%
0.13 0.05 20% 0.04 67%
0.57 0.49 Saved 0 100%
1.53 0.55 Saved 0 100%
Level
Rear
Shock Absorbers
Front
Damper Front
Strut Assembly Front
Coil Spring Front
Suspension Support
Misc
Damper Rear
Strut Assembly
Coil Spring Rear
Strut Stopper
Insolating Rubber Spring System
Upper Coil Spring Tower
Average / kg
Lightest Part
in
Comparison
/ kg
Savings to
originally
Lightest Part
/ %
New Part
Weight / kg
Savings
compared to
Average / %
103.1 89.5 32.8 68%
43.39 32.43 17.45 60%
15.11 10.19 Saved 0 100%
7.82 5.76 1.89 76%
Lower Arm 7.23 5.76 Saved 0.00 100%
Upper Arm* 2.37 2.37 20% 1.89 20%
4.30 4.12 Saved 0 100%
14.52 12.10 6.83 53%
Steering Knuckle 11.26 6.13 30% 4.29 62%
Hub & Bearing 3.26 2.82 10% 2.54 22%
59.72 55.38 15.4 74%
19.52 17.05 Saved 0 100%
1.43 1.41 Saved 0 100%
12.78 10.90 1.86 85%
Upper Transversal Arms 4.23 2.32 20% 1.86 56%
Lower Transversal Arms 6.92 4.99 Saved 0 100%
Rear Control Arm 2.18 1.48 Saved 0 100%
14.01 7.72 20% 6.17 56%
2.58 1.64 5% 1.56 40%
5.74 4.94 20% 3.95 31%
2.98 2.04 Saved 0 100%
* not available in all compared vehicles
Level
Bearing
Casing
Stabilizer Bar System
Axle
K-Frame reinforcements
Arm Suspension System
Arm Suspension System
Stabilizer Bar System
Complete Steering Knuckle
Rear Axle
Steering Knuckle
Axles
Front Axle
K-Frame incl. Reinforcement
CHAPTER 2 MODELS
17
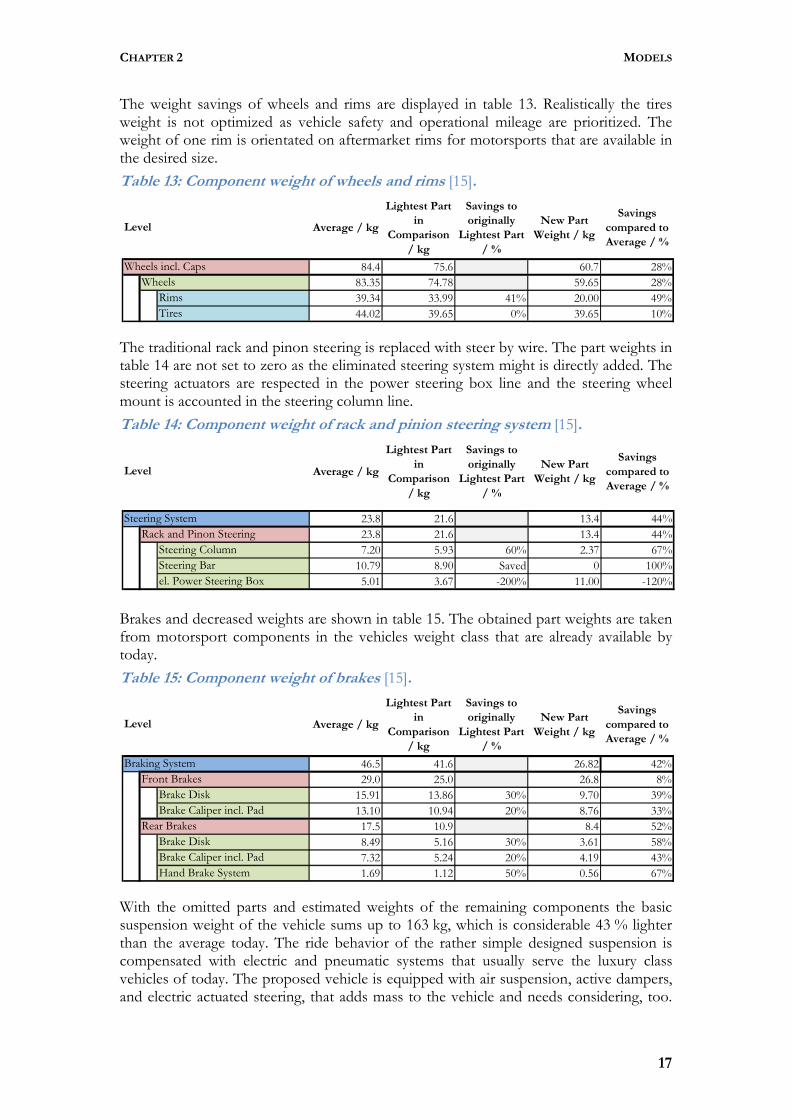
The weight savings of wheels and rims are displayed in table 13. Realistically the tires weight is not optimized as vehicle safety and operational mileage are prioritized. The weight of one rim is orientated on aftermarket rims for motorsports that are available in the desired size.
Table 13: Component weight of wheels and rims [15].
The traditional rack and pinon steering is replaced with steer by wire. The part weights in table 14 are not set to zero as the eliminated steering system might is directly added. The steering actuators are respected in the power steering box line and the steering wheel mount is accounted in the steering column line.
Table 14: Component weight of rack and pinion steering system [15].
Brakes and decreased weights are shown in table 15. The obtained part weights are taken from motorsport components in the vehicles weight class that are already available by today.
Table 15: Component weight of brakes [15].
With the omitted parts and estimated weights of the remaining components the basic suspension weight of the vehicle sums up to 163 kg, which is considerable 43 % lighter than the average today. The ride behavior of the rather simple designed suspension is compensated with electric and pneumatic systems that usually serve the luxury class vehicles of today. The proposed vehicle is equipped with air suspension, active dampers, and electric actuated steering, that adds mass to the vehicle and needs considering, too.
Average / kg
Lightest Part
in
Comparison
/ kg
Savings to
originally
Lightest Part
/ %
New Part
Weight / kg
Savings
compared to
Average / %
84.4 75.6 60.7 28%
83.35 74.78 59.65 28%
39.34 33.99 41% 20.00 49%
44.02 39.65 0% 39.65 10%
Level
Rims
Tires
Wheels
Wheels incl. Caps
Average / kg
Lightest Part
in
Comparison
/ kg
Savings to
originally
Lightest Part
/ %
New Part
Weight / kg
Savings
compared to
Average / %
23.8 21.6 13.4 44%
23.8 21.6 13.4 44%
7.20 5.93 60% 2.37 67%
10.79 8.90 Saved 0 100%
5.01 3.67 -200% 11.00 -120%
Level
Steering System
Rack and Pinon Steering
Steering Column
Steering Bar
el. Power Steering Box
Average / kg
Lightest Part
in
Comparison
/ kg
Savings to
originally
Lightest Part
/ %
New Part
Weight / kg
Savings
compared to
Average / %
46.5 41.6 26.82 42%
29.0 25.0 26.8 8%
15.91 13.86 30% 9.70 39%
13.10 10.94 20% 8.76 33%
17.5 10.9 8.4 52%
8.49 5.16 30% 3.61 58%
7.32 5.24 20% 4.19 43%
1.69 1.12 50% 0.56 67%
Brake Disk
Brake Caliper incl. Pad
Hand Brake System
Brake Disk
Brake Caliper incl. Pad
Rear Brakes
Front Brakes
Braking System
Level

CHAPTER 2 MODELS
18
The estimation is of course a rough estimation with reservations. Only a global picture of the possible suspension weight should be gained by that investigation and further proof is required for absolute values. The supposed component weights are listed in table 16.
Table 16: Parts that are added to the current suspension design.
Part Name Qty Weight / Qty Part Weight / kg
Leaf Spring 2 1.00 2.00
Leaf Spring End Caps 4 0.25 1.00
Leaf Spring Mount 4 0.45 1.80
Air Pressure Pump 1 5.00 5.00
Air Reservoir 1 4.50 4.50
Air Valves 4 0.15 0.60
Air Hoses 10 0.05 0.50
Air Ride Control Unit 1 2.00 2.00
Brake Force Distribution Valve 1 0.20 0.20
Brake Rods 2 0.20 0.40
Sum / kg: 18.0
By adding the assumed suspension mass of 162.8 kg from table 10 and the 18 kg additional part weights shown in table 16 the total suspension mass is calculated to 170.8 kg. This corresponds to overall weight savings of 36.8 % versus the averaged suspension weights and 32.6 % versus the sum of the originally lightest suspension parts. It can be shown that reasonable weight savings can be achieved with the transversal leaf spring suspension layout.
Sprung and Unsprung Mass
From the upper A-arm the half part outside of the damper mount is respected to be not suspended, furthermore about 35% of the A-arm weight is located outside the damper mount. Half of the outer leaf spring part from chassis mounts to knuckle is considered to be unsuspended, too [16]. The same is valid for the steering actuator, where also 50% count as suspended.
With the assumed component weights of table 10 the amount of unsprung mass at the front and rear axle is calculated in table 17.
Table 17: Unsuspended masses at the front and rear axle.
Unsprung masses /kg
Part Part weight % Unsuspended Front Rear
Upper A-arm 1.20 18% 0.21 0.21
Leaf spring 3.50 33% 1.17 1.17
Steering system 11.00 50% 5.50 -
Wheels per axle 42.18 100% 42.18 42.18
Brakes front 26.8 100% 26.8 -
Brakes rear 8.36 100% - 8.36
Sum
75.86 51.92

CHAPTER 2 MODELS
19
2.1.2 Spring Characteristics
One key design criteria for a suspension with a transversal leaf spring without lower control arms is constant ride height. By the variable air spring the ground clearance can be held at a certain level independent from the vehicles load state. This allows the leaf spring to operate in a rather narrow deflection envelope. In this small operational range the deflections and distortions due to the simplified layout are rather small. Controlling the ride height according to the load case requires an active air spring that keeps the load on the leaf spring constant at around 1400 N. By using the same leaf spring front and rear production costs are expected to decrease.
The desired front hub forces and wheel rates for the vehicle in tare and laden weight are stated in table 18 and the forces versus wheel movement are drawn in figure 8.
Table 18: Desired front spring characteristics at wheel
Front axle
Spring force at wheel /N Spring rate at wheel /N/mm
Leaf spring Gas spring Leaf spring
rate Gas spring
rate Parasite
rate Total rate
Laden 1400 1936 11 4 4 19
Tare 1400 1445 11 3.5 4 18.5
Figure 8: Desired front wheel force characteristics for tare and laden weight for front axle
The desired rear hub forces and wheel rates for the vehicle in tare and laden weight are stated in table 19 and the forces versus wheel movement are drawn in figure 9. Note the higher influence of weight increase for the rear axle.
-1
0
1
2
3
4
5
6
-120 -100 -80 -60 -40 -20 0 20 40 60 80 100 120
Sp
rin
g F
orc
e a
t W
he
el
/ [k
N]
Wheel Travel / [mm]
Front Wheel Force CharacteristicsTotal - TareTotal - LadenGas Spring -TareGas Spring - LadenLeaf SpringParasite Rate

CHAPTER 2 MODELS
20
Table 19: Desired rear spring characteristics at wheel
Figure 9: Desired rear wheel force characteristics for tare and laden weight for rear axle
2.1.2.1 Leaf Spring
In general rigid axles with leaf springs became very unpopular for passenger vehicles due to its poor ride behavior compared to multi link axles. Throughout the research since about 1975 it was found out that glass fiber composite materials have a rather good spring behavior due to large elastic deformation capabilities. Glass fiber leaf springs were already used in some low volume mass production vehicles in the 90’s, but never had played a major role in passenger vehicles [17]. The main disadvantage is the unsolved question of recycling possibilities for used composite springs. Advantage of glass fiber springs is the low weight, low energy consumption in production process, good control over the properties when manufacturing, good price compared to other composite materials, very good spring behavior, durability and nearly unlimited design possibilities.
The proposed leaf spring has a uniform rectangular shape with rounded edges for ease of manufacturing. The material is chosen to glass fiber reinforced plastic (GFRP) with 43% fibers. In table 20 different materials are compared regarding their specific material properties.
-1
0
1
2
3
4
5
6
-120 -100 -80 -60 -40 -20 0 20 40 60 80 100 120
Sp
rin
g F
orc
e a
t W
he
el
/ [k
N]
Wheel Travel / [mm]
Rear Wheel Force CharacteristicsTotal - Tare
Total - Laden
Gas spring - Tare
Gas Spring - Laden
Leaf Spring
Parasite Rate
Rear axle
Spring force at wheel / [N] Spring rate at wheel / [N/mm]
Leaf spring Gas spring Leaf spring
rate Gas spring
rate Parasite
rate Total rate
Laden 1400 2377 11 5 4 20
Tare 1400 660 11 3 4 18

CHAPTER 2 MODELS
21
Table 20: Properties of GFRP compared to Aluminum, Steel and Heavy Duty Carbon Fiber Reinforced Plastic (CFRP HD) [18].
Material
Young’s Modulus
Density Tensile strength Compressive
strength
[MPa] [g/cm³] [MPa] [MPa]
Aluminum 71000 2.80 540 480
Steel 207000 7.83 1655 1520
GFRP 43% 22800 2.00 463 507
CFRP HD 67230 1.55 524 500
As can be seen from table 20 the Young’s modulus of GFRP is rather low compared to other materials which underlines its suitability as spring. The material can handle roughly the same loads as aluminum while it’s almost 30 % lighter than that. In figure 10 the leaf spring dimension and parameter names are shown.
Figure 10: Cross section of proposed leaf spring in 3D and with dimensions. B represents the width and H the height, the corresponding wall thicknesses are tb and th.
The dimensions of the spring are not only dependent of the material data but also on the possible space envelope in the vehicle. The available space in longitudinal direction (vehicle coordinate system) results in a wider or narrower leaf spring design. The advantage of a wide design is the increased longitudinal stiffness which may lead to unneeded brake force rods while the disadvantages are the increased weight and bulky installation space. The final driveline concept of the vehicle is very open and leaves room for different leaf spring geometries. While a front wheel drive vehicle with traditional combustion engine will have very limited unused space at the axle the leaf spring geometry must in this case be as small as possible for not perturbing other parts. The drawback of the necessary front brake rod is compensated with decreased leaf spring weight and increased crash safety. For the same vehicle at the rear axle on the other hand there is a lot of space where a wide leaf spring can be installed and no brake rod must be used for compensating longitudinal forces. An all wheel driven electric vehicle will have limited available space at both axles where the narrower spring has advantages even though an extra linkage at the rear axle for the brake forces will be needed, too. In order to decrease complexity in the following the front spring is chosen to have a narrow design while at the rear a wide version is installed.
Dependent from the outer dimensions the wall thicknesses are set by the project description to obtain the desired spring forces. In table 21 three different leaf spring geometries are presented with their advantages. All proposals resist the maximum lateral
tb
H
th
B

CHAPTER 2 MODELS
22
force of the vehicle and do not buckle under lateral compression. Furthermore different types of foam or core material could be implemented to increase
Table 21: Alternation of leaf spring width and expected geometry changes.
Leaf spring width (B) Narrow ≤50 mm Intermediate ≈80 -100 mm
Wide ≥150 mm
Installation space Small installation space Normal Large clearance required
Vertical wall (H) Rather High Normal Rather low
Wall thicknesses (tb,th) Rather Thick Rather thin
Brake rods required Recommended (front) Unnecessary
The leaf spring dimensions are finally set in section 2.2.1 where the different spring widths are evaluated.
2.1.2.2 Gas Spring
The gas spring is integrated on top of the damper unit and consists of a 600 cm³ large reservoir for air. The force acts at the same points on the upper A-arm as the damper. The gas spring is filled by a central pressure pump unit in the engine bay of the vehicle and connected to a small high pressure tank. Active controlled valves on each air spring cylinder control the flow of air into and out of the active volume. Excessive pressure is feed into a low pressure catch tank which is connected to the pump for recycling. The reservoir is shaped like a flat can with a membrane that is mounted through the center, so that two half moon shaped volumes are formed.
According to equation (2) [19], gas springs generally have a non-linear progressive spring rate if the chamber volume is finite. In this report the parameters of the proposed air spring are based on comparison of present available air springs for vehicles. At a later stage detailed calculations on the gas spring with the given design envelope are required. The damping rate induced by the air volume is in the following neglected and considered to be included in the main dampers.
The executed force of an air spring is calculated like below in equation (2) with the parameters reservoir volume V0, operating pressure p0, isentropic gas exponent κ, membrane area AW and change of volume V times stroke s.
The product of gas spring stiffness
c = �∙����∙��
� , (1)
and the stroke s results with the translation V0=AW · s in the force
F = �� ∙ A� ∙ � ����∙��
� . (2)
As result a polynomial behavior is expected.
The assumed spring rate is approximated by typical gas spring characteristics and represented by the curves shown in figure 11. Further investigations are required to define the precise parameters including the actual design parameters of the pressure levels, reservoir size, membrane thickness and material, which are here not treated for simplification. The geometrical translations from spring into hub forces are included in the graphs in order to compare the spring forces with the hub forces.

CHAPTER 2 MODELS
23
Figure 11: Assumed gas spring characteristics to obtain the desired wheel hub forces as function of spring displacement for the two load states tare and laden vehicle.
2.1.3 Dampers
The damper acts between the same hardpoints as the gas spring and the same translation factor between wheel hub and damper is employed. The damper characteristics are adjusted according damping data of a reference vehicle that are scaled regarding geometry and weight. For values see figure 12.
Figure 12: Damper force versus damper speed for the proposed vehicle.
The damping ratio
ζ = c2 ∙ �k ∙ f�� ∙ m (3)
is an indicator how the system of mass m, spring stiffness k, geometrical factor fgeo, damper coefficient c=-F/v behaves with respect to critical damping (ζ=1), where the
0
1
2
3
4
5
6
-100 -80 -60 -40 -20 0 20 40 60 80 100 120
Fo
rce
/ [
kN
]
Spring Deflection / [mm]
Gas Spring Forces
Front Tare Front Laden
Rear Tare Rear Laden
-4
-3
-2
-1
0
1
2
3
4
5
-3 -2 -1 0 1 2 3
Fo
rce
/ [
kN
]
Velocity / [m/s]
Damper Characteristics
Front
Rear
Compression Rebound

CHAPTER 2 MODELS
24
fastest damping is found. Between 0<ζ<1 the system is under-damped and oscillations can be found until the system is at rest. For passenger vehicles damping ratios in the area of 0.3< ζ<0.4 are common for compression, where the lower value is for the loaded vehicle and the higher value for curb weight. The damping ratio is dependent from the damper velocity, see figure 13 where the damping ratio as function of damper velocity is plotted.
Figure 13: Damping ratio dependent of damper speed
For the rear axle in tare condition a rather high relative damping is found for the current settting, with values of around 0.8 during rebound. This is a tradeoff between comfort and safety at laden condition versus the implementation of active dampers. Such dampers could be adjusted to the actual load state just like the air springs and are highly recommended at the rear axle in order to ensure good damping at the unladen rear axle.
2.1.4 Anti-Roll-Bar Stiffness
The anti-roll bar (ARB), or stabilizer, in a vehicle increases roll stiffness along the vehicles longitudinal axis by transferring loads between two independently suspended wheels on the same axle. While cornering the ARB transfers force from the loaded outer wheel to the less loaded inner wheel so that both chassis roll and body height can efficiently be decreased, which is desired in order to maintain good controllability in curves.
Often the ARB is a torsion spring which is connected to the wheel carriers with some sort of link. The lever arms, lever arm bending stiffness and the torsion stiffness of the middle section of the ARB determine the force transfer with respect to the deflection angle, see also figure 2.
As starting value for the design process the known values for anti-roll of a known reference vehicle are used. The vehicle has about the same dimensions and the data were validated in previous projects. A scaling factor regarding the weight difference between the investigated and reference vehicle is calculated. The desired anti-roll bar forces are shown in table 22 and figure 14.
0.0
0.2
0.4
0.6
0.8
1.0
1.2
1.4
-2 -1 0 1 2
Da
mp
ing
Ra
tio
/ [
]
Damper Velocity / [m/s]
Damping Ratio
Front Tare
Front Laden
Rear Tare
Rear Laden

CHAPTER 2 MODELS
25
Table 22: Desired anti-roll force transformed into wheel hubs
Tare Laden
Front Rear Front Rear
ARB-Stiffness reference vehicle [Nm/deg] 590 95 590 95
Link length reference vehicle [mm] 200 200 200 200
Translation factor geometry
reference vehicle [rad/mm²] 6·10
-6 6·10
-6 6·10
-6 6·10
-6
ARB-Stiffness reference vehicle in
Wheel Hubs
[N/mm
offset] 202.8 32.7 202.8 32.7
Weight reference vehicle [kg] 765 505 872 703
Weight concept car [kg] 580 420 680 770
Weight Scaling Factor concept
car/ reference vehicle [] 0.7582 0.8317 0.7799 1.0952
Resulting ARB force at wheel of
concept car
[N/mm
offset] 153.8 27.2 158.2 35.8
As can be seen from table 22 above the stabilizer at the front axle has about the same stiffness for the two load conditions and the difference at the rear is rather small. For the vehicle the ARB stiffness at the front axle is set to 155 N/mm at the wheel and 30 N/mm at the rear axle. With the geometry given, this corresponds to a front stabilizer stiffness of 450 Nm/deg and 79 Nm/deg at the rear.
Figure 14: Transformed anti-roll force for front and rear axle as function of the wheel offset.
With certain mounting configurations the transversal leaf spring layout automatically transfers load from one wheel to the other side when not uniform deflected.
The leaf spring integrated stabilizer stiffness can only be adjusted by changing the distance between the spring mounts. Since the leaf spring stiffness has to serve the required wheel hub forces (see figure 8 and figure 9), the mounting points and spring characteristics have a rather narrow alternation range. As the mounts are connected to the vehicle on certain hardpoints shifting them around changes the whole undercarriage of the vehicle or requires reinforcements that add weight and hence do not serve the lightweight concept of the vehicle. Furthermore if the mounts are shifted more outwards,
-10000
-8000
-6000
-4000
-2000
0
2000
4000
6000
8000
10000
-50 -30 -10 10 30 50
An
ti R
oll
Ba
r F
orc
e /
[N
]
Wheel Offset / [mm]
Anti-Roll-Bar Forces
Front Tare
Front Loaden
Rear Tare
Rear Loaden

CHAPTER 2 MODELS
26
the deflection of the leaf spring in the middle gets quite big, where the geometry of the differential may be perturbed. Also the lower link would be very short which results in a very unfortunate wheel movement during wheel travel.
For weight reduction the use of the air spring as a replacement ARB is considered. The already present air spring system would serve this task, and despite of a somewhat larger compressor and catch tank no mechanical stabilizer is required. Weight savings of around 3-4 kg at each axle are expected. A proof for the functionality and reliability of this concept is not attempted in this investigation.
2.1.5 Camber
Important measures for the wheel alignment with respect to the road surface and driving direction are the angles for camber, caster and toe, see figure 15. Most vehicles have adaptable mounting points for the knuckle so that the wheel alignment can be changed slightly to the manufacturers or customers desired values. According to the suspension demands the camber at the front and rear axle is set to -1 deg, which means the wheels are somewhat leaning inwards to the vehicle. The proposed camber compensation during wheel travel should be in the region of -28 deg per meter wheel travel, meaning that during compression (positive wheel travel per definition by the vehicle coordinate system) additional negative camber is gained as a result of the unequal length A-arms. As the lower control arm (the leaf spring) is longer than the upper A-arm the camber curve is negative warped going from rebound to compression. Accordingly during rebound positive camber gain is expected until maximum camber is reached before dropping to more negative values as result of the unequal length arm suspension layout.
2.1.6 Caster
The caster angle is defined as inclination from the king pin line from the vertical in the tire side view. Positive caster has a rearwards leaning axis of lower and upper knuckle connection points. Usually at front axles there is slight positive caster (~ 6 deg) in order to stabilize the vehicles straight running together with the pneumatic trail of the tire. At the rear the knuckle is usually completely upright with no caster angle [16].
In order to achieve the caster of 6 deg at the front axle the outer hardpoint of the upper A-arm was designed to be offset longitudinally by 32 mm towards the rear. Other measures were not touched and the other measures proved to be rather independent from the precise longitudinal location of the upper knuckle connection.
2.1.7 Toe
The toe defines the pre-steering angle of the wheel, hence it is the angle between the radial wheel plane with respect to the longitudinal axis of the vehicle. Toe-in is found when steering inwards resp. the distance between the tires of one axle is less at front than at the rear. Toe-out is the opposite when steering outwards. Toe has a major influence on vehicle stability during straight running and the cornering response. In general car manufacturers set the toe to a slightly positive value of 0.1 ° at the front and rear as toe-out should be avoided for handling reasons. As the driving forces at the front axle deflect the suspension bushings the toe is usually compensated to zero [16]. In braking condition more toe-in is generated as result of bushing deflection which helps the car to stabilize. For understeering response at the beginning of cornering toe-in is desired while for initial oversteering behavior the toe should be negative (toe-out).

CHAPTER 2 MODELS
27
In Adams/Car the values for toe and camber can be directly set at the wheel hub, which allows the user to set the wheel angles easily.
The different wheel alignment angles are explained in figure 15: Camber is the inward or outward inclination of the wheel with respect to the vertical axis in the lateral plane, Caster is the inclination of the steering axis from vertical in the longitudinal plane and toe defines the wheel angle from the longitudinal axis in vertical plane.
Figure 15: Explanation of the different angles to describe wheel alignment: Caster (positive = top leaning rearwards), Camber (negative = top leaning inwards)) and Toe angle (negative = Toe-out).
2.1.8 Roll Center
The roll centers at front and rear axle define the longitudinal roll axis of the vehicle. The distance of the vehicle center of gravity to the virtual roll center line defines the lever arm for the calculation of the roll moment during curving.
The suspension requirements postulate that the roll center height at the front should be at 70 mm and at the rear at 80 mm above ground. The suspension hardpoints of the upper A-arm to chassis mount were chosen to be manipulated to achieve the appropriate layout shown in figure 16. In table 23 the new A-arm mounts (left side) to the chassis in vehicle coordinate system are shown.
Figure 16: Desired Roll center setting for the suspension layout. Shown are the instantaneous centers for front (magenta) and rear suspension (blue) compared to the original layout (red).
-400 -200 0 200 400
Caster Angle
-1000 -500 0 500 1000
Camber Angle
-500 0 500
-500
0
500
Toe Angle
Front
-1000 -500 0 500 1000 1500 2000
-200
0
200
400
600
800
1000
Modified Front Suspension
Modified Rear SuspensionOriginal Layout

CHAPTER 2 MODELS
28
Table 23: Updated A-arm points for good roll center location
x [mm] y [mm] z [mm]
Front (left side) 0 -515 136.21
Rear (left side) 2700 -515 132.06
This information was also fed into the calculation of the percentage of anti-dive and anti-squat in next chapter.
2.1.9 Anti-Dive and Anti-Squat
To keep the pitch motion of the vehicle at a minimum for comfort reasons and driving safety, geometrical changes to the suspension are applied that reduce squat/dive and lift effects. Especially the dive movement during braking or squat motion during acceleration is considered to be disturbing and annoying. In order to ensure good squat-/ dive-motion compensations the control arms should be angled in the xz-plane. Hence modifying the suspension regarding the pivot point at front and rear axle was judged to be beneficial.
The suspension layout defines geometrically the so called pivot point. The pivot point and wheel contact patch define a line that is extended to the vertical projection of the wheel center line of the opposite axle. If the intersection with that line is above the horizontal projected center of gravity, the car will lift while if it is below the vehicle will dip. 100 % anti-lift is obtained if the pivot point is located on a line between the horizontally projected COG on the wheel hub line to the contact patch. Anti-lift usually is expressed in % of compensation; therefore the height of the center of gravity is divided by the actual distance of the intersection point from ground level. In figure 17 the different centers of gravity are shown for the two load cases and the inclination of the 100% anti-dive/squat layout.
Figure 17: Geometrical definition of the pivot point for the two load cases in 100% anti-dive resp. anti-squat configuration.
The pre-defined A-arms are orientated in parallel planes hence the pivot point is located in the ground as it is for double wishbone suspension laterally. Hence no dive or squat compensation would be possible with the original suspension layout. As can be seen from figure 17 the required 35 % anti-squat at the rear axle for rear wheel drive are not compliant with the 10 % anti-dive during braking. In order to achieve 10 % anti-dive (as stated in the requirements) the pivot points of the suspension are calculated as figure 19
center of gravity ladencenter of gravity tare
100 % Anti-Dive Rear
100 % Anti-Dive Front
100 % Anti-Squat RWD100 % Anti-Squat FWD

CHAPTER 2 MODELS
29
shows. The disadvantage when it comes to anti-squat motion is considered to be acceptable in the following. New locations of the upper A-arm mounts are according to table 24.
Figure 18: Anti-Dive and Anti-Lift conflict for the investigated vehicle in tare condition.
Figure 19: Anti-Dive and Anti-Lift configuration for the investigated vehicle.
Table 24: Modified upper A-arm location to achieve 10% anti-dive with the designed roll center heights.
x [mm] y [mm] z [mm]
Front (left side)
Upper arm front -100 -515 143.60
Upper arm rear 100 -515 128.81
Rear (left side)
Upper arm front 2600 -515 126.78
Upper arm rear 2800 -515 137.34
center of gravity tare
10 % Anti-Dive Rear
10 % Anti-Dive Front35 % Anti-Squat RWD
35 % Anti-Squat FWD
Pivot Point Front Axle
Mounts Upper Arm Front
Pivot Point Rear AxleMounts Upper Arm Rear
10 % Anti-Dive

CHAPTER 2
2.1.10 Steering
For a future perspective considerable weight savings are achieved by eliminating the mechanical path between steering wheel and knuckle using Additionally there is no rigid connection between left and right wheelallows controlling the steer angles important if one wants to information of the ride height sensors in the dampers, the steer angle can be corrwith respect to the current suspension deflection. The disadvantage of toe change during wheel travel can hence be eliminated by this. At a later stage four wheel steering (4WS) can be introduced, too.
The steering ratio at the front is set to 14° swheel. This ratio is within the range of many well-known steer feeling.
The maximum steer torque is assumed to occur at stand still, according to known that the required wheel steering torque does not depend on the wheel center offset from the king pin line but increases with higher vehicle load and lower tire pressure. Hence weight - that occurs in case of 4WS at the ladenof 2.5 bar about 100 Nm are required to turn the wheelfrom the toe links to the wheel carrier of 120parking is approximately 10150 Nm are required. In Assuming cornering at full load with 1g and a maximal trail pneumatic trail) the linear actuator has to deal witthat corresponds to a maximal tolerable
Evaluating measurement data from a double lane change maneuver,angle change is found in the region of
Figure 20: Steering angle and rack speed during a double lane change maneuver at 80 km/h.
Suitable actuators that cope with the forces and speeddetails see curve 1 in figure included, further investigations are needed to define the precise properties of the steering actuators. A solution could be even more powerful steering actuators or changed tierodlocations. It is assumed that the weight remains in the same a
~ 60mm/s
teering
For a future perspective considerable weight savings are achieved by eliminating the mechanical path between steering wheel and knuckle using steer-by-wire technology.
here is no rigid connection between left and right wheel allows controlling the steer angles at each wheel individually. This is
if one wants to control the toe during suspension travel. By using the information of the ride height sensors in the dampers, the steer angle can be corrwith respect to the current suspension deflection. The disadvantage of toe change during wheel travel can hence be eliminated by this. At a later stage four wheel steering (4WS)
The steering ratio at the front is set to 14° steering wheel angle per steer angle at the wheel. This ratio is within the range of many medium-class vehicles and gives the driver a
The maximum steer torque is assumed to occur at stand still, according to known that the required wheel steering torque does not depend on the wheel center offset from the king pin line but rather from wheel load and tire pressure. The moment
vehicle load and lower tire pressure. Hence assuming the occurs in case of 4WS at the laden rear axle - of 3780 N and a ti
Nm are required to turn the wheel. With the geometrical offset from the toe links to the wheel carrier of 120 mm the required cylinder pressure for
100 Nm/0.12 m = 833 N. If the tire pressure drops In this case the available steering force is limited to 1
Assuming cornering at full load with 1g and a maximal trail of 50 mm (caster trail and pneumatic trail) the linear actuator has to deal with 385 kg*9.81 g*0.05
maximal tolerable force to the actuator of about 1575
Evaluating measurement data from a double lane change maneuver, the maximum steer angle change is found in the region of about 60 mm/s, see also figure 20 below.
: Steering angle and rack speed during a double lane change maneuver
cope with the forces and speeds are available already by todayfigure 21. At the moment no safety factor for faste
investigations are needed to define the precise properties of the steering olution could be even more powerful steering actuators or changed tierod
t is assumed that the weight remains in the same area of the given
Maximum actuator
speed ~ 60mm/s
MODELS
30
For a future perspective considerable weight savings are achieved by eliminating the wire technology. required, which
individually. This is for instance control the toe during suspension travel. By using the
information of the ride height sensors in the dampers, the steer angle can be corrected with respect to the current suspension deflection. The disadvantage of toe change during wheel travel can hence be eliminated by this. At a later stage four wheel steering (4WS)
teering wheel angle per steer angle at the vehicles and gives the driver a
The maximum steer torque is assumed to occur at stand still, according to [20]. It is known that the required wheel steering torque does not depend on the wheel center
from wheel load and tire pressure. The moment assuming the highest N and a tire pressure
With the geometrical offset ed cylinder pressure for
If the tire pressure drops to 1.5 bar case the available steering force is limited to 1250 N.
mm (caster trail and 5 m = 188.8 Nm
about 1575 N.
the maximum steer below.
: Steering angle and rack speed during a double lane change maneuver
are available already by today [21], . At the moment no safety factor for faster steering is
investigations are needed to define the precise properties of the steering olution could be even more powerful steering actuators or changed tierod
given example.

CHAPTER 2 MODELS
31
Figure 21: Speed 1 and current 5 curve for different loads of a 12V linear actuator (Thomson Electrak 10 [21])
The tie rod introduces large changes of steering angle during vertical suspension travel depending on the connection points to vehicle and knuckle, see figure 22. Moving the outer mount to z=-100 mm (in vehicle coordinate system) shows rather small distortion and a rather linear behavior.
Figure 22: Steering Angle as function of vertical location of tie rod. Assumed is a horizontal tie rod and location index according to the vehicle coordinate system.
The dependency of the tierod location also plays a role for the toe angle at the wheel when simulating suspension travel. Toe-in of 0.1° is desired. Further improvement of the toe angle during wheel travel is expected by shifting the actuators vehicle mounts slightly upwards. By that the toe change is rather linear where positive toe (toe-in) is resulting for expansion as can be shown later and toe-out is gained during compression. The steering actuators need to be mounted on the hardpoints (vehicle coordinate system) shown in table 25 in order to have optimal behavior.
-3
-2
-1
0
1
2
3
-100 -50 0 50 100
Ste
eri
ng
An
gle
/ [
de
g]
Wheel Travel / [mm]
Steering Angle dependent on Tie Rod Location
Tie Rod -200 mm Tie Rod -150 mm
Tie Rod -100 mm Tie Rod -50 mmTie Rod 0mm Tie Rod +100mm

CHAPTER 2 MODELS
32
Table 25: Modified steering actuator mounting points to achieve little steering wheel angle change during wheel travel.
Steering actuator mounts x [mm] y [mm] z [mm]
To knuckle
Left -75 -731.99 -100
Right -75 731.99 -100
To vehicle
Left -75 -383 -105
Right -75 383 -105
2.1.11 Wheels
The proposed vehicle is equipped with 16” rims and 205/60 or 215/55 tires. This can be seen as a compromise between fuel efficiency and grip. Wider tires would provide a larger contact patch (correspondingly enlarged force transfer at same friction level) while narrower tires would be more fuel efficient due to reduced air drag and less rolling resistance due to decreased contact patch area.
According to the evaluation of the tare-down data the average weight of one tire is about 9.8 kg. Since passenger vehicle tires have been optimized regarding good grip and controllability as well as safety, lifetime, durability or cost over the last century, saving rubber and reducing the amount of steel in the carcass and bead is not discussed in this report. For this reason and simplicity in the simulation standard tires with a weight of 9.5 kg are assumed for the vehicle.
The rims though can be from light materials such as aluminum and magnesium alloy. Examples from motorsports show that 16” rims (TRM F1 16x6.5) for track use weigh below 5 kg per rim [22]. Even steel (casted and forged) rims should be considered since the higher strength of steel can decrease the amount of material needed.
With 50 % weight saving achieved by using lightweight aluminum rims and with low weight standard stock tires a total of about 25 % wheel weight can be saved compared to the average, see also table 13. Furthermore aerodynamic capsulation of the rim is beneficial for economy due to reduced air drag.

CHAPTER 2 MODELS
33
2.1.12 Brakes
Transfer of longitudinal forces depends on normal forces and road friction. To use the tires capability to transfer brake forces at maximum without locking wheels, the brake force needs to be balanced between front and rear axle for optimal use of brakes and avoiding of locking up wheels.
The axle normal load including the load transfer during braking (negative acceleration a) is
"� = #� ∙ $ − �#&'& ∙ ( ∙ ) (4)
for the front axle and
"* = #* ∙ $ + �#&'& ∙ ( ∙ ) (5)
for the rear axle.
The brake forces at a certain road friction are directly dependent on the normal load:
,� = - ∙ "� (6)
and
,* = - ∙ "* . (7)
The brake force distribution β for a two axled vehicle is calculated according to:
. = ,�/�,� + ,* . (8)
At the same friction level the optimal brake force equals the dimensionless deceleration
γ:
.'0& = 1 − 2 + ( ∙ 3 . (9)
Hence the optimal brake force depends besides the vehicles location of COG also on the actual deceleration.
Due to the fact that the tare and laden weight of the vehicle differ largely the rear brake forces need to be limited in case of an empty vehicle at hard braking. The load transfer reduces the rear wheel forces so much that almost all braking force has to be applied at the front in order to not lock the rear wheels. On the other hand during laden state braking, the rear brakes can take up quite high braking loads of more than 250% of the tare state (tare: 453 N; laden: 1175 N). A load sensitive brake pressure at the rear axle is recommended, which can be realized by control of rear brake pressure via the ABS unit.

CHAPTER 2 MODELS
34
Figure 23: Optimal brake force distribution at front and rear axle for different load cases.
For a realistic case and for easier application the brake force distribution is optimized for brake forces of 1g. The brake forces at the front axle do not differ a lot between the laden and tare case, see figure 23. The brake at the front should be designed in a way that is handles the brake loads for both cases very well. This means that 78% of the brake force is applied at the front axle in tare condition while in laden condition it is 69 %.
Figure 24: Brake force per wheel, assuming an optimal brake force distribution βOPT,1g over different decelerations.
The front brake pressure can be kept equal for both load cases due to low differences and only a load sensitive brake pressure valve for the rear is needed, see figure 24.
The largest brake forces occur during emergency braking with laden vehicle at the front axle. For an assumed maximum deceleration of 1g the brake force at each front wheel would be 2298 N for the loaded vehicle (2219 N at tare weight). Correspondingly the highest brake forces at the rear wheels are found for laden state and high brake levels: At -1 g deceleration and laden state each wheel has a braking force of 1175 N.
0.0
0.1
0.2
0.3
0.4
0.5
0.6
0.7
0.8
0.9
-1.2 -1 -0.8 -0.6 -0.4 -0.2 0
Bra
ke
Fo
rce
Dis
trib
uti
on
/ [
]
Deceleration / [g]
Optimal Brake Force Distribution β
Tare Laden
0
500
1000
1500
2000
2500
3000
-1.2 -1 -0.8 -0.6 -0.4 -0.2 0
Bra
ke
Fo
rce
on
Wh
ee
l /
[N]
Deceleration / [g]
Brake Force per Wheel at fixed βOPT,1g
Front Tare
Front Laden
Rear Tare
Rear Laden

CHAPTER 2 MODELS
35
2.2 Models
To predict the behavior of the suspension layout and in order to obtain forces and deflections the suspension is virtually built and ensuing simulated. There are two methods chosen:
The first method is a 1D simulation of the leaf spring using the software Matlab. The aim of this is to obtain the optimal dimensions of the spring assuming a certain material. The geometry was iterated so that the optimal deflection/force properties were obtained. At 1100 N load the deflection from the straight position should be 100 mm as stated in chapter 2.1.2.
The other method uses professional software from MSC Software called Adams/Car. The whole suspension is virtually built including every member, bushings, steering system and tires. The simulations include static and dynamic events such as wheel travel, loads at any point of the suspension, loads at the tire, or complete driving events as the ISO-lane change. Advantageous is that the software considers the bushing displacement and forces as well as the tire deformation.
2.2.1 FEM Leaf Spring Model
In order to predict reaction forces and deformations the finite element method (FEM) is used. A model using Matlab was chosen to suit the present investigation. Adams is quite advanced simulation software, which for simple models can be a bit overshooting. Therefore the leaf spring itself was modeled in Matlab for simple force and deflection investigations. With that model the influence of different dimensions resp. wall thicknesses and fiber compounds can be simulated as well as different beam end and mount forces and torques. In the end by using the material properties of glass fiber and with known forces and deflections both in vertical and longitudinal direction (mostly braking) the dimensions of the leaf spring can be determined preliminarily. The 2D element formation is done according to figure 25.
Figure 25: Principle of finite element method. Shown are the forces and moments in one element respectively the corresponding reaction forces in the nodes.
Each node has the 3 reaction forces M, MT and T, with their corresponding displacement coordinates φ, θ and w. The postulated displacement and force vector are: u = (w1, θ1, φ1, w2, θ2, φ2)
t and F = (T1, M1, MT1, T2, M2, MT2)t.

CHAPTER 2 MODELS
36
Element shape functions are
"� = 1 − 3 �56�
*+ 2 �5
6�7,
"* = −: + 2 5
6 − 5;
6 , "7 = 1 − 5
6 ,
"< = 3 �56�
*+ 2 �5
6�7,
"= = 5
6 − 5;
6 , and "A = 5
6 ,
(10)
while the stiffness matrix is composed as following for static bending and torsion evaluation [23]:
BC =
DEEEEEEEEEEEF 12GH
ℎ7 − 6GHℎ* 0
− 6GHℎ*
4GHℎ 0
0 0 MNℎ
− 12GHℎ7 − 6GH
ℎ* 06GHℎ*
2GHℎ 0
0 0 − MNℎ
− 12GHℎ7
6GHℎ* 0
− 6GHℎ*
2GHℎ 0
0 0 − MNℎ
12GHℎ7
6GHℎ* 0
6GHℎ*
4GHℎ 0
0 0 MNℎ O
PPPPPPPPPPPQ
(11)
From the spring dimensions (L, B, H, tB and tH) and force inputs (S, MTM and MT) the cross section A, volume V, location of shear and mass center, xSC and xm, and moments of inertia, IXX IYY and IXY, as well as the torsional constant J are calculated. The polar moment of inertia I0, mass moment of inertia J0, as well as bending stiffness EI and torsional stiffness GJ are calculated with help of the material properties (Young’s modulus E, Poisson’s ratio ν and density ρ). The number of elements is arbitrary eligible but a number of n=1000 elements proved to be good for optimum of resolution versus computing time. The nodes for mounting the leaf spring are automatically selected to the closest node of the input value; hence a maximum error of 0.7 mm is introduced with this method.
Following the stiffness matrix, load matrix, and mass matrix of the system are assembled according to the formula shown above. The boundary conditions are applied in the stiffness matrix.
As graphical output the leaf spring deflection w and bushing twist θ (versus horizontal plane) are chosen. The leaf spring deflection at installation shape in the code is reached with a negative load of -1400 N, -100 mm deflection with a load of (-1400 +300) N = -1100 N, steady state requires 0 N and 100 mm bump is achieved with a load of 1100 N. The results are depicted in figure 26.

CHAPTER 2 MODELS
37
Figure 26: Deflection of the leaf spring and bushing rotation from horizontal at red: assumed maximum deflection at full bump (at +100 mm; 2500 N), blue: at steady state (at 0 mm; 1400 N), green: assumed lowest axle load at full rebound (at -100 mm; 300 N), black: no load (installation shape, at -127 mm; 0 N).
The shape of the leaf spring was iterated until the desired leaf spring forces of -1100 N at -100 mm deflection were obtained with the chosen dimensions and material properties. The maximal brake forces of -2300 N at the front axle and -1175 N at the rear axle from chapter 1.6.2 were considered, too. The greater thickness in the vertical wing of the profile is due to the fact that minimal longitudinal deflection at the chosen outside geometries was attempted.
Table 26: Alternated leaf spring dimensions with vertical and horizontal deflection, weights and depictured deflection.
Leaf Spring Width Narrow Medium Wide
Shape
Outer Dimension (B x H)
30 x 30 mm 80 x 22 mm 200 x 20 mm
Wall Thickness (tb x th)
8 x 1 mm 8 x 2.2 mm 3 x 1.1 mm
Vertical Deflection @ -1100 N
-101 mm -100.9 mm -100.3 mm
Horizontal Deflection Front @ -2200 N
-144.6 mm -15.95 mm -3.52 mm
Horizontal Deflection Rear @ -1175 N
-73.93 mm -8.153 mm -1.721 mm
Weight 1.016 kg 1.2672 kg 1.0936 kg
In figure 27 the deflections are shown for the different leaf spring designs.
0 0.5 1 1.5-150
-100
-50
0
50
100
150deflection, bushing rotation over length of leaf spring
length of leaf spring [m]
disp
lace
men
t [m
m],
bus
hing
rot
atio
n [°]
deflection [mm]
bushing roatation [deg]

CHAPTER 2 MODELS
38
Narrow Medium Wide
Figure 27: Vertical and Longitudinal leaf spring displacement during braking with 1g without brake force support for the tree different design layouts. The black curve with -100 mm deflection at the end nodes represents the vertical displacement. The deflection during deceleration with 1 g with blue color is for the front leaf spring without brake rod and the curve in red color for the rear leaf spring.
The resulting longitudinal leaf spring deflection with the narrow leaf spring design at the front axle would be -144.6 mm, which justifies the use of brake rods at the front. At the rear the deformation of the wide leaf spring is very small and does not exceed -1.721 mm for emergency braking at 1 g, see table 26.
2.2.2 Adams Suspension Model
Adams/Car is a simulation tool that has topography of 3 steps for setting up a simulation of a vehicle or of parts of the vehicle. The lowest order file in this is the “template”. The template contains basic information about the layout of a part as for instance the design, geometry or amount of connection points. To create or modify template parts the template builder has to be used. The medium level “subsystem” in the standard view of Adams/car has to be used as pre-step to an “assembly”, the highest order file format. To start setting up a suspension a set of known hardpoints is required that define the essential key data for the geometry.
Suspension assemblies represent an individual suspension of the car and can consist of several subsystems such as suspension subsystem, ARB subsystem or steering resp. tire subsystems.
The suspension assembly can be simulated in both static and dynamic load cases and investigated without interferences from other vehicle movements. The complete vehicle has to be built up from several subsystems to a “Full-Vehicle Assembly”. This vehicle can be simulated also in static and dynamic load cases as well as file driven events, which means that recorded testing data from physical driving tests can be fed into the simulation.
2.2.3 Description of Vehicle Model
The front and rear suspension are built form individual templates according to the vehicle data given in chapter 1 and in table 27. For each component an individual part is created: front suspension, rear suspension, brakes, steering, front resp. rear tires, front and rear stabilizer, and chassis.
0 0.5 1 1.5-150
-100
-50
0
50
length of leaf spring [m]
disp
lace
men
t [m
m]
0 0.5 1 1.5-150
-100
-50
0
50
length of leaf spring [m]
disp
lace
men
t [m
m]
0 0.5 1 1.5-150
-100
-50
0
50
length of leaf spring [m]
disp
lace
men
t [m
m]

CHAPTER 2 MODELS
39
Table 27: Hardpoints of the investigated suspension.
2.2.4 Leaf Spring in Adams
Since there is no stock tool in MSC Software that implements a transversally mounted leaf spring a replacement model is built. This spring uses rods and bushings. By that the deflection of the leaf spring is approximated with 21 nodes. The bushings between the rods create the spring forces when deflected. The bushings are named differently so that the leaf spring properties can easily be adapted when not using uniform thickness/material properties. There are correspondingly bushings for the left and right side of the vehicle. The design of the leaf spring is shown in figure 28.
Figure 28: Leaf spring approximation with a 21 node rod bushing beam. The blue rods mark the connection rod to the knuckle, the chassis (larger bushings) and of the two leaf spring halves.
A pre-torque is defined by shifting the angle of no load to the original installation shape of the leaf spring. Here the results from the Matlab simulation are very useful. For fast adaption of the leaf spring an input mask in Excel is used, where depending on preload, required spring rate and installation deflection angle the desired bushing is created directly. As the leaf spring always takes the same loads at every axle and every load case no changes to the leaf spring bushings have to be made when simulating different axle weights.
The leaf spring is attached to the knuckle via a spherical joint (rotational at rear) and a bushing with reduced torsional torque. The attachment to the chassis is performed by bushings which have no z-rotational moment. In order to not block the leaf spring from bending, the y-movement (both in bushing and vehicle coordinate system) is not limited on the mount bushings. To ensure zero lateral movement of the leaf spring in the virtual model a hidden constraint on the center node of the leaf spring restricts the movement
Template: _front_suspension Template: _rear_suspension
hardpoint name symmetry x_value y_value z_value hardpoint name symmetry x_value y_value z_value
CA_10 single 0 0 -145 CA_10 single 0 0 -145
brake_rod_inner left/right 231 -386 -145 CA_0 left/right 0 -740 -145
brake_rod_outer left/right 85 -635 -145 CA_1 left/right 0 -666 -145
CA_0 left/right 0 -740 -145 CA_2 left/right 0 -592 -145
CA_1 left/right 0 -666 -145 CA_3 left/right 0 -518 -145
CA_2 left/right 0 -592 -145 CA_4 left/right 0 -444 -145
CA_3 left/right 0 -518 -145 CA_5 left/right 0 -370 -145
CA_4 left/right 0 -444 -145 CA_6 left/right 0 -296 -145
CA_5 left/right 0 -370 -145 CA_7 left/right 0 -222 -145
CA_6 left/right 0 -296 -145 CA_8 left/right 0 -148 -145
CA_7 left/right 0 -222 -145 CA_9 left/right 0 -74 -145
CA_8 left/right 0 -148 -145 LS_mount_6 left/right 0 -300 -145
CA_9 left/right 0 -74 -145 damper_upper left/right 0 -500 393
LS_mount_6 left/right 0 -300 -145 spring_lower left/right 0 -635 160
damper_upper left/right 0 -500 393 upper_arm_front left/right -100 -515 130.279
spring_lower left/right 0 -635 160 upper_arm_rear left/right 100 -515 140.836
tierod_inner left/right -75 -386 -72.5 upper_control_arm left/right 0 -685 164
tierod_outer left/right -75 -740 -72.5 wheel_center left/right 0 -760 0
upper_arm_front left/right -100 -515 146.107
upper_arm_rear left/right 100 -515 131.31
upper_control_arm left/right 0 -685 164
wheel_center left/right 0 -760 0

CHAPTER 2 MODELS
40
to the vehicle xz-plane. Possible solutions for the real vehicle could be the use of a watt linkage or constraining the y-movement of the leaf spring in one mounting point only. Detailed investigations on the leaf spring attachment and lateral fixation are not covered in this report but have to be performed at a later stage.
It is important that the bushings are orientated correctly so that the leaf spring acts in the proper direction, see figure 29. In the present investigation of the leaf spring the bushings x-axis points to ground.
Figure 29: Orientation of bushing coordinate system in Adams/Car.
The bushing characteristics for the leaf spring are displayed in figure 30.
Figure 30: Leaf spring translational and rotational force of the bushings.
2.2.5 Gas Spring in Adams
In MSC Adams the gas spring is represented by a normal coil spring with modified behavior according to the values of figure 11. The force over deflection curve is modeled in order to obtain realistic air spring behavior with the present volume. With that method every load case requires its own specific gas spring setting for both front and rear axle. For simplicity the simulations are performed only for tare and laden weight status; any other load state can be easily established by adjusting the gas spring forces to the desired load case.
-15
-10
-5
0
5
10
15
-10 -8 -6 -4 -2 0 2 4 6 8 10
Fo
rce
/ [
kN
]
Displacement / [mm]
Leaf Spring Bushing
Translational Force
Fx
Fy
Fz-15
-10
-5
0
5
10
15
-45 -30 -15 0 15 30 45
Mo
me
nt
/ [k
Nm
]
Displacement / [deg]
Leaf Spring Bushing
Rotational Force
Mx
My
Mz

CHAPTER 2 MODELS
41
2.2.6 Front Suspension
The complete front suspension with the approximated leaf spring in Adams is shown in figure 31.
Figure 31: Front suspension in Adams/Car including the brake rods and with coil spring as replacement for the air spring.
Figure 32: Top view of front suspension half plane.
The brake rod is orientated towards wheel center as one can see from top view, see figure 32. The deflections in the emergency braking and abuse simulations of the leaf spring in Matlab showed that the use of brake rods at the front is necessary. By that brake steer can be eliminated.
2.2.7 Rear Suspension
The rear suspension uses the same transversal leaf spring. Differences compared to the front regarding the layout can be found in the missing brake rod, missing toe links and the reduced degree of freedom in the knuckle joints. The connection to both the upper A-arm and to the leaf spring is through a rotational joint that allows free vertical movement but transfers longitudinal moments. Hence the tie rod can be eliminated. By design the rear brake forces are lower than on the front and can be absorbed in the suspension.
The rear suspension is depicted in figure 33 where the missing brake support and tie rods are detectable compared to the front suspension.

CHAPTER 2 MODELS
42
Figure 33: Rear suspension in Adams/Car.
If applying 4WS a toe rod needs to be installed and the knuckle rotational joints need replacement by spherical ball joints. The steering angle is introduced by a tie rod at the same location as at the front for simplicity.
2.2.8 Steering
The prospected electric steering actuator is represented by a traditional rack and pinion steering system that has a linear transmission between steering wheel and knuckle. The steering ratio is set to 14°/°.
When all wheel steering is applied, the electrical rear steering is represented by a conventional rack and pinion steering system that acts on the rear tie rods as it is applied at the front axle. The rear rack is connected to the front steering system via an arbitrary translation ratio.
2.2.9 Tires
This investigation uses validated Pacejka 2002 Tire Model in the dimension 205/55 R16. This corresponds to a tire diameter of 632 mm and is rather close to the proposed tire dimensions (205/60 R16 (652 mm) and 215/50 R16 (643 mm), compare with table 3. The advantage using this tire is the thoroughly validated model. The tire model follows Pacejka’s magic formula, which is an empirical formula with a set of fitting parameters. Actual testing data were used to verify the simulation of tire models hence the coherence for such a validated tire model is rather accurate [24]. The vertical tire stiffness is assumed to be 200 kN/m. The tire and rim weighs in total 16 kg as defined in section 2.1.1 and table 10 above.

CHAPTER 3 KINEMATICS & COMPLIANCE
43
3. KINEMATICS & COMPLIANCE With kinematics and compliance the wheel movements relative to the body during suspension travel or when forces are applied to the wheels are addressed.
The results of the simulation of the proposed suspension layout in Adams/Car are shown in this section. The following demands presented in table 28 have to be fulfilled by the vehicle.
Table 28: Demanded vehicle parameters
Vertical eigenfrequency front Hz 1.3
Vertical eigenfrequency rear Hz 1.5
Roll stiffness deg/s/m^2 0.3
Steering ratio steering wheel angle/wheel angle 14
Weight distribution f/r 0.58
Wheel base mm 2700
Track width mm 1520
Centre of gravity mm 550
Front suspension
Unbalance lever mm max 50
Caster angle deg 6
Camber compensation deg/m 28
Roll centre height mm 70
Roll centre height migration mm/mm -1.7
Bump understeer deg/m 8
Antidive N/N 0.1
Antilift N/N 0.1
Shock absorber ratio mm/mm 0.7
Lateral force understeer, 0 mm deg/kN 0.1
Drive force steer deg/kN 0.0
Brake force steer deg/kN 0.0
Rear suspension
Camber compensation deg/m 28
Roll centre height mm 80
Roll centre height migration mm/mm -1.7
Bump understeer deg/m 1
Antisquat N/N 0.1
Antilift N/N 0.35
Shock absorber ratio mm/mm 0.7
Lateral force understeer, 0 mm deg/kN 0.05
Drive force oversteer deg/kN 0.1
Brake force steer deg/kN 0.2
The graphs show the different output parameters during different wheel travel events. The simulations can be evaluated and analyzed for every step of the simulation. Some kinematic parameters such as camber, caster, and toe can be directly analyzed and

CHAPTER 3 KINEMATICS & COMPLIANCE
44
plotted. Also forces and moments such as aligning torque, hub forces, damper and spring forces as well as damper and spring displacement can be read out.
To judge the compliance of the different suspension parameters the main focus is set onto the expected deflection envelope during driving in tare and fully laden condition. This envelope is not easy to define but wheel travels of between ±40 mm to maximum ±65 mm are expected under normal driving conditions. Some of the parameters are only evaluated for the left side of the vehicle for simplicity where same results were obtained for the right vehicle half. Correspondingly some parameters are only shown for the vehicle under tare condition when the laden state follows the exact same results. All results in Adams are accessible via the in-built post-processor but for better overview and evaluation the results are processed and plotted in Excel.
3.1 Eigenfrequencies
The eigenfrequencies in table 29 show the interaction of sprung and unsprung masses the decoupled system where gravity is respected. Most important are the frequencies of the body in the decoupled system as this is the frequency the driver perceives in reality. For the evaluation the sprung mass and unsprung mass for the different load states and axles were fed into a quarter car model. Damping and spring parameters are set to the vehicle demands as stated in table 18 and 19 resp. in figure 12.
Table 29: Eigenfrequencies for the front and rear axle during tare and laden condition. Marked in blue are the important frequencies for the driver.
Front Rear
Tare Laden Tare Laden
Frequency of Body / [Hz] 1.271 1.190 1.474 1.147
Frequency of Tire /[Hz] 13.139 13.152 15.866 15.928
The desired frequencies of 1.3 Hz at the front axle and 1.5 Hz at the rear axle can be fulfilled with the current suspension layout. The frequencies drop when the vehicle is laden. At the front axle the difference between tare and laden state is lower than at the rear. The values for the rear axle differ more due to the large difference of tare and laden axle weight.
3.2 Hub Forces
One key feature of the suspension that is evaluated are the hub forces of the different axles for the two load conditions tare and laden. As the interaction of the bushings of the leaf spring is rather complex this is the first parameter to evaluate. As can be seen from figure 34 and figure 35, the resulting hub forces fulfill the requirements of the vehicle description.

CHAPTER 3 KINEMATICS & COMPLIANCE
45
Figure 34: Hub forces during parallel wheel travel.
Figure 34 shows the actual hub forces of the Adams/Car model compared to the desired hub forces. The slightly polynomial shapes of the curves are a result of the translation factor between hub and spring and the non-linear spring forces of the gas spring that were introduced for realistic air spring parameters. The deviations from the linear curves in the region of -50 mm to +30 mm wheel travel are considerable low, hence a quasi linear behavior is ensured.
In figure 35 the hub forces between left and right wheel are plotted and a coherence of both sides can be seen. Hence the leaf spring distributes the load equally between left and right wheel.
Figure 35: The hub forces of the suspension model in Adams/Car for the left and right wheel of both axles and the two different load states.
0
1
2
3
4
5
6
7
-100 -50 0 50 100
Hu
b F
orc
e /
[k
N]
Wheel Travel / [mm]
Comparison of Hub Forces
Front Tare - Adams Front Tare - Linear Front Laden - Adams Front Laden - Linear Rear Tare - Adams Rear Tare - LinearRear Laden - Adams Rear Laden - Linear
0
1
2
3
4
5
6
7
-100 -50 0 50 100
Hu
b F
orc
e /
[k
N]
Wheel Travel / [mm]
Comparison between Left & Right Hub Forces
Front Tare Left Front Tare Right
Front Laden Left Front Laden Right
Rear Tare Left Rear Tare Right
Rear Laden Left Rear Laden Right

CHAPTER 3 KINEMATICS & COMPLIANCE
46
3.3 Anti Roll Bar Forces
The load transfer from one wheel to the other can be read from the simulations when comparing parallel and opposite wheel travel hub forces. The difference between the two curves for each load case and axle is the inbuilt ARB force that results from the leaf spring and its mounting geometry. The hub forces of opposite wheel travel compared to the results of parallel wheel travel are shown in figure 36.
Figure 36: Hub forces of opposite wheel travel in Adams/Car for the left wheel of both axles and the two different load states compared to the hub forces of parallel wheel travel.
The difference between parallel and opposite wheel travel refers to the in-built stabilizer effect and is visualized in figure 37. Reading the graph shows that the built in stabilizer forces are equal for the two load cases and quite the same on front and rear axle. Both are insufficient compared to the desired stabilizer forces. The front leaf spring can only deliver 2.8 % of the desired stabilizer forces postulated in chapter 2.1.4 while at the rear 12.5 % are obtained. Hence the gas spring system has to be equipped with a logic that actively controls the vehicle roll by modifying the pressures for each wheel individually.
The originally plan for the leaf spring suspension design was omitting the ARB due to the built in forces created by the support at the mounting points. It can be shown that the target forces are difficult to reach with this simple shaped leaf spring design. It is doubtable if the stabilizer forces could be reached at all without additional mechanical system, but therefore extensive optimization is necessary. If the proposed integration of the ARB function into the gas spring system is not suitable due to e.g. complexity or reaction time, simple ARBs could be installed as a backup solution at cost of increased weight.
0
1
2
3
4
5
6
7
8
-100 -50 0 50 100
Hu
b F
orc
e /
[N
]
Wheel Travel / [mm]
Hub Forces: Parallel & Opposite Wheel Travel Front Tare Parallel
Front Tare Opposite
Front Laden Parallel
Front Laden Opposite
Rear Tare Parallel
Rear Tare Opposite
Rear Laden Parallel
Rear Laden Opposite

CHAPTER 3 KINEMATICS & COMPLIANCE
47
Figure 37: Stabilizer function of leaf spring compared to desired Anti-Roll Bar force.
3.4 Shock Absorber Ratio
The shock absorber ratio describes the resistance proportion between expansion and compression. Usually a higher force during rebound stage is desired as during expansion the damper has to compensate the body weight. During compression the forces are lower since only the unsprung mass has to be attained. In general the ratio varies between 50/50 up to 70/30, where the first value represents the control during rebound. In figure 38 the damper forces over damper speed are shown for a wheel travel event between -50 and 50 mm in the corresponding direction in 0.1 seconds wherefrom also the damper ratio as shown in figure 39 is derived from. No differences for the two load states are found, front and rear axle show different behavior and have due to different A-arm inclinations different strokes. In figure 40 the damper force over stroke is shown, where the lags at the left end of the compression curves and to the right of the expansion curves are due to the inertia in the dynamic simulation.
Figure 38: Damper force as function of damper speed of the simulated vehicle.
-2.0
-1.5
-1.0
-0.5
0.0
0.5
1.0
1.5
2.0
-100 -50 0 50 100
Hu
b F
orc
e /
[k
N]
Wheel Travel / [mm]
Stabilizer Forces
Front TareFront LadenRear TareRear LadenDesired FrontDesired Rear
-4.0
-3.0
-2.0
-1.0
0.0
1.0
2.0
3.0
-1.25 -1.00 -0.75 -0.50 -0.25 0.00 0.25 0.50 0.75 1.00
Da
mp
er
Fo
rce
/ [
kN
]
Damper Speed / [m/s]
Damper Force
Compression Front
Expansion Front
Compression Rear
Expansion Rear

CHAPTER 3 KINEMATICS & COMPLIANCE
48
Figure 39: Damper ratio as function of the absolute value of damper speed of the simulated vehicle.
Figure 40: Damper force as function of damper displacement for front and rear axle during compression and extension between -50 and 50 mm at a frequency of 10 Hz.
3.5 Camber Angle
The camber angle represents the wheel alignment vertically to the road. A 90° angle between the horizontal plane and the in-wheel plane results in 0° camber angle. Postulated is a camber of -1° at 0 mm wheel travel, with compensation during wheel travel of -28° / m.
As can be seen in figure 41 the camber angle varies in a quite narrow band around the desired camber angle. There is no difference to detect between tare and laden condition, nor is it dependent from the type of wheel travel (parallel, opposite or vehicle roll). Due to the suspension geometry with basically two unequal length arms naturally a curved shape is obtained. For the wheel travel envelope of -25 mm to + 25 mm almost a linear slope of the camber can be detected which leads to the conclusion that the postulated camber gain is achieved. The camber during compression above +25 mm wheel travel is
0
0.1
0.2
0.3
0.4
0.5
0.6
0.7
0.8
0.9
1
0.0 0.2 0.4 0.6 0.8 1.0 1.2
Da
mp
er
rati
o /
[]
Damper Speed / [m/s]
Compression to Expansion Ratio
Front
Rear
-5
-4
-3
-2
-1
0
1
2
3
0 20 40 60 80
Da
mp
er
Fo
rce
/ [
kN
]
Damper Stroke / [|mm|]
Damper Force
Compression Front
Expansion Front
Compression Rear
Expansion Rear

CHAPTER 3 KINEMATICS & COMPLIANCE
49
slightly higher than the desired 28 °/m while for rebound it is lower. The curve peaks at about -25 mm wheel travel and then drops further at higher rebound levels.
Figure 41: Camber angle for different suspension travel events and different load cases.
3.6 Caster Angle
The caster angle is the inclination of the kingpin line projected in the xz-plane. The caster angle sets together with the tire radius the caster trail, which besides the pneumatic trail of the wheel is responsible for the steering aligning torque. Per vehicle definition the caster at the front axle should be at 6 °, while at the rear the usual 0 ° are applied. The resulting caster angle for this vehicle ranges between 3.5 ° and 7.5 ° at the front axle and caster gain is detectable for compression; see figure 42. A small difference for the different load cases at the front axle can be found where the steeper curves correspond to the parallel wheel travel and the more flat curves are result of opposite wheel travel. The rear axle behaves differently: Here caster loss is found for positive wheel travel (compression) and no difference between the load cases is visible. In general the changes at the rear are very small.
For normal driving conditions the caster angle is in the expected envelope, the changes at the front axle are acceptable while at the rear axle almost no change is detectable.
-8
-6
-4
-2
0
2
4
6
8
-100 -50 0 50 100
Ca
mb
er
An
gle
/ [
de
g]
Wheel Travel / [mm]
Camber Angle
Front Tare Parallel Front Tare Opposite
Front Laden Parallel Front Laden Opposite
Rear Tare Parallel Rear Tare Opposite
Rear Laden Parallel Rear Laden Opposite
Desired

CHAPTER 3 KINEMATICS & COMPLIANCE
50
Figure 42: Caster angle for different wheel travel events and load states.
3.7 Toe
As described in section 2.1.7 the toe of the vehicle is desired to enable good straight driving and understeering behavior when turning into a curve. The pre-set toe was 0.1° at both axles. As the simulation results showed that the toe at the front axle got negative (toe-out) even though toe-in was applied, the toe values for the front axle were adjusted to 0.25° toe-in in order to archive about 0.1° during normal driving condition. When front wheel drive is applied the pre-toe value can be reduced slightly since the driving forces will counteract the missing pre-toe during acceleration. Toe-out is to avoid at the front axle due to reduced driving stability.
The front axle shows toe-out under compression and toe-in under rebound which is a quite desirable setting for understeering vehicle behavior, see figure 43. During vehicle roll while turning the outer wheel is charged with more toe-out making the vehicle turn less while the inner wheel gains toe as result of less vertical force making the wheel turning less. Both together improve the vehicle understeering behavior. Here it gets quite clear, why the leveling function with load sensitive gas springs is so important for the vehicle: With only small deviations to compression or rebound the wheels have zero toe which reduces straight driving ability and provides for oversteering behavior. The minimum value for toe during parallel wheel travel is -0.022 ° and found for 20 mm compression; for opposite wheel travel zero (0.007 °) is found at -14 mm wheel travel independent form the load state.
The rear axle is always toed inwards and shows only slightly increased toe-in during compression which is the opposite of the front axle. Again this consequences understeering behavior when starting to turn into a curve and during quasi static curving as the outer wheel ( under compression) toes in a little more than the inner wheel.
At the front axle there are minor differences detectable for the two different wheel travel events: The steeper curve in figure 43 represents the parallel wheel travel while the more flat curve represents the opposite wheel travel. Hence opposite wheel deflection reduces the effects of toe-gain under rebound. This is the same effect as previously detected in section 3.6 where during opposite wheel travel the effects of caster gain are decreased compared to parallel deflection. Noticeable is also the influence of the vehicle weight when opposite wheel deflection is applied as the loaded vehicle will gain less toe-in with rebound as the car at tare weight.
-1
0
1
2
3
4
5
6
7
8
-100 -50 0 50 100
Ca
ste
r A
ng
le /
[d
eg
]
Wheel Travel / [mm]
Caster Angle
Rear Tare Parallel Rear Tare OppositeRear Laden Parallel Rear Laden OppositeFront Tare Parallel Front Tare OppositeFront Laden Parallel Front Laden OppositeDesired

CHAPTER 3 KINEMATICS & COMPLIANCE
51
The range of variations at the rear axle is irrelevant as the toe is almost equal during all load conditions and wheel deflection events.
In general the toe values are acceptable; solutions for somewhat lower distortion from the located toe-in are preferable.
Figure 43: Toe angle during wheel travel for front and rear axle in laden and tare condition.
3.8 Roll Center Height
The roll center height with the leaf spring model in Adams is shown in figure 45 below. The postulated roll center height according to the vehicle demands (table 6) at the front is 70 mm while it is 80 mm at the rear. Both axles should have a negative roll center migration of -1.7 mm/mm during wheel travel, meaning that the roll center moves towards ground when the wheels move upwards. As can be seen the desired roll centers can be obtained with the present suspension layout and the roll center migration remains less than stipulated. This is a result of the rather long leaf spring control arm and the flat orientation during leveling height in combination with the upper control arm. Inclining the leaf spring at leveling height so that the control arm is lower at the wheel side than at the mount would increase the roll center migration. The upper A-arms arm on the other hand cannot be shortened or elongated since the design envelope leaves no room for major changes. Investigations with alternated lower control arm mounts are required for optimal compliance as well as reconsidering the desired roll center migration.
-1.0
-0.8
-0.6
-0.4
-0.2
0.0
0.2
0.4
0.6
0.8
1.0
-100 -50 0 50 100
To
e A
ng
le /
[d
eg
]
Wheel Travel / [mm]
Toe Angle Tare & Laden
Front Tare Parallel Front Tare OppositeRear Tare Parallel Rear Tare OppositeFront Laden Parallel Front Laden OppositeRear Laden Parallel Rear Laden OppositeDesired

CHAPTER 3 KINEMATICS & COMPLIANCE
52
Figure 44: Roll center location at the front for proposed suspension layout.
Figure 45: Roll Center location at rear axle for the proposed suspension layout.
For parallel wheel travel of the suspension between ±50 mm in tare condition the global trend of roll center migration has an inclination of -0.52 mm/mm. During laden condition the migration sums up to -0.54 mm/mm for the front axle and -0.59 mm/mm for the rear axle. The migration slopes are depicted in figure 46.
-100
-50
0
50
100
150
200
250
300
-100 -50 0 50 100
Ro
ll C
en
ter
He
igh
t /
[mm
]
Wheel Travel / [mm]
Roll Center Height Front
Front Tare Parallel
Front Tare Opposite
Front Laden Parallel
Front Laden Opposite
Desired Front
-100
-50
0
50
100
150
200
250
300
-100 -50 0 50 100
Ro
ll C
en
ter
He
igh
t /
[mm
]
Wheel Travel / [mm]
Roll Center Height Rear
Rear Tare Parallel
Rear Tare Opposite
Rear Laden Parallel
Rear Laden Opposite
Desired Rear

CHAPTER 3 KINEMATICS & COMPLIANCE
53
Figure 46: Roll Center Height migration during parallel wheel travel between ± 50 mm in tare and laden condition. Indicated are also the slopes of the migration and the roll center height at leveling height.
3.9 Anti-Lift, Anti-Dive and Anti-Squat
The anti-dive and anti-squat motions of the vehicle were optimized by adjusting the upper control arm chassis mounts to the theoretical hard points as described in section 2.1.9. By that focus on the braking was set and 10 % anti-dive applied. In the following the results from the simulations are shown for the whole suspension system, see figure 47 and figure 48.
Figure 47: Anti-Lift motion during tare and laden condition for front and rear axle.
The front suspension serves with 10 % Anti-lift as desired. At the rear the changes of the upper control arm mounts to the chassis do not have the expected effect of 35 %, but still provide 25 % which is rather good. In order to not affect the fairly good anti-squat behavior, the rear anti-lift motion is accepted. The effects of wheel travel to the rear axle on anti-lift are rather low, while at the front clearly a dependency can be detected. The
y = -0.521x + 67.61
y = -0.512x + 72.50
0
20
40
60
80
100
120
-50 -30 -10 10 30 50
Ro
ll C
en
ter
He
igh
t /
[mm
]
Wheel Travel / [mm]
Roll Center Height Tare
Front Tare Parallel
Rear Tare Parallel
y = -0.545x + 66.56
y = -0.588x + 68.81
0
20
40
60
80
100
120
-50 0 50
Ro
ll C
en
ter
He
igh
t /
[mm
]
Wheel Travel / [mm]
Roll Center Height Laden
Front Laden Parallel
Rear Laden Parallel
-15
-5
5
15
25
35
-100 -50 0 50 100
An
ti L
ift
/ [%
]
Wheel Travel / [mm]
Anti Lift Tare & Laden
Front Tare Rear TareFront Laden Rear LadenDesired Front Desired Rear

CHAPTER 3 KINEMATICS & COMPLIANCE
54
more the front suspension is compressed the more lift will occur. Load state and type of wheel deflection (parallel or opposite) have minor influence.
Figure 48: Anti-Dive resp. Anti- Squat motion during tare and laden condition for front and rear axle.
3.10 Normal Driving Compliance
In the following section the suspension compliance during normal driving is evaluated. Therefore the steering angle during longitudinal acceleration (accelerating and braking) and vertical wheel deflection (driving over a bump) is shown.
3.10.1 Drive and Brake Steer
The steering angle for normal driving events is evaluated for both axles and longitudinal forces. Herby it should be ensured that the driving resp. braking moments do not affect the steering in a negative way making the car turn when the driver hits the pedals.
For driving stability there should be no additional steering angle introduced at the front axle, however very small distortions can be found. For the rear axle a change of 0.1 deg/kN is obtained which is exactly the tolerated value for braking. For acceleration 0.2 deg/kN would be allowed, which is not reached as the steer angle deflection is linear. In figure 49 the steering angles for both axles are depicted.
-60
-40
-20
0
20
40
60
-100 -50 0 50 100
An
ti D
ive
/An
ti S
qu
at
/ [%
]
Wheel Travel / [mm]
Anti Dive/Anti Squat Tare & Laden
Front TareRear TareFront LadenRear LadenDesired Front

CHAPTER 3 KINEMATICS & COMPLIANCE
55
Figure 49: Steering angle as function of the applied driving or braking force.
3.10.2 Bump Steer
When hitting an obstacle on the road or driving over a bump, the steering angle change should be kept at a minimum in order to maintain the desired driving direction. In figure 50 the steering angle as function of the wheel deflection is shown for the front axle. The steering has the same behavior for tare and laden condition. Bump steer occurs at the front most for parallel wheel travel, somewhat lower steer angle change can be found for opposite wheel travel. The obtained bump steer slope is about 8 deg/m as originally desired. At the rear axle bum steer gain of 1 deg/m is obtained in the simulations, see figure 51. The rear axle is less affected and shows toe-in during compression which is generally beneficial for vehicle stabilization.
Figure 50: Bump steer angle at front axle dependent on wheel travel during tare and laden condition.
-1.0
-0.8
-0.6
-0.4
-0.2
0.0
0.2
0.4
0.6
0.8
1.0
-2500 -1500 -500 500 1500 2500
Ste
eri
ng
An
gle
/ [
de
g]
Longidutinal Force / [N]
Steering Angle Longitudinal Force
Front Left Front Right Rear Left
Rear Right Desired Front Max. Rear
-1.0
-0.8
-0.6
-0.4
-0.2
0.0
0.2
0.4
0.6
0.8
1.0
-100 -50 0 50 100
Ste
er
An
gle
/ [
de
g]
Wheel Travel / [mm]
Steer Angle Front Tare & Laden
Front Tare ParallelFront Tare OppositeFront Laden ParallelFront Laden OppositeDesired Front

CHAPTER 3 KINEMATICS & COMPLIANCE
56
Figure 51: Bump steer angle at rear axle dependent on wheel travel during tare and laden condition.
3.11 Abuse Compliance
The wheel alignment during abuse is important as contact to the body and other parts must be avoided. The abuse forces according to table 8 are applied to the virtual suspension model.
The longitudinal abuse forces are 10.84 kN at the front axle and 12.27 kN at the rear axle. The reaction forces at 65 mm bump are shown in figure 52 below. The front wheel travel in direction to the rear is rather small with 0.238 mm/kN, which is a result of the stiffening brake rods.
At the rear 1.04 mm/kN are found, which is still considerable low compared to the brake force deformation. The longitudinal compliance during the abuse forces is hence ensured. The initial wheel travel in x-direction at zero force applied is due to the positive wheel deflection of 65 mm.
Figure 52: Longitudinal wheel deflection as result of the abuse forces.
As it was to expect, the front axle deflection is rather low due to the installation of the brake rod, whereas at the rear axle maximum deflections of 15 mm are found. In both
0.00
0.05
0.10
0.15
0.20
0.25
0.30
0.35
0.40
0.45
0.50
-100 -50 0 50 100
Ste
er
An
gle
/ [
de
g]
Wheel Travel / [mm]
Steer Angle Rear Tare & Laden
Rear Tare Parallel
Rear Tare Opposite
Rear Laden Parallel
Rear Laden Opposite
Desired Rear
0
2
4
6
8
10
12
14
16
-12500 -10000 -7500 -5000 -2500 0
Wh
ee
l T
rav
el
X /
[m
m]
Longitudinal Force X /[N]
Abuse Reaction Longitudinal
Front Static
Front Dynamic
Rear Static
Rear Dynamic

CHAPTER 3 KINEMATICS & COMPLIANCE
57
cases the longitudinal displacement of the wheel is within the design envelope as the wheel arches provide enough space for longitudinal wheel travel. The introduced steer angle is depicted in figure 53. It can be seen that the compliance of the steering is rather good even though extreme loads are applied. Even though the rear knuckle is only suspended on upper control arm and leaf spring via rotational joints and no longitudinal member is absorbing load, the steering introduced is with rather low and remains within the allowed envelope.
Figure 53: Steer angle as result of longitudinal abuse forces
The lateral abuse forces sum up to 9440 N at the rear axle and 8340 N at the front axle. The force is applied at the wheel center and positive values both of force and deviation are oriented to the right from drivers view. The force is applied at full bump which means a suspension deflection of +65 mm.
For lateral abuse compliance the track deviation as function of force is plotted in figure 54. It can be detected that the front track deviation is rather small while larger deflections at the rear are visible. This might be a result of the stiffening brake rods at the front that transfer some of the load directly into the chassis. However in general the deviations under abuse force are with a maximum of -1.5 mm rather small so that the lateral compliance during abuse is ensured. The general offset from zero results from the initial wheel deflection of +65 mm.
-1.50
-1.00
-0.50
0.00
0.50
1.00
1.50
-10000 -5000 0 5000 10000
Ste
er
An
gle
/ [
de
g]
Longitudinal Force / [N]
Steer Angle under Longitudinal Force
Front Left Front Right
Rear Left Rear Right

CHAPTER 3 KINEMATICS & COMPLIANCE
58
Figure 54: Lateral Track deviation as function of applied lateral abuse force
The vertical abuse is not successfully tested because the suspension model required adequate bumpstops in order to cope with the abuse forces. The implementation of bumpstops in Adams/Car was not done due to low importance for the investigated compliances in this report. It is assumed that bumpstops are available which are easy to integrate and cope with the forces. The development of proper bumpstops remains for future research on this particular leaf spring suspension design.
3.12 Summary
The previous section shows that the requirements from table 6 are fulfilled quite well with this suspension design as summarized in table 30. Even though the suspension is not equipped with a sophisticated multilink design and advanced tire alignment control it seems that it keep up with the requirements. Improvements could be done in the stabilizer forces of the leaf spring and the toe settings. Both can be addressed with small changes to the current design: Adding a stabilizer and implementing active toe control as function of wheel travel in a four wheel steered vehicle by using the electric steering actuators for compensation. Also the roll center height migration and the anti-x settings leave room for improvements. For more facts the full vehicle is simulated dynamically in next chapter.
-8
-6
-4
-2
0
2
4
6
8
-10000 -5000 0 5000 10000
Tra
ck D
ev
iati
on
/ [
mm
]
Abuse Force / [N]
Abuse Reaction Lateral
Front Left
Front Right
Rear Left
Rear Right

CHAPTER 3 KINEMATICS & COMPLIANCE
59
Table 30: Degree of parameter satisfaction with the present suspension layout.
Value Unit Desired Obtained
Vertical Eigenfrequency front Hz 1.3 1.34
Vertical Eigenfrequency rear Hz 1.5 1.56
Roll stiffness deg/m/s² 0.3 0.34
Front suspension
Caster angle deg 6 6
Camber compensation deg/m 28 30
Roll centre height mm 70 67.6
Roll centre height migration mm/mm -1.7 -0.55
Bump understeer deg/m 8 8
Anti-Dive N/N 0.1 0.1
Anti-Lift N/N 0.1 0.1
Shock absorber ratio mm/mm 0.7 0.5
Lateral force understeer, 0 mm deg/kN 0.1 0.45
Drive force steer deg/kN 0.0 0.01
Brake force steer deg/kN 0.0 0.01
Rear suspension
Camber compensation deg/m 28 30
Roll centre height mm 80 72.5
Roll centre height migration mm/mm -1.7 -0.55
Bump understeer deg/m 1 1
Antisquat N/N 0.1 0.1
Antilift N/N 0.35 0.25
Shock absorber ratio mm/mm 0.7 0.5
Lateral force understeer, 0 mm deg/kN 0.05 0.012
Drive force oversteer deg/kN 0.1 0.1
Brake force steer deg/kN 0.2 0.1

CHAPTER 4 FULL VEHICLE SIMULATION
60
4. FULL VEHICLE SIMULATION
4.1 Modifications of Suspension for Full
Vehicle Investigation
As the computing time for the complete car simulation turned out to be too long due to more than 240 degrees of freedom in the two leaf springs, a simplified version of the suspension was needed. The concept was changed to a double control arm suspension where the leaf spring is replaced by a simple rod that is attached onto the former leaf spring mounts. As the in-built stabilizer function was lost due to the changes an anti-roll bar at the front and rear is introduced.
It is required that the complex leaf spring model is represented by the simplified model rather accurate. The hub forces and anti-roll bar were tweeked so that the leaf spring model is replaced quite well. The following investigations should demonstrate that the suspension parameters during wheel travel are quite the same for both versions. Differences regarding toe, camber, caster and track width between the previously investigated suspension layout and the modified version for both front and rear axle in the two different load cases tare and laden are shown in this section.
4.1.1 Simplified Version for Front and Rear Suspension
Besides the previously described – and rather complex – version a simplified model of the front and rear suspension was built. In the following the two different models are either called leaf spring versus lower control arm model or advanced versus simplified model.
Figure 55: Simplified version of front suspension including the introduced anti-roll bar.
Figure 55 and figure 56 show the simplified suspension design where the leaf spring is replaced by one lower control arm on each side (blue rods). They are attached at the same mounts using the same bushings on each end as the leaf spring. Basically the shape of the lower knuckle movement projected in the yz-plane changes from an ellipsoid curve to a constant radius circle. Additionally anti-roll bars are installed to imitate the stabilizer function of the replaced leaf spring and the assumed gas spring system. The bushing parameters in the rod ends are the same as for the leaf spring model.

CHAPTER 4 FULL VEHICLE SIMULATION
61
Figure 56: Simplified version of rear suspension including anti-roll bar.
4.1.2 Spring Parameters and Hub Forces
The spring stiffness is transferred into the gas springs and an anti-roll bar is introduced to imitate the natural anti-roll function of the leaf spring. As the leaf springs at the front and rear axle have the same shape and parameters, the only reasonable way to influence the built-in stabilizer effect is possible by reducing the front ARB effect with stiffening the mount’s bushing regarding it’s lateral (vehicle coordinates) movement. For ease of calculation the ARB is attached at the lower gas spring node. The distance between the stabilizer attachments at the chassis bushing to the suspension droplink is the same at front and rear to easily compare the ARB torque.
In order to imitate the hub forces of the complex leaf/gas spring interaction gas springs are created that represent the same hub forces with respect to the wheel travel. The parameters for the replacement spring are shown in figure 57. It is clear that the shape of the replacement springs do not follow natural coil spring or gas spring behavior.
Figure 57: Spring behavior of the replacement spring for the simplified suspension models.
The error between the leaf spring model and simplified control arm model is reduced to a minimum by adapting the replacement gas springs. In the region of ±50 mm wheel travel a maximum deviation of -25 N can be found as shown in Figure 58.
-2
0
2
4
6
8
10
12
-100 -50 0 50 100
Sp
rin
g F
orc
e /
[k
N]
Spring Displacement / [mm]
Spring Force Simplified Model
Front Laden
Front Tare
Rear Tare
Rear Laden

CHAPTER 4 FULL VEHICLE SIMULATION
62
Figure 58: Error of hub forces between advanced and simplified version of the suspension for the different axles and load conditions for ±65 mm wheel travel.
4.1.3 Anti Roll Bar Forces
In order to simulate the built-in stabilizer forces in combination with the anti-roll logic that is integrated into the gas spring, standard ARBs were integrated into the vehicle. In figure 59 the replacement stabilizer parameters are shown.
Figure 59: Stabilizer parameters for the simplified model to imitate the built in anti-roll behavior of the leaf spring model. Front forces are adjusted in order to obtain the desired vehicle roll.
4.1.4 Camber, Caster and Toe Angles
The camber angle for the two different suspension models are very similar in shape and slope as can be seen from figure 60 below. No differences between laden and tare condition were obtained, in general while parallel wheel travel slightly higher offset is detectable. In the region of ±65 mm wheel deflection no greater differences than -0.1 deg resp. +0.35 deg are found. Hence the camber angles between the two suspension models are considered to be equal enough.
-40
-30
-20
-10
0
10
20
-75 -50 -25 0 25 50 75
Off
set
of
Fo
rce
s /
[N ]
Wheel Travel / [mm]
Comparison Hub Forces
Leaf Spring & Simplified Model
Front Tare Front Laden
Rear Tare Rear Laden
y = 153.7x
y = 35.76x - 1E-13
-10000
-5000
0
5000
10000
-50 -30 -10 10 30 50
An
ti R
oll
Ba
r F
orc
e /
[N
]
Wheel Offset / [mm]
Anti-Roll-Bar Forces
FrontRearLinear (Front)Linear (Rear)

CHAPTER 4 FULL VEHICLE SIMULATION
63
Figure 60: Error of camber angle for the two different suspension models during parallel and opposite wheel travel.
The same applies for the difference in caster angle, see figure 61. There is literally no difference between tare and laden state, for parallel wheel travel slightly larger deviation can be found compared to opposite wheel travel. The maximum error between ±65 mm wheel travel ranges from -0.20 deg (-3 %) to 0.5 deg (8 %) at the front axle and can be considered to be insignificant.
Figure 61: Caster angle comparison for the two different suspension models.
The difference in toe is depicted in figure 62.
-0.2
-0.1
0.0
0.1
0.2
0.3
0.4
0.5
-75 -60 -45 -30 -15 0 15 30 45 60 75
Ca
mb
er
Dif
fere
nce
/ [
de
g]
Wheel Travel
Difference in Camber Angle between
Simplified and Advanced Model
Front Parallel
Front Opposite
Rear Parallel
Rear Opposite
-0.4
-0.2
0.0
0.2
0.4
0.6
0.8
-75 -60 -45 -30 -15 0 15 30 45 60 75
Ca
ste
r D
iffe
ren
ce /
[d
eg
]
Wheel Travel / [mm]
Caster Angle Difference between
Simplified and Advanced Model
Front Parallel
Front Opposite
Rear Parallel
Rear Opposite

CHAPTER 4 FULL VEHICLE SIMULATION
64
Figure 62: Toe angle difference for the two different suspension models.
As the main responsible part (leaf spring) was replaced by a rigid connection, the adjustment of toe settings between simplified and advanced suspension model is not easy. Both the track deviation and the influence of the twist of the spring during suspension travel are missing. The tierod hardpoints at the front therefore were adjusted to [-75,-386,-103] for the connection to the steering rack and to [-75,745.9, 95] at the knuckle to avoid very large deflections.
In total the toe angle shows sufficient coherence for the rear axle, where the difference between the models changes almost linear with respect to wheel travel. The deviations for the front axle in parallel travel are more complex as the steering angle changes a lot between the two suspension systems with flexible ellipsoid (leaf spring suspension) and stiff circle (simplified suspension) lower knuckle joint movement. The difference for opposite wheel travel deviates from the parallel, but no difference between tare and laden condition is found. Even though the values do not converge nicely, the results are valued sufficiently accurate whereas no further tuning to the tierod hardpoints of the simplified version is performed.
4.1.5 Track Width
The resulting difference in track width is shown in figure 63. Rather good coherence between the two different suspension models is found, justifying the use of the simplified model with a straight rod instead of the flexible leaf spring. No differences between laden and tare condition are detected. Between opposite and parallel wheel travel a track deviation of max. 0.5 mm can be detected for maximum wheel deflection. The differences between flex rod and leaf spring model are visible but marginally and do not exceed -0.6 mm resp. +1.4 mm in the range of ±65 mm wheel travel.
-0.5
-0.4
-0.3
-0.2
-0.1
0.0
0.1
0.2
0.3
-75 -60 -45 -30 -15 0 15 30 45 60 75
To
e D
iffe
ren
ce /
[d
eg
]
Wheel Travel / [mm]
Toe Angle Difference between
Advanced and Simplified Model
Front Parallel Front Opposite
Rear Parallel Rear Opposite

CHAPTER 4 FULL VEHICLE SIMULATION
65
Figure 63: Error in track travel during vertical wheel travel.
-1.0
-0.5
0.0
0.5
1.0
1.5
-75 -60 -45 -30 -15 0 15 30 45 60 75
Tra
ck d
iffe
ren
ce /
[m
m]
Wheel Travel / [mm]
Track Difference between Advanced and
Simplified Suspension Model
Front Parallel
Front Opposite
Rear Parallel
Rear Opposite

CHAPTER 4 FULL VEHICLE SIMULATION
66
4.2 Maneuvers & Results
It could be shown in the previous section that the differences between the two different Adams/Car models are visible but rather small. In order to be able to simulate the full vehicle it is acceptable that minor deviations between the models exist. As the suspension layout is still at a proposal state where a lot can be changed, adapted and modified it would be possible to adjust the hardpoints of the simple models in a way that the leaf spring model is represented perfectly, which on the other hand is not meeting the expectations of this report.
The full vehicle is simulated using open and closed loop events. Open loop events are such that simulate the vehicle under certain parameters. Hence the output values are a pure result of the parameters that were fed into the simulation. In contradiction to the closed loop events no feedback information is given to the system. The closed loop events engage a driver model that reacts and corrects the vehicle input with delay to maintain predefined requirements. Here the output information (e.g the path) is actually fed back into the input and compared with the desired values. A standard driver model with 0.5 s delay time is used for the closed loop simulations.
In order to obtain basic values of the vehicle in dynamic motion open loop step steer is conducted. Also a constant radius circle test is performed where the speed is rising with maneuver time.
4.2.1 Constant Radius Circle Test
The steering angle over lateral acceleration shown in figure 64 indicates the required steering input to accomplish constant radii under speed sweep. It can be concluded that understeering behavior is found which turns into oversteering behavior at high speeds.
Figure 64: Steering angle over lateral acceleration for different constant radii cornering events
4.2.2 Handling Diagram
The handling diagram gives quite plenty of output information about the vehicles over- and understeering behavior. The results are obtained by evaluating the normalized lateral acceleration with respect to the side slip angle (ideal steering angle minus actual steering angle) at different circle radii and speeds. The constant radius circle maneuver was
-1
0
1
2
3
4
-1.00 -0.80 -0.60 -0.40 -0.20 0.00 0.20
Ste
eri
ng
An
gle
/ [
de
g]
Lateral Acceleration / [g]
Steering Angle
Radius 50
Radius 75
Radius 100

CHAPTER 4 FULL VEHICLE SIMULATION
67
chosen as proper simulation since the constant of wheelbase over radius is used to read the diagram. In figure 65 can be detected that understeering behavior is found for lower lateral accelerations while oversteering at higher lateral accelerations occurs. The former meets the desired requirements for driving stability and safety. The oversteered sections and the rather high slip angles need to be explained in further tests. Stiffening the front ARB was judged to be appropriate attempt to counteract this phenomen, but did not show improvements.
Figure 65: Handling diagram for the full vehicle model at different turning radii
4.2.3 Roll Angle
The roll angle over lateral acceleration is defined as roll stiffness and specified in the vehicle demands, see table 28. As can be seen in figure 66 the resulting roll stiffness ranges in the area of the desired value.
Figure 66: Roll angle over lateral acceleration for the proposed full vehicle model.
0.00
0.20
0.40
0.60
0.80
1.00
-4 -3 -2 -1 0 1
No
rma
lize
d L
ate
ral
Ace
lera
tio
n [
g]
δA - δ / [deg]
Handing Diagram
Radius 50
Radius 75
Radius 100
y = -0.34x + 0.01
-0.70
-0.60
-0.50
-0.40
-0.30
-0.20
-0.10
0.00
0.10
0.00 0.50 1.00 1.50 2.00
Ro
ll A
ng
le /
[d
eg
]
Lateral Acceleration / [m/s²]
Roll Angle
Roll Angle
Linear (Roll Angle)

CHAPTER 4 FULL VEHICLE SIMULATION
68
4.2.4 ISO Lane Change
The ISO-lane change involves a driver model and is performed as closed loop simulation. This represents a driving event which serves as a reference or boundary for realistic maneuvers that can occur on open road and which the car has to deal with. The handling of the vehicle in this respect is visualized in figure 67.
The lane change according to ISO Standards is performed at different speeds. A driver model with 0.5 s preview time ensures that the vehicle follows the designated path. As can be seen in figure 67 the paths for speeds ranging from 35 to 125 km/h do not differ widely. From that can be derived that driving stability is ensured for normal driving conditions. Unstable driving behavior occurs at speeds over 165 km/h which is exceeding the designed maximal velocity of the vehicle.
Figure 67: Path of the ISO lane change at different speeds.
In can be concluded that the ISO lane change is performed with good results. Even at higher speeds there is quite good coherence between the different paths.
-4.0
-3.5
-3.0
-2.5
-2.0
-1.5
-1.0
-0.5
0.0
0 50 100 150 200 250
Pa
th Y
/ [
m]
Path X / [m]
ISO Lane Change
35 km/h 55 km/h
65 km/h 75 km/h
95 km/h 105 km/h
115 km/h 125 km/h

CONCLUSION
69
5. CONCLUSION The evaluation of the taredown data of four medium-class vehicles shows possible weight savings of about 33 %. These weight savings are achieved by replacing conventional link or strut suspension components with a transversal leaf spring as well as increased usage of lightweight materials. The assumed weight savings are based on the investigation of modern suspension component weights and potential investigation of lightweight construction. Most weights are based on racing components, so mechanical weakness is suspended, whereas the reduced service life can be seen as a drawback. For some parts it appeared to be rational not changing the weight economy, i.e. tires and bearings.
The kinematics and compliance of the investigated suspension layout with a transversal leaf spring mounted instead of lower control arms fulfils the defined requirements rather accurate. The evaluation of the design concept and kinematic simulations in Adams/Car proofs compliance with the demanded suspension parameters in sufficient detail. It can be shown that the suspension model works for each axle individually and in interaction with the full vehicle. By adding active ride height control the transversal leaf spring concept is balanced and provides equally well driving behavior despite the load. For the two investigated conditions (tare and fully laden) no exceptional differences can be found. No active toe control is required to meet the vehicle requirements.
The deviations between the simplified suspension for simulation and the leaf spring model are marginally and can be accepted in order to be able to get the full vehicle simulation running. Caster, camber and track deviation are literally the same even the concept designs vary quite significantly.
The vehicle simulations show the behavior of a balanced vehicle. From the handling diagram an understeering behavior is found for low and mid range lateral accelerations. For higher lateral accelerations above 0.8g e.g tight radii or high speeds, oversteering behavior is obtained. Target for future research should be to investigate the root cause of this oversteering tendency and implement countermeasures to obtain safe ride behavior for all lateral accelerations.
However the limitations of the simulation need to be considered and the consistency of the results has to be judged carefully. Numerical and rounding errors cannot be avoided and lead to instabilities while simulating. Even with the simplified suspension layout there are many degrees of freedom that lead to rather high calculation amount. For future research the use of high performance computers is recommended when simulating transversal leaf spring suspension layouts. Also development of a detailed transversal leaf spring model in Adams/Car should be considered.

References
70
REFERENCES 1. Schulze, M. ingenieur.de. [Online] [Cited: October 4th, 2014.] http://www.ingenieur.de/Themen/Produktion/Materialmix-neue-PKW-Modelle-leichter.
2. Schipper, L. Automobile use, fuel economy and CO2 emissions in industrialized countries: Encouraging trends through 2008? Transport Policy. March 2011, Vol. 18, 2, pp. 358-372.
3. Official press release for BMW E92. 05 2006.
4. Official press release for BMW F10. 2010.
5. Reiß, C. Aluminium Messe: Megatrend automobiler Leichtbau – Abspecken dank Aluminium. [Online] Reed Exhibitions Deutschland GmbH, August 14, 2012. [Cited: October 2nd, 2014.] http://www.iw-online.de/dokumente/pdf/FachbeitragAluminium14.08.2012 DruckPDF.pdf.
6. GUSS-NEWS - Informationen zu aktuellen Entwicklungen in der Gießereiindustrie! giesserei.com. [Online] [Cited: September 10th, 2014.] http://www.giesserei.com/news/ disp.php?Pos=2158&ID=ag1dcehasdiloo8g84rg3sljj6.
7. AUTOHAUS online. AUTOHAUS online. autohaus.de: Neuer Mercedes SL mit Alukarosserie. [Online] [Cited: October 4th, 2014.] http://www.autohaus.de/neuer-mercedes-sl-mit-alukarosserie-1082366.html.
8. Beste, D. springerprofessional.de. Springer für Professionals. [Online] 11 09th, 2012. [Cited: August 11th, 2014.] http://www.springerprofessional.de/aluminium-macht-automobil-karriere/3625920.html.
9. THE FUTURE OF URBAN MOBILITY - BMW i. www.bmw.com. [Online] [Cited: September 11th, 2014.] http://www.bmw.com/com/en/insights/corporation /bmwi/concept.html.
10. Mute. mute-automobile.de. [Online] [Cited: September 9th, 2014.] http://www.mute-automobile.de/technik/sicherheitskonzept/aluminium-fahrgastzelle.html.
11. Hufenbach, W. TU Dresden. tu-dresden.de. [Online] [Cited: July 29th, 2014.] http://tu-dresden.de/aktuelles/newsarchiv/2011/8/ineco/newsarticle_view.
12. Kampker, A. RWTH Aachen. rwth-aachen.de. [Online] [Cited: July 9th, 2014.] http://www.rwth-aachen.de/cms/main/root/Die_RWTH/Aktuell/Pressemitteilungen /~beaw/Elektromobilitaet_made_in_Aachen.
13. BMW ETK vers. 2.36. 2013/01/08.
14. Grühsem, S. and Zollino, P. Volkswagen Nachrichten aus der mobilen Zukunft. viavision.org. [Online] [Cited: August 4th, 2014.] http://www.volkswagenag.com/ content/vwcorp/info_center/de/publications/2013/03/Viavision_Nr2.bin.html/binarystorageitem/file/ViaVision_D.pdf.
15. A2Mac1. a2mac1.com. Automotive Benchmarking. [Online] [Cited: Dec 12th, 2014.] http://www.a2mac1.com.
16. Puhn, F. How to make your car handle. s.l. : HP Book, 1976. ISBN 978-0912656465.
17. Beardmore, P. and Johnson, C. F. The Potential for Composites in Structural Automotive. Composites Science and Technology. 26, 1986, pp. 251-281.

References
71
18. Swiss Composite. [Online] [Cited: August 30th, 2014.] http://www.swiss-composite.ch/pdf/i-Werkstoffdaten.pdf.
19. Pahl, H.-J. Luftfedern in Nutzfahrzeugen: Auslegung, Berechnung, Praxis. Dormagen : LFT Luftfedertechnik, 2002.
20. Heacock, F. H. and Jeffrey, H. The Application of Power Assistance to the Steering of Wheeled Vehicles. Proceedings of the Institution of Mechanical Engineers: Automobile Division. January 1953, 7: 69-94.
21. Thomson Linear Motion. [Online] [Cited: October 22nd, 2014.] http://www.thomsonlinear.com/website/com/eng/products/actuators/electrak_10.php.
22. Wheel Weight List. wheelweights.net. [Online] [Cited: August 30th, 2014.] http://www.wheelweights.net/.
23. Zenkert, D. Matrix and Finite Element Methods. 1997, 23.
24. Pacejka, H. B. and Bakker, E. The magic formula tire model. Vehicle System Dynamics: International Journal of Vehicle Mechanics and Mobility. 21, 1992.

APPENDIX VEHICLE SPECIFICATION
APPENDIX - VEHICLE SPECIFICATION
GEOMETRICAL TRANSFER OF HUB FORCES INTO DAMPER/ GAS SPRING
The wheel hub forces are transferred into the air spring via a geometrical transmission factor as shown.
The fraction of wheel movement versus spring deflection for the proposed suspension design varies in this case between 1.34 and 1.71 depending on the actual wheel deflection. All damping and air spring force values have to be multiplied with the square of this factor to obtain right values. Since the factor changes with leaf spring deflection these factors were geometrically evaluated by simulation the Adams model instead of manually calculating it for every 2 mm of wheel travel; resulting in 101 increments between -100 and 100 mm.
The spring stiffness equals
RS0TUVW = RX6CCY ∙ ZWC'* , (12)
respectively the damping coefficients
[\]^0CT = [X6CCY ∙ ZWC'* , (13)
with
ZWC' = _`abccdefghcd_`ijfklmncodcpekqld
. (14)
As the rear suspension follows the same geometric rules as the front suspension, the translation factor is the same for both axes.
Table with detailed scaling factor:
Wheel Travel /
[mm]
Spring Displace-
ment / [mm]
Scaling
Factor
-113.7 -66.7 1.71
-105.9 -62.2 1.70
-98.0 -57.8 1.70
-90.2 -53.3 1.69
-82.4 -48.9 1.68
-74.5 -44.5 1.68
-66.7 -40.0 1.67
-58.8 -35.5 1.66
-51.0 -30.9 1.65
-43.1 -26.3 1.64
-35.3 -21.7 1.63
-27.5 -17.0 1.62
-19.6 -12.2 1.61
-11.8 -7.4 1.60

APPENDIX VEHICLE SPECIFICATION
-3.9 -2.5 1.58
0.0 0.0 1.58
3.9 2.5 1.58
11.8 7.5 1.57
19.6 12.6 1.56
27.5 17.7 1.55
35.3 23.0 1.53
43.1 28.3 1.52
51.0 33.8 1.51
58.8 39.3 1.50
66.7 45.0 1.48
74.5 50.7 1.47
82.4 56.5 1.46
90.2 62.5 1.44
98.0 68.6 1.43
105.9 74.7 1.42
113.7 81.0 1.40

APPENDIX VEHICLE SPECIFICATION
EXCEL MASK FOR GENERATING SPRING FORCES WITH AUTOMATIC INTEGRATION OF THE
GEOMETRICAL FACTOR
Blue Fields: Adjust Parameters/ Text
Spring Creator
-90.5 Free Length / [mm] 269.2 -90.8 Free Length / [mm] 269.2
112.2 112.4
Tare Laden Tare Laden
Gas Spring Rate at Wheels
N/mm 3.5 4.0Gas Spring Rate at Wheels
N/mm 3.0 5.0
Initial Load N 1445 1936 Initial Load N 660.1 2376.6
Max. Deflection /[mm]
FRONT
Min. Deflection /[mm]
Max. Deflection /[mm]
Min. Deflection /[mm]
REAR
$ Spring characteristics forGas Spring Front Tare $ Spring characteristics forGas Spring Front Loaden $ Spring characteristics forGas Spring Rear Tare $ Spring characteristics forGas Spring Rear Loaden
$ version: 6 $ version: 7 $ version: 8 $ version: 8
$ modified by Florian Christ 07 February 2013 $ modified by Florian Christ 07 February 2013 $ modified by Florian Christ 07 February 2013 $ modified by Florian Christ 07 February 2013
$---------------------------------------------------------------------MDI_HEADER$---------------------------------------------------------------------MDI_HEADER$---------------------------------------------------------------------MDI_HEADER$---------------------------------------------------------------------MDI_HEADER
[MDI_HEADER] [MDI_HEADER] [MDI_HEADER] [MDI_HEADER]
FILE_TYPE = 'spr' FILE_TYPE = 'spr' FILE_TYPE = 'spr' FILE_TYPE = 'spr'
FILE_VERSION = 4.0 FILE_VERSION = 4.0 FILE_VERSION = 4.0 FILE_VERSION = 4.0
FILE_FORMAT = 'ASCII' FILE_FORMAT = 'ASCII' FILE_FORMAT = 'ASCII' FILE_FORMAT = 'ASCII'
$--------------------------------------------------------------------------UNITS$--------------------------------------------------------------------------UNITS$--------------------------------------------------------------------------UNITS$--------------------------------------------------------------------------UNITS
[UNITS] [UNITS] [UNITS] [UNITS]
LENGTH = 'mm' LENGTH = 'mm' LENGTH = 'mm' LENGTH = 'mm'
ANGLE = 'degrees' ANGLE = 'degrees' ANGLE = 'degrees' ANGLE = 'degrees'
FORCE = 'newton' FORCE = 'newton' FORCE = 'newton' FORCE = 'newton'
MASS = 'kg' MASS = 'kg' MASS = 'kg' MASS = 'kg'
TIME = 'second' TIME = 'second' TIME = 'second' TIME = 'second'
$--------------------------------------------------------------------SPRING_DATA$--------------------------------------------------------------------SPRING_DATA$--------------------------------------------------------------------SPRING_DATA$--------------------------------------------------------------------SPRING_DATA
[SPRING_DATA] [SPRING_DATA] [SPRING_DATA] [SPRING_DATA]
FREE_LENGTH = 269.2 FREE_LENGTH = 269.2 FREE_LENGTH = 269.2 FREE_LENGTH = 269.2
$ Please note the required preload in Adams/Car has to be /[N]2217.7 $ Please note the required preload in Adams/Car has to be /[N]2970.9 $ Please note the required preload in Adams/Car has to be /[N]1003.2 $ Please note the required preload in Adams/Car has to be /[N]3612.0
$--------------------------------------------------------------------------CURVE$--------------------------------------------------------------------------CURVE$--------------------------------------------------------------------------CURVE$--------------------------------------------------------------------------CURVE
[CURVE] [CURVE] [CURVE] 0.5 [CURVE]
{ disp force} { disp force} { disp force} { disp force}
-90.5 1671.4 -90.5 2346.6 -90.8 650.2 -90.8 3192.8
-86.2 1707.2 -86.2 2387.4 -86.7 675.0 -86.7 3237.1
-82.2 1735.1 -82.2 2419.3 -82.8 693.8 -82.8 3268.4
-78.3 1758.3 -78.3 2445.9 -78.9 709.2 -78.9 3291.9
-74.4 1778.6 -74.4 2469.1 -75.1 722.3 -75.1 3310.3
-70.6 1797.2 -70.6 2490.4 -71.3 734.1 -71.3 3325.3
-66.9 1814.9 -66.9 2510.5 -67.5 745.2 -67.5 3338.1
-63.1 1832.1 -63.1 2530.2 -63.7 755.7 -63.7 3349.4
-59.3 1849.3 -59.3 2549.9 -59.9 766.1 -59.9 3360.0
-55.6 1866.8 -55.6 2569.8 -56.1 776.7 -56.1 3370.1
-51.8 1884.7 -51.8 2590.3 -52.3 787.5 -52.3 3380.4
-48.0 1903.3 -48.0 2611.6 -48.5 798.8 -48.5 3390.9
-44.2 1922.7 -44.2 2633.8 -44.6 810.7 -44.6 3402.1
-40.3 1943.1 -40.3 2657.1 -40.8 823.2 -40.8 3414.1
-36.5 1964.5 -36.5 2681.6 -36.9 836.5 -36.9 3427.1
-32.6 1987.1 -32.6 2707.4 -32.9 850.7 -32.9 3441.2
-28.6 2010.9 -28.6 2734.6 -28.9 865.9 -28.9 3456.7
-24.7 2036.0 -24.7 2763.3 -24.9 882.0 -24.9 3473.7
-20.7 2062.5 -20.7 2793.6 -20.9 899.2 -20.9 3492.2
-16.6 2090.5 -16.6 2825.5 -16.8 917.6 -16.8 3512.4
-12.5 2119.9 -12.5 2859.1 -12.7 937.1 -12.7 3534.4
-8.4 2150.9 -8.4 2894.5 -8.5 957.9 -8.5 3558.3
-4.2 2183.5 -4.2 2931.8 -4.3 979.9 -4.3 3584.2
0.0 2217.7 0.0 2970.9 0.0 1003.2 0.0 3612.0
4.3 2253.5 4.3 3011.9 4.3 1028.0 4.3 3642.5
8.6 2291.1 8.6 3054.8 8.7 1054.0 8.7 3675.7
13.0 2330.5 13.0 3099.8 13.1 1081.5 13.1 3711.9
17.4 2371.6 17.4 3146.8 17.6 1110.4 17.6 3751.2
21.9 2414.5 21.9 3195.8 22.1 1140.7 22.1 3793.7
26.5 2459.2 26.5 3246.9 26.7 1172.6 26.7 3839.2
31.1 2505.8 31.1 3300.1 31.3 1205.9 31.3 3888.0
35.7 2554.1 35.7 3355.4 36.0 1240.7 36.0 3940.1
40.5 2604.3 40.5 3412.8 40.8 1277.0 40.8 3995.4
45.3 2656.4 45.3 3472.2 45.6 1314.8 45.6 4054.0
50.1 2710.2 50.1 3533.7 50.5 1354.2 50.5 4115.8
55.0 2765.7 55.0 3597.2 55.5 1394.9 55.5 4180.9
60.0 2823.0 60.0 3662.7 60.5 1437.1 60.5 4249.2
65.1 2881.8 65.1 3729.9 65.5 1480.7 65.5 4320.7
70.2 2942.2 70.2 3798.9 70.7 1525.6 70.7 4395.2
75.4 3004.0 75.4 3869.5 75.8 1571.7 75.8 4472.6
80.6 3066.9 80.6 3941.5 81.1 1618.9 81.1 4552.7
85.8 3130.8 85.8 4014.5 86.3 1667.1 86.3 4635.3
91.1 3195.4 91.1 4088.2 91.6 1715.9 91.6 4719.9
96.4 3260.1 96.4 4162.2 96.9 1765.2 96.9 4806.1
101.7 3324.6 101.7 4235.9 102.1 1814.5 102.1 4893.3
107.0 3388.0 107.0 4308.4 107.3 1863.3 107.3 4980.6
112.2 3449.3 112.2 4378.4 112.4 1910.9 112.4 5066.7