
1 Bacterial Suspension Cultures - Wiley-VCH
54
1 Bacterial Suspension Cultures Patrick Sagmeister, Mohammadhadi Jazini, Joachim Klein, and Christoph Herwig Abstract Bacteria became the primary workhorses of the biotechnology industry due to fast growth on inexpensive media, well understood genetics, and an advanced genetic engineering toolset. This chapter provides a thorough basis for biopro- cess and bioreactor design of cultivating bacteria in industrial scale suspension culture. First, an overview of the product spectrum produced by bacteria is pre- sented. Thereafter, industrial expression technologies and strain engineering aspects are discussed with special attention on plasmid stability and predict- ability of product titers to large scale. Subsequently, bioprocessing strategies for bacteria in suspension culture are discussed, focusing on the production of recombinant products in fed-batch mode. As discussed, bioprocess design has to consider technical constraints as well as physiological constraints of the cell. Based on this, a detailed roadmap for the design of a bacterial bioprocess is provided. Subsequently, insight into bioreactor design, engineering, and instru- mentation is given, discussing stirred-tank bioreactors, for multi-use and for single use purposes. The chapter finishes with a discussion of regulatory aspects (quality by design) as well as industrial scale economic aspects. The sections on bioreactor design and “quality by design” should also be regarded as valid for the entire book. 1.1 Introduction Heterotrophic bacteria are those bacteria that use organic carbon-containing com- pounds as sources of carbon and energy. Many bacteria in this category are able to produce valuable bioproducts; hence, they play an important role in modern man- ufacturing. The focus of this chapter is the cultivation of such bacteria in suspen- sion culture. These cultures have been implemented widely in commercial production of many bioproducts. This chapter concentrates on practical and 41 Industrial Scale Suspension Culture of Living Cells, First Edition. Edited by Hans-Peter Meyer and Diego R. Schmidhalter. Ó 2014 Wiley-VCH Verlag GmbH & Co. KGaA. Published 2014 by Wiley-VCH Verlag GmbH & Co. KGaA.
-
Upload
khangminh22 -
Category
Documents
-
view
1 -
download
0
Transcript of 1 Bacterial Suspension Cultures - Wiley-VCH

1Bacterial Suspension CulturesPatrick Sagmeister, Mohammadhadi Jazini, Joachim Klein, and Christoph Herwig
Abstract
Bacteria became the primary workhorses of the biotechnology industry due tofast growth on inexpensive media, well understood genetics, and an advancedgenetic engineering toolset. This chapter provides a thorough basis for biopro-cess and bioreactor design of cultivating bacteria in industrial scale suspensionculture. First, an overview of the product spectrum produced by bacteria is pre-sented. Thereafter, industrial expression technologies and strain engineeringaspects are discussed with special attention on plasmid stability and predict-ability of product titers to large scale. Subsequently, bioprocessing strategiesfor bacteria in suspension culture are discussed, focusing on the production ofrecombinant products in fed-batch mode. As discussed, bioprocess design hasto consider technical constraints as well as physiological constraints of the cell.Based on this, a detailed roadmap for the design of a bacterial bioprocess isprovided. Subsequently, insight into bioreactor design, engineering, and instru-mentation is given, discussing stirred-tank bioreactors, for multi-use and forsingle use purposes. The chapter finishes with a discussion of regulatoryaspects (quality by design) as well as industrial scale economic aspects. Thesections on bioreactor design and “quality by design” should also be regardedas valid for the entire book.
1.1Introduction
Heterotrophic bacteria are those bacteria that use organic carbon-containing com-pounds as sources of carbon and energy. Many bacteria in this category are able toproduce valuable bioproducts; hence, they play an important role in modern man-ufacturing. The focus of this chapter is the cultivation of such bacteria in suspen-sion culture. These cultures have been implemented widely in commercialproduction of many bioproducts. This chapter concentrates on practical and
41
Industrial Scale Suspension Culture of Living Cells, First Edition.Edited by Hans-Peter Meyer and Diego R. Schmidhalter.� 2014 Wiley-VCH Verlag GmbH & Co. KGaA. Published 2014 by Wiley-VCH Verlag GmbH & Co. KGaA.

industrial aspects of the process and reactor design for the cultivation of heterotro-phic bacteria, and the authors expect the reader to have enough scientific back-ground about microbial systems.
In this chapter, first, a thorough review of bacterial products is presented(Section 1.2). Among all products, the one that has the most promising and thriv-ing market is introduced. Recombinant therapeutics, specifically fragmentantigen-bindings, were found to be a fast-growing market. Subsequently, indus-trial aspects of bacterial expression systems, especially those dealing with theproduction of recombinant therapeutics, are discussed. Section 1.3 explainsbioprocess design aspects such as technical and physiological constraints and cul-tivation strategy. Section 1.4 gives insight into the bioreactor design, engineering,and instrumentation. This section serves as a general basis for the design of bio-reactors for cultivation of not only bacteria but also yeasts. Single-use bioreactorsare covered in Section 1.5. Various regulatory aspects of microbial systems andkey economic parameters are discussed in Sections 1.6 and 1.7, respectively.
1.2Organisms, Cells, and their Products
1.2.1Bacteria as Production Platform for Various Products
Bacteria are a very large and diverse group of unicellular organisms. These orga-nisms are a few micrometers long, do not possess a nucleus, and are found inevery habitat of the earth. Bacteria as production platforms provide many advan-tages that make them popular. Their molecular biology is well understood. Theygrow rapidly on inexpensive media and their characterization is straightforward.Considering recombinant DNA technology, the construction of bacterial vectors isrelatively easy and common bacterial expression platforms profit from an estab-lished regulatory track record [1].
A wide variety of products are produced by bacteria. They are extensively used inwhite, red and green biotechnology markets. Many of these products, amongthem amino acids, solvents, vitamins, and antibiotics, are synthesized naturally.Nevertheless, the invention of recombinant technology facilitated the productionof those products that are not synthesized naturally. Recombinant proteins andpDNA are representative for this category. Hence, all bacterial products can beroughly classified into natural and recombinant products (Table 1.1). Of course,natural products are also boosted in productivity via genetically engineered path-ways. Depending on the application field and purpose of use, they are producedin different amounts with varying added-value. The production efficiencies of nat-ural products can be greatly enhanced through metabolic pathway engineering.Most of the native products are produced in large quantities while recombinantproducts are produced in low kilogram ranges. Typically, compounds with applica-tions in the field of red biotechnology are high value, low volume products.
42 1 Bacterial Suspension Cultures
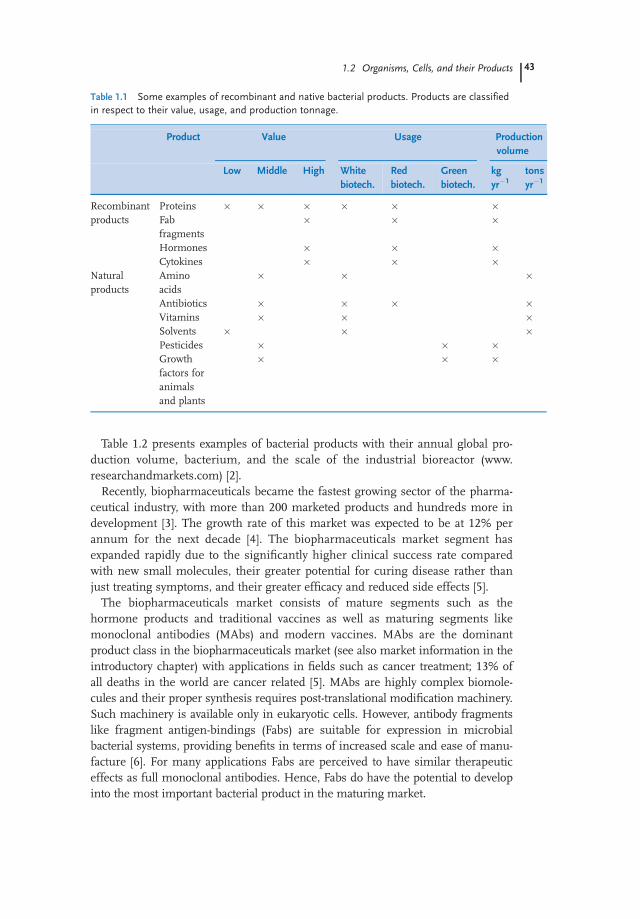
Table 1.2 presents examples of bacterial products with their annual global pro-duction volume, bacterium, and the scale of the industrial bioreactor (www.researchandmarkets.com) [2].
Recently, biopharmaceuticals became the fastest growing sector of the pharma-ceutical industry, with more than 200 marketed products and hundreds more indevelopment [3]. The growth rate of this market was expected to be at 12% perannum for the next decade [4]. The biopharmaceuticals market segment hasexpanded rapidly due to the significantly higher clinical success rate comparedwith new small molecules, their greater potential for curing disease rather thanjust treating symptoms, and their greater efficacy and reduced side effects [5].
The biopharmaceuticals market consists of mature segments such as thehormone products and traditional vaccines as well as maturing segments likemonoclonal antibodies (MAbs) and modern vaccines. MAbs are the dominantproduct class in the biopharmaceuticals market (see also market information in theintroductory chapter) with applications in fields such as cancer treatment; 13% ofall deaths in the world are cancer related [5]. MAbs are highly complex biomole-cules and their proper synthesis requires post-translational modification machinery.Such machinery is available only in eukaryotic cells. However, antibody fragmentslike fragment antigen-bindings (Fabs) are suitable for expression in microbialbacterial systems, providing benefits in terms of increased scale and ease of manu-facture [6]. For many applications Fabs are perceived to have similar therapeuticeffects as full monoclonal antibodies. Hence, Fabs do have the potential to developinto the most important bacterial product in the maturing market.
Table 1.1 Some examples of recombinant and native bacterial products. Products are classifiedin respect to their value, usage, and production tonnage.
Product Value Usage Productionvolume
Low Middle High Whitebiotech.
Redbiotech.
Greenbiotech.
kgyr�1
tonsyr�1
Recombinantproducts
Proteins � � � � � �Fabfragments
� � �
Hormones � � �Cytokines � � �
Naturalproducts
Aminoacids
� � �
Antibiotics � � � �Vitamins � � �Solvents � � �Pesticides � � �Growthfactors foranimalsand plants
� � �
1.2 Organisms, Cells, and their Products 43

The most common bacterial host, which is widely used as production platformfor the production of Fabs and other biopharmaceuticals, is Escherichia coli. Hence,in the following, key aspects of this bacterial expression system is discussed.
1.2.2Historical Outline for Escherichia coli
The relevance of bacteria for the development of modern life-sciences and the bio-tech industry is extraordinary. Escherichia coli, a rod shaped Gram negative intesti-nal bacterium, is the most important model organism for microbiology, genetechnology, and biotechnology. Major scientific achievements such as bacterialconjugation, topography of gene structure as well as transformation, wereobtained from studies on the bacterium E. coli [7–9]. These findings paved theway to modern genetic engineering, which enabled efficient production of indus-trial and pharmaceutical proteins through the use of recombinant DNA technol-ogy. The introduction of recombinant DNA technology can be regarded as aquantum leap for the whole biotechnology industry. Its role as an omnipresentcompanion of biotechnology related research made E. coli a well-characterizedorganism. Access to a wealth of strain-specific information including a fullysequenced genome has obvious advantages. Furthermore, E. coli is outstandingregarding growth rate, safety, ease of cultivation due to simple nutritional demandand suitability for high-density cultivation, and the availability of a large tool box ofgenetic techniques for genome modification [1,10–12]. Nowadays, E. coli serves asa host organism for the industrial production of various recombinant proteins,
Table 1.2 Some examples of bulk chemicals, their production volume, and the respectivebacterial host.
Bioproduct Product category Bacteria Annualproduction(tons yr�1)
Bioreactorscale(m3)a)
L-Glutamic acid Native product(primary metabolite)
Brevibacteriumspecies
1 600 000 50–500
L-Lysine-HCL Native product(primary metabolite)
Brevibacteriumlactofermentum
850 000 50–500
Vitamin C Native product(primary metabolite)
Gluconobacteroxydans
107 000 50–500
Monensin Native product(secondary metabolite)
Streptomycescinnamonensis
>3000 50–500
a-Amylase Recombinant product Bacillus subtilis 26 000(only inChina)
50–500
Recombinant proteinsfor medical purposes
Recombinant product Escherichia coli 10–100 kg 0.05–15
a) The size of the reactors depends on the plant capacity. However, bioreactors as large as somehundreds of cubic meters are common.
44 1 Bacterial Suspension Cultures

including insulin, b-interferon, and numerous technical enzymes. Most microbialrecombinant proteins are still produced in E. coli, although recombinant expres-sion in other organisms such as other bacterial platforms, yeast, and fungi wasproven to be applicable in an industrial context.
1.2.3Industrial Aspects of Bacterial Expression Systems
For successful process development, the key aspects given in Table 1.3 need to beaddressed in the early phases of a strain development program. These key aspectsare discussed in more detail in the subsequent sections.
Sufficient Productivity, a Prerequisite for Commercial Success The choice of theproduction strain background is essential since different hosts and expression sys-tems solve different challenges. For simple monomeric proteins with no solubilityissues E. coli is good to go. E. coli is still the main workhorse, producing nearly70% of all commercial microbial recombinant proteins.
Nevertheless, at least for the time being, the huge diversity of proteins thatnature invented cannot be produced by a single expression technology. No singlestrain or vector is capable of being the best expression option for all types of bio-pharmaceuticals. No one system fits all of the target molecules (Table 1.4).
Solubility, Inclusion Body-Free Processes for Higher Yields and Simple DSP In prin-ciple, positively and negatively regulated inducible expression systems can beused. The induction kinetics of positively regulated systems (using e.g. promotersof the arabinose, rhamnose, and melibiose catabolic operons) is completely differ-ent from negatively regulated expression systems using e.g. the T5, T7, lac or tacpromoters which are induced by IPTG or lactose. The maximum product amountusing negatively regulated systems is already detectable a few hours after induc-tion start, in contrast to positively regulated systems in which the product peak isdetectable after more than 8 h of induction. A slow induction kinetics favors the
Table 1.3 Industrial key aspects for the use of bacterial expression systems.
Aspect Goals
Productivity >15 g l�1 for proteins as inclusion bodies;a)
>5 g l�1 for simple monomeric proteins;>0.5 g l�1 for more complex proteins such as heterodimers
Solubility Inclusion body-free processes for higher yields, reliable, simple DSP, and norefolding tanks
Stability Genetic stability of host and plasmid (both segregational and structural) tosupport reliable, predictable, and scalable high cell density cultivation
Scalability Predictable to large scaleSpeed Short development times to identify the best production clone and suitable
process within a few weeks
a) Inclusion bodies: insoluble protein aggregates. To obtain the protein in active form, additionalsteps in downstream processing are necessary (Section 1.3.3).
1.2 Organisms, Cells, and their Products 45

formation of soluble, functional target protein, especially for periplasmic produc-tion. IPTG-induced negatively regulated systems may overload the secretionmachinery and the periplasmic space with very high target protein amounts lead-ing to aggregation and solubility issues.
In addition, IPTG-induced promoters are not tightly controlled; the non-inducedpromoter activity is much higher compared to positively regulated systems, lead-ing to product accumulation in the absence of IPTG. Already at very low IPTGconcentrations the promoter is fully active and therefore makes promoter tuningvery difficult or even impossible. However, process technological approachesaimed at promoter tuning using IPTG induced promoters have been reported [13].
In contrast, the transcriptional activity of the rhamnose promoter is very low inthe absence of L-rhamnose, enabling easy plasmid construction and clone selec-tion for proteins that interfere with the cell metabolism and are therefore toxic[14]. Transcription is activated by two regulators, RhaR and RhaS, which interactwith rhamnose. Activated rhaR enables its own transcription as well as that ofRhaS, which positively regulates the transcription from the rhamnose promoter.
Recently, a process technological method that allows tunable recombinant pro-tein expression using the pBAD promoter via simultaneous feeding of D-glucoseand L-arabinose was reported [15]. The method aims to achieve high product titersthrough moderate long-term expression of recombinant product.
Owing to low titer, solubility, or impurity issues (such as endotoxin), E. colimight not always be a suitable host. Then, alternative microbial expression sys-tems need to be evaluated (Table 1.4) such as Bacillus subtilis or also yeast such as
Table 1.4 Commercial bacterial expression systems.
Host Trade name Company
Escherichia coli pAVEway Fujifilm Diosynth BiotechnologiesT7 Brookhaven National LaboratoryXS LonzaESETEC Wacker ChemieBioXcellence Boehringer IngelheimNAFT system SandozPlugBug DSM
GenentechpBAD Life Technologies
Pseudomonas fluorescens Pfenex PfenexCorynebacterium glutamicum Corynex AjinomotoBacillus subtilis MoBiTec
TakaraXS Lonza
DSMBacillus brevis Itoham FoodsBacillus megaterium MoBiTecLactococcus lactis NICE MoBiTec (NIZO food research)Brevibacillus choshinensis Takara
46 1 Bacterial Suspension Cultures

Pichia pastoris. It does make sense to cover a broader phylogenetic spectrum ofmicrobial hosts (Gram negative, lower eukaryote, Gram positive) to identify viablemicrobial production systems for every single protein of interest. Real secretionhosts such as B. subtilis are very useful as they accumulate the target protein inthe culture supernatant, which therefore sometimes circumvents solubility issueswhich may appear for periplasmic production in E. coli. In addition, cell-freemedium with reasonable product titers is the perfect starting point for simple andsuccessful downstream process development.
Genetic Stability of Host and Plasmid to Support Reliable, Predictable and ScalableHigh Cell Density Fermentation A common problem of state-of-the-art bacterialexpression technology is host and plasmid instability. For example, the frequentlyused T7 expression system suffers from three major issues:
1) commonly used production strains contain prophages;2) related host instability [16];3) segregational and structural plasmid instability.
BL21 and its recA mutant BLR are very popular E. coli host strains, which areavailable as lDE3 lysogens called BL21(DE3) and BLR(DE3). A lytic cycle of lDE3can be induced by stress. Though a rare event, spontaneous induction of lamb-doid prophages under process conditions is described in literature [17]. For thisreason, it is assumed that any culture broth derived from a prophage containingE. coli contains a certain number of phages even under standard process condi-tions. Fortunately, due to the immunity phenomenon, a released free phage doesnot affect its lysogenic host, but, nevertheless, phage release and contamination isa large-scale issue for multipurpose plants with changing production hosts andneeds to be addressed carefully.
Figure 1.1 illustrates host instability in the framework of a use test as part of acell banking procedure. The cultures were inoculated from the correspondingglycerol stocks from the state-of-the-art host/plasmid combination (BLR(DE3)), astable production strain and a reference culture from a freshly transformed strain.The cultures were induced and samples collected and analyzed by SDS-PAGE(sodium dodecyl sulfate polyacrylamide gel electrophoresis). For the commercialT7 system a reduced productivity is visible for the master cell cultures and noproduct at all with working cell cultures. The genetically stable host/plasmid com-bination always delivers the same product amount, which is the optimal startingpoint for the development of a robust production process. Sequencing of thegenomic DNA of non-producing BLR (DE3) revealed that the T7 polymerase istruncated, thus eliminating or reducing the T7 polymerase activity, which ulti-mately reduces or eliminates the target protein yield.
Figure 1.2a addresses plasmid stability. Although all strains look good in earlystrain development, cultivation data show that the strains are not equally usablefor upscaling purposes. Fed-batch cultivations (1 L multiple bioreactors) using astate-of-the-art host/plasmid combination were compared with the first- and
1.2 Organisms, Cells, and their Products 47

second-generation and newly developed genetically stable host/plasmid combina-tions. The first-generation plasmid carries a multimer resolution site (Cer) and thesecond-generation host/plasmid combination stabilizes the plasmid via an auxo-trophic marker. Segregational plasmid stability was tested before and after induc-tion. The commercial expression system showed plasmid instability even beforeinduction and after induction nearly all plasmids were lost (4% plasmid contain-ing cells). Compared to that, the new expression system stably maintains the plas-mid throughout the whole cultivation process. A productive and genetically stableproduction strain is the foundation of a robust and reliable production process.
Figure 1.2b addresses plasmid stability in the case of very difficult to produceproducts under production conditions with very high selection pressure (1 l multi-ple bioreactor experiments). The producing cells have massive growth limitations(Figure 1.2b) and plasmids are therefore lost very early. In this case 100% plasmidstability is an absolute requirement for production of the desired product. A 100%plasmid retention also offers the possibility of an extended induction time andtherefore further potential to improve the titer. On top of that the system alsoguarantees plasmid retention during master cell banking. Hence, 100% plasmidstability is the foundation of a consistent, reliable, and scalable process.
Scalability, Predictable to Large Scale Scalability means that the results fromearly strain screening through process development can be translated into laterproduction scale. That means for strain development that the specific
Figure 1.1 Host instability in the framework ofa use test as part of the cell banking procedure.The master and working cell cultures (MCC,WCC) were inoculated from the correspondingglycerol stocks from the state-of-the-art host/plasmid combination (BLR (DE3)), the
genetically stable host/plasmid combination(strain W3110 with an expression plasmidusing a rhamnose inducible promoter), and areference culture from a freshly transformedstrain. The cultures were induced, samples col-lected and analyzed by SDS-PAGE.
48 1 Bacterial Suspension Cultures

Figure 1.2 (a) Fed-batch fermentation with anopen access host/plasmid combination com-pared to the first and second generation of anewly developed stabilized host/plasmid com-bination. Segregational plasmid stability wastested before and during induction. (b) Fed-
batch fermentation with a non-stabilized andthree stabilized host/plasmid combinations fora very difficult to produce product and underproduction conditions with very high selectionpressure (1-l multiple bioreactor experiments).Segregational plasmid stability was tested.
1.2 Organisms, Cells, and their Products 49

productivities need to be in a similar range and predictable to a certain extent.Figure 1.3a shows a comparison of specific product titer (mg l�1 OD�1) of 13different proteins in a shake flask compared to 10-l fed-batch bioreactor. It is acollection of productivities throughout various protein classes, reflecting apretty good alignment between shake flask (batch) and 10-l cultivation (fed-batch). Figure 1.3b shows how 10-l fed-batch translates to large scale (1000 or15 000 l). A comparison of specific titer (mg l�1 OD�1) of two different proteinsin 10-l high cell density cultivation and large-scale high cell density cultivation(y-axis) is shown. The data show good alignment between 10 l and at-scale pro-cess (1000 l, 15 000 l), independent of the protein class for a large number ofbatches.
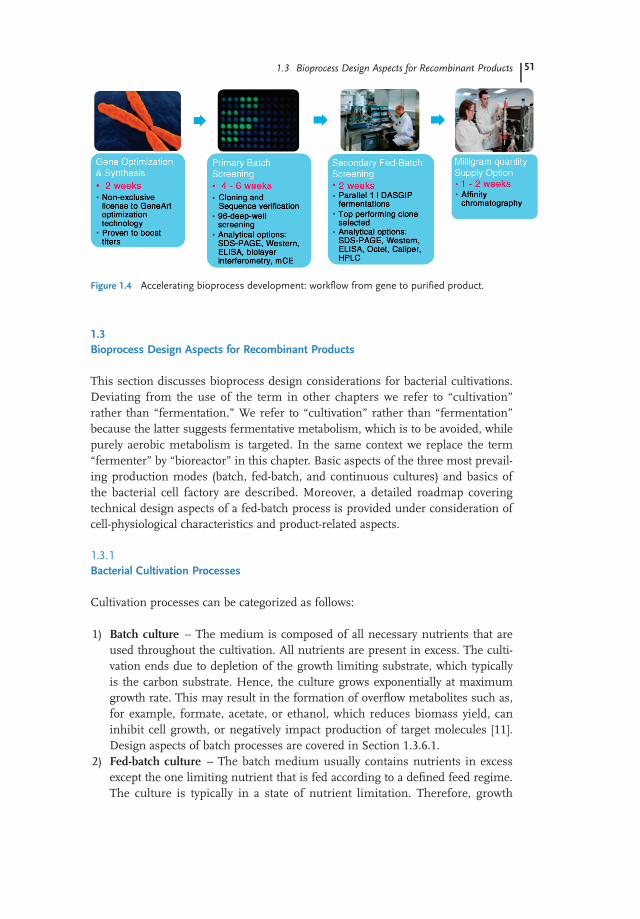
Speed, Short Development Times to Identify the Best Production Clone Within aFew Weeks The major challenge in industrial strain development is the limitedtime. Most strain development programs are part of a process development pro-gram that itself is under immense time pressure. A typical industrial strain devel-opment feasibility study covers gene optimization and synthesis, primary batchscreening in 96/24-well format, including basic analytics (Figure 1.4), secondaryfed-batch cultivation runs to verify the early batch screening, and, sometimes, pro-tein supply for first functional assays (Figure 1.4). Gene synthesis might be atime-critical factor since the time for gene synthesis is dependent on gene length,complexity (such as repetitive sequences), and GC content. Sometimes, requestedsequences are found to be toxic and/or genetically unstable. Hence, a reasonabledevelopment time from gene synthesis to non-GMP product material supply ofaround 10–12 weeks can be achieved.
Figure 1.3 Scalability from shake flask to 1000 l and 15000 l. (a) Shake flask to 10 l; (b) 10 l to1000 l and 15 000 l.
50 1 Bacterial Suspension Cultures
1.3Bioprocess Design Aspects for Recombinant Products
This section discusses bioprocess design considerations for bacterial cultivations.Deviating from the use of the term in other chapters we refer to “cultivation”rather than “fermentation.” We refer to “cultivation” rather than “fermentation”because the latter suggests fermentative metabolism, which is to be avoided, whilepurely aerobic metabolism is targeted. In the same context we replace the term“fermenter” by “bioreactor” in this chapter. Basic aspects of the three most prevail-ing production modes (batch, fed-batch, and continuous cultures) and basics ofthe bacterial cell factory are described. Moreover, a detailed roadmap coveringtechnical design aspects of a fed-batch process is provided under consideration ofcell-physiological characteristics and product-related aspects.
1.3.1Bacterial Cultivation Processes
Cultivation processes can be categorized as follows:
1) Batch culture – The medium is composed of all necessary nutrients that areused throughout the cultivation. All nutrients are present in excess. The culti-vation ends due to depletion of the growth limiting substrate, which typicallyis the carbon substrate. Hence, the culture grows exponentially at maximumgrowth rate. This may result in the formation of overflow metabolites such as,for example, formate, acetate, or ethanol, which reduces biomass yield, caninhibit cell growth, or negatively impact production of target molecules [11].Design aspects of batch processes are covered in Section 1.3.6.1.
2) Fed-batch culture – The batch medium usually contains nutrients in excessexcept the one limiting nutrient that is fed according to a defined feed regime.The culture is typically in a state of nutrient limitation. Therefore, growth
Figure 1.4 Accelerating bioprocess development: workflow from gene to purified product.
1.3 Bioprocess Design Aspects for Recombinant Products 51

kinetics are controlled by the addition of the growth limiting substrate. Apply-ing an exponential feeding profile allows for control of the specific growth rateat a constant rate. Preferentially, growth rates are chosen such that the forma-tion of overflow metabolites is avoided. Design aspects of fed-batch processesare covered in Section 1.3.6.3.
3) Continuous culture – Continuous cultures are characterized by controlledinflow (Fin) of nutrients and outflow of culture broth (Fout) with Fin equal toFout. The dilution rate D (D¼ F/V¼ m) controls growth kinetics. More specifi-cally, it controls the growth rate as D equals the specific growth rate m. Steadystates are typically achieved after five residence times.
1.3.2Gram Negative Cell Factory: Cellular Compartments and Transport across Membranes
Transcription and translation of the gene product takes place in the bacterial cyto-plasm. Several features, such as the presence of protein folding modulators (chap-erones) and favorable pH conditions, make the bacterial cytoplasm an idealcompartment for the folding of recombinant proteins. Chaperons are special pro-teins that assist folding of polypeptides. The pH is maintained actively at 7.2–7.8through “pH homeostasis” [18]. However, not every desired protein can be func-tionally produced in the bacterial cytoplasm. Some proteins require post-transla-tional modifications to gain full functionality. Escherichia coli does not provide thecapability for post-translational modifications. Furthermore, the formation ofdisulfide bridges is hampered in the reductive environment of the bacterialcytosol.
The space between the inner and outer membrane of Gram negative bacteria isreferred to as “periplasmic space” (Figure 1.5). Unlike the cytoplasmic space, pH
Figure 1.5 Compartments of a Gram negative cell factory.
52 1 Bacterial Suspension Cultures

and osmolarity of this compartment are less well maintained [19]. However, theperiplasm features the “disulfide bond formation system” (Dsb system), enzy-matic machinery capable of forming and isomerizing disulfide bonds and there-fore modulating the correct folding of proteins which contain structural disulfidebonds [20]. This opens up the possibility to produce active and correctly foldedrecombinant proteins containing disulfide bonds in bacteria. However, as tran-scription and translation of the recombinant gene product takes place in the cyto-plasm, translocation of the polypeptide across the inner membrane to theperiplasmic space is necessary. Translocation can be enabled by the general secre-tory pathway (GSP). Transport across the inner membrane is targeted via a signal-ing sequence, which is cleaved off during translocation [21]. In the periplasmicspace the protein folds into its native conformation. The twin-arginine trans-location (TAT) pathway constitutes an alternative translocation pathway [22]. Incontrast to the GSP, the protein correctly folds in the cytoplasm and is translo-cated in its native correctly folded state.
Targeting proteins into the extracellular space is referred to as protein secretion.Following transcription and translation in the cytoplasm, the protein has to bemoved across the inner and outer membrane to be secreted into the extracellularspace. While targeting of recombinant proteins into the periplasm to achieveactive disulfide bridge formation is already established for commercial processes,secretory production is considered more challenging. However, promising com-mercial technologies are emerging such as the Wacker ESETEC� technology. Gen-eral strategies for secretory production of recombinant proteins are (i) targeting ofthe recombinant protein to the periplasmic space and subsequent targeting to theextracellular space (two-step translocation) and (ii) the use of transport proteinsmediating the transport across inner and outer membrane simultaneously(one-step translocation) [10,23]. Furthermore, approaches involving the co-expression of bacteriocin release proteins are reported [24,25]. Process technologi-cal approaches to increase recombinant protein release have been recentlyreported [26].
1.3.3Industrial Strategies: Quality, Folding State, and Location of RecombinantProtein Products
Folding state and product location have a big impact on type and number ofrequired downstream processing operations and consequently on overall processeconomics. Industrial strategies are (i) soluble extracellular production of recombi-nant products, (ii) soluble intracellular production of recombinant products (withdisulfide bonds in periplasm, without disulfide bonds in cytoplasm), and (iii) pro-duction of recombinant proteins as insoluble aggregates known as an “inclusionbody” (IB), located in the cytoplasm (Figure 1.6).
Ideally, active soluble target protein is secreted selectively by recombinant bacte-ria to the extracellular space requiring solely separation of soluble product andbiomass by means of centrifugation. This way steps such as cell rupture can be
1.3 Bioprocess Design Aspects for Recombinant Products 53

avoided [24]. However, secretory production is still highly challenging and extrac-ellular protein yields are not yet satisfactory.
Some proteins tend to form insoluble and typically activity restricted aggregatesreferred to as inclusion bodies. Physical and structural characteristics of inclusionbodies can differ strongly depending on the target protein and cultivation condi-tions [27,28]. Typical measures aiming to reduce the extent of inclusion body for-mation and driving a process towards formation of soluble target protein are (i)lowering cultivation temperature and (ii) using weak expression systems, whichallow tuning of production kinetics. However, the success of these measures ishighly dependent upon the characteristics of the protein product.
Obviously, the same measures are used to promote inclusion body formation asit may be, for example, desirable for the synthesis of proteins that are toxic to theproduction organism. Recombinant proteins present as inclusion bodies are oftenhighly pure and can be obtained at high titers. However, achieving the native,active protein conformation demands protein refolding, which is typically carried
Figure 1.6 Impact of upstream product foldingstate on downstream process complexity. Pro-tein location (intracellular, periplasm or cell-free medium) and protein solubility determinetype and number of unit operations requiredfor obtaining a cell free solution of the func-tional active protein. Sometimes, conversely tothe above scheme, inclusion body processes
are designed such that solubilized protein ispre-purified through a chromatography stepprior to refolding. Ultrafiltration steps are usedfor broth concentration. Diafiltration steps areused to change buffer characteristics asrequired for refolding and chromatographicpurification steps.
54 1 Bacterial Suspension Cultures

out via highly diluted batch-, fed-batch, or continuous processes, resulting in largeprocess volumes. For more information on inclusion body processing see Refer-ences [29,30], for process technology aspects of continuous refolding processessee Reference [31]. Although integration of elaborate refolding steps in the down-stream process is required, inclusion body processes may represent the most eco-nomical way of processing for a given recombinant protein product. Host-cellproteins encapsulated in recombinant inclusion bodies can negatively impactrefolding yields [32]. Therefore, implementing chromatographic steps prior toinclusion body refolding can be beneficial [33].
1.3.4Approaches towards Bioprocess Design, Optimization, and Manufacturing
Bioprocess development aims to investigate the relationship between productquality and performance attributes, typically via targeted experimentation in labo-ratory-scale bioreactors. Simplistically speaking, experiments are carried out, vary-ing set-points of process parameters (e.g., temperature, pH, feeding strategy). As aresult, product as well as process related variables (concentration of product, for-mation of carbon dioxide) are measured (Figure 1.7). Using inverse analysis, therelationship between process parameters (e.g., cultivation temperature) and pro-cess variables (e.g., product titer) can be explored for the benefit of increased pro-cess understanding, process optimization, establishment of process models, andthe development of process control strategies. In subsequent manufacturing, theestablished process knowledge can be exploited for maintaining consistent
Figure 1.7 Approaches towards bioprocess design/optimization and manufacturing.
1.3 Bioprocess Design Aspects for Recombinant Products 55

product quality and optimal productivity as well as to reduce process failures (pre-dictive bioprocessing).
1.3.5Bacterial Bioprocess Design
1.3.5.1 Technical and Physiological Constraints for Bacterial Bioprocess DesignThe following section describes general bioprocess design aspects for the designof scalable, industrial bioprocesses. Generally speaking, bioprocess design aims atsetting of optimal process parameters for optimal growth and product formationconditions, including (i) control of optimal pH value, (ii) control of optimal tem-perature, (iii) supply of sufficient nutrients, and (iv) supply of sufficient oxygen.
Control of pH and temperature is typically performed using the simple propor-tional integral (PI) controllers implemented in every commercially available labo-ratory or industrial scale bioreactor and is not considered further in this chapter.However, sufficient supply of oxygen (oxygen transfer from gaseous phase into thecultivation broth) needs to be considered during basic process design. Processeswith expected oxygen uptake rates (OURs) exceeding the maximum oxygen trans-fer rate (OTRmax) capacity need to be avoided. Bacterial bioprocesses produce heatdue to the oxidation of substrate needed for growth (460 kJ per mol-O2). Thechoice of substrate has a significant effect on the heat produced per biomassformed, as further outlined in Chapter 2 on yeast suspension culture.
Hence, dependent on the biological activity, the bioreactor needs to be cooled toallow the control of cultivation temperature. During bioprocess design, the maxi-mum cooling capacity needs to be considered; the heat production rate (HPR) isnot allowed to exceed the maximum heat transfer rate (HTRmax). In summary,technical bioprocess design constraints (HTRmax and OTRmax) need to be consid-ered during bioprocess design. Industrial thresholds for OTRmax are typically 300–500 mmol-O2 l�1 h�1, depending on the possibility to gas the reactor with pureoxygen, pressurize the reactor, and the kLa of the bioreactor in use.
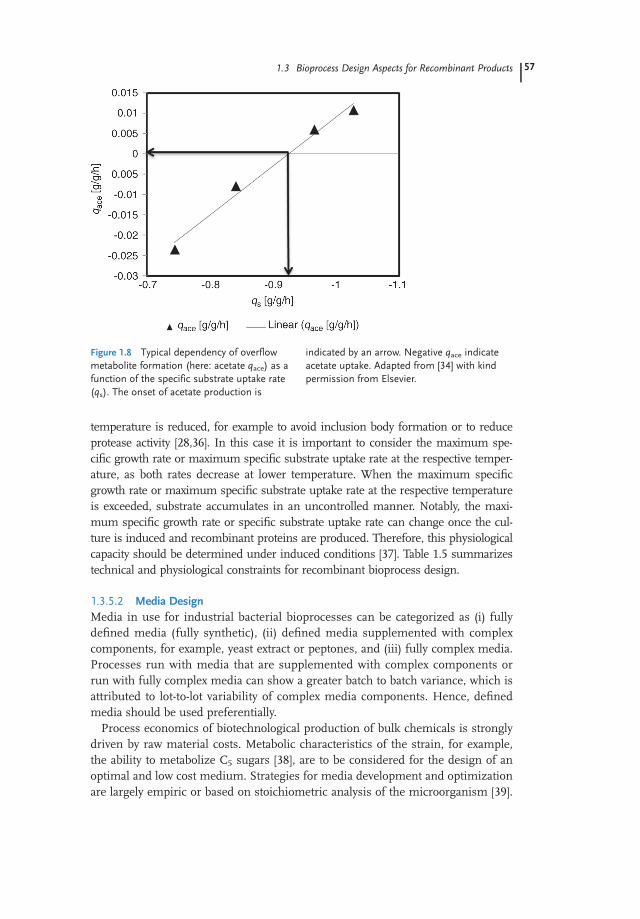
Next to those “technical constraints,” “physiological bioprocess design con-straints” also need to be considered. Bacteria produce unwanted overflow metabo-lites such as acetate (bacterial Crabtree effect) once a defined specific growth rate,with respect to the specific substrate uptake rate, is exceeded. The accumulation ofoverflow metabolites reduces biomass yields, may cause inhibition of growth, andmay have detrimental effects on recombinant protein production. Therefore, pro-duction of overflow metabolites needs to be avoided by controlling the specificgrowth rate, with respect to the specific substrate uptake rate, below the thresholdvalue for the onset of overflow metabolite production [11,34]. This threshold valuecan be determined experimentally, for example, through dynamic chemostat experi-mentation or dynamic decelerostat experimentation [34]. Figure 1.8 gives a typicaldependency of the specific acetate production rate as a function of the specificuptake rate qs. Notably, overflow metabolite formation characteristics can changeonce the culture is induced and recombinant proteins are produced and maybe time dependent [35]. In some processes, it is desired that the cultivation
56 1 Bacterial Suspension Cultures
temperature is reduced, for example to avoid inclusion body formation or to reduceprotease activity [28,36]. In this case it is important to consider the maximum spe-cific growth rate or maximum specific substrate uptake rate at the respective temper-ature, as both rates decrease at lower temperature. When the maximum specificgrowth rate or maximum specific substrate uptake rate at the respective temperatureis exceeded, substrate accumulates in an uncontrolled manner. Notably, the maxi-mum specific growth rate or specific substrate uptake rate can change once the cul-ture is induced and recombinant proteins are produced. Therefore, this physiologicalcapacity should be determined under induced conditions [37]. Table 1.5 summarizestechnical and physiological constraints for recombinant bioprocess design.
1.3.5.2 Media DesignMedia in use for industrial bacterial bioprocesses can be categorized as (i) fullydefined media (fully synthetic), (ii) defined media supplemented with complexcomponents, for example, yeast extract or peptones, and (iii) fully complex media.Processes run with media that are supplemented with complex components orrun with fully complex media can show a greater batch to batch variance, which isattributed to lot-to-lot variability of complex media components. Hence, definedmedia should be used preferentially.
Process economics of biotechnological production of bulk chemicals is stronglydriven by raw material costs. Metabolic characteristics of the strain, for example,the ability to metabolize C5 sugars [38], are to be considered for the design of anoptimal and low cost medium. Strategies for media development and optimizationare largely empiric or based on stoichiometric analysis of the microorganism [39].
Figure 1.8 Typical dependency of overflowmetabolite formation (here: acetate qace) as afunction of the specific substrate uptake rate(qs). The onset of acetate production is
indicated by an arrow. Negative qace indicateacetate uptake. Adapted from [34] with kindpermission from Elsevier.
1.3 Bioprocess Design Aspects for Recombinant Products 57

Preferentially, statistical experimental design (design of experiments, DoEs)methodologies [40] are to be used to minimize the experimental effort towards anoptimized medium.
1.3.5.3 Product Titer is Determined by the Biomass Concentration and the SpecificProductivity qpIndustrial processes aim at the production of a maximum amount of prod-uct within quality specifications in a minimum amount of time. The producttiter (g l�1 product) at the end of the process is determined by the integralof the specific productivity qp multiplied by the biomass concentrationx (Equation 1.1):
Titer ¼ZtEnd
tInd
qpx dt ð1:1Þ
Hence, the maximum titer achievable is determined by three distinct processvariables:
1) Specific productivity (qp): The biomass specific activity (qp) describes theamount of product formed per biomass (cells) in a defined time interval. Iden-tifying the interactions between process parameters (temperature, dissolvedoxygen, feeding strategy) and the specific productivity (qp) and its time function
Table 1.5 Technical and physiological constraints for basic recombinant bioprocess design.
Technical constraint Requirement Process failure
Maximum heat trans-fer rate
HPRa)<HTRmaxb) Temperature cannot be controlled! reactor
heats upMaximum oxygentransfer rate
OURc)<OTRmaxd) Dissolved oxygen cannot be controlled! cul-
ture runs into oxygen limitation, reductivemetabolism occurs
PhysiologicalconstraintOnset of overflowmetabolite production
me)<macetat_onsetf) Overflow metabolites accumulate! reduced
biomass and product yields and possiblegrowth inhibition
Maximum growth rateat set-pointtemperature
m<mmaxg) Substrate accumulates!uncontrolled accu-
mulation and possible growth inhibition
a) HPR: heat production rate¼ heat produced due to microbial growth.b) HTRmax: maximum heat transfer rate¼maximum cooling capacity of reactor.c) OUR: oxygen uptake rate¼ oxygen consumed due to microbial growth.d) OTRmax: maximum oxygen transfer rate.e) m: specific growth rate.f) macetat_onset: threshold specific growth rate where acetate formation occurs.g) mmax: maximum specific growth rate.
58 1 Bacterial Suspension Cultures

is a major goal of process development. It is important to achieve both a highqp as well as maintaining qp high over a maximum amount of time.
2) Biomass concentration (x): The volumetric product formation rate (rp) is pro-portional to the biomass concentration in the broth. Hence, industrial fed-batch processes aim to maximize biomass concentration, while maintaining ahigh specific productivity qp.
3) Productive time (tEnd� tInd): The productive time, that is, the time intervalbetween the start of induction (tInd) and the end of the process (tEnd), governsthe overall amount of product that can be produced. The end of the process(tEnd) is initiated once the specific productivity qp reaches zero or is based ontime–space yield considerations (Section 1.3.6.6 and Figure 1.11).
1.3.6Industrial Production Strategy by Two-Step Cultivation
Typically, industrial fed-batch processes follow a two-step strategy. The first stepaims at maximizing the biomass concentration (x) while considering technicaland physiological process constraints and involves a non-induced batch and fed-batch process phase. In these phases biomass should be accumulated without theformation of overflow metabolites and while staying within the technical limita-tions of the bioreactor setup. Subsequently, the culture is induced, for example, byadding a chemical component triggering the formation of recombinant product(indicated by an arrow in Figure 1.9). Feeding is typically continued linearly atmaximum feeding rate (Feed Rate A in Figure 1.9) or reduced to a level optimalfor recombinant protein production (Feed Rate B in Figure 1.9).
The next subsections describe concepts impacting productivity of recombinantfed-batch processes and basic bioprocess design aspects of the batch, fed-batch,and induction phase of industrial recombinant processes.
Figure 1.9 Industrial two step strategy.
1.3 Bioprocess Design Aspects for Recombinant Products 59
1.3.6.1 Batch Phase for the Accumulation of BiomassA sterile medium containing a carbon source (e.g., 20 g l�1 glucose) is inoculatedwith a pre-culture. The initial batch carbon source concentration is limited bytechnical constraints (e.g., maximum oxygen uptake rates, calculated for unlimitedgrowth at maximum specific growth rate) or by physiological constraints, forexample, the formation of unwanted overflow metabolites.
The initial biomass concentration (seed), determined by the inoculum volumeand inoculum biomass concentration, is typically of minor physiological impor-tance for most bacterial cultures, whereas when cultivating filamentous organismsit is considered to be very critical. However, the amount of seed drives batch timeand is therefore of economic importance. For a typical E. coli strain an inoculumvolume of 10 ml per liter culture broth, at an OD of 1, is sufficient to allow for lag-phase free unlimited growth.
In the batch phase the culture growth is non-limited at a maximum specificgrowth rate (m). Hence the specific substrate uptake rate (qs) is maximized. Typi-cally, overflow metabolites (in the case of E. coli mainly acetate) are formed in thisphase. This can be problematic when the accumulated overflow metabolites arenot fully consumed in the subsequent fed-batch phase, since the presence of over-flow metabolites negatively impacts recombinant protein production. Reduction ofcultivation temperature during the batch phase may help to avoid accumulation ofoverflow metabolites as it results in a reduced specific growth rate. However, thisimpacts on the duration of the batch phase.
1.3.6.2 Structured Approach Towards Batch DesignThe initial substrate concentration determines the biomass concentration at theend of the batch phase, which can be estimated by the biomass yield coefficient inthe batch phase. Equation 1.2 shows the calculation of end biomass concentrationin the batch phase:
xBatch;end ¼ sBatch;0Yx=s þ xBatch;0 ð1:2Þwhere:� xBatch,end: concentration of biomass after the batch phase (g l�1);� sBatch,0: initial substrate concentration (g l�1);� Yx/s: biomass yield coefficient (g g�1), typically �0.4–0.48 g g�1 for E. coli;� xBatch,0: initial biomass concentration (g l�1).
On the basis of the end biomass concentration and the specific growth rate ofthe respective organism, the volumetric biomass conversion rate at the end of thebatch can be calculated (Equation 1.3):
rxBatch;max ¼ mxBatch;end ð1:3Þwhere:� rxBatch,max: maximum volumetric biomass conversion rate in the batch process
(g l�1 h�1);
60 1 Bacterial Suspension Cultures

� m: specific growth rate of the process (h�1);� xBatch,end: biomass concentration at the end of the batch phase (g l�1).
A design criterion for basic design of batch processes keeps OUR below themaximum oxygen transfer rate of the reactor setup. On the basis of the end bio-mass conversion rate and the oxygen/biomass yield coefficient, the maximum oxy-gen uptake rate can be calculated at the end of the batch phase (Equation 1.4):
OUR ¼ rxBatch;max YO2=x
OUR < OTRmaxð1:4Þ
where:� OUR: oxygen uptake rate (mmol l�1 h�1);� OTRmax: maximum oxygen transfer rate of reactor setup;� rxBatch,end: metabolic biomass conversion rate at the end of the batch process
(g l�1 h�1);� YO2/x: oxygen/biomass yield coefficient (mmol g�1).
Table 1.6 gives the process parameters for a batch phase.
1.3.6.3 Fed-Batch Phase Process Design from ScratchFollowing the batch phase, a fed-batch process is started. By applying a feed-for-ward exponential feeding profile, assuming a constant biomass yield coefficient,the fed-batch process mode allows us to control the specific growth rate m as wellas the specific substrate uptake rate qs. This way formation of overflow metabolitescan be avoided. The flow rates F0 and F are given in l h�1; in case the flow ratesare given in g h�1 the feed solution density needs to be considered. The initialflow rate can be calculated according to Equation 1.5:
F0 ¼ x0V0m
Y x=Scinð1:5Þ
The feed-forward function can be calculated according to Equation 1.6:
F ¼ F0emt ð1:6ÞThe initial biomass concentration of the fed-batch phase x0 can be calculated
from the initial substrate concentration in the batch phase, as described in theprevious section. The biomass yield coefficient of the fed-batch phase must be
Table 1.6 Process parameters batch phase.
Governing process parameters Design criterion Ranges
Initial substrate concentration OTRmaxa)/HTRmax
b) 10–20 g l�1
Temperature OTRmax/HTRmax 25–37 �C
a) OTRmax: Maximum oxygen transfer rate.b) HTRmax: Maximum heat transfer rate.
1.3 Bioprocess Design Aspects for Recombinant Products 61

determined experimentally. Notably, the biomass yield coefficient of the fed-batchphase is typically higher than the biomass yield coefficient of the batch phase,since the formation of overflow metabolites is avoided. The maximum feed con-centration (cin) is mainly dependent on the substrate used. Glycerol based sub-strates can even be pumped in pure form (1261 g l�1, pure glycerol), which isbeneficial for not filling up the bioreactor with water. Heating of the transfer pipeand/or direct heating of glucose feeding solution is advisable when the concentra-tion is higher than 500 g l�1.
The specific growth rate of the fed-batch process should be controlled below thespecific growth rate threshold for overflow metabolites production [41]. Thisthreshold can be determined by elaborate, time consuming continuous experi-mentation or dynamic methods [34]. As a rule of thumb no overflow metabolitesformation is typically observed at specific growth rates that are below 1
4 mmax. How-ever, this rule of thumb has to be handled with care since metabolite formation isstrongly strain dependent. Table 1.7 gives key design criteria.
The amount of biomass to be formed in the fed-batch phase is strongly depen-dent on the function of the specific productivity during the induction phase, asdescribed in the next section. Furthermore, similar to the design of batch pro-cesses (see previous section), reactor capabilities with respect to maximum oxygentransfer rates are to be considered.
The biomass formation rate at the end of the fed-batch process is driven by thespecific growth rate (m) of the fed-batch process as well as the biomass concentra-tion to be achieved. The maximum biomass formation rate at the end of the fed-batch can be found from Equation 1.7:
rx Fed Batch;max ¼ mFed BatchxFed Batch;end ð1:7Þwhere:� rxFed-Batch,max: maximum metabolic biomass conversion rate at the end of the
fed-batch process (g l�1 h�1);� mFed_Batch: specific growth rate of the fed-batch process (h�1);� xFed_Batch,end: biomass concentration at the end of the fed-batch phase (g l�1).
Table 1.7 Key design criteria in feed-forward exponential fed-batch processes.
Parameters Criterion/measurement Ranges
Initial biomass concentration Process development 5–15 g l�1
Biomass yield coefficient Process development 0.3–0.5 g g�1
Feed-substrate concentration HPLC/enzymatic measurements 400–800 g l�1
Specific growth rate ma)<moverflowb)< mmax
c) 0.1–0.8mmax
a) m: specific growth rate.b) moverflow: specific growth rate threshold where formation of overflow metabolites starts.c) mmax: maximum specific growth rate.
62 1 Bacterial Suspension Cultures

The maximum oxygen uptake rate at the end of the fed-batch is given in Equa-tion 1.8:
OUR ¼ rxFed Batch;max YO2=x
OUR < OTRmaxð1:8Þ
Table 1.8 gives key design criteria for the accumulation of biomass.
1.3.6.4 Induction Phase: Product Formation CharacteristicsThe second step of the industrial two-step strategy is initiated by the induction ofthe culture, which initiates recombinant protein production. Owing to theredirection of cell resources, better metabolism towards recombinant protein pro-duction in highly induced systems (metabolic burden), the cellular populationundergoes severe physiological changes.
As a result of the physiological changes, quadratic functions of the specificproduct production rate (qp) as well as the volumetric production rate (rp) areobserved (Figure 1.10). The level of qp as well as how it rises and declines isstrongly connected to the applied feeding profile as well as process parameters(T, pH, DO), media components, desired product location as well as foldingstate, and the host/vector combination used. The final product titer to beachieved depends upon the function of qp, more specifically on the integral ofrpdt (¼qpxdt).
As mentioned above, the final titer achievable in a fed-batch process is influ-enced by the integral of the specific productivity (qp) and the biomass concentra-tion (x) in the productive time. Hence, not only the level of qp drives final producttiter, but also how long qp can be maintained at a high level (tEnd� tInd). This isillustrated in Figure 1.10, showing real data from a recombinant E. coli fed-batchprocess. Parameter set 1 as well as parameter set 2 resulted in a quadratic rp andqp function (Figure 1.10a and c). Parameter set 2 shows a higher maximum qp andrp than parameter set 1 (Figure 1.10a and c). However, the high level of qp and rpcannot be maintained over a long period in Parameter Set 2, as shown by thestrong decrease in qp and rp after 5 h of induction. Therefore, despite a lower max-imum rp a higher overall product titer is obtained using parameter set 1(Figure 1.10d).
Table 1.8 Key design criteria for exponential fed-batch processes for the accumulation ofbiomass.
Parameters Design Criterion/Measurement Ranges
Biomass concentration Batch design 20–70 g l�1
Cultivation temperature Process development 25–37 �CBiomass yield coefficient Process development 0.3–0.5 g g�1
Feed – substrate concentration HPLC/enzymatic measurements, gravimetric(in industrial environment)
400–800 g l�1
Specific growth rate m<moverflow<mmax 0.1–0.8mmax
1.3 Bioprocess Design Aspects for Recombinant Products 63

1.3.6.5 Process Parameters Impacting Recombinant Product FormationAs mentioned in the last section, qp trajectories are strongly dependent uponapplied feeding profile as well as process parameters (T, pH, DO), media com-ponents, desired product location as well as folding state, and the host/vectorcombination used. Optimization efforts are typically carried out using statisti-cal experimental plans (design of experiments, DoE). For a comprehensivereview on the application of DoE methodologies for bioprocesses see Refer-ence [40].
Prior to optimization, process parameters under investigation need to be chosenfollowing clear bioengineering reasoning. Owing to the high number of processparameters that can be optimized, the process parameters investigated should becarefully selected, for example, using risk assessment tools such as Ishikawa dia-grams or failure mode and effects analysis (FMEA). For further information onthe application of risk assessment tools within bioprocess development see the A-Mab case study in Reference [42]. Table 1.9 provides an overview of factorsimpacting recombinant protein formation and the rationale for their investigationrelating to process productivity and product quality.
Figure 1.10 Typical product formation charac-teristics in recombinant bacterial bioprocesses.The specific as well as volumetric product for-mation rate qp shows typically a quadratic
function ((a) and (c)). The increase in the bio-mass concentrations is depicted in subplot (b).Final product titer is governed by the integral ofrp (d).
64 1 Bacterial Suspension Cultures

1.3.6.6 Concept of Time–Space YieldThe “time–space yield” (g l�1 h�1) refers to the product (g) achievable per reactorvolume (l) and bioreactor occupancy. Bioreactor occupancy not only includesinduction time, but also non-productive process stages such as reactor prepara-tion, cleaning, and sterilization (CIP, cleaning in place, and SIP, steaming inplace), batch phase, and fed-batch phase for the accumulation of biomass. Hence,the time–space yield provides a convenient measure of how much product can beproduced in the respective bioreactor scale available. Figure 1.11 illustrates theconcept of time–space yield. As we recall from the last section, the example“parameter set 1” yields a higher titer due to a higher integral of rpdt(Figure 1.11a). However, it takes almost 30 h to achieve this titer of 850 U l�1,compared to the 15 h of time after induction to achieve 600 U using “parameterset 2”. Figure 1.11b plots the “time–space yield” and, hence, the product yield perreactor volume and bioreactor occupancy. It can be seen that although highertiters can be obtained using “parameter set 1” the time–space yields of the twoparameter sets are almost identical in respect to the overall occupancy of thebioreactor.
Table 1.9 Fed-batch process parameters with impact on induction phase productivities.
Processparameters
Industrial ranges Reasoning Reference
m 0.01–0.5 h�1 (typically decliningwithin induction within two stepcultivation strategy)
Impact on cellular energylevel;impact on metabolic load;impact on cell stress dueto carbon depletion;impact on inclusion bodyformation
[43–45]
T 10–37 �C Reduced inclusion bodyformation at lowertemperatures;increased solubility ofproteins at lowertemperatures;reduced metabolic load atlower temperatures;reduced productivitiesdue to reduced translationat lower temperatures
[28,46]
pH 5–7.2 Interferes with protonmotive force
DO(dissolvedoxygencorporation)
>40%, also due to spatialinhomogeneity in large scalebioreactors
Overflow metaboliteformation
[47]
1.3 Bioprocess Design Aspects for Recombinant Products 65

1.4Basic Bioreactor Design Aspects
1.4.1Introduction
In general, a bioreactor is defined as a vessel in which biological reactions takeplace. Depending on the type of microorganism different types of bioreactorshave been designed and introduced so far. Generally speaking, bioreactors aregrouped into two main categories based on the presence and absence of oxygenand the requirement of stirring as follows:
� stirred and aerated bioreactors;� anaerobic bioreactors and non-stirred bioreactors, such as air-lift bioreactors.
Stirred and aerated bioreactors (stirred-tank reactor, STR) are those usuallyused for production of the products that are the focus of this chapter due tothe requirement for a high OTR (oxygen transfer rate). Hence, this chapterdescribes the design and engineering of STRs. However, disposable bioreac-tors are briefly introduced and their potential and perspective for bacterial cul-tivation is discussed.
The main function of a bioreactor is to provide a well-controlled environmentfor optimal growth of microorganisms and production of products. Thisencompasses:
� proper control of standard process parameters as pH, temperature, dissolvedoxygen concentration, substrate feed rates, gas flow rates, and so on;
� sterility (well-defined, functional sterile boundaries);� controlled cleaning;� control of heat and mass transfer;� control of shear stress.
Figure 1.11 Illustration of final product titer and time–space yield of the process.
66 1 Bacterial Suspension Cultures

To design an apparatus that provides such an environment, different aspectsconcerning design and construction must be considered. In addition, a deepunderstanding of the mass transfer is indispensable. Here we aim to cover thefollowing factors:
� dimensioning;� construction principles;� heat and mass transfer aspects;� sterilization and cleaning aspects;� monitoring strategies.
1.4.2Vessel Design and Construction
For the design and construction of a bioreactor, one must keep in mind somecardinal rules (Table 1.10). These rules help the designer to design a bioreactorthat provides for the required well-controlled environment. Generally, thedesign should follow aseptic design principles as laid down in several designguidelines [48].
1.4.3Dimensioning
The first step in the design of a bioreactor is the choice of an appropriate reactorvolume. This is decided, on the one hand, based on the plant capacity, which isdependent on the economic and market analysis and, on the other hand, by con-sidering the time–space yield. Typically, 75–80% of the reactor net volume repre-sents the working volume and the rest is devoted to the head space, depending ofcourse on foaming of the given process.
Once the decision regarding the total volume of the bioreactor is taken, thedimensions can be easily chosen according to some rules of thumb. Figure 1.12shows typical dimensions of an industrial stirred tank bioreactor for bacterial andother microbial cultivation:
HDt
¼ 2:5 � 3;di
Dt¼ 0:3 � 0:5;
Hl
di¼ 0:3 � 0:5;
Hi
di¼ 1 � 2; 4 baffles;
Lb
Dt
¼ 0:08 � 0:1;Hb ffi H;Lc
Dt¼ 0:02
1.4.3.1 Materials of ConstructionThe materials of construction of the bioreactor are of utmost importance. Thematerial of the bioreactor must be chemically inert so that it does not leach ele-ments into the medium. On the other hand, the material should not only fulfilldesign considerations, it should fulfill economic requirements as well as regula-tory requirements, such as from the US FDA (Food and drug administration),
1.4 Basic Bioreactor Design Aspects 67

Table 1.10 Cardinal rules for design and construction of a bioreactor.
Processrequirements
Cardinal rules Related bioreactorpart
Sterility Any connection to the reactor should be madeaccessible for steaming in place (SIP) and cleaning inplace (CIP). This also includes prior removal of air, asthis can act as insulation
Connections
Sterility Direct connection between sterile and non-sterileparts of the system should be avoided. Bacteria cangrow through closed connections
Connections
Sterility Flange connections are prone to facilitate contamina-tion due to thermal expansion or equipment vibration.Pipes should therefore be designed and tested forstress free isometry
Connections
Sterility Welded constructions that are properly polished arepreferred
Vessel body
Sterility The shape of the reactor and its construction shouldbe in such a way that any dead legs and crevicesshould be prevented. This should also include weld-ing in the product wetting area
Vessel body
Sterility For cleanability, the reactor must be self-draining Vessel bodySterility Any connection to the reactor and any ports should be
steam-sealedPorts andconnections
Sterility The vessel should always be kept under definedoverpressure to avoid any back contamination. As adesign suggestion, it also should tolerate positivepressure up to at least three bar gauge to enhanceoxygen solubility
Vessel body
Sterility Valves should be easy to clean, maintain and sterilize ValvesSterility The vessel should be suitable for aseptic long-term
operation and meet the requirements of regulatoryauthorities
Vessel body
Aeration andagitation
Adequate aeration and agitation should be provided tomeet the culture requirements
Agitator, engine, baf-fles, impellers
Agitation Power consumption should be as low as possible Motor, agitator,impellers
pH andtemperature
pH and temperature control systems should beprovided
pH and temperaturecontrol systems
Processmode
The vessel should be designed to enable differentprocess modes
Vessel body
Aeration,heat transfer
Evaporation loss from the bioreactor should not beexcessive
Sparger, heating andcooling system
Economics Cheapest materials with satisfactory properties shouldbe used
Materials ofconstruction
68 1 Bacterial Suspension Cultures

EMA (European Medicine Agency), and MHRA (Medicine and Healthcare Prod-ucts Regulatory Agency).
The body of bioreactors, which are larger than 10 l, is typically made of stainlesssteel. Those holding smaller volumes mainly consist of glass. Because of excellentelectro-polishing and low leaching characteristics, stainless steel 316 or 316 L(1.4404 and 1.4435) are commonly used. Stainless steel 304 or 304 L are used forparts of the vessels that are not in contact with the product, such as the heating–cooling system or the platform. In addition to the vessel body, the material of theelastomers used for static seals is also important. Silicone, EPDM, and Teflon arecommonly used for head plates and elsewhere. Conformity certificates accordingto FDA CFR Part 170ff should be provided. For further information, the authorsrecommend References [49,50].
1.4.3.2 Surface Quality and WeldingThe smoother the surface the better is the cleaning. For internal surfaces of thevessel and pipes, a roughness of Ra 0.8 mm is suggested. More informationabout the surface characteristics can be found in Reference [51]. However, surfaceroughness is not the only factor that affects cleaning. The natural interactionbetween surface and reactor contents determines the cleaning success. Therefore,for a certain medium and broth, swab tests will be necessary to demonstrate suc-cessful cleaning.
Tungsten arc welding is the most common technique used to weld vessels andpipes in biopharmaceutical technology. Automatic welding such as orbital weldingis used to connect the pipes wherever the geometry of the pipework allows thistechnique. In addition to the welding, also welding polishing quality down toabove-mentioned roughness specification and its inspection by endoscopy is ofutmost importance.
Figure 1.12 Typical dimensions of a stirred tank reactor.
1.4 Basic Bioreactor Design Aspects 69

1.4.3.3 Nozzles and PortsA bioreactor consists of various internal and external parts, each contributing tothe proper function of the bioreactor. Baffles, impellers, motor, and sparger play amajor role in the mass transfer while ports are indispensable for placing of sen-sors, sampling, and harvesting. The jacket serves for heating and cooling.
All bioreactors used for cultivation of bacteria have nearly the same configura-tion and fittings, which facilitates execution of various process modes. Every bio-reactor is usually equipped with ports for pH sensors, dissolved oxygen sensors,temperature sensors, antifoam sensor, a port for sampling, and ports for the addi-tion of base, acid, and feeds. In contrast to laboratory scale bioreactors, in pilotand large scale bioreactors the sensors are mounted in the bottom-periphery ofthe vessel (Figure 1.13).
With reference to the sampling port, various commercial systems are availablefor aseptic sampling. The sampling system should be designed such that the ster-ile boundary is maintained during repeated sampling. For a detailed description ofsampling systems refer to Reference [52].
1.4.4Mass Transfer
Providing homogeneous mixing is a prerequisite for successful cultivation. Ofcourse, homogeneous distribution of all medium components is important,
Figure 1.13 Schematic drawing of a standard stirred tank bioreactor. The internal or externalcomponents affect the capabilities of the bioreactor to maintain and control the operatingconditions.
70 1 Bacterial Suspension Cultures

but the transfer of oxygen from the gas phase to the liquid phase and thetransfer of carbon dioxide from liquid phase to gas phase still represent a bigchallenge in microbial cultivations. This necessitates a proper stirrer designand operation.
The oxygen uptake rate (OUR) is defined as the number of moles of oxygentaken up by the cells per unit volume and time. As mentioned in Section 1.3, thisparameter serves as process design criterion. The oxygen demand of the cells cor-relates with the biomass growth rate (Section 1.3). On the other hand, the oxygentransfer rate (OTR) is defined as the number of moles of oxygen exchangedbetween the gas phase and the liquid phase per unit volume and time. This is theoxygen that is potentially accessible to the cells. The OTR is expressed as a productof a coefficient (the volumetric gas transfer coefficient (Kla)) and the driving force(DC) as follows (Equation 1.9):
OTR ¼ K la CO2 � CO2
� �ð1:9Þ
where CO2 is the dissolved oxygen concentration in the liquid phase and CO2
is theequilibrium concentration of oxygen in the liquid at the given temperature andpressure in the bioreactor.
To date, different methods and techniques have been established for the deter-mination of Kla. A description and explanation of these techniques is beyond thescope of this book and can be found elsewhere [52]. Here, we focus on the factorsinfluencing OTR and the practical improvement strategy.
The cells take up the oxygen very rapidly. Hence, the rate-limiting step is the availabil-ity of oxygen by transfer from the gas phase to the liquid phase. As a design rule, theOTR should be high enough to satisfy OUR requirements. The OTR can be adjusted bymeans of changing both Kla and DC. The Kla is dependent on the geometry of thereactor, the gas flow rate, and the stirrer speed. Increasing the gas flow rate enhancesKla to a certain extent and thereafter has no significant impact [53]. On the other hand,too high a gas flow rate increases foaming tendency. It is reported that a well-designedagitation system should provide for a specific energy input (P/V) of >5 kW m�3 and animpeller tip speed> 1.5 m s�1 [54]. C
O2depends on the mole fraction of O2 in the inlet
gas and the total pressure of the bioreactor (Henry’s law).In high cell density cultures, the actual OTR may be lower than the OUR, hence
the measured dissolved oxygen concentration (usually annotated as DO or pO2)may fall below the critical level. Therefore, the OTR needs to be increased. This isachieved by changing parameters as follows:
� head pressure;� air inflow rate;� agitator speed;� oxygen inflow rate.
Usually, a cascaded control strategy is implemented, in which the above-men-tioned parameters are changed in accordance with the DO controller output. The
1.4 Basic Bioreactor Design Aspects 71
use of oxygen-enriched air should be considered as the last option because addi-tion of the oxygen imposes additional cost to the process.
1.4.5Cleaning in Place
After harvesting, the bioreactor must be prepared for the next operation. Thispreparation includes cleaning and sterilization of the bioreactor and all associatedtransfer lines. Cleaning in place (CIP) is defined as the removal of culture left-overs from process equipment and transfer lines. This typically is accomplishedby spraying and rinsing of water and cleaning solutions in recirculation modewithout the removal or dismantling of the equipment. The generally applicablecleaning scheme utilizes a pre-rinse to remove gross soils, a hot caustic flush todigest and dissolve remaining soils, a water wash to remove residual caustic, anda potential hot water for injection (WFI) or purified water (PW) wash.
Cleaning methods and cleaning agents used vary, depending on the process(type of microorganism, product produced, and facility, among others). Similarcleanliness can be achieved with different methods. Four important factors affect-ing CIP are: time, velocity, cleaning agent, and temperature. For a good CIP sys-tem design and operation the following recommendations are suggested [48]:
� construction of CIP systems equivalent to the material quality of the mainprocess;
� bioreactors with electro-polished surface of Ra<¼0.6 are preferred;� splashing with CIP spray balls should be between 30 to 40 l per m reactor cir-
cumference per min; more spray balls than one may be installed for propercleaning; the total flow rate can be split to the number of spray balls, whichshould be run alternately;
� the minimum flow velocity through the CIP and transfer piping is consideredto be 1.5 m s�1 (6 ft s�1) to avoid biofilm formation;
� in case the minimum flow velocity cannot be kept in large pipes, a minimumReynolds number of 10 000 is suggested to assure good mass, heat, andmomentum transfer of cleaning solution;
� dead legs must be less than three-pipe diameters of the branch to assure ade-quate cleaning (3D rule);
� 1% (w/v) solution of sodium hydroxide at 75–80 C for 15–20 min is usually usedafter pre-rinse;
� acid treatment can be used optionally to break pH after caustic treatment;� final rinse with process water quality is used to verify cleaning was successful.
The acceptance criterion is normally a conductivity measurement slightlyhigher than the feed water quality (1.3 mS cm�1), but still much lower thancontaminants.
For pharmaceutical applications, validation of the CIP is necessary to demon-strate a reasonable degree of assurance that cleanliness was achieved as desired
72 1 Bacterial Suspension Cultures

and in a reproducible manner. More information on CIP can be found in Refer-ence [51].
1.4.6Steaming in Place
Steaming in place (SIP) refers to sanitization or sterilization without dismantlingthe equipment or lines. This technique is used to sterilize commercial bioreactors.Steam sterilization of the bioreactor is performed either with medium (full steri-lization in place) or without medium (empty sterilization in place). Full steriliza-tion is typically applied to in situ sterilization of the batched medium. Steam isinjected into coils and/or jackets and to some extent into the reactor head space(clean steam). The agitator is turned on for faster heat transfer. In the case ofempty sterilization, clean steam is injected into the empty vessel and the systemis sterilized similar to the full sterilization. Empty sterilization is preferred whenheat sensitive media are used or when it is intended to reduce heating and coolingtimes. The state-of-art of SIP is a wide area and more insight into this field isavailable elsewhere [51].
The presence of the air reduces heat transfer during heating phase of steriliza-tion. Therefore, removal of air prior to cleaning and heating up must be ensuredbefore closing all valves. When the system cools down, sterile air or nitrogen mustbe supplied to avoid the formation of a vacuum. These gases are usually filter ster-ilized. A sufficient peak capacity of gas to compensate for the collapse of steam tocondensate must be available within seconds.
1.4.7Monitoring and Control of Bioprocesses
1.4.7.1 Standard Instrumentation – Measuring and Control of Process ParametersProcess parameters such as cultivation temperature, pH, and dissolved oxygen aretypically controlled at defined set-points that are optimal for bacterial growth andproduct formation. Hence, a bioreactor must be equipped with measuring sensorsto allow for precise and frequent monitoring of these parameters.
Sensor accuracy, long-term stability, measurement range, and sensor robustnessmust be considered for the choice of an appropriate sensor. Furthermore, in-linebioreactor sensors must be temperature resistant in order to resist multiple steri-lization cycles.
Control of standard process parameters is typically performed via simple propor-tional integral (PI) controllers that are generally implemented in commerciallyavailable bioreactor operating software. Control of dissolved oxygen can beapproached via a cascade of manipulated variables: First, the controller acts onone input variable, for example, stirrer speed until a maximum is reached. In asecond step, the controller acts on another input variable impacting the oxygentransfer rate, for example, reactor pressure, air flow rates, or oxygen flow rates.
1.4 Basic Bioreactor Design Aspects 73

Temperature, pressure, pH, pO2, gas flow, and agitator speed are part of stan-dard control equipment for bacterial bioprocesses. Table 1.11 lists typical accura-cies and measurement ranges of commercially available sensors.
1.4.7.2 Challenges with Bioreactor Standard SensorsThe pO2 and pH sensors may show a drift during long-term operation, distortingproper control of process parameters. Since it is very difficult to detect a sensordrift, it is strongly recommended to install redundant pH and pO2 probes. More-over, in large bioreactors with a volume larger than 10 m3, inhomogeneous mixingmay occur and the sensor reading may depend on the sensor location. Hence,three sensors of each type may be mounted on the vessel body. Two of them canbe mounted near each other at the lower lateral location of the vessel, while thethird sensor may be installed between the second and third agitator level.
Furthermore, off-gas analysis has emerged as a standard process analytical toolfor monitoring bacterial bioprocesses. Changes in metabolic rates can be very wellobserved by monitoring carbon dioxide evolution and oxygen uptake.
1.4.7.3 Advanced Bioprocess Analytics: Real-Time Monitoring of Process VariablesMultiple bioprocess variables change during a bacterial bioprocess. Biomassincreases (typically exponentially), carbon source and nitrogen sources are con-sumed, and recombinant product and metabolites are formed. Furthermore, thecells undergo physiological changes, increase or decrease in size, or even segre-gate in multiple subpopulations. Monitoring of these variables is of great interestfor the development and understanding of bioprocesses as well as for bioprocesscontrol during manufacturing.
In recent decades, a plethora of process analytical equipment aimed at measur-ing these process variables has been developed. Near-infrared, mid-infrared,as well as Raman spectrometers for the use in bioprocesses are commerciallyavailable. Placed in situ (place in the bioreactor), they allow for the online monitor-ing of metabolites, substrates, and products. However, typically sophisticated
Table 1.11 Standard measurement and control in a bioreactor.
Operatingcondition
Sensor Range Accuracyon range
Controllertype
Temperature Pt-100a) 0–150 �C 1 �C PIb)
Pressure Piezo-resistor 0–3 bar gage 20 mbar PIGas flow Thermal mass flow
meterAir: 0–2 vvm;oxygen: 0–0.4 vvm
2% PI
pH pH electrode 2–12 0.05 PIpO2 Clark electrode; fluores-
cence quenching0–100% 2% Cascade
controllerAgitationspeed
Tacho/stroboscope Along scale upstrategy
1% PI
a) Platinum (Pt) electrical resistance temperature probe with an electrical resistance of 100V at 0 �C.b) Proportional integral controller.
74 1 Bacterial Suspension Cultures

chemometric methods1) are necessary for the establishment of calibrations, whichneed robust reference data. For a recent review of spectroscopic methods for bio-process monitoring see Reference [55].
HPLC (high-performance liquid chromatography), GC (gas chromatography),enzymatic assays, and flow injection analysis2) enable accurate quantification of awide range of chemical and biological components using simple (typically linear)calibrations. However, they are typically used off-line (decoupled in terms of timefrom the process), demanding sampling from the bioreactor and sample treat-ment. Furthermore, the obtained offline information can then not be used for bio-process control purposes. Hence, in recent decades a lot of effort was undertakento interface these devices directly to the bioreactor, for example, using aseptic fil-tration probes (e.g. see Reference [56]). This allows monitoring of the componentsof interest with a high frequency and without manual user interaction. However,challenges such as clogging of interface tube lines and fouling of filtration mem-branes can hamper the applicability. Furthermore, the interface poses a potentialthreat to the sterility of the bioreactor.
Biomass acts as catalyst for product and metabolite formation as well as sub-strate consumption and is therefore of great interest. The biomass concentrationin the bioreactor can be measured in real-time using in-line turbidity probes,which are typically based on measuring a back-scattering signal. Furthermore,dielectric spectroscopy in-line probes are commercially available for estimation ofthe biomass concentration. The latter can also be used to extract morphologicalinformation.
Flow cytometers allow for detection of subpopulations of cells and hence grant asegregated view on the biomass. Living and dead cells can be quantified usingappropriate dyes. Interfacing a flow cytometer with a bioreactor demands a sev-eral-magnitude dilution step. Although challenging, flow cytometers have alreadybeen successfully interfaced with bioreactors [57].
Difficult to measure process variables can also be estimated using mathematicalmodels. To do so in real-time, appropriate software processing readily availableprocess data (off-gas analysis, flow rates) into unknown process variables (e.g., thebiomass or substrate concentrations) are used. These “sensors” are referred to as“software sensors,” or “soft-sensors,” and provide the benefit of low cost (no addi-tional analytical equipment required). Furthermore, they do not violate the sterilebarrier of the bioprocess. Depending on the type of soft-sensor (data driven3) orfirst principle4)) and the type of process model, a varying amount of training orparameter fitting data is necessary to run a soft-sensor.
1) Science of the extraction of chemical information from large data sets using statistical/mathematical/computational methods.
2) Automated analysis method where a sample is injected in a continuous carrier stream forchemical analysis.
3) Use of large data sets for the calibration of the soft-sensor, typically using chemometric methods,for examples see Reference [58].
4) Use of first-principle relationships (mass balances, kinetic models). For examples see References[34,37].
1.4 Basic Bioreactor Design Aspects 75

Along with chemical information, physiological information (e.g., cellular fluxdistributions) is also of interest to characterize the state of the cellular populationin real-time. Specific rates (specific growth rates, specific uptake rates) as well asyield coefficients (distribution of anabolic, catabolic fluxes) grant insight into cellu-lar flux distributions, for example, to assess the change in the physiological stateof the cellular population due to the production of recombinant proteins [59]. Theycan be calculated in real-time by means of soft-sensors from a combination ofprocess signals (off-gas analysis, in-flow of feed solution, and in-flow of air/oxy-gen) [60,61].
1.5Single Use Bioreactors for Microbial Cultivation
Single use bioreactors (SUBRs) also referred to as disposable bioreactors, are pre-sterilized plastic containers intended for the cultivation of mammalian, insect,yeast, or bacterial cells. This section discusses the use of SUBRs for the cultivationof microbial cells.5) Possible benefits and process-technological design constraintsfor bioprocesses using single use bioreactors are discussed, providing a criticaloutline of the potential of the use of SUBRs for industrial microbial suspensionprocesses.
1.5.1Multi-use or Single Use?
Multi-use stainless steel stirred tank reactors that need to be cleaned and sterilizedin situ (clean in place and steam in place, see Sections 1.4.5 and 1.4.6, respectively)emerged as the primary workhorse for the cultivation of cells in suspension cul-ture. Since stainless steel stirred-tank reactors proved applicable, why should therebe a benefit in switching to a plastic disposable alternative? From the manufactur-er’s perspective, single use bioreactors offer several advantages:
1) no cleaning validation is necessary (reduces paperwork, effort, and cost);2) no CIP/SIP piping is necessary (lower investment);3) no CIP/SIP kitchens are necessary (manufacturing sites are smaller);4) time for reactor preparation is reduced;5) time for campaign changeover6) can be significantly reduced;6) personnel savings;7) investment cost savings.
In respect to investment, process scheduling, and manufacturing flexibility, sin-gle use bioreactors have undisputable advantages. Furthermore, disposable
5) Yeast and bacterial cells (in this context).6) Change from one product to another in the same manufacturing site.
76 1 Bacterial Suspension Cultures

process monitoring probes are available to monitor basic process variables such aspH and dissolved oxygen. Materials of single use bioreactors that come in contactwith the product are considered GMP (good manufacturing practice, the higheststandard for the manufacturing of pharmaceutical drugs) compliant. However,several characteristics of single use bioreactors challenge their broad applicabilityfor microbial bioprocesses, which are discussed in the following section.
1.5.2Challenges for the Use of Single Use Bioreactors in Microbial Bioprocesses
Bacterial and yeast bioprocesses offer the possibility of fast growth and the possi-bility to achieve high cell densities, resulting in high volumetric productivities. Asoutlined in Section 1.3, process development takes place in a framework of techni-cal and physiological constraints. Maximum heat transfer rates and maximumoxygen transfer rates of the bioreactor as well as physiological constraints need tobe considered for the design of a bioprocess. Stainless steel bioreactors were spe-cifically designed for optimal oxygen transfer through high power inputs and highheat transfer via high performing double jackets. Therefore, they are ideal for highperforming bioprocesses (see Section 1.4 and references cited therein).
In contrast, single use bioreactors are characterized by (in comparison withstainless steel reactors) low power input, low oxygen transfer rates, and high mix-ing times. Plastic has a low heat transfer coefficient; therefore, heat removal fromthe bioreactor is inferior to steel. Mass transfer rates (oxygen transfer rates in par-ticular) are lower due to low power input and the difficulty in pressurizing dispos-able single use bioreactors. However, oxygen transfer rates in single usebioreactors can be increased by the addition of pure oxygen. The following discus-sion mainly focuses on stirred-tank single use bioreactors since they have themost relevance for the cultivation of microbial cells. Wave bag type single use bio-reactors as frequently applied for the seed trains in mammalian cell cultivations(Chapter 12) are discussed in other chapters.
1.5.3Microbial Bioprocess Development Using Single Use Bioreactors
In single use bioreactors, oxygen transfer rates and heat transfer rates are inferiorto stainless steel, narrowing the technically feasible process parameter space.
For example, final product titer in recombinant bioprocesses is mainly determinedby the (i) biomass concentration and (ii) the specific growth rate (Section 1.3.5.3 andreferences cited therein). In oxidative processes, possible combinations of finalbiomass concentrations achievable and specific growth rates are constrained by max-imum oxygen transfer rates and maximum heat transfer rates of the bioreactor.Hence, optimal processing parameters in respect to product titer might not befeasible in single use bioreactors.
Single use bioreactors pose an additional challenge to bioprocess design inrespect to scale ability of bioprocesses. Maximum volumetric power input,
1.5 Single Use Bioreactors for Microbial Cultivation 77

maximum heat transfer rates, and maximum oxygen transfer rates of commer-cially available single use bioreactors decrease as a function of scale (Figure 1.14).This is due to a decrease in the area/volume ratio (decrease in maximum heattransfer rates) and mechanical limitations of disposable stirrers.
Figure 1.15 depicts the maximum biomass concentration that can be achieved ata given specific growth rate without running into oxygen limitation. Single usebioreactors of different sizes and a typical stainless steel stirred tank reactor arecompared. The iso-lines indicate the maximum biomass concentration achievable
Figure 1.14 Maximum oxygen transfer rates (OTRmaxs) and volumetric power input (P/V) forcommercially available single use stirred bioreactors of different sizes. OTRmax was calculatedbased on Kla values measured in coalescing media assuming 25% oxygen saturation.
Figure 1.15 Maximum biomass concentrationsfeasible with different types of single use bio-reactors (SUBRs) as a function of the specificgrowth rate (controlled in fed-batch mode or
maximum specific growth rate in batch pro-cesses). Maximum oxygen transfer rates asthe basis for the calculation are depicted inFigure 1.14.
78 1 Bacterial Suspension Cultures

at a given specific growth rate without running into oxygen limitation. It can beseen, that with steel stirred tank reactors high biomass concentrations at high spe-cific growth rates are feasible. For example, at a specific growth rate of 0.2 h�1
biomass can be grown exponentially up to a biomass concentration of 55 g l�1
without running into oxygen limitation, as indicated by an arrow. With SUBRs,high densities can only be achieved at very low specific growth rates without run-ning into oxygen limitation. Since the productivity is growth rate dependent(Section 1.3.6.5 and references cited therein), processes might be forced to be runat suboptimal conditions. This affects the potential bioprocess design space.
1.5.4Applications for Single Use Bioreactors in Microbial Suspension Cultures
In the previous sections, the advantages and disadvantages of single use bioreac-tors were discussed. In summary, SUBRs show distinct advantages in respect toprocess scheduling (reduced downtime necessary between batches, no cleaningvalidation) and saving of initial investment costs. However, this manufacturing flex-ibility comes at cost of process design flexibility. Designing high performing high celldensity processes in single use bioreactors is much more challenging using singleuse bioreactors compared to stainless steel bioreactors. However, single use bio-reactors can be the first choice for processes with low specific growth rates or forthe cultivation of anaerobic microorganisms or production of secondary metabo-lites, where mass and heat transfer are less challenging. Hence, single use bio-reactors have the potential to be a rewarding alternative to stainless steelbioreactors.
Possible applications for single use bioreactors encompass:
1) products required in low quantities;2) multi-product facilities with a high number of product changeovers;3) personalized medicine pharmaceuticals;4) cultivation of anaerobic organisms;5) seed trains.
For further information on design, constraints, and applications of single usebioreactors the reader is referred to the literature [62,63].
1.6Quality by Design: Vision or Threat for Twenty-First Century PharmaceuticalManufacturing
Biopharmaceutical drug products produced in living organisms are under tightcontrol of regulatory authorities to ensure product quality, safety, and efficacy. Todate, this goal is mainly achieved through final product testing and fixed manufac-turing ranges. Manufacturing ranges are defined based on mainly empiric process
1.6 Quality by Design: Vision or Threat for Twenty-First Century Pharmaceutical Manufacturing 79

development efforts. These take place prior to the submission stage of a new phar-maceutical drug. Thereafter, during the entire product lifecycle, the manufacturerhas limited means to change and improve the manufacturing process. This regu-latory inflexibility made the implementation of novel technologies in existing pro-cesses practically impossible, slowing down innovation in the pharmaceuticalindustry.
In the early 2000s, the regulatory authorities realized that there is a necessity tochange the regulatory submission process of new pharmaceutical and bio-pharmaceutical drugs. In an attempt to grant the manufacturers more flexibilityand allow the efficient implementation of new technologies, novel concepts sum-marized under the term “quality by design” (QbD) were promoted by the regula-tory authorities. In contrast to “testing quality into the product,” “quality bydesign” aims to ensure product quality through a thorough investigated manufac-turing process. In terms of the regulatory authorities “quality should be built-in orbe by design . . . ” and not solely “ . . . tested into products” [64]. Following QbDprinciples, manufacturers are encouraged to thoroughly investigate their processfollowing a science and risk based approach to achieve process understanding.This should allow them to be capable of actively handling wanted or unwantedprocess variability. In return for the demonstrated process understanding, regula-tory trust is earned by the manufacturers. This should lead to increased manufac-turing flexibility.
The first part of this section summarizes the basic concepts of QbD. The regula-tory guidance in respect to the task of the practical implementation of QbD isreviewed and a discussion of benefits and challenges of QbD from the manufac-turer’s perspective is conducted. Thereafter, we discuss the regulatory demand of“process understanding” in respect to biopharmaceutical QbD manufacturing pro-cesses (where highly complex molecules are produced in cells as manufacturingunits). In the last part of the section we discuss who will shape the future of QbDin pharmaceutical manufacturing: Will the manufacturers’ readily accept anddevelop the concepts of QbD or will QbD evolve to a unilateral regulatoryimperative?
1.6.1Regulatory Drive towards the Implementation of QbD
From 2003 to 2012 the pharmaceutical QbD framework was developed in a seriesof documents developed by International Conference of Harmonization (ICH),United States food and drug administration (FDA) as well as its European andJapanese equivalents (EMA and MLHW (Japanese Ministry of Health and Wel-fare)). Primary documents concerning the implementation of QbD, including theprincipal aim of the document, are listed in Table 1.12.
QbD is referred to as a “holistic” approach towards pharmaceutical manufactur-ing. QbD covers drug and product development, manufacturing process develop-ment, and also stretches to post-drug and process approval manufacturing. Hence,QbD is not limited to process development but covers the whole lifecycle of a
80 1 Bacterial Suspension Cultures

pharmaceutical drug. The current understanding of QbD for pharmaceuticals wasmainly shaped by a series of documents of the “International Conference on theHarmonization of Technical Requirements for Registration of Pharmaceuticals forHuman Use” (“ICH” for short). These documents will now be reviewed briefly.“Risk” and “risk management” are key elements of QbD. Risk is defined as the
product of “severity” and “probability” and “detectability.” The main goal of riskmanagement is to reduce the risk to drug product quality throughout the productlifecycle. ICH Q9 aims to provide guidance on how to implement modern riskmanagement tools in the pharmaceutical industry. ICH Q8 specifies how risk-and science-based process development within a QbD framework can be struc-tured and communicated within the regulatory submission. More precisely, ICHQ8 specifies what the QbD contents within the Pharmaceutical Development sec-tion of a regulatory submission in the ICH M4 common technical document(CTD) can look like. Overarching and complementing documents ICH Q8 andICH Q9, document ICH Q10 gives guidance about how to implement a qualitymanagement system, including guidance for management responsibilities as wellthe current understanding about what a pharmaceutical quality system can looklike. The most recent document, ICH Q11 (2011), tries to provide guidance onwhat information should be provided in the CTD section of a regulatory submis-sion. Furthermore, ICH Q11 discusses the possibility of submission of“enhanced” and “classical” approaches and also discusses the possibility of sub-mitting a combination of both. However, ICH Q11 still remains vague concerningits guidance about how QbD elements can now be effectively put into practice.
Quality risk management tools as presented in ICH Q9 are ineffective without aproduct-lifecycle spanning quality management concept as presented in ICH Q10.Furthermore, quality management is difficult without a solid risk- and science-based knowledge basis derived from process development as specified in ICH Q8.Hence, in our opinion full quality by design can only be achieved using the
Table 1.12 Leading quality by design related regulatory documents.
Document Principal aim Reference
Pharmaceutical cGMPs for thetwenty first century – A Risk-BasedApproach
Communicate the regulatory goal topush a risk based approach in thepharmaceutical industry
[65]
ICH Q8R2 Guidance for the implementation ofQbD concepts in process development
[64]
ICH Q9 Guidance for implementation of qualityrisk management tools in the drugproduct lifecycle
[66]
ICH Q10 Guidance for the implementation of apharmaceutical quality system
[67]
Guidance for Industry PAT-A frame-work for Innovative PharmaceuticalDevelopment, Manufacturing, andQuality Assurance
Provide a framework for the develop-ment and implementation of processanalytical technology in the pharmaceuti-cal industry
[68]
1.6 Quality by Design: Vision or Threat for Twenty-First Century Pharmaceutical Manufacturing 81

combinations of tools and concepts presented in the ICH Q8, ICH Q9, and ICHQ10 documents (Figure 1.16).
1.6.2Process Development along QbD Principles
QbD starts with predefined objectives. As outlined in ICH Q8 a “quality targetproduct profile (QTPP)” needs to be established, summarizing all quality, safety,and efficacy characteristics of the drug product [64]. Based on the QTPP, chemi-cal, biological, and physical characteristics and their respective ranges are identi-fied, which form the set of critical quality attributes (CQAs) for the drug product.Subsequently, a manufacturing process is to be designed to ensure the entireproperties of the drug quality attributes as defined in the CQAs stay within thedefined ranges. Using risk assessment tools and prior knowledge on the manufac-turing process, process parameters with possible impact on drug product qualityare identified, called critical process parameters (CPPs). From an early stage inprocess development onwards, the impact of CPPs on CQAs is thoroughly investi-gated. The toolset for this investigation is statistical experimental design (design ofexperiments, DoEs), process analytical technology, as well as mechanistic model-ing. Quantifying and describing (on a statistical or mechanistic level) the interac-tions of CPPs and CQAs can be considered the key step to the demonstration ofprocess understanding and also of a quality by design submission. The mathemat-ical description of CPP and CQA interactions is referred to as “knowledge space”(Figure 1.17). This multidimensional space of process parameters carries theinformation on how CQAs change as a function of CPPs. The subset of CPPranges where the quality attributes of the drug product as defined by the CQAsare met is referred to as “design space.” Within the design space all combinations
Figure 1.16 The QbD puzzle is composed of risk management (ICH Q9), risk-based manufac-turing process development (ICH Q8), and a quality management system (ICH Q10).
82 1 Bacterial Suspension Cultures

of CPPs lead to the desired CQAs of the drug and therefore also meet all require-ments as defined in the QTPP. Within the design space, intended and notintended changes of critical process parameters do not compromise drug productquality. This allows the regulatory authorities to grant the freedom to the manufac-turer to operate freely within the boundaries of the design space. This regulatoryflexibility is highly desired by the manufacturing industry, for example, to respondto unintended changes such as variations in material quality attributes or otherprocess variations. Basic elements of QbD including risk assessment, the defini-tion of CPPs and CQAs, as well as the development of the design and knowledgespace are exemplified in the A-mAb case study [42]. The basic QbD concept forprocess development is outlined, reviewed, and commented on in several recentcontributions and textbooks [69–74].
Process analytical technology (PAT) emerged as a key element of process devel-opment and manufacturing along QbD principles. PAT is defined as a “system todesign, analyze and control manufacturing through timely measurements.” Ide-ally, critical process parameters (CPPs) or even critical quality attributes (CQAs)can be measured in real-time (i.e., at the time of processing). In combination withthe process understanding developed during process development, PAT aims toassess (analyze) and even control drug quality. Depending on the objective, aplethora of analytical devices based on various measurement principles capable ofbeing implemented as PAT are commercially available, as discussed for bio-pharmaceutical applications elsewhere [75]. However, it should be stressed at thispoint that timely measurements alone or just linking an online monitoring deviceto the process are not PAT approaches. PAT evolves as a combination of timely
Figure 1.17 Knowledge space, design space, and operating space.
1.6 Quality by Design: Vision or Threat for Twenty-First Century Pharmaceutical Manufacturing 83

measurements and its purposeful use is for the development of process under-standing (during process development). PAT can also be a tool to make use ofprocess understanding within manufacturing (control on the basis of processunderstanding). Typically, a PAT system is composed of the process analyticalmeasurement device embedded in a control or process analysis strategy.
Understanding of the CPPs impact on the process as well as timely informationon the process state through PAT also acts as the basis for the development of acontrol strategy. A control strategy aims at ensuring that the CQAs stay within thedesired range. Although not considered the final goal of QbD and PAT, QbD canlead to potential real-time release. Hence it can grant the possibility to releaseproducts without final product testing.
1.6.3Entry Points to QbD for Manufacturers
ICH Q11 distinguishes between “classical” and “enhanced” submission processesfor pharmaceutical drugs, whereby the latter refers to the implementation of QbDelements [76]. Furthermore, future submission processes can also be a combina-tion of both [76]. Hence, the industry is not forced to enforce full QbD in a fewyears but can implement step by step QbD elements. As an example, the industrycan choose to introduce a PAT application for a single unit operation. However,since QbD is conceptually holistic, this gradual implementation is in the authors’opinion not believed to show the full industrial benefit. In the authors’ opinionQbD will unfold the most benefit if (i) implemented as early as possible (immedi-ately after drug discovery) and (ii) applied in a holistic fashion spanning the wholeproduct lifecycle using the combination of tools outlined in ICH Q8, Q9, and Q10.Furthermore, existing processes can possibly be upgraded to QbD processes usinghistorical data to allow process optimization, which would show an immediatebenefit.
1.6.4Challenges for Putting QbD Into Practice
The concepts of QbD have been developed and discussed in the pharmaceuticalindustry for more than a decade. However, there is, to our knowledge, still nosingle full QbD process including design space approved by the regulatory author-ities. The main challenges for putting QbD into practice are listed here:
� Industrial doubt and vague regulatory guidance: From a manufacturers’ per-spective submitting a QbD dossier is accompanied with high risk. A significanthigher amount of investment must be made in the initial phases of productdevelopment. In these early stages, the additional regulatory flexibility grantedby the regulatory authorities cannot be predicted. Even more difficult is the pre-diction of the economic benefit of a possible future higher degree of regulatoryflexibility (which is not specified in detail). Summarizing, it is difficult to assess
84 1 Bacterial Suspension Cultures

whether submitting a QbD process is an economically reasonable decision. Fur-thermore, the regulatory guidance is still vague, complicating the assessment ofrisk and benefit of a QbD submission.
� Industrial hesitation to share information with the regulatory authorities: Fordecades it has been pharmaceutical practice to share as little processing infor-mation as possible with the regulatory authorities. Sharing information onfailed batches is still unthinkable for manufacturers. However, the developmentof mutual trust between industry and regulatory authorities demands opencommunication. To put QbD into practice, the regulatory authorities and theindustry have to communicate openly and at eye level.
� Validity of risk assessment: Risk assessments for ranking of the criticality ofprocess parameters are carried out using a team of experts. Parameters selectedas critical within the risk assessment are then selected for the design andknowledge space development. Risk assessments are per se highly subjectiveand can rarely be reproduced once the team of experts is changed. However,the decision of criticality propagates to design space development. In caseswhere the regulatory authorities disagree with the criticality assessment (e.g.,one parameter is assessed as non-critical although the regulatory authoritiesconsidered this parameter critical within the review process), the design spacecannot be approved.
� Validation of the design space: Following risk assessment, multivariate studiestake place leading to the development of a design space. These studies are typi-cally carried out in laboratory-scale bioreactors. Here the question of scalabilityof the design space arises. Are the effects at 10 000-liter scale the same as at10-liter scale? Do scale dependent effects interfere with CPP/CQA interactions?Is the down-scale model correct and how can it be validated? In cases where thescalability of the design space is not proven, it is highly questionable whether itcan be approved by the regulatory authorities. However, it is generally under-stood that the design space cannot be validated entirely at the target scale. As aresolution to this dilemma, the current solution for the validation of the designspace is the demonstration that the process delivers the expected product qual-ity at some operating points only.
1.6.5Process Understanding for Biopharmaceutical Processes
In biopharmaceutical upstream processes, highly complex molecules areassembled by living organisms. The cell can be considered as the primary produc-tion unit (Figure 1.18). Hence, highly complex cellular processes are responsiblefor quality, safety, and efficacy of the drug product. In a QbD context, this posesimmense challenges to the demonstration of process understanding. Changes inprocess parameters do not directly impact critical quality attributes, but initiate achange in the physiological status and biochemistry of the cell [59]. The questionarises, whether the sound description of the cellular changes (changes in the
1.6 Quality by Design: Vision or Threat for Twenty-First Century Pharmaceutical Manufacturing 85

assembling unit) is obligatory for the demonstration of “process understanding.”In this context, the authors’ aim at differentiating three different levels of processunderstanding:
1) Statistical process understanding: using statistical tools to prove and quantifythe impact of CPPs on CQAs. This is typically done using multi-linear regres-sion models.
2) Statistical process understanding plus mechanistic hypothesis: the identifiedstatistical correlations can be interpreted on the basis of scientific hypotheses(e.g., multi-linear regression coefficients can be clearly interpreted).
3) Mechanistic process understanding: the impact of CPPs on the productionunit as well as its impact on the CQAs can be described using a mechanisticmodel.
While the A-mAb case study [42] only focuses on statistical process understand-ing, the level and quality of process understanding demanded by the regulatoryauthorities is still a topic of speculation. However, it is safe to assume that thelevel and quality of process understanding demonstrated within the regulatorysubmission will directly impact the degree of regulatory flexibility and trustgranted by the regulatory authorities.
1.6.5.1 Quality by Design – Opportunity or Threat for the Pharmaceutical Industry?QbD was conceived by the regulatory authorities to promote science- and risk-based approaches in pharmaceutical manufacturing and to facilitate innovation.Although a full QbD process is not yet approved by the regulatory authorities,QbD has already initiated change in both the pharmaceutical industry and theregulatory authority organizations:
Figure 1.18 The cell as primary production unit determines product quality. In extracellular pro-duction, process parameters can also influence product quality attributes directly. Figure isadapted from Reference [59].
86 1 Bacterial Suspension Cultures

1) QbD fueled investment in research and development in the pharmaceuticalprocess sciences;
2) QbD initiated the increased use of risk assessment and risk managementtools;
3) QbD fueled the hire of statisticians both on side of the industry as well as onside of the regulatory authorities.
QbD may result in increasing costs during process development (design space,PAT strategy, control strategy establishment). On the other hand, this initial invest-ment can result in cost savings at later stages of the product lifecycle. Table 1.13summarizes further benefits of implementing QbD.
The realization of QbD in the pharmaceutical world is still in its infancy andmany open questions need to be resolved. However, despite the slow process ofadapting QbD principles in pharmaceutical manufacturing, it is a common under-standing that QbD “won’t go away.” Hence, in our opinion the industry musteagerly respond to these new paradigms of manufacturing and actively shape thefuture of QbD by using mechanistic approaches, as encouraged by ICH Q11. Ifnot, QbD is likely to become a regulatory imperative rather than a mutual effort toincrease drug product quality and therefore patient safety.
1.7Process Economics
This section briefly discusses general design aspects with impact on processeconomics.
1.7.1Optimization of Overall Productivity and Capital Expenses of the Production Facility
Operating a production facility aims at optimizing the product output, while mak-ing optimum use of the installed assets. Hence there is a trade-off to be foundbetween capital and operating expenses.
Capital expenses consist of the installation of equipment of an integrated bio-pharmaceutical process. The first principle objective for an appropriate facility
Table 1.13 Benefits of the implementation of QbD (quality by design).
Benefit
1 Higher degree of process understanding2 Less failed batches through better investigated manufacturing processes3 More efficient and effective control of change4 Increased regulatory flexibility5 Return on investment6 Continuous improvement of processes
1.7 Process Economics 87

design is balancing the durations of USP (upstream processing) and DSP (down-stream processing) unit operations. USP usually consists of seed stage, produc-tion, harvesting, and isolation. DSP consists of purification steps, usually asequence of chromatography and ultra- and diafiltration steps. The rate-limitingstep of batch scheduling is determined on the one hand by the longest unit opera-tion and on the other hand by the longest occupation of a production suite (inwhich only one batch at a time can be processed and which consists of multipleunit operations). This can be analyzed using time and motion analysis tools (e.g.,Batch Plus of Aspen Tech, Schedule Pro of Intelligen).
The unit operation of the longest duration in mammalian cultures is theproduction step itself. Typically, multiple bioreactors are run for cascaded har-vesting. In microbial processes, however, the identification of the unit opera-tion of the longest duration is not that obvious. For bacterial processes, theproduction can be finished in three days including cleaning and preparation.In contrast to all other biopharmaceutical processes, the intracellular productlocation in E. coli may shift the rate-limiting unit operation to the refoldingstep. Irrespective of whether continuous or fed-batch processing is selected,slow refolding kinetics cannot be overruled in cases were reasonable refoldingrecovery yields are targeted. When the rate limiting unit operation is not theproduction bioreactor, the seeding tasks can be shifted into the production bio-reactor and seed steps can be omitted. This is possible as bacteria have theability to grow also at very small inoculum fractions.
1.7.2Further Economic Effects by Intracellular Product Location
In cases of intracellular product location, additional unit operations have to beinstalled (Figure 1.6). Such unit operations require not only additional equipmentin the process chain itself (homogenizer, high speed centrifuge, solubilization ves-sel, diafiltration for solvent removal, refolding tank) but also additional buffertanks for the operation.
As a consequence, those buffer tanks may need their own additional floor forpreparation and holding of buffers. Additionally, corrosion resistant material ofconstruction (1.4539, 904L or Hastelloy C22) is needed for the harsh process con-ditions (using 3 M urea or 6 M guanidine�HCl) in the solubilization steps of inclu-sion bodies. The reader should also keep in mind that any solvent or chemicaladded to the process must also leave the process. Hence, the solubilization buffersmay also require a separate waste collection system and, subsequently, solutionsfor the disposal of the waste.
1.7.3Comparison of Product Yields, Intracellular Versus Extracellular
We finish this chapter with a comparison of the final product yield, which can beobtained by extracellular or intracellular product location.
88 1 Bacterial Suspension Cultures

Table1.14
Com
parisonof
titersan
dstep
yields
forextracellular,pe
riplasmic,and
intracellularinclusionbo
dy(IB)processes.
Unitop
eration
Step
yield(g
g�1 )
Con
centratio
n(g
l�1bioreactor
volume)
Extracellular
IntracellularPP
SIntracellularIBs
Extracellular
IntracellularPP
SIntracellularIBs
Pro
duct
ion
——
3.00
3.00
20.0
0C
entr
ifu
gati
on/m
icrofi
ltrat
ion
0.90
0.90
0.90
2.70
2.70
18.0
0C
elld
isru
ptio
n—
0.90
0.85
—2.
4315
.30
Cen
trif
uga
tion
ofce
llde
bris
—0.
900.
90—
2.19
13.7
7So
lubi
lizat
ion
ofin
clu
sion
bodi
es—
—0.
85—
—11
.70
Diafi
ltrat
ion
for
solv
ent
rem
oval
——
0.95
——
11.1
2R
efol
din
g—
—0.
50—
—5.
56C
hro
mat
ogra
phy
10.
900.
900.
902.
431.
975.
00U
ltrafi
ltrat
ion
10.
900.
900.
902.
191.
774.
50C
hro
mat
ogra
phy
20.
900.
900.
901.
971.
594.
05U
ltrafi
ltrat
ion
20.
900.
900.
901.
771.
433.
65C
hro
mat
ogra
phy
30.
900.
900.
901.
591.
293.
28U
ltrafi
ltrat
ion
30.
900.
900.
901.
431.
162.
95C
once
ntr
atio
n¼fi
nal
bulk
0.95
0.95
0.95
1.36
1.10
2.81
Overallprocessyield
0.45
0.37
0.14
1.36
1.10
2.81
1.7 Process Economics 89

In the near future product titers of 3–5 g l�1 in the extracellular medium and inthe periplasmic space exiting the bioreactor can be expected. However, whenexpressed as inclusion bodies, a product titer of up to 20 g l�1 at the exit of thebioreactor is an expected value. Hence, which process would yield the higher pro-ductivity? Table 1.14 uses typically achieved step recoveries to compare the per-formance of the overall process of the three product scenarios. The total yield ofthe inclusion body process decreases drastically due to the multiple additional unitoperations and the still lousy refolding recovery. The overall titer remains favor-able, though, compared to soluble products. However, factors like batch cycletime, lower investment costs, and lower processing risk will clearly drive develop-ment to extracellular and soluble products in the future!
References
1 Baneyx, F. (1999) Recombinant proteinexpression in Escherichia coli. Curr. Opin.Biotechnol., 10, 411–421.
2 Dechema e.V (2004) Wei�e Biotechnologie:Chancen f€ur Deutschland, Dechema e.V.
3 Scott, C. (2008) In the bioprocess zone: thestate of the art is science. BioProcess Int.,6, 8–20.
4 Jakovcic, K. (2007) Biomanufacturingstrategies: market drivers, build-vs-buydecisions and opportunities in contractrelationship management, BusinessInsights Ltd. www.business-insights.com.
5 Sinclair, A. (2009) An industry intransition. BioProcess Int., 7, 1.
6 Smales, C.M., James, D., Popplewell, A.,Sehdev, M. et al. (2005) Expression ofAntibody Fragments by PeriplasmicSecretion in Escherichia coli, in TherapeuticProteins, Humana Press, pp. 17–30.
7 Tatum, E.L. and Lederberg, J. (1947) Generecombination in the bacteriumEscherichia coli. J. Bacteriol.,53, 673–684.
8 Benzer, S. (1961) On the topography of thegenetic fine structure. Proc. Natl. Acad. Sci.USA, 47, 403–415.
9 Cohen, S.N. and Chang, A.C. (1973)Recircularization and autonomousreplication of a sheared R-factor DNAsegment in Escherichia coli transformants.Proc. Natl. Acad. Sci. USA, 70, 1293–1297.
10 Huang, C.-J., Lin, H., and Yang, X. (2012)Industrial production of recombinanttherapeutics in Escherichia coli and its
recent advancements. J. Ind. Microbiol.Biotechnol., 39, 383–399.
11 Lee, S.Y. (1996) High cell-densityculture of Escherichia coli. TrendsBiotechnol., 14, 98–105.
12 Terpe, K. (2006) Overview of bacterialexpression systems for heterologous proteinproduction: from molecular and biochemicalfundamentals to commercial systems. Appl.Microbiol. Biotechnol., 72, 211–222.
13 Striedner, G., Cserjan-Puschmann, M.,Potschacher, F., and Bayer, K. (2003)Tuning the transcription rate ofrecombinant protein in strong Escherichiacoli expression systems through repressortitration. Biotechnol. Prog., 19, 1427–1432.
14 Wickstrum, J.R., Skredenske, J.M.,Balasubramaniam, V., Jones, K. et al. (2010)The AraC/XylS family activator RhaSnegatively autoregulates rhaSR expressionby preventing cyclic AMP receptor proteinactivation. J. Bacteriol., 192, 225–232.
15 Sagmeister, P., Schimek, C., Meitz, A.,Herwig, C. et al. (2013) Tunablerecombinant protein production with E.coli in a mixed feed environment, Appl.Microbiol. Biotechnol. Dec 14. [Epub aheadof print]
16 Vethanayagam, J.G. and Flower, A.M.(2005) Decreased gene expression from T7promoters may be due to impairedproduction of active T7 RNA polymerase.Microb. Cell Fact., 4, 3.
17 Sambasivarao, Y., Jasmin, A., Kuska, B.,and Rajeev, P. (2012) PCR analysis:
90 1 Bacterial Suspension Cultures

detection of bacteriophage contamination inbiotechnology used to produce recombinantdrugs. J. Sci. (JOS), 3, 201–204.
18 Padan, E. and Schuldiner, S. (1986)Intracellular pH regulation in bacterialcells. Methods Enzymol., 125, 337–352.
19 Missiakas, D. and Raina, S. (1997) Proteinfolding in the bacterial periplasm. J.Bacteriol., 179, 2465–2471.
20 Bardwell, J.C., McGovern, K., andBeckwith, J. (1991) Identification of aprotein required for disulfide bondformation in vivo. Cell, 67, 581–589.
21 Pugsley, A.P. (1993) The complete generalsecretory pathway in Gram-negativebacteria. Microbiol. Rev., 57, 50–108.
22 Sargent, F., Berks, B.C., and Palmer, T.(2006) Pathfinders and trailblazers: aprokaryotic targeting system for transportof folded proteins. FEMS Microbiol. Lett.,254, 198–207.
23 Choi, J.H. and Lee, S.Y. (2004) Secretoryand extracellular production of recombinantproteins using Escherichia coli. Appl.Microbiol. Biotechnol., 64, 625–635.
24 Sommer, B., Friehs, K., and Flaschel, E.(2010) Efficient production of extracellularproteins with Escherichia coli by means ofoptimized coexpression of bacteriocinrelease proteins. J. Biotechnol., 145,350–358.
25 van der Wal, F.J., Luirink, J., and Oudega,B. (1995) Bacteriocin release proteins:mode of action, structure, andbiotechnological application. FEMSMicrobiol. Rev., 17, 381–399.
26 Jazini, M. and Herwig, C. (2013) Substrateoscillations boost recombinant proteinrelease from Escherichia coli. BioprocessBiosyst. Eng., 1–10.
27 Upadhyay, A.K., Murmu, A., Singh, A., andPanda, A.K. (2012) Kinetics of inclusionbody formation and its correlation with thecharacteristics of protein aggregates inEscherichia coli. PLoS One, 7, e33951.
28 Baneyx, F. and Mujacic, M. (2004)Recombinant protein folding andmisfolding in Escherichia coli. Nat.Biotechnol., 22, 1399–1408.
29 Singh, S.M. and Panda, A.K. (2005)Solubilization and refolding of bacterialinclusion body proteins. J. Biosci. Bioeng.,99, 303–310.
30 Panda, A.K. (2003) Bioprocessing oftherapeutic proteins from the inclusionbodies of Escherichia coli. Adv. Biochem.Eng. Biotechnol., 85, 43–93.
31 Schlegl, R., Tscheliessnig, A., Necina, R.,Wandl, R. et al. (2005) Refolding of proteinsin a CSTR. Chem. Eng. Sci., 60, 5770–5780.
32 Maachupalli-Reddy, J., Kelley, B.D., andDe Bernardez Clark, E. (1997) Effect ofinclusion body contaminants on theoxidative renaturation of hen egg whitelysozyme. Biotechnol. Prog., 13, 144–150.
33 Batas, B., Schiraldi, C., and Chaudhuri, J.B.(1999) Inclusion body purification andprotein refolding using microfiltrationand size exclusion chromatography.J. Biotechnol., 68, 149–158.
34 Sagmeister, P., Wechselberger, P., Jazini,M., Meitz, A. et al. (2013) Soft sensorassisted dynamic bioprocess control:efficient tools for bioprocess development.Chem. Eng. Sci., 96, 190–198.
35 Neubauer, P., Lin, H.Y., and Mathiszik, B.(2003) Metabolic load of recombinantprotein production: inhibition of cellularcapacities for glucose uptake andrespiration after induction of aheterologous gene in Escherichia coli.Biotechnol. Bioeng., 83, 53–64.
36 Yang, M., Johnson, S.C., and Murthy, P.P.(2012) Enhancement of alkaline phytaseproduction in Pichia pastoris: influence ofgene dosage, sequence optimization andexpression temperature. Protein Expr. Purif.,84, 247–254.
37 Sagmeister, P., Kment, M., Wechselberger,P., Meitz, A. et al. (2013) Soft-sensorassisted dynamic investigation of mixedfeed bioprocesses. Process Biochem..48, 1839–1847.
38 Song, H. and Lee, S.Y. (2006) Production ofsuccinic acid by bacterial fermentation.Enzyme Microb. Technol., 39, 352–361.
39 Zhu, Y., Rinzema, A., Tramper, J., and Bol,J. (1996) Medium design based onstoichiometric analysis of microbialtransglutaminase production byStreptoverticillium mobaraense. Biotechnol.Bioeng., 50, 291–298.
40 Mandenius, C.F. and Brundin, A. (2008)Bioprocess optimization using design-of-experiments methodology. Biotechnol. Prog.,24, 1191–1203.
References 91

41 Eiteman, M.A. and Altman, E. (2006)Overcoming acetate in Escherichia colirecombinant protein fermentations. TrendsBiotechnol., 24, 530–536.
42 CMC Biotech-Working-Group (2009)A-Mab: a Case Study in BioprocessDevelopment. http://www.casss.org/associations/9165/files/A-Mab_Case_Study_Version_2-1.pdf.
43 Glick, B.R. (1995) Metabolic load andheterologous gene expression. Biotechnol.Adv., 13, 247–261.
44 Wong, H.H., Kim, Y.C., Lee, S.Y., andChang, H.N. (1998) Effect of post-inductionnutrient feeding strategies on theproduction of bioadhesive protein inEscherichia coli. Biotechnol. Bioeng.,60, 271–276.
45 Shin, C.S., Hong, M.S., Bae, C.S., and Lee,J. (1997) Enhanced production of humanmini-proinsulin in fed-batch cultures athigh cell density of Escherichia coli BL21(DE3)[pET-3aT2M2]. Biotechnol. Prog.,13, 249–257.
46 Song, J.M., An, Y.J., Kang, M.H., Lee, Y.H.et al. (2012) Cultivation at 6–10 degrees C isan effective strategy to overcome theinsolubility of recombinant proteins inEscherichia coli. Protein Expr. Purif.,82, 297–301.
47 Luli, G.W. and Strohl, W.R. (1990)Comparison of growth, acetate production,and acetate inhibition of Escherichia colistrains in batch and fed-batchfermentations. Appl. Environ. Microbiol.,56, 1004–1011.
48 ASME (2009) Bioprocessing Equipment:ASME BPE Guidelines, ASME.
49 Dillon, C.P., Rahoi, D.W., and Tuthill, A.H.(1992) Stainless steel for bioprocessing.BioPharm, 5, 32.
50 Lydersen, B.K., D’Elia, N.A., and Nelson,K.L. (1994) Bioprocess Engineering: Systems,Equipment and Facilities, John Wiley &Sons, Inc., New York.
51 DECHEMA (1991) Standardisierungs- undAusr€ustungsempfehlungen f€urBioreaktoren und periphere Einrichtungen,Frankfurt am Main DECHEMA.
52 Stanbury, P.F., Whitaker, A., and Hall, S.J.(1995) Principles Of FermentationTechnology, Butterworth Heinemann.,Burlington, MA.
53 Doran, P.M. (1995) Bioprocess EngineeringPrinciples, Elsevier Science & TechnologyBooks, London.
54 Najafpour, G.D. (2007) BiochemicalEngineering and Biotechnology, Elsevier,Oxford.
55 Lourenco, N.D., Lopes, J.A., Almeida, C.F.,Sarraguca, M.C. et al. (2012) Bioreactormonitoring with spectroscopy andchemometrics: a review. Anal. Bioanal.Chem., 404, 1211–1237.
56 Dietzsch, C., Spadiut, O., and Herwig, C.(2013) On-line multiple componentanalysis for efficient quantitative bioprocessdevelopment. J. Biotechnol., 163, 362–370.
57 Broger, T., Odermatt, R.P., Huber, P., andSonnleitner, B. (2011) Real-time on-lineflow cytometry for bioprocess monitoring.J. Biotechnol., 154, 240–247.
58 Luttmann, R., Bracewell, D.G., Cornelissen,G., Gernaey, K.V. et al. (2012) Soft sensorsin bioprocessing: A status report andrecommendations. Biotechnol. J., 7,1040–1047.
59 Sagmeister, P., Wechselberger, P., andHerwig, C. (2012) Information processing:rate-based investigation of cell physiologicalchanges along design space development.PDA J. Pharm. Sci. Tech., 66, 526–541.
60 Wechselberger, P., Sagmeister, P., andHerwig, C. (2013) Real-time estimation ofbiomass and specific growth rate inphysiologically variable recombinant fed-batch processes. Bioprocess Biosyst. Eng.,36, 1205–1218.
61 Jobe, A.M., Herwig, C., Surzyn, M., Walker,B. et al. (2003) Generally applicable fed-batch culture concept based on thedetection of metabolic state by on-linebalancing. Biotechnol. Bioeng., 82, 627–639.
62 Eibl, R., Kaiser, S., Lombriser, R., and Eibl,D. (2010) Disposable bioreactors: thecurrent state-of-the-art and recommendedapplications in biotechnology. Appl.Microbiol. Biotechnol., 86, 41–49.
63 Galliher, P.M., Hodge, G., Guertin, P.,Chew, L. et al. (2010) Single-use BioreactorPlatform for Microbial Fermentation, inSingle-Use Technology in BiopharmaceuticalManufacture, John Wiley & Sons, Inc.,Hoboken, pp. 241–250.
64 ICH (2009) Q8(R2), PharmaceuticalDevelopment.
92 1 Bacterial Suspension Cultures

65 FDA (2004) Pharmaceutical cGMPS for the21st Century — A Risk-Based Approach.
66 ICH (2005) Q9, Quality Risk Management.67 ICH (2008) Q10, Pharmaceutical Quality
System.68 FDA (2003) Guidance for Industry PAT-A
framework for Innovative PharmaceuticalDevelopment, Manufacturing, and QualityAssurance.
69 Schmitt, S.E. (2011) Quality by Design:Putting Theory Into Practice, ParenteralDrug Association.
70 Rathore, A.S. (2009) Roadmap forimplementation of quality by design (QbD)for biotechnology products. TrendsBiotechnol., 27, 546–553.
71 Read, E.K., Park, J.T., Shah, R.B., Riley, B.S.et al. (2009) Process analytical technology(PAT) for biopharmaceutical products: PartI. concepts and applications. Biotechnol.Bioeng., 105, 276–284.
72 Read, E.K., Shah, R.B., Riley, B.S., Park, J.T.et al. (2009) Process analytical technology(PAT) for biopharmaceutical products: Part
II. Concepts and applications. Biotechnol.Bioeng., 105, 285–295.
73 Rathore, A.S., Yu, M., Yeboah, S., andSharma, A. (2008) Case study andapplication of process analytical technology(PAT) towards bioprocessing: Use of on-line high-performance liquidchromatography (HPLC) for making real-time pooling decisions for processchromatography. Biotechnol. Bioeng.,100, 306–316.
74 Harms, J., Wang, X., Kim, T., Yang, X., andRathore, A.S. (2008) Defining processdesign space for biotech products: Casestudy of Pichia pastoris fermentation.Biotechnol. Prog., 24, 655–662.
75 €Undey, C., ErtunSc, S., Mistretta, T., andLooze, B. (2010) Applied advanced processanalytics in biopharmaceuticalmanufacturing: challenges and prospects inreal-time monitoring and control. J. ProcessContr., 20, 1009–1018.
76 ICH (2009) Q11, Development andManufacture of Drug Substances.
References 93

Summary Box: Characteristics of Production System
Production systems,cells, and products
Expression systems type of cells Yeast, Saccharomyces cerevisiae and Pichia pastoris astypical representatives
Typical products preferred for theproduction of
Primary and secondary metabolites, heterologousproteins and biomass
Special products Biomass, ethanol, riboflavin, biopharmaceuticalproteins (e.g., hepatitis B vaccine, insulin, etc.)
System maturityProducts on the market
ISO and GMP yeast products on the market; potentialnot yet exhausted; system development continues
Characteristicsaffecting productquality
Secretion, product location, proteolysis Intracellular production and secretion
Post-translational modifications asdisulfide bonds, glycosylation, proteinmultimers, product size
All post-translational modifications possible.Glycosylation in S. cerevisiae: high-mannose typeglycosylation, inP. pastoris: low-mannose type (human likegylco-engineeredP. pastoris strains are available)
System robustness, solubility issues,endotoxins
Good robustness, no solubility problems andendotoxins
Systemscharacteristicsconcerning growthand productivity
Maximum specific growth rate,mmax (h�1)
S. cerevisiae approx. 0.4P. pastoris approx. 0.25
Maximum dry biomass concentration,xmax (g l�1)
S. cerevisiae 60–100P. pastoris 80–150
Maximum specific product productionrate, qP (mg g�1 � h�1)
S. cerevisiae 0.21 (insulin)P. pastoris 0.375 (insulin)
Maximum volumetric productproduction rate, rP (mg l�1 � h�1)
S. cerevisiae 25 (HSA extra cellular protein)P. pastoris 42 (extracellular protein)P. pastoris 160 (intracellular protein)
Maximum product titres, cp,max (g l�1) Ethanol (15%), protein intracellular 10–20Protein secreted <5
Specific maintenance, ms (g g�1 �h�1) 0.016 g � g�1 � h�1 (P. pastoris)
Yield coefficients YX/S andYP/S (g g�1)
P. pastoris YX/Glucose¼ 0.55YX/Methanol¼ 0.42
Energy and carbon sourceSpecial nutritional requirements
Carbon 46–52% (w/w)Nitrogen 6–9% (w/w)Phosphor 0.8–2.6% (w/w)Sulfur 0.01–0.25% (w/w)
Maximum oxygen uptake rate,OURmax (mmol l�1 �h�1)Specific oxygen consumption(mmol g�1 h�1)
480 mmol � l�1 � h�1 for a P. pastoris/methanol culturewith a biomassconcentration of 100 g l�1.4.8� 0.5 mmol g�1 h�1
Heat production rate (W m�3)Specific heat production
67 000 (P. pastoris/methanol, 100 g l�1)0.67� 0.007 W g�1
Typical duration from inoculation of aproduction culture to harvest (days)
3–5
Systems shear sensitivity no special shear sensitivity
Preferred bioreactor designEquipment standard and typicalproduction scale
Continuous stirred-tank reactor (10 m3), disk stackcentrifuge
Most important production costdrivers of production culture
Man power, maintenance cost of bioreactor system,DSP
Process development cost aspectsDuration of process development
Development of strain, analytical methods,fermentation and purification; basic development6� 2 months
Key strengths of system High biomass yields
Key weaknesses of system Low specific production rates
Issues to be addressed in the future Increase of specific productivity, uncoupling of growthfrom product formation
94