Activities at Lone Star UAS Test Site and TAMUCC - UNOLS |
26
Activities at Lone Star UAS Test Site and TAMUCC An update Scientific Committee for Oceanographic Aircraft Research December 17, 2020 Bringing UAS to America’s Skies Presenter: Michael J. Starek Associate Professor Geospatial Systems Engineering
-
Upload
khangminh22 -
Category
Documents
-
view
1 -
download
0
Transcript of Activities at Lone Star UAS Test Site and TAMUCC - UNOLS |

Activities at Lone Star UAS Test Site and TAMUCCAn updateScientific Committee for Oceanographic Aircraft ResearchDecember 17, 2020
Bringing UAS to America’s Skies
Presenter: Michael J. StarekAssociate ProfessorGeospatial Systems Engineering

Update information provided by Tye Payne, Director of Operations, LSUASC
FAA Test Site: ~3600 flights and 250+ customers (to date)

• Four pilots scheduled to undergo training on Penguin C in Oregon in January/February 2021
• Functional Check Flights in South Texas completed August 2020 on Penguin B– NSF Grant focused on multi-sensor
(camera, geo-tracking, and methane) use in a high-endurance platform
– Functional Check Flights were also used to test small Ground-Based Radar system potentially crucial for manned & unmanned flight deconfliction during disaster operations
3
Penguin B/C

4
3D printed mount for Piccolo autopilot and differential GNSS
sniffer installed on mounting plate
Penguin B UAS for methane hydrates developed from NSF MRIDr. David Bridges, Dr. Rick Coffin, Dr. Mahdy, Dr. Starek of TAMUCC
Sony A6000 + GeoSnap Pro
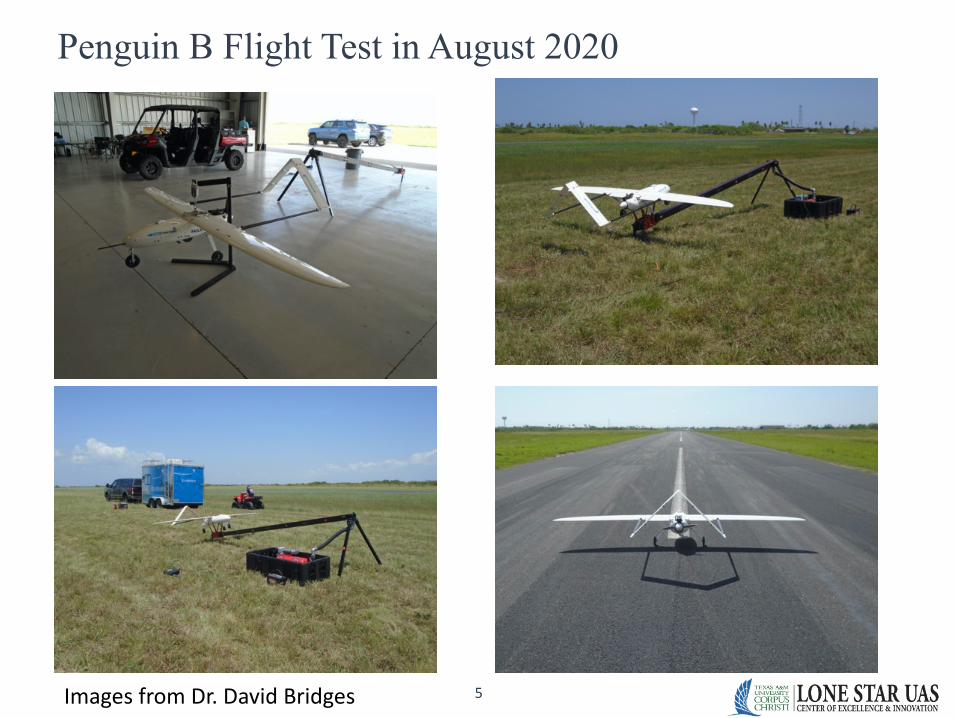
Penguin B Flight Test in August 2020
5Images from Dr. David Bridges

• Exercises conducted in October 2019 with Texas Task Force 1
– Swiftwater & Search Skills Set Training near Galveston, TX
• Hurricane Response along North Padre and Mustang Island following Hurricane Hanna
– Operations included coordination with County Judge, Corpus Christi Police Department and Corpus Christi Beach Task Force
• Monitoring of coastal beaches during and following mandatory shutdowns and closures during 2020 COVID response
6
sUAS Disaster Response
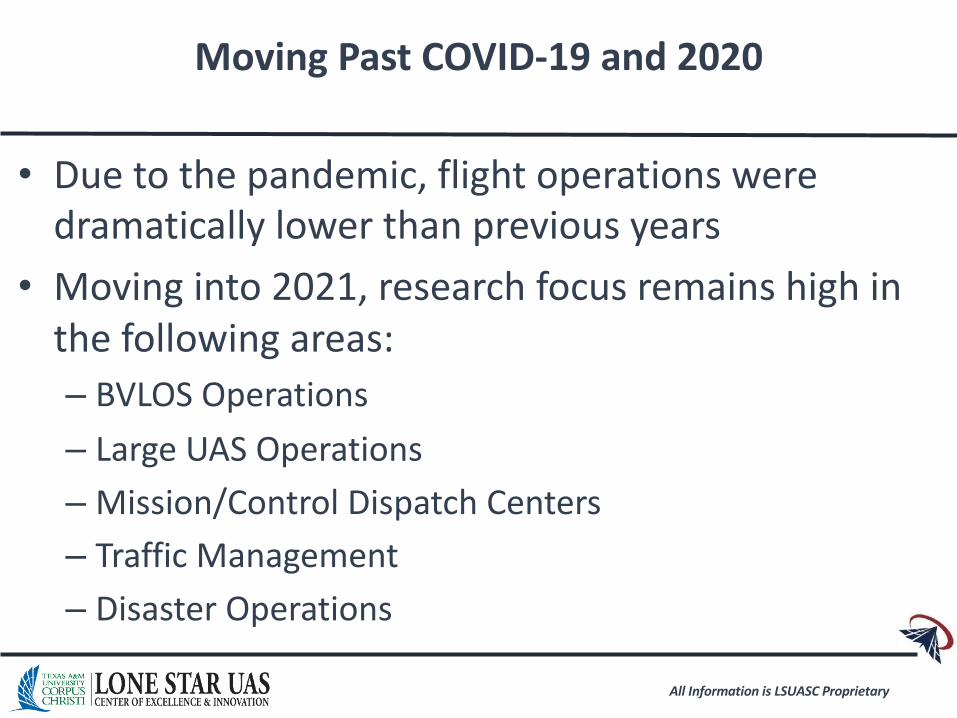
• Due to the pandemic, flight operations were dramatically lower than previous years
• Moving into 2021, research focus remains high in the following areas:– BVLOS Operations– Large UAS Operations– Mission/Control Dispatch Centers– Traffic Management– Disaster Operations
Moving Past COVID-19 and 2020
All Information is LSUASC Proprietary

UAS Activities at TAMUCC

New Project: Developing Survey-Grade Vertical Accuracy UAS Data for Shoreline Projects Using Real Time and Post-Processed Kinematic Solutions
Wingtra Onehybrid platformPPK GNSS and Sony RX1R II 42 MP
Local base station versus longer distance baseline CORS

Metashape vs Pix4D vs Drone2MapPPK GNSS only solutions, Water not masked during processing
# of photos = 550 | Avg. calibrated = 515GSD = 1.42 cm | Area = ~ 0.5 square km
Metashape > Strict processingDrone2Map & Pix4D > Default processing settings
Metashape Pix4D Drone2Map
Mus
tang
Isla
nd,
TX
SfM Generated Digital Surface Models (DSMs)
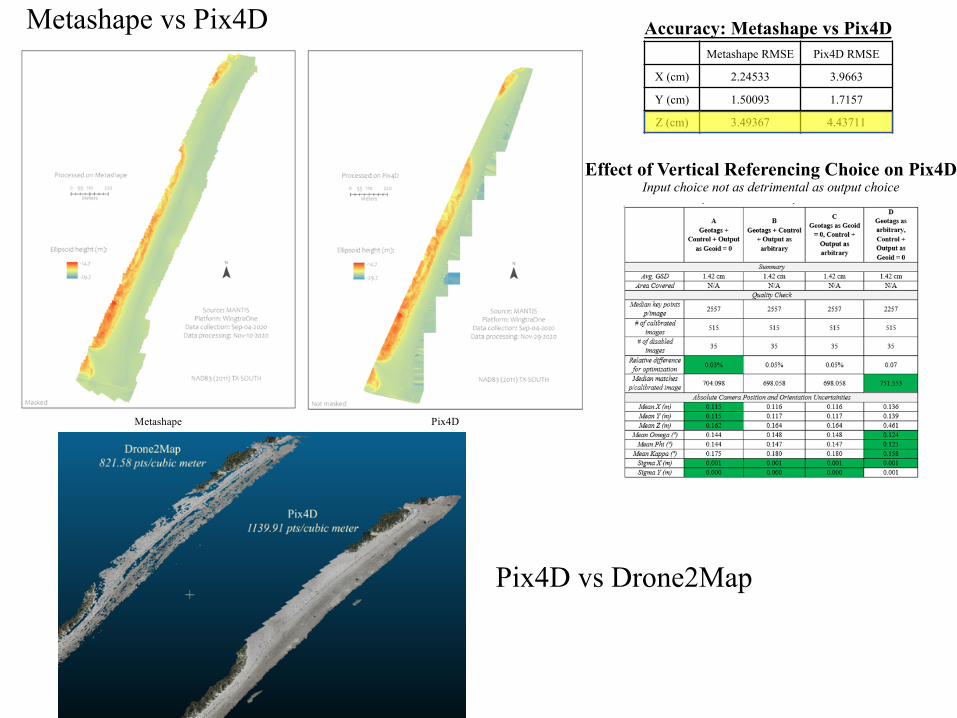
Metashape vs Pix4D
Metashape Pix4D
Metashape RMSE Pix4D RMSE
X (cm) 2.24533 3.9663
Y (cm) 1.50093 1.7157
Z (cm) 3.49367 4.43711
Accuracy: Metashape vs Pix4D
Pix4D vs Drone2Map
Effect of Vertical Referencing Choice on Pix4DInput choice not as detrimental as output choice
page012
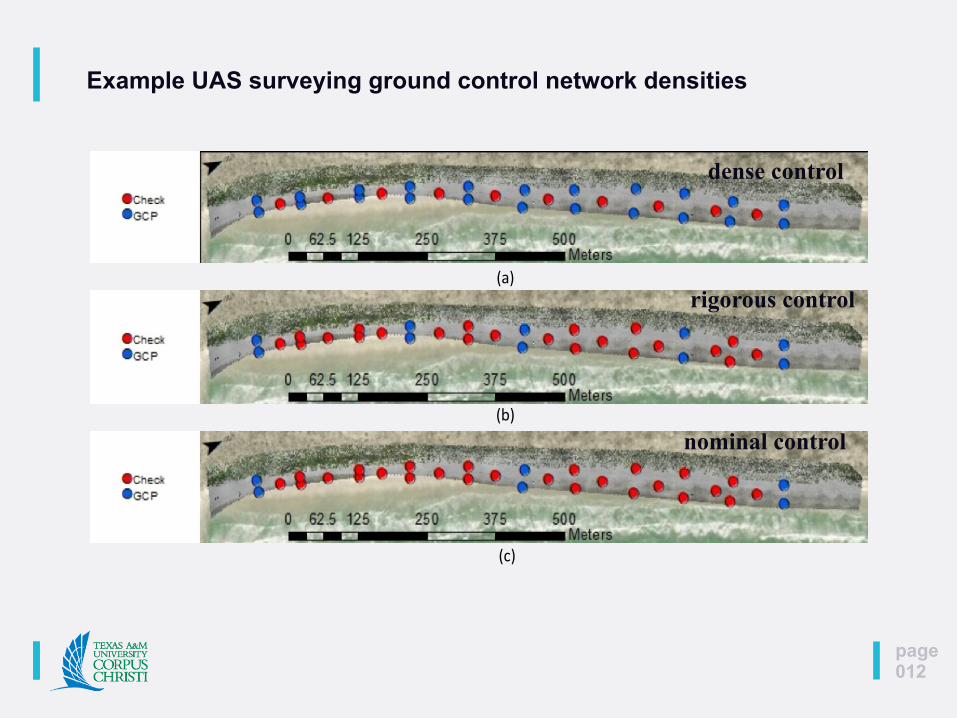
(a)
(b)
(c)
Example UAS surveying ground control network densities
dense control
rigorous control
nominal control

page013
Apalachicola NERR UAS Survey Little St. George Island, FL (September 2020)
Mapped the entire Gulf shoreline (9 miles) in 1 day using PPK only solution for georeferencing
SfM point cloud
SfM DEM
Hurricane Michael hit the region back in 2018

page014

Post-Hurricane Hanna UAS Flights for Nueces County, TX
Location: North Padre Island, TXDate: 07/29/20

Massive foredune cuts


UAS Photo-bathymetry?
• consumer-grade cameras
• cheap but limited to local scales
• flexible
(image source: NTS)

page019
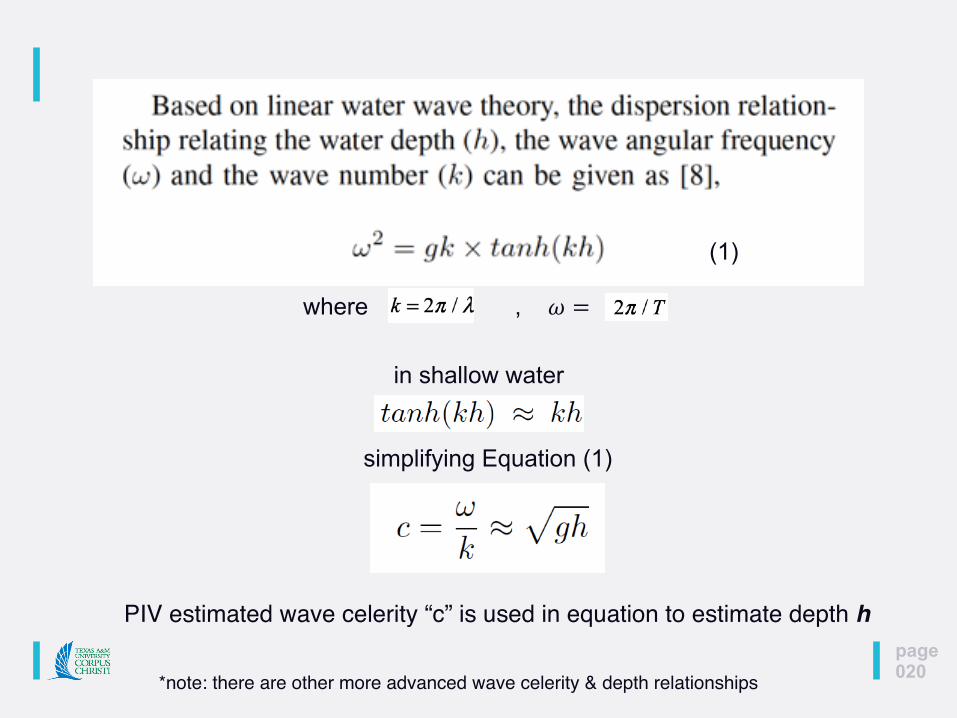
ExampleParticle Image Velocimetry (PIV) for Surf Zone (temporal approach)
Experiments conducted at Bob Hall Pier, TX(latest results from Summer 2019)
1. Python PIV sequential image pair2. Image stabilization3. Estimate velocity vector field 4. Estimate depth
page020
in shallow water
PIV estimated wave celerity “c” is used in equation to estimate depth h
simplifying Equation (1)
(1)
where , ! =
*note: there are other more advanced wave celerity & depth relationships

page021
- Automated wave crest velocities almost 3x slower compared to manual wave crest measurements throwing off the bathymetry calculations
- Yielded accurate sandbar shape and bathymetry profile shape- With compensation, within 5% of ground truth depths at 50 m & 30 fps
Jesse McDonald, Jason Pollard, Michael J. Starek, Dulal Kar. 2020 (in press). Surfzone Bathymetry Estimation Using Wave Characteristics Observed by Unmanned Aerial Systems. In IGARSS 2020-2020 IEEE International Geoscience and Remote Sensing Symposium. IEEE.

…
Video Frame Splitting
Real World Coord Reprojection to Image Coord.
Image rectification (local/world )
page022
ExamplecBathy: A robust algorithm for estimating nearshore bathymetry (spectral)
Phantom 4 Pro RTK
2Hz frame rate
Holman, R., Plant, N. and Holland, T., 2013. cBathy: A robust algorithm for estimating nearshore bathymetry. Journal of geophysical research: Oceans, 118(5), pp.2595-2609.

Calculation of Camera POSE in Time
Generation of Grid for Depth Calculation
Image Time Stack (Timex) for cBathy Algorithm Depth Estimated Map
Research in progress by TAMUCC MS student Larissa Freguete

Study was conducted back in 2015 forTPWD. Results recently published in Shore& Beach, 2020.

Questions?
Comments??
Contact: [email protected]
Contact:Dr. Michael J. StarekConrad Blucher InstituteSchool of Engineering and Computing [email protected]
Thank you SCOAR!