Acquisitions of solvent thrifts: Wealth effects and managerial motivations
20
Journalof BANKING & FINANCE ELSEVIER Journal of Banking & Finance 21 (1997) 1431-1450 Acquisitions of solvent thrifts: Wealth effects and managerial motivations Atul Gupta a,*, Richard L.B. LeCompte b, Lalatendu Misra c a Department of Finance, Bentley College, Waltham, MA 02154, USA b Wichita State University, Wichita, KS 67260, USA The University of Texas at San Antonio, San Antonio, TX 78249, USA Received 11 May 1995; accepted 6 June 1997 Abstract We examine voluntary acquisitions of solvent stock-held thrift institutions since 1979, and find that bidding firms suffered losses, target firms gained, and the impact of the merger on the bidder-target pair was positive on average. During the post-FIR- REA period acquirers experienced smaller losses and targets experienced smaller gains relative to the pre-FIRREA period. An investigation into the motives of bidding firm management provides evidence indicating the presence of synergy, agency, and hubris motivations in the pre-FIRREA period. Although the acquisitions environment under- went substantial changes in the post-FIRREA period, we find no evidence of corre- sponding changes in acquisition motivations. JEL classification." G21; G28 Keywords: Savings and loans; Mergers; Acquisitions; Managerial motives *Corresponding author. Tel.: (617) 891-2772; fax (617) 891-2896; e-mail: [email protected]. S0378-4266/97/$17.00 © 1997 Elsevier Science B.V. All rights reserved. PHS0378-4266(97)00026- 5
-
Upload
independent -
Category
Documents
-
view
1 -
download
0
Transcript of Acquisitions of solvent thrifts: Wealth effects and managerial motivations

Journalof BANKING &
FINANCE ELSEVIER Journal of Banking & Finance 21 (1997) 1431-1450
Acquisitions of solvent thrifts: Wealth effects and managerial motivations
Atul Gupta a,*, Richard L.B. LeCompte b, Lalatendu Misra c a Department of Finance, Bentley College, Waltham, MA 02154, USA
b Wichita State University, Wichita, KS 67260, USA The University of Texas at San Antonio, San Antonio, TX 78249, USA
Received 11 May 1995; accepted 6 June 1997
Abstract
We examine voluntary acquisitions of solvent stock-held thrift institutions since 1979, and find that bidding firms suffered losses, target firms gained, and the impact of the merger on the bidder-target pair was positive on average. During the post-FIR- REA period acquirers experienced smaller losses and targets experienced smaller gains relative to the pre-FIRREA period. An investigation into the motives of bidding firm management provides evidence indicating the presence of synergy, agency, and hubris motivations in the pre-FIRREA period. Although the acquisitions environment under- went substantial changes in the pos t -FIRREA period, we find no evidence of corre- sponding changes in acquisition motivations.
JEL classification." G21; G28
Keywords: Savings and loans; Mergers; Acquisitions; Managerial motives
* Corresponding author. Tel.: (617) 891-2772; fax (617) 891-2896; e-mail: [email protected].
S0378-4266/97/$17.00 © 1997 Elsevier Science B.V. All rights reserved. P H S 0 3 7 8 - 4 2 6 6 ( 9 7 ) 0 0 0 2 6 - 5

1432 A. Gupta et al. / Journal of Banking & Finance 21 (1997) 1431-1450
1. Introduction
This paper presents an empirical examination of the wealth effects, and mo- tivations underlying acquisitions of solvent, stock-held thrift institutions dur- ing the 1980s and early 1990s. The paper has two objectives. The first is an examination of the impact of the acquisition announcement on stock returns for both bidder and target firms. These abnormal return estimates are used to obtain the aggregate wealth impact of the acquisition on bidder-target pairs. The next objective is to obtain insight into the underlying motivations of bid- ding firm management in making acquisition bids by employing an approach similar to that used by Berkovitch and Narayanan (1993). In particular, we at- tempt to identify if any of three possible motivations - synergy, agency, and hubris - served as the dominant force driving these thrift acquisitions.
For a sample of 138 acquisitions over the 1979-1992 time period, we find that firms acquiring solvent, stock-held thrifts experience a statistically signifi- cant two-day announcement period abnormal return of-0.75%. Such acquir- ing firm losses are consistent with several studies of bidder returns in bank acquisitions during the 1980s (Baradwaj et al., 1991; Dubofsky and Fraser, 1989; Hannan and Wolken, 1989; Sushka and Bendeck, 1988), all of which re- port negative abnormal returns to bidding firms in acquisitions of solvent banks. Houston and Ryngaert (1994) also report negative average acquirer ab- normal returns of-2.32% over a five-day window for large bank mergers in the 1985-1991 period.
The enactment of the Financial Institutions Reform, Recovery, and En- forcement Act (FIRREA) in August 1989 significantly altered the environment of thrift acquisitions. Looking at pre- and post-FIRREA bids, we find that the average acquirer abnormal return for 78 acquisitions in the pre-FIRREA peri- od is -1.34%, and statistically significant, whereas the 60 post-FIRREA acqui- sitions yield acquiring firm average abnormal returns of 0.02%, which are not statistically significant. One explanation for such improved acquirer perfor- mance is that survival considerations in the more competitive post-F1RREA environment may have enhanced the willingness of target thrifts to be acquired. This in turn would reduce the cost of the acquisition for the acquirer. A second explanation draws on the significant decline in the relative size of these acqui- sitions in the post-FIRREA period; if the impact on acquiring finn wealth is positively related to the relative size of the merger, then a decline in relative ac- quisition size should result in a decline in the absolute size of the acquirer's stock price reaction.
Sixty-five of the 138 target firms in the sample were publicly traded and had sufficient returns data available to allow analysis of their abnormal returns. These target savings and loans (SLs) experienced a statistically significant two-day announcement period average abnormal return of 21.57%, a finding consistent with the literature on both financial and non-financial acquisitions.
A. Gupta et al. / Journal of Banking & Finance 21 (1997) 1431 1450 1433
The average dollar gain to the 65 combined bidder-target pairs, computed over the two-day announcement window, is $3.5 million. This positive aggregate wealth effect is consistent with the proposition that acquisitions of solvent stock-held thrifts were economically desirable transactions on average, in that they added to the aggregate wealth of the shareholders of the two firms.
Finally, the investigation into managerial motivations underlying solvent thrift acquisitions is conducted by examining the correlation between target gains and total gains, and the correlation between target gains and acquirer gains. We hypothesize that acquisitions motivated by synergy (agency) should yield a positive (negative) correlation between target and total gains, and the presence of hubris should yield a non-positive correlation between target and acquirer gains, at least for the sub-sample of mergers where the aggregate wealth gain is positive. The correlations are estimated for mergers occurring both pre- and post-FIRREA, and we utilize an empirical approach designed to control for the disproportionate increase in bank acquirers and the signifi- cant decline in target and relative size in post-FIRREA mergers. We find a sta- tistically significant positive (negative) correlation between target and total gains for mergers with positive (negative) total gains, and a statistically insig- nificant correlation between target and acquirer gains for the positive total gains sub-samples, both pre- and post-FIRREA. These results imply that all three motives were present in both pre-FIRREA and post-FIRREA acquisi- tions, and suggest that while FIRREA introduced many changes in the acqui- sitions environment, it did not result in any one acquisition motivation becoming predominant in the post-FIRREA period.
The rest of the paper is organized as follows. The economic and regulatory environment of thrift institutions, and possible motivations of acquiring firm management are outlined in Section 2. Sample characteristics are described in Section 3, and empirical methodology is briefly described in Section 4. Event study results and a discussion of the wealth effects is presented in Section 5. Re- sults from tests designed to distinguish between different managerial acquisi- tion motivations are presented in Section 6, followed by some concluding comments in Section 7.
2. Managerial motivations and the environment of thrift mergers
2.1. The pre -FIRREA environment
Starting in the early 1980s, legislative actions aimed at deregulating the fi- nancial sector enhanced the level of competition in the financial services indus- try. The removal of a variety of asset, liability, and geographic restrictions that existed prior to this period, the heightened level of competition, and lax regu- latory oversight resulted in increasing numbers of failures of thrift institutions,

1434 A. Gupta et al. / Journal of Banking & Finance 21 (1997) 1431-1450
which in turn led to a substantial increase in the number of mergers and acqui- sitions in the industry. Many weaker institutions sought healthy merger part- ners for survival, whereas stronger institutions viewed these potential target firms as providing opportunities for initial market penetration at a very low cost. Such mergers have also provided acquiring firms with opportunities to: (a) improve their capital position, (b) increase their deposits, and possibly re- duce their deposit costs, through buying and attracting new core deposit cus- tomers, and (c) expand their business relationship with current multi-market customers who are more likely to be attracted to institutions with many offices. The possibility of obtaining such synergistic gains may have been the underly- ing motivation for many of these transactions.
While possibilities for synergistic gains from mergers clearly existed during this period, the agency motive may have also driven some transactions. Agency motivated acquisitions can enhance managerial employment opportunities and perquisites, possibly at the expense of the firm's shareholders. Similarly, risk- reducing acquisitions could have penalized shareholders while adding to man- agerial job security. Finally, in addition to the synergy and agency motivations, it is possible that at least some of the mergers were driven by managerial hu- bris.
2.2. FIRREA." The impact on managerial motives
The passage of FIRREA opened up new investment opportunities for firms in the financial sector by permitting commercial banks to acquire solvent thrifts and removing constraints on inter-state acquisitions and state-wide branching. Since there is no reason why such changes should eliminate the potential gains from growth via acquisition that existed prior to FIRREA, synergy as an ac- quisition motive should continue to play a role in post-FIRREA mergers. In fact, as argued by Cornett and Tehranian (1989, 1990), larger firms may have a relative advantage when operating in an increasingly deregulated and com- petitive environment, making growth enhancement potentially consistent with value maximization or synergistic motivations.
By permitting commercial banks to acquire solvent stock-held thrift institu- tions the passage of FIRREA opened up an area of growth from which banks had so far been shut out. To the extent that some bank (and/or thrift) managers value potentially shareholder wealth reducing growth opportunities, this change provided fresh opportunities to implement such value reducing acqui- sitions. This suggests the possibility that an agency motive may also play an important role in post-FIRREA acquisitions of solvent thrifts. Finally, it is un- likely that the passage of FIRREA should by itself have any significant impact on the magnitude of managerial hubris. If hubris has a role in the market for corporate control, then the possibility of a subset of acquisitions being motivat- ed by hubris exists, both pre- and post-FIRREA.
A. Gupta et al. I Journal o f Banking & Finance 21 (1907) 1431 1450 1435
In sum, there does not appear to be any a priori reason why the passage of FIRREA should have changed managerial motives underlying the acquisition of solvent stock-held thrift institutions. In fact it seems logical to presume that different mergers would have differing underlying motivations, both pre- and post-FIRREA, and that our tests should reveal this diversity of motivations.
.2.3. FIRREA." The impact on shareholder wealth
One consequence of permitting commercial banks to acquire solvent thrifts was an increase in the level of competition in the financial services industry. The enhanced competition should have made it more difficult for smaller firms to compete, making them more willing to be acquired by a larger entity. This would enhance the likelihood of their survival, albeit in an altered organiza- tional setting as a subsidiary of the acquiring firm. Empirically, such increased willingness to be acquired should work to the benefit of acquiring firm share- holders, and implies that acquirer (target) gains should be larger (smaller) in post-FIRREA mergers. In contrast, the enhanced competition in the acquisi- tions market resulting from the entry of commercial banks as acquiring firms could be expected to reduce acquirer gains in the post-FIRREA period.
Another consequence of permitting commercial banks into this acquisitions market is an enormous increase in the average size of acquiring firms in post- FIRREA mergers. This increase, coupled with a 50% decline in average target size resulted in a steep decline in the relative size of the average transaction - relative size, measured as target assets divided by acquirer assets, of post-FIR- REA mergers is approximately 25% of pre-FIRREA transactions. This steep decline in the size of the mergers is expected to have had a dampening effect on the magnitude of acquirer abnormal returns in the post-FIRREA period.
3. Data
3.1. Sampling procedure
Acquirers of solvent stock-held thrift institutions whose bids were approved by the Federal Home Loan Bank Board (FHLBB) or the Office of Thrift Su- pervision (OTS) during the period 1979-1992 constitute the sample used in this study. An initial sample of mergers was compiled from a list provided by the OTS and articles from various issues of Savings Institutions magazine. The Wall Street Journal, the Wall Street Journal Index, the Dow Jones News Re- trieval System and the LEXISINEXIS database were used to identify an- nouncement dates for these transactions. The application of the following screens resulted in a total sample of 138 mergers involving solvent thrifts: 1. An identifiable merger announcement date could be discerned from the Wall
1436 A. Gupta et al. I Journal of Banking & Finance 21 (1997) 1431-1450
Street Journal Index, the Dow Jones News Retrieval Service, or the LEXIS/ N E X I S da tabase .
2. Da i ly securi ty re turns for the full s tudy pe r iod were avai lable f rom the C R S P N Y S E / A M E X or the C R S P N A S D A Q files.
3. The merge r a n n o u n c e m e n t was no t c o n t a m i n a t e d by the s imul taneous re- lease o f o ther subs tan t ive co rpo ra t e news.
4. News stories were examined to e l iminate acquis i t ions o f thr if t ins t i tu t ions tha t were ei ther F S L I C - , F D I C - , OTS-, or RTC-ass i s t ed or supervised. Ac- quis i t ions o f mu tua l SLs tha t cou ld be classified as merger convers ions and par t i a l acquis i t ions were also excluded.
3.2. Descriptive sample information
The 138 merger bids include 78 t ransac t ions in the p r e - F I R R E A pe r iod and 60 t r ansac t ions occur r ing af ter the enac tmen t o f F I R R E A in Augus t 1989. There are 28 acquis i t ions over the 1979-1985 per iod. The pace o f acquis i t ion act ivi ty acce lera ted f rom 1986 onward , and there are 38 bids over the three year pe r iod f rom 1986 to 1988. Twen ty -one acquis i t ions occur red dur ing 1989, 12 o f which were p r e - F I R R E A and nine t r ansac t ions fo l lowing its enac tment . The r ema inde r o f the bids occur red p o s t - F I R R E A , inc luding 10 in 1990 and 41 over 1991-1992.
The m a j o r i t y o f the acqu i r ing firms are thrifts, fo l lowed by commerc ia l bank ing inst i tut ions, wi th 67 and 56 acquis i t ions, respectively. The remain ing 15 acquis i t ions were m a d e by o the r f inancial inst i tut ions. 1 P r io r to F I R R E A , thr i f t ins t i tu t ions were the mos t p reva len t type o f acquirers wi th 48 acquirers f rom the thrif t indust ry , 15 acquirers f rom the ba nk ing indus t ry and 15 non-fi- nancia l acquirers . Af te r the enac tmen t o f F I R R E A however , banks were the mos t p reva len t type o f acquirers with 41 acquis i t ions and only 19 acquirers were f rom the thr i f t indust ry . 2 F ina l ly , there are 59 firms that were listed on
The "other financial institutions" category contains acquiring firms that are wholly owned subsidiaries of non-financial corporations.
2 Prior to the enactment of FIRREA, commercial banks were not permitted to buy solvent thrift institutions. In reality, however, banks were able to get around this restriction in various ways. For example, in the mid-1980s Barnett Banks and Marine Midland Bank acquired healthy thrifts by undertaking a sequence of steps. These involved converting the targets from federal to state institutions, then to state-chartered banks, then to national banks, and finally being merged with the bank holding company acquirer. Another interesting illustration is provided by the case of Amoskeag Bank Shares. On 24 October 1983 the Federal Reserve (FED) approved the formation of Amoskeag Bank Shares by allowing the BHC to acquire both a mutual savings bank (MSB) and a commercial bank. The MSB is FDIC-insured and state-chartered, therefore a "bank" rather than a thrift under the FED's interpretation of the BHC act as amended by the Garn-St Germain Act. The FED noted that the Garn-St Germain Act excludes from the definition of "bank" those thrifts that are FSLIC-insured and federally chartered. Therefore, the FED reasoned, a state-chartered thrift that is not FSLIC insured is not within that exception to the definition of "bank." If that thrift makes commercial loans and accepts demand deposits, it is a bank, the FED concluded.

A. Crupta et al. / Journal of Banking & Finance 21 (1997) 1431 1450 1437
the N Y S E and two on the A M E X , while the r ema in ing 77 acqui rers t r aded on the N A S D A Q system. There are 98 in t ra -s ta te acquis i t ions and 40 acquis i t ions which were u n d e r t a k e n across state lines.
The size d i s t r ibu t ion o f acqui r ing firms is shown in Table 1. Panel A o f the table presents b o o k values o f the acqui re r ' s to ta l assets, classified accord ing to the t ime pe r iod o f the acquis i t ion and the indus t ry o f the acqui r ing firm. Ac- quirers in the p r e - F I R R E A per iod are smal ler by a fac tor o f a pp rox ima te ly 1/2, with a mean asset size o f $9.3 bi l l ion c o m p a r e d to an average o f $17 bil l ion for acquirers in the p o s t - F I R R E A per iod. Thr i f t acquirers had assets of $5.9 bi l l ion on average, and are subs tan t ia l ly smal ler than b a n k acquirers , which had an average asset size o f $21 bil l ion. I t is also o f interest tha t in the post- F I R R E A per iod, b a n k acquirers are larger than their p r e - F I R R E A counter - par ts , whereas thr i f t acquirers in the p o s t - F I R R E A per iod are smal ler relat ive to the p r e - F I R R E A per iod. In add i t i on to the increase in the size o f bank ac- quirers in abso lu te terms in the p o s t - F I R R E A per iod, the relat ive size of bank acquirers c o m p a r e d to thr if t acquirers also increased dur ing this per iod.
The d i s t r ibu t ion o f to ta l assets of ta rge t thr i f t ins t i tu t ions is shown in Pan- el B o f Table 1. Targe t thr i f ts are, on average, smal ler than the firms acquir-
Table 1 Acquirer, target, and relative size distributions for 138 stitutions, 1979-1992
acquisitions of solvent, stock-held thrift in-
Sample N Mean c~ Median
Panel A: Acquirer total assets (in millions of dollars) Total sample 138 12 682 25 108 4417 Pre-FIRREA sub-sample 78 9324 16 069 3116 Post-FIRREA sub-sample 60 17 049 33 053 5647
All thrijt acquirers 67 5911 7512 3337 Pre-FIRREA SLs 48 6389 8362 3342 Post-FIRREA SLs 19 4717 4719 3076
All bank aequirers 56 21 143 36 232 8144 Pre-FIRREA banks 15 16 714 29 239 3340 Post-FIRREA banks 41 22 764 38 675 8826 Other pre-FIRREA acquirers 15 11 324 15 434 1756
Panel B: Target total assets (in millions of dollars) All targets 138 919 1827 307 Pre-FIRREA sub-sample 78 1113 2188 406 Post-FIRREA sub-sample 60 666 1178 279
Panel C: Relative size of the transaction (%) (Target total assets / Acquirer total assets) All targets 138 46.3 172.2 7.9 Pre-FIRREA sub-sample 78 69.5 225.6 14.0 Post-FIRREA sub-sample 60 16.3 28.1 5.6
1438 A. Gupta et al. / Journal of Banking & Finance 21 (1997) 1431-1450
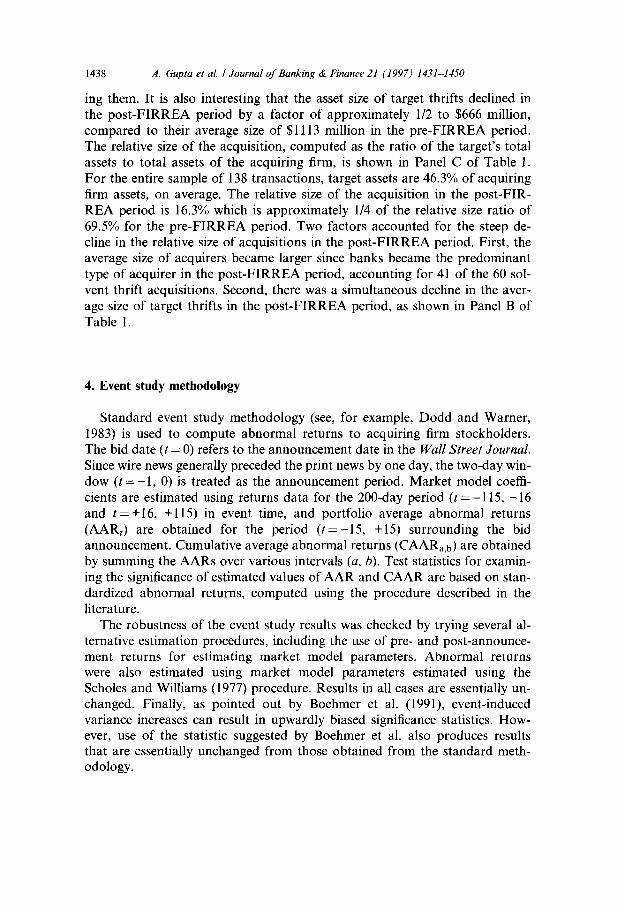
ing them. It is also interesting that the asset size of target thrifts declined in the post-FIRREA period by a factor of approximately 1/2 to $666 million, compared to their average size of $1113 million in the pre-FIRREA period. The relative size of the acquisition, computed as the ratio of the target's total assets to total assets of the acquiring firm, is shown in Panel C of Table 1. For the entire sample of 138 transactions, target assets are 46.3% of acquiring firm assets, on average. The relative size of the acquisition in the post-FIR- REA period is 16.3% which is approximately 1/4 of the relative size ratio of 69.5% for the pre-FIRREA period. Two factors accounted for the steep de- cline in the relative size of acquisitions in the post-FIRREA period. First, the average size of acquirers became larger since banks became the predominant type of acquirer in the post-FIRREA period, accounting for 41 of the 60 sol- vent thrift acquisitions. Second, there was a simultaneous decline in the aver- age size of target thrifts in the post-FIRREA period, as shown in Panel B of Table 1.
4. Event study methodology
Standard event study methodology (see, for example, Dodd and Warner, 1983) is used to compute abnormal returns to acquiring firm stockholders. The bid date (t = 0) refers to the announcement date in the Wall Street Journal. Since wire news generally preceded the print news by one day, the two-day win- dow ( t - - -1 , 0) is treated as the announcement period. Market model coeffi- cients are estimated using returns data for the 200-day period (t =-115, -16 and t = +16, +115) in event time, and portfolio average abnormal returns (AARt) are obtained for the period ( t= -15 , +15) surrounding the bid announcement. Cumulative average abnormal returns (CAARa,b) are obtained by summing the AARs over various intervals (a, b). Test statistics for examin- ing the significance of estimated values of AAR and CAAR are based on stan- dardized abnormal returns, computed using the procedure described in the literature.
The robustness of the event study results was checked by trying several al- ternative estimation procedures, including the use of pre- and post-announce- ment returns for estimating market model parameters. Abnormal returns were also estimated using market model parameters estimated using the Scholes and Williams (1977) procedure. Results in all cases are essentially un- changed. Finally, as pointed out by Boehmer et al. (1991), event-induced variance increases can result in upwardly biased significance statistics. How- ever, use of the statistic suggested by Boehmer et al. also produces results that are essentially unchanged from those obtained from the standard meth- odology.
A. Gupta et al. / Journal o f Banking & Finance 21 (1997) 1431--1450
5. Results
1439
.5.1. Event study results
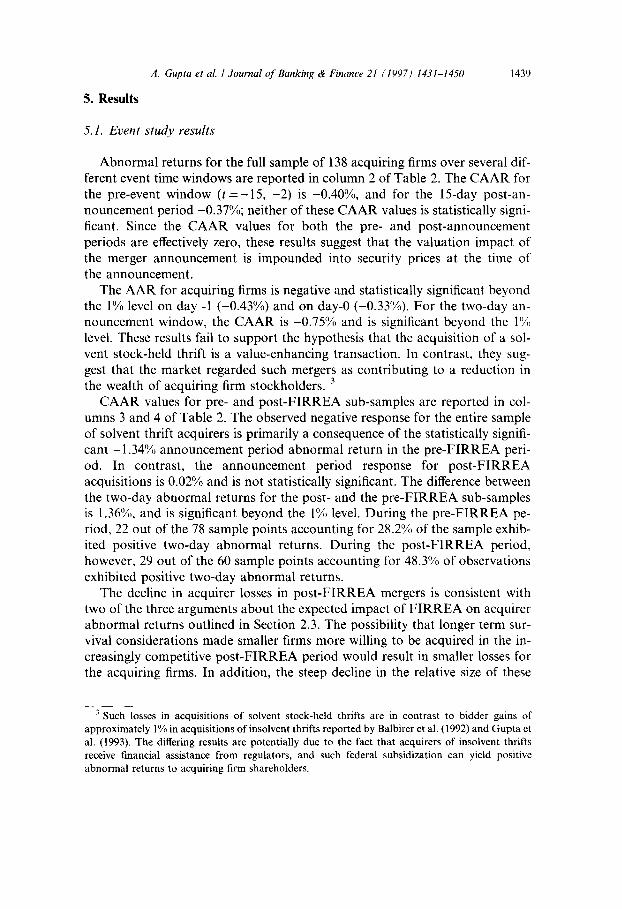
Abnormal returns for the full sample of 138 acquiring firms over several dif- ferent event time windows are reported in column 2 of Table 2. The CAAR for the pre-event window (t =-15 , -2) is -0.40%, and for the 15-day post-an- nouncement period -0.37%; neither of these CAAR values is statistically signi- ficant. Since the C A A R values for both the pre- and post-announcement periods are effectively zero, these results suggest that the valuation impact of the merger announcement is impounded into security prices at the time of the announcement.
The AAR for acquiring firms is negative and statistically significant beyond the 1% level on day -1 (-0.43%) and on day-0 (-0.33%). For the two-day an- nouncement window, the CAAR is -0.75% and is significant beyond the 1% level. These results fail to support the hypothesis that the acquisition of a sol- vent stock-held thrift is a value-enhancing transaction. In contrast, they sug- gest that the market regarded such mergers as contributing to a reduction in the wealth of acquiring firm stockholders. 3
CAAR values for pre- and post-FIRREA sub-samples are reported in col- umns 3 and 4 of Table 2. The observed negative response for the entire sample of solvent thrift acquirers is primarily a consequence of the statistically signifi- cant -1.34% announcement period abnormal return in the pre-FIRREA peri- od. In contrast, the announcement period response for post-FIRREA acquisitions is 0.02% and is not statistically significant. The difference between the two-day abnormal returns for the post- and the pre-FIRREA sub-samples is 1.36%, and is significant beyond the 1% level. During the pre-FIRREA pe- riod, 22 out of the 78 sample points accounting for 28.2% of the sample exhib- ited positive two-day abnormal returns. During the post-FIRREA period, however, 29 out of the 60 sample points accounting for 48.3% of observations exhibited positive two-day abnormal returns.
The decline in acquirer losses in post-FIRREA mergers is consistent with two of the three arguments about the expected impact of FIRREA on acquirer abnormal returns outlined in Section 2.3. The possibility that longer term sur- vival considerations made smaller firms more willing to be acquired in the in- creasingly competitive post-FIRREA period would result in smaller losses for the acquiring firms. In addition, the steep decline in the relative size of these
-~ Such iosses in acquisitions of solvent stock-held thrifts are in contrast to bidder gains of approximately 1% in acquisitions of insolvent thrifts reported by Balbirer et al. (1992) and Gupta et al. (1993). The differing results are potentially due to the fact that acquirers of insolvent thrifts receive financial assistance from regulators, and such federal subsidization can yield positive abnormal returns to acquiring firm shareholders.

1440 A. Gupta et al. / Journal of Banking & Finance 21 (1997) 1431-1450
Table 2 Percentage cumulative average abnormal returns over various event time windows for 138 acquir- ing firms and 65 acquisition targets in voluntary acquisitions of solvent, stock-held thrift institu- tions, 1979-1992.
Window CAAR (%) Acquirers Acquirers CAAR (%) Targets pre- Targets post- from, to for all pre-FIRREA post-FIRREA for all FIRREA FIRREA
acquirers (N= 78) (N = 60) targets (N = 36) (N= 29) (N= 138) (N= 65)
-15, -2 -0.40 -1.13 0.55 4.27 7.29 0.52 (-0.24) (-0.80) (0.55) (4.45)*** (5.54)*** 0.48
-10, +10 -0.96 -2.18 0.64 23.33 25.03 21.26 (-0.87) (-1.54) (0.44) (16.16)*** (13.83)*** (8.80)***
-5, +5 0.26 -0.62 1.39 22.69 23.98 21.09 (0.70) (-0.65) (1.80)* (22.17)*** (18.45)*** (12.64)***
-2, +2 0.19 -0.51 1.09 21.45 21.58 21.29 (0.12) (-1.13) (1.47) (29.10)*** (23.99)*** (18.30)***
-1, 0 a -0.75 -1.34 0.02 21.57 21.65 21.46 (-3.16)*** (-4.23)*** (0.02) (47.74)*** (37.64)*** (29.52)***
+l, +5 0.52 0.55 0.49 -1.75 -1.72 -1.78 (1.44) (1.26) (0.75) (-2.24)** (-1.70)* (-1.46)
+1, +10 0.16 0.04 0.32 -2.25 -2.69 -1.70 (0.36) (0.33) (0.18) (-2.18)** (-1.93)* (-1.11)
+1, +15 -0.37 -0.75 0.15 -2,97 -3.62 -2.16 (-0.41) (-0.47) (-0.08) (-2.29)** (-2.13)* (-1.05)
z-statistics reported in parentheses below the CAAR values *, **, and *** denote significance at the 10%, 5%, and 1% levels, respectively, for two-tailed tests.
a The difference between the two-day abnormal returns for the post-FIRREA and the pre-FIR- REA sub-samples of acquirers is 1.36%, with a corresponding z-statistic of 2.81 which is significant beyond the 1% level.
acquis i t ions in the p o s t - F I R R E A per iod m a y also be a fac tor con t r ibu t ing to the observed difference in acqui re r a b n o r m a l re turns for the two sub-per iods .
Da i ly re turns d a t a are avai lab le for 65 o f the 138 ta rge t firms; 36 o f these targets were acqui red in the p r e - F I R R E A pe r iod and 29 are p o s t - F I R R E A t ransac t ions . C A A R values over several different event t ime windows for this sample o f 65 targets are r epor t ed in co lumns 5-7 o f Table 2. Cons is ten t with results r epo r t ed in the acquis i t ions l i tera ture , s tockholders o f ta rge t thr if ts earn posi t ive and s ta t is t ical ly significant a n n o u n c e m e n t pe r iod a b n o r m a l returns. The ta rge t sample d isp lays a C A A R value o f 4.27% in the 15 days p r io r to the announcemen t , and an add i t i ona l C A A R o f 21.57% dur ing the tw o-da y an- nouncemen t window. These a b n o r m a l re turns are significant beyond the 1% level. F ina l ly , as can be seen in Table 2, cumula t ive a b n o r m a l re turns for ta rge t f irms over a 16-day w indow cu lmina t ing in the b id a n n o u n c e m e n t are 28.94% for the p r e - F I R R E A sub-sample and 21.98% for mergers occurr ing after Au- gust 1989. The decl ine in target gains in the p o s t - F I R R E A per iod is also sup- por t ive o f the a rgumen t tha t the passage o f F I R R E A made smal ler firms more
A. Gupta et al. I Journal of Banking & Finance 21 (1997) 1431-1450 1441
willing to be acquired, resulting in lower target and higher acquirer gains from such mergers.
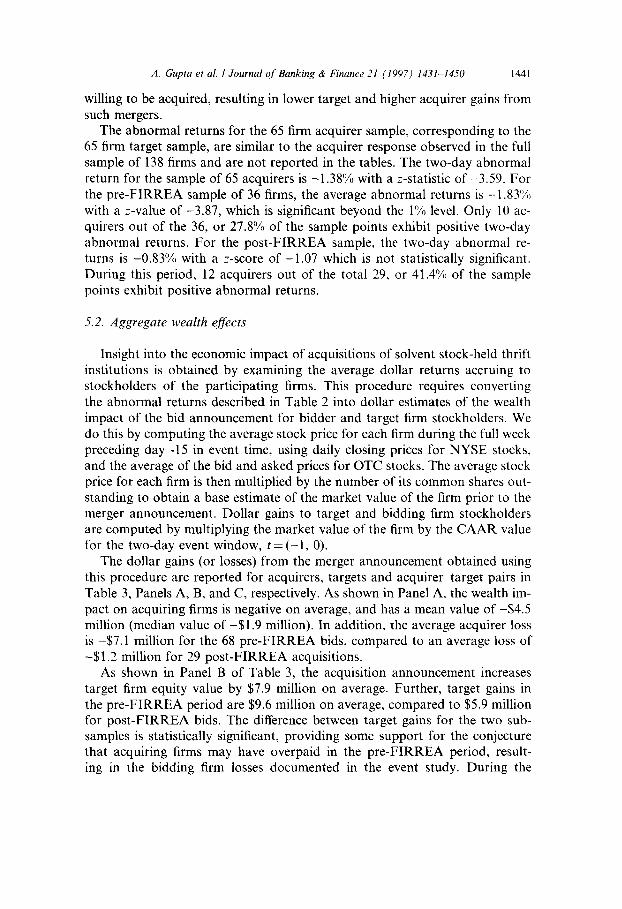
The abnormal returns for the 65 firm acquirer sample, corresponding to the 65 firm target sample, are similar to the acquirer response observed in the full sample of 138 firms and are not reported in the tables. The two-day abnormal return for the sample of 65 acquirers is -1.38% with a z-statistic of-3.59. For the pre-FIRREA sample of 36 firms, the average abnormal returns is -1.83% with a z-value of -3.87, which is significant beyond the 1% level. Only 10 ac- quirers out of the 36, or 27.8% of the sample points exhibit positive two-day abnormal returns. For the post-FIRREA sample, the two-day abnormal re- turns is -0.83% with a z-score of-1.07 which is not statistically significant. During this period, 12 acquirers out of the total 29, or 41.4% of the sample points exhibit positive abnormal returns.
5.2. Aggregate wealth effects
Insight into the economic impact of acquisitions of solvent stock-held thrift institutions is obtained by examining the average dollar returns accruing to stockholders of the participating firms. This procedure requires converting the abnormal returns described in Table 2 into dollar estimates of the wealth impact of the bid announcement for bidder and target firm stockholders. We do this by computing the average stock price for each firm during the full week preceding day -15 in event time, using daily closing prices for NYSE stocks, and the average of the bid and asked prices for OTC stocks. The average stock price for each finn is then multiplied by the number of its common shares out- standing to obtain a base estimate of the market value of the firm prior to the merger announcement. Dollar gains to target and bidding firm stockholders are computed by multiplying the market value of the firm by the CAAR value for the two-day event window, t = (-1, 0).
The dollar gains (or losses) from the merger announcement obtained using this procedure are reported for acquirers, targets and acquirer~arget pairs in Table 3, Panels A, B, and C, respectively. As shown in Panel A, the wealth im- pact on acquiring firms is negative on average, and has a mean value of -$4.5 million (median value of-$1.9 million). In addition, the average acquirer loss is -$7.1 million for the 68 pre-FIRREA bids, compared to an average loss of -$1.2 million for 29 post-FIRREA acquisitions.
As shown in Panel B of Table 3, the acquisition announcement increases target firm equity value by $7.9 million on average. Further, target gains in the pre-FIRREA period are $9.6 million on average, compared to $5.9 million for post-FIRREA bids. The difference between target gains for the two sub- samples is statistically significant, providing some support for the conjecture that acquiring firms may have overpaid in the pre-FIRREA period, result- ing in the bidding firm losses documented in the event study. During the
1442 A. Gupta et at. / Journal of Banking & Finance 21 (1997) 1431-1450
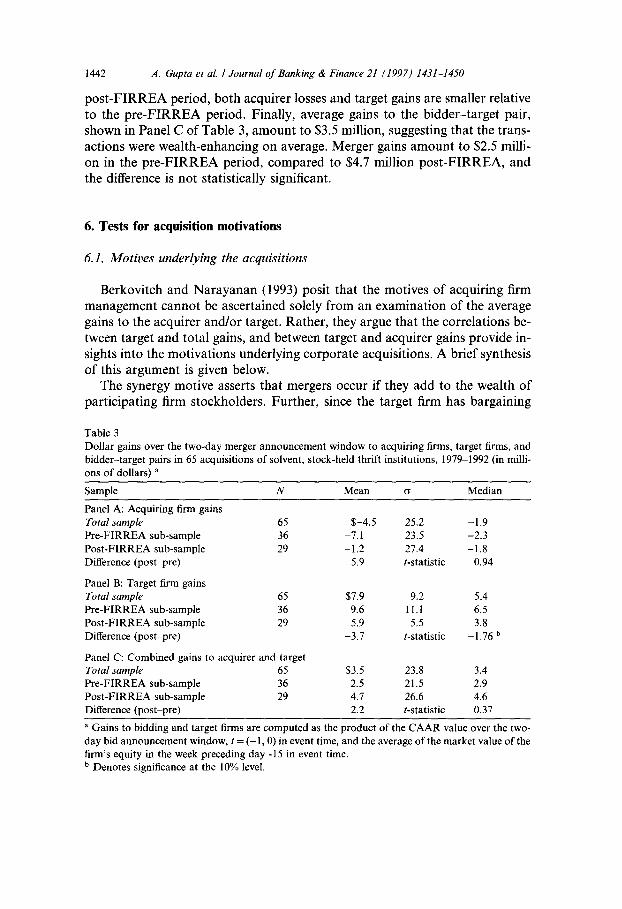
post-FIRREA period, both acquirer losses and target gains are smaller relative to the pre-FIRREA period. Finally, average gains to the bidder-target pair, shown in Panel C of Table 3, amount to $3.5 million, suggesting that the trans- actions were wealth-enhancing on average. Merger gains amount to $2.5 milli- on in the pre-FIRREA period, compared to $4.7 million post-FIRREA, and the difference is not statistically significant.
6. Tests for acquisition motivations
6.1. Motives underlying the acquisitions
Berkovitch and Narayanan (1993) posit that the motives of acquiring firm management cannot be ascertained solely from an examination of the average gains to the acquirer and/or target. Rather, they argue that the correlations be- tween target and total gains, and between target and acquirer gains provide in- sights into the motivations underlying corporate acquisitions. A brief synthesis of this argument is given below.
The synergy motive asserts that mergers occur if they add to the wealth of participating firm stockholders. Further, since the target finn has bargaining
Table 3 Dollar gains over the two-day merger announcement window to acquiring firms, target firms, and bidder-target pairs in 65 acquisitions of solvent, stock-held thrift institutions, 1979-1992 (in milli- ons of dollars) a
Sample N Mean cr Median
Panel A: Acquiring firm gains Total sample 65 $-4.5 25.2 -1.9 Pre-FIRREA sub-sample 36 -7.1 23.5 -2.3 Post-FIRREA sub-sample 29 -1.2 27.4 -1.8 Difference (post-pre) 5.9 t-statistic 0.94
Panel B: Target firm gains Total sample 65 $7.9 9.2 5.4 Pre-FIRREA sub-sample 36 9.6 11.1 6.5 Post-FIRREA sub-sample 29 5.9 5.5 3.8 Difference (post-pre) -3.7 t-statistic -1.76 b
Panel C: Combined gains to acquirer and target Total sample 65 $3.5 23.8 3.4 Pre-FIRREA sub-sample 36 2.5 21.5 2.9 Post-FIRREA sub-sample 29 4.7 26.6 4.6 Difference (post-pre) 2.2 t-statistic 0.37
a Gains to bidding and target firms are computed as the product of the CAAR value over the two- day bid announcement window, t = ( - 1, 0) in event time, and the average of the market value of the firm's equity in the week preceding day -15 in event time. b Denotes significance at the 10% level.

A. Gupta et al. I Journal of Banking & Finance 21 (1997) 1431-1450 1443
power over the bidding firm, target gains are likely to be higher if there are large synergies. Consequently, the synergy motive implies that target and total gains as well as target and acquiring firm gains should be positively correlated. In contrast, the agency motive states that the acquisition is designed to benefit bidding firm management at the expense of the firm's stockholders. If target stockholders have some bargaining power then target gains will increase with the amount of wealth expropriated by bidding firm management, resulting in a negative correlation between target and acquiring firm gains. Since wealth ex- propriation by management will reduce total gains, the agency motive also im- plies that target and total gains should be negatively correlated. Finally, the hubris hypothesis (Roll, 1986) maintains that there are no net gains from merg- ers, and that acquisitions represent transfers of wealth between bidding and target firms. The hubris hypothesis suggests that target and acquiring firm gains should be negatively correlated, and that target and total gains should be uncorrelated.
The correlations between target and total gains (PTT) can be used to distin- guish between synergy versus agency as the primary motive underlying a sam- ple of mergers. In each case, the null hypothesis posits the absence of synergy or agency as the driving motivation underlying the merger. The null hypothesis is thus specified as H0: PTT = 0. The alternative hypothesis for the synergy mo- tivation is Ha: PTT > 0, and for the agency motivation the alternative hypoth- esis is Ha: PTT < 0.
One possible problem with the above tests is that since the synergy and agency motives imply opposite signs for PTT, the presence of both motives in the sample can result in the observance of a zero correlation between tar- get and total gains. This in turn would lead to the erroneous conclusion that the mergers are primarily motivated by hubris. This problem is finessed by noting that the synergy (agency) motive is more likely to be present in the positive (negative) total gains sub-sample. We divide the full sample into pos- itive and negative total gains sub-samples, and estimate the correlations be- tween target and total gains (9TT) within each sub-sample. The null hypothesis for each of the two sub-samples remains H0: pTT = 0. The alter- native hypothesis for the positive total gains sub-sample, which is more likely to be driven by synergistic motivations is Ha: PTT > 0. For the negative total gains sub-sample, which is more likely to be driven by agency, the alternative hypothesis is Ha: 9TT < 0.
Finally, the presence of hubris as a contributing motivation is identified by examining the correlations between target and acquiring firm gains (PTA)- Since hubris represents a transfer from the acquirer to the target, we expect PTA < 0 in the presence of hubris. If hubris is not a motivating factor in the mergers then we expect that synergistic considerations will lead to PTA > 0 for the pos- itive total gains sub-sample, and agency motivations will lead to 10TA < 0 for the negative total gains sub-sample. Therefore, if hubris is present together

1444 A. Crupta et al. / Journal of Banking & Finance 21 (1997) 1431-1450
with other motivations in a sample, it would reinforce the effect of agency (IOTA
<< 0) and mitigate the effects of synergy (PTA ~ 0). This observation allows us to test for the presence of hubris in the sub-sam-
ple of mergers that display only positive total gains. For this sample, the null hypothesis posits the absence of hubris, and is stated as Ho: PTA > 0. The alter- nate hypothesis Ha: IOTA ~ 0, follows from the fact that the presence of hubris would counteract the positive correlation resulting from synergy, the primary merger motivation in this sub-sample. Finally, the fact that agency and hubris both imply the expectation of a negative correlation between target and ac- quirer gains makes it impossible to conduct a well defined test for the presence of hubris in the negative total gains sub-sample.
6.2. Estimating the correlations
Event study abnormal returns and dollar gains results, shown in Tables 2 and 3 respectively, suggest that there are significant differences between shareholder wealth effects in the pre- and post-FIRREA sub-periods. It is possible that the passage of FIRREA may have had an impact on managerial motivations under- lying thrift acquisitions, and the differing wealth effects may be a consequence of these changes. In contrast, it is possible that the differing shareholder wealth ef- fects are a consequence of changes in the market for thrift acquisitions (such as the introduction of commercial banks as potential acquirers), and have little to do with any change in underlying managerial motivations. These confounding possibilities complicate a direct application of the Berkovitch and Narayanan methodology for examining managerial motivations.
One approach to obtaining the correlations pTa- and IOTA is to assign the 65 sample points to a 2 × 2 matrix, delineated across FIRREA and across positive/ negative total gains. Correlations between the target and total gains (Par) and between the acquirer and total gains (PTA) can then be computed for sub-sam- ple in each cell. However, if there are systematic variations present in the sam- ple across FIRREA or across positive/negative total gains, then this procedure would lead to biased estimates by not controlling for the effects of such system- atic variations. There are a number of potential sources from which such sys- tematic variations in the sample may arise, including a disproportionate number of bank acquirers and the dominance of relatively smaller size target firms in the post-FIRREA period. In order to identify potential sources of such systematic variations, we examined the data and report on some additional sample characteristics in Table 4. A discussion of these potential sources of sys- tematic variation follows. 4
4 We are grateful to an anonymous referee o f this Journal for impressing upon us the need to control for such systematic variations.

A. Gupta et al. I Journal of Banking & Finance 21 (1997) 1431-1450 1445
Table 4 Distribution of the sample across FIRREA and between positive and negative total gains sub-sam- ples
Panel A: Number of bank acquirers in the sample
Pre-FIRREA Post-FIRREA
Number of Sample size Percent of Number of Sample Percent banks in cell sample banks size banks
Positive total gains 2 23 8.7 12 18 66.7 Negative total gains 3 13 23.1 7 I1 63.6 Full sample 5 36 13.9 19 29 65.5
Panel B: Size of the acquired thrift (Large means thrft total assets exceed total assets o[ the median target in the sample of 65 thrifts)
Pre-FIRREA Post-FIRREA
Number of Sample size Percent of Number of Sample Percent large thrifts in cell sample large thrifts size large
Positive total gains 15 23 65.2 9 18 50.0 Negative total gains 7 13 53.8 1 11 9.1 Full sample 22 36 61.1 10 29 34.5
The first variable of interest is the number of bank acquirers in the post- FIRREA period. As shown in Panel A of Table 4, there are a total of 24 bank acquirers in the sample, of which 19 made acquisitions in the post-FIRREA period. It is possible that the differences in observed gains between pre- and post-FIRREA periods may be partly attributable to the presence of a dispro- portionate number of bank acquirers in the post-FIRREA period. The pres- ence or absence of bank acquirers may also contribute to the observed variation across the positive and negative gains sub-samples. As shown in Ta- ble 4, during the post-FIRREA period there were 12 bank acquirers in the 18 mergers reporting positive total gains (i.e. 66.6% of the positive total gains sample were banks). During the same period, seven bank acquirers out of l 1 sample points experienced negative total gains (i.e. 63.6% of the negative total gains sample were banks), indicating that while bank acquirers are more nu- merous in the post-FIRREA period, their likelihood of experiencing positive or negative total gains appears to be similar.
Second, data on the size distribution, given in Table 1, shows that post-FIR- REA targets were, on average, approximately half of the size of pre-FIRREA targets. Target gains, and possibly total gains, are likely to be higher if the tar- get size is bigger, and it is possible that such systematic differences in target size may induce biases into the computed correlations. Consequently, we compared the total assets of each target thrift to the median total assets of all the target thrifts in the sample of 65 acquired thrifts. If a thrift has assets greater than the median asset size, we classify it as a Large thrift.
1446 .4. Gupta et al. I Journal o f Banking & Finance 21 (1997) 1431-1450
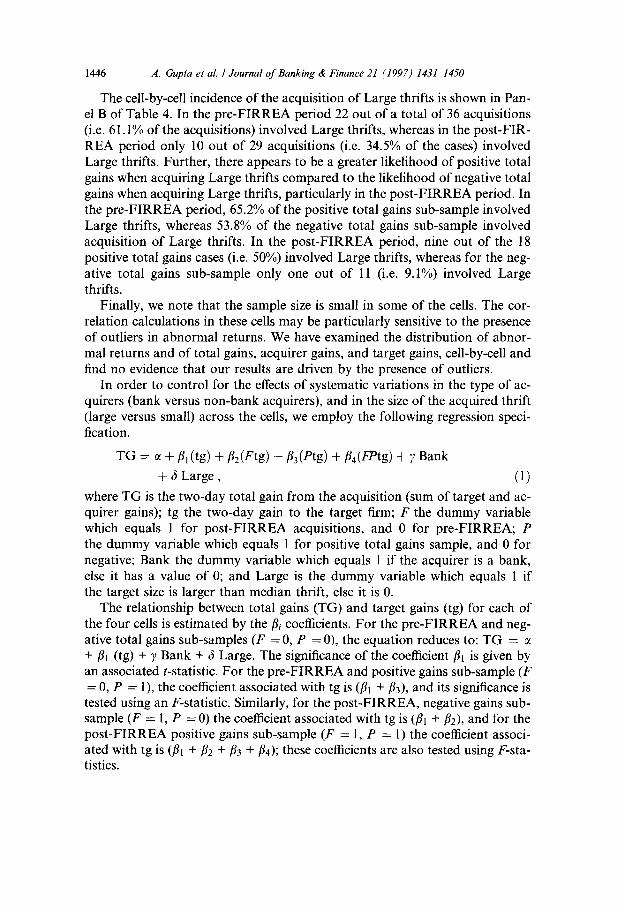
The cell-by-cell incidence of the acquisition of Large thrifts is shown in Pan- el B of Table 4. In the pre-FIRREA period 22 out of a total of 36 acquisitions (i.e. 61.1% of the acquisitions) involved Large thrifts, whereas in the post-FIR- REA period only 10 out of 29 acquisitions (i.e. 34.5% of the cases) involved Large thrifts. Further, there appears to be a greater likelihood of positive total gains when acquiring Large thrifts compared to the likelihood of negative total gains when acquiring Large thrifts, particularly in the post-FIRREA period. In the pre-FIRREA period, 65.2% of the positive total gains sub-sample involved Large thrifts, whereas 53.8% of the negative total gains sub-sample involved acquisition of Large thrifts. In the post-FIRREA period, nine out of the 18 positive total gains cases (i.e. 50%) involved Large thrifts, whereas for the neg- ative total gains sub-sample only one out of 11 (i.e. 9.1%) involved Large thrifts.
Finally, we note that the sample size is small in some of the cells. The cor- relation calculations in these cells may be particularly sensitive to the presence of outliers in abnormal returns. We have examined the distribution of abnor- mal returns and of total gains, acquirer gains, and target gains, cell-by-cell and find no evidence that our results are driven by the presence of outliers.
In order to control for the effects of systematic variations in the type of ac- quirers (bank versus non-bank acquirers), and in the size of the acquired thrift (large versus small) across the cells, we employ the following regression speci- fication.
TG = ~ + fll(tg) + fl2(Ftg) + + 6 Large,
where TG is the two-day total gain
fl3(Ptg) +//4(FPtg) + 7 Bank
(1)
from the acquisition (sum of target and ac- quirer gains); tg the two-day gain to the target firm; F the dummy variable which equals 1 for post-FIRREA acquisitions, and 0 for pre-FIRREA; P the dummy variable which equals 1 for positive total gains sample, and 0 for negative; Bank the dummy variable which equals 1 if the acquirer is a bank, else it has a value of 0; and Large is the dummy variable which equals 1 if the target size is larger than median thrift, else it is 0.
The relationship between total gains (TG) and target gains (tg) for each of the four cells is estimated by the fli coefficients. For the pre-FIRREA and neg- ative total gains sub-samples (F = 0, P =-0), the equation reduces to: TG = -t- //1 (tg) + 7 Bank + 6 Large. The significance of the coefficient fll is given by an associated t-statistic. For the pre-FIRREA and positive gains sub-sample (F = 0, P = 1), the coefficient associated with tg is (ill + f13), and its significance is tested using an F-statistic. Similarly, for the post-FIRREA, negative gains sub- sample (F = 1, P = 0) the coefficient associated with tg is (ill + f12), and for the post-FIRREA positive gains sub-sample (F - 1, P = 1) the coefficient associ- ated with tg is (ill +/12 +//3 +//4); these coefficients are also tested using F-sta- tistics.
A. Gupta et al. I Journal o f Banking & Finance 21 (1997) 1431-1450 1447
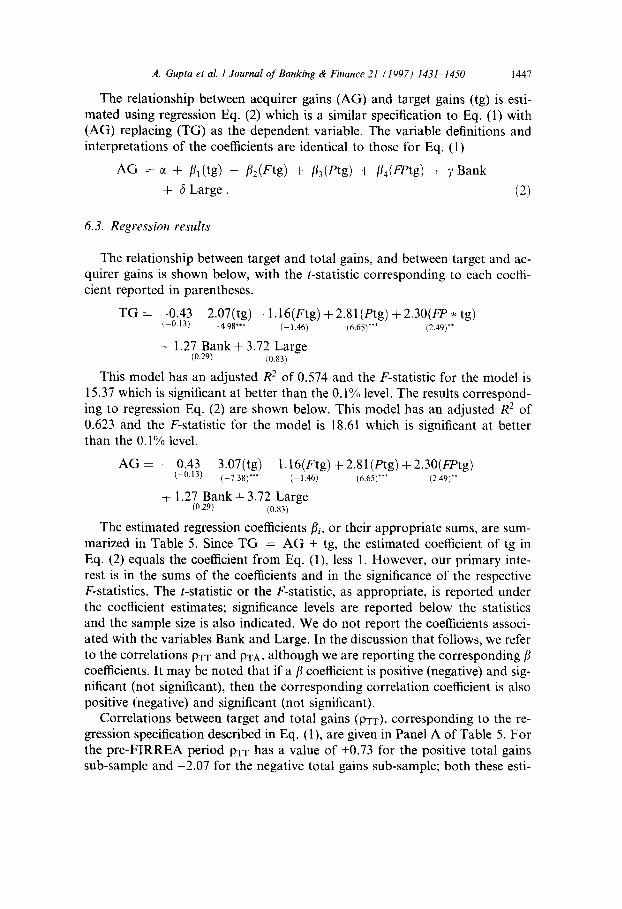
The relationship between acquirer gains (AG) and target gains (tg) is esti- mated using regression Eq. (2) which is a similar specification to Eq. (1) with (AG) replacing (TG) as the dependent variable. The variable definitions and interpretations of the coefficients are identical to those for Eq. (1)
AG = c~ + /31(tg) + /32(Ftg) + /33(etg) + /34(FPtg) + 7Bank
+ fi Large. (2)
6.3. Regression results
The relationship between target and total gains, and between target and ac- quirer gains is shown below, with the t-statistic corresponding to each coeffi- cient reported in parentheses.
TG = -0.43 - 2.07(tg) - 1.16(Ftg) + 2.81 (Ptg) + 2.30(FP • tg) (-0.13) -4.98"** (-1.46) (6.65)*** (2.49)**
+ 1.27 Bank + 3.72 Large (0.29) (0.83)
This model has an adjusted R 2 of 0.574 and the F-statistic for the model is 15.37 which is significant at better than the 0.1% level. The results correspond- ing to regression Eq. (2) are shown below. This model has an adjusted R 2 of 0.623 and the F-statistic for the model is 18.61 which is significant at better than the 0.1% level.
AG = - 0.43 - 3.07(tg) - 1.16(Ftg) + 2.81(Ptg) + 2.30(FPtg) (-0.13) ( 7.38)*** (1.46) (6.65)*** (2.49)**
+ 1.27 Bank + 3.72 Large (0,29) (0.83)
The estimated regression coefficients fli, or their appropriate sums, are sum- marized in Table 5. Since TG = AG + tg, the estimated coefficient of tg in Eq. (2) equals the coefficient from Eq. (1), less 1. However, our primary inte- rest is in the sums of the coefficients and in the significance of the respective F-statistics. The t-statistic or the F-statistic, as appropriate, is reported under the coefficient estimates; significance levels are reported below the statistics and the sample size is also indicated. We do not report the coefficients associ- ated with the variables Bank and Large. In the discussion that follows, we refer to the correlations PaT and 9TA, although we are reporting the corresponding [J coefficients. It may be noted that if a/3 coefficient is positive (negative) and sig- nificant (not significant), then the corresponding correlation coefficient is also positive (negative) and significant (not significant).
Correlations between target and total gains (parT), corresponding to the re- gression specification described in Eq. (1), are given in Panel A of Table 5. For the pre-FIRREA period PTT has a value of +0.73 for the positive total gains sub-sample and -2.07 for the negative total gains sub-sample; both these esti-

1448 A. Crupta et al. I Journal o f Banking & Finance 21 (1997) 1431-1450
Table 5 Relationship between target gains, total gains, and acquirer gains for a sample of 65 acquisitions of solvent, stock-held thrift institutions after controlling for differences between types of acquirers and the size of the acquisition a,
Panel A: Eq. (1) (Target gains, Total gains)
Panel B: Eq. (2) (Target gains, acquirer gains)
Pre-F1RREA Post-FIRREA Pre-FIRREA Post-FIRREA
Positive total gains sub-sample (N= 41) Regression Coefficient 0.73 *** 1.86 *** -0.27 0.86 Test statistic F: [7.74] F: [11.48] F: [1.03] F: [2.47] Significance level [0.7%] [0.0%] [31.5%] [12.2%] Sample size 23 18 23 18
Negative total gains sub-sample (N= 24) Regression coefficient -2.07 ~** -3.24 *** -3.07 *** -4.24 *** Test statistic t: (-4.98) F: [22.79] t: (-7.38) F: [39.06] Significance level [0.0%] [0.0%] [0.0%] [0.0%] Sample size 13 11 13 11
a Gains to bidding and target firms are computed as the product of the CAAR value for the two- day bid announcement window, t = (- 1, 0) in event time, and the average of the market value of the firm's equity in the week preceding day -15 in event time. ***, % and * refer to significance at the 1%, 5% and 10% levels, respectively.
mates are statistically significant at better that the 1% level. These results per- mit rejection o f the null hypothesis o f an absence o f synergy and agency moti- vations in solvent thrift acquisitions in the period preceding the passage o f F I R R E A in August 1989. In contrast , the results suggest the presence o f bo th mot ivat ions driving different subsets o f acquisitions during this period.
As argued earlier, the passage o f F I R R E A led to systematic changes in the types o f firms that are allowed to acquire solvent thrifts and also in the relative size o f such acquisitions. Our investigation into acquisition motivat ions in the p o s t - F I R R E A period controls for such changes in the acquisition environ- ment, and correlat ion results for this sample period are contained in column 2 o f Panel A o f Table 5. Consistent with the findings for the p r e - F I R R E A pe- riod, par has a value o f +1.86 for the positive total gains sub-sample and -3 .24 for the negative total gains sub-sample; bo th these estimates are statistically significant at better that the 1% level. These results permit rejection o f the null hypothesis o f an absence o f synergy and agency mot ivat ions in solvent thrift acquisitions in the period following the passage o f F I R R E A in August 1989. In contrast , the results suggest the presence o f both motivat ions driving differ- ent subsets o f acquisitions during this period. In addition, the results provide s trong evidence in favor o f the proposi t ion that while the passage o f F I R R E A led to significant changes in the acquisition environment facing solvent thrift institutions, it did not systematically change the set o f managerial motivat ions underlying such acquisition efforts. Both synergy and agency mot ivat ions were

A. Gupta et al. / Journal of Banking & Finance 21 (1997) 1431-1450 1449
at play in the pre-FIRREA period, and continue to be in play in post-FIRREA acquisitions.
Finally, correlations between target and acquirer gains (PTA), corresponding to the regression specification described in Eq. (2), are given in Panel B of Ta- ble 5. As described in Section 6.1, it is only possible to construct a well defined test for the absence of hubris for the positive total gains sub-sample. The small, and statistically insignificant correlation estimates for this sub-sample are con- sistent with the presence of hubris in this set of acquisitions, suggesting that all three merger motivations are present in the sample of solvent thrift acquisitions over this time period.
7. Conclusions
This paper presents an empirical investigation into the wealth effects of vol- untary acquisitions of solvent stock-held thrift institutions over the 1979 1992 time period. Overall, acquiring firms in these transactions experienced losses, target stockholders obtained large gains, and the impact of such mergers on the combined wealth of the bidder-target pair was positive on average, suggest- ing that these mergers enhance the aggregate wealth of the shareholders of the two firms. We find that bidding firm losses were significantly greater in mergers occurring in the period prior to the enactment of FIRREA in August 1989. In the post-FIRREA period, acquiring firms earned small positive abnormal re- turns in acquisitions of solvent stock-held thrifts.
An investigation into the motives of bidding firm management provides ev- idence indicating the presence of synergy, agency, and hubris motivations in the pre-FIRREA period. Although the acquisitions environment underwent substantial changes in the post-FIRREA period, we find no evidence of corre- sponding changes in acquisition motivations.
Acknowledgements
The helpful comments of two anonymous referees of this journal are grate- fully acknowledged. In addition, LeCompte and Misra would like to thank their respective institutions for partial financial support for this project in the form of summer research grants. The usual disclaimer applies.
References
Balbirer, S.D., Jud, G.D., Lindahl, F.W., 1992. Regulation, competition and abnormal returns in the market for failed thrifts. Journal of Financial Economics 3 I, 107 131.
1450 A. Gupta et al. I Journal of Banking & Finance 21 (1997) 1431 1450
Baradwaj, B.G., Dubofsky, D.A., Fraser, D.R., 1991. Bidder returns in interstate and intrastate bank acquisitions. Journal of Financial Services Research 5, 261-273.
Berkovitch, E., Narayanan, M.P., 1993. Motives for takeovers: An empirical investigation. Journal of Financial and Quantitative Analysis 28 (3), 347-362.
Boehmer, E., Musumeci, J., Poulsen, A.B., 1991. Event-study methodology under conditions of event-induced variance. Journal of Financial Economics 30, 253-272.
Cornett, M.M., Tehranian, H., 1989. Stock market reactions to the depository institutions deregulation and monetary control act of 1980. Journal of Banking and Finance 13, 81 100.
Cornett, M.M., Tehranian, H., 1990. An examination of the impact of the Garn-St. Germain depository institutions act of 1982. Journal of Finance 45, 95-112.
Dodd, P., Warner, J., 1983. On corporate governance: A study of proxy contests. Journal of Financial Economics 11,401-438.
Dubofsky, D.A., Fraser, D.R., 1989. Regulatory change and the market for bank control. In: Benton Gup (Ed.), Bank Mergers: Current Issues and Perspectives, Kluwer Academic Publishers, Boston, Mass.
Gupta, A., LeCompte, R., Misra, L., 1993. FSLIC assistance and the wealth effects of savings and loan acquisitions. Journal of Monetary Economics 31, 117-128.
Hannan, T.H., Wolken, J.D., 1989. Returns to bidders and targets in the acquisition process: Evidence from the banking industry. Journal of Financial Services Research 3, 5-16.
Houston, J.F., Ryngaert, M.D., 1994. The overall gains from large bank mergers. Journal of Banking and Finance 18, 1155 1176.
Roll, R., 1986. The hubris hypothesis of corporate takeovers. Journal of Business 59, 197 216. Scholes, M., Williams, J., 1977. Estimating betas from nonsynchronous data.. Journal of Financial
Economics 5~ 309-3267. Sushka, M.E., Bendeck, Y., 1988. Bank acquisitions and stockholders' wealth. Journal of Banking
and Finance 12, 551-562.