
Acoustic Measurement of Multisubtidal Internal Modes Generated in Hiroshima Bay, Japan
10
IEEE JOURNAL OF OCEANIC ENGINEERING, VOL. 34, NO. 2, APRIL 2009 103 Acoustic Measurement of Multisubtidal Internal Modes Generated in Hiroshima Bay, Japan Hong-Quang Nguyen, Arata Kaneko, Member, IEEE, Ju Lin, Keisuke Yamaguchi, Noriaki Gohda, and Yoshio Takasugi Abstract—A coastal acoustic tomography (CAT) experiment with seven acoustic stations was successfully carried out to mea- sure multisubtidal internal modes, generated in Hiroshima Bay, Japan, in spite of severe data gaps due to many oyster aquaculture rafts, accompanied by an array of vertical wire strings for growing oysters and distributed widely over the bay. The travel-time data acquired along five transmission lines with better data acquisition rates in one-way or reciprocal directions are analyzed, focusing on subtidal variations of sound speed (proportional to temperature). Significant multisubtidal internal modes are observed in the period range of 1.0–4.0 h. To specify the source region of internal modes and to estimate their propagation speed and direction, the power-spectral and cross-spectral analyses are applied to the time-series data of range-averaged sound speed along the suc- cessful transmission lines. Waves of period ranges 3.8–4.2, 2.0–2.3, and 1.4–1.5 h are identified as the second, third, and fourth modes of long internal waves, respectively, and the first internal mode is attributed to the semidiurnal tide. It is suggested that the source region of internal modes is located in the narrow channel at the northeastern corner of the tomography site and the modes radiate out from the source region, satisfying the propagation parameters (period, phase speed, and propagation direction) determined by this study. The propagation parameters of the subtidal internal modes can also be measured by point temperature sensors, at- tached to aquaculture rafts with an appropriate arrangement. However, it should be noted that the tomographic technique can confirm temperature variations through a spatial average along each ray path. Index Terms—Coastal acoustic tomography (CAT), cross-spec- tral analysis, Hiroshima Bay, power-spectral analysis, subtidal in- ternal modes. I. INTRODUCTION M OST of semienclosed coastal seas facing industrious areas and urban regions are damaged by various en- vironmental problems such as water pollution and red tides. The environmental management and protection require moni- toring of water and material circulation inside the semienclosed Manuscript received May 27, 2008; revised November 10, 2008; accepted December 14, 2008. Current version published May 13, 2009. This work was supported by the Grant-in-Aid for the Creation of Innovations through Busi- ness–Academic–Public Sector Cooperation of the Japan Ministry of Education, Culture, Sports, Science and Technology. The work of J. Lin was supported by the National High-Tech Research and Development Plan of China under Grant 2006AA09Z114. Associate Editor: W. M. Carey. H.-Q. Nguyen, A. Kaneko, and N. Gohda are with the Graduate School of Engineering, Hiroshima University, Hiroshima 739-8527, Japan (e-mail: [email protected]). J. Lin is with the College of Information Science and Technology, Ocean University of China, Qingdao 266100, China. K. Yamaguchi is with NewFlare Technology, Inc., Shizuoka 410-8510, Japan. Y. Takasugi is with the Chugoku Center, National Institute of Advanced In- dustrial Science and Technology, Hiroshima 737-0197, Japan. Digital Object Identifier 10.1109/JOE.2009.2014933 coastal sea, and water exchange to the offshore sea. However, the well-designed measurement of water circulation that covers the entire region of the coastal sea is quite difficult to perform in the coastal sea especially around Japan because of strong fishing activity and heavy shipping traffic. Coastal acoustic tomography (CAT) is proposed as an innovational oceanographic technology that can get snapshots of coastal sea circulation and relax the observational limitation mentioned above [1]–[6]. It should be noted that the technology and science of deep-sea acoustic to- mography, initiated from the U.S., are accumulated in the CAT [7]. Hiroshima Bay is well known as one of the most famous oyster aquaculture fields in Japan. Two thousand aquaculture rafts distributed over the bay and the shipping traffic route passing through the central part of the bay make well-designed oceanographic observations hopeless. The generation of non- linear components of external tides with periods of 6 and 4 h (named M4 and M6 tides, respectively) is reported in the tidal harmonics table, published by the Japan Coast Guard in 1983 on the basis of tidal gauge station data [8]. However, until now, no data on subtidal internal modes with periods less than half a day were reported inside the bay. The purpose of this study is to describe the generation of subtidal internal modes and to elucidate their wave parameters by applying the newly developed CAT technology. II. EXPERIMENT Hiroshima Bay is a typical semienclosed coastal sea area lo- cated at the central part of the Seto Inland Sea, Japan (Fig. 1). To the north, the bay is bordered by the coastal region of Hi- roshima city with artificial piers and wharfs. Itsuku-shima is- land and Eta-jima and Nino-shima islands make a segmented border to the southwest and to the south, respectively. The depth of the bay extends from 4 m at the northern coast to 20 m at the southern border. Hiroshima Bay is the most famous oyster aquaculture region in Japan, but the oyster aquaculture industry is frequently damaged by red tides due to nutrient-rich water. The environmental problem still is a major issue in oyster in- dustries. The CAT experiment composed of seven sound transmission and reception stations H1–H7 (hereinafter called the acoustic stations) was carried out on September 17–28, 2003 (see Fig. 1). Three land-based CAT systems were deployed along the northern coasts using the wharfs and piers [Fig. 2(a)], and the other four CAT systems placed at the southern part of the observation domain were set up, using small lifting rafts placed at both edges of large oyster rafts [Fig. 2(b)]. There is only one hydrophone for acoustic stations H2, H3, and H7 and a 0364-9059/$25.00 © 2009 IEEE
Transcript of Acoustic Measurement of Multisubtidal Internal Modes Generated in Hiroshima Bay, Japan

IEEE JOURNAL OF OCEANIC ENGINEERING, VOL. 34, NO. 2, APRIL 2009 103
Acoustic Measurement of Multisubtidal InternalModes Generated in Hiroshima Bay, Japan
Hong-Quang Nguyen, Arata Kaneko, Member, IEEE, Ju Lin, Keisuke Yamaguchi, Noriaki Gohda, andYoshio Takasugi
Abstract—A coastal acoustic tomography (CAT) experimentwith seven acoustic stations was successfully carried out to mea-sure multisubtidal internal modes, generated in Hiroshima Bay,Japan, in spite of severe data gaps due to many oyster aquaculturerafts, accompanied by an array of vertical wire strings for growingoysters and distributed widely over the bay. The travel-time dataacquired along five transmission lines with better data acquisitionrates in one-way or reciprocal directions are analyzed, focusing onsubtidal variations of sound speed (proportional to temperature).Significant multisubtidal internal modes are observed in theperiod range of 1.0–4.0 h. To specify the source region of internalmodes and to estimate their propagation speed and direction,the power-spectral and cross-spectral analyses are applied to thetime-series data of range-averaged sound speed along the suc-cessful transmission lines. Waves of period ranges 3.8–4.2, 2.0–2.3,and 1.4–1.5 h are identified as the second, third, and fourth modesof long internal waves, respectively, and the first internal mode isattributed to the semidiurnal tide. It is suggested that the sourceregion of internal modes is located in the narrow channel at thenortheastern corner of the tomography site and the modes radiateout from the source region, satisfying the propagation parameters(period, phase speed, and propagation direction) determined bythis study. The propagation parameters of the subtidal internalmodes can also be measured by point temperature sensors, at-tached to aquaculture rafts with an appropriate arrangement.However, it should be noted that the tomographic technique canconfirm temperature variations through a spatial average alongeach ray path.
Index Terms—Coastal acoustic tomography (CAT), cross-spec-tral analysis, Hiroshima Bay, power-spectral analysis, subtidal in-ternal modes.
I. INTRODUCTION
M OST of semienclosed coastal seas facing industriousareas and urban regions are damaged by various en-
vironmental problems such as water pollution and red tides.The environmental management and protection require moni-toring of water and material circulation inside the semienclosed
Manuscript received May 27, 2008; revised November 10, 2008; acceptedDecember 14, 2008. Current version published May 13, 2009. This work wassupported by the Grant-in-Aid for the Creation of Innovations through Busi-ness–Academic–Public Sector Cooperation of the Japan Ministry of Education,Culture, Sports, Science and Technology. The work of J. Lin was supported bythe National High-Tech Research and Development Plan of China under Grant2006AA09Z114.
Associate Editor: W. M. Carey.H.-Q. Nguyen, A. Kaneko, and N. Gohda are with the Graduate School
of Engineering, Hiroshima University, Hiroshima 739-8527, Japan (e-mail:[email protected]).
J. Lin is with the College of Information Science and Technology, OceanUniversity of China, Qingdao 266100, China.
K. Yamaguchi is with NewFlare Technology, Inc., Shizuoka 410-8510, Japan.Y. Takasugi is with the Chugoku Center, National Institute of Advanced In-
dustrial Science and Technology, Hiroshima 737-0197, Japan.Digital Object Identifier 10.1109/JOE.2009.2014933
coastal sea, and water exchange to the offshore sea. However,the well-designed measurement of water circulation that coversthe entire region of the coastal sea is quite difficult to perform inthe coastal sea especially around Japan because of strong fishingactivity and heavy shipping traffic. Coastal acoustic tomography(CAT) is proposed as an innovational oceanographic technologythat can get snapshots of coastal sea circulation and relax theobservational limitation mentioned above [1]–[6]. It should benoted that the technology and science of deep-sea acoustic to-mography, initiated from the U.S., are accumulated in the CAT[7].
Hiroshima Bay is well known as one of the most famousoyster aquaculture fields in Japan. Two thousand aquaculturerafts distributed over the bay and the shipping traffic routepassing through the central part of the bay make well-designedoceanographic observations hopeless. The generation of non-linear components of external tides with periods of 6 and 4 h(named M4 and M6 tides, respectively) is reported in the tidalharmonics table, published by the Japan Coast Guard in 1983on the basis of tidal gauge station data [8]. However, untilnow, no data on subtidal internal modes with periods less thanhalf a day were reported inside the bay. The purpose of thisstudy is to describe the generation of subtidal internal modesand to elucidate their wave parameters by applying the newlydeveloped CAT technology.
II. EXPERIMENT
Hiroshima Bay is a typical semienclosed coastal sea area lo-cated at the central part of the Seto Inland Sea, Japan (Fig. 1).To the north, the bay is bordered by the coastal region of Hi-roshima city with artificial piers and wharfs. Itsuku-shima is-land and Eta-jima and Nino-shima islands make a segmentedborder to the southwest and to the south, respectively. The depthof the bay extends from 4 m at the northern coast to 20 m atthe southern border. Hiroshima Bay is the most famous oysteraquaculture region in Japan, but the oyster aquaculture industryis frequently damaged by red tides due to nutrient-rich water.The environmental problem still is a major issue in oyster in-dustries.
The CAT experiment composed of seven sound transmissionand reception stations H1–H7 (hereinafter called the acousticstations) was carried out on September 17–28, 2003 (seeFig. 1). Three land-based CAT systems were deployed alongthe northern coasts using the wharfs and piers [Fig. 2(a)], andthe other four CAT systems placed at the southern part of theobservation domain were set up, using small lifting rafts placedat both edges of large oyster rafts [Fig. 2(b)]. There is onlyone hydrophone for acoustic stations H2, H3, and H7 and a
0364-9059/$25.00 © 2009 IEEE

104 IEEE JOURNAL OF OCEANIC ENGINEERING, VOL. 34, NO. 2, APRIL 2009
Fig. 1. Location map of the experimental site. The location of seven acoustic stations is indicated with the dots in the magnified map on the right side of the figure.The five solid lines connecting the acoustic stations show the lines that make successful sound transmission. A star mark at station T indicates the position of atemperature sensor.
Fig. 2. Schematic diagrams of (a) land-type and (b) raft-type CAT systems de-ployed in Hiroshima Bay.
four-hydrophone array of 50-cm interval for the remaining sta-tions. Only the hydrophone data with a maximum signal levelare analyzed for the hydrophone array stations. Both the oyster
Fig. 3. Time plots of (a) sea level and (b) wind speed. The duration of thetomography experiment is indicated with the thick horizontal bar in (a).
rafts and the CAT equipped rafts are horizontally displacedwith moored wires at phases synchronized with tidal currents.The transmitter and hydrophone unit, suspended down througha cable in the water from the raft, also oscillated with tidalcurrents. The transmitter and hydrophone unit is put near themiddle of water column for every acoustic station. Modulationof a 5.5-kHz carrier by the pseudorandom signal, called thetenth-order Gold sequence, was transmitted every 10 min.
The sea level data obtained at the tidal gauge station “HI-ROSHIMA” of Japan Coast Guard during September 17–30,2003, are shown in Fig. 3 with the time plot. It is seen from thefigure that the experiment was performed at the transition phasefrom the neap to spring tide. Wind measurement was performedat H5, located at the central part of the tomography region. Thewind data are plotted with the vector diagram in the lower panelof the figure. The wind speed was increased up to 12 m swhen Typhoon 0315 passed the region on September 21, 2003,southward by about 100 km from Hiroshima Bay.
The temperature data are obtained at 5 m below the surfacebuoy, deployed at station T (34 19.5 E, 132 23.5 E) by theJapan Coast Guard for maintaining the ship traffic route insidethe bay. The data are publicly available from the Japan CoastGuard. During the four days from September 18 to 21, strongvertical mixing due to the typhoon homogenized considerablythe stratified water in Hiroshima Bay and caused a significant

NGUYEN et al.: ACOUSTIC MEASUREMENT OF MULTISUBTIDAL INTERNAL MODES GENERATED IN HIROSHIMA BAY, JAPAN 105
Fig. 4. Time plots of 5-m temperature obtained on the Japan Coast Guard buoyduring (a) September 15–30, 2003 and (b) July 15–30, 2003.
temperature decrease of about 2.5 C at station T, with an under-laying subtidal temperature variation of about 1 C [Fig. 4(a)].The temperature variation at mid summer (July 17–30) of thesame year is also shown in Fig. 4(b). The thermal stratificationis strengthened towards the end of July and the range of temper-ature variation reaches 3 C during July 26–27. Here notice thatthe tomography experiment was performed at a time of weakerstratification because the main target of the experiment was tomeasure not temperature structures, but current speed structures.
By considering the number of acoustic stations to be seven,the total number of the transmission lines becomes 21. Howeverthe sound transmissions among H1, H2, and H3 were precludedby the protruding coastlines with wharfs and piers. The soundtransmission between H4 and H6 was obstructed by a small is-land (Benten-shima) existing on the transmission line. The re-ciprocal sound transmission along the line H6H7 failed due to aflawed setting of the system. There were many oyster rafts dis-tributed over the tomography domain, and the position of these
Fig. 5. Ray diagrams obtained between H3 and H6 by the ray tracing methodthat uses range-averaged sound-speed profiles (a) before and (b) after typhoon.The transmitter (Tr) depth at H3 is set to 6 m and the receiver (Re) depth at H6is set to 8.5 m.
oyster rafts was shifted on a daily basis to find a better condi-tion of growing oysters and calm sea surfaces. Thus, the soundtransmissions along the transmission lines H1H4, H1H6, H1H7,H2H4, H2H6, H2H7, H3H5, H3H6, H3H7, H4H7, and H5H7were interrupted severely by the distributed oyster rafts. As a re-sult, the number of successful transmission lines (H1H5, H2H5,H3H4, H4H5, and H5H6) to make statistical data analyses pos-sible reduces to five as indicated with thick solid lines in Fig. 1.Even for the five successful transmission lines, the percentage ofmissing data is in a range as large as 10%–30%. The data in theregion of missing data are produced through linear interpolationof neighboring data before statistical analysis. The ray diagramsobtained between stations H3 and H6 by the ray tracing methodthat uses a range-averaged sound-speed profile before and afterthe typhoon are shown in Fig. 5(a) and (b), respectively. Theray paths for September 18 make an upward convex pattern asexpected for sound transmission through a stratified sea. Thereare only a few ray paths passing the upper 5 m. In contrast, theray paths for September 24 make a downward convex patternas expected in a homogenized ocean and most of ray paths passthe upper 12 m. This means that the depth range in which dataare acquired before and after the typhoon is from 5 to 12 m.
Notice that the range-averaged sound speed can be calcu-lated with enough accuracy even from one-way travel time datawhile the range-averaged current speed requires the reciprocaltravel time data (travel time difference). Thus, the percentage ofmissing data is considerably increased in case of a range-aver-aged current speed calculation, which needs the reciprocal data.This situation makes the statistical analysis of current speed datahopeless. This is the reason why only the sound speed data areinvestigated in this study.
The distances of station pairs were measured every 15 s by theGlobal Positioning System (GPS) antenna and receiver attached
106 IEEE JOURNAL OF OCEANIC ENGINEERING, VOL. 34, NO. 2, APRIL 2009
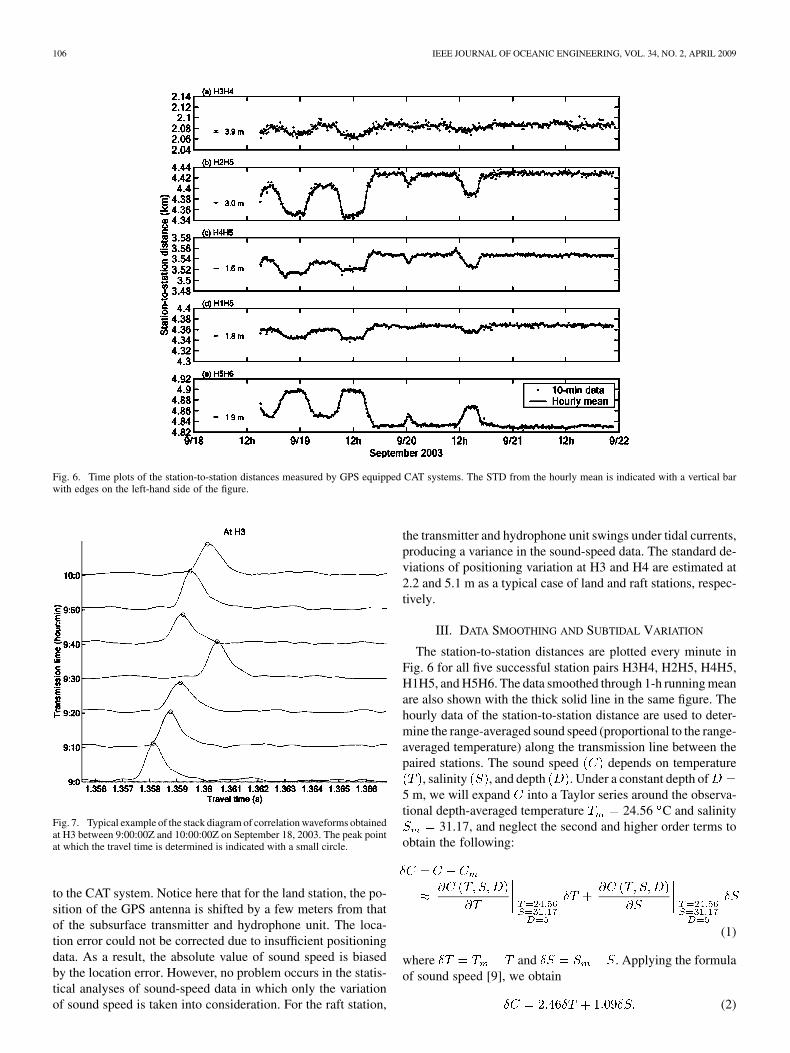
Fig. 6. Time plots of the station-to-station distances measured by GPS equipped CAT systems. The STD from the hourly mean is indicated with a vertical barwith edges on the left-hand side of the figure.
Fig. 7. Typical example of the stack diagram of correlation waveforms obtainedat H3 between 9:00:00Z and 10:00:00Z on September 18, 2003. The peak pointat which the travel time is determined is indicated with a small circle.
to the CAT system. Notice here that for the land station, the po-sition of the GPS antenna is shifted by a few meters from thatof the subsurface transmitter and hydrophone unit. The loca-tion error could not be corrected due to insufficient positioningdata. As a result, the absolute value of sound speed is biasedby the location error. However, no problem occurs in the statis-tical analyses of sound-speed data in which only the variationof sound speed is taken into consideration. For the raft station,
the transmitter and hydrophone unit swings under tidal currents,producing a variance in the sound-speed data. The standard de-viations of positioning variation at H3 and H4 are estimated at2.2 and 5.1 m as a typical case of land and raft stations, respec-tively.
III. DATA SMOOTHING AND SUBTIDAL VARIATION
The station-to-station distances are plotted every minute inFig. 6 for all five successful station pairs H3H4, H2H5, H4H5,H1H5, and H5H6. The data smoothed through 1-h running meanare also shown with the thick solid line in the same figure. Thehourly data of the station-to-station distance are used to deter-mine the range-averaged sound speed (proportional to the range-averaged temperature) along the transmission line between thepaired stations. The sound speed depends on temperature
, salinity , and depth . Under a constant depth of5 m, we will expand into a Taylor series around the observa-tional depth-averaged temperature 24.56 C and salinity
31.17, and neglect the second and higher order terms toobtain the following:
(1)
where and . Applying the formulaof sound speed [9], we obtain
(2)

NGUYEN et al.: ACOUSTIC MEASUREMENT OF MULTISUBTIDAL INTERNAL MODES GENERATED IN HIROSHIMA BAY, JAPAN 107
Fig. 8. Time plots of � calculated from the travel time data for station pairs (a) H3H4, (b) H1H5, and (c) H5H6. The STD from the hourly mean is indicatedwith a vertical bar with edges on the left-hand side of the figures.
The effect of on is 2.5 times greater than that of inthe observational range.
The standard deviation (STD) from the smoothed line pro-vides an index of positioning errors in estimating the range-av-eraged sound speed. The STD is estimated to be 3.9, 3.0, 1.6,1.8, and 1.9 m for H3H4, H2H5, H4H5, H1H5, and H5H6, re-spectively. The STD is drawn with the vertical bar with edgeson the left-hand side of each figure. The STD for H3H4 is con-siderably larger than the other ones, reflecting a large oscillationof the aquaculture raft at station H4 due to strong tidal currents.
The range-averaged sound speed along the trans-mission line may be related to the mean travel time
with the following form:
(3)
where is taken as the mean travel time in reciprocal transmis-sion or the travel time in one-way transmission. The anddenote the travel time for the forward and reverse directions in areciprocal transmission experiment, respectively. The receiveddata are cross-correlated with the tenth-order Gold code, used onthe transmission side, to increase remarkably the signal-to-noiseratio (SNR) of the received signals and the travel time for eachtransmission line is determined at a top point of the biggest
arrival peak in the corresponding cross-correlation waveform.A typical example of correlation waveforms, transmitted fromstation H4 and received at station H3 is shown in Fig. 7 withthe stack plot in which correlation waveforms are offset upwardwith increasing time.
The nearly four-day data of for three sound transmissionlines H3H4, H1H5, and H5H6 are shown at 10-min intervals inFig. 8. A thick solid line shows a 1-h running mean. The STDfrom the mean for the whole period is also shown with a ver-tical bar with edges on the left-hand side of each figure. TheSTDs provide an error bar in estimating from the traveltime data and are estimated to be 1.7 m s for H3H4, 0.5 ms for H1H5, and 0.4 m s for H5H6. The STD is the biggestfor H3H4 and decreases remarkably with distances from H3H4.This is similar to the tendency of the positioning error, as shownin Fig. 6. This is caused by the fact that under the precise clockaccuracy the sound-speed error is proportional to the po-sitioning error with the form where de-notes the mean travel time for each of the transmission lines [1].As seen in the smoothed data, subtidal variations with 2–4-h pe-riods are prominent especially in the sound-speed data of H3H4.A similar subtidal variation also appears in the H1H5 data witha weaker energy level. Such a subtidal variation is very weak inthe H5H6 data far away from the H3H4. The diurnal variationis slightly visible in the H1H5 data.

108 IEEE JOURNAL OF OCEANIC ENGINEERING, VOL. 34, NO. 2, APRIL 2009
Fig. 9. Power-spectral diagrams for the 5-m temperature data of (lower)September 15–30, 2003 and (upper) July 15–30, 2003. The significant subtidalpeaks are pointed out by vertical arrows. The thin vertical bar near the peaksshows the 95% confidence level.
Fig. 10. Power-spectral diagrams of� for station pairs (a) H3H4, (b) H2H5,and (c) H5H6. The spectral peaks belonging to dynamic modes 1, 2, 3, and 4are pointed out by vertical arrows. The thin vertical bar at the peaks shows the95% confidence level.
IV. SPECTRAL ANALYSES
The power-spectral diagram, calculated from the hourlytemperature data at station T during half a month (September15–30) including the duration of the tomography experiment isshown in Fig. 9. Four prominent spectral peaks are visible inthe subtidal range around 4.3, 3.0, and 2.3 h. For comparison,the power-spectral diagram of temperature variation for themid summer 2003 (July 15–30) is also shown in the upper partof the same figure. The spectral peaks for the subtidal rangeexist at 8.3, 6.0, 4.1, and 3.3 h with energy levels higher thanthe September data. The 4-h peak is pronounced especially in
Fig. 11. Cross-spectral (a) amplitude and (b) phase diagrams of � for thetransmission line pairs H3H4-H2H5, H2H5-H1H5, and H1H5-H5H6. Thepeaks of amplitude spectra that serve in phase determination are indicated withthe thick vertical arrows and the corresponding phases are indicated with thevertical arrows and horizontal bar on the phase spectra.
the September temperature data as in the tomography data. Thesemidiurnal variation is rather weak in both spectra.
The power-spectral diagrams for are shown in Fig. 10 forthe transmission lines H3H4, H2H5, and H5H6, respectively.The 10-min resampling data after 1-h smoothing are used inthe power-spectral calculation. For all the transmission lines,prominent spectral peaks are visible in the period ranges of3.8–4.6, 2.2–2.3, and 1.4–1.5 h with decreasing energy levelsas distances from H3H4 are increased. The spectral peaks cor-responding to the semidiurnal internal tide also exist in H2H5and H5H6 data, while for H3H4, the semidiurnal peaks are re-placed by the 8-h event.
The cross-spectral diagrams of for the transmissionline pairs H3H4-H2H5, H1H5-H2H5, and H1H5-H5H6 areshown in Fig. 11(a) and (b) for amplitude and phase, re-spectively. The prominent spectral peaks for amplitude are

NGUYEN et al.: ACOUSTIC MEASUREMENT OF MULTISUBTIDAL INTERNAL MODES GENERATED IN HIROSHIMA BAY, JAPAN 109
TABLE IINTERNAL MODE PARAMETERS DETERMINED BY THE ACOUSTIC TOMOGRAPHY EXPERIMENT
Fig. 12. Vertical profiles of (a) density and (b) vertical velocity for the first,second, third, and fourth internal modes. The CTD data obtained at H4 onSeptember 18, 2003, before the typhoon, is used.
seen in almost the same period ranges of 12.0–12.5, 3.8–4.2,2.0–2.3, and 1.4–1.5 h as those in the power-spectral diagrams.For all the period ranges, the peak heights of the amplitudespectrum are decreased with distances from H3H4. Exceptfor the case of the 4.0-h mode for the transmission line pairH3H4-H2H5, the phase delay is determined at the pointon the phase-spectral diagram corresponding to the peak pointon the amplitude-spectral diagram. The phase delay for the
4.0-h mode of H3H4-H2H5 is better estimated with the meanphase between 3.8 and 4.2 h rather than the phases for thepeak points because phases have large variations in the rangefrom 3.8 to 4.2 h. Here the positive phase delay is taken for thepropagation from H3H4 towards H2H5, from H2H5 towardsH1H5, and from H1H5 towards H5H6.
These phase delay data are later used in the estimation of thepropagation direction of subtidal internal modes (Table I).
V. PARAMETERS OF SUBTIDAL INTERNAL MODES
The subtidal internal variation is the strongest on the soundtransmission line H3H4. This implies strongly that H3H4 isnearest the source region of the subtidal internal modes, at least,inside the tomography domain and it radiates out to the sur-rounding regions inside the domain. This speculation is furtherconfirmed with the following arguments.
The power-spectral analyses of show that the multisub-tidal internal modes with period ranges of 1.4–1.5, 2.0–2.3,and 3.8–4.2 h occur definitely in Hiroshima Bay (see Fig. 11).The occurrence of the semidiurnal internal tide of period range12.0–12.5 h is also a confirmed event although it is largelydisturbed by subtidal internal modes. On the other hand, thephase speed of the internal long waves is 1.8 , 0.8, 0.5,and 0.4 m s for the first, second, third, and fourth modes,respectively, as estimated by the dynamic mode analysis [10].Both the data of the period and phase speed are merged toobtain the wavelength in . The wavelength results in86.4, 11.4, 4.0, and 2.2 km for the first, second, third, and fourthinternal modes, respectively. The profiles of vertical velocityfor the first four dynamic modes are shown in Fig. 12.
The phase lag between the two neighboring transmis-sion lines can be determined from the cross-spectral phases at

110 IEEE JOURNAL OF OCEANIC ENGINEERING, VOL. 34, NO. 2, APRIL 2009
the corresponding periods. Putting the distance between the cen-tral points on two transmission lines into L, we get the wave-length component of subtidal internal modes along the lineconnecting two central points in the following:
(4)
where denotes an integer, selected as zero in this paper. Thepropagation angle of subtidal internal modes measuredfrom the central-point connected line is expressed by
(5)
In oceanography, the angle is commonly measured from thenorth. Following the new definition, we express the propagationdirection with two possibilities by
(6)
where denotes the direction of the central-point line, mea-sured from the north.
The propagation direction of the three subtidal internalmodes (second, third, and fourth) is shown with the ar-rows in Fig. 13(a)–(c) for the three transmission line pairsH3H4–H2H5, H2H5–H1H5, and H1H5–H5H6, respectively.The second internal mode suggests strongly the westwardpropagation from the source region at H3H4. The third internalmode propagates southwestward between H3H4 and H2H5 andits direction turns to the south, closing to H5H6. The fourthinternal mode has almost the same propagation characteristicsas those for the third internal mode.
VI. DISCUSSION AND SUMMARY
The CAT is applied to Hiroshima Bay where strong oysteraquaculture industries have precluded a well-designed oceano-graphic observation. The four-day sound transmission data thatpermits a statistical analysis were acquired along the five trans-mission lines in spite of severe data gaps due to many oysteraquaculture rafts, distributed over the bay. The range-averagedsound speed is calculated along the five transmission lines witha maximum error bar of 1.7 m s (Fig. 8).
The cogeneration of multisubtidal internal modes, indicatedby the significant variation of sound speed, is observed in theperiod range of 1.0–4.0 h and the magnitude of their variationreaches 5 m s beyond a maximum error level of 1.7 m snear the source region. This variation corresponds to a tempera-ture change of about 1.5 C. The energy level of subtidal internalvariation is the biggest at H3H4 at the northeastern corner of theobservation region and decreases southwestward.
The power-spectral and cross-spectral analyses of the range-averaged sound speed are applied to determine the source re-gion, period, and propagation direction of the subtidal internalmodes. The generation of the multisubtidal internal modes iswell confirmed with the power-spectral peaks that exist in theperiod ranges, centered at 4.0, 2.1, and 1.5 h in spite of the errorinclusion due to missing data rates ranging from 10% to 30%.In the cross-spectral amplitude diagrams for the three trans-mission line pairs, prominent spectral peaks are found in the
Fig. 13. Propagation direction of the subtidal internal modes drawn withthe thick solid arrows between the transmission line pairs (a) H3H4-H2H5,(b) H2H5-H1H5, and (c) H1H5-H5H6, The thin solid and thick dotted linesshow the sound transmission lines and the cross transmission lines connectingtheir central points, respectively.
period ranges of 3.8–4.2, 2.0–2.3, and 1.4–1.5 h. By incorpo-rating the result of the dynamic mode analysis of internal longwaves, these peaks are identified as those of the second, third,
NGUYEN et al.: ACOUSTIC MEASUREMENT OF MULTISUBTIDAL INTERNAL MODES GENERATED IN HIROSHIMA BAY, JAPAN 111
and fourth internal modes with respective phase speeds of 0.8,0.5, and 0.4 m s . The semidiurnal internal tide is also identi-fied as the first internal mode with 2.0-m s phase speed.
The wave propagation characteristics of the multisubtidal in-ternal modes are investigated from the phase difference amongthe three transmission lines, arranged in the expected propaga-tion direction of internal modes. The possible propagation direc-tions are determined from the ratio of the cross-transmission linewavelength for the theoretical wavelength. The result suggeststhat the source region of the multi-internal modes is located inthe narrow channel at the northeastern corner of the tomographysite, namely, between stations H3 and H4. The second internalmode propagates westward from the source region while thethird and fourth internal modes propagate in the westward di-rection near the source region and then turn to the south in thesouthwest area of the observation domain. The 5-m temperaturedata, obtained at the central part of Hiroshima Bay, also supportstrongly the generation of the subtidal internal modes mentionedabove.
The propagation parameters (period, phase speed, and propa-gation direction) of the subtidal internal modes can also be mea-sured by point temperature sensors attached to aquaculture raftswith an appropriate arrangement. However, it should be notedthat the tomographic technique can confirm temperature vari-ation through a spatial average along each ray path. Further-more, the tomographic technique has a big advantage in mea-suring the horizontal structures of temperature inside the region,surrounded by multitomographic stations even though, unfortu-nately, such tomographic data are not acquired in this study.
ACKNOWLEDGMENT
The authors would like to thank Dr. F. Syamsudin for his sup-port in data processing and field works. The Japan Coast Guardis acknowledged for providing the sea level and temperaturedata opened to the public.
REFERENCES
[1] H. Zheng, H. Yamaoka, N. Gohda, H. Noguchi, and A. Kaneko, “De-sign of the acoustic tomography system for velocity measurement withan application to the coastal sea,” J. Acoust. Soc. Jpn. (E), vol. 19, pp.199–210, 1998.
[2] J.-H. Park and A. Kaneko, “Assimilation of coastal acoustic tomog-raphy data into a brotropic ocean model,” Geophys. Res. Lett., vol. 27,no. 20, pp. 3373–3376, 2000.
[3] H. Yamaoka, A. Kaneko, J.-H. Park, H. Zheng, N. Gohda, T. Takano,X.-H. Zhu, and Y. Takasugi, “Coastal acoustic tomography system andits field application,” IEEE J. Ocean. Eng., vol. 27, no. 2, pp. 283–295,Apr. 2002.
[4] K. Yamaguchi, J. Lin, A. Kaneko, T. Yamamoto, and N. Gohda, “Acontinuous mapping of tidal current structures in the Kanmon Strait,”J. Oceanogr., vol. 61, pp. 283–294, 2005.
[5] A. Kaneko, K. Yamaguchi, T. Yamamoto, N. Gohda, and H. Zheng,“A coastal acoustic tomography experiment in Tokyo Bay,” ActaOceanologica Sinica, vol. 24, no. 1, pp. 86–94, 2005.
[6] J. Lin, A. Kaneko, N. Gohda, and K. Yamaguchi, “Accurate imagingand prediction of Kanmon Strait tidal current structures by the coastalacoustic tomography data,” Geophy. Res. Lett., vol. 32, no. L14607,2005, DOI: 10.1029/2005GL022914.
[7] W. Munk, P. F. Worcestor, and C. Wunsch, Ocean Acoustic Tomog-raphy. Cambridge, U.K.: Cambridge Univ. Press, 1995, pp. 433–433.
[8] Tidal Harmonics Tables in Japanese Coast. Tokyo, Japan: JapanCoast Guard, 1983, pp. 172–172.
[9] H. Medwin, “Speed of sound in water: A simple equation for realisticparameters,” J. Acoust. Soc. Amer., vol. 58, pp. 1318–1319, 1975.
[10] A. Gill, Atmosphere-Ocean Dynamics. New York: Academic, 1982,pp. 662–662.
Hong-Quang Nguyen was born in Hanoi, Vietnam.He received the B.S. and M.S. degrees in geophysicsfrom Hanoi National University, Hanoi, Vietnam,in 1994 and 2001, respectively. Currently, he isworking towards the Ph.D. degree in environmentalengineering at the Graduate School of Engineering,Hiroshima University, Hiroshima, Japan.
He has been a Lecturer at the Hanoi NationalUniversity since 1995. His current research topicsinclude acoustic measurement of environmentalvariability due to internal tides and waves.
Arata Kaneko (M’02) received the Ph.D. degree influid dynamics from Kyushu University, Fukuoka,Japan, in 1981.
He was a Research Associate at the ResearchInstitute for Applied Mechanics, Kyushu University,during 1997–1981 and an Associate Professor during1982–1990, where he participated in the projects ofKuroshio observation based on advanced technolo-gies such as the towed-type acoustic Doppler currentprofiler (ADCP). In 1991, he became a Professorat the Graduate School of Engineering, Hiroshima
University, Hiroshima, Japan. Since then, he initiated an effort to develop thecoastal acoustic tomography (CAT) for the 4-D measurement and predictionof coastal sea environment variability, which was motivated by a visitingstay at the Woods Hole Oceanographic Institution, Woods Hole, MA, during1985–1986. Recently, he successfully finished the Luzon Strait Acoustic To-mography Experiment as a Japan–China–U.S.–Taiwan joint project, supportedby the Office of Naval Research (ONR).
Dr. Kaneko is a member of the Oceanographic Society of Japan, the MarineAcoustic Society of Japan, the Japan Society of Civil Engineering, the AcousticSociety of Japan, the American Geophysical Union, and the Oceanography So-ciety.
Ju Lin was born in Fuzhou, China, in 1969. He re-ceived the B.S. and M.S. degrees in ocean acousticsfrom the Ocean University of Qingdao, Qingdao,China, in 1991 and 1996, respectively, and the Ph.D.degree in acoustic tomography and model fromHiroshima University, Hiroshima, Japan, in 2005.
He was a Lecturer at the Ocean University of Chinaduring 1996–2006 and has been an Associate Pro-fessor since 2007. His current research topics includethe acoustic measurement of internal wave and otherocean environmental parameters in the Yellow Sea
and Luzon Strait.Dr. Lin is a member of the Acoustic Society of Shangdong, China
Keisuke Yamaguchi received the Ph.D. degree in en-vironmental engineering from Hiroshima University,Hiroshima, Japan, in 2005.
He studied the monitoring and mapping of coastalcurrent structures by means of the coastal acoustictomography (CAT) in the Ph.D. course. He is nowworking with NuFlare Technology, Inc., Shizuoka,Japan, accumulating his mechanical engineering ca-reer.

112 IEEE JOURNAL OF OCEANIC ENGINEERING, VOL. 34, NO. 2, APRIL 2009
Noriaki Gohda received the Ph.D. degree in plasmaphysics from Hiroshima University, Hiroshima,Japan, in 1979.
From 1982 to 2007, he held a faculty position atthe Graduate School Engineering, Hiroshima Univer-sity, where he led the design, construction, and de-velopment of the coastal acoustic tomography (CAT)system. He still makes great effort to support the CATgroup at Hiroshima University.
Yoshio Takasugi received the Ph.D. degree in fish-eries science from the Ocean Research Institute, Uni-versity of Tokyo, Tokyo, Japan, in 1993.
He still gives his support to the Coastal Environ-ment and Monitoring Research Group for Geologyand Geoinformation, National Institute of IndustrialScience and Technology, after formal retirement in2007. He has researched mainly the measurement andanalysis of environmental variability in the Seto In-land Sea of Japan since 1970s. His research interest iscurrent variability and turbulent mixing in the coastal
sea.Dr. Takasugi is a member of the Oceanographic Society of Japan.