Acoustic formation of multicellular tumor ... - Lab on a Chip
11
Lab on a Chip PAPER Cite this: Lab Chip, 2018, 18, 2466 Received 28th May 2018, Accepted 16th July 2018 DOI: 10.1039/c8lc00537k rsc.li/loc Acoustic formation of multicellular tumor spheroids enabling on-chip functional and structural imaging† K. Olofsson, a V. Carannante, b M. Ohlin, ae T. Frisk, a K. Kushiro, c M. Takai, c A. Lundqvist, d B. Önfelt ab and M. Wiklund* a Understanding the complex 3D tumor microenvironment is important in cancer research. This microenvi- ronment can be modelled in vitro by culturing multicellular tumor spheroids (MCTS). Key challenges when using MCTS in applications such as high-throughput drug screening are overcoming imaging and analytical issues encountered during functional and structural investigations. To address these challenges, we use an ultrasonic standing wave (USW) based MCTS culture platform for parallel formation, staining and imaging of 100 whole MCTS. A protein repellent amphiphilic polymer coating enables flexible production of high quality and unanchored MCTS. This enables high-content multimode analysis based on flow cytometry and in situ optical microscopy. We use HepG2 hepatocellular carcinoma, A498 and ACHN renal carcinoma, and LUTC-2 thyroid carcinoma cell lines to demonstrate (i) the importance of the ultrasound–coating com- bination, (ii) bright field image based automatic characterization of MTCS, (iii) detailed deep tissue confocal imaging of whole MCTS mounted in a refractive index matching solution, and (iv) single cell functional analysis through flow cytometry of single cell suspensions of disintegrated MTCS. The USW MCTS culture platform is customizable and holds great potential for detailed multimode MCTS analysis in a high-content manner. Introduction In vivo, tumors grow in a complex 3-dimensional (3D) local environment where cell–cell interactions, the extracellular ma- trix (ECM) and soluble factors govern cell behavior. 1,2 This combination of biomechanical and biochemical elements constitutes the tumor microenvironment which is important for cellular development and function. 3 The widely used stan- dard culture techniques are based on growing cells in a sus- pension or in 2D on flat plastic surfaces. To bridge the gap between in vivo and in vitro in cancer research, numerous 3D cell culturing techniques, combining the advantages of 2D cultures with a 3D physiological context, have seen the light of day in the last couple of years. Many of them aim at pro- ducing multicellular tumor spheroids (MCTS) which are 3D cultured aggregates of cells from single or multiple cell types. These MCTS are appreciated for their ability to better repre- sent the tumor microenvironment 4 in terms of molecular dif- fusion, cell-to-cell and cell-to-ECM signaling, thus providing a heterogeneous tumor model suitable for applications such as drug screening. 5 The techniques to produce MCTS can be divided into ei- ther scaffold-based or scaffold-free strategies. In scaffold- based 3D cultures, cells grow on 3D platforms that mimic the ECM. One example utilizes a liquid two-phase system to form a droplet sphere, of e.g. alginate or collagen, with seeded cells. 6,7 While these systems have the potential to produce large quantities of uniformly sized MCTS, they suffer from re- producibility issues due to ECM batch-to-batch differences and low cell seeding density which poorly reflects the tumor environment with nutrient and gas gradients during early MCTS culture phases. 8 Scaffold-free MTCS formation approaches rely on cell-to- cell adhesive interactions and ECM production by cells dur- ing the culture, and can either be passive or active. Passive strategies are generally based on low-adhesion surfaces and gravitational forces such as hanging drop cultures, 9 micro- patterned surfaces 10 or protein repellent micro-wells. 11 In contrast to the passive methods, active MCTS formation is based on cell position manipulation. This can be done by e.g. increasing cell collisions while obstructing sedimentation through spinning vessels 12 or utilizing external forces such as 2466 | Lab Chip, 2018, 18, 2466–2476 This journal is © The Royal Society of Chemistry 2018 a Dep.t of Applied Physics, KTH Royal Institute of Technology, Sweden. E-mail: [email protected] b Dept. of Microbiology, Tumor and Cell Biology, Karolinska Institutet, Sweden c Dept. of Bioengineering, The University of Tokyo, Japan d Dept. of Oncology-Pathology, Karolinska Institutet, Sweden e Dept. of Engineering Sciences, Uppsala University, Sweden † Electronic supplementary information (ESI) available. See DOI: 10.1039/ c8lc00537k Open Access Article. Published on 16 July 2018. Downloaded on 8/12/2022 5:54:49 AM. This article is licensed under a Creative Commons Attribution-NonCommercial 3.0 Unported Licence. View Article Online View Journal | View Issue
-
Upload
khangminh22 -
Category
Documents
-
view
1 -
download
0
Transcript of Acoustic formation of multicellular tumor ... - Lab on a Chip
Lab on a Chip
PAPER
Cite this: Lab Chip, 2018, 18, 2466
Received 28th May 2018,Accepted 16th July 2018
DOI: 10.1039/c8lc00537k
rsc.li/loc
Acoustic formation of multicellular tumorspheroids enabling on-chip functional andstructural imaging†
K. Olofsson, a V. Carannante, b M. Ohlin,ae T. Frisk, a K. Kushiro,c M. Takai, c
A. Lundqvist, d B. Önfelt ab and M. Wiklund*a
Understanding the complex 3D tumor microenvironment is important in cancer research. This microenvi-
ronment can be modelled in vitro by culturing multicellular tumor spheroids (MCTS). Key challenges when
using MCTS in applications such as high-throughput drug screening are overcoming imaging and analytical
issues encountered during functional and structural investigations. To address these challenges, we use an
ultrasonic standing wave (USW) based MCTS culture platform for parallel formation, staining and imaging
of 100 whole MCTS. A protein repellent amphiphilic polymer coating enables flexible production of high
quality and unanchored MCTS. This enables high-content multimode analysis based on flow cytometry
and in situ optical microscopy. We use HepG2 hepatocellular carcinoma, A498 and ACHN renal carcinoma,
and LUTC-2 thyroid carcinoma cell lines to demonstrate (i) the importance of the ultrasound–coating com-
bination, (ii) bright field image based automatic characterization of MTCS, (iii) detailed deep tissue confocal
imaging of whole MCTS mounted in a refractive index matching solution, and (iv) single cell functional
analysis through flow cytometry of single cell suspensions of disintegrated MTCS. The USW MCTS culture
platform is customizable and holds great potential for detailed multimode MCTS analysis in a high-content
manner.
Introduction
In vivo, tumors grow in a complex 3-dimensional (3D) localenvironment where cell–cell interactions, the extracellular ma-trix (ECM) and soluble factors govern cell behavior.1,2 Thiscombination of biomechanical and biochemical elementsconstitutes the tumor microenvironment which is importantfor cellular development and function.3 The widely used stan-dard culture techniques are based on growing cells in a sus-pension or in 2D on flat plastic surfaces. To bridge the gapbetween in vivo and in vitro in cancer research, numerous 3Dcell culturing techniques, combining the advantages of 2Dcultures with a 3D physiological context, have seen the lightof day in the last couple of years. Many of them aim at pro-ducing multicellular tumor spheroids (MCTS) which are 3Dcultured aggregates of cells from single or multiple cell types.These MCTS are appreciated for their ability to better repre-
sent the tumor microenvironment4 in terms of molecular dif-fusion, cell-to-cell and cell-to-ECM signaling, thus providing aheterogeneous tumor model suitable for applications such asdrug screening.5
The techniques to produce MCTS can be divided into ei-ther scaffold-based or scaffold-free strategies. In scaffold-based 3D cultures, cells grow on 3D platforms that mimic theECM. One example utilizes a liquid two-phase system to forma droplet sphere, of e.g. alginate or collagen, with seededcells.6,7 While these systems have the potential to producelarge quantities of uniformly sized MCTS, they suffer from re-producibility issues due to ECM batch-to-batch differencesand low cell seeding density which poorly reflects the tumorenvironment with nutrient and gas gradients during earlyMCTS culture phases.8
Scaffold-free MTCS formation approaches rely on cell-to-cell adhesive interactions and ECM production by cells dur-ing the culture, and can either be passive or active. Passivestrategies are generally based on low-adhesion surfaces andgravitational forces such as hanging drop cultures,9 micro-patterned surfaces10 or protein repellent micro-wells.11 Incontrast to the passive methods, active MCTS formation isbased on cell position manipulation. This can be done by e.g.increasing cell collisions while obstructing sedimentationthrough spinning vessels12 or utilizing external forces such as
2466 | Lab Chip, 2018, 18, 2466–2476 This journal is © The Royal Society of Chemistry 2018
aDep.t of Applied Physics, KTH Royal Institute of Technology, Sweden.
E-mail: [email protected]. of Microbiology, Tumor and Cell Biology, Karolinska Institutet, Swedenc Dept. of Bioengineering, The University of Tokyo, JapandDept. of Oncology-Pathology, Karolinska Institutet, Swedene Dept. of Engineering Sciences, Uppsala University, Sweden
† Electronic supplementary information (ESI) available. See DOI: 10.1039/c8lc00537k
Ope
n A
cces
s A
rtic
le. P
ublis
hed
on 1
6 Ju
ly 2
018.
Dow
nloa
ded
on 8
/12/
2022
5:5
4:49
AM
. T
his
artic
le is
lice
nsed
und
er a
Cre
ativ
e C
omm
ons
Attr
ibut
ion-
Non
Com
mer
cial
3.0
Unp
orte
d L
icen
ce.
View Article OnlineView Journal | View Issue
Lab Chip, 2018, 18, 2466–2476 | 2467This journal is © The Royal Society of Chemistry 2018
magnetic forces13 or centrifugal forces.14 Each technique hasadvantages and disadvantages but in general, most of thestrategies require labor-intensive MCTS harvest and/or sizesorting before analysis. Also, most MCTS formation methodsdo not address the key challenge of overcoming MCTS lightscattering to obtain single cell metrics through detailed tis-sue imaging in a high-throughput manner.15
Another active external force for cell manipulation is theacoustic radiation force which is a gentle and non-invasiveforce experienced by a particle in an ultrasonic standing wave(USW).16 The USW is induced in a resonator cavity with awidth corresponding to a multiple of half the wavelength17
and the resulting acoustic radiation forces can be used inmany applications such as cell and particle concentration,sorting and trapping.18,19 USW trapping is a method wherecells or particles are spatially immobilized by the appliedacoustic radiation forces and thus a possible avenue for tis-sue engineering which has been shown for, e.g., HepG2MCTS20,21 and neocartilage grafts.22 In addition to the bulkUSW, surface acoustic waves (SAWs) have also been used for3D cell culture,23 as well as acoustic streaming-based cell ag-glomeration in a 24-well plate.24 Our group has previously de-veloped an ultrasound based multi-well microplate platformfor the formation of substrate-anchored quasi-3D tumormodels which were used to investigate natural killer cell–tu-mor dynamics.25 One of the advantages of this approachcompared to other MCST culture techniques is the possibilityto use a flat substrate for optimal imaging while still control-ling the number, size and position of MCTS. For example,high-quality microscopy requires a sub-200 μm cover glass asa substrate. However, glass, as a growth substrate for adher-ent cells, may influence the cell behavior.26 Glass is alsorarely used in standard cell culture platforms.
In this study, we present a new method where the multi-well microplate platform is combined with a cell adhesion re-pellent polymer coating enabling flexible and parallel produc-tion, processing and analysis of 100 uniformly sizedmulticellular full-3D tumor spheroids (MCTS). In contrast tosubstrate-anchored hemi-spheroids as tumor models,25 themethod produces highly uniform, spherical MCTS which arecharacterized on-chip by high resolution confocal microscopyimaging in 3D. The widely used and well-characterizedHepG2 hepatocellular carcinoma cell line is used for optimiz-ing the driving parameters of the acoustic cell culture and forcomparing the appearance of the MCTS with and without thecell adhesion repellent coating. To demonstrate the ability toculture various MCTS types, three additional cell lines are in-vestigated: A498 and ACHN renal carcinoma cell lines andthe LUTC-2 thyroid carcinoma cell line. Among these, theA498 renal carcinoma cell line is used to produce MCTS forflow cytometry analysis, which shows retained cell viability inUSW induced MCTS compared to A498 cells cultured in 2D.To demonstrate the imaging possibilities, we present on-chipconfocal microscopy of whole antibody stained A498 MCTSmounted in a refractive index matching solution (RIMS). TheUSW based MCTS culture platform offers opportunities for
high-content MCTS studies enabled by on-chip optical char-acterization. The possibility to form, process and imageMCTS in the same microplate offers a seamless experimentalworkflow with reduced labor need.
Material and methodCell lines
Four different cell lines were used in the experiments: HepG2hepatocellular carcinoma, A498 renal carcinoma, ACHN renalcarcinoma and LUTC-2 thyroid carcinoma cells. HepG2 cellswere cultured in RPMI-1640 (Thermo Fisher Scientific)supplemented with 10% fetal bovine serum, 100 U mL−1 pen-icillin, 100 μg mL−1 streptomycin and 2 mM L-glutamine.A498, ACHN and LUTC-2 cells were maintained in RPMI 1640GlutaMAX™ medium (Thermo Fisher Scientific)supplemented with 10% fetal bovine serum (Thermo FisherScientific) and 1× MEM Non-Essential Amino Acid Solution(Sigma Aldrich). All cell lines were maintained at 37 °C in 5%CO2 and passaged before they reached confluency.
Ultrasonic multi-well device
The USW based MCTS culture device consists of a silicon-glass multi-well microplate (Fig. 1A) and an ultrasonic trans-ducer (Fig. 1B), as described in previous studies.27,28 In short,a 300 μm thick 4 inch silicon wafer is dry etched throughwith nine 10 × 10 grids of holes, each hole with an area of350 × 350 μm2 and with slightly concave walls, before anodi-cally bonded to a 0.175 mm thick glass wafer and diced intonine 22 × 22 mm2 multi-well microplates.29 A 2 mm thickPDMS gasket is plasma bonded around the micro-well grid toprovide a shared medium reservoir above the micro-wells. Akey design feature is the glass bottom thickness of 0.175mm, corresponding to a No. 1.5 coverslip, which is optimalfor inverted high-resolution optical microscopy.
The ultrasonic transducer consists of a ring-shaped, 38mm diameter, piezo ceramic plate (APC 840, American Piezo,USA) with an 8 mm diameter central hole mounted in an alu-minum frame and connected to an SMB connector. Themulti-well microplate is attached to the piezo ceramic plateusing a spring-loaded plastic and aluminum screw clamp.For an efficient ultrasound coupling, a thin layer of immer-sion oil (Immersol 518 F, Zeiss) is applied between the micro-plate and the piezo ceramic plate.
Protein repellent coating and coating protocol
To produce unanchored MCTS, a random polyIJMPC-co-MPTSSi-co-MPTMSi) coating (Fig. 1A) was used, in which thebiocompatible 2-methacryloyloxyethyl phosphorylcholine(MPC) polymer component exhibits strong protein repellentproperties.30 The hydrophobic nature of 3-(methacryloyloxy)-propyl-trisIJtrimethylsilyloxy) silane (MPTSSi), together withthe silane coupling capability of 3-methacryloxypropyl tri-methoxysilane (MPTMSi) onto SiO2 substrates, provides athin coating with long-term stability in aqueous
Lab on a Chip Paper
Ope
n A
cces
s A
rtic
le. P
ublis
hed
on 1
6 Ju
ly 2
018.
Dow
nloa
ded
on 8
/12/
2022
5:5
4:49
AM
. T
his
artic
le is
lice
nsed
und
er a
Cre
ativ
e C
omm
ons
Attr
ibut
ion-
Non
Com
mer
cial
3.0
Unp
orte
d L
icen
ce.
View Article Online

2468 | Lab Chip, 2018, 18, 2466–2476 This journal is © The Royal Society of Chemistry 2018
environments. The detailed protocols for copolymer synthesisand characterization are described in an earlier study.31 Inthis study, a 0.1 wt% solution of the random copolymer, withmolar ratios MPC :MPTSSi :MPTMSi = 54 : 27 : 19, in metha-nol was used to coat the SiO2 surface of the silicon walls andthe glass bottom in the wells of the microplate.
The multi-well microplate was prepared for coating bycleaning for 30 min at 45 °C in an ultrasonication bath im-mersed in 70% ethanol followed by drying in a desiccator for30 min. For each microplate, 100 μL coating solution wasprepared from the 0.1 wt% polymer solution mixed at 90/10w/w with 0.1 M acetic acid aqueous solution working as a cat-alyst. To further enhance the substrate–polymer silane cou-
pling reaction, the cleaned and dried microplate was treatedwith oxygen plasma for 60 s with 50 sccm O2 and 300 W for-ward power (PlasmaLab 80+, Oxford Instruments) before thecoating solution was applied and left at room temperaturefor 2 hours. The excess solution was then aspirated and themulti-well microplate was dried in a desiccator for 1 hourand in an oven at 70 °C for 1 hour. Before using the coatedmulti-well microplate for ultrasonic 3D culture, it was rinsedand submerged in MilliQ water to let the hydrophilic MPCpolymer disentangle and face outwards for efficient proteinrepulsion. Before reusing the chip for a new ultrasonic 3Dculture, the coated multi-well microplates were cleaned in70% ethanol for 20 minutes and rinsed in MilliQ water.
Temperature regulation
To control the surrounding environment and regulate thetemperature around 36.4 °C, the USW based MCTS culturedevice is placed in an in-house built PID controlled liquid-based temperature control system combined with a commer-cial table top incubator (GalaxyMini, LabRum) (Fig. 1C). ThePID controller (KT4, Panasonic) receives temperature feed-back from a type T thermocouple probe placed on the multi-well microplate and regulates the temperature control systemaccordingly. The control system has an accuracy of ±0.5 °C,therefore, the temperature set point was 36.4 °C to avoidovershooting above 37 °C.
Inside the incubator, the multi-well microplate transducersetup is placed on a copper water block connected to thetemperature control system. The system was designed to ro-bustly regulate the transducer temperature around a desiredset point independently of the applied AC actuation voltageacross the piezo ceramic element which is desirable since theheating effect generated by the transducer drifts slightly overtime without temperature control.
Coating characterization by X-ray photoelectron spectroscopyand ellipsometry
The surface elemental compositions of the coated surfaceswere confirmed by X-ray photoelectron spectroscopy (XPS)(JPS-9010, JEOL Inc.) with a 60° incline (target: Al). Chargecorrections were applied for better comparisons. The thick-ness of the polymer coating was measured with an opticalellipsometer (J.A. Woollam Co.) using a He/Ne laser with anincident angle of 70°. Five different samples were prepared toobtain the average values.
Influence of polymer coating on ultrasonic radiation forces
The influence of the thin polymer coating on the ultrasonicradiation forces was investigated by tracking 10 μm greenfluorescent polystyrene beads, seeded into the micro-wellswith a regular pipette, in movies recorded during the initialultrasonic radiation force focusing in both uncoated andcoated multi-well microplates. Videos (25 fps) of the initialtrapping of 10 μm fluorescent polystyrene beads were ac-quired while the transducer was actuated with 15 Vpp and
Fig. 1 Coating, assembly and seeding of the USW device. The siliconmulti-well microplate is etched with 100 micro-wells (350 μm × 350μm, 300 μm deep), bonded to a glass plate and coated with a proteinrepellent copolymer coating (A) before being mounted onto the trans-ducer (B) by clamping it with a frame. The ultrasonic tissue engineeringplatform is kept at constant temperature during actuation by an in-house built liquid-based temperature control system coupled to acommercial incubator (C). To produce MCTS, a single cell suspensionis seeded into the multi-well microplate with a standard pipette andultrasonic radiation forces trap cells into all 100 micro-well centers.MCTS are then formed when incubated during continuous ultrasonicactuation for 24 hours (D).
Lab on a ChipPaper
Ope
n A
cces
s A
rtic
le. P
ublis
hed
on 1
6 Ju
ly 2
018.
Dow
nloa
ded
on 8
/12/
2022
5:5
4:49
AM
. T
his
artic
le is
lice
nsed
und
er a
Cre
ativ
e C
omm
ons
Attr
ibut
ion-
Non
Com
mer
cial
3.0
Unp
orte
d L
icen
ce.
View Article Online
Lab Chip, 2018, 18, 2466–2476 | 2469This journal is © The Royal Society of Chemistry 2018
2.46 ± 0.5 MHz at 1 kHz frequency modulation. This was re-peated twice before and after the coating was applied in 18micro-wells in three different multi-well microplates. Thefluorescent bead trajectories were captured in the Fiji plug-inTrackMate32 by first identifying all the beads in all the framesand then automatically connecting the trajectories with somemanual correction for bead speed calculations.
Ultrasonic MCTS culture
Adherent tumor cells were treated with 0.25% Trypsin-EDTAsolution (Sigma Aldrich), collected and re-suspended at300 000 cells per mL for MCTS used in imaging experimentsor 500 000 cells per mL for the FACS experiment to increasethe number of events collected during analysis. To produceMCTS, 100 μL of cell suspension was seeded with a regularpipette into the medium reservoir above the micro-wells(Fig. 1D). Gravity settled the cells at the bottom of the micro-wells and a couple of medium exchanges performed with apipette ensured that no cells rested on the silicon walls abovethe micro-wells. A cover glass was placed on top of the PDMSgasket to minimize medium evaporation and preserve sterileconditions. The multi-well microplate was then clamped ontothe transducer and placed on the cooling block inside the in-cubator before being connected to a function generator(DS345, Stanford Research Systems) and amplifier (75A250A,Amplifier Research). To optimize the initial cell aggregationprocedure at the start of each experiment, a frequency modu-lation (FM) scheme was applied where the central frequencyis stepped every 3 s from 2.4 MHz to 2.5 MHz in 10 kHz inter-vals with a 50 kHz span at a rate of 1 kHz. The procedurewas iterated 20 times before the optimal FM scheme was set(2.47 MHz center frequency, 100 kHz span and 1 kHz rate).This automatic startup procedure does not require any visualaccess or other manual alignment procedure.33 While moni-toring the microplate temperature, the amplitude was slowlyincreased from 20 Vpp to 30 Vpp to avoid heating the cells be-yond 37 °C and allow for the cooling system to compensatefor the increased heating. The cells were incubated with 5%CO2 at 36.4 °C with the PID controller set to 36.4 °C for 24hours. After 24 hours of USW trapping, the microplate wastransferred to a passive culture inside a standard incubatorfor another 24 hours.
Passive 3D culture in 2% agarose micro-wells
As a reference, a passive MCTS culture method based on low-adhesion agarose micro-wells was used in the live/dead flowcytometry assay. Molten 2% agarose (Sigma Aldrich) solutionwas poured onto the MCTS micro-mold (#12–256-Small,MicroTissues, Inc.) to obtain agarose hydrogels with 256round-bottom micro-wells (well diameter = 400 μm). Agarosemicro-well molds were transferred into a 24-well plate (SigmaAldrich) and equilibrated in complete culture medium for 1hour, with two medium exchanges before cell seeding. A498renal cell carcinoma cells were re-suspended at 500 000 cellsper mL and seeded in the agarose gel molds (0.2 mL per gel).
Cells were allowed to settle in the micro-wells for 15 min be-fore 2 mL of complete medium was added. The cell culturewas maintained at 37 °C, 5% CO2 for 48 hours before the 2%agarose-induced MCTS were harvested for further analysis.
Live/dead flow cytometry assays
The A498 renal carcinoma cell line from 2D cultures, USW in-duced 3D cultures and 2% agarose-induced 3D cultures weretreated with Accumax (STEMCELL Technologies Inc.) for 1hour at room temperature and washed twice in PBS. Singlecell suspensions were incubated with Fixable Viability Stain700 (BD Bioscience) according to the manufacturer's instruc-tions. Cells were washed twice in PBS, re-suspended in PBSand analyzed by flow cytometry (BD FACSCanto II, BD Biosci-ence). Data analysis was performed with FlowJo Software v10(FLOWJO, LLC). Statistical analysis was performed in theGraphPad Prism 7.0a software.
Spheroid antibody staining and RIMS clearing
A492 MCTS were washed with PBS five times before beingfixed with 4% paraformaldehyde (PFA) for 30 minutes atroom temperature. Washing with the wash buffer (2% BSA,0.2% Triton X-100 in PBS) 5× for 5 minutes, 15 minute incu-bation with the staining solution (0.5% BSA, 0.2% TritonX-100 in PBS) and 1 hour incubation with the blocking solu-tion (2% BSA, 5% goat serum, 5% human serum, 0.2% TritonX-100 in PBS) were performed before incubation with the pri-mary antibody (Anti-integrin beta 1 [12G10] (ab30394),Abcam, diluted 1 : 100) for 20 hours. After incubation withthe primary antibody, the MCTS were washed 3× for 20 mi-nutes with the wash buffer and incubated with the secondaryantibody (Alexa 546 Goat anti-Mouse, Invitrogen) diluted 1 :200 in the staining buffer for 4 hours. The final three washeswith the washing buffer were done before counterstainingwith DAPI (5 mg mL−1, Invitrogen) diluted 1 : 1000 in thestaining buffer for 4 hours at room temperature.
To make the MCTS optically clear for deep tissue imaging,a refractive index matching solution (RIMS) containing 755mg mL−1 Iohexol (Omnipaque 350 mg iodine per mL, GEHealthcare) was applied as the mounting medium. The RIMSreduces light scattering in the MCTS by matching the refrac-tive index of the sample to the oil-immersion objective (n =1.46). The Iohexol RIMS was diluted in PBS to 10%, 25%,50% and 75% (vol/vol) and exchanged in steps before im-mersing the MCTS in 100% RIMS to avoid excessive fluid ex-change in the MCTS which would cause spatial deforma-tion.34 The sequential addition of RIMS with different vol/volpercentages also prevented the MCTS to escape the micro-wells up to the shared medium reservoir due to the densitydifference between the MCTS and RIMS.
Microscopy
Bright field images of the spheroids and movies of the fluo-rescent bead trapping were acquired with an inverted fluores-cence and bright field microscope (Axiovert 40 CFL, Zeiss
Lab on a Chip Paper
Ope
n A
cces
s A
rtic
le. P
ublis
hed
on 1
6 Ju
ly 2
018.
Dow
nloa
ded
on 8
/12/
2022
5:5
4:49
AM
. T
his
artic
le is
lice
nsed
und
er a
Cre
ativ
e C
omm
ons
Attr
ibut
ion-
Non
Com
mer
cial
3.0
Unp
orte
d L
icen
ce.
View Article Online
2470 | Lab Chip, 2018, 18, 2466–2476 This journal is © The Royal Society of Chemistry 2018
Germany) equipped with a DSLR camera (Sony α77, Sony, Ja-pan) and a low magnification objective (EC Plan-Neofluar2.5×/0.075, Zeiss, Germany). Optically sectioned images wereacquired with a confocal light-scanning microscope (LSM880, Zeiss, Germany) with an oil-immersion objective (Plan-Apochromat 63×/1.40 Oil DIC M27, Zeiss, Germany).
ResultsProtein repellent copolymer coating
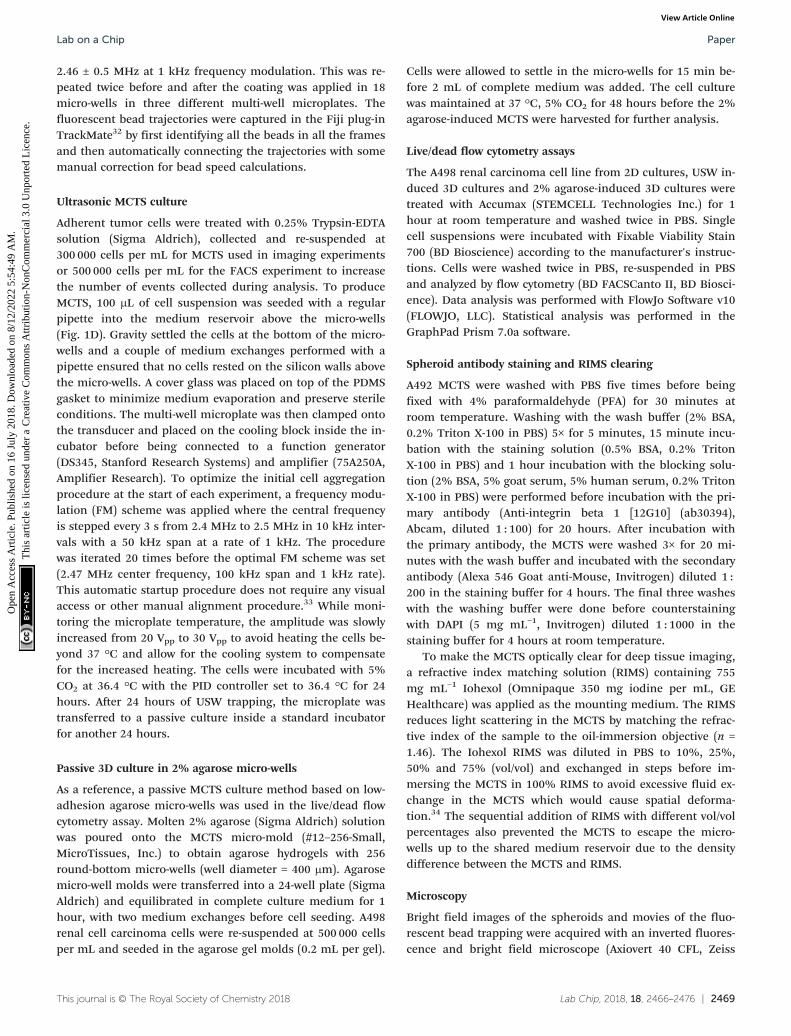
The protein repellent polymer coating (schematically shownin Fig. 1A) applied on the SiO2 surface of the silicon was suc-cessfully characterized by X-ray photoelectron spectroscopy(XPS) and ellipsometry. The polymer coating thickness, mea-sured by ellipsometry on five different samples, was 21.7 ±5.1 nm (mean ± sd). XPS showed a clear difference in multi-well microplate surface chemistry composition before and af-ter polymer coating was applied (Fig. 2). Significant C(1s),N(1s) and P(2p) peaks of the elements in the polymer coatingwere visible at expected energies only for the coated samples.To investigate the possibility to reuse the coated microplateseveral times before recoating, XPS measurements were alsoperformed before and after cleaning of a polymer coatedmicroplate. For comparison, a coated microplate was cleanedfor 10 min in an ultrasonic bath submerged in 70% ethanol,followed by 1 hour of ethanol incubation, and no differencein XPS data could be seen (ESI,† Fig. S1). No autofluorescencefrom the copolymer coating was detected during confocal im-aging and the coating was stable enough to allow for multipleMCTS cultures before new coating was needed.
Ultrasonic trapping performance with coating
Since polymers are non-optimal in resonant acoustic systems,we investigated whether the protein repellent copolymer coat-ing layer influenced the ultrasonic radiation force trapping per-
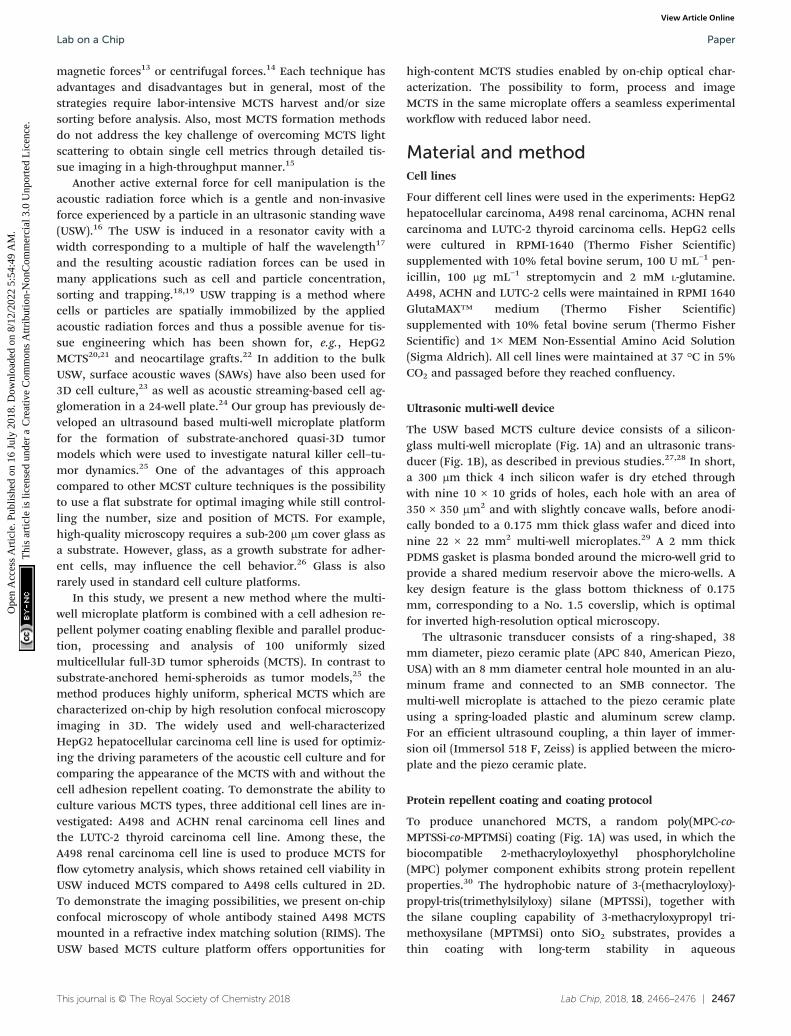
formance indirectly by measuring the maximum speed of poly-styrene beads after seeding the beads according to theprocedure shown in Fig. 1d. In total, 6354 beads were detected(Fig. 3A I) and their trajectories (Fig. 3A II) were analyzed (3127trajectories in the un-coated microplate and 3227 trajectoriesin the coated microplate) and the maximum bead speed distri-butions for the two cases overlapped closely (Fig. 2B) with amedian maximum bead speed of 214 μm s−1 in the coatedmicroplate compared to 220 μm s−1 in the un-coated micro-plate. The two maximum speed distributions show no statisti-cally significant difference determined by pairwise Mann–Whit-ney U test. Thus, coating did not affect trapping efficiency.
MCTS formation and characterization
To investigate the flexibility of the MCTS platform in termsof cell line choice, we cultured MCTS from four different ad-herent cell line suspensions (Fig. 4). The hepatocellular carci-noma cell line HepG2 readily formed both anchored and un-
Fig. 2 Polymer coating successfully covers the multi-well microplate.Plots show elemental surface composition on the multi-well micro-plate, measured by X-ray photoelectron spectroscopy (XPS), before(grey line) and after (orange line) applying the protein repellent poly-mer coating. Charge corrections were applied for better comparison.
Fig. 3 Polymer coating does not influence trapping efficiency. Thebead trajectories were calculated semi-automatically from the ImageJplug-in TrackMate which finds all the beads before the ultrasound isturned on (A I) and connects trajectories for each individual bead untilthey are trapped in the micro-well center (A II). Each line in the imagescorresponds to a bead trajectory and the color indicates maximumbead velocity. Histogram of the maximum speed distribution of 10 μmpolystyrene beads (B) during the initial ultrasound trapping in a coated(blue line, N = 3227) and un-coated (red line, N = 3127) multi-wellmicroplates. The median maximum bead speed is 214 μm s−1 in thecoated microplate (dashed blue line) and 220 μm s−1 in the uncoatedmicroplate (dashed red line).
Lab on a ChipPaper
Ope
n A
cces
s A
rtic
le. P
ublis
hed
on 1
6 Ju
ly 2
018.
Dow
nloa
ded
on 8
/12/
2022
5:5
4:49
AM
. T
his
artic
le is
lice
nsed
und
er a
Cre
ativ
e C
omm
ons
Attr
ibut
ion-
Non
Com
mer
cial
3.0
Unp
orte
d L
icen
ce.
View Article Online

Lab Chip, 2018, 18, 2466–2476 | 2471This journal is © The Royal Society of Chemistry 2018
anchored MCTS after 48 hours (24 h with ultrasoundfollowed by 24 h without ultrasound) in an uncoated and acoated microplate, respectively, while renal carcinoma celllines A498 and ACHN did not form a stable anchored MCTSin the uncoated microplate. When using the A498 cell line inthe uncoated microplate, the ultrasonic radiation forces,using the same actuation scheme as in the coated microplate,were too weak to prevent cell migration. The thyroid carci-noma LUTC-2 cell line and the ACHN cell line showed initialanchored MCTS formation after 24 hours of USW trappingbut after subsequent passive culture (no USW) for 24 hoursthe cells migrated out over the glass bottom and over timeformed a 2D layer (Fig. 4). The quality of the 3D culture di-
rectly after 24 h of ultrasonication (cf. first panel in Fig. 4)can be improved by increasing the actuation voltage over theultrasound transducer (data not shown), but this did not pre-vent the cell spreading at the bottom after the ultrasoundwas turned off (cf. second panel in Fig. 4). The results clearlymotivate the use of the combined USW + coating culturemethod for all tested cell types except for HepG2 (Table 1).
Since HepG2 was the only cell line among the four testedcell lines that was able to efficiently grow in 3D without theuse of the protein repellent coating (cf. Fig. 4), it is of interestto further investigate the importance of the ultrasound 3Dculture method when using a coating for this cell line. Forthese reasons, HepG2 cells were cultured in the multi-well
Fig. 4 Protein repellent coating enables MCTS formation independent of the cell line. Representative bright field images of HepG2, A498, ACHNand LUTC-2 cell lines cultured with and without coating in the multi-well microplate for 24 hours with USW exposure followed by 24 hours ofpassive culture. Each micro-well is 350 μm wide.
Table 1 Summary of cell lines' ability to form MCTS in the multiwall microplate under different conditions
Cell lines
HepG2 A498 ACHN LUTC-2
No coating; 48 h USW off 2D — — —No coating; 24 h USW on +++ + ++ +++No coating; 24 h USW on + 24 h USW off +++ 2D + +With coating; 48 h USW off 3D* — — —With coating; 24 h USW on + 24 h USW off +++ +++ +++ +++
+++ Exclusively one 3D spheroid per well. ++ One major 3D spheroid per well with a minor substrate-interacting 2D monolayer at the bottom.+ One minor 3D spheroid per well with a major substrate-interacting 2D monolayer at the bottom. 2D Exclusively a monolayer 2D culture inthe well. 3D* A multitude of differently sized 3D spheroids per well. — Not tested.
Lab on a Chip Paper
Ope
n A
cces
s A
rtic
le. P
ublis
hed
on 1
6 Ju
ly 2
018.
Dow
nloa
ded
on 8
/12/
2022
5:5
4:49
AM
. T
his
artic
le is
lice
nsed
und
er a
Cre
ativ
e C
omm
ons
Attr
ibut
ion-
Non
Com
mer
cial
3.0
Unp
orte
d L
icen
ce.
View Article Online
2472 | Lab Chip, 2018, 18, 2466–2476 This journal is © The Royal Society of Chemistry 2018
microplate with and without the protein repellent coatingand with and without USW trapping (Fig. 5).
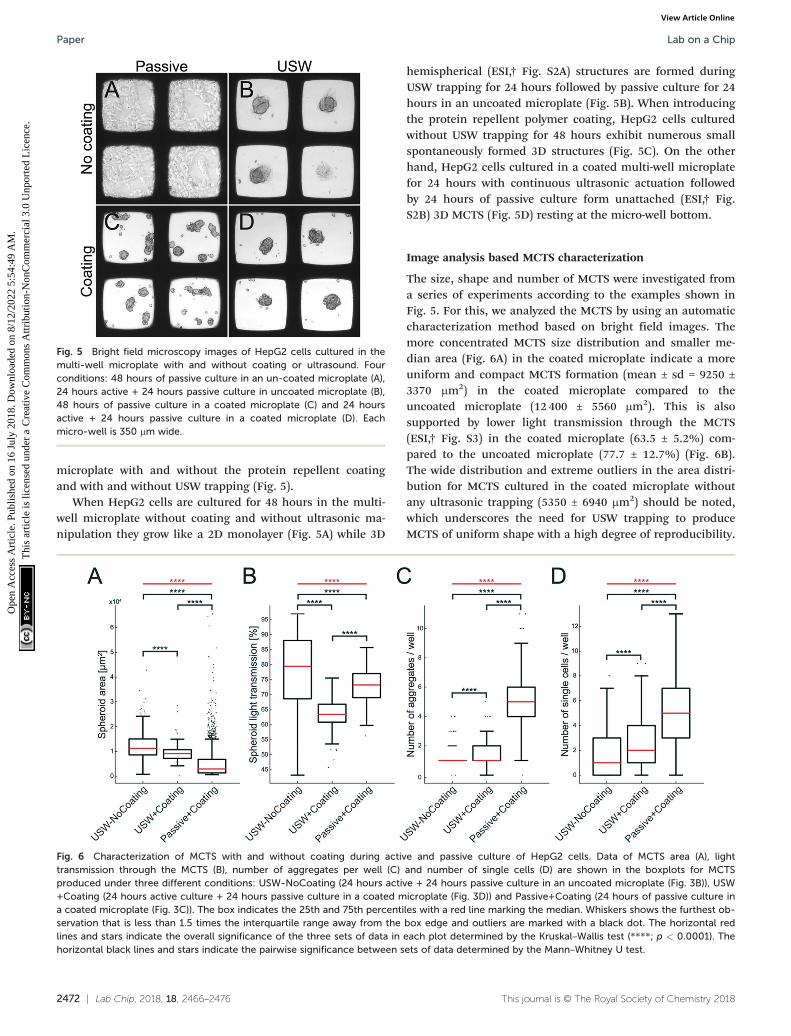
When HepG2 cells are cultured for 48 hours in the multi-well microplate without coating and without ultrasonic ma-nipulation they grow like a 2D monolayer (Fig. 5A) while 3D
hemispherical (ESI,† Fig. S2A) structures are formed duringUSW trapping for 24 hours followed by passive culture for 24hours in an uncoated microplate (Fig. 5B). When introducingthe protein repellent polymer coating, HepG2 cells culturedwithout USW trapping for 48 hours exhibit numerous smallspontaneously formed 3D structures (Fig. 5C). On the otherhand, HepG2 cells cultured in a coated multi-well microplatefor 24 hours with continuous ultrasonic actuation followedby 24 hours of passive culture form unattached (ESI,† Fig.S2B) 3D MCTS (Fig. 5D) resting at the micro-well bottom.
Image analysis based MCTS characterization
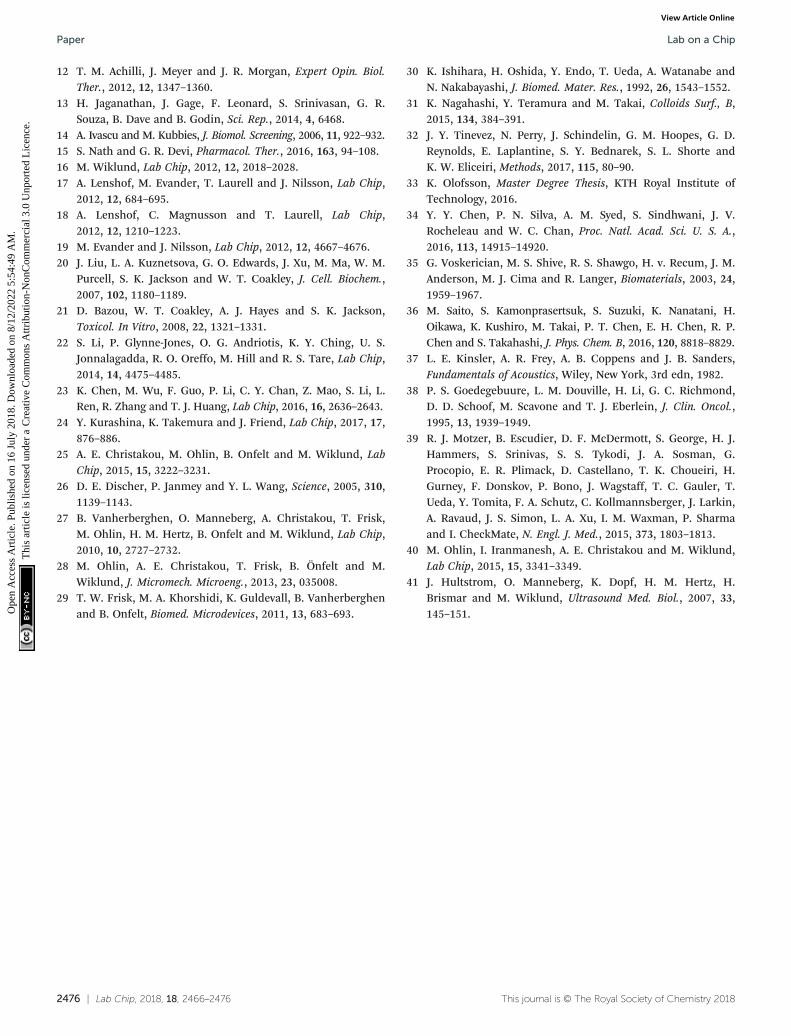
The size, shape and number of MCTS were investigated froma series of experiments according to the examples shown inFig. 5. For this, we analyzed the MCTS by using an automaticcharacterization method based on bright field images. Themore concentrated MCTS size distribution and smaller me-dian area (Fig. 6A) in the coated microplate indicate a moreuniform and compact MCTS formation (mean ± sd = 9250 ±3370 μm2) in the coated microplate compared to theuncoated microplate (12 400 ± 5560 μm2). This is alsosupported by lower light transmission through the MCTS(ESI,† Fig. S3) in the coated microplate (63.5 ± 5.2%) com-pared to the uncoated microplate (77.7 ± 12.7%) (Fig. 6B).The wide distribution and extreme outliers in the area distri-bution for MCTS cultured in the coated microplate withoutany ultrasonic trapping (5350 ± 6940 μm2) should be noted,which underscores the need for USW trapping to produceMCTS of uniform shape with a high degree of reproducibility.
Fig. 5 Bright field microscopy images of HepG2 cells cultured in themulti-well microplate with and without coating or ultrasound. Fourconditions: 48 hours of passive culture in an un-coated microplate (A),24 hours active + 24 hours passive culture in uncoated microplate (B),48 hours of passive culture in a coated microplate (C) and 24 hoursactive + 24 hours passive culture in a coated microplate (D). Eachmicro-well is 350 μm wide.
Fig. 6 Characterization of MCTS with and without coating during active and passive culture of HepG2 cells. Data of MCTS area (A), lighttransmission through the MCTS (B), number of aggregates per well (C) and number of single cells (D) are shown in the boxplots for MCTSproduced under three different conditions: USW-NoCoating (24 hours active + 24 hours passive culture in an uncoated microplate (Fig. 3B)), USW+Coating (24 hours active culture + 24 hours passive culture in a coated microplate (Fig. 3D)) and Passive+Coating (24 hours of passive culture ina coated microplate (Fig. 3C)). The box indicates the 25th and 75th percentiles with a red line marking the median. Whiskers shows the furthest ob-servation that is less than 1.5 times the interquartile range away from the box edge and outliers are marked with a black dot. The horizontal redlines and stars indicate the overall significance of the three sets of data in each plot determined by the Kruskal–Wallis test (****; p < 0.0001). Thehorizontal black lines and stars indicate the pairwise significance between sets of data determined by the Mann–Whitney U test.
Lab on a ChipPaper
Ope
n A
cces
s A
rtic
le. P
ublis
hed
on 1
6 Ju
ly 2
018.
Dow
nloa
ded
on 8
/12/
2022
5:5
4:49
AM
. T
his
artic
le is
lice
nsed
und
er a
Cre
ativ
e C
omm
ons
Attr
ibut
ion-
Non
Com
mer
cial
3.0
Unp
orte
d L
icen
ce.
View Article Online

Lab Chip, 2018, 18, 2466–2476 | 2473This journal is © The Royal Society of Chemistry 2018
Minor differences can be seen in terms of the number of ag-gregates and single cells per well between active culturesusing coated and uncoated microplates (Fig. 6C and D), whilethe passive culture in the coated microplate exhibited multi-ple aggregates (5.1 ± 2.0 cell aggregates per well) and singlecells (5.3 ± 5.6 single cells per well) distributed in the micro-wells. This suggests that HepG2 cells can spontaneously formMCTS without any USW trapping on a non-adherent surface,but in an uncontrolled manner resulting in inconsistent sizesand numbers of MCTS.
Flow cytometry analysis of A498 MCTS
To investigate cell viability in the MCTS formed by USWs andcompare it to MCTS formed in the agarose wells and cells cul-tured in 2D, MCTS were disintegrated into singe cell suspen-sions and analyzed by flow cytometry. The fraction of live cellswas determined in A498 MCTS cultured for 48 hours in the ac-tive USW MCTS culture platform (Fig. 7A), in passive 2% aga-rose round bottom micro-wells (Fig. 7B) or in grown in 2D(Fig. 7C). From 6 independent experiments, we could not findany statistically significant difference in the fractions of living(Fig. 7D) and dead cells (Fig. 7E) between the three cases,which indicates that the active culture conditions do not in-
duce cell death when cells are exposed to USWs for 24 hoursand cells in the center of the MCTS do not die due to a lack ofnutrients as has been described for larger spheroids.15
On-chip confocal whole MCTS imaging
To highlight the potential for on-chip high-content imaging ofwhole MCTS, we stained A498 MCTS with antibodies againstintegrin beta-1 and the nuclei with DAPI before mounting theMCTS in an Iohexol RIMS solution. This enabled whole MCTSconfocal imaging by removing light scattering interfaces so thatoptical sections could be captured throughout the whole MCTSvolume (ESI,† Fig. S4). Confocal z-stacks acquired from A498MCTS cultured for 24 hours, 48 hours and 96 hours show thatthe staining protocol worked and an even staining of beta-1integrin could be detected throughout the volume (Fig. 8).Qualitatively, one can see that the cell density and the spatialorganization of integrin expression change in MCTS culturesfixed after 24 hours compared to 48 hours and 96 hours. Wealso used the DAPI-based imaging method for A498 MCTS andcounted manually the number of nuclei in seven differentspheroids, resulting in 208 ± 36 cells per MCTS. Since we usedthe same seeding procedure for all cell cultures, a similar num-ber is expected in the experiments with the other cell lines.
Fig. 7 Renal carcinoma cells display a similar viability in 2D and 3D cultures. Flow cytometry dot plot graphs of A498 cells cultured in 2D culture(A), USW 3D MCTS culture (B) and 2% agarose-induced 3D culture (C). Here, the viability dye intensity (log scale) on the x-axis and the cell dimen-sion (FSC-H: forward scatter; linear scale) on the y-axis are plotted. Live cells (LIVE gate) are defined as viability dye negative; dead cells (DEADgate) are defined as viability dye positive cells; percentages are indicated above each gate. Graphs showing the percentage of live (D) and dead (E)cells obtained from six independent experiments. Statistical significance has been evaluated with one-way ANOVA with Tukey's multiple compari-son test (n.s. = not significant).
Lab on a Chip Paper
Ope
n A
cces
s A
rtic
le. P
ublis
hed
on 1
6 Ju
ly 2
018.
Dow
nloa
ded
on 8
/12/
2022
5:5
4:49
AM
. T
his
artic
le is
lice
nsed
und
er a
Cre
ativ
e C
omm
ons
Attr
ibut
ion-
Non
Com
mer
cial
3.0
Unp
orte
d L
icen
ce.
View Article Online

2474 | Lab Chip, 2018, 18, 2466–2476 This journal is © The Royal Society of Chemistry 2018
Discussion and conclusion
We have demonstrated an ultrasonic standing wave (USW)based multicellular tumor spheroid (MCTS) platform whereunanchored MCTS can be formed by USWs and a protein re-pellent polymer coating in a multi-well microplate. In con-trast to previous ultrasound-based techniques, this method iscompatible with any tested adherent cell type. This allows forboth on- and off-chip characterization methods of variouscancer relevant MCTS with emphasis on on-chip opticalcharacterization.
The protein repellent copolymer coating, originally devel-oped for long-term suppression of non-specific protein ad-sorption on PDMS surfaces,31 was applied to the silicon/glassmulti-well microplate. Complete inhibition of cell adhesionand XPS and ellipsometry measurements showed that thecoating was evenly distributed across the surface of themicrowell (Fig. 2). The coating also further protects cells byminimizing bare silicon exposure which can affect cell viabil-ity during long term experiments.35 The strong bonding ofthe copolymers to the micro-well surface resulted in a dura-ble coating which allowed for multiple experiment repetitionsbefore recoating was needed. This study in combination witha separate FRET study, where the copolymer coating was usedin a glass chip,36 suggests that this copolymer coating couldbe beneficial where a thin and durable anti-fouling coating isneeded for long-term experiments.
Since polymers are in general avoided in bulk acousticwave resonant systems due to the sub-optimal acoustic prop-erties, it was of interest to investigate whether the USW trap-ping performance would decrease when introducing the co-polymer coating.17 When trying to assess the USW trappingreduction through particle tracking, it was found that the co-polymer coating did not interfere with the ultrasonic radia-tion forces. This could be explained by the thin coating thick-ness (21.7 ± 5.1 nm) compared to the ultrasound wavelength(∼1 mm). The acoustic intensity transmission coefficientequation through two boundaries37 is reduced to the equa-tion describing the intensity transmission coefficient withonly one boundary when the middle layer is very thin com-pared to the wavelength and thus the coating can be consid-ered acoustically transparent. Therefore, the micro-well wallscould be described as purely silicon, which was confirmed byour bead velocity measurements.
Not only is the protein repellent polymer coating impor-tant for reducing substrate–cell interactions, it also im-proves the 3D model quality and enables un-anchoredMCTS formation. To confirm this, an in-house automaticMCTS characterization script was used to investigate differ-ences between anchored and unanchored HepG2 MCTS(Fig. 6). We note that the unanchored MCTS exhibited amore compact and consistent result after 24 hours active +24 hours passive culture. However, we have previouslyshown that longer USW incubation times (over 48 hours)
Fig. 8 Confocal on-chip imaging of RIMS mounted MCTS with immunostaining against integrin β-1 and DAPI. Fixation, staining and RIMS mount-ing of MCTS at 24 hours, 48 hours and 96 hours were performed before confocal z-stack imaging. Each column in the figure shows a representa-tive image of a MCTS from each time point where the top row depicts the YZ side view of a 3D reconstruction and the dashed line indicates the lo-cation of the optical section shown in the bottom row. The bottom row shows an optical section 50 μm deep into the MCTS for each time point(scale bar 20 μm).
Lab on a ChipPaper
Ope
n A
cces
s A
rtic
le. P
ublis
hed
on 1
6 Ju
ly 2
018.
Dow
nloa
ded
on 8
/12/
2022
5:5
4:49
AM
. T
his
artic
le is
lice
nsed
und
er a
Cre
ativ
e C
omm
ons
Attr
ibut
ion-
Non
Com
mer
cial
3.0
Unp
orte
d L
icen
ce.
View Article Online

Lab Chip, 2018, 18, 2466–2476 | 2475This journal is © The Royal Society of Chemistry 2018
also yield a high percentage of anchored HepG2 MCTS witha hemispherical shape.25 Since the automatic MCTS charac-terization script is based on bright field transmissionmicroscopy images, dynamic events at a spheroid level, suchas growth or MCTS defragmentation, can be captured withhigh temporal resolution on living MCTS without any fluo-rescent staining or other treatment which opens up forhigh-throughput drug screening applications. Also, the pos-sibility to grow cells in a 2D monolayer by introducing nei-ther coating nor USW into the multi-well microplate allowsfor control cultures.
The HepG2 cell line is commonly used to demonstrate MCTSformation in various techniques due to its fast aggregation timeand possible applications in drug screening investigating hepa-totoxicity and drug metabolism.10,11,20 However, in order to dem-onstrate the coating importance for MCTS formation we alsoused the renal carcinoma cell line A498 derived from trans-formed kidney tissue, the renal carcinoma cell line ACHN de-rived from a metastatic site (pleural effusion) and the low-passage cell line LUTC-2 that has been established from resectedthyroid carcinomas (Fig. 4). These three cell lines differ in termsof origin, metastatic site and number of passages, and are there-fore a suitable choice for testing the applicability and robustnessof our 3D culture method. Among all tested cell lines, we madea more detailed characterization of A498 (Fig. 7 and 8) not onlydue to its relevance as a model for solid renal cell carcinoma,with applications in e.g. immunotherapy research,38,39 but alsoto demonstrate that we are able to form spheroids with a highlymotile and substrate-interacting cell line that does not formspheroids when using the ultrasound method only (cf. Fig. 4).
To complement automatic characterization at the spher-oid level, protocols for single cell analysis by flow cytometrywere developed. To demonstrate the protocol, live/dead flowassays of A498 renal cell carcinoma cultured in parallel in2D, ultrasonic 3D and passive 2% agarose 3D were performedand no statistically significant difference was observed. Usu-ally, large MCTS with diameters over 450–500 μm show ne-crotic cores; so the retained viability in the MCTS indicatesthe absence of a necrotic core, which can be explained by thecomparably small MCTS diameter around 100 μm.15 This fur-ther supports earlier studies reporting retained viability ofcells trapped through USWs.40,41
While flow cytometry can provide detailed analysis at thesingle cell level, the spatial and structural information is lost.The main obstacle for acquiring structural information fromthe whole MCTS is the internal light scattering which preventsdeep tissue imaging. Therefore, an Iohexol based refractive in-dex matching solution (RIMS) protocol was developed where all100 MCTS were treated simultaneously while being retained inthe micro-wells. The RIMS protocol is diffusion-based andtherefore slower than syringe-pump-based devices designed forrapid MCTS interstitial fluid exchange.34 But since a standardpipette was the only tool needed for fluid manipulation in theplatform, a lower technical threshold and a great reduction inrequired labor were achieved. This relatively fast RIMS tech-nique was shown to be compatible with immunofluorescent
staining (Fig. 8) and thus paves the way for whole MCTS imag-ing without the need for MCTS harvest and slicing to get struc-tural and functional information.
While only monoculture MCTS were used in this study,multiple cell lines could easily be introduced for more com-plex co-culture tumor models. One major advantage withusing USWs to produce MCTS is the modularity in which or-dered and haphazard tissue structures can be created. We be-lieve that layered MCTS of multiple cell lines can be culturedby sequential cell seeding of the different cell lines. Thiscould open up new possibilities for tumor models of highercomplexity or modelling healthy tissue for various uses suchas organ-on-a-chip applications where a higher degree of or-dered structures is needed.
Altogether, we have presented a MCTS culture platformthat can be tailored to meet many of the requirements of can-cer researchers: high MCTS formation yield, automatic analy-sis, low technical threshold and the possibility to performthe whole experiment in a single plate.
Conflicts of interest
There are no conflicts to declare.
Acknowledgements
We thank the Swedish Research Council, the Swedish Foun-dation for Strategic Research, The Swedish Cancer Society,The Swedish Childhood Cancer Foundation and the Stock-holm County Council for financial support.
References
1 P. Lu, V. M. Weaver and Z. Werb, J. Cell Biol., 2012, 196,395–406.
2 C. J. Lovitt, T. B. Shelper and V. M. Avery, Biology, 2014, 3,345–367.
3 H. Yu, J. K. Mouw and V. M. Weaver, Trends Cell Biol.,2011, 21, 47–56.
4 E. Fennema, N. Rivron, J. Rouwkema, C. van Blitterswijk andJ. de Boer, Trends Biotechnol., 2013, 31, 108–115.
5 C. R. Thoma, M. Zimmermann, I. Agarkova, J. M. Kelm andW. Krek, Adv. Drug Delivery Rev., 2014, 69–70, 29–41.
6 L. Yu, M. C. Chen and K. C. Cheung, Lab Chip, 2010, 10,2424–2432.
7 M. Jang, I. Koh, S. J. Lee, J. H. Cheong and P. Kim, Sci. Rep.,2017, 7, 41541.
8 D. Antoni, H. Burckel, E. Josset and G. Noel, Int. J. Mol. Sci.,2015, 16, 5517–5527.
9 S. Raghavan, M. R. Ward, K. R. Rowley, R. M. Wold, S.Takayama, R. J. Buckanovich and G. Mehta, Gynecol. Oncol.,2015, 138, 181–189.
10 T. Tamura, Y. Sakai and K. Nakazawa, J. Mater. Sci.: Mater.Med., 2008, 19, 2071–2077.
11 B. Patra, Y. H. Chen, C. C. Peng, S. C. Lin, C. H. Lee andY. C. Tung, Biomicrofluidics, 2013, 7, 54114.
Lab on a Chip Paper
Ope
n A
cces
s A
rtic
le. P
ublis
hed
on 1
6 Ju
ly 2
018.
Dow
nloa
ded
on 8
/12/
2022
5:5
4:49
AM
. T
his
artic
le is
lice
nsed
und
er a
Cre
ativ
e C
omm
ons
Attr
ibut
ion-
Non
Com
mer
cial
3.0
Unp
orte
d L
icen
ce.
View Article Online
2476 | Lab Chip, 2018, 18, 2466–2476 This journal is © The Royal Society of Chemistry 2018
12 T. M. Achilli, J. Meyer and J. R. Morgan, Expert Opin. Biol.Ther., 2012, 12, 1347–1360.
13 H. Jaganathan, J. Gage, F. Leonard, S. Srinivasan, G. R.Souza, B. Dave and B. Godin, Sci. Rep., 2014, 4, 6468.
14 A. Ivascu and M. Kubbies, J. Biomol. Screening, 2006, 11, 922–932.15 S. Nath and G. R. Devi, Pharmacol. Ther., 2016, 163, 94–108.16 M. Wiklund, Lab Chip, 2012, 12, 2018–2028.17 A. Lenshof, M. Evander, T. Laurell and J. Nilsson, Lab Chip,
2012, 12, 684–695.18 A. Lenshof, C. Magnusson and T. Laurell, Lab Chip,
2012, 12, 1210–1223.19 M. Evander and J. Nilsson, Lab Chip, 2012, 12, 4667–4676.20 J. Liu, L. A. Kuznetsova, G. O. Edwards, J. Xu, M. Ma, W. M.
Purcell, S. K. Jackson and W. T. Coakley, J. Cell. Biochem.,2007, 102, 1180–1189.
21 D. Bazou, W. T. Coakley, A. J. Hayes and S. K. Jackson,Toxicol. In Vitro, 2008, 22, 1321–1331.
22 S. Li, P. Glynne-Jones, O. G. Andriotis, K. Y. Ching, U. S.Jonnalagadda, R. O. Oreffo, M. Hill and R. S. Tare, Lab Chip,2014, 14, 4475–4485.
23 K. Chen, M. Wu, F. Guo, P. Li, C. Y. Chan, Z. Mao, S. Li, L.Ren, R. Zhang and T. J. Huang, Lab Chip, 2016, 16, 2636–2643.
24 Y. Kurashina, K. Takemura and J. Friend, Lab Chip, 2017, 17,876–886.
25 A. E. Christakou, M. Ohlin, B. Onfelt and M. Wiklund, LabChip, 2015, 15, 3222–3231.
26 D. E. Discher, P. Janmey and Y. L. Wang, Science, 2005, 310,1139–1143.
27 B. Vanherberghen, O. Manneberg, A. Christakou, T. Frisk,M. Ohlin, H. M. Hertz, B. Onfelt and M. Wiklund, Lab Chip,2010, 10, 2727–2732.
28 M. Ohlin, A. E. Christakou, T. Frisk, B. Önfelt and M.Wiklund, J. Micromech. Microeng., 2013, 23, 035008.
29 T. W. Frisk, M. A. Khorshidi, K. Guldevall, B. Vanherberghenand B. Onfelt, Biomed. Microdevices, 2011, 13, 683–693.
30 K. Ishihara, H. Oshida, Y. Endo, T. Ueda, A. Watanabe andN. Nakabayashi, J. Biomed. Mater. Res., 1992, 26, 1543–1552.
31 K. Nagahashi, Y. Teramura and M. Takai, Colloids Surf., B,2015, 134, 384–391.
32 J. Y. Tinevez, N. Perry, J. Schindelin, G. M. Hoopes, G. D.Reynolds, E. Laplantine, S. Y. Bednarek, S. L. Shorte andK. W. Eliceiri, Methods, 2017, 115, 80–90.
33 K. Olofsson, Master Degree Thesis, KTH Royal Institute ofTechnology, 2016.
34 Y. Y. Chen, P. N. Silva, A. M. Syed, S. Sindhwani, J. V.Rocheleau and W. C. Chan, Proc. Natl. Acad. Sci. U. S. A.,2016, 113, 14915–14920.
35 G. Voskerician, M. S. Shive, R. S. Shawgo, H. v. Recum, J. M.Anderson, M. J. Cima and R. Langer, Biomaterials, 2003, 24,1959–1967.
36 M. Saito, S. Kamonprasertsuk, S. Suzuki, K. Nanatani, H.Oikawa, K. Kushiro, M. Takai, P. T. Chen, E. H. Chen, R. P.Chen and S. Takahashi, J. Phys. Chem. B, 2016, 120, 8818–8829.
37 L. E. Kinsler, A. R. Frey, A. B. Coppens and J. B. Sanders,Fundamentals of Acoustics, Wiley, New York, 3rd edn, 1982.
38 P. S. Goedegebuure, L. M. Douville, H. Li, G. C. Richmond,D. D. Schoof, M. Scavone and T. J. Eberlein, J. Clin. Oncol.,1995, 13, 1939–1949.
39 R. J. Motzer, B. Escudier, D. F. McDermott, S. George, H. J.Hammers, S. Srinivas, S. S. Tykodi, J. A. Sosman, G.Procopio, E. R. Plimack, D. Castellano, T. K. Choueiri, H.Gurney, F. Donskov, P. Bono, J. Wagstaff, T. C. Gauler, T.Ueda, Y. Tomita, F. A. Schutz, C. Kollmannsberger, J. Larkin,A. Ravaud, J. S. Simon, L. A. Xu, I. M. Waxman, P. Sharmaand I. CheckMate, N. Engl. J. Med., 2015, 373, 1803–1813.
40 M. Ohlin, I. Iranmanesh, A. E. Christakou and M. Wiklund,Lab Chip, 2015, 15, 3341–3349.
41 J. Hultstrom, O. Manneberg, K. Dopf, H. M. Hertz, H.Brismar and M. Wiklund, Ultrasound Med. Biol., 2007, 33,145–151.
Lab on a ChipPaper
Ope
n A
cces
s A
rtic
le. P
ublis
hed
on 1
6 Ju
ly 2
018.
Dow
nloa
ded
on 8
/12/
2022
5:5
4:49
AM
. T
his
artic
le is
lice
nsed
und
er a
Cre
ativ
e C
omm
ons
Attr
ibut
ion-
Non
Com
mer
cial
3.0
Unp
orte
d L
icen
ce.
View Article Online