Access to Finance and Exporting Behavior in Transition Countries
28
Advanced Studies in International Economic Policy Research Kiel Institute for the World Economy Düsternbrooker Weg 120 D-24105 Kiel/Germany Working Paper No. 456 Access to Finance and Exporting Behavior in Transition Countries by Alex Bernard, Augusto Stabilito and Julien Donghoon Yoo April 2010 Kiel Advanced Studies Working Papers are preliminary papers, and responsibility for contents and distribution rests with the authors. Critical comments and suggestions for improvement are welcome.
Transcript of Access to Finance and Exporting Behavior in Transition Countries
Advanced Studies in International Economic Policy Research
Kiel Institute for the World Economy
Düsternbrooker Weg 120
D-24105 Kiel/Germany
Working Paper No. 456
Access to Finance and Exporting Behavior
in Transition Countries
by
Alex Bernard, Augusto Stabilito and Julien Donghoon Yoo
April 2010
Kiel Advanced Studies Working Papers are preliminary papers, and responsibility for contents and distribution rests with the authors. Critical comments and suggestions for improvement are welcome.
Access to Finance and Exporting Behavior inTransition Countries
Alex Bernard, Augusto Stabilito and Julian Donghoon Yoo∗
This version: April 2010
Abstract
We analyze the link between firms’ access to finance and their decisions to enterand exit the export market. We employ the Business Environment and EnterprisePerformance Survey (BEEPS) conducted in 2005 and 2008-2009 to 28 countries inEastern Europe and Central Asia. We find that more productive, foreign ownedand older firms are more likely to start exporting, while larger and more produc-tive firms are less likely to exit the export market. With respect to ex-ante firmcharacteristics, our results confirm that larger and more productive, as well asforeign-owned, firms self-select into exporting. By contrast, there is no relation-ship between the decision of firms to enter or exit export markets and their accessto finance. This may suggest that internal finance plays a greater role in EasternEuropean and CIS countries than in developed countries.
Keywords: Exports, Firm heterogeneity, Access to financeJEL classification: F14, G32, L25, D92
∗The authors are participants of the Advanced Studies Program in International Economic Pol-icy Research at the Kiel Institute for the World Economy. Corresponding address: Dustern-brooker Weg 148, 24105 Kiel (Germany) Contacts: [email protected], [email protected],[email protected]. We are indebted to Holger Gorg for providing us with the original idea ofthis paper and for helpful comments and supervision. We are grateful to Harmen Lehment, MariaLuigia Segnana, Stefano Schiavo and Andrea Fracasso as well as to participants at the AdvancedStudies conference for insightful suggestions and critiques. Comments are welcome!
1
1 Introduction
Firms engagement in international trade and the determinants of trade participation hasbeen widely discussed over recent years (Greenaway et al., 2007; Bernard and Jensen,1999; Bernard and Wagner, 2001). One of the major determinants of firm heterogeneityin the trade literature are financial constraints at the firm level. A number of theoreticaland empirical studies have verified the impact of the financial constraints of a firmon its export behavior. On the theoretical side, Chaney (2005) introduces liquidityconstraints into the heterogeneous firm framework of Melitz (2003). On the empiricalside, Greenaway et al. (2007) and other authors like Bellone et al. (2009) and Muûls(2008) analyze the link between the firms’ financial health and their exporting behavior.
Our paper's contribution to the existing empirical literature is twofold. Firstly, weuse a subjective variable of financial constraint, which measures the ease of access tofinance for the firm. Secondly, our study is the first firm-level analysis of export andfinance for a large cross-country dataset from transition economies in Eastern Europeand Central Asia. Previous empirical research, for example, Greenaway et al. (2007) andBellone et al. (2009) used accounting variables as a proxy for financial health. Moreover,these studies focused on single countries; the UK in Greenaway et al. (2007), France inBellone et al. (2009), and Belgium in Muûls (2008). In contrast, we use a subjectiveresponse of firm managers in a large-scale business enterprise survey conducted in 28countries in Eastern Europe and Central Asia.
We find that more productive, foreign owned and older firms are more likely to startexporting. Concerning export exiters we find that larger and older firms are less likelyto exit. However, we find that there is no relationship between access to finance andthe decision of firms to enter or exit export markets. Hence, internal liquidity maybe more relevant in influencing the export decision in the surveyed countries. Withrespect to ex-ante firm characteristics, our results confirm that more productive andforeign-owned firms are more likely to become exporters, while firm size seems to beless relevant. In line with previous research we find evidence that fixed-entry costs playa large role in influencing the exporting behavior of the firm. In addition, there is someevidence that exporting firms improve their access to finance.
The rest of the paper is organized as follows. Section 2 presents the review of relevantliterature concerning the link between financial constraints and export behavior of firms.Section 3 focuses on empirical analysis, describing data and the empirical methodology,and presents the main results. Section 4 concludes.
2
2 Literature review
In recent years the international trade literature has growingly focused on firm het-erogeneity and on departures from the traditional perfect competition paradigm. Theparallel growing availability of micro-data sources has triggered new empirical researchand validation in this field. For instance, in recent years a few studies have introduceda new source of heterogeneity in Melitz’s (2003) heterogeneous-firm model: imperfectcapital markets and financial constraints. In order to take credit constraints into ac-count, Chaney (2005)1 relaxes the assumption of perfect financial markets and divergesfrom the idea that all valuable industrial projects are financed.2 Hence, firms may endup financially constrained for a number of reasons: banks might be unwilling to financerisky projects; hedging financial products might not be available; informational andnon-tariff barriers might be too costly to the firm; the international contracting envi-ronment is traditionally weak; collateral is low some sectors (Chaney, 2005; Manova,2008).
A growing number of studies have tackled the export and finance issue empirically,both at the firm- (Campa and Shaver, 2002; Bellone et al., 2009; Muûls, 2008) and atthe country- and sector-level (Manova, 2008).
Campa and Shaver (2002), for instance, find that exporters have more cash flowthan non-exporters and are hence more likely to access external finance. Greenawayet al. (2007) ask whether firms'financial health and exporting are linked and how. Theirfinancial measures are a liquidity ratio and a leverage ratio.3 By employing an unbal-anced panel of 9,292 UK manufacturing firms, including balance-sheet data (FAMEdatabase), over the period 1993-2003, they estimate a reduced form model that is ableto answer several empirical questions and find that: (i) more liquid and less leveragedfirms are more likely to export; (ii) continuous exporters are financially healthier (moreliquid and less leveraged) compared to starters, and financial health and export partici-pation are positively linked; (iii) good ex-ante financial health does not necessarily leadto exporting, which is at odds with the theoretical literature emphasizing the role offixed sunk-costs and other empirical studies (Bellone et al., 2009); (iv) there is strong
1Chaney’s model will be briefly described below, section 3.1.2This is true under the Modigliani-Miller theorem (Modigliani and Miller, 1958). Furthermore,
empirical evidence shows that firms finance their investments first and foremost by internal financeand to a minor extent by bank loans, bonds and stocks. There is also evidence that SMEs have loweraccess to bank financing.
3The liquidity ratio is defined as (current assets-current liabilities)/total assets; whereas the leverageratio is defined as short-term debt/current assets.
3

evidence that being a continuous exporter leads to better financial health.In line with Chaney’s model, Bellone et al. (2009) show that financial constraints
act as a barrier to exporting. Their paper differs from Greenaway et al. (2007) byintroducing a new measure of financial constraints and extending the analysis to exportintensity (i.e. the export intensive margin). The empirical analysis makes use of anunbalanced panel of 25,000 French firms over the period 1993-2005. In contrast toGreenaway et al. (2007), Bellone et al. (2009) find that exporters enjoy better ex-antefinancial health compared to non-exporters. The computed pre-entry premium of futureexporters is statistically significant both one year before entry and three years beforeentry. According to their model, access to external finance is a significant determinantof the probability to start exporting due to the presence of sunk entry costs. Moreover,they show that the availability of financial resources significantly shortens the timeleading to the entry of foreign markets. The authors also explore the learning-by-exporting effect. They do not find evidence of an improvement in firms’ financial scoreafter entering the export market.
Muûls (2008) using an unbalanced panel dataset of about 9,000 Belgian manufactur-ing firms in the period 1999-2005 argues that financial constraints positively affect thenumber of destinations but not the number of exported products. Thus, it seems thatthe intensive margin effect found by Bellone et al. (2009) is driven by the number ofmarkets served by the firm (more markets, larger volumes). However, in Muûls (2008)financial constraints do not affect export volumes. Her financial constraint measure isthe Coface score, which combines quantitative and qualitative measures on financialstatements, industry- and firm-specific variables and legal judgements, which togetherform a measure of the firm’s creditworthiness. The fixed effects regression confirms thathaving a higher score (i.e. "normal to strong confidence") makes it more likely to be anexporter. Muûls (2008) does not find a significant relationship between financial con-straints and starting to export. Her explanation for this result is that firms starting toexport may prefer internal financing or for Belgium –being a small open economy –thefixed entry costs for exporting are relatively small. In line with the previous literature,Muûls (2008) finds that the size of the firm and its productivity influence positivelythe decision to start exporting. This result might also explain why credit constraintsmatter in determining the number of destinations. If only large and more productivefirms get access to credit, then these firms might be the one able to cope with the largerup-front fixed costs implied by multi-country exporting.
Manova (2008) extends the previous analyses in several directions. Her theoretical
4

model explicitly addresses the relationship between credit constraints and export vol-umes. Furthermore, she accounts for industry specific and country factors. Followingthe pathbreaking studies of Levchenko (2007) on the relationship between institutionsand trade, Manova (2008) shows that the productivity cut-off is higher in financiallyvulnerable sectors4 and in countries with lower financial development. The predictionof the model is that credit constraints re-distribute exports towards sectors with moretangible assets and lower reliance on outside funds, and towards more productive firmswithin a sector.
The structural estimation of the model employs a panel dataset of 107 countriesand 27 industries (1985-1995). Her measure of financial contractibility (institutionalquality) is the amount of credit extended to the private sectors as a share of GDP. Sheadopts two measures of sectorial financial vulnerability (credit constraints): "externalfinance dependence"5 and "asset tangibility".6
The effect of credit constraints on bilateral exports is significant both in statisticaland in economic terms, which means that the quality of the financial system increasesbilateral trade flows.7 Manova (2008) argues in favor of a causal effect running fromcredit constraints to exporting. In particular, this holds with respect to the relation-ship between private credit and asset tangibility.8 Finally she argues that financiallydeveloped countries export larger volumes on average, in particular in financially morevulnerable sectors (Manova, 2008; Beck, 2003). To reconcile this with the theoreticalmodel, Manova (2008) assumes that firms face credit constraints in financing both fixedand variable costs.
In conclusion, a growing number of empirical studies have analyzed the complexrelationship between exporting and finance. Overall, firm characteristics and traditionalcomparative advantage forces like the quality of the financial system matter, influencingboth the decision to export and (to a minor extent) the volume of exports and thenumber of served markets.
4Defined as those sectors requiring a larger amount of external finance or collateral (Manova, 2008).5Computed as the share of investment not financed by internal cash flow.6Computed as the share of plant, property and equipment over total assets. The statistical unit is
the median US firm for each sector.7For instance, improving the financial system from the 1st to the 3rd quartile of country distribu-
tion, increases bilateral trade flows by roughly 19% in financially vulnerable sectors and 17% in lowtangibility sectors.
8There may be some concern of reverse causality between external finance dependence and exportingwhen relative foreign demand for sectors intensive in external funds increases demand for loans in thissectors. This is not the case for asset tangibility which to some extent is independent from foreigndemand fluctuations.
5

3 Empirical Analysis
3.1 Economic Background
Exporting is a risky activity that implies large fixed entry costs, i. e. "up-front costs".Hence, firms might not be able to finance their international projects only by internalmeans (i.e. by the cash-flow generated from turnover of the domestic market) andmight resort to external funding. In everyday business, access to financial instruments,either in the capital market or in the banking market, might influence the decision toexport. The basic elements of the first theoretical contribution in the field, the Chaneymodel, are presented here (Chaney, 2005). In this model, liquidity constraints areexogenous and do not depend on current productivity. It is assumed that firms inherita given amount of liquidity and are subject to a random liquidity shock A whose valueis expressed in domestic wages: wA (numeraire). Entering the export market is equalto participating in a lottery.
The liquidity constraint (Equation 1) is expressed as:
πd(x) + wA ≥ w∗Cf (1)
where πd(x) are domestic profits, wA is the exogenous liquidity shock and w∗Cf isthe fixed entry cost denominated in foreign wages.
One can define the lowest productivity level below which firms with liquidity A donot export. A is the amount of liquidity the least productive firm would need to enterforeign markets. The usual Melitz-model prediction that more productive firms aremore likely to export, holds.
Table 1: Productivity and exporting
Exit Only dom. prod. Domestic + export
x < xd x < xf x > xf
πd(xd) = 0 πf (xf ) = 0
The model produces two thresholds (Table 1):
1. firms with productivity above Xd produce domestically (or conversely, when pro-ductivity is below Xd firms exit the market);
2. firms with productivity above Xf are able to export.
6
Introducing liquidity constraints yields the following predictions:
• if A (the liquidity shock) is low, only high productivity firms are able to financethemselves;
• if A is high, also low productivity firms are able to enter the export market;
• the higher the entry fixed cost Cf , the higher the liquidity requirement in orderto start exporting.
Chaney (2005) proves the existence of a non-empty set of liquidity constrained firmsthat could profitably export but do not because they are liquidity constrained. In otherwords, these firms would be productive enough to export profitably in the presenceof perfect financial markets. Muûls (2008) and Manova (2008) extend the model byexplicitly introducing endogenous credit constraints. The liquidity constraint (equation2) is modified by an amount E that firms can borrow on financial markets (Muûls, 2008).In order to do so firms must pledge a collateral, which is proportional to the domesticfixed cost.
πd(x) + wA+ E ≥ w∗Cf (2)
This framework enriches the predictions of the model with respect to the relation-ship between export likelihood and the size of the firm (larger firms can pledge largercollateral). The link between productivity (i.e. domestic profits) and credit constraintsis explicitly modeled (Muûls, 2008). In addition, the outcome of the lottery is shapedby the probability of default on the loan, which reflects "the level of financial con-tractibility", thus introducing the quality and strength of the financial institutions ofthe country Manova (2008).
3.2 Data Description and Summary Statistics
3.2.1 Variables description
The data used for the empirical analysis are from the EBRD-World Bank BusinessEnvironment and Enterprise Performance Survey (BEEPS).9
We selected three survey datasets for our estimations: one with firms that were sur-veyed only in 2005 (7,028 observations); a second dataset which includes firms surveyed
9Details of the BEEPS database are included in the appendix.
7
only in 2008-9 (7,766 observations); and finally, a dataset with firms surveyed both in2005 and 2009 (3,972 observations).
From the survey questionnaire, we selected a number of relevant variables for ourempirical analysis. Regarding export status, we construct a dummy variable (EXP),which describes whether a firm participates in export markets, being equal to one if thefirm exports and zero otherwise.10
Our financial constraint variable (AFIN) ranges from 0 (no obstacle for access tofinance) to 4 (very severe obstacle for access to finance). Thus, low values of the variablecorrespond to the relative easiness to gain access to finance for a given firm, and viceversa. We chose this subjective financial variable because this can provide new insightsinto the existing literature on export and financial constraints.
To control for other economic determinants of exporting, we include a labor produc-tivity variable (PROD) constructed as the firm’s per-capita labor cost in US dollars11.In addition, SIZE corresponds to the log number of full-time employees for a firm in agiven year. Age of the firm (AGE) is calculated by subtracting the year a firm is es-tablished from the year the survey is conducted. In addition, we also include a dummyvariable concerning foreign ownership (FOWN) of a given firm. We consider a firmforeign owned if the share of ownership by foreign entities is more than 10 percent.
We also divide the countries into groups based upon income following the WorldBank's categorization. The groups contain low-income countries (LOW), lower middle-income countries (LMED), upper middle-income countries (MED), high-income non-OECD countries (HMED), and high-income OECD countries (HIGH).
3.2.2 Summary statistics
Mean and standard deviations of the main variables, including the subjective responseof the firm's access to finance are reported in the Table 2. Column 1 of Table 2 refers tothe entire sample, column 2 to the sub-sample of non-exporting firms, column 3 to thesub-sample of exporting firms, column 4 to the sub-sample of export starters firms , andcolumn 5 to the sub-sample of export exiters firms. In addition, column 6 and column
10The original survey question deals with the percentage of the firm's sales on foreign markets (eitherdirect or indirect exports). In this paper, we make no distinction between direct exports and indirectexports, and do not discriminate based on either amount of export (absolute values) or degree of export(percentage). Thus, any firm whose percentage of export is not zero is considered an exporter firm forthe given year regardless of the amount and extent of export.
11Because more productive workers seek higher wages PROD is expected to have a positive relation-ship with the export activity of the firm.
8

7 are concerned with continuous non-exporters and continuous exporters, respectively.As the summary shows, exporting firms are larger than non-exporting firms in terms
of employment, sales, and productivity, as well as being older and more likely to beassociated with foreign ownership. In addition, the labor cost per full-time workeris higher for exporting firms than non-exporting firms. A similar conclusion can bedrawn if the comparison is made for continuous exporters and non-exporters, withmore significant differences. These results are consistent with the previous findings inthe literature (Bernard and Jensen, 1999; Greenaway et al., 2007; Roberts and Tybout,1997).
Regarding the access to finance, we find that the variable is not significantly differentacross different samples. Both the sub-samples of non-exporting firm years (1.48) andexporting firm years (1.45) exhibit similar numbers for the financial variable. Also, wedo not observe much difference in between the sub-sample of continuous exporters (1.48)and that of continuous non-exporters (1.46).12 Turning to analyze the financial variableover different size groups in terms of sales and number of employees, Table 8 and Table9 provide the summary statistics. They show that the larger the firms in terms of salesor number of employees, the less likely they are to be financially constrained.
In summary, it is shown that the link between access to finance and export sta-tus is weak while it is true that larger firms in terms of real sales, employment, andproductivity are more likely to be exporters. Furthermore, although the link betweenthe financial variable and the export status of the firm is weak, we find that accessto finance and firm's size are linked, as large firms in terms of sales and number ofemployees are less likely to be financially constrained.
3.3 Research questions and empirical strategy
Our empirical model focuses on the factors that influence the decision to export. Theempirical analysis is based on a firm-level dataset and exploits both the cross-sectionand the panel dimension (2005-2009). The idea behind our model is that the firmmaximizes profits conditional on the decision to export. The explanatory variablesinfluence the marginal cost of production faced by the firm and, hence, its expectedprofits generated from exporting.13
12We also use a different scaling for the financial variable to see if the result is consistent over changesin scaling. The detailed results are provided in Table 7 in the Appendix.
13The aim of the empirical estimation is to determine the direction of the relationship (the sign)between certain firm characteristics and the probability of exporting (the so called “response proba-
9

Table2:
Summary
statisticsofthe
keyvariables
(1)(2)
(3)(4)
(5)(6)
(7)SIZE
t116.25
76.08195.68
179.09194.61
56.61198.45
(12.01)(15.25)
(19.05)(40.27)
(45.81)(4.25)
(23.17)3870
25701300
155158
2255987
AGE
t17.50
15.3221.66
18.9818.16
14.9322,6
(.27)(.28)
(.56)(1.52)
(1.54)(.28)
(.65)3941
25871354
152167
22671035
PROD
t615445
2470041318927
154808262816
2182751642420
(136999)(53464)
(384481)(47608)
(206640)(54850)
(495077)3081
20221059
119120
1773820
FOW
Nt
.094.064
.15.10
.15.06
.16(.0046)
(.0048)(.0097)
(.025)(.028)
(.005)(.011)
39722606
1366155
1672284
1044AFIN
t1.47
1.481.46
1.411.48
1.481.46
(.021)(.026)
(.036)(.110)
(.096)(.028)
(.042)3833
25051328
150160
21951018
Note:
Standarderrors
inparentheses.
No.
Observation
inthird
rowfor
eachvar
ineach
sub-sample.
(1)Totalsam
ple,(2)Firm
sfor
which
EXP
t =0,(3)
Firm
sfor
which
EXP
t =1
(4)Firm
sstarting
toexport,(5)
Firm
sexiting
fromexport
market
(6)Continuous
non-exporter,(7)Continuous
exporterSIZE
t :Num
berof
full-timeem
ployeesin
theprevious
fiscalyear.AGE
t :Subtracting
theyear
ofestablishm
entfrom
theyear
ofsurvey.
PROD
t :Per
capitalabor
costin
USD
.FOW
Nt :
Ifforeign
ownership
ofequity
ismore
than10
percent.AFIN
t :From
0(no
obstacle)to
4(very
severeobstacle
toaccess
tofinance).
10

Is there a link between exporting and access to finance?
Our first model addresses the question of whether there is a relationship between theexport status (EXP) and access to finance (AFIN) at time t, controlling for otherdeterminants of exporting. This is a static model, which does not take into accountsunk costs. In other words we show how current firm characteristics are linked tothe export status of the firm. The empirical strategy is represented by the followingreduced-form equation for the population of firms:
EXPit = αAFINit + βSIZEit + δPRODit + γXit + e (3)
where X is a vector of control variables, and e the stochastic error term whichencompasses all firm-specific and time-specific determinants of profits.
It is assumed that the likelihood to be an exporter increases non-linearly with accessto finance, size of the firm and productivity. Hence, we estimate a logit model by Max-imum Likelihood (ML). Before going in detail into results, it is important to mentionthat we are not analyzing in this section how financial constraints affect the decisionto enter or exit foreign markets. Instead, we perform a simple cross-section regressionto analyze the relationship between variables in 2005 and 2009.
Table 3 reports results of the relationship between exporter firms, financial con-straints and other firm characteristics in 2005 (column 1-3). Results suggest that accessto finance affects the export activity of firms, as the sign of the coefficient is positiveand significant (column 1). Furthermore, we find that larger, older, more productiveand foreign owned firms are more likely to sell goods in foreign markets.
Table 3 also shows results for 2009 (column 4-6). Results regarding size, age andownership are in line with the ones in 2005. However, we find no relationship betweenthe export dummy and access to finance in 2009.
We also performed the cross-section analysis for 2005 and 2009 controlling for fixedeffects concerning industries or countries income. As can be seen in Table 3 for 2005,once we control for industry dummies and income level dummies,14 the relationship isstill significant and positive (column 2-3). Results indicate that firms in low incomecountries are less likely to export than firms in high income countries.
bility”). The dependent variable Y is a discrete variable so that the focus is on the probability of Ybeing 1 (i.e. the firm is an exporter, an entrant or an exiter). This probability [P (Y = 1)] is then afunction of the vector of regressors and it can be expressed as a conditional probability: P (Y = 1|X),where X is a vector of firm characteristics including the firm’s "access to finance".
14Income levels are constructed using the World Bank classification.
11

Table3:
The
determinants
ofexporting:cross-section
regressions
Dependent
Variable:
EXPt=
2005
EXPt=
2005
EXPt=
2005
EXPt=
2009
EXPt=
2009
EXPt=
2009
IndependentVariable:
(1)Logit
(MLE
)(2)
Logit(M
LE)
(3)Logit
(MLE
)(4)
Logit(M
LE)
(5)Logit
(MLE
)(6)
Logit(M
LE)
AFIN
t(0-4)
.211***(.033)
.110***(.036)
.115***(.036)
-.025(.022)
-.052**(.024)
-.006(.025)
PROD
t1.57e-07***(4.59e-08)
2.04e-07***(4.98e-08)
5.93e-08(5.84e-08)
2.85e-09(1.57e-07)
-2.96e-08(1.61e-07)
-3.61e-07(4.98e-07)
SIZE
t.494***(.089)
.553***(.096)
.609***(.097)
.926***(.103)
.729***(.112)
.712***(.114)
SIZE
2t
-.021*(.012)
-.028**(.013)
-.035***(.013)
-.060***(.012)
-.039***(.013)
-.038***(.013)
FOW
Nt
1.604***(.154)
1.585***(.170)
1.618***(.172)
.973***(.122)
1.025***(.133)
.964***(.139)
AGE
t.010***(.002)
.009***(.002)
.009***(.002)
.006***(.001)
.004**(.002)
.003*(.002)
FOW
N∗AFIN
t-.281***(.104)
-.206*(.117)
-.192(.118)
-.058(.065)
-.056(.070)
-.001(.073)
Ind.dummies
tno
yesyes
noyes
yes
LOW
t •-.845***(.216)
-1.340***(.156)
LM
ED
t-.148(.125)
-.756***(.092)
HM
ED
t-.890***(.193)
1.456***(.127)
HIGH
t.462***(.114)
.502***(.111)
Constant
-2.931***(.162)
-2.290***(.648)
-2.162***(.659)
-3.508***(.253)
-3.461***(.500)
-3.790***(.527)
#of
observations4246
42424242
69086908
6908
Log-likelihoodvalue
-2198.33-1928.93
-1898.54-3610.21
-3172.41-2994.86
F/LR
(Chi 2)
551.551079.84
1140.61700.93
1576.541931.64
R2/
Pseudo
R2
.115.218
.088.075
.199.243
Note:
*Significant
at10%
;**Significant
at5%
;***Significant
at1%
;Standard
errorsin
parentheses.•
:thereference
groupis
MED.
12

In 2009 (column 5) controlling for industry dummies AFIN shows up negative andsignificant. Controlling for additional income level dummies shows the same pattern asthe one found in 2005, that is, firms from more developed countries have better chancesto be exporters than those in lower income countries, but AFIN becomes insignificant.
On the whole, we found that there is no clear relationship between exporting firmsand their access to finance in 2005 and 2009. Firm characteristics have the expectedinfluence on the firm’s export activity. The following sections will go into greater depthconcerning firms'decisions to export.
Fixed entry costs and selection into exporting
Exporter firms may signal to banks a competitive advantage and higher creditworthiness(see e.g. Campa and Shaver (2002)). Thus, potential endogeneity may flaw a simplecross-section estimation. Moreover, this way of modelling does not answer the questionwhether financial constraints and other firm characteristics influence the export decisionof a firm. Indeed, theoretical studies suggest that only the most productive firms areable to cover the large fixed costs associated with export market entry. In order to testthis assumption empirically and to mitigate the potential endogeneity problem arisingfrom the positive influence of exports on access to finance, we exploit our full set ofobservations for 2005 and 2009, and run the same regression with lagged explanatoryvariables:
EXPit = αAFINit−1 + βSIZEit−1 + δPRODit−1 + γXit−1 + e (4)
where t refers to 2009 and t-1 to 2005 and the subscript i refers to the firm. EXP is adummy variable which is equal to one if the firm exports in 2009 and zero otherwise.Results are presented in Table 4.
We find that firms that consider access to finance a serious problem in 2005 are morelikely to be an exporter in 2009. This result holds through the various specificationsalso controlling for industry effects (column 2) and for the income level of the countryof origin of the firm (column 3). Hence, firms that feel more financially constrained orhave worse access to external finance are more likely to become or be exporters.15
Our variables and (SIZE and PROD) display the expected sign and are statisticallysignificant. Other firm characteristics like foreign ownership and age display also pos-itive and statistically significant coefficients. These findings confirm the self-selection
15For a more detailed analysis of export starters see below.
13

Table 4: The decision to export and self-selection
Dependent Variable: EXPt
Independent Variable: (1) Logit(MLE)
(2) Logit(MLE)
(3) Logit(MLE)
(4) Logit(MLE)
AFIN t−1 (0-4) .264***(.053)
.139**(.059)
.136**(.061)
.149**(.066)
EXPt−1 3.013***(.161)
PRODt−1 4.18e-07***(8.65e-08)
5.04e-07***(1.02e-07)
4.06e-07***(1.13e-07)
3.50e-07***(1.08e-07)
SIZEt−1 .273*(.158)
.268(.174)
.372**(.179)
.158(.196)
SIZE2t−1 -.010(.021)
-.010(.023)
-.018(.024)
-.018(.026)
FOWNt−1 1.289***(.278)
1.293***(.314)
1.461***(.324)
.743 **(.352)
AGEt−1 .010***(.004)
.008 **(.004)
.007(.004)
.010 **(.004)
FOWN ∗AFIN t−1 -.304*(.178)
-.368*(.195)
-.362*(.200)
-.256(.225)
Ind. dummiest−1 no yes yes no
LOW t−1• -1.101***
(.263)
LMEDt−1 -.673***(.211)
HMEDt−1 .465(.335)
HIGHt−1 1.253***(.312)
Constant -2.250***(.293)
17.01***(1.55)
-16.97***(1.555)
-2.81***(.361)
# of observations 1283 1276 1276 1283
Log-likelihood value -749.70 -643.27 -616.36 -531.48
F / LR(Chi2) 120.15 324.58 378.41 556.59
R2/ Pseudo R2 .007 .201 .235 .340
Note: * Significant at 10%; ** Significant at 5%; *** Significant at 1%;Standard errors in parentheses.All explanatory variables are lagged. • : the reference group is MED.
14

hypothesis that only those firms that are ex-ante more productive, foreign owned andolder select into exporting16 (Bernard and Jensen, 1999; Greenaway et al., 2005; Robertsand Tybout, 1997). In addition, the interaction term between foreign ownership andaccess to finance is negative and significant at the 10%. This suggests that financiallyconstrained foreign owned firms in 2005, are less likely to become exporters in 2009.
Furthermore, in order to highlight the importance of fixed market entry costs adynamic model is estimated by including a lagged dependent variable:
EXPit = θEXPi,t−1 + αAFINi,t−1 + βSIZEi,t−1 + δPRODi,t−1 + γXi,t−1 + e (5)
The lagged export status (EXPt−1) is economically and statistically significant.This finding backs the idea that fixed entry costs play an important role in influencingthe export decision. Indeed, moving from specification (1) to (4) the coefficient onAFIN becomes smaller and less significant.17
Controlling for past export status, productivity, foreign ownership and age remainsignificant determinants of exporting (column 4). Consequently, size and productivitydrive the firm's ability to generate profits from export participation. Both coefficientsbecome smaller in size, which means that they play a role in financing the upfrontmarket entry costs.18
Does access to finance influence the decision to start or exit exporting?
In this section we address a model to study the relationship between financial constraintsof firms and their decision to enter or exit the export market. Our main question iswhether firms that start exporting are different from non-exporters and whether firmsthat exit the export market are different from continuous exporters. To answer thisquestion we first analyze if less financially constrained firms have a higher probabilityof becoming exporters in the next period. We call these firms export starters. Second,we perform the opposite analysis, that is, whether firms who are exporters are likely to
16SIZE is significant only in two out of four specifications, which casts some doubt on the structuralrelationship between size and export entry; on the firm size and export relationship see e.g. Wagner(2001).
17Note that if entry costs would be the only cause for a firm to be financially constrained then thecoefficient on AFIN should not be significant in column 4.
18Bellone et al. (2009) highlight an important caveat in this analysis. Indeed, once the endogenouscovariate is included a potential endogeneity bias arises. Correcting for this would require a GMMestimator or an IV approach.
15
stop doing so in the next period because of obstacles to access external finance.
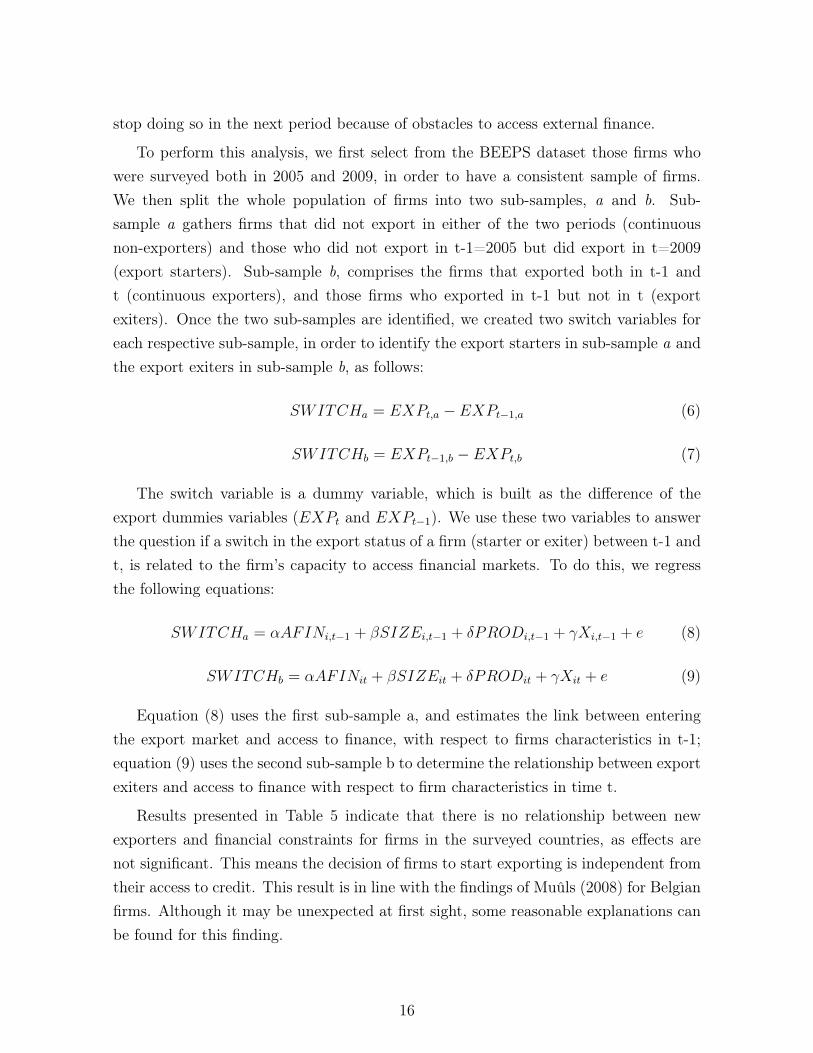
To perform this analysis, we first select from the BEEPS dataset those firms whowere surveyed both in 2005 and 2009, in order to have a consistent sample of firms.We then split the whole population of firms into two sub-samples, a and b. Sub-sample a gathers firms that did not export in either of the two periods (continuousnon-exporters) and those who did not export in t-1=2005 but did export in t=2009(export starters). Sub-sample b, comprises the firms that exported both in t-1 andt (continuous exporters), and those firms who exported in t-1 but not in t (exportexiters). Once the two sub-samples are identified, we created two switch variables foreach respective sub-sample, in order to identify the export starters in sub-sample a andthe export exiters in sub-sample b, as follows:
SWITCHa = EXPt,a − EXPt−1,a (6)
SWITCHb = EXPt−1,b − EXPt,b (7)
The switch variable is a dummy variable, which is built as the difference of theexport dummies variables (EXPt and EXPt−1). We use these two variables to answerthe question if a switch in the export status of a firm (starter or exiter) between t-1 andt, is related to the firm’s capacity to access financial markets. To do this, we regressthe following equations:
SWITCHa = αAFINi,t−1 + βSIZEi,t−1 + δPRODi,t−1 + γXi,t−1 + e (8)
SWITCHb = αAFINit + βSIZEit + δPRODit + γXit + e (9)
Equation (8) uses the first sub-sample a, and estimates the link between enteringthe export market and access to finance, with respect to firms characteristics in t-1;equation (9) uses the second sub-sample b to determine the relationship between exportexiters and access to finance with respect to firm characteristics in time t.
Results presented in Table 5 indicate that there is no relationship between newexporters and financial constraints for firms in the surveyed countries, as effects arenot significant. This means the decision of firms to start exporting is independent fromtheir access to credit. This result is in line with the findings of Muûls (2008) for Belgianfirms. Although it may be unexpected at first sight, some reasonable explanations canbe found for this finding.
16

Table 5: Entrants and exiters
Dependent Variable: ENTRANTS EXITERS
SWITCHa SWITCHa SWITCHb SWITCHb
Independent Variable: (1) Logit(MLE)
(2) Logit(MLE)
(3) Logit(MLE)
(4) Logit(MLE)
AFIN t−1,t (0-4) .091(.092)
.032(.100)
.068(.076)
.100(.082)
PRODt−1,t 3.32e-07**(1.39e-07)
4.50e-07***(1.59e-07)
-.00002**(.00001)
-.00002*(.00001)
SIZEt−1,t .180(.280)
.212(.300)
-.787***(.227)
-.649**(.272)
SIZE2t−1,t -.020(.039)
-.012(.042)
.059**(.026)
.060**(.031)
FOWNt−1,t 1.01***(.347)
.845**(.382)
-.210(.296)
-.243(.316)
AGEt−1,t .013**(.006)
.015**(.006)
-.006(.006)
-.011(.007)
Ind. dummiest−1,t no yes no yes
Constant -2.887***(.485)
15.42***(1.21)
-1.198**(.484)
-16.25***(1.78)
# of observations 852 835 588 575
Log-likelihood value -292.80 -257.48 -306.58 -277.87
F / LR(Chi2) 18.45 80.85 43.71 84.83
R2/ Pseudo R2 .0305 .0135 .0066 .0132
Note: * Significant at 10%; ** Significant at 5%; *** Significant at 1%;Standard errors in parentheses.Explanatory variables are at time t-1=2005 for SWITCHa and time t=2009 forSWITCHb
17
First, we are not analyzing the financial health of firms but their constraints toaccess credit. Therefore, a firm can be financially constrained but have good internalfinancial health indicators, such as liquidity and leverage ratios, which means that firmscould rely on internal liquidity to bear start-up costs.
Second, we are analyzing firms in transition countries, where financial developmentmay differ from that in more advanced countries, where credit markets work moreefficiently. In fact, Konings et al. (2003) argue that in transition economies, capitalmarkets are inefficient and are subject to asymmetric information problems. Hence,credit to private sector tends to be more expensive and probably less available for firmsin transition countries as compared to high income countries.
We also find that productivity, foreign ownership and the age of the firms positivelyaffect the likelihood of a firm to become an exporter. Consistent with the previousliterature, more productive and older firms have higher chances of entering foreignmarkets. Moreover, in line with Greenaway et al. (2005) and Kneller and Pisu (2004)we find that firms that are foreign-owned are more likely to enter export markets. Inline with the results presented in the previous paragraph, more productive firms as wellas foreign owned firms, do not have to rely on external finance. First, more productivefirms may be expected to have better financial ratios than less productive firms. Second,firms with foreign owners could eventually be financed by the headquarters of the firmabroad, diminishing the need of the firm to access the credit market. Both variablespositively affect the likelihood of a firm to export and tend to make firms less dependenton external finance.
Table 5 also shows results for exiters firms. Again, we find no link between thefinancial constraint of firms and their decision to stop exporting. However, we find thatsize is a significant determinant of firms export exit decisions. In fact, larger firms aremore likely to continue exporting, while smaller firms are more likely to exit the exportmarket. In addition, we find evidence that less productive firms are morel likely toexit the export market. In sum, results suggest that firms that become exporters arenot different in their financial constraints from non-exporters, and firms that exit theexport market are not different from those that continue exporting.
Does exporting improve access to finance?
In this section we ask whether exporting improves access to finance, i.e. if there isa learning-by-exporting effect (see e.g. Van Biesebroeck (2005); Bernard and Jensen
18
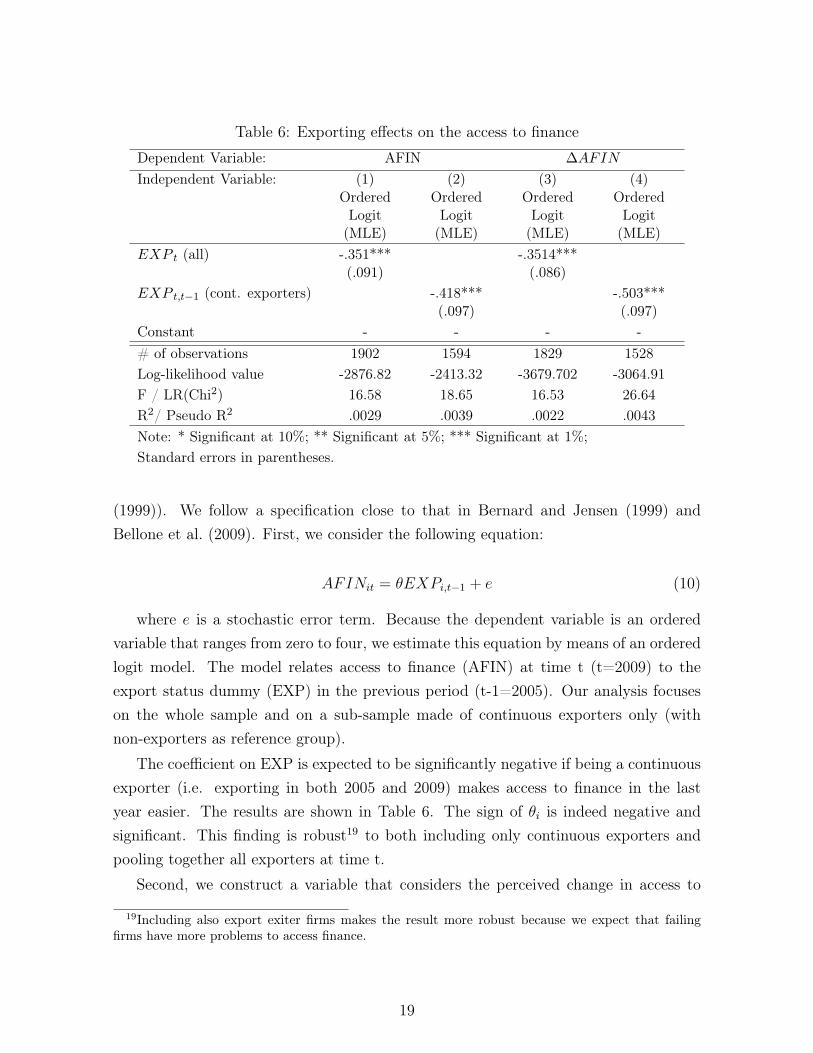
Table 6: Exporting effects on the access to finance
Dependent Variable: AFIN ∆AFIN
Independent Variable: (1)OrderedLogit(MLE)
(2)OrderedLogit(MLE)
(3)OrderedLogit(MLE)
(4)OrderedLogit(MLE)
EXP t (all) -.351***(.091)
-.3514***(.086)
EXP t,t−1 (cont. exporters) -.418***(.097)
-.503***(.097)
Constant - - - -# of observations 1902 1594 1829 1528Log-likelihood value -2876.82 -2413.32 -3679.702 -3064.91F / LR(Chi2) 16.58 18.65 16.53 26.64R2/ Pseudo R2 .0029 .0039 .0022 .0043Note: * Significant at 10%; ** Significant at 5%; *** Significant at 1%;Standard errors in parentheses.
(1999)). We follow a specification close to that in Bernard and Jensen (1999) andBellone et al. (2009). First, we consider the following equation:
AFINit = θEXPi,t−1 + e (10)
where e is a stochastic error term. Because the dependent variable is an orderedvariable that ranges from zero to four, we estimate this equation by means of an orderedlogit model. The model relates access to finance (AFIN) at time t (t=2009) to theexport status dummy (EXP) in the previous period (t-1=2005). Our analysis focuseson the whole sample and on a sub-sample made of continuous exporters only (withnon-exporters as reference group).
The coefficient on EXP is expected to be significantly negative if being a continuousexporter (i.e. exporting in both 2005 and 2009) makes access to finance in the lastyear easier. The results are shown in Table 6. The sign of θi is indeed negative andsignificant. This finding is robust19 to both including only continuous exporters andpooling together all exporters at time t.
Second, we construct a variable that considers the perceived change in access to
19Including also export exiter firms makes the result more robust because we expect that failingfirms have more problems to access finance.
19

finance20 (∆AFIN) between 2005 and 2009.
∆AFINt,t−1 = θEXPt,t−1 + e (11)
where e is a stochastic error term.We again find a negative relationship between being a continuous exporter and de-
terioration in access to finance. Hence, continuous exporters are more likely to improvetheir access to finance compared to non-exporters21.
Is this finding calling for a learning-by-exporting effect? Not unambiguously. On theone hand, exporters which have already met the entry costs may no longer need furtherexternal finance, in particular because exporting may provide them with more liquidity.On the other hand, they may show up as less constrained because their demand forexternal funds is now negligible. Hence, our approach does not allow us to separatethe causal effect running from exports to a better access to finance. However, becausethe survey was conducted toward the end of 2008 and in the first quarter 2009, andbecause respondents reported how their access to finance impacts on current businessactivities, this finding emphasizes the role of exporting as a way of reducing the impacton the firm’s solidity also during systemic crises. In other words, during the crisisand the credit crunch continuous exporters seem to have better access to finance thannon-exporters.
4 Concluding remarks
This paper analyzes the relationship between the exporting behavior of firms and accessto finance in transition countries.We find that there is no relationship between the decision of firms to enter or exitexport markets and their access to external finance. This suggests that internal financemay play a more important role for export decisions in transition economies. Indeed,more productive, foreign owned and older firms are more likely to start exporting. Inaddition, size and experience (i.e. age) matter in keeping the firm in the export market.
20We subtract the AFIN score in 2005 from the AFIN score in 2009. Hence, we get a score which iszero when there are no changes, -1 to -4 when access to finance improved and +1 to +4 when accessto finance worsened. To perform the regression we then assign to each variation in access to financea value from 0 to 8. The resulting variable is 8 when the firm’s access to finance worsened and viceversa is 0 when access to finance improved the most. We then run an ordered logit regression.
21Exiters and entrants were dropped from the sample.
20
With respect to ex-ante firm characteristics, our results confirm that larger and moreproductive firms, as well as foreign-owned firms, self-select into exporting. We alsofind evidence that fixed-entry costs play an important role in influencing the exportingdecision. Moreover, we find evidence that firms in low-income countries are less likelyto become exporters compared to firms in high-income countries.Finally, there is some evidence that exporting firms are able to improve their access toexternal finance.
21
References
Beck, T. (2003, 05). Financial dependence and international trade. Review of Interna-tional Economics 11 (2), 296–316.
Bellone, F., P. Musso, L. Nesta, and S. Schiavo (2009, March). Financial constraintsand firm export behavior. Forthcoming in The World Economy.
Bernard, A. and J. Wagner (2001, March). Export entry and exit by german firms.Review of World Economics (Weltwirtschaftliches Archiv) 137 (1), 105–123.
Bernard, A. B. and B. J. Jensen (1999, February). Exceptional exporter performance:cause, effect, or both? Journal of International Economics 47 (1), 1–25.
Campa, J. M. and J. M. Shaver (2002, September). Exporting and capital investment:On the strategic behavior of exporters. IESE Research Papers D/469, IESE BusinessSchool.
Chaney, T. (2005, July). Liquidity constrained exporters. MIMEO, University ofChicago.
Greenaway, D., A. Guariglia, and R. Kneller (2005). Do financial factors affect ex-porting decisions? GEP Research Paper 05/28, Leverhulme Centre for Research onGlobalization and Economic Policy, University of Nottingham.
Greenaway, D., A. Guariglia, and R. Kneller (2007, November). Financial factors andexporting decisions. Journal of International Economics 73 (2), 377–395.
Kneller, R. and M. Pisu (2004, Autumn). Export-oriented fdi in the uk. Oxford Reviewof Economic Policy 20 (3), 424–439.
Konings, J., M. Rizov, and H. Vandenbussche (2003, February). Investment and fi-nancial constraints in transition economies: micro evidence from poland, the czechrepublic, bulgaria and romania. Economics Letters 78 (2), 253–258.
Levchenko, A. A. (2007, 07). Institutional quality and international trade. Review ofEconomic Studies 74 (3), 791–819.
22

Manova, K. (2008, December). Credit constraints, heterogeneous firms, and interna-tional trade. NBER Working Papers 14531, National Bureau of Economic Research,Inc.
Melitz, M. J. (2003, November). The impact of trade on intra-industry reallocationsand aggregate industry productivity. Econometrica 71 (6), 1695–1725.
Modigliani, F. and M. H. Miller (1958). The cost of capital, corporation finance andthe theory of investment. The American Economic Review 48 (3), 261–297.
Muûls, M. (2008, September). Exporters and credit constraints. a firm-level approach.Research series 200809-22, National Bank of Belgium.
Roberts, M. J. and J. R. Tybout (1997, September). The decision to export in colombia:An empirical model of entry with sunk costs. American Economic Review 87 (4),545–64.
Van Biesebroeck, J. (2005). Exporting raises productivity in sub-saharan african man-ufacturing firms. Journal of International Economics 67 (2), 373 – 391.
Wagner, J. (2001, December). A note on the firm size-export relationship. SmallBusiness Economics 17 (4), 229–37.
23
Appendix A
Business Environment and Enterprise Performance Survey (BEEPS)
The database for the empirical analysis builds on the Business Environment and Enter-prise Performance Survey (BEEPS). Regarding the geographical dimension, the surveysare performed for the vast majority of transition countries of Eastern Europe and Cen-tral Asia.
The BEEPS is a joint initiative between the European Bank for Reconstructionand Development (EBRD) and the World Bank Group. Since the first round of theBEEPS survey in 1999-2000, and through its subsequent rounds since then, the BEEPSincreased its coverage in terms of firms and countries. Indeed, while in the first round4,000 firms were surveyed in 26 countries, in the second round of 2002 the firms admin-istered reached 6,500, and this number rose to 9,500 firms in the third round of 2005.In the last round of 2008-2009, 11.800 enterprises were surveyed in 29 countries.
The scope of the BEEPS is gathering information at the firm level to assess thebusiness environment for private enterprises and the state of business development inthe countries surveyed. In this sense, the Enterprise Surveys collect information aboutthe various constraints to firm performance and growth, including different questionson financial constraints of firms and export decisions.
The samples are selected using stratified random sampling. The universe of firmssurveyed can be grouped in three broad sectors: manufacturing, services and IT22 withat least five full-time employees. The manufacturing and service sectors23 were classifiedaccording to the ISIC Rev 3.1 classification. The public sector24 and the primary sectorenterprises were excluded from the survey, so the universe of firms surveyed belongs tothe private non-agricultural economy.
The structure of the survey is composed by three different types of questionnaires.The Core Module, includes questions asked to all firms from all sectors. The Manufac-turing Module, which is derived from the Core Module adds specific-sectoral questions,and finally, the Service Module, which is also based on the Core Module, adds specificquestion related to the IT service sector. The implementation of the surveys is done ina two stage process. Firstly, a questionnaire is performed over the telephone in order
22Even though IT firms belong to the service sector, they were separated and treated as a new sector23The service sector excludes financial intermediation, real estate and renting activities and all public
or utility sectors24Military, police, education, health, and other government departments
24
to determine if the firm is eligible for the next stage. In the second stage, a face toface interview takes place with a representative of the firm, such as managing directors,accountants, human resource managers and other company staff.
Scaling of access to finance
For the analysis of financial constraints, the BEEPS asks the question “how much of anobstacle is access to finance?”, and starting from this question we construct the variable“access to finance”, which ranges from 0 (no obstacle) to 4 (very severe obstacle). Accessto finance includes “availability and cost, interest rates, fees and collateral requirements”.In order to see whether the summary statistics is independent of different scaling, wedecompose this variable by grouping it into a smaller range. Table A-1 shows the resultof this analysis. We employ four different scaling measures of access to finance byvarying the original scaling of the variable. All the different scaling measures bringthe same conclusion such that the “access to finance” is not significantly different fromeach other for all the sub-samples we are to examine (continuous exporters, continuousnon-exporters, switchers, exiters, etc.).
Income classes
Following the EBRD-World Bank classification, countries in the survey are dividedamong income classes. Table A-4 presents an overview of the classification. LOW=Lowincome countries, LMED=Lower middle income countries, MED=Upper middle incomecountries, HMED=High income non-OECD countries, HIGH=High income OECD coun-tries.
25

Table A-1: Analysis of the access to finance variable(1) (2) (3) (4) (5) (6) (7)*
**AFIN t 1.47 1.48 1.46 1.41 1.48 1.48 1.46(.021) (.026) (.036) (.110) (.096) (.028) (.042)
AFIN(2)t .24 .24 .24 .23 .25 .25 .25(.007) (.008) (.012) (.334) (.034) (.009) (.013)
AFIN(3)t .71 .71 .70 .67 .72 .71 .70(.013) (.016) (.023) (.066) (.065) (.017) (.026)
AFIN(4)t .46 .47 .46 .45 .47 .47 .45(.008) (.009) (.013) (.040) (.039) (.010) (.015)
AFIN(5)t .68 .68 .67 .64 .72 .68 .67(.007) (.009) (.013) (.039) (.035) (.009) (.105)
OBS 3833 2505 1328 150 160 2195 1018
Note: Standard errors in parentheses.*(1) Total sample, (2) Observation such that EXP T=0(3) Observation such that EXP T=1, (4) SWITCHERT−1
(5) EXITERT−1, (6) Continuous Non-Exporter,(7) Continuous Exporter**AFIN t: (0=No, 1=Min, 2=Mod, 3=Maj, 4=Very Severe)AFIN(2)t: (0=No,Min,Mod, 1=Maj,Very Severe)AFIN(3)t: (0=No,Min, 1=Mod, 2=Maj,Very Severe)AFIN(4)t: (0=No,Min, 1=Mod,Maj,Very Severe)AFIN(5)t: (0=No, 1=Otherwise)
Table A-2: Financial variable in different size samples (in terms of real sales)1st Quantile 2nd Quantile 3rd Quantile 4th Quantile 5th Quantile
AFIN t 1,52 1,54 1,59 1,48 1,27(.053) (.054) (.054) (.053) (.053)
Obs 598 600 616 613 614
Note: Standard errors in parentheses.
Table A-3: Financial variable in different size samples (in terms of employment)1st Quantile 2nd Quantile 3rd Quantile 4th Quantile 5th Quantile
AFIN t 1,54 1,54 1,58 1,38 1,24(.046) (.050) (.048) (.047) (.045)
Obs 850 658 723 749 756
Note: Standard errors in parentheses.
26

Table A-4: Country ClassificationIncome Classification
Albania LMEDBelarus MEDGeorgia LMED
Tajikistan LOWTurkey MEDUkraine LMED
Uzbekistan LOWRussia MEDPoland MEDRomania MEDSerbia MED
Kazahkstan MEDMoldova LMEDBosnia MED
Azerbaijan LMEDFYROM MEDArmenia LMEDKyrgyz LOWEstonia HMEDCzech HIGH
Hungary HIGHLatvia MEDSlovakia HIGHSlovenia HMEDBulgaria MEDCroatia HMED
Montenegro MED
27