Effects of physical fitness on relaxed G-tolerance and the exercise pressor response

Accepted for publication in The Astrophysical Journal.
ASCA Observations of "Type 2" LINERs: Evidence for a Stellar Source of
Ionization
Yuichi Terashima
NASA Goddard Space Flight Center, Code 662, Greenbelt, MD 20771
Luis C. Ho
Carnegie Observatories, 813 Santa Barbara St. Pasadena, CA 91101-1292
Andrew F. Ptak
Department of Physics, Carnegie Mellon University, 5000 Forbes Ave., Pittsburgh, PA 15213
Richard F. Mushotzky, Peter J. Serlemitsos, and Tahir Yaqoob 1
NASA Goddard Space Flight Center, Code 662, Greenbelt, MD 20771
and
Hideyo Kunieda 2
Department of Physics, Nagoya University, Chikusa-ku, Nagoya, 464-8602, Japan
ABSTRACT
We present ASCA observations of LINERs without broad Ha emission in their
optical spectra. The sample of "type 2" LINERs consists of NGC 404, 4111, 4192,
4457, and 4569. We have detected X-ray emission from all the objects except for NGC
404; among the detected objects are two so-called transition objects (NGC 4192 and
NGC 4569), which have been postulated to be composite nuclei having both an H II
region and a LINER component.
The images of NGC 4111 and NGC 4569 in the soft (0.5-2 keV) and hard (2-7
keV) X-ray bands are extended on scales of several kpc. The X-ray spectra of NGC
4111, NGC 4457 and NGC 4569 are well fitted by a two-component model that consists
of soft thermal emission with kT ,_ 0.65 keV and a hard component represented by a
power law (photon index ,,- 2) or by thermal bremsstrahlung emission (kT _ several
keV). The extended hard X-rays probably come from discrete sources, while the soft
emission most likely originates from hot gas produced by active star formation in
1Universities Space Research Association.
2presenl address: Inslitute of Space and Astronautical Science, Yoshinodai 3-1-1, Sagamihara, Kanagawa 229-8510,
Japan

tile host galaxy. We have found no clear evidence for the presence of active galactic
nuclei (AGNs) in the sample. Using black hole masses estimated from host galaxy
bulge luminosities, we obtain an upper limit on the implied Eddington ratios less than
5 x 10 -5. If an AGN component is the primary ionization source of the optical emission
lines, then it must be heavily obscured with a column density significantly larger than
i023 cm -2, since the observed X-ray luminosity is insufficient to drive the luminosities
of the optical emission lines. Alternatively, the optical emission could be ionized by a
population of exceptionally hot stars. This interpretation is consistent with the small
[0 I] ,k6300/Ha ratios observed in these sources, the ultraviolet spectral characteristics
in the cases where such information exists, and the X-ray results reported here.
We also analyze the X-ray properties of NGC 4117, a low-luminosity Seyfert 2
galaxy serendipitously observed in the field of NGC 4111.
Subject headings: galaxies: active -- galaxies: nuclei -- X-rays: galaxies
1. Introduction
LINERs (low-ionization nuclear emission-line regions; Heckman 1980) are found in a significant
fraction of bright galaxies (Ho, Filippenko, & Sargent 1997a). The ionizing source of LINERs is
still under debate (see Filippenko 1996 for a review), with candidate ionization mechanisms being
photoionization by low-luminosity active galactic nuclei (AGNs), photoionization by very hot
stars, and collisional ionization by fast shocks. Recent observations have shown that at least some
LINERs are low-luminosity AGNs (hereafter LLAGNs); see Ho (1999a and references therein) for
a review. According to the extensive spectroscopic survey of Ho et al. (1997b), which includes
all bright (BT _< 12.5 mag) gala.des with declinations greater than 0 °, about 20% of LINERs
exhibit a broad Ha emission line in their optical spectra. Hard X-ray observations provide a
powerful means for searching for evidence of an AGN by detecting a pointlike hard X-ray source
at the nucleus. Compact hard X-ray sources have been detected in LINERs that show broad
tta emission (hereafter LINER ls; Iyomoto et al. 1996, 1998; Ptak et al. 1998; Terashima et al.
1998a; Guainazzi & Antonelli 1999; Weaver et al. 1999). The X-ray spectra of these objects are
well represented by a two-component model: a power-law component plus soft thermal emission.
The X-ray spectra of the hard component are quite similar to those of Seyfert galaxies, and typical
X-ray luminosities are 104°-41 ergs s -_. The Ha luminosities of LINER ls are positively correlated
with the X-ray luminosities in the 2-10 keV band (Terashima 1999; Terashima et al. 1999). These
observations strongly support the idea that most LINER ls are LLAGNs.
LINERs constitute the majority of the objects that show spectroscopic evidence for nuclear
activity, and most LINERs (,,, 80_; Ho et al. 1997a, b) show no detectable broad Ha emission
and are classified as "'LINER 2s". Therefore. LINER 2s are the most abundant form of low-level
activity in nearby galaxies. It is not clear whether the origin of LINER 2s is similar to _hat of

LINER ls. If LINER 2s arealsogenuineAGNs,then the emissionfrom their nucleimay beobscured,by analogy,with thepopularobscurationmodelfor Seyfert2 galaxies(LawrenceX:Elvis1982;Antonucci& Miller 1985).If this is the case,then the X-ray spectraof LINER 2sshouldshowevidencefor heavyabsorption(NH > 1"023cm-2) and strongfuorescentiron K emissionlines. Forexample,NGC1052,a LINER 1.9(Hoet al. 1997a)from whichpolarizedbroadHa linehasbeendetected(Barth et al. 1999),showsanX-ray spectrumabsorbedby a column density of
NH _ 3 x 10 23 cm -2 and a fluorescent iron K emission line with an equivalent width of ,,-300 eV
(Weaver et al. 1999). These X-ray characteristics are quite similar to those of luminous Seyfert 2
galaxies (Awaki et a]. 1991a; Smith & Done 1994: Turner et al. 1997a). Thus, this is an example
of an active nucleus which is a low-ionization analog of Seyfert 2 galaxies such as NGC 1068.
Alternatively, the optical emission lines in LINER 2s may be ionized by sources other than
an AGN. Collisional ionization from fast-moving shocks (e.g., Koski & Osterbrock 1976; Fosbury
et al. 1978; Dopita & Sutherland 1995) and photoionization by a cluster of hot, young stars
(Terlevich & Melnick 1985; Filippenko & Terlevieh 1992; Shields 1992) have also been proposed
as possible excitation mechanisms to power the narrow-line emission in LINERs. Ultraviolet (UV)
spectra of several LINER 2s are available from the Hubble Space Telescope (HST), and these
indicate the presence of massive stars in some LINER 2s (Maoz et al. 1998). Maoz et M. (1998)
find that in NGC 404, NGC 4569, and NGC 5055 hot stars play a significant role as an ionizing
source for the optical emission lines. In order to explain the observed Ha luminosities by stellar
photoionization, however, very massive stars (M m 100 M®) are required to be still present (seeFig. 5 in Maoz et al. 1998).
Although UV spectroscopy can probe the presence of massive stars, only UV bright objects
(,-_20%-30% of LINERs; Maoz et al. 1995; Barth et al. 1998; Ho, Filippenko, &,-Sargent 1999)
can be studied. Moreover, Maoz et aft. (1998) have argued that even in objects such as M81,
NGC 4579 or NGC 4594, where an LLAGN is known to be present based on other evidence, the
observed UV continuum power is insufficient to account for the observed line emission, and the
nonstellar component most likely becomes more prominent at higher energies. Searching for the
ionizing source in the X-rays is necessary, to test this hypothesis.
Only' a limited number of X-ray observations of LINER 2s have been performed so far.
Previous X-ray observations with Einstein and ROSA T were limited to soft energies, where heavily
obscured AGNs are difficult to detect. Furthermore, the limited spectral resolution and bandpass
of lhese observations cannot distinguish the thernlal emission of the host galaxy, from the emissionfrom the AGN.
We observed a. small sample of three LINER 2 nuclei (NGC 404, NGC 4111, and NGC
4457) with the ASCA satellite to search for a. hidden ionizing source; the sample also included
NGC 4192 and NGC 4569, which are classified as "transition objects," emission-line nuclei whose
optical spectra suggest a. composite source of ionization, possibly due to a genuine LINER nucleus
mixed in with signal fi'om circumnuclear H II regions. The imaging capability of ASCA (Tanaka,

-4-
Inoue, & ttolt 1994), which extends up to 10 keV, and its moderate spectral resolution enable it
to identify thermal emission from the host galaxy. We also analyze the X-ray properties of NGC
4117, a low-luminosity Seyfert 2 galaxy serendipitously observed in the field of NGC 4111.
This paper is organized as follows. In _2 we summarize the ASCA observations and data
reduction. Image and spectral analysis are reported in §3 and §4, respectively. We discuss the
origin of X-ray emission and the ionizing source in type 2 LINERs in §5. A summary of our
findings is presented in §6.
2. Observations
We observed the three LINER 2s and two transition objects shown in Table 1. These objects
are selected from the Palomar survey of nearby galaxies conducted by tto et al. (1995, 1997a), for
which Ho et al. (1997b) determined that broad Ha emission is not present. We selected objects
that are bright in the narrow Ha emission line, since a large X-ray flux is expected if the ionization
source is due to an AGN (Halpern, & Steiner 1983; Elvis, Soltan, & Keel 1984; Ward et al. 1988:
Koratkar et al. 1995; Terashima 1999; Terashima et al. 1999). We also gave preference to objects
that have previously been studied in the UV using the BST. Both NGC 404 and NGC 4569 are
UV bright and have been studied spectroscopically in the UV by Maoz et al. (1998), while NGC
4111 and NGC 4192 were imaged in the UV but were not detected (Maoz et al. 1996; Barth et al.
1998).
The log of the ASCA observations is shown in Table 2. Detailed descriptions of the ASCA
instruments can be found in Serlemitsos et al. (1995), Ohashi et al. (1996), Makishima et al.
(1996), Burke et al. (1994), and Yamashita et al. (1997). The observation mode of the Solid-state
Imaging Spectrometers (SIS) is summarized in Table 2; the Gas Imaging Spectrometers (GIS)
were operated in the nominal pulse-height mode. We screened the data using standard criteria.
We excluded data taken when (1) the elevation angle from the earth's limb was less than 5° ,
(2) the cut-off rigidity was less than 6 GeV c-1, (3) the satellite was passing through the South
Atlantic Anomaly, and (4) the elevation angle from the day earth's limb was less than 25 ° (only
for the SIS). The observed count rates, after background subtraction, and the net exposure times,
after data screening, are also tabulated in Table 2. Although we observed NGC 404, 4111, 4192
and 4569 on two occasions in order to search for variability, no significant variability was found.
The typical upper limit on variability is 50_,. We therefore use images and spectra combined from
the two observations in the following analysis. In this paper, the quoted errors are at the 90¢_:
confidence level for one parameter of interest, unless otherwise noted.

3. X-ray images
WedetectedX-ray emissionfrom all objectsexceptfor NGC 404. In this section,weshowX-ray imagesandestimatethe spatialextensionof theX-ray emission.
3.1. NGC 404
The nucleusof NGC 404 was not detected in either the SIS or in the GIS images. One
serendipitous source was detected in the SIS image in the 0.5-2 keV band of the second observation.
The SIS image in the 0.5-2 keV band is shown in Figure la. The peak position of this source is
(a, 6)J2oo0 = (1 h 9TM 28 s, 35 ° 38' 59"), and the error radius is about 1'. This source is not clearly
seen i,1 the GIS image or in the SIS image above 2 keV.
We calculated an upper limit for the X-ray flux seen toward the nucleus of NGC 404 using the
following procedure. We made a one-dimensional projection of width 2:5 along the nucleus and
the serendipitous source and then fitted the profile with a model consisting of two point-spread
functions (PSFs) at the positions of the two objects plus a constant background. The model PSFs
were obtained using a ray-tracing code, and they were projected using the same method applied
to the data. The free parameters are the normalizations of the two PSFs and the background
level. We fitted the projected SIS images in the 0.5-2 keV and 2-10 keV bands and obtained a 3a
upper limit of 1.1 x 10 -14 ergs s -1 cm -2 and 6.6 x 10 -14 ergs s -1 em -2, respectively, assuming a
power-law spectrum with a photon index of F = 2. For an assumed distance of 2.4 Mpc (Tully
1988), these upper limits for the X-ray flux correspond to luminosities of 7.6 x 1036 ergs s -1 in the0.5-2 keV band and 4.6 × 1037 ergs s-1 in the 2-10 keV band.
3.2. NGC 4111
Figures lc and ld show the GIS images in the 0.5-2 keV and 2-7 keV bands, respectively.
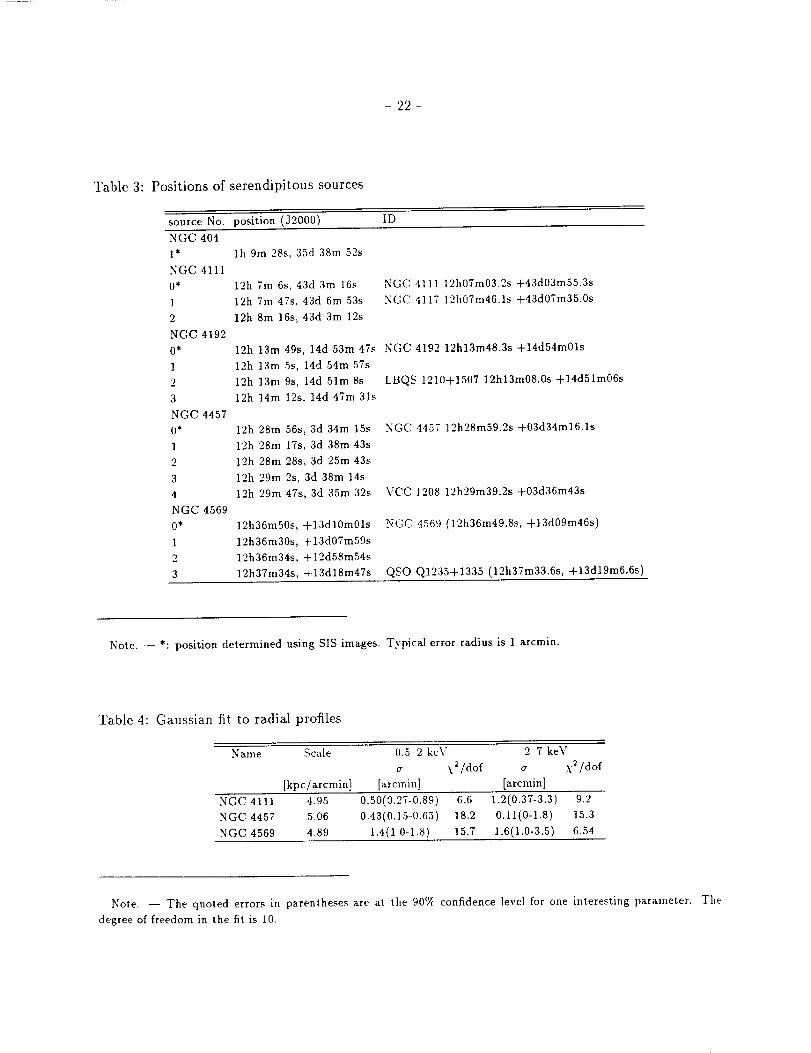
At least three X-ray sources were detected in the GIS field of view, and the positions and
tentative identifications of these are summarized in Table 3. One of these sources, at (o, /S)J2000
= (12 h 7TM 47 _, 43 ° 6' 53 'I) is brighter in the >2 keV image than in the <2 keV image. This hard
source is positionally coincident, within the astrometric uncertainty of ASCA, with NGC 4117, a
B _ 14.0 mag Seyfert 2 galaxy first recognized by Huchra, Wyatt, & Davis (1982). The other two
sources are brighter in the soft-band image. One of the soft sources coincides with the nucleus of
NGC 4111. while the other has no counterpart in the NASA Extragalactic Database (NED).
NGC 4111 is detected also in the SIS image, but the other sources are out of the field of view
of lhe detector. In order to estimate the spatial extent of the X-ray emission, we made azinmthally
averaged radial profiles of surface brightness using the SIS images and compared them with those
of the PSF. We used the SIS images to examine the spatial extent of the emission, since the

-6-
spatialresolutionof the SISisbetter than that of the GIS.Wetried to fit theradial profilesill the0.5-2keVand 2-7 keVbandswith a PSFplusconstantbackgroundmodel.The freeparametersare the normalizationof the PSFand the backgroundlevel. The fits wereunacceptable:\2 =20.9and 30.4for 11degreesof freedom,in the 0.5-2keV and2-7 keV bands,respectively.Inorder to parameterizethe spatialextent,wefitted the radial profileswith a constant background
plus a two-dimensional Gaussian convolved through the PSF. The free parameters in this fit are
the dispersion and normalization of the Gaussian and the background level. This model gave a
significantly better fit with AX'2=14 and 21, respectively, for one additional parameter. These
are significant at more than 99% confidence. The best-fit values of a are summarized in Table
4. The Gaussian model provides a reasonably good representation of the observed profile. These
results indicate that the X-ray images are extended on kpc scales in both the 0.5-2 keV and 2-7
keV bands. The difference in spatial extent between the two energy bands is not significant. The
best-fit profile is shown in Figure 2.
3.3. NGC 4192
NGC 4192 and a few serendipitous sources were detected in the field. The contour maps
of the SIS images in the 0.5-7 keV band are shown in Figure lb. The positions of the detected
sources are summarized in Table 3. An archival ROSAT PSPC image shows two sources, which
combine to yield an elongated morphology, centered on the galaxy. The position angle of the
elongation is ,,- 72 deg and these sources are aligned roughly along the direction of the minor axis
of the gala.,:3', in the ASCA image, this elongation is not clearly seen because of limited photon
statistics and spatial resolution.
Since NGC 4192 is very dim and its exposure time was shorter than those of other objects, we
fitted the one-dimensional projection of the SIS images, as in the case of NGC 404, to measure the
X-ray fluxes; the projection was made with a width of 3f2 along the nucleus and the serendipitous
source (source 3 in Table 3). We fitted the resulting profile with a constant background plus two
PSFs centered at the position of the galaxy nucleus and source 3. The free parameters in the fit
are the normalization of each PSF and the background level. The fit of the projected profiles
in the 0.5-2 keV and 2-10 keV bands yielded X-ray fluxes of 5.7 x 10 -14 ergs s-1 cm -2 and
1.1 x 10 -13 ergs s -1 cm -2, respectively, for an assumed power-law spectrum with r = 1.7 (see {i
4). At an adopted distance of 16.8 Mpc (Tully 1988). these fluxes correspond to the luminosities
of L(0.5-2 ke\:) = 1.9 x 1039 ergs s -1 and L(2--10 ke\:) = 3.8 x 1039 ergs s -1. The significance of
the detection is 9.6a and 6.7a in the 0.5-2 keV and 2-10 keV bands, respectively.

3.4. NGC 4457
NGC 4457wasdetectedin both the SISand GISimages.Contourmapsof GISimagesinthe 0.5-2keVand 2-7 keV bands are shown in Figure le and if. Serendipitous sources are also
detected in the GIS field of view, and their positions are summarized in Table 3. The brightest
one, located at (a, _)J2o00 = (12 h 29 TM 47 s, 3 ° 35' 32"), is plausibly identified with the Virgo cluster
galaxy VCC 1208 [(a, _)J2ooo = (12 h 29 TM 39.2 _, 3 ° 36' 43")].
We fitted the radial profiles of the SIS images in the 0.5-2 keY and 2-7 keV bands using the
same procedure as in NGC 4111. The PSF fits gave X 2 values of 26.9 and 15.3, respective]y, for
11 degrees of freedom. The results of the Gaussian fits are shown in Table 4. The image in the
hard band is consistent with being pointlike, but the upper limit on a is large (a < 1.8 arcmin).
Although the lower boundary of the Gaussian a for the soft-band image fit is greater than zero,
this result cannot rule out the possibility that the soft X-ray source is pointlike, since it is possible
that Gaussian fits to a point source results in nonzero a ( < 0_2) (Ptak 1997). The best-fit profileis shown in Figure 2.
3.5. NGC 4569
NGC 4569 was detected in both the SIS and GIS images, and a few serendipitous sources
were found in the GIS field of view. The GIS images in the 0.5-2 keV and 2-7 keV bands are
shown in Figures lg and lh. The position of the brightest source [(a, 5)J2oo0 = (12 h 37 TM 34 s, 13°
18' 47")] coincides closely with that of the QSO Q1235+1335 [(a,, 5)J2o00 = (12 h 37 TM 33.6 s, 13° 19'
6(_6); z=0.15]. Diffuse emission from the hot gas in the Virgo cluster is also seen in the soft-band
image. NGC 4569 is separated from M87 by 2.1 degrees, and the cluster emission at this angular
distance has been detected in a ROSAT PSPC image by BShringer et al. (1994).
We compared the radial profiles of the SIS images in the 0.5-2 keV and 2-7 keV bands with
those of the PSF and found that the SIS images are clearly extended in both energy bands. The
PSF fits yielded X 2 = 37.2 and 30.7 for 11 degrees of freedom, respectively. The best-fit a for the
Gaussian model is shown in Table 4, and the profiles are shown in Figure 2. The )2 improved
significantly in this model for one additional parameter (A)i 2 = 22 and 24 for the 0.5-2 keV and
2-7 keV images, respectively). The profile in the 2-7 keV band is well fitted by a Gaussian with
cr = 1(6. On the other hand, the residuals of the fit in the 0.5-2 keV band suggest the presence
of a compact source at the center in addition to the emission extended over arcminute scales.
These two components can be identified with the unresolved emission seen in a ROSAT HRI
image (Colbert &" Mushotzky 1999) and the extended emission detected in a ROSAT PSPC image
(Junkes & Hensler ]996).

4. X-ray spectra
Wefitted the X-ray spectraof NGC4111,4117,4457,and 4569.Thespectrawereextractedusinga circular regioncenteredon the nucleuswith a radiusof 3_-4Pwhichis consistentwith thesizesof objects.Therewereno confusing sources within the extraction radius. Background spectra
were extracted from a source-free region in the same field. Tile spectra from the two SIS detectors
(SIS0 and SIS1) were combined, as were those from the two GIS detectors (GIS2 and G1S3). Then
we fitted the SIS and GIS spectra simultaneously. The Galactic hydrogen column densities used
in the spectral fits are derived from the H I observations by Dickey & Lockman (1990). Since
NGC 4192 is too faint for a detailed spectral analysis, we estimated its spectral shape using the
hardness ratio, defined to be the photon flux ratio between the 2-10 keV and 0.5-2 keV bands.
4.1. NGC 4111, NGC 4457, and NGC 4569
The X-ray spectra of NGC 4111, NGC 4457 and NGC 4569 cannot be fitted with a
single-component model. We tried a power-law model and a thermal bremsstrahlung model. The
absorption column density of the matter along the line of sight was treated as a free parameter.
We obtained unacceptable fits (Table 5). Since the value of the obtained reduced X2 is large (> 2),
errors are not shown for spectral parameters in Table 5. A bump is seen around 0.8-0.9 keV in
all the spectra, which can be identified with the Fe L line complex. This feature suggests the
presence of a thermal plasma with a temperature of ,_ 0.7 keV. A Raymond-Smith (hereafter RS;
Raymond & Smith 1977) thermal plasma model also failed to give an adequate fit, and significant
positive residuals were seen above _ 1.5 keV. This indicates the presence of a hard component in
addition to the soft thermal emission. Accordingly, we fitted the spectra with a two-component
model which consists of a soft thermal component and a hard component. We used the RS plasma
to represent the soft thermal component and a power-law or thermal bremsstrahlung contribution
as the hard component. We assumed a Galactic value for the absorption column density of the RS
component. The abundances were fixed at 0.1 of the solar value since it would otherwise not be
well constrained from the data; adopting other values (0.3 and 0.5 solar) gave similar results within
the errors. The absorption column density for the hard component is treated as free parameter.
Table 5 summarizes the results of the fitting. The two-component model reproduces well the
observed spectra, and both a power law and a thermal bremsstrahlung model yield similarly good
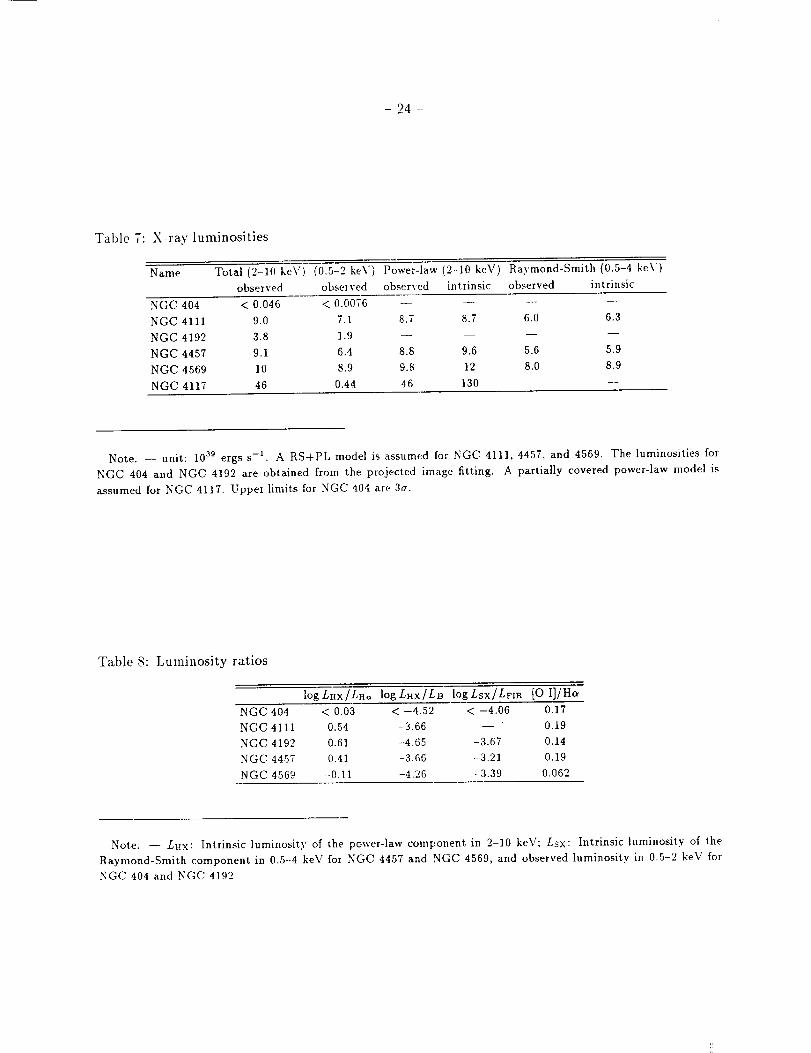
fits. The observed spectra and the best-fit RS plus power-law models are shown in Figure 3, and
Table 7 lists the derived X-ray luminosities. The RS plus thermal bremsstrahlung model gives
very similar luminosities.
It is worth noting that the temperatures of the thermal bremsstrahlung component in NGC
4111 and NGC 4457 are not well constrained, and only lower limits of the telnperature are
obtained. Additionally, if the abundance of the RS component were allowed to vary. only NG('
4111 gives a constrained value (0.006-1.0 solar). We could set only a lower limit of the abundance

for NGC4457(>0.001solar)andNGC4569(>0.05solar).
The X-rayfluxesobtainedfromSISandGISareconsistentwith eachother,within theerrors,for NGC4111andNGC 4457.In the caseof NGC 4569,the SISand GISfluxesdiffer at the levelof 20%-50%;the SISgives,,_ 20% smaller flux in the soft band below 2 keV, while its flux in
hard band above 2 keV is ,,_ 50% larger. This discrepancy is possibly due to the diffuse emission
in the NGC 4569 field and to the different background extract regions. In the spectra of NGC
4569, negative residuals are seen around 1.2 keV. This may be also due to imperfect subtraction of
surrounding diffuse emission, since the temperature of the Virgo intracluster gas in this region is
-,- 2.5 keV, and both the Fe L line complex and the He-like Mg line are expected around an energy
of 1.1-1.3 keV (BShringer et al. 1994; Matsumoto 1998). Because the SIS and GIS each has a
different spatial resolution and field of view, we cannot perfectly match the source-free region used
for background subtraction. Therefore, we regard this discrepancy (up to 50%) as a systematic
error inherent in the derive X-ray fluxes and luminosities of NGC 4569. The typical errors for the
fluxes and luminosities of NGC 4111 and NGC 4457 are ,,-25% (this value does not include the
calibration uncertainty of -,_10%).
4.2. NGC 4192
Since NGC 4192 is very faint, we estimated its spectral slope using a hardness ratio, f(2-10
keV)/f(0.5-2 keV). The photon flux in each energy band was calculated from the fits of the
projected image described in § 3.3. We obtained a hardness ratio of 0.48 4- 0.09 (la errors). If we
assume a spectral shape of a power law absorbed by the Galactic hydrogen column density in the
direction of this galaxy (NH = 2.7 x 10 20 cm-2), this hardness ratio corresponds to P = ,.",,,+0.1¢a_U-o.16
( la errors).
4.3. NGC 4117
For completeness, we mention the results of the spectral analysis for NGC 4117, a low-
luminosity Seyfert 2 galaxy serendipitously observed in the GIS field of NGC 4111. It is of great
inlerest to compare the spectral properties of LINER 2s with low-luminosity Seyfert 2s. The G1S
spectrum of NGC 4117 is shown in Figure 4. It is clear that the soft X-rays are significantly
absorbed by a large column density. We fitted the spectrum with an absorbed power-law model.
= 2 R+l'6 10 23The best-fit parameters are: F "._"-0.slno,)+1.16 and NH = ._-1.o x cm -2. Since small positive
residuals are seen below 2 keV, we also tried to add a power-law component with little absorption.
We assumed that the photon indices of both power laws are the same (equivalent to a partially
covered power-law model) and that the absorption column for the less absorbed power-law
component is equal to the Galactic value (NH = 1.4 x 1020 cm-2). In this model, \2 improved
by only A), 2 = -2.5, and the resulting best-fit model parameters, ms sumlnarized in Table 6, are

-10-
F = 1 11+0.97 and ,¥H q ¢_+0.9 1023.... 1.01 ..... 1.1 x cm -2. The X-ray luminosities for this model are shown
in Table 7, where we adopt a distance of 17 Mpc (Tully 1988). The intrinsic X-ray luminosity of
1.3 × 1041 ergs s -1 is one of the lowest values ever observed for Seyfert 2 galaxies in the hard X-ray
band.
We added a narrow Gaussian to the above models to constrain the Fe K fluorescent line. No
significant improvement of )2 was obtained. The upper limits of the equivalent width are 150 and
125 eV for the single power-law model and the partially covered power-law model, respectively.
The observed X-ray spectrum obscured by large column density (NH > 1023 cm -2) is quite
similar to more luminous Seyfert 2 galaxies. The obtained best-fit photon index is fiat (0.9-1.1),
although the error is large. It is flatter than the canonical value in Seyfert 1 galaxies (e.g. Nandra
et al. 1997) and such an apparently flat spectral slope is often observed in Seyfert 2 galaxies
(Awaki et al. 1991a; Smith & Done 1996; Turner et al. 1997a). Seyfert 2 galaxies usually show
fluorescent Fe K emission line. Although the upper limit on the equivalent width is slightly smaller
than that expected from cold matter of NH = 3 x 1023 cm -2 along the line of sight (150-200 eV;
Awaki et al. 1991a; Leahy & Creighton 1993; Ghisellini, Haardt. & Matt 1994), it is consistent
with Seyfert 2 galaxies within the scatter in the plot of equivalent width versus absorption column
density (Fig 1 in Turner et al. 1997b). Therefore, we found no clear difference between luminous
Seyfert 2 galaxies and the low luminosity Seyfert 2 NGC 4117.
5. Discussion
5.1. Hard Component
We have detected hard X-ray emission from all the objects except for NGC 404. The hard
X-ray (2-7 keV) images of NGC 4111 and NGC 4569 are clearly extended on scales of several
kpc, an indication that a nonstellar, active nucleus is not the primary source of the hard X-ray
emission. This is also consistent with the lack of time variability.
Other lines of evidence suggest that at least some of these galaxies have experienced recent
star formation. The UV spectra of NGC 404 and NGC 4569, for example, show unambiguous
stellar absorption lines arising from young, massive stars (Maoz et al. 1998). Starburst galaxies are
also a source of hard X-rays, and their X-ray spectra can be modeled as thermal bremsstrahlung
emission with a temperature of several keV (e.g., Moran & Lehnert 1997; Ptak et al. 1997; Persic
et al. 1998). However, the morphologies of the hard X-ray emission in starburst galaxies tend to
be either pointlike or only slightly extended (Tsuru et al. 1997; Cappi et al. 1999), significantly
more compact than observed in our sample. It appears, therefore, that hard X-ray emission
associated with starburst activity does not significantly contribute to the emission observed in the
objects in our sample, although this conclusion remains at the moment tentative because only a
small number of starburst galaxies have been studied in the hard X-rays. Note that the extended

-11-
hard X-ray emissionin the starburstgalaxyM83 is interpretedasdueto a collectionof X-raybinariesin its bulge(Okada,Mitsuda,/¢ Dotani 1997).
In normalspiralgalaxies,X-rayemissioncomesmainly from discretesourcessuchaslow-massX-ray binaries(Fabbiano1989:Makishimaet al. 1989).The X-ray sizeof NGC4111and NGC4569in the hard bandis similar to the opticalsize. The upper limit on the X-ray sizeof NGC,1457is alsoconsistentwith its optical size. The extended hard-band images of the above objects
are consistent with a discrete source origin. Their X-ray spectra, approximated by a thernlal
bremsstrahlung model with a temperature of several ke\', are as expected from a collection of
low-mass X-ray binaries (Makishima et al. 1989). The X-ray luminosities of normal spiral galaxies
are roughly proportional to the their optical (B band) light (Fabbiano 1989). Table 8 gives the
Lx/LB values for the galaxies in our sample; taking into consideration the scatter in the Lx-LB
relation, these values agree with those seen in normal galaxies. We conclude that the origin of the
extended hard X-ray emission in our sample probably arises from a collection of discrete X-ray
sources in the host galaxy, and we find no clear evidence for the presence of an AGN.
Note. however, that our data do not rule out the presence of an AGN. If present, the nonstellar
X-ray luminosity in the 2-10 keV band must be significantly smaller than few x 1039 ergs s -1. In
the case that an AGN core is heavily obscured by a large column density of NH > 1024 cm -2, then
we expect only to see X-ray emission scattered by a warm and/or cold reflector. If the scattering
fraction is ,_3% (Turner et al. 1997b; Awaki, Ueno, & Taniguchi 1999), an upper limit on the
intrinsic luminosity is estimated to be ,-_ 1041 ergs s -1. Recent BeppoSAX observations have shown
that several X-ray weak Seyfert 2s are highly obscured by Compton-thick matter (Maiolino et al.
1998). Such a situation could also occur in LINER 2s. If a heavily obscured AGN is present, a
strong Fe K emission line at 6.4 keV is expected with an equivalent width larger than 1 keV (e.g.,
Terashima et al. 1998b). Unfortunately, this hypothesis cannot be tested with our data because
the limited photon statistics do not permit us to set stringent upper limits on the equivalent width
of the Fe K line (typical upper limits of the equivalent widths are ,,_ 2 keV). We will be able to
address this issue with future high-energy observations on missions that have larger effective areas,
such as XMM and ASTRO-E, and that have much finer spatial resolution, such as Chandra.
ttecent work on massive black holes in (nearly) normal galaxies have shown that the mass
of the central black hole is about 1/100 to 1/1000 of the mass of the bulge (e.g., Magorrian et
a l. 1998). Using this black hole mass - bulge mass correlation and our upper limits on X-ray
luminosities of AGN, we can estimate upper limits of the Eddington ratio of the accretion onto
massive black holes in the galaxies in our sample. We calculated the black hole mass using the
relations 3IBH = 0.005Mbulg_ and Mbulge = 5 X 10⁹_l®(Lbulge/lOOL®) L2 (Richstone et al. 1998
and references therein).
We used the upper limits on the X-ray luminosities in the 2-10 keV band, of 1.5 x 10 39 ergss -1 for NGC 404 and 1 x 1041 ergs s -1 for the others, and assumed a bolometric correction of a
factor of 10 and a scattering fl'action of,-_ 3%. The bulge luminosities are calculated by using lhe

- 12-
data in Table11in Hoet at. 1997a.Weobtainedupperlimits on the Eddingtonratios in therangeof (1- 5) x 10-s. Thuswefoundthat massaccretionis taking placewith very low accretionrate or at very lowefficiencyif supermassiveblack holesarepresentin thesegalaxies,as is illmostgalaxies.
5.2. Soft Component
In NGC4111,NGC 4457,and NGC4569wedetectedsoft X-ray emissionthat canberepresentedby a Raymond-Smiththermalplasmawith kT ,._ 0.65 keV. Extended hot gas with a
temperature kT < I keV is generally observed in starburst galaxies, and it is interpreted as due
to gas shock heated by the collective action of supernovae (e.g., Dahlem, Weaver, & Heckman
1998). The X-ray luminosity of the hot gas component is roughly proportional to the far-infrared
(FIR) luminosity: log Lx/LFIR ,'_ -4 (Heckman, Armus, & Milley 1990; David, Forman, &
Jones 1992). We calculated the Lx/LFIR ratios for the galaxies in our sample in order to test
the starburst origin of the soft thermal component. We use the X-ray luminosities of the RS
component corrected for absorption in the 0.5-4 keV band, and LFI R is calculated from the flux
1.26 x 10⁻¹⁴(2.58S60 + $100) W m -2, where $60 and $100 are the flux densities at 60 pm and 100
#m, respectively, in units of janskys (Table 1; see Ho et al. 1997a for details). We used observed
total luminosities in the 0.5-2 keV band for NGC 404 and NGC 4192, since we cannot separate
the thermal component from the total emission. Relations between soft X-ray luminosities and
far infrared luminosities are plotted in Figure 5, where Soft X-ray luminosities are only for a
Raymond-Smith plasma component except for NGC 404 and NGC 4192. We compiled X-ray
luminosities of the soft thermal component in X-ray bright starburst galaxies in ASCA archives
(for detailed results, see Okada et al. 1996; Ptak et al. 1997; Dahlem, Weaver, & Heckman 1998:
Ptak et al. 1999; Della Ceca et al. 1999; Zenzas et at. 1999; Heckman et at. 1999; Moran, Lehnert.
& Helfand 1999). We fitted their ASCA spectra with a model consisting of a RS plasma plus a
thermal bremsstrahlung and measured intrinsic (absorption corrected) X-ray luminosities of the
RS component. These points are also shown in Figure 5. The log Lx/LFIIa values (Table 8 and
Figure 5) distribute around a value of --_-3.5 - -4, which is consistent, within the scatter, with
what is seen in starburst galaxies. With AS'CA spatial resolution we can only say that the X-ray
size is roughly the same as the optical size, consistent with that indicated by higher resolution
ROSAT data for starburst galaxies.
The radial profile of the soft X-ray image of NGC 4569 indicates the presence of a compa.ct
nuclear component in addition to the extended component (a > Y). A comparison between
the radial profiles in the soft and hard bands suggests that the compact component has a soft
spectrum which could be identified with an unresolved source seen in the ROSAT HRI image of
Colbert & Mushotzky (1999). A compact but resolved nuclear source is detected in a UV image
of NGC 4569 taken with HST (Barth et at. 1998), and absorption features in its UV spectrum
indicate _hat the UV source is a cluster of hot stars (Maoz et al. 1998). The X-ray spectra

- 13-
of O-typestarscanbemodeledby a thermalplasmawith a temperatureof kT -_ 1 keV (e.g.,
Corcoran et al. 1994; Kitamoto & Mukai 1996). Since individual O stars have X-ray luminosities
of 1032 - 1033 ergs s -1 (e.g., Rosner, Golub, & Vaiana 1985), about 10 r O stars would be required
to explain the X-ray source at the nucleus detected in the ROSAT HRI image and in the ASCA
soft-band image. This number, however, is too large compared to the number of 0 stars needed
to explain the observed Ha luminosity and the strength of the UV continuum (<1000; Maoz
1999). Moreover. we can rule out the possibility of such a giant cluster of 0 stars from dynamical
constraints. A cluster of 107 05 stars, each ,_40 M®, would amount to a total mass of 4 x l0 s Mq_.
Even under the unreasonable assumption that stars of lower masses are absent, this mass strongly
violates the dynamical mass limit of the nucleus, which has been estimated to be < 106 - 10; Ms_
by Keel (1996). Therefore, we conclude that the hot star contribution to the observed soft X-ray
luminosity is minor. This argument also applies to all the objects in our sample, except for NGC
404, for which only an upper limit of X-ray luminosity is available.
Finally, we note that scattered light from a hidden AGN is unlikely to be the source of the
soft X-ray emission. If AGN emission is blocked by a large column density along the line of
sight, only emission scattered by cold and/or warm material would be observed. If we fit the
X-ray spectra below 2 keV with a simple power-law model, the photon indices become steeper
than 3 for NGC 4111, NGC 4457, and NGC 4569. This spectral slope is significantly steeper
than normally seen in Seyfert 2s, where scattering by warm material is thought to prevail. Cold
reflection produces an X-ray spectrum that is flatter than the intrinsic spectrum. Additionally, the
extended morphologies of the soft X-ray emission makes it unlikely that the photoionized medium
can be maintained at a highly ionized state. Thus the soft component probably does not originate
from scattered AGN emission. Instead, the most likely origin for the soft thermal component is
supernovae-heated hot gas.
5.3. Ionization Photon Budget
We have found no clear evidence for the presence of an AGN in the galaxies in our sample. In
order to compare the ionization source in LINER 2s and transition objects with those of LINER
ls and low-luminosity Seyfert galaxies, we calculated Lx(2-10 keV)/LH_ ratios (Table 8). where
we used the luminosities of the narrow component of the Ha. emission. The Lx/LHo values of the
galaxies in our sample are systematically lower, by more than one order of magnitude, compared
to LINER ls and low-luminosity Seyferts (Terashima 1999; Terashima et al. 1999), objects where
LLAGNs are almost certainly present. The mean log Lx/LHo is 1.6 for LLAGNs, while thelog Lx/LHo values for our sample are smaller than 0.61.
We estimate the number of ionizing photons needed to account for the observed Ha
luminosities, assuming a spectral energy distribution of f, cx t, -1, which is the typical spectral
shape between the UV and X-rays observed in LLAGNs (Ho 1999b), Case B recombination
(Osterbrock 1989), and a covering factor of unity for the ionized gas. A value of log Lx/LH_

- 1,1 --
= 1.4 is sufficient to explain the Ha luminosity by photoionization by an AGN. The observed
log Lx/LHo values, on the other hand. are significantly lower than this. If the AGN is nol
significantly obscured, its luminosity in the 2-10 keV band is estimated to be less than a few ×
1039 ergs s -1. In this case. photons from an AGN account for only a very small fraction (--_5%)
of the observed Ha luminosity. If Ha is due to ionization by an AGN. one would then have to
postulate that tile AGN is heavily obscured with a column density greater than ,-_ 1024 cm -2 and
that only scattered radiation is observable. Alternatively, an ionizing source other than an AGN
is required.
As discussed in the next subsection, galaxies in our sample have lower [OI])_6300/Ha values
than LINERs that are most likely to be AGN. If the low [O I]/Ha ratio is due to dilution by H II
regions, which produce strong Balmer lines and very weak [OI], the difference in Lx/LH_ between
the two classes is reduced. Since the median of the [OI]/Ha ratio for the LINER 2s is about a
factor of 3 smaller than that for the LINER ls with LLAGNs, the Ha emission tracing the AGN
would be 1/3 of the total measured value. Even in this case, however, the observed hard X-ray
luminosities are not enough to drive the Ha luminosities.
5.4. Optical Emission Line Ratios and Ionizing Source
Our sample includes three LINERs (NGC 404, NGC 4111, and NGC 4457) and two transition
objects (NGC 4192 and NGC 4569). By the definition of Ho et al. (1993, 1997a), transition
objects have a smaller [0 I] A6300/Ha ratio than LINERs (Table 8; data from Ho et al. 19973).
This class of emission-line nuclei has been postulated to be composite systems where a LINER
nucleus is spatially contaminated by circumnuclear star-forming regions (Ho et al. 1993; Ho 1996).
On the other hand, photoionization by hot stars in environments with ionization parameters
characteristically lower than in "normal;' giant extragalactic H II regions also generates the
spectral properties of transition objects (Filippenko, g¢ Terlevich 1992; Shields 1992). The presence
of hot stars is seen directly in the UV spectrum of NGC 4569 (Maoz et al. 1998); these stars can
provide the power to explain the observed emission-line luminosities if very massive stars are still
present. The low X-ray output of these systems, as found in this study, lends further support
for this conclusion. Thus, at least some transition objects are likely to be powered by hot stars.
The nucleus of NGC 4192. however, is not detected in the UV band, possibly because of the large
extinction due to the high inclination of the galaxy (83°; Barth et al. 1998). The X-ray properties
and optical emission-line ratios of NGC 4192 are similar to those of NGC 4569, and it, too. might
be primarily powered by hot stars.
We compared the [0 I]/Ha ratios of the LINERs in our sample with those of LINERs from
which AGN-like X-ray emission has been detected. The [O I]/Hc_ ratios for NGC 404. NGC 4111.
and NGC 4457 (Table 8) are lower than in LINERs that are strong LLAGN candidates, and they
are located at the lowest end of the distribution of [O I]/Ha in LINERs (Fig. 7 in Ho et al. 19973).
For comparison, the [O I]/go values for the few LINERs where compact hard X-ray emission

- 15-
hasbeendetectedare0.71(NGC 1052),0.53(NGC 3998),1.22(NGC4203),0.48(NGC 4579),0.18(NGC 4594),and0.24(NGC 4736).3 It is intriguing that the HST UV spectrum of NGC
404 Mso shows strong evidence for the presence of energetically significant hot stars (Maoz et al.
1998); no UV spectral information is available for NGC 4111 and NGC 4457. It is conceivable
that the subset of LINERs with exceptionally weak [O I] emission owe their primary excitation
mechanism to stellar photoionization. Obviously more observations are necessary to settle this
issue. A statistical study using a large sample of objects will be presented elsewhere.
6. Summary
We presented ASCA results for a small sample of LINERs (NGC 404, NGC 4111, and NGC
4457) and transition objects (NGC 4192 and NGC 4569). X-ray emission was detected in all
objects except NGC 404. The X-ray luminosities in the 2-10 keV band range from 4 x 10 39 to
1 X 10⁴o ergs s -1. The images of NGC 4111 and NGC 4569 are extended on scales of several kpc
in both the soft (<2 keV) and hard (>2 keV) energy bands. The X-ray spectra of NGC 4111,
NGC 4457, and NGC 4569 are well represented by a two-component model consisting of a soft
thermal plasma of kT ,.., 0.65 keV plus a hard component (power law or thermal bremsstrahlung).
The soft X-ray emission probably originates from hot gas produced via recent star formation
activity because both the temperature of the gas and the Lx/LFIR ratios are typical of starburst
galaxies. The extended morphology of the hard X-ray emission indicates that it mainly comes
from discrete sources in the host galaxies, and that the AGN contribution is small, if any. The
Lx(2-10 ke\Z)/LHo values for the galaxies in our sample are more than one order of magnitude
smaller than in LINERs with bona fide LLAGNs (those with a detectable broad Ha emission
line and compact hard X-ray emission), and the X-ray luminosities are insufficient for driving the
optical emission-line luminosities. These facts imply that, if an AGN is present, it would have to
be heavily obscured with a column density much greater than NH -_ 1023 cm -2. We suggest that
the optical emission lines in the galaxies in our sample are mainly powered by photoionization by
hot, young stars rather than by an AGN. This hypothesis is supported by the detection of stellar
features due to massive stars in the UV spectra of NGC 404 and NGC 4569, by the systematically
lower [0 I]/Ho ratios in these objects compared to LINERs with bona fide LLAGNs. and by the
low observed X-ray luminosities reported in this work.
We also analyzed the X-ray properties of NGC 4117, a low-luminosity Seyfert 2 galaxy
serendipitously observed in the field of NGC 4111, and found its properties to be consistent with
other Seyfert 2 galaxies with moderate absorbing columns.
3The X-ray results for these objects are published in Weaver et al. (1999), Guainazzi, & Antonelli (1999), Awaki
e_ al. (1991b), Iyomoto et al. (1998), Terashima et al. (1998a), Nicholson et al. (1998). and Roberts et al. (1999).

- 16-
The authors are grateful to all the ASCA team members. We also thank an anonymous referee
for useful comments. YT thanks JSPS for support. LCH acknowledges partial financial support
from NASA grants GO-06837.01-95A, GO-07357.02-96A, and AR-07527.02-96A, which have been
awarded by the Space Telescope Science Institute (operated by AURA, Inc., under NASA conlract
NAS5-26555). We made use of the NASA/IPAC Extragalactic Database (NED) which is operated
by the Jet Propulsion Laboratory, California Institute of Technology, under contract with NASA.
REFERENCES
Antonucci, R. R. J., & Miller, J. S. 1985, ApJ, 297, 621
Awaki, tt., Koyama, K., Inoue, H., & ttalpern, J. P. 1991a, PAS3,43, 195
Awaki, H., Koyama, K., Kunieda, H., Takano, S., Tawara, Y., & Ohashi, T. 1991b, ApJ, 366, 88
Awaki, H., Ueno, S., & Taniguchi, Y. 1999, in The 32nd COSPAR Meeting, Broad band X-ray
Spectra of Cosmic Sources, ed. K. Makishima, & L. Piro (Advances in Space Research), in
press
Barth, A. J., Filippenko, A. V., & Moran, E. C. 1999, ApJ, 515, L61
Barth, A. J., Ho, L. C., Filippenko, A. V., & Sargent, W. L. W. 1998, ApJ, 496, 133
Barth. A. J., Reichert, G. A., Filippenko, A. V., Ho, L. C., Shields, J. C., Mushotzky, R. F.,
Puchnarewicz, E. M. 1996, AJ, 112, 1829
Barth, A. J., Reichert, G. A., Ho, L. C., Shields, J. C., Filippenko, A. V., & Puchnarewicz, E. M.
1997, AJ, 114, 2313
BShringer, H., Briel, U. G., Schwarz, R. A., Voges, W., Hartner, G., & Triimper, T. 1994, Nature,
368, 828
Burke, B. E., Mountain, R. W., Daniels, P. J., & Dolat, V. S. 1994, IEEE Trans. NS-41,375
Cappi. M., et al. 1999, in The 32nd COSPAR Meeting, The AGN-Galaxy Connection, ed. H. R.
Schmitt. A. L. Kinney, & L. C. Ho (Advances in Space Research), 23,905
Colbert. E. J. M., & Mushotzky, R. F. 1999, ApJ, 519, 89
Corcoran, M. F., et M. 1994, ApJ, 436, L95
Dahlem. M., Weaver, K. A., & Heckman. T. M. 1998, ApJS, 118,401
Della Ceca. R.. Griffiths, R. E., Heckman, T. M., Lehnert, M. D., & Weaver, K. A. 1999. ApJ.
514, 772

-17-
Dickey, J. M., & Lockman, F. J. 1990, ARA&A, 28,215
Dopita, M. A., & Sutherland, R. S. 1995, ApJ, 455, 468
Elvis, M., Soltan, A. & Keel, W. C. 1984, ApJ, 283,479
Fabbiano. G. 1989, ARA&A, 27, 87
Filippenko, A. V. 1996, in The Physics of LINERs in \:iew of Recent Observations, ed. M.
Erac]eous et al. (San Francisco: ASP), 17
Filippenko, A. V., & Terlevich, R. 1992, ApJ, 397, L79
Fosbury, R. A. E., Melbold, U., Goss, W. M., & Dopita, M. A. 1978, MNRAS, 183, 549
Ghisellini, G., Haardt, F., & Matt, G. 1994, MNRAS, 267, 743
Guainazzi, M. & Antonelli, L. A. 1999, MNRAS, 304, L15
Halpern, J. P., & Steiner, J. E. 1983, ApJ, 269, L37
Heckman, T. M. 1980, A&A, 87, 152
Heckman, T. M., Armus, L., & Miley, G. K. 1990, ApJS, 74, 833
Heckman, T. M., Armus, L., Weaver, K. A., & Wang, J. 1999, ApJ, 517, 130
Ho, L. C. 1996, in The Physics of LINERs in View of Recent Observations, ed. M. Eracleous et al.
(San Francisco: ASP), 103
Ho, L. C. 1999a, in The 32nd COSPAR Meeting, The AGN-Galaxy Connection, ed. H. R. Schmitt,
A. L. Kinney, & L. C. Ho (Advances in Space Research), 23, 813
Ho, L. C.
Ho, L. C.,
Ho, L. C.,
Ho, L. C.,
Ho, L. C..
Ho, L. C.,
Ho, L. C.,
ltuchra, J.
1999b ApJ, 516, 672
Filippenko, A. V., & Sargent, W. L. W. 1993, ApJ, 417, 63
Filippenko, A. V., & Sargent, W. L. W. 1995, ApJS, 98, 477
Filippenko, A. V., & Sargent, W. L. W. 1996, ApJ, 462, 183
Filippenko. A. V., & Sargent, W. L. W. 1997a, ApJS, 112, 315
Filippenko, A. V., & Sargent. W. L. W. 1999, in preparation
Filippenko, A. V., Sargent, \V. L. W., & Peng, C. Y. 1997b, ApJS, 112,391
P., Wyatt, W. F., & Davis, M. 1982, AJ, 87, 1628
- 18-
Iyomoto,N., Makishima,K., Fukazawa,Y., Tashiro,M., Ishisaki,Y., Nakai,N., & Taniguchi,Y.1996,PASJ,48,231
Iyomoto,N.,Makishima,K., Matsushita,K., Fukazawa,Y., Tashiro,M.. & Ohashi,T. 1998,Ap.I.503.168
Keel,W. C. 1983,ApJS,52,229
Keel,W. C. 1996.PASP,108,917
Koski,A. T., & Osterbrock,D. E. 1976,ApJ, 203,L49
Junkes, N., & Hensler, G. 1996, MPE report 263,459
Kitamoto, S. & Mukai, K. 1996, PASJ, 48,813
Koratkar, A. P., Deustua, S. E., Heckman, T. M., Filippenko, A. V., tto. L. C., & Rao, M. 1995,
ApJ, 440, 132
Lawrence, A., & Elvis, M. 1982, ApJ, 256, 410
Leahy, D., & Creighton, J. 1993, MNRAS, 263, 314
Magorrian, J. et al. 1998, AJ, 115, 2285
Maiolino, R., et al. 1998, A&A, 338,781
Makishima, K., et al. 1989, PASJ, 41,697
Makishima, K., et al. 1996, PASJ, 48, 171
Maoz. D., Filippenko, A. V., Ho, L. C., Macchetto, F. D., Rix, H.-W., & Schneider, D. P. 1996,
ApJS, 107,215
Maoz, D., Filippenko, A. V., Ho, L. C., Rix, H-W., Bahcall, J. N., Schneider, D. P., & Macchetto,
F. D. 1995, ApJ, 440, 91
Maoz, D., Koratkar, A. P., Shields, J. C., Ho, L. C., & Filippenko, A. V. 1998, AJ, 116, 55
Maoz. D. 1999. in The 32rid COSPAR Meeting, The AGN-Galaxy Connection, ed. H. R. Schmitt,
A. L. Kinney, & L. C. Ho (Advances in Space Research), 23. 855
Matsumoto, H. 1998, Ph.D. thesis, Kyoto University
Moran. E. C.. Lehnert, M. D., & Helfand. D. J. 1999, ApJ, in press (astro-ph/9907036)
Nandra K., George I. M., Mushotzky R. F., Turner T. J., Yaqoob T 1997, ApJ 477,602
Nicholson, K. L., Reichert, G. A., Mason. K. O., Puchnarewicz, E. W.. Ho, L. C., Shields, J. C..
& Filippenko, A. V. 1998, MNRAS, 300,893

- 19-
Ohashi,T., et al. 1996,PASJ,48,157
Okada,K., Mitsuda,K., & Dotani,T. 1997,PASJ,49,653
Osterbrock,D. E. 1989,Astrophysicsof GaseousNebulaeandActive GalacticNuclei(Mill Valley:Univ.ScienceBooks)
Ptak,A., Serlemitsos,P.,Yaqoob,T., Mushotzky,R., _ Tsuru, T. 1997,AJ, 113,1286
Ptak, A.. Serlemitsos,P. J., Yaqoob,T., & Mushotzky,R. F. 1999,ApJS, 120,179
Ptak,A., Mushotzky,R. F., Yaqoob,T., & Serlemitsos,P. J. 1999,ApJ, submitted
Raymond,J. C. & Smith, B. W. 1977,ApJS,35,419
Richstone,D. et al. 1998,Nature,395,A14
Roberts,T. P.,Warwick,R. S.,& Ohashi,T. 1999,MNRAS,304,52
Rosner,R., Golub,L., & Vaiana,G. S. 1985,ARA&A, 23,413
Serlemitsos,P. J., et al. 1995,PASJ,47, 105
Shields,J. C. 1992,ApJ, 399,L27
Smith,D. A., & Done, C. 1996, MNRAS, 280, 355
Tanaka, Y., Inoue, H., 8c Holt, S. S. 1994, PASJ, 46, L137
Terashima, Y., Kunieda, H.. Misaki, K., Mushotzky, R. F., Ptak, A. F., gz Reichert, G. A. 1998a,ApJ, .503, 212
Terashima, Y., Ptak, A. F., Fujimoto, R., Itoh, M., Kunieda, H., Makishima, K., & Serlemitsos,P. J. 1998b, ApJ, 496, 210
Terashima, Y. 1999, in Proceedings of 3rd INTEGRAL Workshop: The Extreme Universe
(Astrophysical Letters & Communications), in press (astro-ph/9905218)
Terashima. 5"., et al. 1999, in preparation
Terlevich, R.. _: Melnick, J. 1985, MNRAS, 213, 841
Tsuru, T. G., Awaki, H., Koyama, K., & Ptak, A. 1997, PASJ, 49, 649
Tully, R. B. 1988, Nearby Galaxies Catalog (Cambridge: Cambridge Univ. Press)
Turner. T. J., George, I. M., Nandra, K., 8c Mushotzky, t/. F. 1997a, ApJS, 113, 23
Turner, T. J., George, I. M., Nandra, K., & Mushotzky, R. F. 1997b, ApJ, 488, 164

- 20-
Ward,M. 3., Done,C., Fabian,A. C., Tennant,A. F., & Shafer,R. A. 1988,ApJ, 324.767
Weaver,K. A., Wilson,A. S.,Henkel,C., & Braatz,J. A. 1999,ApJ, 520,130
Yamashita,A., et al. 1997,IEEETrans.NS-44,847
Zezas.A. L., Georgantpoulos;I., & Ward,M. 3. 1998, MNRAS, 301,915
This preprint was prepared with the AAS LATEX macros v4.0.

- 21-
Table1: Observedgalaxies
Name Distancea ClassificationlogF(Ho) log L(Ha,) log LFIR log LB
[Mpc] [ergs s-' cm -2] [ergs s-'] [ergs s-'] [L_,]
.N'GC 404 2.4 L2 -13.21 37.63 40.94 8.58
NGC 4111 17.0 L2 -13.14 39.40 -- 10.01
NGC 4192 16.8 T2 -13.56 38.97 43.25 10.64
NGC 4457 17.4 L2 -12.99 39.57 42.98 10.05
NGC 4569 16.8 T2 -12.36b 40.174 b 43.34 10.73
Note. -- a: Tully (1988); b: Keel (1983); Other data are taken from Ho et al. 1997a.
Table 2: Observation log
Name Date SIS mode
NGC 404 1997 Jul 21 1CCD Faint
SIS
count rate exposure
[counts s -1 ] [ksec]
GIS
count rate exposure
[counts s -1 ] [ksec]
12.3 13.41998 Feb 6 1CCD Faint
NGC4111 1997 Dec 7 1CCD Faint LD0.48keV a
1997 Dec 15 1CCD Faint LD0.48keV a
NGC4192 1997 Dec 17 2CCD Faint/Bright
1997 Dec 23 2CCD Faint/Bright
NGC4457 1998 Jun 14-15 ICCD Faint
NGC4569 1997 Jun 24-25 1CCD Faint
1997 Jul 6-7 1CCD Faint
-- 27.2 -- 29.7
0.008 14.4 0.004 15.6
0.008 19.0 0.003 21.2
-- 3.9 -- 4.3
-- 13.3 -- 14.3
0.01 42.1 0.005 44.0
0.03 21.9 0.006 21.0
0.03 19.0 0.007 20.4
Note. -- a: Level discriminator is enabled.
- 22-
Table3: Positionsof serendipitoussources
sourceNo.position(.]2000) IDNGC4041"NGC41110*12NGC41920*
1
2
3
NGC 4457
0*
1
2
3
4
NGC 4569
0*
1
2
3
Ill 9m 28s, 35d 38m 52s
12h 7m 6s, 43d 3m 16s
12h 7m 47s, 43d 6m 53s
12h 8m 16s, 43d 3m 12s
NGC 4111 12h07m03.2s +43d03m55.3s
NGC 4117 12h07m46.1s +43d07m35.0s
12h 13m49s, 14d 53m 47s NGC4192 12h13m48.3s +14d54m01s
12h 13m 5s, 14d 54m 57s
12h 13m 9s, 14d 51m 8s LBQS 1210+1507 12h13m08.0s +14d51m06s
12h 14m 12s, 14d 47m 31s
12h 28m 56s, 3d 34m 15s
12h 28m 17s, 3d 38m 43s
12h 28m 28s, 3d 25m 43s
12h 29m 2s, 3d 38m 14s
12h 29m 47s, 3d 35m 32s
NGC 4457 12h28m59.2s +03d34m16.1s
VCC 1208 12h29m39.2s +03d36m43s
12h36m50s, +13d10m01s
12h36m30s, +13d07m59s
12h36m34s, +12d58m54s
12h37m34s, +13d18m47s
NGC 4569 (12h36m49.8s, +13d09m46s)
Q$O Q1235+1335 (12h37m33.6s, +13d19m6.6s)
Note. -- *: position determined using SIS images. Typical error radius is 1 arcmin.
Table 4: Gaussian fit, to radial profiles
Name Scale 0.5-2 ke\: 2-7 keV
a \2/dof a x2/dof
[kpc/arcmin] [arcmin] [arcmin]
NGC 4111 4.95 0.50(0.27-0.89) 6.6 1.2(0.37-3.3) 9.2
NGC 4457 5.06 0.43(0.15-0.65) 18.2 0.11(0-1.8) 15.3
NGC 4569 4.89 1.4(1.0-1.8) 15.7 1.6(1.0-3.5) 6.54
Note. -- The quoted errors in parentheses are at the 90_: confidence level for one interesting parameter. The
degree of freedom in the fit is 10.

- 23-
Table 5: Results of spectral fits
Name Model NH_ kT b abundance c NH2a photon index ¢ _.2/dof
[1022cm-2] [keV] [solar] [1022cm -2] or kT [keV]
NGC 4111 74.3/24
48.7/24
14.9/22
14.4/22
70.7/27
50.1/27
17.9/25
18.0 t25
NGC 4569 114.0/35
98.o/350.1(f) 56.2/32
0.1(f) 55.0/32
NGC 4457
Brems 0 0.65
PL 0 3.1
RS+Brems 0.014(f) 0 a_ +°12 0.l(f) n a_+ _.3.... o.1,t ..... 049 > 5.0
RS+PL 0.014(f) 0.65+°)1] 0.1(f) 0 +3° 0.9+__:_Brems 0 3.1
PL 0 2.3
RS+Brems O.O18(f) n _+o.12 0 8a+_.2..... oA_ O.l(f) • --o.s4 > 2.8
RS+PL O.O18(f) 0 a_ +°12 O.l(f) 1 1+ 2.7 1 ..:+_,2"v_--0.] C _ "_ --1,1 _ ' _ --0.8
Brems 0 3.9
PL 0 2.O
RS+Brems 0.029(f) 0 a "+°'°9 1 0+ 0.8.... o.a4 .... 0.9 5'4+-_5
RS+PL 0.029(f) n _+o.o9 1 7+_.o 2.2 4- 0.7_'_ ' --0,10 ""---1.1
Note. -- The quoted errors in parentheses are at the 90% confidence level for one interesting parameter. (f)
denotes a frozen parameter. The model components are as follows: PL = power-law with absorption; Brems =
thermal bremsstrahlung with absorption; RS = Raymond-Smith thermal plasma with the Galactic absorption, a.
Galactic foreground absorption column density, b: temperature of the Raymond-Smith component, c: abundance
of the Raymond-Smith component, u: absorption column density of the hard component ¢: photon index of the
power-law component or temperature of the thermal Bremsstrahlung component.
Table 6: Spectral fitting results of NGC 4117
Model Nn Photon index covering fraction x2/dof
[1022cm-2]
Power-law -_-1o_+16 0 ....q°+a0.s_16 21.9/ 17
Partially covered power-law ,, +gb0.014 ,30_11 1 11 +0.97 n onA+ o.0a6 19.4/15.... _--l.O1 _'_'_--0,038
Note. -- (f) denotes a frozen parameter. _: absorption column density of the uncovered (less absorbed) component
dominating the lower energy range, b: absorption column density of the covered component.
- 24 --
Table 7: X-ray luminosities
Name Total (2-10 keV') (0.5-2 ke\:) Power-law (2-10 keV) Raymond-Smith (0.5-4 ke\")
observed observed observed intrinsic observed intrinsic
NGC 404 < 0.046 < 0.0076 .....
NGC 4111 9.0 7.1 8.7 8.7 6.0 6.3
NGC 4192 3.8 1.9 .....
NGC 4457 9.1 6.4 8.8 9.6 5.6 5.9
NGC 4569 10 8.9 9.8 12 8.0 8.9
NGC 4117 46 0.44 46 130 --- --
Note. -- unit: 1039 ergs s -1. A RS+PL model is assumed for NGC 4111, 4457, and 4569. The luminosities for
NGC 404 and NGC 4192 are obtained from the projected image fitting. A partially covered power-law model is
assumed for NGC 4117. Upper limits for NGC 404 are 3a.
Table 8: Luminosity ratios
logLnx/LH,_ logLnx/Lu logLsx/LFIR [O I]/Ha
NGC 404 < 0.03 < -4.52 < -4.06 0.17
NGC 4111 0.54 --3.66 -- 0.19
NGC 4192 0.61 --4.65 -3.67 0.14
NGC 4457 0.41 -3.66 -3.21 0.19
NGC 4569 -0.!1 -4.26 -3.39 0.062
Note. -- Lnx: Intrinsic luminosity of the power-law component in 2-10 ke\;; Lsx: Intrinsic luminosily of the
Raymond-Smith component in 0.5-4 keV for NGC 4457 and NGC 4569, and observed luminosity in 0.5-2 keV for
NGC 404 and NGC 4192

- 25-
c5E)
+35°55 '
b
+35°40 _ ...............% .....................
(a)
1510 r..' 01 h09m30s 1h09m 01 h08m30s
(b)
+t5o00 , ........
C>
o
+14?45' ................
12h14 rr' 12h13m30 s 12513 m
E3
+43o30 - ............................. ....
(c)
+43 °t 5' ...............................
+43000 • .......
,z
,+42°45 ' ........
12J:09rn 12h08 m 12h07 ''_ 12h06 mR.A.
+43o30 , ...............................
(d)
_Ao.,.,...o%:_'......................i...................i...........
+4_Ouu,-^--..................... ....
+42045 ,............... ............... ; ...... !
121_09m 12h08 m 12h07 m 12h06 m
R.A.

- 26-
d0_1:3
(e)+3°50' (_
/ ) _,'
+3o35 , _I. _ ---" "--'_...............
+3o20 '
12h30 :n 12h29 rn 12h28 m
.+3o50, (r)
12_30'" 12h29 m 12h28 m
dC)
+13°30 ' "
+13°t5 '
+13o00 '
QO
o 0 0 k_.,,_ o
+12o45 '
.+13030'_ ....................... (h)
..........#...........°
1+13o00 ....... ,;...... : &_\t "--"_1
- _C3 o
J
o t.÷12 45 ............................. i.............................. Ii
12r'38 m 12h37 m 12h36 rn 12h38 m 12h37 m 12h36 rnR.A. R.A.
Fig. 1.-- (a) SIS image of NGC 404 from 0.5-2 keV, (b) SIS image of NGC 4192 fronl 0.5-7 keV.
(c) GIS image of NGC 4111 from 0.7-2 keV, (d) GIS image of NGC 4111 from 2-10 keV. (_) GIS
image of NGC 4457 from 0.7-2 keV, (.f) GIg image of NGC 4457 from 2-7 keV, (g) GIS image of
NGC 4569 from 0.7-2 keV, (h) GIS image of NGC 4569 from 2--7 keV. The crosses indicate the
optical position of the nucleus taken from the NED. The contours are linearly spaced. The lowest
contour levels are (a)40%, (b) 40%, (c) 25_, (d) 15%, (e) 40%, (f) 45%, (g) 40%, and (h) 45% of
the peak. Background is not subtracted in these images. Sky coordinates are J2000.

?.E 2x]O -3EOI-.
7m i0-32c
OC9
0
-v 1.5O
"_ 12c_ 0.5
0.5-2 keV
I
(a) NCC 4111
- 27-
6xlO -4
4xlO -4
2x10 -4
(b) NGC 4111
--+--
_1
0.5 J , n
?._ 2xlO -3EuLO_
Tm i0-3
C
ou
0
"_ 1.5O
1
0.5
" I ' I '
-+-l
8xI0-4/ ' ' Ir
6xi0-4 If (d) NGC 4457
FR
4x10⁻⁴ II _[_
2x i0-4 _- q-_-4-- .
1
0.5 , ,
7._ 2xlO -3EO
I
10-32
O(9
O
¢0
¢6
I I
(e) NGC 4569J
:H-
o 4- ' I , 1 ,-I1.5
4-1 - - - =..F-z_F_=-r--.--e-.--_---+---_:_3__-4--.- -
0.5 _ I , ] i
0 2 4
Radius (arcmin)
8xlO -4I 1
6xlO -4
4xlO -4
2xlO -4
0
1.5
1
0.5
(f) NGC 4569
. , I , I ,
__-+-,-+-+-+-÷-_-_
L I , I
0 2 4
Radius (arcmin)
Fig. 2.-- Radial surface brightness profiles fitted with a two- dimensional Gaussian convolved
through the PSF + constant model. Solid lines are the best-fit model and dotted lines are the
background level. Dot-dashed lines are the PSF normalized at the innermost data point. (a) NGC
4111, 0.5-2 keV, (b) NGC 4111, 2-7 keV, (c) NGC 4457, 0.5-2 keV, (d) NGC 4457, 2-7 keV, (e)
NGC 4569, 0.5-2 keV, (J) NGC 4569, 2-7 keV.

- 28 -
7:>
7ID
r_
o10 -4
"_" 4v
m 2
© 0
-4
.._ 4- i
I I i I ! ! I I _ I I i ] !i_>
,--
i -I-
____ -I
0.01
10-3
10 -4
4
0
-2
-4
.... i
(b) NGC 4111 GIS
1 i i
i
i
I 1 I I [ I I I I I I I I
...... _b__f____---_-__---t:-:_4_-__
.... I
7>
T
0
v
g_
0.01
10 -s
10-4
4
2
0
-2
-4
_--" ' I .... j
_., , (C) NGC 4457 SIS
i J L
I I I I ; ] I F" I I / I t i
- • _--- .... i
i i i i I __ i _ .... ,-t
0.01
10 -3
10 -4
4
2
0
-2
-4
' ' ' ' I
(d) NGC 4457 GIS
____1 !
i i
...... +_+_+++_t__+_+-]-____- - -
, L , I i i i
T(0
7(#)
o_A
v
,'o
rv
0.01
10 -3
10-4 !
.... +'1 ' ' '
I
, _ ]--] i I [ _ i- I I, I I t t
4_ +, ÷' ,]
0.5 1 2 5 10
Energy (keV)
0.01
10 -3
10 -4
4
2
0
-2
-4
i I I
i
0.5
(f) NGC 4569 GIS
-'t- +
I-- i2- "- -I-_ t=lzI I
i-. 1
iii] i I; I I I I I I
___ -+----l + l + i i i + i + l
1 2 5 10
Energy (keV)
Fig. 3.-- (a) SIS spectrum of NGC 4111, (b) GIS spectrum of NGC 4111, (c) SIS spectrum of
NGC 4457, (d) GIS spectrum of NGC 4457, (e) SIS spectrum of NGC 4569, (f) GIS spectrum
of NGC 4569. Crosses are the observed da.ta and histograms are the best-fit Raymond-Smith +
absorbed power-law model. The Raymond-Smith component is plotted with a dot-dashed line, and
the power-law component is plotted with a dashed line.

- 29-
0.01
7>
10 -3
7
2c 10 .4
0
lo4 20
-2g' -4
r_
NGC 4117 GIS !
0.5 1 2 5 10
Energy (keV)
Fig. 4.-- GIS spectrum of NGC 4117. Crosses are the observed data and histograms are the best-fitabsorbed power-law model.
I
,._3_
0
//
/
J/
//
s/
/
//
11
//
/ + //.4./
/ + I/ // /
/ /
/ + i/
/ • // • /
// + /4
//
i1
//
I I ,
42 44
log
Fig. 5.-- Correlation between soft X-ray luminosity and fir infrared luminosity for type 2 LINERs
(filled circles) and starburst galaxies (crosses). The soft X-ray luminosities are the Raymond-Smith
component of a two component spectral fit to the ASCA data except for NGC 404 and NGC 4192.
Dashed lines correspond to log Lx/LFm = -3 (upper) and - 4 (lower). Starburst galaxy sample
consists of NGC 5236 (M83), NGC 253, NGC 3310, NGC 3034(M82), NGC 2146, NGC 3256, and
NGC 3690 (from left to right in the plot).

Copyright © 2022 FDOKUMEN