Acceleration versus heart rate for estimating energy expenditure and speed during locomotion in...
12
This article appeared in a journal published by Elsevier. The attached copy is furnished to the author for internal non-commercial research and education use, including for instruction at the authors institution and sharing with colleagues. Other uses, including reproduction and distribution, or selling or licensing copies, or posting to personal, institutional or third party websites are prohibited. In most cases authors are permitted to post their version of the article (e.g. in Word or Tex form) to their personal website or institutional repository. Authors requiring further information regarding Elsevier’s archiving and manuscript policies are encouraged to visit: http://www.elsevier.com/copyright
-
Upload
independent -
Category
Documents
-
view
3 -
download
0
Transcript of Acceleration versus heart rate for estimating energy expenditure and speed during locomotion in...

This article appeared in a journal published by Elsevier. The attachedcopy is furnished to the author for internal non-commercial researchand education use, including for instruction at the authors institution
and sharing with colleagues.
Other uses, including reproduction and distribution, or selling orlicensing copies, or posting to personal, institutional or third party
websites are prohibited.
In most cases authors are permitted to post their version of thearticle (e.g. in Word or Tex form) to their personal website orinstitutional repository. Authors requiring further information
regarding Elsevier’s archiving and manuscript policies areencouraged to visit:
http://www.elsevier.com/copyright

Author's personal copy
ZOOLOGYZoology 111 (2008) 231–241
Acceleration versus heart rate for estimating energy expenditure and
speed during locomotion in animals: Tests with an easy model species,
Homo sapiens
Lewis G. Halseya,�,1, Emily L.C. Shepardc, Carl J. Hulstonb, Michelle C. Venablesb,Craig R. Whitea, Asker E. Jeukendrupb, Rory P. Wilsonc
aSchool of Biosciences, Centre for Ornithology, University of Birmingham, Edgbaston B15 2TT, UKbSchool of Sport and Exercise Sciences, University of Birmingham, Edgbaston B15 2TT, UKcSchool of the Environment and Society, Institute of Environmental Sustainability, Swansea University, Singleton Park,
Swansea SA2 8PP, UK
Received 1 June 2007; received in revised form 24 July 2007; accepted 28 July 2007
Abstract
An important element in the measurement of energy budgets of free-living animals is the estimation of energy costsduring locomotion. Using humans as a particularly tractable model species, we conducted treadmill experiments to testthe validity of tri-axial accelerometry loggers, designed for use with animals in the field, to estimate rate of oxygenconsumption (VO2: an indirect measure of metabolic rate) and speed during locomotion. The predictive power ofoverall dynamic body acceleration (ODBA) obtained from loggers attached to different parts of the body wascompared to that of heart rate (fH). When subject identity was included in the statistical analysis, ODBA was a good,though slightly poorer, predictor of VO2 and speed during locomotion on the flat (mean of two-part regressions:R2¼ 0.91 and 0.91, from a logger placed on the neck) and VO2 during gradient walking (single regression: R2
¼ 0.77from a logger placed on the upper back) than was fH (R2
¼ 0.96, 0.94, 0.86, respectively). For locomotion on the flat,ODBA was still a good predictor when subject identity was replaced by subject mass and height (morphometricstypically obtainable from animals in the field; R2
¼ 0.92 and 0.89) and a slightly better overall predictor than fH(R2¼ 0.92 and 0.85). For gradient walking, ODBA predicted VO2 more accurately than before (R2
¼ 0.83) andconsiderably better than did fH (R2
¼ 0.77). ODBA and fH combined were the most powerful predictor of VO2 andspeed during locomotion. However, ODBA alone appears to be a good predictor and suitable for use in the field inparticular, given that accelerometry traces also provide information on the timing, frequency and duration oflocomotion events, and also the gait being used.r 2008 Elsevier GmbH. All rights reserved.
Keywords: Accelerometry; Energetics; Heart rate; Metabolic rate; Oxygen consumption
Introduction
Energy expenditure is perhaps the single mostimportant unifying aspect of animal biology (Brownet al., 2004). All animals must expend energy in order to
ARTICLE IN PRESS
www.elsevier.de/zool
0944-2006/$ - see front matter r 2008 Elsevier GmbH. All rights reserved.
doi:10.1016/j.zool.2007.07.011
�Corresponding author. Tel.: +121 414 3822; fax: +121 414 5925.
E-mail address: [email protected] (L.G. Halsey).1Present address: School of Human and Life Sciences, Roehampton
University, Holybourne Avenue, London SW15 4JD, UK.

Author's personal copy
live, yet judicious energy expenditure, mediated viaphysical (e.g. in locomotion; Alexander, 2002) orbehavioural (e.g. hibernation/torpor; Geiser, 2004) traitsis critical for survival and is thus a primary focus forselection (Tolkamp et al., 2002). Therefore, wheninvestigating the behavioural ecology of animals, it iscrucial that energy turnover and, in particular, theallocation of energy to specific activities, be measured(McNamara and Houston, 1996).
While the doubly labelled water technique (Lifson etal., 1955; Lefebvre, 1964; Speakman, 1998) is routinelyused to measure the energetics of vertebrates in the field,it has drawbacks in being expensive and givinginformation limited to an integrated measure of totalenergy expenditure between two time periods, with nofrequency, intensity or duration information (Estonet al., 1998; Butler et al., 2004). Measurement of heartbeat frequency (hereafter termed ‘heart rate’) has alsobeen used to allude to energy expenditure in terms ofrate of oxygen consumption (VO2). VO2 is an indirectmeasure of metabolic rate that can be converted to rateof energy expenditure, though this requires additionalassumptions concerning the metabolic substrate beingutilised (Walsberg and Hoffman, 2005). Although heartrate (fH) closely reflects changes in the intensity ofphysical activity, the technique inevitably has limita-tions. For example, the relationship between fH and VO2
can vary considerably depending upon emotional state(Blix et al., 1974), levels of mental exertion (Carrollet al., 1986), fitness level (Henderson et al., 1927; Bocket al., 1928) and type of exercise (Vokac et al., 1975;Maas et al., 1989); cf. Hiilloskorpi et al. (1999) and seeButler et al. (2004) for a review of this issue.
An alternative proxy for VO2 is the measurement ofbody motion, pioneered by Cavagna et al. (1963). Inhumans, body acceleration has generally been found tocorrelate well with metabolic rate and energy expendi-ture in the laboratory and the field. However, wheninvestigating locomotion specifically, certain studieshave indicated clear limitations in measures of bodyacceleration to predict VO2, such as during walking onan incline (e.g., Terrier et al., 2001), and complexities inpredicting VO2 when locomotion includes both walkingand running (Brage et al., 2003). However, such studieshave often recorded activity counts rather than rawaccelerometry values and employed loggers that do notmeasure all three axes of accelerometry (e.g., Brageet al., 2005). Nevertheless, body acceleration is some-times a better predictor than other proxies such as fHand pedometry (Meijer et al., 1989; Eston et al., 1998;Johansson et al., 2006). Thus it might be reasonable tosuppose that body acceleration can provide accurateestimates of animal metabolic expenditure duringlocomotion as well. Indeed, in the only study that hasso far tested for a relationship between VO2 and tri-axialbody acceleration (expressed as overall dynamic body
acceleration (ODBA)) in animals, ODBA showed astrong predictive validity for VO2 in great cormorants(Phalacrocorax carbo) walking on a treadmill (Wilsonet al., 2006).
Periods of locomotion can often constitute a note-worthy proportion of the energy expenditure of ananimal (Garland Jr., 1983; Bennett, 1985). Thus beingable to estimate metabolic costs during different speedsof locomotion is important for the development ofanimal energy budgets. Furthermore, the ability toidentify periods of locomotion from accelerometry data,and the speeds of travel during these periods, isnecessary for ascertaining the foraging ranges of animalsand, through a process of dead reckoning (Wilson andWilson, 1988; Wilson et al., 1991), their rangingpatterns. Interpreting periods of locomotion fromaccelerometry data, and the gait used during thatlocomotion, should be relatively straightforward giventhe detailed time budget data that can now be extractedfrom accelerometry devices employed on animals(Tsuda et al., 2006).
Wilson et al. (2006) demonstrated the potential ofODBA to provide estimates of the metabolic costsassociated with different activities of animals in the field.However, appropriate research into the validity andlimitations of the technique in different scenarios isrequired to obtain good estimates of field energyexpenditure (Butler et al., 2004; Halsey et al., 2007).Using human subjects as a model animal enables a highlevel of control over behaviours during experiments. Wesuggest that locomotion in accelerometer-equipped hu-mans at a range of speeds on a treadmill should providevaluable data to assess the validity of the three-axesaccelerometry logger both to predict speed of locomo-tion and the associated metabolic costs. In particular,the change of gait in humans (walking to running) at acertain speed of locomotion, which is a feature mirroredby a number of terrestrial animals (e.g. red kangaroos,Megaleia rufa; Dawson and Taylor, 1973; ostriches,Struthio camelus; Rubenson et al., 2004), is an interest-ing test of the predictive validity of ODBA. Suchcomplexity could potentially reduce the predictiveaccuracy of accelerometry loggers (Herren et al., 1999)and/or increase the complexity of the calibrationequations required. Similarly, walking on a gradientalso represents a potential problem for accelerometry inestimating metabolic costs if the acceleration data donot relate to the degree of incline (Terrier et al., 2001).Finally, variations in logger placement may affect thesignal recorded by the logger (Bouten et al., 1997). It isimportant to examine the variation that logger positionintroduces in the logger signal since wild animals cannotalways be equipped with loggers on body positionswhich may give the best overall accelerometry signal.
The objective of the present study was to test thevalidity of tri-axial accelerometry loggers designed for
ARTICLE IN PRESSL.G. Halsey et al. / Zoology 111 (2008) 231–241232

Author's personal copy
use with animals in the field (Wilson et al., 2006) toestimate metabolic rate (in terms of VO2) and speedspecifically during locomotion in a model species. Thiswas achieved by assessing the accuracy of ODBA,calculated from the logger recordings, in estimating VO2
and speed during walking and running in humans on atreadmill. The specific aims of the study were:
(1) To examine the validity of ODBA to estimate VO2
during walking and running, calculated from datarecorded on the loggers attached to different areas ofthe body.
(2) To test and compare the validity of the ODBA dataobtained from different attachment positions of theloggers to estimate speed of locomotion.
(3) To test and compare the validity of ODBA obtainedfrom different logger attachments to estimate VO2
during walking at varying degrees of incline.(4) In all cases, to compare the predictive power of
ODBA to fH data.
Materials and methods
Nine men and one woman (mean age7SEM: 26.470.7 years), encompassing a range of fitness levels andstatures, participated in the present study. Before thestart of the experiments, the subjects were weighed(73.577.7 kg) and their height was recorded (17872.1 cm). Subjects were free from any known cardiac ormetabolic disorders and were not currently taking anychronic medication. The experimental protocol wasassessed and approved by the Ethics Sub-Committeein the School of Sport and Exercise Sciences at theUniversity of Birmingham. Informed consent wasobtained from all participants before the trials began.
VO2 (mlmin�1), fH and acceleration in all threespatial dimensions were measured while the subjectsundertook two separate trials on a treadmill (HPCosmos, Nussdorf-Traunstein, Germany) at variousspeeds. During the experiments the temperature of theair-conditioned laboratory was 2072 1C and ventilatedat 96 L s�1. Subjects were required to acclimatise totreadmill walking and running prior to the trials. Thefirst trial consisted of walking and running on thetreadmill at a 0.61 angle (defined as locomotion onthe flat). The second trial involved walking at a constantspeed of 5 kmh�1 with step increases in treadmill angle(gradient walking). In the first trial, the subjectexperienced each speed for 3min after which the nextspeed was applied. The slowest speed (3 kmh�1) wasapplied first and was increased by a predeterminedamount (1 kmh�1), which was kept constant acrosssubjects. Speed was increased stepwise in this manneruntil the subject signalled that they wished to stop, or upto a maximum of 13 increases (to 16 kmh�1). In the
second trial, the subject walked at each treadmill anglefor 3min after which the next angle was encountered.An angle of 0.61 was experienced first, this beingincreased by a predetermined amount (1.11) up to amaximum of 8.31. Thus, subjects walked at a maximumof eight different angles.
Data collection
VO2 and rate of carbon dioxide output were measuredusing a gas analyser (Oxycon Pro, Jaeger, Wuerzburg,Germany), incorporating an oxygen paramagneticanalyser and a carbon dioxide infrared analyser. Valueswere initially measured in BPTS and converted to STPDusing the Haldane transformation. The analysis systeminvolved a lightweight, low-resistance mouthpiece fromwhich samples of the expired air were drawn throughtubing at a constant rate and breath by breathmeasurements were continuously monitored, with thesubject wearing a nose clip. Breath by breath dataenabled confirmation that the subject reached steadystate during exercise at each speed or incline. Heart ratewas measured using a fH monitor (Polar S625X, PolarElectro, Kempele, Finland). Acceleration was measuredusing custom-made acceleration data loggers (largestdimensions 65mm� 36mm� 22mm, mass 35 g) thatrecorded tri-axial acceleration (0–6 g) at up to 32Hzwith 22-bit resolution to a 128Mb RA memory. Theseloggers recorded raw values of acceleration resultingfrom the combination of static (gravity-) plus dynamic(motion-induced) acceleration, which is generally notpossible with commercial activity monitors (Terrieret al., 2001). Further details about these loggers areprovided in Wilson et al. (2008). The fH monitor wasattached to the chest of the subject with a strap. Theacceleration data loggers were attached to the front ofthe neck, the upper back (just below and central to theshoulder blades) and to the lower back (the small of theback). The data loggers were fixed to a strap made fromSilastic P1 (a silicone-based rubber; Dow Corning, UK)that was fastened securely around the subject to ensurethat the logger was held firmly and comfortably inposition.
During the trials, means of VO2, fH and measures ofacceleration in three axes were recorded over the finalminute of each stage, i.e. each speed or angle. Thisensured that the data included in analyses representedsteady state (Meijer et al., 1989; Terrier et al., 2001;Achten et al., 2002).
Data analysis
Due to intermittent problems with accelerometry dataloggers, and on occasion with the respiratory analysissystem, data of all types were not collected for all
ARTICLE IN PRESSL.G. Halsey et al. / Zoology 111 (2008) 231–241 233
Author's personal copy
subjects across both trials. Most notably, the smallamount of data obtained from the accelerometer loggerattached around the neck during gradient walkingprecluded them from analysis. In summary, for eitherone or both trials, ODBA was calculated from the neckplacement of the logger for eight individuals, from theupper back placement for seven individuals and for thelower back placement for all 10 individuals. Heart ratedata were obtained for all individuals in both of thetrials.
Downloaded acceleration data from the three axeswere converted from mV into g using calibrations. Fromeach of the three signals, an approximation of g
resulting from only dynamic acceleration was extracted.The derived values were then converted into absolutepositive units and the resultant values from all threechannels were combined to give an overall value for thetri-axial dynamic acceleration experienced by the sub-jects, i.e. ODBA (see Wilson et al., 2006 for furtherdetails).
During both locomotion on the flat and gradewalking, the relationships between VO2, fH and speedwere linear, as has been found previously (Eston et al.,1998; Brage et al., 2005), see also Fig. 1. However,the nature of human locomotion comprises two gaitswith quite different biomechanical and energetic charac-teristics: the walking gait employed for low speeds andthe running gait. This resulted in many of the regres-sions of VO2 or speed against ODBA while the subjectswere on the flat being clearly non-linear (Fig. 2).Furthermore, the distributions of the data, in particularthe ODBA data, were typically bimodal and thus couldnot be transformed to a Gaussian distribution, negatingthe use of standard regression analyses. Appropriatestatistics are, however, crucial to assess the validitywith which ODBA predicts VO2 and speed in humansduring locomotion so we considered the possibility of
regressing two linear lines (i.e. a two-part linearregression) through the data of interest, since the twoportions of data, corresponding to walking and running,both appeared approximately linear (Fig. 3, see alsoBouten et al., 1994). Regression of two such linear linesnecessitates that the two gaits be identifiable in theaccelerometry data so that the appropriate fit can beapplied; inspection of the acceleration data showed thiswas clearly the case (Fig. 2). Even so, the R2 of linearregressions through the full data sets were always high(for example 0.9370.01 when regressing speed againstODBA derived from a collar placement of the logger,for individual subjects). This suggests that even a singlestep approach is useful, particularly given that singleregression equations are simpler for modelling purposesand single regressions of ODBA can be more easilycompared to the single linear regressions of othervariables (e.g. VO2 against fH) or against the samevariables for species with single gaits (e.g. cormorants;Wilson et al., 2006).
For these reasons, we elected to analyse the data ofthe present study primarily using simple linear mixedeffect models despite the apparent non-linearity of somedata (Herren et al., 1999; Brage et al., 2005). We thusapplied single linear equations in all cases, but alsoapplied two-part linear equations to the data sets of flattreadmill exercise where VO2 or speed was regressedagainst ODBA and sufficient data were available; ineach of these cases, visual inspection suggested that atwo-line fit might be suitable. Regressions of VO2
against ODBA during gradient walking, however, werealways linear and thus only single linear regressions wereapplied (Fig. 3). For all the models, second-orderinteractions were included where more than a singlefixed factor was present. Non-significant interactionswere then removed by stepwise backwards elimination,after which non-significant main effects that were notpresent in a significant interaction were also removed.
The relationships between ODBA obtained from thethree logger placements, and also fH, against VO2 orspeed of locomotion are detailed in Table 1. Firstly, eachvariable was regressed separately against VO2 or speed.In each case, a linear mixed effects model was run thatincluded subject identity (ID) as a random factor. Forlocomotion on the flat, each set of ODBA data was thensplit into two portions after inspection of the data foreach subject to locate the clearest break point in thedata, and the two parts were separately regressed againstVO2 or speed. This accounted for the non-linearity inthe relationships between ODBA and VO2 or speedduring walking and running on the flat. The Burnhamand Anderson (2001) approach for model comparisonwas used and Akaike’s information criterion (AIC)generated for each model as a measure of model fit, thisbeing a measure of the goodness of fit of an estimatedmodel and an operational way of trading off the
ARTICLE IN PRESS
60
50
40
30
20
10
00 50 100 150 200 250
fH (beats min-1)
Mas
s sp
ecfic
rate
of o
xyge
n co
nsum
ptio
n(m
l O2 m
in-1
kg-1
)
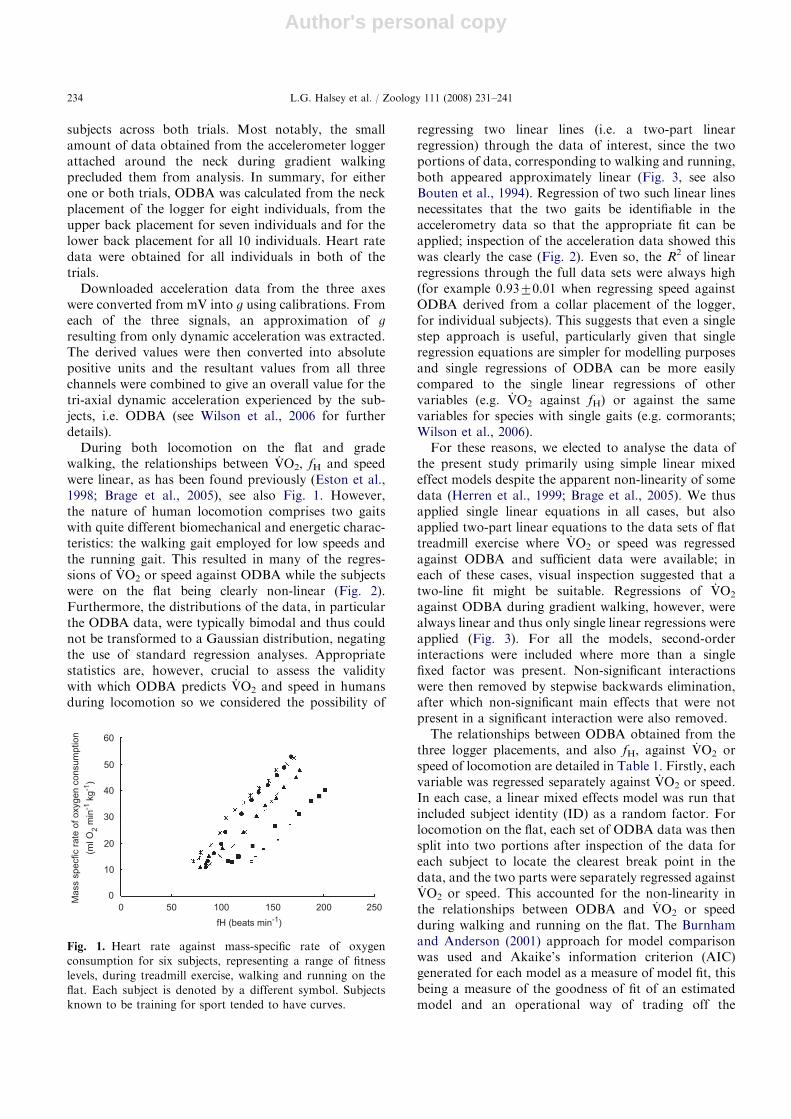
Fig. 1. Heart rate against mass-specific rate of oxygen
consumption for six subjects, representing a range of fitness
levels, during treadmill exercise, walking and running on the
flat. Each subject is denoted by a different symbol. Subjects
known to be training for sport tended to have curves.
L.G. Halsey et al. / Zoology 111 (2008) 231–241234

Author's personal copy
complexity of an estimated model against how well themodel fits the data. The best model has the lowest AIC.Finally, to predict VO2 during locomotion on the flat,speed during locomotion on the flat and VO2 duringgradient walking, a model was run for each case thatincluded both fH and ODBA from the accelerometerlogger location that had the highest AIC.
Akaike weights enable assessment of the probabilitythat a model is the best of the candidate set. For eachcase where ODBA was regressed against VO2 or speedboth in a single regression and as a two-part regression,Akaike weights were calculated to determine whetherthe single-part or two-part regression was the mostsuitable. Akaike weights were also used to compare amodel with only ODBA as an independent, continuousvariable against the relevant model that included bothODBA and fH. Where the interaction term was notsignificant and hence had been removed, the model wassimply a multiple linear regression with a random factorand hence the adjusted R2 is also reported. In thesecases, the adjusted R2 reports how economically theindependent variables explain the variance, with ahigher value thus indicating a better model.
Finally, we investigated the power of ODBA or fH topredict VO2 during locomotion and speed of locomotionin subjects chosen randomly from the population. Ineach of the three cases, the ODBA-based model with thehighest Akaike weight from the candidate set wasadapted to create a model including the variables of
body mass and height, in place of subject ID as arandom factor. Non-significant interactions were re-moved by stepwise backwards elimination. A secondmodel was also generated that included fH, and bodymass and height instead of subject ID (Table 2). Thesemodels tested the predictive power of ODBA or fHduring locomotion when only simple morphometricdata are available for each subject.
Results
The results of the linear mixed effects models run topredict either VO2 or speed during locomotion on a flattreadmill at various speeds, or VO2 during gradientwalking on a treadmill at a single speed are summarisedin Table 1. In each case, either fH and/or ODBA wereregressed against the dependent variable, includingsubject ID as a random factor.
In the two groups of models to describe VO2 andspeed on the flat, fH was a better predictor (higher R2
value) than was ODBA calculated from any of thelogger placements. Also, Akaike weights always stronglyindicated that models including both ODBA and fH aspredictor variables were more suitable to describe thevariation in VO2 or speed of the data collected.Nevertheless, ODBA alone was a good predictor ofVO2 and speed on the flat, and also consistent whencalculated from tri-axial accelerometry data recorded at
ARTICLE IN PRESS
Hea
ve
Time
Walking
Running
0 0.25 0.5 0.75 1 1.25 1.5 1.75 20
2
4
6
8
10
12
14
16
18S
peed
(km
h-1
)
ODBA (g)
Fig. 2. Speed against overall dynamic body acceleration (ODBA) for seven subjects during treadmill exercise, walking and running
on the flat. For each subject (denoted by different symbols), the change of gait between walking and running is clear from a large
change in gain in ODBA. ODBA is calculated from acceleration data recorded on a tri-axial accelerometer attached to the ventral
side of the neck. The inset shows a typical trace of the acceleration recorded in the vertical axis (heave) over time as the subjects
changed gait from walking to running (accompanied by a small increase in treadmill speed).
L.G. Halsey et al. / Zoology 111 (2008) 231–241 235

Author's personal copy
different logger placements (single-part regressions:VO2, 0.91–0.93; Speed, 0.90–0.91). The amount ofvariance predicted in VO2 and speed on the flat usinga single-part regression of ODBA was higher in thepresent study than when ODBA was used to predictVO2 in cormorants (Wilson et al., 2006) (VO2, 0.80;Speed, 0.86, not including values recorded at speed 0).Akaike weights strongly suggested that the two-partregressions were favourable models for regressingODBA against VO2 or speed on the flat.
For the group of models where fH and ODBA wereregressed against VO2 during gradient walking on atreadmill, fH was again a better predictor than wasODBA. The difference was greater for these models,with an R2 of 0.86 for fH while R2 was 0.60 and 0.77 forODBA obtained from loggers placed on the lower backand upper back, respectively. Again, Akaike weightssuggested that the addition of fH to ODBA to predictVO2 represented a considerably better model of thedata.
For each dependent variable, fH was regressed againstthe dependent variable again, but with subject ID as arandom factor replaced by body mass and height ascovariates. The same approach was also taken with
ODBA; ODBA data obtained from the logger positionthat accounted for the greatest amount of variance wastwo-part regressed against the dependent variable again,this time including the covariates of body mass andheight. This approach makes the assumption that eachpairing of VO2 and fH or ODBA are for a differentindividual (Halsey et al., 2007). The R2 values of thesemodels were usually lower but on occasions higher thanthe R2 values of the equivalent models including subjectID. The magnitude of change in R2 was varied (Table 2).Overall though, ODBA was a better predictor of VO2
and speed when body mass and height were included ascovariates than was fH.
Discussion
ODBA calculated from the raw data of the accel-erometer loggers used in the present study were goodpredictors of VO2 and speed during walking andrunning in humans in the laboratory. Although ODBAwas a marginally less good predictor of VO2 than fH, fHis known to have a number of limitations in real lifesituations involving exercise that would not be shared byODBA. For example, undertaking exercise concurrentlywith mental exertion is known to affect, possibly evenuncouple, the relationship between fH and VO2 (Carrollet al., 1986), as can happen during periods of recoveryafter exercise (Saris, 1986). Also, if an individualbecomes fitter, VO2 at a certain running speed, forinstance, will remain fairly constant while fH will belower and stroke volume greater (Henderson et al.,1927, Fig. 1), changing the fH–VO2 relationship. Whilein some cases it may be possible to calibrate the fH–VO2
relationship for these effects, body motion and hence theODBA–VO2 relationship should be relatively unaffectedby levels of mental exertion and physical fitness.
Locomotion on the flat
For locomotion on the flat, the main reason for theslightly lower predictive power of ODBA compared tofH is likely due to the two walking gaits employed(walking and running; Fig. 2). Switching between thetwo, which occurs when a certain speed of locomotion isreached, creates a large change in tri-axial accelerometryvalues recorded but only a relatively small change in fHand VO2 (Figs. 2 and 1, respectively). This explains theimprovement in the models predicting VO2 or speedusing ODBA when two-part regressions were employed,with one part describing the relationship betweenODBA and VO2 or speed during walking and the otherthat during running. Nevertheless, comparing thepresent data to a re-examination of the cormorant datareported by Wilson et al. (2006) shows that even single-part regressions using ODBA in the present study
ARTICLE IN PRESS
4000
3000
2000
1000
00 0.25 0.5 0.75 1 1.25 1.5 1.75 2
ODBA (g)
Rat
e of
oxy
gen
cons
umpt
ion
(ml O
2 m
in-1
)
B
A
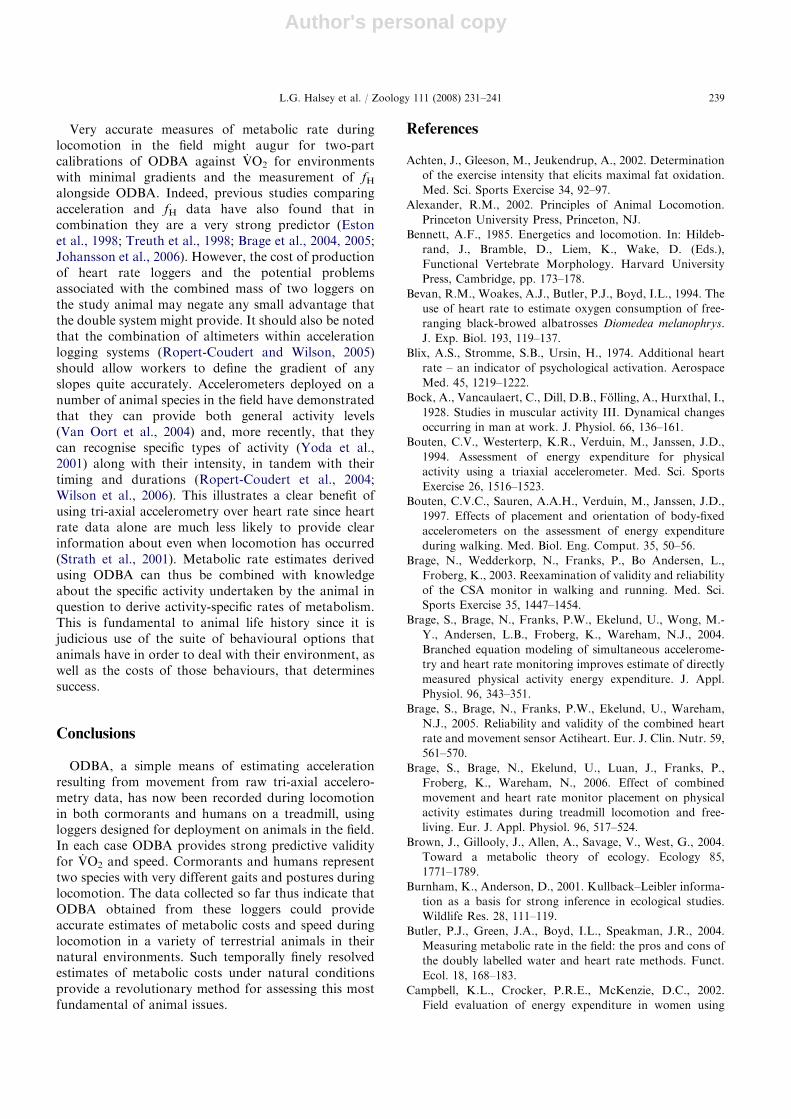
Fig. 3. Rate of oxygen consumption (VO2, ml O2min�1)
against overall dynamic body acceleration (ODBA, g) for a
single subject during treadmill exercise. ODBA is calculated
from acceleration data recorded on a tri-axial accelerometer
attached to the back. Data set A (squares) represents walking
and running on the flat. The change of gait between walking
and running is clear from a large change in gain in ODBA. A
single linear regression line for the entire data set is described
by VO2 ¼ 1597.8 *ODBA+378.9, R2¼ 0.97, thick line. A
two-part regression, with a linear regression line for the
walking data and another linear regression line for the running
data is described by walking data, VO2 ¼ 1827.8*ODBA+
276.1, R2¼ 0.98; running data, VO2 ¼ 2977.7*ODBA�
2045.1, R2¼ 0.93, thin lines. Data set B (triangles) represents
walking at a steady speed (5 kmh�1) on various gradients. The
data have been offset on the y-axis, by an increase of 1000
units, for clarity. The single regression line for the data set is
described by VO2 ¼ 6699.8*ODBA–928.4, R2¼ 0.99.
L.G. Halsey et al. / Zoology 111 (2008) 231–241236
Author's personal copy
predicted VO2 and speed better than VO2 and speed oflocomotion in cormorants, despite the single gait ofcormorants.
The large change in ODBA values when gait switchesin humans is due primarily to changes in the amount ofacceleration recorded by the vertical axis (heave), withthe values being considerably higher during running(Fig. 2). The apparent ease with which different gaitscan be discerned using tri-axial accelerometry meansthat inspection of accelerometer values from free-livinganimals which employ multiple gaits should allowresearchers to determine which gaits are used. Followingthis, if appropriate, two-, or even three-part regressionscould be used to derive VO2 from ODBA accordingly.Future work on species with multiple gaits (e.g. horses;Wickler et al., 2003) should clarify this issue.
During walking and running on the flat, the positionof the accelerometer did not have a marked effect on the
predictive power of ODBA. This concurs with thefindings of Bouten et al. (1997) and Brage et al. (2006).Bouten et al. (1997) note that most studies assessingphysical activity in humans place the accelerometerlogger on the lower back (Montoye et al., 1983; Meijeret al., 1989; Bouten et al., 1994). As far as we are aware,ours is the first work to investigate the utility ofacceleration data collected from a logger placed aroundthe neck of a subject. The choice of the neck wasdeliberate since, for terrestrial mammals at least, loggersand transmitters are almost invariably attached to acollar (Scheibe et al., 1998; Van Oort et al., 2004). It istherefore particularly valuable to discover that ODBAcalculated from the collar placement of the logger is atleast as good a predictor of VO2 and speed on the flat asODBA calculated from upper- or lower-back place-ments. In contrast to bipedal walkers, quadrupedsusually walk on all fours with the neck relatively
ARTICLE IN PRESS
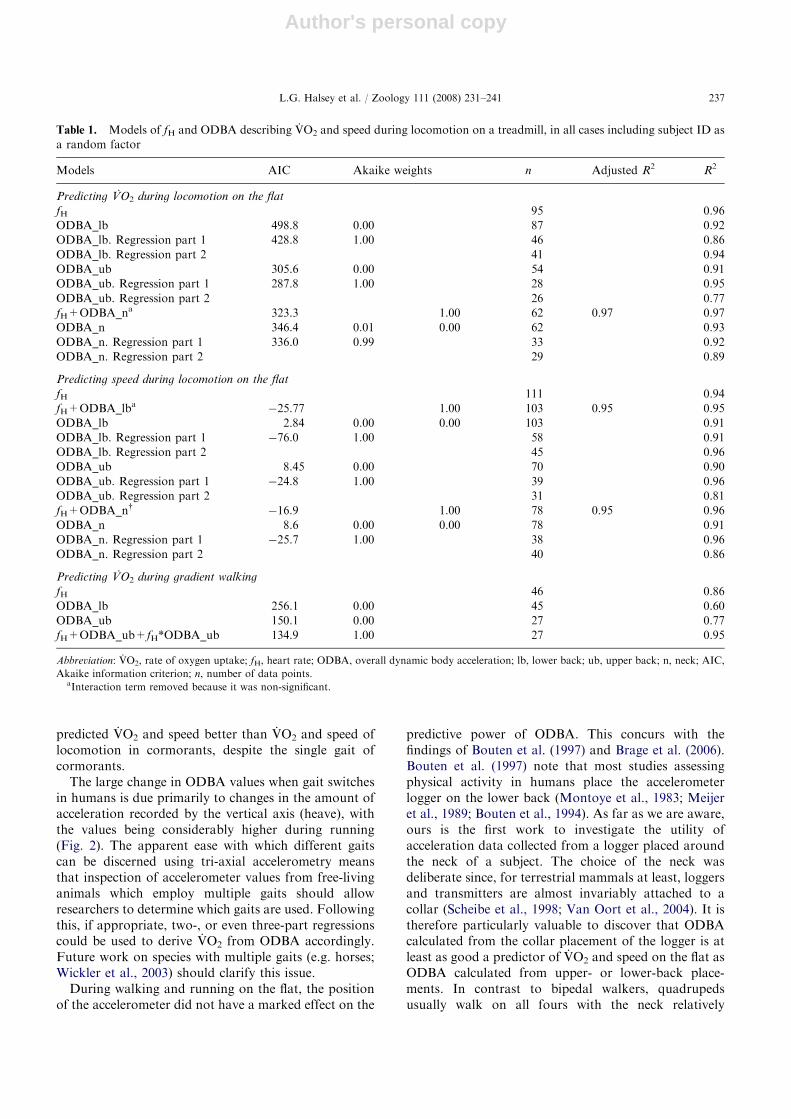
Table 1. Models of fH and ODBA describing VO2 and speed during locomotion on a treadmill, in all cases including subject ID as
a random factor
Models AIC Akaike weights n Adjusted R2 R2
Predicting VO2 during locomotion on the flat
fH 95 0.96
ODBA_lb 498.8 0.00 87 0.92
ODBA_lb. Regression part 1 428.8 1.00 46 0.86
ODBA_lb. Regression part 2 41 0.94
ODBA_ub 305.6 0.00 54 0.91
ODBA_ub. Regression part 1 287.8 1.00 28 0.95
ODBA_ub. Regression part 2 26 0.77
fH+ODBA_na 323.3 1.00 62 0.97 0.97
ODBA_n 346.4 0.01 0.00 62 0.93
ODBA_n. Regression part 1 336.0 0.99 33 0.92
ODBA_n. Regression part 2 29 0.89
Predicting speed during locomotion on the flat
fH 111 0.94
fH+ODBA_lba �25.77 1.00 103 0.95 0.95
ODBA_lb 2.84 0.00 0.00 103 0.91
ODBA_lb. Regression part 1 �76.0 1.00 58 0.91
ODBA_lb. Regression part 2 45 0.96
ODBA_ub 8.45 0.00 70 0.90
ODBA_ub. Regression part 1 �24.8 1.00 39 0.96
ODBA_ub. Regression part 2 31 0.81
fH+ODBA_ny �16.9 1.00 78 0.95 0.96
ODBA_n 8.6 0.00 0.00 78 0.91
ODBA_n. Regression part 1 �25.7 1.00 38 0.96
ODBA_n. Regression part 2 40 0.86
Predicting VO2 during gradient walking
fH 46 0.86
ODBA_lb 256.1 0.00 45 0.60
ODBA_ub 150.1 0.00 27 0.77
fH+ODBA_ub+fH*ODBA_ub 134.9 1.00 27 0.95
Abbreviation: VO2, rate of oxygen uptake; fH, heart rate; ODBA, overall dynamic body acceleration; lb, lower back; ub, upper back; n, neck; AIC,
Akaike information criterion; n, number of data points.aInteraction term removed because it was non-significant.
L.G. Halsey et al. / Zoology 111 (2008) 231–241 237

Author's personal copy
perpendicular to the ground. Nevertheless, given thatODBA is calculated from acceleration recorded from allthree logger axes, it is reasonable to suppose that ODBAfrom a collar-placed logger will be as effective apredictor of VO2 during locomotion in quadrupeds asin bipeds.
Gradient walking
Locomotion on an incline of just a few degreesincreases metabolic rate considerably (Margaria et al.,1963). Certain studies have reported that accelerometrydata are relatively poor predictors of VO2 duringlocomotion on gradients (e.g. Montoye et al., 1983;Terrier et al., 2001). However, Herren et al. (1999) wereable to predict the incline on which humans wererunning fairly well with accelerometry loggers whileCampbell et al. (2002) were able to predict metabolicrate during incline walking accurately using accelero-metry. The differences between such studies may wellreside in the sophistication of the accelerometers usedand the way the data were stored. In our study, ODBAobtained from a logger placed on the upper back wasonly a slightly weaker predictor of VO2 during inclinewalking than on the flat. Indeed, the R2 of 0.77 is similarand often better than that found for many studies whichhave calibrated fH with VO2 during exercise in animals(e.g. king penguins, Aptenodytes patagonicus, 0.73–0.82,Froget et al. 2001; eider ducks, Somateria mollissima,0.46, Hawkins et al., 2000; black-browed albatross,Diomedea melanophris, 0.80, Bevan et al., 1994). Theresults of Herren et al. (1999) suggest that verticalacceleration increases as gradient increases, as would beexpected since vertical acceleration provides the energy
required to move upward, something that helps explainhow tri-axial accelerometry can correlate strongly withVO2 during gradient walking.
Field deployments
In the field, subjects are likely to be randomly selectedand described by measures such as body mass andmorphometrics. Our results suggest that when acceler-ometers are deployed on free-living animals, additionalmorphometric information is likely to be a usefulpredictor of VO2 and speed during locomotion (Chenand Sun, 1997; Terrier et al., 2001; Plasqui et al., 2005).The inclusion of body mass and height was an effectivesubstitute for inclusion of subject ID when using ODBAto estimate VO2 and speed during locomotion on theflat. Furthermore, these two covariates increased thepredictive power of ODBA for VO2 during gradientwalking, when substituted for subject ID. Height affectsgait and thus ODBA, while mass should be aparticularly important predictor of VO2 during gradientlocomotion since the physical work done is proportionalto the mass (Chen and Sun, 1997). Replacing subject IDwith body mass and height was not so effective whenusing fH to estimate VO2 and speed during locomotion;in all cases, the models explained less variance. Indeed,comparison of these models to the equivalent modelsusing ODBA showed that the ODBA models were atleast as good, if not better, predictors. Thus in the field,ODBA, when calibrated with two-part regressions, islikely to be a slightly better predictor of locomotion inhumans than is fH. This is most reasonably explained bylarge changes in the fH–VO2 relationship in humans asphysical fitness varies.
ARTICLE IN PRESS
Table 2. Models of fH and ODBA describing VO2 and speed during locomotion on a treadmill, including subject mass and height
as covariates
Models n R2
Predicting VO2 during locomotion on the flat
fH+mass+height+mass*height+mass*fH+height*fH 95 0.92 (0.96)
ODBA_n+mass+height+mass+ODBA_n+height*ODBA_n [regression part 1] 33 0.91 (0.92)
ODBA_n+mass+height+mass*height+mass*ODBA_n [regression part 2] 29 0.93 (0.89)
Predicting speed during locomotion on the flat
fH+mass+height+mass*height 111 0.85 (0.94)
ODBA_n+mass+height+ODBA_n*height [regression part 1] 38 0.90 (0.96)
ODBA_n+mass+height+ODBA_n*height+mass*height [regression part 2] 40 0.87 (0.86)
Predicting VO2 during gradient walking
fH+mass+height+mass*height 46 0.77 (0.86)
ODBA_ub+mass+height+ODBA_ub*mass+ODBA_ub*height+mass*height 27 0.83 (0.77)
Abbreviation: VO2, rate of oxygen uptake; fH, heart rate; ODBA, overall dynamic body acceleration; ub, upper back; n, neck; n, number of data points.
Values in parentheses are R2 values, provided in Table 1, for the equivalent models that include subject ID as a random factor instead of mass and height
as covariates.
L.G. Halsey et al. / Zoology 111 (2008) 231–241238
Author's personal copy
Very accurate measures of metabolic rate duringlocomotion in the field might augur for two-partcalibrations of ODBA against VO2 for environmentswith minimal gradients and the measurement of fHalongside ODBA. Indeed, previous studies comparingacceleration and fH data have also found that incombination they are a very strong predictor (Estonet al., 1998; Treuth et al., 1998; Brage et al., 2004, 2005;Johansson et al., 2006). However, the cost of productionof heart rate loggers and the potential problemsassociated with the combined mass of two loggers onthe study animal may negate any small advantage thatthe double system might provide. It should also be notedthat the combination of altimeters within accelerationlogging systems (Ropert-Coudert and Wilson, 2005)should allow workers to define the gradient of anyslopes quite accurately. Accelerometers deployed on anumber of animal species in the field have demonstratedthat they can provide both general activity levels(Van Oort et al., 2004) and, more recently, that theycan recognise specific types of activity (Yoda et al.,2001) along with their intensity, in tandem with theirtiming and durations (Ropert-Coudert et al., 2004;Wilson et al., 2006). This illustrates a clear benefit ofusing tri-axial accelerometry over heart rate since heartrate data alone are much less likely to provide clearinformation about even when locomotion has occurred(Strath et al., 2001). Metabolic rate estimates derivedusing ODBA can thus be combined with knowledgeabout the specific activity undertaken by the animal inquestion to derive activity-specific rates of metabolism.This is fundamental to animal life history since it isjudicious use of the suite of behavioural options thatanimals have in order to deal with their environment, aswell as the costs of those behaviours, that determinessuccess.
Conclusions
ODBA, a simple means of estimating accelerationresulting from movement from raw tri-axial accelero-metry data, has now been recorded during locomotionin both cormorants and humans on a treadmill, usingloggers designed for deployment on animals in the field.In each case ODBA provides strong predictive validityfor VO2 and speed. Cormorants and humans representtwo species with very different gaits and postures duringlocomotion. The data collected so far thus indicate thatODBA obtained from these loggers could provideaccurate estimates of metabolic costs and speed duringlocomotion in a variety of terrestrial animals in theirnatural environments. Such temporally finely resolvedestimates of metabolic costs under natural conditionsprovide a revolutionary method for assessing this mostfundamental of animal issues.
References
Achten, J., Gleeson, M., Jeukendrup, A., 2002. Determination
of the exercise intensity that elicits maximal fat oxidation.
Med. Sci. Sports Exercise 34, 92–97.
Alexander, R.M., 2002. Principles of Animal Locomotion.
Princeton University Press, Princeton, NJ.
Bennett, A.F., 1985. Energetics and locomotion. In: Hildeb-
rand, J., Bramble, D., Liem, K., Wake, D. (Eds.),
Functional Vertebrate Morphology. Harvard University
Press, Cambridge, pp. 173–178.
Bevan, R.M., Woakes, A.J., Butler, P.J., Boyd, I.L., 1994. The
use of heart rate to estimate oxygen consumption of free-
ranging black-browed albatrosses Diomedea melanophrys.
J. Exp. Biol. 193, 119–137.
Blix, A.S., Stromme, S.B., Ursin, H., 1974. Additional heart
rate – an indicator of psychological activation. Aerospace
Med. 45, 1219–1222.
Bock, A., Vancaulaert, C., Dill, D.B., Folling, A., Hurxthal, I.,
1928. Studies in muscular activity III. Dynamical changes
occurring in man at work. J. Physiol. 66, 136–161.
Bouten, C.V., Westerterp, K.R., Verduin, M., Janssen, J.D.,
1994. Assessment of energy expenditure for physical
activity using a triaxial accelerometer. Med. Sci. Sports
Exercise 26, 1516–1523.
Bouten, C.V.C., Sauren, A.A.H., Verduin, M., Janssen, J.D.,
1997. Effects of placement and orientation of body-fixed
accelerometers on the assessment of energy expenditure
during walking. Med. Biol. Eng. Comput. 35, 50–56.
Brage, N., Wedderkorp, N., Franks, P., Bo Andersen, L.,
Froberg, K., 2003. Reexamination of validity and reliability
of the CSA monitor in walking and running. Med. Sci.
Sports Exercise 35, 1447–1454.
Brage, S., Brage, N., Franks, P.W., Ekelund, U., Wong, M.-
Y., Andersen, L.B., Froberg, K., Wareham, N.J., 2004.
Branched equation modeling of simultaneous accelerome-
try and heart rate monitoring improves estimate of directly
measured physical activity energy expenditure. J. Appl.
Physiol. 96, 343–351.
Brage, S., Brage, N., Franks, P.W., Ekelund, U., Wareham,
N.J., 2005. Reliability and validity of the combined heart
rate and movement sensor Actiheart. Eur. J. Clin. Nutr. 59,
561–570.
Brage, S., Brage, N., Ekelund, U., Luan, J., Franks, P.,
Froberg, K., Wareham, N., 2006. Effect of combined
movement and heart rate monitor placement on physical
activity estimates during treadmill locomotion and free-
living. Eur. J. Appl. Physiol. 96, 517–524.
Brown, J., Gillooly, J., Allen, A., Savage, V., West, G., 2004.
Toward a metabolic theory of ecology. Ecology 85,
1771–1789.
Burnham, K., Anderson, D., 2001. Kullback–Leibler informa-
tion as a basis for strong inference in ecological studies.
Wildlife Res. 28, 111–119.
Butler, P.J., Green, J.A., Boyd, I.L., Speakman, J.R., 2004.
Measuring metabolic rate in the field: the pros and cons of
the doubly labelled water and heart rate methods. Funct.
Ecol. 18, 168–183.
Campbell, K.L., Crocker, P.R.E., McKenzie, D.C., 2002.
Field evaluation of energy expenditure in women using
ARTICLE IN PRESSL.G. Halsey et al. / Zoology 111 (2008) 231–241 239

Author's personal copy
Tritrac accelerometers. Med. Sci. Sports Exercise 34,
1667–1674.
Carroll, D., Turner, J.R., Prasad, R., 1986. The effects of level
of difficulty of mental arithmetic challenge on heart rate
and oxygen consumption. Int. J. Psychophysiol. 4, 167–173.
Cavagna, G.A., Saibene, F., Margaria, R., 1963. External
work in walking. J. Appl. Physiol. 18, 1–9.
Chen, K., Sun, M., 1997. Improving energy expenditure
estimation by using a triaxial accelerometer. J. Appl.
Physiol. 83, 2112–2122.
Dawson, T., Taylor, C.R., 1973. Energy cost of locomotion in
kangaroos. Nature 246, 313–314.
Eston, R., Rowlands, A., Ingledew, D., 1998. Validity of heart
rate, pedometry, and accelerometry for predicting the
energy cost of children’s activities. J. Appl. Physiol. 84,
362–371.
Froget, G., Butler, P.J., Handrich, Y., Woakes, A.J., 2001.
Heart rate as an indicator of oxygen consumption:
influence of body condition in the king penguin. J. Exp.
Biol. 204, 2133–2144.
Garland Jr., T., 1983. Scaling the ecological cost of transport
to body mass in terrestrial mammals. Am. Nat. 121,
571–587.
Geiser, F., 2004. Metabolic rate and body temperature
reduction during hibernation and daily torpor. Annu.
Rev. Physiol. 66, 239–274.
Halsey, L.G., Fahlman, A., Handrich, Y., Schmidt, A.,
Woakes, A.J., Butler, P.J., 2007. How accurately can we
estimate energetic costs in a marine top predator, the king
penguin? Zoology 110, 81–92.
Hawkins, P.A.J., Butler, P.J., Woakes, A.J., Speakman, J.R.,
2000. Estimation of the rate of oxygen consumption of the
common eider duck (Somateria mollissima), with some
measurements of heart rate during voluntary dives. J. Exp.
Biol. 203, 2819–2832.
Henderson, Y., Haggard, H.W., Dolley, F., 1927. The
efficiency of the heart, and the significance of rapid and
slow pulse rates. Am. J. Physiol. 82, 512–524.
Herren, R., Sparti, A., Aminian, K., Schutz, Y., 1999. The
prediction of speed and incline in outdoor running in
humans using accelerometry. Med. Sci. Sports Exercise 31,
1053–1059.
Hiilloskorpi, H., Fogelholm, M., Laukkanen, R., Pasanen, M.,
Oja, P., Manttari, A., Natri, A., 1999. Factors affecting the
relation between heart rate and energy expenditure during
exercise. Int. J. Sports Med. 20, 438–443.
Johansson, H., Rossander-Hulthen, L., Slinde, F., Ekblom, B.,
2006. Accelerometry combined with heart rate telemetry in
the assessment of total energy expenditure. Br. J. Nutr. 95,
631–639.
Lefebvre, L., 1964. The use of D2 18O for measuring energy
metabolism in Columbia livia at rest and in flight. Auk 81,
403–416.
Lifson, N., Gordon, G., McClintock, R., 1955. Measurement
of total carbon dioxide production by means of D2 O18. J.
Appl. Physiol. 7, 704–710.
Maas, S., Kok, M., Westra, H., Kemper, H., 1989. The
validity of the use of heart rate in estimating oxygen
consumption in static and in combined static/dynamic
exercise. Ergonomics 32, 141–148.
Margaria, R., Cerretelli, P., Aghemo, P., Sassi, G., 1963.
Energy cost of running. J. Appl. Physiol. 18, 367–370.
McNamara, J.M., Houston, A.I., 1996. State-dependent life
histories. Nature 380, 215–221.
Meijer, G.A., Westerterp, K.R., Koper, H., Hoor, F.T., 1989.
Assessment of energy expenditure by recording heart rate and
body acceleration. Med. Sci. Sports Exercise 21, 343–347.
Montoye, H.J., Washburn, R., Servais, S., Ertl, A., Webster,
J.C., Nagle, F.J., 1983. Estimation of energy expenditure by
a portable accelerometer. Med. Sci. Sports Exercise 15,
403–407.
Plasqui, G., Joosen, A., Kester, A., Goris, A., Westerterp,
K.R., 2005. Measuring free-living energy expenditure and
physical activity with triaxial accelerometry. Obesity Res.
13, 1363–1369.
Ropert-Coudert, Y., Wilson, R.P., 2005. Trends and perspec-
tives in animal-attached remote sensing. Front. Ecol.
Environ. 3, 437–444.
Ropert-Coudert, Y., Gremillet, D., Kato, A., Ryan, P.G.,
Naito, Y., Le Maho, Y., 2004. A fine-scale time budget of
Cape gannets provides insights into the foraging strategies
of coastal seabirds. Anim. Behav. 67, 985–992.
Rubenson, J., Heliams, D., Lloyd, D., Fournier, P., 2004. Gait
selection in the ostrich: mechanical and metabolic char-
acteristics of walking and running with and without
an aerial phase. Proc. Roy. Soc. London Ser. B 271,
1091–1099.
Saris, W., 1986. Habitual physical activity in children:
methodology and findings in health and disease. Med.
Sci. Sports Exercise 18, 253–263.
Scheibe, K.M., Schleusner, T., Berger, A., Eichhorn, K.,
Langbein, J., Dal Zotto, L., Streich, W.J., 1998. ETHO-
SYSs – new system for recording and analysis of behaviour
of free-ranging domestic animals and wildlife. Appl. Anim.
Behav. Sci. 55, 195–211.
Speakman, J.R., 1998. The history and theory of the doubly
labeled water technique. Am. J. Clin. Nutr. 68, 932S–938S.
Strath, S.J., Bassett Jr., D.R., Swartz, A.M., Thompson, D.L.,
2001. Simultaneous heart rate-motion sensor technique to
estimate energy expenditure. Med. Sci. Sports Exercise 33,
2118–2123.
Terrier, P., Aminian, K., Schutz, Y., 2001. Can accelerometry
accurately predict the energy cost of uphill/downhill
walking? Ergonomics 44, 48–62.
Tolkamp, B., Emmans, G., Yearsley, J., Kyriazakis, I., 2002.
Optimization of short-term animal behaviour and the
currency of time. Anim. Behav. 64, 945–953.
Treuth, M., Adolph, A., Butte, N., 1998. Energy expenditure
in children predicted from heart rate and activity calibrated
against respiration calorimetry. Am. J. Physiol. Endocrinol.
Metab. 275, 12–18.
Tsuda, Y., Kawabe, R., Tanaka, H., Mitsunaga, Y., Hiraishi,
T., Yamamoto, K., Nashimoto, K., 2006. Monitoring the
spawning behaviour of chum salmon with an acceleration
data logger. Ecol. Freshwater Fish. 15, 264–274.
Van Oort, B.E.H., Tyler, N.J.C., Storeheier, P.V., Stokkan,
K.-A., 2004. The performance and validation of a data
logger for long-term determination of activity in free-
ranging reindeer, Rangifer tarandus L. Appl. Anim. Behav.
Sci. 89, 299–308.
ARTICLE IN PRESSL.G. Halsey et al. / Zoology 111 (2008) 231–241240
Author's personal copy
Vokac, Z., Bell, H., Bautz-Holter, E., Rodahl, K., 1975.
Oxygen uptake/heart rate relationship in leg and
arm exercise, sitting and standing. J. Appl. Physiol. 39,
54–59.
Walsberg, G.E., Hoffman, T.C.M., 2005. Direct calorimetry
reveals large errors in respirometric estimates of energy
expenditure. J. Exp. Biol. 208, 1035–1043.
Wickler, S.J., Hoyt, D.F., Cogger, E.A., Myers, G., 2003. The
energetics of the trot–gallop transition. J. Exp. Biol. 206,
1557–1564.
Wilson, R.P., Wilson, M.P., 1988. Dead reckoning: a new
technique for determining penguin movements at sea.
Meeresforschung 32, 155–158.
Wilson, R.P., Wilson, M.-P., Link, R., Mempel, H., Adams,
N.J., 1991. Determination of movements of African
penguins (Spheniscus demersus) using a compass system:
dead reckoning may be an alternative to telemetry. J. Exp.
Biol. 157, 557–564.
Wilson, R.P., White, C., Quintana, F., Halsey, L., Liebsch, N.,
Martin, G., Butler, P.J., 2006. Moving towards acceleration
for estimates of activity-specific metabolic rate in free-living
animals: the case of the cormorant. J. Anim. Ecol. 75,
1081–1090.
Wilson, R.P., Shepard, E.L.C., Liebsch, N., 2008. Prying into
intimate details of animal lives; use of a daily diary on
animals. Endang. Spec. Res. 4, 123–137.
Yoda, K., Naito, Y., Sato, K., Takahashi, A., Nishikawa, J.,
Ropert-Coudert, Y., Kurita, M., Le Maho, Y., 2001. A new
technique for monitoring the behaviour of free-ranging
adelie penguins. J. Exp. Biol. 204, 685–690.
ARTICLE IN PRESSL.G. Halsey et al. / Zoology 111 (2008) 231–241 241