Accelerated Evolution of Nervous System Genes in the Origin of Homo sapiens
14
Cell, Vol. 119, 1027–1040, December 29, 2004, Copyright ©2004 by Cell Press Accelerated Evolution of Nervous System Genes in the Origin of Homo sapiens (Jerison, 1973; Byrne and Whiten, 1988; Aiello and Dean, 1990; Matsuzawa, 2001). More recently, the genetic ba- sis of brain evolution has emerged as a topic of consider- Steve Dorus, 1,2,4 Eric J. Vallender, 1,2,4 Patrick D. Evans, 1,2 Jeffrey R. Anderson, 1 Sandra L. Gilbert, 1 Michael Mahowald, 1 able discussion. Of particular interest are questions re- Gerald J. Wyckoff, 1,5 Christine M. Malcom, 1,3 garding what genes underlie brain differences between and Bruce T. Lahn 1, * humans and other species, and how changes in these 1 Howard Hughes Medical Institute genes led to specific alterations in brain biology. As yet, Department of Human Genetics these important questions remain poorly explored. In 2 Committee on Genetics this study, we probe these questions by comparative 3 Department of Anthropology genomics studies utilizing both primates and nonpri- University of Chicago mate species. Chicago, Illinois 60637 It has long been noted that brains of various extant and extinct primates display remarkable variation in size, organization, and behavioral output (Noback and Summary Montagna, 1970; Armstrong and Falk, 1982; Byrne and Whiten, 1988; Matsuzawa, 2001). This is particularly true Human evolution is characterized by a dramatic in- for the evolutionary lineage leading from ancestral pri- crease in brain size and complexity. To probe its ge- mates to humans, in which the increase in brain size netic basis, we examined the evolution of genes in- and complexity was remarkably rapid and persistent volved in diverse aspects of nervous system biology. throughout the lineage (Jerison, 1973; Walker et al., We found that these genes display significantly higher 1983). In contrast, for most nonprimate mammalian or- rates of protein evolution in primates than in rodents. ders, the extent of intra-ordinal brain differences is much Importantly, this trend is most pronounced for the sub- more limited (Brodmann, 1912; Pagel and Harvey, 1989). set of genes implicated in nervous system develop- For example, the encephalization quotient, a rough mea- ment. Moreover, within primates, the acceleration of sure of brain size scaled allometrically to body size, protein evolution is most prominent in the lineage lead- can differ by more than an order of magnitude between ing from ancestral primates to humans. Thus, the re- humans and nonhuman primates, but varies much less markable phenotypic evolution of the human nervous between species of any nonprimate order (Williams, system has a salient molecular correlate, i.e., acceler- 2002). Thus, the phenotype of the nervous system has ated evolution of the underlying genes, particularly apparently undergone far greater evolutionary changes those linked to nervous system development. In addi- in primates than most other mammals. tion to uncovering broad evolutionary trends, our Extrapolating from these observations, we hypothe- study also identified many candidate genes—most of sized that the intensified phenotypic evolution of the which are implicated in regulating brain size and be- brain seen in primates might have a molecular corre- havior—that might have played important roles in the late—that is, genes involved in nervous system biology evolution of the human brain. might display more dynamic molecular evolutionary changes in primates relative to nonprimate mammals. Introduction We further surmised that within primates, the lineage leading from ancestral primates to humans might exhibit Greatly expanded and highly complex brains are among more dramatic evolutionary changes than other primate the most defining attributes distinguishing primates, es- lineages, on the basis that the increase in brain size pecially humans, from other mammals (Brodmann, 1912; and complexity is most profound in the lineage leading Jerison, 1973; Finlay and Darlington, 1995). As a result to humans. of increased brain size and complexity, behavioral reper- In this study, we compared the evolutionary rates of an toires became much richer in primates, culminating in extensive set of nervous system-related genes between highly sophisticated cultural behaviors in humans such primates and rodents. To obtain evolutionary rates in as language, tool use, and social learning (Spuhler, 1959; primates, we compared sequences between human and Matsuzawa, 2001). the Old World monkey, macaque. We note that even In past decades, researchers have devoted significant though much discussion of human evolution has fo- efforts toward understanding the evolutionary pro- cused on human-chimpanzee comparisons, the strong cesses that gave rise to the distinct features of the hu- sequence similarities between these two species results man brain. Traditionally, such efforts have focused on in high stochastic uncertainty in the estimation of evolu- tionary rates. This is likely to reduce the statistical power the anatomical and physiological differences between in detecting interesting evolutionary signatures. Human- the human brain and that of the other taxa, as well macaque comparisons, in contrast, offer much more as the behavioral manifestations of these differences accurate rate estimation because of the considerably greater sequence divergence. For the nonprimate mam- *Correspondence: [email protected] malian order, we used rodents, with rat and mouse as 4 These authors contributed equally to this work. the species chosen for comparison. The evolutionary 5 Present address: Division of Biology and Biochemistry, University of Missouri-Kansas City, Kansas City, Missouri, 64108. time separating human and macaque (20–25 million
-
Upload
independent -
Category
Documents
-
view
0 -
download
0
Transcript of Accelerated Evolution of Nervous System Genes in the Origin of Homo sapiens

Cell, Vol. 119, 1027–1040, December 29, 2004, Copyright ©2004 by Cell Press
Accelerated Evolution of Nervous SystemGenes in the Origin of Homo sapiens
(Jerison, 1973; Byrne and Whiten, 1988; Aiello and Dean,1990; Matsuzawa, 2001). More recently, the genetic ba-sis of brain evolution has emerged as a topic of consider-
Steve Dorus,1,2,4 Eric J. Vallender,1,2,4
Patrick D. Evans,1,2 Jeffrey R. Anderson,1
Sandra L. Gilbert,1 Michael Mahowald,1
able discussion. Of particular interest are questions re-Gerald J. Wyckoff,1,5 Christine M. Malcom,1,3
garding what genes underlie brain differences betweenand Bruce T. Lahn1,*humans and other species, and how changes in these1Howard Hughes Medical Institutegenes led to specific alterations in brain biology. As yet,Department of Human Geneticsthese important questions remain poorly explored. In2 Committee on Geneticsthis study, we probe these questions by comparative3 Department of Anthropologygenomics studies utilizing both primates and nonpri-University of Chicagomate species.Chicago, Illinois 60637
It has long been noted that brains of various extantand extinct primates display remarkable variation insize, organization, and behavioral output (Noback andSummaryMontagna, 1970; Armstrong and Falk, 1982; Byrne andWhiten, 1988; Matsuzawa, 2001). This is particularly trueHuman evolution is characterized by a dramatic in-for the evolutionary lineage leading from ancestral pri-crease in brain size and complexity. To probe its ge-mates to humans, in which the increase in brain sizenetic basis, we examined the evolution of genes in-and complexity was remarkably rapid and persistentvolved in diverse aspects of nervous system biology.throughout the lineage (Jerison, 1973; Walker et al.,We found that these genes display significantly higher1983). In contrast, for most nonprimate mammalian or-rates of protein evolution in primates than in rodents.ders, the extent of intra-ordinal brain differences is muchImportantly, this trend is most pronounced for the sub-more limited (Brodmann, 1912; Pagel and Harvey, 1989).set of genes implicated in nervous system develop-For example, the encephalization quotient, a rough mea-ment. Moreover, within primates, the acceleration ofsure of brain size scaled allometrically to body size,protein evolution is most prominent in the lineage lead-can differ by more than an order of magnitude betweening from ancestral primates to humans. Thus, the re-humans and nonhuman primates, but varies much lessmarkable phenotypic evolution of the human nervousbetween species of any nonprimate order (Williams,system has a salient molecular correlate, i.e., acceler-2002). Thus, the phenotype of the nervous system hasated evolution of the underlying genes, particularlyapparently undergone far greater evolutionary changesthose linked to nervous system development. In addi-in primates than most other mammals.tion to uncovering broad evolutionary trends, our
Extrapolating from these observations, we hypothe-study also identified many candidate genes—most ofsized that the intensified phenotypic evolution of the
which are implicated in regulating brain size and be-brain seen in primates might have a molecular corre-
havior—that might have played important roles in thelate—that is, genes involved in nervous system biology
evolution of the human brain. might display more dynamic molecular evolutionarychanges in primates relative to nonprimate mammals.
Introduction We further surmised that within primates, the lineageleading from ancestral primates to humans might exhibit
Greatly expanded and highly complex brains are among more dramatic evolutionary changes than other primatethe most defining attributes distinguishing primates, es- lineages, on the basis that the increase in brain sizepecially humans, from other mammals (Brodmann, 1912; and complexity is most profound in the lineage leadingJerison, 1973; Finlay and Darlington, 1995). As a result to humans.of increased brain size and complexity, behavioral reper- In this study, we compared the evolutionary rates of antoires became much richer in primates, culminating in extensive set of nervous system-related genes betweenhighly sophisticated cultural behaviors in humans such primates and rodents. To obtain evolutionary rates inas language, tool use, and social learning (Spuhler, 1959; primates, we compared sequences between human andMatsuzawa, 2001). the Old World monkey, macaque. We note that even
In past decades, researchers have devoted significant though much discussion of human evolution has fo-efforts toward understanding the evolutionary pro- cused on human-chimpanzee comparisons, the strongcesses that gave rise to the distinct features of the hu- sequence similarities between these two species resultsman brain. Traditionally, such efforts have focused on in high stochastic uncertainty in the estimation of evolu-
tionary rates. This is likely to reduce the statistical powerthe anatomical and physiological differences betweenin detecting interesting evolutionary signatures. Human-the human brain and that of the other taxa, as wellmacaque comparisons, in contrast, offer much moreas the behavioral manifestations of these differencesaccurate rate estimation because of the considerablygreater sequence divergence. For the nonprimate mam-*Correspondence: [email protected] order, we used rodents, with rat and mouse as4These authors contributed equally to this work.the species chosen for comparison. The evolutionary5Present address: Division of Biology and Biochemistry, University
of Missouri-Kansas City, Kansas City, Missouri, 64108. time separating human and macaque (20–25 million

Cell1028
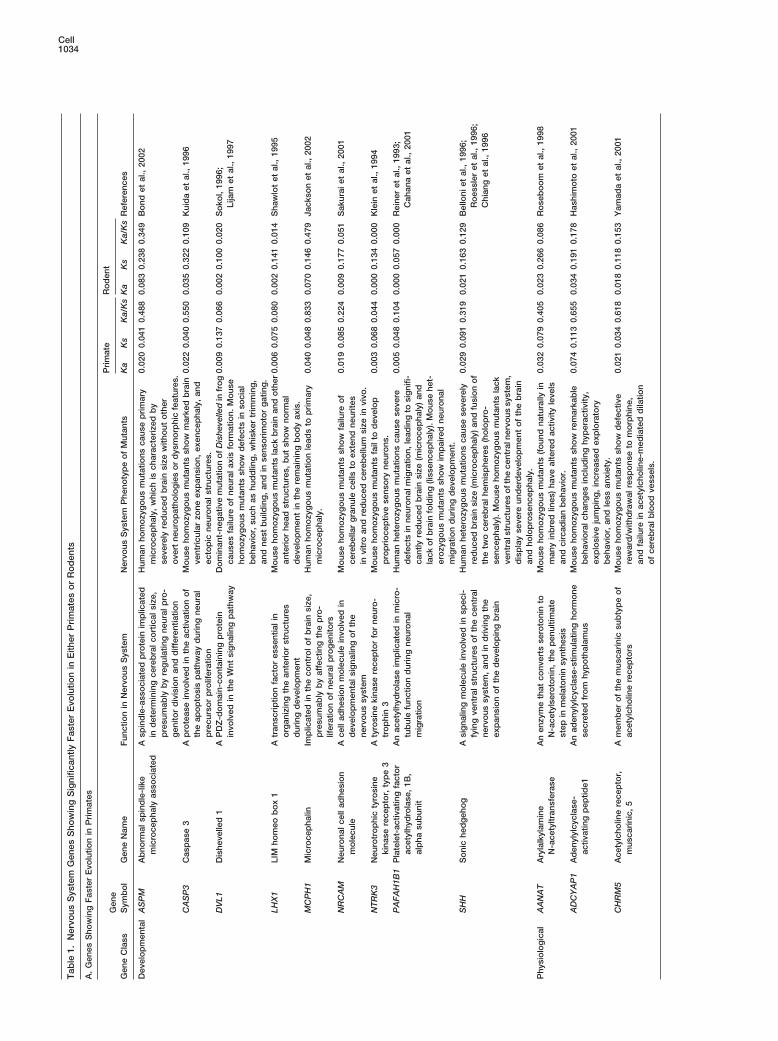
Figure 1. Phylogenetic Relationship of the Four Taxa Used in theStudy
Ratios of encephalization quotient (brain size allometrically scaledto body size) between taxa are indicated following published data(Williams, 2002). Brains of different taxa are not drawn to scale ofabsolute size. Estimated evolutionary time separating these fourtaxa is depicted.
years) is grossly comparable to that separating rat andmouse (16–23 million years) (Kumar and Hedges, 1998;Springer et al., 2003). However, point mutation rates arelower in primates than in rodents (Gibbs et al., 2004),which results in the synonymous sequence divergencebetween human and macaque being about half that be-tween rat and mouse. Despite the fact that human-macaque sequence divergence is less, the size andcomplexity of the brain differ profoundly between these Figure 2. Evolution of Nervous System Genes and Housekeepingtwo primates while remaining grossly comparable be- Genes in Primates and Rodents
tween the two rodents (Figure 1). Comparisons of these (A) Evolutionary rates in primates and rodents.(B) Percentage of genes that evolved with higher Ka/Ks in one or thefour taxa should, therefore, allow us to interpret anyother mammalian order.molecular evolutionary differences of nervous systemThe p values indicate the statistical significance of primate-rodentgenes between primates and rodents within the mean-disparities.
ingful context of contrasting evolutionary outcomes inbrain phenotypes between these two mammalian orders.
By comparing nervous system genes across the four sible. First, we performed extensive literature searches toobtain a set of genes demonstrated to play important rolesaforementioned taxa, we demonstrate that the average
rate of protein evolution as scaled to neutral divergence in the nervous system. Second, we used databases ofexpressed sequence tags (ESTs) and SAGE tags (Vel-is indeed considerably faster in primates than in rodents
and that this trend is most pronounced for the subset culescu et al., 1999) to identify a group of genes ex-pressed exclusively or predominantly in the brain.of genes implicated in nervous system development.
We further show that within primates, such evolutionary Lastly, we included a set of genes implicated in variousdiseases of the nervous system, such as brain malforma-acceleration is much greater in the lineage leading from
ancestral primates to humans relative to lineages lead- tions, mental retardation, and neurodegeneration. Manyof the genes appear to function exclusively in the ner-ing to nonhuman species. Thus, the dramatic evolution
of nervous system phenotype in primates, particularly vous system whereas others may also play roles in addi-tional tissues. In either case, the prominent involvementhumans, is indeed correlated with salient molecular evo-
lutionary footprints in the underlying genes. of these genes in the nervous system makes them goodcandidates for our study. By sequencing and bioin-formatics, we obtained orthologous sequences forResults214 such genes in all of the four taxa chosen for thisstudy (Supplemental Table S1 at http://www.cell.com/Evolution of Nervous System Genes
We used multiple criteria to compile a list of genes as cgi/content/full/119/7/1027/DC1/). We note that thesegenes are scattered randomly across the genome. Be-broadly representative of nervous system biology as pos-

Molecular Evolution of the Human Nervous System1029
Figure 3. The Ka/Ks Distributions of NervousSystem Genes and Housekeeping Genes inPrimates and Rodents
(A) Nervous system-related genes.(B) Housekeeping genes.The p values indicate the statistical signifi-cance of primate-rodent disparities.
cause the acquisition of these genes was done without higher Ka/Ks in primates than rodents, or vice versa.We found that, not surprisingly, there were substantiallyprior knowledge of their evolutionary properties, the
findings discussed below are not due to selective sam- more genes with higher Ka/Ks in primates than the otherway around (118 versus 77; Figure 2B). Such a departurepling of genes with desirable evolutionary parameters.
The pace of protein evolution as scaled to neutral from parity is statistically significant (p � 0.004 by thebinomial test). This observation argues that the higherdivergence is commonly approximated by the ratio be-
tween nonsynonymous (Ka) and synonymous (Ks) substi- average Ka/Ks in primates is contributed to by a largefraction of these nervous system genes beyond just atution rates (Li, 1997). To infer Ka/Ks ratios of genes in
primates, we compared human and macaque orthologs. few outliers.Finally, we compared the Ka/Ks distributions betweenFor rodent Ka/Ks, rat and mouse sequences were com-
pared. The average Ks of these genes is 0.065 � 0.028 primates and rodents. We found that primates have farfewer genes in the very low Ka/Ks range (i.e., Ka/Ks �(mean � SD) for the primate comparison and 0.158 �
0.063 for the rodents, in close agreement with previous 0.05) as compared to rodents, and more genes in thehigh Ka/Ks range (Figure 3A). Statistical tests confirmedreports (Yi et al., 2002; Gibbs et al., 2004). Notably, the
average Ka/Ks of these genes is substantially higher (by that the primate distribution differed significantly fromthe rodent distribution (p �� 0.0001 by the Wilcoxon37%) in primates than in rodents (Figure 2A), and the
disparity is statistically highly significant (p �� 0.0001 signed-rank test).by Fisher’s exact test). As discussed below, additionalstatistical tests further corroborated the significance of Evolution of Housekeeping Genes
The significantly higher average Ka/Ks of nervous systemthis disparity. This result indicates that the average rateof protein evolution for these genes after scaling to neu- genes in primates is suggestive of adaptive evolution.
However, this observation in itself is by no means atral divergence is faster in primates than in rodents bya significant margin. definitive proof of adaptive evolution because it could
also arise from relaxed functional constraint. The classi-We next counted the number of genes that showed
Cell1030
cal (and most stringent) test of adaptive evolution re-quires Ka/Ks greater than 1. Yet, none of the genes sam-pled here have Ka/Ks greater than 1. In fact, theobservation of overall low Ka/Ks is consistent with previ-ous reports that nervous system genes tend to experi-ence strong evolutionary constraint (Duret and Mouchir-oud, 2000). Such constraint, which curbs Ka/Ks to levelssubstantially lower than 1, would mask the effect ofadaptive evolution. We therefore sought additional evi-dence of adaptive evolution by examining the evolutionof a set of housekeeping genes. Given that housekeep-ing genes perform basic cellular functions that are likelyconserved across different species, they should haveevolved predominantly under constraint (and experienc-ing little positive selection). If housekeeping genes alsoshow higher Ka/Ks in primates, then it would cast doubton the interpretation that the elevated Ka/Ks of nervoussystem genes in primates is the consequence of positiveselection. We compiled a list of housekeeping genesthat satisfied two stringent criteria. First, they must beinvolved in the most basic cellular functions such asmetabolism and protein synthesis. Second, they mustexhibit ubiquitous expression based on EST and SAGEdatabases (Velculescu et al., 1999). By sequencing andbioinformatics, we obtained orthologs for 95 such genesacross the four taxa, which are scattered randomlyacross the genome (Supplemental Table S2 at http://www.cell.com/cgi/content/full/119/7/1027/DC1/). Theaverage Ks of these genes is 0.061 � 0.032 (mean �SD) for the primate comparison and 0.171 � 0.067 forthe rodents, which closely parallels the nervous systemgenes. But unlike the nervous system genes, the aver- Figure 4. Evolution of Different Functional Subgroups of Nervousage Ka/Ks of the housekeeping genes in primates is very System Genessimilar to—and statistically indistinguishable from—that (A) Evolutionary rates in primates and rodents.in rodents (Figure 2A). Additionally, the fraction of genes (B) Percentage of genes that evolved with higher Ka/Ks in one or the
other mammalian order.with higher Ka/Ks in primates is comparable to that withThe p values indicate the statistical significance of primate-rodenthigher Ka/Ks in rodents (37 versus 35; Figure 2B). Finally,disparities.the Ka/Ks distributions of these genes are not statistically
distinct between primates and rodents (Figure 3B). Thisfinding indicates comparable levels of selective con-
The evolution of the primate brain is characterized bystraint on housekeeping genes between primates andextensive structural modifications, which are necessar-rodents. It therefore argues that the considerably higherily achieved through changes in the molecular programsaverage Ka/Ks of nervous system genes in primates isthat underlie brain development. If the higher Ka/Ks ofnot a part of a nonspecific, genome-wide phenomenon.nervous system genes in primates is indeed the conse-quence of positive selection, then such selection is likelyClassification of Nervous System Genesto have impinged more intensely on the developmentallyThe above results still leave open two possible interpre-biased genes. The result would be even greater primate-tations. One is stronger positive selection on nervousrodent Ka/Ks disparity (in the direction of higher primatesystem genes in primates than rodents. The other isKa/Ks) for the developmental genes, and perhaps lessweaker functional constraint on these genes in primates.Ka/Ks disparity for the physiological genes. To test thisWe argue that the possibility of weaker constraint seemshypothesis, we classified our nervous system genes intounlikely, on the basis that the primate nervous systemsubgroups whose functions are biased toward eitheris far more complex (and therefore likely demandingnervous system development or physiology. We tookgreater precision in gene function) relative to the rodentseveral cautionary measures to minimize the inherentnervous system. This consideration notwithstanding, weuncertainty in the functional classification of genes.searched for additional evidence that might differentiateFirst, we imposed stringent definitions on both sub-between positive selection and relaxation of constraint.groups. Genes were included in the developmentallyTo this end, we focused on two categories of genes thatbiased subgroup only if a preponderance of evidence,are particularly relevant to the understanding of nervousparticularly in vivo gain- or loss-of-function studies, hadsystem evolution. One comprises genes whose func-demonstrated unequivocal roles of these genes in ner-tions are strongly biased toward nervous system devel-vous system development. On the other hand, genesopment. The other consists of genes biased toward thewere placed in the physiologically biased category onlyroutine physiological operations and maintenance of the
nervous system. if a combination of biochemical, pharmacological, and
Molecular Evolution of the Human Nervous System1031
Figure 5. The Ka/Ks Distributions of ThreeSubgroups of Nervous System Genes in Pri-mates and Rodents
(A) Developmentally biased subgroup.(B) Unclassified subgroup.(C) Physiologically biased subgroup.The p values indicate the statistical signifi-cance of primate-rodent disparities.
genetic evidence had shown that their predominant three subgroups without any overlap between catego-ries. The developmentally biased subgroup containedfunctions lie in the routine operation and maintenance
of the nervous system. Second, we created an “unclassi- 53 genes that included patterning signals of the devel-oping nervous system, downstream components offied” subgroup to encompass all the genes that could
not be clearly assigned to the first two categories, either such signals, transcription factors that specify neuronalphenotypes, and regulators of neural precursor prolifer-because of insufficient functional data or because they
appear to be prominently involved in both neural devel- ation, apoptosis, differentiation, migration, and morpho-genesis. The physiologically biased subgroup had 95opment and physiology. Third, classification of genes
was performed blind to the evolutionary properties of genes, comprised predominantly of neurotransmitters,their synthesis enzymes and receptors, neurohormones,these genes.
The nervous system genes were partitioned into these voltage-gated ion channels, synaptic vesicle compo-

Cell1032
nents, factors involved in synaptic vesicle release, meta- outlying genes with significantly higher Ka/Ks in primatesthan in rodents (hereon referred to as “primate-fast outli-bolic enzymes specific to neurons or glia, and structuralers”) (Table 1A).components of the nervous system. The unclassified
As expected, the developmental subgroup has thesubgroup contained the remaining 66 genes. Notably,highest proportion of outliers (9 out of 53, or 17%). Thethe developmentally biased subgroup showed evenphysiological subgroup contains 9 outliers among 95greater Ka/Ks disparity between primates and rodentsgenes (9%), while the unclassified subgroup has 6 outli-than did the entire set of nervous system genes. Theers among 66 genes (9%). Interestingly, a preponder-average Ka/Ks of this subgroup is significantly higher (byance of these outliers appeared to be involved in control-53%) in primates than in rodents (p � 0.002 by Fisher’sling brain size or behavior. Mouse knockout of CASP3exact test; Figure 4A). In addition, the great majority ofexhibits severe overgrowth of the brain; LHX1 knockoutdevelopmental genes exhibited higher Ka/Ks in primatesshows absence of brain and other anterior structures;whereas only a small fraction displayed higher Ka/Ks inand NRCAM knockout leads to reduced cerebellum size.rodents (37 versus 11), which is a significant departurePerhaps even more interesting are the observations thatfrom parity (p � 0.0002 by the binomial test; Figure 4B).mutations in human ASPM, MCPH1, PAFAH1B1, andIn contrast to the developmental genes, the physiologi-SHH all result in severe reductions in brain size (micro-cally biased subgroup exhibited much less primate-cephaly). Hence, 7 of the outliers are implicated in con-rodent Ka/Ks disparity (Figure 4A). Furthermore, thetrolling brain size. Mouse knockout of DVL1 displaysnumber of genes in this subgroup with higher Ka/Ks indefective social behavior; PEG3 knockout shows im-primates is comparable to that with higher Ka/Ks in ro-paired maternal behavior; ADCYAP1 knockout exhibitsdents (42 versus 43; Figure 4B). Indeed, the reason thataltered anxiety state; knockouts of GDI1, GRIN2A, orthe average Ka/Ks of the physiological subgroup isCSPG3 show deficits in learning or neural correlates ofslightly higher in primates can be attributed to a subsetlearning; knockouts of CHRM5, DRD2, or OPRM1 exhibitof outliers with markedly higher Ka/Ks in primates thandefects in acquiring reward-mediated behavior; and mu-in rodents (these outliers are discussed later).tation in AANAT alters circadian rhythm. Thus, 10 of theInterestingly, the unclassified subgroup shows evolu-outliers are involved in regulating behavior.tionary parameters that are intermediate between the
It is remarkable that 17 out of the 24 primate-fastdevelopmental and the physiological subgroups. This isoutliers are linked to the regulation of either brain sizetrue when considering Ka/Ks values (Figure 4A) or theor behavior. This trend suggests that genes controllingnumber of genes with higher Ka/Ks in either primates orbrain size or behavior are preferential targets of positiverodents (39 versus 23; Figure 4B). We next comparedselection during primate evolution. The functional speci-Ka/Ks distributions between primates and rodents forficity of these outliers adds additional credence to theeach subgroup. For the developmental subgroup, pri-notion that the higher Ka/Ks of nervous system genes inmates showed a marked deficiency of genes in the low-primates is likely the consequence of adaptive evolution.est Ka/Ks range (i.e., Ka/Ks � 0.05) as compared to ro-
For the developmental and unclassified subgroups,dents, but a relative excess of genes in the higher Ka/removal of the primate-fast outliers only moderately re-Ks range (Figure 5A). In particular, the very top Ka/Ksduced the overall primate-rodent Ka/Ks disparities (dataranges (Ka/Ks � 0.5) contain only primate, and no rodentnot shown). This suggests that for these two subgroups,genes. This notable primate-rodent disparity is statisti-the higher average Ka/Ks in primates is contributed tocally highly significant (p �� 0.0001 by the Wilcoxonby many genes, and not just the primate-fast outliers.signed-rank test). In contrast, Ka/Ks distributions of theFor the physiological subgroup, however, removal ofphysiological genes are much more similar betweenthe outlying genes actually led to higher average Ka/Ksprimates and rodents and are not statistically distinctin rodents than in primates (by nearly 10%). This hints(Figure 5C). For the unclassified subgroup, the Ka/Ks at the possibility that, overall, physiological genes mightdistributions again exhibit an intermediate level of pri-actually be slightly more conserved in primates, exceptmate-rodent disparity (Figure 5B).for a small subset of genes that underwent adaptiveThe higher Ka/Ks of nervous system genes in primatesevolution (and hence exhibiting much higher Ka/Ks in pri-
means that there is an overabundance of amino acidmates).
substitutions (after scaling to neutral divergence) in pri-Using the same statistical cutoff, we also obtained 3
mates as compared to rodents. A rough estimate sug- rodent-fast outliers, considerably fewer than the pri-gests an excess of 1–2 amino acid substitutions per mate-fast outliers (Table 1B). Such a dramatic disparitynervous system gene in primates than would have oc- is consistent with the tendency of nervous system genescurred if the average Ka/Ks in primates was similar to to have higher Ka/Ks in primates than in rodents. Among(rather than significantly higher than) the average rodent the 95 housekeeping genes, only two showed significantKa/Ks. The excess becomes 3–4 substitutions per gene Ka/Ks disparities between primates and rodents, andin primates when considering only the developmental both had higher Ka/Ks in rodents (Supplemental Tablesubgroup. S2 online). This reinforces the notion that housekeeping
genes evolved under levels of selective constraint thatGenes with Marked Evolutionary Rate Disparities tended to remain steady across different mammalian lin-between Primates and Rodents eages.To identify candidate genes whose molecular evolution-ary changes might bear particular relevance to brain Comparison between Human Lineageevolution, we searched for genes with the most marked and Macaque LineageKa/Ks disparities between primates and rodents. Using Increases in brain size and complexity are evident in
the evolution of many primate lineages (Jerison, 1973).a p value of 0.05 as a cutoff, we obtained a set of 24

Molecular Evolution of the Human Nervous System1033
However, this increase is far more dramatic in the lin-eage leading to humans than in other primate lineages(Williams, 2002). If the higher average Ka/Ks of nervoussystem genes in primates (based on human-macaquecomparison) is indeed the product of adaptive evolution,then one might expect this accelerated evolution to bemore dramatic in the lineage leading from human-macaque ancestors to humans than the lineage leadingto macaques. To address this possibility, we followed aphylogeny-based methodology as previously described(Messier and Stewart, 1997). Specifically, we chosesquirrel monkey (Saimiri boliviensis), a New World mon-key, as an outgroup to partition human-macaque se-quence divergence into the two respective branches.(Squirrel monkey can serve as a highly reliable outgroupbecause it is closely related to the catarrhine clade con-taining human and macaque; rat and mouse are toodistantly related to primates to be reliable outgroups.)
We first focused on the primate-fast outliers of thenervous system genes because they have the greatestlikelihood of bearing relevance to primate brain evolu-tion. Using squirrel monkey sequences as an outgroup,we found that they have much higher average Ka/Ks inthe human lineage than the macaque lineage (Figure 6A)and that the difference is statistically significant (p �0.004 by Fisher’s exact test). Additionally, at the levelof individual genes, the great majority (20 out of 24)evolved faster in the human lineage, which is a signifi-cant departure from parity (p � 0.002 by the binomialtest).
As a control, we also examined a set of 25 nervoussystem genes with comparable evolutionary rates be-tween primates and rodents and found that these genesdo not show any statistically significant Ka/Ks disparitiesbetween the human and the macaque lineages (Fig-ure 6A).
Thus, nervous system genes with higher Ka/Ks valuesin primates than in rodents also have a strong tendencyto have higher Ka/Ks in the human branch than in themacaque branch. That the Ka/Ks of these genes is mark-edly and specifically elevated along the humanbranch—in which the increase in brain size and com-plexity is most dramatic—further argues that adaptiveevolution rather than relaxed functional constraint islikely responsible.
Comparison between Human Lineage Figure 6. Evolutionary Rates of the Primate-Fast Outliers and theControl Group of Nervous System Genes in Different Primate Lin-and Chimpanzee LineageeagesAnother important question is whether nervous system(A) Comparison between the lineage from human-macaque ancestorgenes show different Ka/Ks between the human lineageto human and the lineage to macaque.and the chimpanzee lineage after the divergence of(B) Comparison between the lineage from human-chimpanzee an-
these two lineages. To address this question, we ob- cestor to human and the lineage to chimpanzee.tained chimpanzee sequences for both the primate-fast (C) Phylogenetic tree depicting Ka/Ks values along the primate lin-outliers and the control group. We then used macaque eage leading to humans (bolded lines) and in nonhuman primate
lineages (plain lines). Note that the Ka/Ks value shown next to theas an outgroup to partition human-chimpanzee diver-squirrel monkey branch applies to the entire lineage from the catar-gence into separate human and chimpanzee branches.rhine ancestor node (indicated by arrow) to squirrel monkey.For the primate-fast outliers, the Ka/Ks of the human
branch is considerably higher than the chimpanzeebranch (Figure 6B). For the control genes, the two lin- from human-chimpanzee ancestors to humans) than in
the chimpanzee terminal branch, due to the fact thateages show comparable and statistically indistinguish-able Ka/Ks values (Figure 6B). these genes were ascertained on the basis of elevated
Ka/Ks in the human-to-macaque lineage (which sub-An important caveat in the above analysis is ascertain-ment bias. The primate-fast outliers were expected to sumes the human terminal branch). We therefore per-
formed computer simulations to evaluate the extent toshow higher Ka/Ks in the human terminal branch (i.e.,
Cell1034
Tab
le1.
Ner
vous
Sys
tem
Gen
esS
how
ing
Sig
nific
antly
Fas
ter
Evo
lutio
nin
Eith
erP
rim
ates
or
Ro
den
ts
A.
Gen
esS
how
ing
Fas
ter
Evo
lutio
nin
Pri
mat
es
Pri
mat
eR
od
ent
Gen
eG
ene
Cla
ssS
ymb
ol
Gen
eN
ame
Fun
ctio
nin
Ner
vous
Sys
tem
Ner
vous
Sys
tem
Phe
noty
pe
of
Mut
ants
Ka
Ks
Ka/
Ks
Ka
Ks
Ka/
Ks
Ref
eren
ces
Dev
elo
pm
enta
lA
SP
MA
bno
rmal
spin
dle
-lik
eA
spin
dle
-ass
oci
ated
pro
tein
imp
licat
edH
uman
hom
ozy
go
usm
utat
ions
caus
ep
rim
ary
0.02
00.
041
0.48
80.
083
0.23
80.
349
Bo
ndet
al.,
2002
mic
roce
pha
lyas
soci
ated
ind
eter
min
ing
cere
bra
lco
rtic
alsi
ze,
mic
roce
pha
ly,
whi
chis
char
acte
rize
db
yp
resu
mab
lyb
yre
gul
atin
gne
ural
pro
-se
vere
lyre
duc
edb
rain
size
with
out
oth
erg
enito
rd
ivis
ion
and
diff
eren
tiatio
no
vert
neur
op
atho
log
ies
or
dys
mo
rphi
cfe
atur
es.
CA
SP
3C
asp
ase
3A
pro
teas
ein
volv
edin
the
activ
atio
no
fM
ous
eho
mo
zyg
ous
mut
ants
sho
wm
arke
db
rain
0.02
20.
040
0.55
00.
035
0.32
20.
109
Kui
da
etal
.,19
96th
eap
op
tosi
sp
athw
ayd
urin
gne
ural
vent
ricu
lar
zone
exp
ansi
on,
exen
cep
haly
,an
dp
recu
rso
rp
rolif
erat
ion
ecto
pic
neur
ona
lstr
uctu
res.
DV
L1D
ishe
velle
d1
AP
DZ
-do
mai
n-co
ntai
ning
pro
tein
Do
min
ant-
neg
ativ
em
utat
ion
ofD
ishe
velle
din
fro
g0.
009
0.13
70.
066
0.00
20.
100
0.02
0S
oko
l,19
96;
invo
lved
inth
eW
ntsi
gna
ling
pat
hway
caus
esfa
ilure
of
neur
alax
isfo
rmat
ion.
Mo
use
Lija
met
al.,
1997
hom
ozy
go
usm
utan
tssh
ow
def
ects
inso
cial
beh
avio
r,su
chas
hud
dlin
g,
whi
sker
trim
min
g,
and
nest
bui
ldin
g,
and
inse
nso
rim
oto
rg
atin
g.
LHX
1LI
Mho
meo
bo
x1
Atr
ansc
rip
tion
fact
or
esse
ntia
lin
Mo
use
hom
ozy
go
usm
utan
tsla
ckb
rain
and
oth
er0.
006
0.07
50.
080
0.00
20.
141
0.01
4S
haw
lot
etal
.,19
95o
rgan
izin
gth
ean
teri
or
stru
ctur
esan
teri
or
head
stru
ctur
es,
but
sho
wno
rmal
dur
ing
dev
elo
pm
ent
dev
elo
pm
ent
inth
ere
mai
ning
bo
dy
axis
.M
CP
H1
Mic
roce
pha
linIm
plic
ated
inth
eco
ntro
lof
bra
insi
ze,
Hum
anho
mo
zyg
ous
mut
atio
nle
ads
top
rim
ary
0.04
00.
048
0.83
30.
070
0.14
60.
479
Jack
son
etal
.,20
02p
resu
mab
lyb
yaf
fect
ing
the
pro
-m
icro
cep
haly
.lif
erat
ion
of
neur
alp
rog
enito
rsN
RC
AM
Neu
rona
lcel
lad
hesi
on
Ace
llad
hesi
on
mo
lecu
lein
volv
edin
Mo
use
hom
ozy
go
usm
utan
tssh
ow
failu
reo
f0.
019
0.08
50.
224
0.00
90.
177
0.05
1S
akur
aiet
al.,
2001
mo
lecu
led
evel
op
men
tals
igna
ling
of
the
cere
bel
lar
gra
nule
cells
toex
tend
neur
ites
nerv
ous
syst
emin
vitr
oan
dre
duc
edce
reb
ellu
msi
zein
vivo
.N
TR
K3
Neu
rotr
op
hic
tyro
sine
Aty
rosi
neki
nase
rece
pto
rfo
rne
uro
-M
ous
eho
mo
zyg
ous
mut
ants
fail
tod
evel
op
0.00
30.
068
0.04
40.
000
0.13
40.
000
Kle
inet
al.,
1994
kina
sere
cep
tor,
typ
e3
tro
phi
n3
pro
pri
oce
ptiv
ese
nso
ryne
uro
ns.
PA
FA
H1B
1P
late
let-
activ
atin
gfa
cto
rA
nac
etyl
hyd
rola
seim
plic
ated
inm
icro
-H
uman
hete
rozy
go
usm
utat
ions
caus
ese
vere
0.00
50.
048
0.10
40.
000
0.05
70.
000
Rei
ner
etal
.,19
93;
acet
ylhy
dro
lase
,1B
,tu
bul
efu
nctio
nd
urin
gne
uro
nal
def
ects
inne
uro
nalm
igra
tion,
lead
ing
tosi
gni
fi-C
ahan
aet
al.,
2001
alp
hasu
bun
itm
igra
tion
cant
lyre
duc
edb
rain
size
(mic
roce
pha
ly)
and
lack
of
bra
info
ldin
g(li
ssen
cep
haly
).M
ous
ehe
t-er
ozy
go
usm
utan
tssh
ow
imp
aire
dne
uro
nal
mig
ratio
nd
urin
gd
evel
op
men
t.S
HH
So
nic
hed
geh
og
Asi
gna
ling
mo
lecu
lein
volv
edin
spec
i-H
uman
hete
rozy
go
usm
utat
ions
caus
ese
vere
ly0.
029
0.09
10.
319
0.02
10.
163
0.12
9B
ello
niet
al.,
1996
;fy
ing
vent
rals
truc
ture
so
fth
ece
ntra
lre
duc
edb
rain
size
(mic
roce
pha
ly)a
ndfu
sio
no
fR
oes
sler
etal
.,19
96;
nerv
ous
syst
em,
and
ind
rivi
ngth
eth
etw
oce
reb
ralh
emis
phe
res
(ho
lop
ro-
Chi
ang
etal
.,19
96ex
pan
sio
no
fth
ed
evel
op
ing
bra
inse
ncep
haly
).M
ous
eho
mo
zyg
ous
mut
ants
lack
vent
rals
truc
ture
so
fthe
cent
raln
ervo
ussy
stem
,d
isp
lay
seve
reun
der
dev
elo
pm
ent
of
the
bra
inan
dho
lop
rose
ncep
haly
.P
hysi
olo
gic
alA
AN
AT
Ary
lalk
ylam
ine
An
enzy
me
that
conv
erts
sero
toni
nto
Mo
use
hom
ozy
go
usm
utan
ts(f
oun
dna
tura
llyin
0.03
20.
079
0.40
50.
023
0.26
60.
086
Ro
seb
oo
met
al.,
1998
N-a
cety
ltran
sfer
ase
N-a
cety
lser
oto
nin,
the
pen
ultim
ate
man
yin
bre
dlin
es)
have
alte
red
activ
ityle
vels
step
inm
elat
oni
nsy
nthe
sis
and
circ
adia
nb
ehav
ior.
AD
CY
AP
1A
den
ylyl
cycl
ase-
An
aden
ylyl
cycl
ase-
stim
ulat
ing
horm
one
Mo
use
hom
ozy
go
usm
utan
tssh
ow
rem
arka
ble
0.07
40.
113
0.65
50.
034
0.19
10.
178
Has
him
oto
etal
.,20
01ac
tivat
ing
pep
tide1
secr
eted
fro
mhy
po
thal
amus
beh
avio
ralc
hang
esin
clud
ing
hyp
erac
tivity
,ex
plo
sive
jum
pin
g,
incr
ease
dex
plo
rato
ryb
ehav
ior,
and
less
anxi
ety.
CH
RM
5A
cety
lcho
line
rece
pto
r,A
mem
ber
of
the
mus
cari
nic
sub
typ
eo
fM
ous
eho
mo
zyg
ous
mut
ants
sho
wd
efec
tive
0.02
10.
034
0.61
80.
018
0.11
80.
153
Yam
ada
etal
.,20
01m
usca
rini
c,5
acet
ylch
olin
ere
cep
tors
rew
ard
/with
dra
wal
resp
ons
eto
mo
rphi
ne,
and
failu
rein
acet
ylch
olin
e-m
edia
ted
dila
tion
of
cere
bra
lblo
od
vess
els.
Molecular Evolution of the Human Nervous System1035
Tab
le1.
Co
ntin
ued
.
Pri
mat
eR
od
ent
Gen
eG
ene
Cla
ssS
ymb
ol
Gen
eN
ame
Fun
ctio
nin
Ner
vous
Sys
tem
Ner
vous
Sys
tem
Phe
noty
pe
of
Mut
ants
Ka
Ks
Ka/
Ks
Ka
Ks
Ka/
Ks
Ref
eren
ces
CH
RN
A2
Cho
liner
gic
rece
pto
r,A
mem
ber
of
the
nico
tinic
sub
typ
eo
fN
ot
avai
lab
le.
0.03
60.
124
0.29
00.
016
0.33
90.
047
Elli
ott
etal
.,19
96ne
uro
naln
ico
tinic
,a2
acet
ylch
olin
e-g
ated
ion
chan
nels
CH
RN
A5
Cho
liner
gic
rece
pto
r,A
mem
ber
of
the
nico
tinic
sub
typ
eo
fN
ot
avai
lab
le.
0.01
50.
062
0.24
20.
011
0.28
90.
038
Bo
ulte
ret
al.,
1990
neur
ona
lnic
otin
ic,
a5ac
etyl
cho
line-
gat
edio
nch
anne
lsD
RD
2D
op
amin
ere
cep
tor
D2
Am
emb
ero
fth
ed
op
amin
ere
cep
tor
Mo
use
hom
ozy
go
usm
utan
tssh
ow
sup
pre
ssio
n0.
005
0.04
20.
119
0.00
00.
115
0.00
0M
ald
ona
do
etal
.,19
97;
fam
ilyo
fm
orp
hine
-med
iate
dre
war
db
ehav
ior
and
Bai
ket
al.,
1995
slo
wm
ove
men
tre
sem
blin
gP
arki
nso
nd
isea
se.
GR
IK4
Glu
tam
ate
rece
pto
r,A
mem
ber
of
the
kain
ate
sub
typ
eo
fN
ot
avai
lab
le.
0.00
30.
030
0.10
00.
002
0.12
30.
016
Szp
irer
etal
.,19
94io
notr
op
icka
inat
e,4
glu
tam
ate-
gat
edio
nch
anne
lsG
RIN
2AG
luta
mat
ere
cep
tor,
Am
emb
ero
fth
eN
MD
Asu
bty
pe
of
Mo
use
hom
ozy
go
usm
utan
tssh
ow
def
icits
in0.
008
0.06
30.
127
0.00
70.
164
0.04
3S
akim
ura
etal
.,19
95io
notr
op
icN
MD
A,
2Ag
luta
mat
e-g
ated
ion
chan
nels
spat
iall
earn
ing
and
syna
ptic
pla
stic
ity.
OP
RM
1O
xyto
cin
rece
pto
rA
G-p
rote
in-c
oup
led
rece
pto
rfo
rM
ous
eho
mo
zyg
ous
mut
ants
sho
wd
efec
tin
0.01
20.
049
0.24
50.
026
0.23
50.
111
Mat
thes
etal
.,19
96o
pio
idlig
and
sm
orp
hine
-med
iate
dan
alg
esia
and
rew
ard
resp
ons
e.U
ncla
ssifi
edC
SP
G3
Cho
ndro
itin
sulfa
teA
cho
ndro
itin
sulfa
tep
rote
og
lyca
nM
ous
eho
mo
zyg
ous
mut
ants
are
ove
rtly
norm
al,
0.02
90.
065
0.44
60.
059
0.18
80.
314
Zho
uet
al.,
2001
pro
teo
gly
can
3im
plic
ated
inne
uro
nala
dhe
sio
nw
ithm
ildd
efic
itsin
syna
ptic
pla
stic
ity.
and
mig
ratio
nD
PP
XD
ipep
tidyl
pep
tidas
eIV
Ad
ipep
tidyl
-pep
tidas
e-lik
ep
rote
inN
ot
avai
lab
le0.
008
0.07
60.
105
0.00
60.
181
0.03
3W
ada
etal
.,19
92re
late
dex
pre
ssed
pre
do
min
antly
inth
eb
rain
GD
I1G
DP
dis
soci
atio
nA
pro
tein
that
inhi
bits
RA
B-m
edia
ted
Hum
anm
utat
ions
caus
ese
vera
lfo
rms
of
0.00
20.
057
0.03
50.
000
0.14
20.
000
D’A
dam
oet
al.,
1998
,in
hib
itor
1G
DP
-GT
Pex
chan
ge
by
pre
vent
ing
X-l
inke
dno
nsp
ecifi
cm
enta
lret
ard
atio
n.20
02d
isso
ciat
ion
of
GD
Pfr
om
RA
BM
ous
eho
mo
zyg
ous
mut
ants
sho
wim
pai
red
sho
rt-t
erm
mem
ory
and
soci
alb
ehav
ior.
LYN
X1
Lynx
1A
neur
ona
lmem
bra
nem
ole
cule
hig
hly
No
tav
aila
ble
.0.
030
0.08
60.
349
0.00
00.
221
0.00
0M
iwa
etal
.,19
99ex
pre
ssed
inth
eb
rain
and
linke
dto
the
mo
dul
atio
no
fne
uro
naln
ico
tinic
acet
ylch
olin
ere
cep
tors
PE
G3
Pat
erna
llyex
pre
ssed
Am
ater
nally
imp
rint
edzi
ncfin
ger
pro
tein
Fem
ale
mut
ant
mic
esh
ow
imp
aire
dnu
rtur
ing
0.02
40.
077
0.31
20.
032
0.17
00.
188
Liet
al.,
1999
gen
e3
imp
licat
edin
the
TN
Fsi
gna
ling
pat
hway
beh
avio
ran
dre
duc
edm
ilkej
ectio
nd
ueto
red
uced
hyp
oth
alam
ico
xyto
cin
neur
ons
.T
TR
Tra
nsth
yret
inA
thyr
oid
horm
one
carr
ier
hig
hly
Mo
use
hom
ozy
go
usm
utan
tsha
vere
duc
ed0.
035
0.06
00.
583
0.04
10.
273
0.15
0E
pis
kop
ou
etal
.,19
93ex
pre
ssed
inch
oro
idp
lexu
san
dth
yro
idho
rmo
nele
vels
but
are
ove
rtly
norm
al.
cons
titut
ing
am
ajo
rp
rote
inco
m-
po
nent
of
cere
bro
spin
alflu
id
B.
Gen
esS
how
ing
Fas
ter
Evo
lutio
nin
Ro
den
ts
Dev
elo
pm
enta
lA
SC
L1A
chae
te-s
cute
com
ple
xA
tran
scri
ptio
nfa
cto
rin
volv
edin
the
Mo
use
hom
ozy
go
usm
utan
tsd
ieat
bir
than
d0.
000
0.11
10.
000
0.02
40.
189
0.12
7G
uille
mo
tet
al.,
1993
like
1d
evel
op
men
to
fo
lfact
ory
,au
tono
mic
,la
cko
lfact
ory
and
auto
nom
icne
uro
ns.
and
ente
ric
neur
ons
NE
UR
OD
2N
euro
gen
icd
iffer
entia
tion
2A
tran
scri
ptio
nfa
cto
rin
volv
edin
ind
ucin
gM
ous
eho
mo
zyg
ous
mut
ants
die
afe
ww
eeks
0.00
10.
049
0.02
00.
047
0.13
60.
346
Ols
enet
al.,
2001
neur
alp
recu
rso
rce
llsto
und
erg
one
u-af
ter
bir
than
dsh
ow
red
uced
cere
bel
lar
rona
ldiff
eren
tiatio
ng
ranu
lar
cell
laye
r.P
hysi
olo
gic
alP
PT
1P
alm
itoyl
-pro
tein
An
enzy
me
that
rem
ove
sp
alm
itate
Mo
use
hom
ozy
go
usm
utat
ions
dev
elo
pm
oto
r0.
000
0.05
40.
000
0.02
50.
253
0.25
3V
esa
etal
.,19
95;
thio
este
rase
1g
roup
sfr
om
lipid
-mo
difi
edp
rote
ins
def
ects
such
assp
astic
ityan
dd
ieb
y10
mo
nths
Gup
taet
al.,
2001
of
age.
Hum
anho
mo
zyg
ous
mut
atio
nsca
use
neur
ona
lcer
oid
lipo
fusc
ino
sis.

Cell1036
which this ascertainment bias would result in elevated fast outliers (i.e., those nervous system genes exhibitingsignificantly higher Ka/Ks in primates than in rodents) isKa/Ks in the human terminal branch. They showed thatconsiderably higher in the lineage leading from human-for the primate-fast outliers, ascertainment bias wouldmacaque ancestors to humans than the lineage leadingindeed lead to an average Ka/Ks of the human terminalto macaques. Furthermore, these same genes were alsobranch being higher than that of the chimpanzee branch.found to have evolved with much higher Ka/Ks in theHowever, the actual Ka/Ks disparity between the humanhuman terminal branch than the chimpanzee branchand the chimpanzee terminal branches is greater thanafter human-chimpanzee divergence. This disparity wasthat expected from ascertainment bias alone (p � 0.04;not seen in a control set of nervous system genes thatsee Experimental Procedures). This suggests that ascer-evolved at comparable rates between primates and ro-tainment bias is unlikely to fully account for—though itdents.clearly contributes to—the observed disparity in Ka/Ks
Fourth, mutations in many nervous system genes, in-between the human and the chimpanzee terminalcluding those with significantly higher Ka/Ks in primates,branches.have been shown to cause severe nervous system de-With sequences of the primate-fast outliers availablefects in humans (Table 1A). This obviously does notin four primate taxa (human, chimpanzee, macaque, andsupport the notion of functional relaxation in thesesquirrel monkey), we constructed a phylogenetic treegenes during human evolution.and calculated Ka/Ks for each segment of the tree (Figure
Fifth, there is no evidence of recent duplications in-6C). Clearly, the segments that lie along the lineagevolving any of the genes studied (data not shown), whichleading to humans (bolded in Figure 6C) have notablyrules out the possibility of increased genetic redundancyhigher Ka/Ks than segments that branch away fromfor these genes in primates.this lineage.
Finally, concurrent with the present study, more de-The above data reinforce the notion that Ka/Ks valuestailed evolutionary analyses were performed on twoof nervous system genes in primates are especially ele-genes included in this study, ASPM and MCPH1, whichvated in the lineage leading from ancestral primates tohave since been published by us and other groupshumans, and that this trend has likely continued through(Zhang, 2003; Evans et al., 2004b; Kouprina et al., 2004;recent human evolution.Evans et al., 2004a; Wang and Su, 2004). These detailedanalyses, motivated by the observation that these twoDiscussiongenes are involved critically and specifically in regulat-ing brain size during development (Bond et al., 2002;In this study, we examined the molecular evolution ofJackson et al., 2002), indeed revealed multiple lines ofan extensive set of nervous system-related genes inevidence in support of their adaptive evolution in pri-primates. We demonstrated that their average rate ofmates and particularly in the primate lineage leading toprotein evolution as scaled to neutral divergence (i.e.,humans. These include (1) significantly higher Ka/Ks inthe Ka/Ks ratio) is significantly higher in primates than inprimates than in nonprimate mammals in addition torodents. One possible interpretation is adaptive evolu-rodents, (2) much higher Ka/Ks in the primate lineage
tion of these genes in primates, but it could also be dueleading to humans than in the other primate lineages, (3)
to relaxed functional constraint. We note, however, thata preponderance of evolutionary signatures supporting
brain size and complexity are much greater in primatesthe presence of positive selection in the lineage leading
than in rodents, which likely places stiffer demands on to humans, such as Ka/Ks � 1 for portions of this lineagethe functional precision of genes. It is therefore difficult and highly significant departure from the neutral expec-to envision the relaxation of functional constraint as a tation of the McDonald-Kreitman test (McDonald andmajor force in the evolution of the primate nervous sys- Kreitman, 1991), and (4) evidence that strong positivetem. This argument notwithstanding, we sought addi- selection tends to be focused within specific domainstional evidence that might bolster the case of adap- of these genes. Other genes not included in this study,tive evolution. such as FOXP2, AHI1, and GLUD2, have also revealed
First, we examined a large set of housekeeping genes a possible link between alterations in protein sequencesand noted that there is no significant primate-rodent and phenotypic evolution of the human brain (Enard etdisparity in the Ka/Ks of these genes. This argues that the al., 2002b; Ferland et al., 2004; Burki and Kaessmann,primate-rodent Ka/Ks disparity seen in nervous system 2004).genes is not a nonspecific, genome-wide phenomenon. Collectively, the above results argue against the pos-
Second, we classified our nervous system genes into sibility of relaxed functional constraint on the primatefunctional categories. We found that the subgroup of nervous system. Instead, they are more consistent withnervous system genes with developmentally biased the interpretation that higher Ka/Ks of nervous systemfunctions displayed much greater primate-rodent Ka/Ks genes in primates—especially along the lineage leadingdisparity than the entire set of genes. In contrast, the to humans—is a reflection of adaptive evolution.Ka/Ks of genes that function predominantly in the routine Indeed, as first recognized by Charles Darwin, adap-physiological operations and maintenance of the ner- tive evolution must have played a key role in drivingvous system showed much less primate-rodent dispar- the acquisition of greater cognitive powers in humansity. The latter observation argues against reduced func- (Darwin, 1871). It is therefore reasonable to supposetional constraint on the primate nervous system per se, that positive selection on genes involved in nervousand together, these results are more consistent with the system biology should have operated more intenselynotion of adaptive evolution. during the descent of humans than in species showing
less dramatic cognitive evolution. However, researchersThird, we found that the average Ka/Ks of primate-

Molecular Evolution of the Human Nervous System1037
have not been able to make a priori predictions regard- higher average rate of protein evolution as scaled toing how intensified selection on the nervous system neutral divergence in primates than in rodents. Second,might have molded the molecular evolution of the pri- such a trend is contributed to by a large number ofmate genome. For example, it has remained a matter genes. Third, this trend is most prominent for genesof speculation as to whether brain evolution involved a implicated in the development of the nervous system.small number of key mutations in a few genes or a very Fourth, within primates, the evolution of these genes islarge number of mutations in many genes (Carroll, 2003). especially accelerated in the lineage leading to humans.It was also not known whether evolutionarily important Based on these themes, we argue that accelerated pro-mutations have occurred predominantly in regulatory tein evolution in a large cohort of nervous system genes,sequences or coding regions (King and Wilson, 1975; which is particularly pronounced for genes involved inMcConkey et al., 2000; McConkey, 2002; Olson and nervous system development, represents a salient ge-Varki, 2003; Carroll, 2003), though preliminary data sug- netic correlate to the profound changes in brain sizegest that gene expression patterns of the human brain and complexity during primate evolution, especiallymight have evolved rapidly (Enard et al., 2002a; Caceres along the lineage leading to Homo sapiens. Besideset al., 2003; Uddin et al., 2004). Whereas our study does revealing broad evolutionary themes, our study alsonot address all these important questions, it does argue identified a set of genes whose molecular evolutionthat the evolution of the brain in primates and particularly might have contributed to the phenotypic evolution ofhumans is likely contributed to by a large number of the brain in primates. In-depth analyses of these genesmutations in the coding regions of many underlying might yield further insights into how changes in specificgenes, especially genes with developmentally biased genes contribute to the emergence of primate- or hu-functions. man-specific traits.
Might genes involved in tissues other than the nervousExperimental Proceduressystem also display accelerated evolution in primates?
We argue that this is a distinct possibility given theSequence Acquisitionprecedent found in nervous system genes. In particular,Standard RT-PCR protocols were employed to amplify coding se-accelerated evolution of genes might be found in tissuequences from the Old World monkey, crab-eating macaque (Macaca
systems that are especially relevant to the adaptation fascicularis), followed by sequencing of PCR product. Ampliconsof primates, such as the immune system, the digestive were designed to be 500–700 bp in length with a minimum of 50–75system, the reproductive system, the integumentary bp of overlap between adjacent amplicons. Nervous system genes
were amplified from cDNA combined from all major regions of thesystem, and the skeletal system.brain. Housekeeping genes were amplified from cDNA combinedRecent discussions surrounding the genetic origin offrom the heart, lung, liver, kidney, and the pooled brain sample.humans have placed a great emphasis on human-chim-Squirrel monkey (Saimiri boliviensis) sequences were obtained in a
panzee comparative genomics. Undoubtedly, this ap- similar manner from brain tissue. For chimpanzee (Pan troglodytes),proach has revealed—and will continue to reveal— amplification was performed on genomic DNA. PCR primers to am-genetic differences that might underlie the biological plify nonhuman primate genes were designed based on orthologous
human cDNA sequences. If a particular set of primers failed, newdistinctions between these two sister species (Chou etprimers would be designed until successful primers were obtained.al., 1998, 2002; Enard et al., 2002b; Clark et al., 2003;In rare cases of single-nucleotide polymorphisms, the derived alleleStedman et al., 2004). Because of the exceedingly highwas ignored because it did not represent fixed difference betweendegree of sequence identity between human and chim-species. Additional sequences, including human, chimpanzee, ma-
panzee genomes, however, comparative studies often caque, squirrel monkey, rat, and mouse, were obtained from pub-lack statistical power, and in many cases would overlook lic databases.genetic differences that bear biological relevance. The
Inference of Ancestral Sequencesissue of weak statistical power in human-chimpanzeeThe human-macaque and the human-chimpanzee ancestral se-sequence comparisons has been noted before (Shi etquences were inferred using the PAMP program available in theal., 2003) and is supported by our simulation studiesPAML v.3.13 software package as previously described (Yang et al.,showing that the average stochastic variance in Ks as1995). Orthologous sequences from human, macaque, and squirrel
a fraction of the true underlying mutation rate is about monkey were used to infer the human-macaque ancestral se-twice in human-chimpanzee comparison as it is in hu- quences. Similarly, orthologous sequences from human, chimpan-man-macaque comparison (our unpublished data). Rel- zee, and macaque were used to infer the human-chimpanzee ances-
tral sequences. In rare cases where there was ambiguity in inferringative to human-chimpanzee comparisons, our approachthe ancestral nucleotide (i.e., the three taxa each had a differentoffers two important advantages. First, the use of a morenucleotide at a given position), the corresponding codon was disre-distant primate species for comparison with humansgarded from the analysis. To obtain Ka/Ks of a terminal phylogeneticprovides the much needed statistical power for de-branch, inferred sequences at the ancestral node of the branch were
termining the evolutionary significance of sequence compared with sequences at the terminal node. To obtain Ka/Ks ofchanges. Second, the use of nonprimate mammals as an internal branch, inferred sequences at one ancestral node were“controls” allows for the identification of primate-spe- compared with inferred sequences at the other ancestral node.cific evolutionary signatures. We therefore propose that
Sequence Analysis and Tests of Statistical Significanceour methodology is a valuable complement to human-Orthologous coding sequences were aligned in frame using thechimpanzee comparisons in probing the genetic basisPileup and Framealign programs from the Wisconsin Package v10.2of human origins.(Accelrys Inc., San Diego, California). The Diverge program from the
In summary, our study revealed the following broad same package was employed to calculate evolutionary parametersthemes that characterize the molecular evolution of the by the Li method (Li, 1993), including the total numbers of nonsynon-nervous system in primates and particularly in humans. ymous (A ) and synonymous (S ) substitutions corrected for multiple
hits and transition/transversion bias, and Ka and Ks. The averageFirst, genes underlying nervous system biology exhibit

Cell1038
Ka/Ks for a group of genes was calculated as the ratio of average chimpanzee terminal branches that was as great as or greater thanthe observed disparity.Ka and average Ks. The error bar of average Ka/Ks was generated
by bootstrap simulation. To evaluate the statistical significance thatthe evolutionary rates of a group of genes differ between two lin- Acknowledgmentseages, a 2 � 2 contingency table was built, with the four entriesbeing the total A and S values in either of the two lineages. Two- We are indebted to L.G. Chemnick and O.A. Ryder at the Centertailed Fisher’s exact test was then applied to the table to obtain for Reproduction of Endangered Species (CRES) of the Zoologicalstatistical significance that evolutionary rates differed between the Society of San Diego, S. Gibson at the Squirrel Monkey Breedingtwo lineages. One-tailed Fisher’s exact test was used to test the and Research Resource at the University of Southern Alabama, andsignificance by which an individual gene had significantly higher U. Bass and H. McClure at the Yerkes National Primate ResearchKa/Ks in one lineage versus the other. Given that this test utilizes Center at Emory University for providing precious tissue samples.the total numbers of nonsynonymous and synonymous changes, it We are grateful to C. Abraczinskas, C. Field, and S. Gould for illustra-is possible that a gene might have substantially higher Ka/Ks in one tions. This work was supported in part by the William Rainey Harperlineage than in the other, and yet the difference does not reach Fellowship (to S.D.) and the Searle Scholarship and the Burroughsstatistical significance because the total numbers of nonsynony- Wellcome Career Award (to B.T.L.).mous and synonymous substitutions are low (as in short genes).Conversely, it is also possible that the Ka/Ks of a gene is only moder- Received: April 17, 2004ately higher in one lineage than in the other, and yet the difference is Revised: August 18, 2004statistically significant because of the large number of substitutions Accepted: October 20, 2004involved (as in long genes). To evaluate the significance of the in- Published: December 28, 2004equality in the number of genes with higher Ka/Ks in one lineageversus the number of genes with higher Ka/Ks in the other lineage, Referencesthe two-tailed binomial test was used. To assess the significancethat two sets of Ka/Ks values had distinct distributions, we used Aiello, L.C., and Dean, C. (1990). An Introduction to Human Evolu-the nonparametric Wilcoxon signed-rank test, which evaluated the tionary Anatomy (London: Academic Press).likelihood of the null hypothesis that two sets of paired data were
Armstrong, E., and Falk, D. (1982). Primate Brain Evolution: Methodsdrawn from the same underlying distribution (Hollander and Wolfe,and Concepts (New York: Plenum Press).1999). We also used the nonparametric Kolmogorov-Smirnov testBaik, J.H., Picetti, R., Saiardi, A., Thiriet, G., Dierich, A., Depaulis,for the same purpose (Hollander and Wolfe, 1999), which in all casesA., Le Meur, M., and Borrelli, E. (1995). Parkinsonian-like locomotorconfirmed the results of the Wilcoxon test.impairment in mice lacking dopamine D2 receptors. Nature 377,424–428.
Computer Simulations Belloni, E., Muenke, M., Roessler, E., Traverso, G., Siegel-Bartelt,Simulations were performed to assess the extent to which the ascer- J., Frumkin, A., Mitchell, H.F., Donis-Keller, H., Helms, C., Hing, A.V.,tainment of the primate-fast outliers would elevate the Ka/Ks of these et al. (1996). Identification of Sonic hedgehog as a candidate genegenes in the human terminal branch (i.e., from human-chimpanzee responsible for holoprosencephaly. Nat. Genet. 14, 353–356.ancestors to humans) relative to the chimpanzee terminal branch.
Bond, J., Roberts, E., Mochida, G.H., Hampshire, D.J., Scott, S.,We considered a phylogenetic tree as depicted in SupplementalAskham, J.M., Springell, K., Mahadevan, M., Crow, Y.J., Markham,Figure S1 at http//www.cell.com/cgi/content/full/119/7/1027/DC1/.A.F., et al. (2002). ASPM is a major determinant of cerebral corticalFour lineages in this tree were germane to the analysis: human-size. Nat. Genet. 32, 316–320.chimpanzee ancestor to human, human-chimpanzee ancestor toBoulter, J., O’Shea-Greenfield, A., Duvoisin, R.M., Connolly, J.G.,chimpanzee, human-chimpanzee ancestor to macaque, and rat toWada, E., Jensen, A., Gardner, P.D., Ballivet, M., Deneris, E.S., andmouse. The levels of neutral divergence in these four lineages wereMcKinnon, D. (1990). Alpha 3, alpha 5, and beta 4: three membersset at a ratio of 6:6:62:174. This ratio was set according to publishedof the rat neuronal nicotinic acetylcholine receptor-related genegenome-typical Ks rates, which are 0.012 between human and chim-family form a gene cluster. J. Biol. Chem. 265, 4472–4482.panzee (Chen et al., 2001), 0.068 between human and macaque (Yi
et al., 2002), and 0.174 between rat and mouse (Gibbs et al., 2004). Brodmann, K. (1912). Ergebnisse uber die vergleichende histolog-For each outlier gene, we performed simulations under the null ische lokalisation der grosshirnrinde mit besonderer berucksichti-assumption that the substitution rate (either nonsynonymous or syn- gung des stirnhirns. Anat. Anz. Suppl. 41, 157–216.onymous) after scaling to neutral divergence is constant across
Burki, F., and Kaessmann, H. (2004). Birth and adaptive evolutionall four lineages. By this assumption, any enrichment or deficit of
of a hominoid gene that supports high neurotransmitter flux. Nat.substitutions in a given lineage (including situations that would pro-
Genet. 36, 1061–1063.duce significantly higher human-macaque Ka/Ks than rat-mouse
Byrne, R.W., and Whiten, A. (1988). Machiavellian Intelligence: SocialKa/Ks) is the result of stochastic fluctuation. As the first step of theExpertise and the Evolution of Intellect in Monkeys, Apes, and Hu-simulation, the total numbers of nonsynonymous (A ) and synony-mans (Oxford: Clarendon Press).mous (S ) substitutions of the gene observed for both the human-Caceres, M., Lachuer, J., Zapala, M.A., Redmond, J.C., Kudo, L.,to-macaque and the rat-to-mouse lineages were summed. The re-Geschwind, D.H., Lockhart, D.J., Preuss, T.M., and Barlow, C. (2003).sulting numbers were then scaled up by 6/242 to correct for theElevated gene expression levels distinguish human from non-humanaddition of the chimpanzee terminal branch in the phylogeny. Theseprimate brains. Proc. Natl. Acad. Sci. USA 100, 13030–13035.corrected A and S numbers were apportioned onto the four lineages
based on the 6:6:62:174 ratio to obtain the number of substitutions Cahana, A., Escamez, T., Nowakowski, R.S., Hayes, N.L., Giacobini,on each lineage as expected under the null assumption of equal M., von Holst, A., Shmueli, O., Sapir, T., McConnell, S.K., Wurst,evolutionary rates across lineages. For an individual lineage, simula- W., et al. (2001). Targeted mutagenesis of Lis1 disrupts corticaltion was performed to generate the number of substitutions that development and LIS1 homodimerization. Proc. Natl. Acad. Sci. USAfollowed the Poisson distribution and with a mean being the ex- 98, 6429–6434.pected number of substitutions. The subset of repetitions for which
Carroll, S.B. (2003). Genetics and the making of Homo sapiens.the human-macaque A and S numbers match that observed for
Nature 422, 849–857.the gene was selected for further analysis. This procedure was
Chen, F.C., Vallender, E.J., Wang, H., Tzeng, C.S., and Li, W.H.performed for all the primate-fast outliers, which produced one(2001). Genomic divergence between human and chimpanzee esti-aforementioned subset of simulated data per gene. One data pointmated from large-scale alignments of genomic sequences. J. Hered.per subset was then randomly selected to create a simulated outlier92, 481–489.data set. By generating 100,000 such simulated outlier data sets,
we were able to obtain the probability by which a simulated outlier Chiang, C., Litingtung, Y., Lee, E., Young, K.E., Corden, J.L., West-phal, H., and Beachy, P.A. (1996). Cyclopia and defective axial pat-data set produced A/S ratio disparity between the human and the

Molecular Evolution of the Human Nervous System1039
terning in mice lacking Sonic hedgehog gene function. Nature required for the early development of olfactory and autonomic neu-rons. Cell 75, 463–476.383, 407–413.
Chou, H.H., Takematsu, H., Diaz, S., Iber, J., Nickerson, E., Wright, Gupta, P., Soyombo, A.A., Atashband, A., Wisniewski, K.E., Shelton,J.M., Richardson, J.A., Hammer, R.E., and Hofmann, S.L. (2001).K.L., Muchmore, E.A., Nelson, D.L., Warren, S.T., and Varki, A. (1998).
A mutation in human CMP-sialic acid hydroxylase occurred after the Disruption of PPT1 or PPT2 causes neuronal ceroid lipofuscinosisin knockout mice. Proc. Natl. Acad. Sci. USA 98, 13566–13571.Homo- Pan divergence. Proc. Natl. Acad. Sci. USA 95, 11751–11756.
Chou, H.H., Hayakawa, T., Diaz, S., Krings, M., Indriati, E., Leakey, Hashimoto, H., Shintani, N., Tanaka, K., Mori, W., Hirose, M., Mat-suda, T., Sakaue, M., Miyazaki, J., Niwa, H., Tashiro, F., et al. (2001).M., Paabo, S., Satta, Y., Takahata, N., and Varki, A. (2002). Inactiva-
tion of CMP-N-acetylneuraminic acid hydroxylase occurred prior to Altered psychomotor behaviors in mice lacking pituitary adenylatecyclase-activating polypeptide (PACAP). Proc. Natl. Acad. Sci. USAbrain expansion during human evolution. Proc. Natl. Acad. Sci. USA
99, 11736–11741. 98, 13355–13360.
Hollander, M., and Wolfe, D.A. (1999). Nonparametric statisticalClark, A.G., Glanowski, S., Nielsen, R., Thomas, P.D., Kejariwal, A.,Todd, M.A., Tanenbaum, D.M., Civello, D., Lu, F., Murphy, B., et methods (New York: John Wiley and Sons).al. (2003). Inferring nonneutral evolution from human-chimp-mouse Jackson, A.P., Eastwood, H., Bell, S.M., Adu, J., Toomes, C., Carr,orthologous gene trios. Science 302, 1960–1963. I.M., Roberts, E., Hampshire, D.J., Crow, Y.J., Mighell, A.J., et al.
(2002). Identification of microcephalin, a protein implicated in de-D’Adamo, P., Menegon, A., Lo Nigro, C., Grasso, M., Gulisano, M.,Tamanini, F., Bienvenu, T., Gedeon, A.K., Oostra, B., Wu, S.K., et al. termining the size of the human brain. Am. J. Hum. Genet. 71,
136–142.(1998). Mutations in GDI1 are responsible for X-linked non-specificmental retardation. Nat. Genet. 19, 134–139. Jerison, J.H. (1973). Evolution of the Brain and Intelligence (New
York: Academic Press).D’Adamo, P., Welzl, H., Papadimitriou, S., Raffaele di Barletta, M.,Tiveron, C., Tatangelo, L., Pozzi, L., Chapman, P.F., Knevett, S.G., King, M.C., and Wilson, A.C. (1975). Evolution at two levels in humansRamsay, M.F., et al. (2002). Deletion of the mental retardation gene and chimpanzees. Science 188, 107–116.Gdi1 impairs associative memory and alters social behavior in mice.
Klein, R., Silos-Santiago, I., Smeyne, R.J., Lira, S.A., Brambilla, R.,Hum. Mol. Genet. 11, 2567–2580.
Bryant, S., Zhang, L., Snider, W.D., and Barbacid, M. (1994). Disrup-Darwin, C. (1871). The Descent of Man, and Selection in Relation tion of the neurotrophin-3 receptor gene trkC eliminates la muscleto Sex (New York: D. Appleton and Company). afferents and results in abnormal movements. Nature 368, 249–251.Duret, L., and Mouchiroud, D. (2000). Determinants of substitution Kouprina, N., Pavlicek, A., Mochida, G.H., Solomon, G., Gersch, W.,rates in mammalian genes: expression pattern affects selection in- Yoon, Y.H., Collura, R., Ruvolo, M., Barrett, J.C., Woods, C.G., ettensity but not mutation rate. Mol. Biol. Evol. 17, 68–74. al. (2004). Accelerated evolution of the ASPM gene controlling brain
size begins prior to human brain expansion. PLoS Biol. 2(5): e126Elliott, K.J., Ellis, S.B., Berckhan, K.J., Urrutia, A., Chavez-Noriega,DOI:10.1371/journal.pbio.0020126.L.E., Johnson, E.C., Velicelebi, G., and Harpold, M.M. (1996). Com-
parative structure of human neuronal alpha 2-alpha 7 and beta Kuida, K., Zheng, T.S., Na, S., Kuan, C., Yang, D., Karasuyama, H.,2-beta 4 nicotinic acetylcholine receptor subunits and functional Rakic, P., and Flavell, R.A. (1996). Decreased apoptosis in the brainexpression of the alpha 2, alpha 3, alpha 4, alpha 7, beta 2, and and premature lethality in CPP32-deficient mice. Nature 384,beta 4 subunits. J. Mol. Neurosci. 7, 217–228. 368–372.Enard, W., Khaitovich, P., Klose, J., Zollner, S., Heissig, F., Giava- Kumar, S., and Hedges, S.B. (1998). A molecular timescale for verte-lisco, P., Nieselt-Struwe, K., Muchmore, E., Varki, A., Ravid, R., et al. brate evolution. Nature 392, 917–920.(2002a). Intra- and interspecific variation in primate gene expression
Li, W.H. (1993). Unbiased estimation of the rates of synonymouspatterns. Science 296, 340–343.
and nonsynonymous substitution. J. Mol. Evol. 36, 96–99.Enard, W., Przeworski, M., Fisher, S.E., Lai, C.S., Wiebe, V., Kitano,
Li, W.H. (1997). Molecular Evolution (Sunderland, Massachusetts:T., Monaco, A.P., and Paabo, S. (2002b). Molecular evolution of
Sinauer Associates).FOXP2, a gene involved in speech and language. Nature 418,
Li, L., Keverne, E.B., Aparicio, S.A., Ishino, F., Barton, S.C., and869–872.Surani, M.A. (1999). Regulation of maternal behavior and offspring
Episkopou, V., Maeda, S., Nishiguchi, S., Shimada, K., Gaitanaris,growth by paternally expressed Peg3. Science 284, 330–333.
G.A., Gottesman, M.E., and Robertson, E.J. (1993). Disruption of theLijam, N., Paylor, R., McDonald, M.P., Crawley, J.N., Deng, C.X.,transthyretin gene results in mice with depressed levels of plasmaHerrup, K., Stevens, K.E., Maccaferri, G., McBain, C.J., Sussman,retinol and thyroid hormone. Proc. Natl. Acad. Sci. USA 90, 2375–D.J., and Wynshaw-Boris, A. (1997). Social interaction and sensori-2379.motor gating abnormalities in mice lacking Dvl1. Cell 90, 895–905.
Evans, P.D., Anderson, J.R., Vallender, E.J., Choi, S.S., and Lahn,Maldonado, R., Saiardi, A., Valverde, O., Samad, T.A., Roques, B.P.,B.T. (2004a). Reconstructing the evolutionary history of Microcepha-and Borrelli, E. (1997). Absence of opiate rewarding effects in micelin, a gene controlling human brain size. Hum. Mol. Genet. 13, 1139–lacking dopamine D2 receptors. Nature 388, 586–589.1145.Matsuzawa, T. (2001). Primate Origins of Human Cognition and Be-Evans, P.D., Anderson, J.R., Vallender, E.J., Gilbert, S.L., Malcom,havior (Tokyo: Springer-Verlag).C.M., Dorus, S., and Lahn, B.T. (2004b). Adaptive evolution of ASPM,
a major determinant of cerebral cortical size in humans. Hum. Mol. Matthes, H.W., Maldonado, R., Simonin, F., Valverde, O., Slowe, S.,Kitchen, I., Befort, K., Dierich, A., Le Meur, M., Dolle, P., et al. (1996).Genet. 13, 489–494.Loss of morphine-induced analgesia, reward effect and withdrawalFerland, R.J., Eyaid, W., Collura, R.V., Tully, L.D., Hill, R.S., Al-Nouri,symptoms in mice lacking the mu-opioid-receptor gene. NatureD., Al-Rumayyan, A., Topcu, M., Gascon, G., Bodell, A., et al. (2004).383, 819–823.Abnormal cerebellar development and axonal decussation due to
mutations in AHI1 in Joubert syndrome. Nat. Genet. 36, 1008–1013. McConkey, E. (2002). A project on gene expression during primatedevelopment is urgently needed. Trends Genet. 18, 446.Finlay, B.L., and Darlington, R.B. (1995). Linked regularities in the
development and evolution of mammalian brains. Science 268, McConkey, E.H., Fouts, R., Goodman, M., Nelson, D., Penny, D.,Ruvolo, M., Sikela, J., Stewart, C.B., Varki, A., and Wise, S. (2000).1578–1584.Proposal for a human genome evolution project. Mol. Phylogenet.Gibbs, R.A., Weinstock, G.M., Metzker, M.L., Muzny, D.M., Soder-Evol. 15, 1–4.gren, E.J., Scherer, S., Scott, G., Steffen, D., Worley, K.C., Burch,
P.E., et al. (2004). Genome sequence of the Brown Norway rat yields McDonald, J.H., and Kreitman, M. (1991). Adaptive protein evolutionat the Adh locus in Drosophila. Nature 351, 652–654.insights into mammalian evolution. Nature 428, 493–521.
Guillemot, F., Lo, L.C., Johnson, J.E., Auerbach, A., Anderson, D.J., Messier, W., and Stewart, C.B. (1997). Episodic adaptive evolutionof primate lysozymes. Nature 385, 151–154.and Joyner, A.L. (1993). Mammalian achaete-scute homolog 1 is
Cell1040
Miwa, J.M., Ibanez-Tallon, I., Crabtree, G.W., Sanchez, R., Sali, A., Vesa, J., Hellsten, E., Verkruyse, L.A., Camp, L.A., Rapola, J., San-tavuori, P., Hofmann, S.L., and Peltonen, L. (1995). Mutations in theRole, L.W., and Heintz, N. (1999). lynx1, an endogenous toxin-like
modulator of nicotinic acetylcholine receptors in the mammalian palmitoyl protein thioesterase gene causing infantile neuronal ceroidlipofuscinosis. Nature 376, 584–587.CNS. Neuron 23, 105–114.
Wada, K., Yokotani, N., Hunter, C., Doi, K., Wenthold, R.J., andNoback, C.R., and Montagna, W. (1970). The Primate Brain (NewShimasaki, S. (1992). Differential expression of two distinct formsYork: Meredith Corporation).of mRNA encoding members of a dipeptidyl aminopeptidase family.Olson, M.V., and Varki, A. (2003). Sequencing the chimpanzee ge-Proc. Natl. Acad. Sci. USA 89, 197–201.nome: insights into human evolution and disease. Nat. Rev. Genet.Walker, A., Falk, D., Smith, R., and Pickford, M. (1983). The skull of4, 20–28.Proconsul africanus: reconstruction and cranial capacity. NatureOlson, J.M., Asakura, A., Snider, L., Hawkes, R., Strand, A., Stoeck,305, 525–527.J., Hallahan, A., Pritchard, J., and Tapscott, S.J. (2001). NeuroD2 isWang, Y.Q., and Su, B. (2004). Molecular evolution of microcephalin,necessary for development and survival of central nervous systema gene determining human brain size. Hum. Mol. Genet. 13, 1131–neurons. Dev. Biol. 234, 174–187.1137.Pagel, M.D., and Harvey, P.H. (1989). Taxonomic differences in theWilliams, M.F. (2002). Primate encephalization and intelligence.scaling of brain on body weight among mammals. Science 244,Med. Hypotheses 58, 284–290.1589–1593.Yamada, M., Lamping, K.G., Duttaroy, A., Zhang, W., Cui, Y., Bymas-Reiner, O., Carrozzo, R., Shen, Y., Wehnert, M., Faustinella, F., Do-ter, F.P., McKinzie, D.L., Felder, C.C., Deng, C.X., Faraci, F.M., andbyns, W.B., Caskey, C.T., and Ledbetter, D.H. (1993). Isolation of aWess, J. (2001). Cholinergic dilation of cerebral blood vessels isMiller-Dieker lissencephaly gene containing G protein beta-subunit-abolished in M(5) muscarinic acetylcholine receptor knockout mice.like repeats. Nature 364, 717–721.Proc. Natl. Acad. Sci. USA 98, 14096–14101.Roessler, E., Belloni, E., Gaudenz, K., Jay, P., Berta, P., Scherer,Yang, Z., Kumar, S., and Nei, M. (1995). A new method of inferenceS.W., Tsui, L.C., and Muenke, M. (1996). Mutations in the humanof ancestral nucleotide and amino acid sequences. Genetics 141,Sonic Hedgehog gene cause holoprosencephaly. Nat. Genet. 14,1641–1650.357–360.Yi, S., Ellsworth, D.L., and Li, W.H. (2002). Slow molecular clocks inRoseboom, P.H., Namboodiri, M.A., Zimonjic, D.B., Popescu, N.C.,Old World monkeys, apes, and humans. Mol. Biol. Evol. 19, 2191–Rodriguez, I.R., Gastel, J.A., and Klein, D.C. (1998). Natural melato-2198.nin ‘knockdown’ in C57BL/6J mice: rare mechanism truncates sero-Zhang, J. (2003). Evolution of the human ASPM gene, a major deter-tonin N-acetyltransferase. Brain Res. Mol. Brain Res. 63, 189–197.minant of brain size. Genetics 165, 2063–2070.Sakimura, K., Kutsuwada, T., Ito, I., Manabe, T., Takayama, C., Ku-Zhou, X.H., Brakebusch, C., Matthies, H., Oohashi, T., Hirsch, E.,shiya, E., Yagi, T., Aizawa, S., Inoue, Y., Sugiyama, H., et al. (1995).Moser, M., Krug, M., Seidenbecher, C.I., Boeckers, T.M., Rauch, U.,Reduced hippocampal LTP and spatial learning in mice lackinget al. (2001). Neurocan is dispensable for brain development. Mol.NMDA receptor epsilon 1 subunit. Nature 373, 151–155.Cell. Biol. 21, 5970–5978.Sakurai, T., Lustig, M., Babiarz, J., Furley, A.J., Tait, S., Brophy,
P.J., Brown, S.A., Brown, L.Y., Mason, C.A., and Grumet, M. (2001).Overlapping functions of the cell adhesion molecules Nr-CAM andL1 in cerebellar granule cell development. J. Cell Biol. 154, 1259–1273.
Shawlot, W., and Behringer, R.R. (1995). Requirement for Lim1 inhead-organizer function. Nature 374, 425–430.
Shi, J., Xi, H., Wang, Y., Zhang, C., Jiang, Z., Zhang, K., Shen, Y.,Jin, L., Yuan, W., Lin, J., et al. (2003). Divergence of the genes onhuman chromosome 21 between human and other hominoids andvariation of substitution rates among transcription units. Proc. Natl.Acad. Sci. USA 100, 8331–8336.
Sokol, S.Y. (1996). Analysis of Dishevelled signalling pathways dur-ing Xenopus development. Curr. Biol. 6, 1456–1467.
Springer, M.S., Murphy, W.J., Eizirik, E., and O’Brien, S.J. (2003).Placental mammal diversification and the Cretaceous-Tertiaryboundary. Proc. Natl. Acad. Sci. USA 100, 1056–1061.
Spuhler, J.N. (1959). The Evolution of Man’s Capacity for Culture(Detroit, MI: Wayne State University Press).
Stedman, H.H., Kozyak, B.W., Nelson, A., Thesier, D.M., Su, L.T.,Low, D.W., Bridges, C.R., Shrager, J.B., Minugh-Purvis, N., andMitchell, M.A. (2004). Myosin gene mutation correlates with anatomi-cal changes in the human lineage. Nature 428, 415–418.
Szpirer, C., Molne, M., Antonacci, R., Jenkins, N.A., Finelli, P.,Szpirer, J., Riviere, M., Rocchi, M., Gilbert, D.J., and Copeland, N.G.(1994). The genes encoding the glutamate receptor subunits KA1and KA2 (GRIK4 and GRIK5) are located on separate chromosomesin human, mouse, and rat. Proc. Natl. Acad. Sci. USA 91, 11849–11853.
Uddin, M., Wildman, D.E., Liu, G., Xu, W., Johnson, R.M., Hof, P.R.,Kapatos, G., Grossman, L.I., and Goodman, M. (2004). Sister group-ing of chimpanzees and humans as revealed by genome-wide phylo-genetic analysis of brain gene expression profiles. Proc. Natl. Acad.Sci. USA 101, 2957–2962.
Velculescu, V.E., Madden, S.L., Zhang, L., Lash, A.E., Yu, J., Rago,C., Lal, A., Wang, C.J., Beaudry, G.A., Ciriello, K.M., et al. (1999).Analysis of human transcriptomes. Nat. Genet. 23, 387–388.