Abundant Pleiotropy in Human Complex Diseases and Traits
12
ARTICLE Abundant Pleiotropy in Human Complex Diseases and Traits Shanya Sivakumaran, 1,6 Felix Agakov, 1,2,6 Evropi Theodoratou, 1,6 James G. Prendergast, 3 Lina Zgaga, 1,4 Teri Manolio, 5 Igor Rudan, 1 Paul McKeigue, 1 James F. Wilson, 1 and Harry Campbell 1, * We present a systematic review of pleiotropy among SNPs and genes reported to show genome-wide association with common complex diseases and traits. We find abundant evidence of pleiotropy; 233 (16.9%) genes and 77 (4.6%) SNPs show pleiotropic effects. SNP pleio- tropic status was associated with gene location (p ¼ 0.024; pleiotropic SNPs more often exonic [14.5% versus 4.9% for nonpleiotropic, trait-associated SNPs] and less often intergenic [15.8% versus 23.6%]), ‘‘predicted transcript consequence’’ (p ¼ 0.001; pleiotropic SNPs more often predicted to be structurally deleterious [5% versus 0.4%] but not more often in regulatory sequences), and certain disease classes. We develop a method to calculate the likelihood that pleiotropic links between traits occurred more often than expected and demonstrate that this approach can identify etiological links that are already known (such as between fetal hemoglobin and malaria risk) and those that are not yet established (e.g., between plasma campesterol levels and gallstones risk; and between immunoglobulin A and juvenile idiopathic arthritis). Examples of pleiotropy will accumulate over time, but it is already clear that pleiotropy is a common property of genes and SNPs associated with disease traits, and this will have implications for identification of molecular targets for drug development, future genetic risk-profiling, and classification of diseases. Introduction Pleiotropy occurs when one gene has an effect on multiple phenotypes. The molecular mechanisms of pleiotropy can be dichotomized into multiple molecular functions of a single gene product and multiple consequences of a single molecular function. 1–3 Although pleiotropy in the genetic architecture of complex disease has been proposed, 4 to date, evidence for its presence has not been systematically evaluated despite suggestions that this could be useful. 5,6 Previous assessments of a shared genetic basis between multiple phenotypes have been confined to restricted anal- yses in (1) specific traits, including immune-mediated diseases; 7 seven diseases studied by the Wellcome Trust Case Control Consortium genome-wide association study (GWAS) 8 including Crohn disease (IBD1 [MIM 266600]); 9 blood pressure and selected hematological traits studied by the Cohorts for Heart and Aging Research in Genomic Epidemiology consortium; 10 and pancreatic cancer [MIM 260350]; 11 (2) single-trait GWASs; 12,13 and (3) a recent phe- nome-wide scan to discover gene-disease associations. 14 The National Human Genome Research Institute’s (NHGRI) Catalog of Published GWAS 15 is a comprehensive resource listing statistically significant SNP-trait associa- tions significant at p < 1 3 10 5 from all GWAS publica- tions that attempt to assay at least 100,000 SNPs. If a study did not report a combined p value, the p value from the largest sample size was recorded in the NHGRI catalog if both discovery and replication samples show an associa- tion at p < 1 3 10 5 . If a study did not include a replication stage, significant SNPs from the initial stage were recorded in the catalog. We considered that the stringent criteria employed for accepting associations in GWASs, including quality control standards, strict p value thresholds, and a requirement for replication, yielded robust evidence of association and so gave a secure basis from which to study evidence for pleiotropy among genes and common genetic variants. In this review, by using the open-access NHGRI catalog, we aim to gain insight into the extent and pattern of plei- otropy in the genetics of common, complex disease to characterize pleiotropic genes and SNPs and to describe clusters of diseases and disease traits. Our prior expectations were that pleiotropic genes would be more common in certain functional groups and pleiotropic SNPs more often located in an upstream or regulatory region than nonpleiotropic genes and SNPs. Furthermore, we anticipated that the network of pheno- types sharing association to common SNPs or genes might give clues to underlying common mechanisms, some of which might be unexpected and suggest hypotheses about shared molecular pathways. Material and Methods Identification of Common Variants Showing Association with Complex Phenotypes Common genetic variants reported to be associated with complex non-Mendelian phenotypes were defined as those contained in the NHGRI catalog (last accessed February 4, 2011). Only SNP-trait associations reporting genome-wide significance (p < 5 3 10 8 ) 16 were considered, and the total number that was included in the 1 Centre for Population Health Sciences, The University of Edinburgh, Edinburgh EH8 9AG, UK; 2 Pharmatics Limited, Edinburgh EH15 3LZ, UK; 3 MRC Human Genetics Unit, Institute of Genetics and Molecular Medicine, Edinburgh EH4 2XU, UK; 4 Andrija Stampar School of Public Health, Medical School, University of Zagreb, 10000 Zagreb, Croatia; 5 Office of Population Genomics, National Human Genome Research Institute, Bethesda, MD 20892, USA 6 These authors contributed equally to this work *Correspondence: [email protected] DOI 10.1016/j.ajhg.2011.10.004. Ó2011 by The American Society of Human Genetics. All rights reserved. The American Journal of Human Genetics 89, 607–618, November 11, 2011 607
-
Upload
independent -
Category
Documents
-
view
2 -
download
0
Transcript of Abundant Pleiotropy in Human Complex Diseases and Traits
ARTICLE
Abundant Pleiotropy in Human ComplexDiseases and Traits
Shanya Sivakumaran,1,6 Felix Agakov,1,2,6 Evropi Theodoratou,1,6 James G. Prendergast,3 Lina Zgaga,1,4
Teri Manolio,5 Igor Rudan,1 Paul McKeigue,1 James F. Wilson,1 and Harry Campbell1,*
We present a systematic review of pleiotropy among SNPs and genes reported to show genome-wide association with common complex
diseases and traits. We find abundant evidence of pleiotropy; 233 (16.9%) genes and 77 (4.6%) SNPs show pleiotropic effects. SNP pleio-
tropic status was associated with gene location (p ¼ 0.024; pleiotropic SNPs more often exonic [14.5% versus 4.9% for nonpleiotropic,
trait-associated SNPs] and less often intergenic [15.8% versus 23.6%]), ‘‘predicted transcript consequence’’ (p ¼ 0.001; pleiotropic SNPs
more often predicted to be structurally deleterious [5% versus 0.4%] but not more often in regulatory sequences), and certain disease
classes. We develop a method to calculate the likelihood that pleiotropic links between traits occurred more often than expected and
demonstrate that this approach can identify etiological links that are already known (such as between fetal hemoglobin and malaria
risk) and those that are not yet established (e.g., between plasma campesterol levels and gallstones risk; and between immunoglobulin
A and juvenile idiopathic arthritis). Examples of pleiotropy will accumulate over time, but it is already clear that pleiotropy is a common
property of genes and SNPs associated with disease traits, and this will have implications for identification of molecular targets for drug
development, future genetic risk-profiling, and classification of diseases.
Introduction
Pleiotropy occurs when one gene has an effect on multiple
phenotypes. The molecular mechanisms of pleiotropy can
be dichotomized into multiple molecular functions of a
single gene product and multiple consequences of a single
molecular function.1–3 Although pleiotropy in the genetic
architecture of complex disease has been proposed,4 to
date, evidence for its presence has not been systematically
evaluated despite suggestions that this could be useful.5,6
Previous assessments of a shared genetic basis between
multiple phenotypes have been confined to restricted anal-
yses in (1) specific traits, including immune-mediated
diseases;7 seven diseases studied by the Wellcome Trust
Case Control Consortium genome-wide association study
(GWAS)8 including Crohn disease (IBD1 [MIM 266600]);9
blood pressure and selected hematological traits studied
by the Cohorts for Heart and Aging Research in Genomic
Epidemiology consortium;10 and pancreatic cancer [MIM
260350];11 (2) single-trait GWASs;12,13 and (3) a recent phe-
nome-wide scan to discover gene-disease associations.14
The National Human Genome Research Institute’s
(NHGRI) Catalog of Published GWAS15 is a comprehensive
resource listing statistically significant SNP-trait associa-
tions significant at p < 1 3 10�5 from all GWAS publica-
tions that attempt to assay at least 100,000 SNPs. If a study
did not report a combined p value, the p value from the
largest sample size was recorded in the NHGRI catalog if
both discovery and replication samples show an associa-
tion at p< 13 10�5. If a study did not include a replication
stage, significant SNPs from the initial stage were recorded
1Centre for Population Health Sciences, The University of Edinburgh, Edinbu
Human Genetics Unit, Institute of Genetics and Molecular Medicine, Edinburg
University of Zagreb, 10000 Zagreb, Croatia; 5Office of Population Genomics,6These authors contributed equally to this work
*Correspondence: [email protected]
DOI 10.1016/j.ajhg.2011.10.004. �2011 by The American Society of Human
The American
in the catalog. We considered that the stringent criteria
employed for accepting associations in GWASs, including
quality control standards, strict p value thresholds, and
a requirement for replication, yielded robust evidence of
association and so gave a secure basis from which to study
evidence for pleiotropy among genes and common genetic
variants.
In this review, by using the open-access NHGRI catalog,
we aim to gain insight into the extent and pattern of plei-
otropy in the genetics of common, complex disease to
characterize pleiotropic genes and SNPs and to describe
clusters of diseases and disease traits.
Our prior expectations were that pleiotropic genes
would be more common in certain functional groups
and pleiotropic SNPs more often located in an upstream
or regulatory region than nonpleiotropic genes and SNPs.
Furthermore, we anticipated that the network of pheno-
types sharing association to common SNPs or genes might
give clues to underlying common mechanisms, some of
which might be unexpected and suggest hypotheses about
shared molecular pathways.
Material and Methods
Identification of Common Variants Showing
Association with Complex PhenotypesCommon genetic variants reported to be associated with complex
non-Mendelian phenotypes were defined as those contained in
the NHGRI catalog (last accessed February 4, 2011). Only SNP-trait
associations reporting genome-wide significance (p < 5 3 10�8)16
were considered, and the total number that was included in the
rgh EH8 9AG, UK; 2Pharmatics Limited, Edinburgh EH15 3LZ, UK; 3MRC
h EH4 2XU, UK; 4Andrija Stampar School of Public Health, Medical School,
National Human Genome Research Institute, Bethesda, MD 20892, USA
Genetics. All rights reserved.
Journal of Human Genetics 89, 607–618, November 11, 2011 607
analysis was 1687 SNPs. In addition, we considered linkage
disequilibrium (LD) blocks-trait association by calculating the LD
between all the GWAS hits used in this analysis and collapsing
those SNPs that were in high LD into single loci (threshold for
high LD r2 > 0.80). Gene nomenclature was standardized by use
of the Human Genome Organisation (HUGO) Gene Nomencla-
ture Committee (HGNC) and Ensembl gene Identification
numbers (IDs).17–19 For each SNP-trait association we accepted
the NHGRI catalog record of which gene(s) and SNPs were consid-
ered by the study authors to mediate the association. This allowed
an investigation of pleiotropy at both gene and variant level.
Three additional comprehensive and systematic approaches
(annotation based on LD, annotation based on a mapped gene
feature of the NHGRI catalog and annotation based on taking all
genes in the LD block) were adopted to evaluate to what extent
the gene author-annotation approach might be subject to bias.
In the first approach (denoted here as LD method) a gene was
assigned to a SNP if the gene overlapped with that SNP. Otherwise
the nearest gene in the same LD block was taken. The second
approach (denoted here as NHGRI mapped gene method) em-
ployed this feature of the NHGRI catalog in which genes were
mapped to the SNP (NCBI) showing the most significant associa-
tion. If the SNP was located within a gene, that gene was listed.
If the SNP was intergenic, both the upstream and downstream
genes were listed. When using this method, we (1) restricted the
analysis only to those SNPs that were located in a gene and (2) con-
ducted a locus analysis for those SNPs that were intergenic,
described the extent of pleiotropy for these loci and added the
loci to the genes. The third approach (denoted here as taking all
genes in the LD block annotation method) was based on the prop-
osition that it is possible for any locus or gene within an LD block
to be associated with the reported SNP and consequently to the
phenotype.
Definition of PleiotropyWe defined pleiotropy as a single gene or variant being associated
with more than one distinct phenotypes (disease endpoints or
quantitative traits) then systematically applied the following
exclusion criteria in order to obtain a conservative estimate of plei-
otropy that was not inflated by highly correlated trait and/or
disease outcomes: (1) the phenotypes were (patho)-physiological
counterparts (e.g., serum uric-acid level and gout), (2) one pheno-
type was a subset of the other (e.g., Crohn disease [MIM 266600]
and inflammatory bowel disease [MIM 266600]), (3) one pheno-
type is used to calculate the other (e.g., low-density lipoprotein
[LDL] cholesterol level and triglyceride levels20), (4) the pheno-
types are similar or strongly correlated such that they might be
measures of the same genetic effect (e.g., bone mineral density
in the spine and hip, serum calcium and phosphorus, serum pros-
tate specific antigen and prostate cancer [MIM 176807], pigmenta-
tion traits), (5) one phenotype is a known causal factor for the
other (e.g., LDL cholesterol level and myocardial infarction
[MIM 608446]).
We categorized genes or variants in the NHGRI catalog as pleio-
tropic or nonpleiotropic after application of the above definition
and criteria. The status in terms of criteria (1–3) was typically
self-evident but in terms of criteria (4) and (5) was occasionally
uncertain. In these circumstances relationships between the
phenotypes associated with the gene or SNP were explored in
the current literature. Categorization then took place by
consensus after discussion between authors (S.S., H.C., J.F.W.).
We estimated the frequency of pleiotropy among the common
608 The American Journal of Human Genetics 89, 607–618, Novemb
complex phenotypes studied by GWASs by identifying the
number of pleiotropic genes and SNPs and presenting this as
a percentage of the overall number of genes and SNPs reported
in the NHGRI catalog.
Pleiotropic genes were characterized by comparing the length of
pleiotropic genes (in kilobases) to the length of nonpleiotropic
genes with Ensembl. We conducted an analysis of biological
processes that the genes were associated with (by using Gene
Ontology [GO] terms21 via GOrilla22,23) to investigate evidence
for enrichment of biological processes among pleiotropic genes.
We characterized pleiotropic SNPs by their location and conse-
quence for the transcript and compared them to nonpleiotropic
SNPs by using standard Ensembl annotation and definitions.
The categories for SNP location were intergenic, upstream, 50
UTR, exon (comprising nonsynonymous coding, synonymous
coding, frameshift coding, and STOP gained), intron (SNPs labeled
as both intronic and NMDtranscript, intronic and splice site, or
intronic and regulatory region are included here), 30 UTR, down-
stream, and within a noncoding gene (i.e., within a gene that
does not code for a protein). We employed the bioinformatic tools
SIFT24 and PolyPhen25 to decide whether nonsynonymous (ns)
SNPs were deleterious. These tools predict the nsSNPs likely to
affect protein function. We categorized nsSNPs as deleterious if
both SIFT and PolyPhen predicted them to be damaging or prob-
ably damaging.
We dichotomized the parameter consequence for the transcript
into two broad categories: very likely to be structurally functional,
which consisted of a STOP codon lost or gained, frameshift
coding, deleterious nonsynonymous coding, or essential splice
site variation and possibly regulatory, which consisted of SNPs
located upstream in a 50 or 30 UTR, or in an intron or region anno-
tated as regulatory by Ensembl.
In this report we will use the term nonpleiotropic genes or SNPs
to denote the group of genes or SNPs in the NHGRI catalog that we
have not defined as pleiotropic. In our descriptive analysis of
pleiotropic genes and SNPs, we compared pleiotropic genes and
SNPs in the NHGRI catalog to this group rather than to all genes
and SNPs in the genome because we considered that differences
with the latter might be confounded by selection of SNPs for the
genotyping arrays or other genic characteristics that are related
to detection of an association.
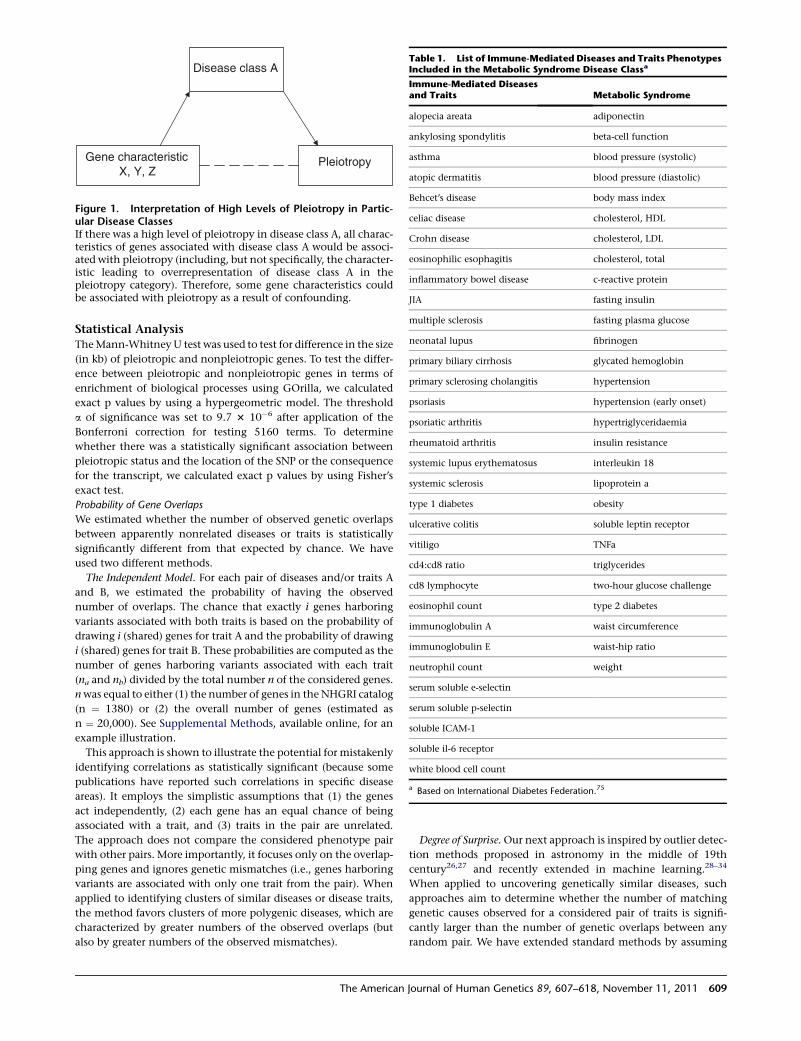
We considered, a priori, that certain disease classes would have
higher levels of pleiotropy than others. Figure 1 suggests causes
and implications of suchoverrepresentation. For example, a higher
level of pleiotropy might be found in certain disease classes and in
these circumstances all characteristics of the genes harboring vari-
ants associated with these diseases might appear to be associated
with pleiotropy but this might be because of confounding. In
this case a stratified analysis by disease category might help to
interpret the observed associations with pleiotropy. We expected
that variants and genes harboring variants associated with the
cluster of immune-mediated phenotypes might form a sizeable
proportion of all pleiotropic SNP and genes. We therefore decided
to present overall findings and then findings after all immune-
mediated phenotypes were coded as one single disease. We thus
describe results for immune-mediated pleiotropic (IMP) genes/
SNPs and nonimmune-mediated pleiotropic (NIMP) genes/SNPs.
Phenotypes coded as immune mediated are presented in Table 1.
Additionally, we conducted an analysis to compare the frequency
of pleiotropy in three well-defined disease classes—immune-medi-
ated disease, the metabolic syndrome (phenotypes included are
presented in Table 1), and cancer.
er 11, 2011
Disease class A
Gene characteristic X, Y, Z
Pleiotropy
Figure 1. Interpretation of High Levels of Pleiotropy in Partic-ular Disease ClassesIf there was a high level of pleiotropy in disease class A, all charac-teristics of genes associated with disease class A would be associ-ated with pleiotropy (including, but not specifically, the character-istic leading to overrepresentation of disease class A in thepleiotropy category). Therefore, some gene characteristics couldbe associated with pleiotropy as a result of confounding.
Table 1. List of Immune-Mediated Diseases and Traits PhenotypesIncluded in the Metabolic Syndrome Disease Classa
Immune-Mediated Diseasesand Traits Metabolic Syndrome
alopecia areata adiponectin
ankylosing spondylitis beta-cell function
asthma blood pressure (systolic)
atopic dermatitis blood pressure (diastolic)
Behcet’s disease body mass index
celiac disease cholesterol, HDL
Crohn disease cholesterol, LDL
eosinophilic esophagitis cholesterol, total
inflammatory bowel disease c-reactive protein
JIA fasting insulin
multiple sclerosis fasting plasma glucose
neonatal lupus fibrinogen
primary biliary cirrhosis glycated hemoglobin
primary sclerosing cholangitis hypertension
psoriasis hypertension (early onset)
psoriatic arthritis hypertriglyceridaemia
rheumatoid arthritis insulin resistance
systemic lupus erythematosus interleukin 18
systemic sclerosis lipoprotein a
type 1 diabetes obesity
ulcerative colitis soluble leptin receptor
vitiligo TNFa
cd4:cd8 ratio triglycerides
cd8 lymphocyte two-hour glucose challenge
eosinophil count type 2 diabetes
immunoglobulin A waist circumference
immunoglobulin E waist-hip ratio
neutrophil count weight
serum soluble e-selectin
serum soluble p-selectin
soluble ICAM-1
soluble il-6 receptor
white blood cell count
a Based on International Diabetes Federation.75
Statistical AnalysisTheMann-WhitneyU test was used to test for difference in the size
(in kb) of pleiotropic and nonpleiotropic genes. To test the differ-
ence between pleiotropic and nonpleiotropic genes in terms of
enrichment of biological processes using GOrilla, we calculated
exact p values by using a hypergeometric model. The threshold
a of significance was set to 9.7 3 10�6 after application of the
Bonferroni correction for testing 5160 terms. To determine
whether there was a statistically significant association between
pleiotropic status and the location of the SNP or the consequence
for the transcript, we calculated exact p values by using Fisher’s
exact test.
Probability of Gene Overlaps
We estimated whether the number of observed genetic overlaps
between apparently nonrelated diseases or traits is statistically
significantly different from that expected by chance. We have
used two different methods.
The Independent Model. For each pair of diseases and/or traits A
and B, we estimated the probability of having the observed
number of overlaps. The chance that exactly i genes harboring
variants associated with both traits is based on the probability of
drawing i (shared) genes for trait A and the probability of drawing
i (shared) genes for trait B. These probabilities are computed as the
number of genes harboring variants associated with each trait
(na and nb) divided by the total number n of the considered genes.
nwas equal to either (1) the number of genes in the NHGRI catalog
(n ¼ 1380) or (2) the overall number of genes (estimated as
n ¼ 20,000). See Supplemental Methods, available online, for an
example illustration.
This approach is shown to illustrate the potential for mistakenly
identifying correlations as statistically significant (because some
publications have reported such correlations in specific disease
areas). It employs the simplistic assumptions that (1) the genes
act independently, (2) each gene has an equal chance of being
associated with a trait, and (3) traits in the pair are unrelated.
The approach does not compare the considered phenotype pair
with other pairs. More importantly, it focuses only on the overlap-
ping genes and ignores genetic mismatches (i.e., genes harboring
variants are associated with only one trait from the pair). When
applied to identifying clusters of similar diseases or disease traits,
the method favors clusters of more polygenic diseases, which are
characterized by greater numbers of the observed overlaps (but
also by greater numbers of the observed mismatches).
The American
Degree of Surprise.Our next approach is inspired by outlier detec-
tion methods proposed in astronomy in the middle of 19th
century26,27 and recently extended in machine learning.28–34
When applied to uncovering genetically similar diseases, such
approaches aim to determine whether the number of matching
genetic causes observed for a considered pair of traits is signifi-
cantly larger than the number of genetic overlaps between any
random pair. We have extended standard methods by assuming
Journal of Human Genetics 89, 607–618, November 11, 2011 609

Table 2. Extent of Pleiotropy in Genes of the NHGRI Catalog
MethodAuthor AnnotationMethoda LD Methodb
Method Based onNHGRI MappedGenes(Only Genes)c
Method Based on theNHGRI Mapped Genes(Genes and Loci)d
Method Based onTaking All Genesin the LD Blocke
Pleiotropic(IMPf and NIMPg)
233 (16.9%) 138 (13.2%) 108 (15.4%) 166 (14.1%) 473 (18.6%)
Not pleiotropic 1147 (83.1%) 909 (86.8%) 592 (84.6%) 1008 (85.9%) 2064 (81.4%)
Total 1380 1047 700 1174 2537
Pleiotropic NIMPg 189 (14.2%) 101 (10%) 85 (12.6%) 127 (11.2%) 189 (14.2%)
Not pleiotropic 1147 (85.9%) 909 (90%) 592 (87.4%) 1008 (88.8%) 1147 (85.9%)
Total 1336 1010 677 1135 1336
a Author annotation method is the primary method adopted in this study where a gene was assigned to a SNP based on the decision of the authors of the originalstudy.b For annotation based on LD, a gene was assigned to a SNP if the gene overlapped with that SNP, otherwise the nearest gene in the same LD block (based onHapMap CEU population) was taken.c Annotation based on a mapped gene feature of NHGRI catalog (gene only): genes are mapped to the SNP with the strongest association (NCBI); if the SNP islocated within a gene, that gene is listed and if the SNP is intergenic, the upstream and downstream genes are both listed. When using this method we restrictedthe analysis only to those SNPs that were located in a gene.d Annotation based on a mapped gene feature of NHGRI catalog (gene and locus): we followed the same procedure as above, but for those SNPs that were inter-genic we conducted a locus analysis, described the extent of pleiotropy for these loci and added the loci to the genes.e Annotation based ased on taking all genes in the LD block: This approach is based on the proposition that it is possible for any locus or gene within an LD block tobe associated with the reported SNP, and consequently to the phenotype.f Genes associated with immune-mediated phenotypes only.g Genes associated with nonimmune-mediated phenotypes.
that the presence of mismatching genetic causes of two diseases is
an indicator of their possible dissimilarity.
To illustrate this idea, consider five uniquely associated genes
harboring variants associated with trait A and 10 uniquely associ-
ated genes harboring variants associated with trait B. Assume that
the traits share two genes in common. In this example, there are
two matching and 13 mismatching genes harboring variants asso-
ciated with the pair {A,B}. In another example, a pair of traits {C,D}
shares two genes, and there are no other genes harboring variants
associated with either of these traits. The presence of thematching
genes in pair {A,B} indicates their possible similarity; however, the
pair is less similar than {C,D}, which has no genetic mismatches.
Our degree of surprise (DS) method identifies phenotype pairs
with a high number of matching or simultaneously absent genes
and a low number of geneticmismatches. The importance weights
of the matching and mismatching genes are proportional to the
surprise, that is inverse frequencies of their occurrences (see
Supplemental Methods Equation 1). In contrast to the indepen-
dent model, our DS approach does not assume that each gene
has an equal chance of being associated with all the phenotypes.
Also, the method does not rely on the restrictive assumption
that all the traits are unrelated—instead, it makes a much weaker
assumption that the genetically related traits are relatively infre-
quent. DS has a formal probabilistic interpretation and might be
viewed as the likelihood ratio of the similarity and dissimilarity
models, which allows for an easy accommodation of the noise
(false positive and false negative genotype-phenotype associa-
tions). The empirical p values of the adjusted DS criterion were
found to be useful for identifying both the existing and novel
couplings between phenotypes.
In order to identify genetically similar traits we have also consid-
ered more conventional approaches (data not shown) based on
correlations, cross-entropy, and Jensen’s divergence.35 These
methods are based on maximizing the degree of genetic overlap
or minimizing the degree of genetic mismatch but not both
criteria simultaneously. In contrast to the reported degree-of-
610 The American Journal of Human Genetics 89, 607–618, Novemb
surprise criterion, these methods were strongly biased to detect
either highly polygenic or monogenic traits.
Results
Genes
HGNC and Ensembl IDs were ascertained for 1380 genes
out of 1431 distinct genes (96%) contained in the NHGRI
catalog. These 1380 genes had been assigned HGNCnames
and subsequently contributed to the analyses (unless
otherwise specified).
Frequency of Pleiotropy
A total of 233 genes were defined as pleiotropic (16.9%
of all genes in the catalog). Table 2 shows how the
frequency of pleiotropy varies somewhat depending on
method of gene assignment in GWASs. All approaches,
however, show that pleiotropy is a common property
with 13.2%–18.6% of all genes demonstrating pleiotropy
as defined in this study. When immune-mediated pheno-
types were classified as a single group, 189 genes remained
pleiotropic.
Characterizing Pleiotropic Genes
Size. The median size of pleiotropic genes was 45.7 kb,
compared with a median of 38.7 kb for nonpleiotropic
genes (p ¼ 0.072; Mann-Whitney U test). When genes
harboring variants associated only with immune-mediated
phenotypes were excluded, the median size of pleiotropic
genes was 49.2 kb, significantly different than the size of
nonpleiotropic genes (p ¼ 0.022). The median size of the
pleiotropic genes harboring variants associated only with
immune-mediated phenotypes was 32.0 kb. The larger
size of pleiotropic compared to nonpleiotropic genes was
confirmed when this analysis was repeated employing
er 11, 2011
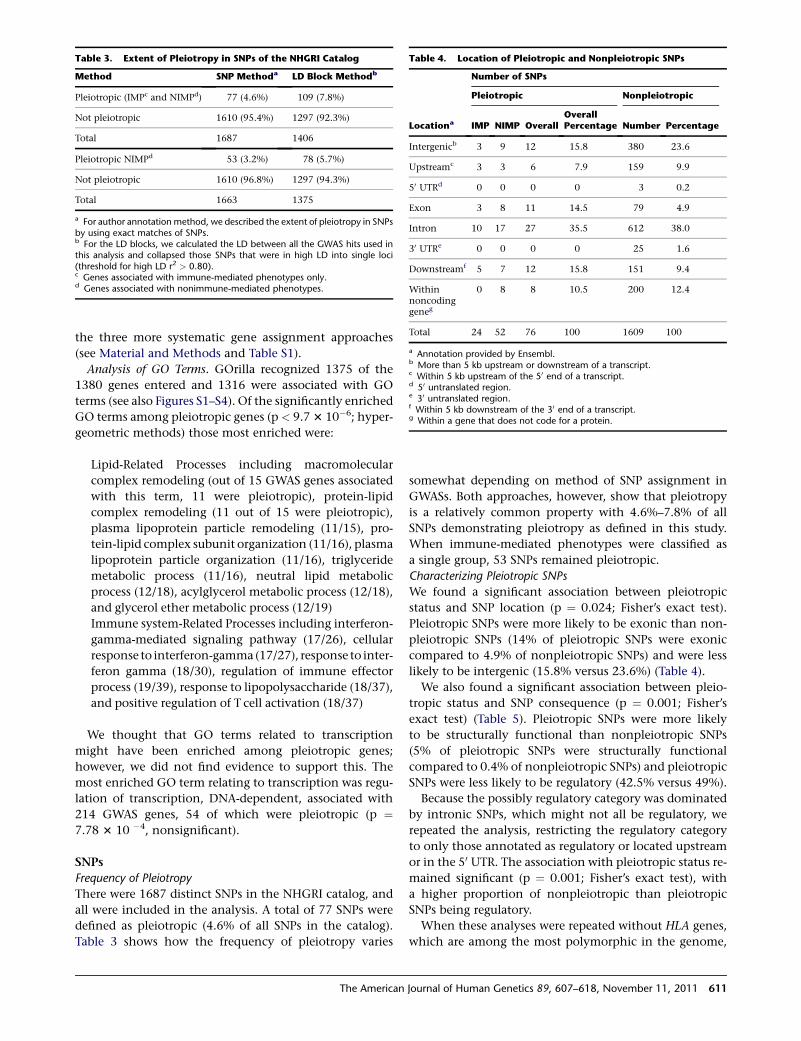
Table 3. Extent of Pleiotropy in SNPs of the NHGRI Catalog
Method SNP Methoda LD Block Methodb
Pleiotropic (IMPc and NIMPd) 77 (4.6%) 109 (7.8%)
Not pleiotropic 1610 (95.4%) 1297 (92.3%)
Total 1687 1406
Pleiotropic NIMPd 53 (3.2%) 78 (5.7%)
Not pleiotropic 1610 (96.8%) 1297 (94.3%)
Total 1663 1375
a For author annotation method, we described the extent of pleiotropy in SNPsby using exact matches of SNPs.b For the LD blocks, we calculated the LD between all the GWAS hits used inthis analysis and collapsed those SNPs that were in high LD into single loci(threshold for high LD r2 > 0.80).c Genes associated with immune-mediated phenotypes only.d Genes associated with nonimmune-mediated phenotypes.
Table 4. Location of Pleiotropic and Nonpleiotropic SNPs
Locationa
Number of SNPs
Pleiotropic Nonpleiotropic
IMP NIMP OverallOverallPercentage Number Percentage
Intergenicb 3 9 12 15.8 380 23.6
Upstreamc 3 3 6 7.9 159 9.9
50 UTRd 0 0 0 0 3 0.2
Exon 3 8 11 14.5 79 4.9
Intron 10 17 27 35.5 612 38.0
30 UTRe 0 0 0 0 25 1.6
Downstreamf 5 7 12 15.8 151 9.4
Withinnoncodinggeneg
0 8 8 10.5 200 12.4
Total 24 52 76 100 1609 100
a Annotation provided by Ensembl.b More than 5 kb upstream or downstream of a transcript.c Within 5 kb upstream of the 50 end of a transcript.d 50 untranslated region.e 30 untranslated region.f Within 5 kb downstream of the 30 end of a transcript.g Within a gene that does not code for a protein.
the three more systematic gene assignment approaches
(see Material and Methods and Table S1).
Analysis of GO Terms. GOrilla recognized 1375 of the
1380 genes entered and 1316 were associated with GO
terms (see also Figures S1–S4). Of the significantly enriched
GO terms among pleiotropic genes (p < 9.73 10�6; hyper-
geometric methods) those most enriched were:
Lipid-Related Processes including macromolecular
complex remodeling (out of 15 GWAS genes associated
with this term, 11 were pleiotropic), protein-lipid
complex remodeling (11 out of 15 were pleiotropic),
plasma lipoprotein particle remodeling (11/15), pro-
tein-lipid complex subunit organization (11/16), plasma
lipoprotein particle organization (11/16), triglyceride
metabolic process (11/16), neutral lipid metabolic
process (12/18), acylglycerol metabolic process (12/18),
and glycerol ether metabolic process (12/19)
Immune system-Related Processes including interferon-
gamma-mediated signaling pathway (17/26), cellular
response to interferon-gamma (17/27), response to inter-
feron gamma (18/30), regulation of immune effector
process (19/39), response to lipopolysaccharide (18/37),
and positive regulation of T cell activation (18/37)
We thought that GO terms related to transcription
might have been enriched among pleiotropic genes;
however, we did not find evidence to support this. The
most enriched GO term relating to transcription was regu-
lation of transcription, DNA-dependent, associated with
214 GWAS genes, 54 of which were pleiotropic (p ¼7.78 3 10 �4, nonsignificant).
SNPs
Frequency of Pleiotropy
There were 1687 distinct SNPs in the NHGRI catalog, and
all were included in the analysis. A total of 77 SNPs were
defined as pleiotropic (4.6% of all SNPs in the catalog).
Table 3 shows how the frequency of pleiotropy varies
The American
somewhat depending on method of SNP assignment in
GWASs. Both approaches, however, show that pleiotropy
is a relatively common property with 4.6%–7.8% of all
SNPs demonstrating pleiotropy as defined in this study.
When immune-mediated phenotypes were classified as
a single group, 53 SNPs remained pleiotropic.
Characterizing Pleiotropic SNPs
We found a significant association between pleiotropic
status and SNP location (p ¼ 0.024; Fisher’s exact test).
Pleiotropic SNPs were more likely to be exonic than non-
pleiotropic SNPs (14% of pleiotropic SNPs were exonic
compared to 4.9% of nonpleiotropic SNPs) and were less
likely to be intergenic (15.8% versus 23.6%) (Table 4).
We also found a significant association between pleio-
tropic status and SNP consequence (p ¼ 0.001; Fisher’s
exact test) (Table 5). Pleiotropic SNPs were more likely
to be structurally functional than nonpleiotropic SNPs
(5% of pleiotropic SNPs were structurally functional
compared to 0.4% of nonpleiotropic SNPs) and pleiotropic
SNPs were less likely to be regulatory (42.5% versus 49%).
Because the possibly regulatory category was dominated
by intronic SNPs, which might not all be regulatory, we
repeated the analysis, restricting the regulatory category
to only those annotated as regulatory or located upstream
or in the 50 UTR. The association with pleiotropic status re-
mained significant (p ¼ 0.001; Fisher’s exact test), with
a higher proportion of nonpleiotropic than pleiotropic
SNPs being regulatory.
When these analyses were repeated without HLA genes,
which are among the most polymorphic in the genome,
Journal of Human Genetics 89, 607–618, November 11, 2011 611
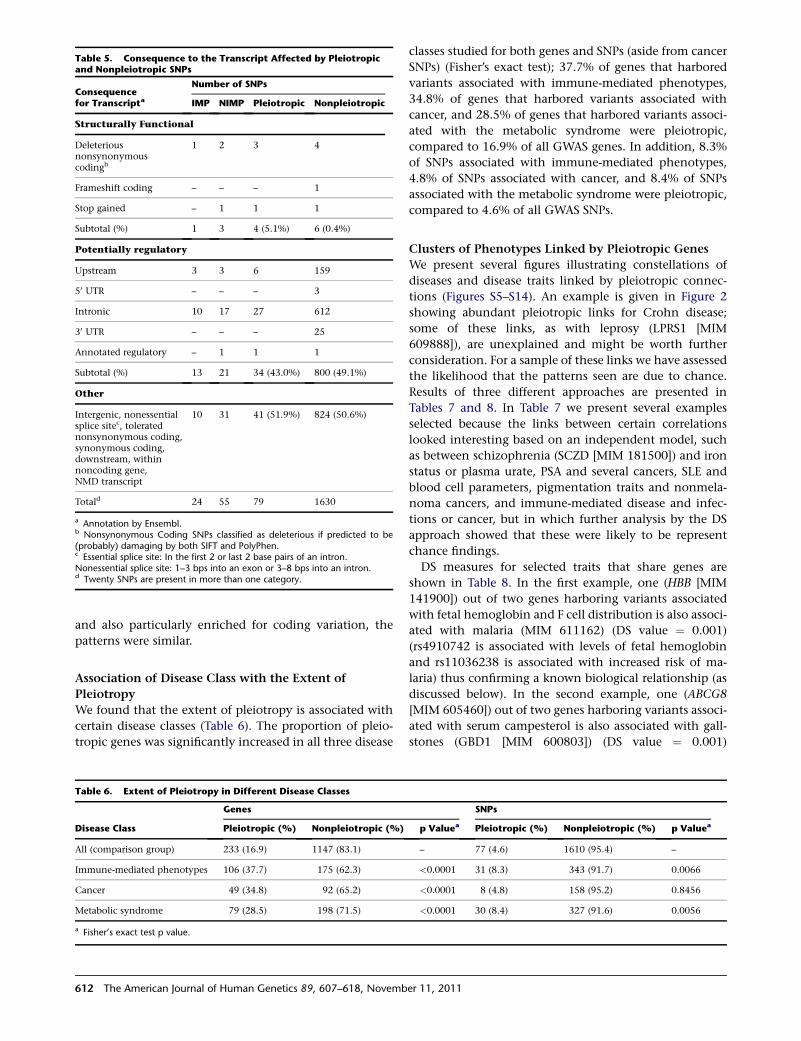
Table 5. Consequence to the Transcript Affected by Pleiotropicand Nonpleiotropic SNPs
Consequencefor Transcripta
Number of SNPs
IMP NIMP Pleiotropic Nonpleiotropic
Structurally Functional
Deleteriousnonsynonymouscodingb
1 2 3 4
Frameshift coding – – – 1
Stop gained – 1 1 1
Subtotal (%) 1 3 4 (5.1%) 6 (0.4%)
Potentially regulatory
Upstream 3 3 6 159
50 UTR – – – 3
Intronic 10 17 27 612
30 UTR – – – 25
Annotated regulatory – 1 1 1
Subtotal (%) 13 21 34 (43.0%) 800 (49.1%)
Other
Intergenic, nonessentialsplice sitec, toleratednonsynonymous coding,synonymous coding,downstream, withinnoncoding gene,NMD transcript
10 31 41 (51.9%) 824 (50.6%)
Totald 24 55 79 1630
a Annotation by Ensembl.b Nonsynonymous Coding SNPs classified as deleterious if predicted to be(probably) damaging by both SIFT and PolyPhen.c Essential splice site: In the first 2 or last 2 base pairs of an intron.Nonessential splice site: 1–3 bps into an exon or 3–8 bps into an intron.d Twenty SNPs are present in more than one category.
and also particularly enriched for coding variation, the
patterns were similar.
Association of Disease Class with the Extent of
Pleiotropy
We found that the extent of pleiotropy is associated with
certain disease classes (Table 6). The proportion of pleio-
tropic genes was significantly increased in all three disease
Table 6. Extent of Pleiotropy in Different Disease Classes
Disease Class
Genes
Pleiotropic (%) Nonpleiotropic (%)
All (comparison group) 233 (16.9) 1147 (83.1)
Immune-mediated phenotypes 106 (37.7) 175 (62.3)
Cancer 49 (34.8) 92 (65.2)
Metabolic syndrome 79 (28.5) 198 (71.5)
a Fisher’s exact test p value.
612 The American Journal of Human Genetics 89, 607–618, Novemb
classes studied for both genes and SNPs (aside from cancer
SNPs) (Fisher’s exact test); 37.7% of genes that harbored
variants associated with immune-mediated phenotypes,
34.8% of genes that harbored variants associated with
cancer, and 28.5% of genes that harbored variants associ-
ated with the metabolic syndrome were pleiotropic,
compared to 16.9% of all GWAS genes. In addition, 8.3%
of SNPs associated with immune-mediated phenotypes,
4.8% of SNPs associated with cancer, and 8.4% of SNPs
associated with the metabolic syndrome were pleiotropic,
compared to 4.6% of all GWAS SNPs.
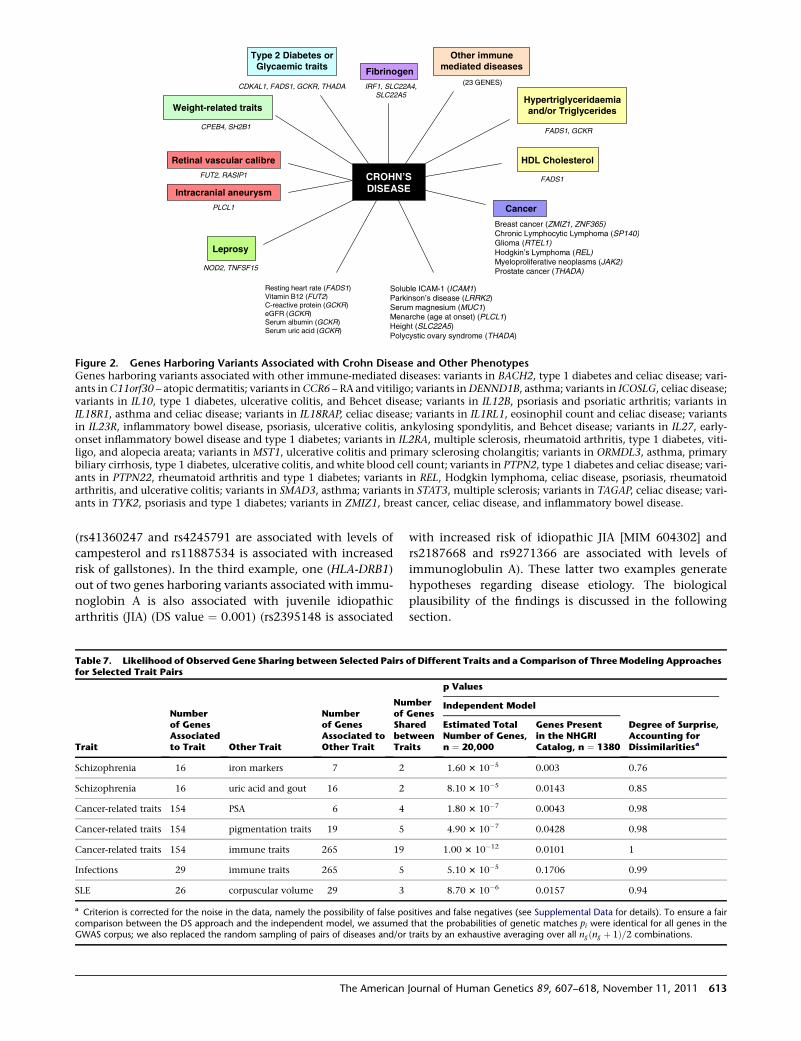
Clusters of Phenotypes Linked by Pleiotropic Genes
We present several figures illustrating constellations of
diseases and disease traits linked by pleiotropic connec-
tions (Figures S5–S14). An example is given in Figure 2
showing abundant pleiotropic links for Crohn disease;
some of these links, as with leprosy (LPRS1 [MIM
609888]), are unexplained and might be worth further
consideration. For a sample of these links we have assessed
the likelihood that the patterns seen are due to chance.
Results of three different approaches are presented in
Tables 7 and 8. In Table 7 we present several examples
selected because the links between certain correlations
looked interesting based on an independent model, such
as between schizophrenia (SCZD [MIM 181500]) and iron
status or plasma urate, PSA and several cancers, SLE and
blood cell parameters, pigmentation traits and nonmela-
noma cancers, and immune-mediated disease and infec-
tions or cancer, but in which further analysis by the DS
approach showed that these were likely to be represent
chance findings.
DS measures for selected traits that share genes are
shown in Table 8. In the first example, one (HBB [MIM
141900]) out of two genes harboring variants associated
with fetal hemoglobin and F cell distribution is also associ-
ated with malaria (MIM 611162) (DS value ¼ 0.001)
(rs4910742 is associated with levels of fetal hemoglobin
and rs11036238 is associated with increased risk of ma-
laria) thus confirming a known biological relationship (as
discussed below). In the second example, one (ABCG8
[MIM 605460]) out of two genes harboring variants associ-
ated with serum campesterol is also associated with gall-
stones (GBD1 [MIM 600803]) (DS value ¼ 0.001)
SNPs
p Valuea Pleiotropic (%) Nonpleiotropic (%) p Valuea
– 77 (4.6) 1610 (95.4) –
<0.0001 31 (8.3) 343 (91.7) 0.0066
<0.0001 8 (4.8) 158 (95.2) 0.8456
<0.0001 30 (8.4) 327 (91.6) 0.0056
er 11, 2011
CDKAL1, FADS1, GCKR, THADA
CPEB4, SH2B1
FUT2, RASIP1
(23 GENES)IRF1, SLC22A4, SLC22A5
NOD2, TNFSF15
FADS1, GCKR
Breast cancer (ZMIZ1, ZNF365)Chronic Lymphocytic Lymphoma (SP140)Glioma (RTEL1)Hodgkin’s Lymphoma (REL)Myeloproliferative neoplasms (JAK2)Prostate cancer (THADA)
Soluble ICAM-1 (ICAM1)Parkinson’s disease (LRRK2)Serum magnesium (MUC1)Menarche (age at onset) (PLCL1)Height (SLC22A5)Polycystic ovary syndrome (THADA)
Resting heart rate (FADS1)Vitamin B12 (FUT2)C-reactive protein (GCKR)eGFR (GCKR)Serum albumin (GCKR)Serum uric acid (GCKR)
FADS1
Leprosy
Fibrinogen
Type 2 Diabetes orGlycaemic traits
Weight-related traitsHypertriglyceridaemiaand/or Triglycerides
Cancer
Retinal vascular calibre
Intracranial aneurysm
HDL Cholesterol
Other immune mediated diseases
PLCL1
CROHN’S DISEASE
Figure 2. Genes Harboring Variants Associated with Crohn Disease and Other PhenotypesGenes harboring variants associated with other immune-mediated diseases: variants in BACH2, type 1 diabetes and celiac disease; vari-ants inC11orf30 – atopic dermatitis; variants inCCR6 – RA and vitiligo; variants inDENND1B, asthma; variants in ICOSLG, celiac disease;variants in IL10, type 1 diabetes, ulcerative colitis, and Behcet disease; variants in IL12B, psoriasis and psoriatic arthritis; variants inIL18R1, asthma and celiac disease; variants in IL18RAP, celiac disease; variants in IL1RL1, eosinophil count and celiac disease; variantsin IL23R, inflammatory bowel disease, psoriasis, ulcerative colitis, ankylosing spondylitis, and Behcet disease; variants in IL27, early-onset inflammatory bowel disease and type 1 diabetes; variants in IL2RA, multiple sclerosis, rheumatoid arthritis, type 1 diabetes, viti-ligo, and alopecia areata; variants in MST1, ulcerative colitis and primary sclerosing cholangitis; variants in ORMDL3, asthma, primarybiliary cirrhosis, type 1 diabetes, ulcerative colitis, and white blood cell count; variants in PTPN2, type 1 diabetes and celiac disease; vari-ants in PTPN22, rheumatoid arthritis and type 1 diabetes; variants in REL, Hodgkin lymphoma, celiac disease, psoriasis, rheumatoidarthritis, and ulcerative colitis; variants in SMAD3, asthma; variants in STAT3, multiple sclerosis; variants in TAGAP, celiac disease; vari-ants in TYK2, psoriasis and type 1 diabetes; variants in ZMIZ1, breast cancer, celiac disease, and inflammatory bowel disease.
(rs41360247 and rs4245791 are associated with levels of
campesterol and rs11887534 is associated with increased
risk of gallstones). In the third example, one (HLA-DRB1)
out of two genes harboring variants associated with immu-
noglobin A is also associated with juvenile idiopathic
arthritis (JIA) (DS value ¼ 0.001) (rs2395148 is associated
Table 7. Likelihood of Observed Gene Sharing between Selected Pairsfor Selected Trait Pairs
Trait
Numberof GenesAssociatedto Trait Other Trait
Numberof GenesAssociated toOther Trait
NuofShabetTra
Schizophrenia 16 iron markers 7 2
Schizophrenia 16 uric acid and gout 16 2
Cancer-related traits 154 PSA 6 4
Cancer-related traits 154 pigmentation traits 19 5
Cancer-related traits 154 immune traits 265 19
Infections 29 immune traits 265 5
SLE 26 corpuscular volume 29 3
a Criterion is corrected for the noise in the data, namely the possibility of false pocomparison between the DS approach and the independent model, we assumedGWAS corpus; we also replaced the random sampling of pairs of diseases and/or
The American
with increased risk of idiopathic JIA [MIM 604302] and
rs2187668 and rs9271366 are associated with levels of
immunoglobulin A). These latter two examples generate
hypotheses regarding disease etiology. The biological
plausibility of the findings is discussed in the following
section.
of Different Traits and a Comparison of ThreeModeling Approaches
mberGenesredweenits
p Values
Independent Model
Degree of Surprise,Accounting forDissimilaritiesa
Estimated TotalNumber of Genes,n ¼ 20,000
Genes Presentin the NHGRICatalog, n ¼ 1380
1.60 3 10�5 0.003 0.76
8.10 3 10�5 0.0143 0.85
1.80 3 10�7 0.0043 0.98
4.90 3 10�7 0.0428 0.98
1.00 3 10�12 0.0101 1
5.10 3 10�5 0.1706 0.99
8.70 3 10�6 0.0157 0.94
sitives and false negatives (see Supplemental Data for details). To ensure a fairthat the probabilities of genetic matches pi were identical for all genes in thetraits by an exhaustive averaging over all ng ðng þ 1Þ=2 combinations.
Journal of Human Genetics 89, 607–618, November 11, 2011 613
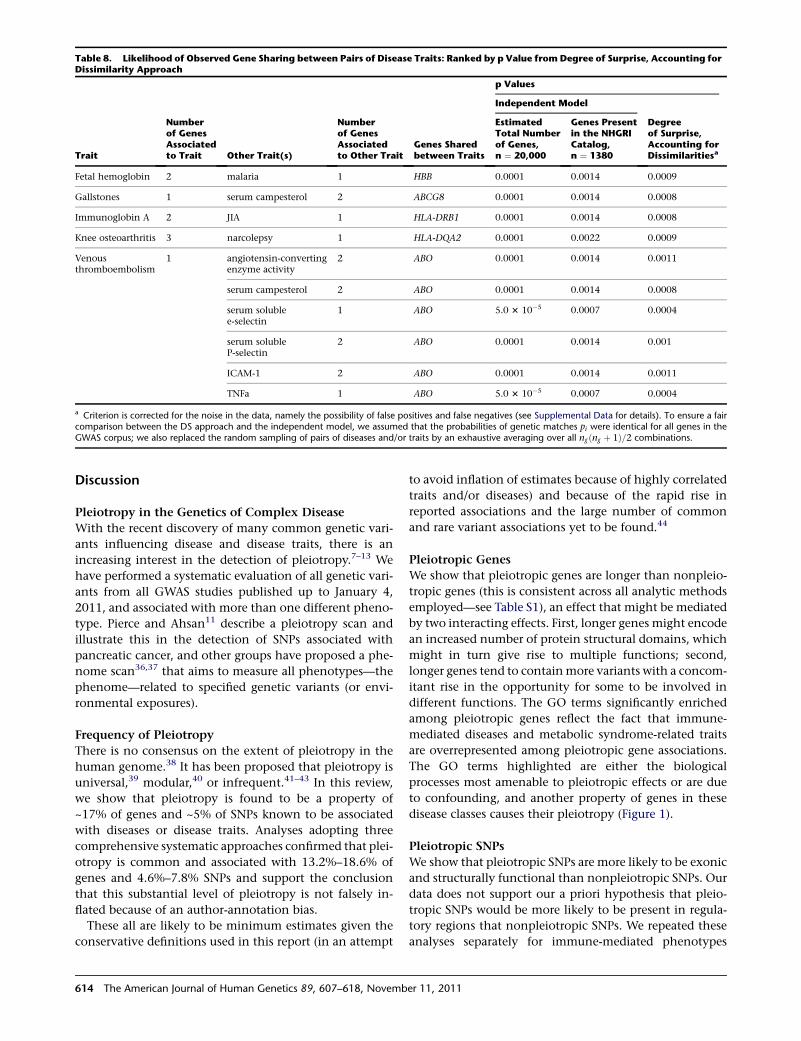
Table 8. Likelihood of Observed Gene Sharing between Pairs of Disease Traits: Ranked by p Value from Degree of Surprise, Accounting forDissimilarity Approach
Trait
Numberof GenesAssociatedto Trait Other Trait(s)
Numberof GenesAssociatedto Other Trait
Genes Sharedbetween Traits
p Values
Independent Model
Degreeof Surprise,Accounting forDissimilaritiesa
EstimatedTotal Numberof Genes,n ¼ 20,000
Genes Presentin the NHGRICatalog,n ¼ 1380
Fetal hemoglobin 2 malaria 1 HBB 0.0001 0.0014 0.0009
Gallstones 1 serum campesterol 2 ABCG8 0.0001 0.0014 0.0008
Immunoglobin A 2 JIA 1 HLA-DRB1 0.0001 0.0014 0.0008
Knee osteoarthritis 3 narcolepsy 1 HLA-DQA2 0.0001 0.0022 0.0009
Venousthromboembolism
1 angiotensin-convertingenzyme activity
2 ABO 0.0001 0.0014 0.0011
serum campesterol 2 ABO 0.0001 0.0014 0.0008
serum solublee-selectin
1 ABO 5.0 3 10�5 0.0007 0.0004
serum solubleP-selectin
2 ABO 0.0001 0.0014 0.001
ICAM-1 2 ABO 0.0001 0.0014 0.0011
TNFa 1 ABO 5.0 3 10�5 0.0007 0.0004
a Criterion is corrected for the noise in the data, namely the possibility of false positives and false negatives (see Supplemental Data for details). To ensure a faircomparison between the DS approach and the independent model, we assumed that the probabilities of genetic matches pi were identical for all genes in theGWAS corpus; we also replaced the random sampling of pairs of diseases and/or traits by an exhaustive averaging over all ng ðng þ 1Þ=2 combinations.
Discussion
Pleiotropy in the Genetics of Complex Disease
With the recent discovery of many common genetic vari-
ants influencing disease and disease traits, there is an
increasing interest in the detection of pleiotropy.7–13 We
have performed a systematic evaluation of all genetic vari-
ants from all GWAS studies published up to January 4,
2011, and associated with more than one different pheno-
type. Pierce and Ahsan11 describe a pleiotropy scan and
illustrate this in the detection of SNPs associated with
pancreatic cancer, and other groups have proposed a phe-
nome scan36,37 that aims to measure all phenotypes—the
phenome—related to specified genetic variants (or envi-
ronmental exposures).
Frequency of Pleiotropy
There is no consensus on the extent of pleiotropy in the
human genome.38 It has been proposed that pleiotropy is
universal,39 modular,40 or infrequent.41–43 In this review,
we show that pleiotropy is found to be a property of
~17% of genes and ~5% of SNPs known to be associated
with diseases or disease traits. Analyses adopting three
comprehensive systematic approaches confirmed that plei-
otropy is common and associated with 13.2%–18.6% of
genes and 4.6%–7.8% SNPs and support the conclusion
that this substantial level of pleiotropy is not falsely in-
flated because of an author-annotation bias.
These all are likely to be minimum estimates given the
conservative definitions used in this report (in an attempt
614 The American Journal of Human Genetics 89, 607–618, Novemb
to avoid inflation of estimates because of highly correlated
traits and/or diseases) and because of the rapid rise in
reported associations and the large number of common
and rare variant associations yet to be found.44
Pleiotropic Genes
We show that pleiotropic genes are longer than nonpleio-
tropic genes (this is consistent across all analytic methods
employed—see Table S1), an effect that might be mediated
by two interacting effects. First, longer genes might encode
an increased number of protein structural domains, which
might in turn give rise to multiple functions; second,
longer genes tend to containmore variants with a concom-
itant rise in the opportunity for some to be involved in
different functions. The GO terms significantly enriched
among pleiotropic genes reflect the fact that immune-
mediated diseases and metabolic syndrome-related traits
are overrepresented among pleiotropic gene associations.
The GO terms highlighted are either the biological
processes most amenable to pleiotropic effects or are due
to confounding, and another property of genes in these
disease classes causes their pleiotropy (Figure 1).
Pleiotropic SNPs
We show that pleiotropic SNPs are more likely to be exonic
and structurally functional than nonpleiotropic SNPs. Our
data does not support our a priori hypothesis that pleio-
tropic SNPs would be more likely to be present in regula-
tory regions that nonpleiotropic SNPs. We repeated these
analyses separately for immune-mediated phenotypes
er 11, 2011
because of concerns about possible confounding (see
Figure 1) but the findings were unchanged.
Clusters of Phenotypes Defined by Pleiotropic Links
By systematically evaluating all gene-trait and SNP-trait
associations in the NHGRI catalog and observing the
various constellations of diseases and traits that arose, it
is possible to contribute evidence to the understanding
of disease etiology and pathogenesis by (1) suggesting
hypotheses and adding evidence to hypotheses for which
there is currently a paucity of data and (2) adding evidence
to established hypotheses surrounding the etiology of
disease. We note that if a phenotype pair is, after further
research, shown to have a causal relationship, then the
gene associated with both these phenotypes should no
longer strictly be considered as pleiotropic, because this
would now be an example of variation in one phenotype
causing variation in the second phenotype. However, until
etiological hypotheses are shown to be correct and a causal
relationship accepted, we will describe genes harboring
variants associated with two correlated phenotypes as
pleiotropic. We present examples of constellations of
diseases and traits in Figures S5–S14.
We demonstrate that calculation of simple probabilities
(by using the independent model) would wrongly assign
many pleiotropic associations as statistically significant. For
example, a relationship between schizophrenia and serum
iron markers45–47 and between schizophrenia and serum
uric acid levels48,49havebeen suggested.A simpleprobability
calculation (Table 7) suggests that these pleiotropic associa-
tions are unlikely to be due to chance and might suggest
further research on this topic. However, our more stringent
DS criterion, which takes into account (1) only genes
harboring variants associated with one or more traits to
date (i.e., not all of the more than 20,000 genes), (2) the
number ofmismatching genes as themarker of dissimilarity
between traits (and therefore our criterion does not overesti-
mate similarities between polygenic traits as other common
approaches do), (3) false negatives (true gene-trait associa-
tions that did not reach a genome-wide significance level),
and (4) false positives (althoughunlikely, given the stringent
p values used in GWAS) and (5) accommodates the binary
nature of the present/absent genetic overlaps, clearly shows
this gene sharing as likely to be due to chance.
We have listed in Table 8 the top ranked correlations
between diseases and/or traits with this approach. The
top ranked correlation is that between fetal hemoglobin
and malaria risk, which confirms a known biological rela-
tionship. The protective properties of high concentrations
of fetal hemoglobin in erythrocytes during the first few
months of life have been known since the 1970s to offer
resistance to infection with Plasmodium falciparum,50 and
the physiological mechanisms have been described.51
This demonstrates the potential of this method of studying
similarity of genetic causes between two traits to correctly
identify shared disease mechanisms and motivate func-
tional research.
The American
The second ranked finding was the ABCG8 pleiotropic
association between serum campesterol and gallstones
risk. Gallstones often have a high content of cholesterol,
and cholesterol oversaturation is one of the main risk
factors in gallstone etiology.52,53 Cholesterol absorption
and secretion into bile is affected by phytosterols
(including campesterol) but also by genetic variants in
ABCG8.54,55 Thus, it is biologically plausible that serum
campesterol and gallstones share a common pathway
and this merits further study.
Our approach also identified the HLA-DRB1 pleiotropic
associations with JIA and immunoglobulin A (IgA) as
very unlikely to be due to chance. High IgA levels have
been reported in a patient with JIA.56 Gilliam et al.57
have shown that JIA patients with joint erosions and
joint-space narrowing had significantly elevated levels of
IgA. The etiology of JIA is unclear, but because of similarity
in genetic influences on IgA and JIA, it is possible that
these traits share a common pathophysiological pathway
and our findings support further investigation of the
involvement of IgA in JIA etiology.
The biological significance of the potentially significant
overlap between the pathophysiological pathways of
narcolepsy and osteoarthritis is less clear. Osteoarthritis
is a chronic degenerative disorder related to aging, but
studies have also shown a strong genetic component.
However, pathophysiological mechanisms have not been
clarified.58 Narcolepsy is caused by the deficiency of hypo-
cretin.59 An autoimmune etiology has been suggested
because of the very strong association with the HLA
subtype DQB1*0602.60,61 The same rationale might sug-
gest an autoimmune component to osteoarthritis etiology.
However, at this point the basis for the shared genetic
influences in these conditions is not clear.
We identified a significant genetic sharing (through ABO
[MIM 110300]) between angiotensin-converting enzyme
activity, venous thromboembolism [MIM 188050] and
serum campesterol, and between TNFa and soluble adhe-
sion molecules E-selectin, P-selectin, and ICAM-1. Many
of these associations have been previously reported in
the literature,62–66 and our findings suggest that these
merit further study.
Implications of Findings
It is likely that there was a degree of misclassification of
genes and/or SNPs into pleiotropic and nonpleiotropic
categories. We attempted to limit this by adopting several
approaches to gene and SNP assignment including system-
atic approaches that should not be affected by observer
bias that could have been present in author-annotated
genes (for example, a tendency to assign associations to
larger genes or to genes for whom the function is known).
Furthermore, we defined and systematically employed
a series of exclusion criteria in order to obtain a conserva-
tive definition of pleiotropy and to attempt to limit the
degree of subjectivity in the definition of pleiotropy (for
example to avoid the recognized upward bias in pleiotropy
Journal of Human Genetics 89, 607–618, November 11, 2011 615

estimates that occurs if trait correlations are not taken into
account as in the exclusion criteria in this study). The
majority of available data at present relate to Northern
American and European white populations, and so it is
not possible to assess whether these findings might vary
in other ethnic groups.
As Wagner and Zhang67 have noted, we can only assess
pleiotropy in the context of which characters have been
already been studied. Therefore labeling a gene or SNP as
nonpleiotropic is always subject to further research. In
this study we have investigated the findings for three illus-
trative disease groups for which there are sufficient data. In
future it might be possible to extend this analysis more
generally to other disease groups. We studied and reported
these separately because we considered that certain disease
classes might exhibit a higher frequency of pleiotropy. It is
possible that this finding could simply be due to an artifact
because these diseases have been explored by GWASs in
greater depth. When all disease classes have been thor-
oughly examined, apparent differences in the frequency
of pleiotropy might not appear so pronounced. We have
accounted for a small probability of false positive and false
negative GWAS associations in the adjusted degree-of-
surprise method. However, mislabeling a gene as pleio-
tropic could have occurred because of reporting bias.
Finally, in many cases only markers in linkage disequilib-
rium with the true causal variant are recorded in the
NHGRI catalog, rather than the true causal variant itself.
Notwithstanding these limitations, our results suggest
that pleiotropy is common in the genetics of complex
disease, and 16.9% of genes and 4.6% of SNPs recorded
in the NHGRI catalog are defined as pleiotropic. Addition-
ally, we have characterized pleiotropic genes as being larger
than nonpleiotropic genes and pleiotropic SNPs as more
likely to be structurally functional and located exonically
and downstream than nonpleiotropic SNPs.
The impact of pleiotropy on genetic testing for common,
complex diseases in clinical and research settings has been
recognized and described with APOE [MIM 107741] as an
exemplar68–70 but has perhaps not received sufficient
emphasis. Companies offering direct-to-consumer testing
and consumers taking this up should be aware that any
variants about which they gain information could, in the
future, be found to be associated with additional (poten-
tially more stigmatizing or untreatable) diseases. An under-
standing of pleiotropic effects is also of key importance for
drug development. For example, although statins inhibit
HMG-CoA reductase, they also have multiple other molec-
ular actions with effects beyond cholesterol reduction,71
and this has been proposed as the basis for their efficacy
in the reduction of cardiovascular outcomes.72,73 Similarly,
selective serotonin reuptake inhibitors have been found to
be effective across different psychiatric disorders because
they act on a pathway common to these differing disor-
ders.36 When a gene has been shown to have opposing
effects on different common diseases (as has been recently
described)74 then this is likely to greatly complicate drug
616 The American Journal of Human Genetics 89, 607–618, Novemb
development and marketing, although knowledge of
pleiotropic associations could help to predict side effects.
These issues are likely to gain in importance as the full
extent of pleiotropy in the genome becomes apparent.
More generally, gaining insight into the level of genetic
connectivity between different diseases and disease traits
gives the opportunity to deduce whether our current clas-
sification and categorization of diseases is valid genetically
or whether genetic similarities traverse current divisions.
This insight might be particularly useful when considering
diseases that have a clinically derived diagnosis and lack
validated diagnostic tests (such as a number of psychiatric
disorders).
Supplemental Data
Supplemental Data include Supplemental Methods, 14 figures,
and one tables and can be found with this article online at
http://www.cell.com/AJHG/.
Acknowledgments
E.T. is funded by Cancer Research UK Fellowship C31250/A10107.
Received: July 5, 2011
Revised: August 25, 2011
Accepted: October 7, 2011
Published online: November 10, 2011
Web Resources
The URLs for data presented herein are as follows:
National Human Genome Research Institute, Catalog of Genome-
Wide Association Studies, http://www.genome.gov/gwastudies/
Online Mendelian Inheritance in Man, http://www.omim.org
References
1. Gruneberg, H. (1938). An analysis of the ‘‘pleiotropic’’ effects
of a new lethal mutation in the rat (Mus norvegicus). Proc.
R. Soc. Lond. B Biol. Sci. 125, 123–144.
2. Dudley, A.M., Janse, D.M., Tanay, A., Shamir, R., and Church,
G.M. (2005). A global view of pleiotropy and phenotypically
derived gene function in yeast. Mol. Syst. Biol. 1, 2005, 0001.
3. He, X., and Zhang, J. (2006). Toward a molecular under-
standing of pleiotropy. Genetics 173, 1885–1891.
4. Becker, K.G. (2004). The common variants/multiple disease
hypothesis of common complex genetic disorders. Med.
Hypotheses 62, 309–317.
5. Hudson, M., Rojas-Villarraga, A., Coral-Alvarado, P., Lopez-
Guzman, S., Mantilla, R.D., Chalem, P., Baron, M., and Anaya,
J.M.; Canadian Scleroderma Research Group; Colombian
Scleroderma Research Group. (2008). Polyautoimmunity and
familial autoimmunity in systemic sclerosis. J. Autoimmun.
31, 156–159.
6. Karasik, D., and Kiel, D.P. (2010). Evidence for pleiotropic
factors in genetics of the musculoskeletal system. Bone 46,
1226–1237.
er 11, 2011

7. Zhernakova, A., van Diemen, C.C., and Wijmenga, C. (2009).
Detecting shared pathogenesis from the shared genetics of
immune-related diseases. Nat. Rev. Genet. 10, 43–55.
8. Huang, W., Wang, P., Liu, Z., and Zhang, L. (2009). Identifying
disease associations via genome-wide association studies.
BMC Bioinformatics 10 (Suppl 1 ), S68.
9. Lees, C.W., Barrett, J.C., Parkes, M., and Satsangi, J. (2011).
New IBD genetics: Common pathways with other diseases.
Gut, in press. Published online February 7, 2011. 10.1136/
gut.2009.199679.
10. Huang, J., Johnson, A.D., and O’Donnell, C.J. (2011). PRIMe:
A method for characterization and evaluation of pleiotropic
regions from multiple genome-wide association studies. Bio-
informatics 27, 1201–1206.
11. Pierce, B.L., and Ahsan, H. (2011). Genome-wide ‘‘pleiotropy
scan’’ identifies HNF1A region as a novel pancreatic cancer
susceptibility locus. Cancer Res. 71, 4352–4358.
12. Okada, Y., Takahashi, A., Ohmiya, H., Kumasaka, N., Kama-
tani, Y., Hosono, N., Tsunoda, T., Matsuda, K., Tanaka, T.,
Kubo, M., et al. (2011). Genome-wide association study for
C-reactive protein levels identified pleiotropic associations
in the IL6 locus. Hum. Mol. Genet. 20, 1224–1231.
13. Voight, B.F., Scott, L.J., Steinthorsdottir, V., Morris, A.P., Dina,
C., Welch, R.P., Zeggini, E., Huth, C., Aulchenko, Y.S., Thor-
leifsson, G., et al; MAGIC investigators; GIANT Consortium.
(2010). Twelve type 2 diabetes susceptibility loci identified
through large-scale association analysis. Nat. Genet. 42,
579–589.
14. Denny, J.C., Ritchie, M.D., Basford, M.A., Pulley, J.M., Bastar-
ache, L., Brown-Gentry, K., Wang, D., Masys, D.R., Roden,
D.M., and Crawford, D.C. (2010). PheWAS: Demonstrating
the feasibility of a phenome-wide scan to discover gene-
disease associations. Bioinformatics 26, 1205–1210.
15. Hindorff, L.A., Junkins, H.A., Hall, P.N., Mehta, J.P., and
Manolio, T.A. (2011). A Catalog of Published Genome-Wide
Association Studies. www.genome.gov/gwastudies.
16. McCarthy, M.I., Abecasis, G.R., Cardon, L.R., Goldstein, D.B.,
Little, J., Ioannidis, J.P., and Hirschhorn, J.N. (2008). Genome-
wide association studies for complex traits: Consensus, uncer-
tainty and challenges. Nat. Rev. Genet. 9, 356–369.
17. Seal, R.L., Gordon, S.M., Lush, M.J., Wright, M.W., and
Bruford, E.A. (2011). genenames.org: The HGNC resources
in 2011. Nucleic Acids Res. 39 (Database issue), D514–D519.
18. Flicek, P., Amode, M.R., Barrell, D., Beal, K., Brent, S., Chen, Y.,
Clapham, P., Coates, G., Fairley, S., Fitzgerald, S., et al. (2011).
Ensembl 2011. Nucleic Acids Res. 39 (Database issue), D800–
D806.
19. HUGO Gene Nomenclature Committee (2011). HGNC Data-
base. http://www.genenames.org/.
20. Friedewald, W.T., Levy, R.I., and Fredrickson, D.S. (1972).
Estimation of the concentration of low-density lipoprotein
cholesterol in plasma, without use of the preparative ultracen-
trifuge. Clin. Chem. 18, 499–502.
21. Ashburner, M., Ball, C.A., Blake, J.A., Botstein, D., Butler, H.,
Cherry, J.M., Davis, A.P., Dolinski, K., Dwight, S.S., Eppig,
J.T., et al; The Gene Ontology Consortium. (2000). Gene
ontology: Tool for the unification of biology. Nat. Genet. 25,
25–29.
22. Eden, E., Lipson, D., Yogev, S., and Yakhini, Z. (2007). Discov-
ering motifs in ranked lists of DNA sequences. PLoS Comput.
Biol. 3, e39.
The American
23. Eden, E., Navon, R., Steinfeld, I., Lipson, D., and Yakhini, Z.
(2009). GOrilla: A tool for discovery and visualization of
enriched GO terms in ranked gene lists. BMC Bioinformatics
10, 48.
24. Kumar, P., Henikoff, S., and Ng, P.C. (2009). Predicting the
effects of coding non-synonymous variants on protein func-
tion using the SIFT algorithm. Nat. Protoc. 4, 1073–1081.
25. Adzhubei, I.A., Schmidt, S., Peshkin, L., Ramensky, V.E.,
Gerasimova, A., Bork, P., Kondrashov, A.S., and Sunyaev, S.R.
(2010). A method and server for predicting damaging
missense mutations. Nat. Methods 7, 248–249.
26. Peirce, B. (1852). Criterion for the Rejection of Doubtful
Observations. Astron. J. II, 161–163.
27. Peirce, B. (1877). On Peirce’s criterion. Proc. Am. Acad. Arts
Sci. 13, 348–351.
28. Bishop, C.M. (1994). Novelty detection and Neural Network
validation. Proceedings of the IEE Conference on Vision,
Image and Signal Processing. 141, 217–222.
29. Chandola, V., Banerjee, A., and Kumar, V. (2009). Anomaly
detection: A survey. ACM Comput. Surv. 41 10.1145/
1541880.1541882.
30. Gao, J., Cheng, H., and Tan, P.-N. (2006). Semi-supervised
outlier detection. Proceedings of the SAC ‘06 ACM Sympo-
sium on Applied Computing. 10.1145/1141277.1141421.
31. Markou,M., and Singh, S. (2003). Novelty detection: A review,
part 1: Statistical approaches. Signal Processing. 83, 2481–
2497.
32. McEliece, R.J. (1977). The Theory of Information and Coding
(Cambridge: Addison-Wesley).
33. Rousseeuw, P., and Leroy, A. (1996). Robust Regression and
Outlier Detection, Third Edition (Hoboken, NJ: John Wiley
& Sons).
34. Tarassenko, L. (1995). Novelty detection for the identification
of masses in mammograms. Proceedings of the 4th IEE Inter-
nationalConferenceonArtificialNeuralNetworks.4, 442–447.
35. Bishop, C.M. (2006). Pattern Recognition and Machine
Learning (New York: Springer).
36. Freimer, N., and Sabatti, C. (2003). The human phenome
project. Nat. Genet. 34, 15–21.
37. Jones, R., Pembrey, M., Golding, J., and Herrick, D. (2005).
The search for genenotype/phenotype associations and the
phenome scan. Paediatr. Perinat. Epidemiol. 19, 264–275.
38. Stearns, F.W. (2010). One hundred years of pleiotropy: A retro-
spective. Genetics 186, 767–773.
39. Wright, S. (1968). Evolution and the genetics of populations,
Volume 1 (Chicago: University of Chicago Press).
40. Welch, J.J., and Waxman, D. (2003). Modularity and the cost
of complexity. Evolution 57, 1723–1734.
41. Albert, A.Y., Sawaya, S., Vines, T.H., Knecht, A.K., Miller, C.T.,
Summers, B.R., Balabhadra, S., Kingsley, D.M., and Schluter,
D. (2008). The genetics of adaptive shape shift in stickleback:
Pleiotropy and effect size. Evolution 62, 76–85.
42. Brem, R.B., Yvert, G., Clinton, R., and Kruglyak, L. (2002).
Genetic dissection of transcriptional regulation in budding
yeast. Science 296, 752–755.
43. Morley, M., Molony, C.M., Weber, T.M., Devlin, J.L., Ewens,
K.G., Spielman, R.S., and Cheung, V.G. (2004). Genetic anal-
ysis of genome-wide variation in human gene expression.
Nature 430, 743–747.
44. Yang, J., Benyamin, B., McEvoy, B.P., Gordon, S., Henders,
A.K., Nyholt, D.R., Madden, P.A., Heath, A.C., Martin, N.G.,
Montgomery, G.W., et al. (2010). Common SNPs explain
Journal of Human Genetics 89, 607–618, November 11, 2011 617
a large proportion of the heritability for human height. Nat.
Genet. 42, 565–569.
45. Insel, B.J., Schaefer, C.A., McKeague, I.W., Susser, E.S., and
Brown, A.S. (2008). Maternal iron deficiency and the risk of
schizophrenia in offspring. Arch. Gen. Psychiatry 65,
1136–1144.
46. McGrath, J., Brown, A., and St Clair, D. (2011). Prevention and
schizophrenia—the role of dietary factors. Schizophr. Bull. 37,
272–283.
47. Sørensen, H.J., Nielsen, P.R., Pedersen, C.B., and Mortensen,
P.B. (2011). Association between prepartum maternal iron
deficiency and offspring risk of schizophrenia: Population-
based cohort study with linkage of Danish national registers.
Schizophr. Bull. 37, 982–987.
48. Buie, L.W., Oertel, M.D., and Cala, S.O. (2006). Allopurinol as
adjuvant therapy in poorly responsive or treatment refractory
schizophrenia. Ann. Pharmacother. 40, 2200–2204.
49. Dickerson, F.B., Stallings, C.R., Origoni, A.E., Sullens, A.,
Khushalani, S., Sandson, N., and Yolken, R.H. (2009). A
double-blind trial of adjunctive allopurinol for schizophrenia.
Schizophr. Res. 109, 66–69.
50. Pasvol, G., Weatherall, D.J., Wilson, R.J., Smith, D.H., and
Gilles, H.M. (1976). Fetal haemoglobin and malaria. Lancet
1, 1269–1272.
51. Shear, H.L., Grinberg, L., Gilman, J., Fabry, M.E., Stamatoyan-
nopoulos, G., Goldberg, D.E., and Nagel, R.L. (1998).
Transgenic mice expressing human fetal globin are pro-
tected from malaria by a novel mechanism. Blood 92, 2520–
2526.
52. Koivusalo, A.I., Pakarinen, M.P., Sittiwet, C., Gylling, H.,
Miettinen, T.A., Miettinen, T.E., and Nissinen, M.J. (2010).
Cholesterol, non-cholesterol sterols and bile acids in paedi-
atric gallstones. Dig. Liver Dis. 42, 61–66.
53. Marschall, H.U., and Einarsson, C. (2007). Gallstone disease.
J. Intern. Med. 261, 529–542.
54. Jakulj, L., Vissers, M.N., Tanck, M.W., Hutten, B.A., Stellaard,
F., Kastelein, J.J., and Dallinga-Thie, G.M. (2010). ABCG5/G8
polymorphisms and markers of cholesterol metabolism:
Systematic review and meta-analysis. J. Lipid Res. 51, 3016–
3023.
55. Sudhop, T., Sahin, Y., Lindenthal, B., Hahn, C., Luers, C., Bert-
hold, H.K., and von Bergmann, K. (2002). Comparison of the
hepatic clearances of campesterol, sitosterol, and cholesterol
in healthy subjects suggests that efflux transporters control-
ling intestinal sterol absorption also regulate biliary secretion.
Gut 51, 860–863.
56. Yildiz, B., and Kural, N. (2007). IgG1 deficiency and high IgA
level with juvenile idiopathic arthritis. Eur. J. Pediatr. 166,
1179–1180.
57. Gilliam, B.E., Chauhan, A.K., Low, J.M., and Moore, T.L.
(2008). Measurement of biomarkers in juvenile idiopathic
arthritis patients and their significant association with disease
severity: A comparative study. Clin. Exp. Rheumatol. 26,
492–497.
58. Valdes, A.M., and Spector, T.D. (2008). The contribution of
genes to osteoarthritis. Rheum. Dis. Clin. North Am. 34,
581–603.
618 The American Journal of Human Genetics 89, 607–618, Novemb
59. De la Herran-Arita, A.K., Guerra-Crespo, M., and Drucker-
Colın, R. (2011). Narcolepsy and orexins: An example of prog-
ress in sleep research. Front Neurol 2, 26.
60. Hallmayer, J., Faraco, J., Lin, L., Hesselson, S., Winkelmann, J.,
Kawashima, M., Mayer, G., Plazzi, G., Nevsimalova, S., Bour-
gin, P., et al. (2009). Narcolepsy is strongly associated with
the T-cell receptor alpha locus. Nat. Genet. 41, 708–711.
61. Hor, H., Kutalik, Z., Dauvilliers, Y., Valsesia, A., Lammers, G.J.,
Donjacour, C.E., Iranzo, A., Santamaria, J., Peraita Adrados, R.,
Vicario, J.L., et al. (2010). Genome-wide association study
identifies new HLA class II haplotypes strongly protective
against narcolepsy. Nat. Genet. 42, 786–789.
62. Blann, A.D., Nadar, S.K., and Lip, G.Y. (2003). The adhesion
molecule P-selectin and cardiovascular disease. Eur. Heart J.
24, 2166–2179.
63. Dandona, P., Dhindsa, S., Ghanim, H., and Chaudhuri, A.
(2007). Angiotensin II and inflammation: The effect of angio-
tensin-converting enzyme inhibition and angiotensin II
receptor blockade. J. Hum. Hypertens. 21, 20–27.
64. Das, U.N. (2005). Is angiotensin-II an endogenous pro-inflam-
matory molecule? Med. Sci. Monit. 11, RA155–RA162.
65. Leeuwenberg, J.F., Smeets, E.F., Neefjes, J.J., Shaffer, M.A.,
Cinek, T., Jeunhomme, T.M., Ahern, T.J., and Buurman,
W.A. (1992). E-selectin and intercellular adhesion molecule-
1 are released by activated human endothelial cells in vitro.
Immunology 77, 543–549.
66. Schmidt-Ott, K.M., Kagiyama, S., and Phillips, M.I. (2000).
The multiple actions of angiotensin II in atherosclerosis.
Regul. Pept. 93, 65–77.
67. Wagner, G.P., and Zhang, J. (2011). The pleiotropic structure
of the genotype-phenotype map: The evolvability of complex
organisms. Nat. Rev. Genet. 12, 204–213.
68. Cooper, Z.N., Nelson, R.M., and Ross, L.F. (2006). Informed
consent for genetic research involving pleiotropic genes: An
empirical study of ApoE research. IRB 28, 1–11.
69. Wachbroit, R. (1998). The question not asked: The challenge
of pleiotropic genetic tests. Kennedy Inst. Ethics J. 8, 131–144.
70. Wade, C.H., and Wilfond, B.S. (2006). Ethical and clinical
practice considerations for genetic counselors related to
direct-to-consumer marketing of genetic tests. Am. J. Med.
Genet. C. Semin. Med. Genet. 142C, 284–292, discussion 293.
71. Takemoto, M., and Liao, J.K. (2001). Pleiotropic effects of
3-hydroxy-3-methylglutaryl coenzyme a reductase inhibitors.
Arterioscler. Thromb. Vasc. Biol. 21, 1712–1719.
72. McFarlane, S.I., Muniyappa, R., Francisco, R., and Sowers, J.R.
(2002). Clinical review 145: Pleiotropic effects of statins: Lipid
reduction and beyond. J. Clin. Endocrinol. Metab. 87, 1451–
1458.
73. Wolfrum, S., Jensen, K.S., and Liao, J.K. (2003). Endothelium-
dependent effects of statins. Arterioscler. Thromb. Vasc. Biol.
23, 729–736.
74. Wang, K., Baldassano, R., Zhang, H., Qu, H.Q., Imielinski, M.,
Kugathasan, S., Annese, V., Dubinsky, M., Rotter, J.I., Russell,
R.K., et al. (2010). Comparative genetic analysis of inflamma-
tory bowel disease and type 1 diabetes implicates multiple loci
with opposite effects. Hum. Mol. Genet. 19, 2059–2067.
75. The International Diabetes Federation. (2006). The IDF
consensus worldwide definition of the metabolic syndrome,
http://www.idf.org/webdata/docs/IDF_Meta_def_final.pdf.
er 11, 2011