Feind- und Konfliktbilder des Kalten Krieges ... - DIPLOMARBEIT
Upload
khangminh22Category
view
2download
0
Patrick Pertl, Dipl.-Ing.
Engine Development of an Extended Expansion Engine -
Expansion to Higher Efficiency
DOCTORAL THESIS
to achieve the university degree of
Doktor der technischen Wissenschaften
submitted to
Graz University of Technology
Supervisor
Univ.-Prof. Dipl.-Ing. Dr.techn. Helmut Eichlseder
Institute of Internal Combustion Engines and Thermodynamics
Graz University of Technology
2nd
Supervisor
Professor Roy Douglas
School of Mechanical and Aerospace Engineering
Queen’s University Belfast
Graz, February 2016

ii
iii
Vorwort
Effektiver Wirkungsgrad größer 50% für PKW-Motoren! Diese einprägende Zieldefinition
bekam ich vor mittlerweile 5 Jahren erstmals zu hören, als der Projektpartner Denso
Deutschland GmbH diese formulierte und mir gleichzeitig das Projekt zugeteilt wurde.
Anfangs fragte ich noch zögerlich, ob man sich im Zuge der Zieldefinition eventuell in der
Motorgröße geirrt hätte. Nein, hatte man nicht! Anhand der durchaus ehrgeizigen Zielsetzung
und der daraus resultierenden enormen Effizienzsteigerung, dies gilt sowohl beim Otto- als
auch beim Dieselmotor, wurde bald klar, dass derzeitige, eher „konventionelle“ Methoden um
den Wirkungsgrad zu steigern, nicht das gewünschte Potential hätten. Somit: „Back to the
roots of theoretical thermodynamics!“
Ein sehr interessanter und überaus vielversprechender Ansatz zur Effizienzsteigerung,
zumindest theoretisch, stellt die „Erweiterte Expansion“ dar. Der Vorteil liegt darin, dass das
Gas durch den verlängerten Expansionshub weiter entspannt und damit die im Gas enthaltene
thermische Energie besser ausgenutzt wird. Den Anstoß dazu lieferte der britische Ingenieur
James Atkinson mit seinem Atkinson-Motor im Jahre 1882. Aufgrund des originellen
Kurbeltriebdesign kann dieser Motor unterschiedliche Kompressions- und Expansionshübe
realisieren. Nach weiteren, detaillierteren thermodynamischen Studien und
Literaturrecherchen kristallisierte sich bald heraus, dass das Konzept der Erweiterten
Expansion zur Erfüllung der Zieldefinition geeignet und somit für weitere Untersuchungen
durchaus erfolgversprechend sein könnte. Dieses Wirkungsgradpotential überzeugte auch
unseren Projektpartner Denso, weshalb das Projekt und somit die Zusammenarbeit über knapp
dreieinhalb Jahre andauerte und mir damit den Weg zur Verfassung der Doktorarbeit ebnete.
Mein Dank gilt hier insbesondre der Fa. Denso Deutschland GmbH und dem zuständigen
Projektleiter Hr. Takaaki Sato, mit dem ich auch abseits des Projektalltags ein
freundschaftliches Verhältnis pflegte.
Neben der Bereitstellung finanzieller Mittel, welche für einen kontinuierlichen Projektablauf
entscheidend sind, sind vor allem die zur Verfügung stehenden Ressourcen von enormer
Bedeutung zum Gelingen eines, teilweise mit hoher Komplexität gekennzeichneten, Projekts.
Bezüglich infrastruktureller, materieller und vor allem personeller Ressourcen war ich am
Institut für Verbrennungskraftmaschinen und Thermodynamik bestens aufgehoben und
konnte jederzeit mit großer Unterstützung rechnen. Deshalb möchte ich mich auch zu allererst
bei meinem Fachbereichsleiter, Assoc.Prof. Dipl.-Ing. Dr. Roland Kirchberger, sowie den
stellvertretenden Fachbereichsleiter Dr. Stephan Schmidt, für das mir entgegengebrachte
Vertrauen und die Möglichkeit, dieses Projekt durchzuführen und zu leiten, bedanken. Dieser
Dank gilt natürlich auch dem Institutsvorstand und meinem Doktorvater, Herrn. Univ.-Prof.
Dipl.-Ing. Dr. Helmut Eichlseder, der mir die Durchführung dieser Doktorarbeit ermöglichte
und mich mit wissenschaftlich zielgerichteten Antworten zu diversen Fragestellungen
unterstützte und somit zum Erfolg des Projekts und dieser Arbeit beitrug. Ebenfalls möchte
ich mich bei Prof. Roy Douglas für die Begutachtung der Dissertation bedanken.
Da solch umfassende Projekte niemals von einer Person allein bewältigt werden können, gilt
ein besonders wertvoller Dank den Mitarbeitern des Instituts sowie Studenten, welche über
die Jahre beteiligt waren. Durch ihren entgegengebrachten Enthusiasmus und ihre hohe

iv
Kompetenz bei der Bearbeitung diverser Aufgabenstellungen zeichneten sie verantwortlich
für den kontinuierlichen Projektfortschritt und letztendlich für den sehr erfolgreichen
Abschluss. Besonders hervorzuheben ist die freundschaftliche Art und Weise während der
gemeinsamen Projektzeit.
Es ist ein besonderes Privileg, wenn man Beruf und Freundschaft verbinden kann. Während
meiner Zeit am Institut wurde mir dieses Privileg zuteil. Deshalb gilt ein besonders
freundschaftlicher Dank meinem Freund und Kollegen Dipl.-Ing. Alexander Trattner, der mir
während meiner Zeit am Institut immer mit fachlichen (hot eh imma gstimmt!) und vor allem
menschlichen Rat stets bei Seite gestanden ist. Lieber Alex, danke für deine Freundschaft!
Ein großes Dankeschön gilt Frau Mag. Claudia Melde für das Korrekturlesen, die
grammatikalische und sprachliche Unterstützung bei der Erstellung dieser Arbeit, sowie bei
unzähligen Hilfestellungen mit manch bürokratischen Universitätshürden.
Meinen bisherigen Lebensweg in dieser Form und Weise einzuschlagen ist nicht
selbstverständlich und bedingt familiärer Unterstützung. Auf diesem Wege möchte ich mich
bei meinen Eltern und Großeltern recht herzlich für das entgegengebrachte Vertrauen und
Verständnis bedanken.
Ich möchte diese Arbeit meiner Freundin Christine widmen. Ich danke dem wunderbaren
Zufall, der dich in mein Leben „colliden“ lies. Liebe Chrisi:
Every conversation with you starts a celebration in me
You’re sugar on my soul
And you're like no one I know
Forever togetherness
Love you my Honey!

v
Dedication
I would like to dedicate this doctoral thesis to my girlfriend Christine. Thanks for the
wonderful coincidence that let you “collide” into my life! Dear Chrisi:
Every conversation with you starts a celebration in me
You’re sugar on my soul
And you're like no one I know
Forever togetherness
Love you my Honey!
vi
Table of contents
VORWORT ......................................................................................................................................................... III
DEDICATION ....................................................................................................................................................... V
TABLE OF CONTENTS .................................................................................................................................... VI
SYMBOLS, INDICES AND ABBREVIATIONS .......................................................................................... VIII
EIDESSTATTLICHE ERKLÄRUNG / AFFIDAVIT ..................................................................................... XI
ABSTRACT ....................................................................................................................................................... XII
ZUSAMMENFASSUNG ................................................................................................................................. XIV
1 INTRODUCTION ....................................................................................................................................... 1
2 POSSIBILITIES TO IMPROVE THE EFFICIENCY OF AN ICE ....................................................... 6
2.1 INCREASE OF THEORETICAL EFFICIENCY .................................................................................................... 6 2.2 REDUCTION OF INNER ENGINE LOSSES ..................................................................................................... 11 2.3 REDUCTION OF MECHANICAL LOSSES ...................................................................................................... 19 2.4 RECOVERY OF WASTE-ENERGY ................................................................................................................ 21 2.5 ALTERNATIVE PROPULSION CONCEPTS .................................................................................................... 23
3 EXTENDED EXPANSION ...................................................................................................................... 25
3.1 THEORETICAL THERMODYNAMIC ANALYSES BASED ON AN AIR-STANDARD ATKINSON CYCLE ............... 28 3.2 THEORETICAL THERMODYNAMIC ANALYSES BASED ON AN ATKINSON IDEAL ENGINE CYCLE ................. 33 3.3 EXTENDED EXPANSION ENGINE DESIGN APPLICATIONS (TECHNOLOGY STATUS) ..................................... 35
3.3.1 Basic principle of the Atkinson cycle piston motion (on the example of planetary gear crank train
arrangement) ............................................................................................................................................... 41 3.4 PRE-LAYOUT OF AN EE ENGINE WITH 1D-CFD SIMULATION ................................................................... 44
3.4.1 1D-CFD simulation methodology ................................................................................................. 44 3.4.2 Efficiency potential and engine size .............................................................................................. 47 3.4.3 Comparison between Atkinson and Miller concepts with 1D-CFD simulation ............................. 49
3.5 TARGET ENGINE LAYOUT ......................................................................................................................... 53
4 NUMERICAL SIMULATION OF THE EXTENDED EXPANSION ENGINE ................................. 55
4.1 SIMULATION METHODOLOGY AND STARTING BASIS ................................................................................ 55 4.2 FULL LOAD BEHAVIOUR ........................................................................................................................... 57 4.3 ENGINE SPEED INFLUENCE ....................................................................................................................... 61 4.4 PART LOAD BEHAVIOUR .......................................................................................................................... 62 4.5 DE-THROTTLING ...................................................................................................................................... 68 4.6 CYLINDER DEACTIVATION ....................................................................................................................... 71 4.7 DRIVING CYCLE ANALYSIS ...................................................................................................................... 74
4.7.1 Brake specific fuel consumption results (BSFC maps) .................................................................. 75 4.7.2 Influence of valve train variability on BSFC ................................................................................. 77 4.7.3 Results of the driving cycle analysis .............................................................................................. 79
5 DESIGN OF THE EXTENDED EXPANSION PROTOTYPE ENGINE ............................................ 83
5.1 VALVE TIMING OPTIMISATION PROCESS ................................................................................................... 88 5.1.1 Valve timing optimisation process at full load .............................................................................. 89 5.1.2 Valve timing optimisation process at part load ............................................................................. 90
5.2 MASS BALANCING ................................................................................................................................... 92 5.2.1 Free mass forces and moments of the unbalanced EE prototype engine ...................................... 93 5.2.2 Mass balancing of the Extended Expansion prototype engine .................................................... 102
6 EXPERIMENTAL INVESTIGATIONS ............................................................................................... 106
6.1 FULL LOAD BEHAVIOUR ......................................................................................................................... 109 6.2 ENGINE SPEED INFLUENCE ..................................................................................................................... 117 6.3 LOAD INFLUENCE .................................................................................................................................. 124 6.4 IGNITION VARIATION ............................................................................................................................. 127 6.5 PART LOAD BEHAVIOUR ........................................................................................................................ 131 6.6 FRICTION BEHAVIOUR............................................................................................................................ 136

vii
6.7 EXHAUST TEMPERATURE BEHAVIOUR ................................................................................................... 141
7 EVALUATION OF THE NUMERICAL SIMULATIONS ................................................................. 143
7.1 EVALUATION OF THE FULL LOAD BEHAVIOUR ....................................................................................... 145 7.2 EVALUATION OF THE PART LOAD BEHAVIOUR ....................................................................................... 149
8 CONCLUSIONS AND OUTLOOK ....................................................................................................... 151
LITERATURE ....................................................................................................................................................... I
LIST OF FIGURES ......................................................................................................................................... VIII
LIST OF TABLES ........................................................................................................................................... XIV
viii
Symbols, indices and abbreviations
Latin symbols
𝑉𝐶 m³ Compression volume
𝑉𝐻,𝐶 m³ Swept volume at compression stroke
𝑉𝐻,𝐸 m³ Swept volume at expansion stroke
p.p. Percentage points
Greek symbols
𝛾 Volume ratio
𝜀 Compression ratio
𝜀𝐶 Compression ratio
𝜀𝐸 Expansion ratio
𝜑 ° CA Crank angle
𝜂 Efficiency
𝜂e ; 𝜂i Effective; indicated (inner) efficiency
𝜂m Mechanical efficiency
𝜂th Thermal efficiency
𝜂𝑡ℎ_𝐴𝑡𝑘𝑖𝑛𝑠𝑜𝑛 Thermal efficiency of the air-standard Atkinson
cycle
𝜂𝑡ℎ_𝑂𝑡𝑡𝑜 Thermal efficiency of the air-standard Otto cycle
𝜅 Isentropic exponent
𝜆 Air/fuel ratio
𝜆a Volumetric efficiency
Operators und designations
d Complete differential
δ Incomplete differential
∂ Partial differential
Δ Difference between two quantities
Π Product
Σ Sum · Time derivative
Further indices and abbreviations
1D One-dimensional
3D Three-dimensional
abs Absolute
AFR Air/Fuel Ratio
ARC Activated Radical Combustion
BDC Bottom dead centre
BEV Battery Electric Vehicle
BMEP Brake mean effective pressure
BSFC Brake specific fuel consumption

ix
CCS Cylinder coordinate system
CER Compression to Expansion Ratio
CFD Computational Fluid Dynamics
CHP Combined Heat and Power
CI Compression ignition
CNG Compressed natural gas
CO2 Carbon dioxide
COG Centre of gravity
CR Compression ratio
deth De-throttling
DIN German Institute for Standardization
DMFC Direct methanol fuel cells
DOHC Double overhead camshaft
EE Extended Expansion
EGR Exhaust gas recirculation
EREV Extended-range electric vehicles
EU European Union
EV Electric Vehicle
EVC Exhaust valve closing
EVO Exhaust valve opening
Ex-PL Exhaust part load valve timing
Ex-WOT Exhaust full load valve timing
FEM Finite element method
FMEP Friction mean effective pressure
FTP-75 Federal Test Procedure
GCS Global coordinate system
GE Gas exchange
GE IMEP Gas exchange indicated mean effective pressure
HC Hydrocarbon
HCCI Homogenous Charge Compression Ignition
HEV Hybrid electric vehicle
HP High pressure
ICE Internal combustion engine
IMEP Indicated mean effective pressure
In-deth Intake de-throttled valve timing
In-PL Intake part load valve timing
In-WOT Intake full load valve timing
IPCC Intergovernmental Panel on Climate Change
ISFC Indicated specific fuel consumption
ISO International Organization for Standardization
IVC Intake valve closing
IVO Intake valve opening
IVT Institute of Internal Combustion Engines and Thermodynamics
JC08 Japanese driving cycle
LNG Liquefied natural gas
LP Low pressure
LPG Liquefied petroleum gas
max Maximum
MEP Mean effective pressure
MFB Mass fraction burned
MFB10 Mass fraction burned 10%
MFB50 Mass fraction burned 50%
x
MFB90 Mass fraction burned 90%
min Minimum
MPI Multi Point Injection
NEDC New European Driving Cycle
NOx Nitrogen oxides
NVH Noise, vibration, and harshness
OEM Original equipment manufacturer
ORC Organic Rankine cycle
PEFC Polymer electrolyte fuel cells
PEV Plug-in electric vehicle
PHEM Passenger car and Heavy duty Emission Model
PHEV Plug-in hybrid vehicles
PL Part load
RCP Representative Concentration Pathways
rel relative
SI Spark ignition
SOC Start of combustion
SOFC Solid oxide fuel cell
SULEV Super Ultra Low Emissions Vehicle
SUV Sport Utility Vehicle
TDC Top dead centre
TDCGE Top dead centre (at) gas exchange
TDCI Top dead centre (at) ignition
TWC Three-way catalyst
VCR Variable compression ratio
VGT Variable-geometry turbocharger
VVT Variable valve timing
WOT Wide Open Throttle (corr. to full load)
According to DIN 1304-1, DIN 1345, DIN 13 345 and ISO 80 0000-5

xi
Eidesstattliche Erklärung / Affidavit
Ich erkläre an Eides statt, dass ich die vorliegende Arbeit selbstständig verfasst, andere als die
angegebenen Quellen/Hilfsmittel nicht benutzt, und die den benutzten Quellen wörtlich und
inhaltlich entnommenen Stellen als solche kenntlich gemacht habe. Das in TUGRAZonline
hochgeladene Textdokument ist mit der vorliegenden Dissertation identisch.
I declare that I have authored this thesis independently, that I have not used other than the
declared sources/resources, and that I have explicitly indicated all material which has been
quoted either literally or by content from the sources used. The text document uploaded to
TUGRAZonline is identical to the present doctoral thesis.
Dipl.-Ing. Patrick Pertl
Graz, 10 February 2016
xii
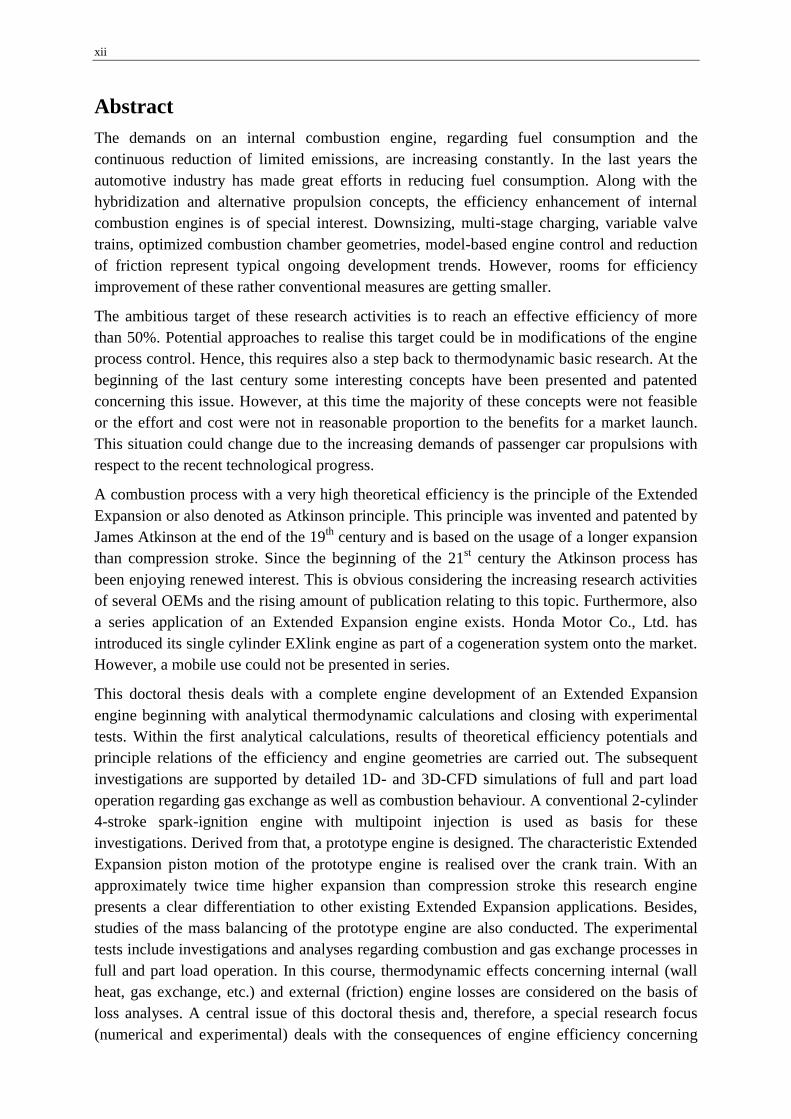
Abstract
The demands on an internal combustion engine, regarding fuel consumption and the
continuous reduction of limited emissions, are increasing constantly. In the last years the
automotive industry has made great efforts in reducing fuel consumption. Along with the
hybridization and alternative propulsion concepts, the efficiency enhancement of internal
combustion engines is of special interest. Downsizing, multi-stage charging, variable valve
trains, optimized combustion chamber geometries, model-based engine control and reduction
of friction represent typical ongoing development trends. However, rooms for efficiency
improvement of these rather conventional measures are getting smaller.
The ambitious target of these research activities is to reach an effective efficiency of more
than 50%. Potential approaches to realise this target could be in modifications of the engine
process control. Hence, this requires also a step back to thermodynamic basic research. At the
beginning of the last century some interesting concepts have been presented and patented
concerning this issue. However, at this time the majority of these concepts were not feasible
or the effort and cost were not in reasonable proportion to the benefits for a market launch.
This situation could change due to the increasing demands of passenger car propulsions with
respect to the recent technological progress.
A combustion process with a very high theoretical efficiency is the principle of the Extended
Expansion or also denoted as Atkinson principle. This principle was invented and patented by
James Atkinson at the end of the 19th
century and is based on the usage of a longer expansion
than compression stroke. Since the beginning of the 21st century the Atkinson process has
been enjoying renewed interest. This is obvious considering the increasing research activities
of several OEMs and the rising amount of publication relating to this topic. Furthermore, also
a series application of an Extended Expansion engine exists. Honda Motor Co., Ltd. has
introduced its single cylinder EXlink engine as part of a cogeneration system onto the market.
However, a mobile use could not be presented in series.
This doctoral thesis deals with a complete engine development of an Extended Expansion
engine beginning with analytical thermodynamic calculations and closing with experimental
tests. Within the first analytical calculations, results of theoretical efficiency potentials and
principle relations of the efficiency and engine geometries are carried out. The subsequent
investigations are supported by detailed 1D- and 3D-CFD simulations of full and part load
operation regarding gas exchange as well as combustion behaviour. A conventional 2-cylinder
4-stroke spark-ignition engine with multipoint injection is used as basis for these
investigations. Derived from that, a prototype engine is designed. The characteristic Extended
Expansion piston motion of the prototype engine is realised over the crank train. With an
approximately twice time higher expansion than compression stroke this research engine
presents a clear differentiation to other existing Extended Expansion applications. Besides,
studies of the mass balancing of the prototype engine are also conducted. The experimental
tests include investigations and analyses regarding combustion and gas exchange processes in
full and part load operation. In this course, thermodynamic effects concerning internal (wall
heat, gas exchange, etc.) and external (friction) engine losses are considered on the basis of
loss analyses. A central issue of this doctoral thesis and, therefore, a special research focus
(numerical and experimental) deals with the consequences of engine efficiency concerning
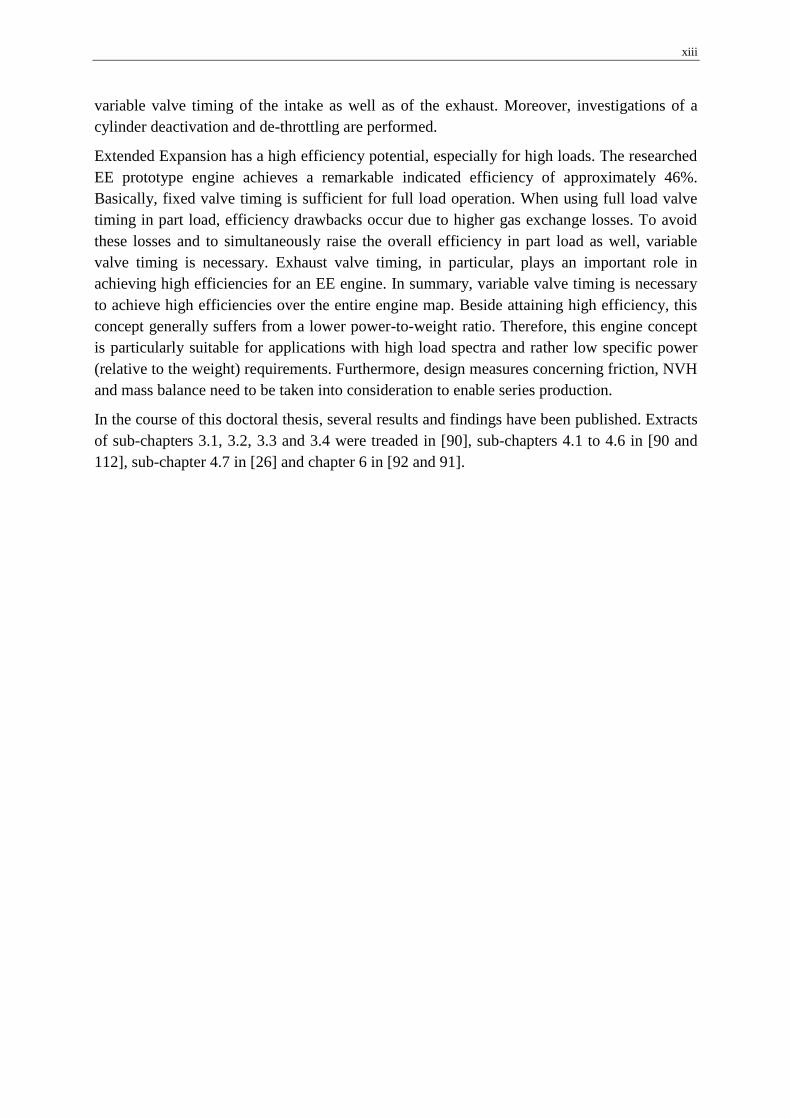
xiii
variable valve timing of the intake as well as of the exhaust. Moreover, investigations of a
cylinder deactivation and de-throttling are performed.
Extended Expansion has a high efficiency potential, especially for high loads. The researched
EE prototype engine achieves a remarkable indicated efficiency of approximately 46%.
Basically, fixed valve timing is sufficient for full load operation. When using full load valve
timing in part load, efficiency drawbacks occur due to higher gas exchange losses. To avoid
these losses and to simultaneously raise the overall efficiency in part load as well, variable
valve timing is necessary. Exhaust valve timing, in particular, plays an important role in
achieving high efficiencies for an EE engine. In summary, variable valve timing is necessary
to achieve high efficiencies over the entire engine map. Beside attaining high efficiency, this
concept generally suffers from a lower power-to-weight ratio. Therefore, this engine concept
is particularly suitable for applications with high load spectra and rather low specific power
(relative to the weight) requirements. Furthermore, design measures concerning friction, NVH
and mass balance need to be taken into consideration to enable series production.
In the course of this doctoral thesis, several results and findings have been published. Extracts
of sub-chapters 3.1, 3.2, 3.3 and 3.4 were treaded in [90], sub-chapters 4.1 to 4.6 in [90 and
112], sub-chapter 4.7 in [26] and chapter 6 in [92 and 91].

xiv
Zusammenfassung
Die Anforderungen an Verbrennungskraftmaschinen hinsichtlich Kraftstoffeinsparung und
gleichzeitiger Emissionsminimierung stetig an. in den letzten Jahren wurden seitens der
Automobilindustrie große Anstrengungen unternommen um die Effizienz der Antriebe zu
steigern. Im Zusammenspiel mit Hybridisierung und anderer alternativer Antriebskonzepten
ist die Effizienzsteigerung der „reinen“ Verbrennungskraftmaschine von besonderem
Interesse. Dabei bilden beispielsweise Downsizing, mehrstufige Aufladung, variable
Ventiltrieb, optimierte Brennraumgeometrien, modelbasierte Motorsteuerungen und die
Reduktion der Motorreibung typische Entwicklungs- und Forschungsschwerpunkte. Jedoch
werden aufgrund dieser intensiven Entwicklungsarbeiten die Potentiale zur
Effizienzsteigerung stetig geringer.
Das hochgesteckte Ziel derzeitiger Forschungsaktivitäten ist jedoch ein effektiver
Motorwirkungsgrad von mehr als 50%. Mögliche Ansätze zur Realisierung dieses Ziels
könnten in einer Modifikation der Motorprozessführung liegen. Damit begibt man sich wieder
auf die Ebene der thermodynamischen Grundlagenuntersuchungen. Bereits zu Beginn des
vorigen Jahrhunderts wurden diesbezüglich einige interessante Konzepte patentiert und
vorgestellt, jedoch waren viele dieser Konzepte damals technologisch nicht umsetzbar bzw.
stand der Aufwand, diese Technologien auf den Markt zu bringen, in keinem Verhältnis zum
Nutzen. Dies könnte sich in Anbetracht gestiegener Ansprüche an den PKW-Antrieb und
angesichts aktueller technologischer Fortschritte ändern.
Ein Brennverfahren mit hohem theoretischem Wirkungsgradpotential ist das Prinzip der
erweiterten Expansion, bei dem der Expansionshub größer als der Kompressionshub ist. In
Anlehnung an seinen Erfinder wird dieses Verfahren auch Atkinson-Prinzip genannt. Der
britischen Ingenieur James Atkinson patentierte sein Motorkonzept im späten 19. Jahrhundert.
In den letzten Jahren erlangte dieses Prinzip wieder größere Aufmerksamkeit, was sich auch
in einer steigenden Anzahl von Publikationen widerspiegelt. Des Weiteren existiert bereits
eine Serienanwendung eines Motors mit erweiterter Expansion von Honda, welcher jedoch
nicht mobil, sondern als Stromerzeuger in einer Kraft-Wärme-Kopplung eingesetzt wird.
Diese Doktorarbeit behandelt eine komplette Motorenentwicklung eines Motorkonzepts mit
erweiterter Expansion – von thermodynamischen Grundsatzuntersuchungen bis hin zu
experimentellen Prüfstandtests. Im Rahmen der thermodynamischen
Grundsatzuntersuchungen wurde das theoretische Grenzpotential ermittelt um damit
prinzipielle Tendenzen bezüglich Wirkungsgrad und Motorgröße abschätzen zu können. Die
darauffolgenden Untersuchungen basieren auf 1D- und 3D-CFD Simulationen und
ermöglichen detailliertere Aussagen über Wirkungsgradpotentiale bzw. Verbrennungs- und
Gaswechselverhalten in Voll- und Teillastbetrieb. Als Basis für die CFD-Untersuchungen
dient ein konventioneller 2-Zylinder 4-Takt Ottomotor mit Saugrohreinspritzung. Abgeleitet
aus den Simulationsergebnissen wurde ein Prototypenmotor ausgelegt und konstruiert. Die
charakteristische Kolbenbewegung dieses Prototypenmotors ist auf Basis eines
Koppelgetriebes realisiert. Mit einem ca. doppelt so großen Expansions- als Ansaugvolumen
unterscheidet sich dieser Versuchsträger von anderen bisher ausgeführten Atkinson-Motoren.
Zusätzlich sind Studien über Massenausgleichsmaßnahmen durchgeführt worden. Die
experimentellen Untersuchungen beinhalten Analysen bezüglich Brennverlauf und
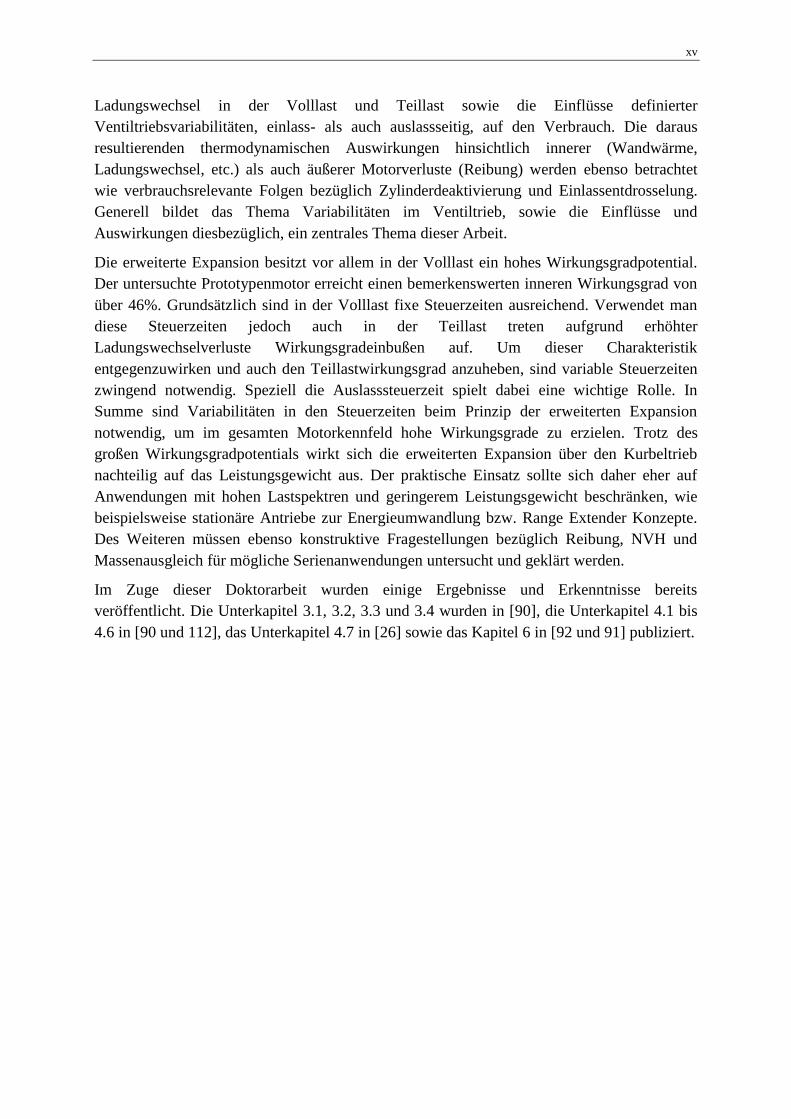
xv
Ladungswechsel in der Volllast und Teillast sowie die Einflüsse definierter
Ventiltriebsvariabilitäten, einlass- als auch auslassseitig, auf den Verbrauch. Die daraus
resultierenden thermodynamischen Auswirkungen hinsichtlich innerer (Wandwärme,
Ladungswechsel, etc.) als auch äußerer Motorverluste (Reibung) werden ebenso betrachtet
wie verbrauchsrelevante Folgen bezüglich Zylinderdeaktivierung und Einlassentdrosselung.
Generell bildet das Thema Variabilitäten im Ventiltrieb, sowie die Einflüsse und
Auswirkungen diesbezüglich, ein zentrales Thema dieser Arbeit.
Die erweiterte Expansion besitzt vor allem in der Volllast ein hohes Wirkungsgradpotential.
Der untersuchte Prototypenmotor erreicht einen bemerkenswerten inneren Wirkungsgrad von
über 46%. Grundsätzlich sind in der Volllast fixe Steuerzeiten ausreichend. Verwendet man
diese Steuerzeiten jedoch auch in der Teillast treten aufgrund erhöhter
Ladungswechselverluste Wirkungsgradeinbußen auf. Um dieser Charakteristik
entgegenzuwirken und auch den Teillastwirkungsgrad anzuheben, sind variable Steuerzeiten
zwingend notwendig. Speziell die Auslasssteuerzeit spielt dabei eine wichtige Rolle. In
Summe sind Variabilitäten in den Steuerzeiten beim Prinzip der erweiterten Expansion
notwendig, um im gesamten Motorkennfeld hohe Wirkungsgrade zu erzielen. Trotz des
großen Wirkungsgradpotentials wirkt sich die erweiterten Expansion über den Kurbeltrieb
nachteilig auf das Leistungsgewicht aus. Der praktische Einsatz sollte sich daher eher auf
Anwendungen mit hohen Lastspektren und geringerem Leistungsgewicht beschränken, wie
beispielsweise stationäre Antriebe zur Energieumwandlung bzw. Range Extender Konzepte.
Des Weiteren müssen ebenso konstruktive Fragestellungen bezüglich Reibung, NVH und
Massenausgleich für mögliche Serienanwendungen untersucht und geklärt werden.
Im Zuge dieser Doktorarbeit wurden einige Ergebnisse und Erkenntnisse bereits
veröffentlicht. Die Unterkapitel 3.1, 3.2, 3.3 und 3.4 wurden in [90], die Unterkapitel 4.1 bis
4.6 in [90 und 112], das Unterkapitel 4.7 in [26] sowie das Kapitel 6 in [92 und 91] publiziert.

Introduction 1
1 Introduction
Today, the internal combustion engine (ICE) is used in a variety of sizes and for different
propulsion applications which ranges from hand-held tools and automobiles up to generators
and big ships. The ICE is the worldwide most used energy conversion machine and based on
a reciprocating piston crank train also the engine with the highest efficiency of all thermal
engines. Today, some upcoming competitive technologies in the field of electrification can be
observed and have already shown technical advances. Thus, the enhancement of efficiency
will have to play a key role in the development of future internal combustion engines. Beside
engine efficiency with the direct impact on CO2 emissions other main development drivers for
an ICE can be identified, as the increasing competition of pure electric propulsion and the
customer demand on economical propulsions. The ICE development must respond to these
issues in order to also remain the predominant technology in the future.
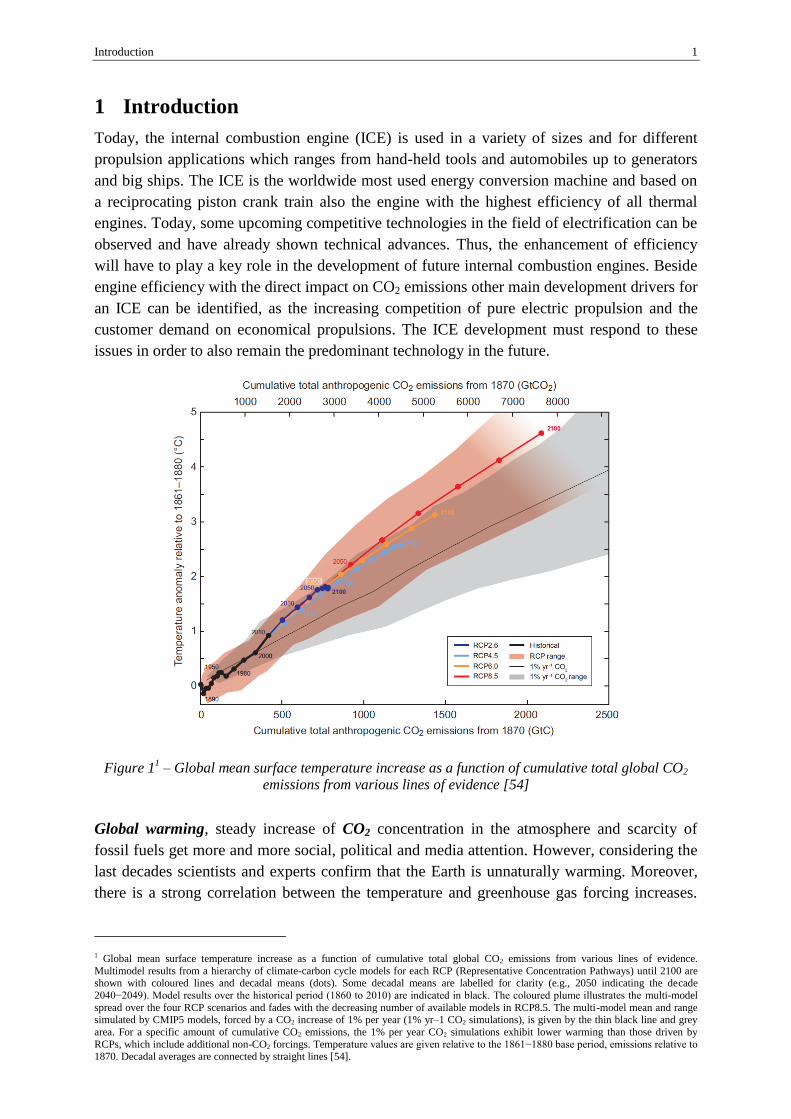
Figure 11 – Global mean surface temperature increase as a function of cumulative total global CO2
emissions from various lines of evidence [54]
Global warming, steady increase of CO2 concentration in the atmosphere and scarcity of
fossil fuels get more and more social, political and media attention. However, considering the
last decades scientists and experts confirm that the Earth is unnaturally warming. Moreover,
there is a strong correlation between the temperature and greenhouse gas forcing increases.
1 Global mean surface temperature increase as a function of cumulative total global CO2 emissions from various lines of evidence.
Multimodel results from a hierarchy of climate-carbon cycle models for each RCP (Representative Concentration Pathways) until 2100 are shown with coloured lines and decadal means (dots). Some decadal means are labelled for clarity (e.g., 2050 indicating the decade
2040−2049). Model results over the historical period (1860 to 2010) are indicated in black. The coloured plume illustrates the multi-model
spread over the four RCP scenarios and fades with the decreasing number of available models in RCP8.5. The multi-model mean and range simulated by CMIP5 models, forced by a CO2 increase of 1% per year (1% yr–1 CO2 simulations), is given by the thin black line and grey
area. For a specific amount of cumulative CO2 emissions, the 1% per year CO2 simulations exhibit lower warming than those driven by
RCPs, which include additional non-CO2 forcings. Temperature values are given relative to the 1861−1880 base period, emissions relative to 1870. Decadal averages are connected by straight lines [54].
2 Introduction
The IPCC (Intergovernmental Panel on Climate Change) indicates that “Cumulative
emissions of CO2 largely determine global mean surface warming by the late 21st century and
beyond (see Figure 1). Most aspects of climate change will persist for many centuries even if
emissions of CO2 are stopped. This represents a substantial multi-century climate change
commitment created by past, present and future emissions of CO2” [54].
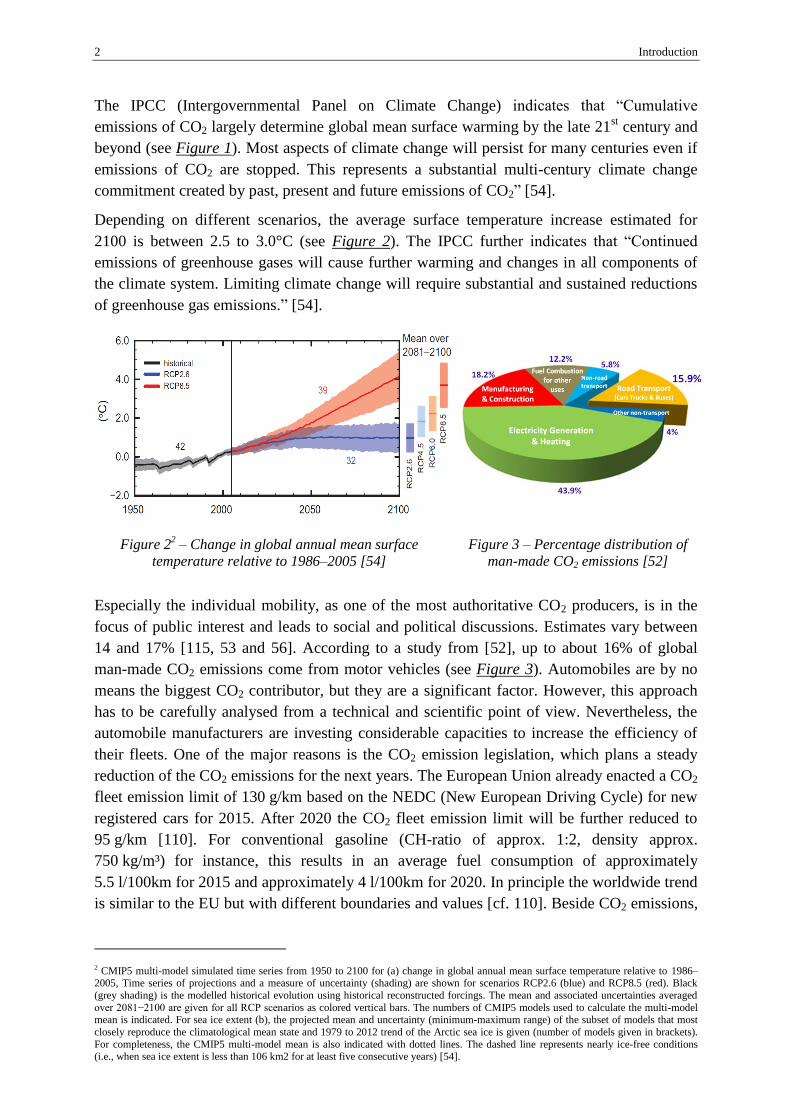
Depending on different scenarios, the average surface temperature increase estimated for
2100 is between 2.5 to 3.0°C (see Figure 2). The IPCC further indicates that “Continued
emissions of greenhouse gases will cause further warming and changes in all components of
the climate system. Limiting climate change will require substantial and sustained reductions
of greenhouse gas emissions.” [54].
Figure 22 – Change in global annual mean surface
temperature relative to 1986–2005 [54]
Figure 3 – Percentage distribution of
man-made CO2 emissions [52]
Especially the individual mobility, as one of the most authoritative CO2 producers, is in the
focus of public interest and leads to social and political discussions. Estimates vary between
14 and 17% [115, 53 and 56]. According to a study from [52], up to about 16% of global
man-made CO2 emissions come from motor vehicles (see Figure 3). Automobiles are by no
means the biggest CO2 contributor, but they are a significant factor. However, this approach
has to be carefully analysed from a technical and scientific point of view. Nevertheless, the
automobile manufacturers are investing considerable capacities to increase the efficiency of
their fleets. One of the major reasons is the CO2 emission legislation, which plans a steady
reduction of the CO2 emissions for the next years. The European Union already enacted a CO2
fleet emission limit of 130 g/km based on the NEDC (New European Driving Cycle) for new
registered cars for 2015. After 2020 the CO2 fleet emission limit will be further reduced to
95 g/km [110]. For conventional gasoline (CH-ratio of approx. 1:2, density approx.
750 kg/m³) for instance, this results in an average fuel consumption of approximately
5.5 l/100km for 2015 and approximately 4 l/100km for 2020. In principle the worldwide trend
is similar to the EU but with different boundaries and values [cf. 110]. Beside CO2 emissions,
2 CMIP5 multi-model simulated time series from 1950 to 2100 for (a) change in global annual mean surface temperature relative to 1986–2005, Time series of projections and a measure of uncertainty (shading) are shown for scenarios RCP2.6 (blue) and RCP8.5 (red). Black
(grey shading) is the modelled historical evolution using historical reconstructed forcings. The mean and associated uncertainties averaged
over 2081−2100 are given for all RCP scenarios as colored vertical bars. The numbers of CMIP5 models used to calculate the multi-model mean is indicated. For sea ice extent (b), the projected mean and uncertainty (minimum-maximum range) of the subset of models that most
closely reproduce the climatological mean state and 1979 to 2012 trend of the Arctic sea ice is given (number of models given in brackets).
For completeness, the CMIP5 multi-model mean is also indicated with dotted lines. The dashed line represents nearly ice-free conditions (i.e., when sea ice extent is less than 106 km2 for at least five consecutive years) [54].
Introduction 3
HC, NOx and soot emissions are restricted for several years. Since the introduction of
emission limits by law, the limit values have been decreased from year to year which have led
to big efforts for engine developers. Nevertheless, it was possible to demonstrate applications
with nearly no impact on local air quality. For SI engines this could be impressively
demonstrated [77]. In addition, it will be discussed if SULEV emissions are also reachable for
CI engines. Currently, some projects are dealing with this issue. Beside improvements
regarding the combustion process and the exhaust after treatment, an economic feasibility
must be given. However, limited emissions are strongly connected with the reachable engine
efficiencies and CO2 emissions, respectively [cf. 77].
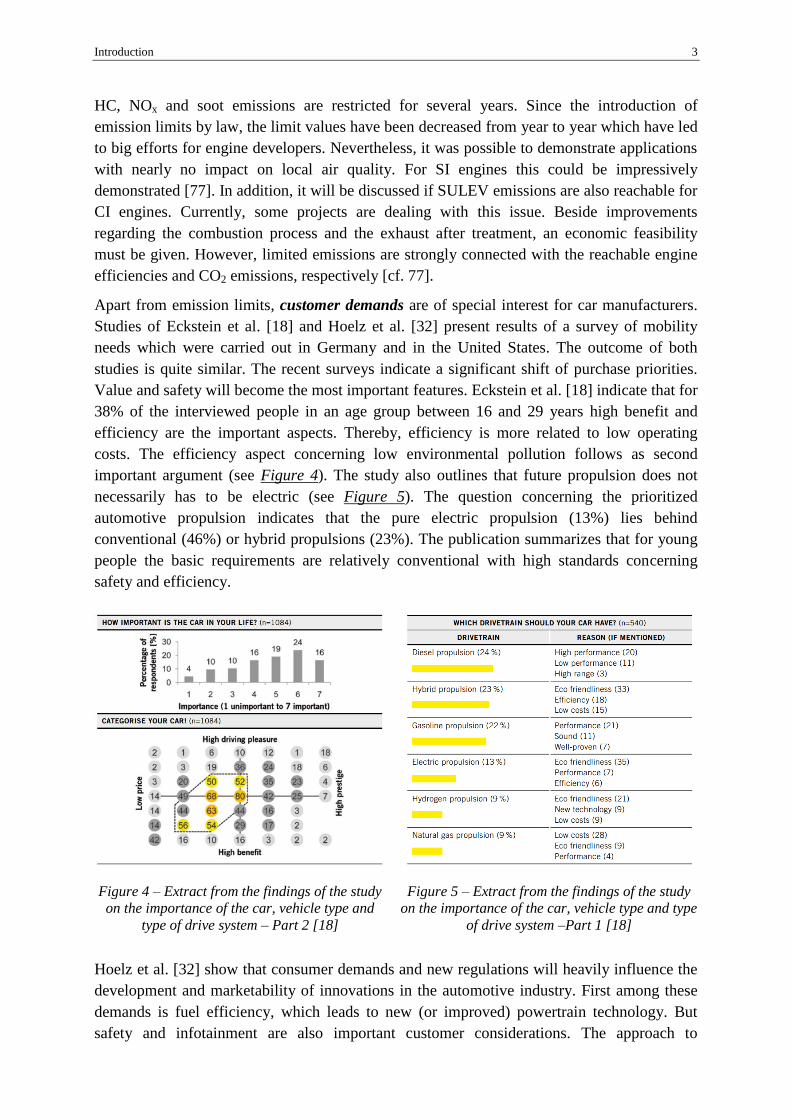
Apart from emission limits, customer demands are of special interest for car manufacturers.
Studies of Eckstein et al. [18] and Hoelz et al. [32] present results of a survey of mobility
needs which were carried out in Germany and in the United States. The outcome of both
studies is quite similar. The recent surveys indicate a significant shift of purchase priorities.
Value and safety will become the most important features. Eckstein et al. [18] indicate that for
38% of the interviewed people in an age group between 16 and 29 years high benefit and
efficiency are the important aspects. Thereby, efficiency is more related to low operating
costs. The efficiency aspect concerning low environmental pollution follows as second
important argument (see Figure 4). The study also outlines that future propulsion does not
necessarily has to be electric (see Figure 5). The question concerning the prioritized
automotive propulsion indicates that the pure electric propulsion (13%) lies behind
conventional (46%) or hybrid propulsions (23%). The publication summarizes that for young
people the basic requirements are relatively conventional with high standards concerning
safety and efficiency.
Figure 4 – Extract from the findings of the study
on the importance of the car, vehicle type and
type of drive system – Part 2 [18]
Figure 5 – Extract from the findings of the study
on the importance of the car, vehicle type and type
of drive system –Part 1 [18]
Hoelz et al. [32] show that consumer demands and new regulations will heavily influence the
development and marketability of innovations in the automotive industry. First among these
demands is fuel efficiency, which leads to new (or improved) powertrain technology. But
safety and infotainment are also important customer considerations. The approach to

4 Introduction
technology will differ between development and emerging markets. Green alternatives, such
as electric cars will likely find more consumer interests in wealthier countries while flex-
fuels, such as ethanol and natural gas, will find wider adoption in emerging markets where the
local climate or resource base favours these fuels over petroleum. By 2020, electric vehicles
and other “green” cars will represent up to a third of the total global sales in development
markets and up to 20% in urban areas of emerging markets. As a general result for the United
States, smaller car models with enhanced safety features will enjoy stronger sales leading up
to 2020. Short-term trends support this thesis: most participants in the United States “cash for
clunkers” program have exchanged SUVs and small trucks for smaller cars.
Today, internal combustion engines dominate the market worldwide, especially in emerging
countries [32]. Nevertheless, a well-known and existing weakness of an ICE is the modest
efficiency at low loads. This problem could be overcome with hybridisation. Due to the
support of the electric motor at low loads and low speeds, the power train efficiency and the
engine efficiency itself (based on an operation point shift) can be improved. VW designed a
plug-in hybrid lightweight prototype vehicle, whereby the powertrain mainly consists of a
two-cylinder Diesel engine in combination with a lithium-ion battery, with a fuel
consumption of 0.9 l/100 km or 24 gCO2/km [117]. This value is remarkable, although this
consumption value is based on the hybrid test procedure, without the consideration of fuel
consumption and CO2 emissions at pure electric drive [77]. Further efficiency potentials and
improvements of hybridisation are lying in start/stop operation and the possible energy
recovery [69].
Statistics of Hoelz et al. [32] specify that hybrids and electric vehicles currently represent a
tiny fraction of total cars on the road. In Germany, 49.6 million cars are in operation of which
1,500 are electric and 22,300 run on hybrid technology. Yet growing environmental concerns,
environmental regulation, volatility of gas prices, and depletion of oil reserves will translate
into a moderate increase in demand for electric vehicles by 2020, especially for use in short
commutes. Nevertheless, there are several potential barriers to a wider adoption of electric
vehicles in the future. These include the elevated costs of electrically powered vehicles, the
limited range of EVs, the lack of infrastructure, and the lack of government incentives or
subsidies [32].
Furthermore, the ascent of EVs in development markets is likely to be threatened by the
emergence of alternative fuel technologies. If R&D efforts are able to reduce the well-to-
wheel efficiency of advanced technology and biofuel combustion engines significantly below
120 g CO2/km, mass market production of EVs may be delayed due to increased customer
acceptance of existing technologies. In addition, Hoelz et al. [32] indicate that the sales of
hybrid cars bear careful scrutiny as they will reveal customer preferences to carmakers. It is
expected that by 2020, hybrids will still outnumber EVs but trends also point to a fully
electric long-term future. However, an objective evaluation of different propulsion systems
must be the basis of future individual mobility in terms of limited resources and
environmental aspects. If considering the entire system (from energy supply to the vehicle),
the internal combustion engine is energetically and environmentally predominant to pure
electric vehicles [106]. At least for the next decades this trend is likely to continue due to
comfort, costs and infrastructure. Taking into account the steady improvements of internal
combustion engines as well as in combination with “intelligent” hybridization for the next
years, individual mobility is guaranteed and more efficient than individual electric mobility.
Introduction 5
Forced by permanent debates about CO2 emissions and the impact on the climate, efficiency
improving processes for an ICE will hold on - also under the aspect of the customer demands
concerning benefit and safety. In addition to the development trends of pure electric vehicles,
hybrids and alternative propulsion concepts, efficiency improvement of the pure ICE will
continue to be of major importance in the automotive industry. But, the room of efficiency
improvement decreases with further technological developments mentioned above.
Nevertheless, additional efficiency improvements are necessary for continuous reduction of
CO2 emissions and maintenance of sustainable energy supply. Therefore, it is also significant
to investigate rather unconventional concepts with huge theoretical efficiency potentials in
terms of their effective benefit and basic feasibility. In the following, several possibilities to
enhance the engine efficiency will be presented and investigated concerning their
thermodynamic efficiency potential and their technological feasibility.
6 Possibilities to improve the efficiency of an ICE
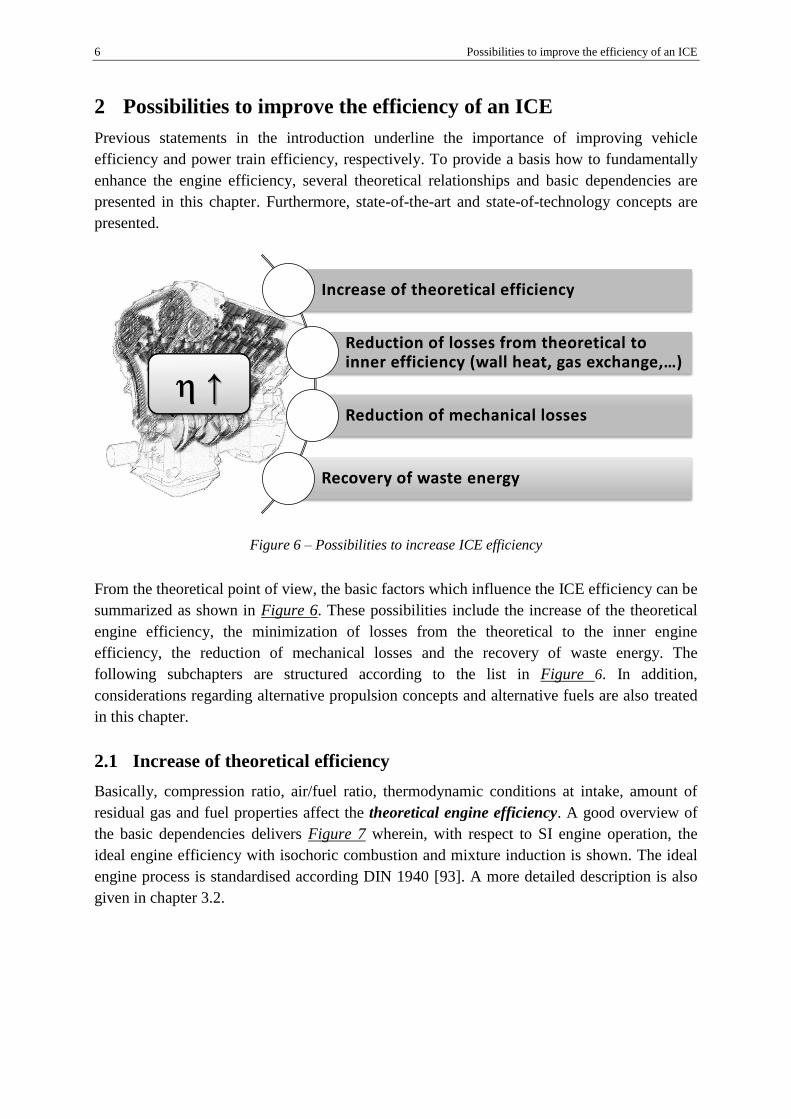
2 Possibilities to improve the efficiency of an ICE
Previous statements in the introduction underline the importance of improving vehicle
efficiency and power train efficiency, respectively. To provide a basis how to fundamentally
enhance the engine efficiency, several theoretical relationships and basic dependencies are
presented in this chapter. Furthermore, state-of-the-art and state-of-technology concepts are
presented.
Figure 6 – Possibilities to increase ICE efficiency
From the theoretical point of view, the basic factors which influence the ICE efficiency can be
summarized as shown in Figure 6. These possibilities include the increase of the theoretical
engine efficiency, the minimization of losses from the theoretical to the inner engine
efficiency, the reduction of mechanical losses and the recovery of waste energy. The
following subchapters are structured according to the list in Figure 6. In addition,
considerations regarding alternative propulsion concepts and alternative fuels are also treated
in this chapter.
2.1 Increase of theoretical efficiency
Basically, compression ratio, air/fuel ratio, thermodynamic conditions at intake, amount of
residual gas and fuel properties affect the theoretical engine efficiency. A good overview of
the basic dependencies delivers Figure 7 wherein, with respect to SI engine operation, the
ideal engine efficiency with isochoric combustion and mixture induction is shown. The ideal
engine process is standardised according DIN 1940 [93]. A more detailed description is also
given in chapter 3.2.
Increase of theoretical efficiency
Reduction of losses from theoretical to inner efficiency (wall heat, gas exchange,…)
Reduction of mechanical losses
Recovery of waste energy

Possibilities to improve the efficiency of an ICE 7
Figure 7 – Ideal engine efficiency (constant
volume process, mixture induction) [93]
Figure 8 – Difference of the ideal engine
efficiency between a constant volume and a
constant pressure process based on mixture
induction [93]
The reachable ideal engine efficiency depends on the compression ratio ε and the air/fuel ratio
λ which further influences the gas properties (κ). In Figure 7 the ideal engine efficiency for a
constant volume process and mixture induction is illustrated. The dashed curve (λ → ∞ and
κ = 1.4) indicates a calculation based on non-temperature-dependent gas properties. All other
curves are based on temperature-dependent gas properties. For high λ values the difference
between temperature-dependent and non-temperature-dependent gas properties is marginal.
Due to the temperature dependency of the specific heat capacities and the dissociation, a
strong λ impact on the ideal efficiency is the consequence. This behaviour reinforces in areas
of air deficiency, due to incomplete combustion (λ < 1). Generally, the efficiency increases
with higher compression ratios and higher air/fuel ratios. Figure 8 shows the efficiency
difference between a constant volume process and a constant pressure process based on
mixture induction. For high λ values the efficiency difference is marginal. The deviation
becomes larger for lower λ and lower ε. Of course this is a theoretical view. In practice, limits
regarding compression ratio and air/fuel ratio due to knocking and exhaust after treatment
exist. However, principle dependencies and, consequently, possible concepts can be derived –
e.g. lean burn operation and variable compression concepts.
Due to the advantageous thermodynamic properties, lean burn operation presents a
promising efficiency enhancing concept. However, for SI engines lean burn operation is
restricted by lean burn ignition limits, reachable mean effective pressures and efforts for
exhaust after treatment. For CI engines lean burn operation is restricted by specific power and
required exhaust gas recirculation. High efficiency values could be presented for passenger
car SI engines with stratified lean burn operation. In stationary part load operation, higher
8 Possibilities to improve the efficiency of an ICE
efficiencies as for comparable CI engines could be reached. If the additional cost for exhaust
gas after treatment for SI engines could be realized cost-efficiently, lean burn operation could
be increasingly used. However, the occurrence of soot and NOx-emissions will be challenging
and probably a new criterion for the future [cf. 77].
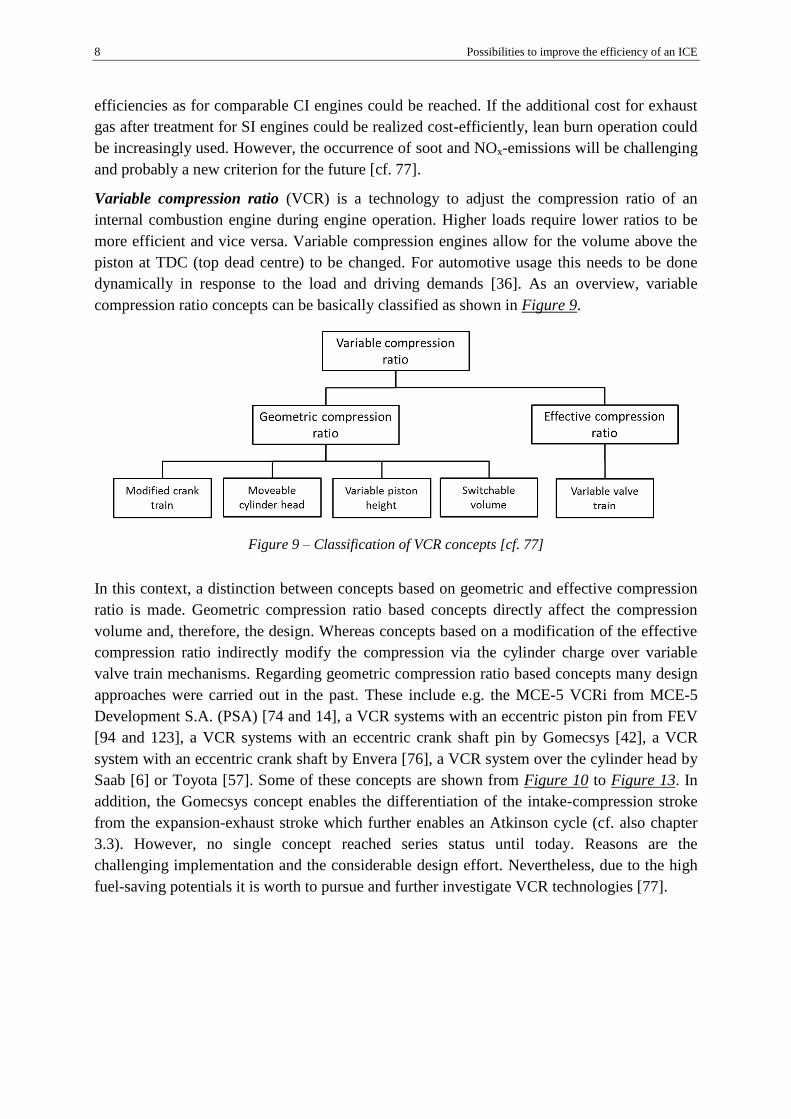
Variable compression ratio (VCR) is a technology to adjust the compression ratio of an
internal combustion engine during engine operation. Higher loads require lower ratios to be
more efficient and vice versa. Variable compression engines allow for the volume above the
piston at TDC (top dead centre) to be changed. For automotive usage this needs to be done
dynamically in response to the load and driving demands [36]. As an overview, variable
compression ratio concepts can be basically classified as shown in Figure 9.
Figure 9 – Classification of VCR concepts [cf. 77]
In this context, a distinction between concepts based on geometric and effective compression
ratio is made. Geometric compression ratio based concepts directly affect the compression
volume and, therefore, the design. Whereas concepts based on a modification of the effective
compression ratio indirectly modify the compression via the cylinder charge over variable
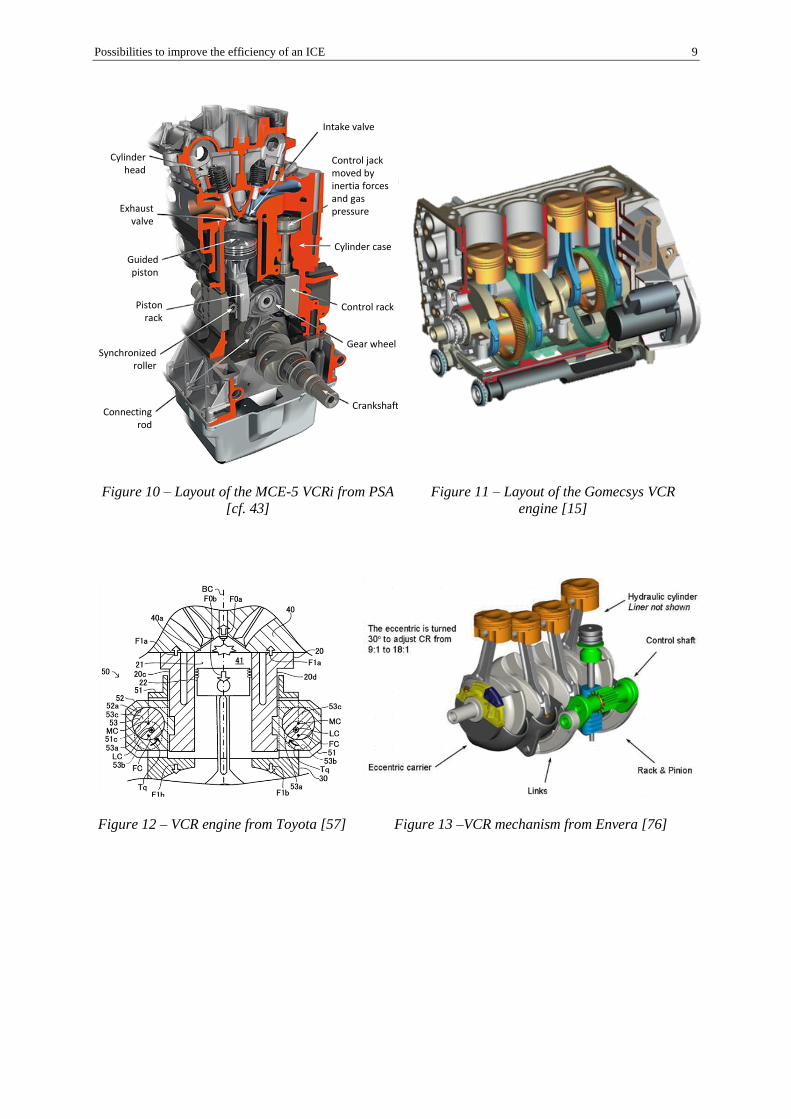
valve train mechanisms. Regarding geometric compression ratio based concepts many design
approaches were carried out in the past. These include e.g. the MCE-5 VCRi from MCE-5
Development S.A. (PSA) [74 and 14], a VCR systems with an eccentric piston pin from FEV
[94 and 123], a VCR systems with an eccentric crank shaft pin by Gomecsys [42], a VCR
system with an eccentric crank shaft by Envera [76], a VCR system over the cylinder head by
Saab [6] or Toyota [57]. Some of these concepts are shown from Figure 10 to Figure 13. In
addition, the Gomecsys concept enables the differentiation of the intake-compression stroke
from the expansion-exhaust stroke which further enables an Atkinson cycle (cf. also chapter
3.3). However, no single concept reached series status until today. Reasons are the
challenging implementation and the considerable design effort. Nevertheless, due to the high
fuel-saving potentials it is worth to pursue and further investigate VCR technologies [77].
Possibilities to improve the efficiency of an ICE 9
Figure 10 – Layout of the MCE-5 VCRi from PSA
[cf. 43]
Figure 11 – Layout of the Gomecsys VCR
engine [15]
Figure 12 – VCR engine from Toyota [57] Figure 13 –VCR mechanism from Envera [76]
Intake valve
Control jack moved by inertia forces and gas pressure
Cylinder case
Control rack
Gear wheel
Crankshaft
Cylinder head
Exhaust valve
Guided piston
Piston rack
Synchronized roller
Connecting rod
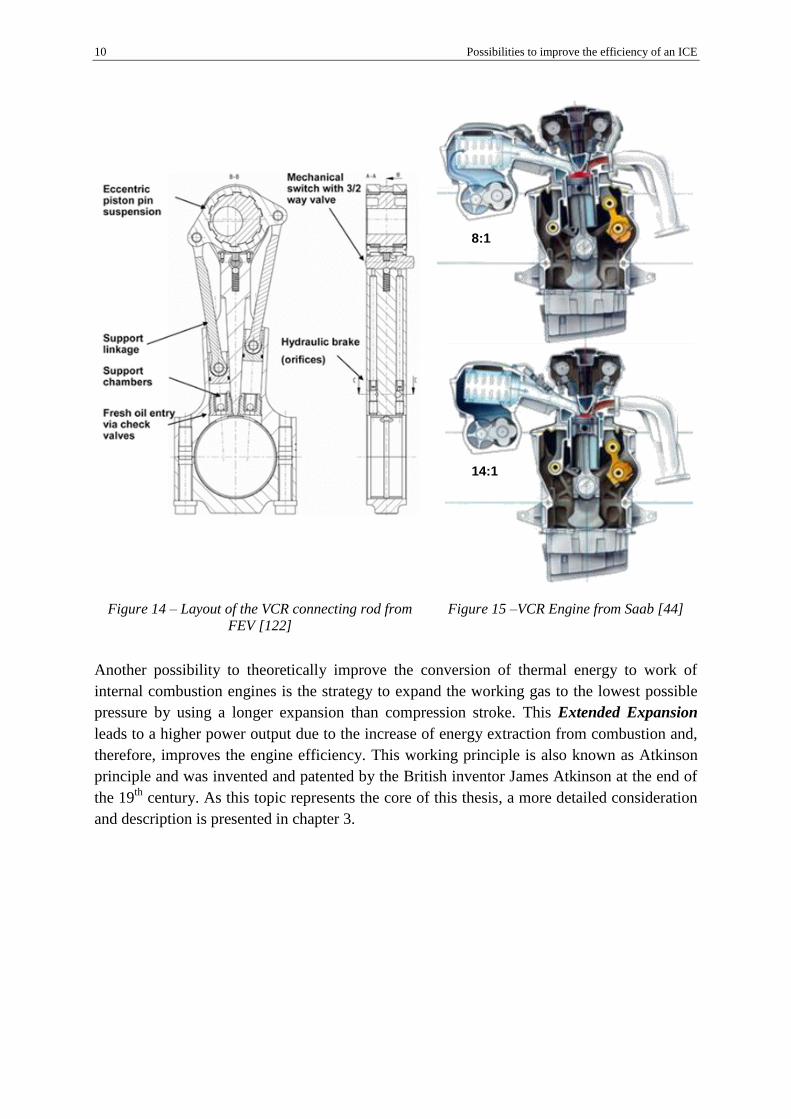
10 Possibilities to improve the efficiency of an ICE
Figure 14 – Layout of the VCR connecting rod from
FEV [122]
Figure 15 –VCR Engine from Saab [44]
Another possibility to theoretically improve the conversion of thermal energy to work of
internal combustion engines is the strategy to expand the working gas to the lowest possible
pressure by using a longer expansion than compression stroke. This Extended Expansion
leads to a higher power output due to the increase of energy extraction from combustion and,
therefore, improves the engine efficiency. This working principle is also known as Atkinson
principle and was invented and patented by the British inventor James Atkinson at the end of
the 19th
century. As this topic represents the core of this thesis, a more detailed consideration
and description is presented in chapter 3.
8:1
14:1

Possibilities to improve the efficiency of an ICE 11
2.2 Reduction of inner engine losses
In contrast to the ideal engine process, the real engine process has a number of losses which
considerably influence the reachable efficiency. These losses include real charge losses,
imperfect combustion losses, real combustion losses, wall heat losses, gas exchange losses
and mechanical losses. The classification of the losses is based on [93]. The determination of
the several losses can be derived by a thermodynamic analysis of losses. The calculation of
the single losses is partly very complex because of the interaction between each loss. Yet, loss
analyses show potentials to optimize the engine in terms of design and the combustion
process. Hereafter, basic thermodynamic relations and, consequentially, derived concepts to
minimize real combustion losses, wall heat losses and gas exchange losses will be presented.
Isochoric combustion leads to highest conceivable efficiencies. The real combustion is
considerably delayed and thermodynamically unfavourable. In addition, constant volume
combustion causes high cylinder pressures and temperatures. The real process is therefore
limited by permitted cylinder pressure loads as well as noise and NOx-emissions. The real
combustion loss is always related to the wall heat loss. A fast combustion minimizes the real
combustion loss, but increases the wall heat loss and vice versa. Both losses are decisively
influenced by the start of combustion, the combustion duration, the combustion shape and the
centre of combustion. An optimisation always requires joint consideration of both losses [93].
Figure 16 – Trade-off between efficiency, wall heat and combustion duration [77]
To thermodynamically evaluate shorter combustion durations without consideration of the
feasibility, simulation results of an SI engine (with fuel stratified injection) in part load
operation are shown in Figure 16. Basically, this study indicates that efficiency potentials are
rather low. However, some design concepts with the aim to approximate an isochoric
combustion process exist. The majority of these concepts are based on holding the piston for a
longer period in the top dead centre (TDC) as in conventional engines. A well-known
application is the double connecting rod engine. The first patent goes back to Alvah L. Powell
in the early nineteen twenties (see Figure 17). In 1970, the German inventor Gerhard Mederer
developed an engine based on Powell’s engine (see Figure 18) with the aim to improve the
engine torque for high loads. But the high expectations could not be fulfilled. According to

12 Possibilities to improve the efficiency of an ICE
studies from [8], the engine delivers in full as well as in part load higher specific fuel
consumption. The expected high torque in medium speed ranges could also not be
demonstrated. Due to the higher design complexity and mechanical losses, these concepts are
rather excluded from technical realisation in series production.
Another possibility to modify the piston motion is a piston pin or crank train offset. However,
studies of Schaffer et al. [99] indicate a rather low thermodynamic potential for an
investigated CI engine. The slight efficiency improvements could also be argued as a result of
a better friction behaviour due to a favourable (smaller) conrod angle.
Figure 17 – Powell Engine [95] Figure 18 – Mederer Engine [75]
The aim of alternative combustion processes is to combine the advantages of CI and SI
operation [89]. The characteristic of the alternative CI process allows the combustion of very
lean or diluted mixtures with low combustion temperatures leading to low NOx and smoke
emissions [51]. The first HCCI engine was the “Lohmann Selbstzünder” (Figure 19) from
1949. Here, the HCCI operation is based on variable compression.
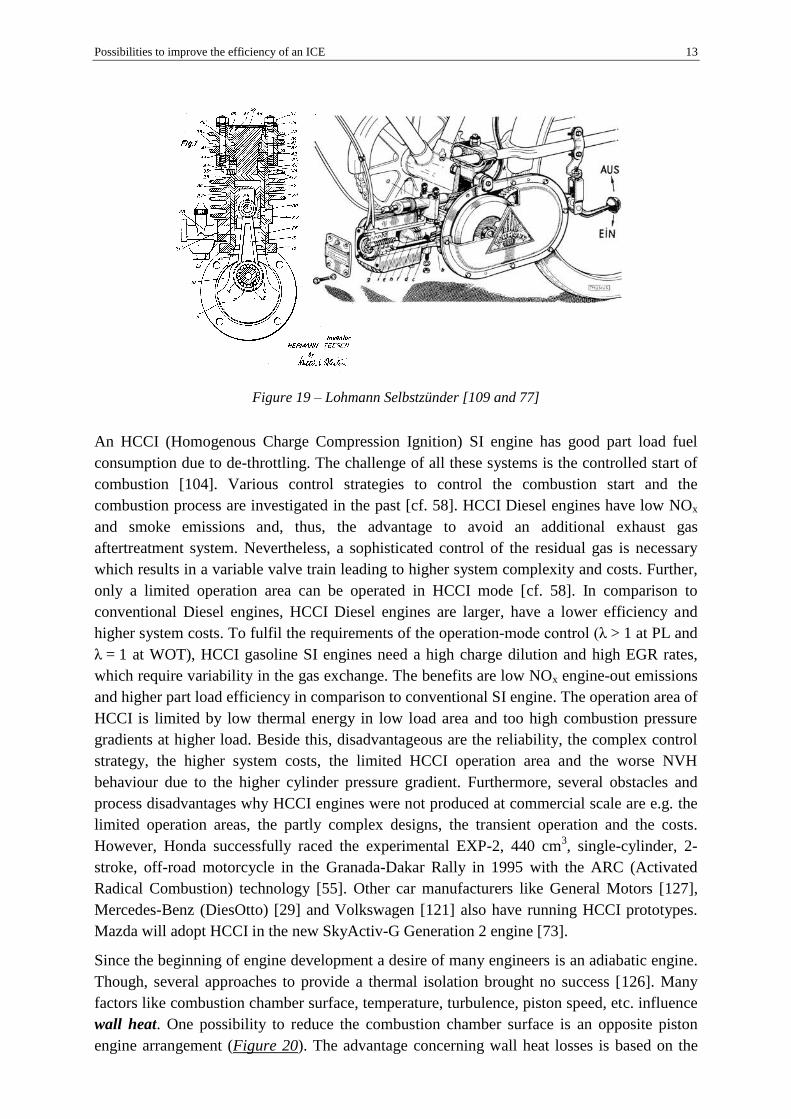
Possibilities to improve the efficiency of an ICE 13
Figure 19 – Lohmann Selbstzünder [109 and 77]
An HCCI (Homogenous Charge Compression Ignition) SI engine has good part load fuel
consumption due to de-throttling. The challenge of all these systems is the controlled start of
combustion [104]. Various control strategies to control the combustion start and the
combustion process are investigated in the past [cf. 58]. HCCI Diesel engines have low NOx
and smoke emissions and, thus, the advantage to avoid an additional exhaust gas
aftertreatment system. Nevertheless, a sophisticated control of the residual gas is necessary
which results in a variable valve train leading to higher system complexity and costs. Further,
only a limited operation area can be operated in HCCI mode [cf. 58]. In comparison to
conventional Diesel engines, HCCI Diesel engines are larger, have a lower efficiency and
higher system costs. To fulfil the requirements of the operation-mode control (λ > 1 at PL and
λ = 1 at WOT), HCCI gasoline SI engines need a high charge dilution and high EGR rates,
which require variability in the gas exchange. The benefits are low NOx engine-out emissions
and higher part load efficiency in comparison to conventional SI engine. The operation area of
HCCI is limited by low thermal energy in low load area and too high combustion pressure
gradients at higher load. Beside this, disadvantageous are the reliability, the complex control
strategy, the higher system costs, the limited HCCI operation area and the worse NVH
behaviour due to the higher cylinder pressure gradient. Furthermore, several obstacles and
process disadvantages why HCCI engines were not produced at commercial scale are e.g. the
limited operation areas, the partly complex designs, the transient operation and the costs.
However, Honda successfully raced the experimental EXP-2, 440 cm3, single-cylinder, 2-
stroke, off-road motorcycle in the Granada-Dakar Rally in 1995 with the ARC (Activated
Radical Combustion) technology [55]. Other car manufacturers like General Motors [127],
Mercedes-Benz (DiesOtto) [29] and Volkswagen [121] also have running HCCI prototypes.
Mazda will adopt HCCI in the new SkyActiv-G Generation 2 engine [73].
Since the beginning of engine development a desire of many engineers is an adiabatic engine.
Though, several approaches to provide a thermal isolation brought no success [126]. Many
factors like combustion chamber surface, temperature, turbulence, piston speed, etc. influence
wall heat. One possibility to reduce the combustion chamber surface is an opposite piston
engine arrangement (Figure 20). The advantage concerning wall heat losses is based on the

14 Possibilities to improve the efficiency of an ICE
absence of the cylinder head surface. However, drawbacks regarding combustion chamber
geometries, gas exchange and mechanical effort exist.
Figure 20 – opoc® (opposed-piston opposed-cylinder) engine [41]
Gas exchange influences the entire engine process and is decisive for the power performance
in full load, for the efficiency and emission behaviour in part load and for a smooth running in
idle. Basically, the desire of an operation-optimised gas exchange over the entire engine map
due to variable gas exchange exists since the early beginning of engine development. Due to
stricter emission limits and the continuously increased fuel consumption requirements in the
past decades, variability in the gas exchange is an effective measure without drawbacks
regarding the desired power performance. During this period, a big amount of different fully
or partially variable valve train systems have been developed and also brought into series
production. Generally, variable valve train systems are applied for SI as well as for CI engines
but with partially different aims. The objectives for SI engines are to minimize gas exchange
losses in part load due to charge- and EGR-optimized intake timing or due to valve
deactivation (cylinder deactivation), to enable high volumetric efficiencies over a wide speed
range, scavenging at full load and low speed, higher combustion stability at cold start by
reducing the residual gas amount, higher efficiencies at full load due to a lower intake charge
temperature, etc. The aims for CI engines are to generally reduce the fuel consumption, to
improve the soot-NOx-trade-off, to reduce the light-off time due to a higher exhaust gas
enthalpy, to enable ideal ignition conditions for reduced compression ratios, etc. [cf. 72].
Historically, the first series production system was introduced by Honda in the early 1980’s
for a motorcycle engine (see Figure 23). Honda presented the VTEC (Variable Timing and
Lift Electronic Control) system to improve the volumetric efficiency of a four-stroke engine
based on a switchable 2-4 valve operation over two camshaft profiles which can be
hydraulically activated [50]. However, the largest field of application represents automobiles
with the focus on intake timing. Basically, variable valve timing systems can be categorized
in camshaft adjustment systems, switchable valve actuation systems and infinitely
adjustable valve timing systems. Due to the high number of these different systems only a
brief overview will be provided in the following.
Starting with camshaft adjustment systems (or also denoted as cam phaser). Today, there are
almost no engine applications for passenger cars without a cam phaser. Mechanical, electrical
and hydraulic systems can be found in series application, whereas hydraulic systems represent
the largest share due to the availability of an existing oil circuit. State-of-the-art hydraulic
systems include vane-type cam phaser and axial piston cam phaser (Denso, Hydraulik-Ring,

Possibilities to improve the efficiency of an ICE 15
Delphi, INA, Borg Warner, etc.). A further possibility for DOHC (double overhead camshaft)
engines is a chain-driven cam phaser to adjust the position of the camshaft to the crankshaft
(see Figure 21). Nowadays, mechanical or electrical cam phaser (see Figure 22) represent a
relatively low application group in series, but also gain increased interests [72].
Figure 21 – Chain-driven cam phaser from
Hydraulik-Ring [31]
Figure 22 – Electrical cam phaser from Timken
Company [1]
Temporally, switchable valve actuation systems are the next systems which are used in series.
By definition, these systems can be distinguished between systems switching between fixed
valve lifts and systems which switch-off the valve actuation (to enable cylinder deactivation).
As mentioned before, the first VVT system of this kind was developed by Honda (Figure 23).
Similar systems, but with partly different designs exist from Toyota (WTLi), Subaru (AVLS),
Nissan (VVL-i) or Mitsubishi (MIVEC) and many more.
Figure 23 – VTEC mechanism from Honda [38] Figure 24 – Porsche Vario Cam [47]
VVT systems based on tappets have been developed by Porsche (see Figure 24). The basic
principle of the Porsche Vario Cam is the same as for systems based on rocker arms. The
Vario Cam system can switch between two valve lifts with the aim to de-throttle the engine.
Similar systems also exist from Volvo (CPS) and Subaru (DWL). The actuating mechanism
can basically also be integrated in the cam follower itself. Recently, only one system is in
series production. Mazda’s Skyactive engine uses a cam follower system from Schaeffler.
Several related concepts from Denso, Delphi, Eaton, FEV, etc. are currently being developed

16 Possibilities to improve the efficiency of an ICE
[72]. A further possibility to realize a variable valve lift is to integrate the VVT mechanism in
the camshaft. Audi has variable camshaft system in series which enables a two-stage
adjustment (see Figure 25). Due to the electromagnetical actuation lost-motion losses can be
avoided. Furthermore this system is independent from the oil temperature which also enables
an operation in the cold start phase. A three-stage system is also available from Schaeffler
[72].
Basically, switchable valve actuation systems also enable cylinder deactivation due to a zero
lift adjustment. Especially for multi-cylinder engines, cylinder deactivation experienced a
strong comeback due to considerable fuel saving potentials in part load (load point shift).
Concerning cylinder deactivation, a large number of different VVT designs already exist. For
OHV-engine (one camshaft) systems with roller tappets from Delphi, Eaton and Schaeffler
have been developed [72]. Cylinder deactivation based on switchable roller tappets has
achieved a breakthrough in the US since 2004. Chrysler and General Motors introduced this
system for almost all engines. For the European market, Mercedes-Benz developed the first
cylinder deactivation system for series application (see Figure 26). A similar system is also
available from Honda based on the VTEC system [38]. Solutions to integrate the deactivation
mechanism in the rocker arm are presented by Mahle, Eaton, Meta Motorentechnik and
Schaeffler [72]. A cylinder deactivation mechanism based on the camshaft is used by Audi
and Volkswagen based on the AVS system. In general, cylinder deactivation is an effective
measure to realize a cost-effective consumption reduction while keeping acceleration values
and engine smoothness of the “bigger” engine. Especially multi-stage systems (Schaeffler)
can be advantageous for future applications [72].
Figure 25 – Audi AVS operating principle [72] Figure 26 – Mercedes Benz ACC operating
principle [72]
The transition between the engines operating points is stepless. Therefore, the best operating
results are achievable with VVT systems which guarantee the greatest possible degrees of
freedom concerning valve lift and valve timing. Infinitely adjustable valve timing systems
have such properties. As for previous discussed systems and design concepts several different
Possibilities to improve the efficiency of an ICE 17
applications also exist for this group of VVTs. Basically, it can be distinguished between
direct valve actuation without camshafts and indirect valve actuation with sophisticated
mechanical-based solutions. Direct valve actuation systems provide maximum freedom for
the engine operation. The majority of these systems are based on pure electrical valve
actuation. These include concepts from BMW, Daimler, FEV, Mahle, Renault, Siemens,
Valeo, etc. [72]. Other direct valve actuation systems are based on an electrohydraulic
operation. Here, examples from Lotus, Bosch, Eaton IAV, etc. can be mentioned [72]. The
highest potentials of all VVT systems concerning low-consumption definitely show direct
valve actuation systems without a camshaft. However, the realization effort regarding part
number, size, costs and development is very high. Despite a long development history of
more than 20 years, no application is currently in series production.
Contrary to this, indirect valve actuation systems with camshafts have been developed for
series application. Early systems are based on multidimensional cams. The Fiat Group has
developed a system in the mid nineteen eighties [111]. Nowadays concepts from Schaeffler
and Suzuki investigate on systems based on VVT with multidimensional cams [72]. Further
systems are based on “twin-camshaft” solutions which are operating in parallel or
eccentrically. Here, systems from Meta or Mahle exist [72]. Beside pure camshaft solutions,
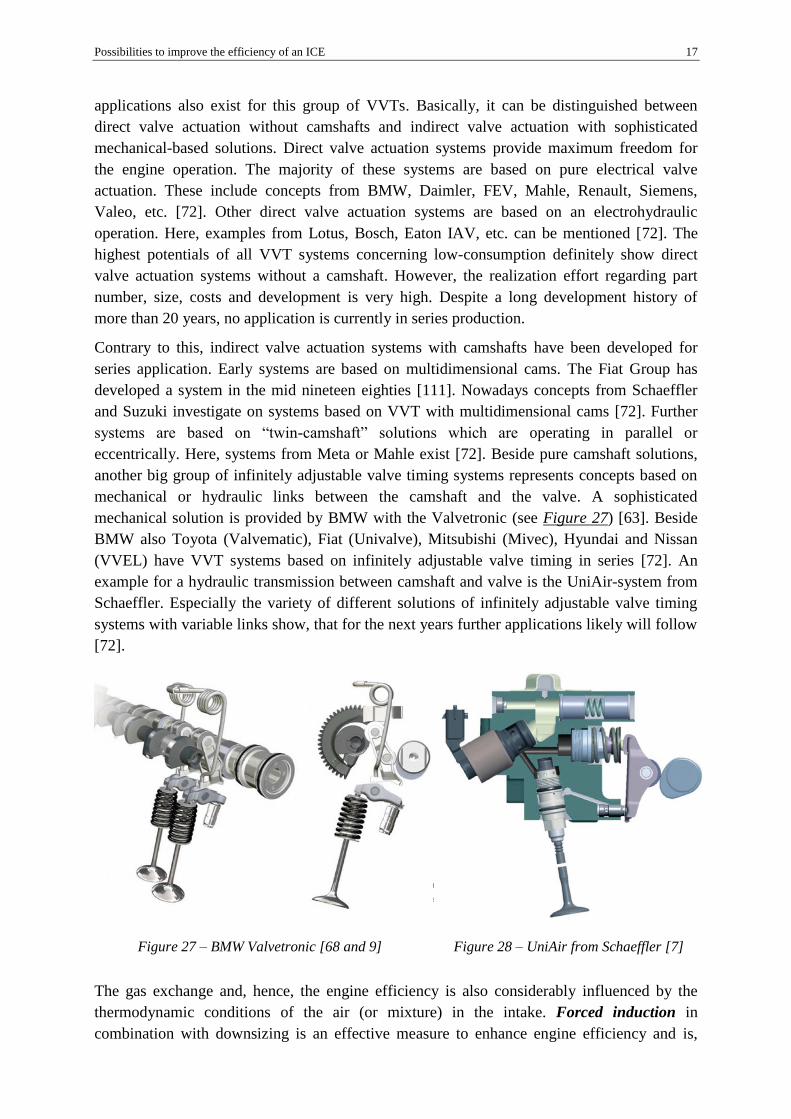
another big group of infinitely adjustable valve timing systems represents concepts based on
mechanical or hydraulic links between the camshaft and the valve. A sophisticated
mechanical solution is provided by BMW with the Valvetronic (see Figure 27) [63]. Beside
BMW also Toyota (Valvematic), Fiat (Univalve), Mitsubishi (Mivec), Hyundai and Nissan
(VVEL) have VVT systems based on infinitely adjustable valve timing in series [72]. An
example for a hydraulic transmission between camshaft and valve is the UniAir-system from
Schaeffler. Especially the variety of different solutions of infinitely adjustable valve timing
systems with variable links show, that for the next years further applications likely will follow
[72].
Figure 27 – BMW Valvetronic [68 and 9] Figure 28 – UniAir from Schaeffler [7]
The gas exchange and, hence, the engine efficiency is also considerably influenced by the
thermodynamic conditions of the air (or mixture) in the intake. Forced induction in
combination with downsizing is an effective measure to enhance engine efficiency and is,

18 Possibilities to improve the efficiency of an ICE
nowadays, established in series engines. Almost every application is based on a turbocharging
system, because a turbocharger consumes less power from the engine than a supercharger.
However, the main drawback is the turbo lag. A possible measure to improve the system
characteristic is the usage of a variable-geometry turbocharger (VGT). The key factor to
establish VGT systems in the future is based on cheap production costs [61].
Possibilities to improve the efficiency of an ICE 19
2.3 Reduction of mechanical losses
Since the beginning of engine development the minimization of mechanical losses is an
important development objective. Mechanical losses have a significantly impact on
efficiency, especially at part load.
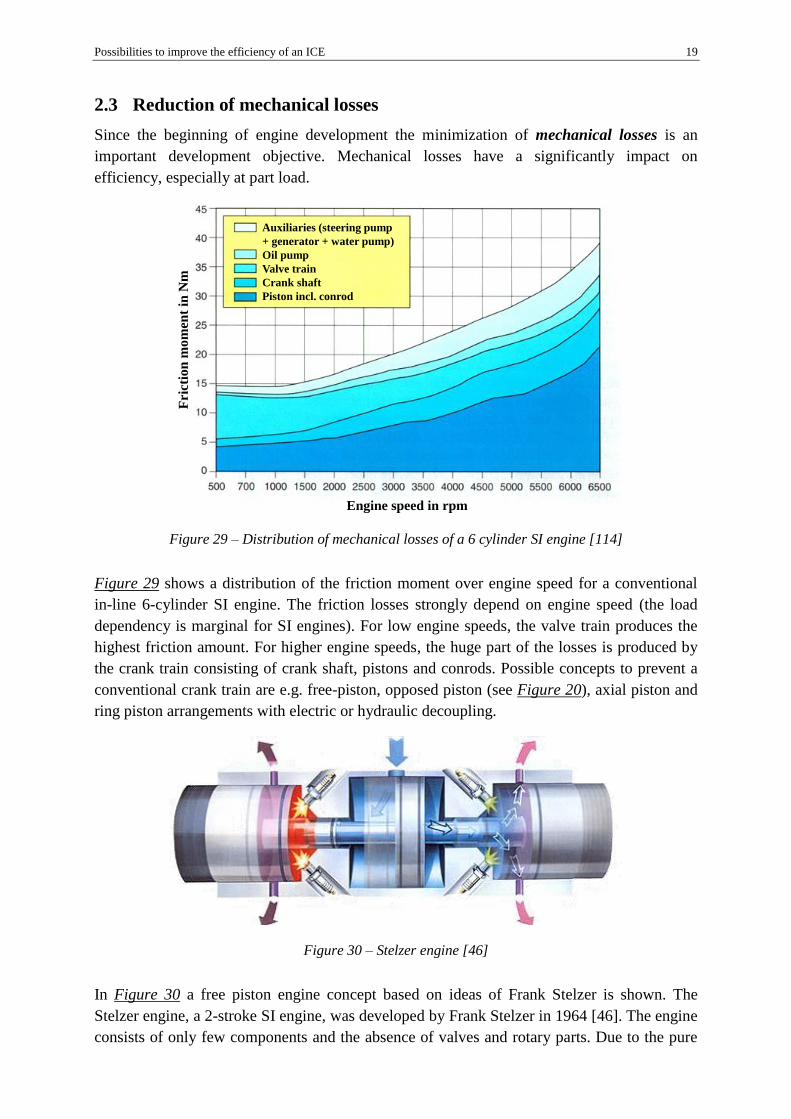
Figure 29 – Distribution of mechanical losses of a 6 cylinder SI engine [114]
Figure 29 shows a distribution of the friction moment over engine speed for a conventional
in-line 6-cylinder SI engine. The friction losses strongly depend on engine speed (the load
dependency is marginal for SI engines). For low engine speeds, the valve train produces the
highest friction amount. For higher engine speeds, the huge part of the losses is produced by
the crank train consisting of crank shaft, pistons and conrods. Possible concepts to prevent a
conventional crank train are e.g. free-piston, opposed piston (see Figure 20), axial piston and
ring piston arrangements with electric or hydraulic decoupling.
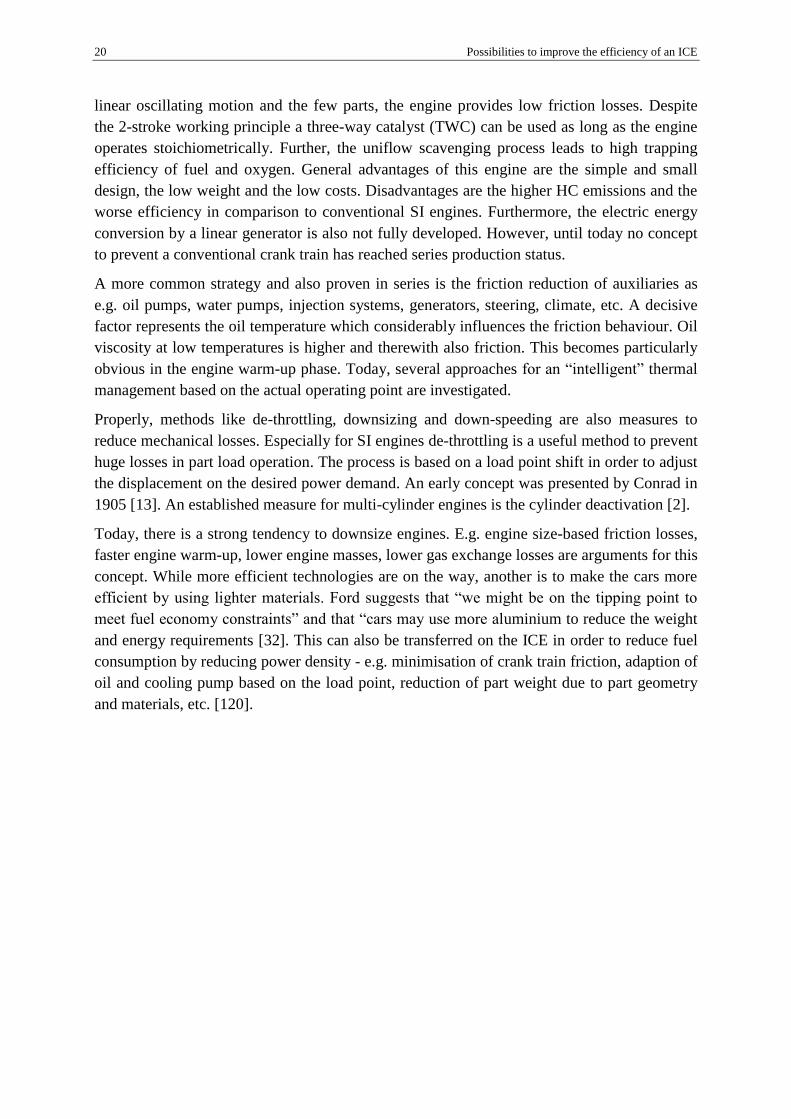
Figure 30 – Stelzer engine [46]
In Figure 30 a free piston engine concept based on ideas of Frank Stelzer is shown. The
Stelzer engine, a 2-stroke SI engine, was developed by Frank Stelzer in 1964 [46]. The engine
consists of only few components and the absence of valves and rotary parts. Due to the pure
Engine speed in rpm
Fric
tion
mo
men
t in
Nm
Auxiliaries (steering pump
+ generator + water pump)
Oil pump
Valve train
Crank shaft
Piston incl. conrod
20 Possibilities to improve the efficiency of an ICE
linear oscillating motion and the few parts, the engine provides low friction losses. Despite
the 2-stroke working principle a three-way catalyst (TWC) can be used as long as the engine
operates stoichiometrically. Further, the uniflow scavenging process leads to high trapping
efficiency of fuel and oxygen. General advantages of this engine are the simple and small
design, the low weight and the low costs. Disadvantages are the higher HC emissions and the
worse efficiency in comparison to conventional SI engines. Furthermore, the electric energy
conversion by a linear generator is also not fully developed. However, until today no concept
to prevent a conventional crank train has reached series production status.
A more common strategy and also proven in series is the friction reduction of auxiliaries as
e.g. oil pumps, water pumps, injection systems, generators, steering, climate, etc. A decisive
factor represents the oil temperature which considerably influences the friction behaviour. Oil
viscosity at low temperatures is higher and therewith also friction. This becomes particularly
obvious in the engine warm-up phase. Today, several approaches for an “intelligent” thermal
management based on the actual operating point are investigated.
Properly, methods like de-throttling, downsizing and down-speeding are also measures to
reduce mechanical losses. Especially for SI engines de-throttling is a useful method to prevent
huge losses in part load operation. The process is based on a load point shift in order to adjust
the displacement on the desired power demand. An early concept was presented by Conrad in
1905 [13]. An established measure for multi-cylinder engines is the cylinder deactivation [2].
Today, there is a strong tendency to downsize engines. E.g. engine size-based friction losses,
faster engine warm-up, lower engine masses, lower gas exchange losses are arguments for this
concept. While more efficient technologies are on the way, another is to make the cars more
efficient by using lighter materials. Ford suggests that “we might be on the tipping point to
meet fuel economy constraints” and that “cars may use more aluminium to reduce the weight
and energy requirements [32]. This can also be transferred on the ICE in order to reduce fuel
consumption by reducing power density - e.g. minimisation of crank train friction, adaption of
oil and cooling pump based on the load point, reduction of part weight due to part geometry
and materials, etc. [120].
Possibilities to improve the efficiency of an ICE 21
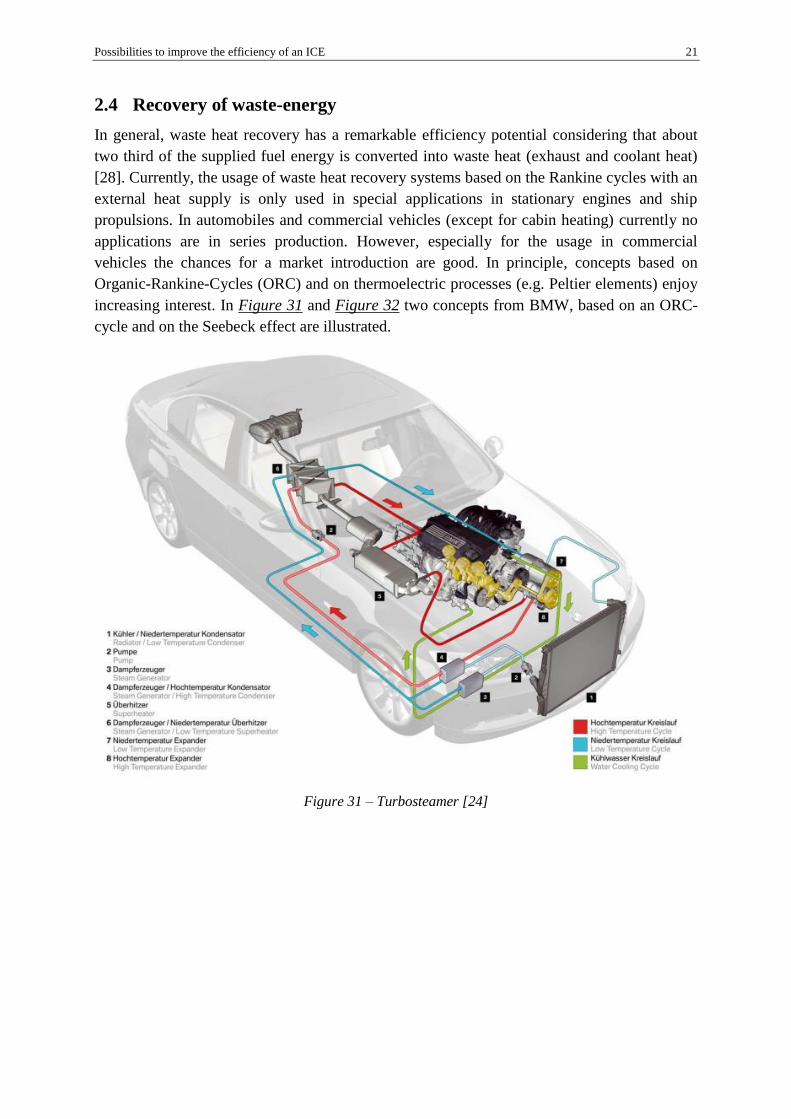
2.4 Recovery of waste-energy
In general, waste heat recovery has a remarkable efficiency potential considering that about
two third of the supplied fuel energy is converted into waste heat (exhaust and coolant heat)
[28]. Currently, the usage of waste heat recovery systems based on the Rankine cycles with an
external heat supply is only used in special applications in stationary engines and ship
propulsions. In automobiles and commercial vehicles (except for cabin heating) currently no
applications are in series production. However, especially for the usage in commercial
vehicles the chances for a market introduction are good. In principle, concepts based on
Organic-Rankine-Cycles (ORC) and on thermoelectric processes (e.g. Peltier elements) enjoy
increasing interest. In Figure 31 and Figure 32 two concepts from BMW, based on an ORC-
cycle and on the Seebeck effect are illustrated.
Figure 31 – Turbosteamer [24]

22 Possibilities to improve the efficiency of an ICE
Figure 32 – Thermoelectric Generator [70]
Intensive research activities of ORC-based concepts could be noticed in the last years, but
with partly different possibilities to use the wasted heat [19, 88, 17, 100, etc.]. Furthermore,
several companies also investigate prototypes based on the Seebeck effect using the waste
heat of the exhaust gas and/or the cooling water [70, 21 and 67]. Generally, these add-on
systems are designed in order to improve fuel consumption. However, due to the
characteristic of the thermoelectric materials (limited temperature area with high efficiency)
the overall efficiency significantly depends on the used temperature of the waste heat. Hence,
a constant temperature level is desirable, but the transient operation of conventional vehicles
causes variable exhaust temperatures and heat energy. Studies indicate that ORC-based waste
energy recovery systems achieve an efficiency increase up to approximately 10% [77].
Although the technical effort is higher in comparison to thermoelectric concepts, ORC
systems have clearly better chances for series application because of the lower efficiency
potential and the expensive and rare materials for a thermoelectric waste heat recovery
concept.

Possibilities to improve the efficiency of an ICE 23
2.5 Alternative propulsion concepts
When discussing fuel consumption potentials, several alternative propulsion systems and
derived alternative engine concepts have to be considered as well. For the sake of
completeness regarding the consideration of improvement possibilities to enhance the ICE
efficiency, a short overview of different principles and concepts will be presented in the
following.
In general language use, the term alternative concepts are often related to alternative fuels.
However, a clear separation between alternative fuel and alternative propulsion concepts is
often not possible. In respect of alternative fuels, “more or less” alternative fuels as LPG,
CNG, LNG, bio fuels, alcohol-based fuels, SynFuels, SunFuels, hydrogen, etc. are in use.
Basically, alternative fuels play an important role in ICE propulsion. Several motivations as
reduction of CO2 and limited emissions, energy independence, conservation of resources,
local availability, etc. should enable a long-term, sustainable and affordable guarantee of ICE
mobility. Hydrogen has the clear benefit of no carbonic and particular emissions during
engine operation. Considering the usage in internal combustion engines today, all
forthcoming concepts are SI engines. The reason is the possible usage of similar engine
components as in gas engines. The efficiency potential for CI hydrogen engines is basically
higher, but due to durability problems, they have only reached prototype status [107 and 118].
An interesting and promising application for hydrogen is the usage in fuel cells. A lot of
automobile manufacturers [cf. 25] investigate and develop fuel cells for mobile applications.
General benefits are the high efficiency, the absence of moving parts and generators, the NVH
behaviour and the low emissions. Disadvantages are the very high costs, the usage of highly
sophisticated materials, the thermal management, the insufficient durability and the heavy
weight. Like all fuel cells for automotive use, they are unlikely to be cost-effective in the
near- or mid-term [113].
Considering alternative propulsion concepts, many alternatives to conventional internal
combustion engine exist and have been intensively investigated in the past. These include e.g.
turbo engines, Stirling engines, Wankel engines, fuel cells, etc. The desire for higher specific
power consequently leads to the conclusion to integrate turbo engines in automobiles.
Basically, gas turbines for automotive propulsion are not new. Chrysler and Rover built
turbine cars, but only for racing applications [37]. However, some automotive concepts
already exist or are in development for EREV (Extended-range electric vehicle) applications
[11, 12 and 27]. Traditionally, the Stirling engine is classified as an external combustion
engine. The external combustion can reach extremely low emissions and permits the use of
fuels which e.g. are not suitable for ICE. One concept example for automotive usage is the
Stir-Lec 1 from GM [40]. In the past, several vehicle tests have been accomplished [103 and
102], but the technical advance of aftertreatment systems and lower costs of the ICE led to the
stop of the Stirling research for automobiles. A famous alternative engine concept represents
the Wankel engine. Due to the long development history, a big number of applications in
different vehicle types as automobiles (Mazda, NSU, etc.), motorcycles (Hercules, Norton,
etc.) and aircrafts (RFB, Citroën, etc.) exist. However, despite the long development, Wankel
engines do not reach the efficiency of reciprocating engines and the piston sealing is still
challenging and influences durability. However, the Wankel engine can be an interesting
alternative for EREV propulsion due to its specific advantages [105].

24 Possibilities to improve the efficiency of an ICE
At this time, the probably most famous and most sophisticated technology of all alternative
propulsion concepts represent hybrid electric vehicles (HEVs). About 9 million hybrid
electric cars have been sold worldwide by September 2014 [34]. These sales numbers are not
negligible whereupon the classification into alternative concepts leads to reconsideration. In
contrast, a plug-in electric vehicle (PEV) can be classified as alternative propulsion concept
due to the rather low sales numbers. For definition, PEV is a superset of electric vehicles that
includes all-electric or battery electric vehicles (BEVs), plug-in hybrid vehicles (PHEVs), and
electric vehicle conversions of hybrid electric vehicles and conventional internal combustion
engine vehicles [35]. However, considering the well-to-wheel efficiency of a BEV, a pure
ICE has clear advantages. Results from Spicher [106] and Hoelz et al. [32] indicate that, well-
to-wheel efficiency, individual benefits, comfort and cost are more advantageous for pure ICE
propulsion. Nevertheless, if the energy supply will be based on renewable energies, this trend
could rapidly be reversed. Another important issue of pure electric driving is the energy
storage which influences the vehicle efficiency, weight and size as well as comfort, costs and
infrastructure. The question whether a pure electric driving will prevail in future strongly
depends on the reachable energy density and the battery mass.
Summarizing chapter 2, considerable improvement potentials still exist for conventional SI
and CI engines. An increased usage of supercharging in combination with downsizing, also
for SI engines with direct injection, will be expedient. The reduction of friction losses has also
significant potentials due to the availability of new materials. Further, concepts with variable
valve timing and appropriate heat and energy management offer great potentials concerning
efficiency and emissions. Several alternative propulsion concepts (gas turbines, Stirling
engines, Wankel engines, etc.) were investigated in the past. However, the majority of these
concepts only reached prototype status or is established as niche products. Mobility
requirements of today’s society cannot only be fulfilled with electric vehicles. Moreover, the
well-to-wheel efficiency (if not using renewable technologies for the energy supply) is worse
compared to applications with ICEs. Therefore, the efficiency improvement of the ICE will be
continued and is clearly evident for the near future. A rather unconventional, but also
promising efficiency improving strategy is the Extended Expansion principle. In recent years,
Extended Expansion (realized over the crank or valve train) attracted increasing attention.
Several OEMs have been doing investigations on this efficiency-increasing principle in the
whole range from small up to automotive engines. The next chapter is especially addressed to
this engine principle and includes studies of theoretically reachable efficiency potentials as
well as a historical and technical overview of related concepts.

Extended Expansion 25
3 Extended Expansion
The development process of the Extended Expansion engine represents the core of this
doctoral thesis. The objective of the first studies is the definition of an EE engine layout
including main technological and geometrical boundaries. Therefore, this chapter gives a
short overview about the history and state-of-technology applications of EE engines
(Atkinson and Miller) as well as several thermodynamic and kinematic pre-studies, based on
analytical and numerical simulations, in order to define first appropriate EE engine layouts,
will be presented. In detail, these pre-studies include analytical calculations regarding the
theoretical achievable efficiency, kinematic investigations concerning the basic principle of
the EE piston motion, numerical simulations to more precisely evaluate the efficiency
potentials depending on the engine size as well as a comparison between Atkinson and Miller
cycles.
The basic idea of Extended Expansion in internal combustion engines gained increased
interests in the last decade. This fact is also recognizable due to a variety of publications
regarding this topic up to several designed concepts. Moreover, one EE engine for a
cogeneration system is in series production [108]. The idea to improve the conversion of
thermal energy to work, due to the strategy to expand the working gas to the lowest possible
pressure by using a longer expansion than compression stroke, is not new. At the end of the
19th
century the British inventor James Atkinson patented his engine based on a dedicated
linkage system connected with the crank train. The engine was originally designed to avoid
infringing certain patents covering Otto cycle engines. However, this special crank train
arrangement also enables, beside a piston motion with a longer expansion than compression
stroke, 4-strokes in one crank shaft revolution.
Figure 33 – Atkinson engine patent [3]
In contrast to the Atkinson engine, the American inventor Ralph Miller presented an engine
concept which provides the EE effect over appropriate valve timing adjustments (Figure 34).
Miller describes in his patents from 1946 and 1957 [79 and 80] a 4-stroke engine concept with
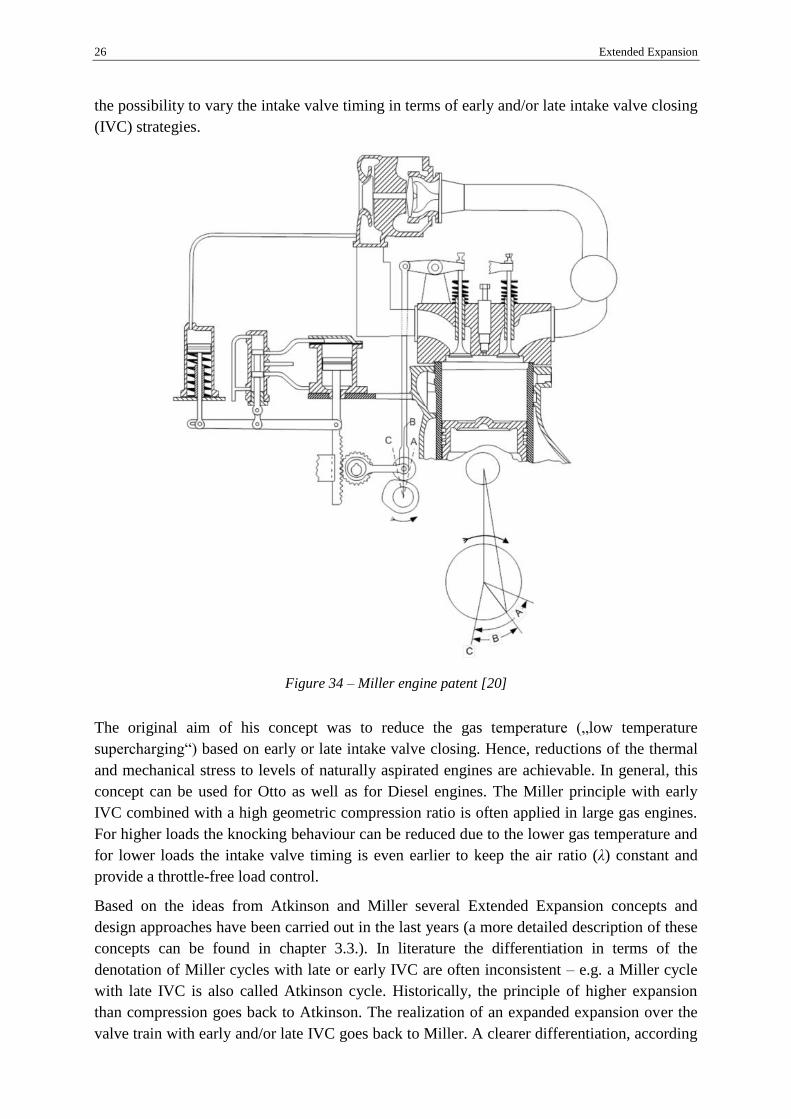
26 Extended Expansion
the possibility to vary the intake valve timing in terms of early and/or late intake valve closing
(IVC) strategies.
Figure 34 – Miller engine patent [20]
The original aim of his concept was to reduce the gas temperature („low temperature
supercharging“) based on early or late intake valve closing. Hence, reductions of the thermal
and mechanical stress to levels of naturally aspirated engines are achievable. In general, this
concept can be used for Otto as well as for Diesel engines. The Miller principle with early
IVC combined with a high geometric compression ratio is often applied in large gas engines.
For higher loads the knocking behaviour can be reduced due to the lower gas temperature and
for lower loads the intake valve timing is even earlier to keep the air ratio (λ) constant and
provide a throttle-free load control.
Based on the ideas from Atkinson and Miller several Extended Expansion concepts and
design approaches have been carried out in the last years (a more detailed description of these
concepts can be found in chapter 3.3.). In literature the differentiation in terms of the
denotation of Miller cycles with late or early IVC are often inconsistent – e.g. a Miller cycle
with late IVC is also called Atkinson cycle. Historically, the principle of higher expansion
than compression goes back to Atkinson. The realization of an expanded expansion over the
valve train with early and/or late IVC goes back to Miller. A clearer differentiation, according

Extended Expansion 27
to [20, 30 and 85] can be given by defining an Expanded Expansion process realized over the
crank train as Atkinson cycle and an Expanded Expansion process realized over the valve
train as Miller cycle. In thermodynamics an ideal Extended Expansion cycle is denoted as
Atkinson cycle and established in the field. The following chapters deal with theoretical
thermodynamic potentials of Atkinson-cycles based on air-standard cycle [82] and ideal
engine cycle [93] calculations.
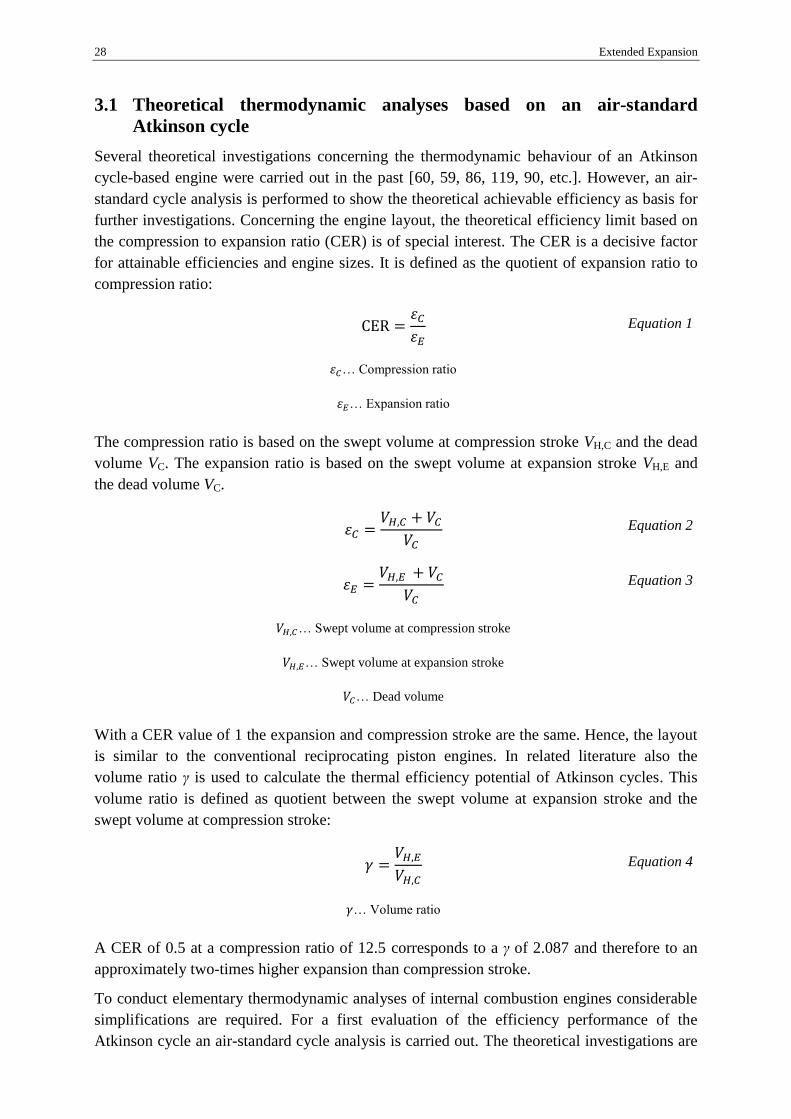
28 Extended Expansion
3.1 Theoretical thermodynamic analyses based on an air-standard
Atkinson cycle
Several theoretical investigations concerning the thermodynamic behaviour of an Atkinson
cycle-based engine were carried out in the past [60, 59, 86, 119, 90, etc.]. However, an air-
standard cycle analysis is performed to show the theoretical achievable efficiency as basis for
further investigations. Concerning the engine layout, the theoretical efficiency limit based on
the compression to expansion ratio (CER) is of special interest. The CER is a decisive factor
for attainable efficiencies and engine sizes. It is defined as the quotient of expansion ratio to
compression ratio:
CER =𝜀𝐶
𝜀𝐸 Equation 1
𝜀𝐶… Compression ratio
𝜀𝐸… Expansion ratio
The compression ratio is based on the swept volume at compression stroke VH,C and the dead
volume VC. The expansion ratio is based on the swept volume at expansion stroke VH,E and
the dead volume VC.
𝜀𝐶 =𝑉𝐻,𝐶 + 𝑉𝐶
𝑉𝐶 Equation 2
𝜀𝐸 =
𝑉𝐻,𝐸 + 𝑉𝐶
𝑉𝐶 Equation 3
𝑉𝐻,𝐶… Swept volume at compression stroke
𝑉𝐻,𝐸… Swept volume at expansion stroke
𝑉𝐶… Dead volume
With a CER value of 1 the expansion and compression stroke are the same. Hence, the layout
is similar to the conventional reciprocating piston engines. In related literature also the
volume ratio γ is used to calculate the thermal efficiency potential of Atkinson cycles. This
volume ratio is defined as quotient between the swept volume at expansion stroke and the
swept volume at compression stroke:
𝛾 =𝑉𝐻,𝐸
𝑉𝐻,𝐶 Equation 4
𝛾… Volume ratio
A CER of 0.5 at a compression ratio of 12.5 corresponds to a γ of 2.087 and therefore to an
approximately two-times higher expansion than compression stroke.
To conduct elementary thermodynamic analyses of internal combustion engines considerable
simplifications are required. For a first evaluation of the efficiency performance of the
Atkinson cycle an air-standard cycle analysis is carried out. The theoretical investigations are

Extended Expansion 29
based on the air-standard Otto cycle, which, efficiency-wise, is the state-of-the-art process
when neglecting all restrictions concerning the thermal loads or cylinder peak pressure. The
defined simplifications, based on [93], for the air-standard Otto cycle and the air-standard
Atkinson cycle are listed in the following:
The working fluid is modelled as an ideal gas with constant gas properties at standard
conditions (cold air cycle)
The combustion process is replaced by a constant-volume heat transfer from an external
source
No wall heat losses
No flow losses
Isentropic compression and expansion
Figure 35 – pV-diagram (Air-standard Otto cycle
(1-4) vs. Air-standard Atkinson cycle (1-4*))
Figure 36 – Ts-diagram (Air-standard Otto cycle
(1-4) vs. Air-standard Atkinson cycle (1-4*))
Beside these defined calculation boundaries, the difference between the air-standard Atkinson
cycle and the air-standard Otto cycle is an extended isentropic expansion to ambient pressure
(comp. V4 to V4* in Figure 35). Consequently, the piston movement from the bottom dead
centre (V4*) to volume V1 leads to a heat release at constant pressure.
Air-standard Otto cycle Air-standard Atkinson cycle
1-2 Isentropic compression 1-2 Isentropic compression
2-3 Isochoric heat addition 2-3 Isochoric heat addition
3-4 Isentropic expansion 3-4* Isentropic expansion
4-1 Isochoric heat release 4*-1 Isobaric heat release
Table 1 – Changes of state (Air-standard Otto cycle vs. Air-standard Atkinson cycle)
Press
ure
Volume
1
2
3
4
4*
V1=V4V2=V3 V4*
p1=p4*
Tem
peratu
re
Entropy
1
2
3
4
4*
V2=V3
V1=V4
p1=p4*

30 Extended Expansion
These additional changes of state, compared to the air-standard Otto cycle, lead to an
increased indicated work. The difference of the indicated work is marked as hatched area in
both, the pV-diagram (Figure 35) and the Ts-diagram (Figure 36).
The thermal efficiency of the air-standard Otto cycle ηth_Otto, which is the ratio of indicated
work to added heat of the cycle, is a function of the compression ratio εC and the isentropic
exponent κ.
𝜂𝑡ℎ_𝑂𝑡𝑡𝑜 = 1 −1
𝜀𝐶𝜅−1 Equation 5
𝜀𝐶 =
𝑉4
𝑉2 Equation 6
The thermal efficiency of the air-standard Atkinson cycle ηth_Atkinson is based on an expansion
to ambient pressure level (comp. p1 in Figure 35). Therefore, the cycle efficiency depends on
the isentropic exponent κ, the compression ratio εC and the expansion ratio εE.
𝜂𝑡ℎ_𝐴𝑡𝑘𝑖𝑛𝑠𝑜𝑛 = 1 −𝜅 ∙ (𝜀𝐸 − 𝜀𝐶)
𝜀𝐸𝜅 − 𝜀𝐶
𝜅 Equation 7
𝜀𝐸 =
𝑉4∗
𝑉2 Equation 8
In Figure 37 a comparison between the thermal efficiency of the air-standard Otto cycle and
the air-standard Atkinson cycle over the compression ratio is shown. The results are based on
the previously defined calculation boundaries.
Figure 37 – Thermal efficiency (Air-standard Otto cycle vs. Air-standard Atkinson cycle with
expansion to ambient pressure)
Taking into account that the heat supply is the same for both cycles, the indicated work is
Th
erm
al
eff
icie
ncy
in
%
0
10
20
30
40
50
60
70
80
90
Compression ratio
0 5 10 15 20 25 30
Air-standard Atkinson cycle Air-standard Otto cycle
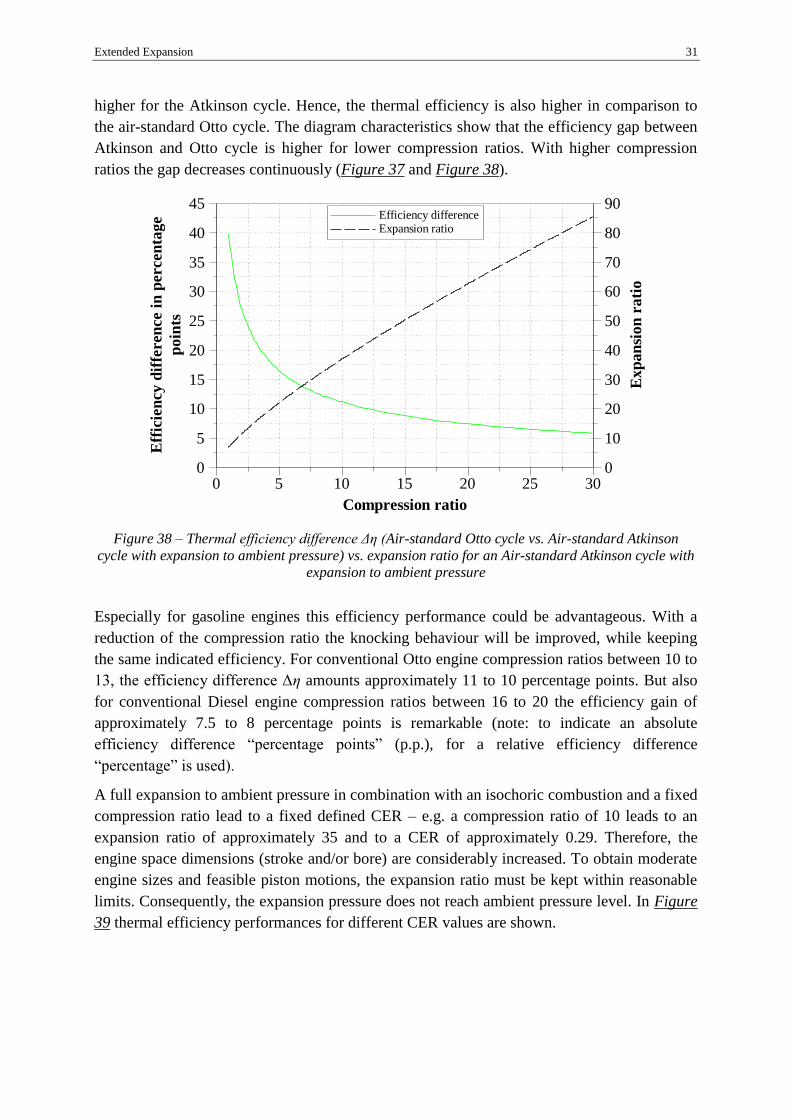
Extended Expansion 31
higher for the Atkinson cycle. Hence, the thermal efficiency is also higher in comparison to
the air-standard Otto cycle. The diagram characteristics show that the efficiency gap between
Atkinson and Otto cycle is higher for lower compression ratios. With higher compression
ratios the gap decreases continuously (Figure 37 and Figure 38).
Figure 38 – Thermal efficiency difference Δη (Air-standard Otto cycle vs. Air-standard Atkinson
cycle with expansion to ambient pressure) vs. expansion ratio for an Air-standard Atkinson cycle with
expansion to ambient pressure
Especially for gasoline engines this efficiency performance could be advantageous. With a
reduction of the compression ratio the knocking behaviour will be improved, while keeping
the same indicated efficiency. For conventional Otto engine compression ratios between 10 to
13, the efficiency difference Δη amounts approximately 11 to 10 percentage points. But also
for conventional Diesel engine compression ratios between 16 to 20 the efficiency gain of
approximately 7.5 to 8 percentage points is remarkable (note: to indicate an absolute
efficiency difference “percentage points” (p.p.), for a relative efficiency difference
“percentage” is used).
A full expansion to ambient pressure in combination with an isochoric combustion and a fixed
compression ratio lead to a fixed defined CER – e.g. a compression ratio of 10 leads to an
expansion ratio of approximately 35 and to a CER of approximately 0.29. Therefore, the
engine space dimensions (stroke and/or bore) are considerably increased. To obtain moderate
engine sizes and feasible piston motions, the expansion ratio must be kept within reasonable
limits. Consequently, the expansion pressure does not reach ambient pressure level. In Figure
39 thermal efficiency performances for different CER values are shown.
Eff
icie
ncy
dif
feren
ce i
n p
ercen
tag
e
poin
ts
0
5
10
15
20
25
30
35
40
45
Compression ratio
0 5 10 15 20 25 30
Ex
pan
sio
n r
ati
o
0
10
20
30
40
50
60
70
80
90 Efficiency difference Expansion ratio

32 Extended Expansion
Figure 39 – Consequence of reduced CER for the thermal efficiency performance
The dashed line marks the air-standard Atkinson cycle efficiency (with expansion to ambient
pressure) which is the upper efficiency limit. The reachable efficiency decreases with
increasing CER. The curve with a CER of 1 represents the air-standard Otto cycle efficiency.
A CER of 0.5 delivers good efficiencies, while enabling moderate engine sizes. The
efficiency potential is between 5.5 to 6.5 percentage points in comparison to the conventional
Otto engine at a considered compression ratio range between approximately 9 and 14.
Certainly, the simulation results strongly depend on the given gross heat release. If the
calculated heat supply is not simplified as an isochoric change of state, the required CER for
reaching ambient pressure conditions at gas exchange decreases. Thus, engine space
dimensions are positively influenced (cf. also chapter 3.2). The effect of temperature-
dependent gas properties has to be considered as well. However, the first simplified
thermodynamic investigations show a significant efficiency increase by the Atkinson cycle.
Th
erm
al
eff
icie
ncy
in
%
55
60
65
70
75
80
Compression ratio
9 10 11 12 13 14 15 16
1.0
1.0
1.0
0.9
0.9
0.9
0.8
0.8
0.8
0.7
0.7
0.7
0.6
0.6
0.6
0.5
0.5
0.5
0.4
0.4
0.4

Extended Expansion 33
3.2 Theoretical thermodynamic analyses based on an Atkinson ideal
engine cycle
To estimate the theoretical efficiency potential for an internal combustion engine in more
detail, some differences to the air standard cycle have to be considered. The main difference
concerns the temperature-dependent gas properties of the cylinder charge which has a
considerable impact on the results. The ideal engine process is defined according DIN 1940
and complies with a geometrically similar real engine with following properties:
Same geometries as the real engine
Complete charging at bottom dead centre (BDC) with real charge (pure air or mixture
without a consideration of residual gas
The cylinder charge refers to thermodynamic conditions at intake - temperature and
pressure as in the intake manifold and after any compressor
Same λ as the real engine
Imperfect combustion until the chemical equilibrium
Ideal combustion process according to defined changes of state (constant volume, constant
pressure or a combination of both)
No wall heat and flow losses (gas friction) which results in an isentropic compression and
expansion
No leakage
Ideal gas exchange at BDC (isochoric change of state) or ideal gas exchange loop in case
of supercharged 4-stroke engines
The working fluid is pure charge without residual gas modelled as a mixture of ideal gases
with the consideration of temperature-dependent gas properties
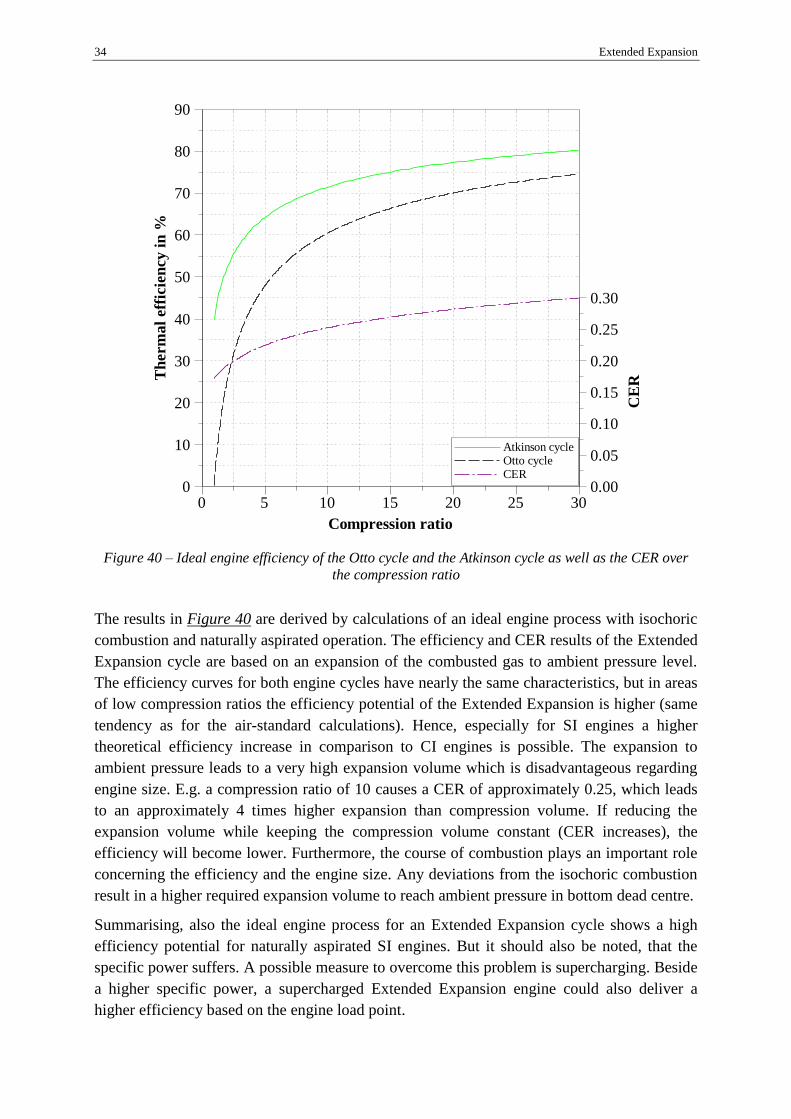
34 Extended Expansion
Figure 40 – Ideal engine efficiency of the Otto cycle and the Atkinson cycle as well as the CER over
the compression ratio
The results in Figure 40 are derived by calculations of an ideal engine process with isochoric
combustion and naturally aspirated operation. The efficiency and CER results of the Extended
Expansion cycle are based on an expansion of the combusted gas to ambient pressure level.
The efficiency curves for both engine cycles have nearly the same characteristics, but in areas
of low compression ratios the efficiency potential of the Extended Expansion is higher (same
tendency as for the air-standard calculations). Hence, especially for SI engines a higher
theoretical efficiency increase in comparison to CI engines is possible. The expansion to
ambient pressure leads to a very high expansion volume which is disadvantageous regarding
engine size. E.g. a compression ratio of 10 causes a CER of approximately 0.25, which leads
to an approximately 4 times higher expansion than compression volume. If reducing the
expansion volume while keeping the compression volume constant (CER increases), the
efficiency will become lower. Furthermore, the course of combustion plays an important role
concerning the efficiency and the engine size. Any deviations from the isochoric combustion
result in a higher required expansion volume to reach ambient pressure in bottom dead centre.
Summarising, also the ideal engine process for an Extended Expansion cycle shows a high
efficiency potential for naturally aspirated SI engines. But it should also be noted, that the
specific power suffers. A possible measure to overcome this problem is supercharging. Beside
a higher specific power, a supercharged Extended Expansion engine could also deliver a
higher efficiency based on the engine load point.
Th
erm
al
eff
icie
ncy
in
%
0
10
20
30
40
50
60
70
80
90
Compression ratio
0 5 10 15 20 25 30
CE
R
0.00
0.05
0.10
0.15
0.20
0.25
0.30
Atkinson cycle Otto cycle CER

Extended Expansion 35
3.3 Extended Expansion engine design applications (technology status)
Since the beginning of the 21st century Extended Expansion enjoys renewed interest. A large
number of patents and concepts are based on the Atkinson and the Miller principle. In general,
these concepts have the potential to dramatically reduce the fuel consumption. Today, various
approaches to realize an Extended Expansion cycle exist and can basically be categorized in
Atkinson cycle-based concepts, Miller cycle-based concepts, concepts with an additional
expansion cylinder, split cycle-based concepts and basically also turbo-compound concepts.
An Atkinson cycle-based engine provides the Extended Expansion via sophisticated
mechanical crank train solutions. For these engines, numerous different concepts and patents
exist [87, 4, 23, etc.]. As mentioned before, the very first patent originates from James
Atkinson (cf. Figure 4) in which the different strokes are realized over an additional
mechanism added to the crankshaft. Further approaches are based on a superposition of two
piston motions with different amplitudes, phases and frequency. Due to the superposition a
periodic piston motion over 720°CA can be realized. A more detailed description of the
specific Atkinson cycle-based piston motion and its consequences on gas exchange, valve
timing and valve overlap is shown in chapter 3.3.1. Generally, an Atkinson cycle-based piston
motion can be obtained via a linkage system [87 and 119], a planetary gear [4], a double or
opposite piston engine arrangement with a common combustion chamber [23 and 71] or a
piston-in-piston design [97].
Figure 41 – Honda EXlink engine [108] Figure 42 – Austin engine [4]
The probably most famous representative of an Atkinson engine based on a linkage system is
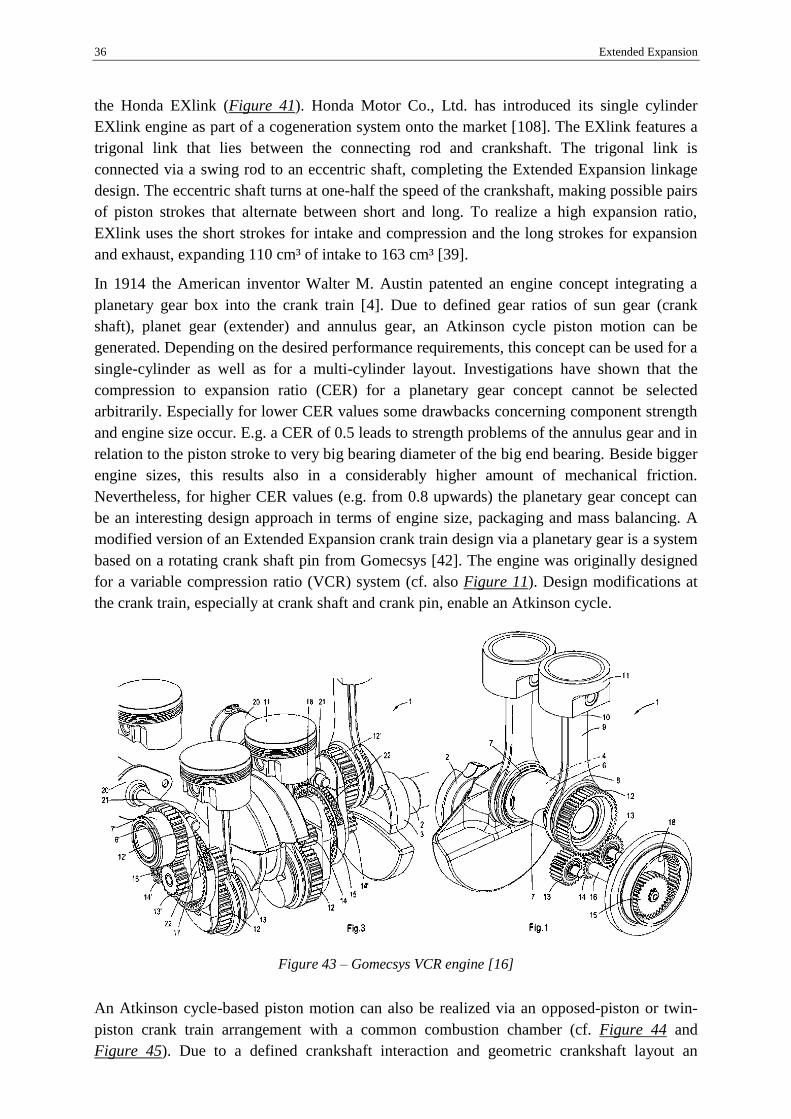
36 Extended Expansion
the Honda EXlink (Figure 41). Honda Motor Co., Ltd. has introduced its single cylinder
EXlink engine as part of a cogeneration system onto the market [108]. The EXlink features a
trigonal link that lies between the connecting rod and crankshaft. The trigonal link is
connected via a swing rod to an eccentric shaft, completing the Extended Expansion linkage
design. The eccentric shaft turns at one-half the speed of the crankshaft, making possible pairs
of piston strokes that alternate between short and long. To realize a high expansion ratio,
EXlink uses the short strokes for intake and compression and the long strokes for expansion
and exhaust, expanding 110 cm³ of intake to 163 cm³ [39].
In 1914 the American inventor Walter M. Austin patented an engine concept integrating a
planetary gear box into the crank train [4]. Due to defined gear ratios of sun gear (crank
shaft), planet gear (extender) and annulus gear, an Atkinson cycle piston motion can be
generated. Depending on the desired performance requirements, this concept can be used for a
single-cylinder as well as for a multi-cylinder layout. Investigations have shown that the
compression to expansion ratio (CER) for a planetary gear concept cannot be selected
arbitrarily. Especially for lower CER values some drawbacks concerning component strength
and engine size occur. E.g. a CER of 0.5 leads to strength problems of the annulus gear and in
relation to the piston stroke to very big bearing diameter of the big end bearing. Beside bigger
engine sizes, this results also in a considerably higher amount of mechanical friction.
Nevertheless, for higher CER values (e.g. from 0.8 upwards) the planetary gear concept can
be an interesting design approach in terms of engine size, packaging and mass balancing. A
modified version of an Extended Expansion crank train design via a planetary gear is a system
based on a rotating crank shaft pin from Gomecsys [42]. The engine was originally designed
for a variable compression ratio (VCR) system (cf. also Figure 11). Design modifications at
the crank train, especially at crank shaft and crank pin, enable an Atkinson cycle.
Figure 43 – Gomecsys VCR engine [16]
An Atkinson cycle-based piston motion can also be realized via an opposed-piston or twin-
piston crank train arrangement with a common combustion chamber (cf. Figure 44 and
Figure 45). Due to a defined crankshaft interaction and geometric crankshaft layout an
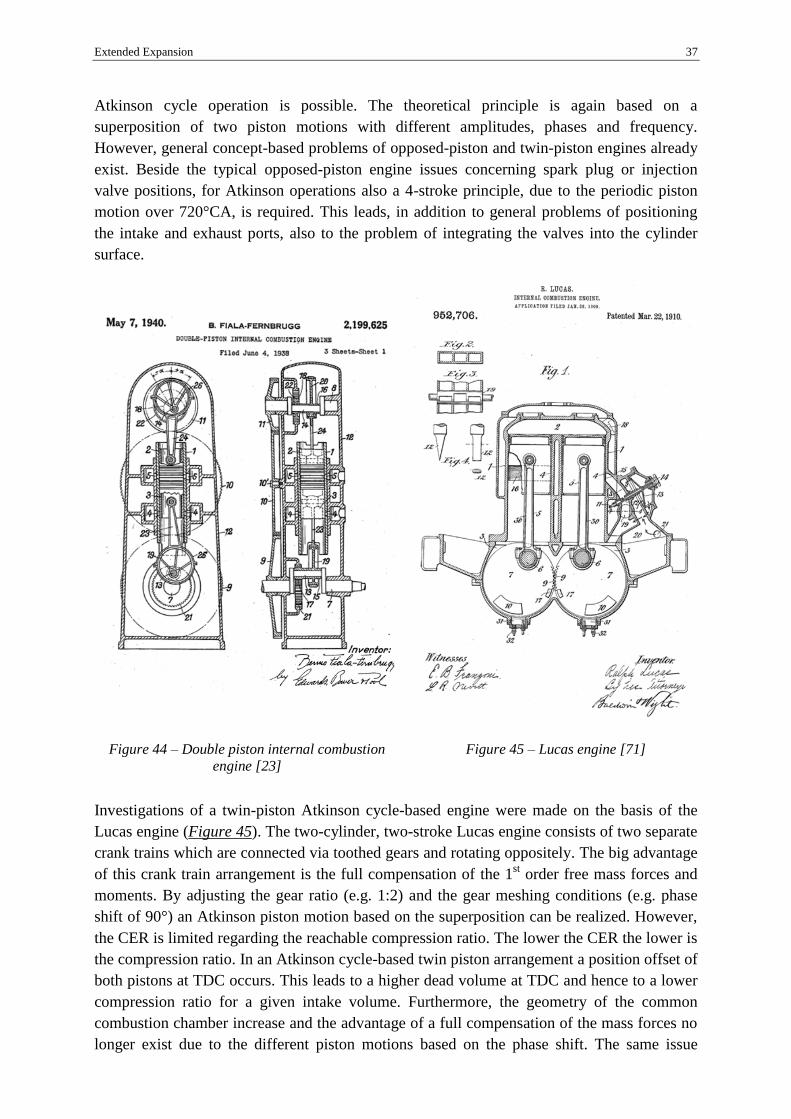
Extended Expansion 37
Atkinson cycle operation is possible. The theoretical principle is again based on a
superposition of two piston motions with different amplitudes, phases and frequency.
However, general concept-based problems of opposed-piston and twin-piston engines already
exist. Beside the typical opposed-piston engine issues concerning spark plug or injection
valve positions, for Atkinson operations also a 4-stroke principle, due to the periodic piston
motion over 720°CA, is required. This leads, in addition to general problems of positioning
the intake and exhaust ports, also to the problem of integrating the valves into the cylinder
surface.
Figure 44 – Double piston internal combustion
engine [23]
Figure 45 – Lucas engine [71]
Investigations of a twin-piston Atkinson cycle-based engine were made on the basis of the
Lucas engine (Figure 45). The two-cylinder, two-stroke Lucas engine consists of two separate
crank trains which are connected via toothed gears and rotating oppositely. The big advantage
of this crank train arrangement is the full compensation of the 1st order free mass forces and
moments. By adjusting the gear ratio (e.g. 1:2) and the gear meshing conditions (e.g. phase
shift of 90°) an Atkinson piston motion based on the superposition can be realized. However,
the CER is limited regarding the reachable compression ratio. The lower the CER the lower is
the compression ratio. In an Atkinson cycle-based twin piston arrangement a position offset of
both pistons at TDC occurs. This leads to a higher dead volume at TDC and hence to a lower
compression ratio for a given intake volume. Furthermore, the geometry of the common
combustion chamber increase and the advantage of a full compensation of the mass forces no
longer exist due to the different piston motions based on the phase shift. The same issue
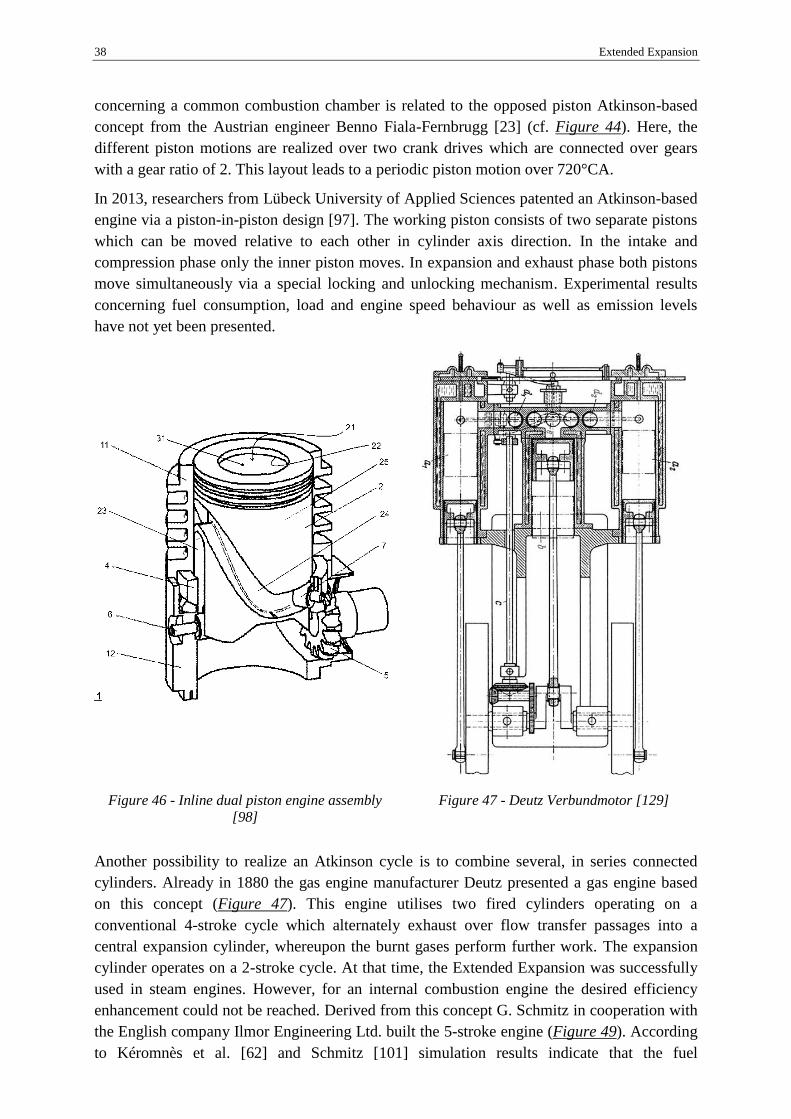
38 Extended Expansion
concerning a common combustion chamber is related to the opposed piston Atkinson-based
concept from the Austrian engineer Benno Fiala-Fernbrugg [23] (cf. Figure 44). Here, the
different piston motions are realized over two crank drives which are connected over gears
with a gear ratio of 2. This layout leads to a periodic piston motion over 720°CA.
In 2013, researchers from Lübeck University of Applied Sciences patented an Atkinson-based
engine via a piston-in-piston design [97]. The working piston consists of two separate pistons
which can be moved relative to each other in cylinder axis direction. In the intake and
compression phase only the inner piston moves. In expansion and exhaust phase both pistons
move simultaneously via a special locking and unlocking mechanism. Experimental results
concerning fuel consumption, load and engine speed behaviour as well as emission levels
have not yet been presented.
Figure 46 - Inline dual piston engine assembly
[98]
Figure 47 - Deutz Verbundmotor [129]
Another possibility to realize an Atkinson cycle is to combine several, in series connected
cylinders. Already in 1880 the gas engine manufacturer Deutz presented a gas engine based
on this concept (Figure 47). This engine utilises two fired cylinders operating on a
conventional 4-stroke cycle which alternately exhaust over flow transfer passages into a
central expansion cylinder, whereupon the burnt gases perform further work. The expansion
cylinder operates on a 2-stroke cycle. At that time, the Extended Expansion was successfully
used in steam engines. However, for an internal combustion engine the desired efficiency
enhancement could not be reached. Derived from this concept G. Schmitz in cooperation with
the English company Ilmor Engineering Ltd. built the 5-stroke engine (Figure 49). According
to Kéromnès et al. [62] and Schmitz [101] simulation results indicate that the fuel
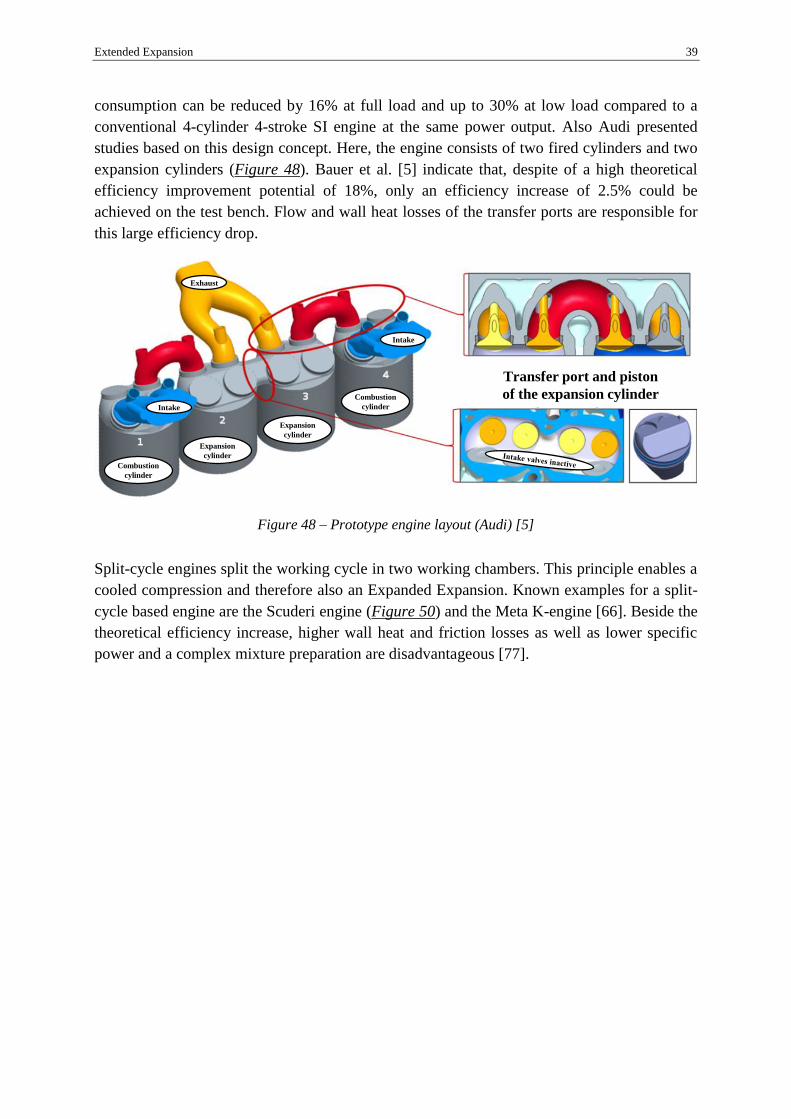
Extended Expansion 39
consumption can be reduced by 16% at full load and up to 30% at low load compared to a
conventional 4-cylinder 4-stroke SI engine at the same power output. Also Audi presented
studies based on this design concept. Here, the engine consists of two fired cylinders and two
expansion cylinders (Figure 48). Bauer et al. [5] indicate that, despite of a high theoretical
efficiency improvement potential of 18%, only an efficiency increase of 2.5% could be
achieved on the test bench. Flow and wall heat losses of the transfer ports are responsible for
this large efficiency drop.
Figure 48 – Prototype engine layout (Audi) [5]
Split-cycle engines split the working cycle in two working chambers. This principle enables a
cooled compression and therefore also an Expanded Expansion. Known examples for a split-
cycle based engine are the Scuderi engine (Figure 50) and the Meta K-engine [66]. Beside the
theoretical efficiency increase, higher wall heat and friction losses as well as lower specific
power and a complex mixture preparation are disadvantageous [77].
Transfer port and piston
of the expansion cylinder
Expansion
cylinder
Expansion
cylinder
Combustion
cylinder
Combustion
cylinderIntake
Intake
Exhaust

40 Extended Expansion
Basically, a turbo compound system with a downstream-placed turbine enables also an
Extended Expansion process. This system is e.g. used in series applications for trucks and
industrial Diesel engines (Volvo and Scania) [77].
Beside pure Atkinson concepts, well-known Extended Expansion concepts use dedicated
valve timing strategies. The so-called Miller-cycle engines with late or early IVC timing are
used in several series supercharged SI engines since few years (Ford, Honda, Infiniti, Kia,
Lexus, Mazda (Sky Active), Mercedes, Toyota, etc.). The majority of these Miller engines are
used as propulsion for hybrid vehicles. E.g. Toyota Motor Corporation has developed a new
series of SI engines based on a Miller concept with late IVC timing to improve the thermal
efficiency of their hybrids as well as their conventional engine fleet. The 1.3 l supercharged SI
engine can reach a thermal efficiency of 38% [81]. Beside the Miller principle also water-
cooled EGR (exhaust gas recirculation), a higher compression ratio of 13.5, adapted intake
and exhaust geometries and several friction improvement measures for the engine and the
auxiliaries are realized in this engine unit [81]. In contrast to the usage in passenger cars, the
Miller cycle operation in combination with supercharging is state-of-the-art for large gas
engines.
Generally, Extended Expansion-based crank train and valve train concepts are suitable for SI
and CI engines in a wide application range like passenger cars, utility vehicles, sports-, small-
or stationary engines. Despite the advantage of a huge theoretical efficiency increase some
drawbacks already exist. They affect specific power, engine size, engine speed limitations
Figure 49 – 5-stroke internal combustion engine
from Ilmor Engineering Ltd. [49]
Figure 50 – Scuderi split cycle engine [45]

Extended Expansion 41
concerning the mean piston velocity, challenges regarding combustion-chamber geometry,
mass balancing and crank train mechanics. A concrete implementation for the majority of the
presented concepts will be challenging in the future. Increased friction and wall heat losses as
well as lower specific power in comparison to conventional engines are clear disadvantages.
However, the huge theoretical efficiency potential requires further research activities e.g. for
special applications and/or for restricted operational areas. In terms of Atkinson engines,
several OEMs are already investigating on this topic and it is likely that several applied
solutions will appear as automotive propulsion in future.
3.3.1 Basic principle of the Atkinson cycle piston motion (on the example of planetary
gear crank train arrangement)
The mathematical principle of an Atkinson piston motion using a superposition of two
different oscillations was mentioned before. Here, a more detailed look on the principle of
Atkinson cycle-based piston motions as well as the consequences on valve timing by means
of an example of planetary gear crank train arrangement will be presented. Figure 51 shows a
schematic crank train arrangement for a single cylinder application. Due to defined gear ratios
of sun gear (crank shaft), planet gear (extender) and annulus gear, an Atkinson cycle piston
motion can be generated.
Figure 51 – Main parts of an Atkinson cycle-based engine via planetary gear (left image: 3D view,
right image: sectional view)
The basic principle of the Atkinson cycle piston motion via a planetary gear is based on the
superposition of two oscillations with different amplitudes, frequencies and phases (Figure
52). The phase shift of the extender wheel is +/- 90° and the frequency is either 0.5- or 1.5-
times of the crank shaft basis movement. The superposition results in a periodic motion over
720°CA with different amplitudes for the compression and the expansion stroke. Using this
specific pattern, the Atkinson cycle can only be implemented in a four-stroke principle.
Crank shaft
Extender
Conrod
Piston
Annulus gear

42 Extended Expansion
Figure 52 – Atkinson cycle-based piston motion (superposition of extender- and crankshaft motion)
In comparison to a conventional crank train, the Atkinson piston motion leads to a shift of the
top dead centres (cf. TDCI and TDCGE in Figure 52), resulting in a shorter time for gas
exchange. Due to this specific characteristic the valve timing has to be adapted (cf. also
Figure 65).

Extended Expansion 43
Figure 53 – Piston motion of an Atkinson cycle-based engine via planetary gear
In Figure 53 an Atkinson engine layout with a CER of 0.5, an intake volume of 400 cm³ and a
compression ratio of 12.5 is shown. The process for an SI engine proceeds as follows: The top
dead centre at ignition (TDCI) is at 0°CA (point 1). The compressed air-fuel mixture ignites
and the piston travels back down to the bottom dead centre (BDC - point 2). During the
exhaust stroke, the piston returns to top dead centre while the exhaust valve is open. The
second revolution starts with the intake stroke. The piston descends from the top dead centre
at gas exchange (TDCGE - point 3) to the bottom dead centre (BDC - point 4). Due to the
dead centre shift the TDCGE is at 387°CA (TDCGE at 360°CA for conventional engines).
With both intake and exhaust valves closed, the piston returns to the top dead centre at
ignition and the process starts from the beginning.
TD
CI
TD
CI
BD
C
BD
C
TD
CG
E
Cy
lin
der v
olu
me i
n c
m³
0
100
200
300
400
500
600
700
800
900
Crank angle in °CA
0 60 120 180 240 300 360 420 480 540 600 660 720
3
4
1
Dead volume
Co
mp
ress
ion
stro
ke
Ex
pa
nsi
on
str
ok
e
1 1
2
Cy
lin
der
vo
lum
e [d
m³]
0.0
0.1
0.2
0.3
0.4
0.5
0.6
0.7
0.8
0.9
Crank angle [°CA]
0 60 120 180 240 300 360 420 480 540 600 660 720
1
2
3
4
1
Dead volume
Ex
pa
nsi
on
str
ok
e
Co
mp
ress
ion
stro
ke
TD
CI
BD
C
BD
C
TD
CG
E
TD
CI
TDCI
TDCI
BDC
BDC
TDCG
E
Cylin
der v
olume
in cm
³
0
100
200
300
400
500
600
700
800
900
Crank angle in °CA
0 60 120 180 240 300 360 420 480 540 600 660 720
3
4
1
Dead volume
Comp
ressio
nstr
oke
Expa
nsion
strok
e
1 1
2
Cy
lin
der
vo
lum
e [d
m³]
0.0
0.1
0.2
0.3
0.4
0.5
0.6
0.7
0.8
0.9
Crank angle [°CA]
0 60 120 180 240 300 360 420 480 540 600 660 720
1
2
3
4
1
Dead volume
Ex
pa
nsi
on
str
ok
e
Co
mp
ress
ion
stro
ke
TD
CI
BD
C
BD
C
TD
CG
E
TD
CI
Cy
lin
der
vo
lum
e [d
m³]
0.0
0.1
0.2
0.3
0.4
0.5
0.6
0.7
0.8
0.9
Crank angle [°CA]
0 60 120 180 240 300 360 420 480 540 600 660 720
1
2
3
4
1
Dead volume
Ex
pa
nsi
on
str
ok
e
Co
mp
ress
ion
stro
ke
TD
CI
BD
C
BD
C
TD
CG
E
TD
CI
Cy
lin
der
vo
lum
e [d
m³]
0.0
0.1
0.2
0.3
0.4
0.5
0.6
0.7
0.8
0.9
Crank angle [°CA]
0 60 120 180 240 300 360 420 480 540 600 660 720
1
2
3
4
1
Dead volume
Ex
pa
nsi
on
str
ok
e
Co
mp
ress
ion
stro
ke
TD
CI
BD
C
BD
C
TD
CG
E
TD
CI
Cy
lin
der
vo
lum
e [d
m³]
0.0
0.1
0.2
0.3
0.4
0.5
0.6
0.7
0.8
0.9
Crank angle [°CA]
0 60 120 180 240 300 360 420 480 540 600 660 720
1
2
3
4
1
Dead volume
Ex
pa
nsi
on
str
ok
e
Co
mp
ress
ion
stro
ke
TD
CI
BD
C
BD
C
TD
CG
E
TD
CI

44 Extended Expansion
3.4 Pre-layout of an EE engine with 1D-CFD simulation
The ideal engine process for an Extended Expansion cycle shows a high efficiency potential
for naturally aspirated SI engines. However, the previous investigations and results in chapter
3.1 and 3.2 are based on analytical calculations. To evaluate the efficiency potentials
depending on the engine size (CER) in more detail, 1D-CFD simulations are carried out.
Furthermore, these investigations deal with the question of the principle realisation (design)
of an Extended Expansion working process. Generally, Extended Expansion can be realized
over the valve train (Miller cycle) or over the crank train (Atkinson cycle). Regarding the
design complexity, Miller cycles with adapted valve timing strategies show clear advantages
in comparison to Atkinson cycles with partly sophisticated crank mechanism. On the other
hand, Miller concepts have limits regarding reachable compression to expansion ratios, which
leads to reduced thermal efficiencies.
3.4.1 1D-CFD simulation methodology
In this chapter, the used simulation methodology will be explained and the starting boundaries
will be defined. The simulation methodology can be seen in Figure 54.
Figure 54 – 1D-CFD Simulation methodology
A conventional 4-stroke SI motorcycle engine with multi-point fuel injection and
stoichiometric lambda control is used as base engine. Other technical specifications of the
base engine are listed in Table 2. The base engine was experimentally measured on the engine
test bench and on the flow test bench to obtain combustion data, specific power, specific fuel
consumption and flow coefficients. These data are used to adjust the simulation model and to
evaluate the 1D-CFD simulation results of the base engine. If the simulation corresponds with
the experiment, simulation boundaries as starting basis for the EE simulation model can be
derived. These include e.g. Vibe gross heat release, EGR rates, volumetric efficiencies, etc.
The heat transfer model is based on Woschni 1990 [125 and 124] for both, the base engine
and the EE engine simulation model. The engine process simulation is performed with AVL
BOOST. The simulation model of the Extended Expansion engine (also denoted as Atkinson
Extended Expansion Engine
Heat release (dQ/dj)
1-D CFD SimulationResidual gas (EGR)
Simulation parameterf(la, rpm, EGR)1-D CFD Simulation
Base Engine
Volumetric eff. (la)
Design parameter
Evaluation Other results …
Test bench datap, T, fuel …
BM
EP
[bar]
0
2
4
6
8
10
12
14
16
18
20
engine speed [rpm]
1000 1500 2000 2500 3000 3500 4000 4500 5000 5500 6000
350350
350
400 400
400325
325325
300300
300
300
280
280280
280
280
280
270
270
270
270
270
270
260
260
260
260
260
260250
250
250
250
240
240
618
506413383 462381429 390
356330297293323 299 315
268 289268270 321300 279
282 306253255259 260 267
246249260 249 311264
258 250 240 271242286323
238264 250254 292
260 240 278317
291288
308276
ISFC=f(Nm, rpm)
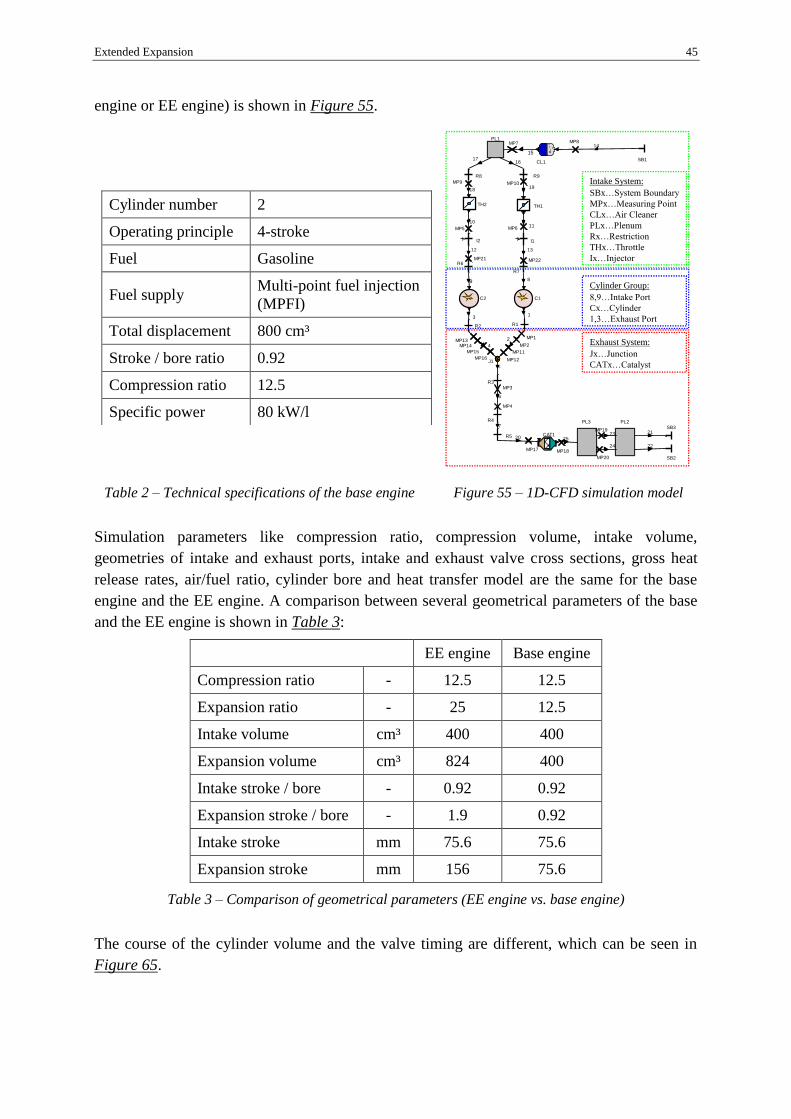
Extended Expansion 45
engine or EE engine) is shown in Figure 55.
Simulation parameters like compression ratio, compression volume, intake volume,
geometries of intake and exhaust ports, intake and exhaust valve cross sections, gross heat
release rates, air/fuel ratio, cylinder bore and heat transfer model are the same for the base
engine and the EE engine. A comparison between several geometrical parameters of the base
and the EE engine is shown in Table 3:
EE engine Base engine
Compression ratio - 12.5 12.5
Expansion ratio - 25 12.5
Intake volume cm³ 400 400
Expansion volume cm³ 824 400
Intake stroke / bore - 0.92 0.92
Expansion stroke / bore - 1.9 0.92
Intake stroke mm 75.6 75.6
Expansion stroke mm 156 75.6
Table 3 – Comparison of geometrical parameters (EE engine vs. base engine)
The course of the cylinder volume and the valve timing are different, which can be seen in
Figure 65.
Cylinder number 2
Operating principle 4-stroke
Fuel Gasoline
Fuel supply Multi-point fuel injection
(MPFI)
Total displacement 800 cm³
Stroke / bore ratio 0.92
Compression ratio 12.5
Specific power 80 kW/l
Table 2 – Technical specifications of the base engine Figure 55 – 1D-CFD simulation model
C1C2
J1
R1R2
1
2
3
4
R3
5
MP1
MP2
R4
6
R5
7
MP3
MP4
PL1
TH1TH2
SB1
89
R6
R7
I1I2
1011
12 13
CL1
14
15
1617
R8 R9
1819
MP5 MP6
CAT1
MP7 MP8
20
PL2PL3
SB2
SB321
22
23
24
25
MP9 MP10
MP11
MP12
MP13MP14
MP15
MP16
MP17 MP18
MP19
MP20
MP21 MP22
Intake System:
SBx…System Boundary
MPx…Measuring Point
CLx…Air Cleaner
PLx…Plenum
Rx…Restriction
THx…Throttle
Ix…Injector
Cylinder Group:
8,9…Intake Port
Cx…Cylinder
1,3…Exhaust Port
Exhaust System:
Jx…Junction
CATx…Catalyst

46 Extended Expansion
Figure 56 – Cylinder volume and valve timing (EE engine (CER=0.5) vs. base engine)
The cylinder volume of the EE engine is based on a planetary gear crank train arrangement.
The movement of the big end bearing describes a cycloid and leads to a TDC shift (cf. chapter
3.3.1). With a planetary gear-based crank train and due to appropriate geometrical parameters
CER variations can be made very simple, but the TDC shift and the shape of the cylinder
volume cannot be influenced. With a crank train arrangement via a linkage system the shape
of the cylinder volume can be modified due to the higher number of variation parameters and,
therefore, additionally optimised (cf. chapter 5). The EE piston motion causes a top dead
centre shift. Hence, the valve timing is adapted to the EE piston motion. Figure 65 also shows
the changed valve lift performance of the EE cycle with a CER of 0.5 compared to the base
engine. Exhaust open timing and intake close timing are the same for both, as well as the
maximum valve lift and the valve overlap. The valve overlap phase is shifted according to the
top dead centre shift.
The intake volume and the cylinder bore of the EE engine simulation model are similar to the
base engine. In order to achieve the defined CER, the expansion volume must be enlarged.
This aspect leads to higher piston velocities during the expansion phase. In the simulation
limits regarding piston speeds are not considered. For a practical use, this EE engine should
rather implement a short-stroke design, compared to the base engine with the same intake
volume. Additionally, with a short-stroke design (and based on the same intake volume)
higher efficiencies can be expected due to the lower surface to volume ratio. To reach the
same turbulence in the cylinder and to obtain the same gross heat release as for the base
engine, the intake system remains unchanged. As mentioned before, the required input data
like mass flow, pressure data, etc. are derived from test bench and flow bench measurements
Cy
lin
der v
olu
me i
n d
m³
0.0
0.1
0.2
0.3
0.4
0.5
0.6
0.7
0.8
Crank angle in °CA
0 60 120 180 240 300 360 420 480 540 600 660 720
EE engine Base engine
Va
lve l
ift
in m
m
0
2
4
6
8
10
12

Extended Expansion 47
of the base engine. The considered operating point is at full load (WOT) and 6000 rpm, which
represents the base engine’s best fuel consumption.
3.4.2 Efficiency potential and engine size
The first EE engine layout is made for full load operation with the aim to improve the
efficiency while keeping the power performance of the base engine. In the following,
indicated efficiency results concerning different CER values are carried out. CER affects the
efficiency behaviour as well as the valve timing.
Figure 57 – Cylinder volume and valve timing of the base engine and the EE engine for different CER
values (0°CA is TDCI)
In Figure 57 the cylinder volume characteristics and the valve timing of the base engine and
the Extended Expansion engine for several CERs over °CA are illustrated. With lower CER
values a larger TDC shift occurs, which leads to a longer duration of the expansion and
exhaust phase in comparison to the intake and compression phase (cf. also 3.3.1). Therefore,
the valve timing must be adjusted due to an optimized cylinder charge and efficiency.
Cy
lin
der v
olu
me i
n d
m³
0.0
0.1
0.2
0.3
0.4
0.5
0.6
0.7
0.8
0.9
Crank angle in °CA
0 60 120 180 240 300 360 420 480 540 600 660 720
EE engine (CER = 0.5) EE engine (CER = 0.7) Base engine
Valv
e l
ift
in m
m
0
2
4
6
8
10
12
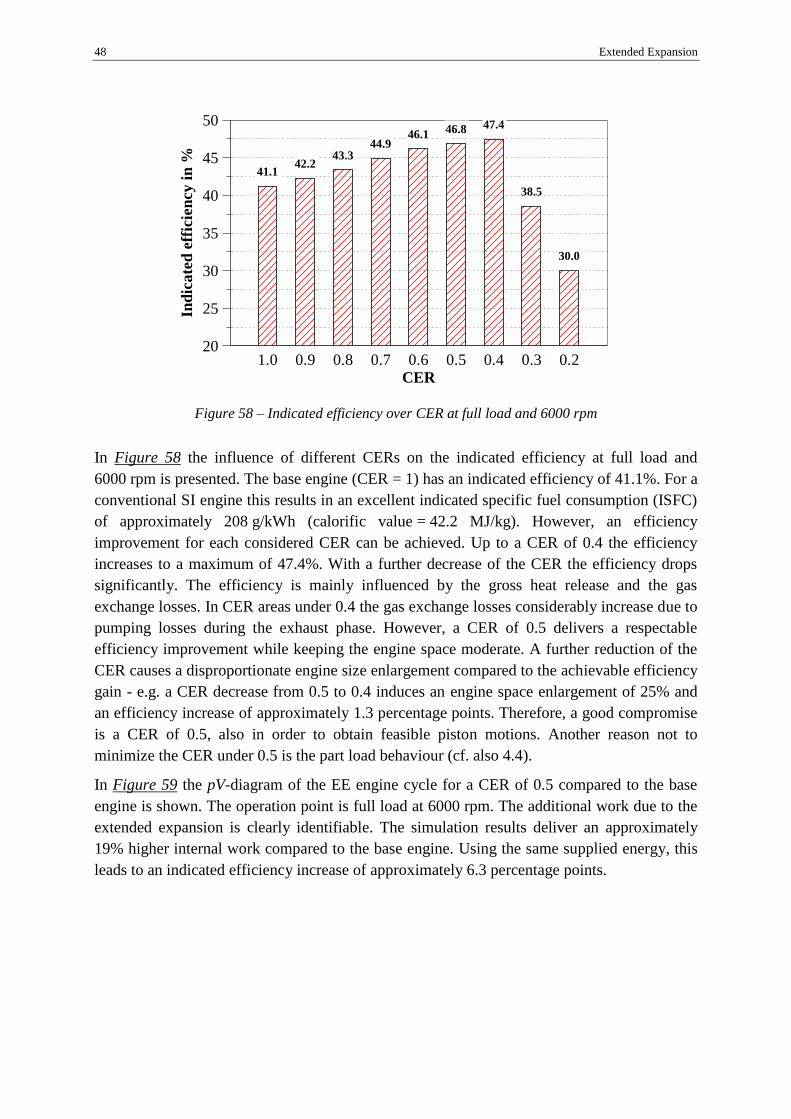
48 Extended Expansion
Figure 58 – Indicated efficiency over CER at full load and 6000 rpm
In Figure 58 the influence of different CERs on the indicated efficiency at full load and
6000 rpm is presented. The base engine (CER = 1) has an indicated efficiency of 41.1%. For a
conventional SI engine this results in an excellent indicated specific fuel consumption (ISFC)
of approximately 208 g/kWh (calorific value = 42.2 MJ/kg). However, an efficiency
improvement for each considered CER can be achieved. Up to a CER of 0.4 the efficiency
increases to a maximum of 47.4%. With a further decrease of the CER the efficiency drops
significantly. The efficiency is mainly influenced by the gross heat release and the gas
exchange losses. In CER areas under 0.4 the gas exchange losses considerably increase due to
pumping losses during the exhaust phase. However, a CER of 0.5 delivers a respectable
efficiency improvement while keeping the engine space moderate. A further reduction of the
CER causes a disproportionate engine size enlargement compared to the achievable efficiency
gain - e.g. a CER decrease from 0.5 to 0.4 induces an engine space enlargement of 25% and
an efficiency increase of approximately 1.3 percentage points. Therefore, a good compromise
is a CER of 0.5, also in order to obtain feasible piston motions. Another reason not to
minimize the CER under 0.5 is the part load behaviour (cf. also 4.4).
In Figure 59 the pV-diagram of the EE engine cycle for a CER of 0.5 compared to the base
engine is shown. The operation point is full load at 6000 rpm. The additional work due to the
extended expansion is clearly identifiable. The simulation results deliver an approximately
19% higher internal work compared to the base engine. Using the same supplied energy, this
leads to an indicated efficiency increase of approximately 6.3 percentage points.
Ind
ica
ted
eff
icie
ncy
in
%
20
25
30
35
40
45
50
CER
0.20.30.40.50.60.70.80.91.0
0.0
41.142.2
43.344.9
46.1 46.8 47.4
38.5
30.0
0.0
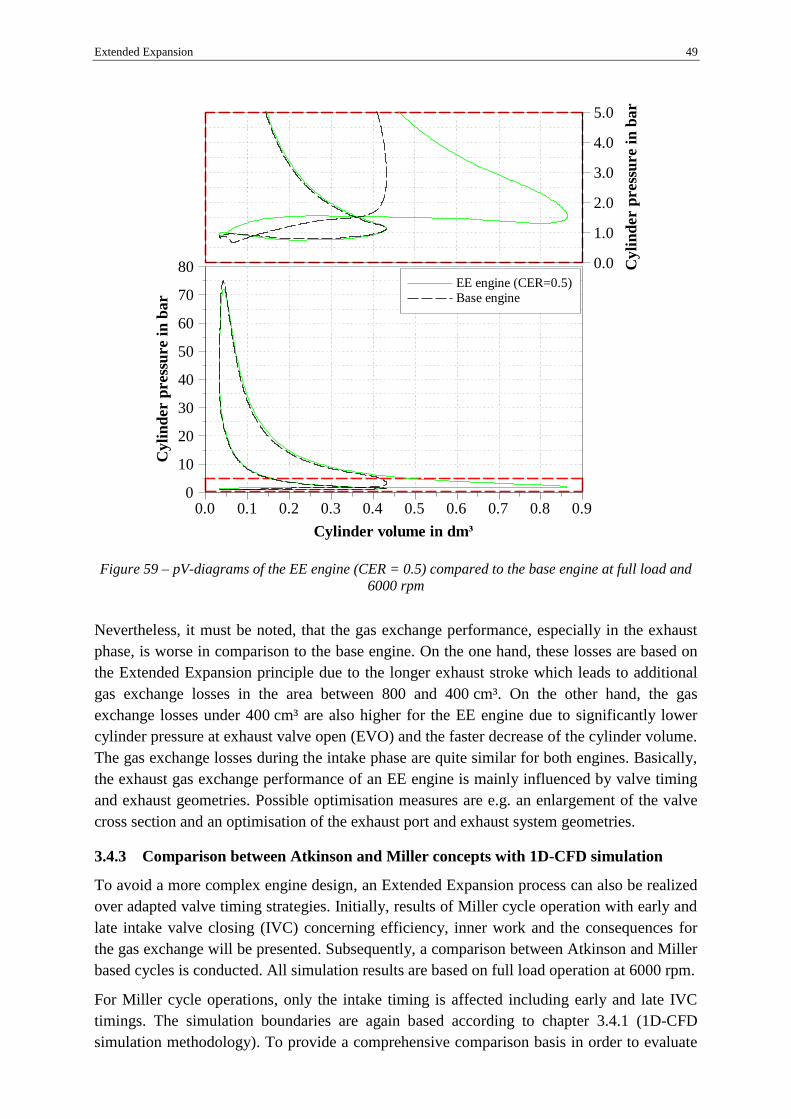
Extended Expansion 49
Figure 59 – pV-diagrams of the EE engine (CER = 0.5) compared to the base engine at full load and
6000 rpm
Nevertheless, it must be noted, that the gas exchange performance, especially in the exhaust
phase, is worse in comparison to the base engine. On the one hand, these losses are based on
the Extended Expansion principle due to the longer exhaust stroke which leads to additional
gas exchange losses in the area between 800 and 400 cm³. On the other hand, the gas
exchange losses under 400 cm³ are also higher for the EE engine due to significantly lower
cylinder pressure at exhaust valve open (EVO) and the faster decrease of the cylinder volume.
The gas exchange losses during the intake phase are quite similar for both engines. Basically,
the exhaust gas exchange performance of an EE engine is mainly influenced by valve timing
and exhaust geometries. Possible optimisation measures are e.g. an enlargement of the valve
cross section and an optimisation of the exhaust port and exhaust system geometries.
3.4.3 Comparison between Atkinson and Miller concepts with 1D-CFD simulation
To avoid a more complex engine design, an Extended Expansion process can also be realized
over adapted valve timing strategies. Initially, results of Miller cycle operation with early and
late intake valve closing (IVC) concerning efficiency, inner work and the consequences for
the gas exchange will be presented. Subsequently, a comparison between Atkinson and Miller
based cycles is conducted. All simulation results are based on full load operation at 6000 rpm.
For Miller cycle operations, only the intake timing is affected including early and late IVC
timings. The simulation boundaries are again based according to chapter 3.4.1 (1D-CFD
simulation methodology). To provide a comprehensive comparison basis in order to evaluate
Cy
lin
der p
ress
ure i
n b
ar
0
10
20
30
40
50
60
70
80
Cylinder volume in dm³
0.0 0.1 0.2 0.3 0.4 0.5 0.6 0.7 0.8 0.9
EE engine (CER=0.5)
Base engine
Cy
lin
der p
ress
ure i
n b
ar
0.0
1.0
2.0
3.0
4.0
5.0
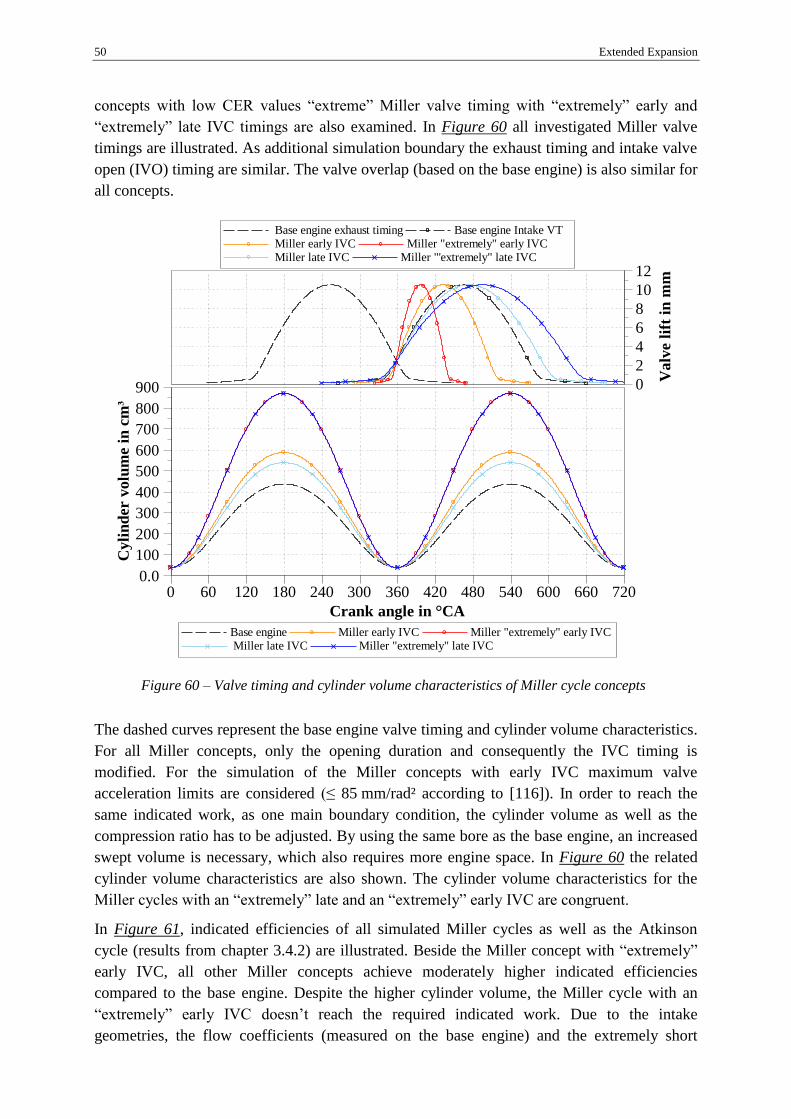
50 Extended Expansion
concepts with low CER values “extreme” Miller valve timing with “extremely” early and
“extremely” late IVC timings are also examined. In Figure 60 all investigated Miller valve
timings are illustrated. As additional simulation boundary the exhaust timing and intake valve
open (IVO) timing are similar. The valve overlap (based on the base engine) is also similar for
all concepts.
Figure 60 – Valve timing and cylinder volume characteristics of Miller cycle concepts
The dashed curves represent the base engine valve timing and cylinder volume characteristics.
For all Miller concepts, only the opening duration and consequently the IVC timing is
modified. For the simulation of the Miller concepts with early IVC maximum valve
acceleration limits are considered (≤ 85 mm/rad² according to [116]). In order to reach the
same indicated work, as one main boundary condition, the cylinder volume as well as the
compression ratio has to be adjusted. By using the same bore as the base engine, an increased
swept volume is necessary, which also requires more engine space. In Figure 60 the related
cylinder volume characteristics are also shown. The cylinder volume characteristics for the
Miller cycles with an “extremely” late and an “extremely” early IVC are congruent.
In Figure 61, indicated efficiencies of all simulated Miller cycles as well as the Atkinson
cycle (results from chapter 3.4.2) are illustrated. Beside the Miller concept with “extremely”
early IVC, all other Miller concepts achieve moderately higher indicated efficiencies
compared to the base engine. Despite the higher cylinder volume, the Miller cycle with an
“extremely” early IVC doesn’t reach the required indicated work. Due to the intake
geometries, the flow coefficients (measured on the base engine) and the extremely short
Cy
lin
der v
olu
me i
n c
m³
0.0
100
200
300
400
500
600
700
800
900
Crank angle in °CA
0 60 120 180 240 300 360 420 480 540 600 660 720
Base engine Miller early IVC Miller "extremely" early IVC Miller late IVC Miller "extremely" late IVC
Valv
e l
ift
in m
m
0
2
4
6
8
10
12
Base engine exhaust timing Base engine Intake VT Miller early IVC Miller "extremely" early IVC Miller late IVC Miller "'extremely" late IVC

Extended Expansion 51
opening duration the cylinder cannot be fully charged. All other Miller variants achieve, as a
result of the cylinder volume modifications, the required indicated work of the base engine as
comparison basis. The highest efficiency of a Miller concept is reached via an early IVC
timing with 43%. The indicated efficiency for Miller concepts with a later IVC timing ranges
between 42.3 and 42.5%. However, the highest efficiency, based on the same indicated work,
can be achieved with the Atkinson cycle with 46.8%.
Figure 61 –Indicated efficiency of simulated Miller cycles at full load and 6000 rpm
The gas exchange loops of Miller cycles with early IVC strategies at full load and 6000 rpm
are shown in Figure 62.
Figure 62 – GE loops of Miller cycles with early IVC strategies at full load and 6000 rpm
Ind
ica
ted
eff
icie
ncy
in
%
0
5
10
15
20
25
30
35
40
45
50
Base engine Miller early IVC Miller "'extremely" early IVC Miller late IVC Miller "'extremely" late IVC Atkinson (over crank train)
41.143.0
35.4
42.3 42.5
46.8
Cy
lin
der p
ress
ure i
n b
ar
0
1
2
3
4
5
Cylinder volume in cm³
0 100 200 300 400 500 600 700 800 900
Base engine Miller early IVC Miller "extremely" early IVC
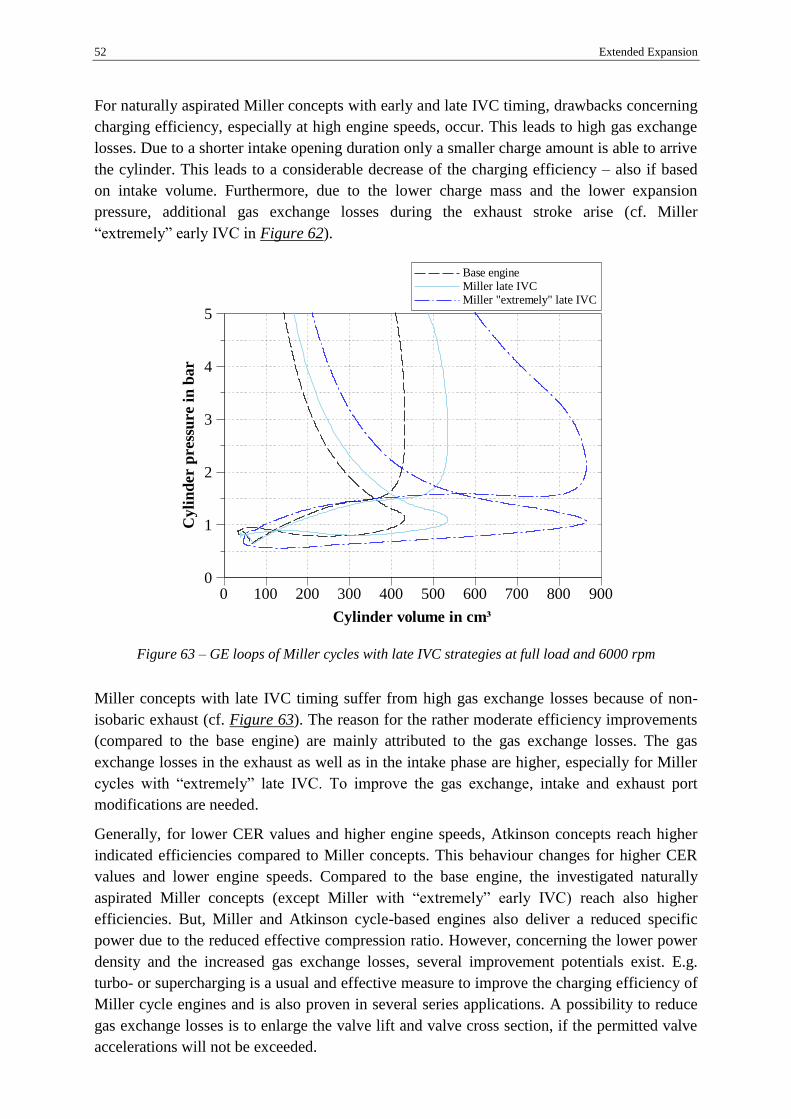
52 Extended Expansion
For naturally aspirated Miller concepts with early and late IVC timing, drawbacks concerning
charging efficiency, especially at high engine speeds, occur. This leads to high gas exchange
losses. Due to a shorter intake opening duration only a smaller charge amount is able to arrive
the cylinder. This leads to a considerable decrease of the charging efficiency – also if based
on intake volume. Furthermore, due to the lower charge mass and the lower expansion
pressure, additional gas exchange losses during the exhaust stroke arise (cf. Miller
“extremely” early IVC in Figure 62).
Figure 63 – GE loops of Miller cycles with late IVC strategies at full load and 6000 rpm
Miller concepts with late IVC timing suffer from high gas exchange losses because of non-
isobaric exhaust (cf. Figure 63). The reason for the rather moderate efficiency improvements
(compared to the base engine) are mainly attributed to the gas exchange losses. The gas
exchange losses in the exhaust as well as in the intake phase are higher, especially for Miller
cycles with “extremely” late IVC. To improve the gas exchange, intake and exhaust port
modifications are needed.
Generally, for lower CER values and higher engine speeds, Atkinson concepts reach higher
indicated efficiencies compared to Miller concepts. This behaviour changes for higher CER
values and lower engine speeds. Compared to the base engine, the investigated naturally
aspirated Miller concepts (except Miller with “extremely” early IVC) reach also higher
efficiencies. But, Miller and Atkinson cycle-based engines also deliver a reduced specific
power due to the reduced effective compression ratio. However, concerning the lower power
density and the increased gas exchange losses, several improvement potentials exist. E.g.
turbo- or supercharging is a usual and effective measure to improve the charging efficiency of
Miller cycle engines and is also proven in several series applications. A possibility to reduce
gas exchange losses is to enlarge the valve lift and valve cross section, if the permitted valve
accelerations will not be exceeded.
Cy
lin
der p
ress
ure i
n b
ar
0
1
2
3
4
5
Cylinder volume in cm³
0 100 200 300 400 500 600 700 800 900
Base engine Miller late IVC Miller "extremely" late IVC
Extended Expansion 53
3.5 Target engine layout
Based on the investigations of the previous sub-chapters, an engine layout regarding main
technological and geometrical boundaries will be defined. According to the ideal engine
efficiency characteristics, the Extended Expansion is more efficient for lower compression
ratios (see Figure 38). Furthermore, for naturally aspirated SI engines only few efficiency
raising concepts exist in contrast to supercharged engines. These facts lead to the decision to
choose a naturally aspirated SI engine as basis. In terms of efficiency versus engine space a
CER of 0.5 is a good compromise. This ratio leads to a considerable efficiency potential
while enabling moderate engine sizes.
Due to the intended usage in the automotive sector an engine speed range from 1500 to
6000 rpm is desirable. As mentioned in chapter 3.4.3, pure Miller cycles (Extended
Expansion over valve train) have significantly efficiency drawbacks regarding the defined
target requirements. Considering the defined CER of 0.5 and the maximum engine speed of
6000 rpm, Miller-cycle engines suffer, beside a lower inner efficiency in comparison to
Atkinson cycle-based engines, from a lower specific power. In addition, naturally aspirated
Miller engines have disadvantages at high engine speeds. For an early IVC, the inlet time is
very short and therewith the volumetric efficiency decreases (although if it’s based on the
intake volume). With a late IVC, a higher volumetric efficiency can be gained, but, due to the
higher amount of gas exchange losses, the efficiency improvement is low (cf. chapter 3.4.3).
This leads to the decision to concentrate on Atkinson cycle-based engines for further
investigations.
Having defined the Atkinson working principle, the question of the design implementation for
a CER of 0.5 arises. Several design concepts for Atkinson engines are presented in chapter
3.3. To avoid additional flow losses and wall heat losses over flow transfer passages, the
combustion process should take place in one working chamber. Hence, design concepts with
additional expansion cylinders (like Schmitz/Ilmor and Audi) and split-cycle concepts (like
Scuderi and Meta) will be excluded from the selection. Regarding Atkinson cycle-based
double or opposite piston design arrangement, the position of spark plugs and intake and
exhaust ports, the chamber geometry and the limited compression ratio are adverse aspects
and are thus excluded from the design concepts. A CER of 0.5 causes strength problems of
the annulus gear and very big bearing diameter of the big end bearing (friction) for crank
trains based on planetary gears. Due to these characteristics, a crank train arrangement
based on a linkage system is chosen. The reason for this decision is also based on the fact that
a successful series application from Honda is already available. However, despite the similar
principle design arrangement, the main differentiations to the Exlink engine concern the
engine geometries (CER) and the engine operation range. Honda uses a CER of
approximately 0.7. Here, all further investigations deal with a CER of 0.5. The Exlink engine
is used as combined heat and power generation in series. Therefore, the operation range is
basically limited to one operation point. The demand to use an EE engine in the automotive
sector requires an engine operation in the entire engine map. In addition, a complete operation
from part to full load in the defined engine speed range from 1500 to 6000 rpm needs variable
valve timing to avoid considerable gas exchange losses. Therefore, a main focus of the
research work is put on valve timing variability and, hence, to extensive simulation and
experimental investigations on this topic. Additionally, the maximum mean piston velocity is

54 Extended Expansion
limited to 25 m/s for durability reasons.
Summarising, a list of the main technical decisions for the Extended Expansion engine is
presented as follows:
Naturally aspirated SI combustion process
CER of 0.5
Desired speed range between 1500 and 6000 rpm
Extended Expansion over the crank train (Atkinson principle)
Crank train arrangement based on a linkage system
Implementation of variable valve timing
Mean piston speed limit of 25 m/s at 6000 rpm
Based on these decisions and boundaries, detailed 1D-CFD investigations are carried out to
evaluate the efficiency potential in more detail.
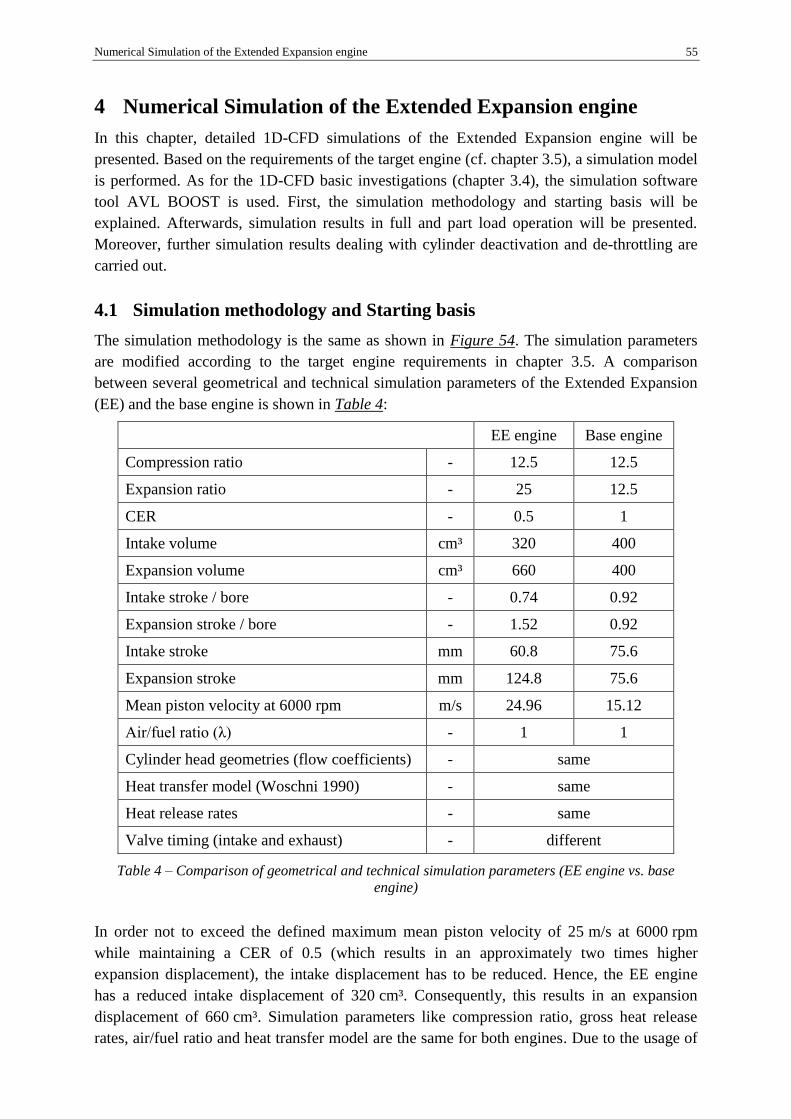
Numerical Simulation of the Extended Expansion engine 55
4 Numerical Simulation of the Extended Expansion engine
In this chapter, detailed 1D-CFD simulations of the Extended Expansion engine will be
presented. Based on the requirements of the target engine (cf. chapter 3.5), a simulation model
is performed. As for the 1D-CFD basic investigations (chapter 3.4), the simulation software
tool AVL BOOST is used. First, the simulation methodology and starting basis will be
explained. Afterwards, simulation results in full and part load operation will be presented.
Moreover, further simulation results dealing with cylinder deactivation and de-throttling are
carried out.
4.1 Simulation methodology and Starting basis
The simulation methodology is the same as shown in Figure 54. The simulation parameters
are modified according to the target engine requirements in chapter 3.5. A comparison
between several geometrical and technical simulation parameters of the Extended Expansion
(EE) and the base engine is shown in Table 4:
EE engine Base engine
Compression ratio - 12.5 12.5
Expansion ratio - 25 12.5
CER - 0.5 1
Intake volume cm³ 320 400
Expansion volume cm³ 660 400
Intake stroke / bore - 0.74 0.92
Expansion stroke / bore - 1.52 0.92
Intake stroke mm 60.8 75.6
Expansion stroke mm 124.8 75.6
Mean piston velocity at 6000 rpm m/s 24.96 15.12
Air/fuel ratio (λ) - 1 1
Cylinder head geometries (flow coefficients) - same
Heat transfer model (Woschni 1990) - same
Heat release rates - same
Valve timing (intake and exhaust) - different
Table 4 – Comparison of geometrical and technical simulation parameters (EE engine vs. base
engine)
In order not to exceed the defined maximum mean piston velocity of 25 m/s at 6000 rpm
while maintaining a CER of 0.5 (which results in an approximately two times higher
expansion displacement), the intake displacement has to be reduced. Hence, the EE engine
has a reduced intake displacement of 320 cm³. Consequently, this results in an expansion
displacement of 660 cm³. Simulation parameters like compression ratio, gross heat release
rates, air/fuel ratio and heat transfer model are the same for both engines. Due to the usage of

56 Numerical Simulation of the Extended Expansion engine
the base engine cylinder head, port geometries, valve cross sections and the cylinder bore are
also the same. Furthermore, the complete intake system (injection system, air box air filter,
etc.) is similar to the base engine. Vibe gross heat release rates are derived from measured
combustion data of the base engine. These rates are also used for the EE engine simulation
model. The heat transfer model is based on Woschni 1990 [125 and 124]. The required input
data like air mass, fuel mass, cylinder pressure, flow coefficients, etc. are derived from test
bench and flow test bench measurements of the base engine. For each investigated load point,
the optimum intake and exhaust valve timing concerning EE engine efficiency and permitted
valve train loads are used. Therefore, an optimisation methodology is performed which affects
the engine performance as well as the valve train design. A more detailed description of the
valve timing optimisation process is presented in chapter 5.1.
The simulation results include full (WOT) and part load (PL) operation points. The WOT
operation is investigated in a speed range between 2000 and 6000 rpm. A special focus is put
on the gas exchange behaviour, whereas the PL point (BMEP = 2 bar / 2000 rpm) is
comprehensively investigated regarding the influence of different valve timings (lift and
phase). According to test bench measurements, the FMEP (friction mean effective pressure)
of the base engine is 1.1 bar at this PL point. Hence, 2 bar BMEP (brake mean effective
pressure) corresponds to 3.1 bar IMEP (indicated mean effective pressure). The friction of the
EE engine is assumed with the 1.5 times higher value of the base engine. The main reasons
for this estimation are based on two factors. On the one hand, the higher number of parts
(almost twice of the base engine) increases the friction losses. On the other hand, the lower
deflection of the conrod during expansion decreases the friction losses due to lower piston
side forces. However, the friction behaviour of the EE engine must be finally proofed by
experimental tests (see also chapter 6.6). Additionally, studies regarding de-throttling and
cylinder deactivation are also carried out.

Numerical Simulation of the Extended Expansion engine 57
4.2 Full load behaviour
Initially, full load investigations concerning different CER (compression to expansion ratio)
values on the engine efficiency are presented in chapter 3.4.2. According to these studies, a
CER of 0.5 delivers high indicated efficiency while keeping the engine size moderate.
Generally, CER affects the efficiency behaviour as well as the valve timing. Hence, several
valve timing adjustments are examined in order to reach the optimum efficiency while
keeping the same power as the base engine. As comparison basis for the numerical
investigations, the same indicated engine power is used.
Figure 64 –Indicated power and indicated mean effective pressure (EE engine vs. base engine)
In Figure 64, the indicated power of the EE and the base engine over the defined speed range
is shown. Basically, with the same engine geometries and the same technical boundary
conditions, the EE engine delivers more work due to the EE working principle. Because of the
decreased intake volume (from 400 to 320 cm³ per cylinder) and the adjusted intake valve lift
(cf. Figure 65), the indicated EE engine power is approximately the same in the considered
engine speed range. The mean effective pressure (MEP) for all further simulation results is
related to the intake volume (320 cm³). When the MEP is based on the expansion volume
(660 cm³), the values are consequently lower. This is also true when relating the MEP on a
mean value of intake and expansion volume.
Engine Speed in rpm
2000 2500 3000 3500 4000 4500 5000 5500 6000
Ind
icate
d p
ow
er i
n k
W
0
10
20
30
40
50
60 EE engine Base engine
Ind
icate
d m
ea
n
eff
ecti
ve p
ress
ure i
n b
ar
0
5
10
15
20
IMEP_EE (In Vol) IMEP_EE (mean value) IMEP_EE (Ex Vol) IMEP_Base engine (In Vol)
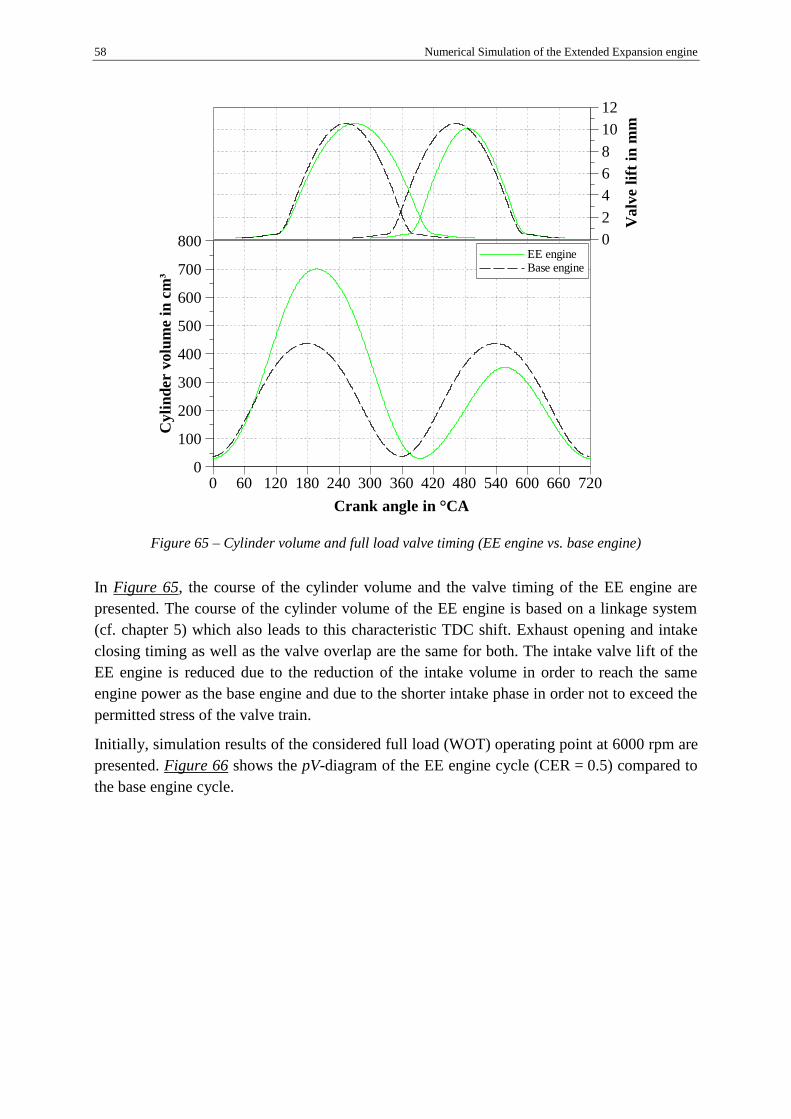
58 Numerical Simulation of the Extended Expansion engine
Figure 65 – Cylinder volume and full load valve timing (EE engine vs. base engine)
In Figure 65, the course of the cylinder volume and the valve timing of the EE engine are
presented. The course of the cylinder volume of the EE engine is based on a linkage system
(cf. chapter 5) which also leads to this characteristic TDC shift. Exhaust opening and intake
closing timing as well as the valve overlap are the same for both. The intake valve lift of the
EE engine is reduced due to the reduction of the intake volume in order to reach the same
engine power as the base engine and due to the shorter intake phase in order not to exceed the
permitted stress of the valve train.
Initially, simulation results of the considered full load (WOT) operating point at 6000 rpm are
presented. Figure 66 shows the pV-diagram of the EE engine cycle (CER = 0.5) compared to
the base engine cycle.
Cy
lin
der v
olu
me i
n c
m³
0
100
200
300
400
500
600
700
800
Crank angle in °CA
0 60 120 180 240 300 360 420 480 540 600 660 720
EE engine Base engine
Valv
e l
ift
in m
m
0
2
4
6
8
10
12
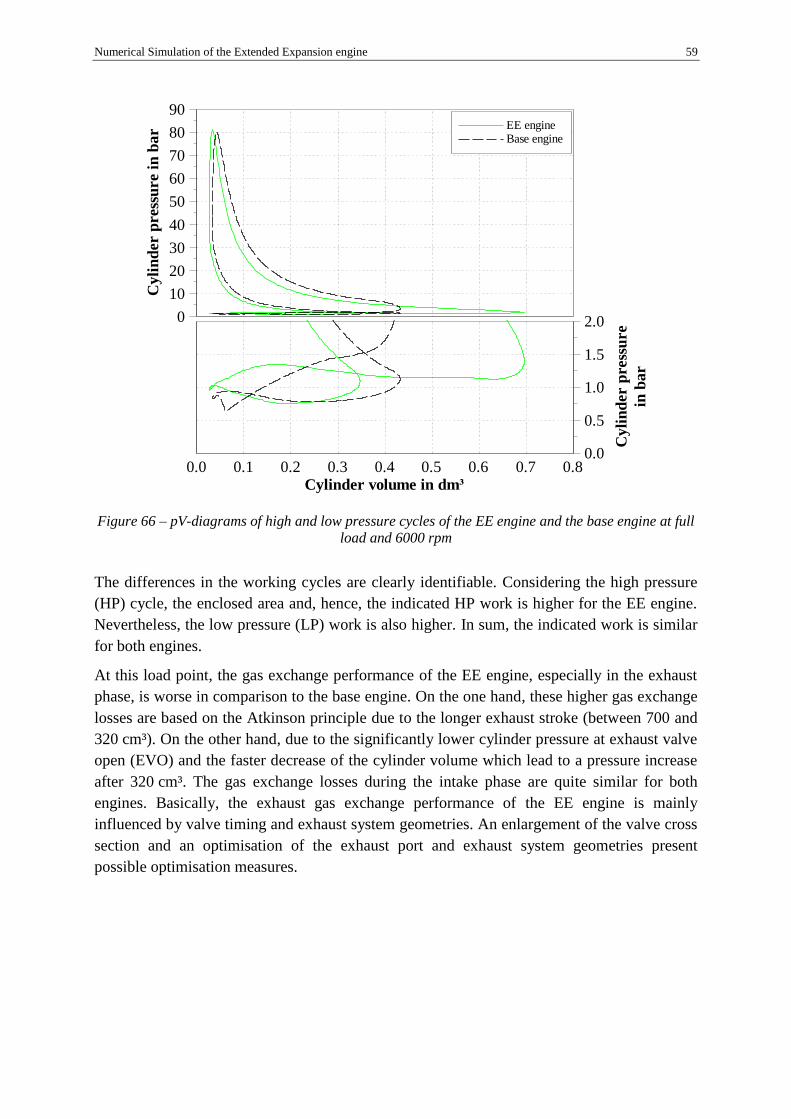
Numerical Simulation of the Extended Expansion engine 59
Figure 66 – pV-diagrams of high and low pressure cycles of the EE engine and the base engine at full
load and 6000 rpm
The differences in the working cycles are clearly identifiable. Considering the high pressure
(HP) cycle, the enclosed area and, hence, the indicated HP work is higher for the EE engine.
Nevertheless, the low pressure (LP) work is also higher. In sum, the indicated work is similar
for both engines.
At this load point, the gas exchange performance of the EE engine, especially in the exhaust
phase, is worse in comparison to the base engine. On the one hand, these higher gas exchange
losses are based on the Atkinson principle due to the longer exhaust stroke (between 700 and
320 cm³). On the other hand, due to the significantly lower cylinder pressure at exhaust valve
open (EVO) and the faster decrease of the cylinder volume which lead to a pressure increase
after 320 cm³. The gas exchange losses during the intake phase are quite similar for both
engines. Basically, the exhaust gas exchange performance of the EE engine is mainly
influenced by valve timing and exhaust system geometries. An enlargement of the valve cross
section and an optimisation of the exhaust port and exhaust system geometries present
possible optimisation measures.
Cylinder volume in dm³
0.0 0.1 0.2 0.3 0.4 0.5 0.6 0.7 0.8
Cyli
nd
er p
ress
ure i
n b
ar
0
10
20
30
40
50
60
70
80
90 EE engine Base engine
Cy
lin
der p
ress
ure
in b
ar
0.0
0.5
1.0
1.5
2.0
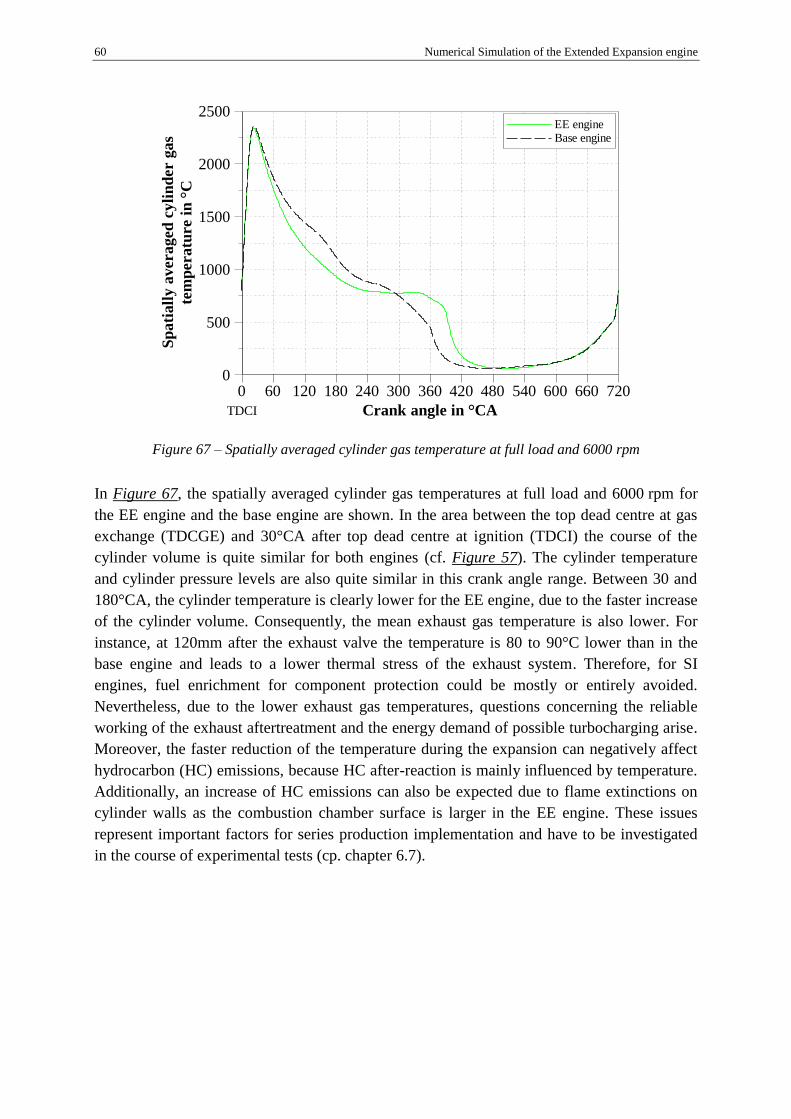
60 Numerical Simulation of the Extended Expansion engine
Figure 67 – Spatially averaged cylinder gas temperature at full load and 6000 rpm
In Figure 67, the spatially averaged cylinder gas temperatures at full load and 6000 rpm for
the EE engine and the base engine are shown. In the area between the top dead centre at gas
exchange (TDCGE) and 30°CA after top dead centre at ignition (TDCI) the course of the
cylinder volume is quite similar for both engines (cf. Figure 57). The cylinder temperature
and cylinder pressure levels are also quite similar in this crank angle range. Between 30 and
180°CA, the cylinder temperature is clearly lower for the EE engine, due to the faster increase
of the cylinder volume. Consequently, the mean exhaust gas temperature is also lower. For
instance, at 120mm after the exhaust valve the temperature is 80 to 90°C lower than in the
base engine and leads to a lower thermal stress of the exhaust system. Therefore, for SI
engines, fuel enrichment for component protection could be mostly or entirely avoided.
Nevertheless, due to the lower exhaust gas temperatures, questions concerning the reliable
working of the exhaust aftertreatment and the energy demand of possible turbocharging arise.
Moreover, the faster reduction of the temperature during the expansion can negatively affect
hydrocarbon (HC) emissions, because HC after-reaction is mainly influenced by temperature.
Additionally, an increase of HC emissions can also be expected due to flame extinctions on
cylinder walls as the combustion chamber surface is larger in the EE engine. These issues
represent important factors for series production implementation and have to be investigated
in the course of experimental tests (cp. chapter 6.7).
TDCI
Sp
ati
all
y a
vera
ged
cy
lin
der g
as
tem
peratu
re i
n °
C
0
500
1000
1500
2000
2500
Crank angle in °CA
0 60 120 180 240 300 360 420 480 540 600 660 720
EE engine Base engine

Numerical Simulation of the Extended Expansion engine 61
4.3 Engine speed influence
Figure 68 – Indicated efficiencies over engine speed at full load
Figure 68 presents a comparison of the full load efficiencies over engine speed. The EE valve
timing corresponds to those in Figure 57 for a CER of 0.5. The EE engine delivers an
efficiency enhancement in all simulated operation points. Assuming the friction of the EE
engine with the 1.5 times higher value of the base engine, the effective efficiency is also
improved. As mentioned before, the gas exchange losses (hatched area) are generally high and
increase with higher engine speed. However, there is a substantial potential for improvements.
Basically, the question arises when valve timing variability is needed in full load to reach high
efficiency and high power. For the EE engine, as well as for the base engine, the cylinder
charge can, depending on the operation point, be adjusted via valve timing. But the effect on
the efficiency is small. Hence, for pure full load operation fixed valve timing is sufficient for
the EE engine.
In summary, the predicted efficiency results of the analytical air-standard analysis correspond
with the 1D-CFD simulation. A significant indicated efficiency increase of approximately
11.1% at 2000 rpm up to 16.8% at 6000 rpm compared to the base engine can be achieved.
Ind
icate
d e
ffic
ien
cy
in
%
25.0
27.5
30.0
32.5
35.0
37.5
40.0
42.5
45.0
47.5
50.0
52.5
55.0
Engine speed in rpm
2000 2500 3000 3500 4000 4500 5000 5500 6000
EE engine Base engine EE engine (HP cycle) Base engine (HP cycle) EE engine GE loss Base engine GE loss
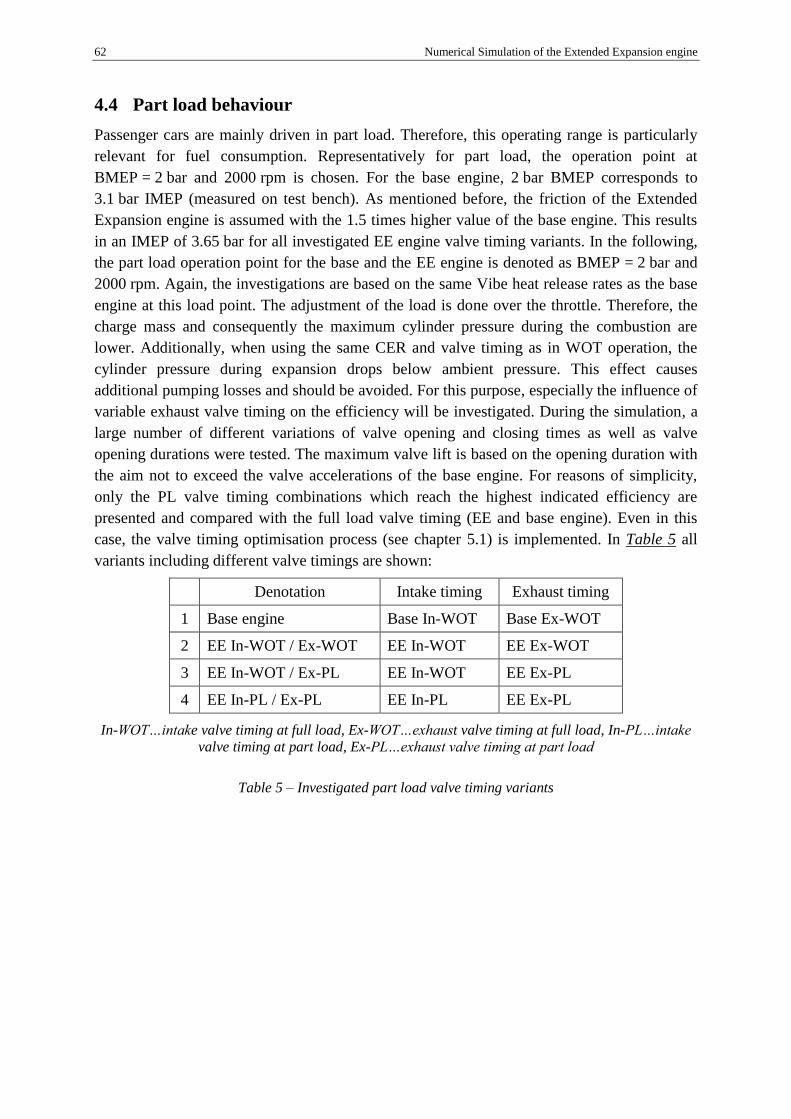
62 Numerical Simulation of the Extended Expansion engine
4.4 Part load behaviour
Passenger cars are mainly driven in part load. Therefore, this operating range is particularly
relevant for fuel consumption. Representatively for part load, the operation point at
BMEP = 2 bar and 2000 rpm is chosen. For the base engine, 2 bar BMEP corresponds to
3.1 bar IMEP (measured on test bench). As mentioned before, the friction of the Extended
Expansion engine is assumed with the 1.5 times higher value of the base engine. This results
in an IMEP of 3.65 bar for all investigated EE engine valve timing variants. In the following,
the part load operation point for the base and the EE engine is denoted as BMEP = 2 bar and
2000 rpm. Again, the investigations are based on the same Vibe heat release rates as the base
engine at this load point. The adjustment of the load is done over the throttle. Therefore, the
charge mass and consequently the maximum cylinder pressure during the combustion are
lower. Additionally, when using the same CER and valve timing as in WOT operation, the
cylinder pressure during expansion drops below ambient pressure. This effect causes
additional pumping losses and should be avoided. For this purpose, especially the influence of
variable exhaust valve timing on the efficiency will be investigated. During the simulation, a
large number of different variations of valve opening and closing times as well as valve
opening durations were tested. The maximum valve lift is based on the opening duration with
the aim not to exceed the valve accelerations of the base engine. For reasons of simplicity,
only the PL valve timing combinations which reach the highest indicated efficiency are
presented and compared with the full load valve timing (EE and base engine). Even in this
case, the valve timing optimisation process (see chapter 5.1) is implemented. In Table 5 all
variants including different valve timings are shown:
Denotation Intake timing Exhaust timing
1 Base engine Base In-WOT Base Ex-WOT
2 EE In-WOT / Ex-WOT EE In-WOT EE Ex-WOT
3 EE In-WOT / Ex-PL EE In-WOT EE Ex-PL
4 EE In-PL / Ex-PL EE In-PL EE Ex-PL
In-WOT…intake valve timing at full load, Ex-WOT…exhaust valve timing at full load, In-PL…intake
valve timing at part load, Ex-PL…exhaust valve timing at part load
Table 5 – Investigated part load valve timing variants
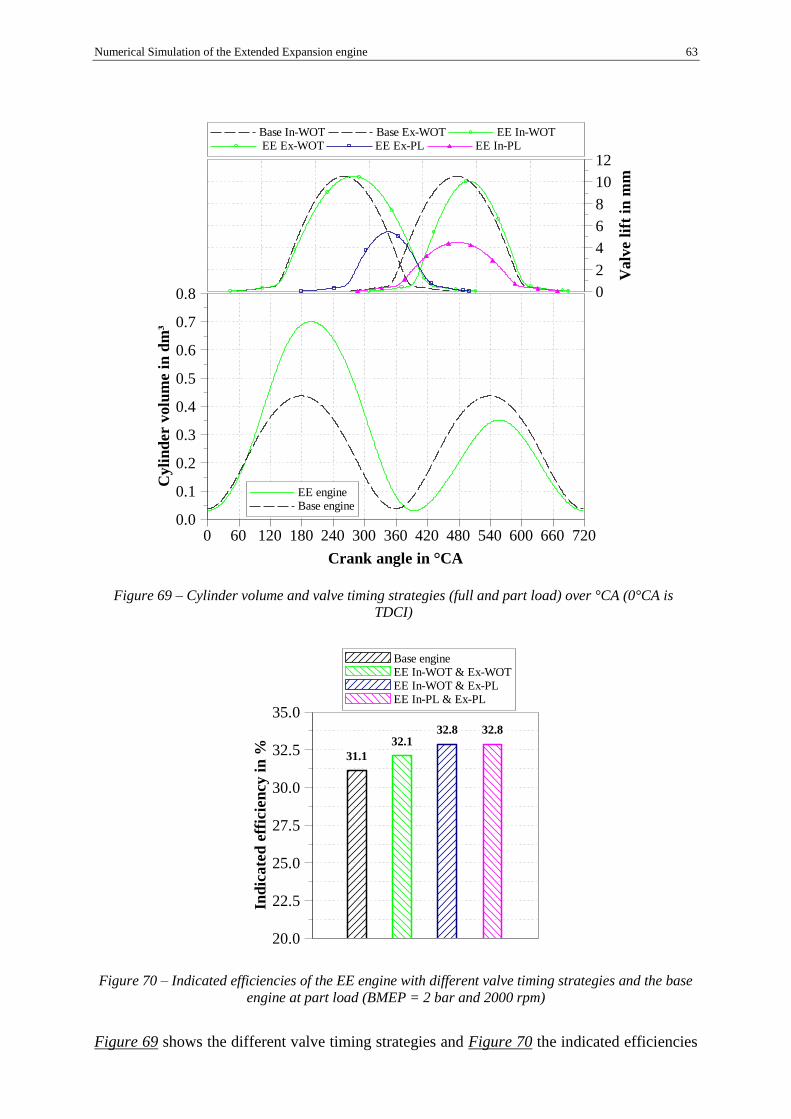
Numerical Simulation of the Extended Expansion engine 63
Figure 70 – Indicated efficiencies of the EE engine with different valve timing strategies and the base
engine at part load (BMEP = 2 bar and 2000 rpm)
Figure 69 shows the different valve timing strategies and Figure 70 the indicated efficiencies
Ind
ica
ted
eff
icie
ncy i
n %
20.0
22.5
25.0
27.5
30.0
32.5
35.0
Base engine EE In-WOT & Ex-WOT EE In-WOT & Ex-PL EE In-PL & Ex-PL
31.1
32.132.8 32.8
Figure 69 – Cylinder volume and valve timing strategies (full and part load) over °CA (0°CA is
TDCI)
Cyli
nd
er v
olu
me i
n d
m³
0.0
0.1
0.2
0.3
0.4
0.5
0.6
0.7
0.8
Crank angle in °CA
0 60 120 180 240 300 360 420 480 540 600 660 720
EE engine Base engine
Va
lve l
ift
in m
m
0
2
4
6
8
10
12
Base In-WOT Base Ex-WOT EE In-WOT EE Ex-WOT EE Ex-PL EE In-PL

64 Numerical Simulation of the Extended Expansion engine
for the base engine and the EE engine with full load valve timing and the efficiency-optimised
intake and exhaust valve timing. According to the simulation, the highest efficiency can be
reached with a late EVO (exhaust valve open) timing in combination with a short opening
duration. The base engine has an indicated efficiency of 31.1%. The EE engine with pure full
load valve timing achieves an efficiency of 32.1%. As a result of the modified exhaust valve
timing, the gas exchange losses can be reduced. This leads to an efficiency increase of 32.8%
for the variants EE In-WOT / Ex-PL and EE In-PL / Ex-PL. The simulation further indicates
that the intake valve timing has a minor influence on the EE part load efficiency. However, it
must be noted that the efficiency improvement of the EE engine variants is also based on the
load point shift due to the lower intake volume and the friction estimation. Nevertheless, the
efficiency dependency on the exhaust timing is clearly identifiable.
Figure 71 –GE loops of the EE engine with different valve timing strategies and the base engine at
part load (BMEP = 2 bar and 2000 rpm)
In Figure 71, pV-diagrams of the gas exchange loops of the base and the EE engine with the
different valve timing variants at BMEP = 2 bar and 2000 rpm are presented. The cylinder
charge amount and the CER have considerable impacts on the expansion pressure and, hence,
on the efficiency. Because of the lower charge mass due to throttling, the expansion end
pressure is under ambient pressure with a CER of 0.5. In Figure 71, the reason for the lower
efficiency of the EE engine using full load valve timing is obvious. The exhaust valve opens
before the piston reaches the bottom top dead centre. Due to the lower cylinder pressure,
exhaust gas flows back into the combustion chamber. This effect causes an additional
pumping loss which significantly increases the gas exchange losses. With a later exhaust
valve opening (EVO) the gas will be compressed before the exhaust valve opens. Although
the opening duration and the valve lift are shorter in comparison to full load valve timing,
which cause a cylinder pressure increase during the exhaust phase (between 300 and
500 cm³), the gas exchange losses are lower. A longer exhaust valve lift will probably further
improve the gas exchange, but this also leads to higher valve accelerations when using the
same valve opening duration. The intake characteristics of the EE engine valve timing
Cy
lin
der p
ress
ure i
n b
ar
0.0
0.5
1.0
1.5
2.0
Cylinder volume in dm³
0 0.1 0.2 0.3 0.4 0.5 0.6 0.7 0.8
Base engine EE In-WOT & Ex-WOT EE In-WOT & Ex-PL EE In-PL & Ex-PL
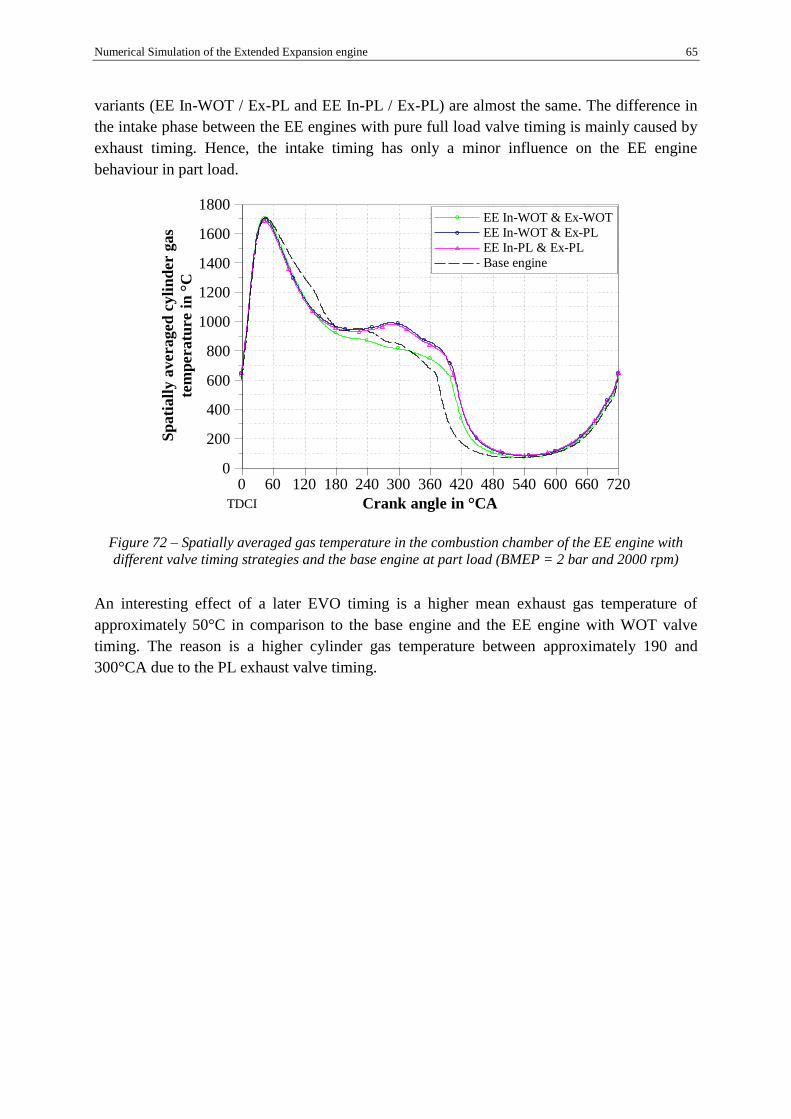
Numerical Simulation of the Extended Expansion engine 65
variants (EE In-WOT / Ex-PL and EE In-PL / Ex-PL) are almost the same. The difference in
the intake phase between the EE engines with pure full load valve timing is mainly caused by
exhaust timing. Hence, the intake timing has only a minor influence on the EE engine
behaviour in part load.
Figure 72 – Spatially averaged gas temperature in the combustion chamber of the EE engine with
different valve timing strategies and the base engine at part load (BMEP = 2 bar and 2000 rpm)
An interesting effect of a later EVO timing is a higher mean exhaust gas temperature of
approximately 50°C in comparison to the base engine and the EE engine with WOT valve
timing. The reason is a higher cylinder gas temperature between approximately 190 and
300°CA due to the PL exhaust valve timing.
TDCI
Sp
ati
all
y a
vera
ged
cy
lin
der g
as
tem
peratu
re i
n °
C
0
200
400
600
800
1000
1200
1400
1600
1800
Crank angle in °CA
0 60 120 180 240 300 360 420 480 540 600 660 720
EE In-WOT & Ex-WOT
EE In-WOT & Ex-PL
EE In-PL & Ex-PL
Base engine
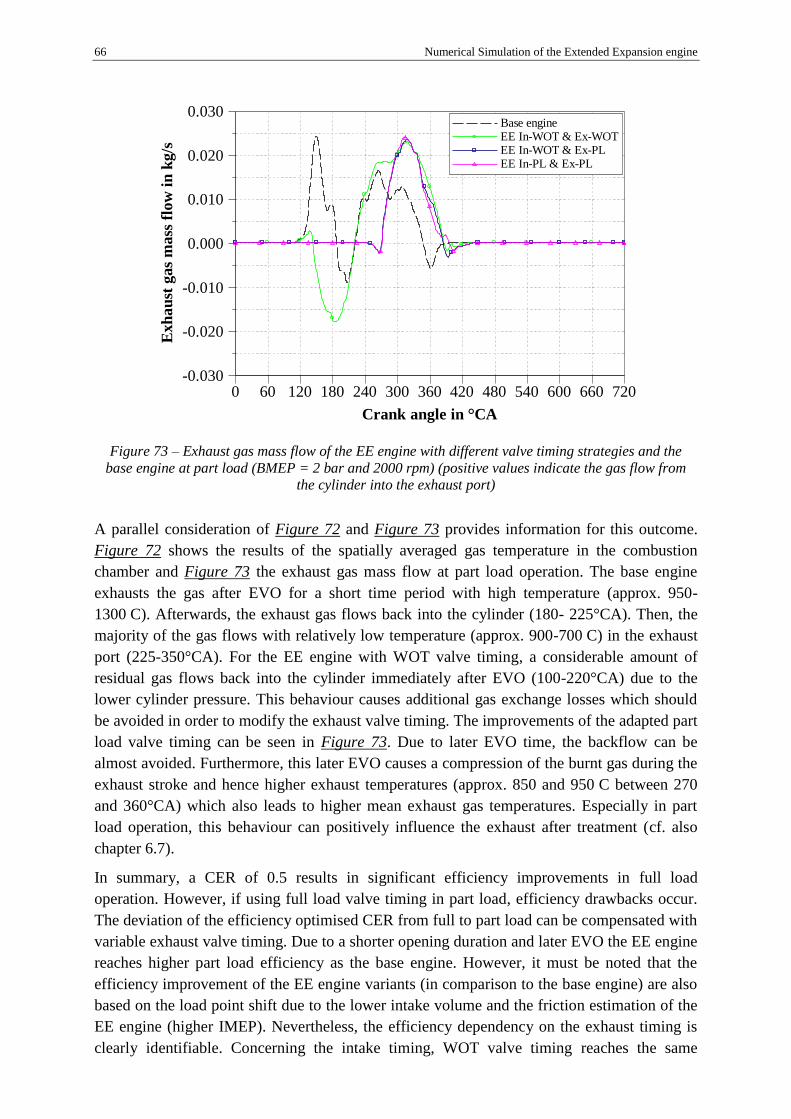
66 Numerical Simulation of the Extended Expansion engine
Figure 73 – Exhaust gas mass flow of the EE engine with different valve timing strategies and the
base engine at part load (BMEP = 2 bar and 2000 rpm) (positive values indicate the gas flow from
the cylinder into the exhaust port)
A parallel consideration of Figure 72 and Figure 73 provides information for this outcome.
Figure 72 shows the results of the spatially averaged gas temperature in the combustion
chamber and Figure 73 the exhaust gas mass flow at part load operation. The base engine
exhausts the gas after EVO for a short time period with high temperature (approx. 950-
1300 C). Afterwards, the exhaust gas flows back into the cylinder (180- 225°CA). Then, the
majority of the gas flows with relatively low temperature (approx. 900-700 C) in the exhaust
port (225-350°CA). For the EE engine with WOT valve timing, a considerable amount of
residual gas flows back into the cylinder immediately after EVO (100-220°CA) due to the
lower cylinder pressure. This behaviour causes additional gas exchange losses which should
be avoided in order to modify the exhaust valve timing. The improvements of the adapted part
load valve timing can be seen in Figure 73. Due to later EVO time, the backflow can be
almost avoided. Furthermore, this later EVO causes a compression of the burnt gas during the
exhaust stroke and hence higher exhaust temperatures (approx. 850 and 950 C between 270
and 360°CA) which also leads to higher mean exhaust gas temperatures. Especially in part
load operation, this behaviour can positively influence the exhaust after treatment (cf. also
chapter 6.7).
In summary, a CER of 0.5 results in significant efficiency improvements in full load
operation. However, if using full load valve timing in part load, efficiency drawbacks occur.
The deviation of the efficiency optimised CER from full to part load can be compensated with
variable exhaust valve timing. Due to a shorter opening duration and later EVO the EE engine
reaches higher part load efficiency as the base engine. However, it must be noted that the
efficiency improvement of the EE engine variants (in comparison to the base engine) are also
based on the load point shift due to the lower intake volume and the friction estimation of the
EE engine (higher IMEP). Nevertheless, the efficiency dependency on the exhaust timing is
clearly identifiable. Concerning the intake timing, WOT valve timing reaches the same
Ex
ha
ust
ga
s m
ass
flo
w i
n k
g/s
-0.030
-0.020
-0.010
0.000
0.010
0.020
0.030
Crank angle in °CA
0 60 120 180 240 300 360 420 480 540 600 660 720
Base engine EE In-WOT & Ex-WOT EE In-WOT & Ex-PL EE In-PL & Ex-PL

Numerical Simulation of the Extended Expansion engine 67
indicated efficiency as the investigated intake PL valve timing. Hence, for this PL point
(BMEP = 2 bar and 2000 rpm) intake WOT timing is sufficient. Additionally, it is
conceivable to de-throttle the intake path in order to further reduce the gas exchange losses in
part load. This measure is state-of-the-art for conventional SI engines and also proven in
series applications. Hence, de-throttling represents another possibility to further improve the
efficiency for an Atkinson engine in part load. In the next chapter this topic will be
investigated in more detail.
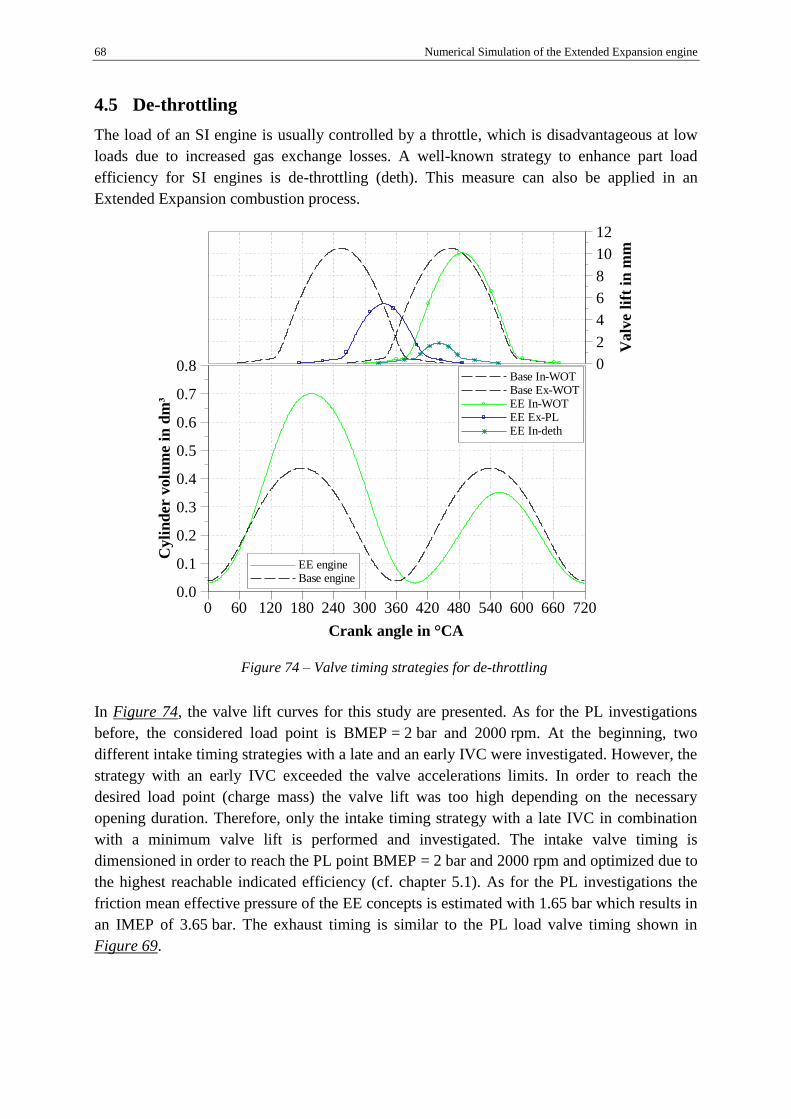
68 Numerical Simulation of the Extended Expansion engine
4.5 De-throttling
The load of an SI engine is usually controlled by a throttle, which is disadvantageous at low
loads due to increased gas exchange losses. A well-known strategy to enhance part load
efficiency for SI engines is de-throttling (deth). This measure can also be applied in an
Extended Expansion combustion process.
Figure 74 – Valve timing strategies for de-throttling
In Figure 74, the valve lift curves for this study are presented. As for the PL investigations
before, the considered load point is BMEP = 2 bar and 2000 rpm. At the beginning, two
different intake timing strategies with a late and an early IVC were investigated. However, the
strategy with an early IVC exceeded the valve accelerations limits. In order to reach the
desired load point (charge mass) the valve lift was too high depending on the necessary
opening duration. Therefore, only the intake timing strategy with a late IVC in combination
with a minimum valve lift is performed and investigated. The intake valve timing is
dimensioned in order to reach the PL point BMEP = 2 bar and 2000 rpm and optimized due to
the highest reachable indicated efficiency (cf. chapter 5.1). As for the PL investigations the
friction mean effective pressure of the EE concepts is estimated with 1.65 bar which results in
an IMEP of 3.65 bar. The exhaust timing is similar to the PL load valve timing shown in
Figure 69.
Cy
lin
der v
olu
me i
n d
m³
0.0
0.1
0.2
0.3
0.4
0.5
0.6
0.7
0.8
Crank angle in °CA
0 60 120 180 240 300 360 420 480 540 600 660 720
EE engine Base engine
Valv
e l
ift
in m
m
0
2
4
6
8
10
12
Base In-WOT Base Ex-WOT EE In-WOT EE Ex-PL EE In-deth

Numerical Simulation of the Extended Expansion engine 69
Figure 75 – GE loops of the EE engine (In-deth & Ex-PL and In-WOT & Ex-PL) and the base engine
(In-WOT / Ex-WOT) at part load (BMEP = 2 bar and 2000 rpm)
In Figure 75, the pV-diagrams of the gas exchange loops of the de-throttled version (EE In-
deth & Ex-PL) in comparison to the PL timing EE In-WOT & Ex-PL (cf. also Figure 71) and
the base engine are shown. Due to the modified intake timing, the gas exchange losses during
the intake phase are clearly lower. The gas exchange losses during the exhaust phase between
EE In-deth & Ex-PL and EE In-WOT & Ex-PL are quite similar due to the same exhaust
valve timing.
Figure 76 – Indicated part load efficiency of the EE engine (In-deth & Ex-PL and In-WOT & Ex-PL)
and the base engine (In-WOT & Ex-WOT) at part load (BMEP = 2 bar and 2000 rpm)
In Figure 76, the indicated efficiencies with de-throttling (EE In-deth & Ex-PL) in
comparison to the PL timing EE In-WOT & Ex-PL and the base engine are presented. Due to
de-throttling, a further efficiency increase of approximately 1.2% could be gained in
Cyli
nd
er p
ress
ure i
n b
ar
0.0
0.5
1.0
1.5
2.0
Cylinder volume in dm³
0 0.1 0.2 0.3 0.4 0.5 0.6 0.7 0.8
EE In-deth & Ex-PL
EE In-WOT & Ex-PL
Base engine
Ind
ica
ted
eff
icie
ncy i
n %
20.0
22.5
25.0
27.5
30.0
32.5
35.0
Base engine EE In-WOT & Ex-PL EE In-deth & Ex-PL
31.1
32.833.2

70 Numerical Simulation of the Extended Expansion engine
comparison to the EE PL timing. The improvements are solely due to the reduction of the
intake-based gas exchange losses. Summarising, similar to conventional engines, the
efficiency of an EE engine can also be increased with de-throttling. This measure is also
proven by experimental tests (cf. chapter 6).

Numerical Simulation of the Extended Expansion engine 71
4.6 Cylinder deactivation
Previous results show high efficiency potentials especially in full load operation. To take
advantage of this behaviour, investigations concerning cylinder deactivation (load point shift)
in part load are conducted. The simulation boundaries are again based on chapter 4.1
(Simulation methodology and Starting basis) and 4.4 (Part load behaviour). However, in
contrast to the simulations before, another boundary condition is introduced: the 2nd
cylinder
is motored with closed valves while the 1st cylinder operates with twice the load. A higher
load for the fired cylinder has an impact on exhaust timing which further influences engine
efficiency.
Denotation Intake timing Exhaust timing
1 Cyl deact Ex-WOT EE In-WOT EE Ex-WOT
2 Cyl deact Ex-PL EE In-WOT EE Ex-PL
3 Cyl deact Ex-PL / early EVO EE In-WOT EE Ex-PL / early EVO
Table 6 – Investigated valve timing variants for cylinder deactivation
For the following investigations, three valve timing variants (see Table 6) including exhaust
WOT & PL timing (Figure 69) and an additional exhaust timing strategy with an earlier EVO
and a larger opening duration (EE Ex-PL / early EVO) are simulated. The intake timing is
similar for all variants and based on the WOT timing of the EE engine according to Figure
69. All considered valve timings can be seen in Figure 77.
Figure 77 – EE valve timing variants for cylinder deactivation over °CA (0°CA is TDCI)
The researched load point for the EE engine is BMEP = 2 bar and 2000 rpm. The FMEP is
again estimated with 1.65 bar (cf. chapter 4.4). In Figure 78, the pV-diagram of the gas
exchange loops and in Figure 79, the exhaust gas mass flow is shown.
Va
lve l
ift
in m
m
0
2
4
6
8
10
12
Crank angle in °CA
0 60 120 180 240 300 360 420 480 540 600 660 720
EE In-WOT EE Ex-WOT EE Ex-PL EE Ex-PL / early EVO

72 Numerical Simulation of the Extended Expansion engine
Figure 78 – GE loops of the EE engine at cylinder deactivation at part load (BMEP = 2 bar and
2000 rpm)
Figure 79 – Exhaust gas mass flow of the EE engine at cylinder deactivation (BMEP=2 bar and
2000 rpm)
Despite the higher load, the efficiency maximum cannot be reached with pure full load timing
(intake and exhaust). Using WOT exhaust timing, the valve opens earlier and due to the
cylinder pressure conditions (pressure at EVO is lower than ambient pressure) a backflow
from the exhaust port into the cylinder occur (see Figure 79 – EE Ex-WOT between 135 and
220°CA). During the subsequent exhaust phase, the cylinder pressure is slightly higher than
ambient pressure. Hence, the backflow causes a pressure increase and, therefore, additional
gas exchange losses. To avoid the backflow, an adaption of the EVO time is necessary. The
Cy
lin
der p
ress
ure i
n b
ar
0.0
0.5
1.0
1.5
2.0
Cylinder volume in dm³
0 0.1 0.2 0.3 0.4 0.5 0.6 0.7 0.8
EE Ex-WOT EE Ex-PL EE Ex-PL / early EVO
Ex
ha
ust
ga
s m
ass
flo
w i
n k
g/s
-0.020
-0.010
0.000
0.010
0.020
0.030
0.040
Crank angle in °CA
0 60 120 180 240 300 360 420 480 540 600 660 720
EE Ex-WOT EE Ex-PL EE Ex-PL / early EVO
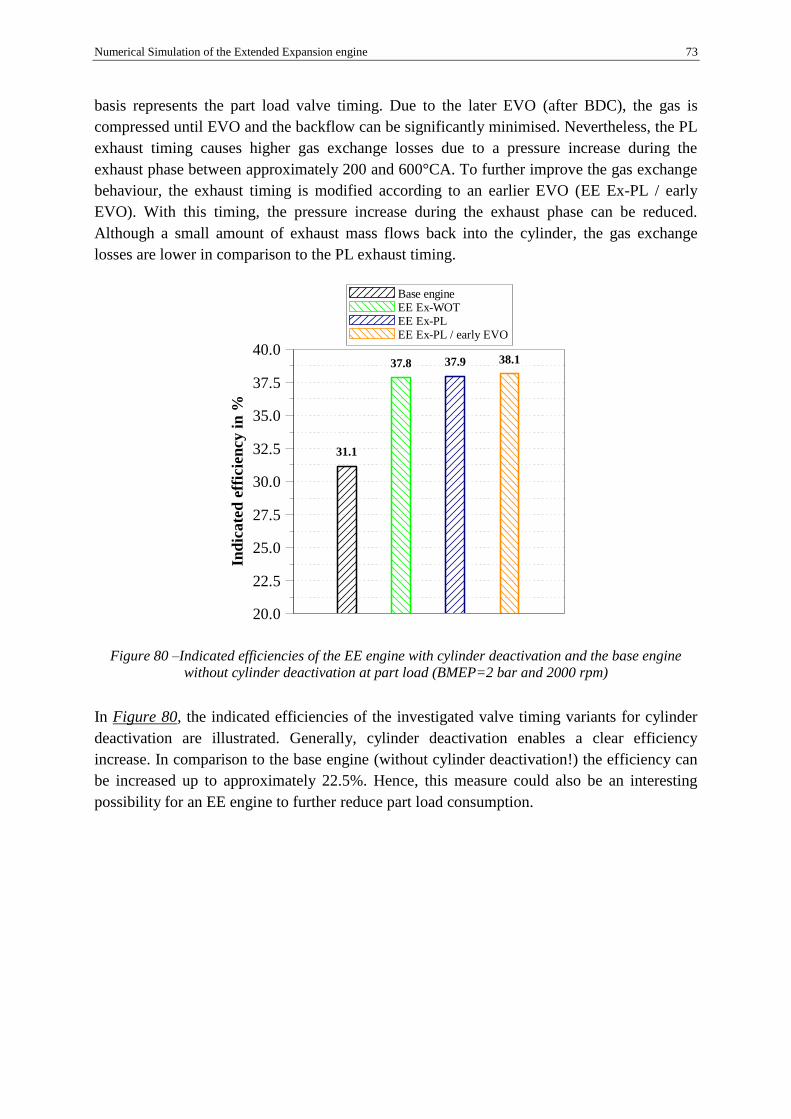
Numerical Simulation of the Extended Expansion engine 73
basis represents the part load valve timing. Due to the later EVO (after BDC), the gas is
compressed until EVO and the backflow can be significantly minimised. Nevertheless, the PL
exhaust timing causes higher gas exchange losses due to a pressure increase during the
exhaust phase between approximately 200 and 600°CA. To further improve the gas exchange
behaviour, the exhaust timing is modified according to an earlier EVO (EE Ex-PL / early
EVO). With this timing, the pressure increase during the exhaust phase can be reduced.
Although a small amount of exhaust mass flows back into the cylinder, the gas exchange
losses are lower in comparison to the PL exhaust timing.
Figure 80 –Indicated efficiencies of the EE engine with cylinder deactivation and the base engine
without cylinder deactivation at part load (BMEP=2 bar and 2000 rpm)
In Figure 80, the indicated efficiencies of the investigated valve timing variants for cylinder
deactivation are illustrated. Generally, cylinder deactivation enables a clear efficiency
increase. In comparison to the base engine (without cylinder deactivation!) the efficiency can
be increased up to approximately 22.5%. Hence, this measure could also be an interesting
possibility for an EE engine to further reduce part load consumption.
Ind
ica
ted
eff
icie
ncy i
n %
20.0
22.5
25.0
27.5
30.0
32.5
35.0
37.5
40.0
Base engine EE Ex-WOT EE Ex-PL EE Ex-PL / early EVO
31.1
37.8 37.9 38.1
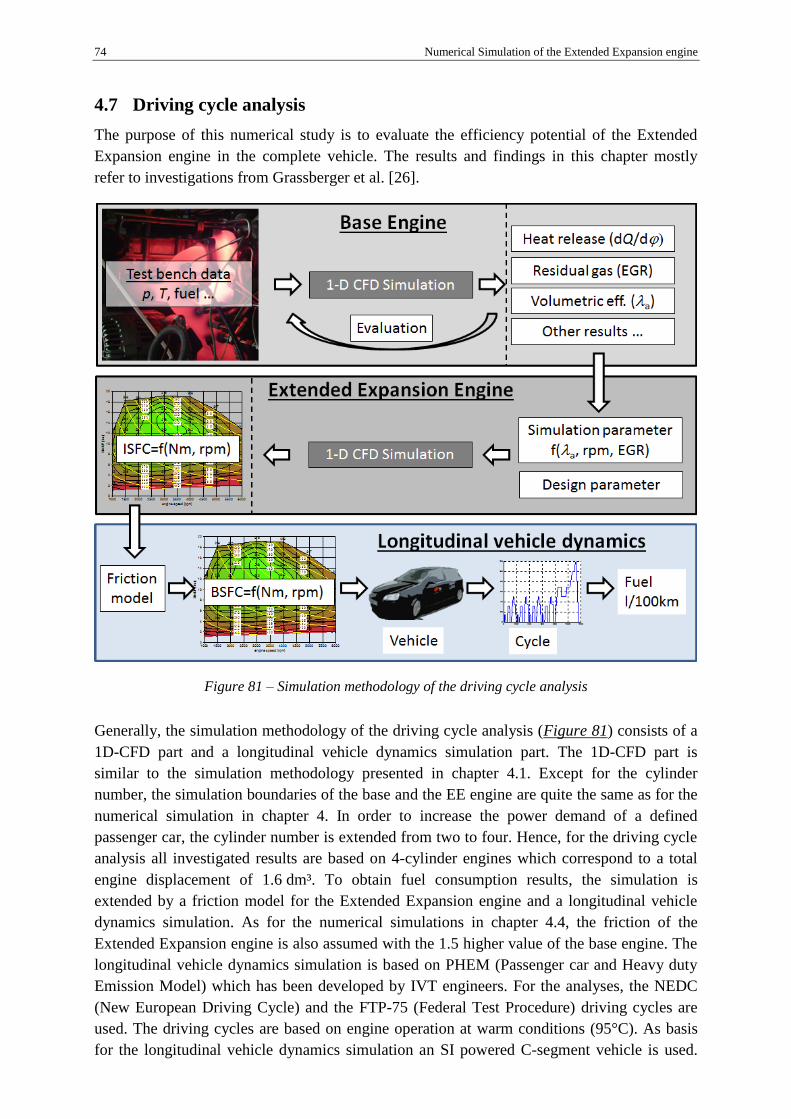
74 Numerical Simulation of the Extended Expansion engine
4.7 Driving cycle analysis
The purpose of this numerical study is to evaluate the efficiency potential of the Extended
Expansion engine in the complete vehicle. The results and findings in this chapter mostly
refer to investigations from Grassberger et al. [26].
Figure 81 – Simulation methodology of the driving cycle analysis
Generally, the simulation methodology of the driving cycle analysis (Figure 81) consists of a
1D-CFD part and a longitudinal vehicle dynamics simulation part. The 1D-CFD part is
similar to the simulation methodology presented in chapter 4.1. Except for the cylinder
number, the simulation boundaries of the base and the EE engine are quite the same as for the
numerical simulation in chapter 4. In order to increase the power demand of a defined
passenger car, the cylinder number is extended from two to four. Hence, for the driving cycle
analysis all investigated results are based on 4-cylinder engines which correspond to a total
engine displacement of 1.6 dm³. To obtain fuel consumption results, the simulation is
extended by a friction model for the Extended Expansion engine and a longitudinal vehicle
dynamics simulation. As for the numerical simulations in chapter 4.4, the friction of the
Extended Expansion engine is also assumed with the 1.5 higher value of the base engine. The
longitudinal vehicle dynamics simulation is based on PHEM (Passenger car and Heavy duty
Emission Model) which has been developed by IVT engineers. For the analyses, the NEDC
(New European Driving Cycle) and the FTP-75 (Federal Test Procedure) driving cycles are
used. The driving cycles are based on engine operation at warm conditions (95°C). As basis
for the longitudinal vehicle dynamics simulation an SI powered C-segment vehicle is used.

Numerical Simulation of the Extended Expansion engine 75
The main technical data of the vehicle are listed in Table 7.
Vehicle data
Vehicle mass kg 1280
Transmission - Manual
Number of gears - 6
Drag coefficient - 0.3
Cross sectional area m² 2.2
Table 7 – Technical data of the reference vehicle
In the following, five engine concepts including a combination with cylinder deactivation for
load point shifting and variable valve timing for minimizing gas exchange losses are
investigated: SI-conventional (Base), SI-conventional with cylinder deactivation (Base cyl.
deact.), SI Extended Expansion (EE), SI Extended Expansion with cylinder deactivation (EE
cyl. deact.) and SI Extended Expansion with two-step variable exhaust valve lift (EE var.
exhaust timing).
4.7.1 Brake specific fuel consumption results (BSFC maps)
As mentioned before, the BSFC results of the EE concepts are based on the 1.5 times higher
FMEP than for the base engine. Figure 82 shows the brake specific fuel consumption (BSFC)
map of the base engine and Figure 83 the BSFC map of the EE engine without valve train
variability. The operation points of the NEDC are marked with circles and the triangles
represent the FTP-75 cycle. The base engine is designed for high performance applications
with a speed range of up to 8000 rpm. This engine has its optimum BSFC of 245 g/kWh
(relates to an effective efficiency of approx. 35% with a lower calorific value of 42 MJ/kg) at
5000 rpm and full load. The Extended Expansion leads to a minimum BSFC of 205 g/kWh
(effective efficiency approx. 41.8%) which means an efficiency improvement of 16.3%.
The CER is set to 0.5 for low fuel consumption at full load. However, this lower CER is
disadvantageous for fuel consumption in part load operation because of additional pumping
losses during the exhaust phase (cf. also Figure 71). With an equal intake displacement the
EE engine has higher efficiencies at high loads and lower efficiencies at low loads compared
to the base engine. Because of the higher full load efficiency, the EE engine needs less intake
mass to reach the same nominal power. Furthermore, the reduced intake displacement of the
EE engine leads to a load point shift to an operating range with lower fuel consumption. As a
result, the EE engine without valve train variability achieves lower BSFC also in part load
operation compared to the base engine. Additionally, there is a possibility of further efficiency
improvement by avoiding enrichment operation at WOT due to the lower exhaust gas
temperature in case of the EE engine (cf. also chapter 6). However, in the following results
this is not considered.
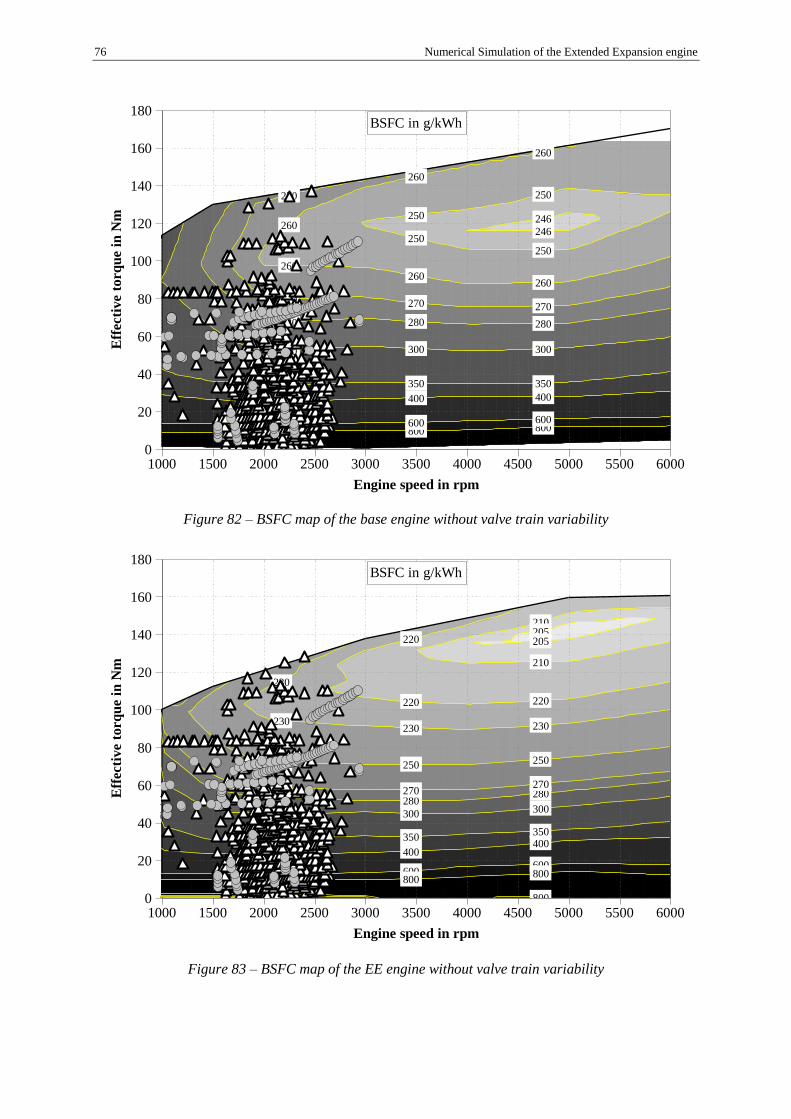
76 Numerical Simulation of the Extended Expansion engine
Figure 82 – BSFC map of the base engine without valve train variability
Figure 83 – BSFC map of the EE engine without valve train variability
Eff
ecti
ve t
orq
ue i
n N
m
0
20
40
60
80
100
120
140
160
180
Engine speed in rpm
1000 1500 2000 2500 3000 3500 4000 4500 5000 5500 6000
800 800 800600 600 600
400 400 400350 350 350
300 300 300
280 280 280
270
270 270 270
260
260
260
260
260
260
250
250
250
250
246
246
BSFC in g/kWhE
ffecti
ve t
orq
ue i
n N
m
0
20
40
60
80
100
120
140
160
180
Engine speed in rpm
1000 1500 2000 2500 3000 3500 4000 4500 5000 5500 6000400
400 400400
600
600 600600
800
800 800800
800
280 280280
250 250 250
230
230230 230
220
220
220
210
210205205
350 350350
270 270270
300 300 300
BSFC in g/kWh
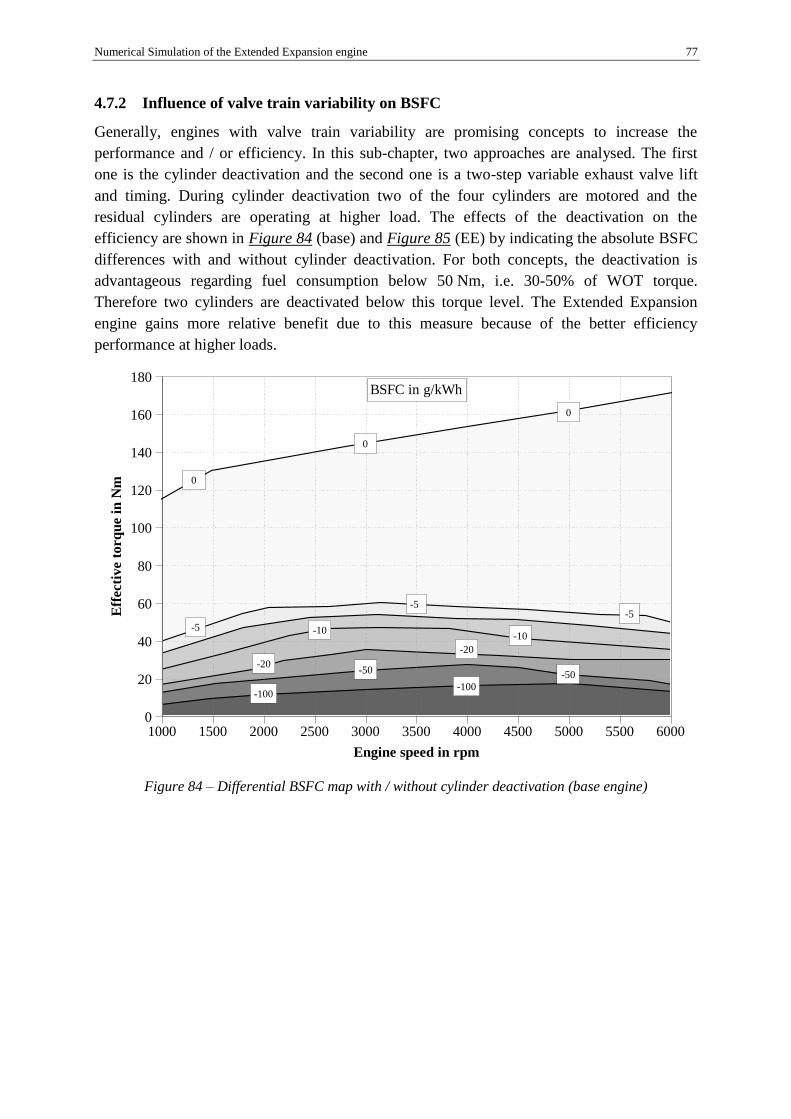
Numerical Simulation of the Extended Expansion engine 77
4.7.2 Influence of valve train variability on BSFC
Generally, engines with valve train variability are promising concepts to increase the
performance and / or efficiency. In this sub-chapter, two approaches are analysed. The first
one is the cylinder deactivation and the second one is a two-step variable exhaust valve lift
and timing. During cylinder deactivation two of the four cylinders are motored and the
residual cylinders are operating at higher load. The effects of the deactivation on the
efficiency are shown in Figure 84 (base) and Figure 85 (EE) by indicating the absolute BSFC
differences with and without cylinder deactivation. For both concepts, the deactivation is
advantageous regarding fuel consumption below 50 Nm, i.e. 30-50% of WOT torque.
Therefore two cylinders are deactivated below this torque level. The Extended Expansion
engine gains more relative benefit due to this measure because of the better efficiency
performance at higher loads.
Figure 84 – Differential BSFC map with / without cylinder deactivation (base engine)
Eff
ecti
ve t
orq
ue i
n N
m
0
20
40
60
80
100
120
140
160
180
Engine speed in rpm
1000 1500 2000 2500 3000 3500 4000 4500 5000 5500 6000
BSFC in g/kWh
-5
-10
-20
-100-100
-50 -50-20
-5-10
0
0
0
-5

78 Numerical Simulation of the Extended Expansion engine
Figure 85 – Differential BSFC map with / without cylinder deactivation (EE engine)
The second measure to improve part load efficiency is the usage of variable exhaust valve lift
timing (lift and phase). Within this study, a two-step valve timing mechanism is investigated.
In part load operation, the EE engine with WOT valve timing has additional pumping losses
during the exhaust phase (cf. also Figure 71). To reduce this loss, the exhaust timing is
modified. Compared to the WOT valve characteristics the PL EVO (exhaust valve opening) is
later and the opening duration is shorter (cf. Figure 69). The intake valve lift and timing
remain unchanged. The variation of the exhaust timing (lift and phase) is performed and
simulated in order to find a configuration to improve the efficiency at 25 Nm effective torque
(corresponds to approx. 2 bar BMEP). Figure 86 shows the absolute BSFC improvement of
the EE engine with this two-step valve timing mechanism.
Eff
ecti
ve t
orq
ue i
n N
m
0
20
40
60
80
100
120
140
160
180
Engine speed in rpm
1000 1500 2000 2500 3000 3500 4000 4500 5000 5500 6000
BSFC in g/kWh
-5-10
-20
-100
-100
-50
-50
-20
-5-10
0
0
0
-5
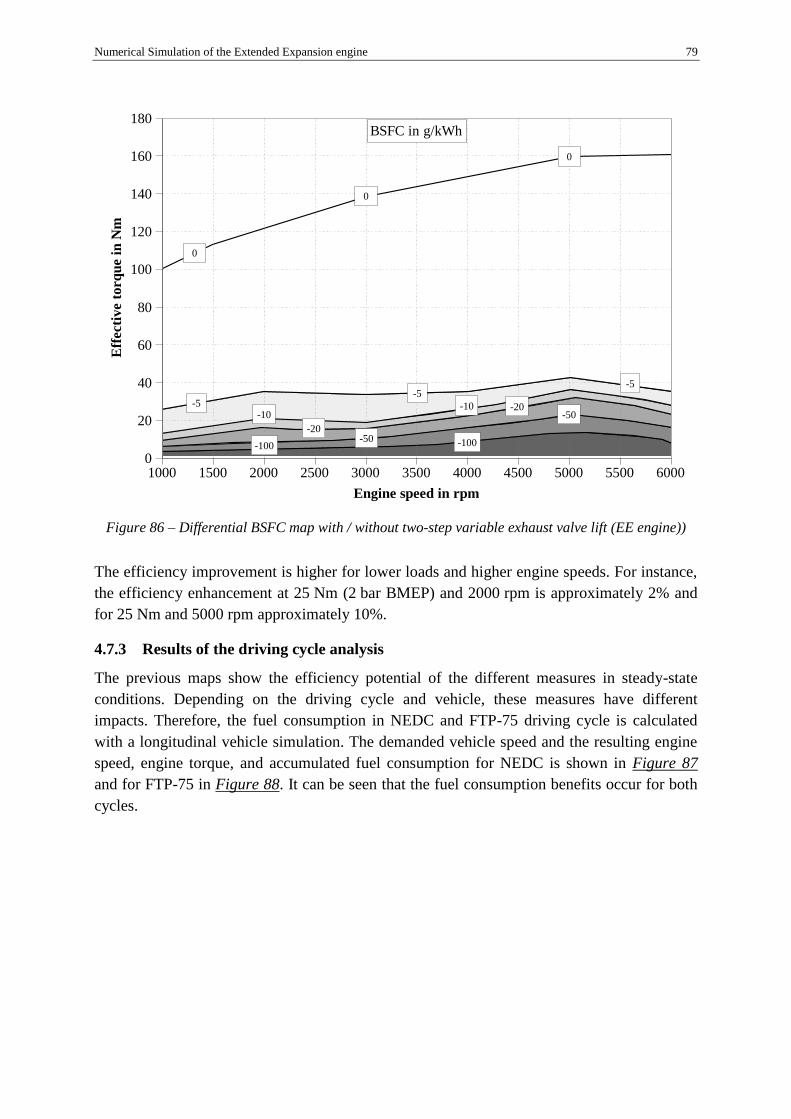
Numerical Simulation of the Extended Expansion engine 79
Figure 86 – Differential BSFC map with / without two-step variable exhaust valve lift (EE engine))
The efficiency improvement is higher for lower loads and higher engine speeds. For instance,
the efficiency enhancement at 25 Nm (2 bar BMEP) and 2000 rpm is approximately 2% and
for 25 Nm and 5000 rpm approximately 10%.
4.7.3 Results of the driving cycle analysis
The previous maps show the efficiency potential of the different measures in steady-state
conditions. Depending on the driving cycle and vehicle, these measures have different
impacts. Therefore, the fuel consumption in NEDC and FTP-75 driving cycle is calculated
with a longitudinal vehicle simulation. The demanded vehicle speed and the resulting engine
speed, engine torque, and accumulated fuel consumption for NEDC is shown in Figure 87
and for FTP-75 in Figure 88. It can be seen that the fuel consumption benefits occur for both
cycles.
Eff
ecti
ve t
orq
ue i
n N
m
0
20
40
60
80
100
120
140
160
180
Engine speed in rpm
1000 1500 2000 2500 3000 3500 4000 4500 5000 5500 6000
BSFC in g/kWh
-5
-10-20
-100 -100-50
-50
-20
-5 -10
0
0
0
-5
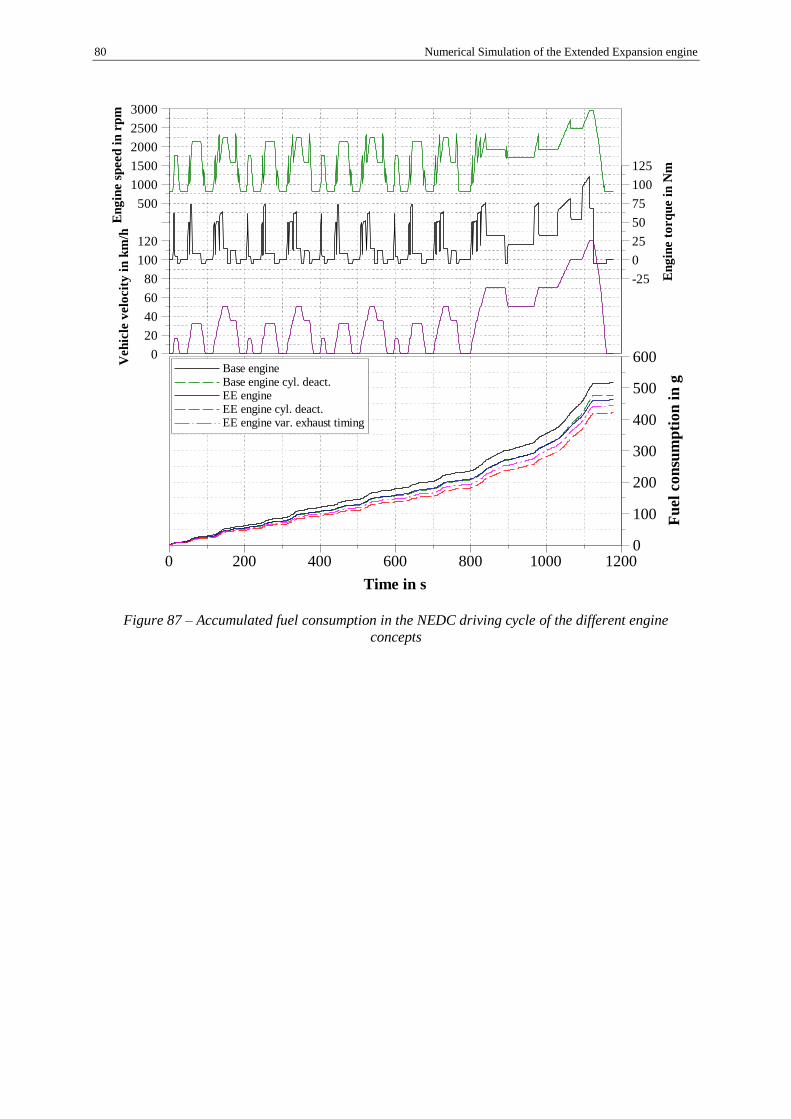
80 Numerical Simulation of the Extended Expansion engine
Figure 87 – Accumulated fuel consumption in the NEDC driving cycle of the different engine
concepts
Time in s
0 200 400 600 800 1000 1200
Fu
el
co
nsu
mp
tion
in
g
0
100
200
300
400
500
600 Base engine Base engine cyl. deact. EE engine EE engine cyl. deact. EE engine var. exhaust timing
En
gin
e t
orq
ue i
n N
m
-25
0
25
50
75
100
125
En
gin
e s
peed
in
rp
m
500
1000
1500
2000
2500
3000V
eh
icle
velo
cit
y i
n k
m/h
0
20
40
60
80
100
120
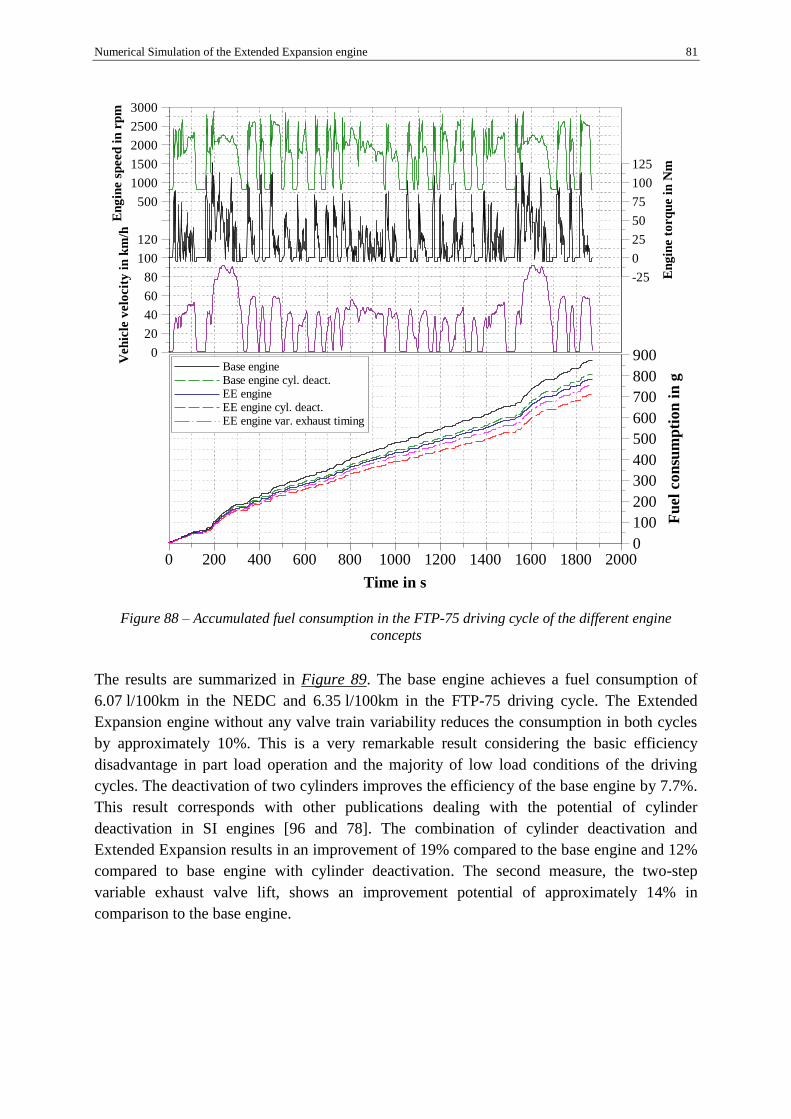
Numerical Simulation of the Extended Expansion engine 81
Figure 88 – Accumulated fuel consumption in the FTP-75 driving cycle of the different engine
concepts
The results are summarized in Figure 89. The base engine achieves a fuel consumption of
6.07 l/100km in the NEDC and 6.35 l/100km in the FTP-75 driving cycle. The Extended
Expansion engine without any valve train variability reduces the consumption in both cycles
by approximately 10%. This is a very remarkable result considering the basic efficiency
disadvantage in part load operation and the majority of low load conditions of the driving
cycles. The deactivation of two cylinders improves the efficiency of the base engine by 7.7%.
This result corresponds with other publications dealing with the potential of cylinder
deactivation in SI engines [96 and 78]. The combination of cylinder deactivation and
Extended Expansion results in an improvement of 19% compared to the base engine and 12%
compared to base engine with cylinder deactivation. The second measure, the two-step
variable exhaust valve lift, shows an improvement potential of approximately 14% in
comparison to the base engine.
Time in s
0 200 400 600 800 1000 1200 1400 1600 1800 2000
Fu
el
co
nsu
mp
tion
in
g
0
100
200
300
400
500
600
700
800
900 Base engine Base engine cyl. deact. EE engine EE engine cyl. deact. EE engine var. exhaust timing
En
gin
e t
orq
ue i
n N
m
-25
0
25
50
75
100
125
En
gin
e s
peed
in
rp
m
500
1000
1500
2000
2500
3000
Veh
icle
velo
cit
y i
n k
m/h
0
20
40
60
80
100
120
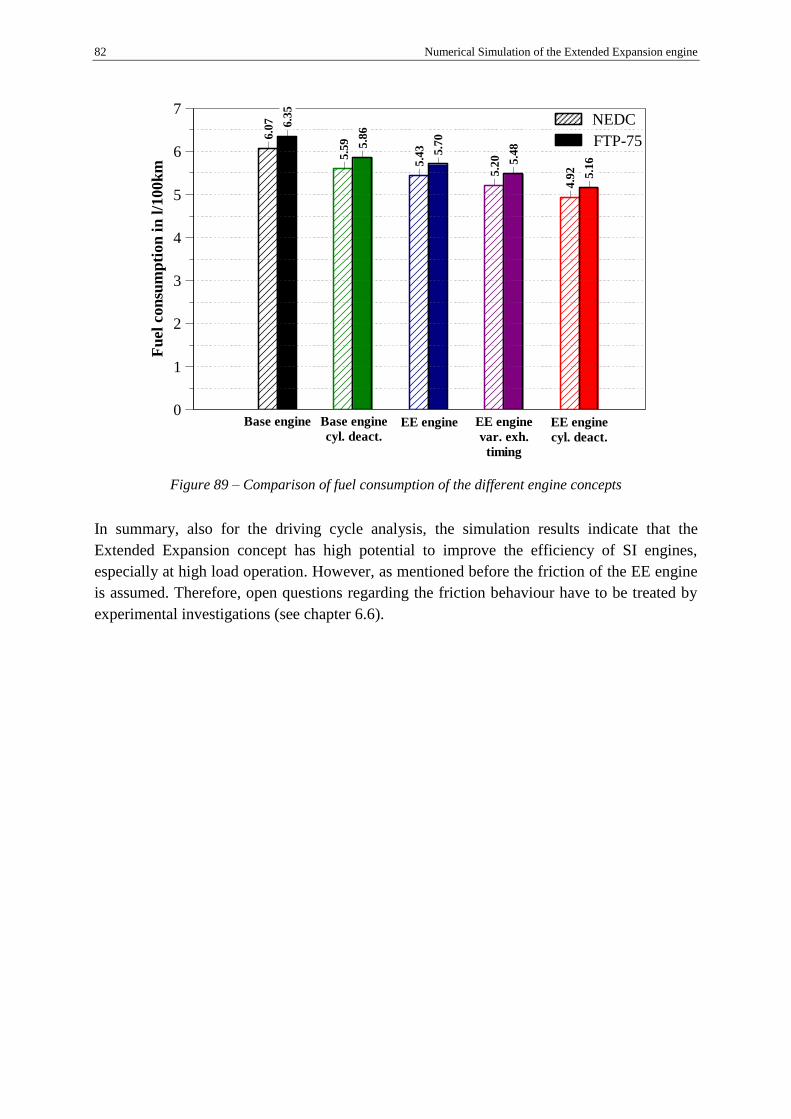
82 Numerical Simulation of the Extended Expansion engine
Figure 89 – Comparison of fuel consumption of the different engine concepts
In summary, also for the driving cycle analysis, the simulation results indicate that the
Extended Expansion concept has high potential to improve the efficiency of SI engines,
especially at high load operation. However, as mentioned before the friction of the EE engine
is assumed. Therefore, open questions regarding the friction behaviour have to be treated by
experimental investigations (see chapter 6.6).
NEDC
FTP-75
Base engine
cyl. deact.EE engine
cyl. deact.
EE engine EE engine
var. exh.
timing
Fu
el
con
sum
pti
on
in
l/1
00
km
0
1
2
3
4
5
6
7
6.0
7
5.5
9
5.4
3
5.2
0
4.9
2
6.3
5
5.8
6
5.7
0
5.4
8
5.1
6
Base engine
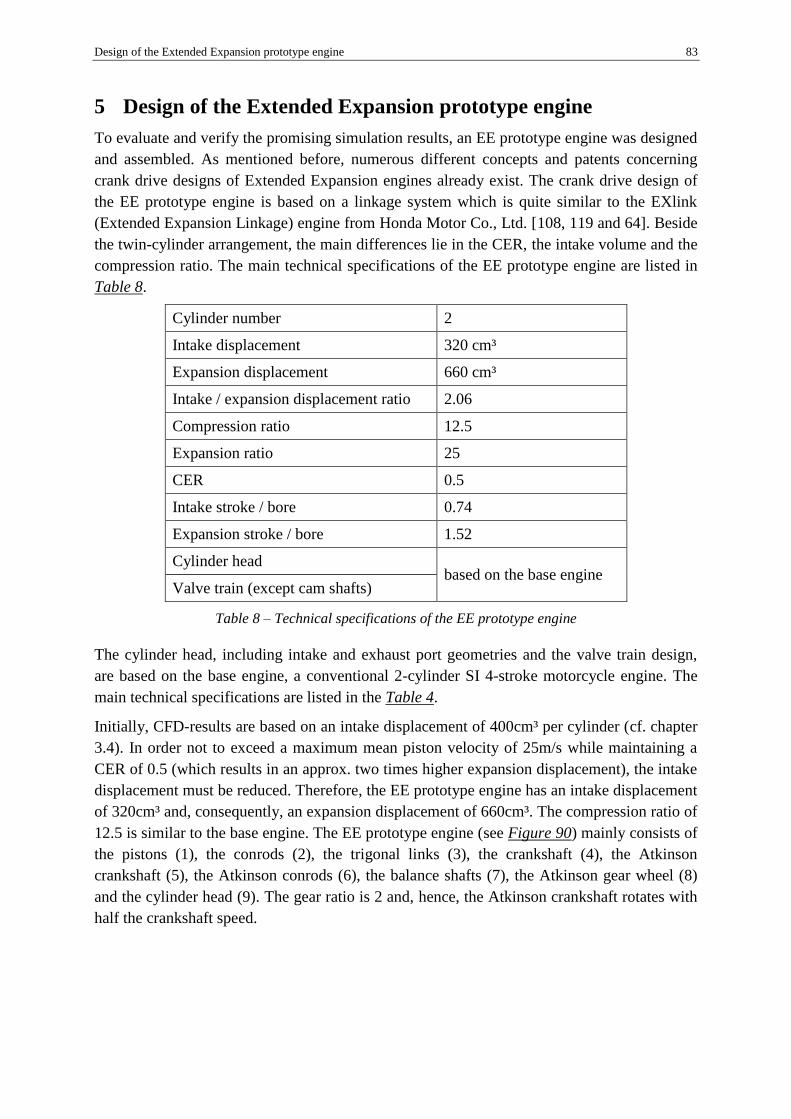
Design of the Extended Expansion prototype engine 83
5 Design of the Extended Expansion prototype engine
To evaluate and verify the promising simulation results, an EE prototype engine was designed
and assembled. As mentioned before, numerous different concepts and patents concerning
crank drive designs of Extended Expansion engines already exist. The crank drive design of
the EE prototype engine is based on a linkage system which is quite similar to the EXlink
(Extended Expansion Linkage) engine from Honda Motor Co., Ltd. [108, 119 and 64]. Beside
the twin-cylinder arrangement, the main differences lie in the CER, the intake volume and the
compression ratio. The main technical specifications of the EE prototype engine are listed in
Table 8.
Cylinder number 2
Intake displacement 320 cm³
Expansion displacement 660 cm³
Intake / expansion displacement ratio 2.06
Compression ratio 12.5
Expansion ratio 25
CER 0.5
Intake stroke / bore 0.74
Expansion stroke / bore 1.52
Cylinder head based on the base engine
Valve train (except cam shafts)
Table 8 – Technical specifications of the EE prototype engine
The cylinder head, including intake and exhaust port geometries and the valve train design,
are based on the base engine, a conventional 2-cylinder SI 4-stroke motorcycle engine. The
main technical specifications are listed in the Table 4.
Initially, CFD-results are based on an intake displacement of 400cm³ per cylinder (cf. chapter
3.4). In order not to exceed a maximum mean piston velocity of 25m/s while maintaining a
CER of 0.5 (which results in an approx. two times higher expansion displacement), the intake
displacement must be reduced. Therefore, the EE prototype engine has an intake displacement
of 320cm³ and, consequently, an expansion displacement of 660cm³. The compression ratio of
12.5 is similar to the base engine. The EE prototype engine (see Figure 90) mainly consists of
the pistons (1), the conrods (2), the trigonal links (3), the crankshaft (4), the Atkinson
crankshaft (5), the Atkinson conrods (6), the balance shafts (7), the Atkinson gear wheel (8)
and the cylinder head (9). The gear ratio is 2 and, hence, the Atkinson crankshaft rotates with
half the crankshaft speed.

84 Design of the Extended Expansion prototype engine
Figure 90 – EE prototype engine layout
The piston motion is based on a linkage system crank train arrangement. As mentioned in
sub-chapter 3.3.1, this specific engine layout results in a characteristic piston motion based on
the superposition of two oscillations with different amplitudes, frequencies and phases. The
phase shift between the crank shaft and the Atkinson crank shaft is 90° and the frequency is
0.5 times of the crank shaft basis movement. This results in a periodic motion over 720°CA
with different amplitudes for the compression and the expansion stroke.
Basically, the piston motion is influenced by 13 geometrical and technological parameters like
angles and lengths as well as the gear ratio. On the one hand, this leads to a high number of
different possible geometric variations and therefore to high complexity. On the other hand,
the shape of the piston stroke curves can be modified and optimised in a targeted manner. To
investigate the piston movement a kinematic study based on numerical models is generated
which allows to analyse the piston stroke and the component movement. The aim of the
kinematic study is to find a technologically feasible piston movement regarding defined
1
2
3
4
5
7 8
9
6

Design of the Extended Expansion prototype engine 85
geometrical and technological requirements. These requirements include, beside the target
engine requirements listed in chapter 3.5 and the main technical specifications in Table 8,
further specific technological and geometrical requirements like (cf. Figure 91):
Figure 91 – Piston motion optimisation process
In order to fulfil all defined simulation boundaries, an optimisation process integrating an
adapted methodology and calculation algorithm is performed, as shown in Figure 91. Within
this process collision checks between all moving parts as well as checks of critical crank train
bearing forces are also conducted. Regarding the verification of critical bearing loads, an
engineering evaluation is initially done, in order to compare occurring loads with crank train
load limits of conventional series engine. The numerical kinematic simulations are done with
MATLAB.
The final piston strokes for both cylinders are presented in Figure 92. The firing interval
between cylinder 1 and 2 is 360°CA. The characteristic TDC offset between the EE engine in
comparison to the base engine (conventional crank train) is clearly identifiable (cf. also
chapter 3.3.1).
NO
Check:
Bearing loads
critical
Parameter
variation
Check:
Piston motion
meets
requirements?
Check:
Collision
between
moving parts
Appropriate
piston motion
YES
Requirements:
• Mean piston velocity < 25m/s
• Continuous course of the piston
motion with ideally one inflection
point between TDC and BDC
• Same compression ratio and intake
volume for both cylinders
• Same CER for both cylinders
NO
YES

86 Design of the Extended Expansion prototype engine
Figure 92 – EE prototype engine piston motion
The entire engine is designed with regard to structural stress and fatigue strength limits of the
used materials. Except the trigonal link, the calculations of all other parts are carried out in an
analytical manner. In order to determine critical load cases for each engine part, defined
procedures adopted from [65, 84 and 128] are used. Due to engineering evaluations, critical
load cases are compared with load cases of existing series engines. Furthermore, the
component safety regarding loads, geometries and used materials for each engine part is
calculated.
The conrods are analytically calculated in terms of buckling, dynamic tensile and compressive
bending stress. Because of the complex design and the high forces and moments, the trigonal
link is calculated via FEM (Finite element method). Also in this case and based on
engineering evaluations, several load cases are calculated and assessed regarding maximum
loads and critical cross sections. Due to the FEM simulation, the trigonal link structure is
further optimized regarding stiffness and weight, which is advantageous in order to reduce the
free mass forces and moments. The bolts, which connect the trigonal link and the conrods, are
calculated regarding surface pressure and tensile stress. Both crankshafts are dimensioned
considering shear forces, bending moments and torsional moments. Furthermore, a static
proof of strength against material yielding and a dynamic proof of strength concerning
material fatigue are performed. All gear wheels are designed considering tooth root strength
and Hertzian stress in the pitch points. The camshafts are dimensioned according to
mechanical strength limits concerning valve accelerations and forces. All bearings are
calculated via a rigid body simulation with AVL EXCITE Designer which mainly considers
bearing forces, bearing geometries, radial bearing clearance and oil properties.
To reduce the free mass forces and moments, balance shafts are additionally integrated. Both
balance shafts rotate with crankshaft speed and, therefore, only the 1st order mass forces can
be reduced. The implemented balance shaft arrangement enables a partially compensation of
the mass forces of 1st order of approximately 80 % (further details are presented in chapter
5.2).
Pis
ton
str
ok
e i
n m
m
0
20
40
60
80
100
120
140
Crank angle in °CA
0 60 120 180 240 300 360 420 480 540 600 660 720
EE engine_cyl1 EE engine_cyl2 Base engine
TDCI_1 TDCI_2

Design of the Extended Expansion prototype engine 87
For an Atkinson working principle, the exhaust valve timing is crucial for engine efficiency
regarding the gas exchange losses. For example with a CER of 0.5 a significant reduction of
the fuel consumption in full load can be reached. Using the same CER and valve timing in
part load (PL) the engine efficiency suffers. To avoid this characteristic, variable exhaust
valve timing is necessary (cf. chapter 4.4). Recent 1D-CFD simulation results show that a late
EVO (exhaust valve opening) in combination with a shorter valve opening duration is
necessary. Therefore, the valve timing need to be modified for each considered load point (cf.
Figure 115). Regarding the valve train of the EE prototype engine, several camshafts with
adapted cam designs for full and part load are performed. The different cam designs are
dimensioned according to optimum efficiency (1D-CFD) with respect to mechanical strength
limits concerning valve accelerations and forces.
In summary, all parts are sufficiently dimensioned regarding their loads, geometries and used
materials. The calculated load points include part load operation at 2000 rpm and full load
operation at 6000 rpm, which represents the maximum engine speed.
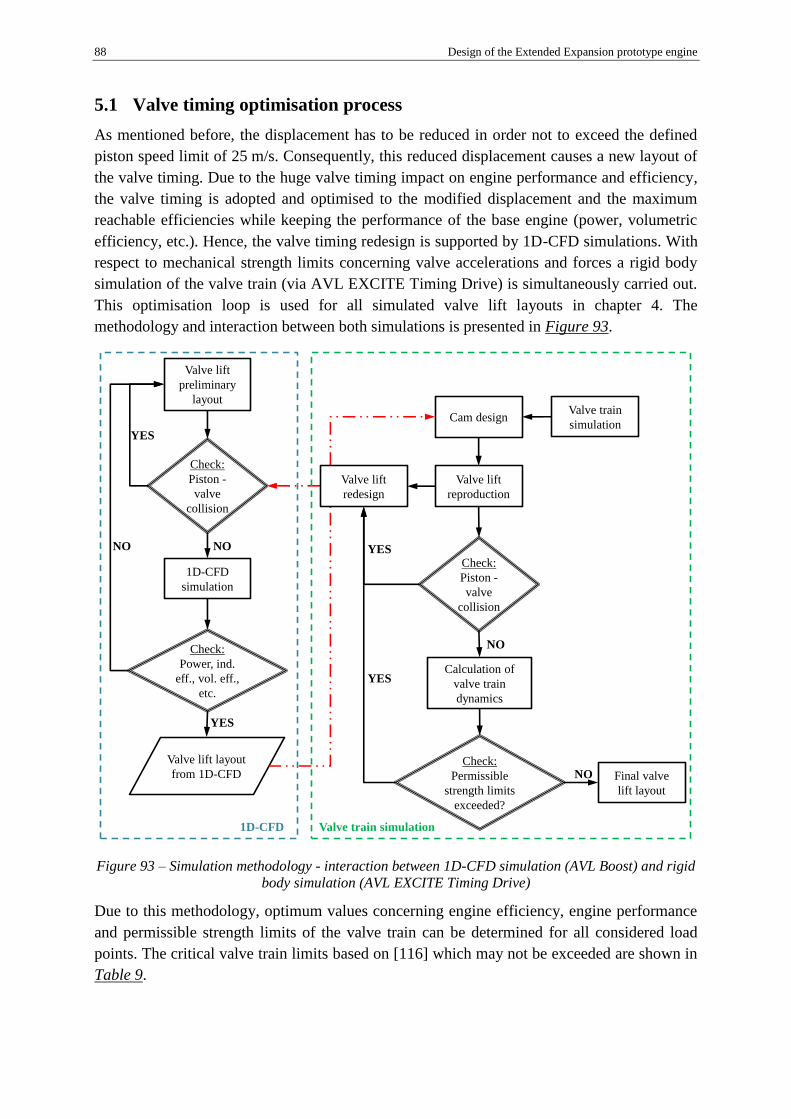
88 Design of the Extended Expansion prototype engine
5.1 Valve timing optimisation process
As mentioned before, the displacement has to be reduced in order not to exceed the defined
piston speed limit of 25 m/s. Consequently, this reduced displacement causes a new layout of
the valve timing. Due to the huge valve timing impact on engine performance and efficiency,
the valve timing is adopted and optimised to the modified displacement and the maximum
reachable efficiencies while keeping the performance of the base engine (power, volumetric
efficiency, etc.). Hence, the valve timing redesign is supported by 1D-CFD simulations. With
respect to mechanical strength limits concerning valve accelerations and forces a rigid body
simulation of the valve train (via AVL EXCITE Timing Drive) is simultaneously carried out.
This optimisation loop is used for all simulated valve lift layouts in chapter 4. The
methodology and interaction between both simulations is presented in Figure 93.
Figure 93 – Simulation methodology - interaction between 1D-CFD simulation (AVL Boost) and rigid
body simulation (AVL EXCITE Timing Drive)
Due to this methodology, optimum values concerning engine efficiency, engine performance
and permissible strength limits of the valve train can be determined for all considered load
points. The critical valve train limits based on [116] which may not be exceeded are shown in
Table 9.
Valve lift
preliminary
layout
Check:
Piston -
valve
collision
1D-CFD
simulation
Check:
Power, ind.
eff., vol. eff.,
etc.
Valve lift layout
from 1D-CFD NO
NONO
YES
YES
1D-CFD
Valve train
simulationCam design
Valve lift
reproduction
Check:
Piston -
valve
collision
Final valve
lift layout
Check:
Permissible
strength limits
exceeded?
Calculation of
valve train
dynamics
NO
YES
YES
Valve train simulation
Valve lift
redesign

Design of the Extended Expansion prototype engine 89
Surface pressure between
camshaft and rocker arm
970 N/mm² at idle
780 N/mm² at 6000 rpm
Valve acceleration < 85 mm/rad² [116]
Cam radius > 2.5 mm
Table 9 – Critical valve train limits
An explanation of this optimisation process for full and part load valve timing will be given in
short examples in the following.
5.1.1 Valve timing optimisation process at full load
The aim of the preliminary layout is to reach an efficiency maximum while keeping the power
performance of the base engine. The considered operation point is full load at 6000 rpm. In
comparison to conventional piston motions, the EE piston motion leads to a top dead centres
shift which results in a shorter time for the gas exchange. However, this TDC shift leads to a
collision between the valves and the piston (see Figure 94 – left image) according to the valve
train arrangement and used valve timing. Hence, the valve timing has to be adapted
concerning the phase (see Figure 94 – right image).
Figure 94 – Check of the piston-valve collision - left image: before adaption; right image: after
adaption (0 mm represents the cylinder head gasket surface)
The phase modifications affect the intake as well as the exhaust valve timing. In detail, the
IVO (intake valve opening) and EVC (exhaust valve closing) are later leading to a shorter
intake and to a longer exhaust opening duration. However, these modified valve timing
require further optimisation of relevant thermodynamic target values as power, volumetric
efficiency, indicated efficiency, etc. Later IVO and EVC lead to an amended valve overlap
timing which is decisive for the gas exchange behaviour concerning the residual gas amount.
To exhaust the gas as thoroughly as possible and to enable high volumetric efficiencies the
EVC timing is realised as late as possible (+36°CA compared to the base engine).
Nevertheless, it must be noted that a later EVC basically leads to higher scavenging losses.
The IVO is positioned as early as possible. Concurrently, the TDC shift causes a reduced
Pis
ton
str
ok
e i
n m
m
-140
-120
-100
-80
-60
-40
-20
0
20
Crank angle in °CA
0 90 180 270 360 450 540 630 720
EE piston stroke EE_In_WOT EE_Ex_WOT
Pis
ton
str
ok
e i
n m
m
-140
-120
-100
-80
-60
-40
-20
0
20
Crank angle in °CA
0 90 180 270 360 450 540 630 720
EE piston stroke EE_In_WOT EE_Ex_WOT
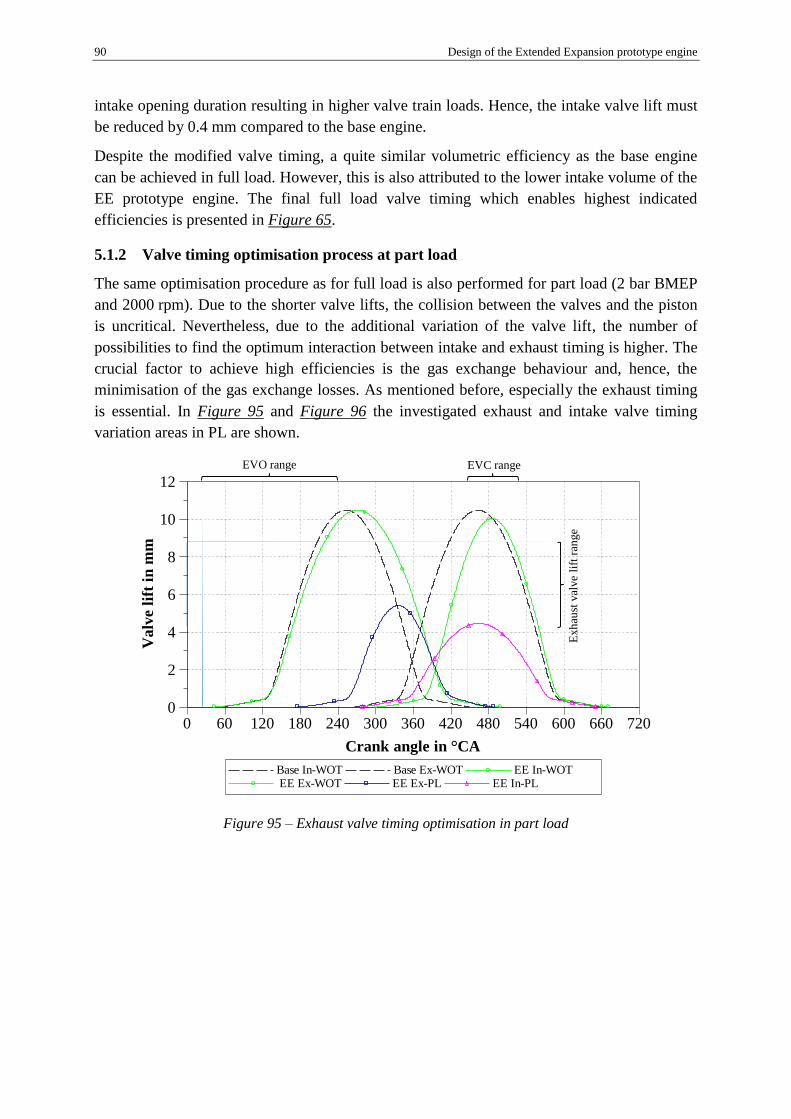
90 Design of the Extended Expansion prototype engine
intake opening duration resulting in higher valve train loads. Hence, the intake valve lift must
be reduced by 0.4 mm compared to the base engine.
Despite the modified valve timing, a quite similar volumetric efficiency as the base engine
can be achieved in full load. However, this is also attributed to the lower intake volume of the
EE prototype engine. The final full load valve timing which enables highest indicated
efficiencies is presented in Figure 65.
5.1.2 Valve timing optimisation process at part load
The same optimisation procedure as for full load is also performed for part load (2 bar BMEP
and 2000 rpm). Due to the shorter valve lifts, the collision between the valves and the piston
is uncritical. Nevertheless, due to the additional variation of the valve lift, the number of
possibilities to find the optimum interaction between intake and exhaust timing is higher. The
crucial factor to achieve high efficiencies is the gas exchange behaviour and, hence, the
minimisation of the gas exchange losses. As mentioned before, especially the exhaust timing
is essential. In Figure 95 and Figure 96 the investigated exhaust and intake valve timing
variation areas in PL are shown.
Figure 95 – Exhaust valve timing optimisation in part load
Exh
aust
val
ve
lift
ran
ge
EVO range EVC range
Valv
e l
ift
in m
m
0
2
4
6
8
10
12
Crank angle in °CA
0 60 120 180 240 300 360 420 480 540 600 660 720
Base In-WOT Base Ex-WOT EE In-WOT EE Ex-WOT EE Ex-PL EE In-PL
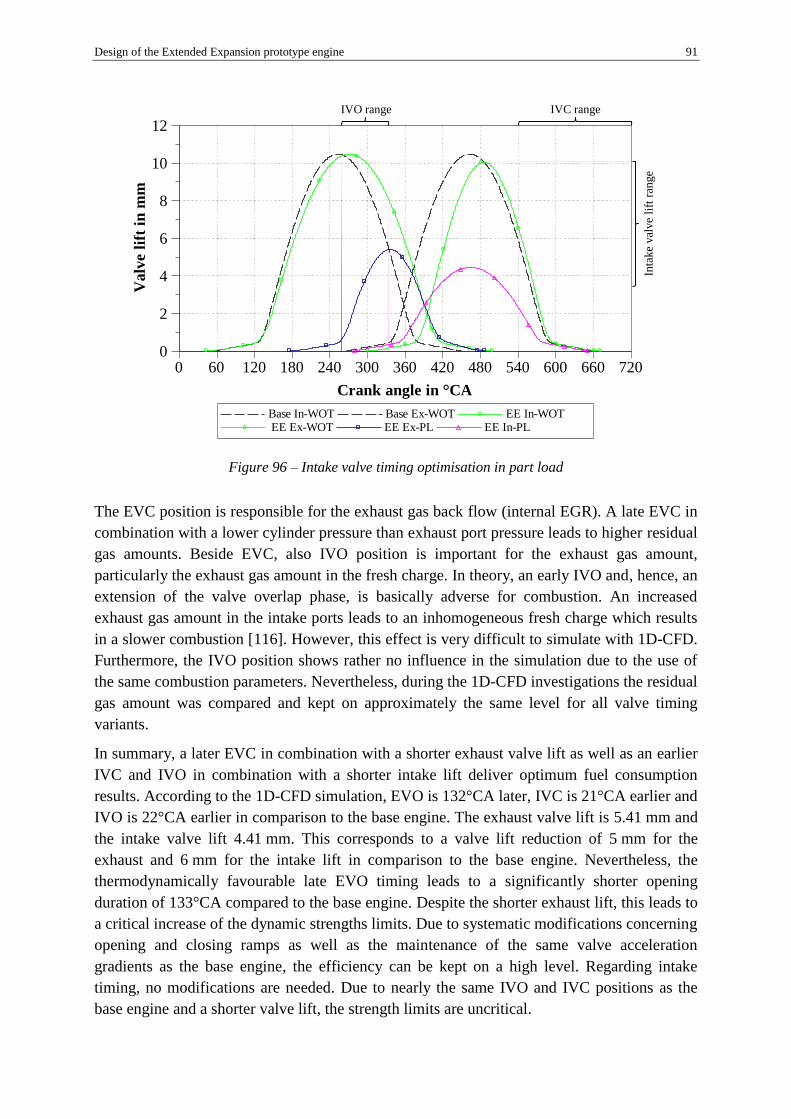
Design of the Extended Expansion prototype engine 91
Figure 96 – Intake valve timing optimisation in part load
The EVC position is responsible for the exhaust gas back flow (internal EGR). A late EVC in
combination with a lower cylinder pressure than exhaust port pressure leads to higher residual
gas amounts. Beside EVC, also IVO position is important for the exhaust gas amount,
particularly the exhaust gas amount in the fresh charge. In theory, an early IVO and, hence, an
extension of the valve overlap phase, is basically adverse for combustion. An increased
exhaust gas amount in the intake ports leads to an inhomogeneous fresh charge which results
in a slower combustion [116]. However, this effect is very difficult to simulate with 1D-CFD.
Furthermore, the IVO position shows rather no influence in the simulation due to the use of
the same combustion parameters. Nevertheless, during the 1D-CFD investigations the residual
gas amount was compared and kept on approximately the same level for all valve timing
variants.
In summary, a later EVC in combination with a shorter exhaust valve lift as well as an earlier
IVC and IVO in combination with a shorter intake lift deliver optimum fuel consumption
results. According to the 1D-CFD simulation, EVO is 132°CA later, IVC is 21°CA earlier and
IVO is 22°CA earlier in comparison to the base engine. The exhaust valve lift is 5.41 mm and
the intake valve lift 4.41 mm. This corresponds to a valve lift reduction of 5 mm for the
exhaust and 6 mm for the intake lift in comparison to the base engine. Nevertheless, the
thermodynamically favourable late EVO timing leads to a significantly shorter opening
duration of 133°CA compared to the base engine. Despite the shorter exhaust lift, this leads to
a critical increase of the dynamic strengths limits. Due to systematic modifications concerning
opening and closing ramps as well as the maintenance of the same valve acceleration
gradients as the base engine, the efficiency can be kept on a high level. Regarding intake
timing, no modifications are needed. Due to nearly the same IVO and IVC positions as the
base engine and a shorter valve lift, the strength limits are uncritical.
Inta
ke
val
ve
lift
ran
ge
IVO range IVC range
Valv
e l
ift
in m
m
0
2
4
6
8
10
12
Crank angle in °CA
0 60 120 180 240 300 360 420 480 540 600 660 720
Base In-WOT Base Ex-WOT EE In-WOT EE Ex-WOT EE Ex-PL EE In-PL

92 Design of the Extended Expansion prototype engine
5.2 Mass balancing
The mass balancing of the EE prototype engine represents a special design topic. Here, the
term “mass balancing” is based on reciprocating piston engines. Basically, free mass forces
and moments induce movements on the frame - in case of a vehicle on the chassis. For an ICE
operation, a smooth running performance as well as low vibrations and noise emissions are
relevant aspects beside efficiency (fuel consumption), reliability, cost-effective maintenance,
etc. Consequently, mass balancing, in particular for the EE prototype engine, requires special
attention.
The calculations are based on geometries and masses of all relevant EE prototype engine
parts. These include pistons, piston pins, conrods, trigonal links, the crankshaft, the Atkinson
crankshaft, the Atkinson conrods and all relevant additional parts like bearings, piston rings,
etc. The geometry data are determined via Catia V5 and the appropriate masses are calculated
with the corresponding density of the used materials. As for the kinematic calculation of the
piston movement before, the part accelerations are also determined via MATLAB. These
calculations are performed in a numerical manner. The mass point distribution of the conrods
is based on two points. In case of the EE prototype conrods the difference between a two and
a three point distribution is marginal. Hence, a two point distribution is chosen.
As starting basis for the calculations, a coordinate system is defined and can be seen in Figure
97. The direction of the z-axis is chosen along the cylinder and the x-axis is the crank shaft
axis. Therefore, the y-axis is along the engine lateral axis.
Figure 97 – Selection of the coordinate system
z
x
y
GCS
CCS_1CCS_2
y_CCS_2 y_GCSy_CCS_1
x_CCS_2
x_GCS
x_CCS_1
z_GCS z_CCS_1z_CCS_2

Design of the Extended Expansion prototype engine 93
The entire working cycle of the EE prototype engine lasts two crank shaft revolutions
(720°CA). Until this working cycle, the expansion and compression as well as the exhaust and
intake strokes are different. The TDC offset is 360°CA, therefore, the phase shift between
both cylinders is also 360°CA. The piston strokes of each cylinder are shown in Figure 92.
In the following, results concerning free mass forces and moments of the unbalanced
situation, and derived from that, results of the realized mass balancing are presented.
Additionally, a comparison between the EE prototype engine and different conventional 2-
cylinder engines is carried out.
5.2.1 Free mass forces and moments of the unbalanced EE prototype engine
To evaluate balancing measures, results of the unbalanced situation of the EE prototype
engine are shown first. The following results are based on numerical calculations. The crank
shaft speed is 6000 rpm. The EE prototype engine free mass forces in the z-y plane are
illustrated in Figure 98.
Figure 98 – Free mass forces of the unbalanced EE prototype engine at 6000 rpm
The maximum/minimum deflections are approximately 50/-50 kN in z-direction and
approximately 32/-35 kN in y-direction. Generally, the total mass forces are on a very high
level compared to conventional 2-cylinder engines, when using the same engine speed as well
as the same geometries and masses of pistons and conrods. A detailed comparison between
the loads of the EE prototype engine and several conventional two-cylinder concepts is given
in the end of sub-chapter 5.2.2. However, the main reason for these high loads as well as the
specific curve shape is the amount of free mass forces of the trigonal link. For a better
Free mass force in y-direction in N
-60000 -40000 -20000 0 20000 40000 60000
Free m
ass
fo
rce i
n z
-dir
ecti
on
in
N
-60000
-40000
-20000
0
20000
40000
60000

94 Design of the Extended Expansion prototype engine
understanding and to explain this specific load characteristics, the individual kinematics and
free mass forces of the relevant EE prototype engine parts like pistons, conrods, trigonal links
and Atkinson conrods will be presented. As basis, the centre of gravity (COG) movement of
each relevant engine part is shown in Figure 99.
Figure 99 – Centre of gravity (COG) movement of the relevant EE prototype engine parts
The different curves for each engine part in Figure 99 are based on a complete working cycle
over 720°CA. The centre of the coordinate axis represents the centre of the crank shaft. As
expected, the movement of the piston is along the z-axis. The angle between the conrod and
the cylinder axis is very low during the expansion phase. Therefore, the COG of the conrod
performs an almost vertical (along the z-axis) motion between TDCI and BDC (expansion
stroke). Subsequently, the conrod deflects stronger along the y-axis (larger conrod angle)
which results in oval curve shapes - the bigger one for expansion and exhaust and the smaller
one for intake and compression. The trigonal link rotates with crank shaft speed which results
in a movement combining two oval curves. The deflection is slightly larger in y-direction.
The Atkinson conrod rotates with half engine speed. Therefore, a single curve results over
720°CA. The greatest deflection occurs along an approximately 45° angle of the coordinates.
The resulting mass forces based on the individual part weights at 6000 rpm are presented in
Figure 100.
D istance [m ]
-0.3
0
0.0
0
0.3
0
Dis
tan
ce
[m
]
-0 .30
0.00
0.30
P iston C O G movement
C onrod C O G movement
Trigonal link C O G movement
Atkinson conrod C O G movement
y_CCS
z_CCS
COG_Piston
COG_Conrod
Crank shaft centre
COG_Atkinson conrod
COG_Trigonal link
D istance [m ]
-0.3
0
0.0
0
0.3
0
Dis
tan
ce
[m
]
-0.30
0.00
0.30
P iston C O G movement
C onrod C O G movement
Trigonal link C O G movement
Atkinson conrod C O G movement
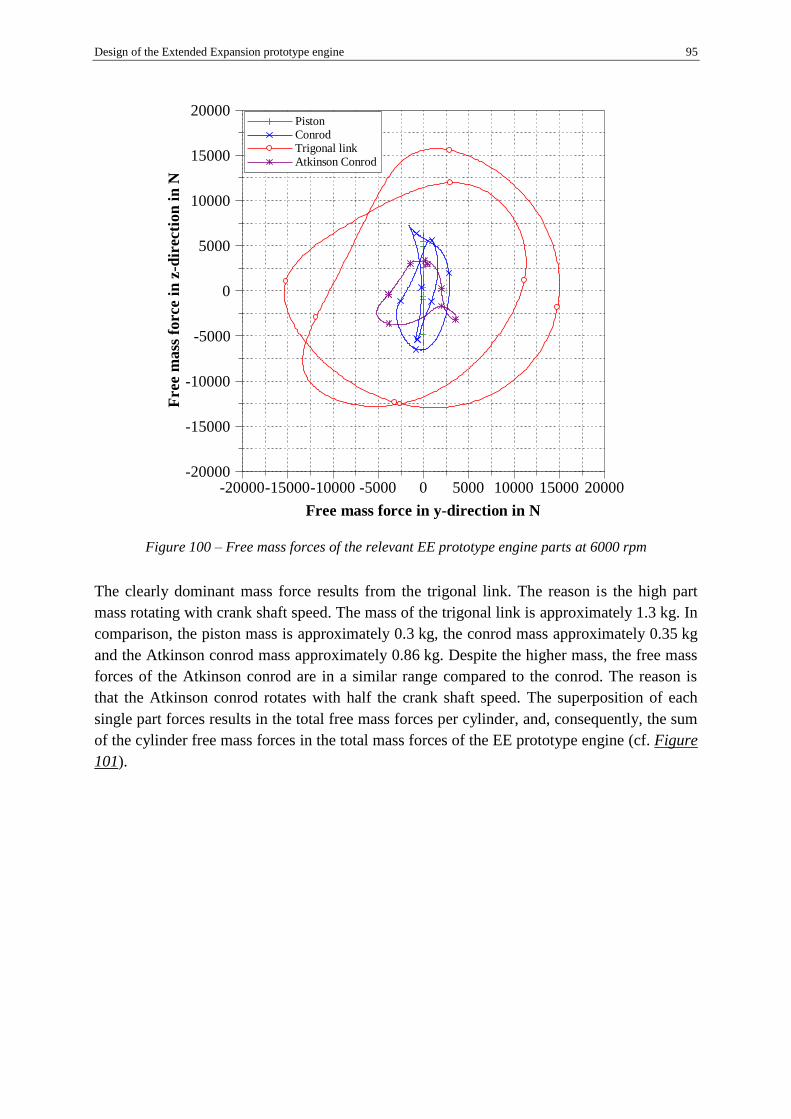
Design of the Extended Expansion prototype engine 95
Figure 100 – Free mass forces of the relevant EE prototype engine parts at 6000 rpm
The clearly dominant mass force results from the trigonal link. The reason is the high part
mass rotating with crank shaft speed. The mass of the trigonal link is approximately 1.3 kg. In
comparison, the piston mass is approximately 0.3 kg, the conrod mass approximately 0.35 kg
and the Atkinson conrod mass approximately 0.86 kg. Despite the higher mass, the free mass
forces of the Atkinson conrod are in a similar range compared to the conrod. The reason is
that the Atkinson conrod rotates with half the crank shaft speed. The superposition of each
single part forces results in the total free mass forces per cylinder, and, consequently, the sum
of the cylinder free mass forces in the total mass forces of the EE prototype engine (cf. Figure
101).
Free mass force in y-direction in N
-20000-15000-10000 -5000 0 5000 10000 15000 20000
Free m
ass
fo
rce i
n z
-dir
ecti
on
in
N
-20000
-15000
-10000
-5000
0
5000
10000
15000
20000 Piston Conrod Trigonal link Atkinson Conrod

96 Design of the Extended Expansion prototype engine
Figure 101 – Free mass forces of the relevant parts, the cylinders and the entire EE prototype engine
at 6000 rpm
The curves of both cylinder forces are congruent, but phase-shifted by 360°. The mass forces
of the EE prototype engine result from the superposition of both curves (cf. Figure 98).
Figure 102 – Free mass moments around the y- and z-axis at 6000 rpm
Free mass force in y-direction in N
-60000 -40000 -20000 0 20000 40000 60000
Free m
ass
fo
rce i
n z
-dir
ecti
on
in
N
-60000
-40000
-20000
0
20000
40000
60000
Atkinson Conrod Piston Trigonal link Conrod Cylinder 1 / Cylinder 2 EE Prototype Engine
Crank angle in °CA
0 90 180 270 360 450 540 630 720
Free m
ass
mom
en
ts i
n N
m
-800
-600
-400
-200
0
200
400
600
800
Free mass moment around y-axis Free mass moment around z-axis
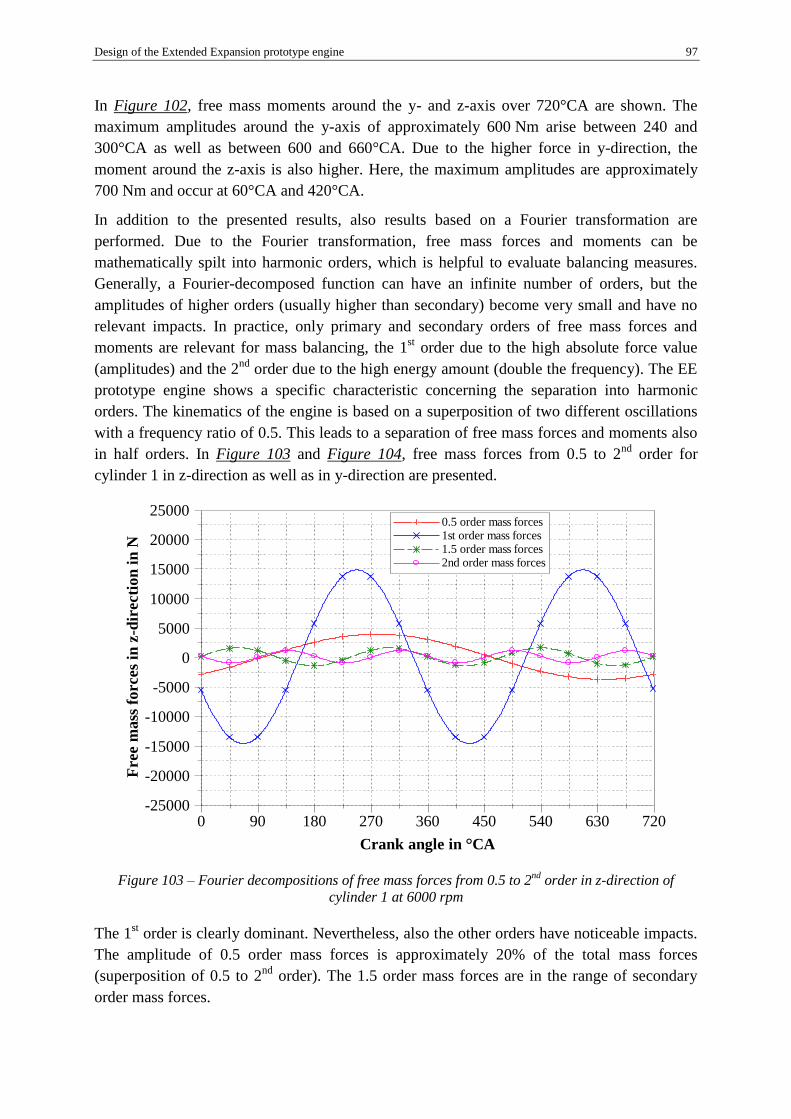
Design of the Extended Expansion prototype engine 97
In Figure 102, free mass moments around the y- and z-axis over 720°CA are shown. The
maximum amplitudes around the y-axis of approximately 600 Nm arise between 240 and
300°CA as well as between 600 and 660°CA. Due to the higher force in y-direction, the
moment around the z-axis is also higher. Here, the maximum amplitudes are approximately
700 Nm and occur at 60°CA and 420°CA.
In addition to the presented results, also results based on a Fourier transformation are
performed. Due to the Fourier transformation, free mass forces and moments can be
mathematically spilt into harmonic orders, which is helpful to evaluate balancing measures.
Generally, a Fourier-decomposed function can have an infinite number of orders, but the
amplitudes of higher orders (usually higher than secondary) become very small and have no
relevant impacts. In practice, only primary and secondary orders of free mass forces and
moments are relevant for mass balancing, the 1st order due to the high absolute force value
(amplitudes) and the 2nd
order due to the high energy amount (double the frequency). The EE
prototype engine shows a specific characteristic concerning the separation into harmonic
orders. The kinematics of the engine is based on a superposition of two different oscillations
with a frequency ratio of 0.5. This leads to a separation of free mass forces and moments also
in half orders. In Figure 103 and Figure 104, free mass forces from 0.5 to 2nd
order for
cylinder 1 in z-direction as well as in y-direction are presented.
Figure 103 – Fourier decompositions of free mass forces from 0.5 to 2nd
order in z-direction of
cylinder 1 at 6000 rpm
The 1st order is clearly dominant. Nevertheless, also the other orders have noticeable impacts.
The amplitude of 0.5 order mass forces is approximately 20% of the total mass forces
(superposition of 0.5 to 2nd
order). The 1.5 order mass forces are in the range of secondary
order mass forces.
Crank angle in °CA
0 90 180 270 360 450 540 630 720
Free m
ass
fo
rces
in z
-dir
ecti
on
in
N
-25000
-20000
-15000
-10000
-5000
0
5000
10000
15000
20000
25000 0.5 order mass forces 1st order mass forces 1.5 order mass forces 2nd order mass forces
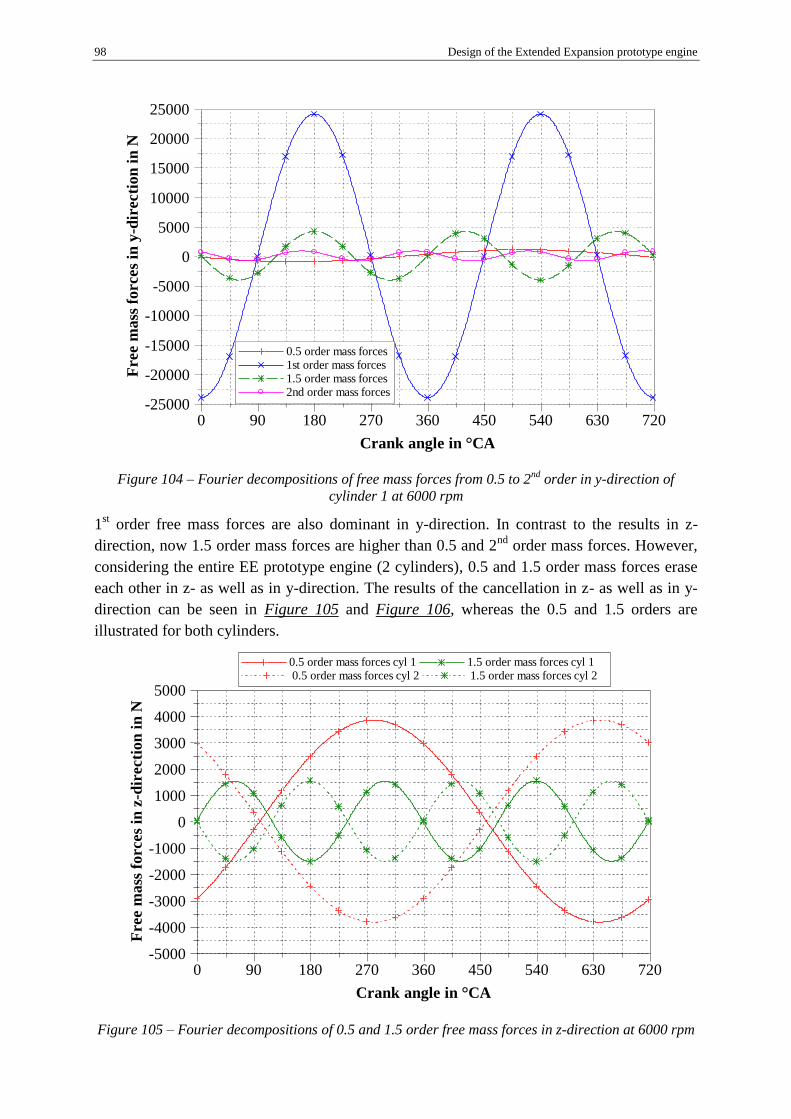
98 Design of the Extended Expansion prototype engine
Figure 104 – Fourier decompositions of free mass forces from 0.5 to 2nd
order in y-direction of
cylinder 1 at 6000 rpm
1st order free mass forces are also dominant in y-direction. In contrast to the results in z-
direction, now 1.5 order mass forces are higher than 0.5 and 2nd
order mass forces. However,
considering the entire EE prototype engine (2 cylinders), 0.5 and 1.5 order mass forces erase
each other in z- as well as in y-direction. The results of the cancellation in z- as well as in y-
direction can be seen in Figure 105 and Figure 106, whereas the 0.5 and 1.5 orders are
illustrated for both cylinders.
Figure 105 – Fourier decompositions of 0.5 and 1.5 order free mass forces in z-direction at 6000 rpm
Crank angle in °CA
0 90 180 270 360 450 540 630 720
Free m
ass
forces
in y
-dir
ecti
on
in
N
-25000
-20000
-15000
-10000
-5000
0
5000
10000
15000
20000
25000
0.5 order mass forces 1st order mass forces 1.5 order mass forces 2nd order mass forces
Crank angle in °CA
0 90 180 270 360 450 540 630 720
Free m
ass
fo
rces
in z
-dir
ecti
on
in
N
-5000
-4000
-3000
-2000
-1000
0
1000
2000
3000
4000
5000
0.5 order mass forces cyl 1 1.5 order mass forces cyl 1 0.5 order mass forces cyl 2 1.5 order mass forces cyl 2

Design of the Extended Expansion prototype engine 99
Figure 106 – Fourier decompositions of 0.5 and 1.5 order free mass forces in y-direction at 6000 rpm
Summarizing, only primary and the secondary orders remain. In Figure 107 and Figure 108,
1st and 2
nd order free mass forces as well as their superposition in y- and z-direction are
shown.
Figure 107 – Free mass forces of the EE prototype engine in z-direction at 6000 rpm (numerical
calculation and calculation based on orders)
Crank angle in °CA
0 90 180 270 360 450 540 630 720
Free m
ass
forces
in y
-dir
ecti
on
in
N
-5000
-4000
-3000
-2000
-1000
0
1000
2000
3000
4000
5000
0.5 order mass forces cyl 1 1.5 order mass forces cyl 1 0.5 order mass forces cyl 2 1.5 order mass forces cyl 2
Crank angle in °CA
0 90 180 270 360 450 540 630 720
Overa
ll f
ree m
ass
fo
rces
in z
-dir
ecti
on
in
N
-40000
-30000
-20000
-10000
0
10000
20000
30000
40000
1st order mass forces 2nd order mass forces superposition of orders analytical calculation

100 Design of the Extended Expansion prototype engine
Figure 108 – Free mass forces of the EE prototype engine in y-direction at 6000 rpm (numerical
calculation and calculation based on orders)
The maximum/minimum deflections of the superposition are approximately 28/-31 kN in z-
direction and approximately 47/-49 kN in y-direction. Considering the free mass forces of the
entire engine in y- and z-direction, the superposition almost corresponds with the primary
order because of the relatively low impact of the secondary order. Therefore, only 1st order
mass forces will be balanced for the EE prototype engine (cf. chapter 5.2.2). In Figure 107
and Figure 108, the numerical results are additionally illustrated. It can be seen that the
difference between the numerical calculation and the superposition of first and secondary
orders are marginal.
A Fourier decomposition of the free mass moments of the entire EE prototype engine around
the y- and z-axis are shown in Figure 109 and in Figure 110, whereby the orders from 0.5 to
2nd
are presented.
Crank angle in °CA
0 90 180 270 360 450 540 630 720
Overa
ll f
ree m
ass
fo
rces
in y
-dir
ecti
on
in
N
-60000
-50000
-40000
-30000
-20000
-10000
0
10000
20000
30000
40000
50000
60000
1st order mass forces 2nd order mass forces superpostion of orders analytical calculation
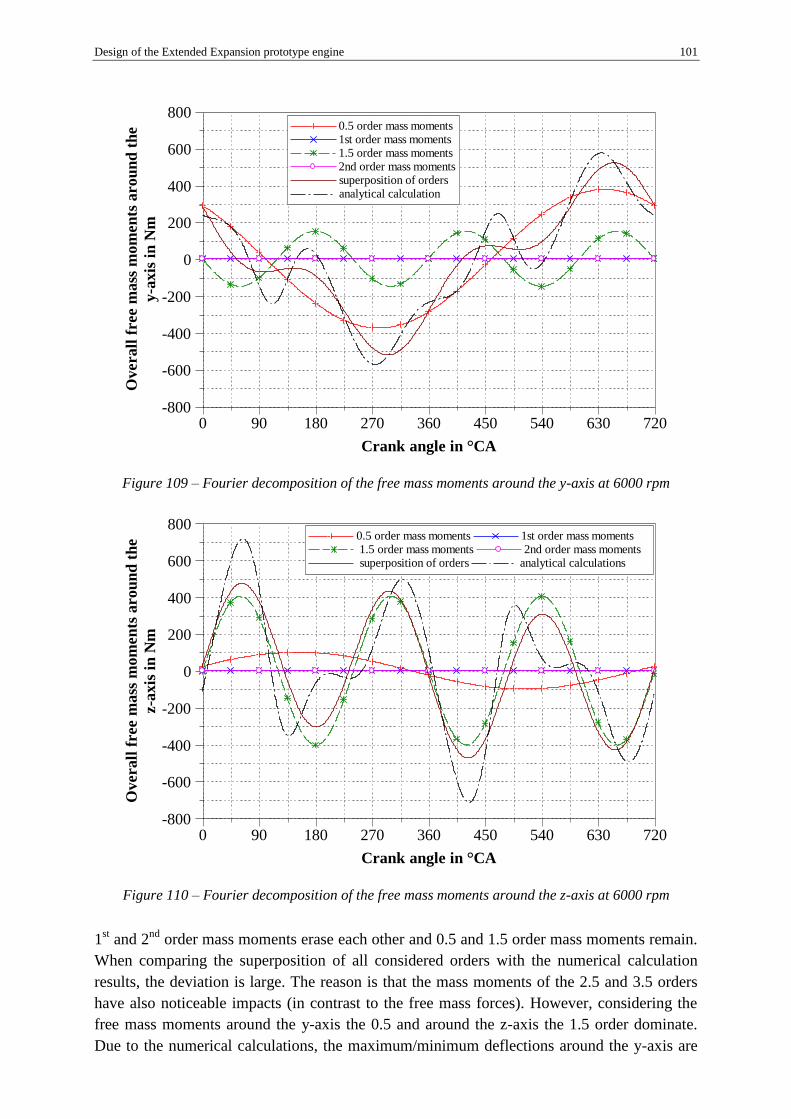
Design of the Extended Expansion prototype engine 101
Figure 109 – Fourier decomposition of the free mass moments around the y-axis at 6000 rpm
Figure 110 – Fourier decomposition of the free mass moments around the z-axis at 6000 rpm
1st and 2
nd order mass moments erase each other and 0.5 and 1.5 order mass moments remain.
When comparing the superposition of all considered orders with the numerical calculation
results, the deviation is large. The reason is that the mass moments of the 2.5 and 3.5 orders
have also noticeable impacts (in contrast to the free mass forces). However, considering the
free mass moments around the y-axis the 0.5 and around the z-axis the 1.5 order dominate.
Due to the numerical calculations, the maximum/minimum deflections around the y-axis are
Crank angle in °CA
0 90 180 270 360 450 540 630 720
Overall
free m
ass
mo
men
ts a
rou
nd
th
e
y-a
xis
in
Nm
-800
-600
-400
-200
0
200
400
600
800 0.5 order mass moments 1st order mass moments 1.5 order mass moments 2nd order mass moments superposition of orders analytical calculation
Crank angle in °CA
0 90 180 270 360 450 540 630 720
Overall
free m
ass
mo
men
ts a
rou
nd
th
e
z-a
xis
in
Nm
-800
-600
-400
-200
0
200
400
600
800 0.5 order mass moments 1st order mass moments
1.5 order mass moments 2nd order mass moments superposition of orders analytical calculations

102 Design of the Extended Expansion prototype engine
approximately between -600 and 600 Nm and around the z-axis approximately between -750
and 750 Nm.
5.2.2 Mass balancing of the Extended Expansion prototype engine
The EE prototype engine consists of two balance shafts, which partly compensate 1st order
mass forces. A compensation of 2nd
order mass forces is not implemented due to the relatively
low impact on total mass forces (see Figure 107 and Figure 108). Furthermore, an
implementation of 2nd
order balance shafts leads to a significant enlargement of the engine
size. The arrangement of the balance shafts can be seen in Figure 111.
Figure 111 – Implementation of the balance shafts in the crank case
The difference between the free mass forces of the unbalanced and the partly balanced EE
prototype engine is presented in Figure 112. Here, the results of the unbalanced EE prototype
engine, the implementation of only one balance shaft (1st balance shaft) and the
implementation of both balance shafts (1st and 2
nd balance shaft) are shown.
1st balancer shaft
(crank shaft speed) 2nd balancer shaft
(crank shaft speed)
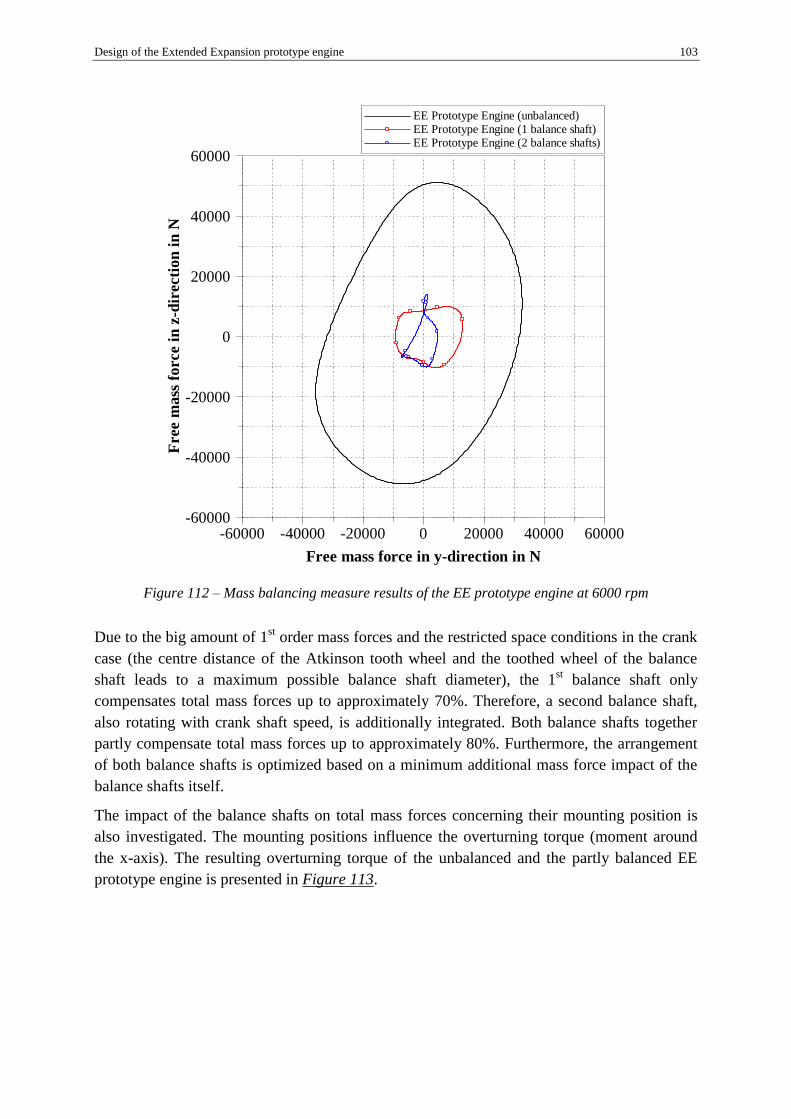
Design of the Extended Expansion prototype engine 103
Figure 112 – Mass balancing measure results of the EE prototype engine at 6000 rpm
Due to the big amount of 1st order mass forces and the restricted space conditions in the crank
case (the centre distance of the Atkinson tooth wheel and the toothed wheel of the balance
shaft leads to a maximum possible balance shaft diameter), the 1st balance shaft only
compensates total mass forces up to approximately 70%. Therefore, a second balance shaft,
also rotating with crank shaft speed, is additionally integrated. Both balance shafts together
partly compensate total mass forces up to approximately 80%. Furthermore, the arrangement
of both balance shafts is optimized based on a minimum additional mass force impact of the
balance shafts itself.
The impact of the balance shafts on total mass forces concerning their mounting position is
also investigated. The mounting positions influence the overturning torque (moment around
the x-axis). The resulting overturning torque of the unbalanced and the partly balanced EE
prototype engine is presented in Figure 113.
Free mass force in y-direction in N
-60000 -40000 -20000 0 20000 40000 60000
Free m
ass
fo
rce i
n z
-dir
ecti
on
in
N
-60000
-40000
-20000
0
20000
40000
60000
EE Prototype Engine (unbalanced) EE Prototype Engine (1 balance shaft) EE Prototype Engine (2 balance shafts)

104 Design of the Extended Expansion prototype engine
Figure 113 – Overturning torque of the EE prototype engine at 6000 rpm
Due to the mounting positions of the balancer shafts, the overturning torque is higher for the
balanced EE prototype engine. However, this result represents an optimum regarding the
minimum possible overturning torque, when considering the space requirement possibilities
of the integration of the balance shafts.
Summarising, a fully compensation of 1st and 2
nd order free mass forces and 0.5 and 1.5 order
free mass moments cannot be realised with two balance shafts for an Extended Engine
concept based on a linkage system. If using four balance shafts, only the free mass forces can
be theoretically compensated in z- and y-direction. The EE prototype engine has no 1st and 2
nd
order free mass moments. Therefore, no measures regarding the free mass moments were
made. However, it is generally possible to compensate the half order mass moments over the
camshafts with additional counter weights. The advantage is that camshafts rotate with half
the crank shaft speed and, therefore, no additional balance shafts and no additional
transmissions are necessary. Concerning this topic, a patent from Audi for an Atkinson-based
engine exist [10].
Finally, a comparison of the free mass forces of the EE prototype engine with conventional 2-
cylinder engines is conducted. The 2-cylinder engine selection includes crank train
arrangements of In-line 180, V 180, V 90 and V 60. The relevant engine parts (piston, conrod,
crank train, etc.) of the conventional engines have same geometries and material properties as
used for the EE prototype engine. The results are again based on 6000 rpm.
Crank angle in °CA
0 90 180 270 360 450 540 630 720
Ov
ertu
rn
ing t
orq
ue (
mom
en
t a
rou
nd
th
e
x-a
xis
) in
Nm
-6000
-5000
-4000
-3000
-2000
-1000
0
1000
2000
3000
4000
5000
6000
EE prototype engine (unbalanced) EE prototype engine (2 balance shafts)
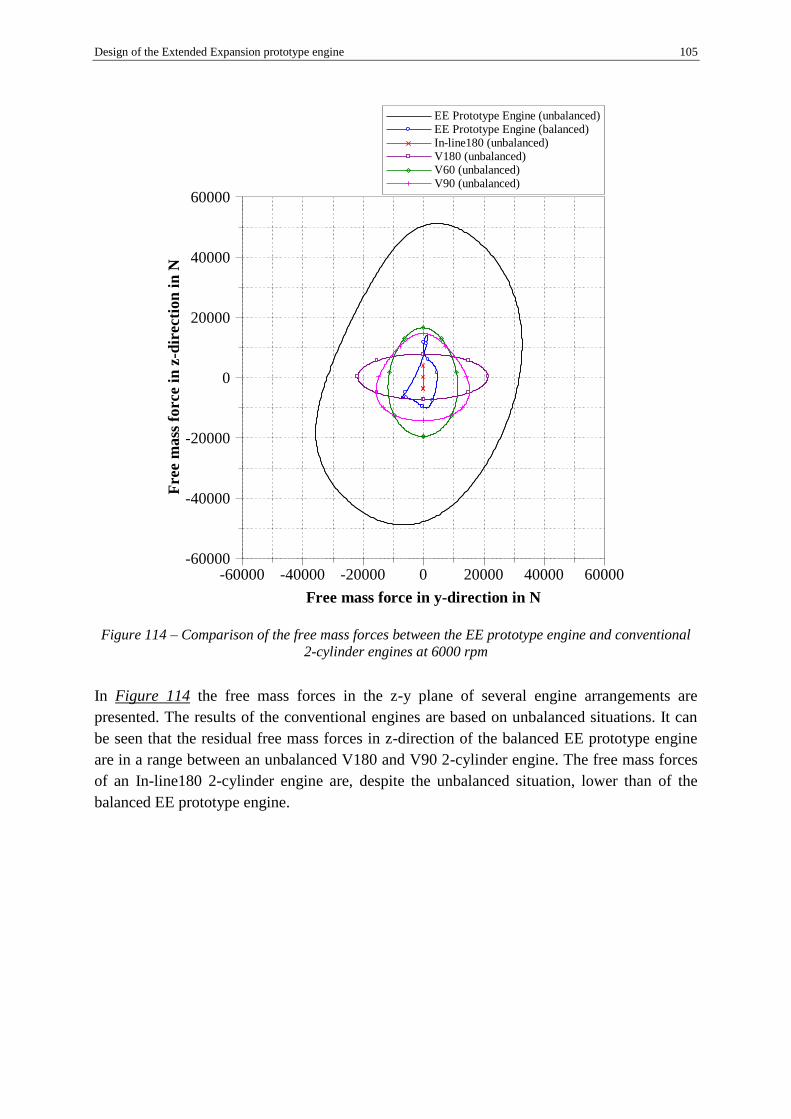
Design of the Extended Expansion prototype engine 105
Figure 114 – Comparison of the free mass forces between the EE prototype engine and conventional
2-cylinder engines at 6000 rpm
In Figure 114 the free mass forces in the z-y plane of several engine arrangements are
presented. The results of the conventional engines are based on unbalanced situations. It can
be seen that the residual free mass forces in z-direction of the balanced EE prototype engine
are in a range between an unbalanced V180 and V90 2-cylinder engine. The free mass forces
of an In-line180 2-cylinder engine are, despite the unbalanced situation, lower than of the
balanced EE prototype engine.
Free mass force in y-direction in N
-60000 -40000 -20000 0 20000 40000 60000
Free m
ass
fo
rce i
n z
-dir
ecti
on
in
N
-60000
-40000
-20000
0
20000
40000
60000
EE Prototype Engine (unbalanced) EE Prototype Engine (balanced) In-line180 (unbalanced) V180 (unbalanced) V60 (unbalanced) V90 (unbalanced)

106 Experimental Investigations
6 Experimental Investigations
To evaluate and verify the promising simulation results, the EE prototype engine was
experimentally tested. All measurements are performed on an engine test bench at the
Institute of Internal Combustion Engines and Thermodynamics (IVT). Beside the prototype
engine, the test bench setup includes series parts of the base engine, such as air box, air filter,
throttle body with the injection system, ignition system, three-way catalyst, exhaust silencer,
etc.
The measurement instrumentation includes high and low pressure indication systems for both
cylinders as well as for the intake and exhaust path. A lambda-sensor ahead of the three-way
catalyst is used for the lambda-control. For the selective lambda control of each cylinder, a
lambda sensor is positioned after the exhaust port. In addition, temperature sensors are
mounted in the air box, in front of the three-way catalyst and in the intake and exhaust paths.
The measurement of the fuel mass is based on a Coriolis measurement system. The effective
engine torque is measured via a torque measuring flange. The measurement of the engine-out
emissions completes the measuring setup.
The experimental investigations are based on stationary full load (WOT) and part load (PL)
measurements. All measurements are performed with λ=1. Further, separate oil and water
conditioning systems are also integrated. Hence, constant oil and water temperatures are
realized for the measurement. Both temperatures were regulated to 90°C.
In-WOT…intake valve timing at full load, In-deth…de-throttled intake valve timing at part load, Ex-
WOT…exhaust valve timing at full load, Ex-PL…exhaust valve timing at part load
Figure 115 – Intake and exhaust timing variants (valve lift curves) of the EE prototype engine
TDCI TDCGE
Crank angle in °CA0 90 180 270 360 450 540 630 720
Va
lve l
ift
in m
m
0
2
4
6
8
10
12
In-WOT Ex-WOT In-deth Ex-PL
Dis
pla
cem
en
t in
dm³
0.0
0.1
0.2
0.3
0.4
0.5
0.6
0.7
0.8 Displacement
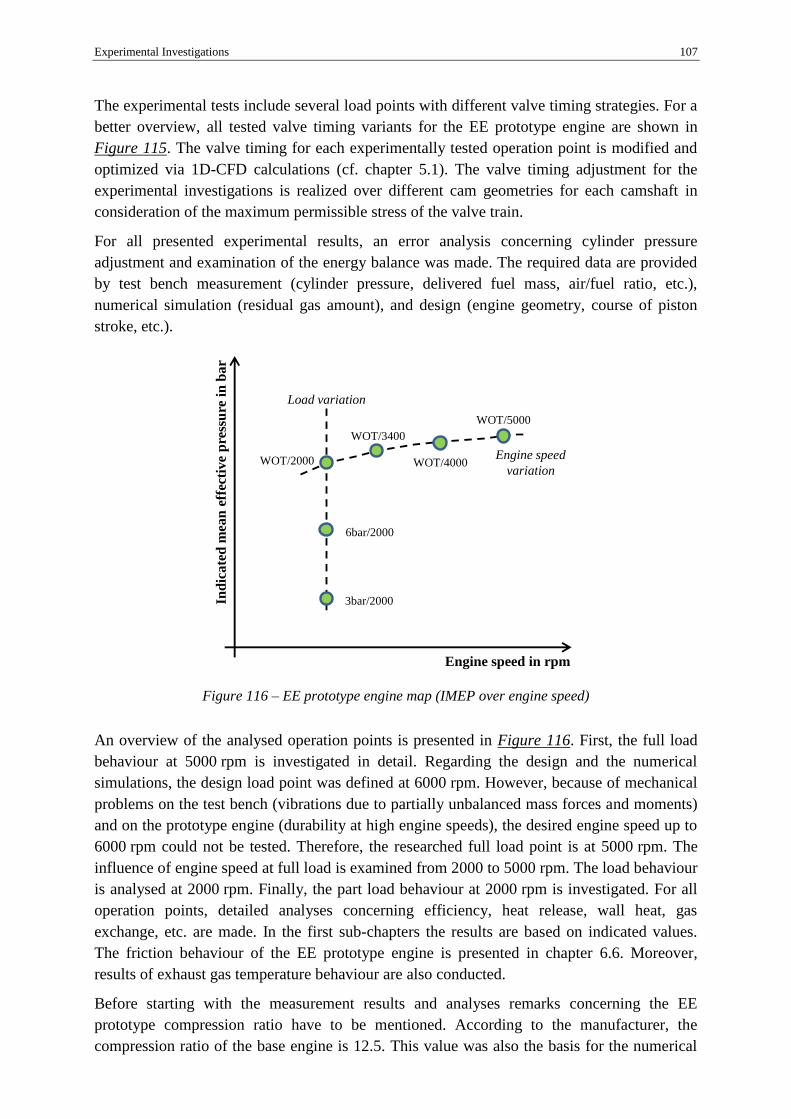
Experimental Investigations 107
The experimental tests include several load points with different valve timing strategies. For a
better overview, all tested valve timing variants for the EE prototype engine are shown in
Figure 115. The valve timing for each experimentally tested operation point is modified and
optimized via 1D-CFD calculations (cf. chapter 5.1). The valve timing adjustment for the
experimental investigations is realized over different cam geometries for each camshaft in
consideration of the maximum permissible stress of the valve train.
For all presented experimental results, an error analysis concerning cylinder pressure
adjustment and examination of the energy balance was made. The required data are provided
by test bench measurement (cylinder pressure, delivered fuel mass, air/fuel ratio, etc.),
numerical simulation (residual gas amount), and design (engine geometry, course of piston
stroke, etc.).
Figure 116 – EE prototype engine map (IMEP over engine speed)
An overview of the analysed operation points is presented in Figure 116. First, the full load
behaviour at 5000 rpm is investigated in detail. Regarding the design and the numerical
simulations, the design load point was defined at 6000 rpm. However, because of mechanical
problems on the test bench (vibrations due to partially unbalanced mass forces and moments)
and on the prototype engine (durability at high engine speeds), the desired engine speed up to
6000 rpm could not be tested. Therefore, the researched full load point is at 5000 rpm. The
influence of engine speed at full load is examined from 2000 to 5000 rpm. The load behaviour
is analysed at 2000 rpm. Finally, the part load behaviour at 2000 rpm is investigated. For all
operation points, detailed analyses concerning efficiency, heat release, wall heat, gas
exchange, etc. are made. In the first sub-chapters the results are based on indicated values.
The friction behaviour of the EE prototype engine is presented in chapter 6.6. Moreover,
results of exhaust gas temperature behaviour are also conducted.
Before starting with the measurement results and analyses remarks concerning the EE
prototype compression ratio have to be mentioned. According to the manufacturer, the
compression ratio of the base engine is 12.5. This value was also the basis for the numerical
Ind
icate
d m
ean
eff
ecti
ve
pre
ssu
re i
n b
ar
Engine speed in rpm
3bar/2000
6bar/2000
WOT/3400
WOT/4000
WOT/5000
Load variation
WOT/2000Engine speed
variation

108 Experimental Investigations
simulation for the EE engine (cf. chapter 4). Due to volumetric measurements of the
combustion chamber, the effective compression ratio of the EE prototype is reduced to 11.8.
This fact is mainly caused by two reasons. Firstly, the origin compression ratio of the base
engine was, in contrast to the manufacturer data, only 12.2. Secondly, the integration of the
pressure sensor for the indication system leads to an increase of the compression volume and,
therefore, to a further reduction of the compression ratio.
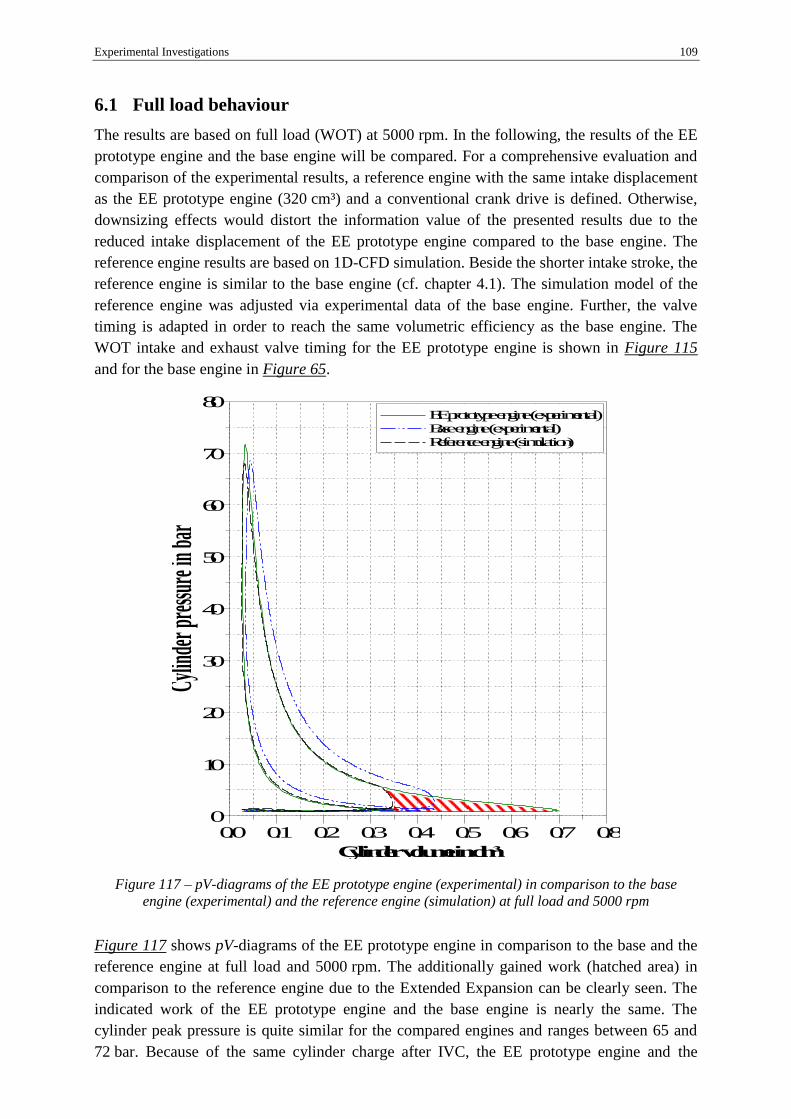
Experimental Investigations 109
6.1 Full load behaviour
The results are based on full load (WOT) at 5000 rpm. In the following, the results of the EE
prototype engine and the base engine will be compared. For a comprehensive evaluation and
comparison of the experimental results, a reference engine with the same intake displacement
as the EE prototype engine (320 cm³) and a conventional crank drive is defined. Otherwise,
downsizing effects would distort the information value of the presented results due to the
reduced intake displacement of the EE prototype engine compared to the base engine. The
reference engine results are based on 1D-CFD simulation. Beside the shorter intake stroke, the
reference engine is similar to the base engine (cf. chapter 4.1). The simulation model of the
reference engine was adjusted via experimental data of the base engine. Further, the valve
timing is adapted in order to reach the same volumetric efficiency as the base engine. The
WOT intake and exhaust valve timing for the EE prototype engine is shown in Figure 115
and for the base engine in Figure 65.
Figure 117 – pV-diagrams of the EE prototype engine (experimental) in comparison to the base
engine (experimental) and the reference engine (simulation) at full load and 5000 rpm
Figure 117 shows pV-diagrams of the EE prototype engine in comparison to the base and the
reference engine at full load and 5000 rpm. The additionally gained work (hatched area) in
comparison to the reference engine due to the Extended Expansion can be clearly seen. The
indicated work of the EE prototype engine and the base engine is nearly the same. The
cylinder peak pressure is quite similar for the compared engines and ranges between 65 and
72 bar. Because of the same cylinder charge after IVC, the EE prototype engine and the
Cylin
der p
ressu
re in
bar
0
10
20
30
40
50
60
70
80
Cylinder volume in dm³
0.0 0.1 0.2 0.3 0.4 0.5 0.6 0.7 0.8
EE prototype engine (experimental) Base engine (experimental) Reference engine (simulation)

110 Experimental Investigations
reference engines have the same absolute fuel consumption (kg/h). The higher work at equally
supplied fuel mass consequently leads to a higher efficiency (approximately 46% - cf. Figure
119).
Figure 118 – GE-loops of the EE prototype engine (experimental) in comparison to the base engine
(experimental) and the reference engine (simulation) at full load and 5000 rpm
Figure 118 shows the gas exchange (GE) loops at full load and 5000 rpm of the EE prototype
engine, the reference engine, and the base engine. In general, gas exchange losses for an
Extended Expansion concept are very high due to the principle-based higher exhaust stroke
volume. However, the valve timing of the EE prototype engine is optimized via 1D-CFD
calculations with the aim not to drop below ambient pressure level at the end of the
expansion. Otherwise, this could result in higher gas exchange losses due to additional
pumping losses (cf. also 6.3). As it can be seen in Figure 118, the valve timing is certainly not
ideal. During half the exhaust stroke of the EE prototype engine, the expansion pressure is
under ambient pressure level. In this phase, the change of state is approximately isobaric.
After 0.3 dm³ a pressure increase occurs, which leads to further increased gas exchange
losses. The reason for this characteristic is the gas dynamic behaviour of the exhaust system.
However, improvement potentials to reduce the gas exchange work basically exist. For
example, optimisations of the exhaust system regarding the special exhaust gas dynamics and
adaptions of the exhaust valve diameter in combination with exhaust port geometries could be
appropriate measures. Moreover, the exhaust valve timing must be further adopted. Due to
this gas exchange characteristic, the EVO (exhaust valve opening) of the EE prototype engine
should be set earlier in order to avoid additional pumping losses (cf. also chapter 4.4). The gas
exchange characteristics of the base and the reference engine are quite similar. It can be also
seen that the gas exchange behaviour of the numerical results qualitatively correspond with
those of the base engine. For this load point, the gas exchange losses are on very low levels
for 4-stroke engines.
Cy
lin
der p
ress
ure i
n b
ar
0.00
0.50
1.00
1.50
2.00
2.50
3.00
Cylinder volume in dm³
0.0 0.1 0.2 0.3 0.4 0.5 0.6 0.7 0.8
EE prototype engine (experimental) Base engine (experimental) Reference engine (simulation)

Experimental Investigations 111
Figure 119 – Loss analysis for full load operation at 5000 rpm
The indicated efficiencies and the engine losses up to the ideal engine process for the EE
prototype, the base and the reference engine at full load and 5000 rpm are presented in Figure
119. The determination of the losses is based on the calculation methodology according to
[93]. Beginning with the ideal engine efficiency with real charge, the losses regarding
imperfect combustion, real combustion, wall heat and gas exchange are calculated. The losses
results from work differences related to the supplied fuel energy. The residual gas amount for
the calculation of each variant is based on 1D-CFD simulation. The calculation of the heat
transfer coefficient is based on the theoretical approaches of Woschni [125 and 124]. Further
calculation data including air/fuel ratio, fuel mass, cylinder pressure and exhaust gas
concentrations are provided from test bench measurements. For all investigated variants, the
air/fuel ratio (AFR) is 1. As mentioned in chapter 5, the compression ratio is determined via
volumetric measurements. The base engine has a compression ratio of 12.2. Hence, the
reference engine is simulated with the same. The compression ratio of the EE prototype
engine is 11.8. Due to the extended expansion process, the efficiency of the ideal engine with
real charge is slightly under 60% for a compression ratio of 11.8, an AFR of 1 and a residual
gas amount of 2%. The base and the reference engine achieve approximately 48% with a
compression ratio of 12.2 and an AFR of 1. Here, the residual gas amount is 2.5%.
The loss due to real combustion is between 2 and 2.3 percentage points (p.p.) for all
considered engines and in a typical range for 4-stroke SI engines. Considering the gross heat
release rates, the MFB50 (50% of mass fraction burned) point is between 8 and 9°CA after
TDCI and MFB90 (90% of mass fraction burned) between 21 and 23°CA after TDCI for all
engines, which is also quite normal for an SI combustion process. The gross heat release rate
for the reference engine is modelled with Vibe functions, whereas the Vibe shape parameters
are derived from experimental data of the base engine. The combustion behaviour between
EE prototype engine Base engine Reference engine
Eff
icie
ncy
an
d l
oss
es
in %
0
5
10
15
20
25
30
35
40
45
50
55
60
65
EE prototype engine Base engine Reference engine
Eff
icie
ncy
an
d l
oss
es
in %
0
5
10
15
20
25
30
35
40
45
50
55
60
65
Imperfect combustion loss Real combustion loss Wall heat loss Gas exchange loss Indicated efficiency

112 Experimental Investigations
the engines does not differ significantly for this load point. Basically, the combustion mainly
proceeds in a range between -10 to 20°CA. The course of the cylinder volume and, therefore,
the cylinder volume gradients are quite the same for all engines at this area (see Figure 65).
Hence, the increased piston velocity does not affect the EE prototype engine combustion
behaviour at this load point. In Figure 120, gross heat release and integrated gross heat release
over °CA at full load and 5000 rpm are presented for all considered engines.
Figure 120 – Gross heat release and integrated gross heat release of the EE prototype engine
(experimental) in comparison to the base engine (experimental) and the reference engine (simulation)
at full load and 5000 rpm
The losses due to imperfect combustion are approximately 1.8% for the base and the reference
engine. For the EE prototype engine, this loss is significantly increased to approximately
2.8%. At this load point, the HC emission level of approximately 5000 ppm is very high with
approximately 30% above the base engine (cf. also Figure 137). A possible reason for this
behaviour could be the lower mean in-cylinder gas temperature of the EE prototype engine. In
Figure 121, the in-cylinder gas temperatures for all considered engines are presented. The
maximum temperatures are between 2160 and 2220°C. It can be clearly seen that the
temperature gradient, especially after 40°CA a. TDC, is steeper for the EE prototype engine.
The reason is the faster decrease of the cylinder volume. This also results in a lower gas
temperature of approximately 100°C (averaged value between -10 and 100°CA) in
comparison to the base engine. The values of the reference engine are located between the EE
prototype engine and the base engine. Due to the higher wall heat losses, caused by a lower
volume to surface ratio, the temperature gradient is steeper between 40 and 60°CA after TDC.
After 60°CA a. TDC the characteristic is similar to the base engine.
Crankangle in °CA
-30 -20 -10 0 10 20 30 40 50 60 70
Gross
hea
t rele
ase
in
J/°
CA
0
5
10
15
20
25
30
35
40
45
50
55
60
65 EE prototype engine (exp.) Base engine (exp.) Reference engine (sim.)
Inte
gra
ted
gross
hea
t rele
ase
in
J
0
100
200
300
400
500
600
700
800
900
1000
1100
1200
1300

Experimental Investigations 113
Figure 121 – In-cylinder gas temperatures of the EE prototype engine (experimental) in comparison
to the base engine (experimental) and the reference engine (simulation) at full load and 5000 rpm
A distinction between HC emission from scavenging and HC emissions from the imperfect
combustion process is not made. Due to the distinctive valve overlap, it is quite possible that a
considerable amount of unburnt HC directly flow in the exhaust port during gas exchange.
Based on experimental experience of the base engine, this behaviour is especially noticeable
at high loads and low speeds. As the base engine has its maximum engine speed at 9000 rpm,
it is possible that scavenging losses also occur at full load and 5000rpm. This would also
explain the relatively high imperfect combustion losses of the base engine in comparison to
conventional 4-stroke engines with a shorter valve overlap. Furthermore, the piston clearance
of the EE prototype engine in comparison to the base engine is also higher. As a precaution
and based on gathered experience of the base engine, a higher piston clearance was designed
to avoid piston damage. The base engine sometimes has strength problems due to slight piston
seizure which occur around BDC, especially at cold conditions. In this case, the piston
clearance is a bit too small. Considering the even lower expansion end temperature of the EE
prototype engine, the consequences would be more intensive. Therefore, the piston clearance
is slightly increased. This measure likely increases HC emissions.
The gas exchange losses are determined between EVO (exhaust valve opening) and IVC
(intake valve closing). The gas exchange losses of the EE prototype engine with
approximately 4% are on a very high level in comparison to the base and the reference engine.
The GE loss of the base engine is approximately 0.8% which is a remarkable value for a 4-
stroke engine. The GE losses of the reference engine are even lower with approximately
0.5%. The reason is mainly caused by the lower displacement in combination with the same
valve cross section as the base engine. However, the gas exchange losses of the EE prototype
Crank angle in °CA
-60 -40 -20 0 20 40 60 80 100
In-c
yli
nd
er g
as
tem
pera
ture i
n °
C
0
200
400
600
800
1000
1200
1400
1600
1800
2000
2200
2400
EE prototype engine (exp.) Base engine (exp.) Reference engine (sim.)
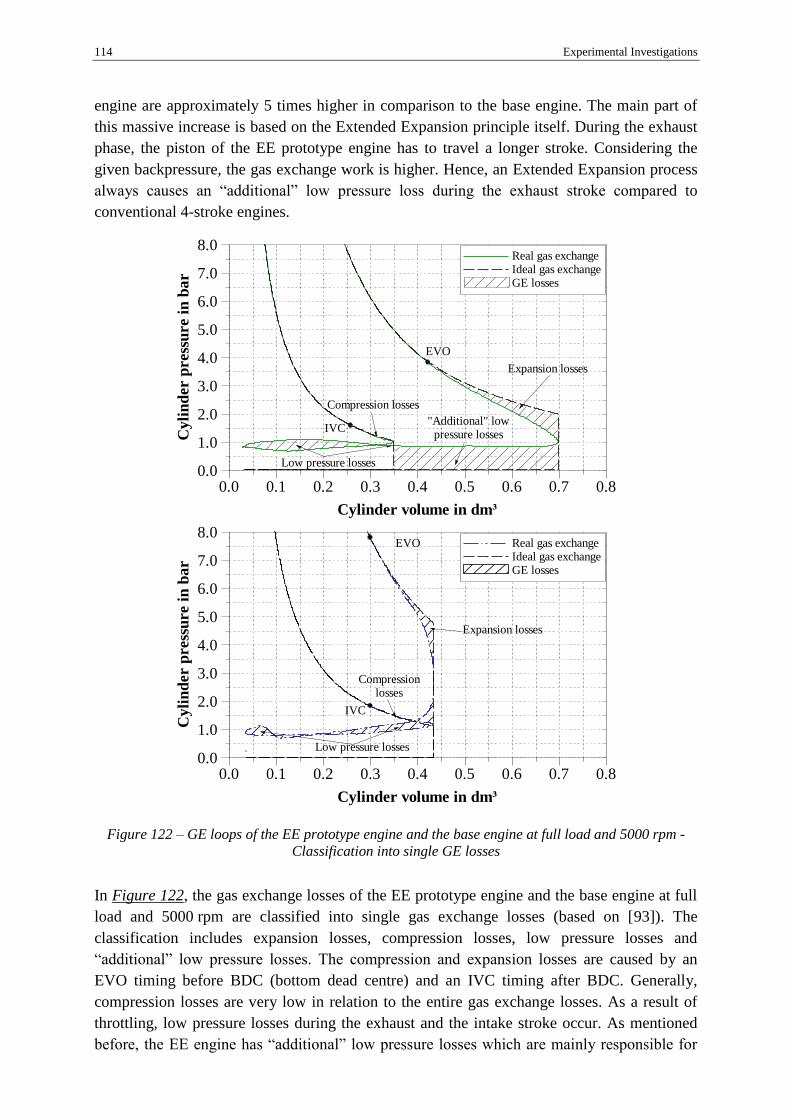
114 Experimental Investigations
engine are approximately 5 times higher in comparison to the base engine. The main part of
this massive increase is based on the Extended Expansion principle itself. During the exhaust
phase, the piston of the EE prototype engine has to travel a longer stroke. Considering the
given backpressure, the gas exchange work is higher. Hence, an Extended Expansion process
always causes an “additional” low pressure loss during the exhaust stroke compared to
conventional 4-stroke engines.
Figure 122 – GE loops of the EE prototype engine and the base engine at full load and 5000 rpm -
Classification into single GE losses
In Figure 122, the gas exchange losses of the EE prototype engine and the base engine at full
load and 5000 rpm are classified into single gas exchange losses (based on [93]). The
classification includes expansion losses, compression losses, low pressure losses and
“additional” low pressure losses. The compression and expansion losses are caused by an
EVO timing before BDC (bottom dead centre) and an IVC timing after BDC. Generally,
compression losses are very low in relation to the entire gas exchange losses. As a result of
throttling, low pressure losses during the exhaust and the intake stroke occur. As mentioned
before, the EE engine has “additional” low pressure losses which are mainly responsible for
IVC
EVO
Expansion losses
Compression losses
Low pressure losses
"Additional" lowpressure lossesC
yli
nd
er p
ress
ure i
n b
ar
0.0
1.0
2.0
3.0
4.0
5.0
6.0
7.0
8.0
Cylinder volume in dm³
0.0 0.1 0.2 0.3 0.4 0.5 0.6 0.7 0.8
Real gas exchange Ideal gas exchange GE losses
IVC
EVO
Expansion losses
Compressionlosses
Low pressure losses
Cyli
nd
er p
ress
ure i
n b
ar
0.0
1.0
2.0
3.0
4.0
5.0
6.0
7.0
8.0
Cylinder volume in dm³
0.0 0.1 0.2 0.3 0.4 0.5 0.6 0.7 0.8
Real gas exchange Ideal gas exchange GE losses
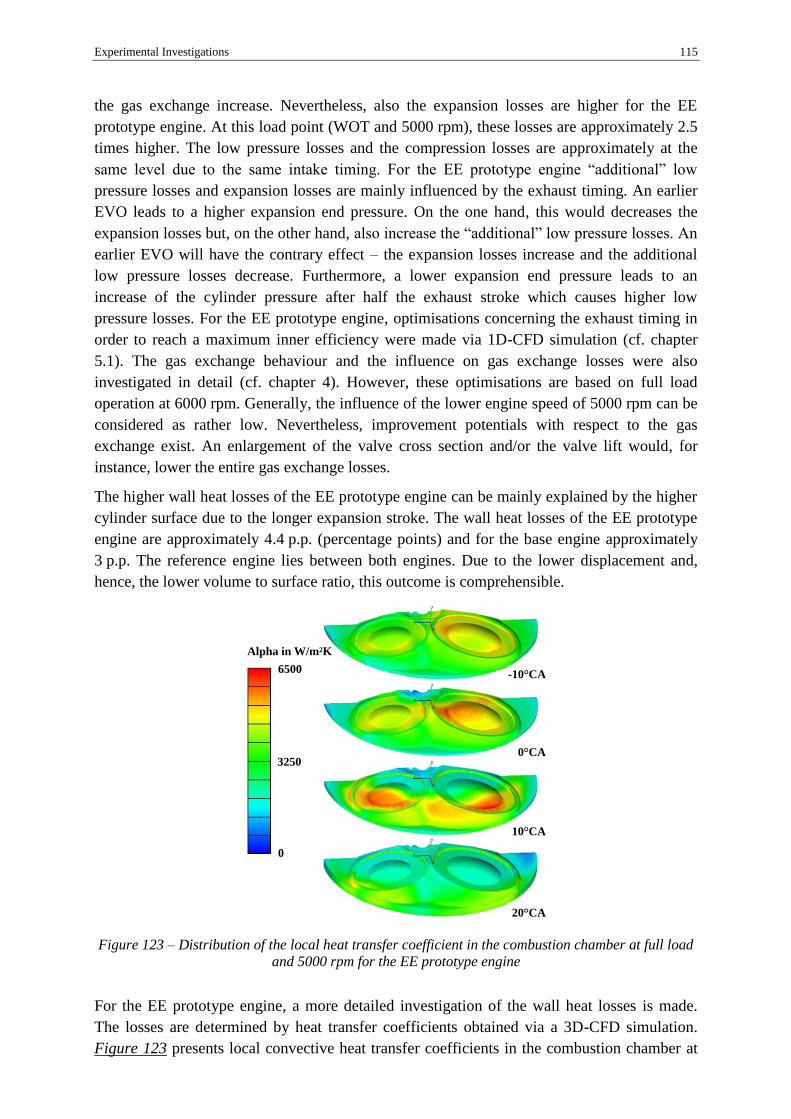
Experimental Investigations 115
the gas exchange increase. Nevertheless, also the expansion losses are higher for the EE
prototype engine. At this load point (WOT and 5000 rpm), these losses are approximately 2.5
times higher. The low pressure losses and the compression losses are approximately at the
same level due to the same intake timing. For the EE prototype engine “additional” low
pressure losses and expansion losses are mainly influenced by the exhaust timing. An earlier
EVO leads to a higher expansion end pressure. On the one hand, this would decreases the
expansion losses but, on the other hand, also increase the “additional” low pressure losses. An
earlier EVO will have the contrary effect – the expansion losses increase and the additional
low pressure losses decrease. Furthermore, a lower expansion end pressure leads to an
increase of the cylinder pressure after half the exhaust stroke which causes higher low
pressure losses. For the EE prototype engine, optimisations concerning the exhaust timing in
order to reach a maximum inner efficiency were made via 1D-CFD simulation (cf. chapter
5.1). The gas exchange behaviour and the influence on gas exchange losses were also
investigated in detail (cf. chapter 4). However, these optimisations are based on full load
operation at 6000 rpm. Generally, the influence of the lower engine speed of 5000 rpm can be
considered as rather low. Nevertheless, improvement potentials with respect to the gas
exchange exist. An enlargement of the valve cross section and/or the valve lift would, for
instance, lower the entire gas exchange losses.
The higher wall heat losses of the EE prototype engine can be mainly explained by the higher
cylinder surface due to the longer expansion stroke. The wall heat losses of the EE prototype
engine are approximately 4.4 p.p. (percentage points) and for the base engine approximately
3 p.p. The reference engine lies between both engines. Due to the lower displacement and,
hence, the lower volume to surface ratio, this outcome is comprehensible.
Figure 123 – Distribution of the local heat transfer coefficient in the combustion chamber at full load
and 5000 rpm for the EE prototype engine
For the EE prototype engine, a more detailed investigation of the wall heat losses is made.
The losses are determined by heat transfer coefficients obtained via a 3D-CFD simulation.
Figure 123 presents local convective heat transfer coefficients in the combustion chamber at
0
6500
3250
Alpha in W/m²K
-10 CA
0 CA
10 CA
20 CA

116 Experimental Investigations
different crank angle positions during the combustion. Areas with very high values represent
the flame front propagation. The estimation of the wall heat losses is based on globally
averaged wall heat values. The integrated wall heat of cylinder, piston, and cylinder head are
shown in Figure 124. The cooling temperature was kept constant (95°C) for all experimental
investigations. Due to the higher gas temperatures, highest wall heat losses occur on piston
and cylinder head. These two characteristics further show that wall heat losses considerably
increase after start of combustion (SOC). Between 50-60°CA after TDCI, these wall heat
losses further increase, but only slightly. The wall heat loss of the cylinder has an almost
linear characteristic and rises, at 30°CA after TDCI. This behaviour can be explained by the
longer expansion stroke and, therefore, the increased cylinder surface.
Figure 124 – Integrated wall heat of cylinder head, cylinder and piston at full load and 5000 rpm
(0°CA is TDCI, -15°CA is SOC)
In summary, the full load operation results at 5000 rpm show a remarkable high efficiency
potential. The EE prototype engine achieves an indicated efficiency of approximately 46%. In
comparison, the base engine reaches approximately 40.4% and the reference engine
approximately 39.7%. Mainly caused by higher wall heat losses, downsizing has a negative
impact on inner efficiency at full load. However, this result is comprehensible because
downsizing is an efficiency-raising part load measure. In the next chapter, the engine speed
influence at full load is presented in more detail.
Crank angle in °CA
-100 -80 -60 -40 -20 0 20 40 60 80 100
Inte
gra
ted
wa
ll h
ea
t in
J
-120
-100
-80
-60
-40
-20
0
20
Summation Cylinder head Cylinder Piston

Experimental Investigations 117
6.2 Engine speed influence
For stationary full load operation, remarkable efficiency results were gained. Now, the
influence of engine speed on efficiency will be investigated. In this sub-chapter, a comparison
between the EE prototype engine and the base engine is carried out. The downsized reference
engine does not offer benefits in full load operation. Therefore, the engine speed behaviour of
the reference engine will not be considered in the following investigations. The full load valve
timing corresponds to the valve timing according to Figure 115 (EE prototype engine) and
Figure 65 (base engine). The ignition timing is chosen to reach approximately the same centre
of combustion. The MFB50 point lies between 8 and 9°CA a. TDCI for both engines.
Figure 125 – Indicated power and indicated mean effective pressure (IMEP) at full load over engine
speed (EE prototype engine vs. base engine)
Figure 125 shows the indicated power and the indicated mean effective pressure (IMEP) at
full load over engine speed for the EE prototype engine and the base engine. Both engines
reach approximately the same indicated power at WOT operation. Hence, the indicated work
is also the same. The IMEP is based on the intake displacement (cf. chapter 4.2). The intake
displacement per cylinder is 400 cm³ for the base engine and 320 cm³ for the EE prototype
engine. Consequently, the IMEP is higher for the EE prototype engine. The base engine has
its maximum full load IMEP at approximately 5500 rpm. Due to the same intake geometries
and intake valve timing, the charge behaviour of the base engine is quite similar to the EE
prototype engine.
Engine speed in rpm
2000 2500 3000 3500 4000 4500 5000
Ind
icate
d p
ow
er i
n k
W
0
10
20
30
40
50
60 EE prototype engine (exp.) Base engine (exp.)
Ind
ica
ted
mea
n
eff
ecti
ve p
ress
ure i
n b
ar
0.0
2.5
5.0
7.5
10.0
12.5
15.0
17.5
20.0
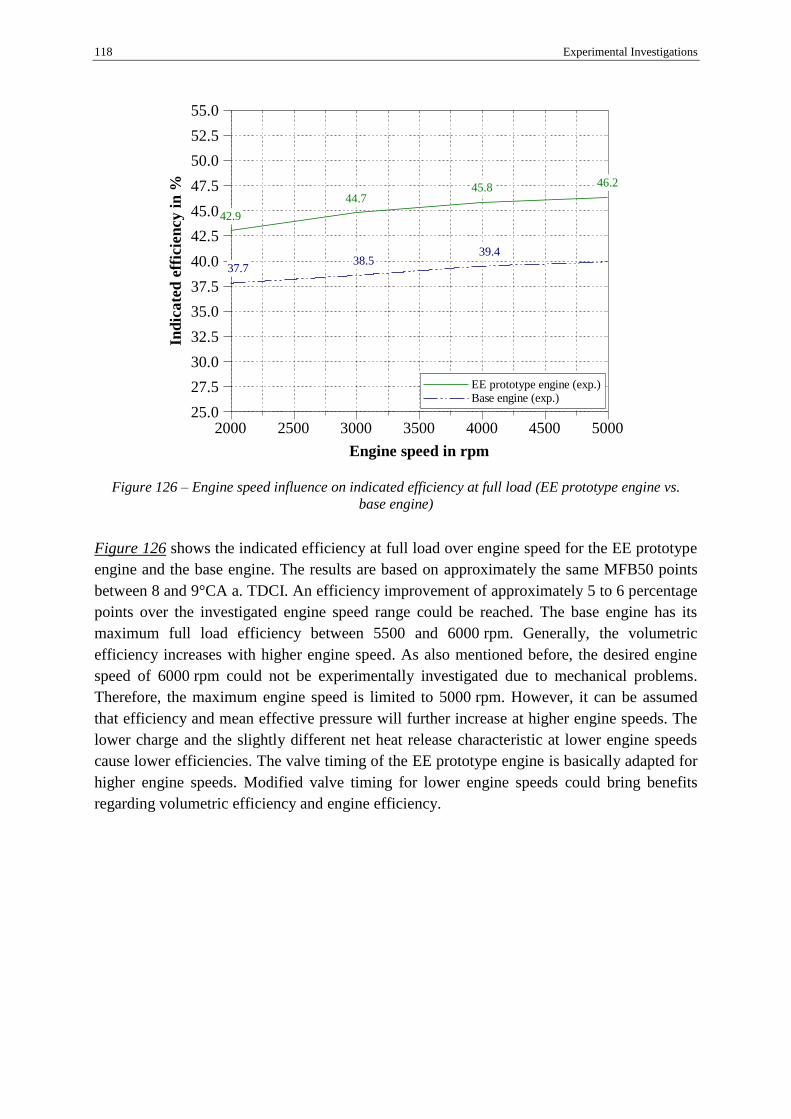
118 Experimental Investigations
Figure 126 – Engine speed influence on indicated efficiency at full load (EE prototype engine vs.
base engine)
Figure 126 shows the indicated efficiency at full load over engine speed for the EE prototype
engine and the base engine. The results are based on approximately the same MFB50 points
between 8 and 9°CA a. TDCI. An efficiency improvement of approximately 5 to 6 percentage
points over the investigated engine speed range could be reached. The base engine has its
maximum full load efficiency between 5500 and 6000 rpm. Generally, the volumetric
efficiency increases with higher engine speed. As also mentioned before, the desired engine
speed of 6000 rpm could not be experimentally investigated due to mechanical problems.
Therefore, the maximum engine speed is limited to 5000 rpm. However, it can be assumed
that efficiency and mean effective pressure will further increase at higher engine speeds. The
lower charge and the slightly different net heat release characteristic at lower engine speeds
cause lower efficiencies. The valve timing of the EE prototype engine is basically adapted for
higher engine speeds. Modified valve timing for lower engine speeds could bring benefits
regarding volumetric efficiency and engine efficiency.
Engine speed in rpm
2000 2500 3000 3500 4000 4500 5000
Ind
ica
ted
eff
icie
ncy i
n %
25.0
27.5
30.0
32.5
35.0
37.5
40.0
42.5
45.0
47.5
50.0
52.5
55.0
EE prototype engine (exp.) Base engine (exp.)
42.9
44.745.8 46.2
37.738.5
39.4
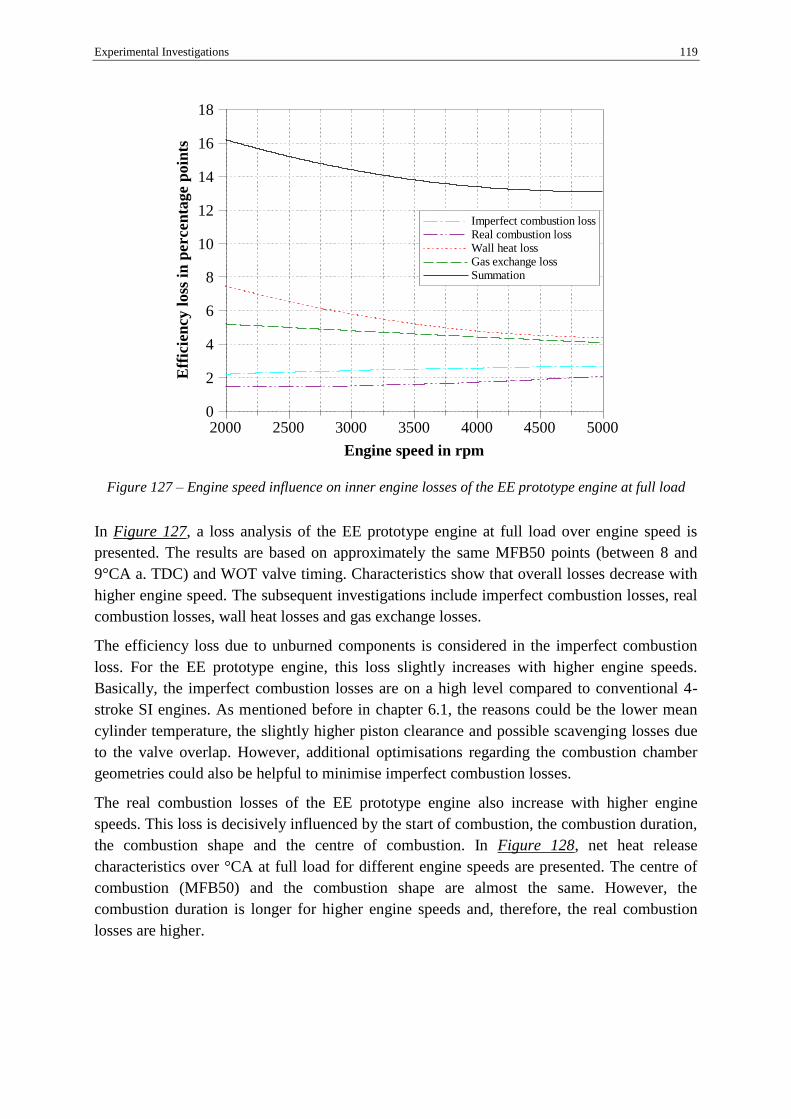
Experimental Investigations 119
Figure 127 – Engine speed influence on inner engine losses of the EE prototype engine at full load
In Figure 127, a loss analysis of the EE prototype engine at full load over engine speed is
presented. The results are based on approximately the same MFB50 points (between 8 and
9°CA a. TDC) and WOT valve timing. Characteristics show that overall losses decrease with
higher engine speed. The subsequent investigations include imperfect combustion losses, real
combustion losses, wall heat losses and gas exchange losses.
The efficiency loss due to unburned components is considered in the imperfect combustion
loss. For the EE prototype engine, this loss slightly increases with higher engine speeds.
Basically, the imperfect combustion losses are on a high level compared to conventional 4-
stroke SI engines. As mentioned before in chapter 6.1, the reasons could be the lower mean
cylinder temperature, the slightly higher piston clearance and possible scavenging losses due
to the valve overlap. However, additional optimisations regarding the combustion chamber
geometries could also be helpful to minimise imperfect combustion losses.
The real combustion losses of the EE prototype engine also increase with higher engine
speeds. This loss is decisively influenced by the start of combustion, the combustion duration,
the combustion shape and the centre of combustion. In Figure 128, net heat release
characteristics over °CA at full load for different engine speeds are presented. The centre of
combustion (MFB50) and the combustion shape are almost the same. However, the
combustion duration is longer for higher engine speeds and, therefore, the real combustion
losses are higher.
Engine speed in rpm
2000 2500 3000 3500 4000 4500 5000
Eff
icie
ncy
loss
in
percen
tage p
oin
ts
0
2
4
6
8
10
12
14
16
18
Imperfect combustion loss Real combustion loss Wall heat loss Gas exchange loss Summation

120 Experimental Investigations
Figure 128 – Net heat release characteristics of the EE prototype engine at full load for different
engine speeds
Real combustion losses always relate to wall heat losses. A fast combustion minimizes the
real combustion losses, but at the same time also increases the wall heat losses. This tendency
is also noticeable for an Extended Expansion operating principle. However, the wall heat
losses represent the highest internal losses and can be mainly explained by the higher cylinder
surface.
As a consequence of slightly different net heat release rates and different peak cylinder
pressure values, different cylinder pressure characteristics result after the expansion phase
and, hence, influence the gas exchange. As mentioned before, the gas exchange losses of the
EE prototype engine at full load and 5000 rpm are above average (cf. Figure 119 and Figure
122). In Figure 129, the gas exchange behaviour over engine speed at full load for the EE
prototype engine and the base engine are presented. The gas exchange losses of the EE
prototype engine are approximately 4 to 5.2 p.p. over the investigated speed range. In
comparison to the base engine, which has an excellent gas exchange behaviour, the losses are
approximately 500 to 600% higher. The main part of this massive increase is based on the EE
principle itself - beside the increase of the inner work also the gas exchange losses increase
due to the longer piston stroke.
Crank angle in °CA
-30 -20 -10 0 10 20 30 40 50 60
Net
hea
t rele
ase
in
J/°
CA
-5
0
5
10
15
20
25
30
35 WOT / 2000rpm WOT / 3400rpm WOT / 4000rpm WOT / 5000rpm
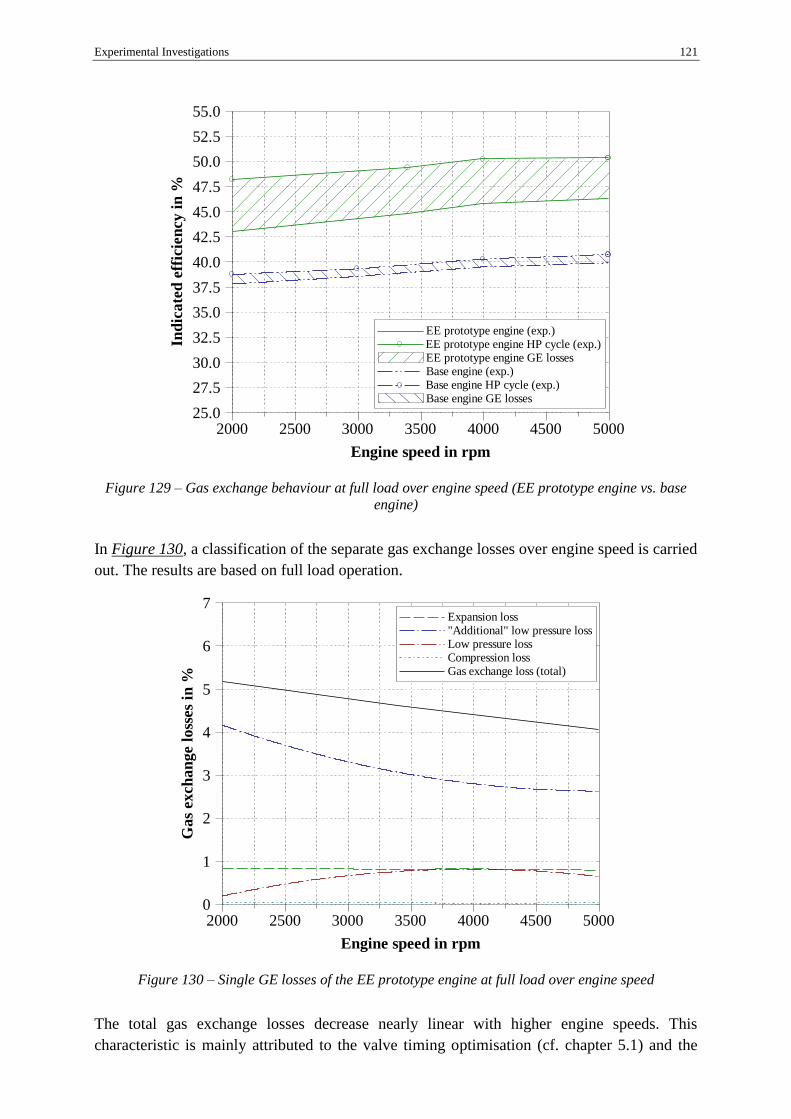
Experimental Investigations 121
Figure 129 – Gas exchange behaviour at full load over engine speed (EE prototype engine vs. base
engine)
In Figure 130, a classification of the separate gas exchange losses over engine speed is carried
out. The results are based on full load operation.
Figure 130 – Single GE losses of the EE prototype engine at full load over engine speed
The total gas exchange losses decrease nearly linear with higher engine speeds. This
characteristic is mainly attributed to the valve timing optimisation (cf. chapter 5.1) and the
Engine speed in rpm
2000 2500 3000 3500 4000 4500 5000
Ind
ica
ted
eff
icie
ncy i
n %
25.0
27.5
30.0
32.5
35.0
37.5
40.0
42.5
45.0
47.5
50.0
52.5
55.0
EE prototype engine (exp.) EE prototype engine HP cycle (exp.) EE prototype engine GE losses Base engine (exp.) Base engine HP cycle (exp.) Base engine GE losses
Engine speed in rpm
2000 2500 3000 3500 4000 4500 5000
Ga
s exch
an
ge l
oss
es
in %
0
1
2
3
4
5
6
7 Expansion loss "Additional" low pressure loss Low pressure loss Compression loss Gas exchange loss (total)

122 Experimental Investigations
intake and exhaust port geometries. As mentioned in chapter 5, the cylinder head of the base
engine is also used for the EE prototype engine. Because of the usage in a motorcycle (high-
speed engine layout), the port geometries are optimised for higher engine speeds. Besides, the
base engine has also its best fuel consumption at a speed range between 5000 and 6000 rpm.
Hence, the valve timing is also optimised for this speed range. Generally, the expansion losses
remain almost constant over the engine speed. The low pressure losses show the inverse
characteristic compared to the “additional” low pressure losses which represent the main part
of the GE losses. The “additional” low pressure losses are mainly based on the longer exhaust
stroke. However, due to the valve timing optimisation the “additional” low pressure losses are
lower for higher engine speeds. However, both losses are affected by the EVO timing. A
parallel consideration of the single GE losses for 5000 and 2000 rpm (Figure 131 and Figure
132) shows this behaviour. The EVO timing is the same for both engine speeds.
Figure 131 – Single GE losses of the EE prototype engine at full load and 5000 rpm
For 5000 rpm the gas exchange behaviour during half the exhaust stroke is quite optimal
because of the nearly isobaric change of state. Afterwards, the cylinder pressure increases and
leads to higher low pressure losses. An earlier EVO could improve the low pressure losses at
full load by avoiding the pressure increase after half the exhaust stroke. However, this would
also lead to higher “additional” low pressure losses due to possible pumping losses at the
exhaust phase. Basically, a later EVO timing would result in an earlier (before half the
exhaust stroke) pressure increase and, again, in an increase of the “additional” low pressure
losses. Nevertheless, a later EVO improves the part load efficiency. The reasons for this
behaviour are presented in more detail in chapter 6.5. However, at full load and 5000 rpm the
GE losses are a minimum when using this EVO timing.
IVC
EVO
Expansion losses
Compression losses
Low pressure losses
"Additional" lowpressure lossesC
yli
nd
er p
ress
ure i
n b
ar
0.0
1.0
2.0
3.0
4.0
5.0
6.0
7.0
8.0
Cylinder volume in dm³
0.0 0.1 0.2 0.3 0.4 0.5 0.6 0.7 0.8
Real gas exchange Ideal gas exchange GE losses
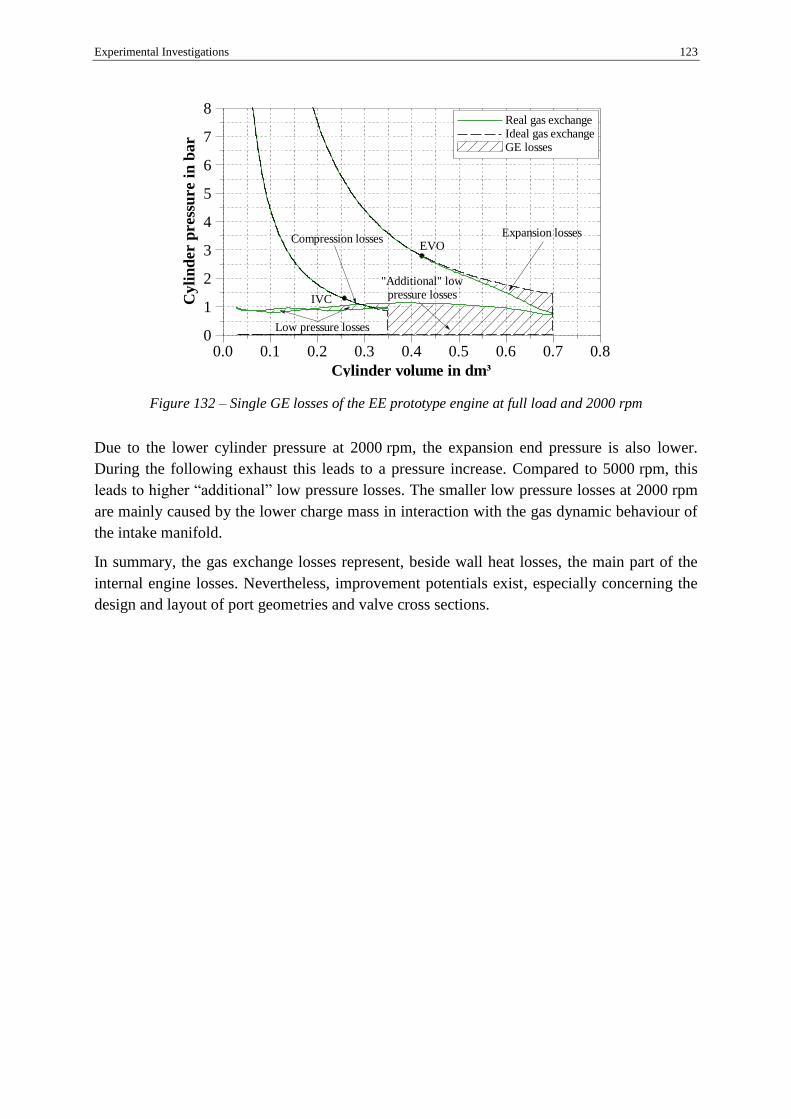
Experimental Investigations 123
Figure 132 – Single GE losses of the EE prototype engine at full load and 2000 rpm
Due to the lower cylinder pressure at 2000 rpm, the expansion end pressure is also lower.
During the following exhaust this leads to a pressure increase. Compared to 5000 rpm, this
leads to higher “additional” low pressure losses. The smaller low pressure losses at 2000 rpm
are mainly caused by the lower charge mass in interaction with the gas dynamic behaviour of
the intake manifold.
In summary, the gas exchange losses represent, beside wall heat losses, the main part of the
internal engine losses. Nevertheless, improvement potentials exist, especially concerning the
design and layout of port geometries and valve cross sections.
IVC
EVOExpansion losses
Compression losses
Low pressure losses
"Additional" lowpressure lossesC
yli
nd
er p
ress
ure i
n b
ar
0
1
2
3
4
5
6
7
8
Cylinder volume in dm³
0.0 0.1 0.2 0.3 0.4 0.5 0.6 0.7 0.8
Real gas exchange Ideal gas exchange GE losses

124 Experimental Investigations
6.3 Load influence
The investigations regarding the load influence include four load points which are measured
at 2000 rpm. The IMEP full load is at approximately 11 bar (load point 1) and the part load
point at approximately 3.5bar (load point 4). Further, the measured load points are based on
approximately the same MFB50 points between 9 (load points 1, 2 and 3) and 10°CA after
TDCI (load point 4).
Figure 133 – Load influence of the EE prototype engine at 2000 rpm
Extended Expansion is very efficient, especially for high loads. This characteristic can be seen
in Figure 133 in which the load influence at 2000 rpm and full load valve timing is presented.
Due to increasing gas exchange losses (in comparison to the high pressure work), the engine
efficiency is decreasing at lower loads. Gas exchange losses of conventional SI engines
mainly occur in the intake phase. Considering the EE cycle, considerable losses also arise
during the exhaust phase. Figure 134 shows the gas exchange loops of the EE prototype
engine from low to high loads.
12
3
4
Indicated mean effective pressure in bar
3 4 5 6 7 8 9 10 11 12
Ind
ica
ted
eff
icie
ncy i
n %
25.0
27.5
30.0
32.5
35.0
37.5
40.0
42.5
45.0
47.5
50.0
52.5
55.0 Indicated efficiency Indicated efficiency (HP cycle) GE losses
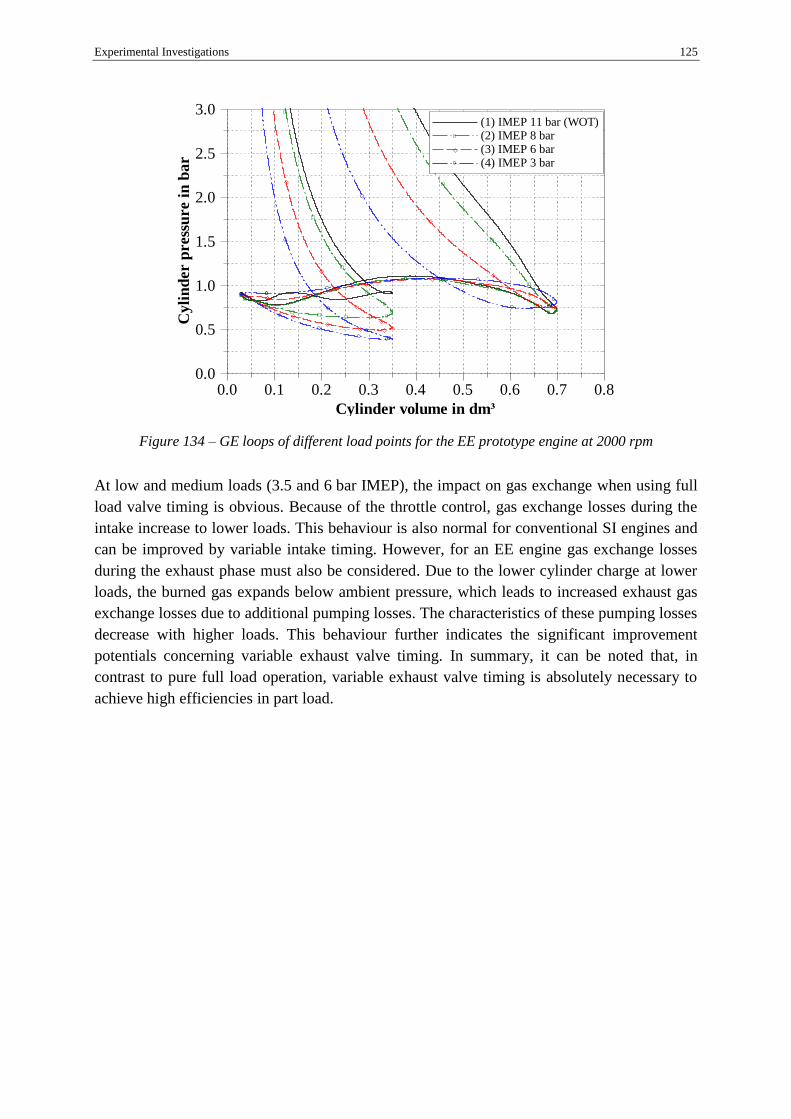
Experimental Investigations 125
Figure 134 – GE loops of different load points for the EE prototype engine at 2000 rpm
At low and medium loads (3.5 and 6 bar IMEP), the impact on gas exchange when using full
load valve timing is obvious. Because of the throttle control, gas exchange losses during the
intake increase to lower loads. This behaviour is also normal for conventional SI engines and
can be improved by variable intake timing. However, for an EE engine gas exchange losses
during the exhaust phase must also be considered. Due to the lower cylinder charge at lower
loads, the burned gas expands below ambient pressure, which leads to increased exhaust gas
exchange losses due to additional pumping losses. The characteristics of these pumping losses
decrease with higher loads. This behaviour further indicates the significant improvement
potentials concerning variable exhaust valve timing. In summary, it can be noted that, in
contrast to pure full load operation, variable exhaust valve timing is absolutely necessary to
achieve high efficiencies in part load.
Cylinder volume in dm³
0.0 0.1 0.2 0.3 0.4 0.5 0.6 0.7 0.8
Cyli
nd
er p
ress
ure i
n b
ar
0.0
0.5
1.0
1.5
2.0
2.5
3.0 (1) IMEP 11 bar (WOT) (2) IMEP 8 bar (3) IMEP 6 bar (4) IMEP 3 bar
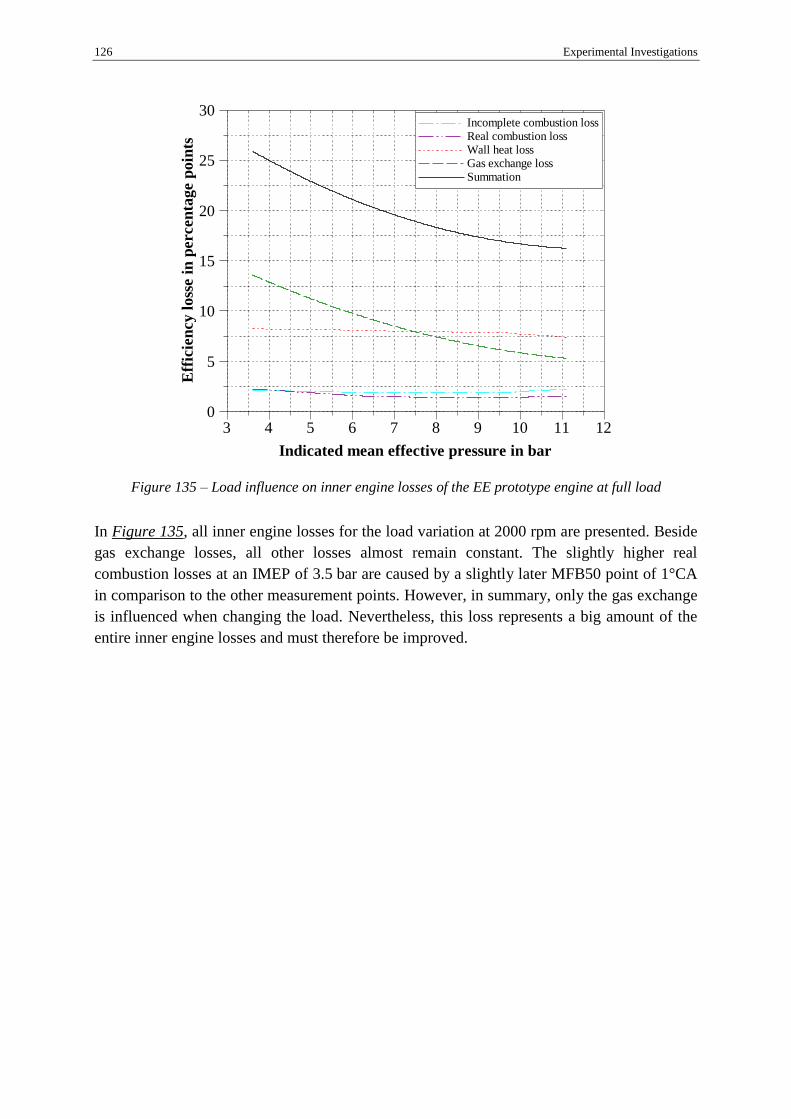
126 Experimental Investigations
Figure 135 – Load influence on inner engine losses of the EE prototype engine at full load
In Figure 135, all inner engine losses for the load variation at 2000 rpm are presented. Beside
gas exchange losses, all other losses almost remain constant. The slightly higher real
combustion losses at an IMEP of 3.5 bar are caused by a slightly later MFB50 point of 1°CA
in comparison to the other measurement points. However, in summary, only the gas exchange
is influenced when changing the load. Nevertheless, this loss represents a big amount of the
entire inner engine losses and must therefore be improved.
Indicated mean effective pressure in bar
3 4 5 6 7 8 9 10 11 12
Eff
icie
ncy l
oss
e i
n p
ercen
tag
e p
oin
ts
0
5
10
15
20
25
30 Incomplete combustion loss Real combustion loss Wall heat loss Gas exchange loss Summation
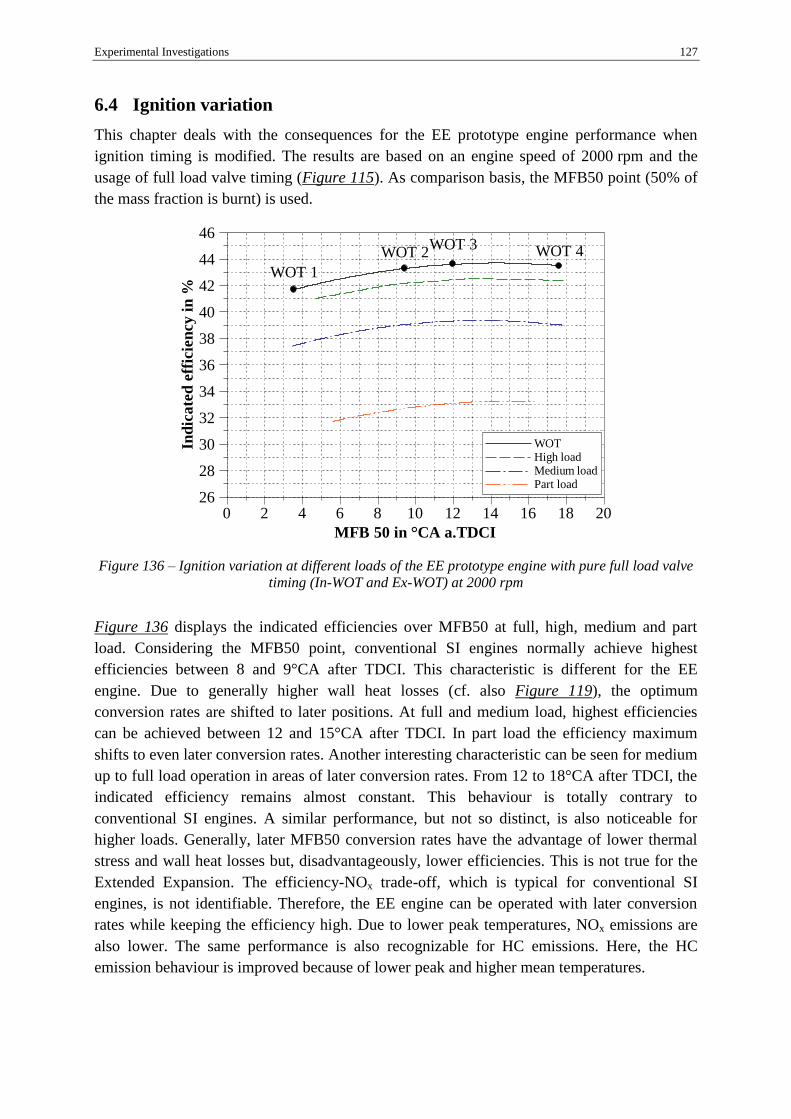
Experimental Investigations 127
6.4 Ignition variation
This chapter deals with the consequences for the EE prototype engine performance when
ignition timing is modified. The results are based on an engine speed of 2000 rpm and the
usage of full load valve timing (Figure 115). As comparison basis, the MFB50 point (50% of
the mass fraction is burnt) is used.
Figure 136 – Ignition variation at different loads of the EE prototype engine with pure full load valve
timing (In-WOT and Ex-WOT) at 2000 rpm
Figure 136 displays the indicated efficiencies over MFB50 at full, high, medium and part
load. Considering the MFB50 point, conventional SI engines normally achieve highest
efficiencies between 8 and 9°CA after TDCI. This characteristic is different for the EE
engine. Due to generally higher wall heat losses (cf. also Figure 119), the optimum
conversion rates are shifted to later positions. At full and medium load, highest efficiencies
can be achieved between 12 and 15°CA after TDCI. In part load the efficiency maximum
shifts to even later conversion rates. Another interesting characteristic can be seen for medium
up to full load operation in areas of later conversion rates. From 12 to 18°CA after TDCI, the
indicated efficiency remains almost constant. This behaviour is totally contrary to
conventional SI engines. A similar performance, but not so distinct, is also noticeable for
higher loads. Generally, later MFB50 conversion rates have the advantage of lower thermal
stress and wall heat losses but, disadvantageously, lower efficiencies. This is not true for the
Extended Expansion. The efficiency-NOx trade-off, which is typical for conventional SI
engines, is not identifiable. Therefore, the EE engine can be operated with later conversion
rates while keeping the efficiency high. Due to lower peak temperatures, NOx emissions are
also lower. The same performance is also recognizable for HC emissions. Here, the HC
emission behaviour is improved because of lower peak and higher mean temperatures.
WOT 1
WOT 2WOT 3 WOT 4
MFB 50 in °CA a.TDCI
0 2 4 6 8 10 12 14 16 18 20
Ind
ica
ted
eff
icie
ncy
in
%
26
28
30
32
34
36
38
40
42
44
46
WOT High load Medium load Part load

128 Experimental Investigations
Figure 137 – HC and NOx emissions over MFB50 of the EE prototype engine at full load and
2000 rpm
In Figure 137, HC (based on C1 measurement) and NOx emissions over MFB50 in full load
at 2000 rpm are shown. If the EE engine has the MFB50 at 18°CA instead of 8°CA after
TDCI, HC emissions can be decreased by approximately 7.5% and NOx emissions by
approximately 15.5% without any efficiency losses. But, it should also be noted that the
absolute emission values are generally on a very high level. Beside the lower mean-cylinder
temperature (cf. Figure 121), a possible reason for higher HC emissions could also lie in the
higher piston clearance of the EE prototype engine in comparison to the base engine. As
mentioned before, a larger piston clearance was designed as precaution measure.
Nevertheless, this measure likely increases HC emissions. In addition, optimisations
regarding the combustion chamber geometries could also be helpful to enhance the HC
emission behaviour.
In Figure 138, cylinder pressure characteristics and pV-diagrams of the defined full load
operation points at 2000 rpm are shown. As expected, early positions of MFB50 result in
higher cylinder peak pressure values and vice versa. In full load operation and 2000 rpm, the
ignition timing has only a minor influence on the gas exchange. However, the gas exchange
performance is bad. With full load valve timing, a considerable pressure increase during the
exhaust phase is noticeable. Furthermore, the intake timing also reveals significant
optimisation potentials (A more detailed consideration of this topic is given in chapter 6.5).
MFB50 in °CA a. TDCI
0 2 4 6 8 10 12 14 16 18 20
HC
an
d N
Ox
em
issi
on
s in
pp
m
2500
3000
3500
4000
4500
5000
5500
6000
6500
7000
7500 HC emissions NOx emissions
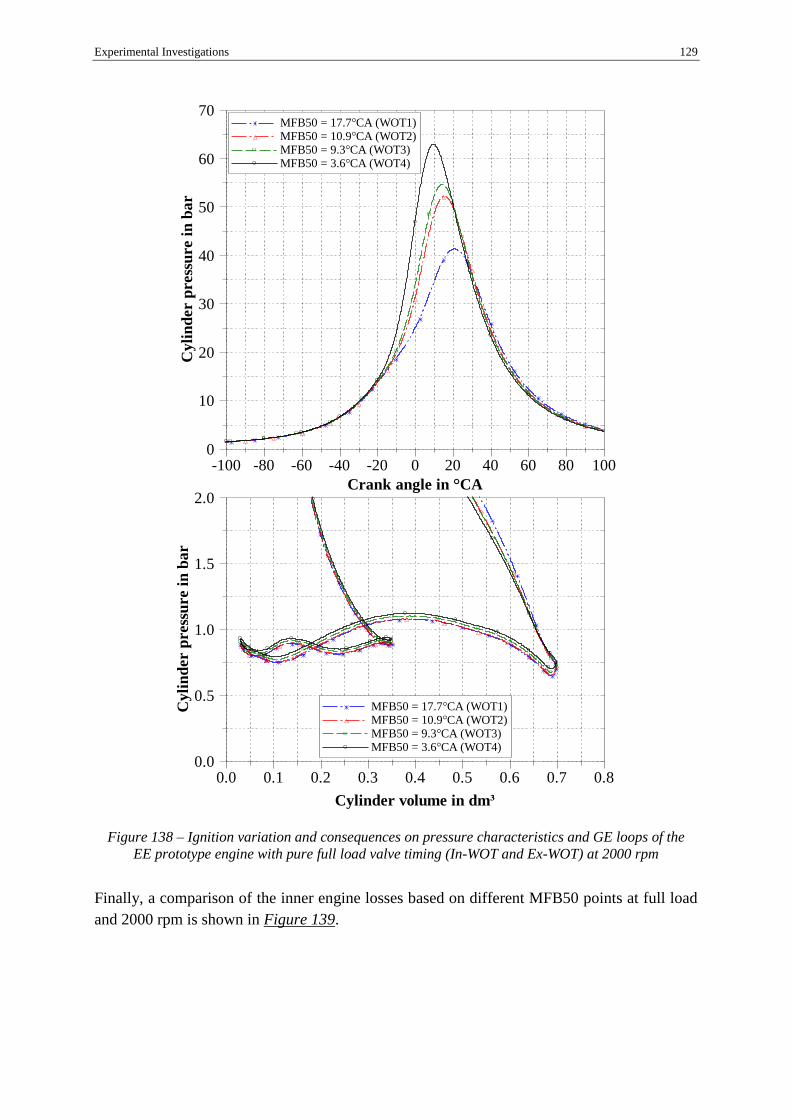
Experimental Investigations 129
Figure 138 – Ignition variation and consequences on pressure characteristics and GE loops of the
EE prototype engine with pure full load valve timing (In-WOT and Ex-WOT) at 2000 rpm
Finally, a comparison of the inner engine losses based on different MFB50 points at full load
and 2000 rpm is shown in Figure 139.
Crank angle in °CA
-100 -80 -60 -40 -20 0 20 40 60 80 100
Cy
lin
der p
ress
ure i
n b
ar
0
10
20
30
40
50
60
70 MFB50 = 17.7°CA (WOT1) MFB50 = 10.9°CA (WOT2) MFB50 = 9.3°CA (WOT3) MFB50 = 3.6°CA (WOT4)
Cylinder volume in dm³
0.0 0.1 0.2 0.3 0.4 0.5 0.6 0.7 0.8
Cy
lin
der p
ress
ure i
n b
ar
0.0
0.5
1.0
1.5
2.0
MFB50 = 17.7°CA (WOT1) MFB50 = 10.9°CA (WOT2) MFB50 = 9.3°CA (WOT3) MFB50 = 3.6°CA (WOT4)
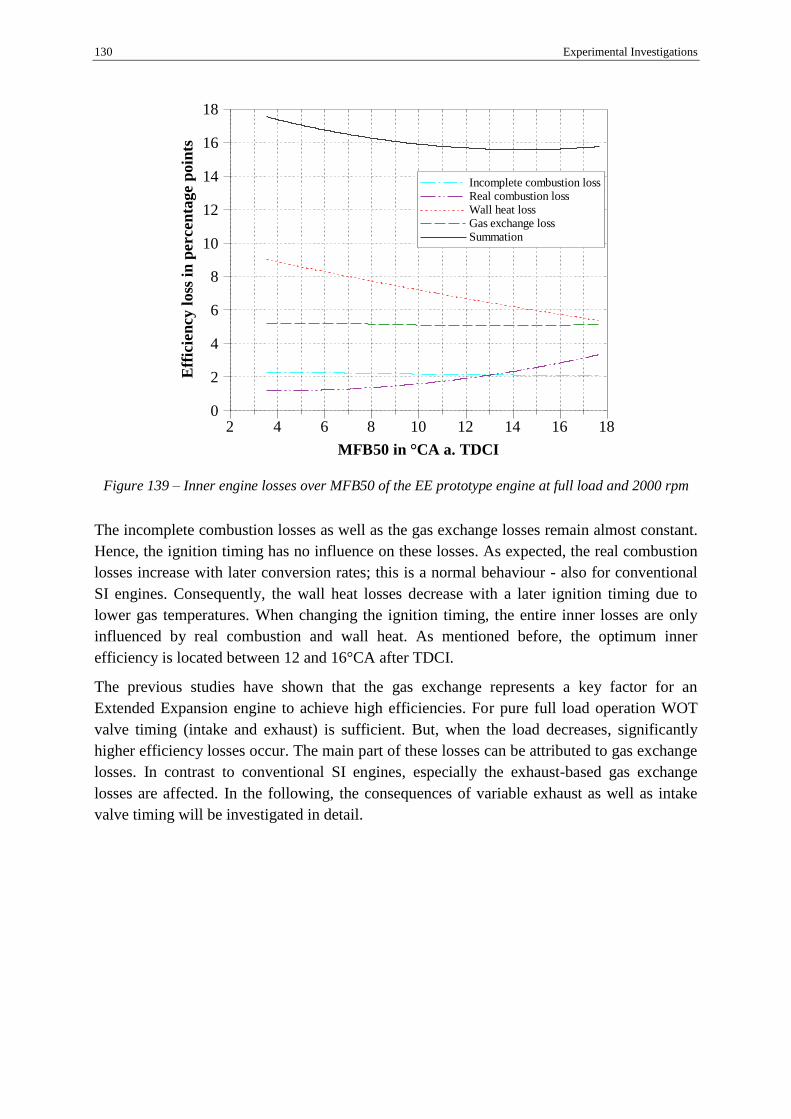
130 Experimental Investigations
Figure 139 – Inner engine losses over MFB50 of the EE prototype engine at full load and 2000 rpm
The incomplete combustion losses as well as the gas exchange losses remain almost constant.
Hence, the ignition timing has no influence on these losses. As expected, the real combustion
losses increase with later conversion rates; this is a normal behaviour - also for conventional
SI engines. Consequently, the wall heat losses decrease with a later ignition timing due to
lower gas temperatures. When changing the ignition timing, the entire inner losses are only
influenced by real combustion and wall heat. As mentioned before, the optimum inner
efficiency is located between 12 and 16°CA after TDCI.
The previous studies have shown that the gas exchange represents a key factor for an
Extended Expansion engine to achieve high efficiencies. For pure full load operation WOT
valve timing (intake and exhaust) is sufficient. But, when the load decreases, significantly
higher efficiency losses occur. The main part of these losses can be attributed to gas exchange
losses. In contrast to conventional SI engines, especially the exhaust-based gas exchange
losses are affected. In the following, the consequences of variable exhaust as well as intake
valve timing will be investigated in detail.
MFB50 in °CA a. TDCI
2 4 6 8 10 12 14 16 18
Eff
icie
ncy
lo
ss i
n p
ercen
tag
e p
oin
ts
0
2
4
6
8
10
12
14
16
18
Incomplete combustion loss Real combustion loss Wall heat loss Gas exchange loss Summation

Experimental Investigations 131
6.5 Part load behaviour
For an Extended Expansion engine, the exhaust valve timing is especially essential to achieve
high efficiency in the entire engine map. As already mentioned, a CER of 0.5 leads to very
high efficiencies at full load, but when using full load valve timing, higher gas exchange
losses occur in part load. To avoid this effect and simultaneously raise the efficiency also in
part load, variable valve timing is necessary. Previous 1D-CFD investigations have shown
that a late exhaust open timing and a short opening duration could be helpful (cf. chapter 4.4).
On the basis of these studies, the valve timing at part load was adapted (cf. Figure 115).
The following studies include a comparison of different valve timing strategies for part load
operation. The valve timing variation concerns the exhaust as well as the intake timing. In
Table 10 all investigated engines and the different valve timing strategies are shown:
Denotation Intake timing Exhaust timing
1 EE In-WOT & Ex-WOT EE In-WOT EE Ex-WOT
2 EE In-WOT & Ex-PL EE In-WOT EE Ex-PL
3 EE In-deth & Ex-PL EE In-deth EE Ex-PL
4 Reference engine Base In-WOT Base Ex-WOT
5 Base engine Base In-WOT Base Ex-WOT
Table 10 – Investigated PL valve timing variants for the experimental tests
The simulated reference engine with series valve timing (cf. chapter 6.1) and the
experimentally measured base engine serve as comparison basis. The intake displacement of
the base engine is 400 cm³. For the reference engine the intake displacement is 320 cm³ and,
thus, the same as for the EE prototype engine. Therefore, the downsizing benefit for the EE
prototype engine in part load compared to the reference engine is equalised. For the EE
prototype engine three different valve timings are investigated. The first one includes WOT
valve timing for intake and exhaust. In chapter 6.3 and chapter 6.4 results for this valve timing
are already analysed. Here, these results will be again presented and compared with other
valve timing variants. The second variation features modified exhaust valve timing with a late
exhaust opening timing and a short opening duration. During the numerical simulations
(chapter 4.4), a valve timing variant with PL intake and exhaust timing (see Figure 69) was
also investigated. This valve timing strategy was also experimentally tested, but no efficiency
benefit could be identified. Therefore, this measure is excluded from the following studies. A
well-known strategy to enhance part load efficiency for SI engines is de-throttling. This
measure can also be applied for an Extended Expansion process. Therefore, the third variant
includes an appropriate de-throttling intake timing to further enhance part load efficiency.
In order to establish a comparison basis for the part load results, the indicated mean effective
pressure (IMEP) is chosen. The part load point for all investigated variants is 3 bar IMEP and
2000 rpm, which corresponds to 2 bar BMEP and 2000 rpm for the base engine. The FMEP
of the reference engine is assumed with the same value as the base engine. Hence, the
effective load point is also the same. The EE prototype engine variants with full load intake
timing (In-WOT) are throttled in order to achieve an IMEP of 3 bar. With appropriate cam
geometries for the de-throttled EE variant (see In-deth & Ex-PL in Figure 115) and a fully
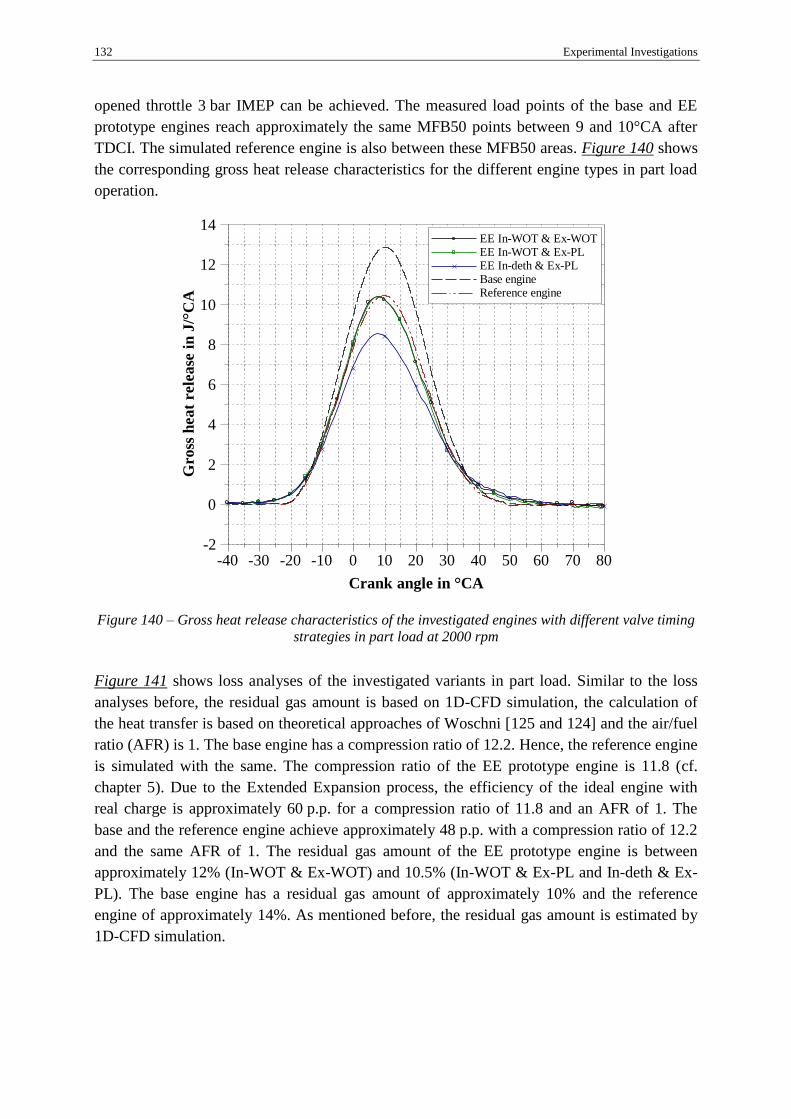
132 Experimental Investigations
opened throttle 3 bar IMEP can be achieved. The measured load points of the base and EE
prototype engines reach approximately the same MFB50 points between 9 and 10°CA after
TDCI. The simulated reference engine is also between these MFB50 areas. Figure 140 shows
the corresponding gross heat release characteristics for the different engine types in part load
operation.
Figure 140 – Gross heat release characteristics of the investigated engines with different valve timing
strategies in part load at 2000 rpm
Figure 141 shows loss analyses of the investigated variants in part load. Similar to the loss
analyses before, the residual gas amount is based on 1D-CFD simulation, the calculation of
the heat transfer is based on theoretical approaches of Woschni [125 and 124] and the air/fuel
ratio (AFR) is 1. The base engine has a compression ratio of 12.2. Hence, the reference engine
is simulated with the same. The compression ratio of the EE prototype engine is 11.8 (cf.
chapter 5). Due to the Extended Expansion process, the efficiency of the ideal engine with
real charge is approximately 60 p.p. for a compression ratio of 11.8 and an AFR of 1. The
base and the reference engine achieve approximately 48 p.p. with a compression ratio of 12.2
and the same AFR of 1. The residual gas amount of the EE prototype engine is between
approximately 12% (In-WOT & Ex-WOT) and 10.5% (In-WOT & Ex-PL and In-deth & Ex-
PL). The base engine has a residual gas amount of approximately 10% and the reference
engine of approximately 14%. As mentioned before, the residual gas amount is estimated by
1D-CFD simulation.
EVO
EVO
EVO
Crank angle in °CA
-40 -30 -20 -10 0 10 20 30 40 50 60 70 80
Gro
ss h
ea
t rele
ase
in
J/°
CA
-2
0
2
4
6
8
10
12
14 EE In-WOT & Ex-WOT EE In-WOT & Ex-PL EE In-deth & Ex-PL Base engine Reference engine
Cylinder volume in dm³
0.0 0.1 0.2 0.3 0.4 0.5 0.6 0.7 0.8
Cy
lin
der p
ress
ure i
n b
ar
0.0
0.5
1.0
1.5
2.0 EE In-WOT & Ex-WOT EE In-WOT & Ex-PL EE In-deth & Ex-PL Base engine Reference engine
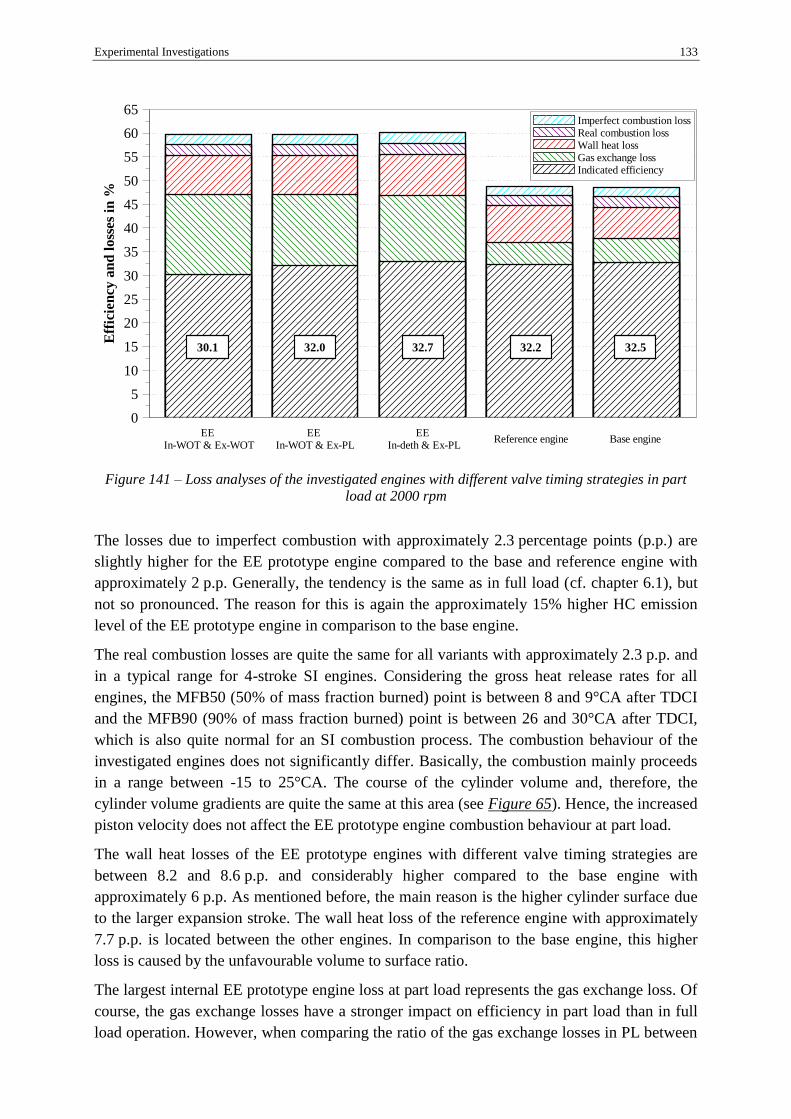
Experimental Investigations 133
Figure 141 – Loss analyses of the investigated engines with different valve timing strategies in part
load at 2000 rpm
The losses due to imperfect combustion with approximately 2.3 percentage points (p.p.) are
slightly higher for the EE prototype engine compared to the base and reference engine with
approximately 2 p.p. Generally, the tendency is the same as in full load (cf. chapter 6.1), but
not so pronounced. The reason for this is again the approximately 15% higher HC emission
level of the EE prototype engine in comparison to the base engine.
The real combustion losses are quite the same for all variants with approximately 2.3 p.p. and
in a typical range for 4-stroke SI engines. Considering the gross heat release rates for all
engines, the MFB50 (50% of mass fraction burned) point is between 8 and 9°CA after TDCI
and the MFB90 (90% of mass fraction burned) point is between 26 and 30°CA after TDCI,
which is also quite normal for an SI combustion process. The combustion behaviour of the
investigated engines does not significantly differ. Basically, the combustion mainly proceeds
in a range between -15 to 25°CA. The course of the cylinder volume and, therefore, the
cylinder volume gradients are quite the same at this area (see Figure 65). Hence, the increased
piston velocity does not affect the EE prototype engine combustion behaviour at part load.
The wall heat losses of the EE prototype engines with different valve timing strategies are
between 8.2 and 8.6 p.p. and considerably higher compared to the base engine with
approximately 6 p.p. As mentioned before, the main reason is the higher cylinder surface due
to the larger expansion stroke. The wall heat loss of the reference engine with approximately
7.7 p.p. is located between the other engines. In comparison to the base engine, this higher
loss is caused by the unfavourable volume to surface ratio.
The largest internal EE prototype engine loss at part load represents the gas exchange loss. Of
course, the gas exchange losses have a stronger impact on efficiency in part load than in full
load operation. However, when comparing the ratio of the gas exchange losses in PL between
EE In-WOT & Ex-WOT
Base engineReference engineEE
In-WOT & Ex-PLEE
In-deth & Ex-PL
Eff
icie
ncy a
nd
loss
es
in %
0
5
10
15
20
25
30
35
40
45
50
55
60
65
EE prototype engine Base engine Reference engine
Eff
icie
ncy
an
d l
oss
es
in %
0
5
10
15
20
25
30
35
40
45
50
55
60
65
Imperfect combustion loss Real combustion loss Wall heat loss Gas exchange loss Indicated efficiency
30.1 32.0 32.7 32.2 32.5

134 Experimental Investigations
the EE prototype engine and the base engine, the results are quite the same as in WOT
operation with pure WOT valve timing. Nevertheless, it can also be seen that the valve timing
modifications have a positive impact on engine efficiency. In comparison to pure WOT
timing, the gas exchange losses can be reduced by 1.8 p.p. with In-WOT / Ex-PL and 2.7 p.p.
with In-deth / WOT-PL valve timing. This tendency can also be seen considering the gas
exchange indicated mean effective pressure (GE IMEP) which is presented in Figure 142.
Figure 142 – Gas exchange indicated mean effective pressure (GE IMEP) of the investigated engines
with different valve timing strategies in part load at 2000 rpm
As the GE IMEP lowers the engine IMEP, the values are negative. The pure modification of
WOT exhaust timing to PL exhaust timing improves the GE IMEP of the EE prototype engine
by approximately 17%. A further improvement of approximately 7% can be achieved with de-
throttled intake timing. Considering the GE losses, the reduction is approximately 12% from
WOT to PL exhaust timing and approximately 19% from pure WOT timing to de-throttled
intake timing and PL exhaust timing. Although the relative GE loss difference of the EE
prototype engine in comparison to the base and reference engine is not as pronounced as in
full load, the losses are also significantly higher in part load. The main reason is again based
on the longer exhaust stroke. In sum, the losses are approximately 2.8 times higher for the EE
prototype engine (for comparison: 5 times higher in WOT operation). However, if considering
the gas exchange loops of the EE prototype engines, the GE improvement is clearly visible
(cf. Figure 143).
EE In-WOT & Ex-WOT
Base engineReference engineEE
In-WOT & Ex-PLEE
In-deth & Ex-PL
IME
P -
Gas
exch
an
ge i
n b
ar
-1.8
-1.6
-1.4
-1.2
-1.0
-0.8
-0.6
-0.4
-0.2
-0.0

Experimental Investigations 135
Figure 143 – GE loops of the investigated engines with different valve timing strategies in part load at
2000 rpm
When using full load valve timing in part load operation, additional gas exchange losses due
to pumping losses arise. At EVO (exhaust valve opening) the cylinder pressure is below
ambient pressure. Therefore, exhaust gas flows from the exhaust port back into the cylinder.
This backflow and, hence, the additional gas mass causes higher gas exchange losses and lead
to lower indicated efficiencies. Due to the later EVO, the burned gas is compressed during the
beginning of the exhaust stroke. This measure reduces the backflow and, compared to pure
full load valve timing, also the gas exchange losses even though the opening duration and
valve lift are shorter which induce a pressure increase during the end of the exhaust phase.
Basically, a longer exhaust valve lift will allow further improvements, but, this leads in
combination with shorter opening durations to high valve accelerations. The reduction of the
gas exchange work due to de-throttling is also clearly visible. However, the lower cylinder
charge results in a lower pressure at EVO, which further causes increased gas exchange losses
during the exhaust phase. This drawback can be reduced via further modifications on exhaust
cam and exhaust port geometries.
In summary, an efficiency improvement could not be demonstrated in part load. The indicated
efficiency is 32.7% in the best case (In-deth & Ex-PL) and almost equal to the indicated
efficiency of the base engine with 32.5%. Nevertheless, it must be noted that the base engine
operates with pure WOT valve timing. If the same de-throttling measures will be also
installed in the base engine, the efficiency will be further improved. The EE prototype engine
with pure WOT timing delivers the lowest efficiency with 30.1%, followed by WOT intake
timing and PL exhaust timing with 32%. The simulated reference engine achieves an
indicated efficiency of 32.2%.
In conclusion, it can be noted that the valve timing modifications and optimisation (based on
1D-CFD calculation) provide an efficiency enhancement in part load for EE prototype engine.
Furthermore, the results clearly show that valve timing (or valve train) variabilities are
essential for an Extended Expansion engine concept to achieve higher efficiencies also in PL.
EVO
EVO
EVO
Crank angle in °CA
-40 -30 -20 -10 0 10 20 30 40 50 60 70 80
Gro
ss h
ea
t rele
ase
in
J/°
CA
-2
0
2
4
6
8
10
12
14 EE In-WOT & Ex-WOT EE In-WOT & Ex-PL EE In-deth & Ex-PL Base engine Reference engine
Cylinder volume in dm³
0.0 0.1 0.2 0.3 0.4 0.5 0.6 0.7 0.8
Cy
lin
der p
ress
ure i
n b
ar
0.0
0.5
1.0
1.5
2.0 EE In-WOT & Ex-WOT EE In-WOT & Ex-PL EE In-deth & Ex-PL Base engine Reference engine
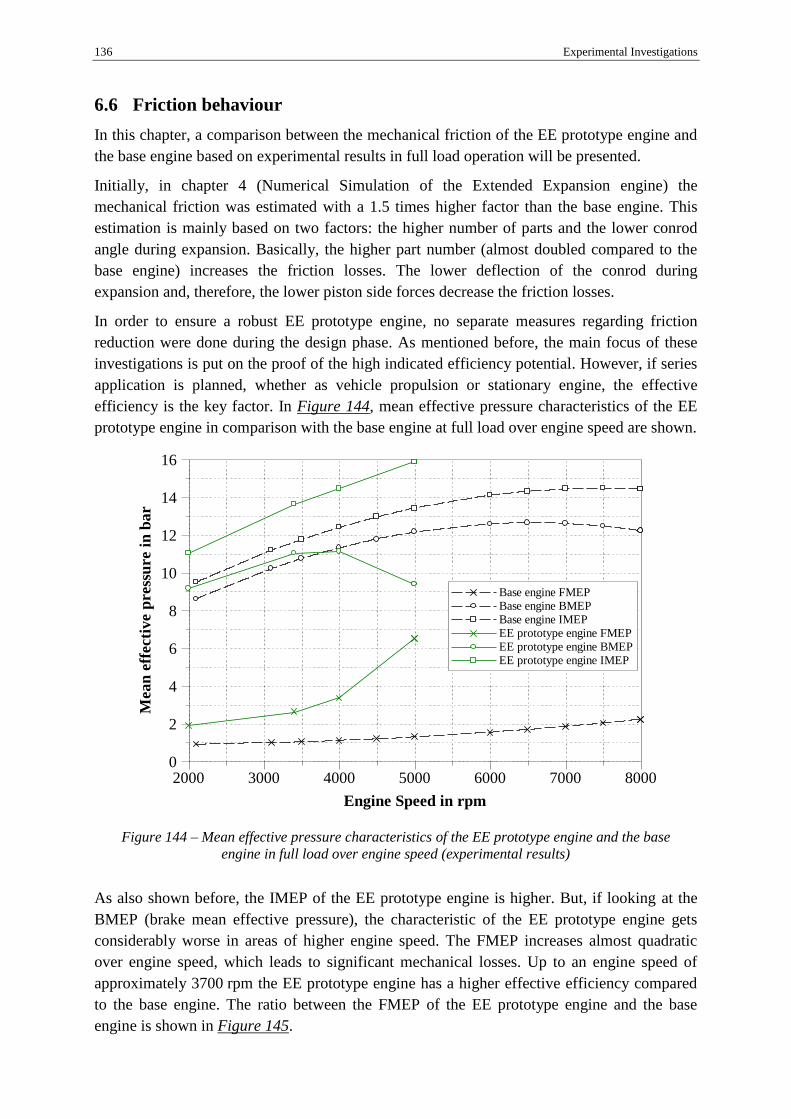
136 Experimental Investigations
6.6 Friction behaviour
In this chapter, a comparison between the mechanical friction of the EE prototype engine and
the base engine based on experimental results in full load operation will be presented.
Initially, in chapter 4 (Numerical Simulation of the Extended Expansion engine) the
mechanical friction was estimated with a 1.5 times higher factor than the base engine. This
estimation is mainly based on two factors: the higher number of parts and the lower conrod
angle during expansion. Basically, the higher part number (almost doubled compared to the
base engine) increases the friction losses. The lower deflection of the conrod during
expansion and, therefore, the lower piston side forces decrease the friction losses.
In order to ensure a robust EE prototype engine, no separate measures regarding friction
reduction were done during the design phase. As mentioned before, the main focus of these
investigations is put on the proof of the high indicated efficiency potential. However, if series
application is planned, whether as vehicle propulsion or stationary engine, the effective
efficiency is the key factor. In Figure 144, mean effective pressure characteristics of the EE
prototype engine in comparison with the base engine at full load over engine speed are shown.
Figure 144 – Mean effective pressure characteristics of the EE prototype engine and the base
engine in full load over engine speed (experimental results)
As also shown before, the IMEP of the EE prototype engine is higher. But, if looking at the
BMEP (brake mean effective pressure), the characteristic of the EE prototype engine gets
considerably worse in areas of higher engine speed. The FMEP increases almost quadratic
over engine speed, which leads to significant mechanical losses. Up to an engine speed of
approximately 3700 rpm the EE prototype engine has a higher effective efficiency compared
to the base engine. The ratio between the FMEP of the EE prototype engine and the base
engine is shown in Figure 145.
Engine Speed in rpm
2000 3000 4000 5000 6000 7000 8000
Mea
n e
ffecti
ve p
ress
ure i
n b
ar
0
2
4
6
8
10
12
14
16
Base engine FMEP Base engine BMEP Base engine IMEP EE prototype engine FMEP EE prototype engine BMEP EE prototype engine IMEP

Experimental Investigations 137
Figure 145 – FMEP ratio of the EE prototype engine in full load over engine speed (experimental
results)
The best FMEP ratio with approximately 2.1 is at 2000 rpm. After 3500 rpm, the friction
increases significantly. At 5000 rpm the FMEP of the EE prototype engine is about 5 times
higher in comparison to the base engine. The same tendency can also be seen in Figure 146 in
which the mechanical efficiencies of both engines are presented. At 5000 rpm, the mechanical
efficiency is approximately 30 p.p. lower than of the base engine.
Figure 146 – Mechanical efficiencies of the EE prototype engine and the base engine in full load
over engine speed (experimental results)
Finally, the effective full load efficiency of the EE prototype engine and the base engine over
the engine is shown in Figure 147:
Engine Speed in rpm
2000 2500 3000 3500 4000 4500 5000
FM
EP
rati
o
1.5
2.0
2.5
3.0
3.5
4.0
4.5
5.0
5.5
Engine Speed in rpm
2000 3000 4000 5000 6000 7000 8000
Mech
an
ica
l eff
icie
ncy
in
%
0.55
0.60
0.65
0.70
0.75
0.80
0.85
0.90
0.95
1.00
Base engine EE prototype engine

138 Experimental Investigations
Figure 147 – Effective and indicated efficiencies of the EE prototype engine and the base engine in
full load over engine speed (experimental results)
Despite the significantly higher friction losses, the EE prototype engine achieves higher
effective efficiencies in comparison to the base engine in speed areas between approximately
2000 and 3500 rpm. The maximum effective efficiency with approximately 36.5% is at
3400 rpm. Hence, in the best case, an efficiency improvement of approximately 4.3% could
be reached. Altogether, the results again show the high efficiency potentials especially at full
load operation.
Figure 148 – Effective and indicated efficiencies of the EE prototype engines with different valve
timings at part load at 2000 rpm (experimental results)
Engine speed in rpm
2000 2500 3000 3500 4000 4500 5000
Eff
icie
ncy i
n %
25.0
27.5
30.0
32.5
35.0
37.5
40.0
42.5
45.0
47.5
50.0
52.5
55.0 Effective efficiency (EEE) Indicated efficiency (EEE) Friction loss (EEE) Indicated efficiency (Base) Effective efficiency (Base) Friction loss (Base)
EE In-WOT & Ex-WOT
Base engineEE
In-WOT & Ex-PLEE
In-deth & Ex-PL
Eff
icie
ncy i
n %
0
5
10
15
20
25
30
35
40 Indicated efficiency Effective efficiency
30.1
32.0 32.7 32.5
12.7
14.6 15.1
21.5

Experimental Investigations 139
In Figure 148, the indicated and effective efficiencies of the EE prototype engine with
different valve timings and the base engine at part load and 2000 rpm are shown. As before,
for the comparison the same IMEP of 3 bar for both engines is used. In contrast to full load
operation, no effective efficiency improvements could be achieved in part load. Although the
FMEP ratio with approximately 1.6 is not as pronounced as in WOT with approximately 2.6,
the effective efficiency of the EE prototype engine is clearly lower. The reason is the lower
indicated efficiency improvement in part load compared to full load operation. The indicated
efficiencies (except with pure WOT timing) are quite the same as the base engine ones. Due
to significantly higher friction losses, the effective efficiency of the EE prototype engine
strongly suffers. In the best case, with de-throttled intake and PL exhaust valve timing (In-
deth & Ex-PL), the efficiency is approximately 30% lower compared to the base engine.
Considering the different EE prototype engine valve timings in part load, the implemented
adaptions have no impact on the friction behaviour. The friction losses with approximately
17.5 p.p. are quite the same for all EE engine variants.
Figure 149 – Mechanical efficiencies of the EE prototype engines with different valve timings in
part load at 2000 rpm (experimental results)
The different mechanical efficiencies are presented in Figure 149. The EE prototype engines
with different valve timing variants achieve approximately 42 and 46%. The effective
efficiency of the base engine is approximately 66%.
In summary, it can be noted, that the expected friction improvement due to lower piston side
forces is not clearly identifiable, especially at higher speed ranges. A possible reason could
also be found in the higher piston velocity of the EE prototype engine (approximately twice
the base engine). Furthermore, these results also indicate that the friction behaviour is more
affected by the higher number of moving parts. However, improvement potentials still exist.
Several redesign measures in combination with detailed FEM calculations concerning part
geometry, stiffness, weight and material can reduce the friction losses. However, at WOT
EE In-WOT & Ex-WOT
Base engineEE
In-WOT & Ex-PLEE
In-deth & Ex-PL
Mech
an
ica
l eff
icie
ncy
in
%
0
10
20
30
40
50
60
70
42.3
45.5 46.3
66.2

140 Experimental Investigations
operation and lower engine speeds higher effective efficiencies in comparison to the base
engine can be gained. Therefore, Extended Expansion is particularly suitable for applications
with high load spectra, rather low specific power (relative to the weight) requirements and
rather low engine speeds – e.g. ICE for extended-range electric vehicles (EREV) or stationary
engines.

Experimental Investigations 141
6.7 Exhaust temperature behaviour
Exhaust aftertreatment represents an important factor for series production implementation.
Especially for an Extended Expansion process and its concept-based lower exhaust gas
temperature, the question of a reliable working exhaust aftertreatment arises.
Figure 150 – Exhaust gas temperatures (engine-out and before TWC) of the EE prototype engine
and the base engine in full load over engine speed (experimental results)
In Figure 150, exhaust gas temperatures of the EE prototype engine and the base engine at
full load are presented. The temperature measuring points are positioned in the exhaust
manifold (engine-out) and before the three-way catalyst (TWC). This engine has one main
catalyst which is located approximately 1.1 m after the exhaust manifold. The exhaust
temperature of the EE prototype engine is approximately 50 to 120°C lower in a speed range
between 3000 and 5000 rpm. This characteristic has clear advantages concerning lower
thermal stress of the exhaust system while enabling a reliable catalytic aftertreatment with an
absolute exhaust gas temperature between approximately 500 and 550°C.
An interesting behaviour is noticeable in part load operation (BMEP = 2bar and 2000 rpm).
The temperatures are higher for the EE prototype engine. In Figure 151, the absolute exhaust
gas temperatures before the TWC are shown.
Engine speed in rpm
3000 3500 4000 4500 5000
Ex
ha
ust
ga
s te
mp
era
ture i
n °
C
200
300
400
500
600
700
800
900
Base engine (Engine-Out) Base engine (before TWC) EE prototype engine (Engine-Out) EE prototype engine (before TWC)
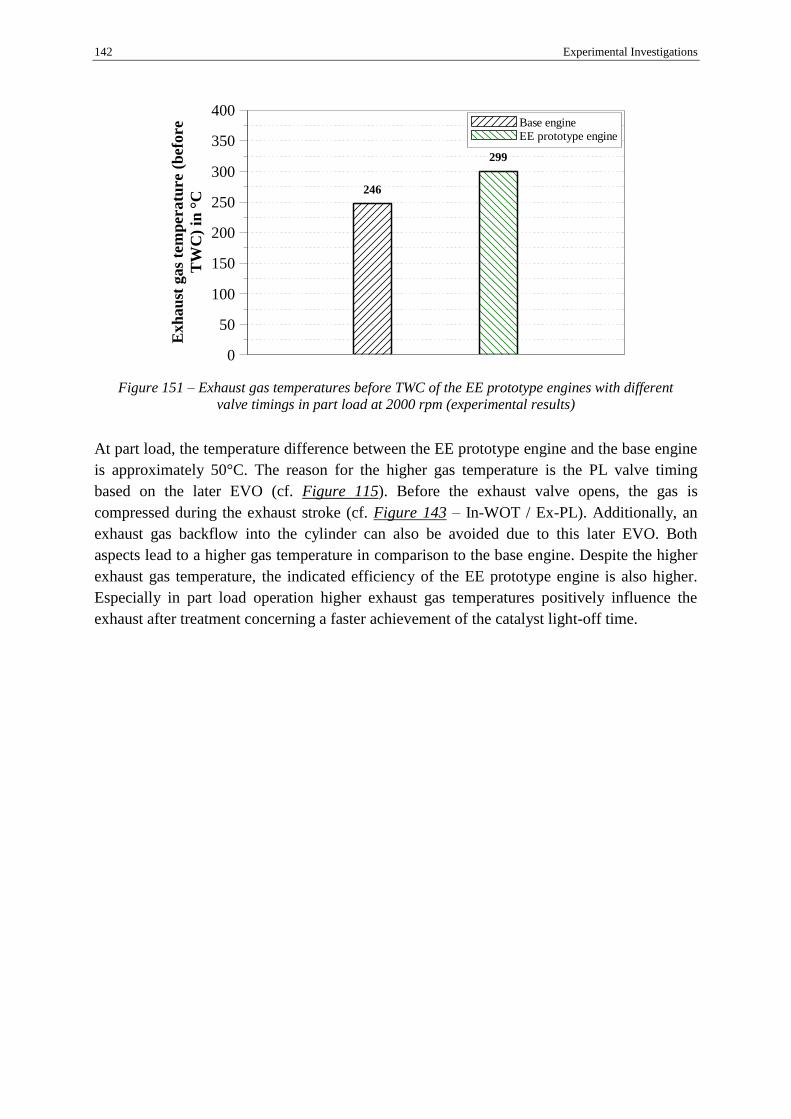
142 Experimental Investigations
Figure 151 – Exhaust gas temperatures before TWC of the EE prototype engines with different
valve timings in part load at 2000 rpm (experimental results)
At part load, the temperature difference between the EE prototype engine and the base engine
is approximately 50°C. The reason for the higher gas temperature is the PL valve timing
based on the later EVO (cf. Figure 115). Before the exhaust valve opens, the gas is
compressed during the exhaust stroke (cf. Figure 143 – In-WOT / Ex-PL). Additionally, an
exhaust gas backflow into the cylinder can also be avoided due to this later EVO. Both
aspects lead to a higher gas temperature in comparison to the base engine. Despite the higher
exhaust gas temperature, the indicated efficiency of the EE prototype engine is also higher.
Especially in part load operation higher exhaust gas temperatures positively influence the
exhaust after treatment concerning a faster achievement of the catalyst light-off time.
Ex
ha
ust
ga
s te
mp
era
ture (
befo
re
TW
C)
in °
C
0
50
100
150
200
250
300
350
400 Base engine EE prototype engine
299
246
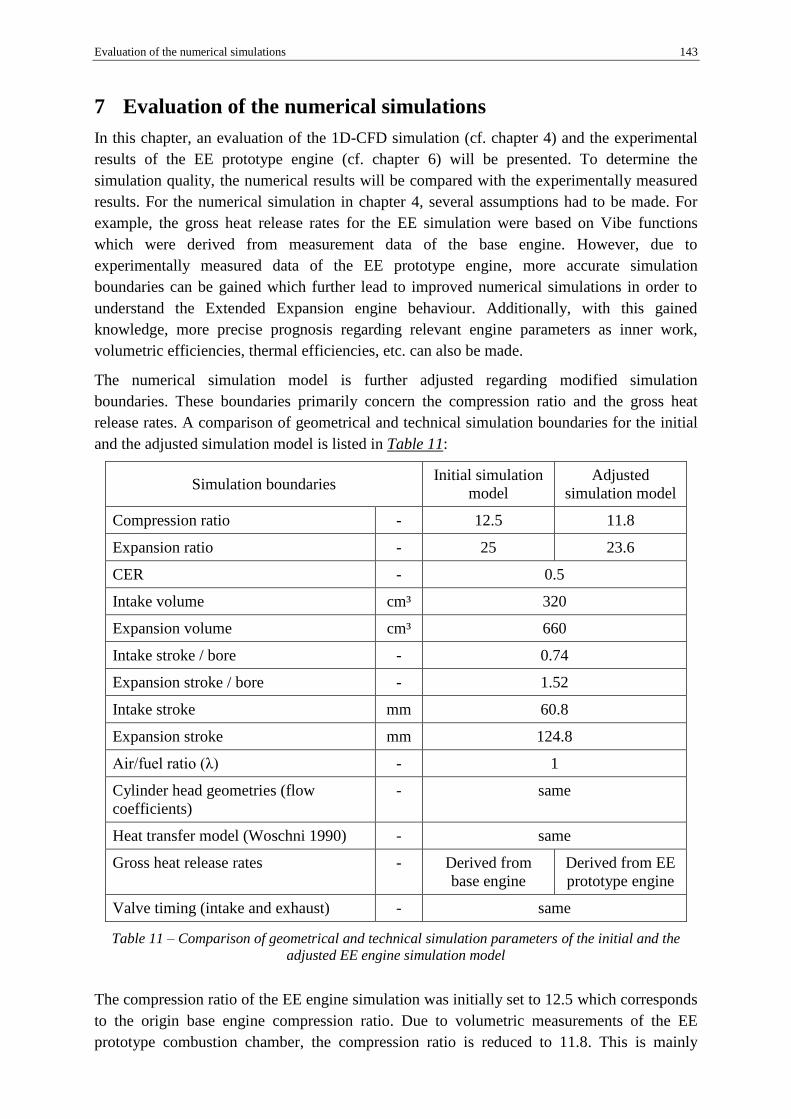
Evaluation of the numerical simulations 143
7 Evaluation of the numerical simulations
In this chapter, an evaluation of the 1D-CFD simulation (cf. chapter 4) and the experimental
results of the EE prototype engine (cf. chapter 6) will be presented. To determine the
simulation quality, the numerical results will be compared with the experimentally measured
results. For the numerical simulation in chapter 4, several assumptions had to be made. For
example, the gross heat release rates for the EE simulation were based on Vibe functions
which were derived from measurement data of the base engine. However, due to
experimentally measured data of the EE prototype engine, more accurate simulation
boundaries can be gained which further lead to improved numerical simulations in order to
understand the Extended Expansion engine behaviour. Additionally, with this gained
knowledge, more precise prognosis regarding relevant engine parameters as inner work,
volumetric efficiencies, thermal efficiencies, etc. can also be made.
The numerical simulation model is further adjusted regarding modified simulation
boundaries. These boundaries primarily concern the compression ratio and the gross heat
release rates. A comparison of geometrical and technical simulation boundaries for the initial
and the adjusted simulation model is listed in Table 11:
Simulation boundaries Initial simulation
model
Adjusted
simulation model
Compression ratio - 12.5 11.8
Expansion ratio - 25 23.6
CER - 0.5
Intake volume cm³ 320
Expansion volume cm³ 660
Intake stroke / bore - 0.74
Expansion stroke / bore - 1.52
Intake stroke mm 60.8
Expansion stroke mm 124.8
Air/fuel ratio (λ) - 1
Cylinder head geometries (flow
coefficients)
- same
Heat transfer model (Woschni 1990) - same
Gross heat release rates - Derived from
base engine
Derived from EE
prototype engine
Valve timing (intake and exhaust) - same
Table 11 – Comparison of geometrical and technical simulation parameters of the initial and the
adjusted EE engine simulation model
The compression ratio of the EE engine simulation was initially set to 12.5 which corresponds
to the origin base engine compression ratio. Due to volumetric measurements of the EE
prototype combustion chamber, the compression ratio is reduced to 11.8. This is mainly
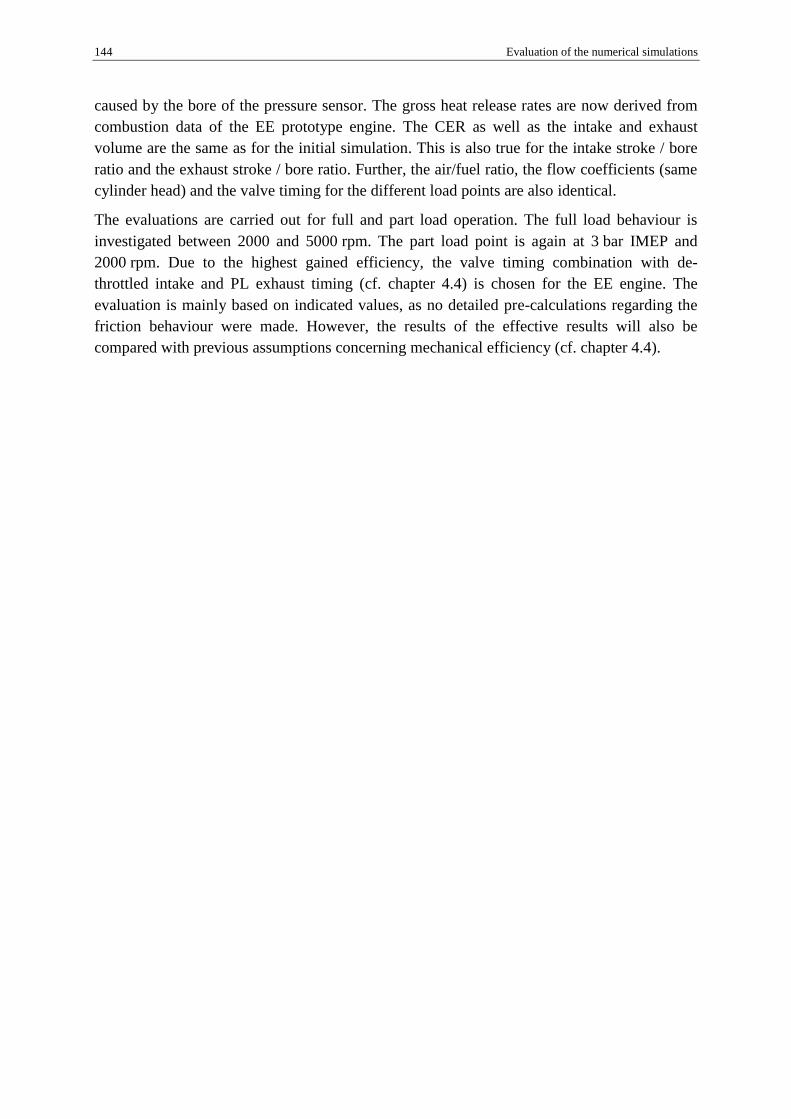
144 Evaluation of the numerical simulations
caused by the bore of the pressure sensor. The gross heat release rates are now derived from
combustion data of the EE prototype engine. The CER as well as the intake and exhaust
volume are the same as for the initial simulation. This is also true for the intake stroke / bore
ratio and the exhaust stroke / bore ratio. Further, the air/fuel ratio, the flow coefficients (same
cylinder head) and the valve timing for the different load points are also identical.
The evaluations are carried out for full and part load operation. The full load behaviour is
investigated between 2000 and 5000 rpm. The part load point is again at 3 bar IMEP and
2000 rpm. Due to the highest gained efficiency, the valve timing combination with de-
throttled intake and PL exhaust timing (cf. chapter 4.4) is chosen for the EE engine. The
evaluation is mainly based on indicated values, as no detailed pre-calculations regarding the
friction behaviour were made. However, the results of the effective results will also be
compared with previous assumptions concerning mechanical efficiency (cf. chapter 4.4).
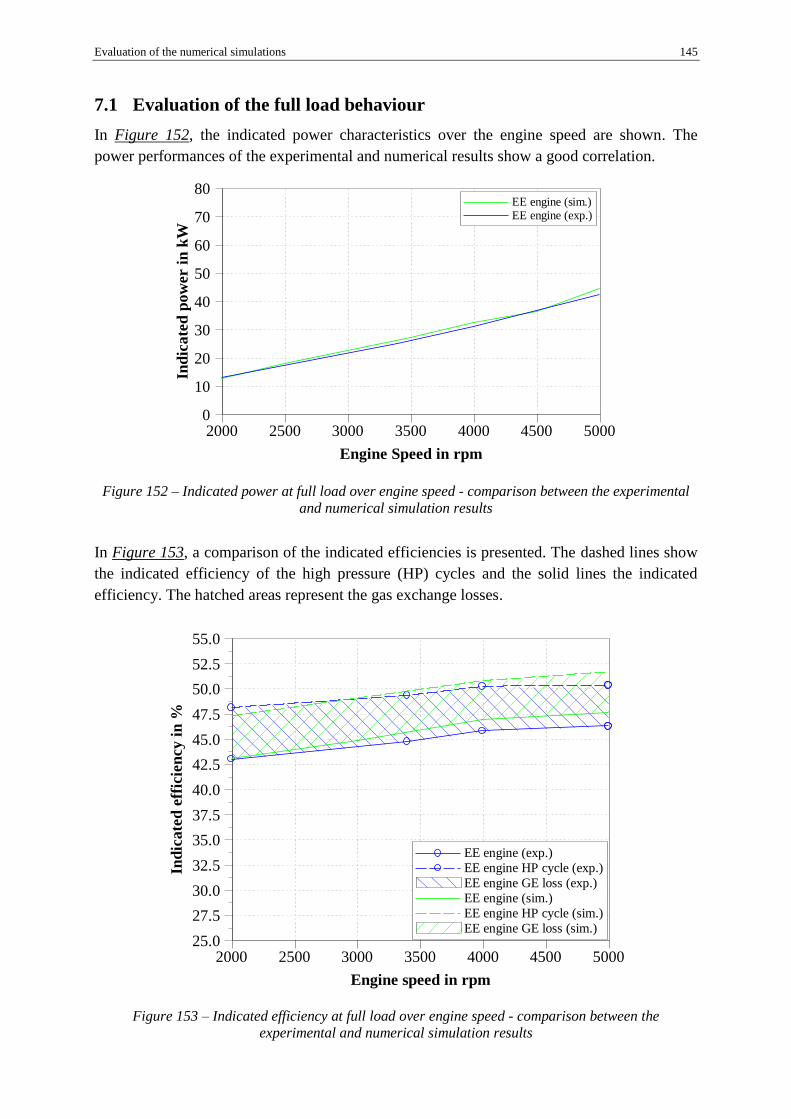
Evaluation of the numerical simulations 145
7.1 Evaluation of the full load behaviour
In Figure 152, the indicated power characteristics over the engine speed are shown. The
power performances of the experimental and numerical results show a good correlation.
Figure 152 – Indicated power at full load over engine speed - comparison between the experimental
and numerical simulation results
In Figure 153, a comparison of the indicated efficiencies is presented. The dashed lines show
the indicated efficiency of the high pressure (HP) cycles and the solid lines the indicated
efficiency. The hatched areas represent the gas exchange losses.
Figure 153 – Indicated efficiency at full load over engine speed - comparison between the
experimental and numerical simulation results
Ind
icate
d p
ow
er i
n k
W
0
10
20
30
40
50
60
70
80
Engine Speed in rpm
2000 2500 3000 3500 4000 4500 5000
EE engine (sim.) EE engine (exp.)
Ind
icate
d e
ffic
ien
cy
in
%
25.0
27.5
30.0
32.5
35.0
37.5
40.0
42.5
45.0
47.5
50.0
52.5
55.0
Engine speed in rpm
2000 2500 3000 3500 4000 4500 5000
EE engine (exp.)
EE engine HP cycle (exp.)
EE engine GE loss (exp.)
EE engine (sim.)
EE engine HP cycle (sim.)
EE engine GE loss (sim.)

146 Evaluation of the numerical simulations
Basically, the tendencies of the efficiency behaviour over engine speed are quite similar for
both. This is also true for the amount of the gas exchange losses which are also almost the
same. However, it can be seen that, especially for higher engine speeds, the absolute
efficiency results deviates to a greater amount. A possible reason for this deviation could be
the determination of the wall heat. As mentioned, the wall heat transfer model is based on
Woschni 1990 [125 and 124]. This model is widely used for conventional SI engines.
However, in literature there is no appropriate heat transfer model known for an Extended
Expansion combustion process. Another uncertainty for the determination of the wall heat
affects temperatures of the liner, the piston and the cylinder head. The more precise these
temperatures are determined, the better the simulation quality is. During the experimental test,
no temperature measurements of these engine parts were made. This fact requires an
assumption of temperatures in order to have starting conditions for the simulation which
further allows simulation inaccuracies. However, to precisely determinate the wall heat,
further investigations and experimental tests have to be performed.
As mentioned in chapter 6.6, the friction behaviour of the EE prototype engine is very bad,
especially for higher engine speeds. Initially, friction assumptions expected a 1.5 times higher
FMEP compared to the base engine. These assumptions were mostly incorrect. The
consequences can be seen in Figure 154. However, to estimate the friction behaviour of a new
engine concept, purely on the basis of simulations, is very difficult and only possible in a
limited form. In addition, no experimentally measured data of a comparable EE engine were
available in order to have an appropriate comparison basis. Hence, the effective efficiency
outcomes of this study can provide a first basis for more detailed investigations of the friction
behaviour of an EE engine.
Figure 154 – Effective and indicated efficiencies at full load over engine speed - comparison between
the experimental and numerical simulation results
Finally, the full load point at 5000 rpm will be evaluated. A comparison of the pV-diagrams
Eff
icie
ncy i
n %
25.0
27.5
30.0
32.5
35.0
37.5
40.0
42.5
45.0
47.5
50.0
52.5
55.0
Engine speed in rpm
2000 2500 3000 3500 4000 4500 5000
EE engine ind. eff. (exp.)
EE engine eff. eff. (exp.)
EE engine friction losses (exp.)
EE engine ind. eff. (sim.)
EE engine eff. eff. (sim.)
EE engine friction losses (sim.)

Evaluation of the numerical simulations 147
between the simulation and the experiment is presented in Figure 155.
Figure 155 – pV-diagrams at full load and 5000 rpm - comparison between the experimental and
numerical simulation results
Comparing the compression and combustion phase, the simulation shows very good
correlations. As mentioned before, the simulation of the wall heat transfer doesn’t perfectly
correspond with the experimental results. Hence, a deviation in the cylinder pressure is also
noticeable at the expansion phase. The gas exchange pressure characteristics show also good
correlations, especially until half the exhaust phase. The simulated gas exchange loop shows
slight deviations which are probably based on the flow coefficients of the intake and exhaust
ports. Especially the deviation at the exhaust is comprehensible. The flow coefficients for the
simulation are based on the base engine. For the EE prototype engine no additional
measurement on the flow test bench were made. Considering the longer exhaust stroke, it is
convincible that slightly different flow coefficients will result.
In summary, good correlations of the power performance and the cylinder pressure
Cy
lin
der p
ress
ure i
n b
ar
0
10
20
30
40
50
60
70
80
Cylinder volume in cm³
0 100 200 300 400 500 600 700 800
EE prototype engine (experimental) EE prototype engine (simulation)
Cyli
nd
er p
ress
ure i
n b
ar
0.0
0.5
1.0
1.5
2.0
2.5
3.0
Cylinder volume in cm³
0 100 200 300 400 500 600 700 800
EE prototype engine (experimental) EE prototype engine (simulation)
Cy
lin
der p
ress
ure i
n b
ar
0
10
20
30
40
50
60
70
80
Cylinder volume in cm³
0 100 200 300 400 500 600 700 800
EE prototype engine (experimental) EE prototype engine (simulation)
Cy
lin
der p
ress
ure i
n b
ar
0.0
0.5
1.0
1.5
2.0
2.5
3.0
Cylinder volume in cm³
0 100 200 300 400 500 600 700 800
EE prototype engine (experimental) EE prototype engine (simulation)

148 Evaluation of the numerical simulations
characteristics in full load between the 1D-CFD simulation and the experimental results could
be achieved. Nevertheless, additional investigations and measurements in order to determine
the wall heat are necessary to calculate the indicated efficiencies more precisely.
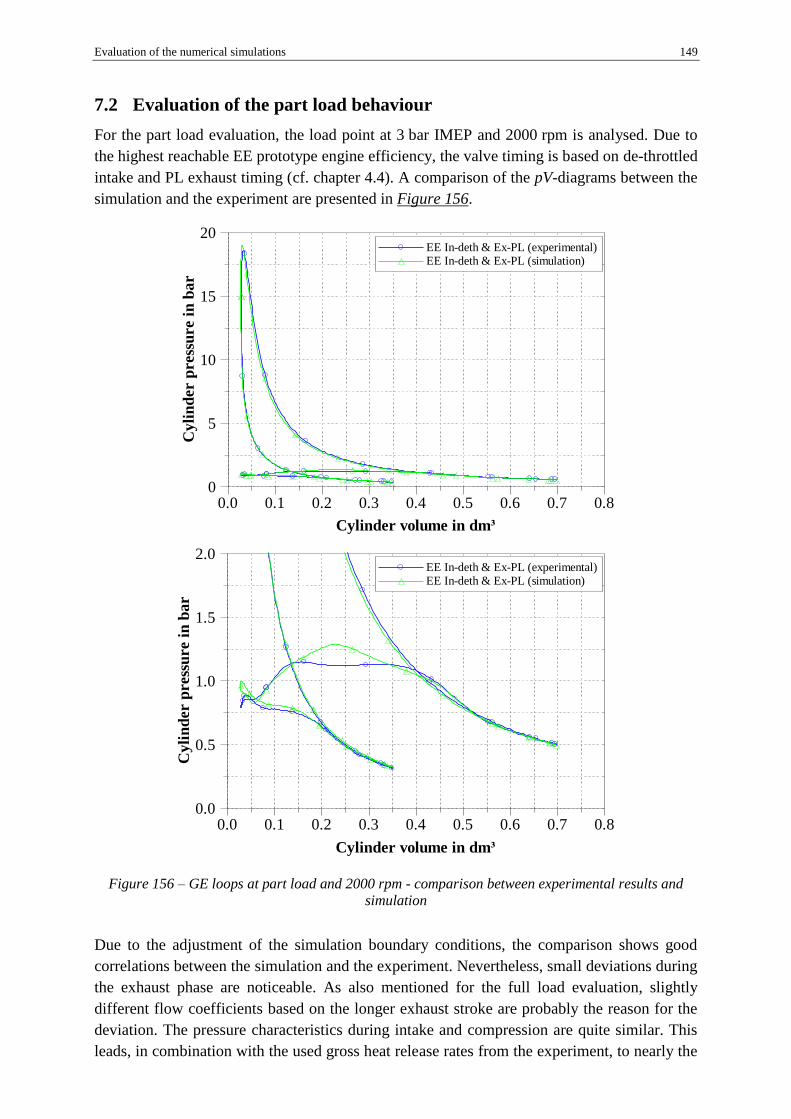
Evaluation of the numerical simulations 149
7.2 Evaluation of the part load behaviour
For the part load evaluation, the load point at 3 bar IMEP and 2000 rpm is analysed. Due to
the highest reachable EE prototype engine efficiency, the valve timing is based on de-throttled
intake and PL exhaust timing (cf. chapter 4.4). A comparison of the pV-diagrams between the
simulation and the experiment are presented in Figure 156.
Figure 156 – GE loops at part load and 2000 rpm - comparison between experimental results and
simulation
Due to the adjustment of the simulation boundary conditions, the comparison shows good
correlations between the simulation and the experiment. Nevertheless, small deviations during
the exhaust phase are noticeable. As also mentioned for the full load evaluation, slightly
different flow coefficients based on the longer exhaust stroke are probably the reason for the
deviation. The pressure characteristics during intake and compression are quite similar. This
leads, in combination with the used gross heat release rates from the experiment, to nearly the
Cylinder volume in dm³
0.0 0.1 0.2 0.3 0.4 0.5 0.6 0.7 0.8
Cyli
nd
er p
ress
ure i
n b
ar
0.0
0.5
1.0
1.5
2.0 EE In-deth & Ex-PL (experimental) EE In-deth & Ex-PL (simulation)
Cylinder volume in dm³
0.0 0.1 0.2 0.3 0.4 0.5 0.6 0.7 0.8
Cy
lin
der p
ress
ure i
n b
ar
0
5
10
15
20 EE In-deth & Ex-PL (experimental) EE In-deth & Ex-PL (simulation)
Cylinder volume in dm³
0.0 0.1 0.2 0.3 0.4 0.5 0.6 0.7 0.8
Cyli
nd
er p
ress
ure i
n b
ar
0.0
0.5
1.0
1.5
2.0 EE In-deth & Ex-PL (experimental) EE In-deth & Ex-PL (simulation)
Cylinder volume in dm³
0.0 0.1 0.2 0.3 0.4 0.5 0.6 0.7 0.8
Cy
lin
der p
ress
ure i
n b
ar
0
5
10
15
20 EE In-deth & Ex-PL (experimental) EE In-deth & Ex-PL (simulation)

150 Evaluation of the numerical simulations
same peak cylinder pressure. Furthermore, also the expansion shows a good agreement. This
suggests that the determination of the wall heat in part load provides better results and
correlations as in full load. Therefore, the deviation in the indicated efficiency between the
simulation and the experiment is small. According to the adjusted simulation, the indicated
efficiency is 32.3% and approximately 0.4 p.p. lower in comparison to the experimental
results (cf. chapter 6.5). However, this is intelligible because of quite the same high pressure
cycle characteristics and the minor deviations in the gas exchange. The gas exchange losses
are slightly higher for the simulation. An experimental determination of the flow coefficients
of the EE prototype engine should correct this deviation.

Conclusions and outlook 151
8 Conclusions and outlook
The enhancement of efficiency will play a more and more important role in the development
of future internal combustion engines. In recent years, engine industry has made great efforts
in reducing fuel consumption for various propulsion concepts. Beside hybridization and
alternative propulsion concepts, the efficiency enhancement of the internal combustion engine
is of special interest. Downsizing, multi-stage charging, variable valve trains, cylinder
deactivation, optimized combustion chamber geometries, model-based engine control units
and reduced friction through revised engine components represent typical ongoing
development trends. However, due to the technological progress, efficiency potentials of these
rather conventional measures are almost exhausted. The Atkinson cycle is a very effective
single measure to enhance efficiency and can be very well combined with ongoing
development trends. Moreover, increasing attention is also noticeable in the industry. Several
OEMs have been doing investigations on this efficiency-increasing principle in the whole
range from small engines up to automotive ones.
This doctoral thesis presents a complete engine development process of an Extended
Expansion engine (also known as Atkinson engine). The first investigations were supported
by analytical thermodynamic calculations. Within these calculations rough estimations in
order to define the main engine geometries and to determine thermal efficiencies were carried
out. Afterwards, detailed numerical simulations via 1D- and 3D-CFD calculations of defined
full and part load operation points were the basis for a closer understanding of the gas
exchange as well as the combustion behaviour of an EE engine. With the help of several
layout and thermodynamic studies concerning main technological and geometrical engine
requirements, an appropriate base engine was defined. This engine, a conventional 2-cylinder,
4-stroke, SI motorcycle engine, forms the basis of the general EE engine layout. Derived from
that, the EE prototype engine was designed and prototyped. Due to pre-defined target
boundaries, the piston motion was realised over the crank train (Atkinson principle) with a
CER (compression to expansion ratio) of 0.5, which results in an approximately twice time
higher expansion than compression stroke. Hence, this researched engine presents a clear
differentiation of other existing Extended Expansion applications. Regarding the importance
of a smooth running of the engine, special attentions were paid to mass balancing measures.
After the prototyping phase, the EE engine was experimentally tested. The experimental tests
conduct investigations regarding engine load, ignition timing, engine speed, engine gas and
part temperatures and the friction behaviour in full as well as in part load operation.
Moreover, a special research focus (numerical and experimental) dealt with the consequences
of variable intake and exhaust valve timing.
The Extended Expansion has a high efficiency potential, especially for high loads. The
researched EE prototype engine achieves a remarkable indicated efficiency of approximately
46% and, hence, an efficiency increase of approximately 14% (4.6 p.p.) in comparison to the
base engine. Nevertheless, it must be noted that wall heat and gas exchange losses are above
average in comparison to conventional SI engines. However, the gas exchange shows further
improvement potentials, especially concerning exhaust timing.
Generally, the full load valve timing of the EE engine is quite similar to those of conventional
engines. Therefore, a high volumetric efficiency (based on the intake volume) can also be

152 Conclusions and outlook
achieved for higher engine speeds. For conventional engines, too, the cylinder charge (based
on the operation point) can be slightly increased due to variable valve timing. A higher charge
of the EE principle also leads to higher mean effective pressures and efficiencies. Basically,
fixed valve timing is sufficient for full load operation.
For passenger cars, part load operation is especially relevant for fuel consumption. A CER
(compression to expansion ratio) of 0.5 leads to significantly increased EE engine efficiencies
at full load. However, when using full load valve timing in part load, efficiency drawbacks
occur due to higher gas exchange losses. To avoid these losses and to simultaneously raise the
overall efficiency in part load as well, variable valve timing is necessary. Exhaust valve
timing, in particular, plays an important role in achieving high efficiencies for an EE engine.
The investigations show that a late exhaust open timing and a short opening duration are
essential. Further, a larger maximum valve lift in combination with a shorter opening duration
is desirable. As for conventional engines, de-throttling also leads to reduced gas exchange
losses for an EE concept. The indicated efficiency at part load (BMEP = 2 bar and 2000 rpm)
is approximately 32.7% and quite similar to the base engine. In summary, variable valve
timing is absolutely necessary to achieve high efficiencies when the engine operates in full
load and in part load.
The exhaust aftertreatment of the EE engine is positively influenced. Compared to the base
engine, the gas temperatures in full load are lower and lead to a lower thermal stress of the
after treatment system. In part load, the gas temperatures are higher for the EE prototype
engine due to modified exhaust valve timing. Because of the higher exhaust gas temperature,
the indicated PL efficiency of the EE prototype engine is quite the same as for the base engine
- the higher exhaust temperature is compensated by the higher gained work. However, the EE
engine temperature behaviour results in a faster achievement of the catalyst light-off time in
PL.
The evaluation of the CFD simulations, based on the experimental results, basically shows
good correlations in full and part load. Solely the determination of the indicated efficiency in
full load indicates small deviations. In this case, additional investigations concerning the wall
heat behaviour in order to calculate wall heat losses more precisely are necessary. This
certainly includes detailed determinations of gas temperature as well as engine part
temperatures for liner, piston, cylinder head, etc.
Beside attaining high efficiency, the EE concept suffers from high friction and a lower power-
to-weight ratio. Especially for higher engine speeds, the effective efficiency drastically
decreases. The main reasons are the higher number of parts and bearing and also the increased
mass forces at higher engine speeds. The advantage of a lower conrod angle and, hence, a
reduction of the piston side forces could not be demonstrated. However, it should be
considered that for the EE prototype engine optimisations regarding friction were not
implemented for reasons of durability and reliability. But, to enable series production, design
measures concerning friction, NVH and mass balance need additionally to be taken.
Generally, an Extended Expansion engine concept is particularly suitable for applications
with high load spectra, rather low specific power (relative to the weight) and low engine
speeds. Therefore, EE engines could be the promising propulsion for stationary applications
or extended-range electric vehicles (EREV).

Conclusions and outlook 153
Despite the long development and the achieved progresses, worthwhile and partly surprising
potentials concerning efficiency, emissions and power density exist. Based on a high R&D
intensity, not least by research activities of alternative propulsion systems, these potentials
will ensure a long and dominant role of the internal combustion engine.
In the course of this doctoral thesis, several results and findings have been published. Extracts
of sub-chapters 3.1, 3.2, 3.3 and 3.4 were treaded in [90], sub-chapters 4.1 to 4.6 in [90 and
112], sub-chapter 4.7 in [26] and chapter 6 in [92 and 91].

Literature i
Literature
1. Ai, X., Wilmer, M., Remboski, D., “Electrical Variable Cam Phase Shifter for Internal
Combustion Engine,” SAE Technical Paper Series, SAE 2008-01-1351, Detroit, 2008
2. Albertson, W., C., et al., “Displacement on Demand – der Antrieb von morgen mit
Zylinderabschaltung, MTZ Sonderheft: „Antriebe mit Zukunft“ 12,“ 12–18, 2005
3. Atkinson, J., “Gas engine,” Patent No.: US 367 496, Aug. 2, 1887
4. Austin W.M., “Variable stroke internal combustion engine,” Patent No.: US 1 278 563,
Feb 3, 1916
5. Bauer, M., Wurms, R., Budack, R., Wensing, M., „Potenziale von Ottomotoren mit
einem zusätzlichen Expansionszylinder,“ 5. MTZ Fachtagung Ladungswechsel des
Verbrennungsmotors, Stuttgart, 2012
6. Bergsten, L., Drangel, H., „Der neue Saab SVC Motor – Ein Zusammenspiel zur
Verbrauchsreduzierung von variabler Verdichtung, Hochaufladung und Downsizing,“ 9.
Aachener Kolloquium Fahrzeug- und Motorentechnik, 2000
7. Bernard, L., et al., „Elektrohydraulische Ventilsteuerung mit dem „MultiAir“-
Verfahren,“ MTZ – Motortechnische Zeitschrift 70(2009) 12, Wiesbaden, 2009
8. Blumberg, J., Gerster, J., „Versuche mit einem Serienmuster nach Umrüstung auf ein
Knickpleuel,“ MTZ, Mar. 1988
9. Borgmann K., Hofmann R., Liebl J., Melcher T.: Der BMW 4-Zylinder-Motor – Der
erste Mitglied der neuen Ottomotoren-Generation, Pressemitteilung der BMW AG,
München, 2000
10. Brendel, M., Dengler, S., “Brennkraftmaschine mit verlängertem Expansionshub und
Momentenausgleich“, Patent No.: DE102010027351 A1, Jan. 2012
11. Capstone Turbine Corporation, “Capstone Hybrid Vehicle Experience,” Capstone
Turbine Corporation, December 2009, www.capstoneturbine.com (retrieved 2015-04-
10)
12. Capstone Turbine Corporation, “CMT-380 - Microturbine Supercar,” Capstone Turbine
Corporation, December 2009, www.capstoneturbine.com (retrieved 2015-04-10)
13. Conrad, R., „Konstruktionsmöglichkeiten für Kohlenwasserstoffmotoren mit
wachsendem Drehmoment bei sinkender Tourenzahl,“ Der Motorwagen VIII(XIX),
1905
14. Constensou, C., Kapus, P., et al., “Development of a Variable Compression Ratio
GTDI Engine with 2-Stage Turbocharging and Cooled External EGR,” SAE High
Efficiency Engine Conference, April 2012
15. Corfield, G., Harrison, K., “Optimisation of Gomecsys variable compression ratio
engine with GT-Power simulation tools,” Prodrive Automotive Technology,
Warwickshire, England, October 2006
16. De Gooijer, L., H., “Reciprocating piston mechanism,” Patent No.: US 20120180583
A1, Jul 19, 2012
17. Doyle, E., Di Nanno, L., Kramer S., “Installation of a diesel-organic Rankine compound
engine in a class 8 truck for a single-vehicle test,” SAE Paper No.790646, 1979
18. Eckstein, L., et al., “Mobility Requirements of Future Customer Generations,” ATZ
09/2011, Volume 113, Sep. 2011
ii Literature
19. Eder, A., “Waste-Heat Recovery in Highly Efficient Powertrains – a Key to further CO2
reductions,” Der Arbeitsprozess des Verbrennungsmotors - 12. Tagung, Sep. 2009,
20. Eilts, P., „Das Miller- und das Atkinsonverfahren an Verbrennungsmotoren,“ 7. MTZ
Fachtagung Ladungswechsel im Verbrennungsmotor, 2014
21. Fairbanks, J., “Thermoelectric Applications in Vehicles Status 2008,” U.S. Department
of Energy, 2008
22. Fasse, M., „Autohersteller: BMW verliert Glauben an den Wasserstoffantrieb,“
Handelsblatt, Dec. 2009, http://www.handelsblatt.com/unternehmen/industrie/
autohersteller-bmw-verliert-glauben-an-den-wasserstoffantrieb/3320432.html (retrieved
2015-02-22)
23. Fiala-Fernbrugg, B., “Double-piston internal combustion engine,” Patent No.: US 2 199
625, June 4, 1938
24. Freymann, R., Strobl, W., Obieglo, A., “The Turbosteamer: A System Introducing the
Principle of Cogeneration in Automotive Applications,” Motortechnische Zeitschrift,
MTZ 05/2008, Jahrgang 69, pp.404-412, May 2008
25. Fuel Cell Handbook – 7th Edition, EG&G Technical Services, Inc., Nov. 2004
26. Grassberger, H., Pertl, P., Sato, T., et al., “Expansion to higher efficiency -
Requirements on valve actuation for Atkinson cycle-based engines,” 13th Stuttgarter
Int. Symposium "Automotive and Engine Technology" , S. 129 – 143, 2013
27. Green Car Congress, „Bladon Jets, SR Drives and Jaguar Land Rover Win Funding for
Gas Turbine Electric Vehicle Project,” Green Car Congress, Jan. 2010,
http://www.greencarcongress.com/2010/01/bladon-20100129.html (retrieved 2015-03-
10)
28. Gstrein, W., „Nutzung weiterer Potenziale zur Erhöhung des Wirkungsgrades von
Dieselmotor-Antriebe,“ ÖVK Vortrag TU Graz, 2008
29. Hanlon, M., “Mercedes-Benz unveils DiesOtto - the future of the gasoline engine,” Jul.
2007, http://www.gizmag.com/go/7679/ (retrieved 2014-12-12)
30. Heywood, J., “Internal Combustion Engine Fundamentals,” ISBN 0-07-100499-8, 1989
31. Hilite International, Inc., “Unternehmensbroschüre,” Stand 0507, Marktheidenfeld,
2007
32. Hoelz, M., Collins, M., Roehm, H., “A new era Accelerating towards 2020 – An
automotive industry transformed,” Deloitte Touche Tohmatsu, 2009
33. Homepage: http://en.wikipedia.org/wiki/Biofuel (retrieved 2015-04-10)
34. Homepage: http://en.wikipedia.org/wiki/Hybrid_electric_vehicle (retrieved 2015-04-12)
35. Homepage: http://en.wikipedia.org/wiki/Plug-in_electric_vehicle (retrieved 2015-04-
12)
36. Homepage: http://en.wikipedia.org/wiki/Variable_compression_ratio (retrieved 2015-
03-15)
37. Homepage: http://imgkid.com/gas-turbine-engine-car.shtml (retrieved 2015-03-17)
38. Homepage: http://world.honda.com/automobile-technology/VTEC/ (retrieved 2015-03-
16)
39. Homepage: http://world.honda.com/powerproducts-technology/exlink/ (retrieved 2015-
03-16)
40. Homepage: http://www.carscoops.com/2009/05/chevy-volt-granddaddy-gm-1969-
gasoline.html (retrieved 2015-04-05)
Literature iii
41. Homepage: http://www.ecomotors.com/ (retrieved 2015-04-01)
42. Homepage: http://www.gomecsys.com (retrieved 2015-03-28)
43. Homepage: http://www.mce-5.com/ (retrieved 2015-03-15)
44. Homepage: http://www.saabnet.com/tsn/press/000318.html (retrieved 2015-03-15)
45. homepage: http://www.scuderigroup.com/ (retrieved 2015-04-03)
46. Homepage: http://www.stelzermotor.com (retrieved 2015-04-02)
47. Homepage: http://www.total911.com/thought-of-the-day-a-cam-for-all-seasons/
(retrieved 2015-03-16)
48. Homepage: http://www2.mazda.com/en/publicity/release/2007/200708/070808.html
(retrieved 2015-04-04)
49. Homepage: www.5-stroke-engine.com (retrieved 2015-04-03)
50. Honda Motor Co., Ltd., “Variable Valve Timing for Power and Fuel Economy,”
http://world.honda.com/history/challenge/1989vtecengine/index.html (retrieved 2015-
03-17)
51. Iijima, A., Yoshida, K., Shoji, H., “A Study of HCCI Combustion using Spectroscopic
Techniques and Chemical Kinetic Simulations,” SETC Small Engine Technology
Conference, 20097070, Penang, Malaysia, 2009
52. International Organization of Motor Vehicle Manufacturers, “Climate change and CO2
brochure,” http://oica.net/wp-content/uploads/climate-change-and-co2-brochure.pdf
(retrieved 2014-07-08)
53. IPCC, 2007, “Climate Change 2007: Synthesis Report. Contribution of Working Groups
I, II and III to the Fourth Assessment Report of the Intergovernmental Panel on Climate
Change [Core Writing Team, Pachauri, R.K and Reisinger, A. (eds.)].” IPCC, Geneva,
Switzerland, 104 pp., 2007
54. IPCC, 2013, “Climate Change 2013: The Physical Science Basis. Contribution of
Working Group I to the Fifth Assessment Report of the Intergovernmental Panel on
Climate Change [Stocker, T.F., D. Qin, G.-K. Plattner, M. Tignor, S.K. Allen, J.
Boschung, A. Nauels, Y. Xia, V. Bex and P.M. Midgley (eds.)].” Cambridge University
Press, Cambridge, United Kingdom and New York, NY, USA, 1535 pp., 2013
55. Ishibashi, Y., Nishida, K., Sakai Y., Sakuyama H., “Two-Stroke Gas Exchanging
Method for Controlling Auto-Ignition: Activated Radical Combustion”, Article of
Honda R&D Technical Review, Vol.15 No.1, 2000
56. Janssens-Maenhout, G., et.al, “Results of the emission inventory EDGAR v4.2 of
November 2011,” European Commission - JRC Joint Research Centre, IES Institute for
Environment and Sustainability, Air and Climate Unit, TP 290, I-21027, Ispra (VA),
Italy, 2013
57. Kamiyama, E., “Variable compression ratio internal combustion engine,” Patent No.:
WO2008/153192 A1, Dec. 2008
58. Kawano, D., et.al. “Ignition and Combustion Control of Diesel HCCI,” SAE Paper No.
2005-01-2132, SAE Brasil Fuels & Lubricants Meeting, Rio De Janiero, Brazil, May
2005
59. Kentfield, J., "Extended, and Variable, Stroke Reciprocating Internal Combustion
Engines," SAE Technical Paper 2002-01-1941, doi:10.4271/2002-01-1941, 2002
60. Kentfield, J., “A Simple Variable Expansion-Ratio, Spark Ignition, Four Stroke,
Engine,” SAE Technical Paper 932874, 1993
iv Literature
61. Kerkau, M., Knirsch, S., Neußer, H.-J., „Der neue Sechs-Zylinder-Biturbo-Motor mit
variabler Turbinengeometrie für den Porsche 911 Turbo,“ 27. Int. Wiener
Motorensymposium, 2006
62. Kéromnès A., Delaporte B., Schmitz G., Le Moyne L., “Development and validation of
a 5 stroke engine for range extenders application,” Energy Conversion and Management
82 (2014) 259–267, 2014
63. Klüting, M., Landerl, C., „Der neue Sechszylinder-Ottomotor von BMW- Teil l:
Konzept und konstruktive Merkmale,“ MTZ 65, 868-880, 2004
64. Koga, H., Watanabe S., “Research on Extended Expansion General-Purpose Engine –
Heat Release and Friction”, SAE Technical Paper 2007-32-0003, 2007
65. Köhler, E., Flierl, R., „Verbrennungsmotoren,“ 4. Auflage, ISBN 3-528-43108-3, Sep.
2006
66. Kreuter, P., et al., “K-Motor – A new Combustion Engine Concept with Increase of
Efficiency by 50%,” 28th International Vienna Motor Symposium, 2007
67. Kushch, A., “The Effects of an Exhaust Thermoelectric Generator of a GM Sierra
Pickup Truck,” Hi-Z Technology Inc., DEER Conference 2004, Coronado, California,
2004
68. Landerl, C., „Der neue BMW Reihensechszylinder Ottomotor mit Magnesium-
Aluminium-Verbundkurbelgehäuse – Trends in der Motorentechnologie,“ Bayern
Innovativ, Passau, 2004
69. Lenz, H., P., „Tendenzen in der Entwicklung der Fahrzeugantrieb,“ ÖVK, Jan. 2011
70. Liebl, J., et al., “The Thermoelectric Generator from BMW is Making Use of Waste
Heat,” MTZ worldwide Edition, Apr. 2009
71. Lucas, R., “Internal-combustion engine,” Patent No.: US 952706 A, Mar. 22, 1910
72. Mahle GmbH, „Ventiltrieb - Systeme und Komponenten,“ Springer Fachmedien
Wiesbaden 2013, ATZ/MTZ-Fachbuch, ISBN 978-3-8348-2490-5, 2013
73. Mazda Motor Corporation, “A new-generation highly-efficient direct-injection gasoline
engine that achieves the world's highest gasoline engine compression ratio of 14.0:1,”
http://www.mazda.com/en/innovation/technology/skyactiv/ (retrieved 2015-03-07)
74. MCE-5 Development S.A., “MCE-5 VCRi – Pushing back the fuel consumption
reduction limits,” http://mce-5.com/english/index.html (retrieved 2015-07-07)
75. Mederer, G., “Mederer Engine,” Patent No.: EP 0314773 B1, Aug. 1991
76. Menderl, C., “Envera Variable Compression Ratio Engine,” Envera, LLC, March 2011
77. Merker, G., P., Teichmann, R., „Grundlagen Verbrennungsmotoren,“ ATZ/MTZ-
Fachbuch, doi:10.1007/978-3-658-03195-4_19, Springer Fachmedien Wiesbaden, 2014
78. Middendorf, H., Theobald, J., Lang, L., Hartel K., „Der 1,4-L-TSI-Ottomotor mit
Zylinderabschaltung“, MTZ 03/2012 Jahrgang 73, S. 186-193, 2012
79. Miller, R., “Internal-combustion engine,” Patent No.: US 2 400 247 A, May 14, 1946
80. Miller, R., “Supercharged engine,” Patent No.: US 2 817 322 A, Dec. 14, 1957
81. Mitani, S., Hashimoto, S., Nomura, H., Shimizu, R. et al., “New Combustion Concept
for Turbocharged Gasoline Direct-Injection Engines,” SAE Int. J. Engines 7 (2)
doi:10.4271/2014-01-1210, 2014
82. Moran, M., et al., “Principle of Engineering Thermodynamics - Seventh Edition,” ISBN
978-0-470-91801-2, Nov. 2011
Literature v
83. Moteki, K., Aoyama, S., Ushijima, K., Hiyoshi, R., et. al., “A Study of a Variable
Compression Ratio System with a Multi-Link Mechanism”, SAE Technical Paper 2003-
01-0921, doi:10.4271/2003-01-0921, 2003
84. Muhs, D. et al., „Roloff / Matek Maschinenelemente,“ 16. Auflage, ISBN 3-528-07028-
5, 2003
85. Naber, J., D., and Johnson, J., E., “Internal combustion engine cycles and concepts,”
Michigan Technological University, doi:10.1533/9780857097422.2.197, 2014
86. Nagesh, M., Govinda M., K., and Gopalakrishnan, K., “Experimental Investigation on
Extended Expansion Engine (EEE),” SAE Technical Paper 920452,
doi:10.4271/920452, 1992
87. Nelson, C., D., “Variable stroke engine,” Patent No.: US 4 517 931, May 1985
88. Oomori, H., Ogino, S., "Waste Heat Recovery of Passenger Car Using a Combination of
Rankine Bottoming Cycle and Evaporative Engine Cooling System," SAE Technical
Paper 930880, doi:10.4271/930880, 1993
89. Osborne R. J. et al.: Evaluation of HCCI for Future Gasoline Powertrains, SAE Paper
No.: 2003-01-0750, SAE World Congress, Detroit, 2004
90. Pertl, P., Trattner, A., et al., "Expansion to Higher Efficiency - Investigations of the
Atkinson Cycle in Small Combustion Engines," SAE Technical Paper 2012-32-0059,
doi:10.4271/2012-32-0059, 2012
91. Pertl, P., Trattner, A., et al., “Expansion to Higher Efficiency - Experimental
Investigations of the Atkinson Cycle in Small Combustion Engines,” SAE Technical
Paper 2012-32-0809, 2015
92. Pertl, P., Trattner, A., et al.: “Experimentelle Untersuchungen eines Ottomotors mit
erweiterter Expansion über den Kurbeltrieb und die bedeutende Rolle der variablen
Ventilsteuerung,“ Ladungswechsel im Verbrennungsmotor, 2014
93. Pischinger, R., Klell, M., Sams, T., „Thermodynamik der Verbrennungskraftmaschine –
Der Fahrzeugantrieb,“ 3. Auflage, ISBN 3-211-83679-9, 2009
94. Pischinger, S., Wittek, K., Tiemann, C., “Two-stage Variable Compression Ratio with
Eccentric Piston Pin,” MTZ worldwide Edition: 2009-02, 2009
95. Powell, A., L., “Powell Engine,” Patent No.: US 1 663 261 A, Mar. 1928
96. Ross J., Grigoriadis P., et. al., “Neue Wege zum variable Hubvolumen – was kommt
nach der Zylinderabschaltung am Ottomotor?“, 33. Internationales Wiener
Motorensymposium, 2012
97. Ross, A., “Inline Dual Piston Engine,” Patent No.: EP 2449227 B1, June 2010
98. Ross, A., „Ansteuerung für einen Inline-Doppelkolbenmotor,“ Patent No.: DE
102012004981 A1, Mar 2012
99. Schaffer, K., M., Eichlseder, H., Weissteiner D., „Potenziale eines Pkw-Dieselmotors
mit geschränktem Kurbelbetrieb,“ 11. Tagung „Der Arbeitsprozess des
Verbrennungsmotors“, Sep. 2007
100. Schmiederer, K. et al., “The Potential Fuel Consumption of a Truck Engine plus
Rankine Cycle System, derived from Performance Measurements over Steady State and
Transient Test Cycles at Constant Emissions Levels,” 33rd International Vienna Motor
Symposium, Apr. 2012
101. Schmitz, G., “Five Stroke Internal Combustion Engine - A new concept for internal
combustion engines,” June 2011

vi Literature
102. Shaltens, R., K., “Phase I Results from the Stirling-Powered Vehicle Project,”
DOE/NASA/50112-76, NASA, NASA TM-100978, 1988
103. Shaltens, R., K., “Stirling Powered Van Program Overview,” SAE 861303, Sep. 1986
104. Shirota, D., Iida, N., “An Investigation of the Potential of Thermal and Mixing
Stratifications for Reducing Pressure Rise Rate on HCCI Combustion by using Rapid
Compression Machine,” SETC Small Engine Technology Conference, SAE
International 20097070, Penang, Malaysia, 2009
105. Sorger, H., “The AVL Pure Range Extender – Layout, Development and Results,”
Austrian Society of automotive engineers, SAE, Graz, Austria, Dec. 2009
106. Spicher, U., “Analysis of the Efficiency of Future Powertrains for Individual Mobility,”
MTZ 02/2012, 2012
107. Spuller, C., Eichlseder, H., „Möglichkeiten zur Darstellung dieselmotorischer
Brennverfahren mit Wasserstoff,“ Der Arbeitsprozess des Verbrennungsmotors - 12.
Tagung, Graz, Austria, Sep. 2009
108. Takita, Y., Kono, S., and Naoi, A., “Study of Methods to Enhance Energy Utilization
Efficiency of Micro Combined Heat and Power Generation Unit-Equipped with an
Extended Expansion Linkage Engine and Reduction of Waste Energy,” SAE Paper
Number: 2011-32-0574, doi:10.4271/2011-32-0574, Small Engine Technology
Conference, 2011
109. Teegen, H., „Gemischverdichtende Zweitakt-Verbrennungskraftmaschine mit
einstellbarer Kompression und Selbstzuendung,“ Patent No.: DE 864 476 (C), 1950
110. The International Council on Clean Transportation (ICCT), “Global Light-duty
Vehicles: Fuel Economy/GHG Emissions Standards,” June 2012
111. Titolo, A., „Die variable Ventilsteuerung von Fiat,“ MTZ – Motortechnische Zeitschrift
47 Heft 5, Wiesbaden, 1986
112. Trattner, A., Pertl, P., Sato, T., et al, „Die bedeutende Rolle des variablen Ventiltriebes
bei einem Motorkonzept mit erweiterter Expansion über den Kurbeltrieb,“ 5. MTZ-
Fachtagung Ladungswechsel im Verbrennungsmotor, S. 1 – 18, 2012
113. Turner, J. et al., “The Lotus Range Extender Engine,” SAE 2010 Powertrains, Fuels &
Lubricants Meeting, SAE International 2010-01-2208, San Diego, California, 2010
114. Unger, H., „Valvetronic - Der Beitrag des Ventiltriebs zur Reduzierung der CO2-
Emissionen des Ottomotors,“ Die Bibliothek der Technik Band 263, ISBN 3-478-
93308-0, 2004
115. Unger, N., et al., “Attribution of climate forcing to economic sectors,” Proceedings of
the National Academy of Sciences of the United States of America, 107, 3382-3387,
doi:10.1073/pnas.0906548107, 2010
116. Van Basshuysen, R., et al., „Handbuch Verbrennungsmotor – Grundlagen,
Komponenten, Systeme, Perspektiven,“ ISBN 978-3-8348-1549-1, 6. Auflage,
Vieweg+Teubner, 2011
117. Volkswagen AG, “To the Point: Breakthrough for the 1-Litre Car Volkswagen presents
the most fuel-efficient automobile in the world,” Press release, Wolfsburg / Frankfurt,
Sep. 2009
118. Wallner, T., “Opportunities and Risks for Hydrogen Internal Combustion Engines in the
United States,” Der Arbeitsprozess des Verbrennungsmotors - 12. Tagung, Graz,
Austria, Sep. 2009

Literature vii
119. Watanabe, S., Koga, H., Kono, S., “Research on Extended Expansion General-Purpose
Engine – Theoretical Analysis of Multiple Linkage System and Improvement of
Thermal Efficiency,” SAE Technical Paper 2006-32-0101, doi:10.4271/2006-32-0101,
2006
120. Weissbäck, M., et al., „Der Effizienzmotor – Ökonomische Alternative zum
Downsizing-Trend,“ MTZ 12/2011, 2011
121. Willand, J., Jelitto, C., Jakobs, J., “The GCI Combustion Process from Volkswagen,”
MTZ worldwide Edition: 2008-04, 2008
122. Wittek, K., “Development of a Two-stage Variable Compression Ratio Engine,” FEV
Motorentechnik GmbH, Aachen, Germany, 2008
123. Wittek, K., Tiemann, C., Pischinger, S., “Two-Stage Variable Compression Ratio with
Eccentric Piston Pin and Exploitation of Crank Train Forces,” SAE Int. J. Engines
2(1):1304-1313, doi:10.4271/2009-01-1457, 2009
124. Woschni, G., “Computer Programs to Determine the Relationship between Pressure,
Flow, Heat Release and Thermal Load in Diesel Engines,” SAE Technical Paper
650450, 1965
125. Woschni, G., Fieger, J., „Experimentelle Bestimmung des örtlich gemittelten
Wärmeübergangskoeffizienten im Ottomotor,“ MTZ - Motortechnische Zeitschrift 42,
1981
126. Woschni, G., Kolesa, K., Spindler, W., „Isolierung der Brennraumwände - Ein
lohnendes Entwicklungsziel bei Verbrennungsmotoren,“ MTZ 47(12), 495-500, 1986
127. Yun, H., Wermuth, N., Najt, P., “High Load HCCI Operation Using Different valving
Strategies in a Naturally-Aspirated Gasoline HCCI Engine,” SAE 2011-01-0899, 2011
128. Zima, S., „Kurbeltriebe,“ 1. Auflage, ISBN 3-528-03115-8, 1998
129. Zima, S., Ficht, R., „Ungewöhnliche Motoren,“ 3. Auflage, ISBN 978-3-8343-3140,
2010
viii List of figures
List of figures
Figure 1 – Global mean surface temperature increase as a function of cumulative total global
CO2 emissions from various lines of evidence [54] ........................................................... 1
Figure 2 – Change in global annual mean surface temperature relative to 1986–2005 [54] ..... 2
Figure 3 – Percentage distribution of man-made CO2 emissions [52] ....................................... 2
Figure 4 – Extract from the findings of the study on the importance of the car, vehicle type
and type of drive system – Part 2 [18] ............................................................................... 3
Figure 5 – Extract from the findings of the study on the importance of the car, vehicle type
and type of drive system –Part 1 [18] ................................................................................ 3
Figure 6 – Possibilities to increase ICE efficiency .................................................................... 6
Figure 7 – Ideal engine efficiency (constant volume process, mixture induction) [93] ............. 7
Figure 8 – Difference of the ideal engine efficiency between a constant volume and a constant
pressure process based on mixture induction [93] ............................................................. 7
Figure 9 – Classification of VCR concepts [cf. 77] ................................................................... 8
Figure 10 – Layout of the MCE-5 VCRi from PSA [cf. 43] ...................................................... 9
Figure 11 – Layout of the Gomecsys VCR engine [15] ............................................................. 9
Figure 12 – VCR engine from Toyota [57] ................................................................................ 9
Figure 13 –VCR mechanism from Envera [76] ......................................................................... 9
Figure 14 – Layout of the VCR connecting rod from FEV [122] ............................................ 10
Figure 15 –VCR Engine from Saab [44] .................................................................................. 10
Figure 16 – Trade-off between efficiency, wall heat and combustion duration [77] ............... 11
Figure 17 – Powell Engine [95] ............................................................................................... 12
Figure 18 – Mederer Engine [75] ............................................................................................. 12
Figure 19 – Lohmann Selbstzünder [109 and 77] .................................................................... 13
Figure 20 – opoc® (opposed-piston opposed-cylinder) engine [41] ....................................... 14
Figure 21 – Chain-driven cam phaser from Hydraulik-Ring [31] ........................................... 15
Figure 22 – Electrical cam phaser from Timken Company [1] ................................................ 15
Figure 23 – VTEC mechanism from Honda [38] ..................................................................... 15
Figure 24 – Porsche Vario Cam [47] ....................................................................................... 15
Figure 25 – Audi AVS operating principle [72] ...................................................................... 16
Figure 26 – Mercedes Benz ACC operating principle [72] ..................................................... 16
Figure 27 – BMW Valvetronic [68 and 9] ............................................................................... 17
Figure 28 – UniAir from Schaeffler [7] ................................................................................... 17
Figure 29 – Distribution of mechanical losses of a 6 cylinder SI engine [114] ....................... 19
Figure 30 – Stelzer engine [46] ................................................................................................ 19
Figure 31 – Turbosteamer [24] ................................................................................................. 21
Figure 32 – Thermoelectric Generator [70] ............................................................................. 22

List of figures ix
Figure 33 – Atkinson engine patent [3] .................................................................................... 25
Figure 34 – Miller engine patent [20] ...................................................................................... 26
Figure 35 – pV-diagram (Air-standard Otto cycle (1-4) vs. Air-standard Atkinson cycle (1-
4*)) ................................................................................................................................... 29
Figure 36 – Ts-diagram (Air-standard Otto cycle (1-4) vs. Air-standard Atkinson cycle (1-4*))
.......................................................................................................................................... 29
Figure 37 – Thermal efficiency (Air-standard Otto cycle vs. Air-standard Atkinson cycle with
expansion to ambient pressure) ........................................................................................ 30
Figure 38 – Thermal efficiency difference Δη (Air-standard Otto cycle vs. Air-standard
Atkinson cycle with expansion to ambient pressure) vs. expansion ratio for an Air-
standard Atkinson cycle with expansion to ambient pressure .......................................... 31
Figure 39 – Consequence of reduced CER for the thermal efficiency performance ............... 32
Figure 40 – Ideal engine efficiency of the Otto cycle and the Atkinson cycle as well as the
CER over the compression ratio ....................................................................................... 34
Figure 41 – Honda EXlink engine [108] .................................................................................. 35
Figure 42 – Austin engine [4] .................................................................................................. 35
Figure 43 – Gomecsys VCR engine [16] ................................................................................. 36
Figure 44 – Double piston internal combustion engine [23] .................................................... 37
Figure 45 – Lucas engine [71] .................................................................................................. 37
Figure 46 - Inline dual piston engine assembly [98] ................................................................ 38
Figure 47 - Deutz Verbundmotor [129] ................................................................................... 38
Figure 48 – Prototype engine layout (Audi) [5] ....................................................................... 39
Figure 49 – 5-stroke internal combustion engine from Ilmor Engineering Ltd. [49] .............. 40
Figure 50 – Scuderi split cycle engine [45] .............................................................................. 40
Figure 51 – Main parts of an Atkinson cycle-based engine via planetary gear (left image: 3D
view, right image: sectional view) ................................................................................... 41
Figure 52 – Atkinson cycle-based piston motion (superposition of extender- and crankshaft
motion) ............................................................................................................................. 42
Figure 53 – Piston motion of an Atkinson cycle-based engine via planetary gear .................. 43
Figure 54 – 1D-CFD Simulation methodology ........................................................................ 44
Figure 55 – 1D-CFD simulation model.................................................................................... 45
Figure 56 – Cylinder volume and valve timing (EE engine (CER=0.5) vs. base engine) ....... 46
Figure 57 – Cylinder volume and valve timing of the base engine and the EE engine for
different CER values (0°CA is TDCI) ............................................................................. 47
Figure 58 – Indicated efficiency over CER at full load and 6000 rpm .................................... 48
Figure 59 – pV-diagrams of the EE engine (CER = 0.5) compared to the base engine at full
load and 6000 rpm ............................................................................................................ 49
Figure 60 – Valve timing and cylinder volume characteristics of Miller cycle concepts ........ 50
Figure 61 –Indicated efficiency of simulated Miller cycles at full load and 6000 rpm ........... 51
Figure 62 – GE loops of Miller cycles with early IVC strategies at full load and 6000 rpm .. 51
x List of figures
Figure 63 – GE loops of Miller cycles with late IVC strategies at full load and 6000 rpm ..... 52
Figure 64 –Indicated power and indicated mean effective pressure (EE engine vs. base
engine) .............................................................................................................................. 57
Figure 65 – Cylinder volume and full load valve timing (EE engine vs. base engine) ............ 58
Figure 66 – pV-diagrams of high and low pressure cycles of the EE engine and the base
engine at full load and 6000 rpm ...................................................................................... 59
Figure 67 – Spatially averaged cylinder gas temperature at full load and 6000 rpm ............... 60
Figure 68 – Indicated efficiencies over engine speed at full load ............................................ 61
Figure 69 – Cylinder volume and valve timing strategies (full and part load) over °CA (0°CA
is TDCI) ............................................................................................................................ 63
Figure 70 – Indicated efficiencies of the EE engine with different valve timing strategies and
the base engine at part load (BMEP = 2 bar and 2000 rpm) ............................................ 63
Figure 71 –GE loops of the EE engine with different valve timing strategies and the base
engine at part load (BMEP = 2 bar and 2000 rpm) .......................................................... 64
Figure 72 – Spatially averaged gas temperature in the combustion chamber of the EE engine
with different valve timing strategies and the base engine at part load (BMEP = 2 bar and
2000 rpm) ......................................................................................................................... 65
Figure 73 – Exhaust gas mass flow of the EE engine with different valve timing strategies and
the base engine at part load (BMEP = 2 bar and 2000 rpm) (positive values indicate the
gas flow from the cylinder into the exhaust port) ............................................................ 66
Figure 74 – Valve timing strategies for de-throttling ............................................................... 68
Figure 75 – GE loops of the EE engine (In-deth & Ex-PL and In-WOT & Ex-PL) and the base
engine (In-WOT / Ex-WOT) at part load (BMEP = 2 bar and 2000 rpm) ....................... 69
Figure 76 – Indicated part load efficiency of the EE engine (In-deth & Ex-PL and In-WOT &
Ex-PL) and the base engine (In-WOT & Ex-WOT) at part load (BMEP = 2 bar and
2000 rpm) ......................................................................................................................... 69
Figure 77 – EE valve timing variants for cylinder deactivation over °CA (0°CA is TDCI) ... 71
Figure 78 – GE loops of the EE engine at cylinder deactivation at part load (BMEP = 2 bar
and 2000 rpm) .................................................................................................................. 72
Figure 79 – Exhaust gas mass flow of the EE engine at cylinder deactivation (BMEP=2 bar
and 2000 rpm) .................................................................................................................. 72
Figure 80 –Indicated efficiencies of the EE engine with cylinder deactivation and the base
engine without cylinder deactivation at part load (BMEP=2 bar and 2000 rpm) ............ 73
Figure 81 – Simulation methodology of the driving cycle analysis ......................................... 74
Figure 82 – BSFC map of the base engine without valve train variability .............................. 76
Figure 83 – BSFC map of the EE engine without valve train variability ................................ 76
Figure 84 – Differential BSFC map with / without cylinder deactivation (base engine) ......... 77
Figure 85 – Differential BSFC map with / without cylinder deactivation (EE engine) ........... 78
Figure 86 – Differential BSFC map with / without two-step variable exhaust valve lift (EE
engine)) ............................................................................................................................. 79
Figure 87 – Accumulated fuel consumption in the NEDC driving cycle of the different engine
concepts ............................................................................................................................ 80

List of figures xi
Figure 88 – Accumulated fuel consumption in the FTP-75 driving cycle of the different
engine concepts ................................................................................................................ 81
Figure 89 – Comparison of fuel consumption of the different engine concepts ...................... 82
Figure 90 – EE prototype engine layout................................................................................... 84
Figure 91 – Piston motion optimisation process ...................................................................... 85
Figure 92 – EE prototype engine piston motion ...................................................................... 86
Figure 93 – Simulation methodology - interaction between 1D-CFD simulation (AVL Boost)
and rigid body simulation (AVL EXCITE Timing Drive) ............................................... 88
Figure 94 – Check of the piston-valve collision - left image: before adaption; right image:
after adaption (0 mm represents the cylinder head gasket surface) ................................. 89
Figure 95 – Exhaust valve timing optimisation in part load .................................................... 90
Figure 96 – Intake valve timing optimisation in part load ....................................................... 91
Figure 97 – Selection of the coordinate system ....................................................................... 92
Figure 98 – Free mass forces of the unbalanced EE prototype engine at 6000 rpm ................ 93
Figure 99 – Centre of gravity (COG) movement of the relevant EE prototype engine parts .. 94
Figure 100 – Free mass forces of the relevant EE prototype engine parts at 6000 rpm .......... 95
Figure 101 – Free mass forces of the relevant parts, the cylinders and the entire EE prototype
engine at 6000 rpm ........................................................................................................... 96
Figure 102 – Free mass moments around the y- and z-axis at 6000 rpm ................................. 96
Figure 103 – Fourier decompositions of free mass forces from 0.5 to 2nd
order in z-direction
of cylinder 1 at 6000 rpm ................................................................................................. 97
Figure 104 – Fourier decompositions of free mass forces from 0.5 to 2nd
order in y-direction
of cylinder 1 at 6000 rpm ................................................................................................. 98
Figure 105 – Fourier decompositions of 0.5 and 1.5 order free mass forces in z-direction at
6000 rpm .......................................................................................................................... 98
Figure 106 – Fourier decompositions of 0.5 and 1.5 order free mass forces in y-direction at
6000 rpm .......................................................................................................................... 99
Figure 107 – Free mass forces of the EE prototype engine in z-direction at 6000 rpm
(numerical calculation and calculation based on orders) ................................................. 99
Figure 108 – Free mass forces of the EE prototype engine in y-direction at 6000 rpm
(numerical calculation and calculation based on orders) ............................................... 100
Figure 109 – Fourier decomposition of the free mass moments around the y-axis at 6000 rpm
........................................................................................................................................ 101
Figure 110 – Fourier decomposition of the free mass moments around the z-axis at 6000 rpm
........................................................................................................................................ 101
Figure 111 – Implementation of the balance shafts in the crank case .................................... 102
Figure 112 – Mass balancing measure results of the EE prototype engine at 6000 rpm ....... 103
Figure 113 – Overturning torque of the EE prototype engine at 6000 rpm ........................... 104
Figure 114 – Comparison of the free mass forces between the EE prototype engine and
conventional 2-cylinder engines at 6000 rpm ................................................................ 105
Figure 115 – Intake and exhaust timing variants (valve lift curves) of the EE prototype engine
xii List of figures
........................................................................................................................................ 106
Figure 116 – EE prototype engine map (IMEP over engine speed) ....................................... 107
Figure 117 – pV-diagrams of the EE prototype engine (experimental) in comparison to the
base engine (experimental) and the reference engine (simulation) at full load and
5000 rpm ........................................................................................................................ 109
Figure 118 – GE-loops of the EE prototype engine (experimental) in comparison to the base
engine (experimental) and the reference engine (simulation) at full load and 5000 rpm
........................................................................................................................................ 110
Figure 119 – Loss analysis for full load operation at 5000 rpm ............................................ 111
Figure 120 – Gross heat release and integrated gross heat release of the EE prototype engine
(experimental) in comparison to the base engine (experimental) and the reference engine
(simulation) at full load and 5000 rpm ........................................................................... 112
Figure 121 – In-cylinder gas temperatures of the EE prototype engine (experimental) in
comparison to the base engine (experimental) and the reference engine (simulation) at
full load and 5000 rpm ................................................................................................... 113
Figure 122 – GE loops of the EE prototype engine and the base engine at full load and
5000 rpm - Classification into single GE losses ............................................................ 114
Figure 123 – Distribution of the local heat transfer coefficient in the combustion chamber at
full load and 5000 rpm for the EE prototype engine ...................................................... 115
Figure 124 – Integrated wall heat of cylinder head, cylinder and piston at full load and
5000 rpm (0°CA is TDCI, -15°CA is SOC) ................................................................... 116
Figure 125 – Indicated power and indicated mean effective pressure (IMEP) at full load over
engine speed (EE prototype engine vs. base engine) ..................................................... 117
Figure 126 – Engine speed influence on indicated efficiency at full load (EE prototype engine
vs. base engine) .............................................................................................................. 118
Figure 127 – Engine speed influence on inner engine losses of the EE prototype engine at full
load ................................................................................................................................. 119
Figure 128 – Net heat release characteristics of the EE prototype engine at full load for
different engine speeds ................................................................................................... 120
Figure 129 – Gas exchange behaviour at full load over engine speed (EE prototype engine vs.
base engine) .................................................................................................................... 121
Figure 130 – Single GE losses of the EE prototype engine at full load over engine speed ... 121
Figure 131 – Single GE losses of the EE prototype engine at full load and 5000 rpm .......... 122
Figure 132 – Single GE losses of the EE prototype engine at full load and 2000 rpm .......... 123
Figure 133 – Load influence of the EE prototype engine at 2000 rpm .................................. 124
Figure 134 – GE loops of different load points for the EE prototype engine at 2000 rpm .... 125
Figure 135 – Load influence on inner engine losses of the EE prototype engine at full load 126
Figure 136 – Ignition variation at different loads of the EE prototype engine with pure full
load valve timing (In-WOT and Ex-WOT) at 2000 rpm ............................................... 127
Figure 137 – HC and NOx emissions over MFB50 of the EE prototype engine at full load and
2000 rpm ........................................................................................................................ 128
Figure 138 – Ignition variation and consequences on pressure characteristics and GE loops of
List of figures xiii
the EE prototype engine with pure full load valve timing (In-WOT and Ex-WOT) at
2000 rpm ........................................................................................................................ 129
Figure 139 – Inner engine losses over MFB50 of the EE prototype engine at full load and
2000 rpm ........................................................................................................................ 130
Figure 140 – Gross heat release characteristics of the investigated engines with different valve
timing strategies in part load at 2000 rpm ...................................................................... 132
Figure 141 – Loss analyses of the investigated engines with different valve timing strategies
in part load at 2000 rpm ................................................................................................. 133
Figure 142 – Gas exchange indicated mean effective pressure (GE IMEP) of the investigated
engines with different valve timing strategies in part load at 2000 rpm ........................ 134
Figure 143 – GE loops of the investigated engines with different valve timing strategies in
part load at 2000 rpm ..................................................................................................... 135
Figure 144 – Mean effective pressure characteristics of the EE prototype engine and the base
engine in full load over engine speed (experimental results) ......................................... 136
Figure 145 – FMEP ratio of the EE prototype engine in full load over engine speed
(experimental results) ..................................................................................................... 137
Figure 146 – Mechanical efficiencies of the EE prototype engine and the base engine in full
load over engine speed (experimental results) ............................................................... 137
Figure 147 – Effective and indicated efficiencies of the EE prototype engine and the base
engine in full load over engine speed (experimental results) ......................................... 138
Figure 148 – Effective and indicated efficiencies of the EE prototype engines with different
valve timings at part load at 2000 rpm (experimental results) ....................................... 138
Figure 149 – Mechanical efficiencies of the EE prototype engines with different valve timings
in part load at 2000 rpm (experimental results) ............................................................. 139
Figure 150 – Exhaust gas temperatures (engine-out and before TWC) of the EE prototype
engine and the base engine in full load over engine speed (experimental results) ........ 141
Figure 151 – Exhaust gas temperatures before TWC of the EE prototype engines with
different valve timings in part load at 2000 rpm (experimental results) ........................ 142
Figure 152 – Indicated power at full load over engine speed - comparison between the
experimental and numerical simulation results .............................................................. 145
Figure 153 – Indicated efficiency at full load over engine speed - comparison between the
experimental and numerical simulation results .............................................................. 145
Figure 154 – Effective and indicated efficiencies at full load over engine speed - comparison
between the experimental and numerical simulation results .......................................... 146
Figure 155 – pV-diagrams at full load and 5000 rpm - comparison between the experimental
and numerical simulation results .................................................................................... 147
Figure 156 – GE loops at part load and 2000 rpm - comparison between experimental results
and simulation ................................................................................................................ 149
xiv List of tables
List of tables
Table 1 – Changes of state (Air-standard Otto cycle vs. Air-standard Atkinson cycle) .......... 29
Table 2 – Technical specifications of the base engine ............................................................. 45
Table 3 – Comparison of geometrical parameters (EE engine vs. base engine) ...................... 45
Table 4 – Comparison of geometrical and technical simulation parameters (EE engine vs. base
engine) .............................................................................................................................. 55
Table 5 – Investigated part load valve timing variants ............................................................ 62
Table 6 – Investigated valve timing variants for cylinder deactivation ................................... 71
Table 7 – Technical data of the reference vehicle .................................................................... 75
Table 8 – Technical specifications of the EE prototype engine ............................................... 83
Table 9 – Critical valve train limits .......................................................................................... 89
Table 10 – Investigated PL valve timing variants for the experimental tests ........................ 131
Table 11 – Comparison of geometrical and technical simulation parameters of the initial and
the adjusted EE engine simulation model ...................................................................... 143
Copyright © 2022 FDOKUMEN