Frontal Behavioral Syndromes in Cortical and Subcortical Dementia
Upload
independentCategory
view
4download
0
Abnormal c-fos-Like Immunoreactivity inthe Superior Colliculus and Other
Subcortical Visual Centers ofPigmented Royal College
of Surgeons Rats
BIN LU,1 PETER COFFEY,2 SHAOMEI WANG,1 RENATA FERRARI,3
AND RAYMOND LUND1*1Department of Ophthalmology and Visual Science, Moran Eye Center,University of Utah Health Science Center, Salt Lake City, Utah 84132
2Department of Psychology, University of Sheffield, Sheffield S10 2TP, United Kingdom3Dipartimento di Scienze Biomediche Sezione di Fisiologia, University of Modena,
1-41100 Modena, Italy
ABSTRACTNeurons in the central nervous system often show a transient up-regulation of expres-
sion of the immediate early gene c-fos when presented with precise novel stimuli. In normalrats, neurons in most subcortical visual centers show low levels of fos-like immunoreactivity(FLI) expression, but there is a substantial and transient increase in FLI expression if theanimal is exposed to a flashing light. This is especially evident in the superior colliculus (SC).We have examined here FLI expression in the subcortical visual centers of the Royal Collegeof Surgeons rat, focusing specifically on the SC. In this animal, as a result of a genetic defect,there is early loss of rod photoreceptors over the first few months of life, along with slowerdisappearance of cones. Although light stimulation showed that FLI expression was verysimilar to that seen in normal rats, the basal levels of FLI expression under dark-maintainedconditions were much higher than normal, even exceeding the levels seen after visualstimulation. In the SC, the elevation of FLI expression was already evident by 6 weeks of ageand reached a plateau by 17 weeks. Other subcortical visual centers also showed elevatedbasal levels of FLI expression, although in general the increases were less dramatic than theincrease in the SC. The elevated FLI expression in dark-maintained condition seen in the SCwas abolished by contralateral optic nerve section. It was also severely diminished bysubretinal cell transplantation at 3 weeks of age with the objective of limiting photoreceptorloss over part of the retina. These results suggest that the elevated basal FLI expression isa retina-driven event. Although it correlates with the loss of rod photoreceptors, it is unlikelyto reflect reduced photoreceptor drive but rather some form of bursting activity generated inthe inner retina, as a result of circuit reorganization or receptor up-regulation. J. Comp.Neurol. 472:100–112, 2004. © 2004 Wiley-Liss, Inc.
Indexing terms: c-fos; vision; RCS rat; dystrophy; rat
Grant sponsor: United Kingdom Medical Research Council (MRC); Grantsponsor: Foundation for Fighting Blindness; Grant sponsor: Research toPrevent Blindness; Grant sponsor: National Institutes of Health; Grantnumber: EY014038-01.
*Correspondence to: Raymond Lund, University of Utah Health Sci-ences, Moran Eye Center, 75 N. Medical Drive, Salt Lake City, UT 84132.E-mail: [email protected]
Received 12 August 2003; Revised 30 October 2003; Accepted 17 Decem-ber 2003
DOI 10.1002/cne.20069
THE JOURNAL OF COMPARATIVE NEUROLOGY 472:100–112 (2004)
© 2004 WILEY-LISS, INC.
Photoreceptor degeneration resulting from dysfunctioneither of the photoreceptors themselves or of the adjacentretinal pigment epithelial cell (RPE) layer constitutes amajor cause of blindness. Studying the causes of and po-tential treatments for this neurodegenerative condition isaided by the availability of animal models with naturalmutations homologous or analogous to those seen in pa-tients and of transgenics with specific human mutations(LaVail, 1981; Dryja et al., 1990, 1991; Sung et al., 1991;Nathans, 1992; Shokravi and Dryja, 1993; Chang et al.,2002).
Although considerable attention has been given toevents in the retina associated with photoreceptor degen-eration, much less attention has been given until recentlyto the effects of retinal changes on visual centers of thecentral nervous system (CNS). This is important to inves-tigate, because, with the special arrangement presentedby the eye, being physically separated from the rest of theCNS, and with the chronic nature of photoreceptor degen-eration, the visual system of retinal degeneration mutantsprovides a useful model for studying the secondary effectsof central neurodegenerative disease in general.
We have over the past few years been studying centralconsequences of retinal degeneration and repair (Law-rence et al., 2000; Lund et al., 2001; Coffey et al., 2002),using for much of this work the Royal College of Surgeons(RCS) rat, which has a genetic defect resulting in loss ofrod photoreceptors over the first 3 months of life (Dowlingand Sidman, 1962; LaVail and Battelle, 1975; Sauve et al.,2001). Cones persist for longer periods, even up to 1 year(LaVail et al., 1974), but in diminished numbers. Thedisorder is due to a deletion mutation of the receptortyrosine kinase gene MERTK (D’Cruz et al., 2000), whichcompromises the ability of RPE cells to phagocytose outersegments (Bok and Hall, 1971; Mullen and LaVail, 1976;Edwards and Szamier, 1977). Because the defect is ex-pressed as a recessive mutation, the congenic nondystro-phic rat can be used as a control. Although the loss ofphotoreceptors is the most evident deficit in the earlystages of the disease, it is apparent that there are second-ary consequences, not only in the retina (Caldwell andMcLaughlin, 1983; El-Hifnawi, 1987; Caldwell et al.,1989; Seaton et al., 1994; Bush et al., 1995; Villegas-Perez
et al., 1999; Jones et al., 2003; Marc et al., 2003; Wang etal., 2003) but also in the brain (Sauve et al., 1996; Girmanet al., 1999; Hetherington et al., 2000).
A further change seen in the CNS is the increasednumber of cells expressing fos-like immunoreactivity(FLI) in the superior colliculus (SC) of animals maintainedin the dark. This elevated expression is eliminated byinjection of tetrodotoxin (TTX) into the vitreous, suggest-ing that it is caused by changes in retinal activity (Lu etal., 2001b). FLI is thought to demonstrate changes inexpression of c-fos, which, along with other immediate-early gene products, such as c-Jun, Jun B, Jun D, Fos B,and Krox-24 (Curran et al., 1984; Ryder et al., 1989; Ko-vary and Bravo, 1991a,b), is involved in stimulus–transcription coupling, allowing stimuli that are ineffec-tive per se in gene encoding to induce changes in geneexpression. Cells of the CNS generally show high levels ofc-fos expression only when they are activated by quiteprecise stimulus regimens (Morgan and Curran, 1991),but elevated expression usually persists for a relativelyshort time after the inception of a novel stimulus, return-ing to baseline levels after a few hours.
In the visual centers of normal rodents, maintained inthe dark, very few cells show FLI expression, but, afternovel visual stimulation, the number of FLI cells increasesdramatically over a period of 2 hours, and then returns tobaseline level (Craner et al., 1992; Montero and Jian,1995). Continuous stimulation over a prolonged periodfails to sustain elevated expression, indicating that, as inother systems, FLI expression occurs in response to achanged condition but not to steady-state activity. Thismakes the observation recorded in dark-maintained RCSrats all the more enigmatic, because it implies that, tosustain high FLI levels, the loss of photoreceptors occur-ring in the RCS rat, though restricting the photoreceptor-mediated drive to central visual structures, is also causingan opposite effect involving some form of nonsustainedstimulation, which appears to be of retinal origin.
To provide further background for studying the effect ofthe degenerative process on FLI expression patterns inthe central visual system, we have examined in moredetail how FLI expression patterns change in the SC dur-ing the course of photoreceptor degeneration, how thesepatterns are affected by light stimulation or optic axot-omy, and whether similar events are seen in other pri-mary visual centers. We have also examined whether, bylimiting photoreceptor degeneration in a local area of ret-ina, by transplanting an RPE cell line to the subretinalspace (Coffey et al., 2000, 2002; Lund et al., 2001), FLIexpression patterns might be modulated within the SCeither locally or more broadly across the visual field rep-resentation. Part of this work has been presented previ-ously in a preliminary communication (Lu, 1996).
MATERIALS AND METHODS
Animals
This study used the pigmented dystrophic Royal Collegeof Surgeons rat (RCS rdy� p�), with nondystrophic ani-mals (RCS rdy– p�) as controls. Animals came initiallyfrom a stock maintained at the Institute of Ophthalmol-ogy, University College London. Subsequently, animalswere bred in house.
All animals were housed under a 12-hour light/12-hourdark cycle, with free access to food and water. All aspects
Abbreviations
dLGN dorsal lateral geniculate nucleusGCL ganglion cell layerIGL intergeniculate leafletINL inner nuclear layerIPL inner plexiform layerMTN medial terninal nucleiNOT nucleus of the optic tractOC optic chiasmON optic nerveOPL outer plexiform layerOPN the olivary pretectal nucleusOS outer segmentsPAG periaqueductal greyPPT posterior pretectal nucleusSC superior colliculusSGI stratum griseum intermedialeSGS stratum griseum superficialeSO stratum opticumSZ stratum zonalevLGN ventral lateral geniculate nucleus3V third ventricle
101c-fos ACTIVITY IN RCS RAT
of this study were performed with U.K. Home Office ap-proval under section 5(4) of the U.K. Animals (ScientificProcedures) Act 1986 and under conditions that con-formed to the National Institute of Health guidelines.
Surgical procedures
For transplantation, donor RPE cells (ARPE 19) wereobtained from the American Type Cell Collection (ATCC).Recipient RCS rats (aged 23 days) received suspensions ofcells (2 � 105 cells in 2 �l) into the subretinal space of oneeye. Cells were introduced into the upper (n � 5) or lower(n � 5) temporal retinal regions. Animals were immuno-suppressed by adding cyclosporin to the drinking water(see Coffey et al., 2002, for details).
To provide a no-input control, a subgroup of animals(n � 3) received unilateral intraorbital optic axotomy un-der ketamine hydrochloride (75 mg/kg) and xylazine (6.5mg/kg) anesthesia 1 week prior to 17 weeks of age. Thisremoved optic input from the contralateral SC, leaving theipsilateral SC as an in-animal control.
Stimulation protocol
RCS rats were studied at 4, 6, 10, 17, 26, and 52 weeksof age (n � 6/age groups). Half of each group (n � 3) wasplaced in a dark room for 12 hours before being killed, andthe other half was placed in a dark room for 12 hours,followed by visual stimulation (60-W light source, 15 sec-onds on, 15 seconds off for 1 hour). Both eyes remaineduncovered through the stimulus period. All animals werestimulated without anesthesia and were allowed to movefreely about the cage during stimulation.
Both optic axotomy and cell transplant groups wereexamined only after being maintained in the dark. Forthese animals, as well as those used for investigating FLIin other visual centers, a single time point of 17 weeks waschosen, because this represented the stage at which FLIhad achieved its maximal level in the SC.
On completion of treatment, rats that had been exposedto stimulation were left for a further 1 hour in the sameroom without light, before being perfused under deep pen-tobarbital anesthesia with 4% paraformaldehyde in phos-phate buffer (pH 7.4). Dark-maintained rats were simi-larly fixed under red-light illumination. All animalsreported on here were killed between 10:30 AM and 2:30
PM, to avoid variations in the level of FLI labeling associ-ated with the diurnal cycle (Craner et al., 1992).
Tissue preparation and histology
The eyes and brains to be prepared for staining wereremoved after perfusion fixation and left in the same fix-ative overnight at 4°C. Eyes were cut on a cryostat (20�m), and sections were stained with cresyl violet to showthe morphology of the retina over time. Brain sectionswere cut transversely (50 �m) on a vibrotome and col-lected in 0.1 M phosphate-buffered saline (PBS). The FLIimmunohistochemistry was performed with a previouslydescribed methodology (Lu et al., 2001b). The primarypolyclonal rabbit antibody (gift from Dr. G. Evans, OxfordUniversity) was raised against the synthetic protein-P55c-fos. This peptide contains sequences common to theN-terminal region of all known c-Fos and v-Fos proteins.Although the antibody has been well characterized (Huntet al., 1987), its recognition of other fos-related proteinscannot be excluded, hence the designation of FLI in thispaper. For the transplant group, eyes were removed afterprimary fixation, and whole-mount retinae were preparedand mounted on coated slides to show the location andextent of the graft.
Quantitative analysis of FLI expression
Detailed quantitation was performed in the SC only.Sections were examined at �4 primary magnification: Anycells in which staining or identity was uncertain wereexamined at higher magnification. Sections were selectedfor analysis at 0.5-mm intervals at five rostrocaudal levelsthrough the SC [–5.8 to –7.8 mm caudal to bregma, withPaxinos and Watson (1986) for reference]. The positions ofFLI cells were plotted bilaterally and counted. The lami-nar nomenclature of the rat SC followed the standardconvention of alternating cell- and fiber-rich layers [i.e.,stratum zonale (SZ), stratum griseum superficiale (SGS),stratum opticum (SO), stratum griseum intermediale(SGI)]. A density profile of FLI cells was determined foreach lamina. The area of subdivisions within the SC wasmeasured with a Summagraphics digitizing tablet andMacDraft graphic software. The numbers of FLI cells(counts/mm2 � SEM) were collected for each lamina of theSC. Differences in the regional expression of FLI within
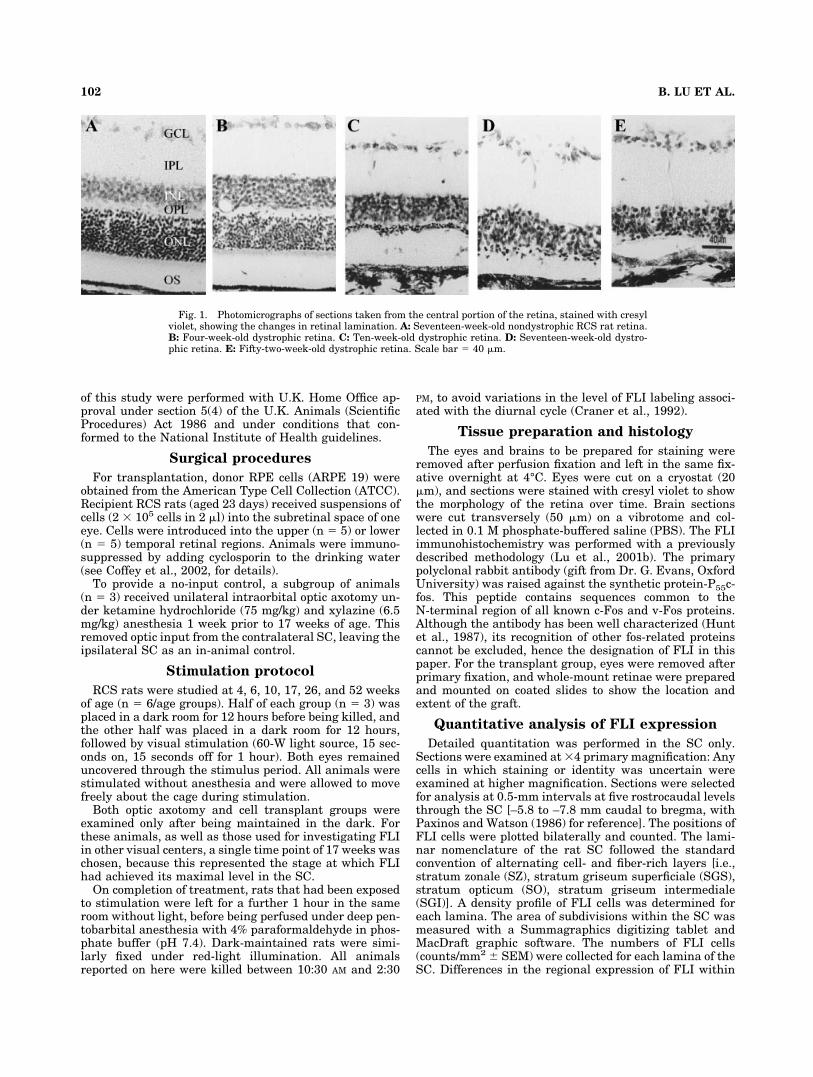
Fig. 1. Photomicrographs of sections taken from the central portion of the retina, stained with cresylviolet, showing the changes in retinal lamination. A: Seventeen-week-old nondystrophic RCS rat retina.B: Four-week-old dystrophic retina. C: Ten-week-old dystrophic retina. D: Seventeen-week-old dystro-phic retina. E: Fifty-two-week-old dystrophic retina. Scale bar � 40 �m.
102 B. LU ET AL.

Figure 2 (Continued)
103c-fos ACTIVITY IN RCS RAT
the SC of animals subjected to different experimentalconditions were assessed using multiple-factorial analysesof variance (Winer, 1971). Separate analyses of variancewere conducted on the results of specific experimentalgroups, and the Newman Keuls post hoc test was used toassess significance between groups.
Photographs
Photographs were taken with a computer-based ImagePro Plus system and were adjusted for brightness andcontrast in Adobe Photoshop 6.0.
RESULTS
By way of background for the FLI studies, we firstexamined the outer retina at each of the main time pointsstudied, because some variance does occur between ani-mals maintained in different colonies. In the nondystro-phic RCS rat (Fig. 1A), the photoreceptor layer was on theorder of 10–12 cells thick, and this did not change signif-icantly over the first year of life. In the dystrophic ani-mals, the photoreceptor layer was quite similar to nondys-trophic animals at 4 weeks of age (Fig. 1B), being about 10cells in depth, although even at this age there was indi-cation of disruption of outer segment material. By 10weeks of age (Fig. 1C), the photoreceptor layer had been
reduced to two or three cells in depth and was furtherreduced to a sparse monolayer by 17 weeks of age (Fig.1D). At 52 weeks, it was difficult to detect definitive pho-toreceptors in cresyl violet-stained material (see Fig. 1E).
Pattern of FLI expression in theSC over time
Our previous work showed elevated expression of FLI inthe SC of dystrophic animals maintained in the dark (Luet al., 2001a). How this related to light stimulation condi-tions and how it changed during development relative tothe loss of photoreceptors was not explored. This part ofthe study has examined the FLI expression patterns atdifferent ages during the course of photoreceptor degen-eration after maintenance in the dark and after lightstimulation.
FLI expression over time in dark-maintained rats.
In the SC of nondystrophic animals, only a small numberof cells were FLI positive at each of the time points studied(Fig. 2A,E,I). There was a small difference in FLI expres-sion at 4 weeks vs. 10 weeks vs. 17 weeks, but it was notsignificant. The counts at 52 weeks (Table 1) were sig-nificantly lower than at the other time points studied(P � 0.05).
In dystrophic animals, the dark-maintained FLI densityin the SC was similar to that of nondystrophic animals at
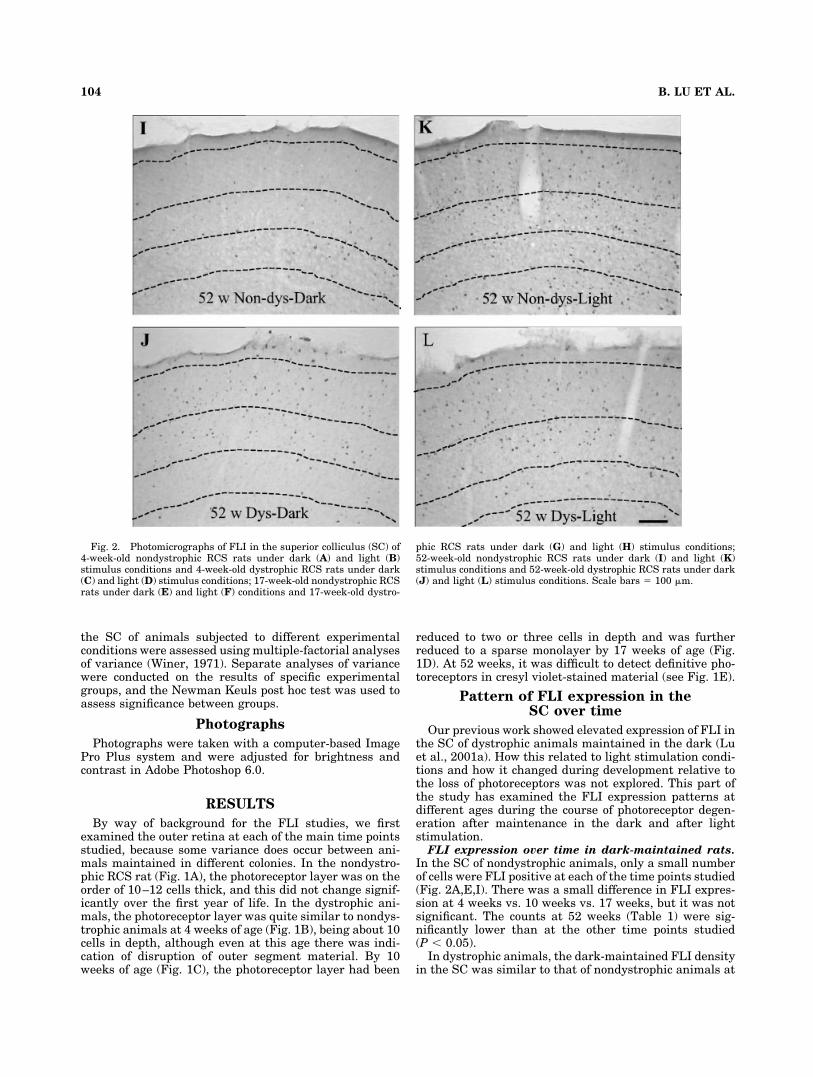
Fig. 2. Photomicrographs of FLI in the superior colliculus (SC) of4-week-old nondystrophic RCS rats under dark (A) and light (B)stimulus conditions and 4-week-old dystrophic RCS rats under dark(C) and light (D) stimulus conditions; 17-week-old nondystrophic RCSrats under dark (E) and light (F) conditions and 17-week-old dystro-
phic RCS rats under dark (G) and light (H) stimulus conditions;52-week-old nondystrophic RCS rats under dark (I) and light (K)stimulus conditions and 52-week-old dystrophic RCS rats under dark(J) and light (L) stimulus conditions. Scale bars � 100 �m.
104 B. LU ET AL.
4 weeks of age (Fig. 2C, Table 1). However, there was asignificant increase in FLI counts with age from 6 weeks ofage (data not shown) onward, reaching a maximum by 17weeks of age (Fig. 2G, Table 1). At 26 (data not shown) and52 weeks, FLI cell counts were still elevated comparedwith counts in nondystrophic animals (Fig. 2J comparedwith I). Although the counts at 52 weeks were half thelevel recorded at 17 weeks, the ratio between nondystro-phic and dystrophic remained approximately the same.
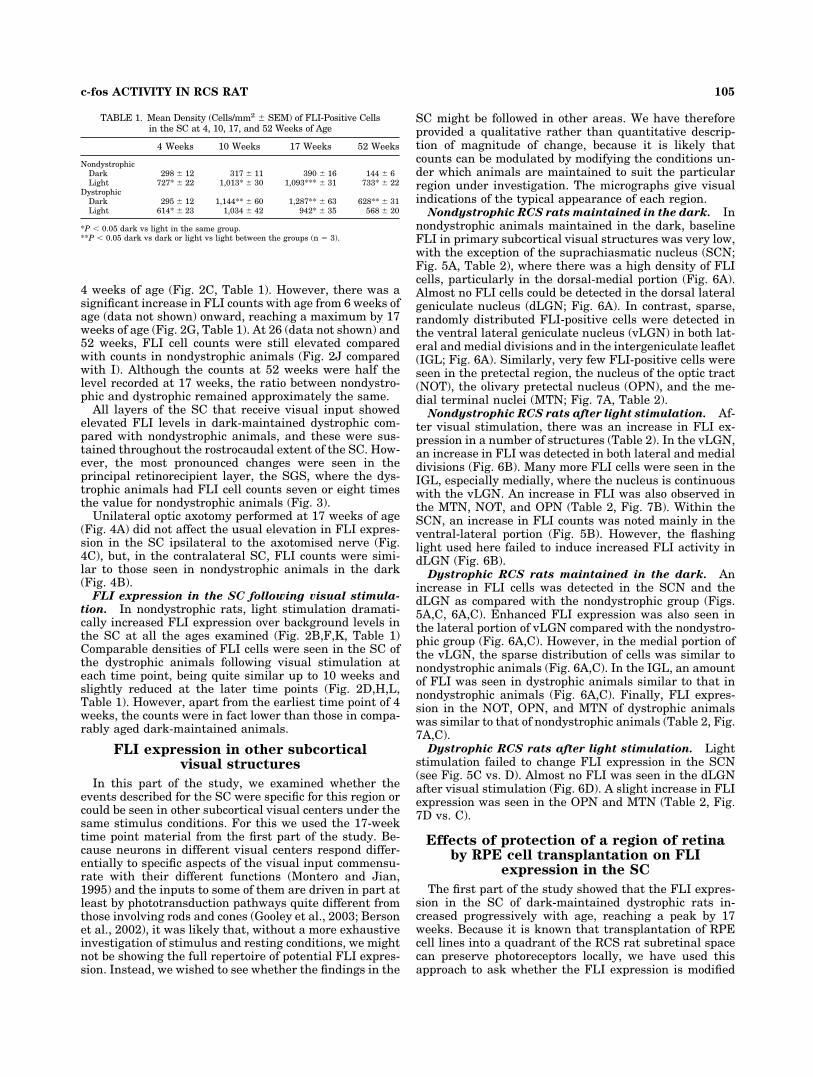
All layers of the SC that receive visual input showedelevated FLI levels in dark-maintained dystrophic com-pared with nondystrophic animals, and these were sus-tained throughout the rostrocaudal extent of the SC. How-ever, the most pronounced changes were seen in theprincipal retinorecipient layer, the SGS, where the dys-trophic animals had FLI cell counts seven or eight timesthe value for nondystrophic animals (Fig. 3).
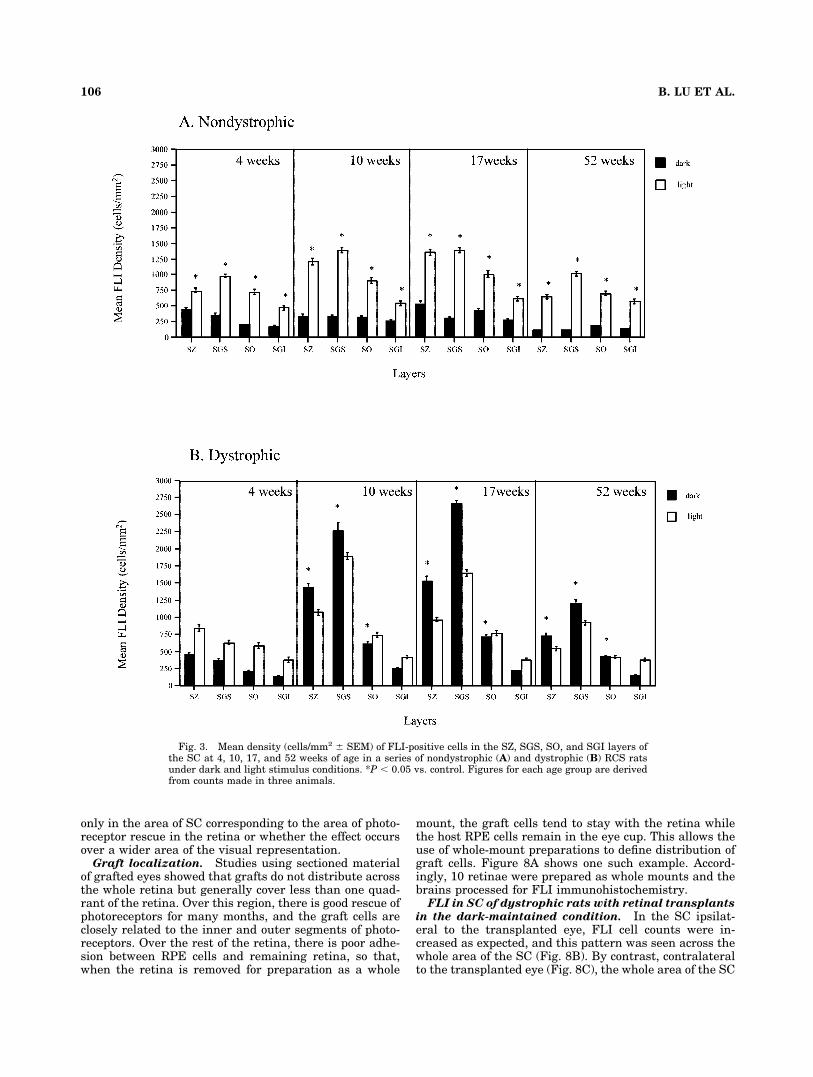
Unilateral optic axotomy performed at 17 weeks of age(Fig. 4A) did not affect the usual elevation in FLI expres-sion in the SC ipsilateral to the axotomised nerve (Fig.4C), but, in the contralateral SC, FLI counts were simi-lar to those seen in nondystrophic animals in the dark(Fig. 4B).
FLI expression in the SC following visual stimula-
tion. In nondystrophic rats, light stimulation dramati-cally increased FLI expression over background levels inthe SC at all the ages examined (Fig. 2B,F,K, Table 1)Comparable densities of FLI cells were seen in the SC ofthe dystrophic animals following visual stimulation ateach time point, being quite similar up to 10 weeks andslightly reduced at the later time points (Fig. 2D,H,L,Table 1). However, apart from the earliest time point of 4weeks, the counts were in fact lower than those in compa-rably aged dark-maintained animals.
FLI expression in other subcorticalvisual structures
In this part of the study, we examined whether theevents described for the SC were specific for this region orcould be seen in other subcortical visual centers under thesame stimulus conditions. For this we used the 17-weektime point material from the first part of the study. Be-cause neurons in different visual centers respond differ-entially to specific aspects of the visual input commensu-rate with their different functions (Montero and Jian,1995) and the inputs to some of them are driven in part atleast by phototransduction pathways quite different fromthose involving rods and cones (Gooley et al., 2003; Bersonet al., 2002), it was likely that, without a more exhaustiveinvestigation of stimulus and resting conditions, we mightnot be showing the full repertoire of potential FLI expres-sion. Instead, we wished to see whether the findings in the
SC might be followed in other areas. We have thereforeprovided a qualitative rather than quantitative descrip-tion of magnitude of change, because it is likely thatcounts can be modulated by modifying the conditions un-der which animals are maintained to suit the particularregion under investigation. The micrographs give visualindications of the typical appearance of each region.
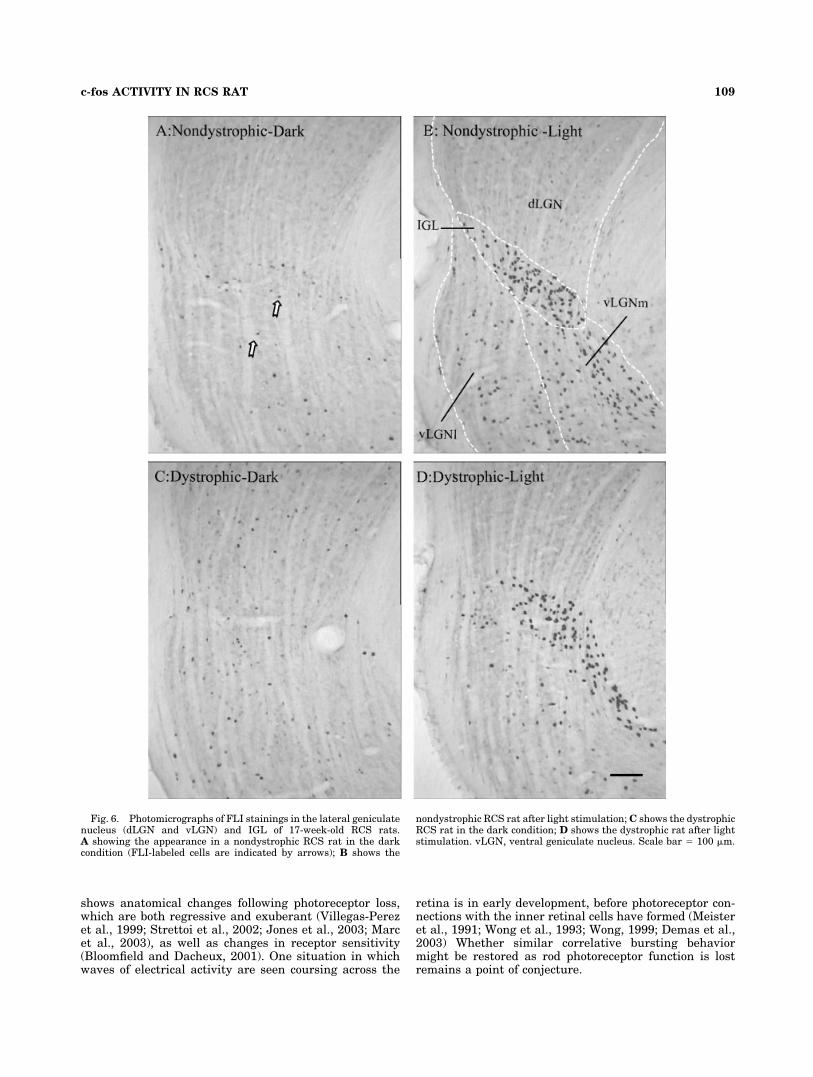
Nondystrophic RCS rats maintained in the dark. Innondystrophic animals maintained in the dark, baselineFLI in primary subcortical visual structures was very low,with the exception of the suprachiasmatic nucleus (SCN;Fig. 5A, Table 2), where there was a high density of FLIcells, particularly in the dorsal-medial portion (Fig. 6A).Almost no FLI cells could be detected in the dorsal lateralgeniculate nucleus (dLGN; Fig. 6A). In contrast, sparse,randomly distributed FLI-positive cells were detected inthe ventral lateral geniculate nucleus (vLGN) in both lat-eral and medial divisions and in the intergeniculate leaflet(IGL; Fig. 6A). Similarly, very few FLI-positive cells wereseen in the pretectal region, the nucleus of the optic tract(NOT), the olivary pretectal nucleus (OPN), and the me-dial terminal nuclei (MTN; Fig. 7A, Table 2).
Nondystrophic RCS rats after light stimulation. Af-ter visual stimulation, there was an increase in FLI ex-pression in a number of structures (Table 2). In the vLGN,an increase in FLI was detected in both lateral and medialdivisions (Fig. 6B). Many more FLI cells were seen in theIGL, especially medially, where the nucleus is continuouswith the vLGN. An increase in FLI was also observed inthe MTN, NOT, and OPN (Table 2, Fig. 7B). Within theSCN, an increase in FLI counts was noted mainly in theventral-lateral portion (Fig. 5B). However, the flashinglight used here failed to induce increased FLI activity indLGN (Fig. 6B).
Dystrophic RCS rats maintained in the dark. Anincrease in FLI cells was detected in the SCN and thedLGN as compared with the nondystrophic group (Figs.5A,C, 6A,C). Enhanced FLI expression was also seen inthe lateral portion of vLGN compared with the nondystro-phic group (Fig. 6A,C). However, in the medial portion ofthe vLGN, the sparse distribution of cells was similar tonondystrophic animals (Fig. 6A,C). In the IGL, an amountof FLI was seen in dystrophic animals similar to that innondystrophic animals (Fig. 6A,C). Finally, FLI expres-sion in the NOT, OPN, and MTN of dystrophic animalswas similar to that of nondystrophic animals (Table 2, Fig.7A,C).
Dystrophic RCS rats after light stimulation. Lightstimulation failed to change FLI expression in the SCN(see Fig. 5C vs. D). Almost no FLI was seen in the dLGNafter visual stimulation (Fig. 6D). A slight increase in FLIexpression was seen in the OPN and MTN (Table 2, Fig.7D vs. C).
Effects of protection of a region of retinaby RPE cell transplantation on FLI
expression in the SC
The first part of the study showed that the FLI expres-sion in the SC of dark-maintained dystrophic rats in-creased progressively with age, reaching a peak by 17weeks. Because it is known that transplantation of RPEcell lines into a quadrant of the RCS rat subretinal spacecan preserve photoreceptors locally, we have used thisapproach to ask whether the FLI expression is modified
TABLE 1. Mean Density (Cells/mm2 � SEM) of FLI-Positive Cellsin the SC at 4, 10, 17, and 52 Weeks of Age
4 Weeks 10 Weeks 17 Weeks 52 Weeks
NondystrophicDark 298 � 12 317 � 11 390 � 16 144 � 6Light 727* � 22 1,013* � 30 1,093*** � 31 733* � 22
DystrophicDark 295 � 12 1,144** � 60 1,287** � 63 628** � 31Light 614* � 23 1,034 � 42 942* � 35 568 � 20
*P � 0.05 dark vs light in the same group.**P � 0.05 dark vs dark or light vs light between the groups (n � 3).
105c-fos ACTIVITY IN RCS RAT
only in the area of SC corresponding to the area of photo-receptor rescue in the retina or whether the effect occursover a wider area of the visual representation.
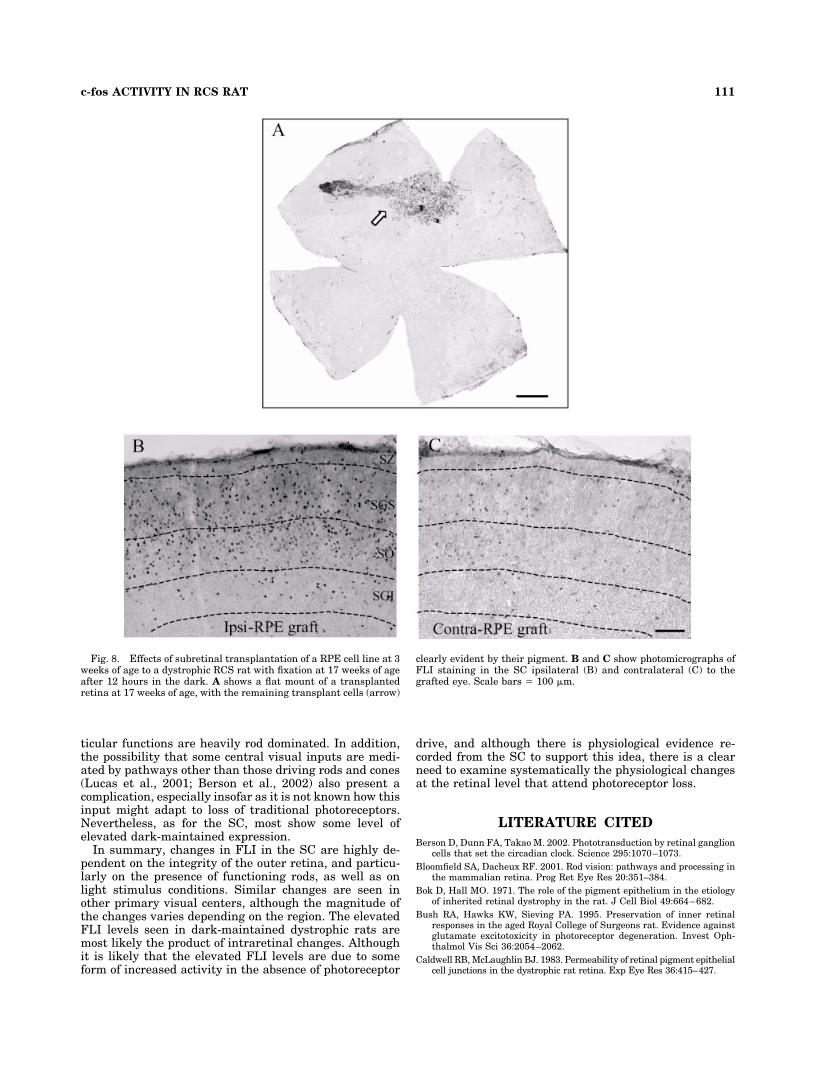
Graft localization. Studies using sectioned materialof grafted eyes showed that grafts do not distribute acrossthe whole retina but generally cover less than one quad-rant of the retina. Over this region, there is good rescue ofphotoreceptors for many months, and the graft cells areclosely related to the inner and outer segments of photo-receptors. Over the rest of the retina, there is poor adhe-sion between RPE cells and remaining retina, so that,when the retina is removed for preparation as a whole
mount, the graft cells tend to stay with the retina whilethe host RPE cells remain in the eye cup. This allows theuse of whole-mount preparations to define distribution ofgraft cells. Figure 8A shows one such example. Accord-ingly, 10 retinae were prepared as whole mounts and thebrains processed for FLI immunohistochemistry.
FLI in SC of dystrophic rats with retinal transplants
in the dark-maintained condition. In the SC ipsilat-eral to the transplanted eye, FLI cell counts were in-creased as expected, and this pattern was seen across thewhole area of the SC (Fig. 8B). By contrast, contralateralto the transplanted eye (Fig. 8C), the whole area of the SC
Fig. 3. Mean density (cells/mm2 � SEM) of FLI-positive cells in the SZ, SGS, SO, and SGI layers ofthe SC at 4, 10, 17, and 52 weeks of age in a series of nondystrophic (A) and dystrophic (B) RCS ratsunder dark and light stimulus conditions. *P � 0.05 vs. control. Figures for each age group are derivedfrom counts made in three animals.
106 B. LU ET AL.
showed substantially reduced FLI expression regardlessof the location of the injection site (upper or lower tempo-ral retina). Counts were made of lateral and medial halvesof the SC at four different AP levels. The absolute levels ofFLI expression were very similar to those seen in nondys-trophic animals maintained in the dark. However, be-cause the counts were performed under conditions slightlydifferent from those used in the main part of the study, theopposite SC counts from the same quadrants served ascontrols, and data were expressed as the count in a specificquadrant as a proportion of the count in the correspondingquadrant in the opposite SC. For a graft in the uppertemporal retina, the figure for the anterolateral quadrant(corresponding the quadrant protected by the graft) was27%, anteromedial 27%, posterolateral 36%, posterome-dial 33%. For a graft in the ventromedial quadrant, thefigure for the anterolateral quadrant was 17%, anterome-dial 18%, posterolateral (corresponding the tquadrant pro-tected by the graft) 40%, posteromedial 30%. These com-pared with the previous results, in which the counts indark-maintained nondystrophic animals were 30% of dys-trophic dark-maintained counts. FLI expression in the SCclearly failed to correlate with the projection area of res-cued retina, insofar as the reduced FLI counts comparedwith control conditions. FLI counts showed no regionalvariations that might have correlated with graft location,and upper and lower retinal grafts gave similar outcomes.
DISCUSSION
This study shows an elevated basal level of FLI expres-sion in the SC of dark-maintained dystrophic RCS ratswith age, which was first seen by 6 weeks of age and wasabolished by optic axotomy. By contrast, the FLI expres-sion seen after light stimulation was not significantly dif-ferent from that in normal control rats. Within other sub-cortical visual centers, the pattern of FLI expression indark-maintained rats showed changes comparable tothose seen in the SC, although, in general, these were notnearly as pronounced as in the SC. In some regions, suchas the SCN, there was evident increase in FLI expressionafter light stimulation, but, in others, most notably thedLGN, FLI expression was actually reduced. Finally,transplantation of an RPE cell line to limit the progress ofphotoreceptor degeneration over part of the retina sup-pressed the elevated FLI levels in the SC; this occurrednot only in the region of central representation of thetransplant location but over the whole visual field.
These results show, therefore, that, whereas the pat-terns of FLI expression after exposure of rats to flashinglight were very little different in dystrophic comparedwith normal rats, there was a profound increase afterdark maintenance. The effect of optic axotomy abolishingthe elevated FLI in the dark is in accordance with previ-ous studies showing that elevated FLI expression was alsoabolished by TTX injections into the eye (Lu et al., 2001b).Other work (Lu et al., 2001a) has shown that a similarphenomenon occurs in the rd mouse, another photorecep-tor loss mutant caused in this case by a primary defect ofthe photoreceptors. This argues that the observations inthe present study are related to photoreceptor loss and notto an attendant idiosyncrasy of the RCS rat. Taken to-gether, these findings point to the importance of the in-tegrity of photoreceptors as a key factor in the preventionof the elevated FLI counts in dark-maintained animals.
Fig. 4. Photomicrographs of FLI expression on both sides of the SCof a dystrophic RCS rat at 17 weeks of age after unilateral ONtransection. A: Low-power view defining regions shown at highermagnification in B and C. After ON transection, the reduction in FLIexpression was observed in the SC contralateral to the transected ON(B). An elevated level of FLI was still observed in the SC ipsilateral tothe ON transection (C). Scale bars � 500 �m in A; 100 �m in B,C.
107c-fos ACTIVITY IN RCS RAT

However the fact that little difference can be seen betweendystrophic and nondystrophic rats under conditions oflight stimulation suggests that there may be differentialinfluences of rods and cones. This is supported by thedifferential loss of rod and cone function in the RCS rat.ERG studies (Bush et al., 1995; Sauve et al., 2003) showedthat the a-wave, which in large part reflects rod photore-ceptor activity, is lost by about 8 weeks of age in pig-mented RCS rats. This is close to the age at which theelevated FLI in dark-maintained rats is first seen (6weeks). Rods disappear over much of the retina by about90 days, although there is disruption of outer segments ata much earlier age. Cones survive much longer (LaVailand Battelle, 1975), and they can mediate behaviors suchas spatial visual discriminations for many months, albeitat progressively reduced levels of performance (Prusky etal., 2002). Adaptation studies on dystrophic RCS ratsmade by recording threshold responses in the SC confirman early loss of rod function and suggest a progressivedeterioration of cone threshold responses with time (Gir-man et al., 2003). These results therefore suggest that thedark-maintained result relates to the early loss of rodfunction but that cones, even in depleted numbers, areable to maintain the light stimulation response. The lackof deterioration with time in the light-driven responsecompared with that of nondystrophic animals is perhaps
surprising, insofar as all the evidence points to a progres-sive loss of cones, although it should be noted that there isa reduced response even in nondystrophic animals at 52weeks. One explanation for the lack of change in dystro-phic animals with age could be that the threshold for theFLI activation is lower than that for acuity tests. Thereduced level in nondystrophic animals could possibly bedue to some normal loss of cones or cone function with age,but this has not been explored systematically in otherwork.
If loss of rod function is the key factor causing increasedFLI levels in the SC, then what might be the explanation?From previous work examining c-fos changes under vary-ing conditions, it might be expected that a dystrophic RCSrat more than 6 weeks old is sending inputs from the eyeto the SC that 1) are not sustained and 2) continue un-abated when the cone system is inactive. Work recordingresponses from the SC of such animals (Sauve et al., 1996)indicates an increased level of spontaneous activity, whichfluctuates over a 0.2–0.4-second time base and might pro-vide a suitable driving stimulus for c-fos expression.
The substrate for such increased activity might comefrom plasticity in circuitry in the inner retina as a conse-quence of loss of rod drive. There is ample evidence of thepotential for such functional plasticity under a range ofconditions (Vaney, 1997). A growing body of literature
Fig. 5. Photomicrographs of coronal sections through the suprachiasmatic nucleus (SCN) with FLIstaining in nondystrophic RCS rats at 17 weeks of age (A,B) and in dystrophic rats (C,D) under the darkand light stimulus condition. Scale bar � 100 �m.
108 B. LU ET AL.
shows anatomical changes following photoreceptor loss,which are both regressive and exuberant (Villegas-Perezet al., 1999; Strettoi et al., 2002; Jones et al., 2003; Marcet al., 2003), as well as changes in receptor sensitivity(Bloomfield and Dacheux, 2001). One situation in whichwaves of electrical activity are seen coursing across the
retina is in early development, before photoreceptor con-nections with the inner retinal cells have formed (Meisteret al., 1991; Wong et al., 1993; Wong, 1999; Demas et al.,2003) Whether similar correlative bursting behaviormight be restored as rod photoreceptor function is lostremains a point of conjecture.
Fig. 6. Photomicrographs of FLI stainings in the lateral geniculatenucleus (dLGN and vLGN) and IGL of 17-week-old RCS rats.A showing the appearance in a nondystrophic RCS rat in the darkcondition (FLI-labeled cells are indicated by arrows); B shows the
nondystrophic RCS rat after light stimulation; C shows the dystrophicRCS rat in the dark condition; D shows the dystrophic rat after lightstimulation. vLGN, ventral geniculate nucleus. Scale bar � 100 �m.
109c-fos ACTIVITY IN RCS RAT
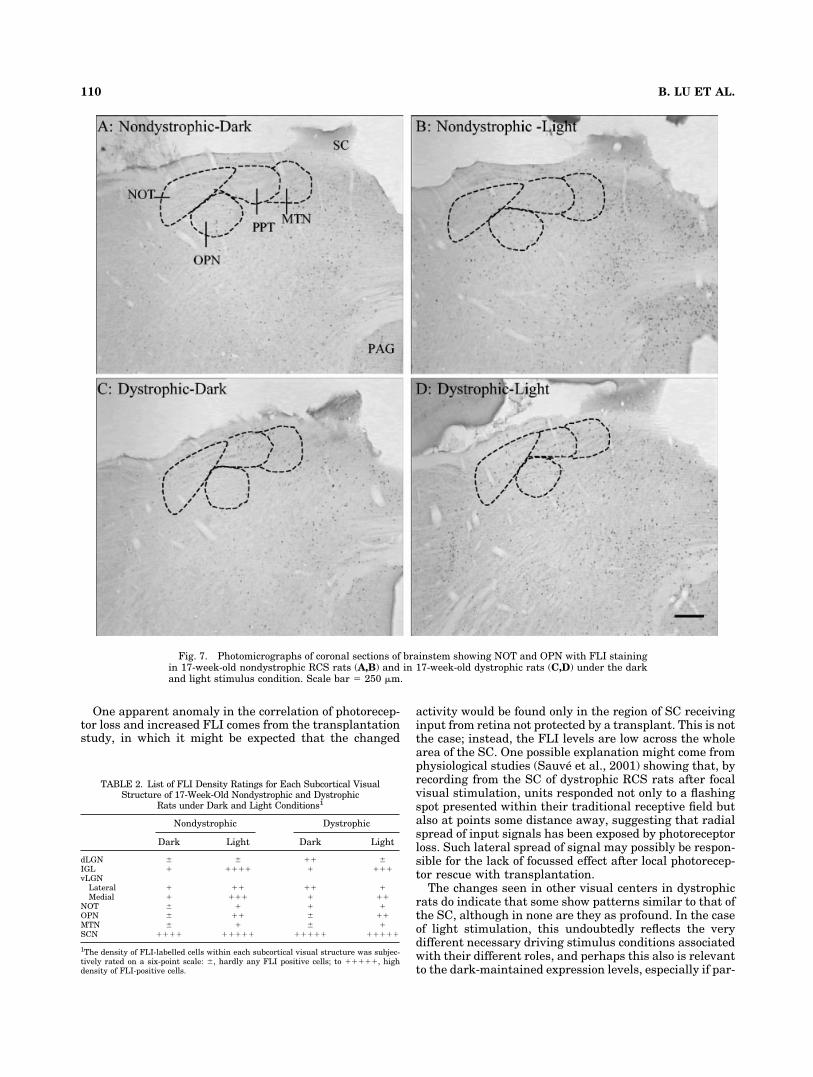
One apparent anomaly in the correlation of photorecep-tor loss and increased FLI comes from the transplantationstudy, in which it might be expected that the changed
activity would be found only in the region of SC receivinginput from retina not protected by a transplant. This is notthe case; instead, the FLI levels are low across the wholearea of the SC. One possible explanation might come fromphysiological studies (Sauve et al., 2001) showing that, byrecording from the SC of dystrophic RCS rats after focalvisual stimulation, units responded not only to a flashingspot presented within their traditional receptive field butalso at points some distance away, suggesting that radialspread of input signals has been exposed by photoreceptorloss. Such lateral spread of signal may possibly be respon-sible for the lack of focussed effect after local photorecep-tor rescue with transplantation.
The changes seen in other visual centers in dystrophicrats do indicate that some show patterns similar to that ofthe SC, although in none are they as profound. In the caseof light stimulation, this undoubtedly reflects the verydifferent necessary driving stimulus conditions associatedwith their different roles, and perhaps this also is relevantto the dark-maintained expression levels, especially if par-
Fig. 7. Photomicrographs of coronal sections of brainstem showing NOT and OPN with FLI stainingin 17-week-old nondystrophic RCS rats (A,B) and in 17-week-old dystrophic rats (C,D) under the darkand light stimulus condition. Scale bar � 250 �m.
TABLE 2. List of FLI Density Ratings for Each Subcortical VisualStructure of 17-Week-Old Nondystrophic and Dystrophic
Rats under Dark and Light Conditions1
Nondystrophic Dystrophic
Dark Light Dark Light
dLGN � � �� �IGL � ���� � ���vLGN
Lateral � �� �� �Medial � ��� � ��
NOT � � � �OPN � �� � ��MTN � � � �SCN ���� ����� ����� �����
1The density of FLI-labelled cells within each subcortical visual structure was subjec-tively rated on a six-point scale: �, hardly any FLI positive cells; to �����, highdensity of FLI-positive cells.
110 B. LU ET AL.
ticular functions are heavily rod dominated. In addition,the possibility that some central visual inputs are medi-ated by pathways other than those driving rods and cones(Lucas et al., 2001; Berson et al., 2002) also present acomplication, especially insofar as it is not known how thisinput might adapt to loss of traditional photoreceptors.Nevertheless, as for the SC, most show some level ofelevated dark-maintained expression.
In summary, changes in FLI in the SC are highly de-pendent on the integrity of the outer retina, and particu-larly on the presence of functioning rods, as well as onlight stimulus conditions. Similar changes are seen inother primary visual centers, although the magnitude ofthe changes varies depending on the region. The elevatedFLI levels seen in dark-maintained dystrophic rats aremost likely the product of intraretinal changes. Althoughit is likely that the elevated FLI levels are due to someform of increased activity in the absence of photoreceptor
drive, and although there is physiological evidence re-corded from the SC to support this idea, there is a clearneed to examine systematically the physiological changesat the retinal level that attend photoreceptor loss.
LITERATURE CITED
Berson D, Dunn FA, Takao M. 2002. Phototransduction by retinal ganglioncells that set the circadian clock. Science 295:1070–1073.
Bloomfield SA, Dacheux RF. 2001. Rod vision: pathways and processing inthe mammalian retina. Prog Ret Eye Res 20:351–384.
Bok D, Hall MO. 1971. The role of the pigment epithelium in the etiologyof inherited retinal dystrophy in the rat. J Cell Biol 49:664–682.
Bush RA, Hawks KW, Sieving PA. 1995. Preservation of inner retinalresponses in the aged Royal College of Surgeons rat. Evidence againstglutamate excitotoxicity in photoreceptor degeneration. Invest Oph-thalmol Vis Sci 36:2054–2062.
Caldwell RB, McLaughlin BJ. 1983. Permeability of retinal pigment epithelialcell junctions in the dystrophic rat retina. Exp Eye Res 36:415–427.
Fig. 8. Effects of subretinal transplantation of a RPE cell line at 3weeks of age to a dystrophic RCS rat with fixation at 17 weeks of ageafter 12 hours in the dark. A shows a flat mount of a transplantedretina at 17 weeks of age, with the remaining transplant cells (arrow)
clearly evident by their pigment. B and C show photomicrographs ofFLI staining in the SC ipsilateral (B) and contralateral (C) to thegrafted eye. Scale bars � 100 �m.
111c-fos ACTIVITY IN RCS RAT
Caldwell RB, Roque RS, Solomon SW. 1989. Increased vascular densityand vitreo-retinal membranes accompany vascularization of the pig-ment epithelium in the dystrophic rat retina. Curr Eye Res 8:923–937.
Chang B, Hawes NL, Hurd RE, Davisson MT, Nusinowitz S, Heckenlively JR.2002. Retinal degeneration mutants in the mouse. Vis Res 42:517–525.
Coffey PJ, Whiteley SJ, Lund RD. 2000. Preservation and restoration ofvision following transplantation. Prog Brain Res 127:489–499.
Coffey PJ, Girman S, Wang SM, Hetherington L, Keegan DJ, Adamson P,Greenwood J, Lund RD. 2002. Long-term preservation of corticallydependent visual function in RCS rats by transplantation. Nat Neuro-sci 5:53–56.
Craner SL, Hoffman GE, Lund JS, Humphrey AL, Lund RD. 1992. cFoslabeling in rat superior colliculus: activation by normal retinal path-ways and pathways from intracranial retinal transplants. Exp Neurol117:219–229.
Curran T, Miller AD, Zokas L, Verma IM. 1984. Viral and cellular fosproteins: a comparative analysis. Cell 36:259–268.
D’Cruz PM, Yasumura D, Weir J, Matthes MT, Abderrahim H, LaVail MM,Vollrath D. 2000. Mutation of the receptor tyrosine kinase gene Mertkin the retinal dystrophic RCS rat. Hum Mol Genet 9:645–651.
Demas J, Eglen SJ, Wong RO. 2003. Developmental loss of synchronousspontaneous activity in the mouse retina is independent of visualexperience. J Neurosci 23:2851–2860.
Dowling JE, Sidman RL. 1962. Inherited retinal dystrophy in the rat.J Cell Biol 14:73–107.
Dryja TP, McGee TL, Reichel E, Hahn LB, Cowley GS, Yandell DW,Sandberg MA, Berson EL. 1990. A point mutation of the rhodopsingene in one form of retinitis pigmentosa. Nature 343:364–366.
Dryja TP, Hahn LB, Cowley GS, McGee TL, Berson EL. 1991. Mutationspectrum of the rhodopsin gene among patients with autosomal dom-inant retinitis pigmentosa. Proc Natl Acad Sci U S A 88:9370–9374.
Edwards RB, Szamier RB. 1977. Defective phagocytosis of isolated rodouter segments by RCS rat retinal pigment epithelium in culture.Science 197:1001–1003.
El-Hifnawi E. 1987. Pathomorphology of the retina and its vasculature inhereditary retinal dystrophy in RCS rats. In: Zrenner E, Krastel H,Goebel H-H, editors. Research in retinitis pigmentosa. Advances in thebiosciences, vol 62. Oxford: Pergamon. p 417–434.
Girman SV, Sauve Y, Lund RD. 1999. Receptive field properties of singleneurons in rat primary visual cortex. J Neurophysiol 82:301–311.
Girman SV, Wang S, Lund RD. 2003. Cortical visual functions can bepreserved by subretinal RPE cell grafting in RCS rats. Vis Res 43:1817–1827.
Gooley JJ, Lu J, Fischer D, Saper CB. 2003. A broad role for melanopsin innonvisual photoreception. J Neurosci 23:7093–7106.
Hetherington L, Benn M, Coffey PJ, Lund RD. 2000. Sensory capacity of theRoyal College of Surgeons rat. Invest Ophthalmol Vis Sci 41:3979–3983.
Hunt SP, Pini A, Evan G. 1987. Induction of c-fos-like protein in spinal cordneurons following sensory stimulation. Nature 328:632–634.
Jones BW, Watt CB, Frederick JM, Baehr W, Chen CK, Levine EM, MilamAH, Lavail MM, Marc RE. 2003. Retinal remodeling triggered by pho-toreceptor degenerations. J Comp Neurol 464:1–16.
Kovary K, Bravo R. 1991a. Expression of different Jun and Fos proteinsduring the G0-to-G1 transition in mouse fibroblasts: in vitro and in vivoassociations. Mol Cell Biol 11:2451–2459.
Kovary K, Bravo R. 1991b. The jun and fos protein families are both requiredfor cell cycle progression in fibroblasts. Mol Cell Biol 11:4466–4472.
LaVail MM. 1981. Analysis of neurological mutants with inherited retinal degen-eration. Friedenwald lecture. Invest Ophthalmol Vis Sci 21:638–657.
LaVail MM, Battelle BA. 1975. Influence of eye pigmentation and lightdeprivation on inherited retinal dystrophy in the rat. Exp Eye Res21:167–192.
LaVail MM, Sidman M, Rausin R, Sidman RL. 1974. Discrimination oflight intensity by rats with inherited retinal degeneration: a behavioraland cytological study. Vis Res 14:693–702.
Lawrence JM, Sauve Y, Keegan DJ, Coffey PJ, Hetherington L, Girman S,Whiteley SJ, Kwan AS, Pheby T, Lund RD. 2000. Schwann cell graftinginto the retina of the dystrophic RCS rat limits functional deteriora-tion. Royal College of Surgeons. Invest Ophthalmol Vis Sci 41:518–528.
Lu B, Coffey PJ, Lund RD. 1996. C-FOS expression in retina and superiorcolliculus of RCS rat following light flashes. Invest Ophthalmol Vis Sci 37:S1047.
Lu B, Keegan DJ, Homes T, Humphries M, Coffey PJ, Lund RD. 2001a.Abnormal c-fos-like immunoactivity in the superior colliculus of the
rhodopsin gene knockout and rd mutant mice. Invest Ophthalmol VisSci 42:S766.
Lu B, Lund RD, Coffey PJ. 2001b. Basal increase in c-Fos-like expressionin superior colliculus of Royal College of Surgeons dystrophic rats canbe abolished by intraocular injection of tetrodotoxin. Neuroscience 107:109–115.
Lucas RJ, Freedman MS, Lupi D, Munoz M, David-Gray ZK, Foster RG.2001. Identifying the photoreceptive inputs to the mammalian circa-dian system using transgenic and retinally degenerate mice. BehavBrain Res 125:97–102.
Lund RD, Adamson P, Sauve Y, Keegan DJ, Girman SV, Wang S, WintonH, Kanuga N, Kwan AS, Beauchene L, Zerbib A, Hetherington L,Couraud PO, Coffey P, Greenwood J. 2001. Subretinal transplantationof genetically modified human cell lines attenuates loss of visual func-tion in dystrophic rats. Proc Natl Acad Sci U S A 98:9942–9947.
Marc RE, Jones BW, Watt CB, Strettoi E. 2003. Neural remodeling inretinal degeneration. Prog Ret Eye Res 22:607–655.
Meister M, Wong RO, Baylor DA, Shatz CJ. 1991. Synchronous bursts ofaction potentials in ganglion cells of the developing mammalian retina.Science 252:939–943.
Montero VM, Jian S. 1995. Induction of c-fos protein by patterned visualstimulation in central visual pathways of the rat. Brain Res 690:189–199.
Morgan JI, Curran T. 1991. Stimulus-transcription coupling in the nervoussystem: involvement of the inducible proto-oncogenes fos and jun. AnnuRev Neurosci 14:421–451.
Mullen RJ, LaVail MM. 1976. Inherited retinal dystrophy: primary defectin pigment epithelium determined with experimental rat chimeras.Science 192:799–801.
Nathans J. 1992. Rhodopsin—structure, function, and genetics. Biochem-istry 31:4923–4931.
Paxinos G, Watson C. 1986. The rat brain in stereotaxic coordinates.Sydney: Academic Press.
Prusky GT, Lu B, Douglas RM, Lund RD. 2002. Loss of vision resultingfrom retinal degeneration is limited by retinal transplants. Soc Neu-rosci Abstr 158.12.
Ryder K, Lanahan A, Perez-Albuerne E, Nathans D. 1989. jun-D: a thirdmember of the jun gene family. Proc Natl Acad Sci U S A 86:1500–1503.
Sauve Y, Klassen H, Whitely SJO, Litchfield TM, Lund RD. 1996. Retinotopicanalysis of response parameters in the superior colliculus of RCS ratsfollowing retinal pigment cell transplants. Soc Neurosci Abstr 22:1978.
Sauve Y, Girman SV, Wang S, Lawrence JM, Lund RD. 2001. Progressivevisual sensitivity loss in the Royal College of Surgeons rat: perimetricstudy in the superior colliculus. Neuroscience 103:51–63.
Sauve Y, Lu B, Lund RD. 2003. The relationship between full field elec-troretinogram and perimetry-like visual thresholds in RCS rats duringphotoreceptor degeneration and rescue by cell transplants. Vis Res20:100–112.
Seaton AD, Sheedlo HJ, Turner JE. 1994. A primary role for RPE trans-plants in the inhibition and regression of neovascularization in theRCS rat. Invest Ophthalmol Vis Sci 35:162–169.
Shokravi MT, Dryja TP. 1993. Retinitis pigmentosa and the rhodopsingene. Int Ophthalmol Clin 33:219–228.
Strettoi E, Porciatti V, Falsini B, Pignatelli V, Rossi C. 2002. Morphologicaland functional abnormalities in the inner retina of the rd/rd mouse.J Neurosci 22:5492–5504.
Sung CH, Davenport CM, Hennessey JC, Maumenee IH, Jacobson SG,Heckenlively JR, Nowakowski R, Fishman G, Gouras P, Nathans J.1991. Rhodopsin mutations in autosomal dominant retinitis pigmen-tosa. Proc Natl Acad Sci U S A 88:6481–6485.
Vaney DI. 1997. Neuronal coupling in rod-signal pathways of the retina.Invest Ophthalmol Vis Sci 38:267–273.
Villegas-Perez MP, Wang S, Vidal-Sanz M, Holmes T, Lund RD. 1999.Retinal ganglion cell and axonal abnormalities caused by vascularcompression in rd mice. Invest Ophthalmol Vis Sci 40:S459.
Wang S, Villegas-Perez MP, Holmes T, Lawrence JM, Vidal-Sanz M,Hurtado-Montalban N, Lund RD. 2003. Evolving neurovascular rela-tionships in the RCS rat with age. Curr Eye Res 27:183–196.
Winer B. 1971. Statistical principals in experimental design. New York:McGraw-Hill.
Wong R, Meister M, Shatz CJ. 1993. Transient period of correlated burst-ing activity during development of the mammalian retina. Neuron11:923–938.
Wong RO. 1999. Retinal waves and visual system development. Annu RevNeurosci 22:29–47.
112 B. LU ET AL.
Copyright © 2022 FDOKUMEN