Genetic ablation of dynactin p150Glued in postnatal neurons ...
Upload
independentCategory
view
3download
0
Cell Metabolism
Article
Ablation of ARNT/HIF1b in Liver AltersGluconeogenesis, Lipogenic GeneExpression, and Serum KetonesXiaohui L. Wang,1 Ryo Suzuki,1 Kevin Lee,1 Thien Tran,1 Jenny E. Gunton,1,5 Asish K. Saha,2,3 Mary-Elizabeth Patti,1
Allison Goldfine,1 Neil B. Ruderman,2,3 Frank J. Gonzalez,4 and C. Ronald Kahn1,*1Joslin Diabetes Center, Harvard Medical School, Boston, MA 02215, USA2Diabetes Unit, Section of Endocrinology, Boston Medical Center, Boston, MA 02118, USA3Departments of Medicine and Physiology, Boston University School of Medicine, Boston, MA 02118, USA4Laboratory of Metabolism, National Cancer Institute, Bethesda, MD 20892, USA5Diabetes and Transcription Factors, Garvan Institute of Medical Research, Sydney, Australia*Correspondence: [email protected] 10.1016/j.cmet.2009.04.001
SUMMARY
We have previously shown that expression of thetranscription factor ARNT/HIF1b is reduced in isletsof humans with type 2 diabetes. We have now foundthat ARNT is also reduced in livers of diabetics. Tostudy the functional effect of its reduction, wecreated mice with liver-specific ablation (L-ARNTKO) using ARNT loxP mice and adenoviral-mediateddelivery of Cre. L-ARNT KO mice had normal bloodglucose but increased fed insulin levels. Thesemice also exhibited features of type 2 diabetes withincreased hepatic gluconeogenesis, increased lipo-genic gene expression, and low serum b-hydroxybu-tyrate. These effects appear to be secondary toincreased expression of CCAAT/enhancer-bindingprotein alpha (C/EBPa), farnesoid X receptor (FXR),and sterol response element-binding protein 1c(SREBP-1c) and a reduction in phosphorylation ofAMPKwithout changes in the expression of enzymesin ketogenesis, fatty acid oxidation, or FGF21. Theseresults demonstrate that a deficiency of ARNT actionin the liver, coupled with that in b cells, couldcontribute to the metabolic phenotype of humantype 2 diabetes.
INTRODUCTION
The liver plays a major role in glucose and lipid homeostasis inboth humans and rodents (Saltiel and Kahn, 2001; Michaelet al., 2000). Hepatic glucose production is critical in the fastingstate, providing fuel for the brain, renal medulla, and red bloodcells. Initially, hepatic glucose is released from glycogen by theprocess of glycogenolysis, but after several hours of fasting,glucose production is primarily from gluconeogenesis, a processby which the liver produces glucose from precursors such aslactate and pyruvate (Pilkis and Granner, 1992; Cherringtonet al., 1998). In addition, fatty acid b-oxidation is activated duringfasting, providing ATP for the liver (Postic et al., 2004) and gener-
ating ketone bodies, which provide an alternative fuel source forthe brain and heart (Blazquez et al., 1999). Gluconeogenesis,fatty acid b-oxidation, and ketogenesis are all suppressed byinsulin. In pathological states, such as type 1 diabetes mellitus,elevated gluconeogenesis and ketogenesis contribute signifi-cantly to hyperglycemia and hyperketonemia. One unexplainedand interesting finding is that in type 2 diabetes, where insulinresistance predominates, gluconeogenesis is increased withoutan obvious increase in ketogenesis (Cherrington et al., 1998).Multiple transcription factors and coregulators have been
identified as the downstream targets of insulin signaling in theregulation of gluconeogenesis, lipogenesis, and fatty acid oxida-tion in the liver, including the peroxisome proliferator-activatedreceptors (PPARs), the PPAR coactivators PGC-1a andPGC-1b, forkhead box O1 (FoxO1), farnesoid X receptor (FXR),sterol response element-binding protein 1c (SREBP-1c), andCCAAT/enhancer-binding proteins (C/EBPs) (Pedersen et al.,2007; Qiao et al., 2006; Sinal et al., 2000; Foufelle and Ferre,2002; Horton et al., 2002; Puigserver et al., 2003; Yoon et al.,2001). These proteins function either cooperatively or in parallelin the regulation of expression of genes in glucose and lipidmetabolism. To date, the upstream regulators of the key tran-scription factors involved in control of glucose, lipid, and ketonehomeostasis in the diabetic state remain largely unknown.The aryl hydrocarbon receptor nuclear translocator (ARNT),
also known as hypoxia-inducible factor 1b (HIF1b), is a ubiqui-tously expressed nuclear protein that belongs to the basichelix-loop-helix (bHLH)/PAS family of transcription factors (Reisz-Porszasz et al., 1994). ARNT is a heterodimerization partner forseveral members of the bHLH transcription factor family. Themost extensively studied include the aryl hydrocarbon receptor(AHR), which responds to exogenous organic molecules, suchas dioxins; and HIF1a, which is regulated by cellular oxygentension (Semenza, 1999; Ema et al., 1997). With its cognate het-erodimer partners, ARNT regulates a wide range of processesinvolving detoxification of organic molecules, response tohypoxia, development of the vascular system, cell proliferation,and control of glycolytic enzymes (Semenza, 1999; Ema et al.,1997).Previous studies from our laboratory have demonstrated
reduced expression of ARNT in b cells in humans with type 2 dia-betes and provided evidence that this reduction contributes to
428 Cell Metabolism 9, 428–439, May 6, 2009 ª2009 Elsevier Inc.
impaired insulin secretion in type 2 diabetes (Gunton et al., 2005).In the present study, we found that ARNT expression was alsoreduced in liver of obese individuals with type 2 diabetes. Wefurther demonstrated that liver-specific knockout of the ARNT/HIF1b increases the expression of key lipogenic and gluconeo-genic enzymes, resulting in increased gluconeogenesis anddyslipidemia but low levels of circulatory ketones. Such effectsappear to be mediated by activation of key transcription factorsin gluconeogenesis and lipogenesis, including SREBP-1c, FXR,and C/EBPa. Together, these results suggest that ARNT playsimportant roles in the control of metabolism in b cells and liver,and that alterations in ARNT expression in liver may lead todysregulation of glucose homeostasis and lipid metabolismwithout increased ketogenesis.
RESULTS
Reduced Expression of ARNT in the Liversof Humans with Type 2 Diabetes and Micewith STZ-Induced DiabetesMicroarray analysis was performed to assess expression ofARNT in liver specimens from normal lean individuals, obeseindividuals, and obese type 2 diabetics. Expression of ARNTmRNA was not altered in obese subjects without diabetesmellitus (DM), but was reduced in obese type 2 diabetic patientswith both well-controlled (DM [W]) and poorly-controlled (DM [P])blood glucose levels (Figure 1A). Although these differences didnot reach statistical significance in each diabetic group due tothe small sample size, when considered together, the datademonstrated an average 30% decrease in the expression ofARNTmRNA in the liver of obese individuals with type 2 diabetes(p < 0.02). As shown in Table 1, blood glucose concentrationsand fasting insulin levels were higher in the DM (W) and DM (P)groups compared to the lean controls (p < 0.05). Thus, highglucose levels, high insulin levels, and insulin resistance areassociated with the reduced expression of ARNT in the liversof humans with type 2 diabetes.To determine the effects of insulin and glucose in the regulation
ofARNT, streptozocin (STZ)-induceddiabeticmicewere studied.Theglucose levels in thesemicewereelevated4-fold over control(564 ± 9.8 versus 139 ± 7.8 mg/dl, p < 0.005), while insulin levelswere almost undetectable. Expression of ARNT protein in STZdiabetic mice was reduced to 63% ± 9% of Control levels (p <0.004), and this was largely restored to baseline upon insulintreatment (Figure 1B), suggesting that insulin signaling activatesthe expression of the ARNT gene and that ARNT expression isreduced in both insulin-deficient and insulin-resistant states.
Insulin, but Not Glucose, Increases the Expressionand Nuclear Translocation of ARNTTo determine whether the regulation of ARNT expression isa direct effect of glucose or insulin, human hepatoblastomaHuh7 cells were exposed for 16 hr to either low (5 mM) or high(25 mM) glucose and 0, 10, or 100 nM insulin and analyzed forARNT expression by western blotting. No changes in the expres-sion of ARNT were observed at the different glucose concentra-tions (Figure 1C); however, pretreatment for 16 hr with insulin at10 and 100 nM increased the expression of ARNT protein to120% and 130% of Control, respectively (Figure 1D, p < 0.05).
To further determine whether subcellular distribution of ARNTprotein is regulated by glucose or insulin, Huh7 cells wereexposed for 5min to D-glucose (dextrose) at different concentra-tions, 22 mM L-glucose, or 100 nM insulin. Neither D- norL-glucose changed nuclear translocation of ARNT protein(Figure 1E). However, when Huh7 cells were treated with insulinfor 5 min and then subjected to fraction, there was a clear trans-location of ARNT protein from the cytoplasm to the nuclear frac-tion (Figure 1E). Insulin-induced ARNT nuclear translocation wasalso observed by immunofluorescent staining. Thus, in the basalstate, ARNT protein wasmainly located in the cytoplasm of Huh7cells (Figure 1F, subpanels a and c). When these cells weretreated with insulin at 10 and 100 nM (Figure 1F, subpanels cand d) individually for 5 min, ARNT protein translocated intothe nucleus. Thus, insulin can increase the expression and thenuclear translocation of ARNT protein in liver. By contrast,glucose does not directly regulate the expression or nucleartranslocation of ARNT.
Acute Ablation of ARNT in Mouse Liver (L-ARNT KO)To define the potential effects of reduced ARNT expression in theliver, we created an acute postnatal liver-specific ablation ofARNT by tail-vein injection of an adenovirus carrying Cre recom-binase (Ad-Cre) into mice carrying two copies of the ARNT geneinwhich exon 6was flanked by loxP sites (flox/floxmice) to createthe L-ARNT KO mouse (Tomita et al., 2000). Same age and sexARNT flox/flox mice were injected with Ad-CMV vector ascontrols (Control). Three independent groups of five or six pairsof mice (age 9–11 months) were studied between days 4 and 6after the adenoviral injection to determine the effect of acuteARNT deletion on metabolism and gene and protein expression.One was a group of six pairs of female mice on normal chow diet(FNC). The second group consisted of five pairs of male mice onnormal chow diet (MNC). The third group represents six pairs offemale mice on high-fat (60%) diet for 3 months (FHF).To determine the efficacy of Ad-Cre recombination of the
ARNT gene, real-time RT-PCR was performed to quantifyARNT mRNA in liver of all three groups of mice 6 days afteradenovirus injection, using TBP mRNA as the normalizationcontrol. Expression of ARNT mRNA was reduced to 37% ± 5%of control levels in the liver of the FNC group (Figure 2A) and to26% ± 3% and 24% ± 4% of Control in the liver of the MNCand FHF mice (p < 0.00005). Consistent with the mRNA results,expression of ARNT protein was undetectable by western blotof livers of L-ARNT KO mice from the FNC group (Figure 2B), aswell as in the livers of MNC and FHF mice.
L-ARNT KO Induces Insulin Secretionand Hepatic GluconeogenesisWhen compared to levels prior to initiation of the experiment,there were slight reductions in body weight and food intake inboth L-ARNT KO and Control mice after adenovirus injection.However, there were no significant differences in body weightor food intake between L-ARNT KO and Control mice in any ofthe three groups (Figure S1A) on day 6 after the adenovirus injec-tion; there was no difference in blood glucose levels betweenL-ARNTKOmice andControl in either of the FNC orMNCgroupson normal chow (Figure 2C). However, a small but statisticallysignificant increase in fed blood glucose levels was observed
Cell Metabolism
Function of ARNT in Liver
Cell Metabolism 9, 428–439, May 6, 2009 ª2009 Elsevier Inc. 429
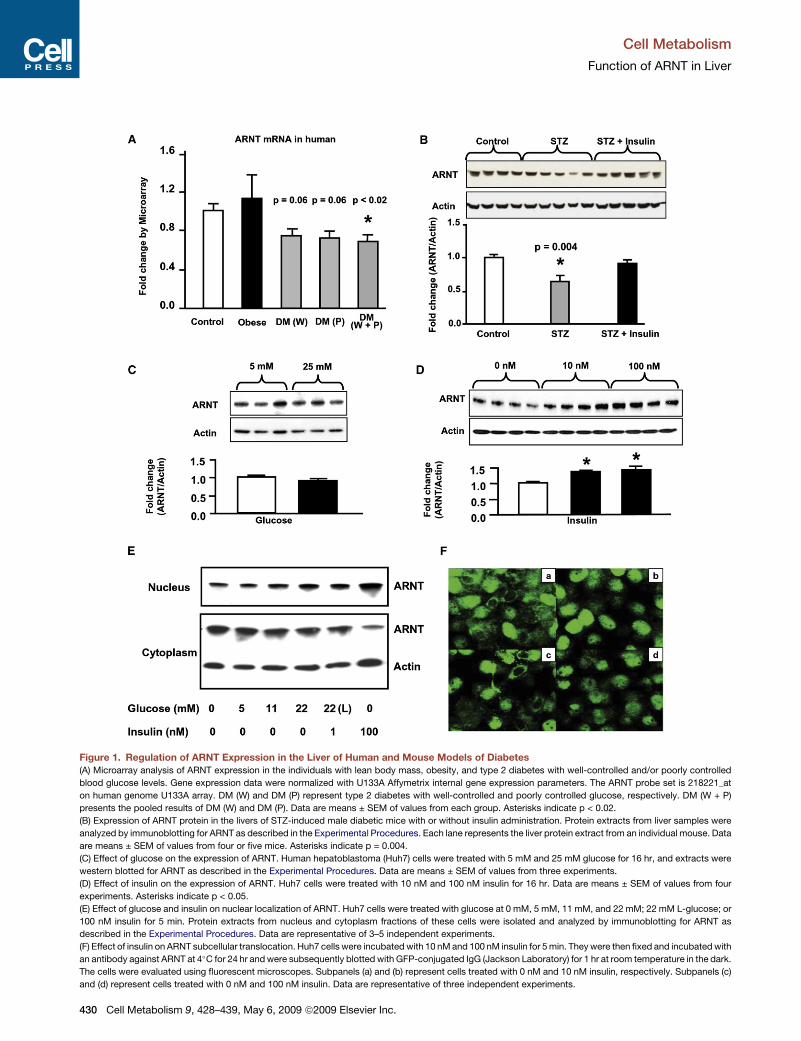
Figure 1. Regulation of ARNT Expression in the Liver of Human and Mouse Models of Diabetes(A) Microarray analysis of ARNT expression in the individuals with lean body mass, obesity, and type 2 diabetes with well-controlled and/or poorly controlled
blood glucose levels. Gene expression data were normalized with U133A Affymetrix internal gene expression parameters. The ARNT probe set is 218221_at
on human genome U133A array. DM (W) and DM (P) represent type 2 diabetes with well-controlled and poorly controlled glucose, respectively. DM (W + P)
presents the pooled results of DM (W) and DM (P). Data are means ± SEM of values from each group. Asterisks indicate p < 0.02.
(B) Expression of ARNT protein in the livers of STZ-induced male diabetic mice with or without insulin administration. Protein extracts from liver samples were
analyzed by immunoblotting for ARNT as described in the Experimental Procedures. Each lane represents the liver protein extract from an individual mouse. Data
are means ± SEM of values from four or five mice. Asterisks indicate p = 0.004.
(C) Effect of glucose on the expression of ARNT. Human hepatoblastoma (Huh7) cells were treated with 5 mM and 25 mM glucose for 16 hr, and extracts were
western blotted for ARNT as described in the Experimental Procedures. Data are means ± SEM of values from three experiments.
(D) Effect of insulin on the expression of ARNT. Huh7 cells were treated with 10 nM and 100 nM insulin for 16 hr. Data are means ± SEM of values from four
experiments. Asterisks indicate p < 0.05.
(E) Effect of glucose and insulin on nuclear localization of ARNT. Huh7 cells were treated with glucose at 0 mM, 5 mM, 11 mM, and 22 mM; 22 mM L-glucose; or
100 nM insulin for 5 min. Protein extracts from nucleus and cytoplasm fractions of these cells were isolated and analyzed by immunoblotting for ARNT as
described in the Experimental Procedures. Data are representative of 3–5 independent experiments.
(F) Effect of insulin on ARNT subcellular translocation. Huh7 cells were incubated with 10 nMand 100 nM insulin for 5min. Theywere then fixed and incubatedwith
an antibody against ARNT at 4!C for 24 hr andwere subsequently blotted with GFP-conjugated IgG (Jackson Laboratory) for 1 hr at room temperature in the dark.
The cells were evaluated using fluorescent microscopes. Subpanels (a) and (b) represent cells treated with 0 nM and 10 nM insulin, respectively. Subpanels (c)
and (d) represent cells treated with 0 nM and 100 nM insulin. Data are representative of three independent experiments.
Cell Metabolism
Function of ARNT in Liver
430 Cell Metabolism 9, 428–439, May 6, 2009 ª2009 Elsevier Inc.
in L-ARNT KO mice from the FHF group compared with Control(127.6 ± 5.0 mg/dl versus 106.4 ± 7.6 mg/dl; p < 0.05)(Figure 2C). Fed insulin levels of Control and L-ARNT KO micewere 0.25 ± 0.05 ng/dl versus 0.48 ± 0.14 ng/dl in the FNC groupand 1.51 ± 0.77 ng/dl versus 3.30 ± 1.14 ng/dl in the MNC groupand were significantly increased from 0.62 ± 0.11 ng/dl to 1.20 ±0.20 ng/dl in the FHF group (p = 0.04) (Figure 2D). Increasedfed insulin levels with normal to higher blood glucose levels inthe L-ARNT KO mice were observed in each of the three inde-pendent experimental groups.To better assess the effect of L-ARNT KO on the whole-body
glucose utilization, intraperitoneal glucose tolerance tests (GTTs)were performed in the FNC, FHF, and MNC groups (Figure 2E).Integrated glucose concentrations were calculated as the areaunder the curve (AUC). Overall, no significant differences in theAUC were observed in either the FNC or FHF groups(Figure S1B). Thus, the higher serum insulin levels were able tocompensate for the insulin resistance in female L-ARNT KOmice. GTT tests in L-ARNT KO mice from the MNC group, onthe other hand, revealed a significant increase in glucose valuesat all points from 15 to 120 min (Figure 2E).To directly examine the effect of deficiency of ARNT on hepatic
glucose output, pyruvate challenge experimentswere performedusing the FHF and MNC groups. By measuring blood glucose inresponse to the administration of pyruvate, a major gluconeo-genic substrate, one gets an estimation of gluconeogenic poten-tial in vivo. Followingpyruvate administration inControlmice fromthe FHF group, blood glucose concentrations increased by46 mg/dl over basal levels at 15 min (p < 0.005), plateaued, andthen decreased after 60 min. Glucose concentrations in L-ARNT KO mice were higher at all time points: 138 ± 9.5 mg/dlversus 107 ± 4.5 mg/dl at 15 min (p = 0.02), 120.7 ± 6.2 mg/dlversus 85.6 ± 8.1 mg/dl at 30 min (p = 0.01), and 66.2 ± 7.2 mg/dl versus 48 ± 6.7 mg/dl at 60 min (p = 0.10) (Figure 2F). Thearea under the serum glucose curve following the pyruvate chal-lenge in the FHF group of L-ARNT KO mice was increased 34%compared to theControl (p < 0.02) (Figure 2G). In theMNCgroup,glucose concentrations in L-ARNT KO versus Control mice were
also higher by 40%–50% at the 15, 50, and 60 min time points(p = 0.06, 0.01, and 0.05, respectively) (Figure 2F). The AUC inthe MNC group of L-ARNT KO mice was also increased by41% (p < 0.05) (Figure 2G). Taken together, these results indicateL-ARNT KO mice have significantly increased ability to convertpyruvate to glucose, i.e., higher hepatic gluconeogenesis, thannormal mice.
Insulin Sensitivity and Hepatic Glucose Productionby Hyperinsulinemic-Euglycemic ClampTo measure more precisely whole-body insulin sensitivity andhepatic glucose production, we performed hyperinsulinemic-euglycemic clamps with D-[3-3H]glucose in the FNC group. Atthe time of this procedure, there was no significant difference inbody weight (40.3 ± 2.1 g versus 38.7 ± 1.9 g) or fasting glucoselevels (104 ± 5 mg/dl versus 106 ± 1 mg/dl) between the ControlandL-ARNTKOmice.Whole-body insulin sensitivity, asquantifiedby the glucose infusion rate during the hyperinsulinemic-euglycemic clamp, was reduced in the L-ARNT KO mice (n = 5)to 22.9 ± 2.8 mg/kg/min, compared with 27.2 ± 4.5 mg/kg/min intheControls (n = 6), suggestingmildwhole-body insulin resistance(Figure 2H). Interestingly, basal hepatic glucose production wasalso increased in the L-ARNT KO mice, from 53 ± 12 mg/kg/minto 72 ± 21 mg/kg/min (Figure 2I). Although this difference did notquite reach statistical significance, when considered along withthe increased response to the pyruvate challenge, this findingis consistent with increased basal gluconeogenesis in theL-ARNTKOmice.During thehyperinsulinemic-euglycemicclamp,insulin suppressedhepatic glucoseproduction inboth theL-ARNTand Control groups to a similar extent (82%± 6.2% versus 71%±7.3%) (Figure 2I).
Potential Mechanisms of Increased HepaticGluconeogenesis in L-ARNT KO MiceTo determine the mechanisms of increased hepatic gluconeo-genesis caused by L-ARNT KO, the mRNA expression levels ofkey gluconeogenic enzymes, including phosphoenolpyruvatecarboxykinase (PEPCK), fructose 1,6-bisphosphatase (FBP1),
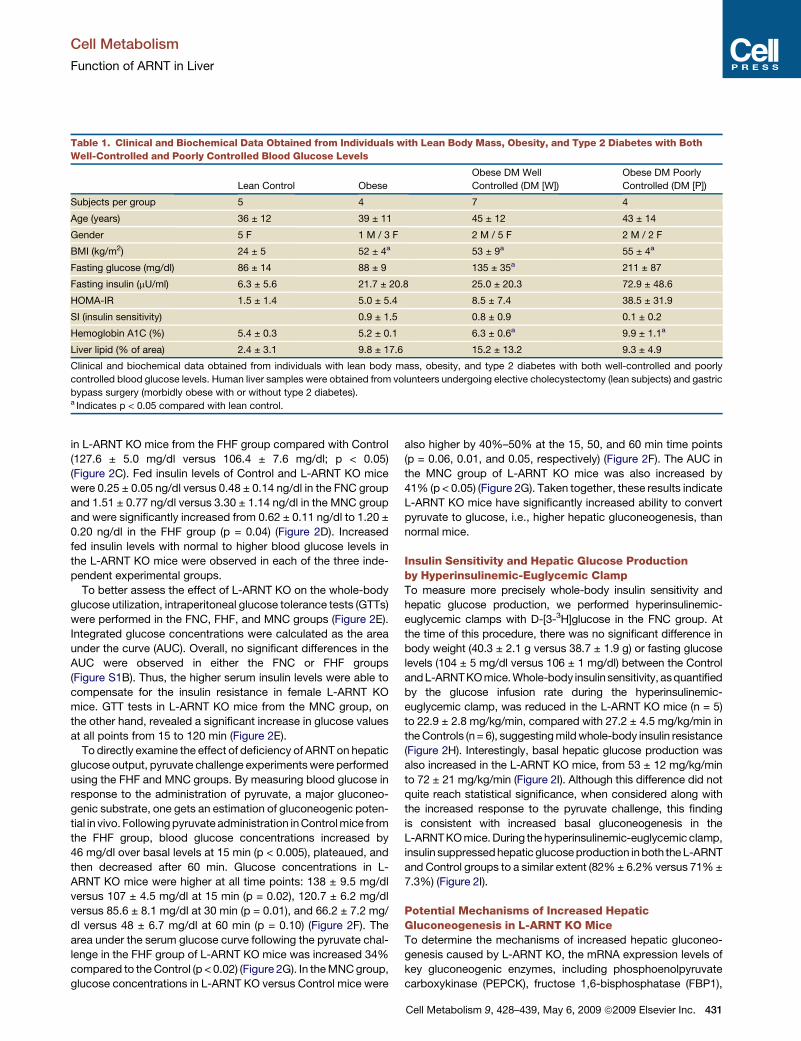
Table 1. Clinical and Biochemical Data Obtained from Individuals with Lean Body Mass, Obesity, and Type 2 Diabetes with BothWell-Controlled and Poorly Controlled Blood Glucose Levels
Lean Control Obese
Obese DM Well
Controlled (DM [W])
Obese DM Poorly
Controlled (DM [P])
Subjects per group 5 4 7 4
Age (years) 36 ± 12 39 ± 11 45 ± 12 43 ± 14
Gender 5 F 1 M / 3 F 2 M / 5 F 2 M / 2 F
BMI (kg/m2) 24 ± 5 52 ± 4a 53 ± 9a 55 ± 4a
Fasting glucose (mg/dl) 86 ± 14 88 ± 9 135 ± 35a 211 ± 87
Fasting insulin (mU/ml) 6.3 ± 5.6 21.7 ± 20.8 25.0 ± 20.3 72.9 ± 48.6
HOMA-IR 1.5 ± 1.4 5.0 ± 5.4 8.5 ± 7.4 38.5 ± 31.9
SI (insulin sensitivity) 0.9 ± 1.5 0.8 ± 0.9 0.1 ± 0.2
Hemoglobin A1C (%) 5.4 ± 0.3 5.2 ± 0.1 6.3 ± 0.6a 9.9 ± 1.1a
Liver lipid (% of area) 2.4 ± 3.1 9.8 ± 17.6 15.2 ± 13.2 9.3 ± 4.9
Clinical and biochemical data obtained from individuals with lean body mass, obesity, and type 2 diabetes with both well-controlled and poorly
controlled blood glucose levels. Human liver samples were obtained from volunteers undergoing elective cholecystectomy (lean subjects) and gastric
bypass surgery (morbidly obese with or without type 2 diabetes).a Indicates p < 0.05 compared with lean control.
Cell Metabolism
Function of ARNT in Liver
Cell Metabolism 9, 428–439, May 6, 2009 ª2009 Elsevier Inc. 431
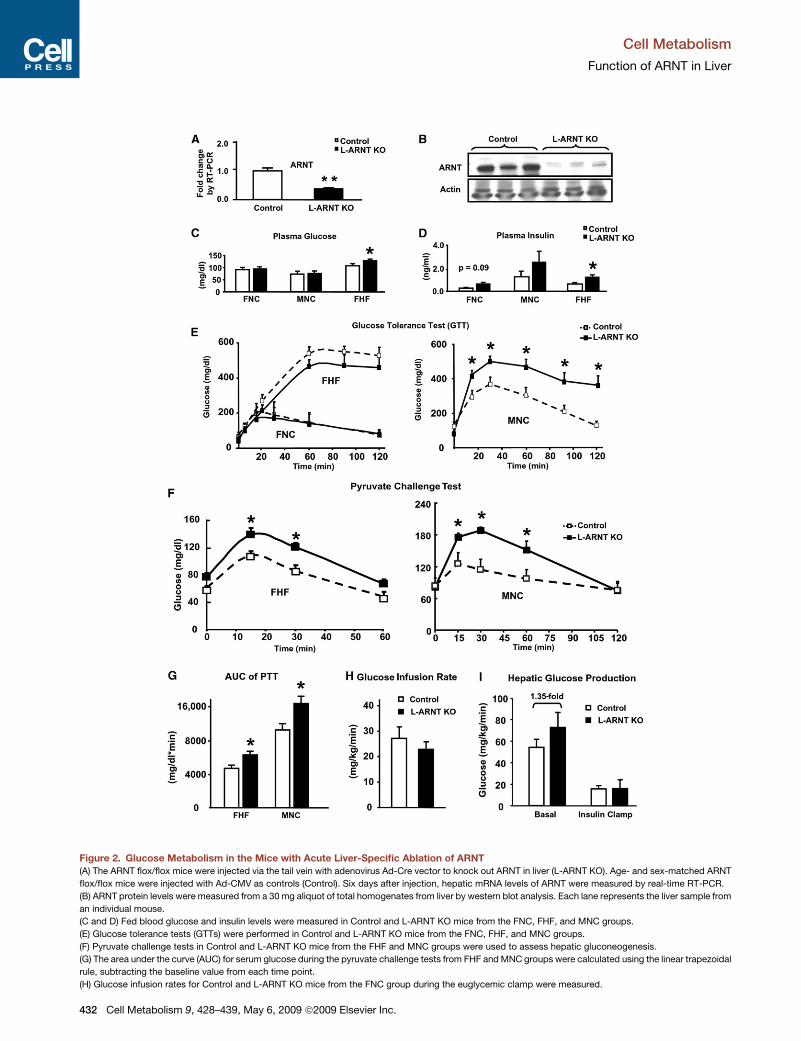
Figure 2. Glucose Metabolism in the Mice with Acute Liver-Specific Ablation of ARNT(A) The ARNT flox/flox mice were injected via the tail vein with adenovirus Ad-Cre vector to knock out ARNT in liver (L-ARNT KO). Age- and sex-matched ARNT
flox/flox mice were injected with Ad-CMV as controls (Control). Six days after injection, hepatic mRNA levels of ARNT were measured by real-time RT-PCR.
(B) ARNT protein levels were measured from a 30 mg aliquot of total homogenates from liver by western blot analysis. Each lane represents the liver sample from
an individual mouse.
(C and D) Fed blood glucose and insulin levels were measured in Control and L-ARNT KO mice from the FNC, FHF, and MNC groups.
(E) Glucose tolerance tests (GTTs) were performed in Control and L-ARNT KO mice from the FNC, FHF, and MNC groups.
(F) Pyruvate challenge tests in Control and L-ARNT KO mice from the FHF and MNC groups were used to assess hepatic gluconeogenesis.
(G) The area under the curve (AUC) for serum glucose during the pyruvate challenge tests from FHF andMNC groups were calculated using the linear trapezoidal
rule, subtracting the baseline value from each time point.
(H) Glucose infusion rates for Control and L-ARNT KO mice from the FNC group during the euglycemic clamp were measured.
Cell Metabolism
Function of ARNT in Liver
432 Cell Metabolism 9, 428–439, May 6, 2009 ª2009 Elsevier Inc.
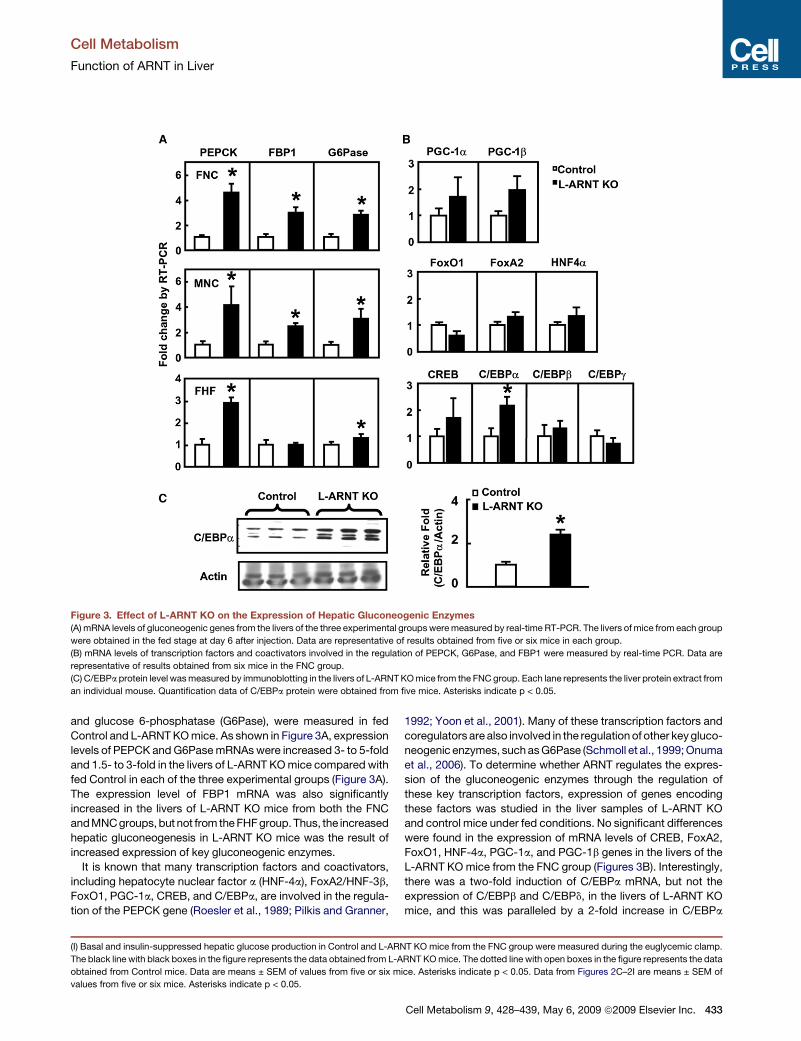
and glucose 6-phosphatase (G6Pase), were measured in fedControl and L-ARNTKOmice. As shown in Figure 3A, expressionlevels of PEPCK andG6PasemRNAswere increased 3- to 5-foldand 1.5- to 3-fold in the livers of L-ARNT KOmice compared withfed Control in each of the three experimental groups (Figure 3A).The expression level of FBP1 mRNA was also significantlyincreased in the livers of L-ARNT KO mice from both the FNCandMNCgroups,but not from theFHFgroup.Thus, the increasedhepatic gluconeogenesis in L-ARNT KO mice was the result ofincreased expression of key gluconeogenic enzymes.It is known that many transcription factors and coactivators,
including hepatocyte nuclear factor a (HNF-4a), FoxA2/HNF-3b,FoxO1, PGC-1a, CREB, and C/EBPa, are involved in the regula-tion of the PEPCK gene (Roesler et al., 1989; Pilkis and Granner,
1992; Yoon et al., 2001). Many of these transcription factors andcoregulators are also involved in the regulationof other keygluco-neogenic enzymes, suchasG6Pase (Schmoll et al., 1999;Onumaet al., 2006). To determine whether ARNT regulates the expres-sion of the gluconeogenic enzymes through the regulation ofthese key transcription factors, expression of genes encodingthese factors was studied in the liver samples of L-ARNT KOand control mice under fed conditions. No significant differenceswere found in the expression of mRNA levels of CREB, FoxA2,FoxO1, HNF-4a, PGC-1a, and PGC-1b genes in the livers of theL-ARNT KOmice from the FNC group (Figures 3B). Interestingly,there was a two-fold induction of C/EBPa mRNA, but not theexpression of C/EBPb and C/EBPd, in the livers of L-ARNT KOmice, and this was paralleled by a 2-fold increase in C/EBPa
(I) Basal and insulin-suppressed hepatic glucose production in Control and L-ARNT KO mice from the FNC group were measured during the euglycemic clamp.
The black line with black boxes in the figure represents the data obtained from L-ARNT KOmice. The dotted line with open boxes in the figure represents the data
obtained from Control mice. Data are means ± SEM of values from five or six mice. Asterisks indicate p < 0.05. Data from Figures 2C–2I are means ± SEM of
values from five or six mice. Asterisks indicate p < 0.05.
Figure 3. Effect of L-ARNT KO on the Expression of Hepatic Gluconeogenic Enzymes(A) mRNA levels of gluconeogenic genes from the livers of the three experimental groupsweremeasured by real-time RT-PCR. The livers of mice from each group
were obtained in the fed stage at day 6 after injection. Data are representative of results obtained from five or six mice in each group.
(B) mRNA levels of transcription factors and coactivators involved in the regulation of PEPCK, G6Pase, and FBP1 were measured by real-time PCR. Data are
representative of results obtained from six mice in the FNC group.
(C) C/EBPa protein level wasmeasured by immunoblotting in the livers of L-ARNTKOmice from the FNCgroup. Each lane represents the liver protein extract from
an individual mouse. Quantification data of C/EBPa protein were obtained from five mice. Asterisks indicate p < 0.05.
Cell Metabolism
Function of ARNT in Liver
Cell Metabolism 9, 428–439, May 6, 2009 ª2009 Elsevier Inc. 433
protein (Figure 3C). Similar results were observed in the MNCgroup (Figure S2). The possibility that the L-ARNT KO activatesgluconeogenesis through activation of the expression of C/EBPa gene is consistent with the growing body of literatureshowing that C/EBPa is involved in the regulation of gluconeo-genesis and lipid metabolism in the liver (Pedersen et al., 2007;Qiao et al., 2006).
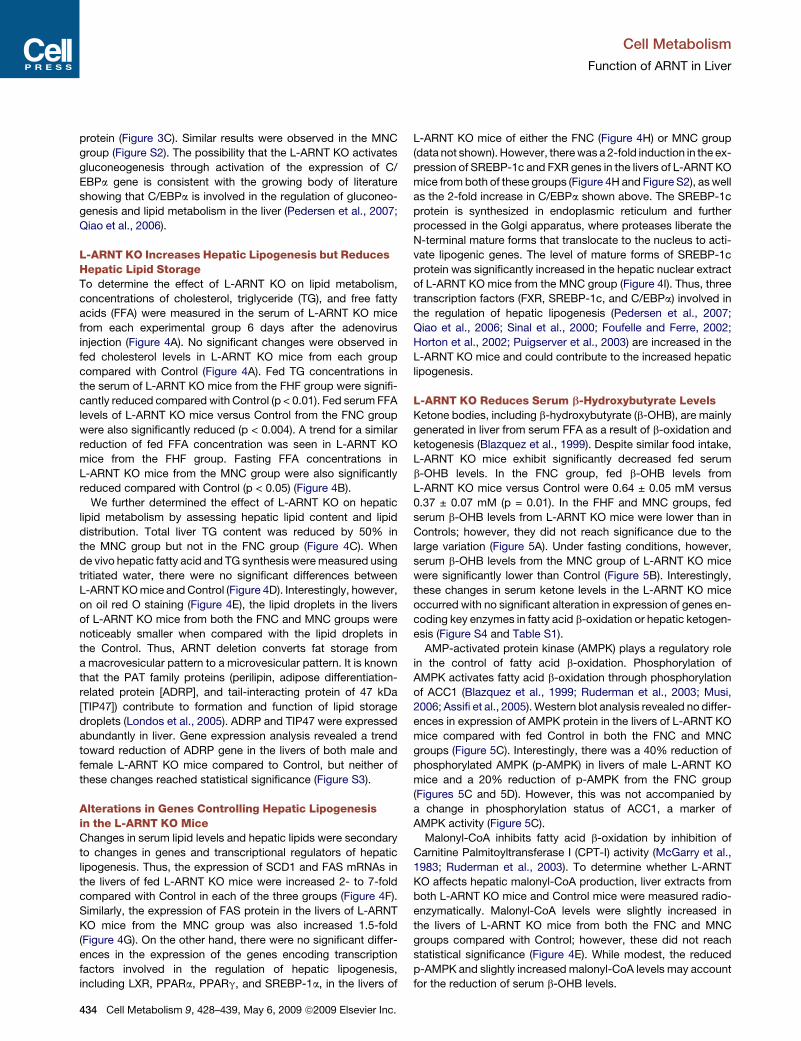
L-ARNT KO Increases Hepatic Lipogenesis but ReducesHepatic Lipid StorageTo determine the effect of L-ARNT KO on lipid metabolism,concentrations of cholesterol, triglyceride (TG), and free fattyacids (FFA) were measured in the serum of L-ARNT KO micefrom each experimental group 6 days after the adenovirusinjection (Figure 4A). No significant changes were observed infed cholesterol levels in L-ARNT KO mice from each groupcompared with Control (Figure 4A). Fed TG concentrations inthe serum of L-ARNT KO mice from the FHF group were signifi-cantly reduced compared with Control (p < 0.01). Fed serum FFAlevels of L-ARNT KO mice versus Control from the FNC groupwere also significantly reduced (p < 0.004). A trend for a similarreduction of fed FFA concentration was seen in L-ARNT KOmice from the FHF group. Fasting FFA concentrations inL-ARNT KO mice from the MNC group were also significantlyreduced compared with Control (p < 0.05) (Figure 4B).
We further determined the effect of L-ARNT KO on hepaticlipid metabolism by assessing hepatic lipid content and lipiddistribution. Total liver TG content was reduced by 50% inthe MNC group but not in the FNC group (Figure 4C). Whende vivo hepatic fatty acid and TG synthesis weremeasured usingtritiated water, there were no significant differences betweenL-ARNTKOmice andControl (Figure 4D). Interestingly, however,on oil red O staining (Figure 4E), the lipid droplets in the liversof L-ARNT KO mice from both the FNC and MNC groups werenoticeably smaller when compared with the lipid droplets inthe Control. Thus, ARNT deletion converts fat storage froma macrovesicular pattern to a microvesicular pattern. It is knownthat the PAT family proteins (perilipin, adipose differentiation-related protein [ADRP], and tail-interacting protein of 47 kDa[TIP47]) contribute to formation and function of lipid storagedroplets (Londos et al., 2005). ADRP and TIP47 were expressedabundantly in liver. Gene expression analysis revealed a trendtoward reduction of ADRP gene in the livers of both male andfemale L-ARNT KO mice compared to Control, but neither ofthese changes reached statistical significance (Figure S3).
Alterations in Genes Controlling Hepatic Lipogenesisin the L-ARNT KO MiceChanges in serum lipid levels and hepatic lipids were secondaryto changes in genes and transcriptional regulators of hepaticlipogenesis. Thus, the expression of SCD1 and FAS mRNAs inthe livers of fed L-ARNT KO mice were increased 2- to 7-foldcompared with Control in each of the three groups (Figure 4F).Similarly, the expression of FAS protein in the livers of L-ARNTKO mice from the MNC group was also increased 1.5-fold(Figure 4G). On the other hand, there were no significant differ-ences in the expression of the genes encoding transcriptionfactors involved in the regulation of hepatic lipogenesis,including LXR, PPARa, PPARg, and SREBP-1a, in the livers of
L-ARNT KO mice of either the FNC (Figure 4H) or MNC group(data not shown). However, therewas a 2-fold induction in the ex-pression of SREBP-1c and FXR genes in the livers of L-ARNT KOmice fromboth of these groups (Figure 4H and Figure S2), aswellas the 2-fold increase in C/EBPa shown above. The SREBP-1cprotein is synthesized in endoplasmic reticulum and furtherprocessed in the Golgi apparatus, where proteases liberate theN-terminal mature forms that translocate to the nucleus to acti-vate lipogenic genes. The level of mature forms of SREBP-1cprotein was significantly increased in the hepatic nuclear extractof L-ARNT KO mice from the MNC group (Figure 4I). Thus, threetranscription factors (FXR, SREBP-1c, and C/EBPa) involved inthe regulation of hepatic lipogenesis (Pedersen et al., 2007;Qiao et al., 2006; Sinal et al., 2000; Foufelle and Ferre, 2002;Horton et al., 2002; Puigserver et al., 2003) are increased in theL-ARNT KO mice and could contribute to the increased hepaticlipogenesis.
L-ARNT KO Reduces Serum b-Hydroxybutyrate LevelsKetone bodies, including b-hydroxybutyrate (b-OHB), are mainlygenerated in liver from serum FFA as a result of b-oxidation andketogenesis (Blazquez et al., 1999). Despite similar food intake,L-ARNT KO mice exhibit significantly decreased fed serumb-OHB levels. In the FNC group, fed b-OHB levels fromL-ARNT KO mice versus Control were 0.64 ± 0.05 mM versus0.37 ± 0.07 mM (p = 0.01). In the FHF and MNC groups, fedserum b-OHB levels from L-ARNT KO mice were lower than inControls; however, they did not reach significance due to thelarge variation (Figure 5A). Under fasting conditions, however,serum b-OHB levels from the MNC group of L-ARNT KO micewere significantly lower than Control (Figure 5B). Interestingly,these changes in serum ketone levels in the L-ARNT KO miceoccurred with no significant alteration in expression of genes en-coding key enzymes in fatty acid b-oxidation or hepatic ketogen-esis (Figure S4 and Table S1).AMP-activated protein kinase (AMPK) plays a regulatory role
in the control of fatty acid b-oxidation. Phosphorylation ofAMPK activates fatty acid b-oxidation through phosphorylationof ACC1 (Blazquez et al., 1999; Ruderman et al., 2003; Musi,2006; Assifi et al., 2005).Western blot analysis revealed no differ-ences in expression of AMPK protein in the livers of L-ARNT KOmice compared with fed Control in both the FNC and MNCgroups (Figure 5C). Interestingly, there was a 40% reduction ofphosphorylated AMPK (p-AMPK) in livers of male L-ARNT KOmice and a 20% reduction of p-AMPK from the FNC group(Figures 5C and 5D). However, this was not accompanied bya change in phosphorylation status of ACC1, a marker ofAMPK activity (Figure 5C).Malonyl-CoA inhibits fatty acid b-oxidation by inhibition of
Carnitine Palmitoyltransferase I (CPT-I) activity (McGarry et al.,1983; Ruderman et al., 2003). To determine whether L-ARNTKO affects hepatic malonyl-CoA production, liver extracts fromboth L-ARNT KO mice and Control mice were measured radio-enzymatically. Malonyl-CoA levels were slightly increased inthe livers of L-ARNT KO mice from both the FNC and MNCgroups compared with Control; however, these did not reachstatistical significance (Figure 4E). While modest, the reducedp-AMPK and slightly increased malonyl-CoA levels may accountfor the reduction of serum b-OHB levels.
Cell Metabolism
Function of ARNT in Liver
434 Cell Metabolism 9, 428–439, May 6, 2009 ª2009 Elsevier Inc.
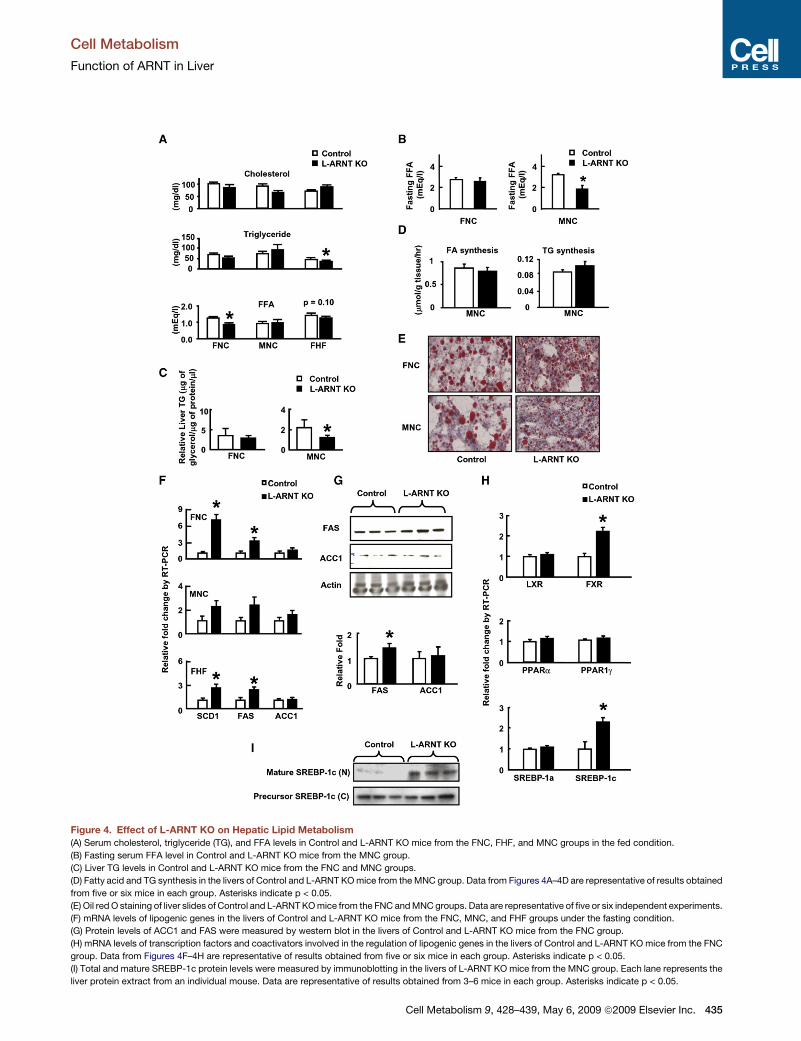
Figure 4. Effect of L-ARNT KO on Hepatic Lipid Metabolism(A) Serum cholesterol, triglyceride (TG), and FFA levels in Control and L-ARNT KO mice from the FNC, FHF, and MNC groups in the fed condition.
(B) Fasting serum FFA level in Control and L-ARNT KO mice from the MNC group.
(C) Liver TG levels in Control and L-ARNT KO mice from the FNC and MNC groups.
(D) Fatty acid and TG synthesis in the livers of Control and L-ARNT KOmice from the MNC group. Data from Figures 4A–4D are representative of results obtained
from five or six mice in each group. Asterisks indicate p < 0.05.
(E) Oil red O staining of liver slides of Control and L-ARNTKOmice from the FNC andMNCgroups. Data are representative of five or six independent experiments.
(F) mRNA levels of lipogenic genes in the livers of Control and L-ARNT KO mice from the FNC, MNC, and FHF groups under the fasting condition.
(G) Protein levels of ACC1 and FAS were measured by western blot in the livers of Control and L-ARNT KO mice from the FNC group.
(H) mRNA levels of transcription factors and coactivators involved in the regulation of lipogenic genes in the livers of Control and L-ARNT KOmice from the FNC
group. Data from Figures 4F–4H are representative of results obtained from five or six mice in each group. Asterisks indicate p < 0.05.
(I) Total and mature SREBP-1c protein levels were measured by immunoblotting in the livers of L-ARNT KOmice from the MNC group. Each lane represents the
liver protein extract from an individual mouse. Data are representative of results obtained from 3–6 mice in each group. Asterisks indicate p < 0.05.
Cell Metabolism
Function of ARNT in Liver
Cell Metabolism 9, 428–439, May 6, 2009 ª2009 Elsevier Inc. 435
Recently, studies from two laboratories have shown thatgrowth factor FGF21 is involved in control of ketone body forma-tion and that FGF21 transgenic mice exhibit increased ketogen-esis (Inagaki et al., 2007; Badman et al., 2007). While FGF21mRNA levels were detected in liver of L-ARNT mice, there wasno significant change in the expression of FGF21 gene in theselivers compared with Control (Figure 5F).
DISCUSSION
In this study, we have shown that there is a reduction in expres-sion of ARNT in livers of humans with type 2 diabetes. Whenthe effect of this reduction of ARNTwas assessed by acute abla-
tion of the ARNT gene in the liver of mice, we found an increase ingluconeogenesis and lipogenesis, an increase in serum insulinlevels, and a relative decrease in ketogenesis. These findings inL-ARNT KO mice mimic those of human type 2 diabetes,suggesting that a deficiency of ARNT action in the liver couldcontribute to the altered metabolic function in humans withtype 2 diabetes. In previous studies, we have shown that individ-uals with type 2 diabetes have a marked reduction of ARNTexpression in pancreatic islets, which when modeled in cellsand mice leads to impaired glucose-stimulated insulin secretionand glucose intolerance (Gunton et al., 2005). Taken together,these results suggest that reductions in ARNT expression in theb cell and liver may play important roles in the defects observed
Figure 5. Effects of L-ARNT KO on Hepatic Fatty Acid b-Oxidation and Ketogenesis(A) Fed serum b-hydroxybutyrate (b-OHB) levels in Control and L-ARNT KO mice from the FNC, MNC, and FHF groups.
(B) Fasting serum b-OHB levels in Control and L-ARNT KO mice from the MNC group.
(C) Total and phosphorylation levels of AMPK and ACC1 proteins were measured by western blotting in the livers of Control and L-ARNT KO mice from the FNC
and MNC groups.
(D) Quantification of protein ratio of p-AMPK/AMPK and p-ACC/ACC in the livers of Control and L-ARNT KO mice from the FNC and MNC groups.
(E) Malonyl-CoA levels in Control and L-ARNT KO mice from the FNC and MNC groups.
(F) mRNA levels of FGF21 genes in the livers of Control and L-ARNTKOmice from theMNC group. Data are representative of results obtained from five or sixmice
in each group. Asterisks indicate p < 0.05.
Cell Metabolism
Function of ARNT in Liver
436 Cell Metabolism 9, 428–439, May 6, 2009 ª2009 Elsevier Inc.
in human type 2 diabetes in glucose homeostasis and lipidmetabolism.The effects of reduction in ARNT on hepatic gluconeogenesis
and lipogenesis are mediated by elevated expression of key glu-coneogenic and lipogenic enzymes, including PEPCK, G6Pase,SCD1, and FAS. Studies from multiple research groups haveshown that the rate-limiting enzymes involved in gluconeogen-esis and lipogenesis are mainly regulated at the transcriptionallevel by a number of transcription factors and their coregulators(Pedersen et al., 2007;Qiao et al., 2006; Sinal et al., 2000; Foufelleand Ferre, 2002; Horton et al., 2002; Puigserver et al., 2003; Yoonet al., 2001). C/EBPa is essential for the activation of hepaticglucose production at birth, and disruption of the C/EBPa genein mice causes hypoglycemia associated with the impairedexpression of the gluconeogenic enzymes PEPCK and G6Pase(Pedersen et al., 2007; Qiao et al., 2006). Acute knockout ofC/EBPa also significantly reduces the expression of lipogenicgenes, including ACC, SCD1, and FAS (Pedersen et al., 2007;Qiao et al., 2006). These effects occur through C/EBPa bindingto its binding element on these gene promoters (Pedersenet al., 2007; Schmoll et al., 1999). ARNT appears to function asan upstream regulator of C/EBPa, such that knockout of ARNTincreases C/EBPa gene expression, which in turn activates theexpression of gluconeogenic and lipogenic enzymes.Besides the increase in C/EBPa gene expression, acute
knockout of ARNT also increases the expression of FXR andSREBP-1c, two important regulators of lipid homeostasis (Sinalet al., 2000; Foufelle and Ferre, 2002; Horton et al., 2002).SREBP-1c mRNA is the predominant isoform in liver and isa member of the bHLH family of DNA binding proteins thatform dimers that recognize the inverted E-box repeats.SREBP-1c mRNA expression is controlled in part by insulin,increased by a fasting and refeeding regimen, and decreasedin rats with STZ-induced diabetes. Overexpression of SREBP-1c in liver prevented the downregulation of lipogenic genes
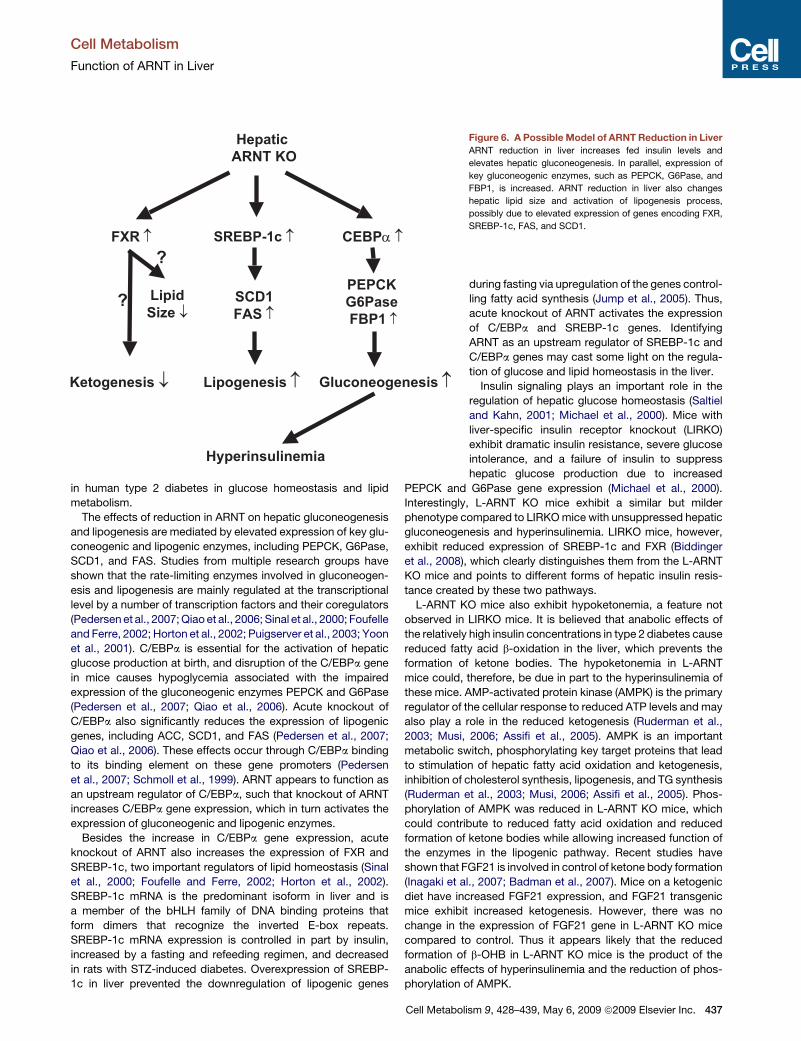
Figure 6. A Possible Model of ARNT Reduction in LiverARNT reduction in liver increases fed insulin levels and
elevates hepatic gluconeogenesis. In parallel, expression of
key gluconeogenic enzymes, such as PEPCK, G6Pase, and
FBP1, is increased. ARNT reduction in liver also changes
hepatic lipid size and activation of lipogenesis process,
possibly due to elevated expression of genes encoding FXR,
SREBP-1c, FAS, and SCD1.
during fasting via upregulation of the genes control-ling fatty acid synthesis (Jump et al., 2005). Thus,acute knockout of ARNT activates the expressionof C/EBPa and SREBP-1c genes. IdentifyingARNT as an upstream regulator of SREBP-1c andC/EBPa genes may cast some light on the regula-tion of glucose and lipid homeostasis in the liver.
Insulin signaling plays an important role in theregulation of hepatic glucose homeostasis (Saltieland Kahn, 2001; Michael et al., 2000). Mice withliver-specific insulin receptor knockout (LIRKO)exhibit dramatic insulin resistance, severe glucoseintolerance, and a failure of insulin to suppresshepatic glucose production due to increased
PEPCK and G6Pase gene expression (Michael et al., 2000).Interestingly, L-ARNT KO mice exhibit a similar but milderphenotype compared to LIRKOmice with unsuppressed hepaticgluconeogenesis and hyperinsulinemia. LIRKO mice, however,exhibit reduced expression of SREBP-1c and FXR (Biddingeret al., 2008), which clearly distinguishes them from the L-ARNTKO mice and points to different forms of hepatic insulin resis-tance created by these two pathways.L-ARNT KO mice also exhibit hypoketonemia, a feature not
observed in LIRKO mice. It is believed that anabolic effects ofthe relatively high insulin concentrations in type 2 diabetes causereduced fatty acid b-oxidation in the liver, which prevents theformation of ketone bodies. The hypoketonemia in L-ARNTmice could, therefore, be due in part to the hyperinsulinemia ofthese mice. AMP-activated protein kinase (AMPK) is the primaryregulator of the cellular response to reduced ATP levels and mayalso play a role in the reduced ketogenesis (Ruderman et al.,2003; Musi, 2006; Assifi et al., 2005). AMPK is an importantmetabolic switch, phosphorylating key target proteins that leadto stimulation of hepatic fatty acid oxidation and ketogenesis,inhibition of cholesterol synthesis, lipogenesis, and TG synthesis(Ruderman et al., 2003; Musi, 2006; Assifi et al., 2005). Phos-phorylation of AMPK was reduced in L-ARNT KO mice, whichcould contribute to reduced fatty acid oxidation and reducedformation of ketone bodies while allowing increased function ofthe enzymes in the lipogenic pathway. Recent studies haveshown that FGF21 is involved in control of ketone body formation(Inagaki et al., 2007; Badman et al., 2007). Mice on a ketogenicdiet have increased FGF21 expression, and FGF21 transgenicmice exhibit increased ketogenesis. However, there was nochange in the expression of FGF21 gene in L-ARNT KO micecompared to control. Thus it appears likely that the reducedformation of b-OHB in L-ARNT KO mice is the product of theanabolic effects of hyperinsulinemia and the reduction of phos-phorylation of AMPK.
Cell Metabolism
Function of ARNT in Liver
Cell Metabolism 9, 428–439, May 6, 2009 ª2009 Elsevier Inc. 437
One of the most interesting findings in the L-ARNT KO micewas the reduced size of the lipid droplets in their livers. It isknown that lack of PAT family proteins reduces the size of lipiddroplets (Londos et al., 2005). L-ARNT mice have a trend toreduced levels of ADRP, one of the PAT proteins, in their livers,which may contribute to the reduced size of the lipid droplets,although this effect is very modest.
The exact molecular mechanism of ARNT action on hepaticmetabolism may be complex. ARNT is a member of the bHLH/PAS family of proteins (Reisz-Porszasz et al., 1994). ARNT func-tions through heterodimerization with AHR in the toxic effect ofdioxin. Within the nucleus, AHR/ARNT heterodimers bind tospecific DNA response elements with the consensus motifTNGTGTG of the target promoter to control gene transcription.The other dimerization partners of ARNT include SIM1 andSIM2 (regulators of neurogenesis) and HIF1a and HIF2a (regula-tors of the cellular response to hypoxia) (Semenza, 1999; Emaet al., 1997). Thus, ARNT may play a role in regulating manydifferent signaling pathways by partnering with different tran-scription factors. Studies on overexpression of ARNT partnersare needed to gain more insight into the mechanisms of ARNTaction in the liver.
Themetabolic syndrome shares a number of features of type 2diabetes and is also increasing at an alarming rate, with almost25% of the adult U.S. population currently affected. Given thefact that the metabolic syndrome and type 2 diabetes increasethe risk of many other conditions, including nonalcoholic fattyliver and cardiovascular disease, more specific and effectivetherapeutic strategies are urgently needed. Certain ligand-acti-vated nuclear receptors, including FXR, SREBP-1c, and C/EBPa, provide promising new targets for this purpose. SinceARNT/HIF1b acts as an upstream regulator of FXR, SREBP-1c,and C/EBPa genes in the regulation of insulin-mediated inhibi-tion on gluconeogenesis and lipogenesis (Figure 6), approachesto modulate ARNT levels or its transcriptional effects couldprovide a novel approach for treatment of diabetes, fatty liver,and the metabolic syndrome.
EXPERIMENTAL PROCEDURES
Animals, Adenoviruses, and Plasma/SerumBiochemical MeasurementsARNT flox/flox mice were generated as previously described (Tomita et al.,
2000). Three groups of ARNT flox/flox mice were studied: male and female
mice (9–11 months) on normal chow diet (MNC and FNC, respectively) and
female mice (9 months) that had been on a 60% high-fat diet for 3 months
(FHF). In each group, half of the mice were injected with the adenoviral-Cre
construct and half with a control adenovirus via the tail vein 4–6 days prior
to the experiments.
Glucose Tolerance and Pyruvate Challenge TestsFor GTT, ARNT flox/flox and L-ARNT KO mice deprived of food for 16 hr were
injected intraperitoneally (i.p.) with glucose (2 g/kg body weight), and glucose
from tail vein blood was measured at 0–120 min using a glucometer. For the
pyruvate challenge test, 16 hr fasted mice were injected i.p. with pyruvate
(2 g/kg) dissolved in saline, and glucose was measured as above.
Hyperinsulinemic-Euglycemic Clamp ExperimentsThe jugular vein of ARNT flox/flox mice was cannulated. After a 2 day recovery
period, Cre and control adenovirus were injected. After an additional 5 days
and a 4 hr fast, a hyperinsulinemic-euglycemic clamp was performed with
D-[3-3H]glucose as described by Norris et al., 2003, using a continuous insulin
infusion of 3.5 mU/kg/min. The adenoviral injection and the clamp technique
were carried out without knowledge, i.e., blinded of the genotype until all
calculations were completed. Hepatic glucose production was assessed by
subtraction of the glucose infusion rate from whole-body glucose turnover
as measured with D-[3-3H]glucose.
Hepatic De Novo LipogenesisARNT flox/flox and L-ARNT KOmice were injected with 0.5mCi of 3H2O (0.4ml
of 1.25 mCi/ml). The rate of hepatic de novo lipogenesis was determined
by measuring the amount of newly synthesized FA and TG present in the liver
1 hr after the i.p. injection. 3H-labeled fatty acids were isolated by saponifica-
tion of liver samples in KOH. After extraction of nonsaponifiable lipids and
acidification with H2SO4, the3H-labeled fatty acids were extracted with chlo-
roform and separated by thin layer chromatography. The plate was stained
with primulin. The FA and TG spots were scraped off the plate, added to
scintillation fluid, and counted in a liquid scintillation counter. The specific
activity of body water was determined and used to calculate de novo lipogen-
esis as micromoles of 3H2O incorporated into FA/hr/g and TG/hr/g of liver
tissue.
Quantification of Hepatic Malonyl-CoA and TG ContentsLiver tissues were removed from ARNT flox/flox and L-ARNT KO mice and
immediately frozen in liquid nitrogen. Liver was homogenized and deprotei-
nized with 10% perchloric acid, the filtrate was neutralized (Saha et al.,
1997), and malonyl CoA was determined radioenzymatically by a modification
of the method of McGarry (McGarry et al., 1978). For the measurement of
hepatic TG content, 0.1–0.2 g of liver tissue from each mouse was homoge-
nized in 500 ml buffer containing 150 mM NaCl and 10 mM Tris (pH 7.5) and
extracted with 400 ml methanol and 800 ml chloroform. The chloroform layer,
containing TG, was evaporated overnight and resuspended in 70% ethanol;
TG was measured enzymatically and expressed relative to protein content.
StatisticsThe results are expressed as means ± SEM. Significance was established
using the Student’s t test and analysis of variance when appropriate. Differ-
ences were considered significant at p < 0.05. Two-way ANOVA with repeat
measurements was performed to analyze measurements obtained by time
course.
ACCESSION NUMBERS
The NCBI GEO accession number for the microarray data reported in this
paper is GSE15653.
SUPPLEMENTAL DATA
Supplemental Data include Supplemental Experimental Procedures, one
table, and four figures and can be found online at http://www.cell.com/
cell-metabolism/supplemental/S1550-4131(09)00092-8.
ACKNOWLEDGMENTS
This work was supported by the Diabetes Genome Anatomy Project Grants
DK-060837, DK-067509, and PO1HL68758 and the Mary K. Iacocca Profes-
sorship. We acknowledge Doctor Londos for providing advice regarding lipid
droplets, Doctor Daryl K. Granner for his suggestions on hepatic gluconeogen-
esis, and members of the Kahn and Kulkarni labs for their helpful discussions.
The authors declare that they have no competing financial interests.
Received: September 29, 2007
Revised: February 6, 2009
Accepted: April 13, 2009
Published: May 5, 2009
REFERENCES
Assifi, M.M., Suchankova, G., Constant, S., Prentki, M., Saha, A.K., and
Ruderman, N.B. (2005). AMP-activated protein kinase and coordination of
Cell Metabolism
Function of ARNT in Liver
438 Cell Metabolism 9, 428–439, May 6, 2009 ª2009 Elsevier Inc.
hepatic fatty acid metabolism of starved/carbohydrate-refed rats. Am. J.
Physiol. Endocrinol. Metab. 289, E794–E800.
Badman, M.K., Pissios, P., Kennedy, A.R., Koukos, G., Flier, J.S., and
Maratos-Flier, E. (2007). Hepatic fibroblast growth factor 21 is regulated by
PPARalpha and is a key mediator of hepatic lipid metabolism in ketotic states.
Cell Metab. 5, 426–437.
Biddinger,S.B.,Hernandez-Ono,A.,Rask-Madsen,C.,Haas, J.T., Aleman, J.O.,
Suzuki, R., Scapa, E.F., Agarwal, C., Carey, M.C., Stephanopoulos, G., et al.
(2008). Hepatic insulin resistance is sufficient to produce dyslipidemia and
susceptibility to atherosclerosis. Cell Metab. 7, 125–134.
Blazquez, C., Woods, A., de Ceballos, M.L., Carling, D., and Guzman, M.
(1999). The AMP-activated protein kinase is involved in the regulation of ketone
body production by astrocytes. J. Neurochem. 73, 1674–1682.
Cherrington, A.D., Edgerton, D., and Sindelar, D.K. (1998). The direct and
indirect effects of insulin on hepatic glucose production in vivo. Diabetologia
41, 987–996.
Ema,M.,Taya,S.,Yokotani,N.,Sogawa,K.,Matsuda,Y., andFujii-Kuriyama,Y.
(1997). A novel bHLH-PAS factor with close sequence similarity to hypoxia-
inducible factor 1alpha regulates the VEGF expression and is potentially
involved in lung and vascular development. Proc. Natl. Acad. Sci. USA 94,
4273–4278.
Foufelle, F., and Ferre, P. (2002). New perspectives in the regulation of hepatic
glycolytic and lipogenic genes by insulin and glucose: a role for the transcrip-
tion factor sterol regulatory element binding protein-1c. Biochem. J. 366,
377–391.
Gunton, J.E., Kulkarni, R.N., Yim, S., Okada, T., Hawthorne, W.J., Tseng, Y.H.,
Roberson, R.S., Ricordi, C., O’Connell, P.J., Gonzalez, F.J., and Kahn, C.R.
(2005). Loss of ARNT/HIF1betamediates altered gene expression and pancre-
atic-islet dysfunction in human type 2 diabetes. Cell 122, 337–349.
Horton, J.D., Goldstein, J.L., and Brown, M.S. (2002). SREBPs: activators
of the complete program of cholesterol and fatty acid synthesis in the liver.
J. Clin. Invest. 109, 1125–1131.
Inagaki, T., Dutchak, P., Zhao,G., Ding, X., Gautron, L., Parameswara, V., Li, Y.,
Goetz, R., Mohammadi, M., Esser, V., et al. (2007). Endocrine regulation of the
fasting response by PPARalpha-mediated induction of fibroblast growth factor
21. Cell Metab. 5, 415–425.
Jump, D.B., Botolin, D., Wang, Y., Xu, J., Christian, B., and Demeure, O.
(2005). Fatty acid regulation of hepatic gene transcription. J. Nutr. 135,
2503–2506.
Londos, C., Sztalryd, C., Tansey, J.T., and Kimmel, A.R. (2005). Role of PAT
proteins in lipid metabolism. Biochimie 87, 45–49.
McGarry, J.D., Stark, M.J., and Foster, D.W. (1978). Hepatic malonyl-CoA
levels of fed, fasted and diabetic rats asmeasured using a simple radioisotopic
assay. J. Biol. Chem. 253, 8291–8293.
McGarry, J.D., Mills, S.E., Long, C.S., and Foster, D.W. (1983). Observations
on the affinity for carnitine, and malonyl-CoA sensitivity, of carnitine palmitoyl-
transferase I in animal and human tissues. Biochem. J. 214, 21–28.
Michael, M.D., Kulkarni, R.N., Postic, C., Previs, S.F., Shulman, G.I.,
Magnuson, M.A., and Kahn, C.R. (2000). Loss of insulin signaling in hepato-
cytes leads to severe insulin resistance and progressive hepatic dysfunction.
Mol. Cell 6, 87–97.
Musi, N. (2006). AMP-activated protein kinase and type 2 diabetes. Curr. Med.
Chem. 13, 583–589.
Norris, A.W., Chen, L., Fisher, S.J., Szanto, I., Ristow, M., Jozsi, A.C.,
Hirshman, M.F., Rosen, E.D., Goodyear, L.J., Gonzalez, F.J., et al. (2003).
Muscle-specific PPARgamma-deficient mice develop increased adiposity
and insulin resistance but respond to thiazolidinediones. J. Clin. Invest. 112,
608–618.
Onuma, H., Vander Kooi, B.T., Boustead, J.N., Oeser, J.K., and O’Brien, R.M.
(2006). Correlation between FOXO1a (FKHR) and FOXO3a (FKHRL1) binding
and the inhibition of basal glucose-6-phosphatase catalytic subunit gene
transcription by insulin. Mol. Endocrinol. 20, 2831–2847.
Pedersen, T.A., Bereshchenko, O., Garcia-Silva, S., Ermakova, O., Kurz, E.,
Mandrup, S., Porse, B.T., and Nerlov, C. (2007). Distinct C/EBPalpha motifs
regulate lipogenic and gluconeogenic gene expression in vivo. EMBO J. 26,
1081–1093.
Pilkis, S.J., and Granner, D.K. (1992). Molecular physiology of the regulation of
hepatic gluconeogenesis and glycolysis. Annu. Rev. Physiol. 54, 885–909.
Postic, C., Dentin, R., and Girard, J. (2004). Role of the liver in the control of
carbohydrate and lipid homeostasis. Diabetes Metab. 30, 398–408.
Puigserver, P., Rhee, J., Donovan, J., Walkey, C.J., Yoon, J.C., Oriente, F.,
Kitamura, Y., Altomonte, J., Dong, H., Accili, D., and Spiegelman, B.M.
(2003). Insulin-regulated hepatic gluconeogenesis through FOXO1-PGC-
1alpha interaction. Nature 423, 550–555.
Qiao, L., MacLean, P.S., You, H., Schaack, J., and Shao, J. (2006). Knocking
down liver CCAAT/enhancer-binding protein alpha by adenovirus-transduced
silent interfering ribonucleic acid improves hepatic gluconeogenesis and lipid
homeostasis in db/db mice. Endocrinology 147, 3060–3069.
Reisz-Porszasz, S., Probst, M.R., Fukunaga, B.N., and Hankinson, O. (1994).
Identification of functional domains of the aryl hydrocarbon receptor nuclear
translocator protein (ARNT). Mol. Cell. Biol. 14, 6075–6086.
Roesler, W.J., Vandenbark, G.R., and Hanson, R.W. (1989). Identification of
multiple protein binding domains in the promoter-regulatory region of the
phosphoenolpyruvate carboxykinase (GTP) gene. J. Biol. Chem. 264,
9657–9664.
Ruderman, N.B., Park, H., Kaushik, V.K., Dean, D., Constant, S., Prentki, M.,
and Saha, A.K. (2003). AMPK as a metabolic switch in rat muscle, liver and
adipose tissue after exercise. Acta Physiol. Scand. 178, 435–442.
Saha, A.K., Vavvas, D., Kurowski, T.G., Apazidis, A., Witters, L.A., Shafrir, E.,
and Ruderman, N.B. (1997). Malonyl-CoA regulation in skeletal muscle: its link
to cell citrate and the glucose-fatty acid cycle. Am. J. Physiol. 272, E641–E648.
Saltiel, A.R., and Kahn, C.R. (2001). Insulin signalling and the regulation of
glucose and lipid metabolism. Nature 414, 799–806.
Schmoll, D., Wasner, C., Hinds, C.J., Allan, B.B., Walther, R., and Burchell, A.
(1999). Identification of a cAMP response element within the glucose- 6-phos-
phatase hydrolytic subunit gene promoter which is involved in the transcrip-
tional regulation by cAMP and glucocorticoids in H4IIE hepatoma cells.
Biochem. J. 338, 457–463.
Semenza, G.L. (1999). Regulation of mammalian O2 homeostasis by hypoxia-
inducible factor 1. Annu. Rev. Cell Dev. Biol. 15, 551–578.
Sinal, C.J., Tohkin, M., Miyata,M., Ward, J.M., Lambert, G., andGonzalez, F.J.
(2000). Targeted disruption of the nuclear receptor FXR/BAR impairs bile acid
and lipid homeostasis. Cell 102, 731–744.
Tomita, S., Sinal, C.J., Yim, S.H., and Gonzalez, F.J. (2000). Conditional
disruption of the aryl hydrocarbon receptor nuclear translocator (Arnt) gene
leads to loss of target gene induction by the aryl hydrocarbon receptor and
hypoxia-inducible factor 1alpha. Mol. Endocrinol. 14, 1674–1681.
Yoon, J.C.,Puigserver,P.,Chen,G.,Donovan, J.,Wu,Z.,Rhee,J.,Adelmant,G.,
Stafford, J.,Kahn,C.R.,Granner,D.K., et al. (2001).Control of hepaticgluconeo-
genesis through the transcriptional coactivator PGC-1. Nature 413, 131–138.
Cell Metabolism
Function of ARNT in Liver
Cell Metabolism 9, 428–439, May 6, 2009 ª2009 Elsevier Inc. 439
Copyright © 2022 FDOKUMEN