A whole genome Bayesian scan for adaptive genetic divergence in West African cattle
18
BioMed Central Page 1 of 18 (page number not for citation purposes) BMC Genomics Open Access Research article A whole genome Bayesian scan for adaptive genetic divergence in West African cattle Mathieu Gautier* 1 , Laurence Flori 1 , Andrea Riebler 2 , Florence Jaffrézic 1 , Denis Laloé 1 , Ivo Gut 3 , Katayoun Moazami-Goudarzi 1 and Jean- Louis Foulley 1 Address: 1 INRA, UMR de Génétique Animale et Biologie Intégrative, 78350 Jouy-en-Josas, France, 2 University of Zurich, Institute of Social and Preventive Medicine, Zurich, Switzerland and 3 CEA, Centre National de Génotypage, 91057 Evry, France Email: Mathieu Gautier* - [email protected]; Laurence Flori - [email protected]; Andrea Riebler - [email protected]; Florence Jaffrézic - [email protected]; Denis Laloé - [email protected]; Ivo Gut - [email protected]; Katayoun Moazami-Goudarzi - [email protected]; Jean-Louis Foulley - [email protected] * Corresponding author Abstract Background: The recent settlement of cattle in West Africa after several waves of migration from remote centres of domestication has imposed dramatic changes in their environmental conditions, in particular through exposure to new pathogens. West African cattle populations thus represent an appealing model to unravel the genome response to adaptation to tropical conditions. The purpose of this study was to identify footprints of adaptive selection at the whole genome level in a newly collected data set comprising 36,320 SNPs genotyped in 9 West African cattle populations. Results: After a detailed analysis of population structure, we performed a scan for SNP differentiation via a previously proposed Bayesian procedure including extensions to improve the detection of loci under selection. Based on these results we identified 53 genomic regions and 42 strong candidate genes. Their physiological functions were mainly related to immune response (MHC region which was found under strong balancing selection, CD79A, CXCR4, DLK1, RFX3, SEMA4A, TICAM1 and TRIM21), nervous system (NEUROD6, OLFM2, MAGI1, SEMA4A and HTR4) and skin and hair properties (EDNRB, TRSP1 and KRTAP8-1). Conclusion: The main possible underlying selective pressures may be related to climatic conditions but also to the host response to pathogens such as Trypanosoma(sp). Overall, these results might open the way towards the identification of important variants involved in adaptation to tropical conditions and in particular to resistance to tropical infectious diseases. Background Cattle are still playing a major role in Africa for food sup- ply, to generate income and draught power or for ceremo- nial purposes. Archaeological, historical and anthropological evidence combined with recent genetic data [1] have provided insights into the complex origins of present day West-African cattle diversity. Indeed, although their wild ancestor Bos primigenius was not native to sub-Saharan Africa, West African cattle popula- tions are representative of both shorthorn (Bos taurus Published: 21 November 2009 BMC Genomics 2009, 10:550 doi:10.1186/1471-2164-10-550 Received: 29 May 2009 Accepted: 21 November 2009 This article is available from: http://www.biomedcentral.com/1471-2164/10/550 © 2009 Gautier et al; licensee BioMed Central Ltd. This is an Open Access article distributed under the terms of the Creative Commons Attribution License (http://creativecommons.org/licenses/by/2.0 ), which permits unrestricted use, distribution, and reproduction in any medium, provided the original work is properly cited.
Transcript of A whole genome Bayesian scan for adaptive genetic divergence in West African cattle

BioMed CentralBMC Genomics
ss
Open AcceResearch articleA whole genome Bayesian scan for adaptive genetic divergence in West African cattleMathieu Gautier*1, Laurence Flori1, Andrea Riebler2, Florence Jaffrézic1, Denis Laloé1, Ivo Gut3, Katayoun Moazami-Goudarzi1 and Jean-Louis Foulley1Address: 1INRA, UMR de Génétique Animale et Biologie Intégrative, 78350 Jouy-en-Josas, France, 2University of Zurich, Institute of Social and Preventive Medicine, Zurich, Switzerland and 3CEA, Centre National de Génotypage, 91057 Evry, France
Email: Mathieu Gautier* - [email protected]; Laurence Flori - [email protected]; Andrea Riebler - [email protected]; Florence Jaffrézic - [email protected]; Denis Laloé - [email protected]; Ivo Gut - [email protected]; Katayoun Moazami-Goudarzi - [email protected]; Jean-Louis Foulley - [email protected]
* Corresponding author
AbstractBackground: The recent settlement of cattle in West Africa after several waves of migration fromremote centres of domestication has imposed dramatic changes in their environmental conditions,in particular through exposure to new pathogens. West African cattle populations thus representan appealing model to unravel the genome response to adaptation to tropical conditions. Thepurpose of this study was to identify footprints of adaptive selection at the whole genome level ina newly collected data set comprising 36,320 SNPs genotyped in 9 West African cattle populations.
Results: After a detailed analysis of population structure, we performed a scan for SNPdifferentiation via a previously proposed Bayesian procedure including extensions to improve thedetection of loci under selection. Based on these results we identified 53 genomic regions and 42strong candidate genes. Their physiological functions were mainly related to immune response(MHC region which was found under strong balancing selection, CD79A, CXCR4, DLK1, RFX3,SEMA4A, TICAM1 and TRIM21), nervous system (NEUROD6, OLFM2, MAGI1, SEMA4A andHTR4) and skin and hair properties (EDNRB, TRSP1 and KRTAP8-1).
Conclusion: The main possible underlying selective pressures may be related to climaticconditions but also to the host response to pathogens such as Trypanosoma(sp). Overall, theseresults might open the way towards the identification of important variants involved in adaptationto tropical conditions and in particular to resistance to tropical infectious diseases.
BackgroundCattle are still playing a major role in Africa for food sup-ply, to generate income and draught power or for ceremo-nial purposes. Archaeological, historical andanthropological evidence combined with recent genetic
data [1] have provided insights into the complex originsof present day West-African cattle diversity. Indeed,although their wild ancestor Bos primigenius was notnative to sub-Saharan Africa, West African cattle popula-tions are representative of both shorthorn (Bos taurus
Published: 21 November 2009
BMC Genomics 2009, 10:550 doi:10.1186/1471-2164-10-550
Received: 29 May 2009Accepted: 21 November 2009
This article is available from: http://www.biomedcentral.com/1471-2164/10/550
© 2009 Gautier et al; licensee BioMed Central Ltd. This is an Open Access article distributed under the terms of the Creative Commons Attribution License (http://creativecommons.org/licenses/by/2.0), which permits unrestricted use, distribution, and reproduction in any medium, provided the original work is properly cited.
Page 1 of 18(page number not for citation purposes)

BMC Genomics 2009, 10:550 http://www.biomedcentral.com/1471-2164/10/550
brachyceros) and longhorn (Bos taurus longifrons) humplesstaurines, humped zebus (Bos indicus) and zebu/taurinehybrid cattle. This early suggested that West African cattlehas originated from several successive and recent coloni-zation events [2,3]. Briefly, shorthorn taurines were intro-duced from the Middle-East and possibly North Africaaround 4,000 years BP [3,4] while longhorn taurine prob-ably arrived at an earlier period (5,000 years BP) follow-ing different migration routes [3]. Although, zebu cattlefirst penetrated through the Horn of Africa in the late 2nd
millennium BC, the major wave of indicine introgressionreally started with the Arab settlements along the EastCoast of Africa from the end of the 7th century AD. Zebucattle spread even more recently over West Africa withmovements of pastoralist people such as the Fulani [1].
As a consequence of their remote origin, West African cat-tle populations have been subjected in recent times tonew environmental pressures imposing strong adaptiveconstraints [5]. Indeed, tropical climate conditions mighthave affected several traits such as reproduction, grazingbehavior, feed/water intake and utilization, milk produc-tion and growth. For instance, some West African short-
horn cattle which are exposed to very harsh conditionshave been subjected to a marked reduction in size [3]. Inaddition, cattle were exposed to new pathogens in partic-ular parasites. A well described example of newly acquiredadaptation to parasitic disease is the ability, known astrypanotolerance, of taurine cattle to survive, reproduceand remain productive within the tsetse infested sub-trop-ical zone characterized by a high prevalence of trypano-somiasis (Figure 1) [6]. This might have in turn limitedthe introgression in these areas of zebus which aretrypanosusceptible (Figure 1).
West African cattle populations thus represent an appeal-ing model to unravel the genome response to adaptationto tropical conditions. The purpose of this study was toperform a whole genome scan for footprints of adaptiveselection based on a newly collected genotyping data setcontaining 36,320 SNPs genotyped on 9 West African cat-tle populations from different bovine sub-species andagro-ecological areas (Figure 1). In particular, we sampledpopulations on both side of the tsetse infested zone.Based on this large data set, we first carried out a detailedanalysis of the genetic structure of these populations. We
Origin of the West African population samplesFigure 1Origin of the West African population samples. A) N'Dama ND2 samples (n = 17) originated from the Samandeni ranch in Burkina Faso [64]; B) Baoulé (BAO) samples (n = 29) and N'Dama ND1 (n = 14) originated from the Gaoua Ranch in Burkina-Faso [64]; C) and D) Somba (SOM) samples (n = 44) originated from Boukombe (Benin) and Nadoba (Togo) regions [65]; E) Lagune (LAG) samples (n = 44) originated from the Porto Novo region in Benin [65]; F) Borgou (BOR) samples (n = 45) originated from the Parakou district in Benin [65]; G) Sudanese Fulani (ZFU) samples (n = 43) originated from the Malan-ville region in Benin [65]; H) Kuri (KUR) samples (n = 47) were collected in Lake Chad islands [64] and I) Choah zebu (ZCH) samples originated from the Bol district in Chad [64]. The tsetse infested region is colored in green on the map.
Page 2 of 18(page number not for citation purposes)

BMC Genomics 2009, 10:550 http://www.biomedcentral.com/1471-2164/10/550
next performed a scan for differentiation among SNPsunder a full Bayesian framework [7,8] for which we pro-posed additional extensions to improve the detection ofloci under selection. We then annotated regions contain-ing SNPs subjected to selection, adopting a systems biol-ogy approach to highlight the main underlyingphysiological functions.
Results and DiscussionSNP polymorphismIn total, 437 individuals belonging to 12 different cattlepopulations, nine of which originating from West Africa(Figure 1), were genotyped for the BovineSNP50 chipassay containing 54,001 SNPs mainly derived fromsequences available in European cattle breeds [9]. Amongthe autosomal SNPs that passed Quality Control analyses(see Methods), we retained the 36,320 SNPs polymorphic(Minor Allele Frequency or MAF above 0.01) in at leastone West-African taurine and one West African zebu pop-ulations. As expected and shown in Figure S1A (addi-tional file 1), this SNP selection procedure, leadingmainly to the elimination of SNPs from European origin,resulted in a relative increase in calculated heterozygosityfor all but outgroup taurine populations (Aubrac or AUBand Oulmès Zaer or OUL). In addition, as revealed by thedistribution of the MAF for the different populations (Fig-ure S1B in additional file 1), the remaining differences inheterozygosity among populations were mainly explainedby the proportion of SNPs with rare variants (MAF <0.05). In particular, marker polymorphism remainedclearly lower in West African taurine populations (ND1,ND2, LAG, SOM and BAO), the proportion of SNPs witha MAF < 0.05 being the highest (36%) in LAG which alsodisplayed the lowest average heterozygosity (0.118).These observations are in agreement with previous studiesbased on microsatellite markers on the same populations[10] and might essentially be explained by the recentdemographic history of West African taurine cattle charac-terized by a marked isolation associated with a strongeffective population size decrease (e.g. [11]). AlthoughWest African zebus (ZFU and ZCH) and hybrids (BORand KUR) displayed more genetic diversity than West Afri-can taurines in our study (Figure S1 in additional file 1),ZFU, ZCH and ZMA levels of polymorphism were clearlylower than, and BOR and KUR ones similar to the taurineoutgroup (AUB and OUL) ones (Figure S1A in additionalfile 1). Nevertheless, studies based on microsatellite data(e.g. [10]) revealed that heterozygosities of ZCH, ZFU,BOR and KUR were higher than European breeds' ones(AUB) which were themselves similar to ZMA. The lack ofzebu specific sequences in the SNP discovery processmight explain these apparent discrepancies.
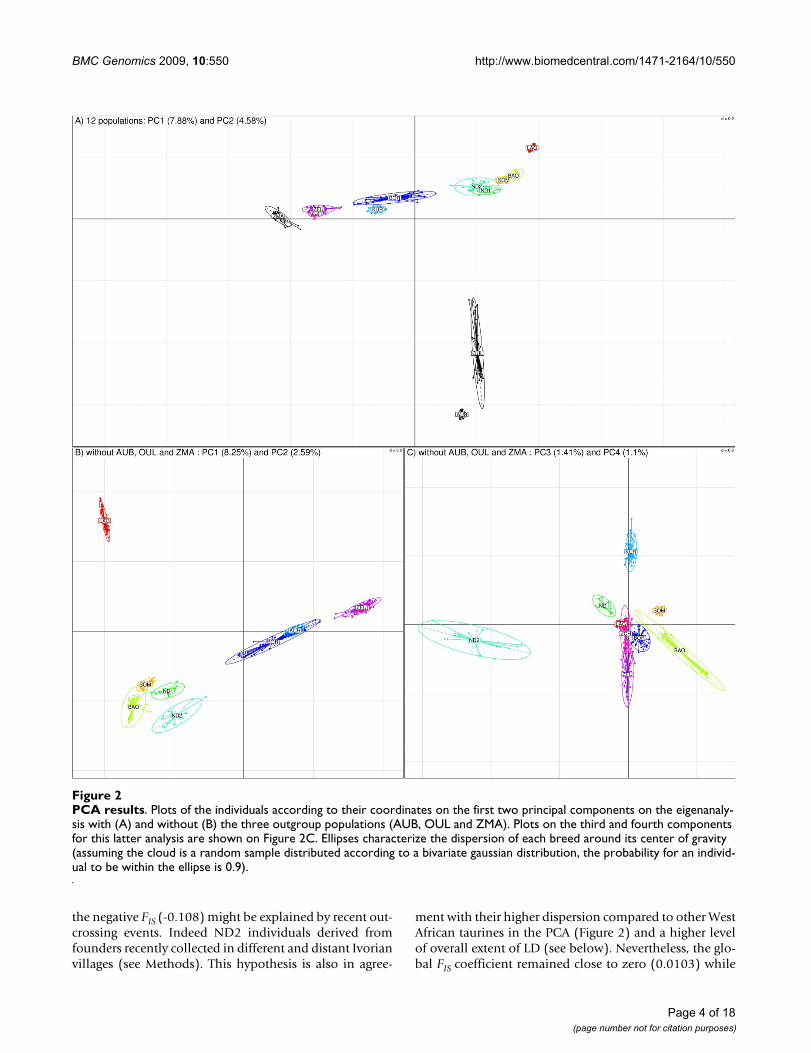
Analysis of Population StructureThe neighbor-joining tree based on Allele Sharing Dis-tances (ASD) [12] allowed us to unambiguously separateindividuals according to their population of origin (FigureS2 in additional file 1). West African individuals branchedin their expected intermediary position relatively to thetaurine (OUL and AUB) and zebu (ZMA) outgroups.Moreover, West African zebus (ZFU and ZCH) were closerto ZMA while West African taurines (LAG, ND1, ND2,BAO and SOM) were closer to OUL and AUB. KUR andBOR individuals branched between West African taurinesand zebus. To go further in the characterization of thepopulation relationships we carried out a principal com-ponent analysis (PCA) [13] based on all available SNPinformation [14]. As shown in Figure 2A and in agree-ment with previous published studies [1,4,15,16], the firstcomponent which accounted for 7.88% of variation sepa-rated West African populations according to a zebu/tau-rine gradient while the second (accounting for 4.58% ofthe total variance) could be associated to an Africa/Europegradient, the North African OUL being closer to the Euro-pean AUB. A similar PCA performed after removing thethree outgroup populations (ZMA, OUL and AUB)allowed to distinguish West African populations accord-ing to the same zebu/taurine gradient on the first axis(which accounted for 8.25% of the total variance). Thesecond and third components (which accounted respec-tively for 2.59% and 1.41% of the total variance) sepa-rated respectively LAG and ND2 from the other WestAfrican taurines (BAO, ND1 and SOM) (Figure 2B). Theposition of ND1 along the third axis suggested a certainlevel of admixture with shorthorn populations, mostprobably of BAO origin, according to their sampling area(Figure 1), although pairwise FST divergence was smallerwhen compared to SOM (Table S1 in additional file 2).Finally, the fourth component (which accounted for1.10% of the total variance) separated both West-Africanhybrids (BOR and KUR) and zebus (ZFU and ZCH) (Fig-ure 2C). Overall, these results demonstrated a clear parti-tion of the West African populations considered. FSTbetween pairs of populations (Table S1 in additional file2) were all found significantly non null (P << 0.00001)and ranged between 0.013 (for ZFU compared to ZCH)and 0.28 (for LAG compared to ZFU).
As reported in Table S1 (additional file 2), within popula-tion FIS were almost null (< 0.006) for ZFU and BOR orvery close to zero (from -0.0121 to 0.0198) for ND1, BAO,KUR and ZCH. The slightly positive FIS (0.0421) observedin SOM might result from the sampling area being apartthe border between Togo and Benin. The positive FIS(0.0414) of similar magnitude observed in LAG mightrather originate from a higher level of inbreeding as sug-gested by the extent of Linkage Disequilibrium (LD)within this population (see below). Conversely, for ND2,
Page 3 of 18(page number not for citation purposes)
BMC Genomics 2009, 10:550 http://www.biomedcentral.com/1471-2164/10/550
the negative FIS (-0.108) might be explained by recent out-crossing events. Indeed ND2 individuals derived fromfounders recently collected in different and distant Ivorianvillages (see Methods). This hypothesis is also in agree-
ment with their higher dispersion compared to other WestAfrican taurines in the PCA (Figure 2) and a higher levelof overall extent of LD (see below). Nevertheless, the glo-bal FIS coefficient remained close to zero (0.0103) while
PCA resultsFigure 2PCA results. Plots of the individuals according to their coordinates on the first two principal components on the eigenanaly-sis with (A) and without (B) the three outgroup populations (AUB, OUL and ZMA). Plots on the third and fourth components for this latter analysis are shown on Figure 2C. Ellipses characterize the dispersion of each breed around its center of gravity (assuming the cloud is a random sample distributed according to a bivariate gaussian distribution, the probability for an individ-ual to be within the ellipse is 0.9).
Page 4 of 18(page number not for citation purposes)

BMC Genomics 2009, 10:550 http://www.biomedcentral.com/1471-2164/10/550
the global FST and FIT were respectively equal to 0.132 and0.141. Such a level of differentiation among the West Afri-can populations was in agreement with the one computedbased on microsatellite markers [10] suggesting a lowimpact of the SNP ascertainment procedure on these esti-mates.
Bayesian scan for differentiation among SNPsWe further studied the differentiation among SNPs andpopulations based on a Bayesian hierarchical modelderived from [7] and presented in more details in theMethods section. Among the factors influencing popula-tion differences in allele counts (differentiation), themodel aims at distinguishing locus-specific from popula-tion-specific factors, such as migration or drift [17].Because most SNPs originated prior to breed differentia-tion, the effect of different mutation rates across locimight be negligible and the SNP-specific effect in themodel is mainly related to selection. Notice that themodel assumed the FIS to be null within each populationwhich appeared sound given the characteristics of ourdata (see Figure S3 in additional file 1 and Methods). Wealso ignored ascertainment biases originating both fromthe SNP discovery process and our selection of SNPs"informative" in West African populations. These two dif-ferent sources are expected to favour polymorphic SNPs ofancient origin (co-segregating in European and Africancattle breeds) and thus modifies to some extent the distri-bution of allele frequencies in the gene pool (x followingour model notations) [18]. Recently, efficient algorithmswere proposed to account for ascertainment biases [19],providing it can be modelled (which is difficult in our caseat least for the first identified source). Nevertheless, for thepurpose of this study we were mainly concerned with pos-sible biases introduced in the locus-specific effect estima-tion which might not be of importance [18]. At least forour second source of ascertainment bias, simulated dataallowed to confirm this statement (Figure S4 in additionalfile 1) since estimation of x was found robust to departurefrom the prior distribution assumed. Similarly, althoughmore variable, locus-specific effect estimates were highlycorrelated with their corresponding simulated values (r >0.8).
To identify loci subjected to selection we thus focused onthe posterior estimates of the SNP effect and evaluated thesignificance of its departure to the null value (expectedunder the neutral hypothesis). In Figure 3, we plotted theposterior SNP specific FST estimate against its Bayes Factor(BF) expressed in deciban units (dB). BF compare modelswith and without the locus effect in terms of posterior toprior odds ratios, thus providing a basis for a decision ruleto identify SNPs under selection (see Methods). The mean(standard deviation) of the posterior distribution for theproportion P of SNPs under selection (computed as the
average over loci of the indicator variable δi associated tothe SNP effect in the hierarchical model) was equal to0.186 (2.7 × 10⁻³). Analyses of four simulated data sets(with respectively 0.1%, 1%, 10% and 18.6% of the SNPsunder selection) revealed that such estimates wereextremely robust to the prior distribution of P (Figure S5in additional file 1). The high proportion of SNPs underselection confirmed that selection had a non negligiblerole in the differentiation of these populations.
To provide insights into the decision rule criterion (interms of BF threshold) to declare SNPs as subjected toselection, we subsequently investigated the power and therobustness of the model using simulated data (see Meth-ods). For each of the four previously mentioned simulateddata sets, we estimated False Discovery Rates (FDR) andFalse Negative Rate (FNR) (Table 1). Application of theJeffreys' rule (see Methods) proved efficient since the FDR,although slightly increasing with the simulated P, wasalways less than 0.5% when considering a threshold of 20on BF (i.e. decisive evidence). However, for such stringenta threshold, the FNR was very high across the four simu-lated data sets (>80%), a detailed inspection (Table S2 inadditional file 2) showing that most non discovered SNPswere those with the smallest simulated effects (αi follow-ing our notations). More precisely, for SNPs under posi-tive selection, the FNR was less than 30% (<10%) when αi
Plot of the estimate of the locus FST against Bayes FactorFigure 3Plot of the estimate of the locus FST against Bayes Factor. The three dashed lines represent the 15, 20 and 25 BF threshold.
Page 5 of 18(page number not for citation purposes)

BMC Genomics 2009, 10:550 http://www.biomedcentral.com/1471-2164/10/550
>2 (αi >4) while above 98% when αi <1. In addition, asexpected from previous studies [7,8,20] and from ouroverall relatively low level of differentiation, the modelwas less powerful to detect SNPs under balancing selec-tion. The observed FNR remained high even for very large(in absolute value) αi (FNR>60% when αi <-4). Decreas-ing the threshold to a less stringent value such as 15 ("verystrong evidence" according to Jeffreys' rule) reduced sub-stantially the FNR (FNR<31% when αi<-4 and FNR<51%when αi <-2) and increased only slightly the FDR. To illus-trate how these values of αi can be related to a coefficientof selection s we finally performed simulations under aWright-Fisher island model with selection for various sand types of selection [20]. For SNPs under positive selec-
tion, αi >2 was achieved for loci with s >0.05 (under adominant model) while for SNPs under balancing selec-tion αi remained low even for large s (αi = -1.40 for s = 0.5)(Table 2). This confirmed that given our overall level ofdifferentiation, the approach is expected to be powerfulfor positively selected SNPs with moderate to high effectbut might lack some power even for those under high bal-ancing selection.
A Genome map of regions under adaptive differentiationWhole genome maps of adaptively differentiated loci inWest African populations are given in Figure 4 for four dif-ferent thresholds on BF value. In total, 2,054 (5.7%),1,119 (3.1%), 619 (1.7%) and 375 (1.0%) of the 36,320
Table 1: FDR (FNR) for different thresholds on BF.
BF threshold (in dB units) P = 0.1% P = 1% P = 10% P = 18.5%
0 1.40 (70.0) 2.98 (56) 14.0 (37.9) 28.5 (27.6)5 0.477 (78.0) 1.07 (66.2) 4.75 (50.1) 8.84 (44.4)10 0.166 (84.0) 0.364 (75.4) 1.71 (61.1) 3.23 (55.7)15 0.0501 (88.0) 0.158 (82.6) 0.653 (71.3) 1.23 (66.1)20 0.0180 (88.0) 0.0788 (86.2) 0.231 (79.9) 0.418 (76.2)25 0.0120 (88.0) 0.0384 (87.8) 0.100 (84.3) 0.172 (82.1)30 0.0120 (88.0) 0.0242 (88.4) 0.0578 (86.9) 0.0934 (85.4)35 0.0120 (90.0) 0.0242 (89.4) 0.0400 (88.7) 0.0369 (87.3)40 0.00 (100) 0.0182 (89.6) 0.0333 (89.5) 0.0197 (88.1)45 0.00 (100) 0.0141 (90.0) 0.0333 (89.8) 0.0172 (88.5)50 0.00 (100) 0.0141 (90.0) 0.0311 (89.9) 0.0172 (88.7)
Results are presented for four simulated data sets with a varying proportion P of loci under selection.
Table 2: Relationship between selection coefficient (s) and locus effect αi
Simulated s Number of loci simulated Average FST (sd) FST range (median) αi
0 4663 0.128 (0.06) 0.007-0.479 (0.121) 00.0025 395 0.173 (0.085) 0.019-0.479 (0.166) 0.3550.005 371 0.189 (0.105) 0.012-0.646 (0.171) 0.4650.0075 362 0.21 (0.108) 0.025-0.56 (0.196) 0.5940.01 343 0.223 (0.113) 0.024-0.585 (0.211) 0.6710.02 287 0.327 (0.152) 0.019-0.729 (0.348) 1.1990.03 270 0.439 (0.183) 0.041-0.748 (0.489) 1.6730.04 258 0.509 (0.194) 0.068-0.841 (0.572) 1.9540.05 276 0.527 (0.199) 0.026-0.838 (0.588) 2.0290.075 252 0.57 (0.242) 0.018-0.887 (0.677) 2.1990.1 247 0.649 (0.227) 0.068-0.925 (0.728) 2.5340.5 192 0.71 (0.239) 0.04-0.972 (0.801) 2.8160.0025 486 0.12 (0.052) 0.006-0.339 (0.113) -0.0710.005 498 0.11 (0.049) 0.017-0.305 (0.104) -0.1670.0075 500 0.104 (0.047) 0.014-0.269 (0.096) -0.240.01 500 0.091 (0.044) 0.002-0.267 (0.086) -0.3830.02 500 0.07 (0.039) 0.005-0.286 (0.061) -0.6690.03 500 0.056 (0.036) 0.006-0.238 (0.048) -0.9070.04 500 0.051 (0.037) 0.002-0.177 (0.043) -1.0050.05 500 0.05 (0.034) 0.004-0.203 (0.042) -1.020.075 500 0.041 (0.033) 0.001-0.19 (0.031) -1.2260.1 500 0.04 (0.034) 0.001-0.22 (0.029) -1.2630.5 500 0.035 (0.034) 0-0.187 (0.027) -1.403
Page 6 of 18(page number not for citation purposes)

BMC Genomics 2009, 10:550 http://www.biomedcentral.com/1471-2164/10/550
SNPs displayed a BF above 15, 20, 25 and 30 respectively(Table S3 in additional file 2). As expected (see above)most of the SNPs displaying high evidence of selectionwere highly differentiated suggesting they were subjectedto positive selection (Figures 3 and 4). More precisely,among the SNPs with a BF value above 15, 537 were
under balancing selection with a FST < 0.011 while 1517were clearly under positive selection with a FST > 0.28. Ata more stringent threshold on BF of 30, 3 SNPs remainedunder balancing selection (FST < 0.0013) and 372 underpositive selection (FST > 0.33). Interestingly, the wholegenome distribution of SNPs declared under selection
Genome position of the locus declared under selectionFigure 4Genome position of the locus declared under selection. For each BF thresholds, the color indicates whether the SNP is neutral (grey), under positive selection (red) or balancing selection (blue). The type of selection (balancing or positive) is deduced from the SNP FST value (< 0.1 or > 0.1).
Page 7 of 18(page number not for citation purposes)
BMC Genomics 2009, 10:550 http://www.biomedcentral.com/1471-2164/10/550
appeared less uniform as the threshold on BF increased(Figure 4). This might be explained by the effect of selec-tion which tends to increase LD between markers [21].Yet, we did not include in the model any spatial structure,which may take into account the LD among SNPs, asrecently proposed ().().(.)[22]. Within the different WestAfrican populations and at the distance of 70 kb corre-sponding to our average marker spacing (Figure S6 inadditional file 1 and Methods), r2 was close to the asymp-totic value (<0.1 in all populations except ND2) (FigureS7 in additional file 1) which is related to the currenteffective population size [23]. As a result, the level of asso-ciation between most SNP pairs was expected to be of sim-ilar magnitude to the one between unlinked markers asillustrated by the correlations of the estimated FST and BFbetween pairs of SNPs which quickly dropped towards 0as they were more distantly related (Table S4 in additionalfile 2).
As an attempt to identify those genomic regions withunexpectedly high proportions of selected SNPs, wesmoothed individual SNP BF values over each chromo-some (see Methods). This empirical, non parametricapproach can efficiently combine information from sev-eral neighboring SNPs and allows the identification of sig-nificantly differentiated regions. This strategy mightprovide in turn a first empirical attempt to correct for falsepositives as expected when a hierarchical structure existsamong populations under study i.e. when some popula-tions share a recent ancestry or there are barriers to geneflow between some of them [24]. As shown in Figure 5and Table 3, 53 significant regions were identified at the5% local FDR (q-value) threshold. In agreement withstrong hitchhiking effects, these regions together con-tained 49.9% of the SNPs with a BF larger than 30 and24.9% of the SNPs with a BF larger than 15. In addition,most of these SNPs were subjected to positive selection(FST > 0.1) although a notable exception is represented bythe region on the middle of BTA23 which was exclusivelycomposed of SNPs under balancing selection. Interest-ingly, this region contains BoLA, the bovine Major Histo-compatibility Complex (MHC) for which balancingselection has already been extensively reported in otherspecies [25,26] and also in other cattle populations [15].To a lesser extent, a few other regions, such as the oneslocalized on the centromeric part of BTA01, the telomericpart of BTA06 and the middle of BTA22 (Figure 5) con-tained a high proportion of SNPs under balancing selec-tion. This might be related to the maintenance of severalhaplotypes containing variants under positive selectionwithin different populations. Alternatively, the fixation ofthe same variant in some populations could also lead tosuch a trend because of the low level of LD across popula-tions [11].
Functional annotation of regions under selectionThe 36,320 SNPs were representative of about 7,177 dif-ferent genes corresponding to approximately one third ofthe total number expected in the genome. For each ofthese, Table S5 (additional file 2) summarizes the numberof SNPs they contained and results from the differentia-tion analysis. Individual SNP information made it never-theless difficult to propose a list of genes subjected toselection and this strategy might be more sensitive to pos-sible false positives introduced by hierarchical structureamong the populations under study [24]. Alternatively, agreat proportion of such genes could include SNPsappearing as significantly differentiated as a result ofhitchhiking with a favourable variant located nearby (seeabove). Hence, among the 191 (853) genes containing orclose to at least one SNP with a BF > 30 (BF > 15), 103(237) mapped within one of the 53 regions identifiedabove. For functional and network analyses, we thusdecided to mainly concentrate on the 42 genes whichwere located for 25 of them (represented in Table S5 inadditional file 2), under the peak of each region, or for theremaining 17 less than 50 kb from the peak of each region(Table 3) (and not represented by any of the 36,320 SNPssurveyed). These 42 genes were viewed as the strongestcandidates underlying the observed footprints of selec-tion. Among these, 37 genes were eligible for networkanalysis, 29 being also eligible for functional analysis. Thefive remaining ones (CCDC46, CTXN3, KRTAP8-1,RNF180, TEKT3) were not eligible for any network orfunctional analyses.
Four significant networks namely N1, N2, N3 and N4(Table S6 in additional file 2) were identified. Three ofthem (N1, N2 and N4) were interconnected and furthermerged into a single network (N). Networks N and N3 arerepresented in Figure 6 and their functional annotationsdetailed in Table S7 (additional file 2). The main hubs ofN corresponded to genes encoding cytokines (CSF2,IFNG, IL4, IL13, IL6, TGFB1 and TNF) and protein kinases(Akt and Erk). Network N contained 22 of our candidategenes (ALK, ANTXR2, CAC3, CCDC71, CD79A, CXCR4,DLK1, DYRK2, EDNRB, HTR4, MAGI1, MATR3, MINK1,MYL2, PADI4, RFX3, RNF220, SEMA4A, SRCAP, TICAM1,TRIM21 and TRPS1), some of them being involved ininnate and adaptive immune response (Figure 6A, TableS7 in additional file 2). Network N3 contained moleculesmainly involved in cancer, cellular function and mainte-nance, and neurological disease, and among them ninecandidate genes (CDC16, DIS3L2, FTSJ3, NEUROD6,OLFM2, PDE1B, RBMS2, RPL3A and SNRPG). Six othercandidate genes (AMZ1, BSFP2, CLDN9, EPDR1, ERGIC1and KIAA0391) were eligible for network analysis butwere included neither in N nor N3. Overall, the functionalannotation suggested that the three main physiologicalfunctions targeted by selection in the breeds we studied
Page 8 of 18(page number not for citation purposes)

BMC Genomics 2009, 10:550 http://www.biomedcentral.com/1471-2164/10/550
Page 9 of 18(page number not for citation purposes)
Table 3: Regions under selection identified at the 5% local FDR (q-value) thresholds.
Interval BTA
Position (size) in Mb Peak Position in Mb BF value of the SNP at the peak position (q-value of the smoothed signal)
Gene at or close to the peak
1 1 3.654-12.74 (9.087) 3.923 50 (0.0467) KRTAP8-1 (3.888-3.888)2 1 133.1-138.6 (5.465) 138.1 51 (0.0345) BFSP2 (138.1-138.2)3 2 0.035-2.687 (2.652) 0.035 51 (0.0001) NA4 2 64.04-67.28 (3.235) 64.25 31 (0.0258) CXCR4 (64.22-64.22)5 2 71.48-78.32 (6.84) 73.84 51 (0.0001) SNRPG (73.75-73.75)6 2 117.7-129.0 (11.35) 124.1 45 (0.0007) DIS3L2 (123.844-124.15)7 2 140.0-140.6 (0.662) 140.0 25 (0.0473) PADI4 (139.9-139.9)8 3 12.39-19.72 (7.325) 15.96 51 (0.0007) SEMA4A (15.94-15.96)9 3 107.9-110.1 (2.219) 108.3 37 (0.0246) RNF220 (108.2-108.3)10 4 24.74-29.70 (4.953) 25.47 38 (0.0002) NA11 4 32.31-37.17 (4.860) 35.71 36 (0.0009) NA12 4 46.84-54.10 (7.259) 51.86 26 (0.0017) EPDR1 (51.77-51.81)13 4 66.29-75.27 (8.977) 67.67 50 (0.0065) NEUROD6 (67.70-67.70)14 5 15.625-16.745 (1.121) 16.15 26 (0.0342) NA15 5 26.81-31.05 (4.245) 28.37 51 (0.0001) PDE1B (28.34-28.39)16 5 47.89-54.39 (6.505) 49.93 51 (0.0004) DYRK2 (49.89-49.90)17 5 58.82-65.26 (6.44) 61.43 47 (0.0001) RBMS2 (61.40-61.46)18 6 89.36-105.4 (16.05) 98.15 51 (0.0011) ANTXR2 (98.00-98.24)19 7 11.59-13.35 (1.753) 12.98 25 (0.0176) OLFM2 (12.90-12.99)20 7 17.02-18.86 (1.846) 17.90 51 (0.0001) TICAM1 (17.90-17.90)21 7 23.53-25.51 (1.987) 25.24 24 (0.0036) CTXN3 (25.23-25.24)22 7 34.96-38.66 (3.703) 36.52 28 (0.0001) NA23 7 46.17-54.47 (8.296) 49.91 51 (0.0001) MATR3 (49.89-49.93)24 7 58.19-61.94 (3.745) 59.43 51 (0.0001) HTR4 (59.31-59.50)25 7 65.23-67.12 (1.897) 66.43 28 (0.0005) RPL35A (66.46-66.46)26 8 41.46-49.56 (8.100) 43.54 51 (0.0011) RFX3 (43.24-43.56)27 11 36.82-41.39 (4.565) 41.08 33 (0.0346) NA28 11 69.22-77.83 (8.614) 72.17 38 (0.0126) ALK (71.89-72.63)29 12 20.68-32.60 (11.93) 23.08 51 (0.0009) NA30 12 51.02-54.06 (3.033) 53.56 40 (0.0265) EDNRB (53.54-53.57)31 12 85.24-85.28 (0.034) 85.24 37 (0.0498) CDC16 (85.23-85.25)32 14 9.072-13.53 (4.461) 11.38 50 (0.0017) NA33 14 33.32-36.43 (3.108) 34.44 38 (0.0022) NA34 14 40.36-46.85 (6.481) 46.08 35 (0.007) TRPS1 (46.06-46.34)35 15 48.98-50.50 (1.522) 50.01 8 (0.0451) TRIM21 (50.07-50.08)36 18 9.24-12.36 (3.119) 12.17 32 (0.0457) CLDN9 (12.17-12.17)37 18 49.99-54.41 (4.412) 51.08 41 (0.0128) CD79A (51.08-51.08)38 19 25.14-29.43 (4.283) 26.87 51 (0.0001) MINK1 (26.86-26.91)39 19 32.87-35.72 (2.857) 33.74 51 (0.0008) TEKT3 (33.71-33.74)40 19 40.02-41.82 (1.798) 41.72 51 (0.0401) CASC3 (41.70-41.72)41 19 44.62-54.41 (9.792) 49.62 51 (0.0001) FTSJ3 (49.61-49.62)42 19 63.36-64.95 (1.594) 64.26 51 (0.0051) CCDC46 (64.16-64.31)43 20 4.040-6.339 (2.299) 4.745 47 (0.0008) ERGIC1 (4.632-4.745)44 20 13.97-18.06 (4.093) 16.50 37 (0.0016) RNF180 (16.31-16.56)45 21 45.09-50.35 (5.261) 46.29 51 (0.0174) KIAA0391 (46.20-46.33)46 21 65.61-66.89 (1.279) 65.74 30 (0.0324) DLK1 (65.72-65.72)47 22 32.32-38.56 (6.235) 36.54 47 (0.0137) MAGI1 (36.14-36.79)48 22 43.79-53.04 (9.249) 51.81 34 (0.0451) CCDC71 (51.80-51.80)49 23 25.59-30.12 (4.529) 29.06 27 (0.0235) NA50 24 52.78-57.25 (4.466) 55.71 51 (0.0255) NA51 25 27.73-30.38 (2.653) 28.70 51 (0.0102) SRCAP (28.67-28.70)52 25 36.33-38.47 (2.142) 37.28 37 (0.0013) MYL2 (37.32-37.33)53 25 41.40-42.52 (1.115) 42.52 50 (0.0278) AMZ1 (42.51-42.53)

BMC Genomics 2009, 10:550 http://www.biomedcentral.com/1471-2164/10/550
were related to i) immune response, ii) nervous systemand iii) skin and hair development which we discuss inthe following.
Immune response genes under selectionSeveral candidate genes (such as CD79A, CXCR4, DLK1,RFX3, SEMA4A, TICAM1 and TRIM21) belonging to Ndirectly participate in antigen recognition, a key processunderlying the development of immune response. For
Whole genome map of regions under selection at the 5% local FDR (q-value) thresholdFigure 5Whole genome map of regions under selection at the 5% local FDR (q-value) threshold. For each of the 29 bovine autosomes, the smoothed BF is plotted against the chromosomal position (green line). For significant positions, non smoothed SNP BF are indicated by a black star. At the corresponding positions, a red (blue) bar is represented on the top of each graph if the SNP was under positive (balancing) selection i.e. displayed a (non smoothed) BF > 15 and a FST > 0.1 (FST < 0.1).
Page 10 of 18(page number not for citation purposes)

BMC Genomics 2009, 10:550 http://www.biomedcentral.com/1471-2164/10/550
instance, TRIM21, a newly identified type of IgG Fc recep-tors [27] participates to both the host anti-viral responsethrough the modulation of IRF3 functions [28] and medi-ation of autoimmune diseases. Footprints of selectionwere recently reported in primates within another mem-ber of the same tripartite motif (TRIM) family of proteinswhich has antiretroviral properties [29,30]. TICAM1 is aToll like receptor (TLR) adapter and thus plays a role ininnate immunity. It possesses, in particular, a high IFNtype I inducing activity during viral infection [31]. DLK1,a member of the epidermal growth factor-like gene family,has been shown in mouse to be involved in B lym-phocytes differentiation and function [32]. More specifi-cally, other genes (such as CD79A, CXCR4, RFX3 andSEMA4A) are related to antigen presentation to T cells inthe context of MHC. Although no MHC genes werepresent in the list analyzed, the corresponding region(#49 in Table 3) and a SNP (with BF = 17 and FST = 0.005)within the bovine HLA-DMB ortholog (Table S4 in addi-tional file 2) were found under strong balancing selection.Among the molecules participating to antigen presenta-tion, the chemokine receptor CXCR4 is co-recruited withCCR5 in the immunological synapse, and it participatesto modulation of T cells response [33]. These two mole-cules were shown to act as co-receptors for HIV entry inhuman cells [34]. A strong signature of balancing selec-tion was reported in the 5' cis-regulatory region of CCR5in human [35], this region displaying as well a selectivesweep in chimpanzee [36]. We also recently observed a
significant signal of selection on a microsatellite locatedless than 1 Mb from CXCR4 in West African taurine [10]and defining the boundary of a QTL underlying the trypa-notolerance trait in cattle [37]. Similarly, RFX3 (43.235-43.563 Mb on BTA08) is located within another QTLidentified in this latter study [37]. This member of the reg-ulatory factor X (RFX) gene family participates with CIITAin the regulation of MHC genes [38-40]. CD79A viaCD79α-CD79β heterodimer located on the surface of Bcells is required for antigen presentation through MHCclass II [41]. SEMA4A a semaphorin expressed on den-dritic cells and B cells is involved in T cell priming and Th1differentiation through its interaction with Tim2expressed on T cells [42].
Although heat stress response may have imposed immu-nological parameter modifications [5], infectious and par-asitical diseases are likely to have represented selectivepressures acting on genes involved in such functions [43].As previously mentioned, trypanosomiasis represents oneof the well known examples of such selective pressure.Nevertheless, the importance of other diseases such astick-borne diseases (anaplasmosis, babesiosis, cowdrio-sis) or anthrax should not be overlooked. For instance,anthrax is hyperendemic (especially in Chad, Togo andIvory Coast) or endemic in West Africa http://www.vetmed.lsu.edu/whocc/mp_world.htm. Notice that theANTRXR2, a receptor of the anthrax toxin was among ourcandidate genes (see network N, Figure 6).
Representation of the N (A) and N3 (B) gene networksFigure 6Representation of the N (A) and N3 (B) gene networks. Symbols corresponding to candidate genes are colored in red.
Page 11 of 18(page number not for citation purposes)
BMC Genomics 2009, 10:550 http://www.biomedcentral.com/1471-2164/10/550
Neural genes under selectionIn addition to the exposure to new pathogens, the recentsettlement of cattle to Sub Saharan Africa might haveimposed a dramatic change in their environmental condi-tions [5]. Hence, cattle (in particular taurine) wereexposed to warmer temperature, to a thermal amplitudedecrease, to a day length change, to differences in solarradiation and also to new feeding conditions. As a result,adaptations needed modifications in global appearance(such as morphology or coat color), in body temperatureregulation, in circadian clock and also in reproductivebehaviour and abilities. Such selective pressures mightpartly explain the physiological functions related to nerv-ous system (neurogenesis and eyesight). Alternatively,neurotropism of several parasites such as Trypanosoma(sp)have been demonstrated at least in human. Some of thecandidate genes related to nervous system developmentand function belonged to N3 (e.g. NEUROD6 andOLFM2) or N (e.g. MAGI1, SEMA4A, HTR4 and EDNRB).NEUROD6 is a member of the neurogenic differentiationtranscription factor family [44] while OLFM2 is a secretedglycoprotein belonging to the noelins family which mod-ulate the timing of neuronal differentiation during devel-opment [45]. Interestingly, MAGI1 is a scaffolding proteinpresent in tight junction of epithelial cells [46], some tran-scripts of the corresponding gene being only expressed inbrain. Moreover it is located within a QTL underlying thetrypanotolerance trait [37]. Besides their role in immuneresponse (see above), semaphorins represented bySEMA4A were initially characterized for their role in theguidance of axonal migration during neuronal develop-ment. Mutations in the conserved semaphorin domain ofSEMA4A are associated with two retinal degenerative dis-eases, retinis pigmentosa and cone-rod dystrophy [47]. Ofmore particular interest is HTR4 which is a serotoninreceptor participating to the serotonergic system.Recently, a mutation within HTR2A, a receptor of thesame family was reported associated with the chronicfatigue syndrome corresponding to a dysregulation ofhypothalamic-pituitary-adrenal (HPA) axis and seroton-ergic system [48]. A reduced responsiveness of the HPAaxis after corticotropin-releasing hormone (CRH) chal-lenge was observed in Boran cattle infected with Trypano-soma congolense [49]. Taken together, a possibleinvolvement of HTR4 in trypanotolerance/susceptibilityin cattle might be hypothesized though we cannot excludean implication of this serotonin receptor in more generalaspects of circadian rythmicity [50].
Genes under selection involved in skin and hair propertiesAlthough EDNRB plays an essential role in the develop-ment of enteric neurons, it is also involved in the develop-ment of epidermal melanocytes, both cell lineages beingderived from the neural crest [51]. As an illustration, sev-eral EDNRB mutations are associated with an auditory
pigmentary syndrome caused by the absence of melano-cytes [52]. However, given the variety of cattle popula-tions surveyed (Figure 1), the footprint of selectionobserved in the EDNRB region is more likely related todifferences in coat color and more particularly to the spot-ting pattern (SOM, BAO and LAG) or the white color(KUR and ZFU). Indeed, EDNRB is also referred to as pie-bald or S locus in mouse [53] and a null mutation inducea white coat color in rat [51]. In the Hereford cattle breed,although not yet fully characterized, locus S seems respon-sible for white spotting pattern [53]. In addition toEDNRB involved in skin and hair pigmentation, othergenes such as TRSP1 which belonged to N and KRTAP8-1which was not eligible for network analysis play a role inhair development in human and mouse. Indeed, TRPS1 isa zinc finger transcription factor implicated in growth andtrichosis, some of its variants being associated with tri-chorhinophalangeal syndromes [54,55]. It is down-regu-lated in patients affected by hypertrichosis and in a mousemodel of hypertrichosis [56]. KRTAP8-1, a keratin associ-ated protein, plays a role in the formation of hair shafts[57].
The skin color and thickness, the hair size and sleeknessand the number of sweat glands directly influencethermo-resistance of cattle living in the tropics [5]. Com-pared to European taurine breeds, zebus which have ahigher density of sweat glands and a smoother and shinierhair coat were reported to better regulate body tempera-ture and more efficiently maintain cellular function dur-ing heat stress [58]. Similarly, slick-haired Holstein cattleare more able to regulate their body temperature thanwild-type [59]. Some skin and hair properties might alsoconfer higher resistance to tick infestation [60,61]. Inter-estingly, some genes involved in hair development alsoparticipate in cornification. Hence the observed footprintof selection within the cluster of keratin associated pro-teins (represented in the candidate genes list by KRTPA8-1, the closest to the peak) might thus also be related tohorn morphology differences [62]. A striking example isthe floating horns of KUR which could represent originaladaptation facilitating swimming in their swamp livingarea [3]. Note that the identified region is also localizedless than 5 Mb from the bovine polled locus [63]
ConclusionWest African cattle provide a valuable resource to betterunderstand the genomic response to selective pressurearising in tropical conditions. This large-scale wholegenome Bayesian scan for adaptive differentiation in pop-ulations representative of the current breed diversityallowed us to identify candidate genes involved in severalkey physiological functions. These results might open theway towards the identification of variants underlyingthese footprints of selection, in particular those involved
Page 12 of 18(page number not for citation purposes)

BMC Genomics 2009, 10:550 http://www.biomedcentral.com/1471-2164/10/550
in the resistance to tropical infectious diseases in cattle butalso in other mammals such as human populations sub-jected to similar pressures.
MethodsAnimal MaterialFigure 1 provides information on the origin of the ninedifferent West African populations sampled in our studyand representatives of the three main types of cattle foundin this area. Longhorn taurines were represented byN'Dama individuals from two distinct origins (ND1 andND2). ND1 individuals (n = 14) originated from theGaoua herd constituted by acquisitions coming from dif-ferent villages in the Pays Lobi (Burkina Faso). ND2 (n =17) samples were collected in the Samandeni herd(Burkina Faso) which was constituted in the early eightiesby acquisitions from the Marahoue ranch (Ivory Coast)and originated from northwestern villages from IvoryCoast where zebu had not been introduced [64]. Short-horn taurines were represented by three different breeds:Baoulé (BAO) samples (n = 29) originated, as ND1, fromthe Gaoua herd [64], Somba (SOM) individuals (n = 44)were sampled in the breed birthplace across the bordernear Nadoba (Togo) and Boukoumbe (Benin), andLagune (LAG) individuals (n = 44) were sampled in thePorto Novo district (Benin) [65]. West African zebus wererepresented by two populations: Sudanese Fulani or ZFU(n = 43) which was sampled in the Malanville region inBenin [65] and Choah zebus or ZCH (n = 59) which wassampled in the Bol district (Chad) [64]. This latter popu-lation was initially sub-divided into two breeds (M'Bororoand Choah Zebus), however, as previously shown [10]and confirmed in our analysis with a dense marker set, noclear differentiation appeared among these. Finally, twohybrid populations were considered: Borgou or BOR (n =45) which is a stabilized crossbred between shorthorntaurines (LAG or BAO) and was sampled in its region oforigin around Parakou in Benin [65] and Kuri or KUR (n= 47) which was sampled from different islands of LakeChad around Bol [64]. This latter breed was sometimesreferred to as a particular longhorn taurine [3], however,several molecular analyses showed a high level of Zebuadmixture in it [4,10]. Moreover, unlike West African tau-rines, KUR is known to be trypano-susceptible. Threeother breeds were considered as outgroups for the detailedgenetic structure analysis: ZMA (n = 35) sampled in theMadagascar Island [66] and representing pure zebu [1],AUB (n = 20) sampled in the birthplace of the breed [67]and representing European taurine, and OUL (n = 40)sampled in the North of Morocco to represent North Afri-can taurine cattle.
Genotyping dataIndividuals were genotyped on the IlluminaBovineSNP50 chip assay [9] at the Centre National de
Génotypage (CNG) platform (Evry, France) using stand-ard procedures http://www.illumina.com. Among the54,001 SNPs included in the chip, only the 51,581 map-ping to a bovine autosome on the latest bovine genomeassembly Btau_4.0 [68] were retained for further analysis.To limit ascertainment bias favouring SNPs from Euro-pean origin, we subsequently discarded 13,786 SNPs(~25%) which were not polymorphic (MAF > 0.01) in atleast one West African taurine (ND1, ND2, LAG, SOM orBAO) and one West African zebu (ZCH or ZFU). Amongthe remaining ones, 1,422 SNPs which were genotyped onless than 85% of the individuals from at least one of thenine West African breeds, were also eliminated. An exacttest for Hardy-Weinberg Equilibrium (HWE) [69] wassubsequently carried out within each breed separately.Based on the obtained p-values, q-values [70] were esti-mated for each SNP using the R package qvalue http://cran.r-project.org/web/packages/qvalue/index.html. Fiftythree SNPs with a q-value < 0.01 in at least one breed werethen discarded from further analysis. In total, 36,320SNPs were finally considered for the study leading to anaverage marker density of 1 SNP every 70 kb over thegenome (Table S8 in additional file 2). Moreover, asshown in Figure S6 (additional file 1) and detailed inTable S8 (additional file 2), the genome coverage washomogeneous with a median distance between consecu-tive SNPs equal to 47.54 kb. Few large gaps between SNPswere present since the 95th (99th) percentile of this dis-tance was 189 kb (385 kb), the largest gap localized onBTA10 being 2 Mb long. Conversely, less than 0.5% of thedistances between successive SNPs were shorter than 20kb. Genotyping data are given in additional file 3.
Analysis of Population Structure and characterization of the extent of LDASD were computed for each pair of individuals using allavailable SNP information by a simple counting algo-rithm: for a given pair of individuals i and j, ASD wasdefined as 1-xij where xij represents the proportion of alle-les alike in state averaged over all genotyped SNPs. Aneighbor-joining tree was computed based on the result-ing distance matrix using the R package APE [71]. We sub-sequently performed a PCA based on all available SNPinformation using the SMARTPCA software package [14].As suggested by Patterson et al. [14], we performed LDcorrection by replacing individual SNP values with theresiduals from a multivariate regression without intercepton the two preceding SNPs on the map, providing theywere less than 200 kb apart. Results were further visual-ized using functionalities available in the R package ade4[72]. The global F-statistics FIT, FST and FIS were estimatedrespectively in the form of F, θ and f [73] using the pro-gram GENEPOP 4.0 [74]. GENEPOP 4.0 was also used toestimate diversity for each locus and population bothwithin individuals and among individuals within a popu-
Page 13 of 18(page number not for citation purposes)

BMC Genomics 2009, 10:550 http://www.biomedcentral.com/1471-2164/10/550
lation. The within breed FIS was derived from the averageof these two quantities over all the SNPs. In order to eval-uate the reliability of the FIS estimates we computed themean and standard deviation over 10,000 samples of5,000 randomly chosen SNPs. FST statistics between pop-ulations were estimated using both SMARTPCA [14] andGENEPOP [74] which are based on two different modelsof population divergence.
In order to characterize the extent of LD, we computed ther2 measure [23] between each marker pair within eachbreed separetely using Haploview 4.1 [75].
Bayesian Model to analyze Differentiation among SNPsIndividual genotyping data were modelled according tothe reparameterized extension, recently proposed by Rie-bler et al. [8], of the initial Bayesian hierarchical modeldeveloped by Beaumont and Balding [7]. Briefly and inthe bi-allelic SNP case, let aij be the observed referenceallele (defined arbitrarily) count in population j = 1, ..., Jat locus i = 1, ..., I. The conditional distribution given thetrue (unobserved) allele frequency pij in that population atthat locus is assumed to be binomial with parameters nij(twice the number of genotyped individuals in popula-tion j at locus i) and pij: aij | pij~Bin(nij, pij) (1). Note that 1)implicitly assumes populations are in HWE or theirrespective inbreeding coefficients (FIS) are null. Non nullFIS could be taken into account in the model by consider-ing instead that the three possible genotypes are drawnfrom a multinomial distribution with parameters corre-sponding to the number of individuals genotyped andgenotype probabilities: (1-FIS
j)pij2 + FIS
jpij; 2(1-FISj)pij(1-pij)
and (1-FISj)(1-pij)2 + FIS
j(1-pij) [18]. Nevertheless, for co-dominant markers such as SNP and given the range of FISvalues in our study (see Results), the binomial distribu-tion seems to be reasonable (Figure S3 in additional file1). The second step assumes that the true allele frequen-cies pij are themselves sampled from a Beta distribution: pij| λij, xi~Beta(λijxi, λij(1-xi)) (2). This distribution relies onan infinite Wright island model involving mutation, driftand migration at its equilibrium state [76,77]. Under thismodel, xi might be interpreted as the frequency of the cho-sen reference allele at locus i in the gene pool from whicheach allele frequency pij is sampled. The scaling parameterλij reflects the gene flow from the gene pool to populationj. Under Wright's model, this parameter is specific to eachpopulation j but remains homogeneous over loci so thatany departure from that property may indicate that locusi is no longer neutral. Note that under the Beta distribu-tion, the first two moments can be simply expressed asE(pij) = xiand Var(pij) = xi(1-xi)(1+λij)-1. Actually (1+λij)-1
can be identified as a FSTij coefficient [17]. The next level
of the model consists of specifying the distributions of λij(or FST
ij) and of xi. These frequencies are nuisance param-eters and uncertainty about them will be taken into
account by assigning to them non informative prior suchas a Beta(1,1) distribution (e.g. [78]). Following Beau-mont and Balding [7], the λij's are modelled via a linearmodel on the logistic transformation of the FST
ij. SinceFST
ij/(1-FSTij) = 1/λij, we can write this model in terms of ηij
= log(FSTij/(1-FST
ij)) = -log(λij) as: ηij = αi+ βj+ γij where αi isa locus effect, βj a population effect and γij an error termcorresponding to a departure of the logit of FST
ij from theadditive decomposition. For theoretical and computa-tional reasons, it is more efficient to consider the previousdecomposition under a hierarchical Bayesian structurethan under its basic form, and implement it as follows: ηij| αi, βj, σγ2~iidN(αi + βj, σγ2) with βj | μβ, σβ2~iidN(μβ, σβ2)and αi | σα2~iidN(0, σα2). Introduction of additional levelsby defining priors on the variance components σα2, σβ2
and σγ2 is straightforward but adds marginal gain in theestimates and requires high supplementary computa-tional costs (Gautier and Foulley, unpublished data). Wethus gave for these components the known values pro-posed initially by Beaumont and Balding (2004): σα2 = 1,σβ2 = 3.24 and σγ2 = 0.25. The prior mean μ for the βj wasalso taken as -2.0. Recently, Riebler et al. [8] introduced inthe above logistic model an auxiliary indicator variable δiattached to each locus specifying whether it can beregarded as selected (δi = 1) or neutral (δi = 0). They dem-onstrated the efficiency of this approach for improving thepower of the statistical procedure, particularly for thedetection of loci under balancing selection. Under thisreparameterized model, the previous parameters αi arewritten as: αi = δiαi * with αi * | σα*2~iidN(0, σα*2). Themodel further assumes a Bernoulli distribution for theindicator δi variable with parameter P: δi | P ~Bin(1, P). Pis itself assumed to be Beta distributed to take into accountuncertainty on this crucial parameter. Here we took P~Beta(0.2,1.8) [8], thus assuming that a priori 10% of theloci are on average under selection, but within a very largerange of possible values as the 95% credibility intervalgoes from almost 0 to 65%. Note that the value σα*2 canbe derived from σα2 since by construction σα2 = E(P) σα*2
(hence σα*2 = 10).
The posterior distributions of the different parameters ofinterest were estimated via MCMC procedures as previ-ously described [8] from 10,000 post burn-in samples(with a burn-in period of 3,000 iterations) and a thinninginterval of k = 25. Convergence was checked using stand-ard criterion. Parameter estimates for the FST
ij were takenas the median of the posterior distribution.
Decision rule to identify non neutral lociIn order to identify outlier loci, we decided to base thedecision rule on a Bayes Factor BFi defined as the ratio ofthe posterior to the prior odds that locus i is selected:
BF Pr data Pr data Pr Pri i i i i= = − = = − =[ ( | ) /[ ( | )]] /[ ( ) /[ (δ δ δ δ1 1 1 1 1 1))]]
Page 14 of 18(page number not for citation purposes)

BMC Genomics 2009, 10:550 http://www.biomedcentral.com/1471-2164/10/550
As δi is an indicator variable, the prior and posterior prob-abilities that δi = 1 are easy to compute since they reduceto expectations as shown below:
where π(P) is the density of the distribution of P definedabove. To make interpretation of the BFi easier, weexpressed them in deciban units (dB) ie dBi = 10log10(BFi)so that 10 dB corresponds to an odds ratio of 10, 20 dB toan odds ratio of 100, 30 dB to an odds ratio of 1,000 andso forth. We then applied the Jeffreys' rule [79] whichquantifies the strength of evidence (here to consider a SNPas being under selection) based on BF using the followingscale: "strong evidence" when 10<dBi<15, "very strong evi-dence" when 15<dBi<20 and "decisive evidence" whendBi>20. Notice that the BF captures the change in the oddsin favor of δi = 1 as we move from the prior to the poste-rior. In that way, it makes this criterion independent of theprior distribution of δi and thus guarantees some robust-ness.
Simulated dataFollowing Foll and Gaggiotti [20], four data sets eachcomprising 50,000 (unlinked) SNPs with respectively9300 (P = 0.186), 5000 (P = 0.1), 500 (P = 0.01) and 50(P = 0.001) under selection (αi ≠ 0) were simulated underthe inference model. To mimic characteristics of our sam-ples, we considered 9 populations with parameters βjequal to the ones estimated on the real data (mean of thecorresponding posterior distribution). For each pair ofsimulated locus/population, we subsequently simulatedthe ηij parameter by adding to the corresponding βj, avalue of γij sampled from a Gaussian distribution(γij~N(0,0.25)) and a value for αi equal to 0 if the locuswas neutral or sampled from a Gaussian distribution(αi~N(0,10)) if the locus was under selection. The fre-quency xiin the ancestral population (or migrant genepool) was sampled from a Beta distribution with parame-ters equal to 0.7. This is equivalent to assume the ancestralpopulation was at equilibrium with 4Nμ = 0.7 where N isthe effective population size and μ the mutation rate [80].Based on these simulated values for xiand ηij we subse-quently derived the pij parameter of the binomial distribu-tion from which the simulated observed aij was sampled(taking nij = 80 for all i and j). Only SNPs displayingMAF>0.01 in at least one simulated West-African taurineand one West-African zebu (identified according to thesimulated βj) were conserved which led to the exclusion offew SNPs (displaying αi too high in general). To a firstapproximation, this also allowed the mimicking of theascertainment bias introduced by the SNP selection crite-rion. The posterior distributions of the different parame-ters of interest were then estimated as described above
from 1,000 post burn-in samples (with a burn-in periodof 3,000 iterations) and a thinning interval of k = 25. BFifor each simulated loci were then computed (see above)and used to compute the (true) FDR and FNR for a giventhreshold. To investigate relationships between the coeffi-cient of selection and the magnitude of the locus effectαiwe performed simulations under a simplified version(without mutation) of the Wright-Fisher island modelwith selection proposed by Beaumont and Balding [7].Briefly, 10 random mating populations with a constantsize of 1,000 individuals and deriving from the sameancestral population were reproduced for 500 generationsassuming a global FST of 0.15. In total, 5,000 neutral SNPsand 500 SNPs for each investigated coefficient and modeof selection were simulated. Initial allele frequencies weredrawn from a Beta distribution with both parametersequal to 0.7. At the end of the process, SNPs displaying aMAF <0.01 in at least 2 populations were discarded. Locusspecific FST were then computed following Weir and Cock-erham [73]. Following Foll and Gaggiotti [20], for eachtype of selection considered, the corresponding averageFST was compared to the one obtained under neutrality (αi= 0) to estimate the average SNP effect.
Annotation of the SNPsBecause the annotation of the bovine genome is stillsparse, the gene content information was derived from theTransMap cross-species alignments available in the UCSCGenome Browser http://genome.ucsc.edu/. For closer evo-lutionary distances, the alignments are created using syn-tenically filtered BLASTZ alignment chains, resulting in aprediction of the orthologous genes in cow. In total,46,598 different RefSeq identifiers were anchored to theBtau_4.0 bovine genome assembly http://genome.ucsc.edu/. Considering that most consecutiveSNPs on the map were separated by more than 20 kb andthe relatively high level of LD at shorter distance (seeResults and [11]) a SNP was considered as representativeof a gene if it was localized within the boundary positionsof the gene that extended by 15 kb upstream and down-stream. According to this criterion, 15,360 out of the36,320 SNPs were representative of 17,190 differentTransMap RefSeq identifiers. Subsequent annotation andanalyses were carried out with the Ingenuity PathwayAnalysis (IPA) software v7.0 (Ingenuity Systems Inc., USA,http://www.ingenuity.com/). Among the 17,190 differentTransMap RefSeq identifiers, 17,151 identifiers (99.7%)were represented in the Ingenuity Pathway KnowledgeBase (IPKB) and corresponded to 7,177 different genesfurther considered as the reference set. Finally, 15,336SNPs were located within a gene, leading to an average of2.21 SNPs per annotated gene. Notice that 421 of theseSNPs were representative of more than one gene.
Pr Pr P P dP P P dP E P Pr data Ei i i( ) ( | ) ( ) ( ) ( ) ( | )δ δ π π δ= = = = = = =1 1 1 and (( | )δ i data
0
1
0
1
∫∫
Page 15 of 18(page number not for citation purposes)

BMC Genomics 2009, 10:550 http://www.biomedcentral.com/1471-2164/10/550
Functional and Network AnalysesFunctional and Networks analyses were carried out usingan approach similar to the one described in [81]. Based onthe information contained in the IPKB, IPA allows per-forming both functional and network analyses. The func-tional analysis aims at identifying the most significantbiological functions represented in the candidate gene listfrom the reference set. Note that among the genes underselection, only those associated with at least one func-tional annotation in IPKB were eligible for functionalanalysis. The most significant functions are then obtainedby comparing functions associated with eligible genesagainst functions associated with all the genes in the refer-ence set using the right-tailed Fisher's exact test. The net-work analysis aims at searching for interactions (knownfrom the literature) between candidate genes and all otherIPKB molecules (genes, gene products or small molecules)and result in the definitions of networks which contains atmost 35 molecules (including candidate genes). For eachnetwork, a score S is computed based on a right-tailedFisher exact test for the overrepresentation of candidategenes (S = -log(p-value)). In our study, networks were con-sidered as significant when S>3 and their associated topfunctions and diseases were further reported.
Identification of regions under selectionIn order to identify regions under selection (with an unex-pectedly high proportions of SNPs subjected to selection),we followed the locally adaptive procedure which allowsto account for variations in distance between the differenttested positions [81,82]. Individual SNP BF values werefirst smoothed over each chromosome with a local varia-ble bandwidth kernel estimator [83]. We further per-formed 250,000 permutations to estimate local p-valueswhich were corrected for multiple testing by computing q-values (see above).
List of AbbreviationsThroughout the text, gene symbols are given according toHUGO standard nomenclature.
Breed Codes: AUB: Aubrac; BAO: Baoulé; BOR: Borgou;KUR: Kuri; LAG: Lagune; ND1: N'Dama (first popula-tion); ND2: N'Dama (second population); OUL: OulmèsZaer; SOM: Somba; ZCH: Choah zebu; ZFU: White FulaniZebu; ZMA; Zebu from Madagascar.
Other abbreviations: ASD: Allele Sharing Distance; BF:Bayes Factor; BTA: Bos TAurus chromosome; dB: decibanunit; HWE: Hardy-Weinberg Equilibrium; IPA; IngenuityPathway Analysis; IPKB: Ingenuity Pathway Knowledgedatabase; FDR: False Discovery Rate; FNR: False NegativeRate; LD: Linkage Disequilibrium; MAF: Minor Allele Fre-quency; MHC: Major Histocompatibility Complex; PCA:
Principal Component Analysis; SNP: Single NucleotidePolymorphism.
Authors' contributionsAll authors read and approved the final manuscript. MGconceived the study, analyzed the data and drafted thepaper. LF performed functional and network analyses anddrafted the paper. AR, FJ, DL and JLF contributed to anal-yses. KMG provided samples and IG oversaw genotypingand quality control of genotyping results.
Additional material
Additional file 1Supplementary Figures. This additional file is a pdf document with seven pages each corresponding to the following supplementary figures: Figure S1 (page 1): SNP Polymorphism within each population. A) Plot of het-erozygosities averaged across all the 36,320 selected SNPs against the cor-responding relative increase after removing non informative SNPs from the full data set B) Distribution of the number of SNPs per population for different MAF range. Figure S2 (page 2): Neighbor-Joining tree relating the 437 individuals. The tree was constructed using allele sharing dis-tances averaged over 36,320 SNPs. Edges are colored according to the individual breed of origin. Figure S3 (page 3): Distribution of allele counts for different FIS, allele frequency and number of genotyped individ-uals. Figure S4 (page 4): Comparison of the distribution of estimated and simulated allele frequencies in the gene pool in four simulated data sets. P represents the proportion of SNP under selection simulated and Alpha the locus effect. Figure S5 (page 5): Posterior distribution of the propor-tion P of loci under selection. Distributions for the real data set and the four different simulated data sets (with known P) are represented. Figure S6 (page 6): Distribution of distances separating consecutive SNPs. Fig-ure S7 (page 7): Decay of average pairwise r2 with inter-marker distance for the different populations. A vertical dotted line indicates the average marker spacing of 70 kb in the study.Click here for file[http://www.biomedcentral.com/content/supplementary/1471-2164-10-550-S1.PDF]
Additional file 2Supplementary Tables. This additional file is an excel file containing 7 sheets each corresponding to the following supplementary tables: Table S1: Differentiation between populations. Estimates of FST between pairs of population computed with SMARTPCA (GENEPOP) software are below (above) the diagonal. Diagonal elements are estimates of population FIS. Standard deviations of the estimates are given in parenthesis. Table S2: Power to detect loci under selection as a function of the simulated locus effect. Table S3: BF and FST estimates for each SNP considered in the study. Table S4: Correlation of BF and FST between pair of SNPs for dif-ferent inter-marker distance bins. Table S5: Description of the 7,177 genes represented by analyzed SNPs. Table S6: Description of significant gene networks. Table S7: Functional annotation of N and N3 networks. Table S8: Genome Coverage of the SNPs.Click here for file[http://www.biomedcentral.com/content/supplementary/1471-2164-10-550-S2.XLS]
Page 16 of 18(page number not for citation purposes)

BMC Genomics 2009, 10:550 http://www.biomedcentral.com/1471-2164/10/550
AcknowledgementsThe authors wish to thank the farmers, the persons in charge of breeding programmes and the CIRDES (Burkina-Faso) team for their precious help in providing the samples from Burkina-Faso, Togo and Benin and Pr Lahous-sine Ouragh from the Rabat Institute of Morocco for providing samples from Oulmès-Zaer breed. They also wish to thank anonymous referees for helpful corrections. The genotyping was supported by the French Ministry of Education and Research and the National Institute of Agronomic Research (INRA AIP "Bio-Ressources").
References1. Hanotte O, Bradley DG, Ochieng JW, Verjee Y, Hill EW, Rege JE:
African pastoralism: genetic imprints of origins and migra-tions. Science 2002, 296(5566):336-339.
2. Epstein H: The Origins of the Domestic Animals of Africa. Vol-ume 1. London: Africana Publishing Corporation; 1971.
3. Payne WJA, Hodges J: Tropical Cattle, Origins, Breeds andBreeding Policies. Oxford: Blackwell Science Ltd; 1997.
4. Freeman AR, Meghen CM, Machugh DE, Loftus RT, Achukwi MD,Bado A, Sauveroche B, Bradley DG: Admixture and diversity inWest African cattle populations. Mol Ecol 2004,13(11):3477-3487.
5. Williamson G, Payne WJA: An introduction to Animal Hus-bandry in the Tropics. English Language Book Service/Longman;1984.
6. Rege JEO, Aboagye GS, Tawah CL: Shorthorn cattle of West andCentral Africa. I. Origin, distribution, classification and pop-ulation statistics. World Anim Rev 1994, 78:1-14.
7. Beaumont MA, Balding DJ: Identifying adaptive genetic diver-gence among populations from genome scans. Mol Ecol 2004,13(4):969-980.
8. Riebler A, Held L, Stephan W: Bayesian variable selection fordetecting adaptive genomic differences among populations.Genetics 2008, 178(3):1817-1829.
9. Matukumalli LK, Lawley CT, Schnabel RD, Taylor JF, Allan MF, HeatonMP, O'Connell J, Moore SS, Smith TPL, Sonstegard TS, et al.: Devel-opment and Characterization of a High Density SNP Geno-typing Assay for Cattle. PLoS ONE 2009, 4(4):e5350.
10. Dayo GK, Thevenon S, Berthier D, Moazami-Goudarzi K, Denis C,Cuny G, Eggen A, Gautier M: Detection of selection signatureswithin candidate regions underlying trypanotolerance inoutbred cattle populations. Mol Ecol 2009, 18(8):1801-1813.
11. Gautier M, Faraut T, Moazami-Goudarzi K, Navratil V, Foglio M,Grohs C, Boland A, Garnier JG, Boichard D, Lathrop GM, et al.:Genetic and haplotypic structure in 14 European and Africancattle breeds. Genetics 2007, 177(2):1059-1070.
12. Bowcock AM, Ruiz-Linares A, Tomfohrde J, Minch E, Kidd JR, Cavalli-Sforza LL: High resolution of human evolutionary trees withpolymorphic microsatellites. Nature 1994, 368(6470):455-457.
13. Cavalli-Sforza LL, Menozzi P, Piazza A: The History and Geogra-phy of Human Genes. Princeton, NJ: PrincetonUniversity Press;1994.
14. Patterson N, Price AL, Reich D: Population structure andeigenanalysis. PLoS Genet 2006, 2(12):e190.
15. Gibbs RA, Taylor JF, Van Tassell CP, Barendse W, Eversole KA, GillCA, Green RD, Hamernik DL, Kappes SM, Lien S, et al.: Genome-wide survey of SNP variation uncovers the genetic structureof cattle breeds. Science 2009, 324(5926):528-532.
16. Moazami-Goudarzi K, Laloe D: Is a multivariate consensus rep-resentation of genetic relationships among populationsalways meaningful? Genetics 2002, 162(1):473-484.
17. Balding DJ: Likelihood-based inference for genetic correlationcoefficients. Theor Popul Biol 2003, 63(3):221-230.
18. Foll M, Beaumont MA, Gaggiotti O: An approximate Bayesiancomputation approach to overcome biases that arise whenusing amplified fragment length polymorphism markers tostudy population structure. Genetics 2008, 179(2):927-939.
19. Guillot G, Foll M: Correcting for ascertainment bias in theinference of population structure. Bioinformatics 2009,25(4):552-554.
20. Foll M, Gaggiotti O: A genome-scan method to identifyselected Loci appropriate for both dominant and codomi-nant markers: a bayesian perspective. Genetics 2008,180(2):977-993.
21. McVean G: The structure of linkage disequilibrium around aselective sweep. Genetics 2007, 175(3):1395-1406.
22. Guo F, Dey DK, Holsinger KE: A Bayesian hierarchical model foranalysis of SNP diversity in multilocus, multipopulation sam-ples. J Am Stat Assoc 2009, 104(485):142-154.
23. Hill WG, Robertson A: Linkage disequilibrium in finite popula-tions. Theoretical and Applied Genetics 1968, 38:226-231.
24. Excoffier L, Hofer T, Foll M: Detecting loci under selection in ahierarchically structured population. Heredity 2009,103(4):285-298.
25. Garrigan D, Hedrick PW: Perspective: detecting adaptivemolecular polymorphism: lessons from the MHC. Evolution2003, 57(8):1707-1722.
26. Hedrick PW: Balancing selection and MHC. Genetica 1998,104(3):207-214.
27. Keeble AH, Khan Z, Forster A, James LC: TRIM21 is an IgG recep-tor that is structurally, thermodynamically, and kineticallyconserved. Proc Natl Acad Sci USA 2008, 105(16):6045-6050.
28. Yang K, Shi HX, Liu XY, Shan YF, Wei B, Chen S, Wang C: TRIM21is essential to sustain IFN regulatory factor 3 activation dur-ing antiviral response. J Immunol 2009, 182(6):3782-3792.
29. Johnson WE, Sawyer SL: Molecular evolution of the antiretrovi-ral TRIM5 gene. Immunogenetics 2009, 61(3):163-176.
30. Newman RM, Hall L, Connole M, Chen GL, Sato S, Yuste E, Diehl W,Hunter E, Kaur A, Miller GM, et al.: Balancing selection and theevolution of functional polymorphism in Old World monkeyTRIM5alpha. Proc Natl Acad Sci USA 2006, 103(50):19134-19139.
31. Seya T, Oshiumi H, Sasai M, Akazawa T, Matsumoto M: TICAM-1and TICAM-2: toll-like receptor adapters that participate ininduction of type 1 interferons. Int J Biochem Cell Biol 2005,37(3):524-529.
32. Raghunandan R, Ruiz-Hidalgo M, Jia Y, Ettinger R, Rudikoff E, RigginsP, Farnsworth R, Tesfaye A, Laborda J, Bauer SR: Dlk1 influencesdifferentiation and function of B lymphocytes. Stem Cells Dev2008, 17(3):495-507.
33. Contento RL, Molon B, Boularan C, Pozzan T, Manes S, Marullo S,Viola A: CXCR4-CCR5: a couple modulating T cell functions.Proc Natl Acad Sci USA 2008, 105(29):10101-10106.
34. Lusso P: HIV and the chemokine system: 10 years later. EmboJ 2006, 25(3):447-456.
35. Bamshad MJ, Mummidi S, Gonzalez E, Ahuja SS, Dunn DM, WatkinsWS, Wooding S, Stone AC, Jorde LB, Weiss RB, et al.: A strong sig-nature of balancing selection in the 5' cis-regulatory regionof CCR5. Proc Natl Acad Sci USA 2002, 99(16):10539-10544.
36. Wooding S, Stone AC, Dunn DM, Mummidi S, Jorde LB, Weiss RK,Ahuja S, Bamshad MJ: Contrasting effects of natural selectionon human and chimpanzee CC chemokine receptor 5. Am JHum Genet 2005, 76(2):291-301.
37. Hanotte O, Ronin Y, Agaba M, Nilsson P, Gelhaus A, Horstmann R,Sugimoto Y, Kemp S, Gibson J, Korol A, et al.: Mapping of quanti-tative trait loci controlling trypanotolerance in a cross of tol-erant West African N'Dama and susceptible East AfricanBoran cattle. Proc Natl Acad Sci USA 2003, 100(13):7443-7448.
38. Nagarajan UM, Long AB, Harreman MT, Corbett AH, Boss JM: Ahierarchy of nuclear localization signals governs the importof the regulatory factor X complex subunits and MHC classII expression. J Immunol 2004, 173(1):410-419.
39. Krawczyk M, Peyraud N, Rybtsova N, Masternak K, Bucher P, BarrasE, Reith W: Long distance control of MHC class II expression
Additional file 3Genotyping Data. This file is a bzipped archive containing the genotyping data (437 individuals and 36,320 SNPs) in the Haploview format (see Methods).Click here for file[http://www.biomedcentral.com/content/supplementary/1471-2164-10-550-S3.BZ2]
Page 17 of 18(page number not for citation purposes)
http://www.ncbi.nlm.nih.gov/entrez/query.fcgi?cmd=Retrieve&db=PubMed&dopt=Abstract&list_uids=7510853

BMC Genomics 2009, 10:550 http://www.biomedcentral.com/1471-2164/10/550
by multiple distal enhancers regulated by regulatory factorX complex and CIITA. J Immunol 2004, 173(10):6200-6210.
40. Gobin SJ, Peijnenburg A, van Eggermond M, van Zutphen M, Berg Rvan den, Elsen PJ van den: The RFX complex is crucial for theconstitutive and CIITA-mediated transactivation of MHCclass I and beta2-microglobulin genes. Immunity 1998,9(4):531-541.
41. Siemasko K, Eisfelder BJ, Stebbins C, Kabak S, Sant AJ, Song W, ClarkMR: Ig alpha and Ig beta are required for efficient traffickingto late endosomes and to enhance antigen presentation. JImmunol 1999, 162(11):6518-6525.
42. Kumanogoh A, Marukawa S, Suzuki K, Takegahara N, Watanabe C,Ch'ng E, Ishida I, Fujimura H, Sakoda S, Yoshida K, et al.: Class IVsemaphorin Sema4A enhances T-cell activation and inter-acts with Tim-2. Nature 2002, 419(6907):629-633.
43. Hill AV: Aspects of genetic susceptibility to human infectiousdiseases. Annu Rev Genet 2006, 40:469-486.
44. Guo L, Jiang M, Ma Y, Cheng H, Ni X, Jin Y, Xie Y, Mao Y: Cloning,chromosome localization and features of a novel humangene, MATH2. J Genet 2002, 81(1):13-17.
45. Moreno TA, Bronner-Fraser M: Noelins modulate the timing ofneuronal differentiation during development. Dev Biol 2005,288(2):434-447.
46. Laura RP, Ross S, Koeppen H, Lasky LA: MAGI-1: a widelyexpressed, alternatively spliced tight junction protein. ExpCell Res 2002, 275(2):155-170.
47. Abid A, Ismail M, Mehdi SQ, Khaliq S: Identification of novelmutations in the SEMA4A gene associated with retinaldegenerative diseases. J Med Genet 2006, 43(4):378-381.
48. Smith AK, Dimulescu I, Falkenberg VR, Narasimhan S, Heim C, Ver-non SD, Rajeevan MS: Genetic evaluation of the serotonergicsystem in chronic fatigue syndrome. Psychoneuroendocrinology2008, 33(2):188-197.
49. Abebe G, Eley RM, ole-MoiYoi OK: Reduced responsiveness ofthe hypothalamic-pituitary-adrenal axis in Boran (Bos indu-cus) cattle infected with Trypanosoma congolense. Acta Endo-crinol (Copenh) 1993, 129(1):75-80.
50. Morin LP: Serotonin and the regulation of mammalian circa-dian rhythmicity. Ann Med 1999, 31(1):12-33.
51. Gariepy CE, Cass DT, Yanagisawa M: Null mutation of endothelinreceptor type B gene in spotting lethal rats causes agangli-onic megacolon and white coat color. Proc Natl Acad Sci USA1996, 93(2):867-872.
52. Read AP, Newton VE: Waardenburg syndrome. J Med Genet1997, 34(8):656-665.
53. Seo K, Mohanty TR, Choi T, Hwang I: Biology of epidermal andhair pigmentation in cattle: a mini-review. Vet Dermatol 2007,18(6):392-400.
54. Hilton MJ, Sawyer JM, Gutierrez L, Hogart A, Kung TC, Wells DE:Analysis of novel and recurrent mutations responsible forthe tricho-rhino-phalangeal syndromes. J Hum Genet 2002,47(3):103-106.
55. Momeni P, Glockner G, Schmidt O, von Holtum D, Albrecht B, Gil-lessen-Kaesbach G, Hennekam R, Meinecke P, Zabel B, Rosenthal A,et al.: Mutations in a new gene, encoding a zinc-finger protein,cause tricho-rhino-phalangeal syndrome type I. Nat Genet2000, 24(1):71-74.
56. Fantauzzo KA, Tadin-Strapps M, You Y, Mentzer SE, Baumeister FA,Cianfarani S, Van Maldergem L, Warburton D, Sundberg JP, Chris-tiano AM: A position effect on TRPS1 is associated withAmbras syndrome in humans and the Koala phenotype inmice. Hum Mol Genet 2008, 17(22):3539-3551.
57. Wu DD, Irwin DM, Zhang YP: Molecular evolution of the keratinassociated protein gene family in mammals, role in the evo-lution of mammalian hair. BMC Evol Biol 2008, 8:241.
58. Hansen PJ: Physiological and cellular adaptations of zebu cat-tle to thermal stress. Anim Reprod Sci 2004, 82-83:349-360.
59. Dikmen S, Alava E, Pontes E, Fear JM, Dikmen BY, Olson TA, HansenPJ: Differences in thermoregulatory ability between slick-haired and wild-type lactating Holstein cows in response toacute heat stress. J Dairy Sci 2008, 91(9):3395-3402.
60. Martinez ML, Machado MA, Nascimento CS, Silva MV, Teodoro RL,Furlong J, Prata MC, Campos AL, Guimaraes MF, Azevedo AL, et al.:Association of BoLA-DRB3.2 alleles with tick (Boophilusmicroplus) resistance in cattle. Genet Mol Res 2006,5(3):513-524.
61. Mattioli RC, Pandey VS, Murray M, Fitzpatrick JL: Immunogeneticinfluences on tick resistance in African cattle with particularreference to trypanotolerant N'Dama (Bos taurus) andtrypanosusceptible Gobra zebu (Bos indicus) cattle. Acta Trop2000, 75(3):263-277.
62. Tomlinson DJ, Mulling CH, Fakler TM: Invited review: formationof keratins in the bovine claw: roles of hormones, minerals,and vitamins in functional claw integrity. J Dairy Sci 2004,87(4):797-809.
63. Drogemuller C, Wohlke A, Momke S, Distl O: Fine mapping of thepolled locus to a 1-Mb region on bovine chromosome 1q12.Mamm Genome 2005, 16(8):613-620.
64. Souvenir-Zafindrajaona P, Zeuh V, Moazami-Goudarzi K, Laloë D,Bourzat D, Idriss A, Grosclaude F: Etude du statut phylogéné-tique du bovin Kouri du lac Tchad à l'aide de marqueursmoléculaires. Revue Elev Méd Vét Pays trop 1999, 52(2):155-162.
65. Moazami-Goudarzi K, Belemsaga DMA, Ceriotti G, Laloë D, Fagbo-houn F, Kouagou NT, Sidibé I, Codjia V, Crimella MC, Grosclaude F,et al.: Caractérisation de la race bovine Somba à l'aide demarqueurs moléculaires. Revue Elev Méd Vét Pays trop 2001,54(2):129-138.
66. Souvenir-Zafindrajaona P, Lauvergne JJ: Comparaison de popula-tions de zébu malgache à l'aide des distances génétiques.Genetics, Selection, Evolution: GSE 1993, 25:373-395.
67. Beja-Pereira A, Alexandrino P, Bessa I, Carretero Y, Dunner S, Fer-rand N, Jordana J, Laloe D, Moazami-Goudarzi K, Sanchez A, et al.:Genetic characterization of southwestern European bovinebreeds: a historical and biogeographical reassessment with aset of 16 microsatellites. Journal of Heredity 2003, 94(3):243-250.
68. Elsik CG, Tellam RL, Worley KC, Gibbs RA, Muzny DM, WeinstockGM, Adelson DL, Eichler EE, Elnitski L, Guigo R, et al.: The genomesequence of taurine cattle: a window to ruminant biologyand evolution. Science 2009, 324(5926):522-528.
69. Wigginton JE, Cutler DJ, Abecasis GR: A note on exact tests ofHardy-Weinberg equilibrium. Am J Hum Genet 2005,76(5):887-893.
70. Storey JD, Tibshirani R: Statistical significance for genomewidestudies. Proc Natl Acad Sci USA 2003, 100(16):9440-9445.
71. Paradis E, Claude J, Strimmer K: APE: Analyses of Phylogeneticsand Evolution in R language. Bioinformatics 2004, 20(2):289-290.
72. Dray S, Dufour AB: The ade4 package: implementing the dual-ity diagram for ecologists. Journal of Statistical Software 2007,22(4):1-20.
73. Weir BS, Cockerham CC: Estimating F-statistics for the analy-sis of population structure. Evolution 1984, 19:395-420.
74. Rousset F: GenePop'007: a complete re-implementation ofthe GenePop software for Windows and Linux. Molecular Ecol-ogy Resources 2008, 8:103-106.
75. Barrett JC, Fry B, Maller J, Daly MJ: Haploview: analysis and visu-alization of LD and haplotype maps. Bioinformatics 2005,21(2):263-265.
76. Rousset F: Inferences from Spatial Population Genetics. InHandbook of Statistical Genetics Volume 2. 3rd edition. Edited by: Bald-ing DJ, Bishop M, Cannings C. Wiley-Interscience; 2008:945-979.
77. Wright S: Isolation by Distance. Genetics 1943, 28(2):114-138.78. Pritchard JK, Stephens M, Donnelly P: Inference of population
structure using multilocus genotype data. Genetics 2000,155(2):945-959.
79. Jeffreys H: Theory of Probability, 3rd edition. Oxford UniversityPress; 1961.
80. Wright S: Evolution in Mendelian Populations. Genetics 1931,16(2):97-159.
81. Flori L, Fritz S, Jaffrezic F, Boussaha M, Gut I, Heath S, Foulley JL, Gau-tier M: The genome response to artificial selection: a casestudy in dairy cattle. PLoS One 2009, 4(8):e6595.
82. Callegaro A, Basso D, Bicciato S: A locally adaptive statisticalprocedure (LAP) to identify differentially expressed chro-mosomal regions. Bioinformatics 2006, 22(21):2658-2666.
83. Herrmann E: Local bandwidth choice in kernel regression esti-mation. J Graphic Comput Statist 1997, 6:35-54.
Page 18 of 18(page number not for citation purposes)
http://www.ncbi.nlm.nih.gov/entrez/query.fcgi?cmd=Retrieve&db=PubMed&dopt=Abstract&list_uids=9806639
http://www.ncbi.nlm.nih.gov/entrez/query.fcgi?cmd=Retrieve&db=PubMed&dopt=Abstract&list_uids=9806639
http://www.ncbi.nlm.nih.gov/entrez/query.fcgi?cmd=Retrieve&db=PubMed&dopt=Abstract&list_uids=9806639
http://www.ncbi.nlm.nih.gov/entrez/query.fcgi?cmd=Retrieve&db=PubMed&dopt=Abstract&list_uids=8394613
http://www.ncbi.nlm.nih.gov/entrez/query.fcgi?cmd=Retrieve&db=PubMed&dopt=Abstract&list_uids=8394613
http://www.ncbi.nlm.nih.gov/entrez/query.fcgi?cmd=Retrieve&db=PubMed&dopt=Abstract&list_uids=8394613
http://www.ncbi.nlm.nih.gov/entrez/query.fcgi?cmd=Retrieve&db=PubMed&dopt=Abstract&list_uids=8570650
http://www.ncbi.nlm.nih.gov/entrez/query.fcgi?cmd=Retrieve&db=PubMed&dopt=Abstract&list_uids=8570650
http://www.ncbi.nlm.nih.gov/entrez/query.fcgi?cmd=Retrieve&db=PubMed&dopt=Abstract&list_uids=8570650