A typology of undergraduate students' conceptions of size and scale: Identifying and characterizing...
22
JOURNAL OF RESEARCH IN SCIENCE TEACHING VOL. 48, NO. 5, PP. 512–533 (2011) A Typology of Undergraduate Students’ Conceptions of Size and Scale: Identifying and Characterizing Conceptual Variation Su Swarat, Greg Light, Eun Jung Park, Denise Drane Searle Center for Teaching Excellence, Northwestern University, 627 Dartmouth Place, Evanston, Illinois 60208 Received 29 June 2009; Accepted 2 November 2010 Abstract: The importance of ‘‘size and scale’’ in nanoscience and engineering has been recognized by both scientists and science educators. A solid understanding of this concept is key to the learning of nanoscience. Students, however, have been reported to have considerable difficulty grasping this concept; yet little is known regarding their state of understanding. To address this knowledge gap, we conducted a series of studies that were aimed at exploring the different ways students conceive of ‘‘size and scale’’ in the context of undergraduate nanoscience and engineering courses. Informed by Variation Theory of Learning (Marton and Booth, 1997), we identified four major categories (with two sub-categories within each) of student conception—fragmented, linear, proportional, and logarithmic. These conception categories, together with the aspects of variation that characterize and distinguish them, are summarized in a typology. In addition to serving as a diagnostic tool to describe students’ understanding, this typology can also be used to guide the development of instructional interventions that facilitate students to move toward a more sophisticated understanding of ‘‘size and scale.’’ ß 2010 Wiley Periodicals, Inc. J Res Sci Teach 48: 512–533, 2011 Keywords: size and scale; conceptual understanding; variation theory The field of nanoscience deals with objects and structures in the range of 1 – 100 nm, a size range that is rarely (if at all) considered in everyday practice. Thus, whether and how students come to grasp phenomena of such small size—defined as ‘‘the extent, bulk or amount of something’’ (Stevens, Sutherland, & Krajcik, 2009)—is a critical issue in nanoscience education. Closely associated with the idea of size is the concept of scale, which refers to the conventionally defined numerical representational systems of size such as the linear scale and the logarithmic scale. Due to the invisible nature of objects at the nanoscale, people need to rely on numerical scales to conceptualize how small they are. Therefore, while size and scale are two separate concepts in many situations, they are treated as one unifying idea in this paper due to the specific context of nanoscience. ‘‘Size and scale’’ has been recognized as a fundamental theme in various science education standards such as the American Association for the Advancement of Science (AAAS) Project 2061 and the Benchmarks for Science Literacy (AAAS, 1993). A solid understanding of this concept is reported to play a critical role in their work by professionals from a wide range of fields (Jones & Taylor, 2009). Recent national workshops with nanoscientists and education experts also identified ‘‘size and scale’’ as one of the ‘‘big ideas’’ both at K-12 and undergraduate levels (Stevens et al., 2009; Wansom et al., 2009). A sophisticated understanding of ‘‘size and scale’’ not only helps students better grasp the size range in which nanoscience operates, but facilitates their learning of size-dependent properties that are arguably at the core of nanoscience. Without a clear understanding of ‘‘size and scale,’’ it is difficult for students to understand the mechanisms behind why objects or materials behave differently at the nanoscale. Additional Supporting Information may be found in the online version of this article. Contract grant sponsor: National Science Foundation and the National Center for Learning and Teaching: Nanoscale Science and Engineering; Contract grant number: ESI-0426328/002. Correspondence to: S. Swarat; E-mail: [email protected] DOI 10.1002/tea.20403 Published online 30 December 2010 in Wiley Online Library (wileyonlinelibrary.com). ß 2010 Wiley Periodicals, Inc.
-
Upload
independent -
Category
Documents
-
view
3 -
download
0
Transcript of A typology of undergraduate students' conceptions of size and scale: Identifying and characterizing...
JOURNAL OF RESEARCH IN SCIENCE TEACHING VOL. 48, NO. 5, PP. 512–533 (2011)
A Typology of Undergraduate Students’ Conceptions of Size and Scale:Identifying and Characterizing Conceptual Variation
Su Swarat, Greg Light, Eun Jung Park, Denise Drane
Searle Center for Teaching Excellence, Northwestern University,
627 Dartmouth Place, Evanston, Illinois 60208
Received 29 June 2009; Accepted 2 November 2010
Abstract: The importance of ‘‘size and scale’’ in nanoscience and engineering has been recognized by both
scientists and science educators. A solid understanding of this concept is key to the learning of nanoscience. Students,
however, have been reported to have considerable difficulty grasping this concept; yet little is known regarding their state
of understanding. To address this knowledge gap, we conducted a series of studies that were aimed at exploring the
different ways students conceive of ‘‘size and scale’’ in the context of undergraduate nanoscience and engineering
courses. Informed by Variation Theory of Learning (Marton and Booth, 1997), we identified four major categories (with
two sub-categories within each) of student conception—fragmented, linear, proportional, and logarithmic. These
conception categories, together with the aspects of variation that characterize and distinguish them, are summarized in a
typology. In addition to serving as a diagnostic tool to describe students’ understanding, this typology can also be used to
guide the development of instructional interventions that facilitate students to move toward a more sophisticated
understanding of ‘‘size and scale.’’ � 2010 Wiley Periodicals, Inc. J Res Sci Teach 48: 512–533, 2011
Keywords: size and scale; conceptual understanding; variation theory
The field of nanoscience deals with objects and structures in the range of 1–100 nm, a size range that is
rarely (if at all) considered in everyday practice. Thus,whether and how students come to grasp phenomena of
such small size—defined as ‘‘the extent, bulk or amount of something’’ (Stevens, Sutherland, & Krajcik,
2009)—is a critical issue in nanoscience education. Closely associated with the idea of size is the concept of
scale, which refers to the conventionally defined numerical representational systems of size such as the linear
scale and the logarithmic scale. Due to the invisible nature of objects at the nanoscale, people need to rely on
numerical scales to conceptualize how small they are. Therefore, while size and scale are two separate
concepts in many situations, they are treated as one unifying idea in this paper due to the specific context of
nanoscience.
‘‘Size and scale’’ has been recognized as a fundamental theme in various science education standards
such as theAmericanAssociation for theAdvancement of Science (AAAS) Project 2061 and theBenchmarks
for Science Literacy (AAAS, 1993). A solid understanding of this concept is reported to play a critical role in
their work by professionals from a wide range of fields (Jones & Taylor, 2009). Recent national workshops
with nanoscientists and education experts also identified ‘‘size and scale’’ as one of the ‘‘big ideas’’ both at
K-12 and undergraduate levels (Stevens et al., 2009;Wansom et al., 2009). A sophisticated understanding of
‘‘size and scale’’ not only helps students better grasp the size range in which nanoscience operates, but
facilitates their learning of size-dependent properties that are arguably at the core of nanoscience. Without a
clear understanding of ‘‘size and scale,’’ it is difficult for students to understand the mechanisms behind why
objects or materials behave differently at the nanoscale.
Additional Supporting Information may be found in the online version of this article.
Contract grant sponsor: National Science Foundation and the National Center for Learning and Teaching:
Nanoscale Science and Engineering; Contract grant number: ESI-0426328/002.
Correspondence to: S. Swarat; E-mail: [email protected]
DOI 10.1002/tea.20403
Published online 30 December 2010 in Wiley Online Library (wileyonlinelibrary.com).
� 2010 Wiley Periodicals, Inc.
Theoretical FrameworkPrevious Research on ‘‘Size and Scale’’
Though relatively few studies have examined students’ understanding of ‘‘size and scale’’ in the science
context, a consistent finding to date is that people have difficulty comprehending and comparing sizes,
particularly extremely small or large ones (Delgado, Stevens, Shin, Yunker, & Krajcik, 2007; Tretter, Jones,
Andre, Negishi, &Minogue, 2006). Tretter and colleagues (2006) provided students (elementary to graduate
level) with objects from the atomic scale to the interplanetary scale, and asked them to assess the size range
(e.g., 1–10m) for each object. Interviews conducted with students while they completed the task of grouping
objects of similar sizes together revealed that students of all ages assigned relative rankings of objects more
accurately than absolute rankings. Conceptual boundaries or ‘‘size landmarks’’separating distinctly different
size categories were also identified for all age groups. Boundaries at the small end of the size spectrum
appeared to be a source of confusion and this difficulty was more pronounced for younger students whowere
unable to rely on measurement units (e.g., mm, nm) to conceptualize different size categories. Similar
findings have been reported by other researchers such as Castellini and colleagues (2007). A larger scale
survey (n¼ 1,500) with similar questions (Waldron, Spencer, & Batt, 2006) also reported that adults and
children had difficulty ranking small, invisible objects (i.e., germ, molecule), even though they had more
success ordering the measurement units (i.e., micrometer, nanometer) corresponding to these objects.
Conceptual difficulty with the small end of the scale was found in a study of middle school students (Jones et
al., 2007). Possible reasons reported for this difficulty included the invisible nature of small objects, the
negative number in the exponential notation, and the unfamiliar names of measurements for these objects. It
seems, as the authors stated, that ‘‘there is a point where small is just undifferentiated small to students’’
(p.192).
Researchers have also explored how people make sense of size differences in quantitative terms.
Delgado and colleagues (2007) investigated how middle and high school students conceptualized objects’
size differences in terms of howmany times bigger/smaller. Participants sorted cards (representing objects of
varying sizes), estimated how many times bigger/smaller each object was compared to a reference object
(i.e., pin head), and then assigned absolute sizes to each object. ‘‘Nearly two-third of the students interviewed
did not perceive a logical, necessary connection between the sizes of two objects and the number of times
bigger one object is than another’’ (p.26). Less than 5% of the participants were able to generate answers
regarding absolute sizes consistent with the number of times bigger/smaller they reported the object to be
relative to the pinhead. Tretter, Jones, and Minogue (2006) asked students ranging from elementary to
graduate level to nameobjects representing awide range of sizes in increments of factors of 10 near the human
body size range, or factors of 1,000 further away from this range. Students performed well in the range near
human body size, but poorly as size increased or decreased. Accuracy was particularly low in the micron
range. Participants tended to name objects that were too small at the very large end and objects that were too
large at the very small end of the size spectrum. Similar results were also found in a related study with
preservice and experienced science teachers (Jones, Tretter, Taylor, & Oppewal, 2008).
The importance of proportional reasoning ability in understanding ‘‘size and scale’’ has been explored in
recent studies. In a study that examined the impact of the film Powers of Ten (Eames Office, 2009) on middle
school students’ understanding of ‘‘size and scale’’ (Jones et al., 2007), students’ proportional reasoning
ability was found to be positively correlated with their accuracy of ordering objects and assigning them with
correct size labels. Taylor’s dissertation study (2008) also found that performance on proportional reasoning
assessment was significantly correlated with the ability to understand the concept ‘‘surface area to volume
ratio,’’ which is closely related to ‘‘size and scale’’.
Variation Theory of Learning
Our study sought to describe not only how students understand the core idea of ‘‘size’’ and ‘‘scale,’’ but
more importantly, how they comprehend the attributes associated with them and the relation between the
attributes. In order to do so, we employed Variation Theory of Learning (Marton & Booth, 1997; Marton &
Pang, 2006; Marton & Tsui, 2004; Pang &Marton, 2005) to guide our research, particularly in terms of data
analysis and interpretation.
TYPOLOGY OF SIZE AND SCALE 513
Journal of Research in Science Teaching
According to Variation Theory, conceptions are viewed in terms of awareness, and learning in terms of
changes in the learner’s awareness structure as it relates to a concept or a phenomenon. That is, different
conceptions correspond to awareness at different levels of complexity derived from different ways of
experiencing a phenomenon.Variation between conceptions is due to the different aspects of the phenomenon
that the learner is able to discern. Variation in learners’ awareness or learners’ experience of a phenomenon
can be described in terms of Aspects of Variation. Research following a Variation Theory approach leads to a
hierarchical set of increasingly more complex categories of conception, complemented by a set of aspects of
variation that highlight the critical distinctions between the conceptions. The more sophisticated the
conception is, the more awareness of aspects of variation it demonstrates. For example, Pang and Marton
(2005) explored students’ understanding of price fluctuation as affected by demand and supply. Five
conceptions increasing in level of sophistication were identified—consideration of change in features of the
goods only, consideration of change in demand only, consideration of change in supply only, consideration of
change in both demand and supply but not their magnitudes of change, and consideration of change in both
demand and supply as well as the relative magnitudes of change. The corresponding critical aspects of
variation were change in demand/supply (directionality), magnitudes of changes in demand/supply, and the
magnitudes of change in relative terms. The least sophisticated conception exhibited awareness of none of
these aspects of variation, and the most sophisticated one demonstrated full awareness.
In such an approach, all conceptions bear important information to describe and understand the
‘‘outcome space.’’ Therefore, alternative conceptions are not treated as flawed and needing to be replaced by
the scientificmodels or theories (Smith, diSessa,&Roschelle, 1993), but valuable knowledge elements that serve
as foundation for students to develop and expand their knowledge system (Vosniadou & Verschaffel, 2004).
Study Goal
In this paper, we report a series of three studies that explored how undergraduate students made sense of
the concept ‘‘size and scale,’’ particularly as it relates to the context of nanoscience.We sought to understand
not only how students ordered and grouped objects based on their size, but more importantly, how they
conceptualized size differences, and represented themwith numerical scales. Such knowledge can contribute
to the design of instructional interventions that promote appropriate use of numerical scale, a crucial skill
required in many STEM courses and professions.
Study Overview
Three related studies (two interview studies and one survey study) were undertaken to explore
undergraduate students’ conceptions of ‘‘size and scale.’’ It should be emphasized that the studies were
exploratory in nature, focusing on relatively small samples of students. Following Variation Theory, each
individual student’s response was treated as representing a potential valid variation of the participant
population, an assumption that is necessary to construct the conceptual space of these students but may be
vulnerable given the small sample size.
The initial interview study (Interview study 1) involved a small group of students, and took a qualitative,
exploratory approach. The findings led to a more focused follow-up study (Interview study 2), with a larger
group of students to further probe their understanding. The second interview study confirmed and extended
findings from Interview study 1, and a typology of student conceptions of ‘‘size and scale’’ was developed
based on the collective results of the two studies. It should be pointed out thatwhile the interviews in these two
studies were conducted in a similar manner, the tasks accompanying the interviews were different, with
Interview study 1 requiring students to generate scales themselves and Interview study 2 asking students to
choose from a set of given options. Subsequently, a set of multiple-choice assessment items was developed,
and administered to a separate larger group of students as away to test the typology. This step was done in the
Survey study, the results of which provided further confirmation of the typology.
MethodsParticipants and Procedures
Participants were subsets of students who enrolled in three engineering courses at a major Midwest
university—a freshman engineering design course for majors (EDC), an introductory materials science
514 SWARAT ET AL.
Journal of Research in Science Teaching
courses for non-majors (MSC-Gen), and an advanced materials science courses for majors (MSC-Adv). All
courses had a nanoscience focus, either by including a nanoscience unit or having nanoscience as the unifying
theme of the course.
In order to capture the wide variations within students’ conceptions, we were particularly concerned
with selecting participants that had the potential of exhibiting varied levels of understanding. In the initial
interview study, a self-developed ‘‘size and scale’’ inventory (see Light et al., 2007 for details) was first
administered to EDC andMSC-Gen students, and within each class, students’ performance placed them into
one of the ‘‘average,’’ ‘‘above-average,’’ and ‘‘below-average’’ groups. Students from each performance
groupwere invited to participate, and the final participants included 12 students (six EDC and sixMSC-Gen)
that varied in terms of gender make-up and ‘‘size and scale’’ understanding. Each student participated in a
task-based think-aloud interview, constructed based on tasks used in previous research (Tretter, Jones, Andre,
et al., 2006). The participants were asked to order a list of objects of widely varying sizes (the length of a
football field, the height of an elephant, the length of a typical science textbook, thewidth of a human hair, the
diameter of a bacterium, the diameter of a virus, and the diameter of a hydrogen atom) along a line, and then to
apply a numerical scale to the line to represent their size differences. Students were prompted to verbalize
their reasoning as they completed the tasks.
Interview study 2 was aimed to further probe the preliminary findings yielded in Interview study 1.
Twenty students—eight from EDC, eight from MSC-Gen, and four from MSC-Adv—participated in this
study. As in interview study 1, these students were chosen following the strategy of ‘‘maximum variation
sampling’’ (Patton, 2001) so that we could include a wide range of students who were likely to hold very
different conceptions of ‘‘size and scale,’’ and thus increase the chance of capturing all possible variations in
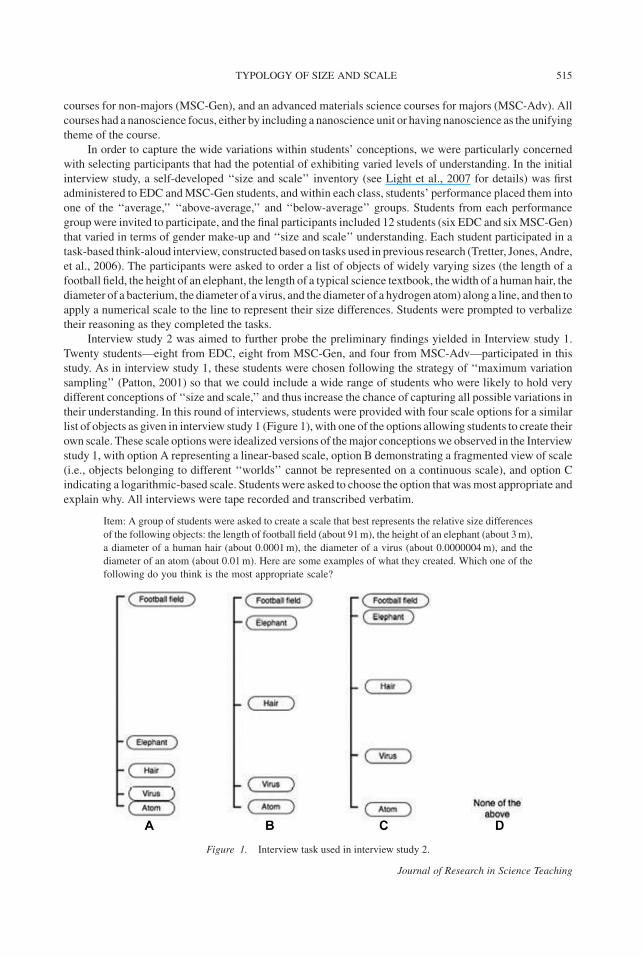
their understanding. In this round of interviews, students were provided with four scale options for a similar
list of objects as given in interview study 1 (Figure 1), with one of the options allowing students to create their
own scale. These scale optionswere idealized versions of themajor conceptionswe observed in the Interview
study 1, with option A representing a linear-based scale, option B demonstrating a fragmented view of scale
(i.e., objects belonging to different ‘‘worlds’’ cannot be represented on a continuous scale), and option C
indicating a logarithmic-based scale. Students were asked to choose the option that wasmost appropriate and
explain why. All interviews were tape recorded and transcribed verbatim.
Item: A group of students were asked to create a scale that best represents the relative size differences
of the following objects: the length of football field (about 91m), the height of an elephant (about 3m),
a diameter of a human hair (about 0.0001m), the diameter of a virus (about 0.0000004m), and the
diameter of an atom (about 0.01m). Here are some examples of what they created. Which one of the
following do you think is the most appropriate scale?
Figure 1. Interview task used in interview study 2.
TYPOLOGY OF SIZE AND SCALE 515
Journal of Research in Science Teaching
The Survey study consisted of 111 students—29 fromEDC, 70 fromMSC-Gen, and 12 fromMSC-Adv.
Most of the students (over 90%) enrolled in the courses agreed to complete the survey, which explains the
variation between number of participants from each course. Three ‘‘size and scale’’ assessment items
(Appendix A) were administered to the participants as part of a larger survey. These assessment items were
designed to reflect the key aspects of variation identified in the interview studies. Item 1 was essentially the
same as the task used in Interview study 2, as it was found to be useful in the interview studies to elicit
students’ scale conception(s); items 2 and 3 aimed to differentiate the fragmented versus the continuous
conception from two different angles—item 2 looked at whether students who held the fragmented view
confused different ‘‘scales’’ with different ‘‘appropriate units of measurement,’’ whereas item 3 examined
whether the visibility and properties of objects of widely varying sizes interfered with students’ belief
regarding the feasibility of representing them on the same scale. Each question consisted of two parts—a
multiple-choice part and a written justification part.
Data Analysis
Given the exploratory nature of the study, the analysis of the Interview study 1 data took a
phenomenographical approach (Akerlind, 2005; Bowden & Marton, 1998; Marton & Booth, 1997; Micari,
Light, Calkins, & Streitwieser, 2007), which aims at mapping out the qualitatively different ways in which
aspects of the phenomenon are experienced, as well as the structural relationships that connect these different
ways of experiencing. The coding process included several steps. First, two researchers individually reviewed
all interview transcripts and accompanying written artifacts to identify different approaches students took in
responding to the interview task (i.e., ordering objects and assigning scale). The variations observed by
individual researchers were then compared and discussed before generating an initial set of codes. The initial
codes were applied to all transcripts by the same researchers, with the goal of grouping excerpts
demonstrating the same ordering and scaling approaches. The researchers then met to compare their coding
results, and discussed the similarities within and differences between these groups. As inter-rater
discrepancies were few (<10%), the researchers made minor revisions to the codes, and proceeded to apply
the revised codes to all the transcript excerpts (additional information of the codes is available as
Supplementary Material accompanying the online article). Instead of conducting this round of coding
separately, the researchers coded the transcripts together, and resolved any discrepancies through
discussions.
Since Interview study 2 was built upon Interview study 1, and less exploratory in nature, the analysis
process was thus more focused. Specifically, the initial codes were derived from the observed variations in
Interview study 1. One of the two researchers from the previous study applied the initial codes to all
transcripts, and excerpts or cases that were not covered by the initial codes were noted. These newly emerged
variations were discussed among the two researchers from Interview study 1, and new codes were created to
describe them. The final codes were then used to code the transcripts by the same researcher who conducted
the initial round of coding (additional information of the codes is available as Supplementary Material
accompanying the online article).
For the survey results, we did not treat them quantitatively by simply calculating the number of items in
which students chose the most complex answer, as we believe that a particular multiple choice does not, in
itself, necessarily warrant the corresponding conceptual understanding it is meant to represent. Instead,
students’ multiple-choice and written justifications were reviewed holistically. For item 1, we coded the
responses using the same codes used in Interview study 2 (i.e., to characterize conceptions based on
the variations observed in the interview studies). For items 2 and 3, initial codes were generated to capture
the variation revealed in students’ responses. These codes were applied to a sample of 59 responses (about
50%of the total responses) by two researchers in three rounds. In each round, about one-third of the responses
were coded by two researchers. Coding results were compared, discrepancies were discussed, and
appropriate revisions were made to the codes (additional information of the codes is available as
Supplementary Material accompanying the online article). The final percent agreement between the
researchers was 82.6%. Any responses that were irrelevant or insensible were coded as such, and excluded
from further analysis.
516 SWARAT ET AL.
Journal of Research in Science Teaching
Results
Interview data suggested four distinctive categories of student conceptions of ‘‘size and scale’’—
fragmented, linear, proportional, and logarithmic. Given its larger sample size, we initially expected the
survey data to reveal more variations that were not captured in the interviews. However, the brief nature of
students’ survey responses often times made classification beyond the aforementioned four categories
difficult. As a result, while the Survey study data confirmed the four categories and some of the within-
category variations, no new conceptions were revealed. In what follows, we will describe the conceptions in
detail, and illustrate themwith example interview excerpts and if available, survey responses. Please note that
of the three survey items, item 1 was most informative with respect to student conceptions, so the survey
responses shown here are primarily from item 1. Items 2 and 3 were more helpful in providing insights on
possible reasons for the fragmented conceptions, and thus were only referred to in the discussion of the
fragmented category.
Fragmented Conceptions
What separates conceptions within this category from the other categories of conception is whether
students understood scale as continuous, or in other words, as capable of representing and ordering objects of
widely varying size in a continuous way. This was a rather surprising finding, as we assumed undergraduate
students would have established a continuous model of ordering, measuring, and comparing objects.
However, the data revealed that while some students held the continuous view, others perceived objects as
residing in separate worlds according to their size—namely, the macro, micro, and nano world.
Correspondingly, their view of the scale was fragmented—each ‘‘world’’ demands its own distinct scale,
and these scales cannot be compared or connected in any way.
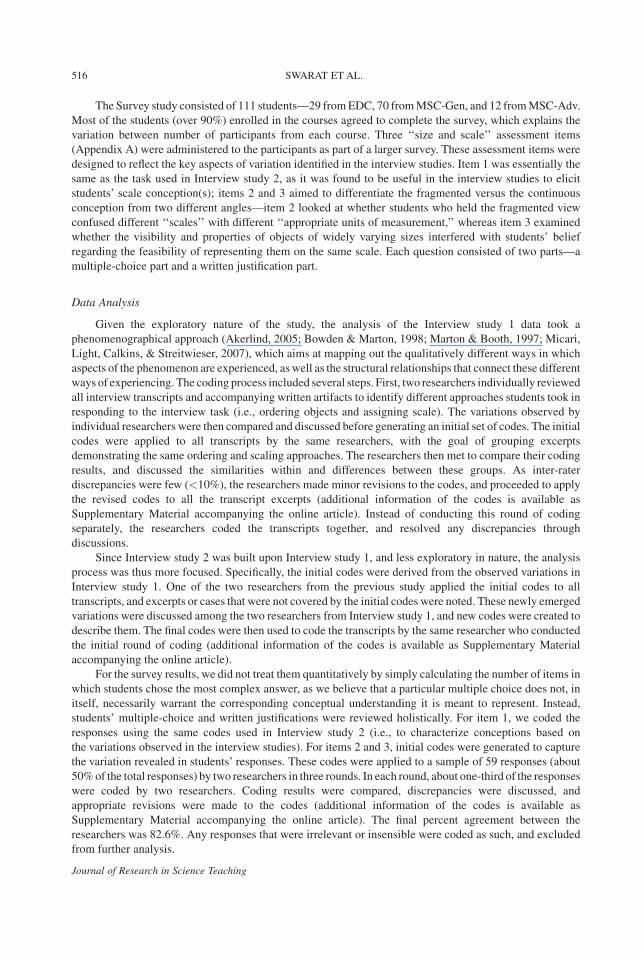
In the interviews, the ‘‘separate worlds’’ view mainly manifested itself as the belief that the macro and
sub-macro worlds are disconnected or fragmented. This view is illustrated by Katrina’s drawing and
comments in response to the interview task (Figure 2). Specifically, she placed macro and sub-macro
objects at each end of the scale, with objects in each group relatively close together. And these two
groups are separated by a huge ‘‘gap,’’ in this case between textbook and hair. Katrina explained her scale
as follows:
Relatively. . .these (pointing at the hair, bacterium, virus, and atom) must be down here at the bottom
‘cause these are so small; these would be all chunked together; and these (pointing at the football field,
elephant, and textbook) would be more like this. . .but this (pointing at the gap between hair and
textbook) is not enough space in between.’
This explanation, coupled with the drawing, suggested that in Katrina’s mind, the size differences
amongmacro or sub-macro objects are negligible and can be ‘‘chunked together,’’ but the difference between
the two ‘‘worlds’’ is so enormous that they could not be compared using the same scale. Indeed, the two
worlds are represented in her drawing by different units of measurement, yards, and feet primarily for the
macro world and nanometers for the sub-macro world.
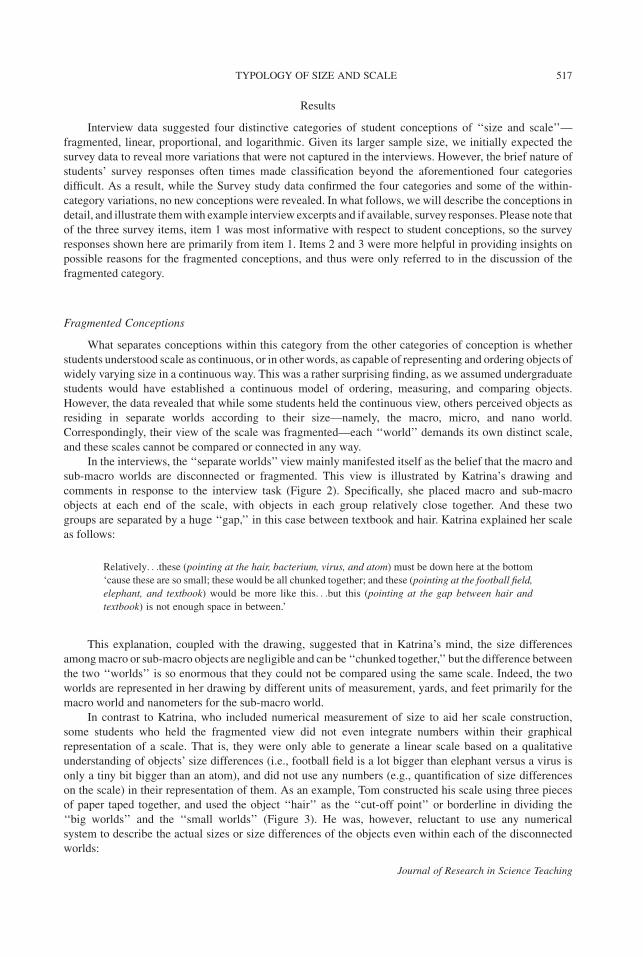
In contrast to Katrina, who included numerical measurement of size to aid her scale construction,
some students who held the fragmented view did not even integrate numbers within their graphical
representation of a scale. That is, they were only able to generate a linear scale based on a qualitative
understanding of objects’ size differences (i.e., football field is a lot bigger than elephant versus a virus is
only a tiny bit bigger than an atom), and did not use any numbers (e.g., quantification of size differences
on the scale) in their representation of them. As an example, Tom constructed his scale using three pieces
of paper taped together, and used the object ‘‘hair’’ as the ‘‘cut-off point’’ or borderline in dividing the
‘‘big worlds’’ and the ‘‘small worlds’’ (Figure 3). He was, however, reluctant to use any numerical
system to describe the actual sizes or size differences of the objects even within each of the disconnected
worlds:
TYPOLOGY OF SIZE AND SCALE 517
Journal of Research in Science Teaching
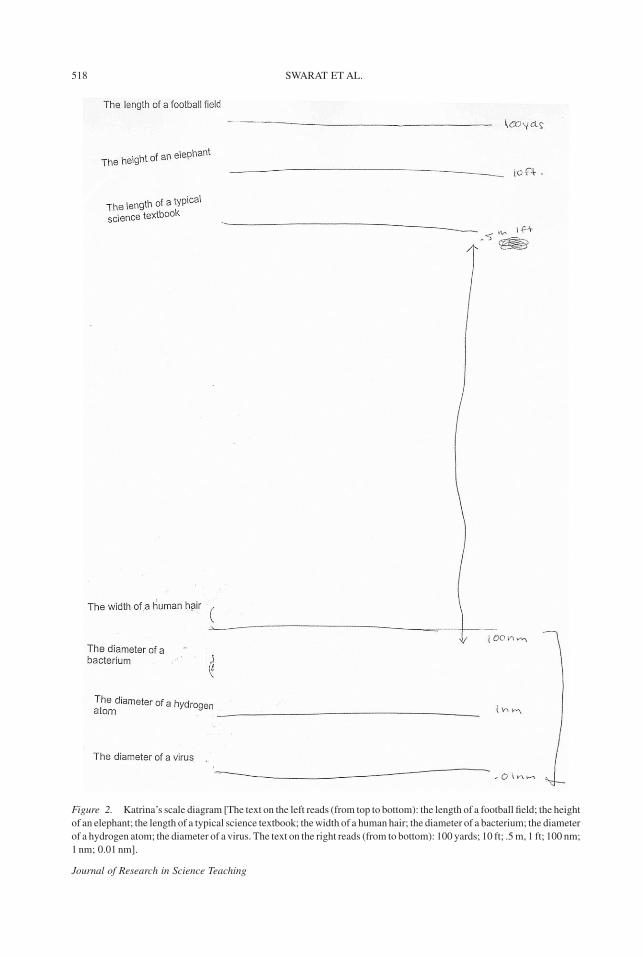
Figure 2. Katrina’s scale diagram [The text on the left reads (from top to bottom): the length of a football field; the height
of an elephant; the length of a typical science textbook; thewidth of a human hair; the diameter of a bacterium; the diameter
of a hydrogen atom; the diameter of a virus. The text on the right reads (from to bottom): 100 yards; 10 ft; .5m, 1 ft; 100 nm;
1 nm; 0.01 nm].
518 SWARAT ET AL.
Journal of Research in Science Teaching
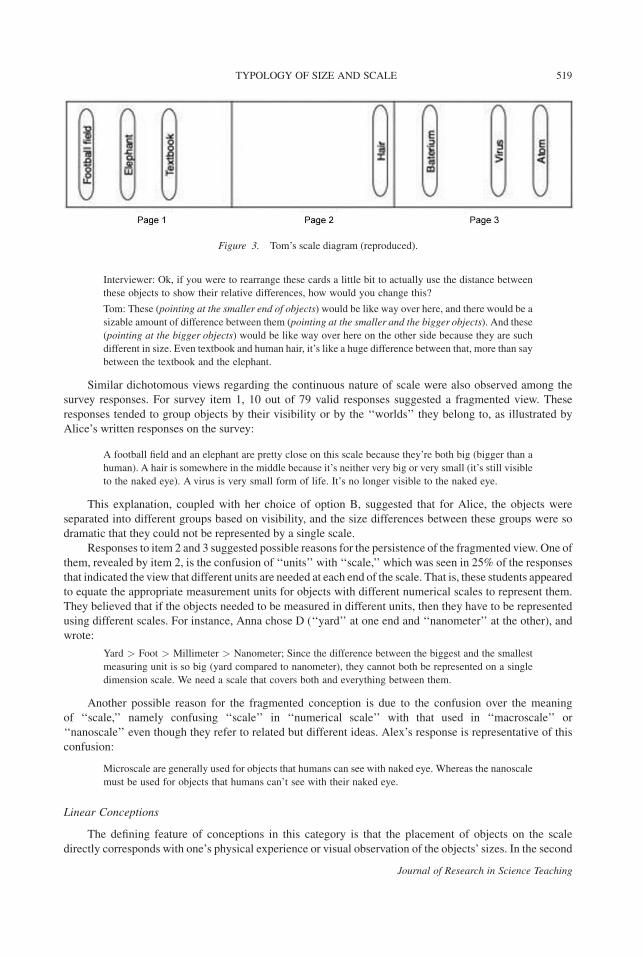
Interviewer: Ok, if you were to rearrange these cards a little bit to actually use the distance between
these objects to show their relative differences, how would you change this?
Tom: These (pointing at the smaller end of objects) would be like way over here, and there would be a
sizable amount of difference between them (pointing at the smaller and the bigger objects). And these
(pointing at the bigger objects) would be like way over here on the other side because they are such
different in size. Even textbook and human hair, it’s like a huge difference between that, more than say
between the textbook and the elephant.
Similar dichotomous views regarding the continuous nature of scale were also observed among the
survey responses. For survey item 1, 10 out of 79 valid responses suggested a fragmented view. These
responses tended to group objects by their visibility or by the ‘‘worlds’’ they belong to, as illustrated by
Alice’s written responses on the survey:
A football field and an elephant are pretty close on this scale because they’re both big (bigger than a
human). A hair is somewhere in the middle because it’s neither very big or very small (it’s still visible
to the naked eye). A virus is very small form of life. It’s no longer visible to the naked eye.
This explanation, coupled with her choice of option B, suggested that for Alice, the objects were
separated into different groups based on visibility, and the size differences between these groups were so
dramatic that they could not be represented by a single scale.
Responses to item 2 and 3 suggested possible reasons for the persistence of the fragmented view. One of
them, revealed by item 2, is the confusion of ‘‘units’’ with ‘‘scale,’’ which was seen in 25% of the responses
that indicated the view that different units are needed at each end of the scale. That is, these students appeared
to equate the appropriate measurement units for objects with different numerical scales to represent them.
They believed that if the objects needed to be measured in different units, then they have to be represented
using different scales. For instance, Anna chose D (‘‘yard’’ at one end and ‘‘nanometer’’ at the other), and
wrote:
Yard > Foot > Millimeter > Nanometer; Since the difference between the biggest and the smallest
measuring unit is so big (yard compared to nanometer), they cannot both be represented on a single
dimension scale. We need a scale that covers both and everything between them.
Another possible reason for the fragmented conception is due to the confusion over the meaning
of ‘‘scale,’’ namely confusing ‘‘scale’’ in ‘‘numerical scale’’ with that used in ‘‘macroscale’’ or
‘‘nanoscale’’ even though they refer to related but different ideas. Alex’s response is representative of this
confusion:
Microscale are generally used for objects that humans can see with naked eye. Whereas the nanoscale
must be used for objects that humans can’t see with their naked eye.
Linear Conceptions
The defining feature of conceptions in this category is that the placement of objects on the scale
directly corresponds with one’s physical experience or visual observation of the objects’ sizes. In the second
Figure 3. Tom’s scale diagram (reproduced).
TYPOLOGY OF SIZE AND SCALE 519
Journal of Research in Science Teaching
interview study, Amy, for example, described a view that scale should serve almost as a literal replication of
the absolute size differences of the objects, that is, in order to be able to visualize the differences between the
tiny objects, a piece of paper is far from sufficient to represent the huge differences between the bigger
objects:
Amy: . . .So the football field is off the charts, first of all, it probably should go to the end of the table.
The elephant is also off the charts because these are so much bigger than these (pointing at the small
objects). For me to show any differentiation between these ones down here (the small objects), you
have to realize these ones (the big objects) are going—maybe not even to the end of the table, maybe to
the bookshelves, or maybe into the next room, but. . .
Interviewer: You mean football field. . .
Amy: . . . for the football field. So that one goes way out. This one (elephant) also does, too.
Interviewer: Like the bookshelf?
Amy: Yeah, I mean, the football field is going to go the farthest away. The elephant, maybe the
elephant goes to the end of this table, and the football field goes to the bookshelf. The textbook, maybe
to where your recorder is. Hair here (pointing at a location slightly closer to her than the recorder).
The virus, I think, is smaller, and then this one (atom) is like that (pointing at a location much closer
to her).
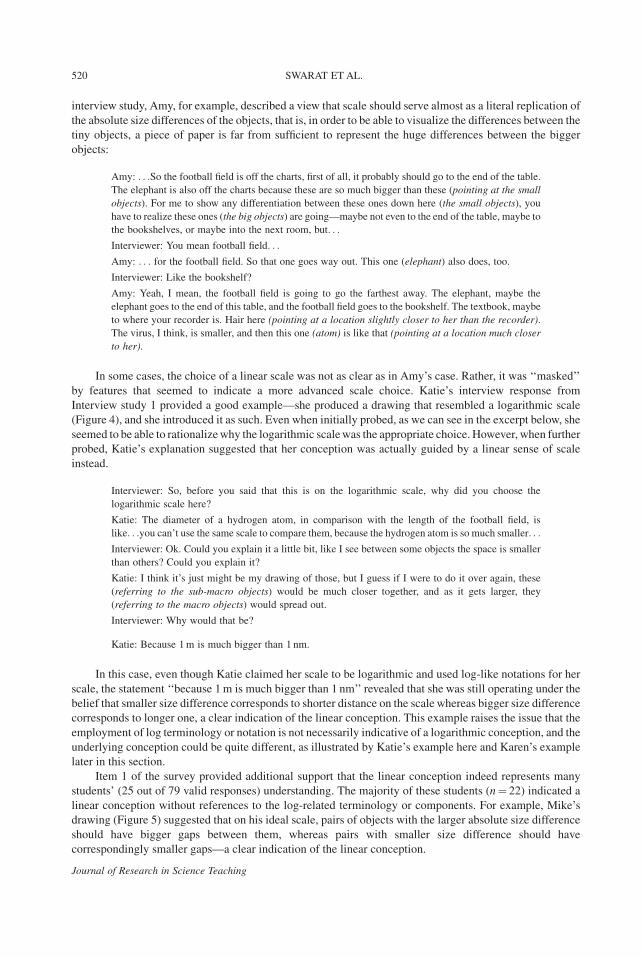
In some cases, the choice of a linear scale was not as clear as in Amy’s case. Rather, it was ‘‘masked’’
by features that seemed to indicate a more advanced scale choice. Katie’s interview response from
Interview study 1 provided a good example—she produced a drawing that resembled a logarithmic scale
(Figure 4), and she introduced it as such. Even when initially probed, as we can see in the excerpt below, she
seemed to be able to rationalizewhy the logarithmic scalewas the appropriate choice. However, when further
probed, Katie’s explanation suggested that her conception was actually guided by a linear sense of scale
instead.
Interviewer: So, before you said that this is on the logarithmic scale, why did you choose the
logarithmic scale here?
Katie: The diameter of a hydrogen atom, in comparison with the length of the football field, is
like. . .you can’t use the same scale to compare them, because the hydrogen atom is so much smaller. . .
Interviewer: Ok. Could you explain it a little bit, like I see between some objects the space is smaller
than others? Could you explain it?
Katie: I think it’s just might be my drawing of those, but I guess if I were to do it over again, these
(referring to the sub-macro objects) would be much closer together, and as it gets larger, they
(referring to the macro objects) would spread out.
Interviewer: Why would that be?
Katie: Because 1m is much bigger than 1 nm.
In this case, even though Katie claimed her scale to be logarithmic and used log-like notations for her
scale, the statement ‘‘because 1m is much bigger than 1 nm’’ revealed that she was still operating under the
belief that smaller size difference corresponds to shorter distance on the scale whereas bigger size difference
corresponds to longer one, a clear indication of the linear conception. This example raises the issue that the
employment of log terminology or notation is not necessarily indicative of a logarithmic conception, and the
underlying conception could be quite different, as illustrated by Katie’s example here and Karen’s example
later in this section.
Item 1 of the survey provided additional support that the linear conception indeed represents many
students’ (25 out of 79 valid responses) understanding. The majority of these students (n¼ 22) indicated a
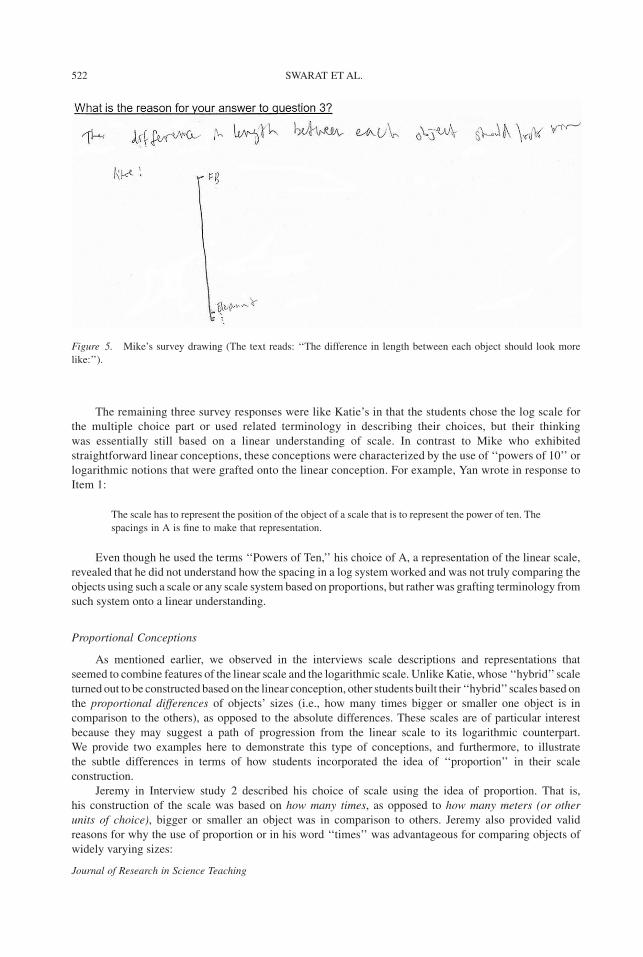
linear conception without references to the log-related terminology or components. For example, Mike’s
drawing (Figure 5) suggested that on his ideal scale, pairs of objects with the larger absolute size difference
should have bigger gaps between them, whereas pairs with smaller size difference should have
correspondingly smaller gaps—a clear indication of the linear conception.
520 SWARAT ET AL.
Journal of Research in Science Teaching
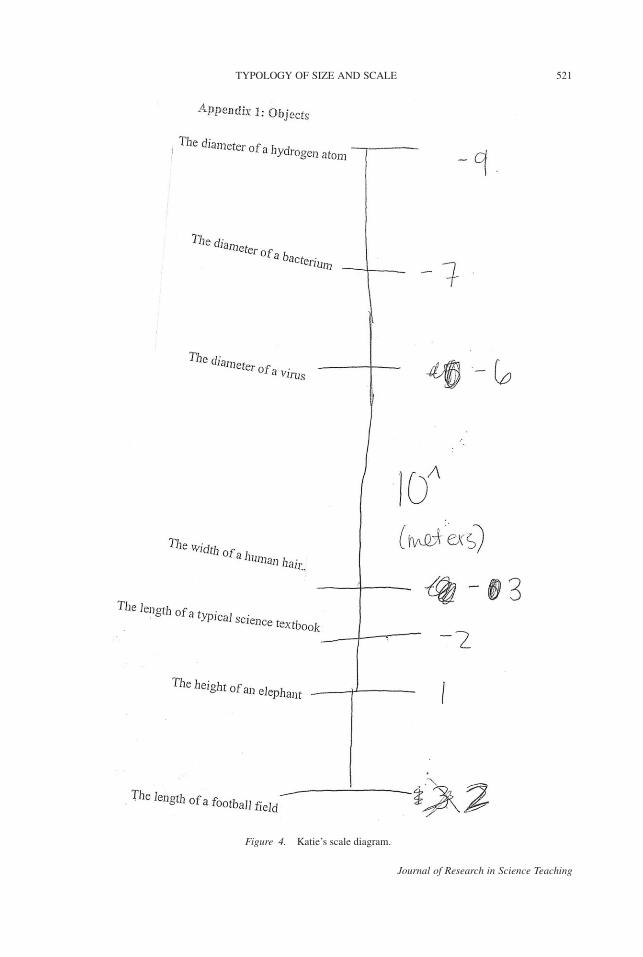
Figure 4. Katie’s scale diagram.
TYPOLOGY OF SIZE AND SCALE 521
Journal of Research in Science Teaching
The remaining three survey responses were like Katie’s in that the students chose the log scale for
the multiple choice part or used related terminology in describing their choices, but their thinking
was essentially still based on a linear understanding of scale. In contrast to Mike who exhibited
straightforward linear conceptions, these conceptions were characterized by the use of ‘‘powers of 10’’ or
logarithmic notions that were grafted onto the linear conception. For example, Yan wrote in response to
Item 1:
The scale has to represent the position of the object of a scale that is to represent the power of ten. The
spacings in A is fine to make that representation.
Even though he used the terms ‘‘Powers of Ten,’’ his choice of A, a representation of the linear scale,
revealed that he did not understand how the spacing in a log system worked and was not truly comparing the
objects using such a scale or any scale system based on proportions, but rather was grafting terminology from
such system onto a linear understanding.
Proportional Conceptions
As mentioned earlier, we observed in the interviews scale descriptions and representations that
seemed to combine features of the linear scale and the logarithmic scale. Unlike Katie, whose ‘‘hybrid’’ scale
turned out to be constructed based on the linear conception, other students built their ‘‘hybrid’’scales based on
the proportional differences of objects’ sizes (i.e., how many times bigger or smaller one object is in
comparison to the others), as opposed to the absolute differences. These scales are of particular interest
because they may suggest a path of progression from the linear scale to its logarithmic counterpart.
We provide two examples here to demonstrate this type of conceptions, and furthermore, to illustrate
the subtle differences in terms of how students incorporated the idea of ‘‘proportion’’ in their scale
construction.
Jeremy in Interview study 2 described his choice of scale using the idea of proportion. That is,
his construction of the scale was based on how many times, as opposed to how many meters (or other
units of choice), bigger or smaller an object was in comparison to others. Jeremy also provided valid
reasons for why the use of proportion or in his word ‘‘times’’ was advantageous for comparing objects of
widely varying sizes:
Figure 5. Mike’s survey drawing (The text reads: ‘‘The difference in length between each object should look more
like:’’).
522 SWARAT ET AL.
Journal of Research in Science Teaching
Jeremy: But when we’re going times, it’s probably—like (for) one elephant to reach to a football field,
it probably takes a while. . .I don’t know, 25 elephants, 25 times. A textbook is probably about maybe a
thousand times. But this stuff (the small objects) is like 10,000, 100,000 (times). . .
(When asked why using ‘times’ in comparison)
Jeremy: Yeah. Because you could say a virus is not a centimeter; an atom is not a centimeter. But we
both know they’re not a centimeter. And, like I said, a virus is not a millimeter. An atom’s not
a millimeter, but we both know they’re small. But what’s the difference from a virus and an atom?
Only times would show us the difference, how small. If we don’t do times, nothing will show us how.
We couldn’t think mathematically how small an atom is.
The use of proportion can be regarded as more advanced than the previously described linear scale,
including the example of a linear scale ‘‘dressed up’’ with log terminology, because this conception
recognizes the idea of relative difference (as opposed to absolute difference) that is muchmore appropriate in
comparing and representing objects of widely varying size. Yet students holding this type of conception are
missing or appear to be unaware of one key aspect of the log scale—a common factor (i.e., 10) to serve as the
reference for comparison. When using proportion as the base for the scale, as the proportion between each
pair of objects varies, the reference unit for the scale also varies depending on the particular object pair under
consideration. Thus, it can only provide a rough, qualitative description of how different the objects are,
but not an accurate portrait of their size differences.
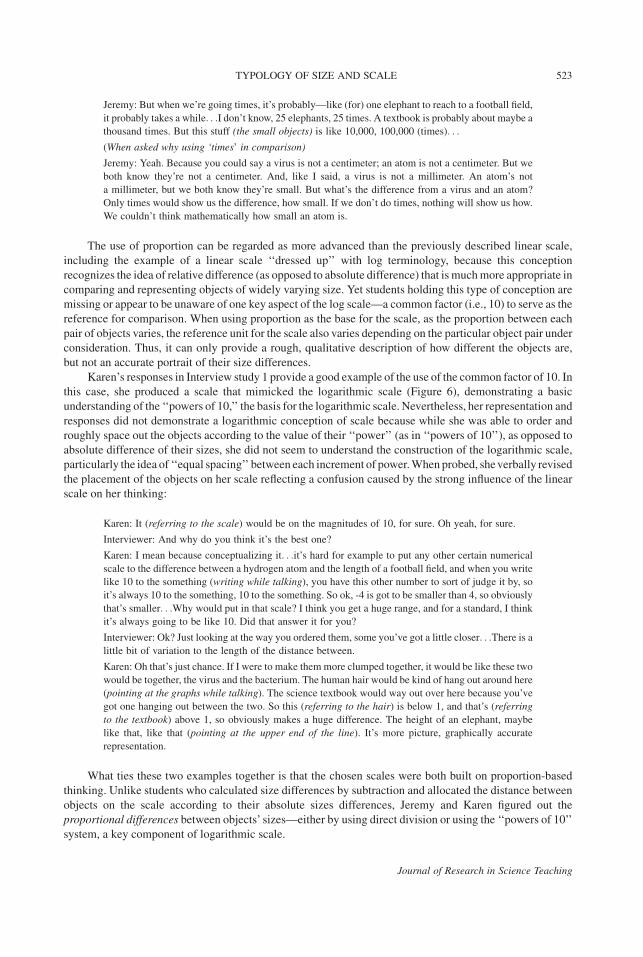
Karen’s responses in Interview study 1 provide a good example of the use of the common factor of 10. In
this case, she produced a scale that mimicked the logarithmic scale (Figure 6), demonstrating a basic
understanding of the ‘‘powers of 10,’’ the basis for the logarithmic scale. Nevertheless, her representation and
responses did not demonstrate a logarithmic conception of scale because while she was able to order and
roughly space out the objects according to the value of their ‘‘power’’ (as in ‘‘powers of 10’’), as opposed to
absolute difference of their sizes, she did not seem to understand the construction of the logarithmic scale,
particularly the idea of ‘‘equal spacing’’ between each increment of power.When probed, sheverbally revised
the placement of the objects on her scale reflecting a confusion caused by the strong influence of the linear
scale on her thinking:
Karen: It (referring to the scale) would be on the magnitudes of 10, for sure. Oh yeah, for sure.
Interviewer: And why do you think it’s the best one?
Karen: I mean because conceptualizing it. . .it’s hard for example to put any other certain numerical
scale to the difference between a hydrogen atom and the length of a football field, and when you write
like 10 to the something (writing while talking), you have this other number to sort of judge it by, so
it’s always 10 to the something, 10 to the something. So ok, -4 is got to be smaller than 4, so obviously
that’s smaller. . .Why would put in that scale? I think you get a huge range, and for a standard, I think
it’s always going to be like 10. Did that answer it for you?
Interviewer: Ok? Just looking at the way you ordered them, some you’ve got a little closer. . .There is a
little bit of variation to the length of the distance between.
Karen: Oh that’s just chance. If I were to make themmore clumped together, it would be like these two
would be together, the virus and the bacterium. The human hair would be kind of hang out around here
(pointing at the graphs while talking). The science textbook would way out over here because you’ve
got one hanging out between the two. So this (referring to the hair) is below 1, and that’s (referring
to the textbook) above 1, so obviously makes a huge difference. The height of an elephant, maybe
like that, like that (pointing at the upper end of the line). It’s more picture, graphically accurate
representation.
What ties these two examples together is that the chosen scales were both built on proportion-based
thinking. Unlike students who calculated size differences by subtraction and allocated the distance between
objects on the scale according to their absolute sizes differences, Jeremy and Karen figured out the
proportional differences between objects’ sizes—either by using direct division or using the ‘‘powers of 10’’
system, a key component of logarithmic scale.
TYPOLOGY OF SIZE AND SCALE 523
Journal of Research in Science Teaching
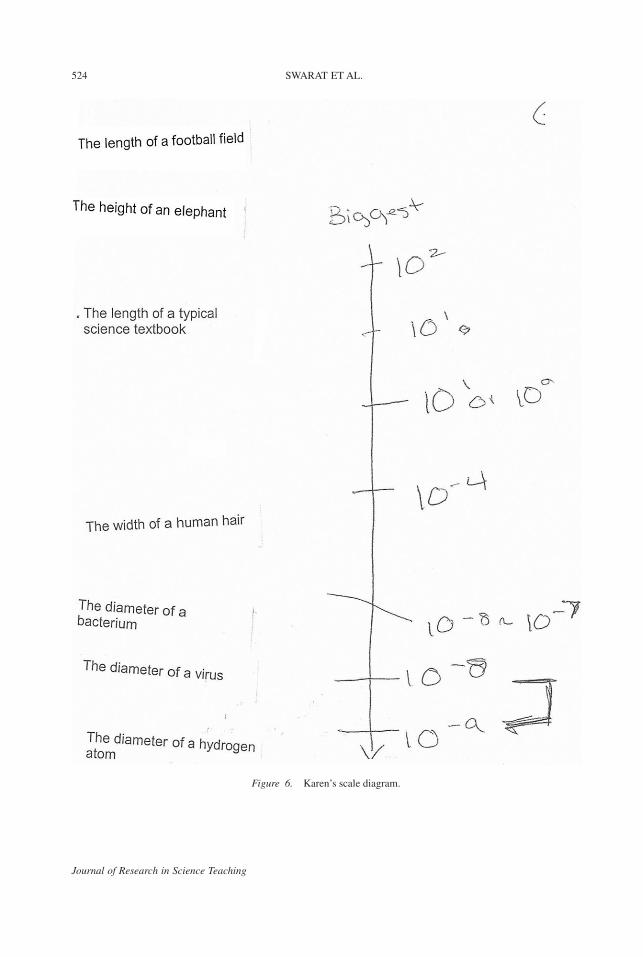
Figure 6. Karen’s scale diagram.
524 SWARAT ET AL.
Journal of Research in Science Teaching
Evidence from the survey data also suggested that proportional conception is another major way
students conceive of size and scale. Specifically, in response to item 1, 26 students based their scale choice on
proportional differences between object sizes, though the comparisons did not involve a common factor.
These responses conveyed similar understanding as Jeremy’s:
Sam: It is reasonable to use C, because the scaling is appropriate. For example, football field and
elephant should be close, as a football field is 30 times larger, whereas the virus is 4000 times larger
than an atom, creating a considerable distance.
Fifteen responses, on the other hand,went beyond the simple calculation of proportions, and employed a
common factor of 10 as the reference for comparison. It should be pointed out that sincemost of these students
chose C (the option intended to represent the log scale), and their written responses were brief, we could
not be absolutely certain that they did not possess a true log understanding. However, we were cautious
about giving these responses such ‘‘benefit of the doubt,’’ as Karen’s case (Figure 5) demonstrated that
someone who understood the idea of ‘‘powers of 10’’ could still fail to recognize a crucial feature of the
logarithmic scale—the equally spaced intervals that represent the common ‘‘power’’ factor (i.e., 10) as in the
‘‘powers of 10’’ system. Therefore, we took a more conservative stance, and characterized these conception
as still under the idea of proportion, the only difference being that now the calculations were rounded to
factors of 10:
Larry: C is the best answer. Hair is 1000 times smaller than the elephant. Virus is 10,000 times smaller
than hair. Atom is 1000 times smaller than virus.
Logarithmic Conception
The most sophisticated conception of size and scale we observed is the logarithmic scale. Unlike the
linear scale, the distances between pairs of objects on a logarithmic scale do not mirror their subtractive size
differences in reality. The location of objects on this scale is calculated based on the logarithm of the objects’
sizes. Kevin’s interview quotes below suggested an understanding of how to convert object size into the
logarithmic system, and why this is advantageous for objects of dramatically different size differences:
Kevin: A logarithmic scale is going in steps of multiples of 10, so here you start at 100m, 10 times
smaller would be 10m, 10 times smaller than that would be 1m. You just go down by factors of
10 until we get down to the nanometer. And this is what you were saying, like the length of a football
field and the height of an elephant maybe isn’t. . .the difference between these two is 90m. . .so the
difference between these two (referring to elephant and textbook) is 9m. . .so of course the bigger
difference you can’t represent that by placing them 90m apart, then 9m apart. If you say that they’re
proportionally different, you can show that using a logarithmic scale. And larger stuff is on top and the
smaller stuff is at the bottom. And you could just roughly estimate how large they are.
Nathan’s interview responses from Interview study 2 below, in addition, provided a clear indication of
how the size differences represented in terms of ‘‘powers of 10’’ was translated into appropriate object
spacing on the log scale. That is, each distance unit (often shown as ‘‘tick marks’’) on the logarithmic scale
corresponds to one ‘‘power’’ (as in ‘‘powers of 10’’), and thus the distance between objects on the scale
represents the number of ‘‘powers’’ on which they differ.
Nathan: Because the difference, for example, between a football field and the elephant is only ten
times bigger than the difference between an elephant and a human hair. So human hair is like ten to
negative 3m. Then the elephant, think of it as 10m, so it’s like ten to the first, so it (the ratio between
hair and elephant) is like four times. And this distance (on the scale between the two objects)
corresponds to almost one to four. Then the difference between a human hair and a virus, 0.4 mm, so
the micrometer is ten to a negative six. . .so, again, the difference in times. . . So the distance betweenthe virus and the elephant is ten to negative seven, and seven is the distance. Like the ratio. . .and the
ratio of elephant to the football field is one, ten to the first, so it looks like seven times this distance.
Seven times here. And about atom, 10 nm. This should be ten to negative eight. . .
TYPOLOGY OF SIZE AND SCALE 525
Journal of Research in Science Teaching
Among students who demonstrated a logarithmic conception, there seems to be an interesting
epistemological distinction. Specifically, even though they understood that both the linear scale and the log
scale can be used to represent size differences (which reflected a rather sophisticated conception of the
scales), only some students seemed to truly understand that both scales were reasonable representational
tools, andwere aware of the advantage of each scale depending on the objects to be represented or the purpose
of representation. For instance, Walter chose both A (the option intended to represent the linear scale) and C
(the option intended to represent the log scale) for the Interview study 2 task, and explained as follows:
Walter: Okay. Let me call these one, two and three. I think whoever did number one (the linear scale)
did a pretty good job in approaching it from an absolute standpoint. . . .And if I was to draw a football
field, I might draw this big. Of course, when you’re drawing really small things like atoms or whatever,
you have to divide this 1m, because this is an absolute scale, right? So you have to divide this 1m into
exceptionally small increments. So it’s not very effective at modeling the small scale. If I was, on the
other hand, to change this to 1mm, this scale, it’s just as valid a scale but, on the other hand, nanometer
would have to be one-millionth of this still. And if I wanted to draw an elephant, it would be a lot
longer than this. Not a very good idea if you want to draw a scale of many things at once.
Walter: A much more effective one would be powers of ten. And what I mean by that is it’s like an
exponential scale or a logarithmic scale. So the way that might work is I might draw a line, and then
I would say—let’s call this ten to the zero—so ten to zero meters. And over here I have ten to the 1m
and ten squared, three, four, five, six, seven. And over here I had a negative one, negative two, negative
three, negative four, negative five, negative six. So over here, ten to the zero meters; that’s 1m, but on
this scale from ten to the negative seven to ten to the seven, are pretty close in size. And then ten
squared, even though it’s a football field, which is so much bigger than a human, it is just two notches
over. And then ten to the one meter, that might be like a building height, maybe like a two-storey
building. Ten to the fifth meters might be like a city block. . . But what I’m trying to say is that this
scale you can go very very big, very very easily. And then, on the other side, you can go very very
small, very very easily.
It is clear that Walter recognized the possible application of both scales, even though preference was
given to the log scale. We deemed such students as having an epistemologically integrated understanding of
the linear and the log scale. Walter’s example contrasted with Joe’s understanding below, who despite
demonstrating a logarithmic conception size and scale through accurately drawing and explaining a
logarithmic scale, believed it ‘‘distorts’’ the size of the objects:
Joe: I think a log scale kind of distorts how it looks.
Interviewer: What do you mean by ‘‘log scale’’?
Joe: A log scale is. . .it goes by factors of ten. So this would be ten to the zero, and then you have ten to
the one, ten to the two, ten to the three, and so forth.
Interviewer: So why would that distort the size of the objects, you said?
Joe: Well, if you were to write these out, this is one, this is ten, a hundred. So if you just looked at this,
you’re saying that the difference between one thousand and ten thousand is the same as the difference
between one and ten, and even though this is a lot more.
Interviewer: So why do people use it?
Joe: They use it because it’s easier to plot things that go for. . .that have a lot of small pieces down at,
say, this area (smaller end), and goes all the way up to this area (bigger end), so that they can plot it on
a reasonable size.
It is interesting that for students like Joe, the linear scale was considered as being ‘‘real’’ or ‘‘normal,’’
and the log scale was viewed as an ‘‘artificial’’ one created for computational convenience or scientific
purposes.
Seven responses (out of 79) to survey item 1 were categorized as demonstrating a logarithmic
conception. Unfortunately, due to the brief nature of the survey responses, we were unable to distinguish
among these responses whether the understanding of logarithmic and linear scales were integrated. However,
we still witnessed some indications in terms of how students viewed and connected the logarithmic and the
526 SWARAT ET AL.
Journal of Research in Science Teaching
linear scale. For instance, Kevin, who chose C (the intended log scale), wrote the following on the survey,
which hinted at an integrated understanding of the log scale and a scale based on visibility:
(The objects could be) Divided by (1) visible, (2) barely visible, (3) invisible; OR log scale is fine too.
Kevin’s response contrasts with Sally’s below, which seemed to express the belief that only the linear
scale is realistic or normal:
I used the based 10 scale just because I tend to like to transform things into numbers that are more
manageable. Another possible scale could be A, which probably just uses the normal scale that most
people would probably pick.
A Typology of Student Understanding of ‘‘Size and Scale’’
It was our goal to explore the different ways in which undergraduate students understand ‘‘size and
scale’’ and the structural relationships characterizing and distinguishing those understandings from each
other. As shown above, our data revealed four conception categories based on students’ descriptions,
explanations, representations, and choices of scale for objects of vastly different sizes ranging from an atom
to a football field—fragmented, linear, proportional, and logarithmic. In addition, the subtle differences
between the examples within the same category suggested the necessity of establishing sub-categories. The
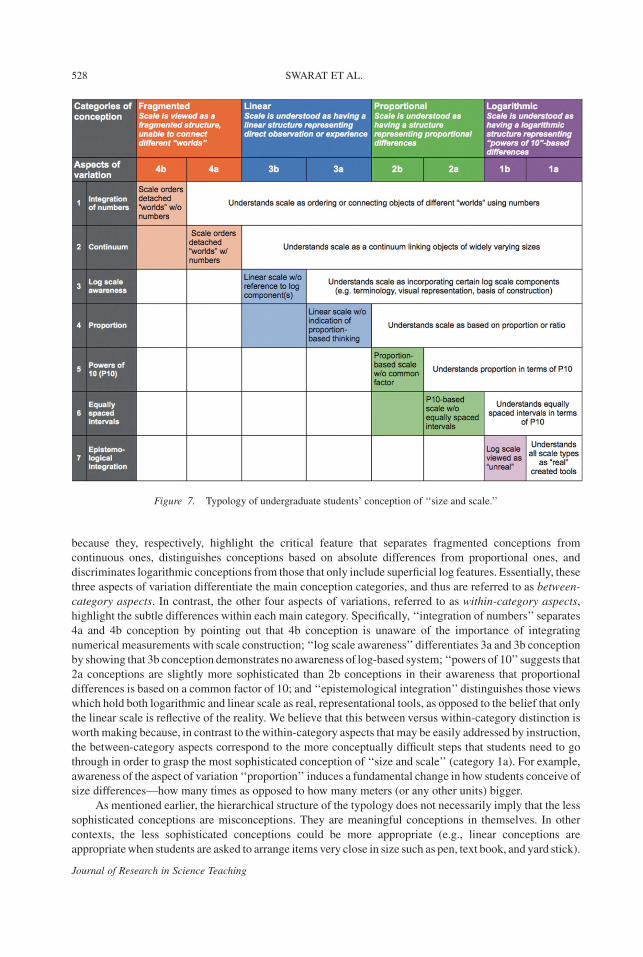
typology of conceptions (Figure 7) provides a map of these categories and sub-categories of conception, and
describes the key aspects of variation that differentiates between them.
As Figure 7 shows, the main categories of conception (1–4) are listed horizontally in the header row,
with two sub-categories (1a-1b, 2a-2b, 3a-3b, 4a-4b) within each category. Within the logarithmic category,
the sub-categories 1a and 1b distinguish between 1a student conceptions (e.g.,Walter), which demonstrate an
awareness of the applicability and epistemological equivalence of both the logarithmic scale and the linear
scale (though viewing the former as more advantageous and appropriate in the context), and 1b conceptions
(e.g., Joe) which view the logarithmic scale as an invention suited for scientific purposes only as opposed to
the linear scale which is more realistic. Students with conceptions in sub-categories 2a and 2b all recognize
the importance of scale based on proportional differences of objects’ sizes, but they differ in that studentswith
2a conceptions (e.g., Karen) calculated the proportional differences based on a common factor of 10, whereas
studentswith 2b conceptions (e.g., Jeremy) did the proportional calculation by using simple divisions.Within
the linear conception category, sub-category 3a conceptions (e.g., Katie) are distinguished by an awareness of
some aspects of logarithmic scale, whereas sub-category 3b conceptions (e.g., Amy) lack such awareness. In
the fragmented category of conceptions, sub-category 4a (e.g., Katrina) and 4b (e.g., Tom) distinguish
between students who are able to integrate numerical measurements within their scale and those who are
unaware of the use of numbers.
The order in which the categories are arranged (i.e., 4b at the left end to 1a at the right end1) corresponds
to a hierarchical progression of less to more sophisticated understanding. The advance in sophistication is
described by the increased complexity of student understanding in terms of their awareness of the key aspects
of variation differentiating the categories and sub-categories of conception. There are seven aspects of
variation which are listed in the first column of the typology. For example, conception 4b describes the view
that scale orders detached ‘‘worlds’’ in a linear fashion, but with no actual numbers associated with such
ordering. This conception contrasts with the other categories in terms of the first aspect of variation
‘‘integration of number’’: all the other categories of conception (4a-1a) recognize the integration of numbers
with scale (regardless of the type of scale chosen). Similarly, the aspect of variation ‘‘proportion’’ sets apart
categories up to 3a from categories 2b and above—the conceptions in latter categories all exhibit the
awareness of the role of proportion in the understanding of scale, whereas the former do not. The most
advanced conceptions display an awareness of all seven aspect of variation.
While these aspects of variation collectively describe the relationship between the conception
categories, we view some of them as playing a more important role in defining the structure of the typology.
The aspects of variation ‘‘continuum,’’ ‘‘proportion,’’ and ‘‘equally spaced intervals’’ are such aspects,
TYPOLOGY OF SIZE AND SCALE 527
Journal of Research in Science Teaching
because they, respectively, highlight the critical feature that separates fragmented conceptions from
continuous ones, distinguishes conceptions based on absolute differences from proportional ones, and
discriminates logarithmic conceptions from those that only include superficial log features. Essentially, these
three aspects of variation differentiate the main conception categories, and thus are referred to as between-
category aspects. In contrast, the other four aspects of variations, referred to as within-category aspects,
highlight the subtle differences within each main category. Specifically, ‘‘integration of numbers’’ separates
4a and 4b conception by pointing out that 4b conception is unaware of the importance of integrating
numerical measurements with scale construction; ‘‘log scale awareness’’ differentiates 3a and 3b conception
by showing that 3b conception demonstrates no awareness of log-based system; ‘‘powers of 10’’ suggests that
2a conceptions are slightly more sophisticated than 2b conceptions in their awareness that proportional
differences is based on a common factor of 10; and ‘‘epistemological integration’’ distinguishes those views
which hold both logarithmic and linear scale as real, representational tools, as opposed to the belief that only
the linear scale is reflective of the reality. We believe that this between versus within-category distinction is
worthmaking because, in contrast to thewithin-category aspects that may be easily addressed by instruction,
the between-category aspects correspond to the more conceptually difficult steps that students need to go
through in order to grasp the most sophisticated conception of ‘‘size and scale’’ (category 1a). For example,
awareness of the aspect of variation ‘‘proportion’’ induces a fundamental change in how students conceive of
size differences—how many times as opposed to how many meters (or any other units) bigger.
As mentioned earlier, the hierarchical structure of the typology does not necessarily imply that the less
sophisticated conceptions are misconceptions. They are meaningful conceptions in themselves. In other
contexts, the less sophisticated conceptions could be more appropriate (e.g., linear conceptions are
appropriatewhen students are asked to arrange items very close in size such as pen, text book, and yard stick).
Figure 7. Typology of undergraduate students’ conception of ‘‘size and scale.’’
528 SWARAT ET AL.
Journal of Research in Science Teaching
Indeed, it is our belief that experts differ from novices not only in terms of the sophistication of the
understanding but also in terms of the knowledge about when and which conception of a phenomenon is
appropriate to apply in a particular context.Our goal of constructing the typology is to describe (as opposed to
judge) the realm of conceptions students hold about ‘‘size and scale,’’ which hopefully can serve as guidance
for students to self-diagnose their own understanding, and for instructors to identify and then address the
strengths and weaknesses in their students’ conceptions.
Discussion
While themounting interest in nanoscience is placing an increasing demand for schools and universities
to teach relevant topics (Stevens et al., 2009; Wansom et al., 2009), little is known about how students
understand one of its fundamental concepts—‘‘size and scale.’’ Focusing on the undergraduate population,
we developed a typology that identified four categories (eight sub-categories) of conceptions, and seven
aspects of variation that characterized the range of student conceptions.
Critical Components of Logarithmic Conception
Logarithmic scale is an effective tool to aid the transition from nanoscale to macroscale, which makes
the logarithmic conception (category 1a and 1b) a critical level of understanding for student to have. The
aspects of variation in our typology suggest that the development of this level of conception is not an ‘‘all or
none’’ process; rather, there are several critical elements (identified by the between-category aspects of
variations) that students need to integrate before fully understanding the logarithmic scale. Specifically, they
need to understand that the log scale connects very big and very small objects on a continuous scale (the
‘‘continuum’’ aspect of variation), to conceptualize size differences (particularly large ones) in terms of
proportions (the ‘‘proportion’’ aspect of variation), to transform proportional differences into appropriate
representation on a logarithmic scale (the ‘‘equally spaced interval’’ aspect of variation). In other words,
students need tomake three key ‘‘mental switches’’ in their conceptual system—from the fragmented view to
the continuous view of different ‘‘worlds,’’ from the use of subtraction to division in calculating objects’ size
differences, and from the interpretation of each unit length on the scale as representing single unit of absolute
difference (e.g., 1m) to representing the difference of one power in terms of ‘‘powers of 10.’’
The importance of the ‘‘mental switch’’ regarding the continuous nature of scale echoes the observation
by Tretter and colleagues (2006) that experts were able to view and relate different scales (e.g., nanoscale,
microscale, macroscale) along a continuum, and move directly from one ‘‘world’’ to another depending on
the context. This contrasts with the fragmented conception held by some of our participants, suggesting that
understanding the continuous nature of scale is a preliminary step toward the logarithmic conception. The
significance of thinking in terms of proportions was also suggested by Delgado’s work (2009, 2010). After
examining students ranging from middle school to undergraduate level, Delgado (2009) constructed a six-
level learning progression for ‘‘size and scale.’’ The use of proportional reasoning to connect relative scale or
absolute sizewas one of the critical skills that characterized themore sophisticated levels of understanding. In
a related study, Delgado (2010) asked undergraduate students to construct graphic representation of scales,
and found that the ability to ‘‘partition an interval,’’ which required thinking in proportional terms, to be
difficult for students to grasp. Similarly, the difficulty of grasping the idea of equally spaced intervals on a
logarithmic scalewas also reported in a study of college studentswho placed historical events on a ‘‘powers of
ten’’ number line (Confrey, 1991). The results revealed that students often had a superficial understanding of
the logarithmic scale without truly understanding the meaning of equally spaced proportional intervals. The
tension between additive (subtractive) and multiplicative (divisive) thinking led to a ‘‘hybrid’’ conception
between the linear and the logarithmic scale, which is similar to the examples in the proportional conception
category reported here.
Two Underlying Conceptual Dimensions
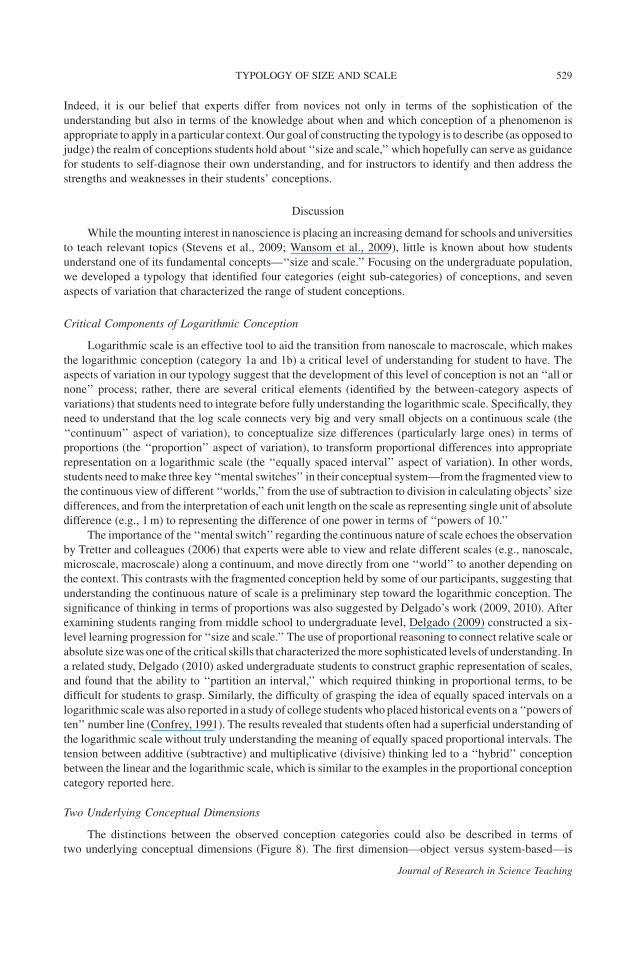
The distinctions between the observed conception categories could also be described in terms of
two underlying conceptual dimensions (Figure 8). The first dimension—object versus system-based—is
TYPOLOGY OF SIZE AND SCALE 529
Journal of Research in Science Teaching
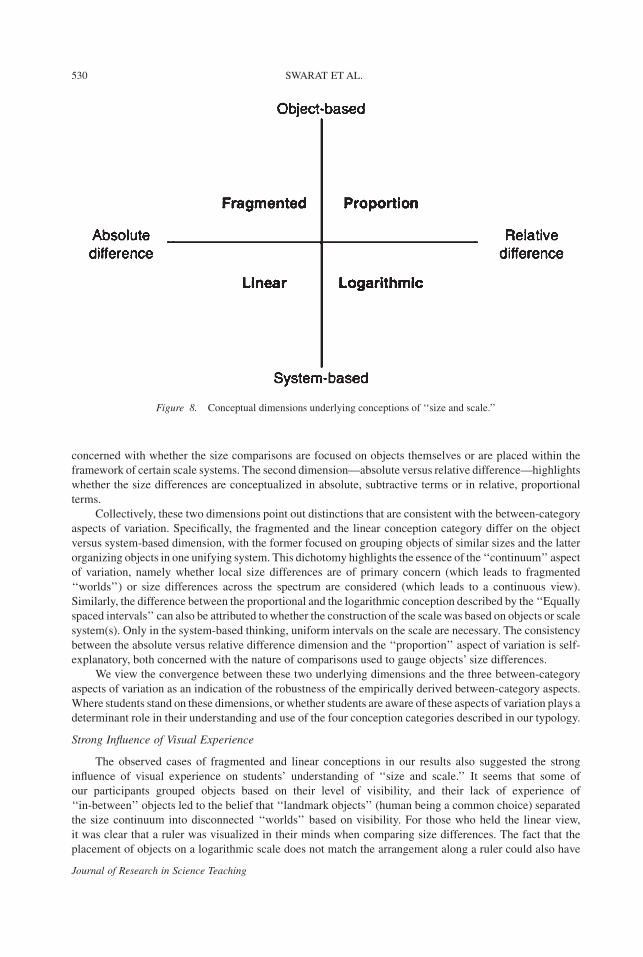
concerned with whether the size comparisons are focused on objects themselves or are placed within the
framework of certain scale systems. The second dimension—absolute versus relative difference—highlights
whether the size differences are conceptualized in absolute, subtractive terms or in relative, proportional
terms.
Collectively, these two dimensions point out distinctions that are consistent with the between-category
aspects of variation. Specifically, the fragmented and the linear conception category differ on the object
versus system-based dimension, with the former focused on grouping objects of similar sizes and the latter
organizing objects in one unifying system. This dichotomy highlights the essence of the ‘‘continuum’’ aspect
of variation, namely whether local size differences are of primary concern (which leads to fragmented
‘‘worlds’’) or size differences across the spectrum are considered (which leads to a continuous view).
Similarly, the difference between the proportional and the logarithmic conception described by the ‘‘Equally
spaced intervals’’ can also be attributed towhether the construction of the scalewas based on objects or scale
system(s). Only in the system-based thinking, uniform intervals on the scale are necessary. The consistency
between the absolute versus relative difference dimension and the ‘‘proportion’’ aspect of variation is self-
explanatory, both concerned with the nature of comparisons used to gauge objects’ size differences.
We view the convergence between these two underlying dimensions and the three between-category
aspects of variation as an indication of the robustness of the empirically derived between-category aspects.
Where students stand on these dimensions, or whether students are aware of these aspects of variation plays a
determinant role in their understanding and use of the four conception categories described in our typology.
Strong Influence of Visual Experience
The observed cases of fragmented and linear conceptions in our results also suggested the strong
influence of visual experience on students’ understanding of ‘‘size and scale.’’ It seems that some of
our participants grouped objects based on their level of visibility, and their lack of experience of
‘‘in-between’’ objects led to the belief that ‘‘landmark objects’’ (human being a common choice) separated
the size continuum into disconnected ‘‘worlds’’ based on visibility. For those who held the linear view,
it was clear that a ruler was visualized in their minds when comparing size differences. The fact that the
placement of objects on a logarithmic scale does not match the arrangement along a ruler could also have
Figure 8. Conceptual dimensions underlying conceptions of ‘‘size and scale.’’
530 SWARAT ET AL.
Journal of Research in Science Teaching
contributed to the belief that the logarithmic scale is an artificial representational tool and does not reflect
the reality.
Our students are not the only ones who relied heavily on visual experience. Even experienced
professionals (Jones &Taylor, 2009) acknowledged the difficulty of conceptualizing very small or very large
size scales because they cannot be easily seen. Interestingly, a study of visual impaired students (Jones,
Taylor, & Broadwell, 2009) demonstrated that while their scale accuracy also decreased the further objects
were removed from the human range, theyweremore accurate than students with normal sight inmaking size
estimations in the small and large ends of the scale.
Instructional Implications
The considerable amount of variation revealed in our data suggested that current instruction is not
effective in helping students develop a sophisticated understanding of ‘‘size and scale.’’ One implication of
our typology is that instructional emphasis should be placed on the aforementioned between-category aspects
of variation.
Given students’ strong reliance on visual experience, one way to help students comprehend the
continuous nature of scale could be to provide students with opportunities of visualizing objects of dramatic
size differences in connection to each other. In fact, the success of this approach has been documented for the
use of the film Powers of Ten (Jones et al., 2007), which shows how things look at different size scales by
zooming in and out of the human range. Stevens and colleagues (Stevens et al., 2007) also demonstrated that
even limited amount of visualization exposure in a 2-week science camp was able to generate significant
learning gains on size characterization. Visualization could also help students better grasp how objects differ
in relation to each other, and thus begin to see the advantages of comparing them in proportional (instead of
absolute) terms.
Though yet to be confirmed, our typology suggests that proportional reasoningmarks a critical transition
point in students’ understanding of logarithmic scale, or in other words, a potentially intermediate step
between the linear and the logarithmic conception. This possible trajectory receives some support from its
convergence with the additive to multiplicative reasoning progression in the mathematical education
literature (e.g., Confrey, 1991; Smith&Confrey, 1994), and from preliminary data collected from students of
different education levels (Park, Swarat, Light, & Drane, 2010). As such, instructional activities that
emphasize the differences between absolute and proportional reasoningwould be useful in advancing student
conceptions of not only ‘‘size and scale,’’ but other related areas that require a solid understanding of
proportional comparison.
The proposed typology, with its guiding framework of Variation Theory, is in fact quite valuable in
designing such instructional interventions. Specifically, instructional activities which provide students an
opportunity to become aware of the key aspects of variation distinguishing their current conceptionwithmore
advanced conception(s) can be provided to help them understand the strengths and weakness of different
conceptions, realize the connections between them, and consequently establish a sophisticated understanding
of ‘‘size and scale.’’ We recently piloted an instructional intervention following this strategy (Park, Swarat,
Light, & Drane, 2009). Its preliminary success indicated the usefulness of the typology as a guide for
instruction design.
Future Directions
Our results raised an interesting possibility that proportional reasoning is a productive intermediate step
in the development of a sophisticated scale understanding. This proposed developmental path remains to be
tested and verified by future studies. Furthermore, it is unclear whether the ability to grasp proportional
reasoning is associated with levels of knowledge acquisition—are there certain amount of exposure to
different scales, or certain accumulation of mathematical knowledge necessary for students to make the
transition from absolute to proportional thinking? These questions also need to be answered, preferably with
longitudinal data.
The validity of our typology, as discussed earlier in the article, is threatened by the relative small number
of participants in the interview studies, and to a certain extent, the brief nature of student responses in the
TYPOLOGY OF SIZE AND SCALE 531
Journal of Research in Science Teaching
survey study. Further validation of the typology needs to be conducted with a larger group of students,
preferably through detailed interviews, to confirm whether all of the categories and sub-categories of
conceptions reported here are representative of the different ways students understand scale.
Our typology is also derived from a relatively homogenous group of students at the college level. While
we believe the findings will apply to similar student population, it is unlikely that the typology is
comprehensive enough to describe the conceptions of all college students, let alone students at theK-12 level.
We have begun to explore high school students’ conceptions of ‘‘size and scale,’’ and anticipate expanding
our research to include students from different educational background in order to further verify and expand
our typology.
The assessment items employed in the study were few, and were not validated through a
psychometrically rigorous process. Survey items 2 and 3, as we found out, were far from ideal in eliciting
a wide range of student conceptions. Although the written justifications in addition to the multiple
choice responses were quite informative, we cannot rule out potential threats to the validity of the items
such as soliciting biased responses or favoring only one particular type of thinking. Generating a larger
pool of items and validating them through a more rigorous round of testing would be the reasonable next
step.
Lastly, given the context of our studies, we placed emphasis on how students understand the logarithmic
scale in the context of comparing objects’ physical sizes, which is one of the many situations where the
concept of ‘‘size and scale’’ could apply. It is unclear howuseful our typologywould be in contextswhere size
does not refer to spatial features such as length, area, or volume (e.g., the Richter’s scale for measuring
earthquake magnitude, the decibel system for measuring sound pressure level). We are interested in carrying
out our research in these related areas to further validate our typology.
The authors would like to acknowledge the National Science Foundation and the National Center for
Learning and Teaching: Nanoscale Science and Engineering (Grant No. ESI-0426328/002) for
support for the research reported in this study.
Notes
1It should be pointed out that the choice of using smaller numbers and letters to represent the more advanced
conceptions is based on the assumption that given our data were collected with undergraduate students, it is probable that
we did not observe less advanced conceptions which are likely to be held by younger students. Thus our ordering of
categories (and sub-categories) allows for the possibility of extending our typology based on related research conducted
with k-12 students.
References
Akerlind, G. S. (2005). Variation and commonality in phenomenographic research methods. Higher Education
Research and Development, 24(4), 321–334.
AmericanAssociation for theAdvancement of Science (AAAS). (1993). Benchmarks for science literacy. NewYork:
Oxford University Press.
Bowden, J., & Marton, F. (1998). The university of learning. London: Kogan Page.
Castellini, O. M., Walejko, G. K., Holladay, C. E., Thiem, T. J., Zenner, G. M., & Crone, W. C. (2007).
Nanotechnology and the public: Effectively communicating nanoscale science and engineering concepts. Journal of
Nanoparticle Research, 9(2), 183–189.
Confrey, J. (1991). Learning to listen:A student’s understanding of powers of ten. In E. vonGlasersfeld (Ed.), Radical
constructivism in mathematics education. (pp. 111–138). Dordrecht: Kluwer.
Delgado, C., (2009) Development of a research-based learning progression for middle school through undergraduate
students’ conceptual understanding of size and scale. Unpublished Dissertation. University of Michigan.
Delgado, C., (2010) Knowledge of scale construction for graphing in undergraduate students. National Association
for Research in Science Teaching Annual Conference, Philadelphia, PA.
Delgado, C., Stevens, S. Y., Shin, N., Yunker, M. L., & Krajcik, J. S., (2007). The development of students’
conceptions of size. National Association for Research in Science Teaching Annual Conference, New Orleans, LA.
Eames Office. (2009). Powers of Ten. Retrieved from http:/ /www.powersof10.com/ (accessed on November 22,
2009).
532 SWARAT ET AL.
Journal of Research in Science Teaching
Jones,M. G., & Taylor, A. R. (2009). Developing a sense of scale: Looking backward. Journal of Research in Science
Teaching, 46(4), 460–475.
Jones, M. G., Taylor, A. R., & Broadwell, B. (2009). Concepts of scale held by students with visual impairment.
Journal of Research in Science Teaching, 46(5), 506–519.
Jones,M. G., Taylor, A., Minogue, J., Broadwell, B.,Wiebe, E., & Carter, G. (2007). Understanding scale: Powers of
ten. Journal of Science Education and Technology, 16(2), 191–202.
Jones,M.G., Tretter, T., Taylor,A.,&Oppewal, T. (2008). Experienced andnovice teachers’ concepts of spatial scale.
International Journal of Science Education, 30(3), 409–429.
Light, G., Swarat, S., Park, E.-J., Drane, D., Tevaarwerk, E., & Mason, T., (2007) Understanding undergraduate
students’ conceptions of a core nanoscience concept: Size and scale. Proceedings of the First International Conference on
Research in Engineering Education, Honolulu, Hawaii.
Micari, M., Light, G., Calkins, S., & Streitwieser, B. (2007). Assessment beyond performance: Phenomenography in
educational evaluation. American Journal of Evaluation, 28(4), 458–476.
Marton, F., & Booth, S. (1997). Learning and awareness. Mahwah, NJ: Lawrence Erlbaum Associates.
Marton, F., & Pang, M. (2006). On some necessary conditions of learning. The Journal of the Learning Sciences,
15(2), 193–220.
Marton, F., & Tsui, A. (2004). Classroom discourse and the space of learning. Hillsdale, NJ: Lawrence Erlbaum.
Pang, M., & Marton, F. (2005). Learning theory as Teaching Resource: Enhancing students understanding of
economic concepts. Instructional Science, 33, 159–191.
Park, E.-J., Swarat, S., Light, G., & Drane, D., (2009). The impact of a teaching intervention for size and scale based
on conceptual variations. Proceedings of the National Association for Research in Science Teaching Annual Conference,
Garden Grove, CA.
Park, E.-J., Swarat, S., Light, G.,&Drane,D., (2010). Student understanding of scale: Fromadditive tomultiplicative
reasoning in the construction of scale representation by ordering objects in a number line. National Association for
Research in Science Teaching Annual Conference, Philadelphia, PA.
Patton, M. Q. (2001). Qualitative research and evaluation methods. 3rd edition. Thousand Oaks, CA: Sage
Publications.
Smith, E., & Confrey, J. (1994). Multiplicative structures and the development of logarithms: What was lost by the
invention of functions? In: G. Harel & J. Confrey (Eds.), The development of multiplicative reasoning in the learning of
mathematics (pp. 331–360). Albany NY: State University of New York Press.
Smith, J. P., diSessa, A. A., & Roschelle, J. (1993). Misconceptions reconceived: A constructivist analysis of
knowledge in transition. Journal of the Learning Sciences, 3, 115–163.
Stevens, S., Shin, N., Delgado, C., Cahill, C., Yunker, M., &Krajcik, J., (2007). Fostering students’ understanding of
interdisciplinary science in a summer science camp. National Association for Research in Science Teaching Annual
Conference, New Orleans, LA.
Stevens, S., Sutherland, L., & Krajcik, J. (2009). The big ideas of nanoscale science and engineering: A guide book
for secondary teachers. National Science Teachers Association Press, Arlington, VA.
Taylor, A. R. (2008). Students’ and teachers’ conceptions of surface area to volume in science contexts:What factors
influence the understanding of the concept of scale? Unpublished Dissertation, North Carolina State University.
Tretter, T. R., Jones, M. G., Andre, T., Negishi, A., & Minogue, J. (2006). Conceptual boundaries and distances:
Students’ and experts’ concepts of the scale of scientific phenomena. Journal of Research in Science Teaching, 43(3),
282–319.
Tretter, T. R., Jones, M. G., & Minogue, J. (2006). Accuracy of scale conceptions in science: Mental maneuverings
across many orders of spatial magnitude. Journal of Research in Science Teaching, 43(10), 1061–1085.
Vosniadou, S., & Verschaffel, L. (2004). Extending the conceptual change approach to mathematics learning and
teaching. Learning and Instruction, 14, 445–451.
Waldron, A. M., Spencer, D., & Batt, C. A. (2006). The current state of public understanding of nanotechnology.
Journal of Nanoparticle Research, 8, 569–575.
Wansom, S., Mason, T., Hersam,M., Drane, D., Light, G., Cormia, R., Stevens, S., & Bodner, G. (2009). A rubric for
post-secondary degree programs in nanoscience and nanotechnology. International Journal of Engineering Education,
25(3), 615–627.
TYPOLOGY OF SIZE AND SCALE 533
Journal of Research in Science Teaching
All in-text references underlined in blue are linked to publications on ResearchGate, letting you access and read them immediately.