Development of Crop Typology in Bangladesh
362
International Crop Research Institute for the Semi- Arid Tropics (ICRISAT) Patancheru, Andhra Pradesh, India Draft Final Report On Development of Crop Typology for Bangladesh Dhaka March, 2014 i
-
Upload
independent -
Category
Documents
-
view
3 -
download
0
Transcript of Development of Crop Typology in Bangladesh
International Crop Research Institute for the Semi-Arid Tropics (ICRISAT)
Patancheru, Andhra Pradesh, India
Draft Final ReportOn
Development of Crop Typology for BangladeshDhaka
March, 2014
i

ii

Table of Contents
Table of Contentsi
List of Tables 4
List of Figures 11
List of Pictures 11
List of Abbreviations 13
Glossary 15
1. Introduction 1
1.1 Agricultural production, population growth and environment-theglobal challenges 1
1.2 Population and crop production in Bangladesh and Asian Countries1
1.3 The agricultural sector and crop production in Bangladesh and Asian countries 2
1.4 The statement of problem 3
1.5 The research question 3
1.6 Objectives of the study 4
1.7 Rationale of the study 4
1.8 Crop typology as new paradigm concept used for sustainable crop production system 4
1.9 Crop typology components and their structural linkages for development of crop typology in Bangladesh 5
iii

1.10 Developing dimensions, factors and principles for development of crop typology in Bangladesh 6
1.11 Development of a framework for developing typical crop typology in Bangladesh 10
1.12 A symbolic presentation of typical structural crop typology in Bangladesh 11
1.13 Approach and Methodology 11
1.14 Research Team 14
1.15 Output of the research 142. Literature Review15
3. Situation Analysis 17
3.1 Geo-demographic features of Bangladesh17
3.1.1 Geographical situation..................................17
3.1.2 Demographic features....................................17
3.1.3 Division wise population by sex and household...........19
3.1.4 Administrative structure of Bangladesh..................19
3.2 Land use for crop production in Bangladesh 20
3.2.1 Land use under crop production..........................20
3.3 Crop categories and types in Bangladesh 21
3.3.1 Crop categories in Bangladesh...........................21
3.3.2 Crop types based on production coverage area............21
3.3.3 Crop types based on seasonal variation..................22
3.3.4 Crop Diversification and crop rotation in Bangladesh....24
3.3.5 Cropping pattern based on cropping seasons (Kharif-I, Kharif-II and Rabi) in Bangladesh.............................25
3.3.6 Cropping patterns based on Districts (area grown) in Bangladesh....................................................27
3.3.7 Crop varieties in Bangladesh............................30
3.4 Agro-meteorological condition for crop production34
3.4.1 Rainfall................................................35
3.4.2 Temperature.............................................36
3.4.3 Humidity................................................38
iv
3.4.4 Sunshine................................................39
3.5 Natural Disasters 40
3.5.1 Flood Prone.............................................40
3.5.2 Flash flood prone.......................................41
3.5.3 Drought Prone...........................................41
3.5.4 Saline prone............................................42
3.6 Agro-Ecological Zones (AEZs) in Bangladesh 43
3.6.1 Area, land type, soil properties based on Agro Ecological Zones (AEZ) in Bangladesh.....................................43
3.6.2 Soil fertility based on agro-ecological zones...........45
3.6.3 Crop varieties based on Agro Ecological Zones (AEZs) in Bangladesh....................................................47
3.6.4 Land types in Bangladesh................................52
3.6.5 Crop suitability by land types in Bangladesh............54
3.6.6 Crop suitability by soil textures.......................54
3.7 Input Use in Bangladesh 55
3.7.1 Seed....................................................55
3.7.2 Fertilizer..............................................55
3.7.3 Pesticide...............................................57
3.7.4 Irrigation..............................................58
3.8 Infrastructure 58
3.8.1 Electricity.............................................58
3.8.2 Communication...........................................59
3.9 Crop Production in Bangladesh 61
3.9.1 Major crops and vegetable productions...................61
3.9.2 Horticultural crop production in Bangladesh.............61
3.10 Socio Economic situation in Bangladesh62
3.10.1 Distribution of age group by Division in Bangladesh.....62
3.10.2 Labour employment by sector in Bangladesh...............62
3.10.3 Division wise labour employment by sector in Bangladesh. 63
3.10.4 Poverty.................................................63
v

3.10.5 Types of agricultural farms.............................65
3.10.6 Farmer’s classification.................................65
3.10.7 Agriculture labour wage rate............................66
3.10.8 Division wise agricultural and non-agricultural occupational status...........................................67
3.10.9 Population engaged in agricultural activities...........67
3.10.10Status of Migration....................................68
3.10.11Literacy and Education.................................68
3.10.12Government and Non-Government Organizations............694. Crop Typology 71
4.1 Characterization for Development Crop Typology 715. Conclusion and Recommendation 255
References 257
vi
List of Tables
Table 1.1: Population growth and crop production in Asian Countries (2000-2011) 2
Table 1.2: Percent of land area planted to crops in Bangladesh, 2011 2
Table 1.3: Trend of Crop Production in Bangladesh and Asian Countries (2000-2011) 3
Table 1.4: Dimensions, factors and principles for development of crop typology of Bangladesh 7
Table 1.5: Steps, task, study, data analysis tools and techniques fordevelopment of crop typology in Bangladesh 12
Table 3.1: Growth of population during 2001 to 2012 in Bangladesh (in million) 17
Table 3.2: Population trend of Bangladesh, 1974-2011 18
Table 3.3: Divisionwise population by sex, sex ratio, number and average size of households, 2011 19
Table 3.4: Total land area, cultivable land and fallow land under Upazilas, Districts and Divisions 20
Table 3.5: General cropping pattern based on rainfed and irrigated condition in Bangladesh 25
Table 3.6: Division and District wise major cropping patterns including horticulture crops in Bangladesh 27
Table 3.7: Crop type, name and number of most used HYV and hybrid varieties in Bangladesh 30
Table 3.8: Development of crop variety types in Bangladesh 31
Table 3.9: Monthly average rainfall (mm) pattern in Bangladesh (2000-2011) 35
Table 3.12: Monthly average maximum temperature (°C) (2000-2011) 37
Table 3.14: Monthly average humidity in Bangladesh (2000-2011) 38
Table 3.17: Area, land type, soil properties and textures of AEZs in Bangladesh 44
Table 3.18: Soil fertility based on AEZs in Bangladesh 46
Table 3.19: Major field and horticultural crops grown according to AEZs 48
Table 3.20: Crop grown by different land types in Bangladesh 54
7

Table 3.21: Crop grown by different soil textures 54
Table 3.22: Use of fertilizer in field crops 56
Table 3.23: Use of fertilizer and pesticides in the horticulture crops56
Table 3.24: Detailed use of pesticide in crop field in Bangladesh 57
Table 3.25: Irrigated areas by Divisions in Bangladesh (2005-2006 and 2011-2012) 58
Table 3.26: Increase of electricity connection 59
Table-3.27: Roads at upazila, union and village level in Bangladesh 59
Table 3.28: Annual area coverage and production of crop varieties in Bangladesh 61
Table 3.30: Population distribution by age group in Bangladesh 62
Table 3.31: Employment by major occupation (million) 63
Table-3.32: Percentage of agriculture dependent population 63
Table-3.33: Different Farmers types 65
Table 3.34: Farmer’s classification (Land ownership) 66
Table-3.35: Wage rate by different units in Bangladesh 66
Table-3.36 Division wise agricultural and non-agricultural occupational status 67
Table-3.37: Population engaged in agricultural activities67
Table 3.38: Division wise migration situation. 68
Table 3.39: Educational status in Bangladesh (2001-2012) 68
Table 3.40: Literacy rate in Bangladesh 69
Table-3.41: Government and non- govt. organizations 69
Table-1: Population in the pilot area 73
Table-2: Field and horticultural crops grown according to AEZs 77
Table 3: Detailed land type of the pilot area 78
Table-4: Detailed land use of the pilot area 79
Table5: Detailed soil texture of top soil (0-15cm) in pilot area 81
Table- 6: Detailed distribution of available soil moisture in the pilotarea 83
Table 7: Soil salinity in the pilot area 85
Table -8: Detailed drainage characteristics of the pilot area 87
8

Table-9: Existing cropping patterns with area in the pilot area 89
Table ?: Input (Seed, Labour, Fertilizer and Pesticides) used in the Dacope pilot upazial 90
Table14: Modes of irrigation, number and area (ha) irrigated in the pilot area 91
Table 15: Incidence of poverty 2005 in the pilot area 92
Table-16: Farmers by land ownership 92
Table-17: Wage rate by different units in Dacope 92
Table-18: Agricultural and non-agricultural occupational status 93
Table-19: Population engaged in agriculture activities (7+ years) activities 93
Table 20: Literacy rate in the pilot area 93
Table-21: Educational status in Dacope 93
Table-22: Housing and sanitary status of dacope 94
Table-23: Government and non- govt. organizations 94
Table 24: Crops grown in the pilot area 95
Table-25: Existing and proposed cropping patterns for claster-1 95
Table-26: Crops grown and fertilizer application for cluster-1 96
Table27: Proposed orchard for inter cropping (Pattern-I) 97
Table28: Proposed cropping pattern for inter cropping (Pattern-II) 97
Table29: Proposed cropping pattern 99
Table 30: Proposed cropping pattern 99
Table31: Proposed cropping pattern100
Table-1: Population in the pilot area. 103
Table-2: Field and horticultural crops grown according to AEZs 105
Table-3: Detailed land use of the pilot area 109
Table -4: Detailed soil texture of the surface soil (0-15 cm) in the pilot area 111
Table- 5: Detailed distribution of available soil moisture in the pilotarea 113
Table -6: Detailed drainage characteristics of the pilot area 115
Table-7: Cropping patterns with area are presented 117
Table ?: Input used in the Khagrachhari pilot area for horticulture crops 119
9
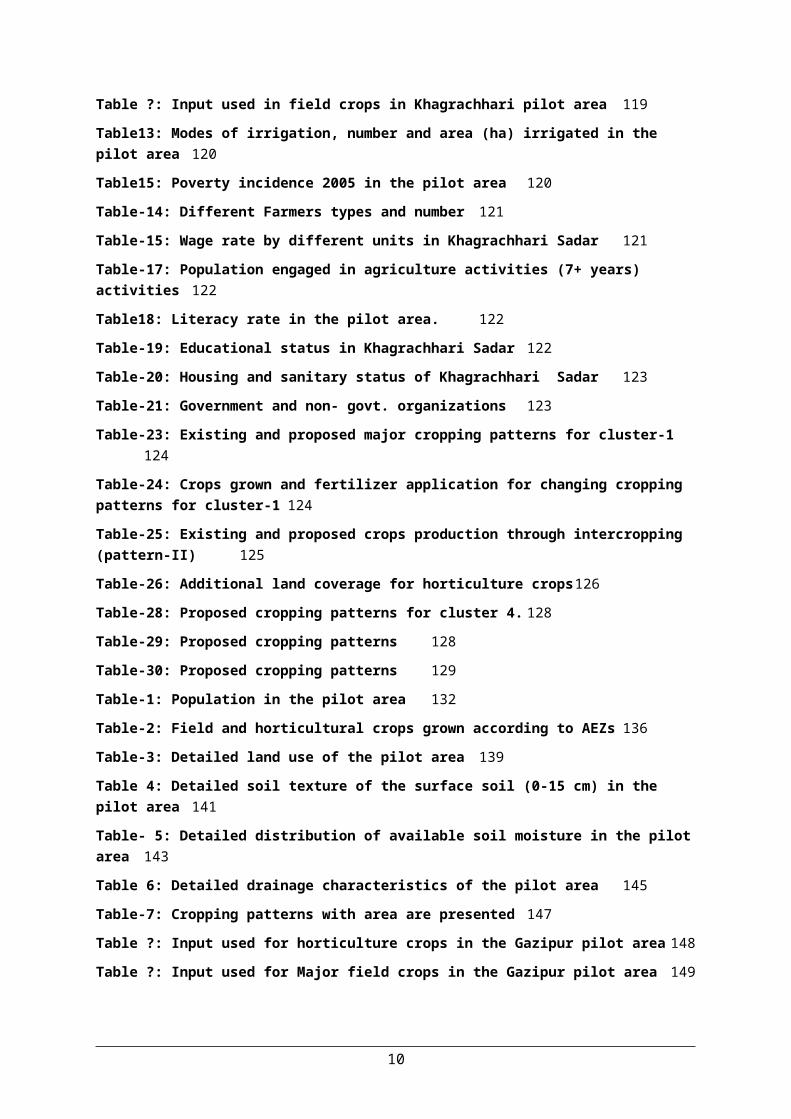
Table ?: Input used in field crops in Khagrachhari pilot area 119
Table13: Modes of irrigation, number and area (ha) irrigated in the pilot area 120
Table15: Poverty incidence 2005 in the pilot area 120
Table-14: Different Farmers types and number 121
Table-15: Wage rate by different units in Khagrachhari Sadar 121
Table-17: Population engaged in agriculture activities (7+ years) activities 122
Table18: Literacy rate in the pilot area. 122
Table-19: Educational status in Khagrachhari Sadar 122
Table-20: Housing and sanitary status of Khagrachhari Sadar 123
Table-21: Government and non- govt. organizations 123
Table-23: Existing and proposed major cropping patterns for cluster-1124
Table-24: Crops grown and fertilizer application for changing cropping patterns for cluster-1 124
Table-25: Existing and proposed crops production through intercropping (pattern-II) 125
Table-26: Additional land coverage for horticulture crops126
Table-28: Proposed cropping patterns for cluster 4. 128
Table-29: Proposed cropping patterns 128
Table-30: Proposed cropping patterns 129
Table-1: Population in the pilot area 132
Table-2: Field and horticultural crops grown according to AEZs 136
Table-3: Detailed land use of the pilot area 139
Table 4: Detailed soil texture of the surface soil (0-15 cm) in the pilot area 141
Table- 5: Detailed distribution of available soil moisture in the pilotarea 143
Table 6: Detailed drainage characteristics of the pilot area 145
Table-7: Cropping patterns with area are presented 147
Table ?: Input used for horticulture crops in the Gazipur pilot area 148
Table ?: Input used for Major field crops in the Gazipur pilot area 149
10

Table13: Modes of irrigation, number and area Irrigated in the pilot area 150
Table15: Poverty incidence in the pilot area 150
Table-15: Different Farmers types and number 150
Table-16: Labor wage rate in Gazipur sadar 151
Table-17: Agricultural and non-agricultural occupational status 151
Table 18: Population engaged in agriculture, industry and services (7+ years) activities151
Table19: Literacy rate in the pilot area 152
Table 20: Educational status in Gazipur sadar 152
Table-21: Sanitary and housing status of GazipurSasar 152
Table 21: Government and non- govt. organizations 153
Table 22: Crops grown in the cluster-1 153
Table-23: Existing and proposed cropping patterns for cluster-1 154
Table-24: Crops grown and fertilizer application for changing cropping patterns for claster-1 154
Table-25: Existing and proposed crop production through intercropping with Zinger (pattern-I) 155
Table-26: Existing and proposed crops production through intercropping with turmeric (pattern-II) 156
Table 27: Additional land coverage for horticulture crops158
Table-28: Proposed cropping patterns for cluster 4. 159
Table-29: Proposed cropping patterns 159
Table 30: Proposed cropping patterns 160
Table 31: Agro-economic performance of existing cropping pattern (T.Aus-T.Aman-Fallow) and Improved cropping pattern(T.Aus-T.Aman-Mung bean) rice 160
Table 32: Return of improve pattern over existing pattern160
Table-1: Population in the pilot area 163
Table-2: Field and horticultural crops grown according to AEZs 167
Table 3: Detailed land type of the pilot area 168
Table-4: Detailed land use of the pilot area 168
Table 5: Detailed soil texture of top soil (0-15cm) in pilot area 168
Table 7: Soil salinity in the pilot area 171
11
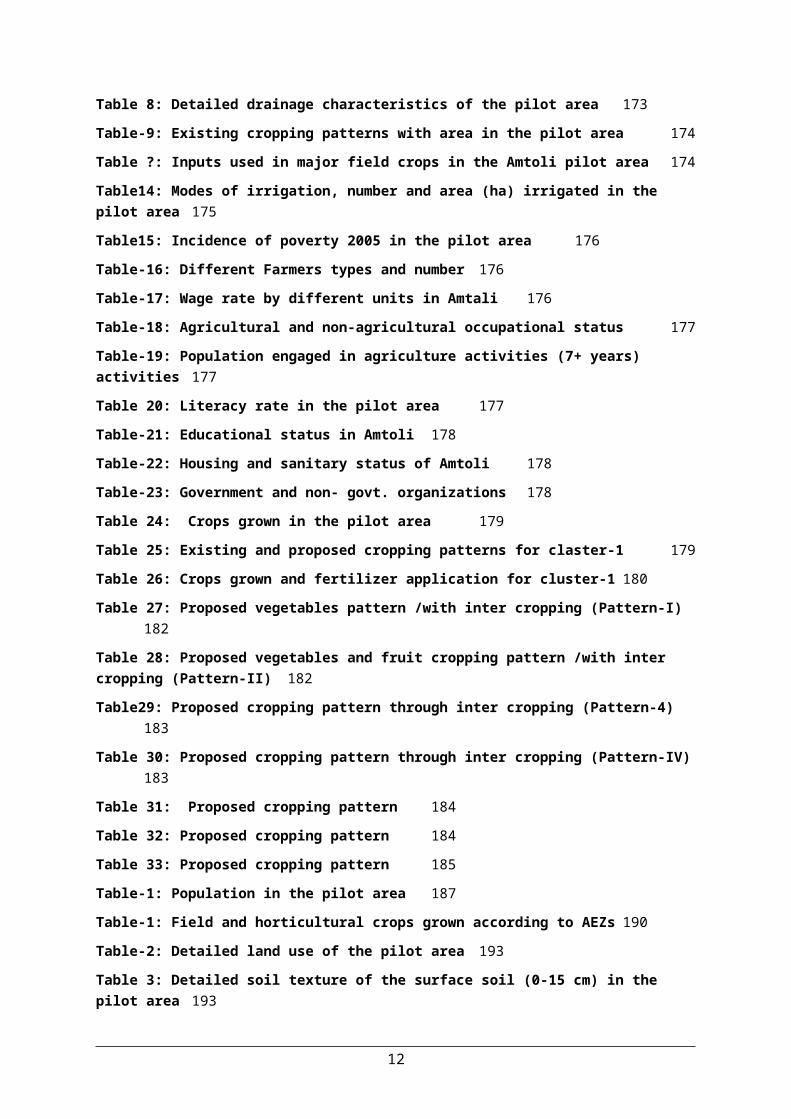
Table 8: Detailed drainage characteristics of the pilot area 173
Table-9: Existing cropping patterns with area in the pilot area 174
Table ?: Inputs used in major field crops in the Amtoli pilot area 174
Table14: Modes of irrigation, number and area (ha) irrigated in the pilot area 175
Table15: Incidence of poverty 2005 in the pilot area 176
Table-16: Different Farmers types and number 176
Table-17: Wage rate by different units in Amtali 176
Table-18: Agricultural and non-agricultural occupational status 177
Table-19: Population engaged in agriculture activities (7+ years) activities 177
Table 20: Literacy rate in the pilot area 177
Table-21: Educational status in Amtoli 178
Table-22: Housing and sanitary status of Amtoli 178
Table-23: Government and non- govt. organizations 178
Table 24: Crops grown in the pilot area 179
Table 25: Existing and proposed cropping patterns for claster-1 179
Table 26: Crops grown and fertilizer application for cluster-1 180
Table 27: Proposed vegetables pattern /with inter cropping (Pattern-I)182
Table 28: Proposed vegetables and fruit cropping pattern /with inter cropping (Pattern-II) 182
Table29: Proposed cropping pattern through inter cropping (Pattern-4)183
Table 30: Proposed cropping pattern through inter cropping (Pattern-IV)183
Table 31: Proposed cropping pattern 184
Table 32: Proposed cropping pattern 184
Table 33: Proposed cropping pattern 185
Table-1: Population in the pilot area 187
Table-1: Field and horticultural crops grown according to AEZs 190
Table-2: Detailed land use of the pilot area 193
Table 3: Detailed soil texture of the surface soil (0-15 cm) in the pilot area 193
12
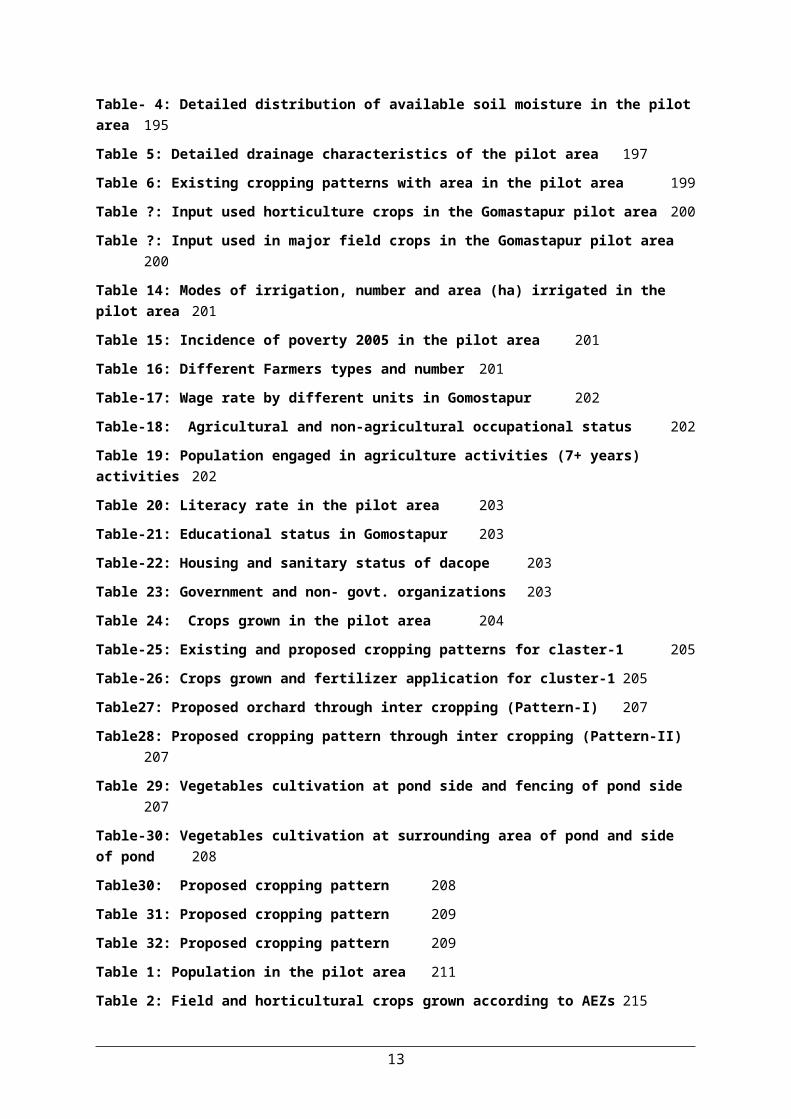
Table- 4: Detailed distribution of available soil moisture in the pilotarea 195
Table 5: Detailed drainage characteristics of the pilot area 197
Table 6: Existing cropping patterns with area in the pilot area 199
Table ?: Input used horticulture crops in the Gomastapur pilot area 200
Table ?: Input used in major field crops in the Gomastapur pilot area200
Table 14: Modes of irrigation, number and area (ha) irrigated in the pilot area 201
Table 15: Incidence of poverty 2005 in the pilot area 201
Table 16: Different Farmers types and number 201
Table-17: Wage rate by different units in Gomostapur 202
Table-18: Agricultural and non-agricultural occupational status 202
Table 19: Population engaged in agriculture activities (7+ years) activities 202
Table 20: Literacy rate in the pilot area 203
Table-21: Educational status in Gomostapur 203
Table-22: Housing and sanitary status of dacope 203
Table 23: Government and non- govt. organizations 203
Table 24: Crops grown in the pilot area 204
Table-25: Existing and proposed cropping patterns for claster-1 205
Table-26: Crops grown and fertilizer application for cluster-1 205
Table27: Proposed orchard through inter cropping (Pattern-I) 207
Table28: Proposed cropping pattern through inter cropping (Pattern-II)207
Table 29: Vegetables cultivation at pond side and fencing of pond side207
Table-30: Vegetables cultivation at surrounding area of pond and side of pond 208
Table30: Proposed cropping pattern 208
Table 31: Proposed cropping pattern 209
Table 32: Proposed cropping pattern 209
Table 1: Population in the pilot area 211
Table 2: Field and horticultural crops grown according to AEZs 215
13
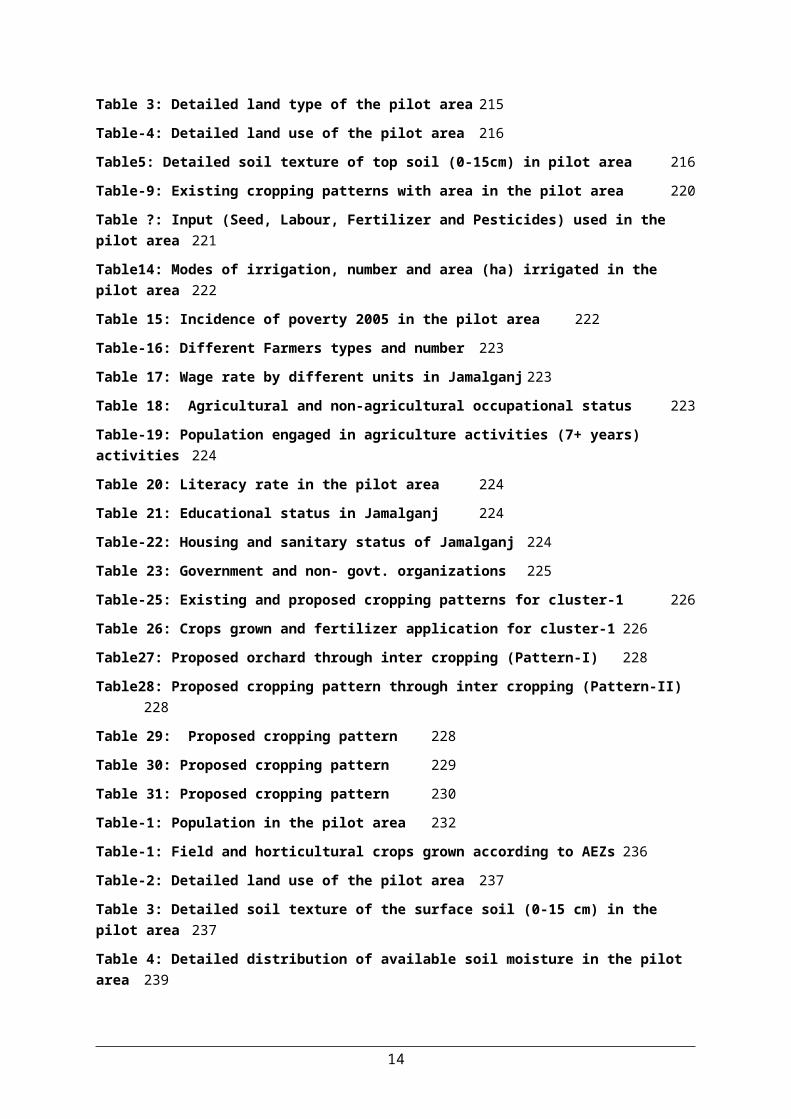
Table 3: Detailed land type of the pilot area 215
Table-4: Detailed land use of the pilot area 216
Table5: Detailed soil texture of top soil (0-15cm) in pilot area 216
Table-9: Existing cropping patterns with area in the pilot area 220
Table ?: Input (Seed, Labour, Fertilizer and Pesticides) used in the pilot area 221
Table14: Modes of irrigation, number and area (ha) irrigated in the pilot area 222
Table 15: Incidence of poverty 2005 in the pilot area 222
Table-16: Different Farmers types and number 223
Table 17: Wage rate by different units in Jamalganj 223
Table 18: Agricultural and non-agricultural occupational status 223
Table-19: Population engaged in agriculture activities (7+ years) activities 224
Table 20: Literacy rate in the pilot area 224
Table 21: Educational status in Jamalganj 224
Table-22: Housing and sanitary status of Jamalganj 224
Table 23: Government and non- govt. organizations 225
Table-25: Existing and proposed cropping patterns for cluster-1 226
Table 26: Crops grown and fertilizer application for cluster-1 226
Table27: Proposed orchard through inter cropping (Pattern-I) 228
Table28: Proposed cropping pattern through inter cropping (Pattern-II)228
Table 29: Proposed cropping pattern 228
Table 30: Proposed cropping pattern 229
Table 31: Proposed cropping pattern 230
Table-1: Population in the pilot area 232
Table-1: Field and horticultural crops grown according to AEZs 236
Table-2: Detailed land use of the pilot area 237
Table 3: Detailed soil texture of the surface soil (0-15 cm) in the pilot area 237
Table 4: Detailed distribution of available soil moisture in the pilot area 239
14

Table 6: Existing major cropping patterns with area in the pilot area241
Table ?: Input used for horticulture crops in the Pirgonj pilot area 241
Table ?: Input used in different field crops in the Pirgonj pilot area242
Table14: Modes of irrigation, number and area (ha) irrigated in the pilot area 242
Table15: Incidence of poverty 2005 in the pilot area 243
Table-16: Different Farmers types and number 243
Table-17: Wage rate by different units in Pirganj 243
Table-18: Agricultural and non-agricultural occupational status 244
Table-19: Population engaged in agriculture activities (7+ years) activities 244
Table 20: Literacy rate in the pilot area 244
Table-21: Educational status in Pirganj 245
Table-22: Housing and sanitary status of dacope 245
Table 24: Crops grown in the pilot area 247
Table-25: Existing and proposed cropping patterns for cluster-1 247
Table-26: Crops grown and fertilizer application for cluster-1 248
Table27: Proposed orchard through inter cropping (Pattern-I) 251
Table28: Proposed cropping pattern through inter cropping (Pattern-II)251
Table -29: Vegetables cultivation at pond side with Macha and fencing of pond side 251
Table-30: Vegetables cultivation at surrounding area of pond and side of pond 252
Table30: Proposed cropping pattern 252
Table 31: Proposed cropping pattern 253
Table 32: Proposed cropping pattern 253
List of Figures
Figure 1.1: Interrelated Components for crop typology development 6
15

Figure 1.2 : A symbolic presentation of typical structural crop typology in Bangladesh 11
Figure 3.1: Division wise NCA and fallow lands in Bangladesh 21
Figure 3.7: Land Types in Bangladesh, 2012 52
Figure 3.6: Land Types in Bangladesh, 2001 52
Figure 3.8.: Electricity connection in Bangladesh (2005 and 2010) 59
Figure 3.11: Farm size in Bangladesh 65
Figure: 3.12 Literacy rate and increased percentage 69
List of Pictures
Picture 1: Boro transplanting in the pilot area 90
Picture 2: Local vegetables seed used 90
Picture 3: Rice processing in the pilot area 91
Picture 4: Plant selected for seed91
Picture 5: Cabbage in the pilot area 118
Picture 6: Brinjal field in the study area 118
Picture7: Famers apply pesticide in the mango orchard 118
Picture 8:Mango orchard in the pilot area 118
Picture 9: Collected for Seed 120
Picture 10: Plant selected for seed 120
Picture 1: HYV Boro crop land in the pilot area 148
Picture 2:Oal kopi field in the pilot area 148
Picture3:Brinjal field in the pilot area 148
Picture4:Intercultural activities in the HYV boro rice field 148
Picture 1:Brinjal field in the pilot area 220
Picture 2:Country bean plant in the pilot area 220
Picture 3: Boro field with irrigation facilities 221
Picture 4: Surface water irrigation in boro crop field in the pilot area 221
Picture 5: Sweet gourd field in the pilot area 221
Picture 6: Weeding in boro field by rice weeder 221
Picture 7: Floating Gardens (Vegetable Farming) 229
16

17
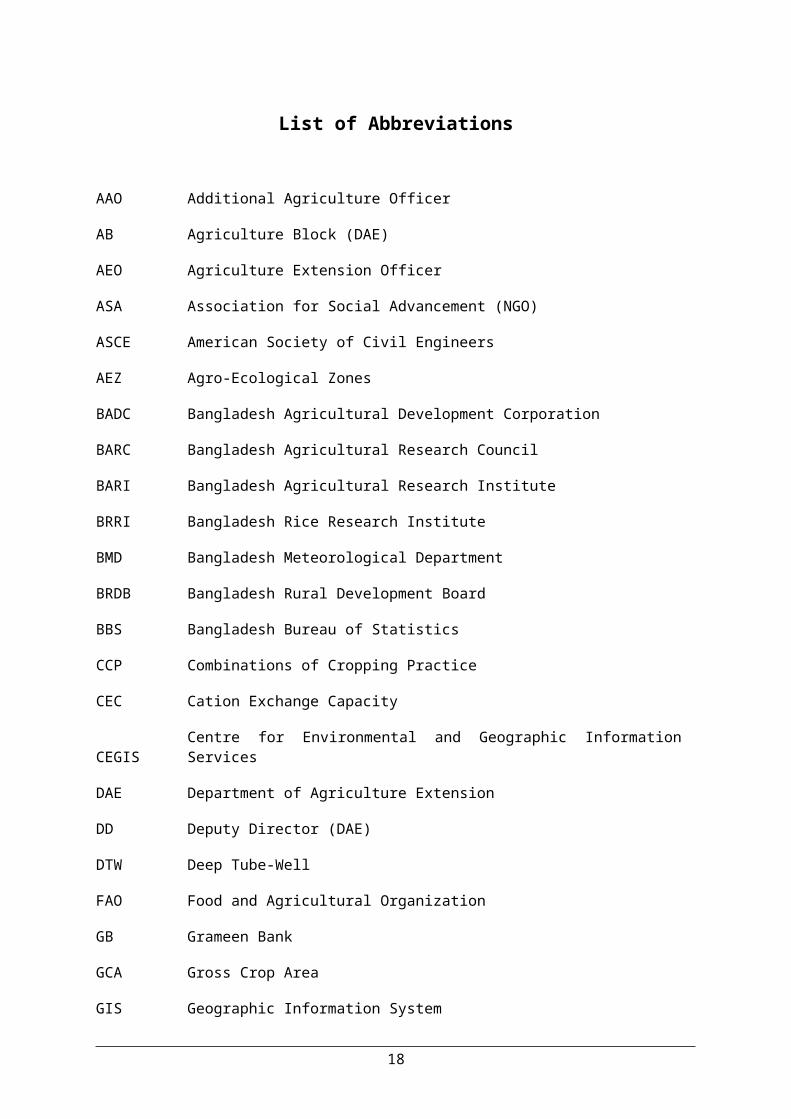
List of Abbreviations
AAO Additional Agriculture Officer
AB Agriculture Block (DAE)
AEO Agriculture Extension Officer
ASA Association for Social Advancement (NGO)
ASCE American Society of Civil Engineers
AEZ Agro-Ecological Zones
BADC Bangladesh Agricultural Development Corporation
BARC Bangladesh Agricultural Research Council
BARI Bangladesh Agricultural Research Institute
BRRI Bangladesh Rice Research Institute
BMD Bangladesh Meteorological Department
BRDB Bangladesh Rural Development Board
BBS Bangladesh Bureau of Statistics
CCP Combinations of Cropping Practice
CEC Cation Exchange Capacity
CEGISCentre for Environmental and Geographic InformationServices
DAE Department of Agriculture Extension
DD Deputy Director (DAE)
DTW Deep Tube-Well
FAO Food and Agricultural Organization
GB Grameen Bank
GCA Gross Crop Area
GIS Geographic Information System
18

GOB Government of Bangladesh
HIED Household Income and Expenditure Survey
HL High Land
Ha Hectare
HYV High Yielding Variety
IGA Income Generating Activities
Kg Kilogram
LGED Local Government Engineering Department
LLP Low Lift Pump
LV Local Variety
MP Muriate of Potash
NCA Net Cultivable Area
NGO Non-Government Organization
RCM Reference Crop Management
SAAO Sub-Assttent Agriculture Officer
SRDI Soil Resource Development Institute
STD Shallow Tube Wells
T/ha Tone per hectare
Tk/ha Taka per hectare
Tk/kg Taka per kilogram
TO Training Officers (DAE)
TSP Triple Super Phosphate
UAO Upazila Agriculture Officer
UEO Upazila Education Officer
UPHE Upazila PublicHhealth Engineer
19

USO Upazila Statistical Officer
20
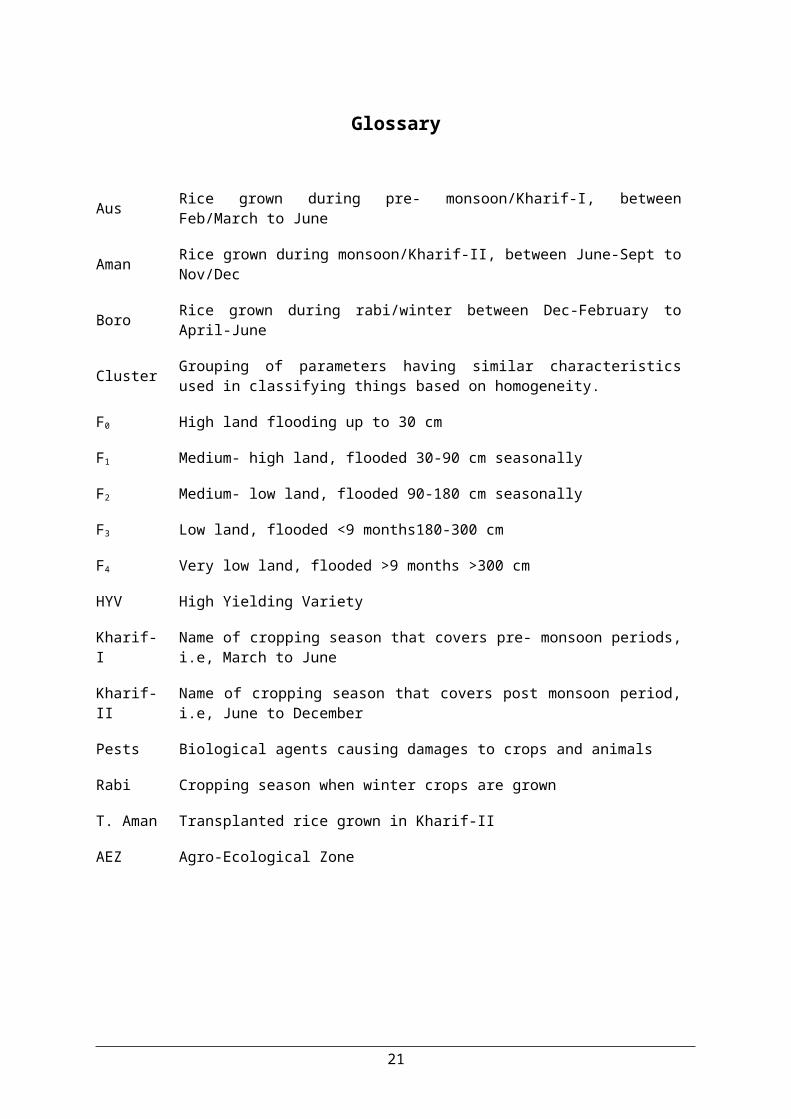
Glossary
Aus Rice grown during pre- monsoon/Kharif-I, betweenFeb/March to June
Aman Rice grown during monsoon/Kharif-II, between June-Sept toNov/Dec
Boro Rice grown during rabi/winter between Dec-February toApril-June
Cluster Grouping of parameters having similar characteristicsused in classifying things based on homogeneity.
F0 High land flooding up to 30 cm
F1 Medium- high land, flooded 30-90 cm seasonally
F2 Medium- low land, flooded 90-180 cm seasonally
F3 Low land, flooded <9 months180-300 cm
F4 Very low land, flooded >9 months >300 cm
HYV High Yielding Variety
Kharif-I
Name of cropping season that covers pre- monsoon periods,i.e, March to June
Kharif-II
Name of cropping season that covers post monsoon period,i.e, June to December
Pests Biological agents causing damages to crops and animals
Rabi Cropping season when winter crops are grown
T. Aman Transplanted rice grown in Kharif-II
AEZ Agro-Ecological Zone
21


Executive Summary
Agricultural production has become decisive basically to meet thebasic food need of human beings. Global population has doubledduring last 45 years to reach seven billion. Currently, world’spopulation is increasing at the rate of 1.3 percent per year andpersistence of this rate will add another two billion population toreach nine billion by 2050. As the world population continues togrow, agricultural production is becoming increasingly importantcontributing not only to the food security, but also to nutrition,health and livelihood for world’s population. Total food grainsproduction in Bangladesh was 51 million metric tons in 2000, whichhas increased to 67 million metric tons in 2011, a 31 percent higherthan previous year’s production, while population increase was 17percent. Crop production for meeting the basic food demand in thecontext of changing environment and increasing population has becomecrucial and key challenge for Bangladesh. To cope up with thischallenge, various type of crops need to be produced to an optimallevel using time and cost efficiently and effectively for whichsustainable crop production system has emerged as the best solution.This calls for motivating farmers to produce crop not only for thepurpose of profit making but also for the purpose of nutrition,health and change in consumption pattern of human beings.
Farmers are growing crops, but they are facing some problems such assalinity, drought, flood. Crops are often damaged by naturalcalamities such as tidal surge, hailstorm, fog, cold wave etc. goodquality seeds and fertilizer locally available, irrigation. On theother hand they don’t have knowledge on modern varieties use,technologies, quality seeds and saplings and post harvesttechnologies. These are the major constraints of low productivity.Farmers are growing crops in the field, but they don’t haveidea/knowledge to do the best cropping patterns. For that reasonsometimes they are losing full or partial yield of all crops. Inmany areas, there are cluster of orchards but farmers are not fullyaware to get the highest yield from orchard or crops. Managementconditions of orchard are very poor. The concept of crop typology isconsidered to meet the challenge of food security for the increasingpopulation.
Seven upazila were selected from seven divisions as a pilot area fordevelopment of crop typology. These are: 1) Salinity area: Dacopeupazila in Khulna district and Amtali upazila in Barguna district;2) Hilly area: Khagrachari sadar in Khagrachari district 3) Floodfree area: Gazipur sadar in Gazipur district Pirgonj upazila inRangpur district; 4) Drought area: Gomastapur upazila in Chapai
Annex- 2
Nawabganj district; and 5) Haor/Flash flood area: Jamalganj upazilain Sunamganj district. Consultation was held with farmers, scientistand local department of agriculture extension personnel of therespective pilot upazila to know about the existing situation offield and horticultural crops. Data were collected from fieldthrough focus group discussion and secondary data were collect fromrespective departments. It was observed that land type is one of themajor factors for selecting crops and cropping patterns in the pilotupazilas. Therefore, cluster based on land type were considered fordeveloping crop typology described in the following sections. Dacope Upazila in Satkhira district in Khulna division
The main constraint of the pilot area is soil and water salinity.Tidal surge also damage the crops. Natural calamities such ashailstorm, fog, cold wave and drought etc. are also affecting normalcrop production to some extent. Inclusion of vegetables in kharif-Iseason in the presently practiced Fallow-T.Aman-Fallow croppingpattern and inclusion of T.Aman in the kharif-II season in thepresently practiced Fallow-Fallow-Boro cropping pattern has beensuggested after intensive consultation with local farmers and DAEofficials.
Amtali upazila in Barisal district Farmers grow more Aman crops in the pilot area than Boro crops dueto scarcity of fresh water during dry season. Kheshari is also grownin large area. Farmers can grow vegetables in the pilot area if thepractice of rain water harvesting can be introduced. Farmers mayprepare 5 vegetables bed each one measuring 5 m long and 5 m wide.
It is possible to practice double cropping in about 277 ha. Most ofthe land remains inundated by tidal water in the pilot area. Sarjanmethod may be introduced in the pilot area. Vegetables, fish andfruit crops can be grown in this method. It is an integrated farmingsystem. Presently 24% area is covered by single crops. According toUAE it is possible to grow double crops about 3% areas if there isirrigation facilities. About 56% lands is double cropped, it ispossible to grow triple crops in about 20% areas if there isirrigation facilities.
Khagrachhari Sadar Upazila of Khagrachhari district in Chittagongdivision
Lack of irrigation water availability is the main problem in thepilot area. Lack of awareness about modern technologies, non-
24
Annex- 2
availability of quality seeds and saplings and post harvest lossesare the major constraints in the hilly area. Farmers are growingcrops on the hills, slope of the hills and in the field, but theyare not about the real planting time, crop variety use, managementpractices. For that reason sometimes they are losing full or partialyield of all crops. In many areas, there are cluster of orchards butfarmers are not fully aware to get the highest yield from orchard orcrops. Management conditions of orchard are very poor.
BARI has developed an irrigation system that can be demonstrated inthe pilot area which will open up opportunity of multiple croppingand increased production per unit area. Intercrops can be introducedin orchard garden with zinger and turmeric so that additionalproduction can be secured from the area currently covered by fruittrees. Vegetables may be introduced in the currently practicedFallow-T.Aman-Fallow cropping pattern.Gazipur Sadar upazila of Gazipur district in Dhaka division
Low soil moisture in dry season, low organic matter, water scarcityin dry season, low water holding capacity are the constraints forcrop production. Farmers create raised boundary (ail) around theindividual plots in the land, but due to land slope can not holdwater for crop production. Farmers are growing many crops in thefield, but cropping pattern varies with locations. There are clusterof fruits, but farmers are not fully aware to get the highest yieldfrom orchard. There is high land where there are mango, pineappleand jackfruit but not well organized.
Presently 40% of cultivated area is single cropped, it is possibleto convert half of this into double cropped area with provision ofirrigation facilities. About 42% land is double cropped, it ispossible to grow triple crops in about half of this area withprovision of irrigation facilities. Jute may be introduced as thefourth crop in the Fallow-T.Aman-Mustard-Boro cropping pattern withthe use of short duration HYVs Gomostapur Upazila in Chapai Nawabgonj district in Rajshahi division
The main constraints of the pilot area are severe drought andsiltation of rivers and khals. The scarcity of irrigation water forcrop production during dry season is very severe. Natural calamitiessuch as over rainfall, hail storm, pest and disease infestation etc.are also affecting normal crop production. About 80% DTW does notwork during dry season due to continuous extraction of ground water.Normally in the pick period fertilizer is not available.
25
Annex- 2
Presently 33% area is covered by single crops. According to UpazilaAgriculture Officer, Gazipur it is possible to grow double crops inat least 5% areas if there is irrigation facilities. Double croppingis presently practiced in 40% area, it is possible to grow triplecrops in 28% areas if there is irrigation facilities. Re-excavationof khals and creation of mini ponds will help in overcoming watercrisis. Cropping pattern may change by introduction of shortduration HYVs. Cropping intensity may increase through Mango-T.amaninter cropping. Crop damage due to drought may be checked throughmulching. Vegetables may be cultivated in pond side. Jamalganj Upazila of Sunamgonj district
The main constraint of the pilot area is flash flooding. Heavyrainfall, long time stagnant flood water also damage crops. Naturalcalamities such as hailstorm, fog, cold wave and drought etc. arealso affecting normal crop production to some extent
About 35% lands is double cropped, it is possible to grow triplecrops in about 5% areas if there is irrigation facilities.Vegetables may by introduced in the kharif-I season in the presentlypracticed Fallow-Lt.Aman-Mustard cropping pattern. In addition,T.Aman may be grown in kharif-II season where presently single borocrop is grown by cultivating submergence tolerant rice variety inAman season.
Pirganj Upazila
Heat stress and high temperature are mainly responsible for creatingdrought situation. Scarcity of surface water in Boro season as wellas lowering of ground water table are constraints for cropproduction. Other barriers are cold weave, hail storm etc.
It is possible to increase double cropping in 7% areas and toincrease triple crops in 30% areas from base condition withirrigation facility. Fallow-Fallow-Mustard-Boro cropping pattern maybe replaced by T.Aus-T.Aman-Boro cropping pattern throughintroduction of short duration varieties. Cropping intensity may beincreased through Maskalai-T.aman intercropping. Zero tillage Maizecultivation. Vegetables may cultivate in pond sideConsidering the present land use, cropping patterns, orchardmanagement, introduction of intercrops in the orchard and finallygrowing four crops in a year from the same land, upazila wise aboutforty clusters were developed, with the consideration of more
26
Annex- 2
intensive land use with improve patterns, four crops grown insteadthree crops, intercrops with orchard etc. What is needed? That istypology of agriculture that incorporates not only the factors thatdefine production technology and output, but also the socioeconomicfactors that determine the constraints that limit the ability offarmers to produce more efficiently and sustainably. Sinceagricultural activities undertaken by farmers are an articulation ofthe multiple objectives of the farm within the agro-ecological andsocioeconomic constraints of the environment, they are likely tofulfill the required role of an integrator of key structuralvariables.
In Bangladesh crop typology concept and cluster wise crop productionsystem is new. It needs research with the collaboration of theresearch institute and side by side do some farmers leveldemonstration through Department of Agriculture Extension.
27
Team Composition
1. Dr. Faruque-Team Leader, CEGIS
2. Professor Md. Ebrahim-DTL, CEGIS
3. Md. Zahidul Islam-Agronomist, CEGIS
4. Md. Toufiq Elahi- GIS Specialist, CEGIS
5. Md. Zahid Hasan Dhali-Research Associate, CEGIS
6. . Md. Mosle Uddin-Research Associate, CEGIS
1. Introduction
1.1 Agricultural production, population growth andenvironment-the global challenges
Agricultural production has become decisive basically to meet thebasic food need of human beings. The decision of food need dependson the growth of population and environment in place. Globalpopulation has been increasing vastly which doubled the populationduring last 45 years that resulted to reach at 7 billion. Currently,world’s population is increasing at the rate of 1.3 percent per yearand persistence of this rate will add another 2 billion populationand reach to 9 billion by 2050. As the world population continues togrow, agricultural production is becoming increasingly importantcontributing not only to the food security, but also to nutrition,health and livelihood for world’s population. Within the globe, thecontinent-Asia covers 29.4% of the Earth's land area but hold apopulation of over 4 billion - accounting for about 56 percent ofthe world population. Among the Asian countries, the population ofBangladesh, India and China are estimated to be around 3 billionwhich accounted for about 75 percent. In the context of increasingpopulation in the world, agricultural productivity for meeting thefood demand is becoming increasingly important. However,agricultural productivity is often linked with questions aboutenvironment, sustainability, ecosystem services and adaptation oftechnological innovation. It is revealed that agriculturalproduction is still considered without due attention to theenvironmental parameters. Agricultural production activities such asweak soil and water management practices, improper crop rotation,poor irrigation practices, use of chemical and fertilizer,deforestation, natural disasters including droughts and floods areaffecting to reduce the land productivity which jeopardize theability to feed the increasing population of the world.
1.2 Population and crop production in Bangladesh andAsian Countries
Bangladesh, a country of South Asia, supports a population of 151million in an area of 147,570 square kilometers, experiencing one ofthe most densely populous countries of the world. It is estimatedthat by 2025, present population of Bangladesh will grow to 193
1

Introduction
million-an increase of nearly 42 million people, representing agrowth rate of 2.78 percent. Meeting the challenges of this fact,agricultural sector of the country has been playing a prudent andpivotal role in the economy showing exemplary achievement in selfsufficiency of food demand which indicates that Bangladesh has thecapability to produce the required food needed for the present andfuture generation. Total food grains production in Bangladesh,according to Bangladesh Bureau of Statistics (BBS) and FAOSTAT was51 million metric tons in 2000, which has increased to 67 millionmetric tons in 2011, a 31 percent higher than previous year’sproduction, while population increase was 17 percent (Table 1.1). Itis revealed that crop production has nearly doubled in comparison tothe increase of population during the last 10 years. In case ofIndia, crop production was 26 percent while increase of populationwas 22 percent. China’s population has decreased by 9 percent butcrop production has increased by 33 percent showing a significantimprovement during the last 10 years. It is revealed that among theother countries of South Asia, the performance of crop production inMyanmar was at the top (65 percent) and Maldives was in the bottomindicated as decreased by 50 percent. On the contrary, the percentof increase of population in Nepal was the highest stated at 29percent while Vietnam was only 10 percent.
Table 1.1: Population growth and crop production in Asian Countries(2000-2011)
Name ofCountry
Crop production during last 10 years2000 2005 2010 2011
Popu
lati
on(Mil
lion
Crop
prod
ucti
onPopu
lati
on(Mil
lion
Crop
prod
ucti
on
Popu
lati
on(Mil
lion
Crop
prod
ucti
onPopu
lati
on(Mil
lion
Crop
prod
ucti
on(Mil
lion
Bangladesh 129 51 144 54 164 67 151 67
India 1,014 657 1,10
4 616 1,189 752 1,241 829
China 1,485 1,055 1,30
4 1,165 1,338 1,343 1,346 1,399
Myanmar 46 37 51 50 53 63 54 61Nepal 24 14 25 17 28 20 31 21Maldives 0.27 0.04 0.30 0.03 0.30 0.02 0.30 0.02
2

Introduction
Vietnam 80 68 83 82 53 90 88 96 Source: FAOSTAT and BBS, Bangladesh
1.3 The agricultural sector and crop production inBangladesh and Asian countries
Agriculture remains the most important sector for the economy ofBangladesh, contributing 19.6 percent to the national GDP andproviding employment for 63 percent of the population and playing akey role in meeting the food demand of the nation.
According to the World Bank, the total arable land in Bangladesh is61.2 percent of the total land area showing a decrease from 68.3percent in 1980. The dominating crops are rice and wheat for whichabout 84 percent of total arable land is used. Next to this, jute,which was known as golden fiber of Bangladesh, still used 2.86percent of arable land. Along the line, pulses, potato, oilseeds,spices and vegetable are grown using almost same amount of land(Table 1.2).
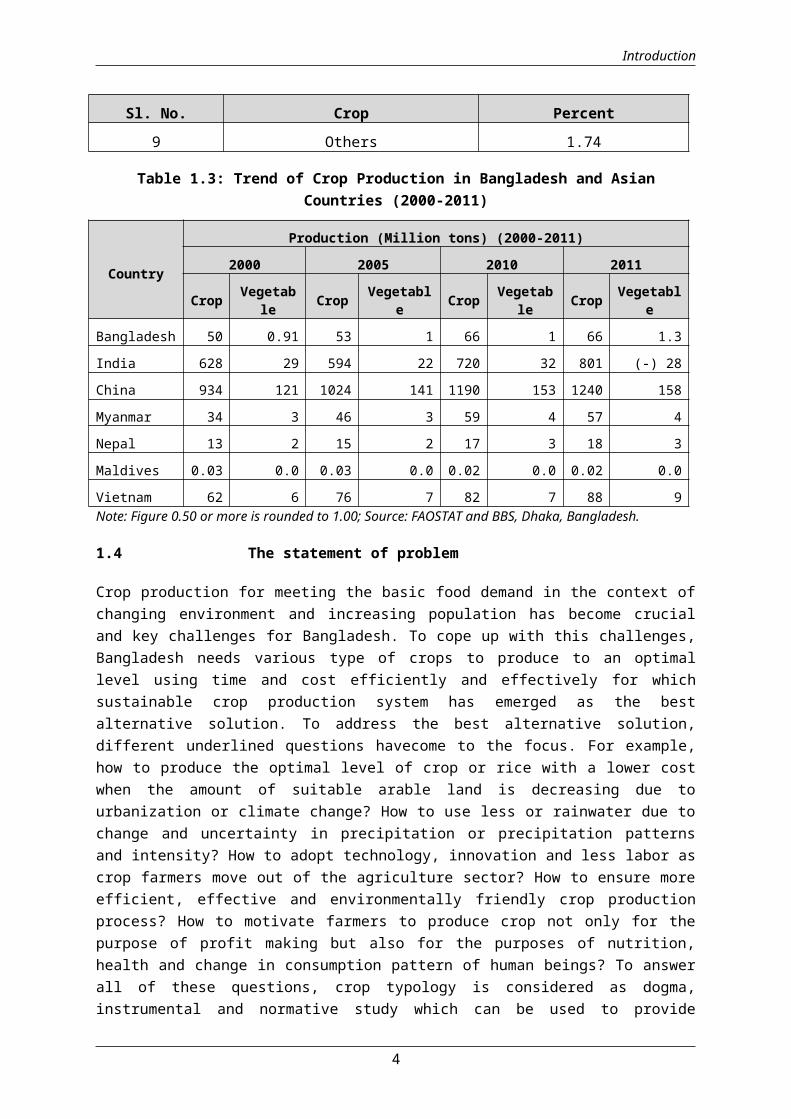
With respect to the level of production, in Bangladesh, cropproduction has increased to 32 percent during the period of 2000 to2011 (Table-3) while the same in India is 28 percent, China 33percent, Myanmar 68 percent, Nepal 38 percent and Vietnam 42percent. The production has decreased by 33 percent in Maldives. Theproduction of vegetable has increased by 45 percent in Bangladeshand Vietnam while Nepal has become highest showing increase by 60percent. Level of increase for China, Myanmar and Maldives are 31percent, 33 percent and 33 percent respectively. In case of India,production has decreased by 28 percent.
Table 1.2: Percent of land area planted to crops in Bangladesh, 2011
Sl. No. Crop Percent1 Rice 79.42 Wheat 4.093 Jute 2.864 Pulses 2.805 Potato 2.396 Oilseeds 2.377 Spices 2.218 Vegetables 2.14
3
Introduction
Sl. No. Crop Percent9 Others 1.74
Table 1.3: Trend of Crop Production in Bangladesh and AsianCountries (2000-2011)
Country
Production (Million tons) (2000-2011)
2000 2005 2010 2011
Crop Vegetable Crop Vegetabl
e Crop Vegetable Crop Vegetabl
eBangladesh 50 0.91 53 1 66 1 66 1.3India 628 29 594 22 720 32 801 (-) 28China 934 121 1024 141 1190 153 1240 158Myanmar 34 3 46 3 59 4 57 4Nepal 13 2 15 2 17 3 18 3Maldives 0.03 0.0 0.03 0.0 0.02 0.0 0.02 0.0Vietnam 62 6 76 7 82 7 88 9Note: Figure 0.50 or more is rounded to 1.00; Source: FAOSTAT and BBS, Dhaka, Bangladesh.
1.4 The statement of problem
Crop production for meeting the basic food demand in the context ofchanging environment and increasing population has become crucialand key challenges for Bangladesh. To cope up with this challenges,Bangladesh needs various type of crops to produce to an optimallevel using time and cost efficiently and effectively for whichsustainable crop production system has emerged as the bestalternative solution. To address the best alternative solution,different underlined questions havecome to the focus. For example,how to produce the optimal level of crop or rice with a lower costwhen the amount of suitable arable land is decreasing due tourbanization or climate change? How to use less or rainwater due tochange and uncertainty in precipitation or precipitation patternsand intensity? How to adopt technology, innovation and less labor ascrop farmers move out of the agriculture sector? How to ensure moreefficient, effective and environmentally friendly crop productionprocess? How to motivate farmers to produce crop not only for thepurpose of profit making but also for the purposes of nutrition,health and change in consumption pattern of human beings? To answerall of these questions, crop typology is considered as dogma,instrumental and normative study which can be used to provide
4

Introduction
holistic crop production solution for meeting the food demand inBangladesh
1.5 The research question
Considering the changing context of environment and populationgrowth of Bangladesh and meeting the basic food need throughdifferent types of crop production, the following research questionis adopted:
How and to what extent the defined dimensions, factors andprinciples can be applied for development of crop typology to meetthe basic food demand for the present and future generation in thechanging context of environment and population growth of Bangladesh?
1.6 Objectives of the study
Translating the research question, the following objectives areadopted:
1. To define the crop typology dimensions, factors and principlesand construct a framework and identification of relevantvariables for construction of crop typology concept forBangladesh;
2. To collect data and information of different administrativelevels (Division, District and Upazila) and performcompilation and analysis using GIS, RS and statistical toolsto describe AEZs, soil, weather (rainfall and temperature),infrastructure (road, irrigation, electricity), socio-economic(poverty, income, agricultural wage, education and gender);
3. Consultation with agricultural scientists, and breeders forrefinement and finalization of crop typology developed by theresearch team;
1.7 Rationale of the study
For various types of crop production, the consideration ofsustainability, productivity, efficiency, effectiveness, zoning,timing are the important component to adopt farming decisions inorder to meet the food demand of the country. An appropriate policyand planning should guide and support this production system. Croptypology is the study of various crops where different factors suchas climate, soil, socio-economic activities, technology areconsidered, which generate a combination of Thus, study of croptypology helps to produce optimal level of crop production in thechanging environment and the context of population growth, which
5
Introduction
basically allows farmers to produce crops effectively andefficiently. The study also helps to the policy planners to makeappropriate policy planning for adopting an environmental-friendlycrop production process. Finally, formulation of appropriate policyplan and environment-friendly practice will support to grow morecrops, which will help to meet the food demand of the present andfuture generations of the country.
1.8 Crop typology as new paradigm concept used forsustainable crop production system
The ‘study or the exploration of crop typology’ is the new paradigmconcept in the context of ‘futurity’, ‘holistic view’, ‘synoptic’,‘productivity’, ‘sustainability’, ‘optimization’, ‘priority to thepoor’ and ‘efficiency and effectiveness’ in resource use. Theconnotation of cropping typology signifies that crop productionsystem or all actions related to the crop production system shouldbe considered holistically instead of ‘reductively’. In practicingproduction process using cropping typology concept, farmer’s view ofthe production system as ‘production with due care to theenvironment’ or ‘following the sustainability principles’, orobtaining ‘optimal production or necessary production’ instead of‘maximum production’ or ‘meeting the present generation’s needconsidering the ‘future generation’s need’, or ‘giving overridingpriority to the poor’ etc. According to the principles ofsustainable development, crop production must satisfy the principlesof sustainability, i.e. crop production system to be practiced basedon the principles of sustainability. It is imperative that there isno scope of degrading the environment or destroying the ecologywhile crop production actions are taken in place. Considering all ofthis, the power of the word ‘crop typology’ with respect to the newparadigm view, it can be stated as ‘undertaking a research orinvestigation process to identify the ‘type’ of crops that havecharacteristics in common for which production system should bebased on sustainability principles. Recently, the empirical studyshows that the Bangladeshi agronomist at BARI claimed that croppingintensity in Bangladesh can be increased by growing four crops ayear in all cultivable land that could be the result of cropproduction using all agricultural land will be more than doubled(The daily Star, dated 8 September, 2013). The study also dispelledout the concern of over exploitation of soil resources that can beresulted to reduce soil fertility and use of chemicals and inorganicfertilizer may affect the climate change which in the long run may
6

Introduction
lead to decrease in food production instead of increase the foodproduction. Therefore, a vital burning question arises that shouldBangladesh adopt the double crop production strategy using allcultivable land without protecting the environment or reducing thesoil fertility? To overcome this constraint, crop typology hasbecome the most pragmatic and contemporary concept as well as a newparadigm view which could be adopted in all crop production systemto ensure environment friendly farming practices, sustaining andincreasing crop production to meet the food demand of the increasingpopulation of the world.
1.9 Crop typology components and their structurallinkages for development of crop typology in Bangladesh
For development of crop typology for Bangladesh, differentcomponents related to the typology development and theirinterrelations are important consideration as because this willbring under detailed study. The Figure 1 explains differentcomponents and how these components are interrelated in order todevelop the crop typology. From the Figure, it signifies that thereare three basic linkages that have to be considered for developmentof the crop typology, which are – (i) crop types, (ii) climaticcondition and system, and (iii) characterization and clusters. Thisthree basic factors need to be used for crop production. Thedecision on the level of crop production comes from the level ofpopulation growth and demand for crop for consumption as food. Whenthe three basic components are interlinked for crop production forwhich the system become sustainable, productive and efficient geo-demographic, agro-ecological, socio-economic, technology andinstitutional factors and principles are rationally applied to thesystem. Thus, before development of crop typology, the typologystudy needs to be extended for this factors and principles. Finally,an evaluation in terms of sustainability, productivity, efficiencyand effectiveness and farmers preference and choice need to beconsidered for finalization of development of crop typology.
7

Introduction
Figure 1.1: Interrelated Components for crop typology development
1.10 Developing dimensions, factors and principles fordevelopment of crop typology in Bangladesh
To develop the crop typology in Bangladesh, first it is imperativeto investigate or perform a study of crops, cropping pattern,cropping intensity and crop production system and then theapplication of paradigm view of typology such as ‘futurity’,‘holistic perspectives’, ‘synoptic’, ‘productivity’,‘sustainability’, ‘optimization’, ‘priority to the poor’ and‘efficiency and effectiveness’ in resource use on the cropproduction system to provide a holistic and synoptic solution forcrop production. To consider all of this, different dimensions,
8
Geo-demographic
Climatic condition and system
Crop Types
Agro-ecological
Socio-economic
Institutional
Population Growth
Characterization and clustering
Crop Demand
Crop Production
Evaluation
Technology
Source: Author and Principal Investigator, Bangladesh
Sustainability, Productivity and
Efficiency

Introduction
factors and principles of crop typology need to be identified.Considering the challenges, underlined problems and understandingthe paradigm concept of crop typology, following factors andprinciples are suggested:
9
Introduction
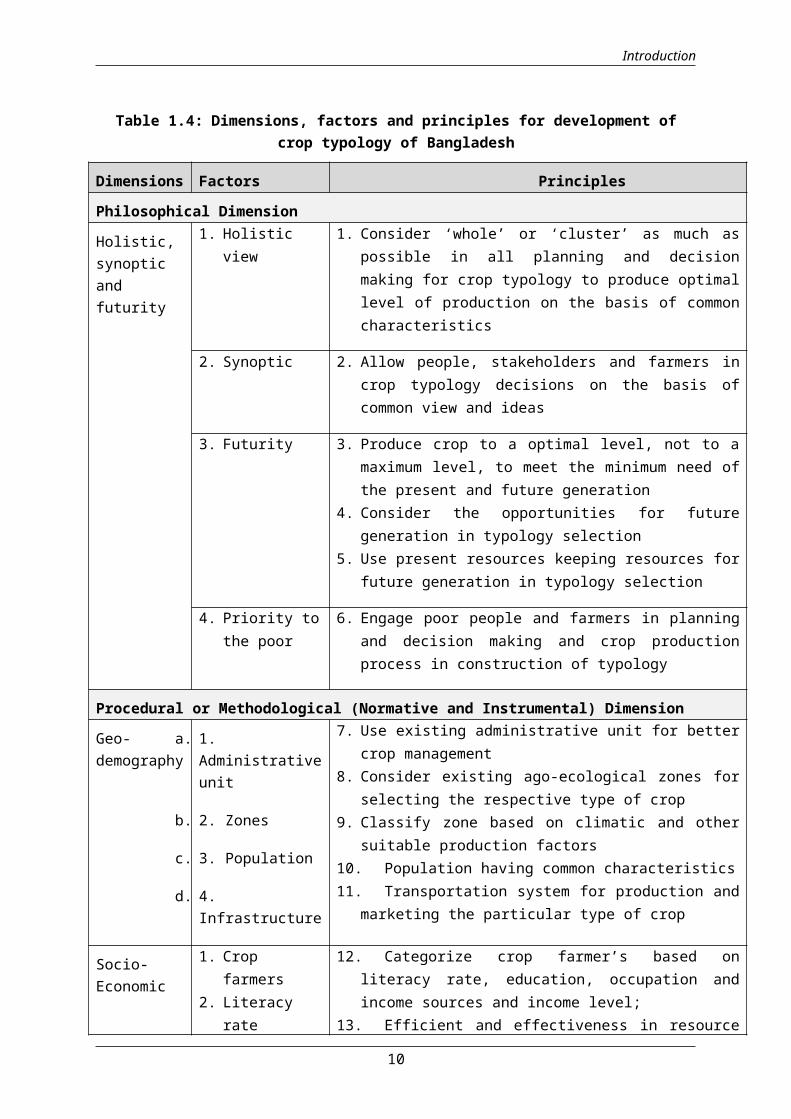
Table 1.4: Dimensions, factors and principles for development ofcrop typology of Bangladesh
Dimensions Factors Principles
Philosophical Dimension
Holistic,synopticandfuturity
1. Holisticview
1. Consider ‘whole’ or ‘cluster’ as much aspossible in all planning and decisionmaking for crop typology to produce optimallevel of production on the basis of commoncharacteristics
2. Synoptic 2. Allow people, stakeholders and farmers incrop typology decisions on the basis ofcommon view and ideas
3. Futurity 3. Produce crop to a optimal level, not to amaximum level, to meet the minimum need ofthe present and future generation
4. Consider the opportunities for futuregeneration in typology selection
5. Use present resources keeping resources forfuture generation in typology selection
4. Priority tothe poor
6. Engage poor people and farmers in planningand decision making and crop productionprocess in construction of typology
Procedural or Methodological (Normative and Instrumental) Dimension
Geo-demography
a. 1.Administrativeunit
b. 2. Zones
c. 3. Population
d. 4.Infrastructure
7. Use existing administrative unit for bettercrop management
8. Consider existing ago-ecological zones forselecting the respective type of crop
9. Classify zone based on climatic and othersuitable production factors
10. Population having common characteristics11. Transportation system for production and
marketing the particular type of crop
Socio-Economic
1. Crop farmers
2. Literacy rate
12. Categorize crop farmer’s based onliteracy rate, education, occupation andincome sources and income level;
13. Efficient and effectiveness in resource
10

Introduction
Dimensions Factors Principles3. Education4. Occupation 5. Level of
income6. Income
sources7. Training8. Cost,
resource use
9. Productivity
10. Labour11. Value
chain12. Market
facilities13. Gender
use, Low cost and cost-effective14. Use low cost and cost-effective for
irrigation and water management system 15. Allow training for the particular ‘type’
of crop production 16. Allow low cost and cost effective
technology17. Consider level of total productivity
instead of single productivity 18. Select farm size based on production,
efficiency and effectiveness 19. Labor to be selected based on gender,
skills and efficiency 20. Consider other social factors for
practice and context21. Consider value chain and market
facilities22. Use gender concept in crop production
and typology selection
Agro-ecological
andTechnology
14. Land type
15. Soil16. Temperat
ure17. Rainfall18. Moisture19. Natural
Disaster20. Landscap
e21. Crop
type
(field andhorticultural)
22. Variety23. Seed24. Fertiliz
er
23. Consider suitable land, soil anddifferent climate condition at differenttime frame which have commoncharacteristics
24. Consider crop homogeneity in amanageable land and soil unit
25. Consider HYV crop variety withoutdegrading ecology and environment
26. Soil fertility never be allowed toreduce when using chemical and fertilizer.Alternative technology could be used;
27. Improving soil fertility using greenmanuring, composting, treating acid soil;
28. Replacing old seeds with quality seed,producing seeds, and linking seedproduction to the local farmers community
29. Promoting bio-pesticides and organiccomposting
30. Promoting bio-fertilizers and createlocal organization for manufacturing
11

Introduction
Dimensions Factors Principles25. Pesticid
e26. Irrigati
on and 27. Water
management
31. Use rainwater or rainfed water as muchas can for production
32. Innovate locally adoptable, low cost andcost effective technology
33. Consider efficiency and effectiveness inirrigation and water management
Institutional
28. System, process andmethod
34. Adopt a year round production systemwith multiple crop production
35. Homogeneity in selection of crop, inputuse, process adopted, zone selection andclimatic condition
36. Efficient and effective in resource useand production system
29. FarmersAssociation
37. Allow local farmers association forempowerment and decision making
30. Policy,Plan andStrategy
38. Formulate strategy applicable to aspecific typology zones
39. Adopt policy and plan applicable to aspecific typology region
Source: Author and Principle Investigator, Bangladesh, 2013
12
Introduction
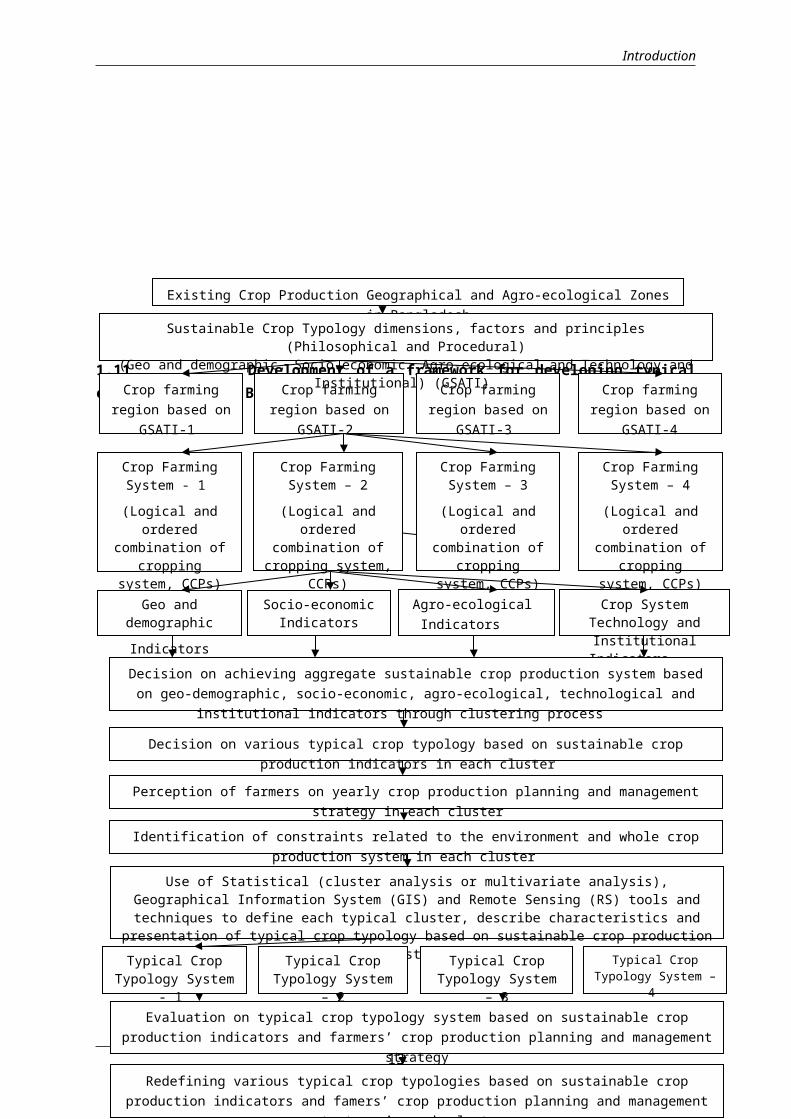
1.11 Development of a framework for developing typicalcrop typology in Bangladesh
13
Use of Statistical (cluster analysis or multivariate analysis), Geographical Information System (GIS) and Remote Sensing (RS) tools and techniques to define each typical cluster, describe characteristics and
presentation of typical crop typology based on sustainable crop production system
Existing Crop Production Geographical and Agro-ecological Zones in Bangladesh
Crop farming region based on
GSATI-1
Crop farming region based on
GSATI-2
Crop farming region based on
GSATI-3
Crop farming region based on
GSATI-4
Crop Farming System - 1 (Logical and
ordered combination of
cropping system, CCPs)
Crop Farming System – 2(Logical and
ordered combination of cropping system,
CCPs)
Crop Farming System – 3(Logical and
ordered combination of
cropping system, CCPs)
Crop Farming System – 4(Logical and
ordered combination of
cropping system, CCPs)
Sustainable Crop Typology dimensions, factors and principles (Philosophical and Procedural)
(Geo and demographic, Socio-economic, Agro-ecological and Technology and Institutional) (GSATI)
Geo and demographicIndicators
Agro-ecological Indicators
Crop System Technology and Institutional Indicators
Socio-economic Indicators
Decision on achieving aggregate sustainable crop production system based on geo-demographic, socio-economic, agro-ecological, technological and
institutional indicators through clustering process
Decision on various typical crop typology based on sustainable crop production indicators in each cluster
Perception of farmers on yearly crop production planning and management strategy in each cluster
Identification of constraints related to the environment and whole crop production system in each cluster
Evaluation on typical crop typology system based on sustainable crop production indicators and farmers’ crop production planning and management
strategyRedefining various typical crop typologies based on sustainable crop
production indicators and famers’ crop production planning and management strategy in each cluster
Typical Crop Typology System
- 1
Typical Crop Typology System
– 2
Typical Crop Typology System
– 3
Typical Crop Typology System –
4
Introduction
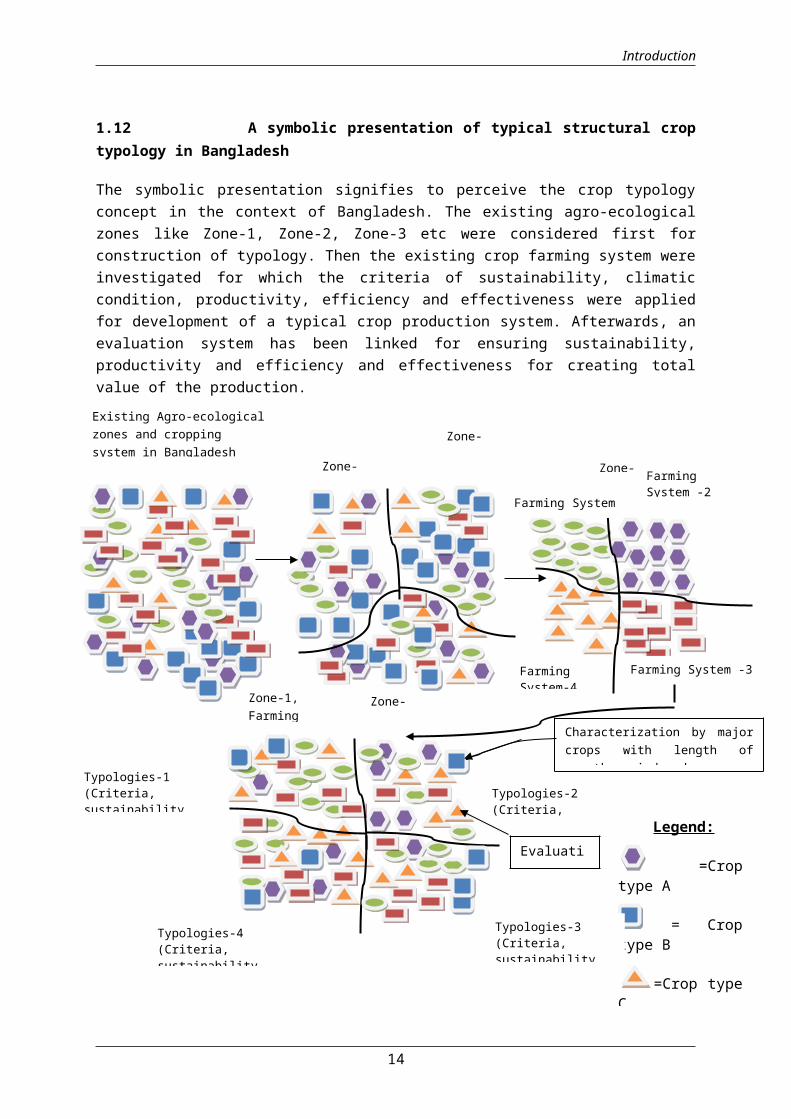
1.12 A symbolic presentation of typical structural croptypology in Bangladesh
The symbolic presentation signifies to perceive the crop typologyconcept in the context of Bangladesh. The existing agro-ecologicalzones like Zone-1, Zone-2, Zone-3 etc were considered first forconstruction of typology. Then the existing crop farming system wereinvestigated for which the criteria of sustainability, climaticcondition, productivity, efficiency and effectiveness were appliedfor development of a typical crop production system. Afterwards, anevaluation system has been linked for ensuring sustainability,productivity and efficiency and effectiveness for creating totalvalue of the production.
14
Existing Agro-ecologicalzones and cropping system in Bangladesh
Zone-
Legend:
=Croptype A
= Croptype B
=Crop typeC
Characterization by majorcrops with length ofgrowth period and zones.
Zone-
Zone-
Farming System-1
FarmingSystem -2
FarmingSystem-4
Typologies-1(Criteria,sustainability
Typologies-2(Criteria, sustainability
Typologies-3(Criteria,sustainability
Typologies-4(Criteria,sustainability
Farming System -3
Zone-
Zone-1, Farming
Evaluation
Introduction
Source: Author and Principal Investigator, Bangladesh
Figure 1.2 : A symbolic presentation of typical structural croptypology in Bangladesh
1.13 Approach and Methodology
The study has been carried out following eight generic steps, statedas follows:
1. Perceiving crop typology concept, dimensions, factors and principles from sustainability, holistic, normative and instrumental perspectives;
2. Description of geo-demographic, agro-ecological zones, land types, climatic condition, socio-economic activities and existing crop production pattern in Bangladesh;
3. Identification of crop farming regions (1, 2, 3, 4, 5 etc.) based on sustainable crop typology principles and indicators;
4. Characterization of existing crop farming system based on logical and ordered combination, CCPs within the region;
5. Compliance of sustainability indicators (ecological, environmental, technological) within the typical crop farming system;
6. Characterization by major crops and zones, and development ofvarious crop typologies within the zonal crop farming system;
7. Evaluation of crop typologies based on farmers’ perception, strategies, productivity preferences and sustainability indicators; and
8. Redefine or revise crop typologies based on crop farming strategies and evaluation and finalization of crop typologies
Multiple data and multiple techniques were applied for datacollection, analysis and presentation as detailed in the followingtable
15
Introduction
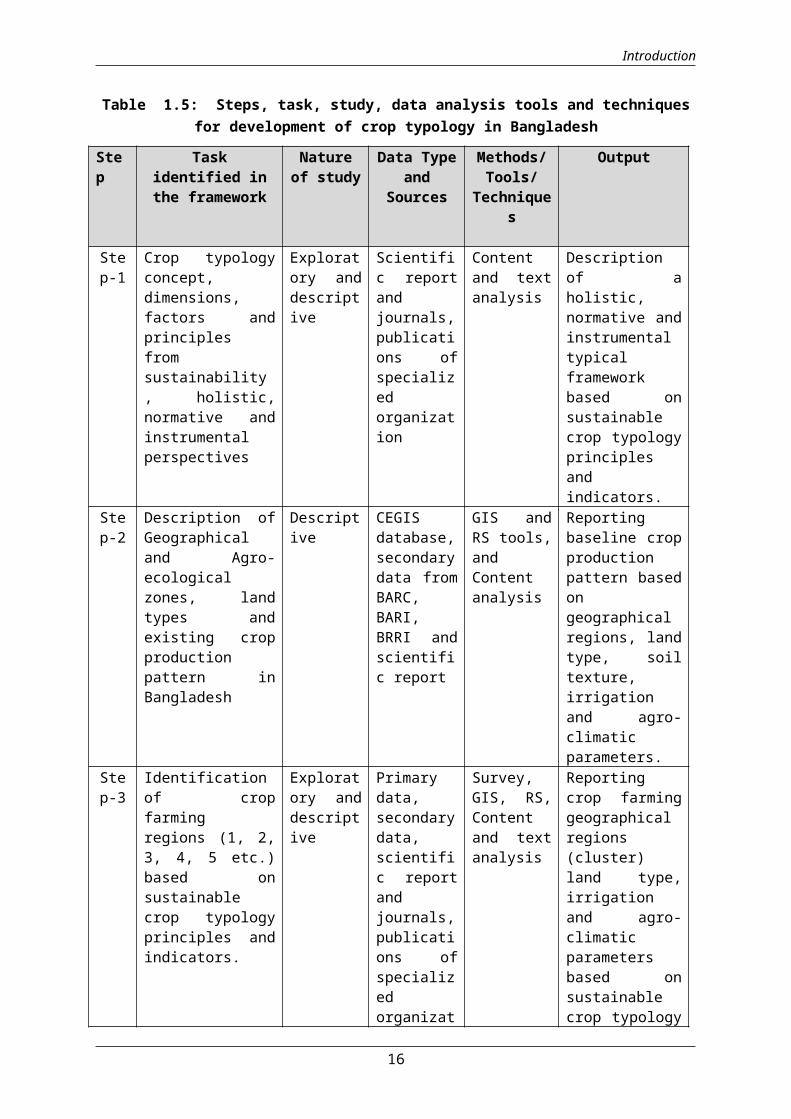
Table 1.5: Steps, task, study, data analysis tools and techniquesfor development of crop typology in Bangladesh
Step
Taskidentified inthe framework
Natureof study
Data Typeand
Sources
Methods/Tools/
Techniques
Output
Step-1
Crop typologyconcept,dimensions,factors andprinciplesfromsustainability, holistic,normative andinstrumentalperspectives
Exploratory anddescriptive
Scientific reportandjournals,publications ofspecializedorganization
Contentand textanalysis
Descriptionof aholistic,normative andinstrumentaltypicalframeworkbased onsustainablecrop typologyprinciplesandindicators.
Step-2
Description ofGeographicaland Agro-ecologicalzones, landtypes andexisting cropproductionpattern inBangladesh
Descriptive
CEGISdatabase,secondarydata fromBARC,BARI,BRRI andscientific report
GIS andRS tools,andContentanalysis
Reportingbaseline cropproductionpattern basedongeographicalregions, landtype, soiltexture,irrigationand agro-climaticparameters.
Step-3
Identificationof cropfarmingregions (1, 2,3, 4, 5 etc.)based onsustainablecrop typologyprinciples andindicators.
Exploratory anddescriptive
Primarydata,secondarydata,scientific reportandjournals,publications ofspecializedorganizat
Survey,GIS, RS,Contentand textanalysis
Reportingcrop farminggeographicalregions(cluster)land type,irrigationand agro-climaticparametersbased onsustainablecrop typology
16

Introduction
Step
Taskidentified inthe framework
Natureof study
Data Typeand
Sources
Methods/Tools/
Techniques
Output
ion principlesandindicators.
Step-4
Characterization ofexisting cropfarming systembased onlogical andorderedcombination,CCPs withinthe region
Descriptive
Primarydata,secondarydata,scientific reportandjournals,publications ofspecializedorganization.
Survey,GIS, RS,Contentanalysis
Reportingexisting cropfarmingsystem basedon logicaland orderedcombination,CCPs withinthe region
Step-5
Compliance ofsustainabilityindicators(ecological,environmental,technological)within thetypical cropfarmingsystem.
Exploratory anddescriptive
Primarydata
Surveymethodand GIS
Reportingtypical cropfarmingsystem basedonsustainability indicatorswithin thecrop farmingsystem
Step-6
Characterization by majorcrops andzones, andDevelopment ofvarious croptypologieswithin thezonal cropfarming system
Exploratory anddescriptive
Primarydata
Surveymethodand GIS
Reportingtypical cropfarmingtypologieswithin thecrop farmingsystem basedonsustainability indicators
Step-7
Evaluation ofcroptypologiesbased onfarmers’
Exploratory anddescriptive
Primarydata
Surveymethodand GIS
Reportingtypical cropfarmingtypologieswithin the
17
Introduction
Step
Taskidentified inthe framework
Natureof study
Data Typeand
Sources
Methods/Tools/
Techniques
Output
perception,strategies,productivitypreferencesandsustainabilityindicators.
crop farmingsystem basedon farmers’evaluationresults
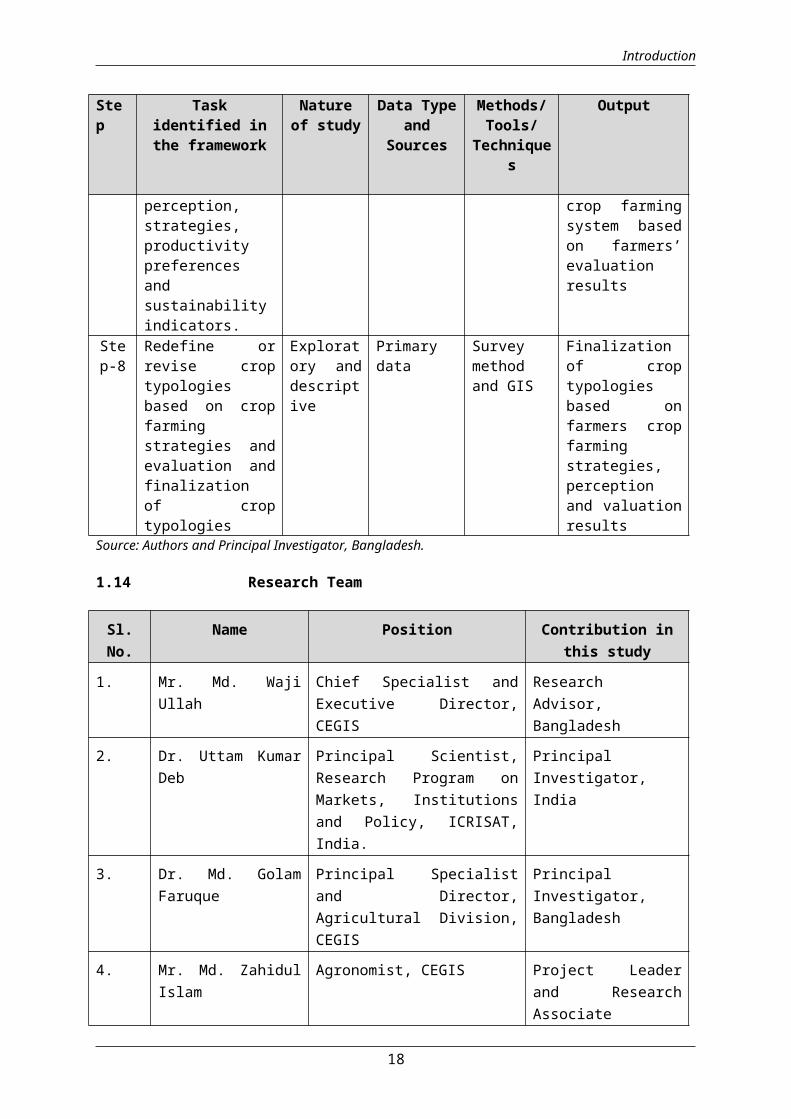
Step-8
Redefine orrevise croptypologiesbased on cropfarmingstrategies andevaluation andfinalizationof croptypologies
Exploratory anddescriptive
Primarydata
Surveymethodand GIS
Finalizationof croptypologiesbased onfarmers cropfarmingstrategies,perceptionand valuationresults
Source: Authors and Principal Investigator, Bangladesh.
1.14 Research Team
Sl.No.
Name Position Contribution inthis study
1. Mr. Md. WajiUllah
Chief Specialist andExecutive Director,CEGIS
ResearchAdvisor,Bangladesh
2. Dr. Uttam KumarDeb
Principal Scientist,Research Program onMarkets, Institutionsand Policy, ICRISAT,India.
PrincipalInvestigator,India
3. Dr. Md. GolamFaruque
Principal Specialistand Director,Agricultural Division,CEGIS
PrincipalInvestigator,Bangladesh
4. Mr. Md. ZahidulIslam
Agronomist, CEGIS Project Leaderand ResearchAssociate
18

Introduction
5. Mr. MohammedZahid HasanDhali
AgriculturalSpecialist, CEGIS
ResearchAssociate
6. Mr. Mosleh Uddin Professional(Agriculture), CEGIS
ResearchAssociate
1.15 Output of the research
The research study would generate the following generic output:
1.Reporting the dimensions, factors and principles of croptypology and construction of crop typology concept andframework for Bangladesh;
2.Describing the existing crop types (field and horticultural),agro-ecological zones (covering district and sub-district),cropping pattern, socio-economic variables, technological andinfrastructure condition for construction and characterizationof crop typology in Bangladesh;
3.Reporting AEZs, soil, weather (rainfall and temperature),infrastructure (road, irrigation, electricity), socio-economic(poverty, income, agricultural wage, education and gender);
19
2. Literature Review
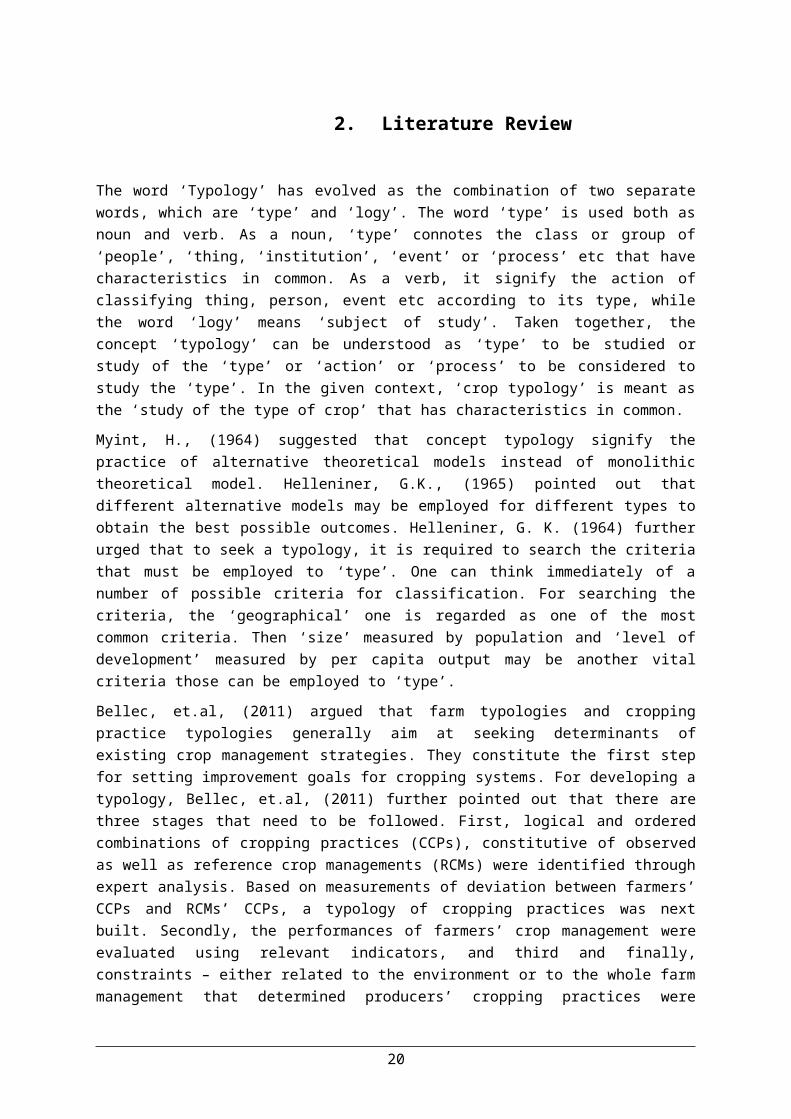
The word ‘Typology’ has evolved as the combination of two separatewords, which are ‘type’ and ‘logy’. The word ‘type’ is used both asnoun and verb. As a noun, ‘type’ connotes the class or group of‘people’, ‘thing, ‘institution’, ‘event’ or ‘process’ etc that havecharacteristics in common. As a verb, it signify the action ofclassifying thing, person, event etc according to its type, whilethe word ‘logy’ means ‘subject of study’. Taken together, theconcept ‘typology’ can be understood as ‘type’ to be studied orstudy of the ‘type’ or ‘action’ or ‘process’ to be considered tostudy the ‘type’. In the given context, ‘crop typology’ is meant asthe ‘study of the type of crop’ that has characteristics in common.
Myint, H., (1964) suggested that concept typology signify thepractice of alternative theoretical models instead of monolithictheoretical model. Helleniner, G.K., (1965) pointed out thatdifferent alternative models may be employed for different types toobtain the best possible outcomes. Helleniner, G. K. (1964) furtherurged that to seek a typology, it is required to search the criteriathat must be employed to ‘type’. One can think immediately of anumber of possible criteria for classification. For searching thecriteria, the ‘geographical’ one is regarded as one of the mostcommon criteria. Then ‘size’ measured by population and ‘level ofdevelopment’ measured by per capita output may be another vitalcriteria those can be employed to ‘type’.
Bellec, et.al, (2011) argued that farm typologies and croppingpractice typologies generally aim at seeking determinants ofexisting crop management strategies. They constitute the first stepfor setting improvement goals for cropping systems. For developing atypology, Bellec, et.al, (2011) further pointed out that there arethree stages that need to be followed. First, logical and orderedcombinations of cropping practices (CCPs), constitutive of observedas well as reference crop managements (RCMs) were identified throughexpert analysis. Based on measurements of deviation between farmers’CCPs and RCMs’ CCPs, a typology of cropping practices was nextbuilt. Secondly, the performances of farmers’ crop management wereevaluated using relevant indicators, and third and finally,constraints – either related to the environment or to the whole farmmanagement that determined producers’ cropping practices were
20

Literature Review
identified for making with the stakeholders, proposals for furthertechnical improvements.
Whaley L. J. (1997) described two purposes of typology: (i) toidentify universal and (ii) to identify the potential range ofvariations. He further put forward four vital opinions: (i) typologyrequires both qualitative and quantitative analysis, and thustypology is highly subjective and it does not meet the scientificstandard, (ii) the aim of typology is not to answer “what types orkind are there? But to answer what types or kinds of structure arethere? (iii) certain aspects of structure correlates and theimplicational universals can be stated in terms of the correlation,(iv) ways that changes through time and (v) develop a properdatabase for suitability.
Parthasarathy and Kelly (2003) defined typology for rain-fedagriculture in terms of (i) characteristics of specific zones, (ii)geographical spread, (iii) dominant agricultural activities, (iv)temporal and spatial variability with respect to crop and livestockperformance, (v) agro-ecological and socio-economic characterizationand (vi) growth of crop yield.
Parthasarathy and Birthal. (2008) uses different factors and searchdifferent responses which was further analyzed to develop crop-livestock system typology that delineates the regions of eachcountry into homogenous crop livestock zones/systems with similarresponses to technology uptake and development initiatives.
Umr, et al., (2008) has defined the concept in the context of farm andproduction unit typologies. According to him, typologies are a wayof representing the diversity of farming systems and productionunits in a given region.
According to the Malton et al., (2005), two types of methods can beused to build a typology: (i) the ‘positive method’ based onstatistical analysis of farm surveys, and (ii) the ‘constructivistmethod’ where types are built from expert knowledge and thenvalidated by surveys.
Groot,. et al. (2008) illustrated different interlinked components,which are used as typology for classification, description andvaluation of ecosystem functions, goods and services.
Yu, et al., (2010) developed a typology of food security indeveloping countries, in which they developed a number of criteriain different stages and produced a matrix to apply this criteria toa suitable country.
21
Literature Review
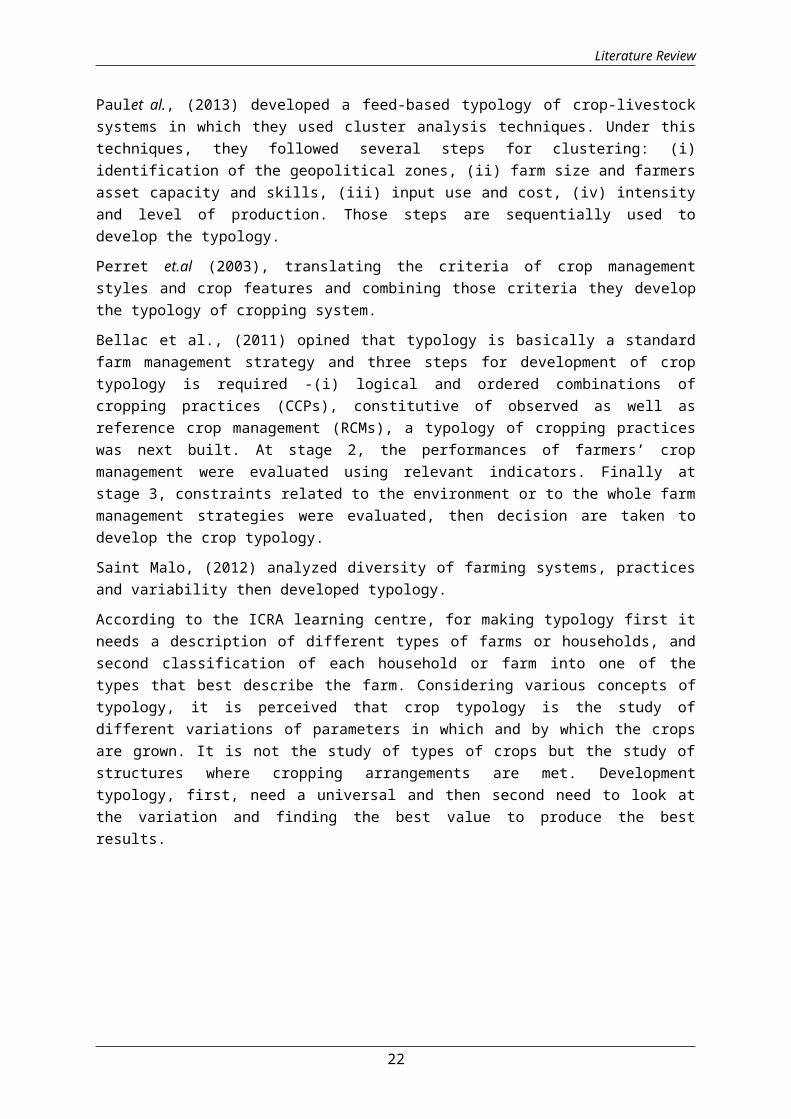
Paulet al., (2013) developed a feed-based typology of crop-livestocksystems in which they used cluster analysis techniques. Under thistechniques, they followed several steps for clustering: (i)identification of the geopolitical zones, (ii) farm size and farmersasset capacity and skills, (iii) input use and cost, (iv) intensityand level of production. Those steps are sequentially used todevelop the typology.
Perret et.al (2003), translating the criteria of crop managementstyles and crop features and combining those criteria they developthe typology of cropping system.
Bellac et al., (2011) opined that typology is basically a standardfarm management strategy and three steps for development of croptypology is required -(i) logical and ordered combinations ofcropping practices (CCPs), constitutive of observed as well asreference crop management (RCMs), a typology of cropping practiceswas next built. At stage 2, the performances of farmers’ cropmanagement were evaluated using relevant indicators. Finally atstage 3, constraints related to the environment or to the whole farmmanagement strategies were evaluated, then decision are taken todevelop the crop typology.
Saint Malo, (2012) analyzed diversity of farming systems, practicesand variability then developed typology.
According to the ICRA learning centre, for making typology first itneeds a description of different types of farms or households, andsecond classification of each household or farm into one of thetypes that best describe the farm. Considering various concepts oftypology, it is perceived that crop typology is the study ofdifferent variations of parameters in which and by which the cropsare grown. It is not the study of types of crops but the study ofstructures where cropping arrangements are met. Developmenttypology, first, need a universal and then second need to look atthe variation and finding the best value to produce the bestresults.
22
3. Situation Analysis
3.1 Geo-demographic features of Bangladesh
3.1.1 Geographical situation
Bangladesh lies in the northeastern part of South Asia bounded byIndia in the west, north, northeast and east, by Myanmar in thesoutheast and by the Bay of Bengal in the South. It is locatedwithin 88 to 89oE Longitude and 22 to 23oN Latitude. According to theFAOSTAT, 2011, total area of Bangladesh is 147,570sq km, in whichavailable land is 133,910 sq km. and water is 10,090 sq km. Landboundaries is 4,246 km and coastline is 580 km. Exclusive economiczone is 200 nm and territorial sea is about 12 nm. The country’stotal arable land including permanent crops is 62 percent, forestsand woodland is 15 percent and others 23 percent.
Bangladesh is blessed with deep, rich and fertile soil, which is agift from the three major rivers that form the deltaic plain uponwhich it is located. The Ganges, Brahmaputra and Meghna Rivers allwend their way down from the Himalayas, carrying nutrients toreplenish cropping field in Bangladesh. Bangladesh is almostentirely flat except from some hills in the Cox’s Bazar Districts,almost entirely at sea level. As a result, the country is sometimesinundated by the major rivers or by the tropical cyclones created bythe tidal bores along the Bay of Bengal. Climatic condition istropical with mild winter (October to March); hot and humid summer(March to June); and humid, warm rainy monsoon (June to October).Terrain is mostly flat alluvial plain; hilly in south- and north-east borders.
3.1.2 Demographic features
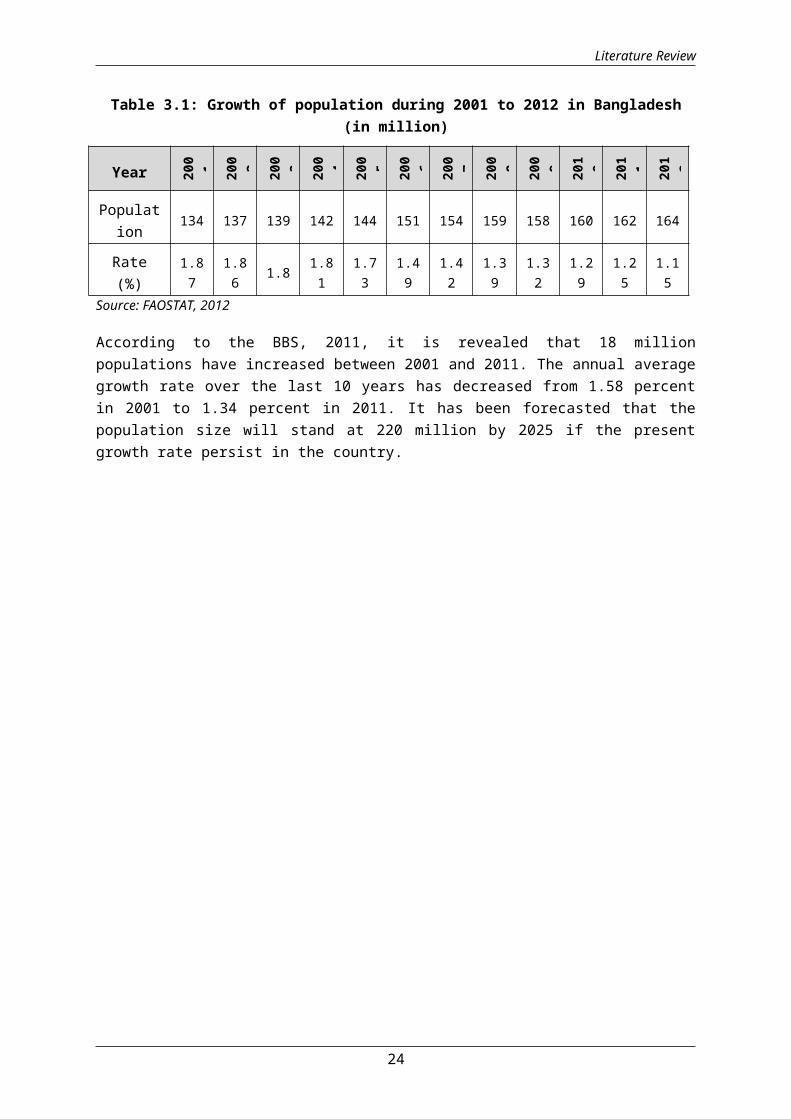
The current population size of Bangladesh is estimated at 164million (FAOSTAT, 2012). The rate of population growth is 1.15 in2012 (Table 3.1). The population of the country was 134 million in1991 and 131 million in 2001. According to Bangladesh Bureau ofStatistics (BBS), the population size was 144 million in 2011 whilethe average annual growth rate was 1.34 percent (Table 3.2)
23
Literature Review
Table 3.1: Growth of population during 2001 to 2012 in Bangladesh(in million)
Year 200 1 200 2 200 3 200 4 200 5 200 6 200 7 200 8 200 9 201 0 201 1 201 2
Population 134 137 139 142 144 151 154 159 158 160 162 164
Rate(%)
1.87
1.86 1.8 1.8
11.73
1.49
1.42
1.39
1.32
1.29
1.25
1.15
Source: FAOSTAT, 2012
According to the BBS, 2011, it is revealed that 18 millionpopulations have increased between 2001 and 2011. The annual averagegrowth rate over the last 10 years has decreased from 1.58 percentin 2001 to 1.34 percent in 2011. It has been forecasted that thepopulation size will stand at 220 million by 2025 if the presentgrowth rate persist in the country.
24

Literature Review
Table 3.2: Population trend of Bangladesh, 1974-2011
1974 1981 1991 2001 2011
Population size (in millions) 71.4 87.1 106.3 124.3 144.8
Population increase (inmillions) - 16.0 19.0 18.0 18.0
Average annual growth rate (inpercent) - 2.32 2.01 1.58 1.34
Source: BBS, 2011
The population density of Bangladesh was 755 in 2001 and 964 in 2011per square kilometer (BBS, 2011). The number of households in 2011was 32.12 million of which 19.45 million were in rural areas and5.86 million in urban areas. The average size of a household was4.5. The literacy rate in 2011 for 7 years and above is 51.8 percentin which male is 54.1 percent and female is 49.4 percent. The adultliteracy rate (15 years and over) was 47.5 percent in 2001. Theeconomic activity rates in 1991 and 2001 were 43.1 and 37.6respectively.
25
Literature Review
Map 3.1: Upazila wise population density in Bangladesh (2001 and2011)
3.1.3 Division wise population by sex and household
The country's population is diversely distributed throughout its 7Divisions and 64 districts. Table 3.3 depicts Division wisepopulation and household size in Bangladesh. The capital city Dhakais the densely populated area having 47 million populations, whilethe population of Sylhet and Barisal are comparatively lower thanthat of Dhaka. The male occupies 51 percent of total populationwhile the female is 49 percent. On an average, a district has apopulation of about 1.8 million, an Upazila 230,000 a union 25,000and a village 2,000.
Table 3.3: Divisionwise population by sex, sex ratio, number andaverage size of households, 2011
DivisionPopulation (million)
Sexratio
Household
Total Male Females Total(million)
Averagesize
Barisal 8.3 4.3 4 96.8 1.83 4.4Chittagong 28.4 14.3 14.1 96.1 5.62 5Dhaka 47.4 24.3 23.1 103.9 10.84 4.3Khulna 16.2 8.2 8.0 100 3.74 4.2Rajshahi 18.4 9.3 9.1 100.4 4.48 4.1Rangpur 16.2 8.2 8.0 99.8 3.81 4.1Sylhet 9.9 5 4.9 99.1 1.8 5.5Bangladesh 144.8 73.6 71.2 99.44 32.12 4.5
Source: BBS’2011 and Banglapedia
The estimated number of households is 32.1 million. On average, ahousehold consists of 4.5 persons. Population increased by about 20lakh per year. The rate of population is increasing at the rate of
26
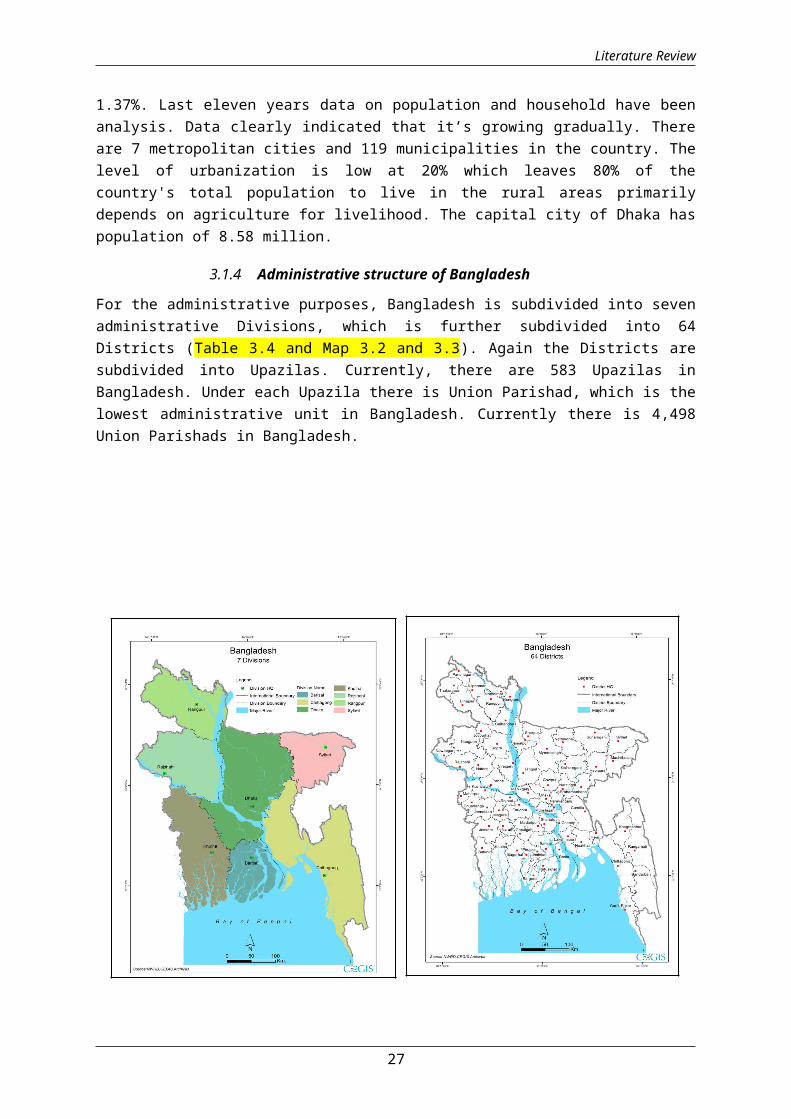
Literature Review
1.37%. Last eleven years data on population and household have beenanalysis. Data clearly indicated that it’s growing gradually. Thereare 7 metropolitan cities and 119 municipalities in the country. Thelevel of urbanization is low at 20% which leaves 80% of thecountry's total population to live in the rural areas primarilydepends on agriculture for livelihood. The capital city of Dhaka haspopulation of 8.58 million.
3.1.4 Administrative structure of Bangladesh
For the administrative purposes, Bangladesh is subdivided into sevenadministrative Divisions, which is further subdivided into 64Districts (Table 3.4 and Map 3.2 and 3.3). Again the Districts aresubdivided into Upazilas. Currently, there are 583 Upazilas inBangladesh. Under each Upazila there is Union Parishad, which is thelowest administrative unit in Bangladesh. Currently there is 4,498Union Parishads in Bangladesh.
27
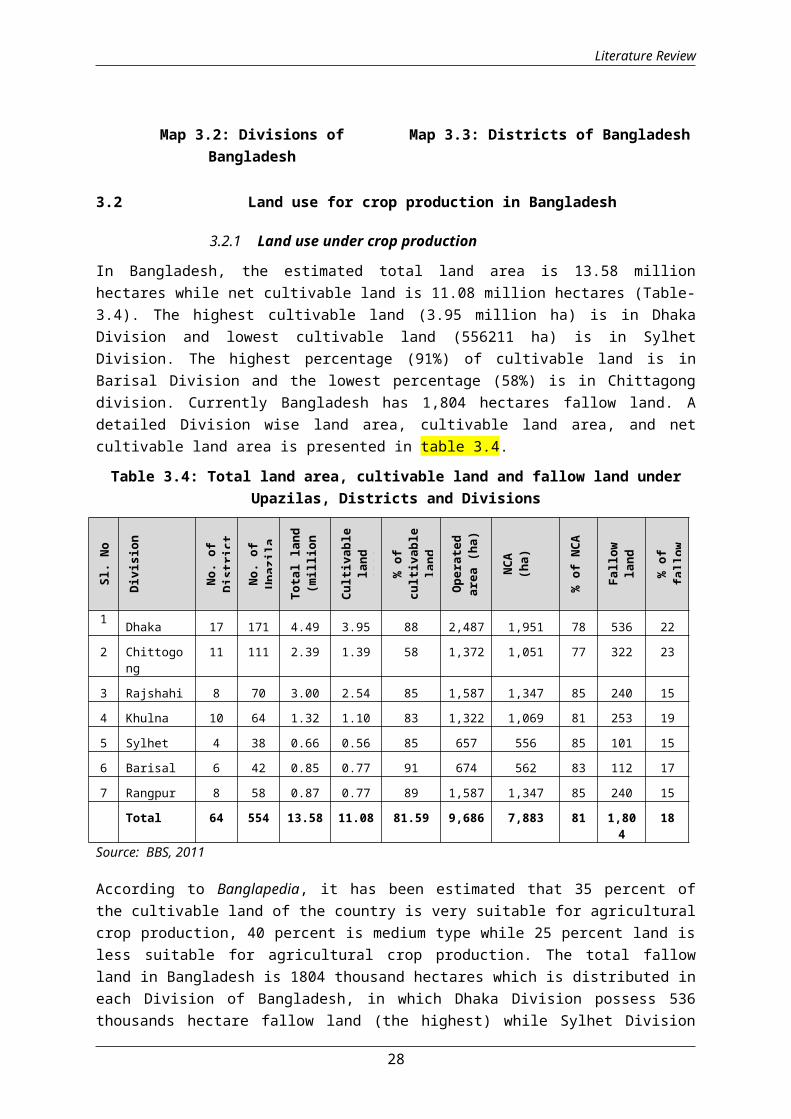
Literature Review
Map 3.2: Divisions ofBangladesh
Map 3.3: Districts of Bangladesh
3.2 Land use for crop production in Bangladesh
3.2.1 Land use under crop production
In Bangladesh, the estimated total land area is 13.58 millionhectares while net cultivable land is 11.08 million hectares (Table-3.4). The highest cultivable land (3.95 million ha) is in DhakaDivision and lowest cultivable land (556211 ha) is in SylhetDivision. The highest percentage (91%) of cultivable land is inBarisal Division and the lowest percentage (58%) is in Chittagongdivision. Currently Bangladesh has 1,804 hectares fallow land. Adetailed Division wise land area, cultivable land area, and netcultivable land area is presented in table 3.4.
Table 3.4: Total land area, cultivable land and fallow land underUpazilas, Districts and Divisions
Sl.
No
Divisi
on
No.
ofDistri
ct
No.
ofUp
azila
Total
land
(milli
onha)
Cultiv
able
land
(milli
on% of
cultiv
able
land
Operat
edarea
(ha
)
NCA
(ha)
% of N
CA
Fall
owland
(000 h
a)
% of
fall
ow
1 Dhaka 17 171 4.49 3.95 88 2,487 1,951 78 536 22
2 Chittogong
11 111 2.39 1.39 58 1,372 1,051 77 322 23
3 Rajshahi 8 70 3.00 2.54 85 1,587 1,347 85 240 15
4 Khulna 10 64 1.32 1.10 83 1,322 1,069 81 253 19
5 Sylhet 4 38 0.66 0.56 85 657 556 85 101 15
6 Barisal 6 42 0.85 0.77 91 674 562 83 112 17
7 Rangpur 8 58 0.87 0.77 89 1,587 1,347 85 240 15
Total 64 554 13.58 11.08 81.59 9,686 7,883 81 1,804
18
Source: BBS, 2011
According to Banglapedia, it has been estimated that 35 percent ofthe cultivable land of the country is very suitable for agriculturalcrop production, 40 percent is medium type while 25 percent land isless suitable for agricultural crop production. The total fallowland in Bangladesh is 1804 thousand hectares which is distributed ineach Division of Bangladesh, in which Dhaka Division possess 536thousands hectare fallow land (the highest) while Sylhet Division
28

Literature Review
has 100 thousand hectares fallow land (the lowest). Figure 3.1illustrates Division wise fallow land in Bangladesh. District wiseTotal land area, cultivable land, NCA and fallow land is presentedin annex-table3.1.45.
Source: BBS’2011
Figure 3.1: Division wise NCA and fallow lands in Bangladesh
3.3 Crop categories and types in Bangladesh
3.3.1 Crop categories in Bangladesh
Crops in Bangladesh are generally categorized into four majorgroups. These are (a) food crops which are the types of crops whichbasically supply and meet the need of the people’s food for whichthe major types are cereals, tubers, roots, pulses, vegetables, oilcrops and fruits, The major cereal crops are rice and wheat etc.,(b) forage crops which are the crops grown basically to feed thelivestock. The main crop of this category are the grasses which aredominating of this category, although it is not widely practiced inBangladesh, (c) fiber crops which basically supply the fiber such asjute, cotton, hemp and kenaf and finally (d) other or miscellaneouscrops which includes tea, tobacco, rubber, ornamental flowers.
3.3.2 Crop types based on production coverage area
With respect to the production coverage area, crops are divided intotwo groups-(a) major crops and (b) minor crops. A detailed of thesetwo crops is given below:
a. Major crops
29

Literature Review
The major crops are those for whose gross crop area (GCA) is onepercent or more. Only nine crops are under this category. These arerice (74 percent), wheat (5 percent), jute (4 percent), rape andmustard (3 percent), lentil (2 percent), chuckling vetch, potato,sugarcane and chilli are grown on one percent or more of the cropacreage (15 million hectare) and considered as major crops inBangladesh.
b. Minor Crops
Crops which are grown on less than one percent of the Gross CroppedArea (CGA) are known as minor crops in Bangladesh. The crops likegram (0.78%), millets and maize (0.60%), onion (0.58%), black gram(0.51%), sweet potato (0.45%), groundnut (0.40%), green pea (0.36%),sesame (0.33%), linseed (0.30%), garlic (0.20%), pea (0.12%), barley(0.10%), etc, are usually considered as minor crops. In addition,some crops, including vegetables, spices, etc, occupy a veryinsignificant proportion of the GCA (i.e. less than 0.10% to eachcrop), and they altogether account for 1.57 percent.
3.3.3 Crop types based on seasonal variation
The crops in this country are grown throughout the year in twodistinct cropping seasons. Based on the seasonal variations, cropsare divided into two groups, which are (a) Kharif crops and (b) Rabicrops. Cosidering the characteristics of the Kharif season, theKharif crops are further divided into two groups, which are (a)Kharif-I crops and (b) Kharif -II crops. Detailed of these crops aregiven below:
a. Kharif crops
The crops that spend the entire or most of the kharif season fortheir physical growth, blossom and fructification, are known askharif crops. The aspects of the Kharif season are (a) hightemperature, (b) heavy rainfall, (c) high relative humidity, (d)more possibilities of storms, (e) more fear of hailstorms, (f) morethreat of flood, (g) more hazards from diseases and pest, (h)irrigation almost not needed, (i) day length is longer or equal tonighttime, (j) The crops that require high temperature arecultivated in kharif season.
Kharif crops encompass the season which is conveniently divided intoKharif-I and Kharif-II seasons. Kharif-I often called Pre-kharifthat actually starts from the middle of March and ends in middle ofMay while Kharif-II starts from middle of May and ends in Middle of
30
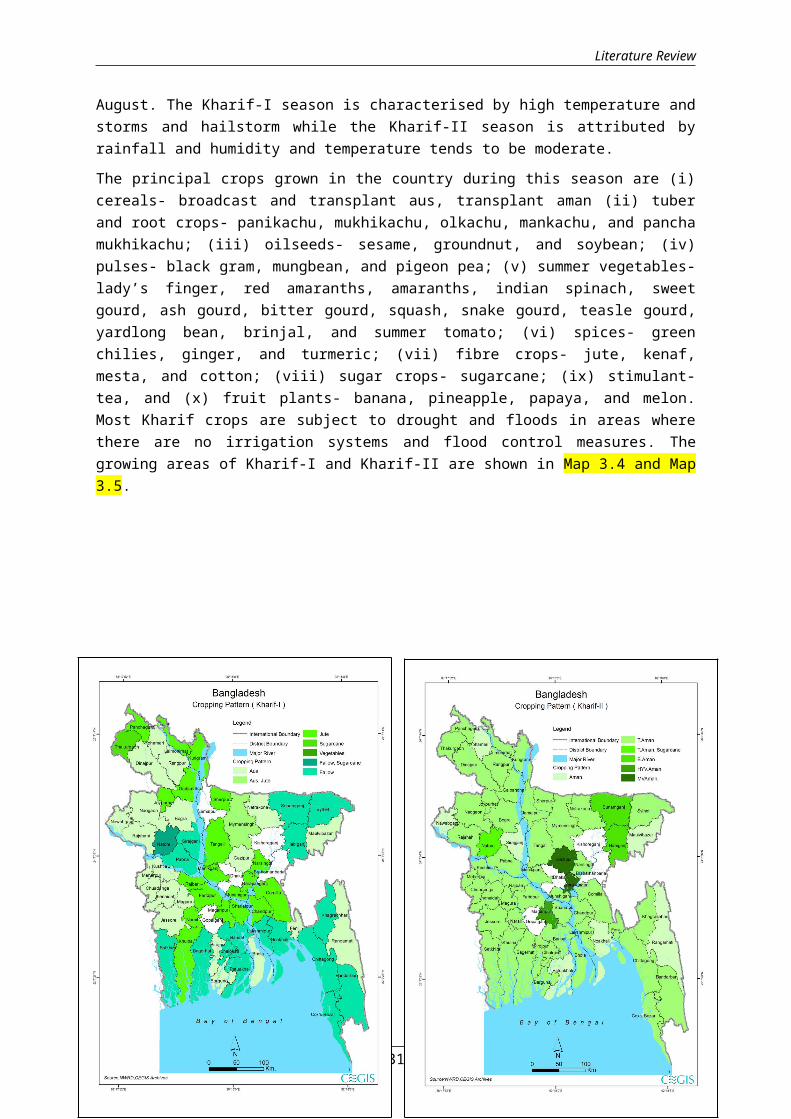
Literature Review
August. The Kharif-I season is characterised by high temperature andstorms and hailstorm while the Kharif-II season is attributed byrainfall and humidity and temperature tends to be moderate.
The principal crops grown in the country during this season are (i)cereals- broadcast and transplant aus, transplant aman (ii) tuberand root crops- panikachu, mukhikachu, olkachu, mankachu, and panchamukhikachu; (iii) oilseeds- sesame, groundnut, and soybean; (iv)pulses- black gram, mungbean, and pigeon pea; (v) summer vegetables-lady’s finger, red amaranths, amaranths, indian spinach, sweetgourd, ash gourd, bitter gourd, squash, snake gourd, teasle gourd,yardlong bean, brinjal, and summer tomato; (vi) spices- greenchilies, ginger, and turmeric; (vii) fibre crops- jute, kenaf,mesta, and cotton; (viii) sugar crops- sugarcane; (ix) stimulant-tea, and (x) fruit plants- banana, pineapple, papaya, and melon.Most Kharif crops are subject to drought and floods in areas wherethere are no irrigation systems and flood control measures. Thegrowing areas of Kharif-I and Kharif-II are shown in Map 3.4 and Map3.5.
31

Literature Review
b. Robi crops
The crops that spend the entire or most of the rabi season for theirphysical growth, blossom and fructification, they are known as rabicrops. The Robi crops are grown during November to February. Theseason is characterized by low temperature, insufficient rainfall,low humidity, less threat to flood and storms, fewer hazards ofdisease, less fear of hailstorms, needs irrigation. The averagelength of the Rabi growing period range from 100-120 days in theextreme west to 140-150 days in the Northeast part of Bangladesh. Major Rabi crops grown in the country include: (i) cereals- wheat,maize, barley, and boro rice; (ii) tuber and roots crops - potatoand sweet potato; (iii) oilseeds- mustard, sesame, groundnut,sunflower, linseed, and safflower; (iv) pulses- chickpea, lentil,grass pea, and cowpea; (v) winter vegetables- cabbage, cauliflower,brinjal, tomato, carrot, turnip, radish, spinach, lettuce, bottlegourd, country bean, and garden pea; (vi) spices- chilli, onion,garlic, coriander, sweet cumin, black cumin, and fenugreek; (vii)fibre crops- sunhemp; (viii) sugar crop- sugarcane; (ix) stimulant-tobacco, and (x) fruit plants- watermelon. The Robi and horticulturecrop growing areas in Bangladesh is shown in maps 3.6 and 3.7respectively.
32
Map 3.4: Kharif I crops by areasin Bangladesh
Map 3.5: Kharif II crops byareas in Bangladesh
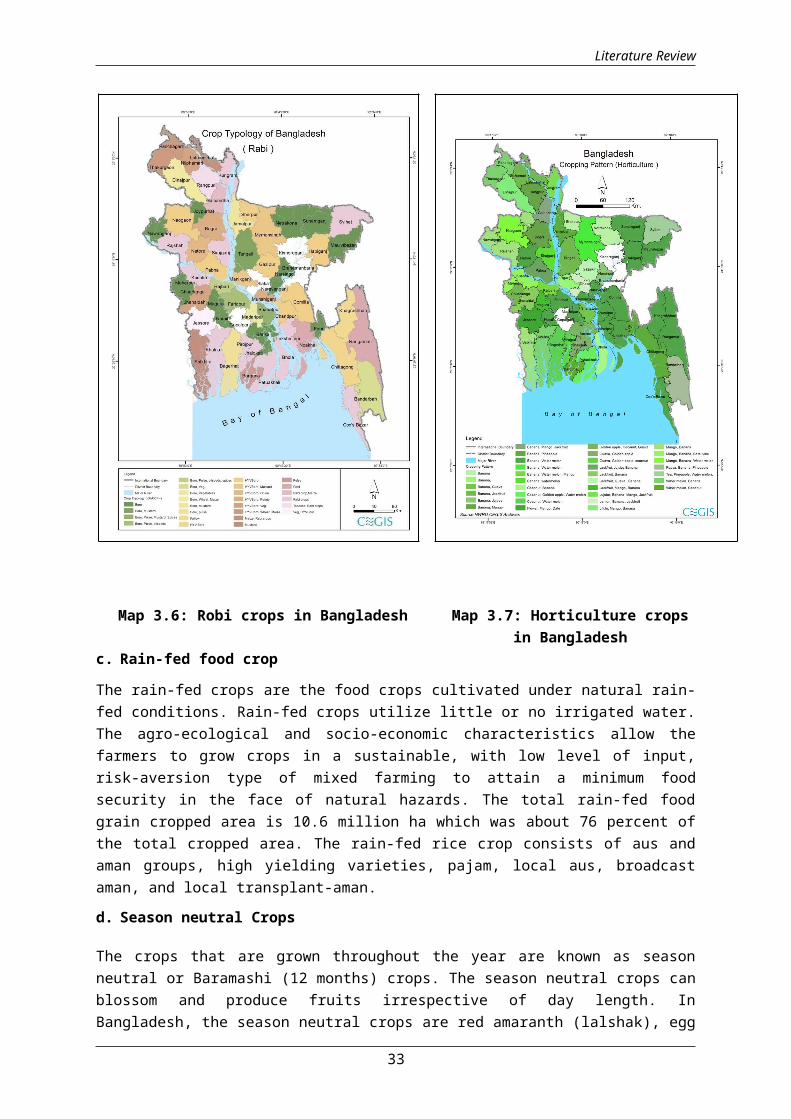
Literature Review
Map 3.6: Robi crops in Bangladesh Map 3.7: Horticulture cropsin Bangladesh
c. Rain-fed food crop
The rain-fed crops are the food crops cultivated under natural rain-fed conditions. Rain-fed crops utilize little or no irrigated water.The agro-ecological and socio-economic characteristics allow thefarmers to grow crops in a sustainable, with low level of input,risk-aversion type of mixed farming to attain a minimum foodsecurity in the face of natural hazards. The total rain-fed foodgrain cropped area is 10.6 million ha which was about 76 percent ofthe total cropped area. The rain-fed rice crop consists of aus andaman groups, high yielding varieties, pajam, local aus, broadcastaman, and local transplant-aman.
d. Season neutral Crops
The crops that are grown throughout the year are known as seasonneutral or Baramashi (12 months) crops. The season neutral crops canblossom and produce fruits irrespective of day length. InBangladesh, the season neutral crops are red amaranth (lalshak), egg
33

Literature Review
plants or brinjals, chilli, papaya, banana etc. which is grown inalmost all parts of the country.
3.3.4 Crop Diversification and crop rotation in Bangladesh
Farmers of Bangladesh practice diversified crops for suitable croprotation of a cropping system in a given year. The purposes thatmotivate farmers of crop diversification are the production of bestoptimal production using multiple crop combination in given yearwithout giving the priority of practice of single cropping system.The crop production factors such as land and soil type, climaticcondition, fertilizer use, seed, irrigation, water, agriculturalmachineries, time frame are used for selection of crops throughoutthe year. Currently the cropping system that are practiced inBangladesh are (a) mixed and relay cropping, (b) Zero tillagemethod, (c) relay cropping and (d) proper utilization of resources.
As an improved and effective agricultural farming technology, likeother countries of the world, farmers in Bangladesh practice croprotation considering the existing soil condition, land type, pestand disease infestation, fertilizer use for sustainable crop yield.In the present context, farmers divide their land into three or fourplots. In the first year, different crops are grown in Rabi, Kharif-I and Kharif-II seasons. Since rice is the principal variety,therefore, it dominates the cropping pattern in Bangladesh.Depending on the land type, temperature, rainfall, sunshine, soilcharacteristics and water availability, rice cropping pattern may besingle, double or triple. In general double or triple croppingpattern is practiced in the high land areas in Bangladesh while inthe medium lowlands, a mixed cropping of Aus and broadcast Aman isthe common cropping practices. In the flooded areas, single croppingof broadcast Aman in Kharif, or Boro in Rabi is the common croppingpractice in Bangladesh. The cropping pattern also varies based onrainfed and irrigated condition. For these two conditions, currentlythe following cropping patterns are practiced in Bangladesh.
Table 3.5: General cropping pattern based on rainfed and irrigatedcondition in Bangladesh
Condition
Cropping seasons in Bangladesh
Kharif-I Kharif-II Rabi
Rainfed Aus/jute/Fallow
T.aman/ Aman/Fallow
Wheat/potato/pulse/Oilseeds/ Sugarcane
Irrigate Vegetables/ T Aman/ Wheat/Boro/potato/
34

Literature Review
d Fallow/ T Aus Fallow/ Maize vegetables/ Maize
For better uses of soil resources, farmers in Bangladesh althoughnot always executed as planned, follow crop rotation to some extent.However, the general practices are cultivation of deep-rooted cropslike jute then follow with shallow rooted crops like rice.
3.3.5 Cropping pattern based on cropping seasons (Kharif-I, Kharif-IIand Rabi) in Bangladesh
Almost all parts of Bangladesh are suitable for production ofvarious types of crops. Based on the suitability of soil and landand other climatic conditions in different seasons in Bangladesh,farmers follow different cropping pattern for production and incometo an optimal level. Crop calendar of Bangladesh is illustrated inFigure 3.2 below.
Figure 3.2: Field crop and fruit crop calendar in BangladeshCrop Kharif I Kharif II Robi
March
April
May
June
July
August
Sept.
Oct.
Nov.
Dec.
Jan.
Feb
T.AusB.AusT.AmanB.AmanBoroWheatMaize(W)PotatoLentilMungbean(W)MustardGroundnut(W)Groundnut(S)Sesame(W)Ginger
35
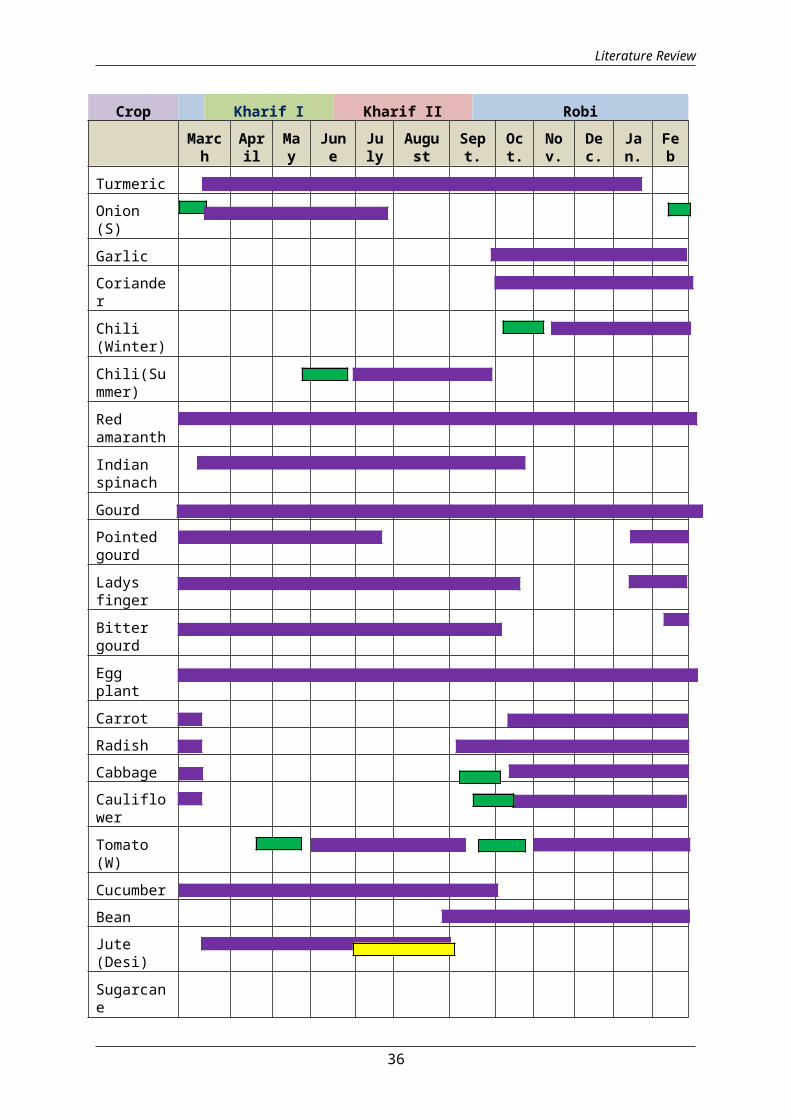
Literature Review
Crop Kharif I Kharif II Robi March
April
May
June
July
August
Sept.
Oct.
Nov.
Dec.
Jan.
Feb
TurmericOnion(S)GarlicCorianderChili(Winter)Chili(Summer)RedamaranthIndianspinachGourdPointedgourdLadysfingerBittergourdEggplantCarrotRadishCabbageCauliflowerTomato(W)CucumberBeanJute(Desi)Sugarcane
36
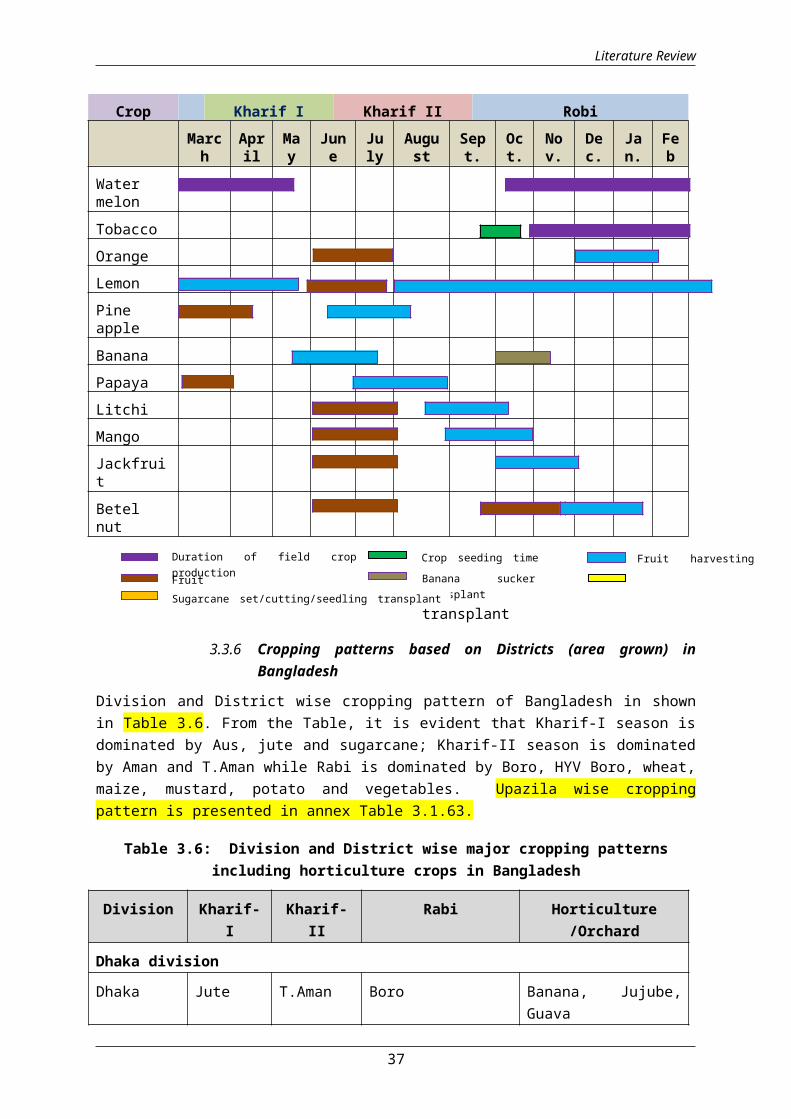
Literature Review
Crop Kharif I Kharif II Robi March
April
May
June
July
August
Sept.
Oct.
Nov.
Dec.
Jan.
Feb
WatermelonTobaccoOrangeLemonPineappleBananaPapayaLitchiMangoJackfruitBetelnut
3.3.6 Cropping patterns based on Districts (area grown) inBangladesh
Division and District wise cropping pattern of Bangladesh in shownin Table 3.6. From the Table, it is evident that Kharif-I season isdominated by Aus, jute and sugarcane; Kharif-II season is dominatedby Aman and T.Aman while Rabi is dominated by Boro, HYV Boro, wheat,maize, mustard, potato and vegetables. Upazila wise croppingpattern is presented in annex Table 3.1.63.
Table 3.6: Division and District wise major cropping patternsincluding horticulture crops in Bangladesh
Division Kharif-I
Kharif-II
Rabi Horticulture/Orchard
Dhaka division
Dhaka Jute T.Aman Boro Banana, Jujube,Guava
37
High labor demandFruit transplanting
Banana sucker
transplant transplant
Sugarcane set/cutting/seedling transplant
Duration of field crop production
Crop seeding time Fruit harvesting

Literature Review
Division Kharif-I
Kharif-II
Rabi Horticulture/Orchard
Faridpur Jute T.Aman Boro, Pulse,oilseeds
Banana, Watermelon
Gazipur Aus MVAman, HYVBoro Jackfruit, Guava,Banana
Gopalgonj Jute Aman HYVBoro, Pulse Water melon,Banana
Jamalpur Vegetable
T.Aman Boro, mustard Banana, Pineapple
Kishorgonj
Fallow T.Aman HYVBoro Banana
Madaripur Jute HYV.Aman Boro, Vegetables Banana, Watermelon
Manikgonj Jute T.Aman HYVBoro, Mustard Banana, Guava
Munshigonj
Jute T.Aman HYVBoro, Potato Banana, Watermelon
Mymensingh
Aus,Jute
T.Aman HYVBoro, Mustard Banana, Watermelon,
Narayangonj
Jute MVAman Boro Banana, Watermelon
Norsingdi Jute T.Aman Boro Banana, Jujube
Netrokona Aus T.Aman Boro Banana
Rajbari Jute T.Aman Boro, Pulse,oilseeds, spices
Banana, Watermelon, Mango
Sariotpur Jute T.Aman Boro, Pulse,Mustard, Spices
Banana, Guava
Sherpur Jute T.Aman HYVBoro Banana
Tangail Jute T.Aman Boro, Mustard Banana, Jackfruit
Chittagong division
Bandarban Fallow T.Aman Boro, Veg. Papya, Banana,Pineapple
B.Baria Fallow T. Aman HYVBoro Banana, Pineapple
Chandpur Jute T. Aman HYVBoro Banana, Watermelon
38
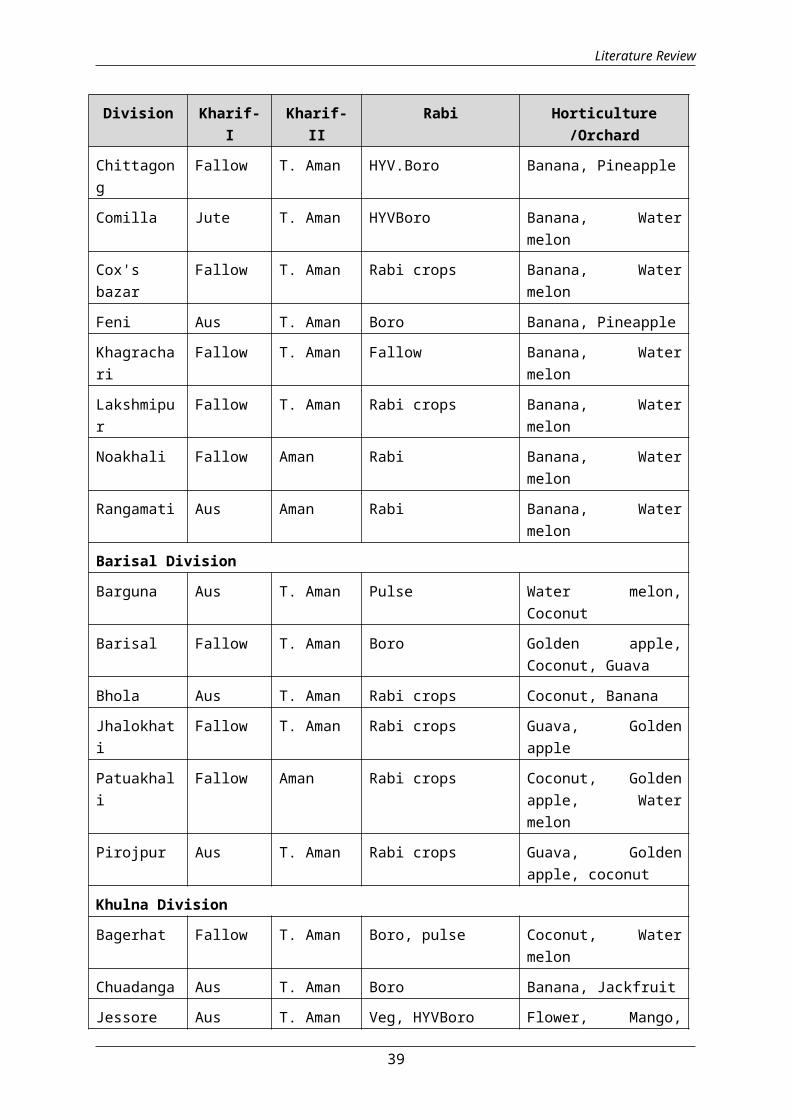
Literature Review
Division Kharif-I
Kharif-II
Rabi Horticulture/Orchard
Chittagong
Fallow T. Aman HYV.Boro Banana, Pineapple
Comilla Jute T. Aman HYVBoro Banana, Watermelon
Cox'sbazar
Fallow T. Aman Rabi crops Banana, Watermelon
Feni Aus T. Aman Boro Banana, Pineapple
Khagrachari
Fallow T. Aman Fallow Banana, Watermelon
Lakshmipur
Fallow T. Aman Rabi crops Banana, Watermelon
Noakhali Fallow Aman Rabi Banana, Watermelon
Rangamati Aus Aman Rabi Banana, Watermelon
Barisal Division
Barguna Aus T. Aman Pulse Water melon,Coconut
Barisal Fallow T. Aman Boro Golden apple,Coconut, Guava
Bhola Aus T. Aman Rabi crops Coconut, Banana
Jhalokhati
Fallow T. Aman Rabi crops Guava, Goldenapple
Patuakhali
Fallow Aman Rabi crops Coconut, Goldenapple, Watermelon
Pirojpur Aus T. Aman Rabi crops Guava, Goldenapple, coconut
Khulna Division
Bagerhat Fallow T. Aman Boro, pulse Coconut, Watermelon
Chuadanga Aus T. Aman Boro Banana, Jackfruit
Jessore Aus T. Aman Veg, HYVBoro Flower, Mango,
39
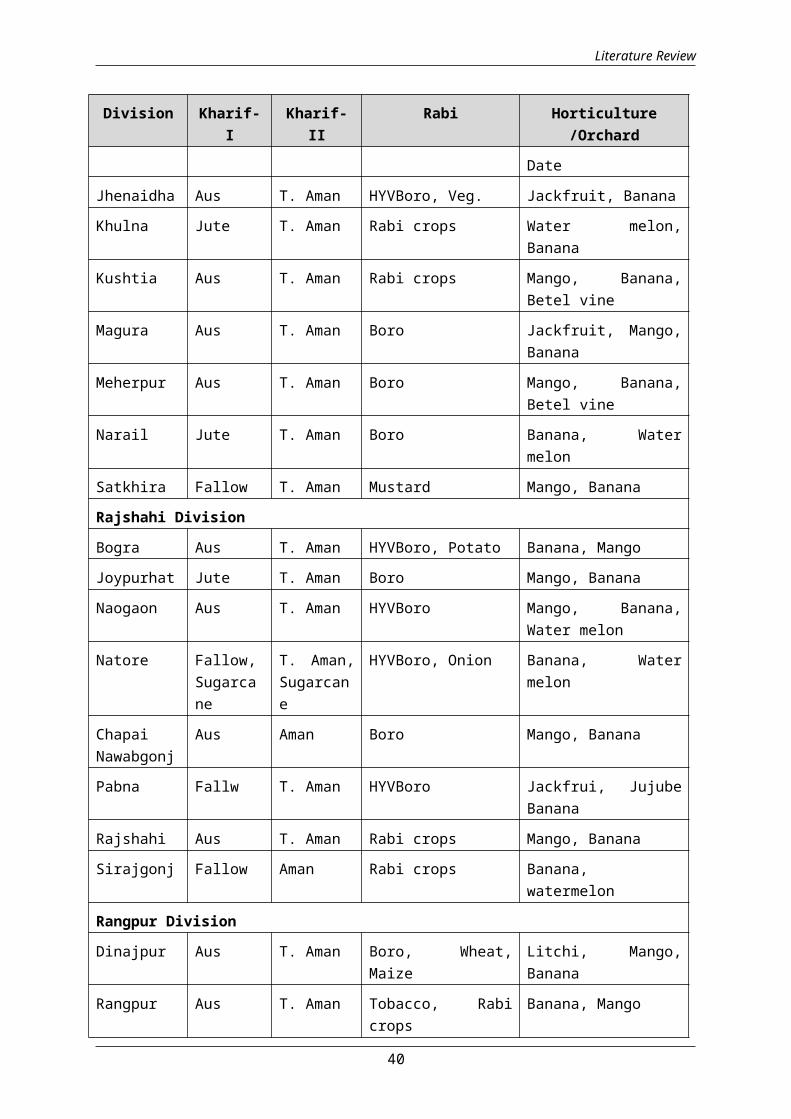
Literature Review
Division Kharif-I
Kharif-II
Rabi Horticulture/Orchard
Date
Jhenaidha Aus T. Aman HYVBoro, Veg. Jackfruit, Banana
Khulna Jute T. Aman Rabi crops Water melon,Banana
Kushtia Aus T. Aman Rabi crops Mango, Banana,Betel vine
Magura Aus T. Aman Boro Jackfruit, Mango,Banana
Meherpur Aus T. Aman Boro Mango, Banana,Betel vine
Narail Jute T. Aman Boro Banana, Watermelon
Satkhira Fallow T. Aman Mustard Mango, Banana
Rajshahi Division
Bogra Aus T. Aman HYVBoro, Potato Banana, Mango
Joypurhat Jute T. Aman Boro Mango, Banana
Naogaon Aus T. Aman HYVBoro Mango, Banana,Water melon
Natore Fallow,Sugarcane
T. Aman,Sugarcane
HYVBoro, Onion Banana, Watermelon
ChapaiNawabgonj
Aus Aman Boro Mango, Banana
Pabna Fallw T. Aman HYVBoro Jackfrui, JujubeBanana
Rajshahi Aus T. Aman Rabi crops Mango, Banana
Sirajgonj Fallow Aman Rabi crops Banana,watermelon
Rangpur Division
Dinajpur Aus T. Aman Boro, Wheat,Maize
Litchi, Mango,Banana
Rangpur Aus T. Aman Tobacco, Rabicrops
Banana, Mango
40

Literature Review
Division Kharif-I
Kharif-II
Rabi Horticulture/Orchard
Gaibandha Jute T. Aman Rabi crop,Maize Banana, Mango,Jackfruit
Kurigram Jute T. Aman Rabi crops Jujube, Banana,Mango, Jackfruit
Lalmonirhat
Jute T. Aman Maize, Rabicrops
Banana, Jackfruit
Nilphamari
Aus Aman HYVBoro, Veg. Banana, Jackfruit
Panchagarh
Jute T. Aman HYVBoro, Wheat,Maize
Water melon,Banana
Thakurgaon
Sugarcane
T. Aman HYV Boro, Wheat,Maize
Water melon,Banana
Sylhet division
Hobigonj Fallow B. Aman HYVBoro Banana, Watermelon
Maulovibazar
Aus Aman Boro Banana, Watermelon
Sunamgonj Fallow B. Aman Boro Banana, Watermelon
Sylhet Fallow T. Aman Rabi crops Tea, Pineapple,Water melon,
Source: CEGIS field visit, District DAE office of Bangladesh
According to the gross cropped area (CGA), there are only nine cropsthat are grown on more than one percent of NCA. These are (1) rice(73 percent), wheat (4.45 percent), jute (3.91 percent), rape andmustard (3.08 percent), lentil (1.54 percent), chicklling vetch(1.25 percent), potato (1.13 percent), sugarcane (1.12 percent) andchilli (1.05 percent) are grown on 1 percent or more of the cropacreages. Farmers also consider horticultural crops like mango,litchi with the common cropping pattern in Bangladesh.
Table 3.6 signify that in Bangladesh, farmers grow rice, potato,wheat, jute, sow pulses, oilseeds, potato, vegetables andsugarcanes. However, the common practices are 2-crop combination and3-crop combinations. The two crops combinations are amon-boro rice
41
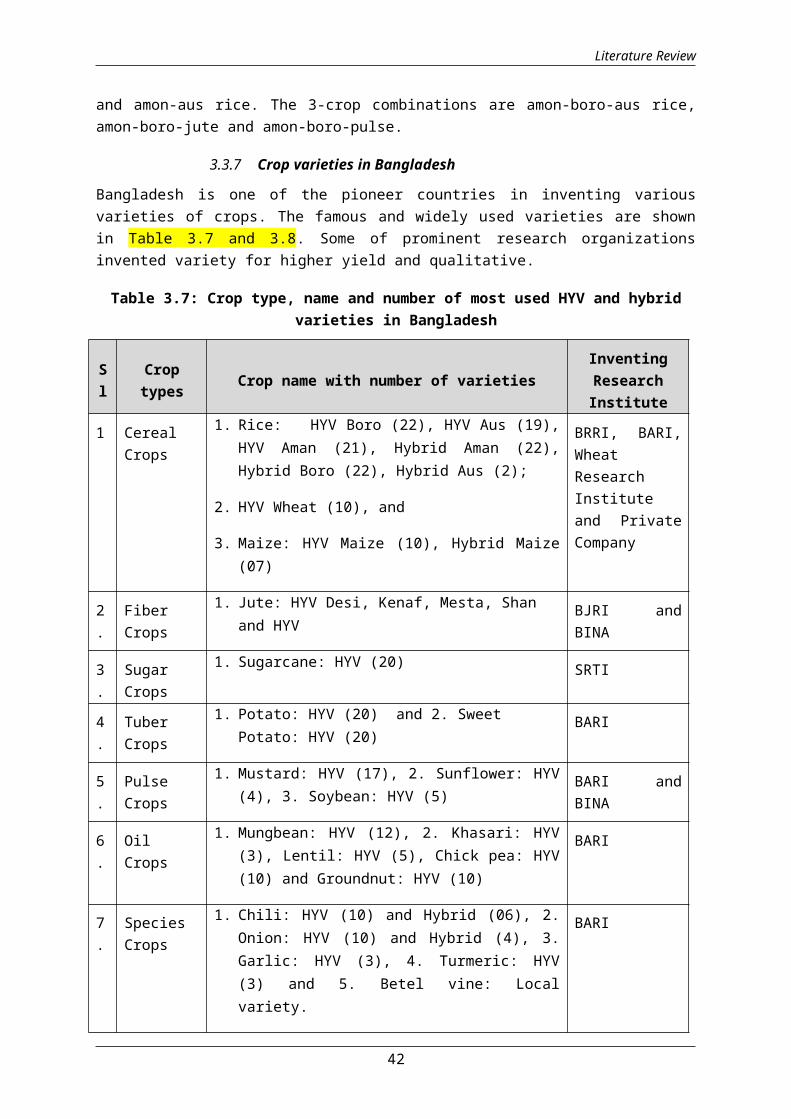
Literature Review
and amon-aus rice. The 3-crop combinations are amon-boro-aus rice,amon-boro-jute and amon-boro-pulse.
3.3.7 Crop varieties in Bangladesh
Bangladesh is one of the pioneer countries in inventing variousvarieties of crops. The famous and widely used varieties are shownin Table 3.7 and 3.8. Some of prominent research organizationsinvented variety for higher yield and qualitative.
Table 3.7: Crop type, name and number of most used HYV and hybridvarieties in Bangladesh
Sl
Croptypes Crop name with number of varieties
InventingResearchInstitute
1 CerealCrops
1. Rice: HYV Boro (22), HYV Aus (19),HYV Aman (21), Hybrid Aman (22),Hybrid Boro (22), Hybrid Aus (2);
2. HYV Wheat (10), and
3. Maize: HYV Maize (10), Hybrid Maize(07)
BRRI, BARI,WheatResearchInstituteand PrivateCompany
2.
FiberCrops
1. Jute: HYV Desi, Kenaf, Mesta, Shan and HYV
BJRI andBINA
3.
SugarCrops
1. Sugarcane: HYV (20) SRTI
4.
TuberCrops
1. Potato: HYV (20) and 2. Sweet Potato: HYV (20)
BARI
5.
PulseCrops
1. Mustard: HYV (17), 2. Sunflower: HYV(4), 3. Soybean: HYV (5)
BARI andBINA
6.
OilCrops
1. Mungbean: HYV (12), 2. Khasari: HYV(3), Lentil: HYV (5), Chick pea: HYV(10) and Groundnut: HYV (10)
BARI
7.
SpeciesCrops
1. Chili: HYV (10) and Hybrid (06), 2.Onion: HYV (10) and Hybrid (4), 3.Garlic: HYV (3), 4. Turmeric: HYV(3) and 5. Betel vine: Localvariety.
BARI
42

Literature Review
Sl
Croptypes Crop name with number of varieties
InventingResearchInstitute
8.
Wintervegetables
1. Tomato: HYV (10) and Hybrid (02), 2.Cabbage: HYV (2) and Hybrid (1), 3.Kankkong: HYV (1) and Hybrid (1), 4.Bean: HYV (7) and Hybrid (1) andCauliflower: HYV (10) and Hybrid(2).
BARI, BAU,IPSA
9.
Summervegetable
1. Brinjal: HYV (5) and Hybrid (02), 2.Cucumber, 3. All gourds: HYV (4) andHybrid (3), 4. Yard long bean: HYV(1) and Hybrid (1).
BARI
Source: BARI, 2011 and Discussion with BRRI, BARI scientist and SAAO.
Note: Details of crops, names varieties are shown in Annex A. Number of varieties is shown in thebracket.
Table 3.8: Development of crop variety types in Bangladesh
Sl
Cropvarietie
s
Scientific names
No.of
variety
Names of the popularvarieties
SignificantCharacteris
tics
1 Rice(Modernvarieties)
Oryza sativa 95 BR-28, BR-25, BR-27,BRRIdhan28, BRRIdhan29, BRRI dhan35,BRRI Dhan47, BRRIdhan51, BRRI dhan36BRRI dhan44, BRRIdhan43, BRRIdhan40,BR-19, BRRI Hybriddhan3, BRRI Hybriddhan 4, BRRI Hybriddhan 2, BRRI dhan ( 2—61)
Highyielding,hazardtolerant,
Hybrid Oroza sativa 8 Hira, Shathi,Jagoroni, BRRIdhan1-4,Aloron, Sonarbangla,Aftab LP, Manik,
Higheryield,HazardSophisticated, careful
43
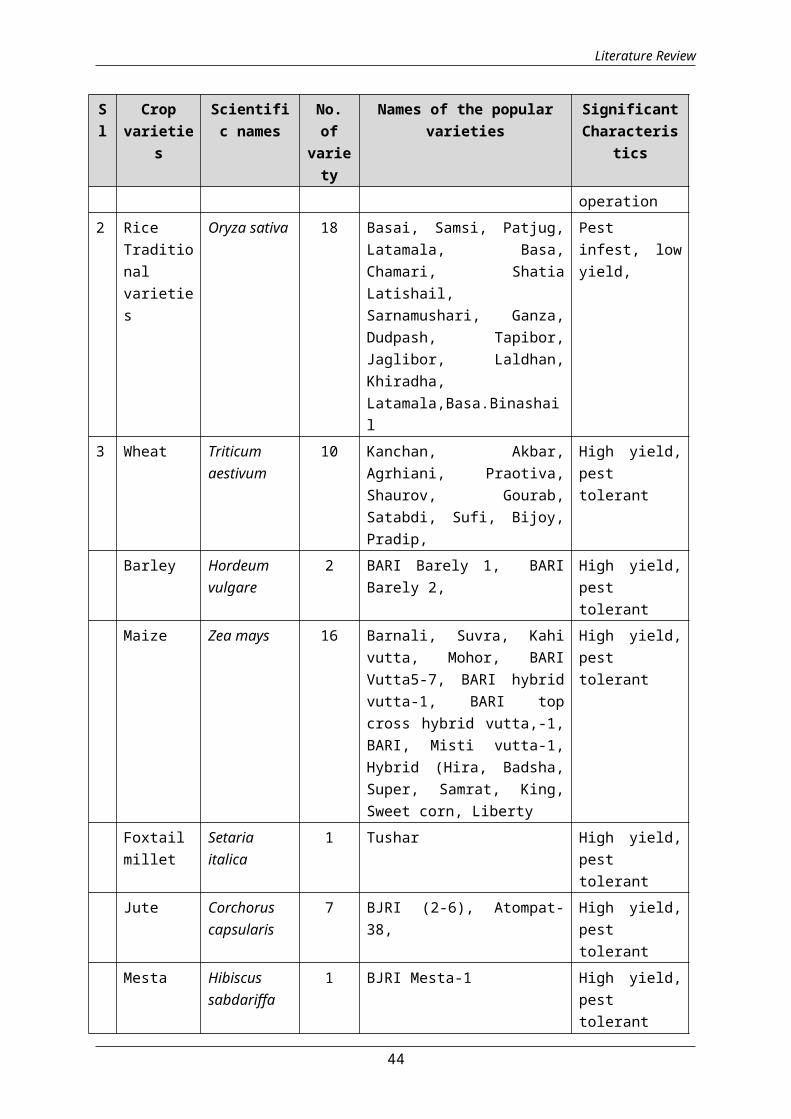
Literature Review
Sl
Cropvarietie
s
Scientific names
No.of
variety
Names of the popularvarieties
SignificantCharacteris
tics
operation2 Rice
Traditionalvarieties
Oryza sativa 18 Basai, Samsi, Patjug,Latamala, Basa,Chamari, ShatiaLatishail,Sarnamushari, Ganza,Dudpash, Tapibor,Jaglibor, Laldhan,Khiradha,Latamala,Basa.Binashail
Pestinfest, lowyield,
3 Wheat Triticumaestivum
10 Kanchan, Akbar,Agrhiani, Praotiva,Shaurov, Gourab,Satabdi, Sufi, Bijoy,Pradip,
High yield,pesttolerant
Barley Hordeumvulgare
2 BARI Barely 1, BARIBarely 2,
High yield,pesttolerant
Maize Zea mays 16 Barnali, Suvra, Kahivutta, Mohor, BARIVutta5-7, BARI hybridvutta-1, BARI topcross hybrid vutta,-1,BARI, Misti vutta-1,Hybrid (Hira, Badsha,Super, Samrat, King,Sweet corn, Liberty
High yield,pesttolerant
Foxtailmillet
Setariaitalica
1 Tushar High yield,pesttolerant
Jute Corchoruscapsularis
7 BJRI (2-6), Atompat-38,
High yield,pesttolerant
Mesta Hibiscussabdariffa
1 BJRI Mesta-1 High yield,pesttolerant
44
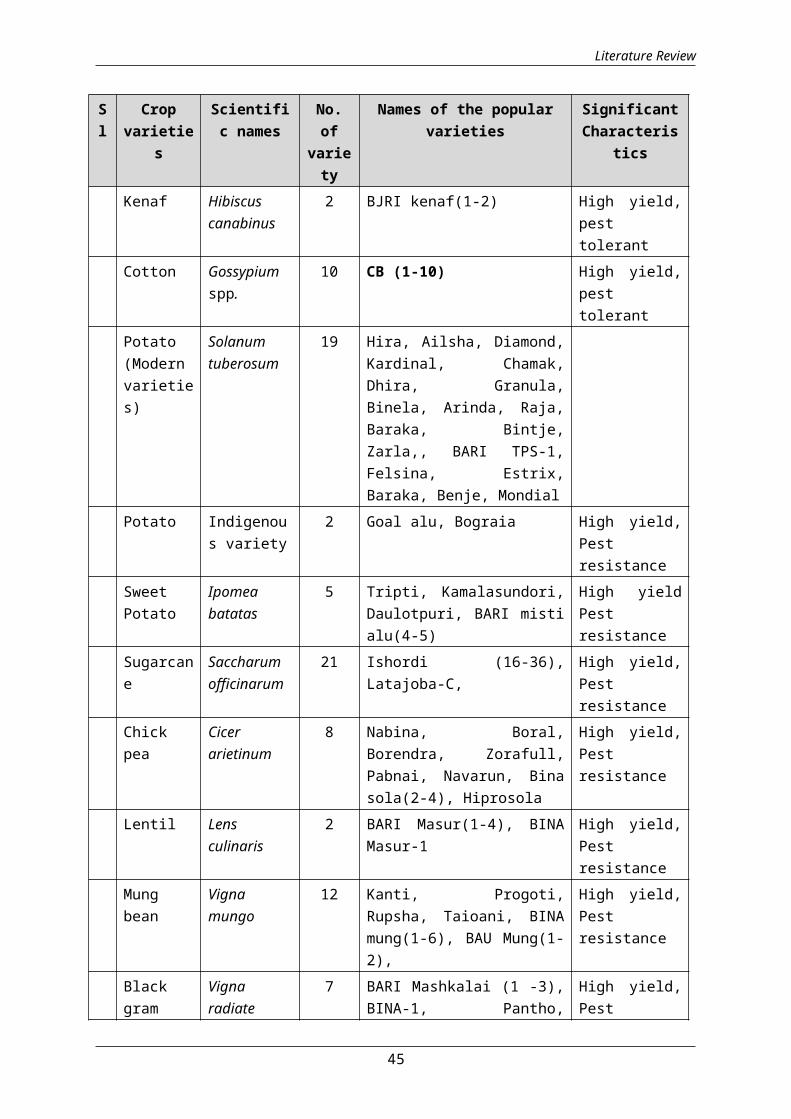
Literature Review
Sl
Cropvarietie
s
Scientific names
No.of
variety
Names of the popularvarieties
SignificantCharacteris
tics
Kenaf Hibiscuscanabinus
2 BJRI kenaf(1-2) High yield,pesttolerant
Cotton Gossypiumspp.
10 CB (1-10) High yield,pesttolerant
Potato(Modernvarieties)
Solanumtuberosum
19 Hira, Ailsha, Diamond,Kardinal, Chamak,Dhira, Granula,Binela, Arinda, Raja,Baraka, Bintje,Zarla,, BARI TPS-1,Felsina, Estrix,Baraka, Benje, Mondial
Potato Indigenous variety
2 Goal alu, Bograia High yield,Pestresistance
SweetPotato
Ipomeabatatas
5 Tripti, Kamalasundori,Daulotpuri, BARI mistialu(4-5)
High yieldPestresistance
Sugarcane
Saccharumofficinarum
21 Ishordi (16-36),Latajoba-C,
High yield,Pestresistance
Chickpea
Cicerarietinum
8 Nabina, Boral,Borendra, Zorafull,Pabnai, Navarun, Binasola(2-4), Hiprosola
High yield,Pestresistance
Lentil Lensculinaris
2 BARI Masur(1-4), BINAMasur-1
High yield,Pestresistance
Mungbean
Vignamungo
12 Kanti, Progoti,Rupsha, Taioani, BINAmung(1-6), BAU Mung(1-2),
High yield,Pestresistance
Blackgram
Vignaradiate
7 BARI Mashkalai (1 -3),BINA-1, Pantho,
High yield,Pest
45
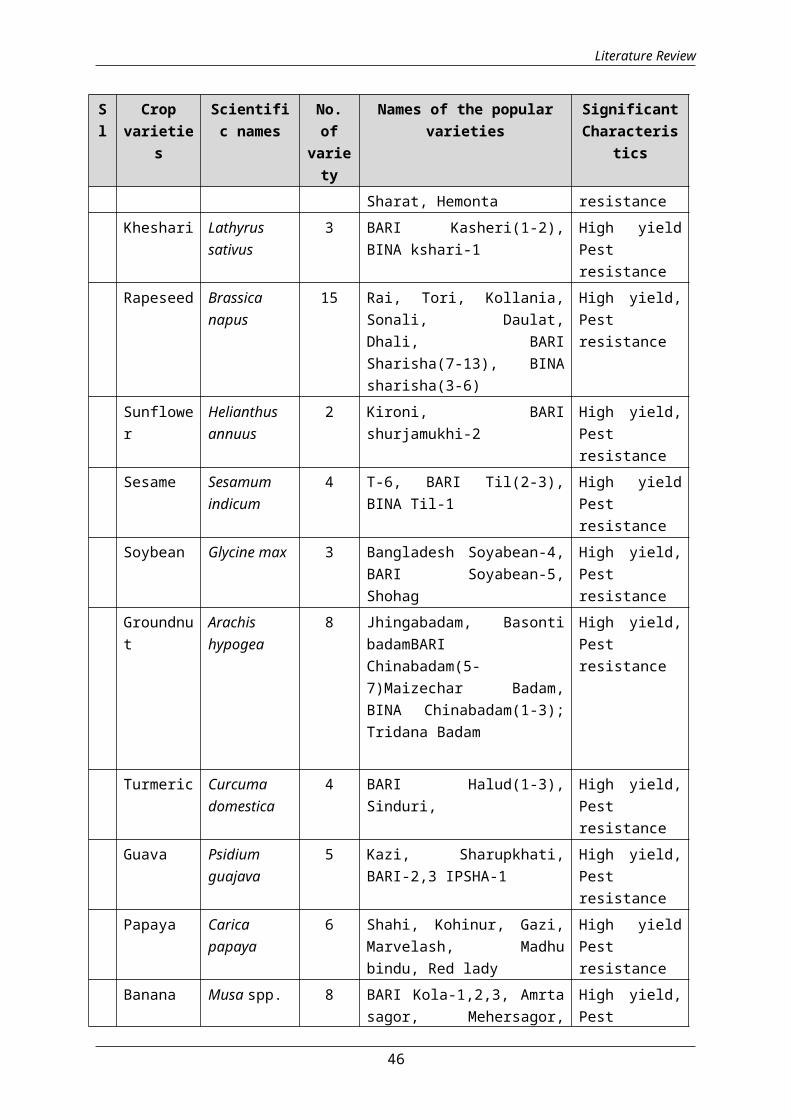
Literature Review
Sl
Cropvarietie
s
Scientific names
No.of
variety
Names of the popularvarieties
SignificantCharacteris
tics
Sharat, Hemonta resistanceKheshari Lathyrus
sativus3 BARI Kasheri(1-2),
BINA kshari-1High yieldPestresistance
Rapeseed Brassicanapus
15 Rai, Tori, Kollania,Sonali, Daulat,Dhali, BARISharisha(7-13), BINAsharisha(3-6)
High yield,Pestresistance
Sunflower
Helianthusannuus
2 Kironi, BARIshurjamukhi-2
High yield,Pestresistance
Sesame Sesamumindicum
4 T-6, BARI Til(2-3),BINA Til-1
High yieldPestresistance
Soybean Glycine max 3 Bangladesh Soyabean-4,BARI Soyabean-5,Shohag
High yield,Pestresistance
Groundnut
Arachishypogea
8 Jhingabadam, BasontibadamBARIChinabadam(5-7)Maizechar Badam,BINA Chinabadam(1-3);Tridana Badam
High yield,Pestresistance
Turmeric Curcumadomestica
4 BARI Halud(1-3),Sinduri,
High yield,Pestresistance
Guava Psidiumguajava
5 Kazi, Sharupkhati,BARI-2,3 IPSHA-1
High yield,Pestresistance
Papaya Caricapapaya
6 Shahi, Kohinur, Gazi,Marvelash, Madhubindu, Red lady
High yieldPestresistance
Banana Musa spp. 8 BARI Kola-1,2,3, Amrtasagor, Mehersagor,
High yield,Pest
46
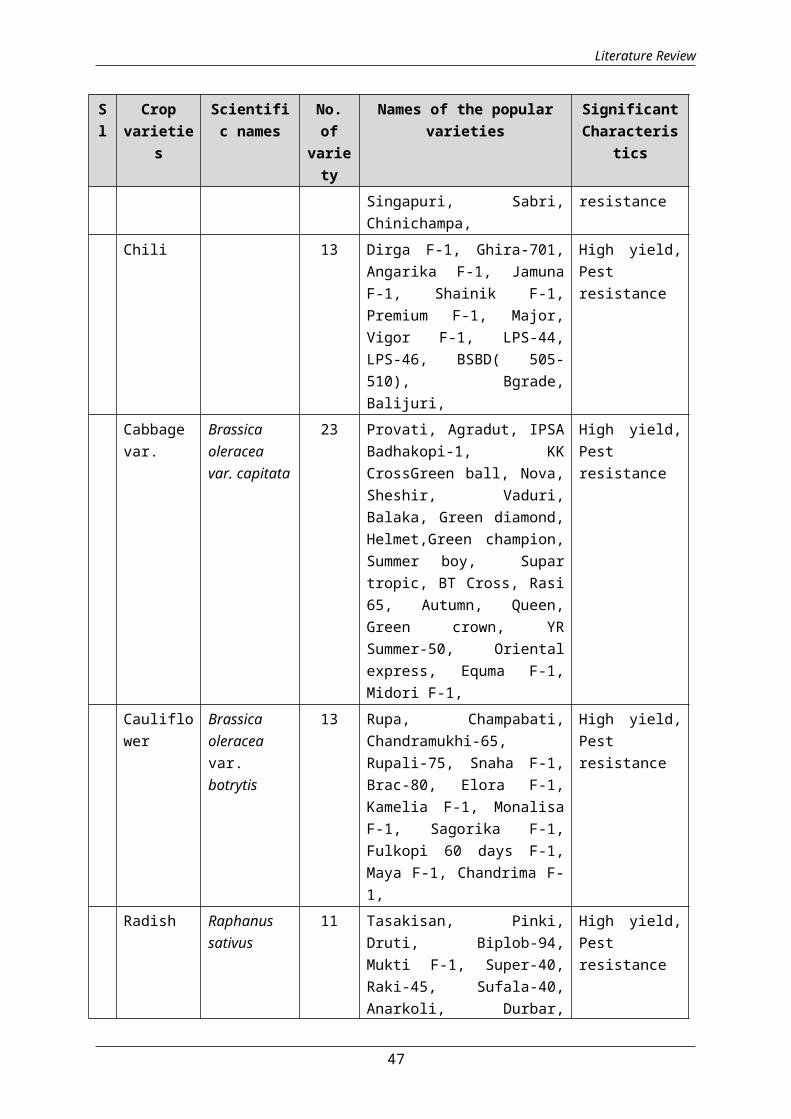
Literature Review
Sl
Cropvarietie
s
Scientific names
No.of
variety
Names of the popularvarieties
SignificantCharacteris
tics
Singapuri, Sabri,Chinichampa,
resistance
Chili 13 Dirga F-1, Ghira-701,Angarika F-1, JamunaF-1, Shainik F-1,Premium F-1, Major,Vigor F-1, LPS-44,LPS-46, BSBD( 505-510), Bgrade,Balijuri,
High yield,Pestresistance
Cabbagevar.
Brassicaoleraceavar. capitata
23 Provati, Agradut, IPSABadhakopi-1, KKCrossGreen ball, Nova,Sheshir, Vaduri,Balaka, Green diamond,Helmet,Green champion,Summer boy, Supartropic, BT Cross, Rasi65, Autumn, Queen,Green crown, YRSummer-50, Orientalexpress, Equma F-1,Midori F-1,
High yield,Pestresistance
Cauliflower
Brassicaoleraceavar.botrytis
13 Rupa, Champabati,Chandramukhi-65,Rupali-75, Snaha F-1,Brac-80, Elora F-1,Kamelia F-1, MonalisaF-1, Sagorika F-1,Fulkopi 60 days F-1,Maya F-1, Chandrima F-1,
High yield,Pestresistance
Radish Raphanussativus
11 Tasakisan, Pinki,Druti, Biplob-94,Mukti F-1, Super-40,Raki-45, Sufala-40,Anarkoli, Durbar,
High yield,Pestresistance
47

Literature Review
Sl
Cropvarietie
s
Scientific names
No.of
variety
Names of the popularvarieties
SignificantCharacteris
tics
Barkoti-40.Onion Allium cepa 7 BARI-1, BARI-2,
Gulshan-71, SarnaLatim Faridpuri,Taherpuri, Goldenball, Diamond
High yieldPestresistance
Tomato Lycopersiconlycopersicum
16 Manik,, Ratan, BARI-3,BARI-4, BARI-5, Caiti,Apurba, Shila, Lalima,Anupama, Jhumka,Sindur, Srabani,Bahar, BINA-2,3
High yield,Pestresistance
Cucumber Cucumissativus
12 Dadi-2231, Hira-904,Hemal, Titumir, Alvi,Green king, Shila,Baromashi, Jati, Greenjaunt , Beautiful,Evergreen,
High yield,Pestresistance
Brinjal Solanummelongena
12 BSBD-403, 410,414,415,417, Kajla,Laboni, Surivi,Chamak, Ullash, Laki,Mohoni
High yield,Pestresistance
Bottlegourd
Lagenariavulgaris
6 Jamali, Jhinai, RajaF-1, Rani F-1, Dalisa
High yieldPestresistance
Source: BARI and BRRI’2012
3.4 Agro-meteorological condition for crop production
Selection of crops for cultivation in a given cropping seasons(Rabi, Kharif-I, Kharif-II) depends on the weather and climaticcondition. For the purpose of this study, the following climaticparameters have been considered:
1. Rainfall2. Temperature3. Humidity, and
48
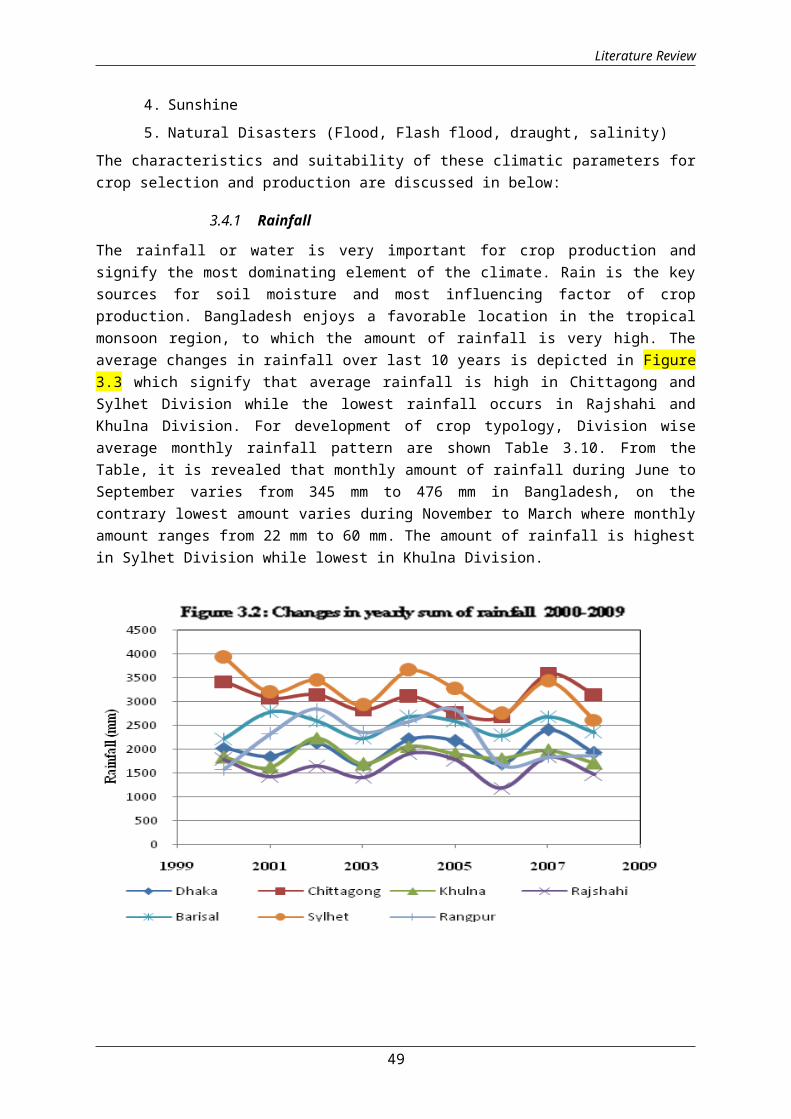
Literature Review
4. Sunshine5. Natural Disasters (Flood, Flash flood, draught, salinity)
The characteristics and suitability of these climatic parameters forcrop selection and production are discussed in below:
3.4.1 Rainfall
The rainfall or water is very important for crop production andsignify the most dominating element of the climate. Rain is the keysources for soil moisture and most influencing factor of cropproduction. Bangladesh enjoys a favorable location in the tropicalmonsoon region, to which the amount of rainfall is very high. Theaverage changes in rainfall over last 10 years is depicted in Figure3.3 which signify that average rainfall is high in Chittagong andSylhet Division while the lowest rainfall occurs in Rajshahi andKhulna Division. For development of crop typology, Division wiseaverage monthly rainfall pattern are shown Table 3.10. From theTable, it is revealed that monthly amount of rainfall during June toSeptember varies from 345 mm to 476 mm in Bangladesh, on thecontrary lowest amount varies during November to March where monthlyamount ranges from 22 mm to 60 mm. The amount of rainfall is highestin Sylhet Division while lowest in Khulna Division.
49
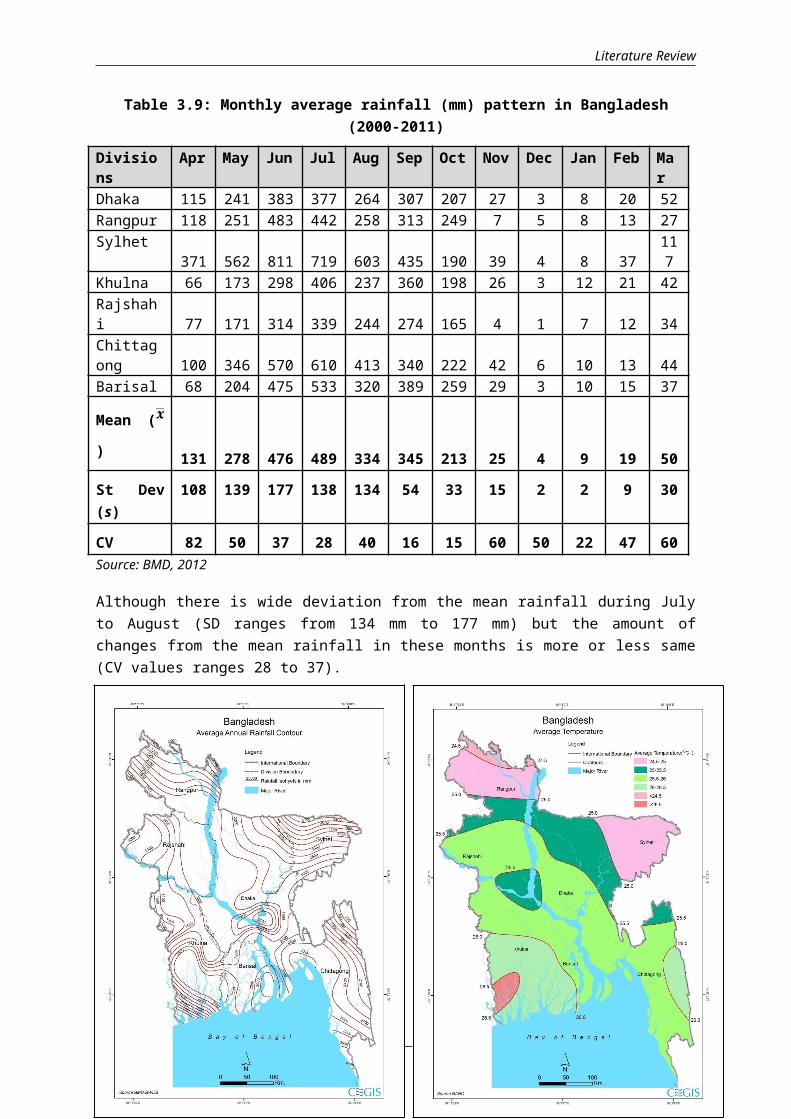
Literature Review
Table 3.9: Monthly average rainfall (mm) pattern in Bangladesh(2000-2011)
Divisions
Apr May Jun Jul Aug Sep Oct Nov Dec Jan Feb Mar
Dhaka 115 241 383 377 264 307 207 27 3 8 20 52Rangpur 118 251 483 442 258 313 249 7 5 8 13 27Sylhet
371 562 811 719 603 435 190 39 4 8 37117
Khulna 66 173 298 406 237 360 198 26 3 12 21 42Rajshahi 77 171 314 339 244 274 165 4 1 7 12 34Chittagong 100 346 570 610 413 340 222 42 6 10 13 44Barisal 68 204 475 533 320 389 259 29 3 10 15 37
Mean (
) 131 278 476 489 334 345 213 25 4 9 19 50
St Dev(s)
108 139 177 138 134 54 33 15 2 2 9 30
CV 82 50 37 28 40 16 15 60 50 22 47 60Source: BMD, 2012
Although there is wide deviation from the mean rainfall during Julyto August (SD ranges from 134 mm to 177 mm) but the amount ofchanges from the mean rainfall in these months is more or less same(CV values ranges 28 to 37).
50
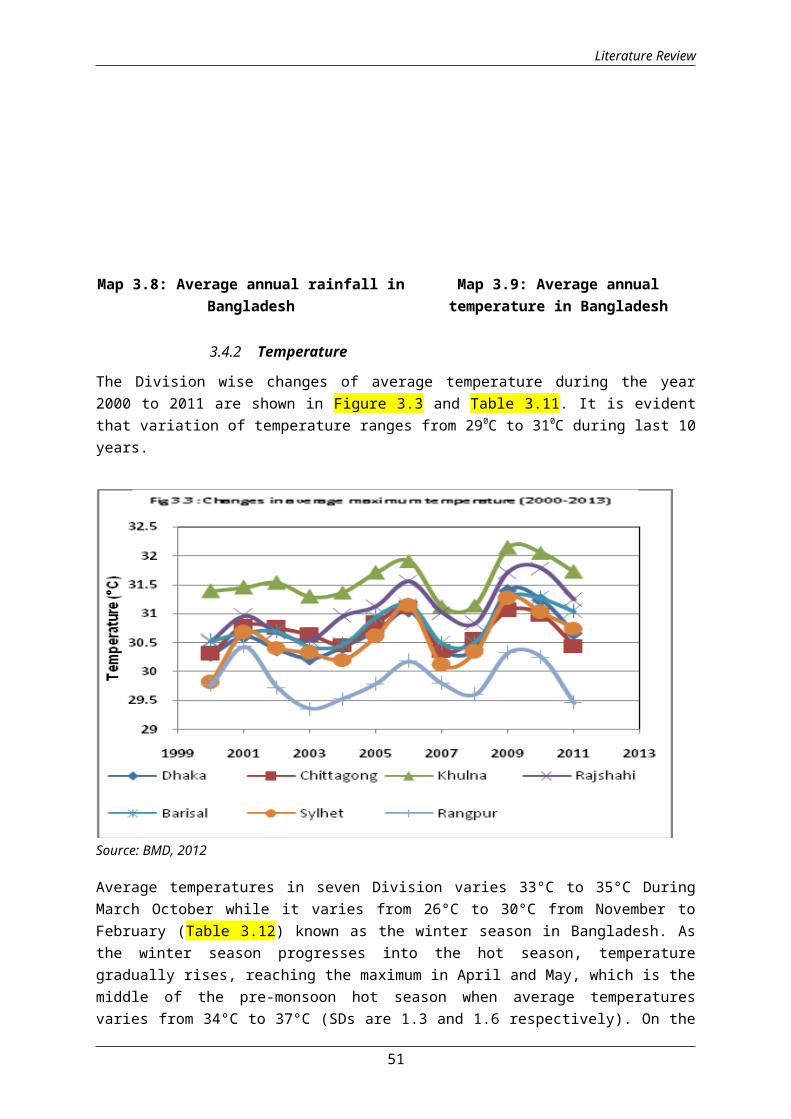
Literature Review
Map 3.8: Average annual rainfall inBangladesh
Map 3.9: Average annualtemperature in Bangladesh
3.4.2 Temperature
The Division wise changes of average temperature during the year2000 to 2011 are shown in Figure 3.3 and Table 3.11. It is evidentthat variation of temperature ranges from 290C to 310C during last 10years.
Source: BMD, 2012
Average temperatures in seven Division varies 33°C to 35°C DuringMarch October while it varies from 26°C to 30°C from November toFebruary (Table 3.12) known as the winter season in Bangladesh. Asthe winter season progresses into the hot season, temperaturegradually rises, reaching the maximum in April and May, which is themiddle of the pre-monsoon hot season when average temperaturesvaries from 34°C to 37°C (SDs are 1.3 and 1.6 respectively). On the
51
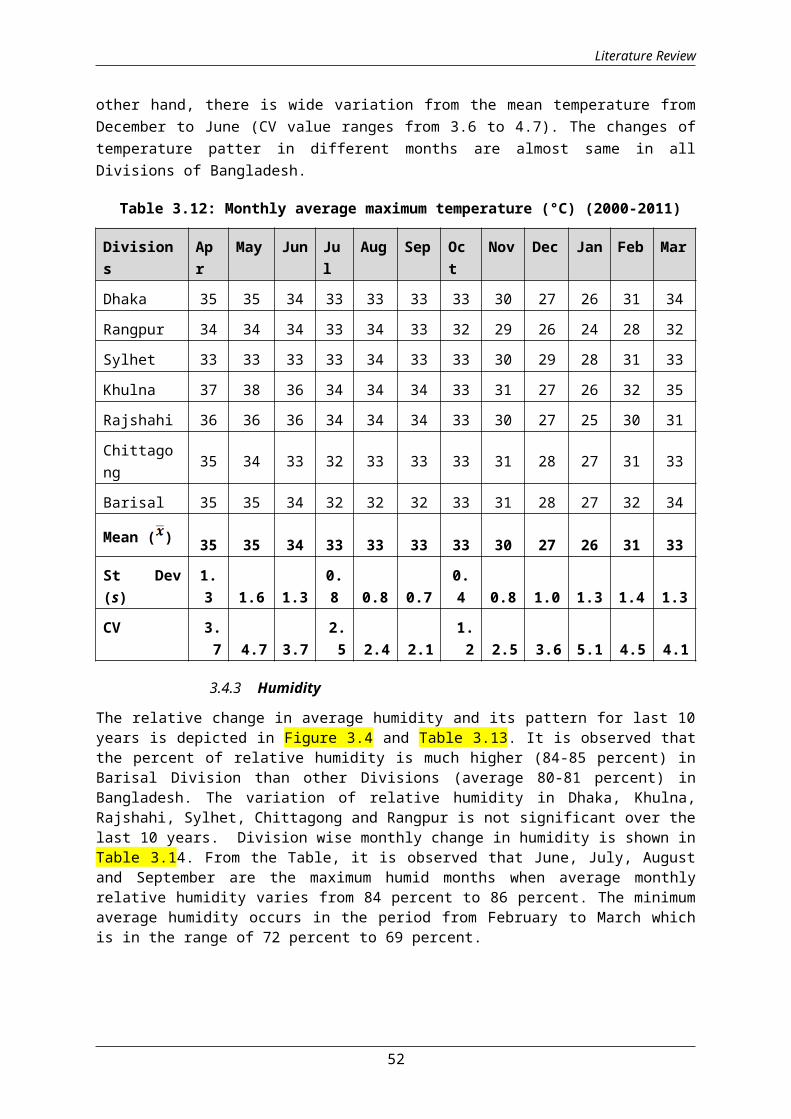
Literature Review
other hand, there is wide variation from the mean temperature fromDecember to June (CV value ranges from 3.6 to 4.7). The changes oftemperature patter in different months are almost same in allDivisions of Bangladesh.
Table 3.12: Monthly average maximum temperature (°C) (2000-2011)
Divisions
Apr
May Jun Jul
Aug Sep Oct
Nov Dec Jan Feb Mar
Dhaka 35 35 34 33 33 33 33 30 27 26 31 34
Rangpur 34 34 34 33 34 33 32 29 26 24 28 32
Sylhet 33 33 33 33 34 33 33 30 29 28 31 33
Khulna 37 38 36 34 34 34 33 31 27 26 32 35
Rajshahi 36 36 36 34 34 34 33 30 27 25 30 31
Chittagong 35 34 33 32 33 33 33 31 28 27 31 33
Barisal 35 35 34 32 32 32 33 31 28 27 32 34
Mean ( ) 35 35 34 33 33 33 33 30 27 26 31 33
St Dev(s)
1.3 1.6 1.3
0.8 0.8 0.7
0.4 0.8 1.0 1.3 1.4 1.3
CV 3.7 4.7 3.7
2.5 2.4 2.1
1.2 2.5 3.6 5.1 4.5 4.1
3.4.3 Humidity
The relative change in average humidity and its pattern for last 10years is depicted in Figure 3.4 and Table 3.13. It is observed thatthe percent of relative humidity is much higher (84-85 percent) inBarisal Division than other Divisions (average 80-81 percent) inBangladesh. The variation of relative humidity in Dhaka, Khulna,Rajshahi, Sylhet, Chittagong and Rangpur is not significant over thelast 10 years. Division wise monthly change in humidity is shown inTable 3.14. From the Table, it is observed that June, July, Augustand September are the maximum humid months when average monthlyrelative humidity varies from 84 percent to 86 percent. The minimumaverage humidity occurs in the period from February to March whichis in the range of 72 percent to 69 percent.
52

Literature Review
The lowest average humidity ranges from 66 percent to 68 percentduring February and March occurs in Sylhet Division while thehighest humidity shown 77 percent to 90 percent occurs in BarisalDivision. In Khulna Division, the minimum average humidity occurs inthe period of February to April which is in the range 74 percent to71percent, while in Rajshahi Division, the minimum average humidityoccurs in the period of February, March and April, which is in therange from 66 percent to 72 percent.
Table 3.14: Monthly average humidity in Bangladesh (2000-2011)
Divisions
Apr May Jun Jul Aug Sep Oct Nov Dec Jan Feb Mar
Dhaka 75 79 85 85 85 85 85 79 78 79 72 70
Rangpur 77 80 85 85 85 86 84 80 81 82 75 70
Sylhet 76 81 87 86 86 85 82 77 75 76 68 66
Khulna 74 76 83 86 86 87 84 80 80 79 74 71
Rajshahi 72 77 83 86 85 86 84 79 79 80 72 69
53
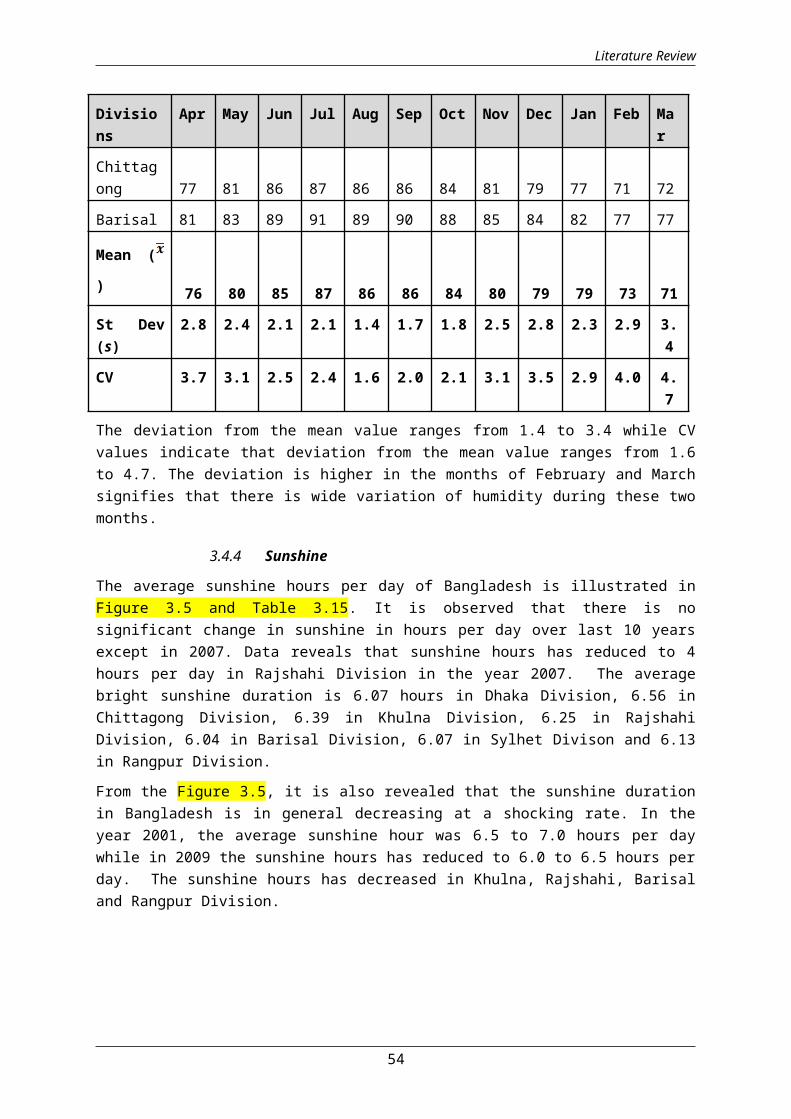
Literature Review
Divisions
Apr May Jun Jul Aug Sep Oct Nov Dec Jan Feb Mar
Chittagong 77 81 86 87 86 86 84 81 79 77 71 72
Barisal 81 83 89 91 89 90 88 85 84 82 77 77
Mean (
) 76 80 85 87 86 86 84 80 79 79 73 71
St Dev(s)
2.8 2.4 2.1 2.1 1.4 1.7 1.8 2.5 2.8 2.3 2.9 3.4
CV 3.7 3.1 2.5 2.4 1.6 2.0 2.1 3.1 3.5 2.9 4.0 4.7
The deviation from the mean value ranges from 1.4 to 3.4 while CVvalues indicate that deviation from the mean value ranges from 1.6to 4.7. The deviation is higher in the months of February and Marchsignifies that there is wide variation of humidity during these twomonths.
3.4.4 Sunshine
The average sunshine hours per day of Bangladesh is illustrated inFigure 3.5 and Table 3.15. It is observed that there is nosignificant change in sunshine in hours per day over last 10 yearsexcept in 2007. Data reveals that sunshine hours has reduced to 4hours per day in Rajshahi Division in the year 2007. The averagebright sunshine duration is 6.07 hours in Dhaka Division, 6.56 inChittagong Division, 6.39 in Khulna Division, 6.25 in RajshahiDivision, 6.04 in Barisal Division, 6.07 in Sylhet Divison and 6.13in Rangpur Division.
From the Figure 3.5, it is also revealed that the sunshine durationin Bangladesh is in general decreasing at a shocking rate. In theyear 2001, the average sunshine hour was 6.5 to 7.0 hours per daywhile in 2009 the sunshine hours has reduced to 6.0 to 6.5 hours perday. The sunshine hours has decreased in Khulna, Rajshahi, Barisaland Rangpur Division.
54

Literature Review
3.5 Natural Disasters
Bangladesh is very prone to natural disasters. Crops production isresponsive to the natural disasters. Crop production can beincreased in a favourable weather and climatic condition while itdecreases in a non-favourable condition. The country is severelyaffected by natural disasters like floods, flash flood, drought,salinity earthquake, riverbank erosion etc. Among this flood,drought and salinity are most important for which a briefinformation is stated below:
3.5.1 Flood Prone
Flood occurrence to a tolerable limit is a recurring phenomenon inBangladesh. Crop damage and loss depends on level of flood water,flow of flood water. Flood water inundates low and mid-low landareas in Bangladesh. For this, fields of crops especially paddyfields go under water. Usually at the time of sowing or post-sowingperiod aman rice suffers damage because of flood. But boro ricesustains loss from floods caused by overflow of rivers during theperiod it matures. Sometimes flood becomes devastating. The mostseverely affected areas by natural hazards are shown in Table 3.16.and Map 3.10.
55
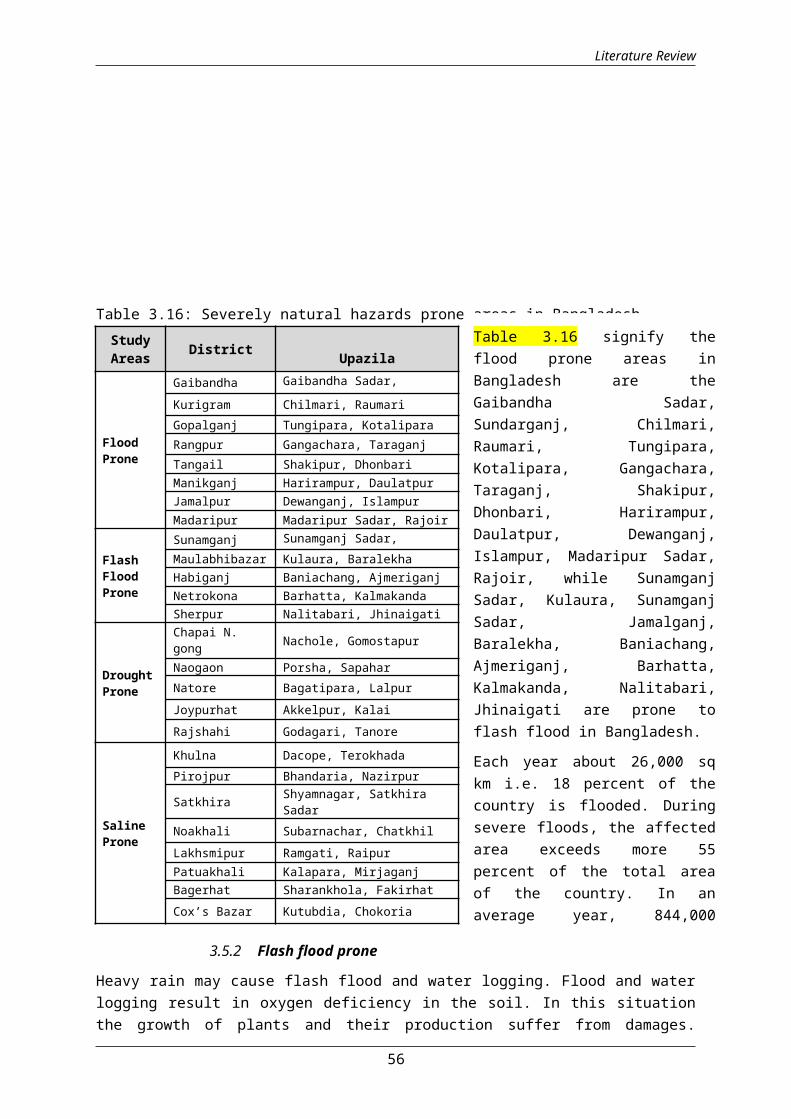
Literature Review
Table 3.16: Severely natural hazards prone areas in Bangladesh. StudyAreas District Upazila
Flood Prone
Gaibandha Gaibandha Sadar, SundarganjKurigram Chilmari, Raumari
Gopalganj Tungipara, KotaliparaRangpur Gangachara, TaraganjTangail Shakipur, DhonbariManikganj Harirampur, DaulatpurJamalpur Dewanganj, IslampurMadaripur Madaripur Sadar, Rajoir
Flash Flood Prone
Sunamganj Sunamganj Sadar, JamalganjMaulabhibazar Kulaura, Baralekha
Habiganj Baniachang, AjmeriganjNetrokona Barhatta, KalmakandaSherpur Nalitabari, Jhinaigati
DroughtProne
Chapai N. gong HoNawbganj
Nachole, Gomostapur
Naogaon Porsha, SapaharNatore Bagatipara, LalpurJoypurhat Akkelpur, KalaiRajshahi Godagari, Tanore
Saline Prone
Khulna Dacope, TerokhadaPirojpur Bhandaria, Nazirpur
Satkhira Shyamnagar, Satkhira Sadar
Noakhali Subarnachar, ChatkhilLakhsmipur Ramgati, RaipurPatuakhali Kalapara, MirjaganjBagerhat Sharankhola, FakirhatCox’s Bazar Kutubdia, Chokoria
3.5.2 Flash flood prone
Heavy rain may cause flash flood and water logging. Flood and waterlogging result in oxygen deficiency in the soil. In this situationthe growth of plants and their production suffer from damages.
56
Table 3.16 signify theflood prone areas inBangladesh are theGaibandha Sadar,Sundarganj, Chilmari,Raumari, Tungipara,Kotalipara, Gangachara,Taraganj, Shakipur,Dhonbari, Harirampur,Daulatpur, Dewanganj,Islampur, Madaripur Sadar,Rajoir, while SunamganjSadar, Kulaura, SunamganjSadar, Jamalganj,Baralekha, Baniachang,Ajmeriganj, Barhatta,Kalmakanda, Nalitabari,Jhinaigati are prone toflash flood in Bangladesh.
Each year about 26,000 sqkm i.e. 18 percent of thecountry is flooded. Duringsevere floods, the affectedarea exceeds more 55percent of the total areaof the country. In anaverage year, 844,000million cubic metre of
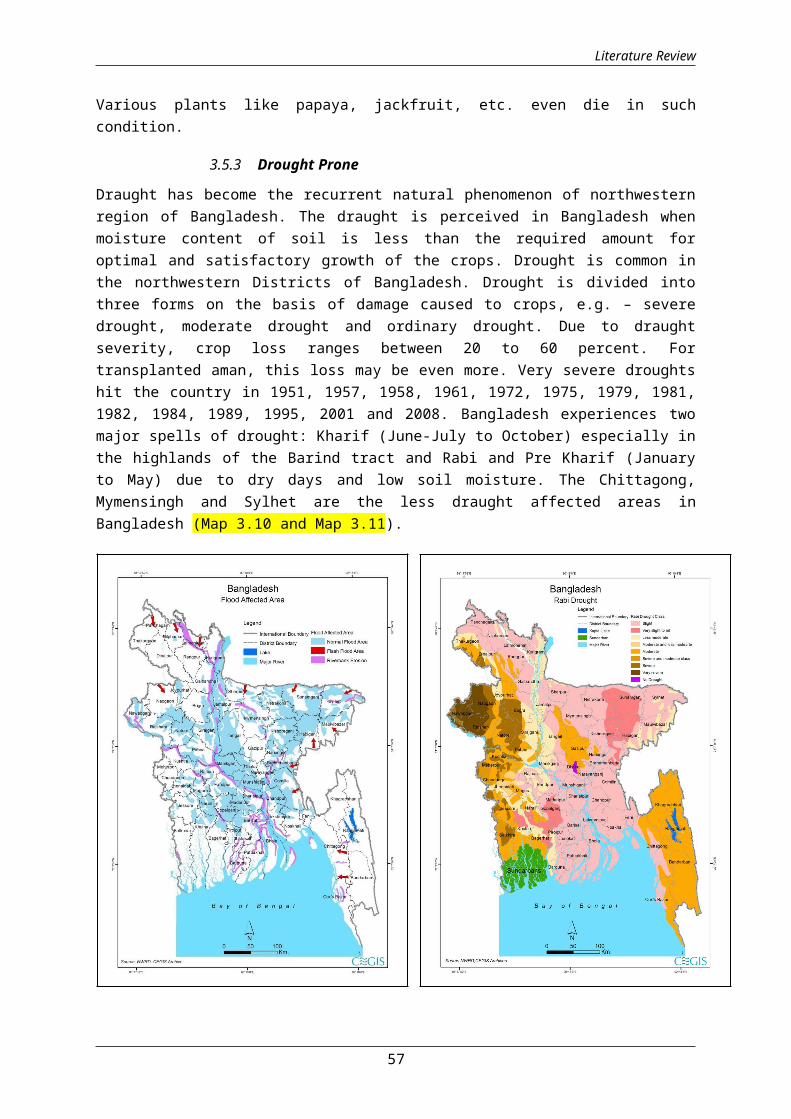
Literature Review
Various plants like papaya, jackfruit, etc. even die in suchcondition.
3.5.3 Drought Prone
Draught has become the recurrent natural phenomenon of northwesternregion of Bangladesh. The draught is perceived in Bangladesh whenmoisture content of soil is less than the required amount foroptimal and satisfactory growth of the crops. Drought is common inthe northwestern Districts of Bangladesh. Drought is divided intothree forms on the basis of damage caused to crops, e.g. – severedrought, moderate drought and ordinary drought. Due to draughtseverity, crop loss ranges between 20 to 60 percent. Fortransplanted aman, this loss may be even more. Very severe droughtshit the country in 1951, 1957, 1958, 1961, 1972, 1975, 1979, 1981,1982, 1984, 1989, 1995, 2001 and 2008. Bangladesh experiences twomajor spells of drought: Kharif (June-July to October) especially inthe highlands of the Barind tract and Rabi and Pre Kharif (Januaryto May) due to dry days and low soil moisture. The Chittagong,Mymensingh and Sylhet are the less draught affected areas inBangladesh (Map 3.10 and Map 3.11).
57
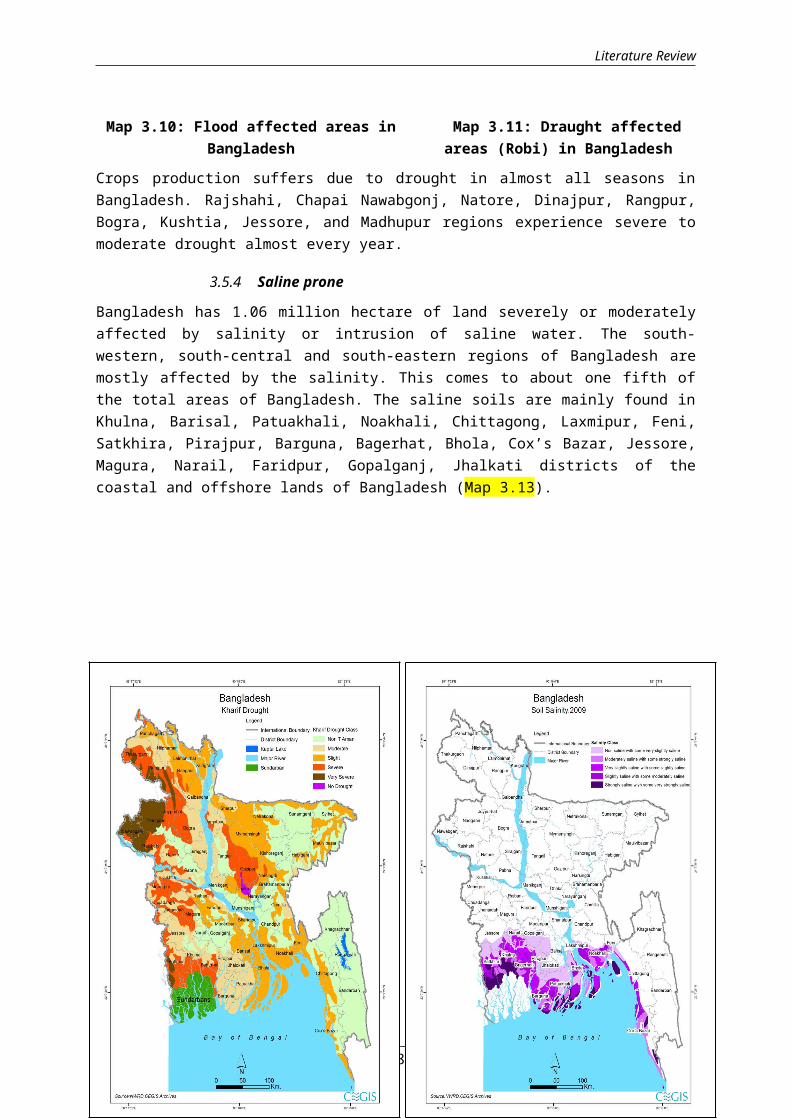
Literature Review
Map 3.10: Flood affected areas inBangladesh
Map 3.11: Draught affectedareas (Robi) in Bangladesh
Crops production suffers due to drought in almost all seasons inBangladesh. Rajshahi, Chapai Nawabgonj, Natore, Dinajpur, Rangpur,Bogra, Kushtia, Jessore, and Madhupur regions experience severe tomoderate drought almost every year.
3.5.4 Saline prone
Bangladesh has 1.06 million hectare of land severely or moderatelyaffected by salinity or intrusion of saline water. The south-western, south-central and south-eastern regions of Bangladesh aremostly affected by the salinity. This comes to about one fifth ofthe total areas of Bangladesh. The saline soils are mainly found inKhulna, Barisal, Patuakhali, Noakhali, Chittagong, Laxmipur, Feni,Satkhira, Pirajpur, Barguna, Bagerhat, Bhola, Cox’s Bazar, Jessore,Magura, Narail, Faridpur, Gopalganj, Jhalkati districts of thecoastal and offshore lands of Bangladesh (Map 3.13).
58
Literature Review
Map3.12: Draught affected areas(Kharif) in Bangladesh
Map 3.13: Saline prone areas inBangladesh
3.6 Agro-Ecological Zones (AEZs) in Bangladesh
Based on physical and agro-climatic environment which are relevantto land use, the land has been divided into 30 agro-ecological zonesand 88 sub-regions. The agro-ecological factors for which cropproductions basically depends are diverse in nature in Bangladesh.The agro-ecological zones of Bangladesh signify the basis of somedefinite characteristics like soil, land, weather condition uponwhich the cropping pattern or decision of year round crop productionpattern can be taken. Considering detailed on 30 AEZs explainingarea, land type, District covered, soil condition and fertility areshown in Annexure – Table (3.1.29 and 3.1.32).
3.6.1 Area, land type, soil properties based on Agro Ecological Zones(AEZ) in Bangladesh
Area, land type, soil pH and soil properties are illustrated inTable 3.17. The highland crops are adapted to the based on localsoil pH. According to SRDI, soils are categorized as very stronglyacidic having pH below 4.5; strongly acidic pH 4.6-5.5; slightlyacidic pH ranges 5.6-6.5; neutral pH 6.6-7.3; slightly alkaline pHranges 7.4-8.4; strongly alkaline pH ranges 8.5-9.0 and verystrongly alkaline pH 9.0. In the Table, the organic matter statushas been classified as: very low (1%); low (1.1-1.7%); medium (1.8-3.4); high (3.4-5.5); and very high >5.5. The dominance crop likerice, jute, wheat, potato etc are grown in almost all agro-ecological zones in Bangladesh. However, a brief description of cropproduction of 30 AEZs is discussed below:
59
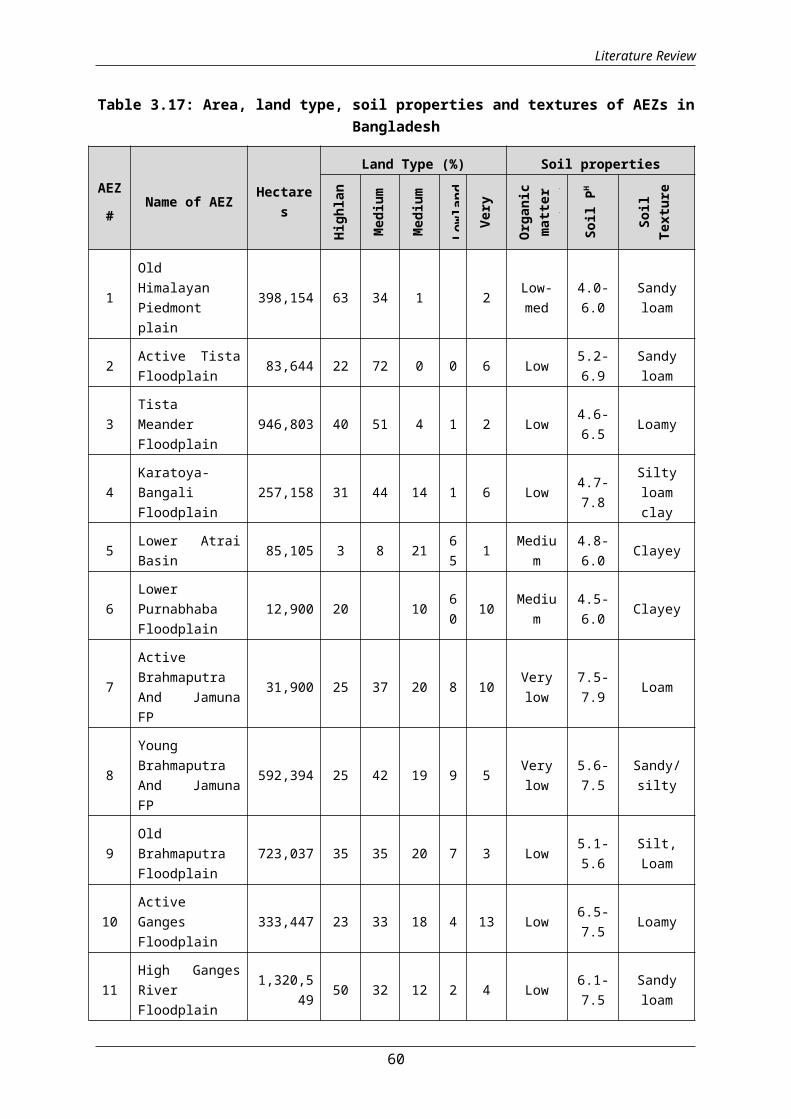
Literature Review
Table 3.17: Area, land type, soil properties and textures of AEZs inBangladesh
AEZ
#Name of AEZ Hectare
s
Land Type (%) Soil properties
Highlan
dMedium
highlan
Medium
lowland
Lowland
Very
lowland
Organic
matter
content
Soil P
H
Soil
Texture
1
OldHimalayanPiedmontplain
398,154 63 34 1 2 Low-med
4.0-6.0
Sandyloam
2 Active TistaFloodplain 83,644 22 72 0 0 6 Low 5.2-
6.9Sandyloam
3TistaMeanderFloodplain
946,803 40 51 4 1 2 Low 4.6-6.5 Loamy
4Karatoya-BangaliFloodplain
257,158 31 44 14 1 6 Low 4.7-7.8
Siltyloamclay
5 Lower AtraiBasin 85,105 3 8 21 6
5 1 Medium
4.8-6.0 Clayey
6LowerPurnabhabaFloodplain
12,900 20 10 60 10 Mediu
m4.5-6.0 Clayey
7
ActiveBrahmaputraAnd JamunaFP
31,900 25 37 20 8 10 Verylow
7.5-7.9 Loam
8
YoungBrahmaputraAnd JamunaFP
592,394 25 42 19 9 5 Verylow
5.6-7.5
Sandy/silty
9OldBrahmaputraFloodplain
723,037 35 35 20 7 3 Low 5.1-5.6
Silt,Loam
10ActiveGangesFloodplain
333,447 23 33 18 4 13 Low 6.5-7.5 Loamy
11High GangesRiverFloodplain
1,320,549 50 32 12 2 4 Low 6.1-
7.5Sandyloam
60
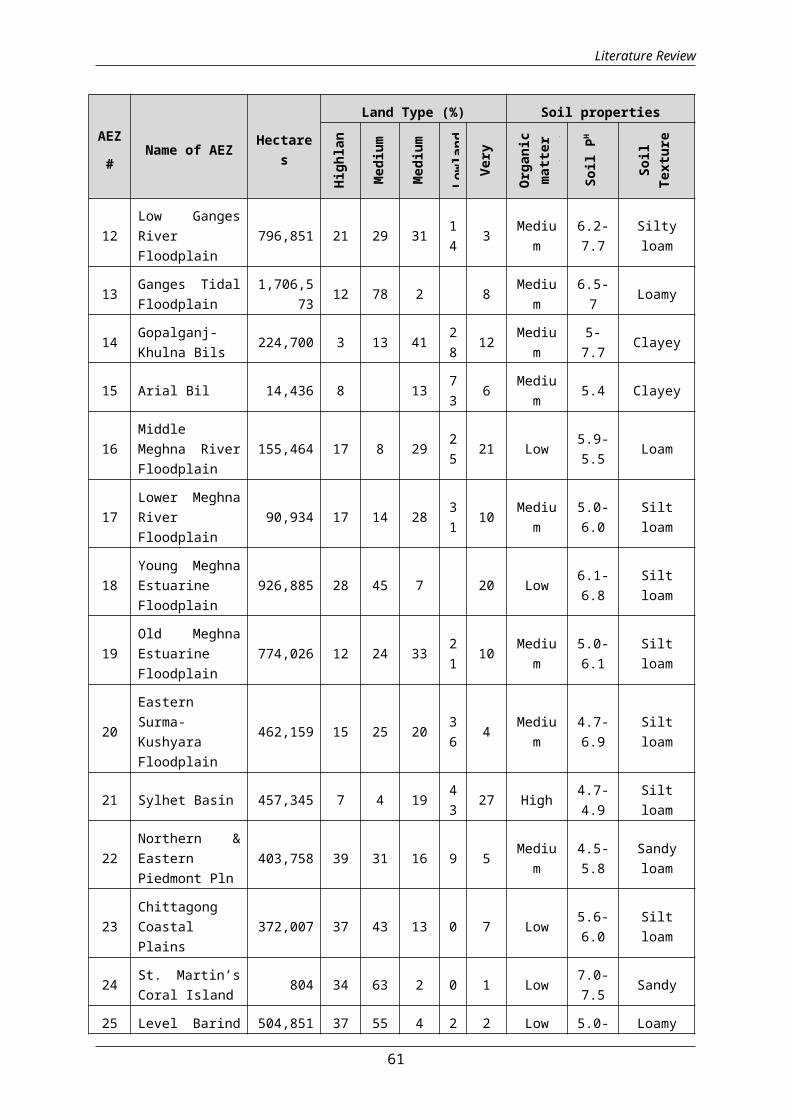
Literature Review
AEZ
#Name of AEZ Hectare
s
Land Type (%) Soil properties
Highlan
dMedium
highlan
Medium
lowland
Lowland
Very
lowland
Organic
matter
content
Soil P
H
Soil
Texture
12Low GangesRiverFloodplain
796,851 21 29 31 14 3 Mediu
m6.2-7.7
Siltyloam
13 Ganges TidalFloodplain
1,706,573 12 78 2 8 Mediu
m6.5-7 Loamy
14 Gopalganj-Khulna Bils 224,700 3 13 41 2
8 12 Medium
5-7.7 Clayey
15 Arial Bil 14,436 8 13 73 6 Mediu
m 5.4 Clayey
16MiddleMeghna RiverFloodplain
155,464 17 8 29 25 21 Low 5.9-
5.5 Loam
17Lower MeghnaRiverFloodplain
90,934 17 14 28 31 10 Mediu
m5.0-6.0
Siltloam
18Young MeghnaEstuarineFloodplain
926,885 28 45 7 20 Low 6.1-6.8
Siltloam
19Old MeghnaEstuarineFloodplain
774,026 12 24 33 21 10 Mediu
m5.0-6.1
Siltloam
20
EasternSurma-KushyaraFloodplain
462,159 15 25 20 36 4 Mediu
m4.7-6.9
Siltloam
21 Sylhet Basin 457,345 7 4 19 43 27 High 4.7-
4.9Siltloam
22Northern &EasternPiedmont Pln
403,758 39 31 16 9 5 Medium
4.5-5.8
Sandyloam
23ChittagongCoastalPlains
372,007 37 43 13 0 7 Low 5.6-6.0
Siltloam
24 St. Martin’sCoral Island 804 34 63 2 0 1 Low 7.0-
7.5 Sandy
25 Level Barind 504,851 37 55 4 2 2 Low 5.0- Loamy
61
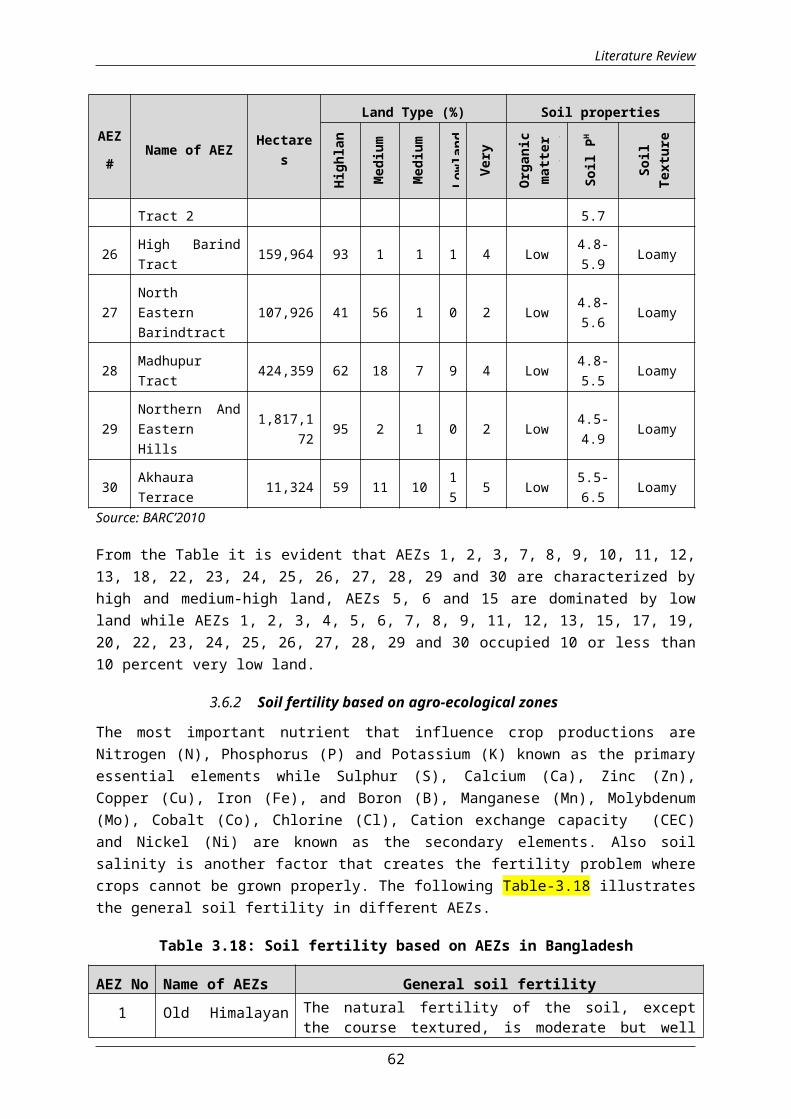
Literature Review
AEZ
#Name of AEZ Hectare
s
Land Type (%) Soil properties
Highlan
dMedium
highlan
Medium
lowland
Lowland
Very
lowland
Organic
matter
content
Soil P
H
Soil
Texture
Tract 2 5.7
26 High BarindTract 159,964 93 1 1 1 4 Low 4.8-
5.9 Loamy
27NorthEasternBarindtract
107,926 41 56 1 0 2 Low 4.8-5.6 Loamy
28 MadhupurTract 424,359 62 18 7 9 4 Low 4.8-
5.5 Loamy
29Northern AndEasternHills
1,817,172 95 2 1 0 2 Low 4.5-
4.9 Loamy
30 AkhauraTerrace 11,324 59 11 10 1
5 5 Low 5.5-6.5 Loamy
Source: BARC’2010
From the Table it is evident that AEZs 1, 2, 3, 7, 8, 9, 10, 11, 12,13, 18, 22, 23, 24, 25, 26, 27, 28, 29 and 30 are characterized byhigh and medium-high land, AEZs 5, 6 and 15 are dominated by lowland while AEZs 1, 2, 3, 4, 5, 6, 7, 8, 9, 11, 12, 13, 15, 17, 19,20, 22, 23, 24, 25, 26, 27, 28, 29 and 30 occupied 10 or less than10 percent very low land.
3.6.2 Soil fertility based on agro-ecological zones
The most important nutrient that influence crop productions areNitrogen (N), Phosphorus (P) and Potassium (K) known as the primaryessential elements while Sulphur (S), Calcium (Ca), Zinc (Zn),Copper (Cu), Iron (Fe), and Boron (B), Manganese (Mn), Molybdenum(Mo), Cobalt (Co), Chlorine (Cl), Cation exchange capacity (CEC)and Nickel (Ni) are known as the secondary elements. Also soilsalinity is another factor that creates the fertility problem wherecrops cannot be grown properly. The following Table-3.18 illustratesthe general soil fertility in different AEZs.
Table 3.18: Soil fertility based on AEZs in Bangladesh
AEZ No Name of AEZs General soil fertility1 Old Himalayan The natural fertility of the soil, except
the course textured, is moderate but well
62
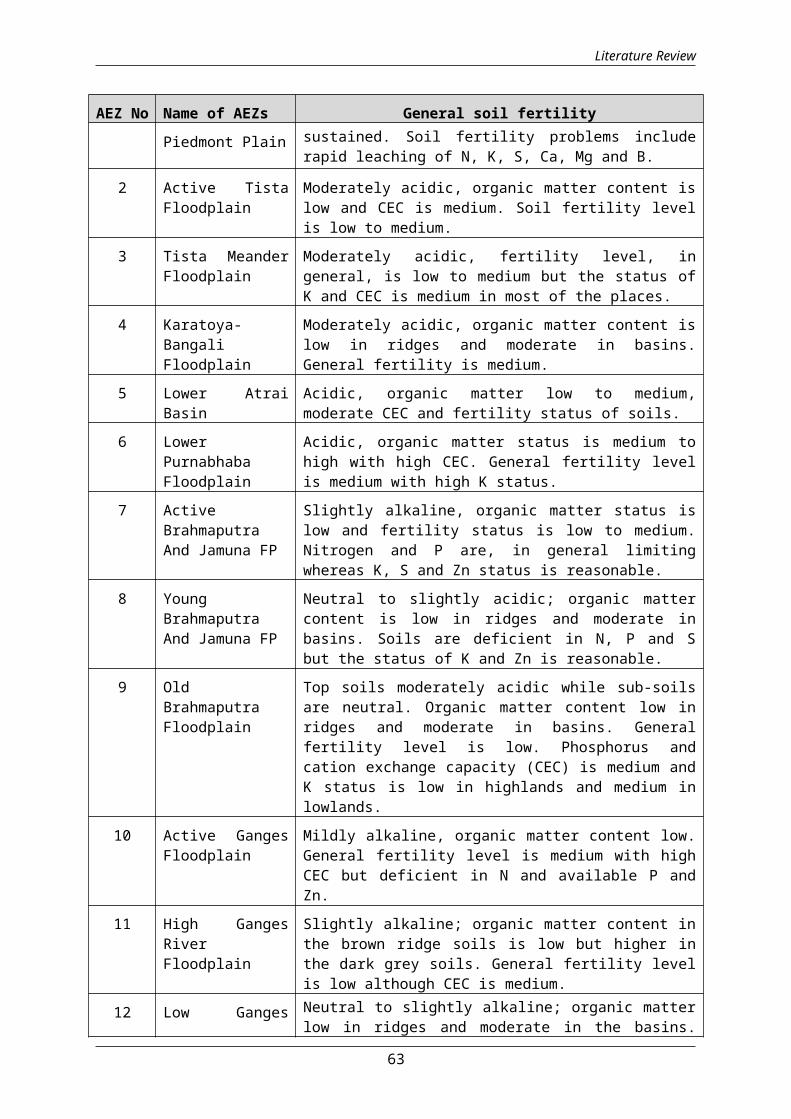
Literature Review
AEZ No Name of AEZs General soil fertilityPiedmont Plain sustained. Soil fertility problems include
rapid leaching of N, K, S, Ca, Mg and B.
2 Active TistaFloodplain
Moderately acidic, organic matter content islow and CEC is medium. Soil fertility levelis low to medium.
3 Tista MeanderFloodplain
Moderately acidic, fertility level, ingeneral, is low to medium but the status ofK and CEC is medium in most of the places.
4 Karatoya-BangaliFloodplain
Moderately acidic, organic matter content islow in ridges and moderate in basins.General fertility is medium.
5 Lower AtraiBasin
Acidic, organic matter low to medium,moderate CEC and fertility status of soils.
6 LowerPurnabhabaFloodplain
Acidic, organic matter status is medium tohigh with high CEC. General fertility levelis medium with high K status.
7 ActiveBrahmaputraAnd Jamuna FP
Slightly alkaline, organic matter status islow and fertility status is low to medium.Nitrogen and P are, in general limitingwhereas K, S and Zn status is reasonable.
8 YoungBrahmaputraAnd Jamuna FP
Neutral to slightly acidic; organic mattercontent is low in ridges and moderate inbasins. Soils are deficient in N, P and Sbut the status of K and Zn is reasonable.
9 OldBrahmaputraFloodplain
Top soils moderately acidic while sub-soilsare neutral. Organic matter content low inridges and moderate in basins. Generalfertility level is low. Phosphorus andcation exchange capacity (CEC) is medium andK status is low in highlands and medium inlowlands.
10 Active GangesFloodplain
Mildly alkaline, organic matter content low.General fertility level is medium with highCEC but deficient in N and available P andZn.
11 High GangesRiverFloodplain
Slightly alkaline; organic matter content inthe brown ridge soils is low but higher inthe dark grey soils. General fertility levelis low although CEC is medium.
12 Low Ganges Neutral to slightly alkaline; organic matterlow in ridges and moderate in the basins.
63
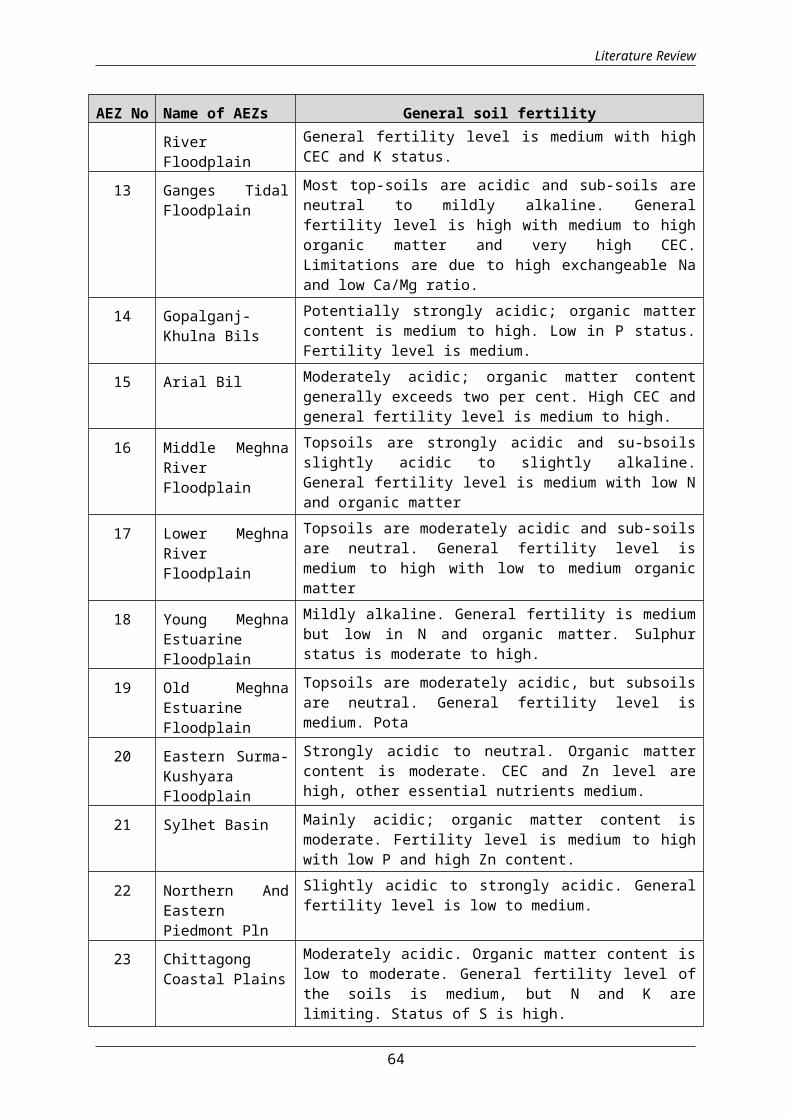
Literature Review
AEZ No Name of AEZs General soil fertilityRiverFloodplain
General fertility level is medium with highCEC and K status.
13 Ganges TidalFloodplain
Most top-soils are acidic and sub-soils areneutral to mildly alkaline. Generalfertility level is high with medium to highorganic matter and very high CEC.Limitations are due to high exchangeable Naand low Ca/Mg ratio.
14 Gopalganj-Khulna Bils
Potentially strongly acidic; organic mattercontent is medium to high. Low in P status.Fertility level is medium.
15 Arial Bil Moderately acidic; organic matter contentgenerally exceeds two per cent. High CEC andgeneral fertility level is medium to high.
16 Middle MeghnaRiverFloodplain
Topsoils are strongly acidic and su-bsoilsslightly acidic to slightly alkaline.General fertility level is medium with low Nand organic matter
17 Lower MeghnaRiverFloodplain
Topsoils are moderately acidic and sub-soilsare neutral. General fertility level ismedium to high with low to medium organicmatter
18 Young MeghnaEstuarineFloodplain
Mildly alkaline. General fertility is mediumbut low in N and organic matter. Sulphurstatus is moderate to high.
19 Old MeghnaEstuarineFloodplain
Topsoils are moderately acidic, but subsoilsare neutral. General fertility level ismedium. Pota
20 Eastern Surma-KushyaraFloodplain
Strongly acidic to neutral. Organic mattercontent is moderate. CEC and Zn level arehigh, other essential nutrients medium.
21 Sylhet Basin Mainly acidic; organic matter content ismoderate. Fertility level is medium to highwith low P and high Zn content.
22 Northern AndEasternPiedmont Pln
Slightly acidic to strongly acidic. Generalfertility level is low to medium.
23 ChittagongCoastal Plains
Moderately acidic. Organic matter content islow to moderate. General fertility level ofthe soils is medium, but N and K arelimiting. Status of S is high.
64
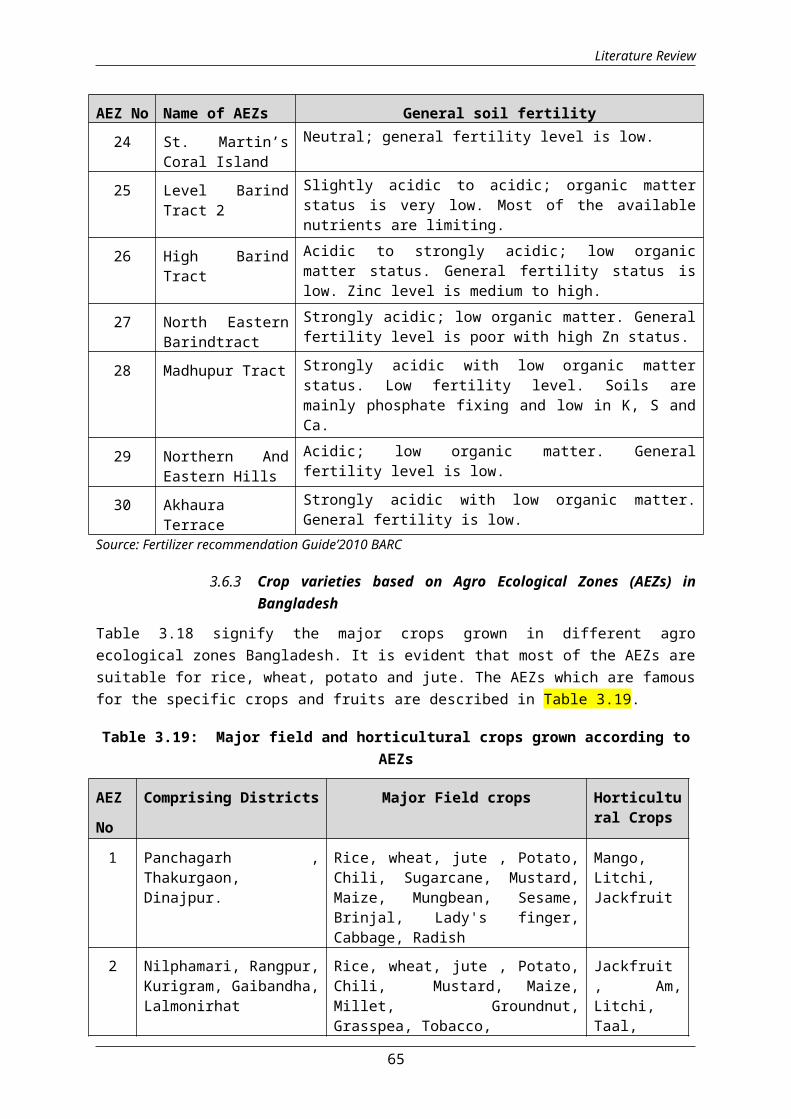
Literature Review
AEZ No Name of AEZs General soil fertility24 St. Martin’s
Coral IslandNeutral; general fertility level is low.
25 Level BarindTract 2
Slightly acidic to acidic; organic matterstatus is very low. Most of the availablenutrients are limiting.
26 High BarindTract
Acidic to strongly acidic; low organicmatter status. General fertility status islow. Zinc level is medium to high.
27 North EasternBarindtract
Strongly acidic; low organic matter. Generalfertility level is poor with high Zn status.
28 Madhupur Tract Strongly acidic with low organic matterstatus. Low fertility level. Soils aremainly phosphate fixing and low in K, S andCa.
29 Northern AndEastern Hills
Acidic; low organic matter. Generalfertility level is low.
30 AkhauraTerrace
Strongly acidic with low organic matter.General fertility is low.
Source: Fertilizer recommendation Guide’2010 BARC
3.6.3 Crop varieties based on Agro Ecological Zones (AEZs) inBangladesh
Table 3.18 signify the major crops grown in different agroecological zones Bangladesh. It is evident that most of the AEZs aresuitable for rice, wheat, potato and jute. The AEZs which are famousfor the specific crops and fruits are described in Table 3.19.
Table 3.19: Major field and horticultural crops grown according toAEZs
AEZ
No
Comprising Districts Major Field crops Horticultural Crops
1 Panchagarh ,Thakurgaon,Dinajpur.
Rice, wheat, jute , Potato,Chili, Sugarcane, Mustard,Maize, Mungbean, Sesame,Brinjal, Lady's finger,Cabbage, Radish
Mango,Litchi,Jackfruit
2 Nilphamari, Rangpur,Kurigram, Gaibandha,Lalmonirhat
Rice, wheat, jute , Potato,Chili, Mustard, Maize,Millet, Groundnut,Grasspea, Tobacco,
Jackfruit , Am,Litchi,Taal,
65

Literature Review
AEZ
No
Comprising Districts Major Field crops Horticultural Crops
3 Rangpur,Panchagarh,Natore, Bogra,Dinajpur, Joypurhat,Noagoan, Rajshahi
Rice, wheat, jute , potato,sugarcane, Mustard, Maize,Mungbean, Brinjal, Lady'sfinger, Cabbage,cauliflower,
BanChalta,Jackfruit
4 Bogra, Sirajgong Rice, wheat, jute , potato,Mustard, Maize, Mungbean,Brinjal, Lady's finger,Cabbage, Cauliflower,Onion, Garlic,
Aam,Kanthal,Kalo jam,Litchu
5 Natore, Bogra,Noagoan, Rajshahi,Sirajgong
Rice and Grasspea Narikel,Amra
6 Noagaon,Chapainowabgong
Boro(rice), Watermilon Khejur,Narikel,
7 Kurigram, Gaibandha,Sirajgong, Pabna,manikgong, Dhaka,Munshigong,Narayangong,Chandpur.
Rice, wheat, jute , potato,Mustard, millet, Chickpea,Grasspea, Sweet potato
Kanthal,Aam
8 Sherpur, jamalpur,Tangail, Manikgong,Munshigong, Dhaka,Narayangong,Gazipur,Mymensingh,Kishorgong,Norsinghdi
Rice, wheat, jute , potato,Mustard, Sesame, Brinjal,Cabbage, sweetpotato,Mouri,
Mango,CoconutSupari,Jackfruit
9 Sherpur, jamalpur,Tangail,Mymensingh,Netrokona,Kishorgong,Norsinghdi,Narayangong, Dhaka,Gazipur
Rice, wheat, jute , Potato,Sugarcane, Mustard, Maize,Mungbean, Grasspea, Lady'sfinger, Cabbage, Chickpea,Onion, Garlic,
Jackfruit
10 Chapainowabgong,Rajshahi, Laxmipur,
Rice, wheat, jute , Potato,Mustard, Blackgram,
Palm, date
66
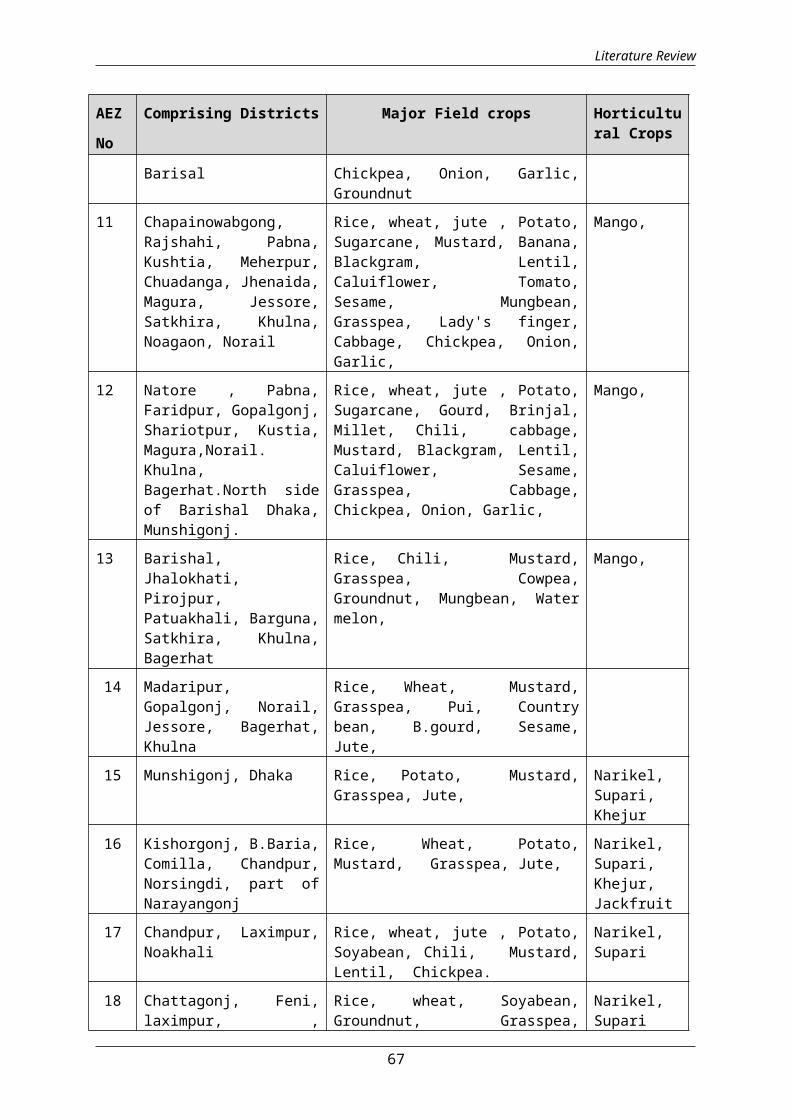
Literature Review
AEZ
No
Comprising Districts Major Field crops Horticultural Crops
Barisal Chickpea, Onion, Garlic,Groundnut
11 Chapainowabgong,Rajshahi, Pabna,Kushtia, Meherpur,Chuadanga, Jhenaida,Magura, Jessore,Satkhira, Khulna,Noagaon, Norail
Rice, wheat, jute , Potato,Sugarcane, Mustard, Banana,Blackgram, Lentil,Caluiflower, Tomato,Sesame, Mungbean,Grasspea, Lady's finger,Cabbage, Chickpea, Onion,Garlic,
Mango,
12 Natore , Pabna,Faridpur, Gopalgonj,Shariotpur, Kustia,Magura,Norail.Khulna,Bagerhat.North sideof Barishal Dhaka,Munshigonj.
Rice, wheat, jute , Potato,Sugarcane, Gourd, Brinjal,Millet, Chili, cabbage,Mustard, Blackgram, Lentil,Caluiflower, Sesame,Grasspea, Cabbage,Chickpea, Onion, Garlic,
Mango,
13 Barishal,Jhalokhati,Pirojpur,Patuakhali, Barguna,Satkhira, Khulna,Bagerhat
Rice, Chili, Mustard,Grasspea, Cowpea,Groundnut, Mungbean, Watermelon,
Mango,
14 Madaripur,Gopalgonj, Norail,Jessore, Bagerhat,Khulna
Rice, Wheat, Mustard,Grasspea, Pui, Countrybean, B.gourd, Sesame,Jute,
15 Munshigonj, Dhaka Rice, Potato, Mustard,Grasspea, Jute,
Narikel,Supari,Khejur
16 Kishorgonj, B.Baria,Comilla, Chandpur,Norsingdi, part ofNarayangonj
Rice, Wheat, Potato,Mustard, Grasspea, Jute,
Narikel,Supari,Khejur,Jackfruit
17 Chandpur, Laximpur,Noakhali
Rice, wheat, jute , Potato,Soyabean, Chili, Mustard,Lentil, Chickpea.
Narikel,Supari
18 Chattagonj, Feni,laximpur, ,
Rice, wheat, Soyabean,Groundnut, Grasspea,
Narikel,Supari
67

Literature Review
AEZ
No
Comprising Districts Major Field crops Horticultural Crops
Noakhali, Bhola,Barisal, Patuakhali,Barguna,
Cowpea, Chili, Mustard,Lentil, Mungbean.
19 Habigonj,B.Baria,Kishorgonj,Comilla, Chandpur,Noakhali, Laxmipur,Dhaka, Norsingdi,Narayangonj,Shariotpur, FeniMadaripur,Gopalgonj, Barisal
Rice, wheat, jute, Potato,Mustard, Lentil,Caluiflower, Tomato, Grasspea, Chili,Chickpea.
Jackfruit,
20 Sylhet, Sunamgonj,Moulovibazar,Hobigonj
Rice, Mustard, countrybean
Lemon,Jackfruit
21 Sunamgonj, Hobigonj,Netrokona,Kishorgonj, B.Baria
Rice, Mustard, Grasspea. Banchalta,Chapalish
22 Sherpur, Netrokona,Sunamgonj, Sylhet,Moulovibazar,Comilla, Hobigonj,B.Baria
Rice, wheat, Jute, Potato,Mustard, Blackgram, Kakrol,Tomato, Grasspea.
Kanthal,Taal
23 Feni, Chattagonj, ,Cox's Bazar.
Rice, Radish, Brinjal,country bean, Lady'sfinger, cowpea, Groundnut,Potato, Mustard, Kakrol,Tomato, Maize.
Narikel,Khejur
24 Sent Martin's Onoin, Garlic, Cucurbits,Grasspea, Rice(Aman)
25 Dinajpur, Gaibandha,Joipurhat, Bogra,Naogaon, Sirajgonj,Natore.
Rice, Sugarcane, Potato,Wheat, Cabbage, Jute,Millet, Mustard, Onion,Cucurbits, Tomato, Maize.
Jackfruit,Mango,
26 Rajshahi,Chapainibabgonj,Noagaon.
Rice, wheat, jute, Potato,Sugarcane, Mustard, Maize,Lentil, Barley,Cauliflower, Spinach,Lady’s finger, Cabbage,
Mango
68
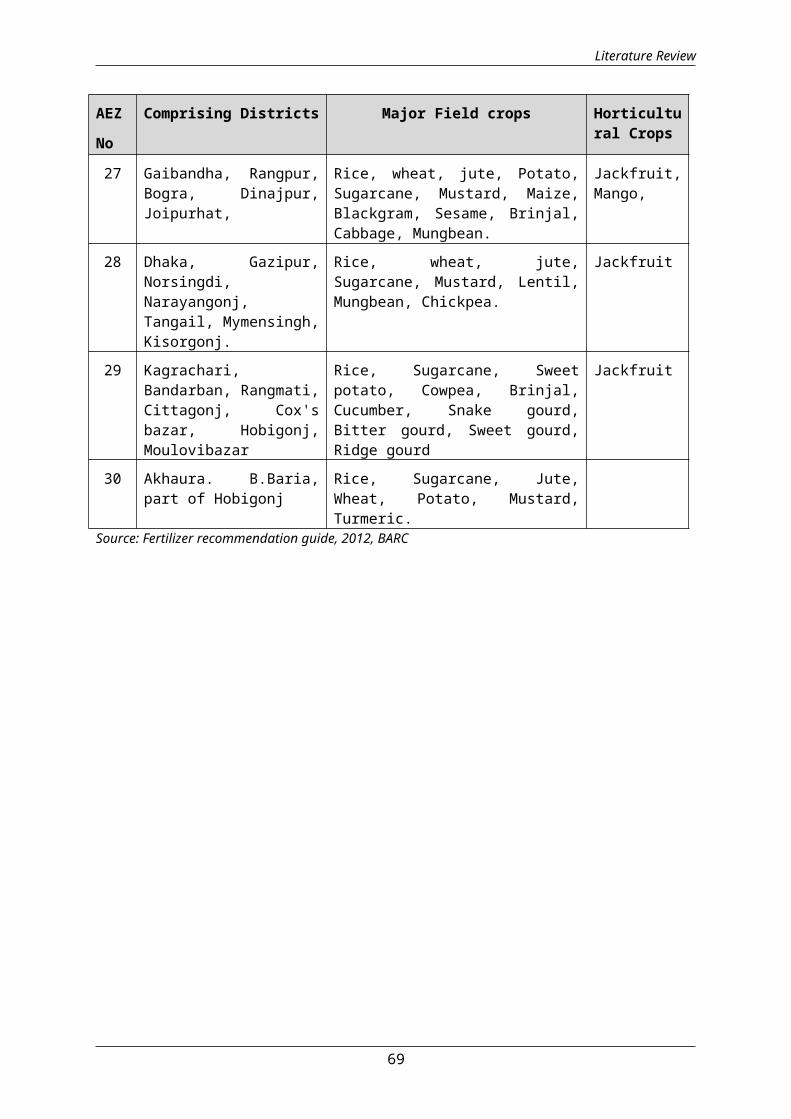
Literature Review
AEZ
No
Comprising Districts Major Field crops Horticultural Crops
27 Gaibandha, Rangpur,Bogra, Dinajpur,Joipurhat,
Rice, wheat, jute, Potato,Sugarcane, Mustard, Maize,Blackgram, Sesame, Brinjal,Cabbage, Mungbean.
Jackfruit,Mango,
28 Dhaka, Gazipur,Norsingdi,Narayangonj,Tangail, Mymensingh,Kisorgonj.
Rice, wheat, jute,Sugarcane, Mustard, Lentil,Mungbean, Chickpea.
Jackfruit
29 Kagrachari,Bandarban, Rangmati,Cittagonj, Cox'sbazar, Hobigonj,Moulovibazar
Rice, Sugarcane, Sweetpotato, Cowpea, Brinjal,Cucumber, Snake gourd,Bitter gourd, Sweet gourd,Ridge gourd
Jackfruit
30 Akhaura. B.Baria,part of Hobigonj
Rice, Sugarcane, Jute,Wheat, Potato, Mustard,Turmeric.
Source: Fertilizer recommendation guide, 2012, BARC
69

Literature Review
Map 3.12: Agroecological zones in Bangladesh
70

Literature Review
Apart from the table, it is evident that AEZ 1 is familiar forlitchi and mango. Currently tea and oranges also been started tocultivate, AEZ 2 which is the popular region for gound-nut and kaun(a kind of cereal), AEZ 3 and 4 mainly famous for tobacco andvegetables, AEZ 5 and 6 where water melon and garlic are cultivatedwidely nowadays, AEZ 7 is suitable for ground-nut and pumpkin, AEZ 8is famous for mango and coconut AEZ 9 where special crops are waterchestnut (Paanifal) and jackfruit, AEZ10 is famous for ground nut,AEZ 11 where cotton is grown, AEZ 12 for broadcasted aman and palm,AEZ 13 is for mango and fruits, AEZ 14: palm and date trees, AEZ 15is the broadcast aman (buna aman) which is the main type of crop inthis region, AEZ 16 where crops includes potato and banana, AEZ 17the general crops includes ground nuts, maize etc., AEZ 18 is forcoconut and betel leaf, AEZ 19: broadcast aman, AEZ 20 is for bororice, AEZ 21 is the production areas of boro rice and vegetables,AEZ 22 is for areca palm, lemons, oranges, AEZ 23 is for betelleaves, AEZ 24 is for coconut, AEZ 25, 26, and 27 where almost allcrops are grown here, AEZ 28 where sal tree (Vatika robusta), Jackfruitand Pineapple, AEZ 29 the special crop is tea and AEZ 30 in whichthe major crops are kakrol and mukundapuri guava.
3.6.4 Land types in Bangladesh
Based on the flooding depth in Bangladesh, the land has beencategorized as highland (F0), medium highland (F1), medium lowland(F2), lowland (F3) and very lowland (F4). The high Lands are theareas which is relatively high and cannot hold waters duringmonsoon. The medium high lands normally flooded upto about 90 cmduring the rainy season for more than two weeks continuously whilethe medium low lands are normally flooded between 90 cm and 180 cm.depth and low land is normally flooded between 180cm and 275 cmdepth during the monsoon season. The very lowland consists of haors,bills, canals and other low lying areas which look like large lakesduring rainy season. The land types of Bangladesh is shown Map
The land type of in Bangladesh is determined based on depth, timingand duration of flooding. In 2001, high land and medium high inBangladesh were 39% and 44% of the total land, while in 2012 thehighland and medium high land decreased about 5% and 4% than that of2001 due to urbanization, settlement and industrialization. Low landand medium low land are suitable for paddy production. Detaileddifferent land types in year 2001 and 2012 are shown in Figures 3.6and 3.7. (District wise land types are presented in annexure tablenumber 3.1.30 and 3.1.31)
71

Literature Review
Source: BARC, SRDI
Figure 3.7: Land Types inBangladesh, 2012
Source: BARC, SRDI
Figure 3.6: Land Types inBangladesh, 2001
72
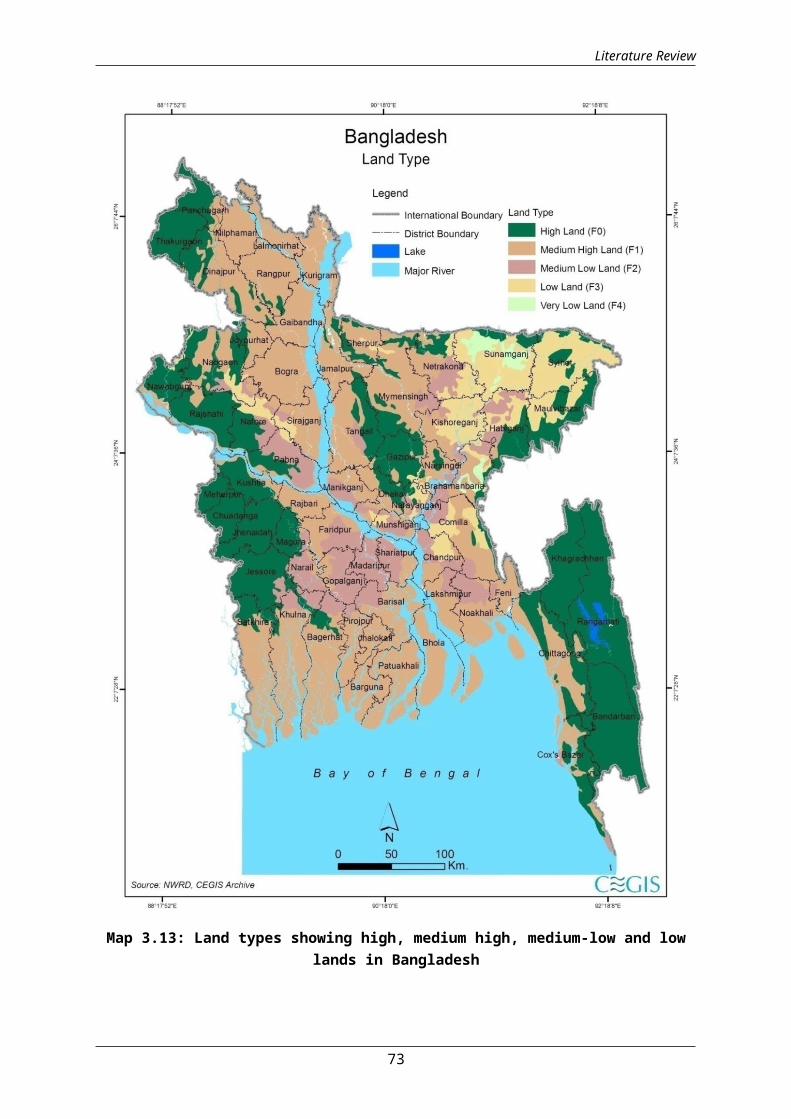
Literature Review
Map 3.13: Land types showing high, medium high, medium-low and lowlands in Bangladesh
73

Literature Review
3.6.5 Crop suitability by land types in Bangladesh
Bangladesh has the hilly lands comprising of Rangmati, Bandarban andKhagrachari Hill Districts, parts of Chitagong, nortarn part ofMymensingh, north and southern parts of Sylhet division, easternborder of Comilla and north eastern strip of Feni District. Apartfrom this, there are char lands that spread over the riversidedistricts of the country Rangpur, Kurigram, Lalmonirhat, Gaibandha,Rajshahi etc. The land types of Bangladesh are shown in Map 3.
Table 3.20: Crop grown by different land types in Bangladesh
LandType
Major field crops Major horticulturecrops
NCA(%)
Highland
Paddy (B. Aus, T. Aus, T. Aman),Wheat, Millet, Maize, Jute,Cotton, Sugarcane, Pulse,Mustard, Onion, Garlic, Termaric,Zinger, Chili, Betel vine,Cabbege, Kangkong, IndianSpenach, Kolmi, Tomato,Cauliflower, All gourd, Bean,Brinjal,Cucumber, Arum, Potato,Sweet potato, Radish.
Mango, Jackfruit,Berry, Litchi,Jujubi, Coconut,Guava, Amloki,Goldenapple,Lemon, Orange,Wood apple,Pomogranate, Date,Banana, Papaya,Pineapple.
33
Mediumhighland
Paddy (B.Aus, T. Aus, T. Aman,Lt. Aman) Wheat, Millet, Maize,Jute, Cotton, Sugarcane, Pulse,Mustard, Groundnut, Sunflower,Soyabean, Onion, Garlic, Chili.Cabbege, Kangkong, IndianSpenach, Kolmi, Tomato,Cauliflower, All gourd, Bean
Coconut, GuavaAmloki, Goldenapple, Orange,Wood apple,Pomogranate, Date,Banana, Papaya,Pineapple.
39
Mediumlowland
Paddy (B. Aus, B. Aman) Wheat,Millet, Maize, Jute, Pulse,Mustard, Groundnut, Sunflower,Soyabean, Onion, Garlic, Chili.
Orange, Woodapple,Pomogranate, Date,Banana, Papaya,Pineapple.
15
Lowland
Paddy (B. Aman, Boro-Hybrid/HYV,Local Boro).
Pomogranate, Date,Banana, Papaya,Pineapple.
11
74
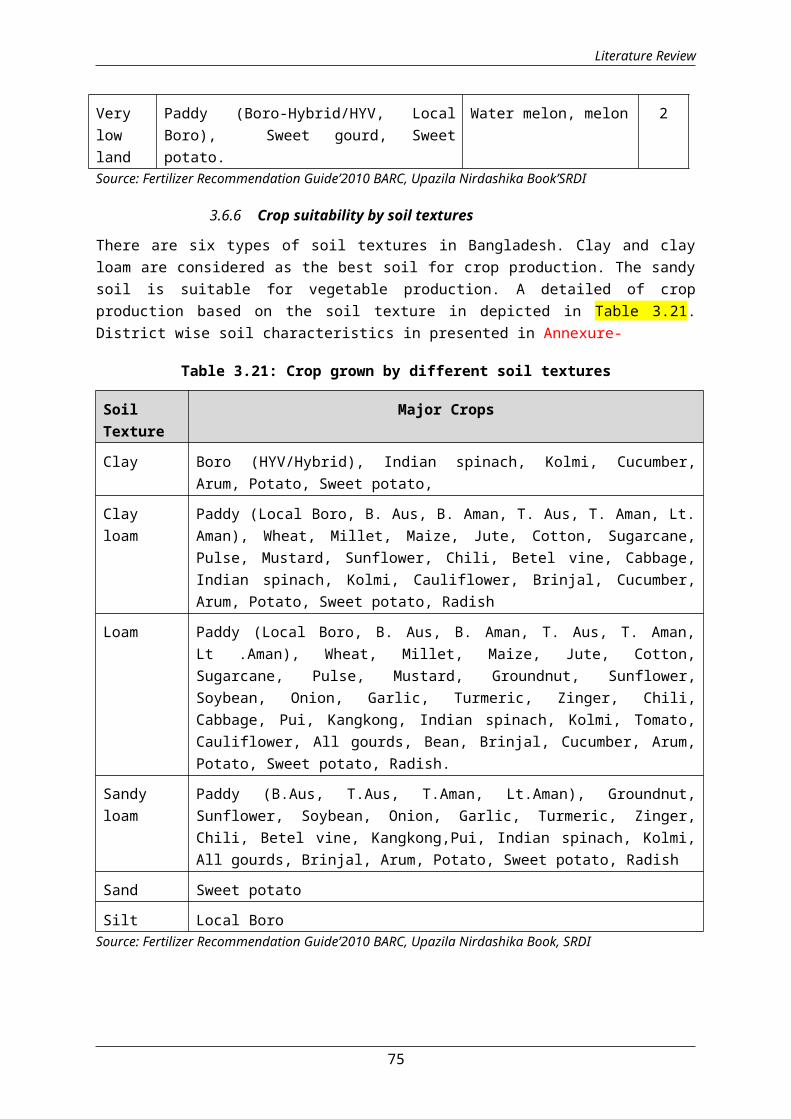
Literature Review
Verylowland
Paddy (Boro-Hybrid/HYV, LocalBoro), Sweet gourd, Sweetpotato.
Water melon, melon 2
Source: Fertilizer Recommendation Guide’2010 BARC, Upazila Nirdashika Book’SRDI
3.6.6 Crop suitability by soil textures
There are six types of soil textures in Bangladesh. Clay and clayloam are considered as the best soil for crop production. The sandysoil is suitable for vegetable production. A detailed of cropproduction based on the soil texture in depicted in Table 3.21.District wise soil characteristics in presented in Annexure-
Table 3.21: Crop grown by different soil textures
SoilTexture
Major Crops
Clay Boro (HYV/Hybrid), Indian spinach, Kolmi, Cucumber,Arum, Potato, Sweet potato,
Clayloam
Paddy (Local Boro, B. Aus, B. Aman, T. Aus, T. Aman, Lt.Aman), Wheat, Millet, Maize, Jute, Cotton, Sugarcane,Pulse, Mustard, Sunflower, Chili, Betel vine, Cabbage,Indian spinach, Kolmi, Cauliflower, Brinjal, Cucumber,Arum, Potato, Sweet potato, Radish
Loam Paddy (Local Boro, B. Aus, B. Aman, T. Aus, T. Aman,Lt .Aman), Wheat, Millet, Maize, Jute, Cotton,Sugarcane, Pulse, Mustard, Groundnut, Sunflower,Soybean, Onion, Garlic, Turmeric, Zinger, Chili,Cabbage, Pui, Kangkong, Indian spinach, Kolmi, Tomato,Cauliflower, All gourds, Bean, Brinjal, Cucumber, Arum,Potato, Sweet potato, Radish.
Sandyloam
Paddy (B.Aus, T.Aus, T.Aman, Lt.Aman), Groundnut,Sunflower, Soybean, Onion, Garlic, Turmeric, Zinger,Chili, Betel vine, Kangkong,Pui, Indian spinach, Kolmi,All gourds, Brinjal, Arum, Potato, Sweet potato, Radish
Sand Sweet potato
Silt Local BoroSource: Fertilizer Recommendation Guide’2010 BARC, Upazila Nirdashika Book, SRDI
75
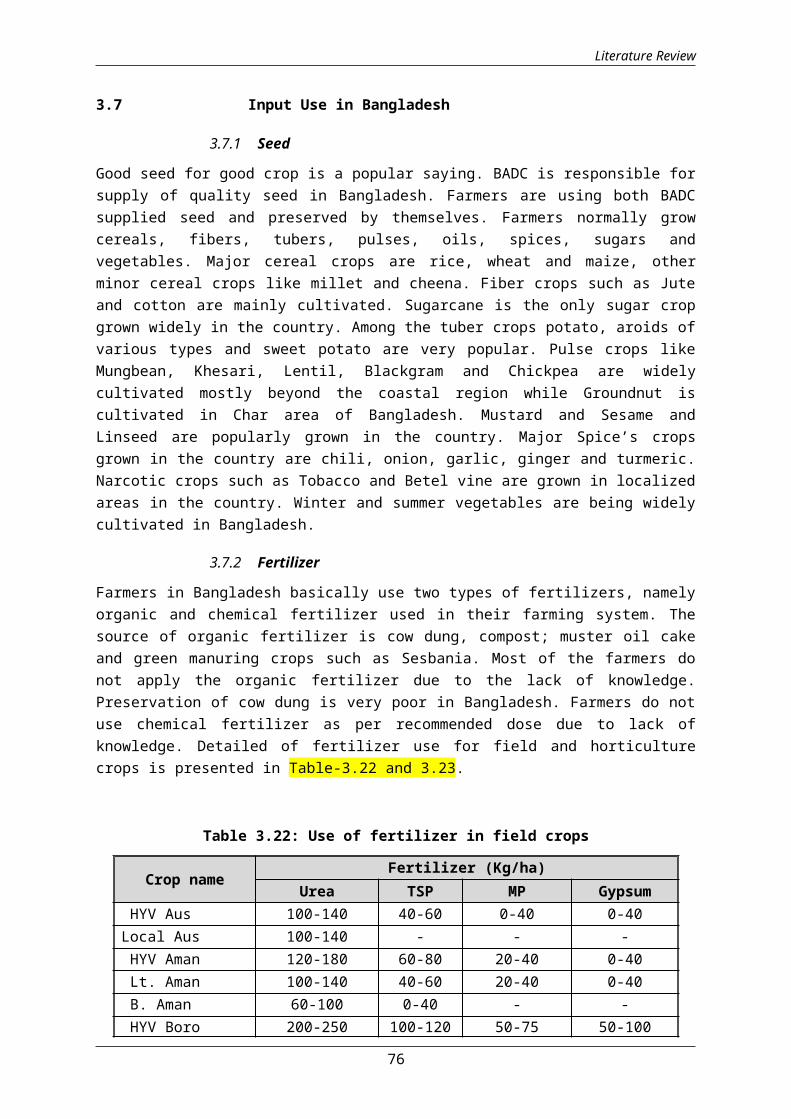
Literature Review
3.7 Input Use in Bangladesh
3.7.1 Seed
Good seed for good crop is a popular saying. BADC is responsible forsupply of quality seed in Bangladesh. Farmers are using both BADCsupplied seed and preserved by themselves. Farmers normally growcereals, fibers, tubers, pulses, oils, spices, sugars andvegetables. Major cereal crops are rice, wheat and maize, otherminor cereal crops like millet and cheena. Fiber crops such as Juteand cotton are mainly cultivated. Sugarcane is the only sugar cropgrown widely in the country. Among the tuber crops potato, aroids ofvarious types and sweet potato are very popular. Pulse crops likeMungbean, Khesari, Lentil, Blackgram and Chickpea are widelycultivated mostly beyond the coastal region while Groundnut iscultivated in Char area of Bangladesh. Mustard and Sesame andLinseed are popularly grown in the country. Major Spice’s cropsgrown in the country are chili, onion, garlic, ginger and turmeric.Narcotic crops such as Tobacco and Betel vine are grown in localizedareas in the country. Winter and summer vegetables are being widelycultivated in Bangladesh.
3.7.2 Fertilizer
Farmers in Bangladesh basically use two types of fertilizers, namelyorganic and chemical fertilizer used in their farming system. Thesource of organic fertilizer is cow dung, compost; muster oil cakeand green manuring crops such as Sesbania. Most of the farmers donot apply the organic fertilizer due to the lack of knowledge.Preservation of cow dung is very poor in Bangladesh. Farmers do notuse chemical fertilizer as per recommended dose due to lack ofknowledge. Detailed of fertilizer use for field and horticulturecrops is presented in Table-3.22 and 3.23.
Table 3.22: Use of fertilizer in field crops
Crop nameFertilizer (Kg/ha)
Urea TSP MP Gypsum HYV Aus 100-140 40-60 0-40 0-40Local Aus 100-140 - - - HYV Aman 120-180 60-80 20-40 0-40 Lt. Aman 100-140 40-60 20-40 0-40 B. Aman 60-100 0-40 - - HYV Boro 200-250 100-120 50-75 50-100
76
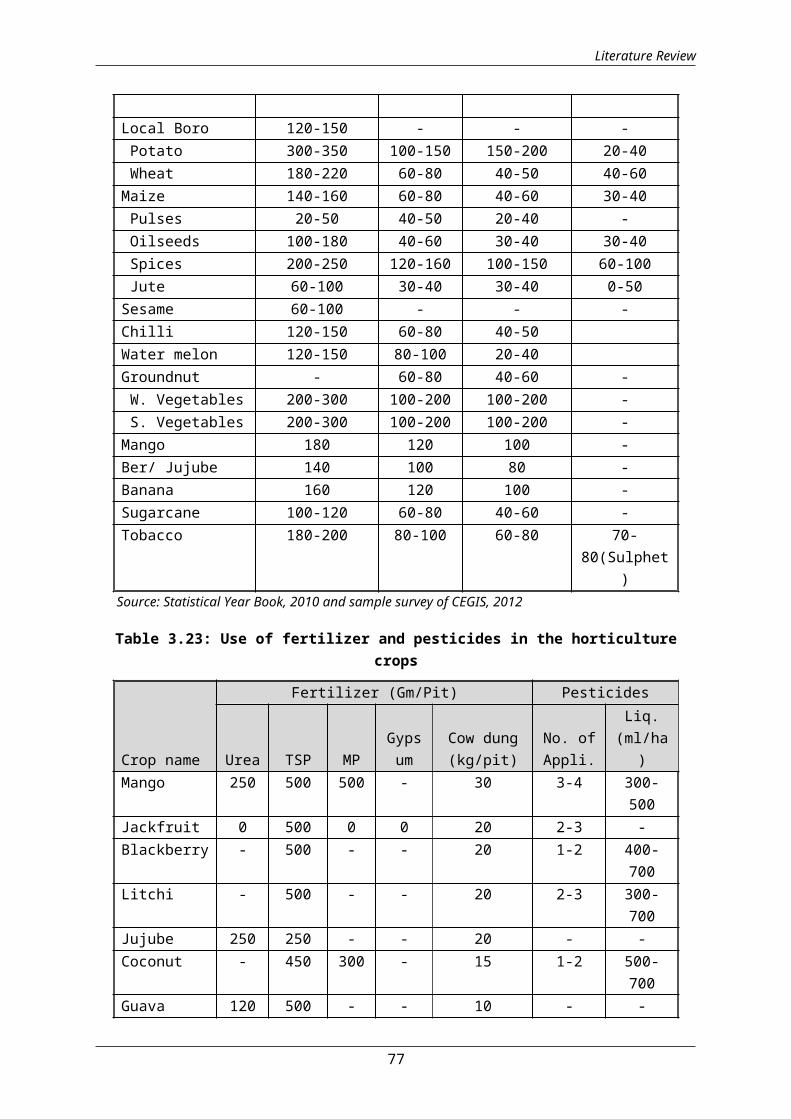
Literature Review
Local Boro 120-150 - - - Potato 300-350 100-150 150-200 20-40 Wheat 180-220 60-80 40-50 40-60Maize 140-160 60-80 40-60 30-40 Pulses 20-50 40-50 20-40 - Oilseeds 100-180 40-60 30-40 30-40 Spices 200-250 120-160 100-150 60-100 Jute 60-100 30-40 30-40 0-50Sesame 60-100 - - -Chilli 120-150 60-80 40-50Water melon 120-150 80-100 20-40Groundnut - 60-80 40-60 - W. Vegetables 200-300 100-200 100-200 - S. Vegetables 200-300 100-200 100-200 -Mango 180 120 100 -Ber/ Jujube 140 100 80 -Banana 160 120 100 -Sugarcane 100-120 60-80 40-60 -Tobacco 180-200 80-100 60-80 70-
80(Sulphet)
Source: Statistical Year Book, 2010 and sample survey of CEGIS, 2012
Table 3.23: Use of fertilizer and pesticides in the horticulturecrops
Crop name
Fertilizer (Gm/Pit) Pesticides
Urea TSP MPGypsum
Cow dung(kg/pit)
No. ofAppli.
Liq.(ml/ha
)Mango 250 500 500 - 30 3-4 300-
500Jackfruit 0 500 0 0 20 2-3 -Blackberry - 500 - - 20 1-2 400-
700Litchi - 500 - - 20 2-3 300-
700Jujube 250 250 - - 20 - -Coconut - 450 300 - 15 1-2 500-
700Guava 120 500 - - 10 - -
77
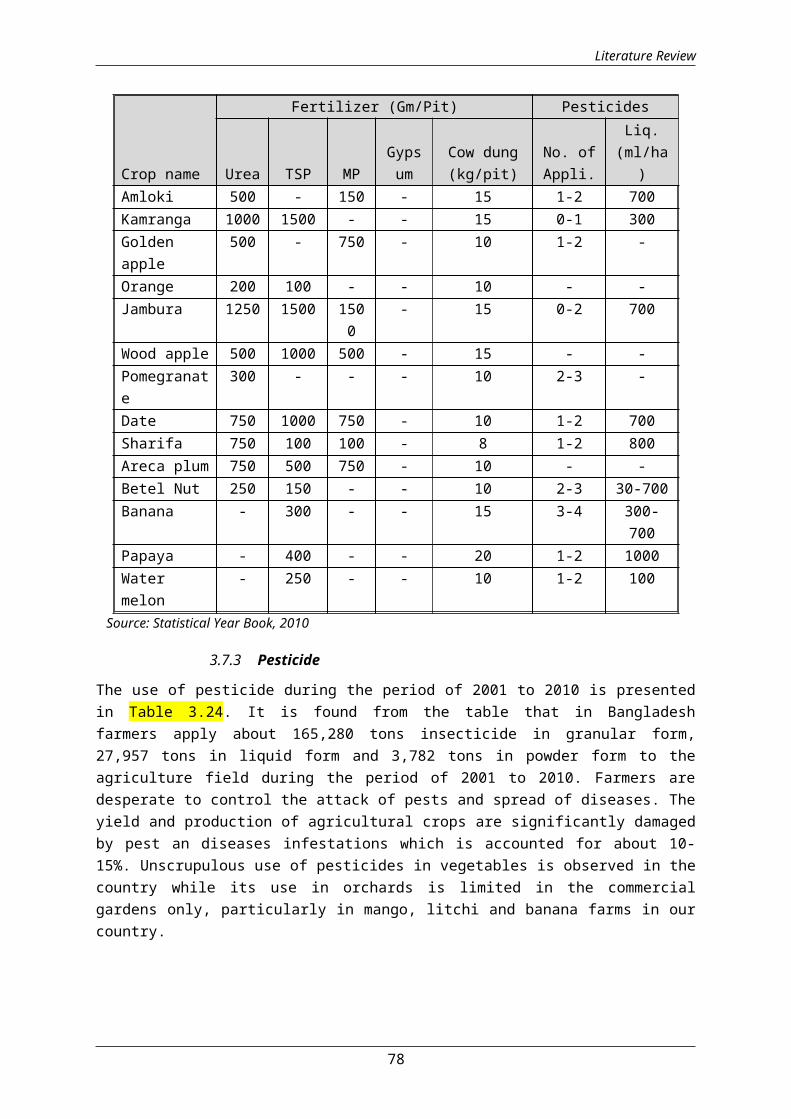
Literature Review
Crop name
Fertilizer (Gm/Pit) Pesticides
Urea TSP MPGypsum
Cow dung(kg/pit)
No. ofAppli.
Liq.(ml/ha
)Amloki 500 - 150 - 15 1-2 700Kamranga 1000 1500 - - 15 0-1 300Goldenapple
500 - 750 - 10 1-2 -
Orange 200 100 - - 10 - -Jambura 1250 1500 150
0- 15 0-2 700
Wood apple 500 1000 500 - 15 - -Pomegranate
300 - - - 10 2-3 -
Date 750 1000 750 - 10 1-2 700Sharifa 750 100 100 - 8 1-2 800Areca plum 750 500 750 - 10 - -Betel Nut 250 150 - - 10 2-3 30-700Banana - 300 - - 15 3-4 300-
700Papaya - 400 - - 20 1-2 1000Watermelon
- 250 - - 10 1-2 100
Source: Statistical Year Book, 2010
3.7.3 Pesticide
The use of pesticide during the period of 2001 to 2010 is presentedin Table 3.24. It is found from the table that in Bangladeshfarmers apply about 165,280 tons insecticide in granular form,27,957 tons in liquid form and 3,782 tons in powder form to theagriculture field during the period of 2001 to 2010. Farmers aredesperate to control the attack of pests and spread of diseases. Theyield and production of agricultural crops are significantly damagedby pest an diseases infestations which is accounted for about 10-15%. Unscrupulous use of pesticides in vegetables is observed in thecountry while its use in orchards is limited in the commercialgardens only, particularly in mango, litchi and banana farms in ourcountry.
78
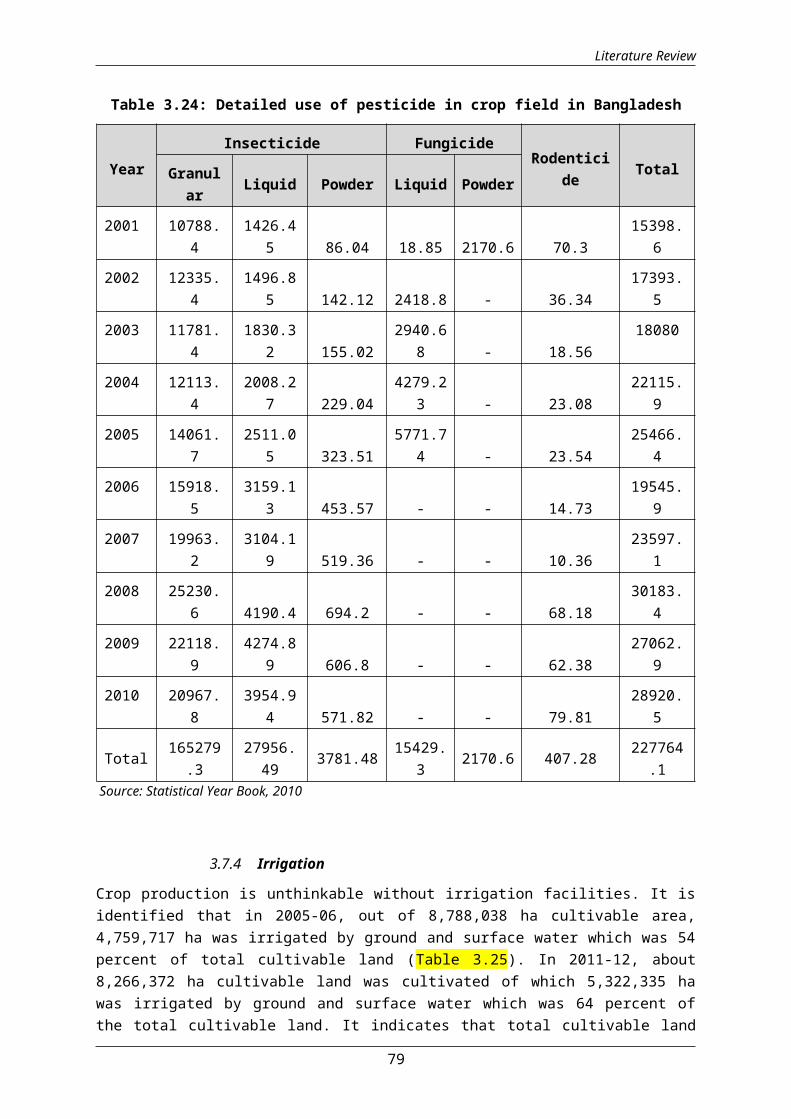
Literature Review
Table 3.24: Detailed use of pesticide in crop field in Bangladesh
YearInsecticide Fungicide
Rodenticide TotalGranul
ar Liquid Powder Liquid Powder
2001 10788.4
1426.45 86.04 18.85 2170.6 70.3
15398.6
2002 12335.4
1496.85 142.12 2418.8 - 36.34
17393.5
2003 11781.4
1830.32 155.02
2940.68 - 18.56
18080
2004 12113.4
2008.27 229.04
4279.23 - 23.08
22115.9
2005 14061.7
2511.05 323.51
5771.74 - 23.54
25466.4
2006 15918.5
3159.13 453.57 - - 14.73
19545.9
2007 19963.2
3104.19 519.36 - - 10.36
23597.1
2008 25230.6 4190.4 694.2 - - 68.18
30183.4
2009 22118.9
4274.89 606.8 - - 62.38
27062.9
2010 20967.8
3954.94 571.82 - - 79.81
28920.5
Total 165279.3
27956.49 3781.48 15429.
3 2170.6 407.28 227764.1
Source: Statistical Year Book, 2010
3.7.4 Irrigation
Crop production is unthinkable without irrigation facilities. It isidentified that in 2005-06, out of 8,788,038 ha cultivable area,4,759,717 ha was irrigated by ground and surface water which was 54percent of total cultivable land (Table 3.25). In 2011-12, about8,266,372 ha cultivable land was cultivated of which 5,322,335 hawas irrigated by ground and surface water which was 64 percent ofthe total cultivable land. It indicates that total cultivable land
79

Literature Review
has decreased by about 6 percent between 2005-06 and 2011-12. In theyear 2005-06, highest (41 percent) irrigated area was in RajshahiDivision and lowest (2 percent) was in Barisal Division. In 2011-12,highest (39 perecnt) irrigated area has been found in RajshahiDivision and lowest (3 percent) was in Barisal Division. During theperiod 2005-06 and 2011-12, there are no significant changes inirrigated areas in all Division except in Khulna Division. Low liftpumps (LLP), deep tube-wells (DTW), shallow tubewells (STW) andcanals are examples of modern irrigation methods in Bangladesh.District wise irrigation is presented in (Annexure-table 3.1.45)
Table 3.25: Irrigated areas by Divisions in Bangladesh (2005-2006and 2011-2012)
DivisionName
Land in hectare, 2005-06
Land in hectare, 2011-12
% ofchange
Cultivated
Irrigated
% oftotal
Cultivated
Irrigated
% oftotal
Dhaka 2,251,866
1,331,105
27.97 2,038,304
1,407,145
26.44 -2
Rajshahi 2,653,655
1,948,785
40.94 2,297,330
2,094,371
39.36 -2
Chittagong
1,251,072
521,266 10.95 1,358,830
546,325 10.26 -1
Khulna 1,197,357
644,611 13.54 940,965 835,641 15.70 2
Sylhet 724,947 203,034 4.27 808,416 271,979 5.11 1
Barisal 709,141 110,936 2.33 822,527 166,865 3.13 1
Total 8,788,038
4,759,717
100 8,266,372
5,322,335
100
Source: BADC, 2012
3.8 Infrastructure
3.8.1 Electricity
Electricity plays an important role in agriculture and farmerslivelihood system. It specially helps to lift surface and groundirrigated water for crop production. Division-wise electricityconnection of the total area and its increase in 2005 and 2010 are
80
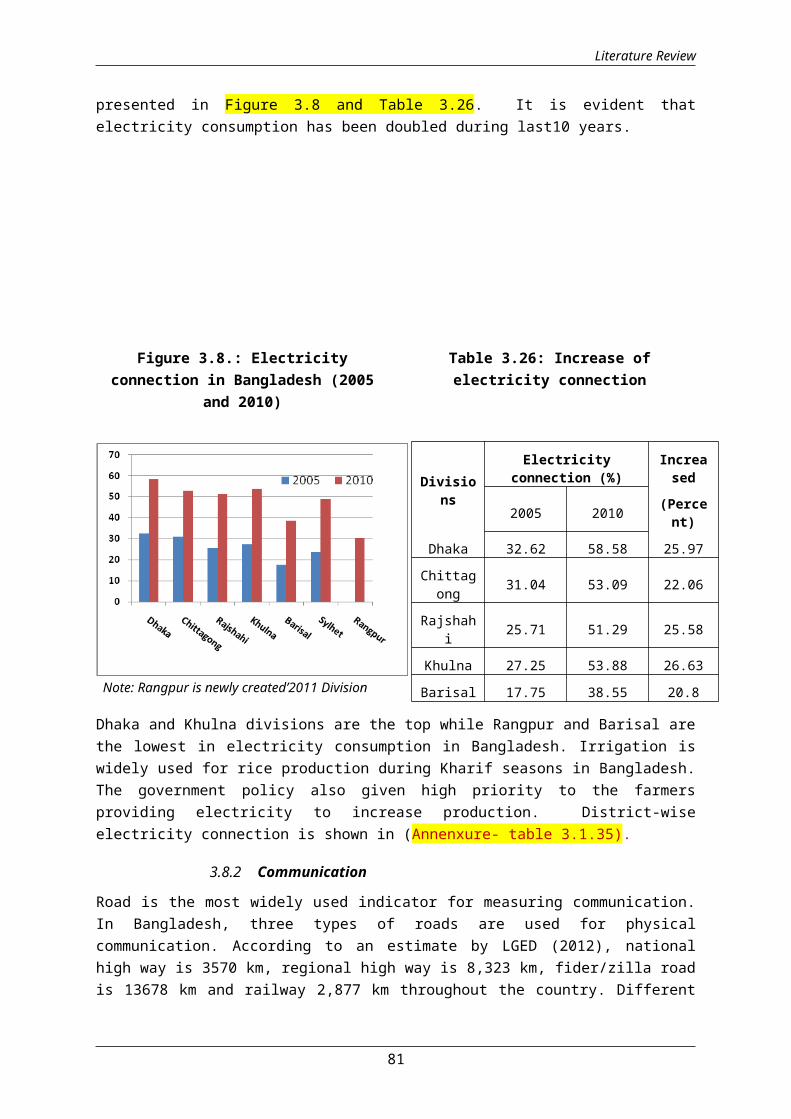
Literature Review
presented in Figure 3.8 and Table 3.26. It is evident thatelectricity consumption has been doubled during last10 years.
Figure 3.8.: Electricityconnection in Bangladesh (2005
and 2010)
Table 3.26: Increase ofelectricity connection
Note: Rangpur is newly created’2011 Division
Dhaka and Khulna divisions are the top while Rangpur and Barisal arethe lowest in electricity consumption in Bangladesh. Irrigation iswidely used for rice production during Kharif seasons in Bangladesh.The government policy also given high priority to the farmersproviding electricity to increase production. District-wiseelectricity connection is shown in (Annenxure- table 3.1.35).
3.8.2 Communication
Road is the most widely used indicator for measuring communication.In Bangladesh, three types of roads are used for physicalcommunication. According to an estimate by LGED (2012), nationalhigh way is 3570 km, regional high way is 8,323 km, fider/zilla roadis 13678 km and railway 2,877 km throughout the country. Different
81
Divisions
Electricityconnection (%)
Increased
(Percent)2005 2010
Dhaka 32.62 58.58 25.97Chittagong 31.04 53.09 22.06
Rajshahi 25.71 51.29 25.58
Khulna 27.25 53.88 26.63Barisal 17.75 38.55 20.8

Literature Review
types of roads in Bangladesh are presented in Table 3.27 and Map3.14.
Table-3.27: Roads at upazila, union and village level in Bangladesh
Road type Kacha road (km) Pucca road(km) Total Length(km)
Upazila Road 9822.45 27950.47 37772.92
Union Road 25580.49 19200.33 44780.82
Village Road(wide)
94359.07 6206.27 106906.89
Village Road(small)
88652.18 18254.71 100565.34
Total roads 218414.19 71611.78 290025.97Source: LGED’2012
82

Literature Review
Map 3.14: Road network in Bangladesh
83

Literature Review
3.9 Crop Production in Bangladesh
3.9.1 Major crops and vegetable productions
Annual crop production and area coverage for various crops inBangaldesh are shown in Table 3.28.
Table 3.28: Annual area coverage and production of crop varieties inBangladesh
Cropname
2001-2002
2003-2004
2005-2006
2007-2008
2008-2009
2009-2010
2010-2011
2011-2012
Millio
n ha
Millio
n tons
Millio
n ha
Millio
n tons
Millio
n ha
Millio
n tons
Millio
n ha
Millio
n tons
Millio
n ha
Millio
n tons
Millio
n ha
Millio
n tons
Millio
n ha
Millio
n tons
Millio
n ha
Millio
n tons
Rice 9.7 30.0
10.1
32.4
10.5
33.7
11.0
36.2
11.2
36.8
11.4
38.7
11.6
39.4
11.8
50.7
Wheat 0.6 2.0 0.5 1.8 0.5 1.7 0.5 1.6 0.5 1.6 0.4 1.5 0.4 1.5 0.4 1.5
Maize 0.1 1.2 0.1 1.3 0.1 1.3 0.1 1.3 0.1 1.4 0.1 1.4 0.1 1.4 0.1 1.4
Pulses 0.4 0.4 0.4 0.4 0.3 0.4 0.3 0.4 0.3 0.4 0.3 0.4 0.3 0.4 0.3 0.4
Oilseeds 0.4 0.5 0.4 0.5 0.3 0.5 0.3 0.5 0.3 0.4 0.3 0.4 0.3 0.4 0.3 0.4
Sugarcane 0.2 4.1 0.2 3.9 0.2 3.7 0.2 3.6 0.1 3.6 0.1 3.5 0.1 3.5 0.1 3.5
Jute 0.5 1.2 0.4 1.1 0.4 1.0 0.4 1.0 0.4 1.0 0.4 1.0 0.4 0.9 0.4 0.9
Fruits 0.2 0.8 0.1 0.7 0.1 0.7 0.1 0.7 0.1 0.7 0.1 0.7 0.1 0.7 0.1 0.7
Vegetables 0.3 2.0 0.3 2.1 0.3 2.1 0.3 2.1 0.3 2.2 0.3 2.2 0.3 2.2 0.3 2.2
Spices 0.3 0.6 0.3 0.6 0.3 0.6 0.3 0.6 0.3 0.6 0.3 0.6 0.3 0.6 0.3 0.6
Potato 0.3 4.2 0.3 4.3 0.3 4.5 0.3 4.6 0.3 4.7 0.3 4.7 0.3 4.7 0.3 4.8
Others 0.3 2.7 0.3 2.8 0.3 2.9 0.3 2.8 0.3 2.7 0.3 2.7 0.3 2.6 0.3 2.5
Total 13.1
49.7
13.4
51.9
13.7
53.0
14.1
55.3
14.3
55.9
14.5
57.7
14.7
58.4
14.9
69.6
Increase - - 0.3 03 0.4 0.2 0.2 0.2 0.2
Increase - - 2.2 1.1 2.3 0.6 1.8 0.7
11.2
Source: BBS, 2012
From the table it is revealed that rice production has increasedmore than 70 percent during last 10 years (i.e. 2001-2002 to 2011-2012). Wheat production also increased more than double during last10 years, while used area for rice production has increased only 2
84
Literature Review
percent; on the contrary, used area has decreased for wheatproduction.
3.9.2 Horticultural crop production in Bangladesh
The climate and weather are suitable for fruit production inBangladesh. Some of regions (District) are more suitable to producemajor crops. Dhaka division is very suitable for banana production,Chittagong Division is suitable for water melon, Rajshahi divisionis mango, Jackfruit in Dhaka division, Litchi in Rangpur division,Guava in Barisal and Jujube production is in Rangpur rather thanother division. Detailed description is presented in table. Districtwise production picture is presented in (Annex table 3.1.37).
85
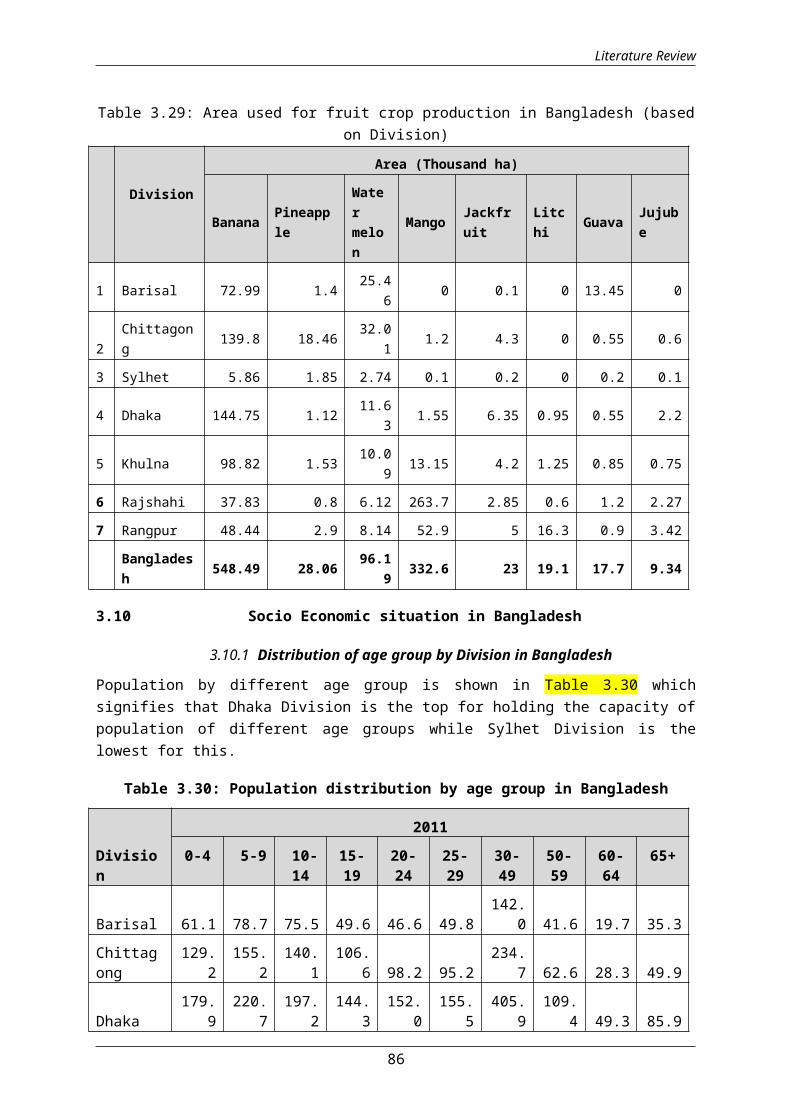
Literature Review
Table 3.29: Area used for fruit crop production in Bangladesh (basedon Division)
Division
Area (Thousand ha)
Banana Pineapple
Watermelon
Mango Jackfruit
Litchi Guava Jujub
e
1 Barisal 72.99 1.4 25.46 0 0.1 0 13.45 0
2
Chittagong 139.8 18.46 32.0
1 1.2 4.3 0 0.55 0.6
3 Sylhet 5.86 1.85 2.74 0.1 0.2 0 0.2 0.1
4 Dhaka 144.75 1.12 11.63 1.55 6.35 0.95 0.55 2.2
5 Khulna 98.82 1.53 10.09 13.15 4.2 1.25 0.85 0.75
6 Rajshahi 37.83 0.8 6.12 263.7 2.85 0.6 1.2 2.27
7 Rangpur 48.44 2.9 8.14 52.9 5 16.3 0.9 3.42
Bangladesh 548.49 28.06 96.1
9 332.6 23 19.1 17.7 9.34
3.10 Socio Economic situation in Bangladesh
3.10.1 Distribution of age group by Division in Bangladesh
Population by different age group is shown in Table 3.30 whichsignifies that Dhaka Division is the top for holding the capacity ofpopulation of different age groups while Sylhet Division is thelowest for this.
Table 3.30: Population distribution by age group in Bangladesh
Division
20110-4 5-9 10-
1415-19
20-24
25-29
30-49
50-59
60-64
65+
Barisal 61.1 78.7 75.5 49.6 46.6 49.8142.
0 41.6 19.7 35.3Chittagong
129.2
155.2
140.1
106.6 98.2 95.2
234.7 62.6 28.3 49.9
Dhaka179.
9220.
7197.
2144.
3152.
0155.
5405.
9109.
4 49.3 85.9
86
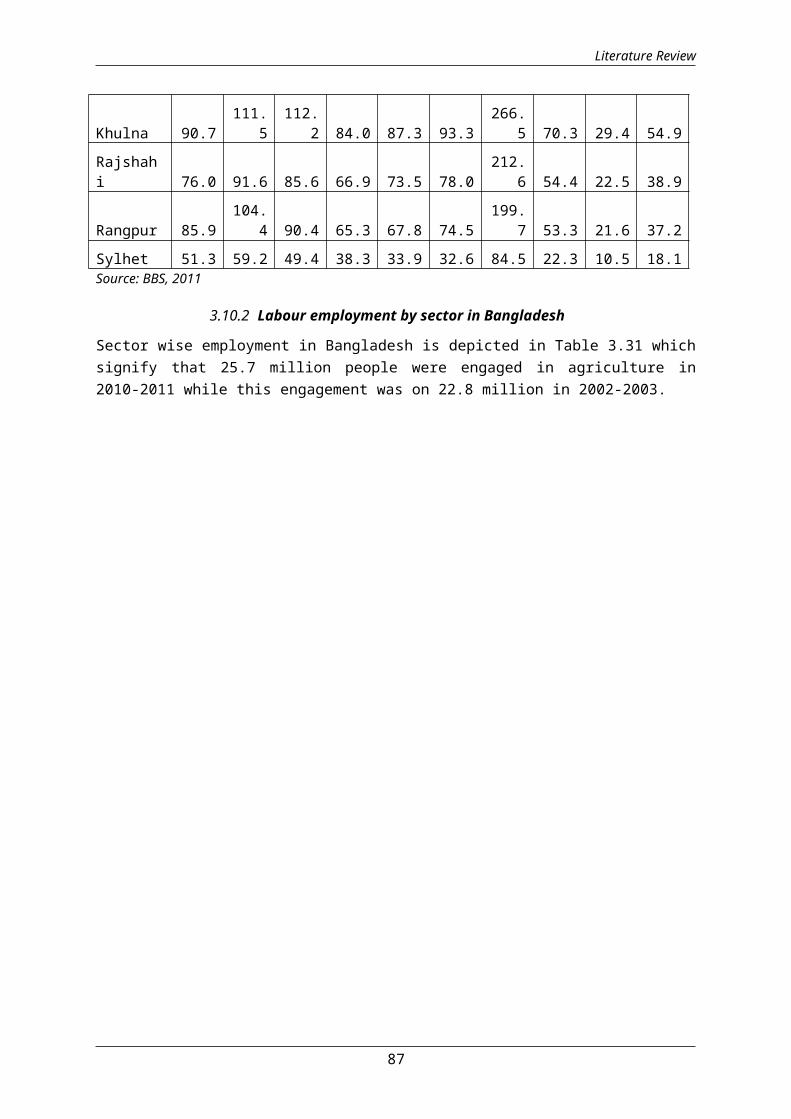
Literature Review
Khulna 90.7111.
5112.
2 84.0 87.3 93.3266.
5 70.3 29.4 54.9Rajshahi 76.0 91.6 85.6 66.9 73.5 78.0
212.6 54.4 22.5 38.9
Rangpur 85.9104.
4 90.4 65.3 67.8 74.5199.
7 53.3 21.6 37.2Sylhet 51.3 59.2 49.4 38.3 33.9 32.6 84.5 22.3 10.5 18.1Source: BBS, 2011
3.10.2 Labour employment by sector in Bangladesh
Sector wise employment in Bangladesh is depicted in Table 3.31 whichsignify that 25.7 million people were engaged in agriculture in2010-2011 while this engagement was on 22.8 million in 2002-2003.
87
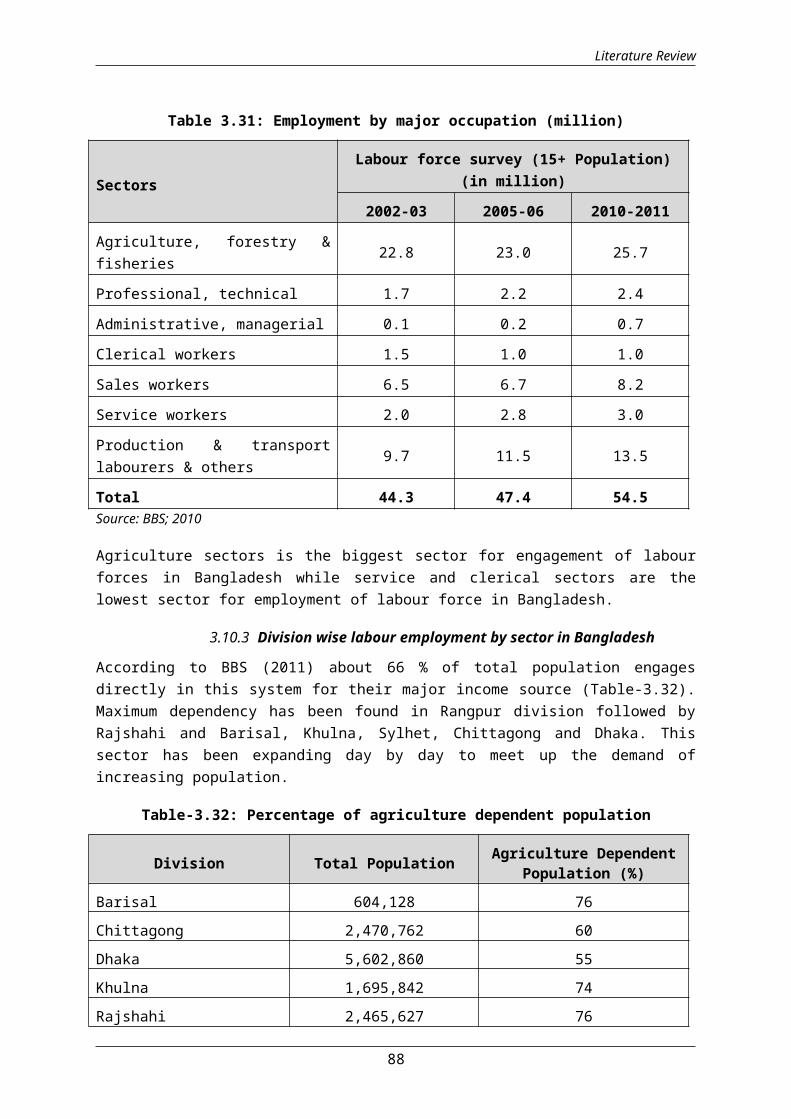
Literature Review
Table 3.31: Employment by major occupation (million)
Sectors Labour force survey (15+ Population)
(in million)
2002-03 2005-06 2010-2011
Agriculture, forestry &fisheries 22.8 23.0 25.7
Professional, technical 1.7 2.2 2.4
Administrative, managerial 0.1 0.2 0.7
Clerical workers 1.5 1.0 1.0
Sales workers 6.5 6.7 8.2
Service workers 2.0 2.8 3.0
Production & transportlabourers & others 9.7 11.5 13.5
Total 44.3 47.4 54.5Source: BBS; 2010
Agriculture sectors is the biggest sector for engagement of labourforces in Bangladesh while service and clerical sectors are thelowest sector for employment of labour force in Bangladesh.
3.10.3 Division wise labour employment by sector in Bangladesh
According to BBS (2011) about 66 % of total population engagesdirectly in this system for their major income source (Table-3.32).Maximum dependency has been found in Rangpur division followed byRajshahi and Barisal, Khulna, Sylhet, Chittagong and Dhaka. Thissector has been expanding day by day to meet up the demand ofincreasing population.
Table-3.32: Percentage of agriculture dependent population
Division Total Population Agriculture DependentPopulation (%)
Barisal 604,128 76Chittagong 2,470,762 60Dhaka 5,602,860 55Khulna 1,695,842 74Rajshahi 2,465,627 76
88
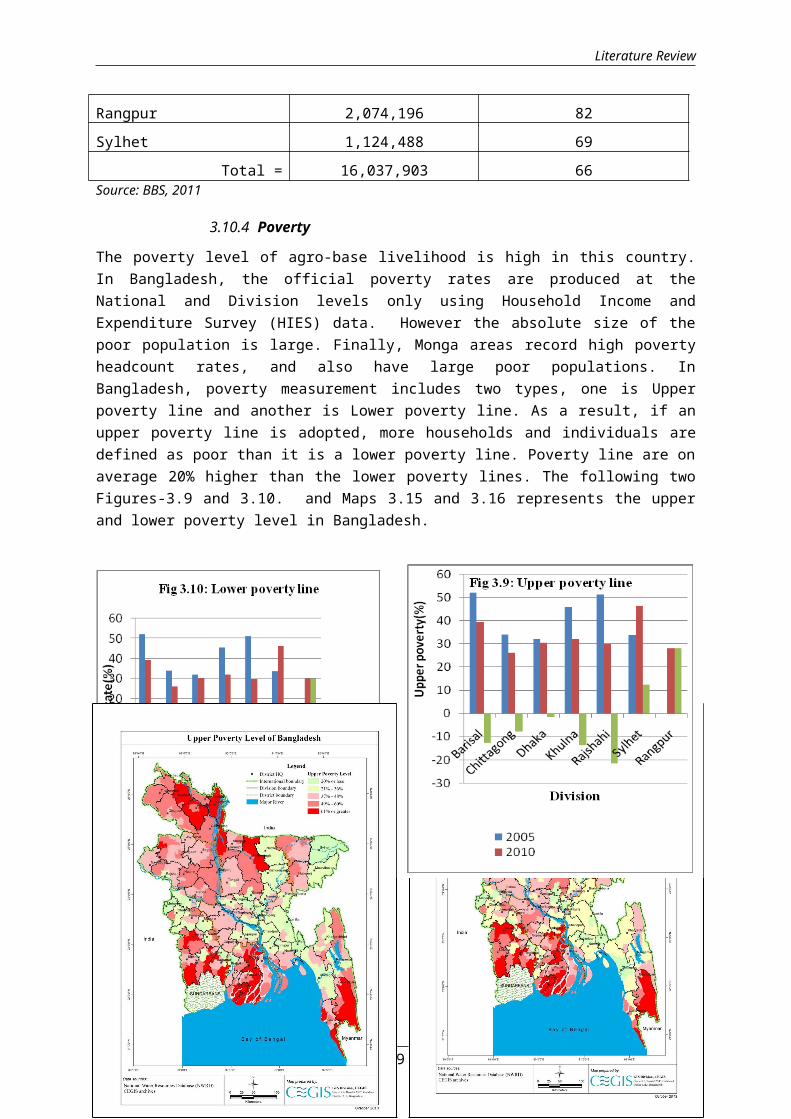
Literature Review
Rangpur 2,074,196 82Sylhet 1,124,488 69
Total = 16,037,903 66Source: BBS, 2011
3.10.4 Poverty
The poverty level of agro-base livelihood is high in this country.In Bangladesh, the official poverty rates are produced at theNational and Division levels only using Household Income andExpenditure Survey (HIES) data. However the absolute size of thepoor population is large. Finally, Monga areas record high povertyheadcount rates, and also have large poor populations. InBangladesh, poverty measurement includes two types, one is Upperpoverty line and another is Lower poverty line. As a result, if anupper poverty line is adopted, more households and individuals aredefined as poor than it is a lower poverty line. Poverty line are onaverage 20% higher than the lower poverty lines. The following twoFigures-3.9 and 3.10. and Maps 3.15 and 3.16 represents the upperand lower poverty level in Bangladesh.
89

Literature Review
Map 3.15: Upper poverty level Map3.16: Lower poverty level
3.10.5 Types of agricultural farms
In Bangladesh, agriculture farm type’s holder has been divided into5 categories; these are landless, marginal, small, medium and largefarm holders. In analyzing from 2001 to 2012, farm type’s holdershave changed due to increasing population, urbanization, expansionof settlement. Detailed description is presented in Figure-3.11.
Figure 3.11: Farm size in Bangladesh
3.10.6 Farmer’s classification
Based on land ownership land has been classified in five categories.These are Landless/ functionally landless<0.2 ha (<50 dec), Marginalfarmer 0.2-0.5 ha (50-125 dec), Small holder 0.5- 1 ha (126-250dec),
90
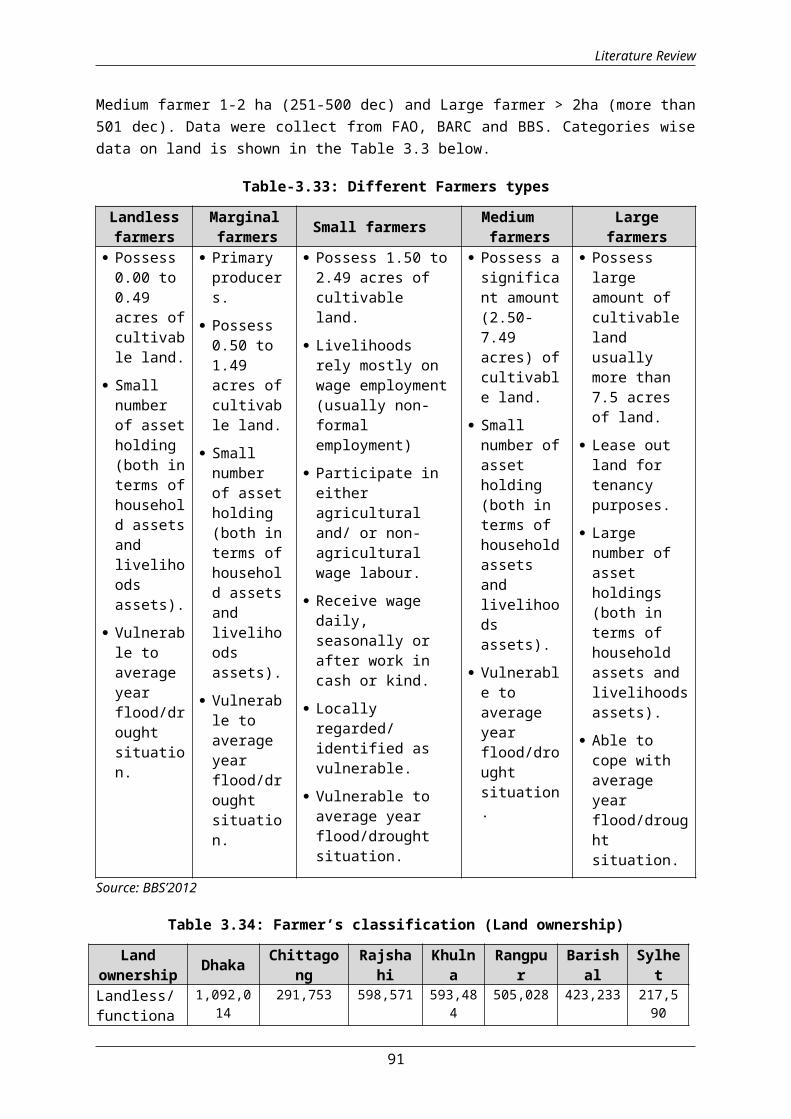
Literature Review
Medium farmer 1-2 ha (251-500 dec) and Large farmer > 2ha (more than501 dec). Data were collect from FAO, BARC and BBS. Categories wisedata on land is shown in the Table 3.3 below.
Table-3.33: Different Farmers types
Landlessfarmers
Marginalfarmers Small farmers Medium
farmersLarge
farmers Possess 0.00 to 0.49 acres ofcultivable land.
Small number of assetholding (both interms ofhousehold assetsand livelihoods assets).
Vulnerable to average year flood/drought situation.
Primary producers.
Possess 0.50 to 1.49 acres ofcultivable land.
Small number of assetholding (both interms ofhousehold assetsand livelihoods assets).
Vulnerable to average year flood/drought situation.
Possess 1.50 to2.49 acres of cultivable land.
Livelihoods rely mostly on wage employment(usually non-formal employment)
Participate in either agricultural and/ or non-agricultural wage labour.
Receive wage daily, seasonally or after work in cash or kind.
Locally regarded/ identified as vulnerable.
Vulnerable to average year flood/drought situation.
Possess asignificant amount(2.50-7.49 acres) ofcultivable land.
Small number ofasset holding (both in terms of householdassets and livelihoods assets).
Vulnerable to average year flood/drought situation.
Possess large amount of cultivable land usually more than 7.5 acres of land.
Lease out land for tenancy purposes.
Large number of asset holdings (both in terms of household assets and livelihoodsassets).
Able to cope with average year flood/drought situation.
Source: BBS’2012
Table 3.34: Farmer’s classification (Land ownership)
Landownership Dhaka Chittago
ng Rajsha
hiKhuln
aRangpu
rBarish
alSylhet
Landless/functiona
1,092,014
291,753 598,571 593,484
505,028 423,233 217,590
91

Literature Review
llylandless<0.2 ha(<50dec.)Marginalfarmer0.2-0.5ha (50-125 dec.)
1,070,385 664,569 525,208 469,40
1 481,404 213,789 162,375
Smallholder0.5- 1ha. (126-250dec.)
727,066 392,727 401,856 348,221 331,775 165,638 117,1
23
Mediumfarmer 1-2 ha.(251-500dec.)
521,001 252,688 379,105 313,293 352,747 29,899 160,0
80
Largefarmer >2ha.(morethan 501dec.)
44,270 27,959 45,585 29,408 43,072 17,963 26,157
Source: DAE, 2012
3.10.7 Agriculture labour wage rate
In ordinary sense, wages are the remuneration paid for the servicesof labour. The agriculture labour is who are working on agriculturalproduction system. In this connection information were collectedfrom BARC and open discussion with different categories of farmers.It was found out that agriculture labor in the peak time (ricetransplanting and harvesting) is higher than in the lean period. Inpeak period male labour in upazila is higher than district anddivisional area. It also varies from male to female. Detailsinformation are shown in Table-3.35 below.
Table-3.35: Wage rate by different units in Bangladesh
Labour wage AgricultureLabourtypes
Wage rate (Taka)Upazila Distric
tDivision Total
Average agri.day labor wage
Male 400 350 300 350Female 250 250 250 250
92

Literature Review
in peak periodAverage agri.day labor wagein lean period.
Male 250 250 250 250Female 100 150 150 133
Source: BARC’2012
3.10.8 Division wise agricultural and non-agricultural occupationalstatus
It is very difficult to find out the households information bydivisions. We tried to collect data from different sources like BARCand BBS. Data were categorized in three categories. These are HHsentirely depending on agricultural production (farm) and HHsentirely depending on non- farm occupation. (Non-farm). Divisionwise information’s are given table-3.4 below.
Table-3.36 Division wise agricultural and non-agriculturaloccupational status
Divisions
Total HHs
HHs entirelydepending onagricultural
production. forincome (farm)
(%)
HHs entirelydepending onnon- farmoccupation.(non farm)
(%)
Division
Barisal 1,781,993 588,057 26 338,579 21
Chittagong 4,867,243 1,606,191 21 924,776 20
Dhaka 11,023,436 3,637,733 26 2,094,453 23
Khulna 3,086,448 954,109 28 541,197 22
Rajshahi 3,889,014 1,283,375 30 738,913 19
Rangpur 11,131,874 3,673,519 35 2,115,056 17
Sylhet 1,499,079 494,696 22 284,825 18Source: BBS’2010
93
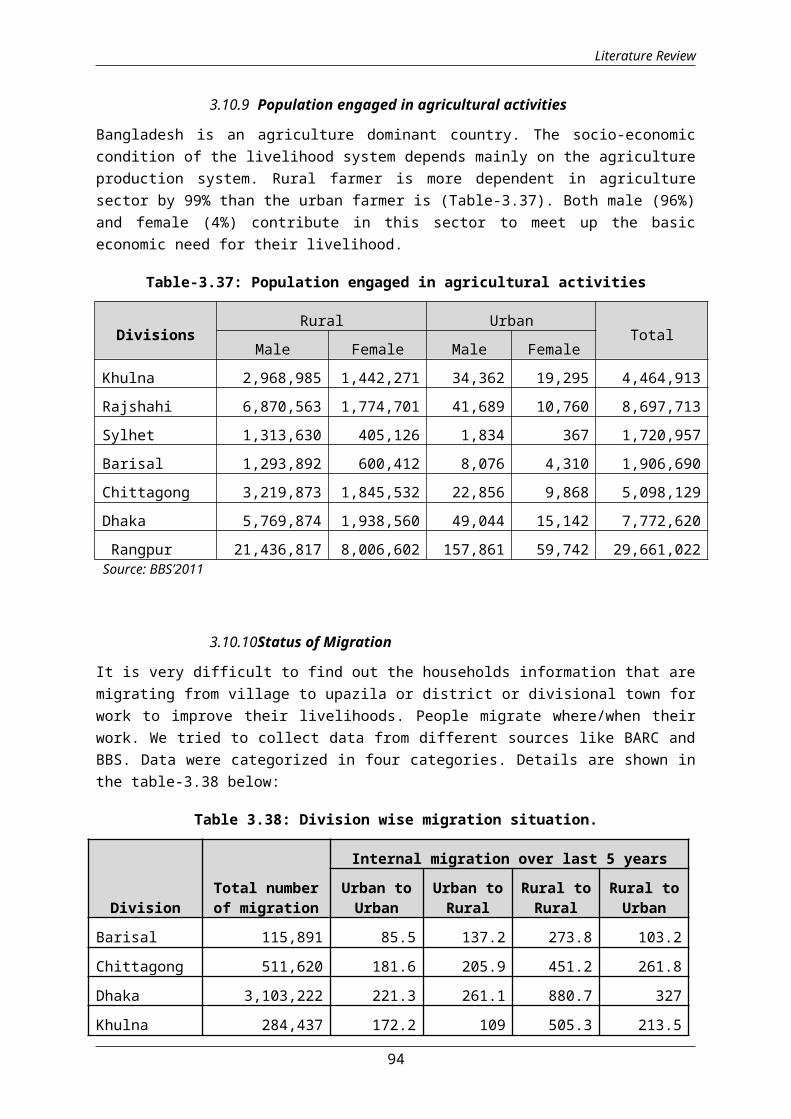
Literature Review
3.10.9 Population engaged in agricultural activities
Bangladesh is an agriculture dominant country. The socio-economiccondition of the livelihood system depends mainly on the agricultureproduction system. Rural farmer is more dependent in agriculturesector by 99% than the urban farmer is (Table-3.37). Both male (96%)and female (4%) contribute in this sector to meet up the basiceconomic need for their livelihood.
Table-3.37: Population engaged in agricultural activities
Divisions Rural Urban
TotalMale Female Male Female
Khulna 2,968,985 1,442,271 34,362 19,295 4,464,913Rajshahi 6,870,563 1,774,701 41,689 10,760 8,697,713Sylhet 1,313,630 405,126 1,834 367 1,720,957Barisal 1,293,892 600,412 8,076 4,310 1,906,690Chittagong 3,219,873 1,845,532 22,856 9,868 5,098,129Dhaka 5,769,874 1,938,560 49,044 15,142 7,772,620 Rangpur 21,436,817 8,006,602 157,861 59,742 29,661,022
Source: BBS’2011
3.10.10Status of Migration
It is very difficult to find out the households information that aremigrating from village to upazila or district or divisional town forwork to improve their livelihoods. People migrate where/when theirwork. We tried to collect data from different sources like BARC andBBS. Data were categorized in four categories. Details are shown inthe table-3.38 below:
Table 3.38: Division wise migration situation.
DivisionTotal numberof migration
Internal migration over last 5 yearsUrban toUrban
Urban toRural
Rural toRural
Rural toUrban
Barisal 115,891 85.5 137.2 273.8 103.2Chittagong 511,620 181.6 205.9 451.2 261.8Dhaka 3,103,222 221.3 261.1 880.7 327Khulna 284,437 172.2 109 505.3 213.5
94
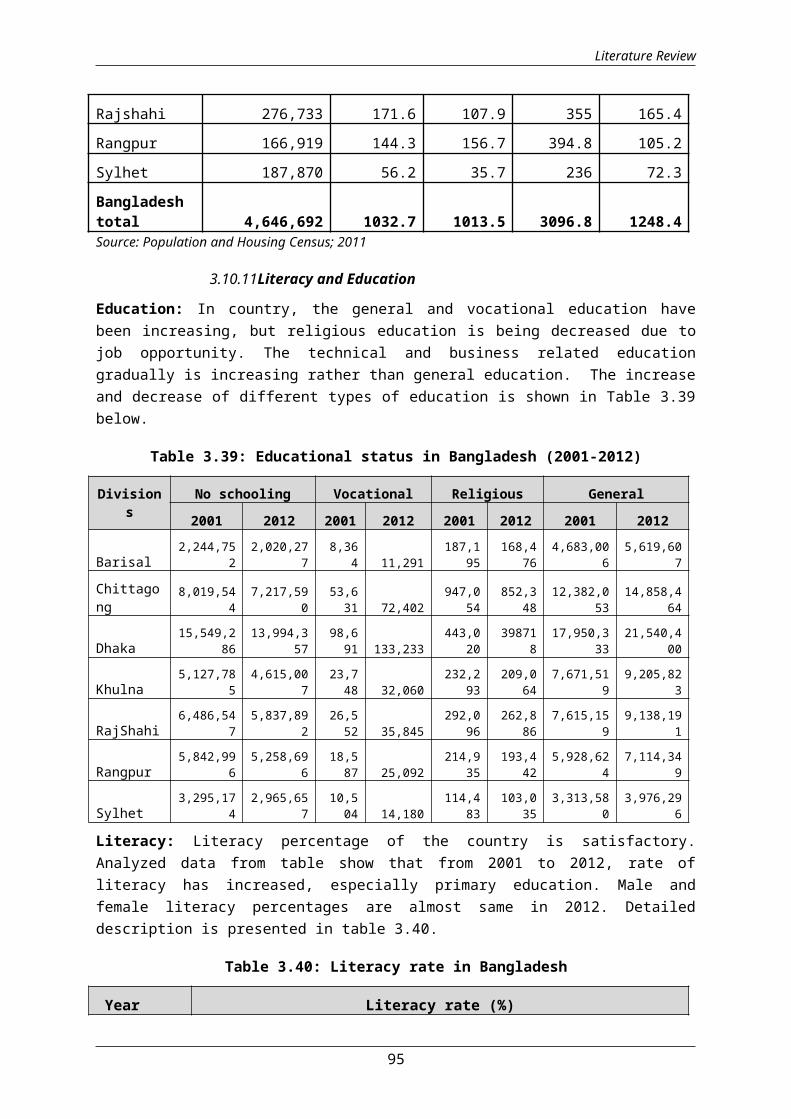
Literature Review
Rajshahi 276,733 171.6 107.9 355 165.4Rangpur 166,919 144.3 156.7 394.8 105.2Sylhet 187,870 56.2 35.7 236 72.3Bangladeshtotal 4,646,692 1032.7 1013.5 3096.8 1248.4Source: Population and Housing Census; 2011
3.10.11Literacy and Education
Education: In country, the general and vocational education havebeen increasing, but religious education is being decreased due tojob opportunity. The technical and business related educationgradually is increasing rather than general education. The increaseand decrease of different types of education is shown in Table 3.39below.
Table 3.39: Educational status in Bangladesh (2001-2012)
Divisions
No schooling Vocational Religious General
2001 2012 2001 2012 2001 2012 2001 2012
Barisal2,244,75
22,020,27
78,36
4 11,291187,1
95168,4
764,683,00
65,619,60
7
Chittagong
8,019,544
7,217,590
53,631 72,402
947,054
852,348
12,382,053
14,858,464
Dhaka15,549,2
8613,994,3
5798,6
91 133,233443,0
2039871
817,950,3
3321,540,4
00
Khulna5,127,78
54,615,00
723,7
48 32,060232,2
93209,0
647,671,51
99,205,82
3
RajShahi6,486,54
75,837,89
226,5
52 35,845292,0
96262,8
867,615,15
99,138,19
1
Rangpur5,842,99
65,258,69
618,5
87 25,092214,9
35193,4
425,928,62
47,114,34
9
Sylhet3,295,17
42,965,65
710,5
04 14,180114,4
83103,0
353,313,58
03,976,29
6
Literacy: Literacy percentage of the country is satisfactory.Analyzed data from table show that from 2001 to 2012, rate ofliteracy has increased, especially primary education. Male andfemale literacy percentages are almost same in 2012. Detaileddescription is presented in table 3.40.
Table 3.40: Literacy rate in Bangladesh
Year Literacy rate (%)
95

Literature Review
Years 5+ Years 7+
Male Female Male Female2001 45 37 47 392012 58.2 57.4 61 57
Increased(%) 13.2 20.4 14 18
Figure: 3.12 Literacy rate and increased percentage
3.10.12Government and Non-Government Organizations
Three categories-local or regional, national and international NGO’sare working in our country. There are various Government and non-Government organizations working in the Divisions to Village. Weknow about Govt. organizational setups from divisions to upazillaslevel. In addition to that there are non-Govt. organizations likeBRDB, LGED, BRAC, ASA, Grameen Bank, etc. work with poorer sectionof the society. Some organizations have their micro credit, health,crops, livestock, poultry, IGA and non-formal educational activitiesin the villages. They gave training on poultry, goat rearing,agriculture, sanitation, etc. Group formation remains the usualapproach for the NGOs in reaching and addressing development needsof the beneficiaries. Division wise name of the non- govt.organizations are listed in the below Tables-3.41.
96
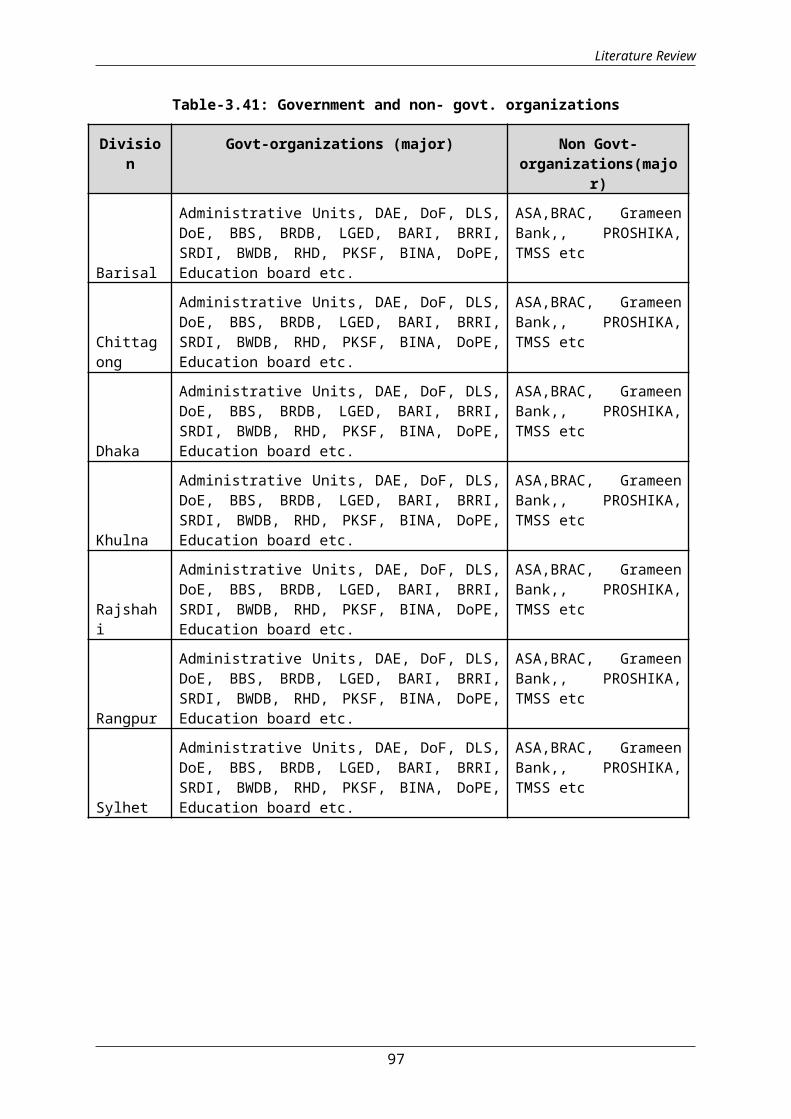
Literature Review
Table-3.41: Government and non- govt. organizations
Division
Govt-organizations (major) Non Govt-organizations(majo
r)
Barisal
Administrative Units, DAE, DoF, DLS,DoE, BBS, BRDB, LGED, BARI, BRRI,SRDI, BWDB, RHD, PKSF, BINA, DoPE,Education board etc.
ASA,BRAC, GrameenBank,, PROSHIKA,TMSS etc
Chittagong
Administrative Units, DAE, DoF, DLS,DoE, BBS, BRDB, LGED, BARI, BRRI,SRDI, BWDB, RHD, PKSF, BINA, DoPE,Education board etc.
ASA,BRAC, GrameenBank,, PROSHIKA,TMSS etc
Dhaka
Administrative Units, DAE, DoF, DLS,DoE, BBS, BRDB, LGED, BARI, BRRI,SRDI, BWDB, RHD, PKSF, BINA, DoPE,Education board etc.
ASA,BRAC, GrameenBank,, PROSHIKA,TMSS etc
Khulna
Administrative Units, DAE, DoF, DLS,DoE, BBS, BRDB, LGED, BARI, BRRI,SRDI, BWDB, RHD, PKSF, BINA, DoPE,Education board etc.
ASA,BRAC, GrameenBank,, PROSHIKA,TMSS etc
Rajshahi
Administrative Units, DAE, DoF, DLS,DoE, BBS, BRDB, LGED, BARI, BRRI,SRDI, BWDB, RHD, PKSF, BINA, DoPE,Education board etc.
ASA,BRAC, GrameenBank,, PROSHIKA,TMSS etc
Rangpur
Administrative Units, DAE, DoF, DLS,DoE, BBS, BRDB, LGED, BARI, BRRI,SRDI, BWDB, RHD, PKSF, BINA, DoPE,Education board etc.
ASA,BRAC, GrameenBank,, PROSHIKA,TMSS etc
Sylhet
Administrative Units, DAE, DoF, DLS,DoE, BBS, BRDB, LGED, BARI, BRRI,SRDI, BWDB, RHD, PKSF, BINA, DoPE,Education board etc.
ASA,BRAC, GrameenBank,, PROSHIKA,TMSS etc
97
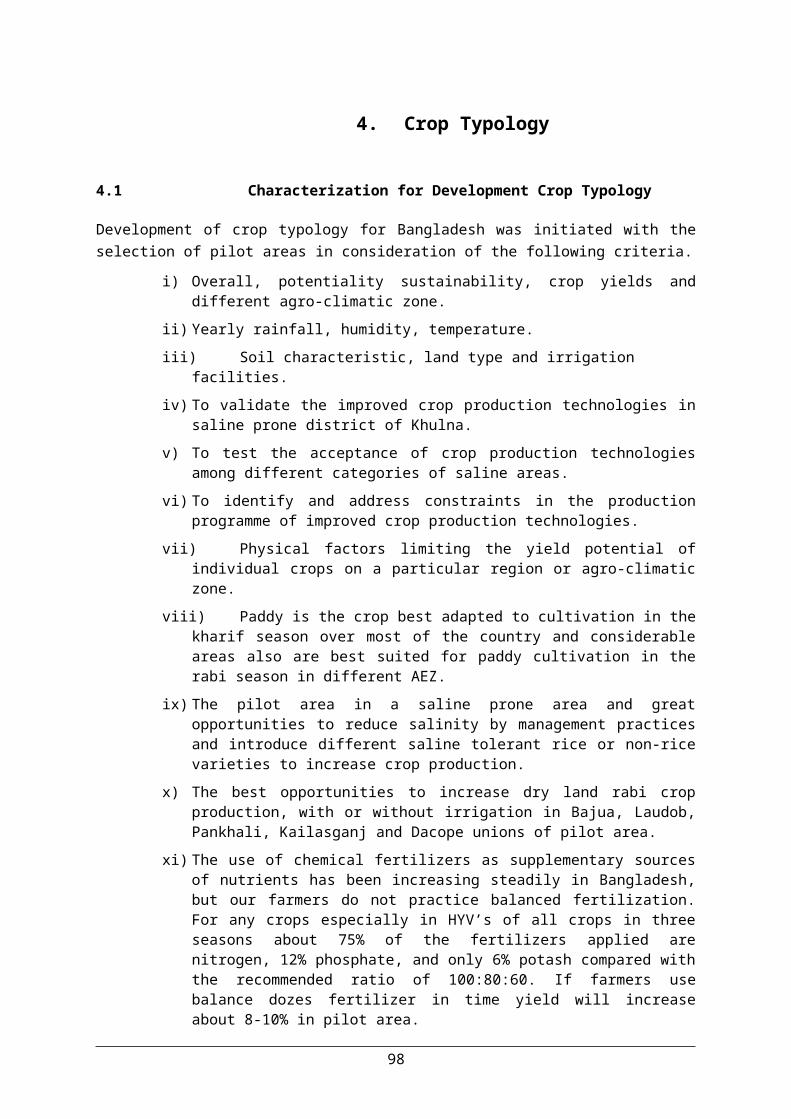
4. Crop Typology
4.1 Characterization for Development Crop Typology
Development of crop typology for Bangladesh was initiated with theselection of pilot areas in consideration of the following criteria.
i) Overall, potentiality sustainability, crop yields anddifferent agro-climatic zone.
ii) Yearly rainfall, humidity, temperature. iii) Soil characteristic, land type and irrigation
facilities. iv) To validate the improved crop production technologies in
saline prone district of Khulna.v) To test the acceptance of crop production technologies
among different categories of saline areas.vi) To identify and address constraints in the production
programme of improved crop production technologies.vii) Physical factors limiting the yield potential of
individual crops on a particular region or agro-climaticzone.
viii) Paddy is the crop best adapted to cultivation in thekharif season over most of the country and considerableareas also are best suited for paddy cultivation in therabi season in different AEZ.
ix) The pilot area in a saline prone area and greatopportunities to reduce salinity by management practicesand introduce different saline tolerant rice or non-ricevarieties to increase crop production.
x) The best opportunities to increase dry land rabi cropproduction, with or without irrigation in Bajua, Laudob,Pankhali, Kailasganj and Dacope unions of pilot area.
xi) The use of chemical fertilizers as supplementary sourcesof nutrients has been increasing steadily in Bangladesh,but our farmers do not practice balanced fertilization.For any crops especially in HYV’s of all crops in threeseasons about 75% of the fertilizers applied arenitrogen, 12% phosphate, and only 6% potash compared withthe recommended ratio of 100:80:60. If farmers usebalance dozes fertilizer in time yield will increaseabout 8-10% in pilot area.
98
Literature Review
Considering the above points the following pilot areas wereselected.
1. Pilot 1: Dacope upazila in Khulna2. Pilot 2: Khagrachhari upazila in Chittagon Hill Tracts3. Pilot 3: Gazipur Sadar Upazila in Gazipur 4. Pilot 4: Amtali upazila in Barisal5. Pilot 5: Gomastapur in Rajshahi6. Pilot 6: Jamalgonj in Sylhet7. Pilot 7: Pirgonj in Rangpur
Detailed description of the 7 pilot areas are presented in thefollowing sections.
99

Literature Review
Pilot-1, Dacope Upazila of Khulna
1. Introduction
From Khulna Division we selected Khulna District and from KhulnaDistrict we selected Dacope upazila as a pilot area. Pilot Upazila(Dacope) has a lot of scope to grow more crops using High YieldingVarieties (HYVs) of field and horticultural crops and land use indifferent season. Khulna zila was upgraded to a zila in 1882.Nothing is definitely known about the zila name. Local traditionstates that the area is called after Khullana, a heroine of Hindumythology who dedicated to kali, a shrine called the temple of theKhullaneswari on the bank of the river Bhairab. The zila is boundedon the north by Jessore and Narail zilas, on the east by Bagerhatzila, on the south by the Bay of Bengal and on the west by Satkhirazila. The zila lies between 22°12' and 23°59' north latitudes andbetween 89°14' and 89°45' east longitudes. The total area of thezila is 4394.45 sq. km. (1696.00 sq. miles) including 2348.55 sq.km. (906.78 sq. miles) forest areas. Annual Average Temperature:Maximum 35.5°C and lowest 12.5°C; annual rainfall is 1710 mm. MainRivers are Rupsa-Pasur, Bhairab, Shibsha, Dharla, Bhadra, Ball, andKobadak (BBS 2011). Administrative map of Dacope upazila is showinin the following map.
100
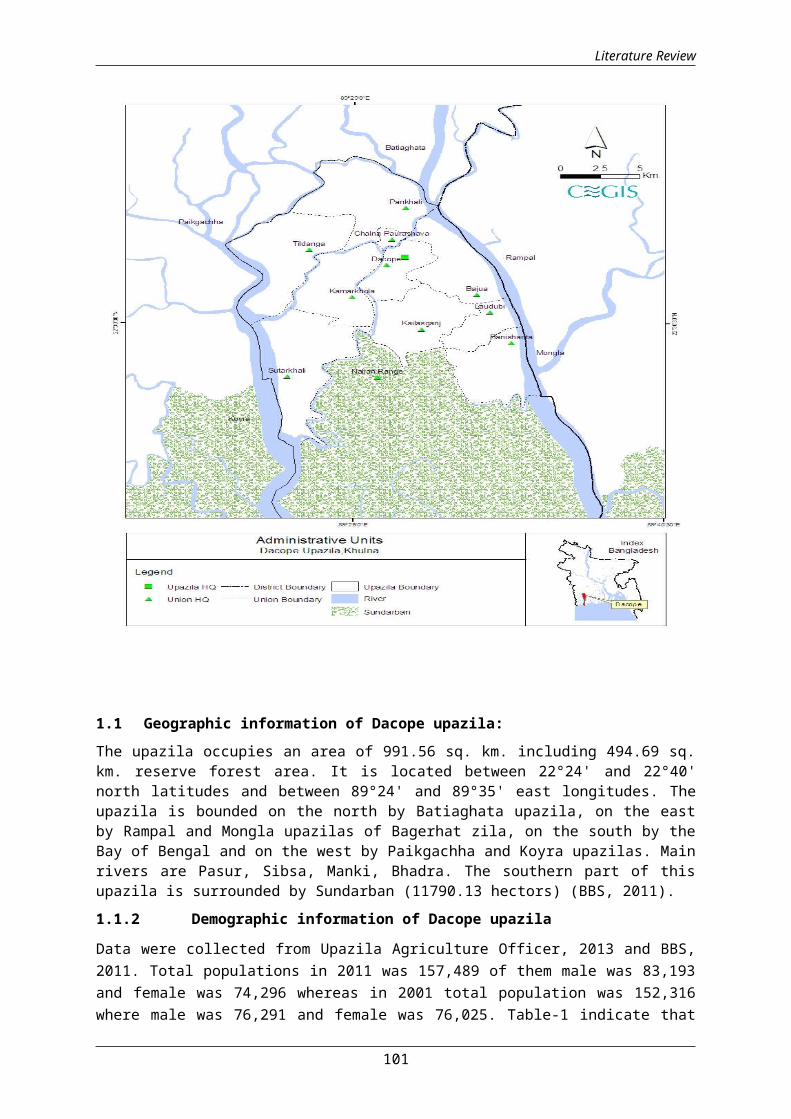
Literature Review
1.1 Geographic information of Dacope upazila:The upazila occupies an area of 991.56 sq. km. including 494.69 sq.km. reserve forest area. It is located between 22°24' and 22°40'north latitudes and between 89°24' and 89°35' east longitudes. Theupazila is bounded on the north by Batiaghata upazila, on the eastby Rampal and Mongla upazilas of Bagerhat zila, on the south by theBay of Bengal and on the west by Paikgachha and Koyra upazilas. Mainrivers are Pasur, Sibsa, Manki, Bhadra. The southern part of thisupazila is surrounded by Sundarban (11790.13 hectors) (BBS, 2011).1.1.2 Demographic information of Dacope upazila
Data were collected from Upazila Agriculture Officer, 2013 and BBS,2011. Total populations in 2011 was 157,489 of them male was 83,193and female was 74,296 whereas in 2001 total population was 152,316where male was 76,291 and female was 76,025. Table-1 indicate that
101
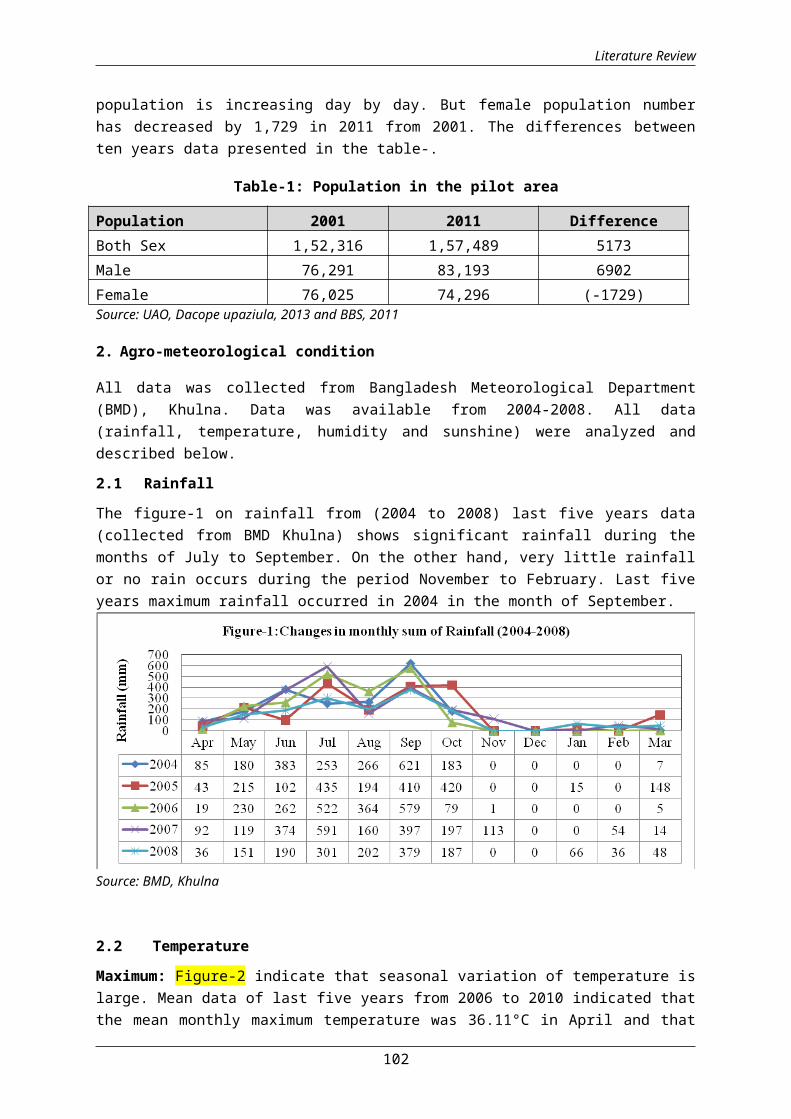
Literature Review
population is increasing day by day. But female population numberhas decreased by 1,729 in 2011 from 2001. The differences betweenten years data presented in the table-.
Table-1: Population in the pilot area
Population 2001 2011 DifferenceBoth Sex 1,52,316 1,57,489 5173Male 76,291 83,193 6902Female 76,025 74,296 (-1729)Source: UAO, Dacope upaziula, 2013 and BBS, 2011
2. Agro-meteorological condition
All data was collected from Bangladesh Meteorological Department(BMD), Khulna. Data was available from 2004-2008. All data(rainfall, temperature, humidity and sunshine) were analyzed anddescribed below.
2.1 Rainfall
The figure-1 on rainfall from (2004 to 2008) last five years data(collected from BMD Khulna) shows significant rainfall during themonths of July to September. On the other hand, very little rainfallor no rain occurs during the period November to February. Last fiveyears maximum rainfall occurred in 2004 in the month of September.
Source: BMD, Khulna
2.2 Temperature
Maximum: Figure-2 indicate that seasonal variation of temperature islarge. Mean data of last five years from 2006 to 2010 indicated thatthe mean monthly maximum temperature was 36.11°C in April and that
102
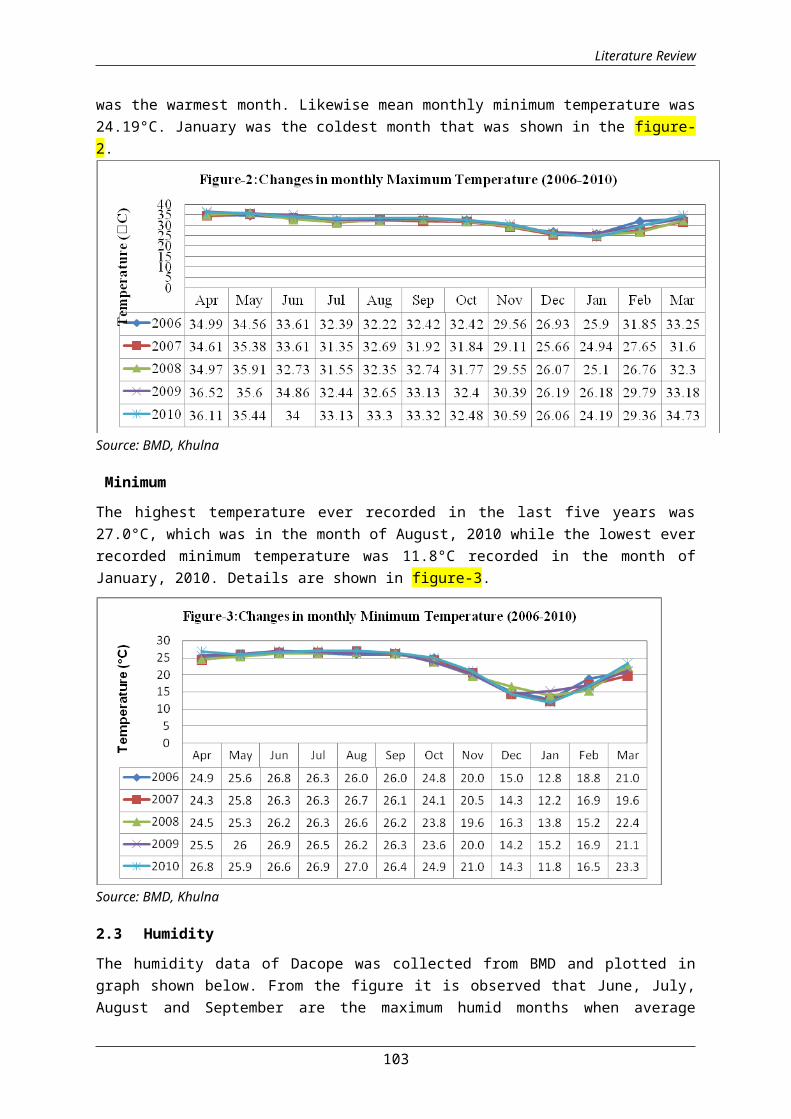
Literature Review
was the warmest month. Likewise mean monthly minimum temperature was24.19°C. January was the coldest month that was shown in the figure-2.
Source: BMD, Khulna
Minimum
The highest temperature ever recorded in the last five years was27.0°C, which was in the month of August, 2010 while the lowest everrecorded minimum temperature was 11.8°C recorded in the month ofJanuary, 2010. Details are shown in figure-3.
Source: BMD, Khulna
2.3 Humidity
The humidity data of Dacope was collected from BMD and plotted ingraph shown below. From the figure it is observed that June, July,August and September are the maximum humid months when average
103
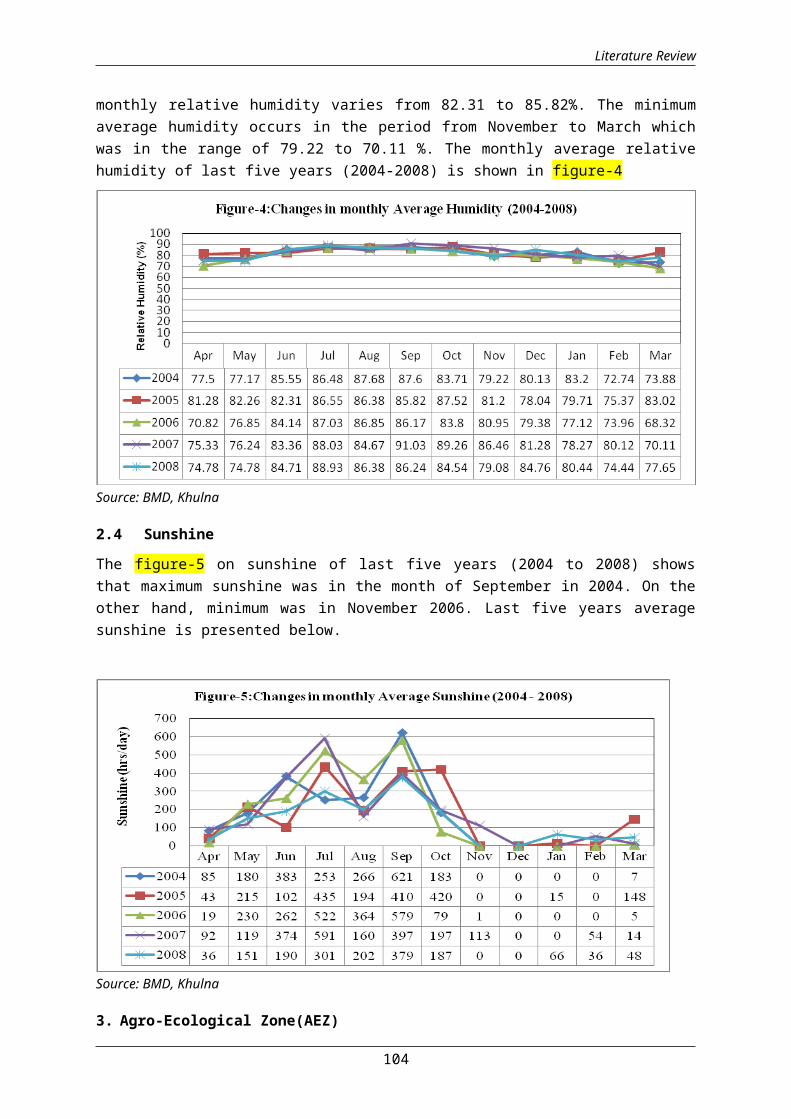
Literature Review
monthly relative humidity varies from 82.31 to 85.82%. The minimumaverage humidity occurs in the period from November to March whichwas in the range of 79.22 to 70.11 %. The monthly average relativehumidity of last five years (2004-2008) is shown in figure-4
Source: BMD, Khulna
2.4 Sunshine
The figure-5 on sunshine of last five years (2004 to 2008) showsthat maximum sunshine was in the month of September in 2004. On theother hand, minimum was in November 2006. Last five years averagesunshine is presented below.
Source: BMD, Khulna
3. Agro-Ecological Zone(AEZ)
104

Literature Review
Bangladesh has been divided into 30 agro-ecological zones (AEZ)depending on physiography, climatic condition, depth and inundationof land. The pilot area is situated in the Ganges Tidal Flood Plain(AEZ-13) is shown in map-. Details descriptions of AEZ are givenbelow and crops (field and horticultural) grown in the pilot areaaccording to AEZs are presented in the table-.
105
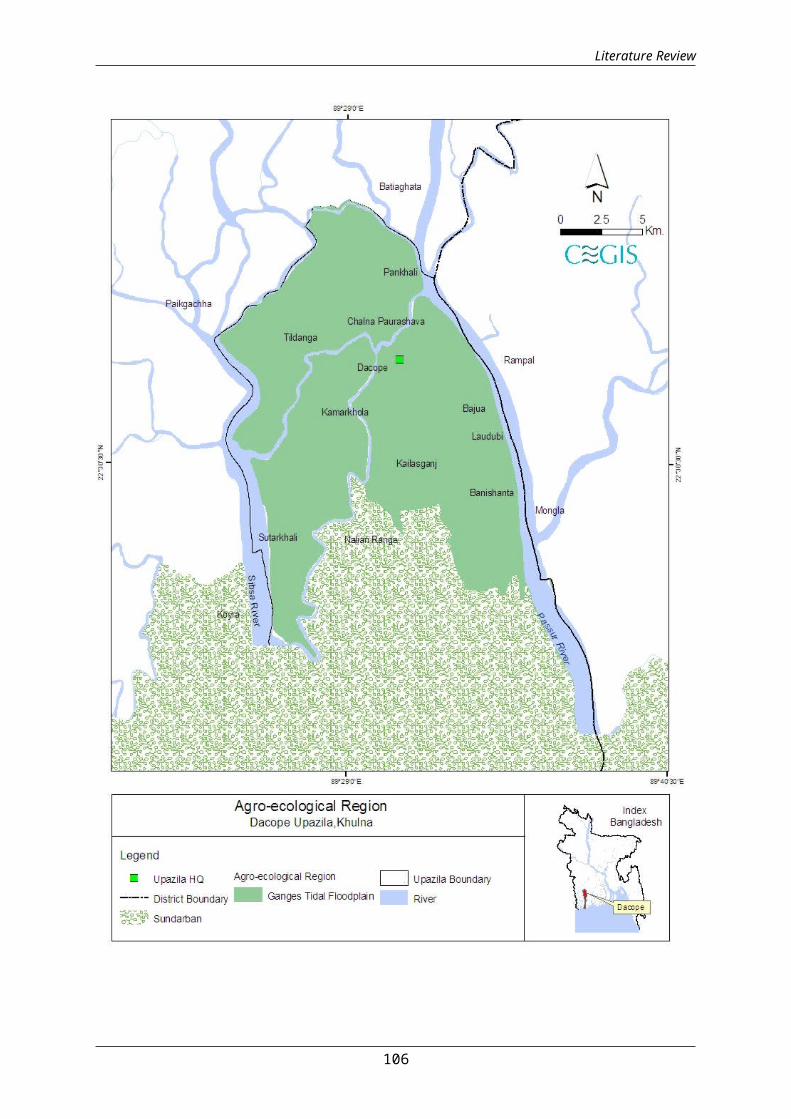
Literature Review
106
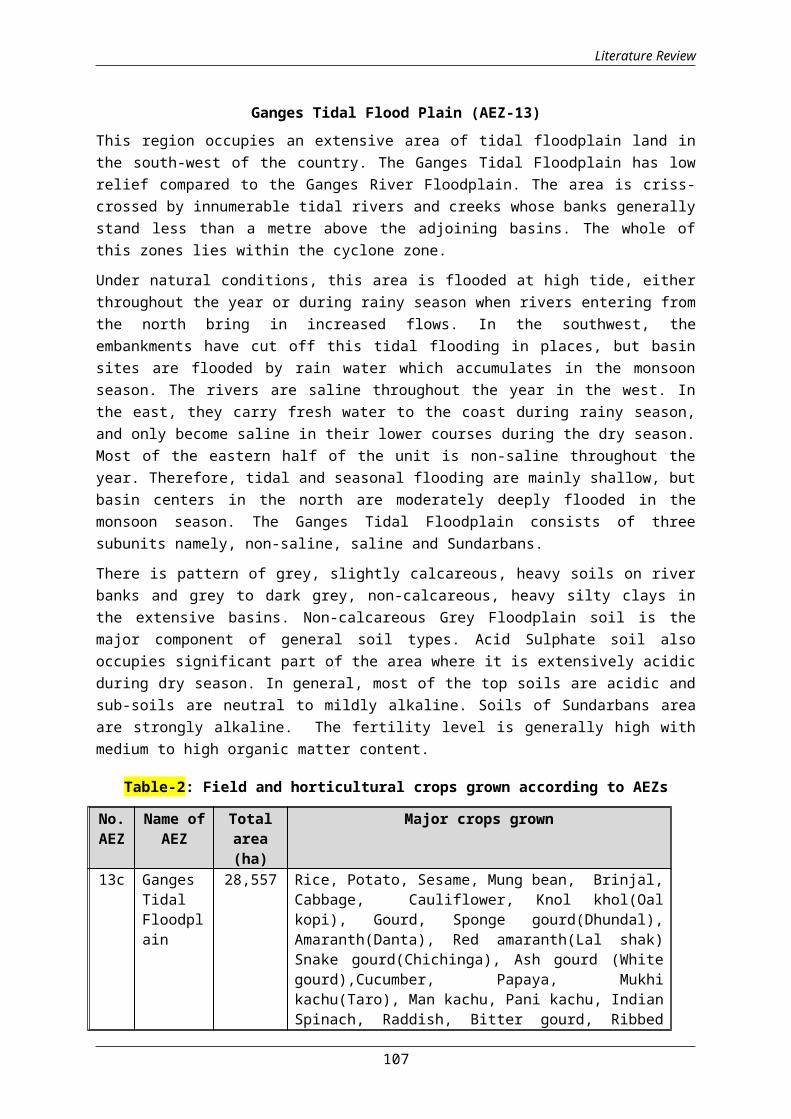
Literature Review
Ganges Tidal Flood Plain (AEZ-13)This region occupies an extensive area of tidal floodplain land inthe south-west of the country. The Ganges Tidal Floodplain has lowrelief compared to the Ganges River Floodplain. The area is criss-crossed by innumerable tidal rivers and creeks whose banks generallystand less than a metre above the adjoining basins. The whole ofthis zones lies within the cyclone zone.
Under natural conditions, this area is flooded at high tide, eitherthroughout the year or during rainy season when rivers entering fromthe north bring in increased flows. In the southwest, theembankments have cut off this tidal flooding in places, but basinsites are flooded by rain water which accumulates in the monsoonseason. The rivers are saline throughout the year in the west. Inthe east, they carry fresh water to the coast during rainy season,and only become saline in their lower courses during the dry season.Most of the eastern half of the unit is non-saline throughout theyear. Therefore, tidal and seasonal flooding are mainly shallow, butbasin centers in the north are moderately deeply flooded in themonsoon season. The Ganges Tidal Floodplain consists of threesubunits namely, non-saline, saline and Sundarbans.
There is pattern of grey, slightly calcareous, heavy soils on riverbanks and grey to dark grey, non-calcareous, heavy silty clays inthe extensive basins. Non-calcareous Grey Floodplain soil is themajor component of general soil types. Acid Sulphate soil alsooccupies significant part of the area where it is extensively acidicduring dry season. In general, most of the top soils are acidic andsub-soils are neutral to mildly alkaline. Soils of Sundarbans areaare strongly alkaline. The fertility level is generally high withmedium to high organic matter content.
Table-2: Field and horticultural crops grown according to AEZs
No.AEZ
Name ofAEZ
Totalarea(ha)
Major crops grown
13c GangesTidalFloodplain
28,557 Rice, Potato, Sesame, Mung bean, Brinjal,Cabbage, Cauliflower, Knol khol(Oalkopi), Gourd, Sponge gourd(Dhundal),Amaranth(Danta), Red amaranth(Lal shak)Snake gourd(Chichinga), Ash gourd (Whitegourd),Cucumber, Papaya, Mukhikachu(Taro), Man kachu, Pani kachu, IndianSpinach, Raddish, Bitter gourd, Ribbed
107
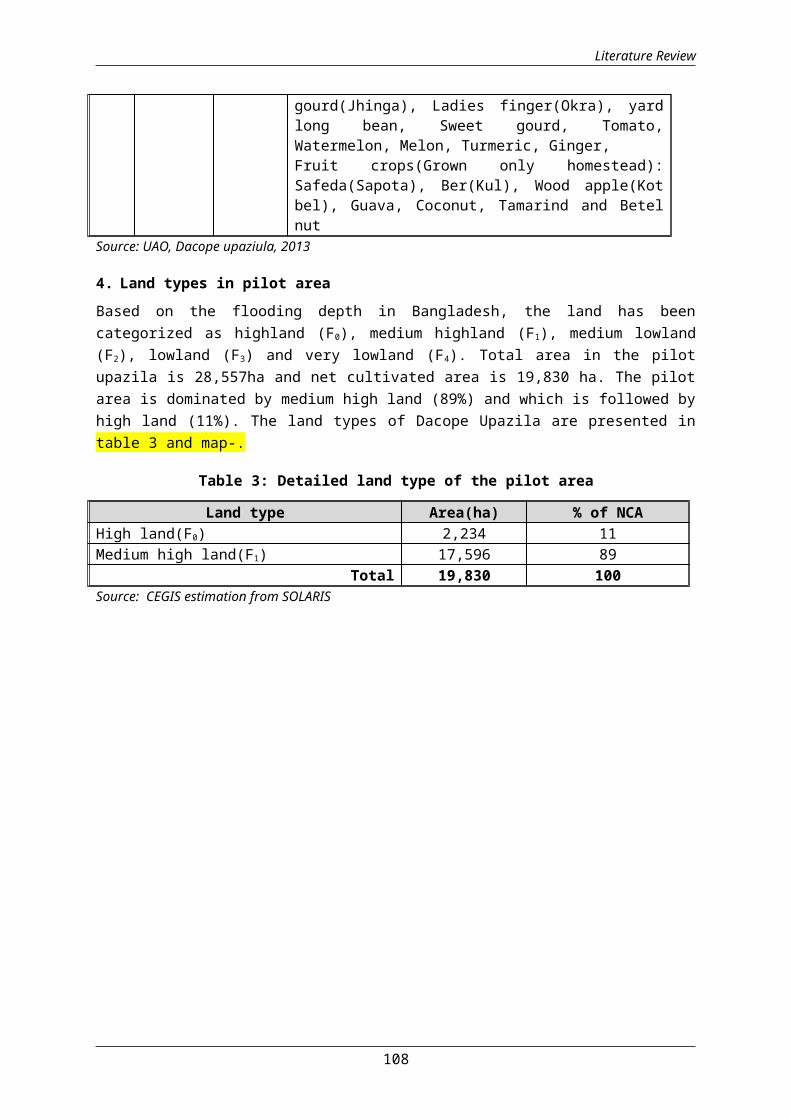
Literature Review
gourd(Jhinga), Ladies finger(Okra), yardlong bean, Sweet gourd, Tomato,Watermelon, Melon, Turmeric, Ginger, Fruit crops(Grown only homestead):Safeda(Sapota), Ber(Kul), Wood apple(Kotbel), Guava, Coconut, Tamarind and Betelnut
Source: UAO, Dacope upaziula, 2013
4. Land types in pilot area Based on the flooding depth in Bangladesh, the land has beencategorized as highland (F0), medium highland (F1), medium lowland(F2), lowland (F3) and very lowland (F4). Total area in the pilotupazila is 28,557ha and net cultivated area is 19,830 ha. The pilotarea is dominated by medium high land (89%) and which is followed byhigh land (11%). The land types of Dacope Upazila are presented intable 3 and map-.
Table 3: Detailed land type of the pilot area
Land type Area(ha) % of NCAHigh land(F0) 2,234 11Medium high land(F1) 17,596 89
Total 19,830 100Source: CEGIS estimation from SOLARIS
108

Literature Review
Map 4: Land type of the pilot area
5. Land use in the pilot area
Total land area is estimated about 28,557 ha and net cultivable landis about 69.44% in the pilot area. The Settlement, Road &Infrastructure, River, Water bodies, Forest and Orchard area are6.10%, 8.26%, 4.39%, 2.12%, 2.49% and 7.21 % of the pilot area
109
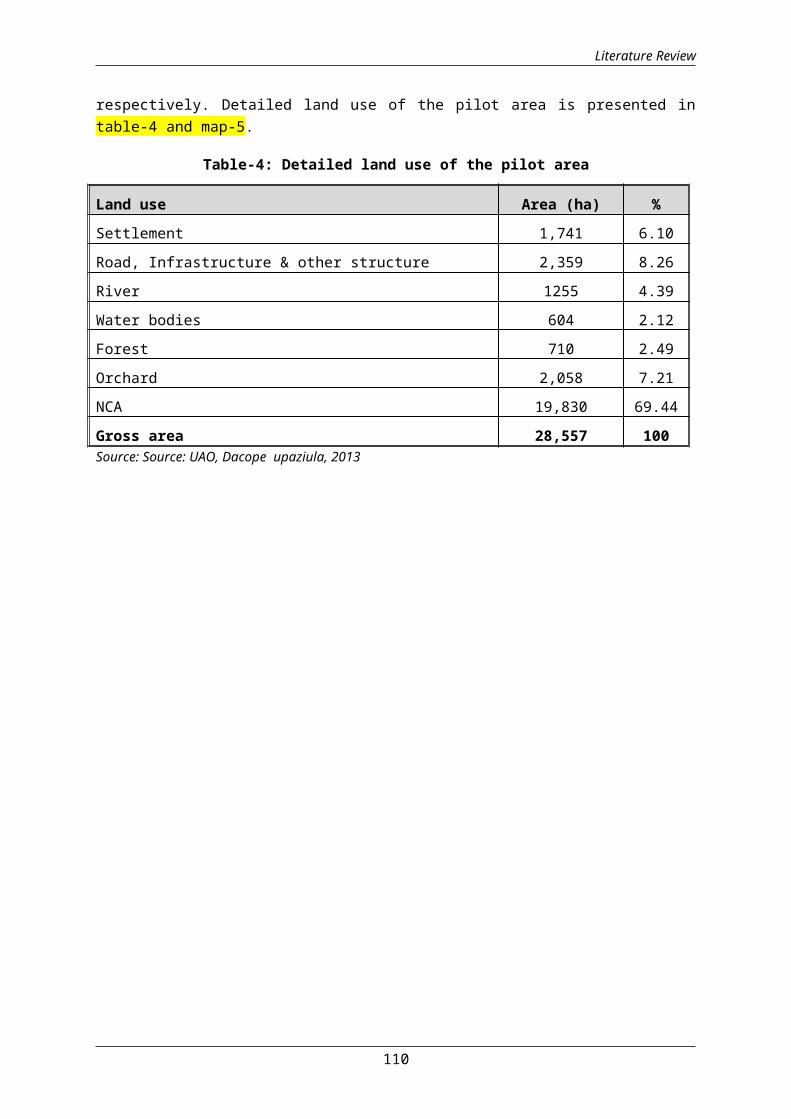
Literature Review
respectively. Detailed land use of the pilot area is presented intable-4 and map-5.
Table-4: Detailed land use of the pilot area
Land use Area (ha) %Settlement 1,741 6.10Road, Infrastructure & other structure 2,359 8.26River 1255 4.39Water bodies 604 2.12Forest 710 2.49Orchard 2,058 7.21NCA 19,830 69.44Gross area 28,557 100Source: Source: UAO, Dacope upaziula, 2013
110
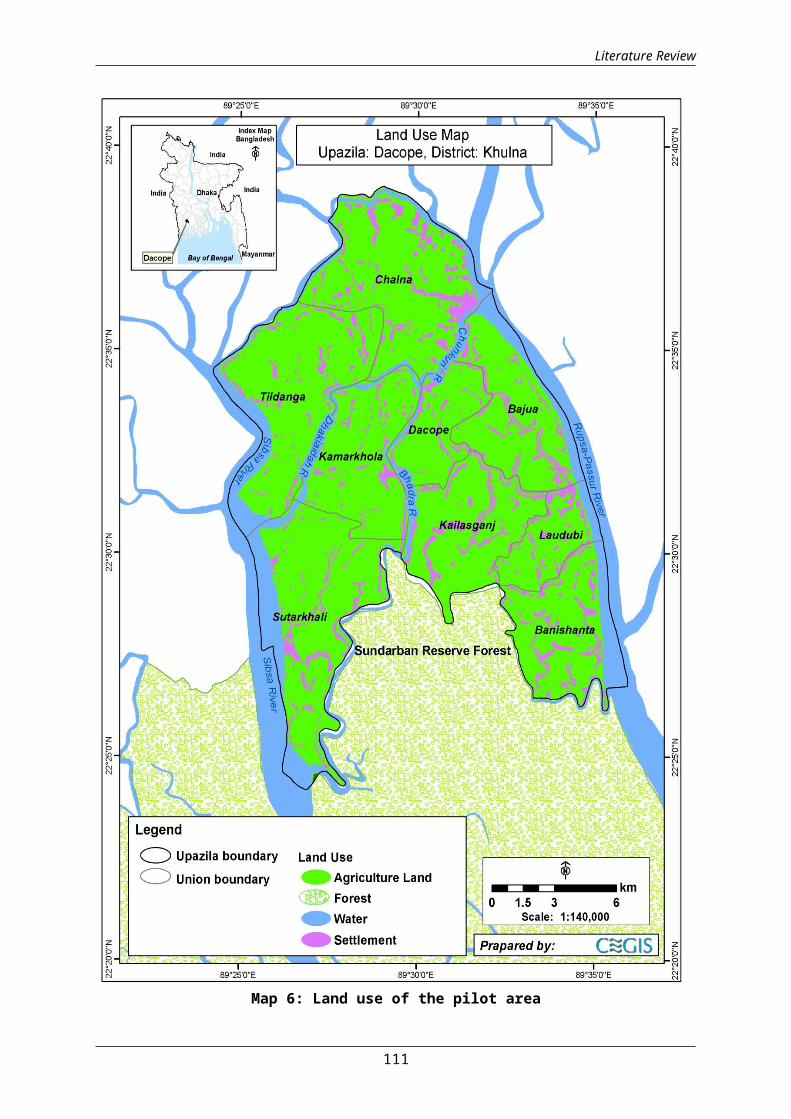
Literature Review
Map 6: Land use of the pilot area
111

Literature Review
6. Soil Texture
Soil texture is the relative proportions of sand, silt and clay. Itis very important for agriculture crop production. The soil textureis dominated by clay (62%) which is followed by clay loam (37%) inthe pilot area. Detailed soil texture is presented in table-5.
Table5: Detailed soil texture of top soil (0-15cm) in pilot area
Texture Area(ha) % of NCAClay 12,325 62Clay Loam 7,290 37Loam 214 1
Total 19,830 100Source: CEGIS estimation from SOLARIS
112
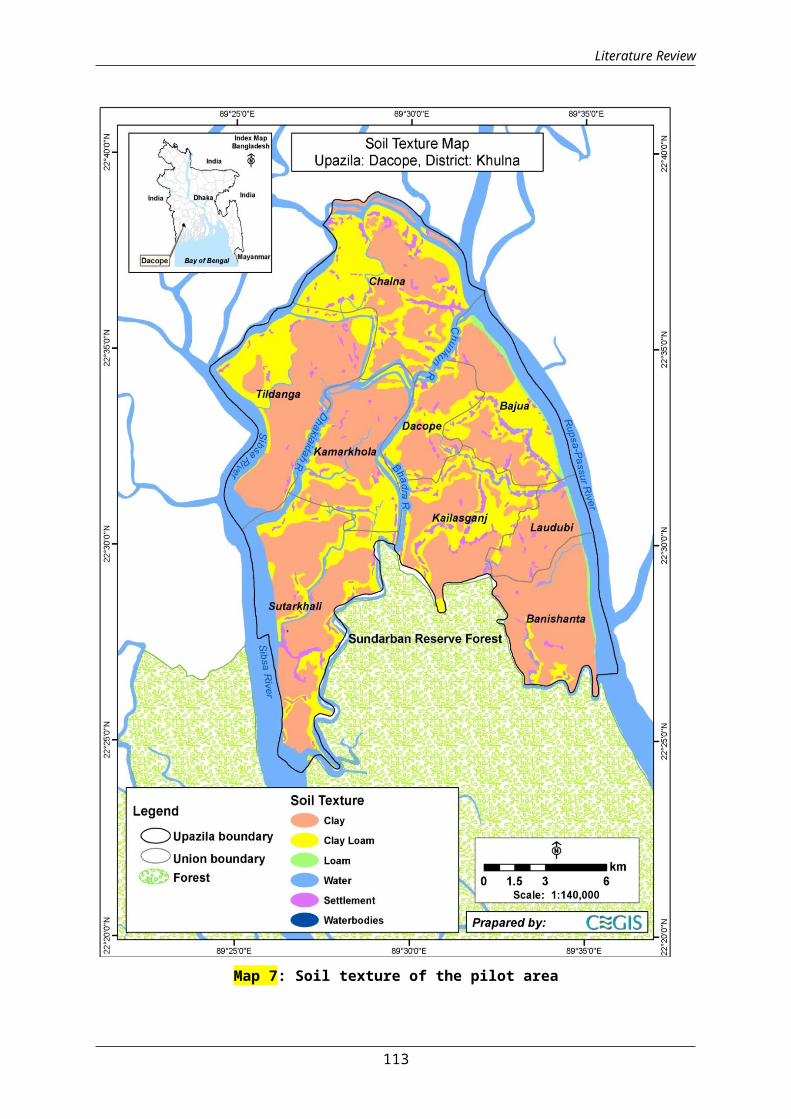
Literature Review
Map 7: Soil texture of the pilot area
113
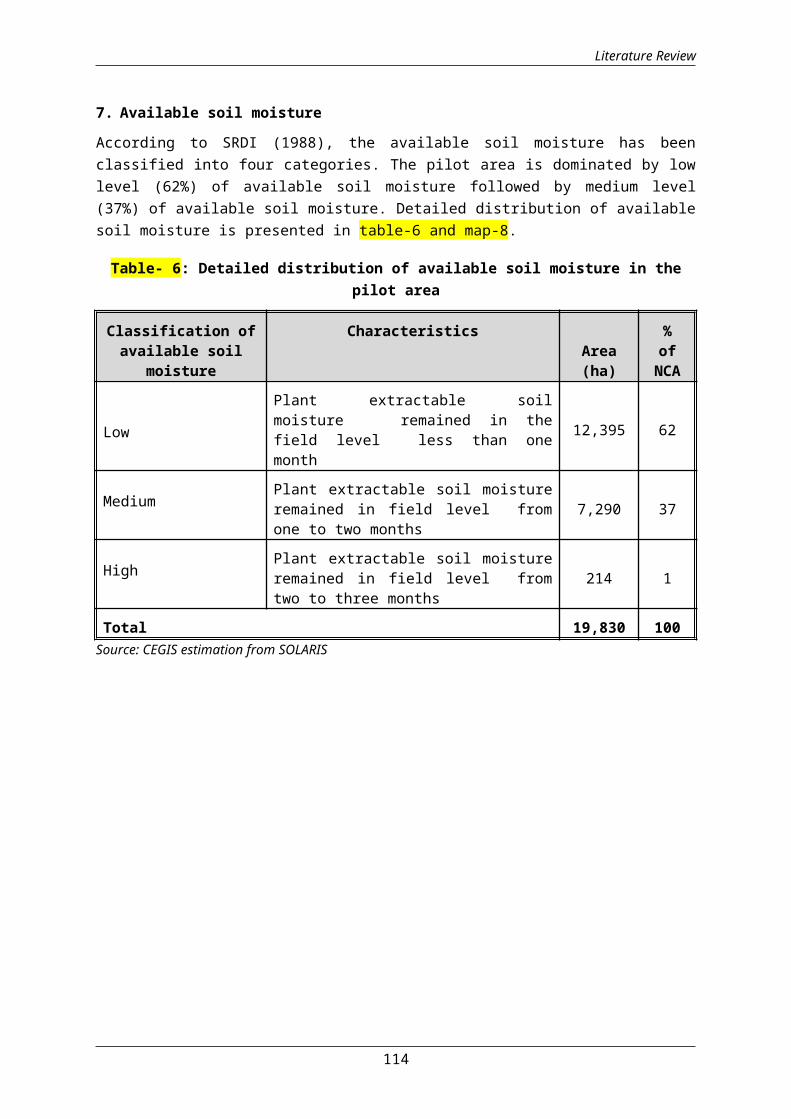
Literature Review
7. Available soil moisture
According to SRDI (1988), the available soil moisture has beenclassified into four categories. The pilot area is dominated by lowlevel (62%) of available soil moisture followed by medium level(37%) of available soil moisture. Detailed distribution of availablesoil moisture is presented in table-6 and map-8.
Table- 6: Detailed distribution of available soil moisture in thepilot area
Classification ofavailable soil
moisture
CharacteristicsArea(ha)
%ofNCA
Low
Plant extractable soilmoisture remained in thefield level less than onemonth
12,395 62
MediumPlant extractable soil moistureremained in field level fromone to two months
7,290 37
HighPlant extractable soil moistureremained in field level fromtwo to three months
214 1
Total 19,830 100Source: CEGIS estimation from SOLARIS
114
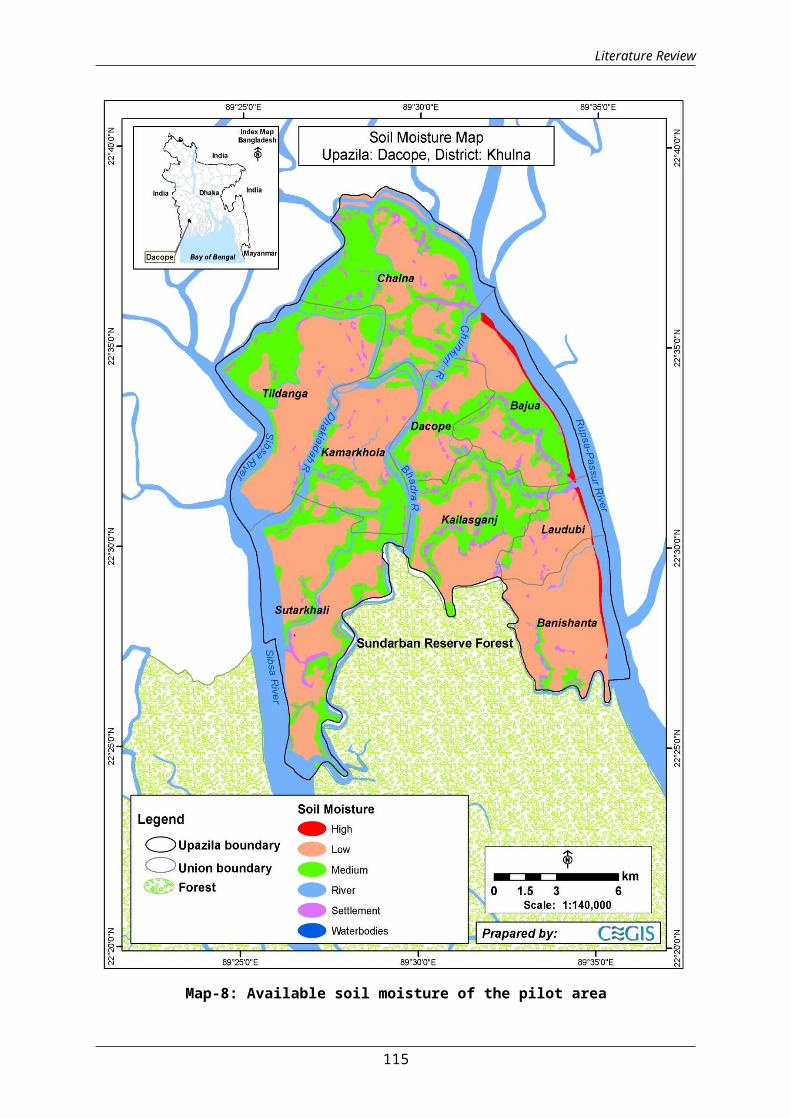
Literature Review
Map-8: Available soil moisture of the pilot area
115

Literature Review
8. Salinity
The soils of the pilot area become saline in the dry season (Jan-May). The soil and water salinity gradually increases with drynessfrom January and reach maximum level in the month April-May and thendecreases due to onset of monsoon rainfall. Soil salinity mapprepared by the SRDI for 2000 and 2010 showed about 96.6% area ofthe pilot area suffered by strongly saline with very strongly salinewhich is followed by slightly saline with some moderatelysaline(3.0%). Detailed soil salinity of the Pilot area is presentedin Table 7 and map-9.
Table 7: Soil salinity in the pilot area
SoilSalinityclass
(ECe=ds/m)
CharacteristicsSalt
affectedareas (ha)
% ofNCA
4.1-8.0 Slightly saline with somemoderately saline 587 3.0
8.1-12.0 Moderately saline with somestrongly saline 82 0.4
12.1-15.0 Strongly saline with verystrongly saline 19,161 96.6
Total 19,830 100 Source: CEGIS estimation from SRDI
116
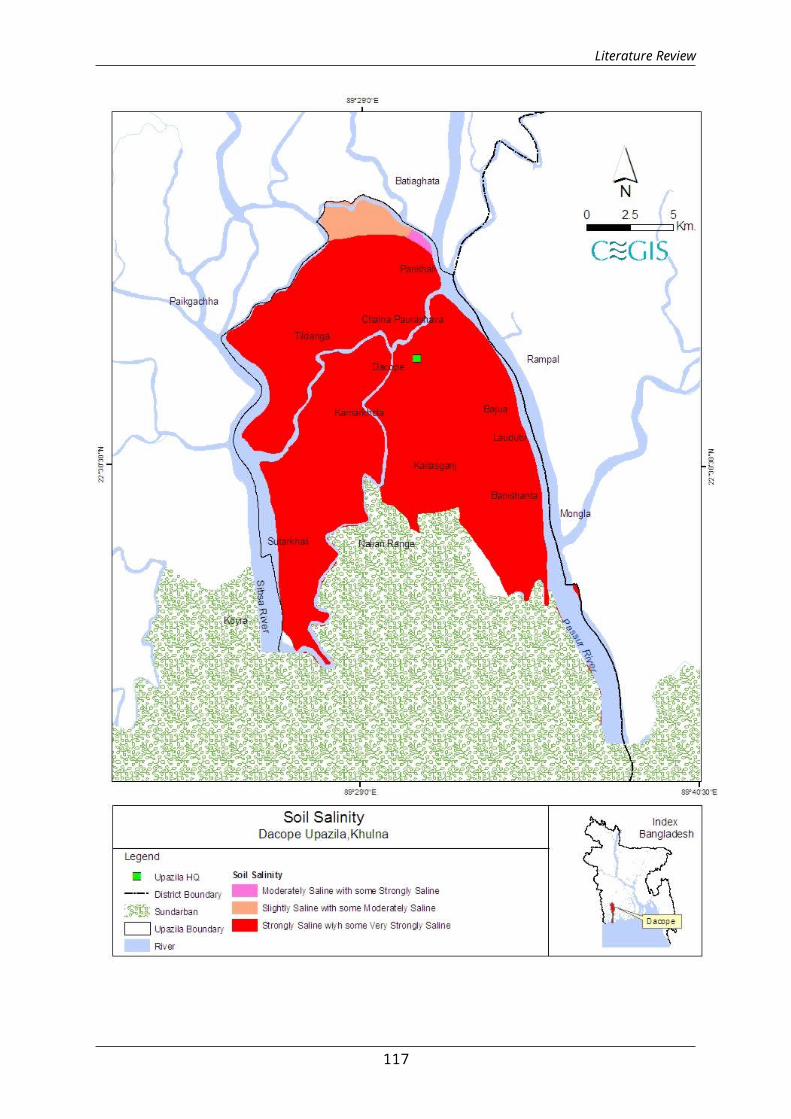
Literature Review
117
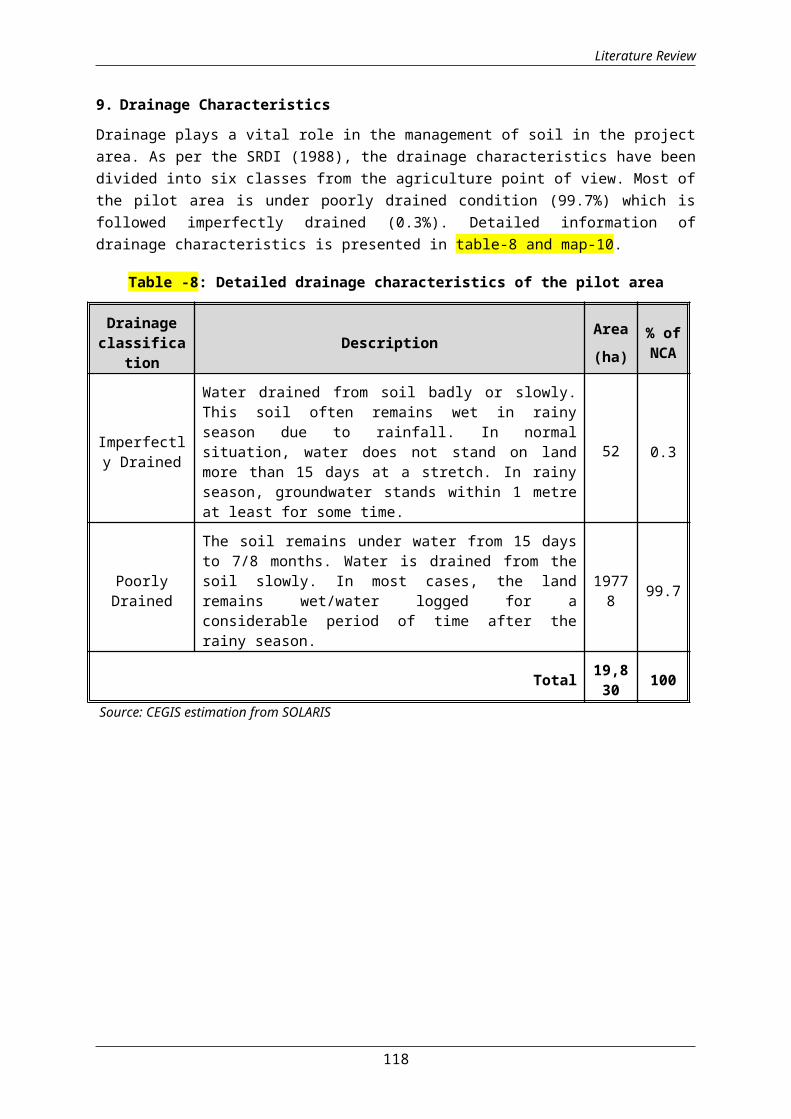
Literature Review
9. Drainage Characteristics
Drainage plays a vital role in the management of soil in the projectarea. As per the SRDI (1988), the drainage characteristics have beendivided into six classes from the agriculture point of view. Most ofthe pilot area is under poorly drained condition (99.7%) which isfollowed imperfectly drained (0.3%). Detailed information ofdrainage characteristics is presented in table-8 and map-10.
Table -8: Detailed drainage characteristics of the pilot area
Drainageclassifica
tionDescription
Area(ha)
% ofNCA
Imperfectly Drained
Water drained from soil badly or slowly.This soil often remains wet in rainyseason due to rainfall. In normalsituation, water does not stand on landmore than 15 days at a stretch. In rainyseason, groundwater stands within 1 metreat least for some time.
52 0.3
PoorlyDrained
The soil remains under water from 15 daysto 7/8 months. Water is drained from thesoil slowly. In most cases, the landremains wet/water logged for aconsiderable period of time after therainy season.
19778 99.7
Total 19,830 100
Source: CEGIS estimation from SOLARIS
118
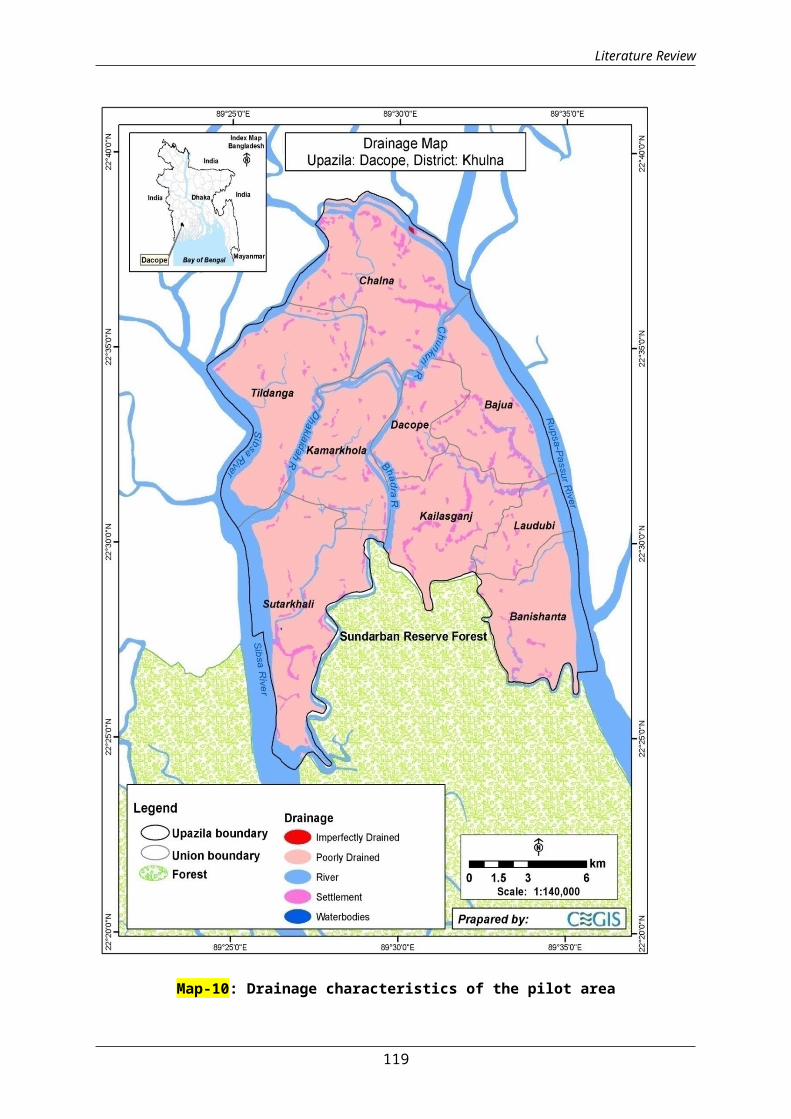
Literature Review
Map-10: Drainage characteristics of the pilot area
119

Literature Review
10. Constraints of crop production
The main constraint of the pilot area is soil and water salinity.Tidal surge also causes for crop damage. Natural calamities such ashailstorm, fog, cold wave and drought etc. are also affecting normalcrop production to some extent.
11. Present cropping patterns
There are 109 villages in Dacope Upazila. Within the villagesDepartment of Agricultural Extension (DAE) has 11 Agriculture Blocks(AB) where farmers are growing different crops in the field, butthey can’t do the same patterns due to salinity and tidal surgeproblem. For that reason sometimes they are losing full or partialyield of all crops.
Dominant cropping pattern is Fallow-T.aman-Fallow which is practicedin 84.04% of the NCA. Next cropping pattern is Fallow-T.aman-Watermelon which is practiced in 7.69% of the NCA. Single, double andtriple cropped area is 84.20%, 12.02% and 3.78% respectively.Cropping intensity of the pilot area is about 120%. Detailedexisting cropping patterns with area of coverage are presented intable-.
Table-9: Existing cropping patterns with area in the pilot area
Sl. No. Cropping Patterns Area(ha) % of NCA
Kharif-I Kharif-II Rabi1 Fallow T.Aman Boro 25 0.132 Fallow Fallow Boro 30 0.153 Aus T. Aman Water
melon600 3.03
4 Fallow T. Aman Watermelon
1,525 7.69
5 Aus T. Aman Fallow 100 0.506 Fallow T. Aman Sesame 16 0.087 Fallow T. Aman Mung bean 18 0.098 Vegetables Fallow Potato 100 0.509 Vegetables Vegetables Potato 30 0.1510 Vegetables Vegetables Spices 50 0.2511 Vegetables Fallow Vegetables 175 0.88
120

Literature Review
12 Vegetables Vegetables Vegetables 75 0.3813 Fallow T. Aman Vegetables 350 1.7714 Aus T. Aman Vegetables 70 0.3515 Fallow T. Aman Fallow 16,666 84.04
Total 19,830 100.00Source: UAO, Dacope upaziula, 2013
Picture 1: Borotransplanting in the pilot area
Picture 2: Localvegetables seed used
12. Input Use in pilot area
Inputs used for growing agricultural crops include seed, fertilizers(including manure), pesticides and labor. Major crops grown with thelevel of these inputs in Dacope pilot upazila is presented intable ?
121
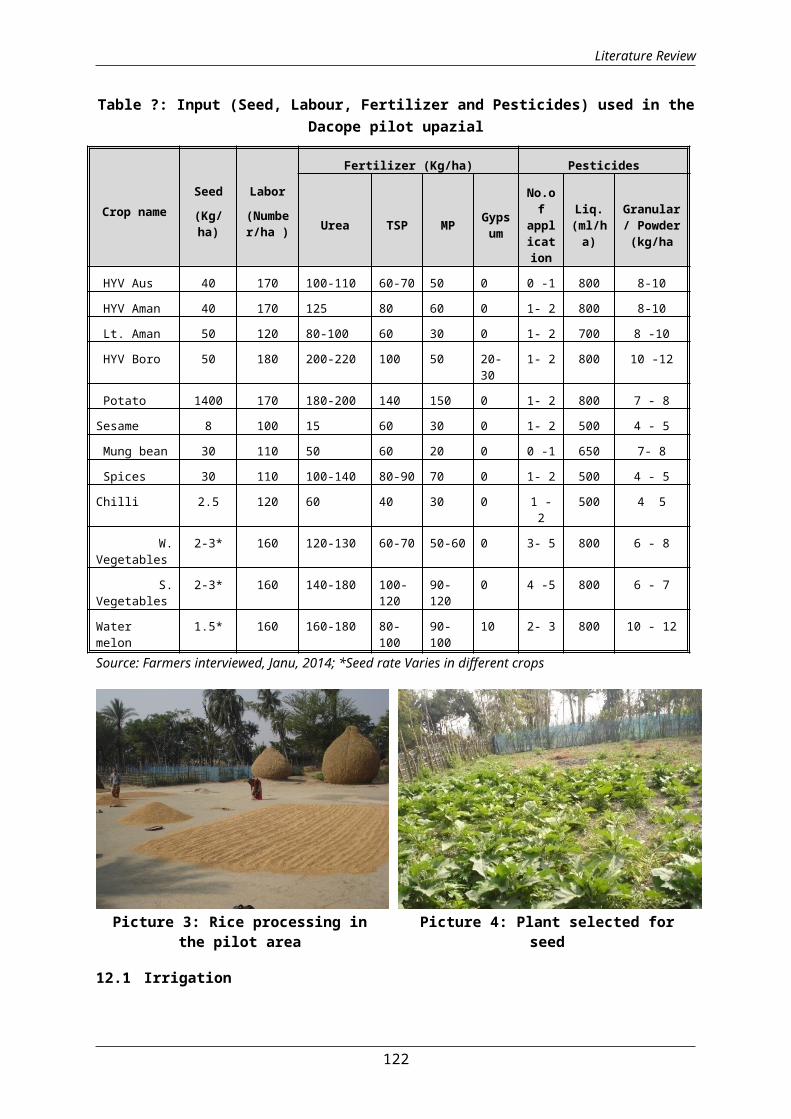
Literature Review
Table ?: Input (Seed, Labour, Fertilizer and Pesticides) used in theDacope pilot upazial
Crop nameSeed
(Kg/ha)
Labor
(Number/ha )
Fertilizer (Kg/ha) Pesticides
Urea TSP MP Gypsum
No.of
application
Liq.(ml/ha)
Granular/ Powder(kg/ha
HYV Aus 40 170 100-110 60-70 50 0 0 -1 800 8-10
HYV Aman 40 170 125 80 60 0 1- 2 800 8-10
Lt. Aman 50 120 80-100 60 30 0 1- 2 700 8 -10
HYV Boro 50 180 200-220 100 50 20-30
1- 2 800 10 -12
Potato 1400 170 180-200 140 150 0 1- 2 800 7 - 8
Sesame 8 100 15 60 30 0 1- 2 500 4 - 5
Mung bean 30 110 50 60 20 0 0 -1 650 7- 8
Spices 30 110 100-140 80-90 70 0 1- 2 500 4 - 5
Chilli 2.5 120 60 40 30 0 1 -2
500 4 5
W.Vegetables
2-3* 160 120-130 60-70 50-60 0 3- 5 800 6 - 8
S.Vegetables
2-3* 160 140-180 100-120
90-120
0 4 -5 800 6 - 7
Watermelon
1.5* 160 160-180 80-100
90-100
10 2- 3 800 10 - 12
Source: Farmers interviewed, Janu, 2014; *Seed rate Varies in different crops
Picture 3: Rice processing inthe pilot area
Picture 4: Plant selected forseed
12.1 Irrigation
122
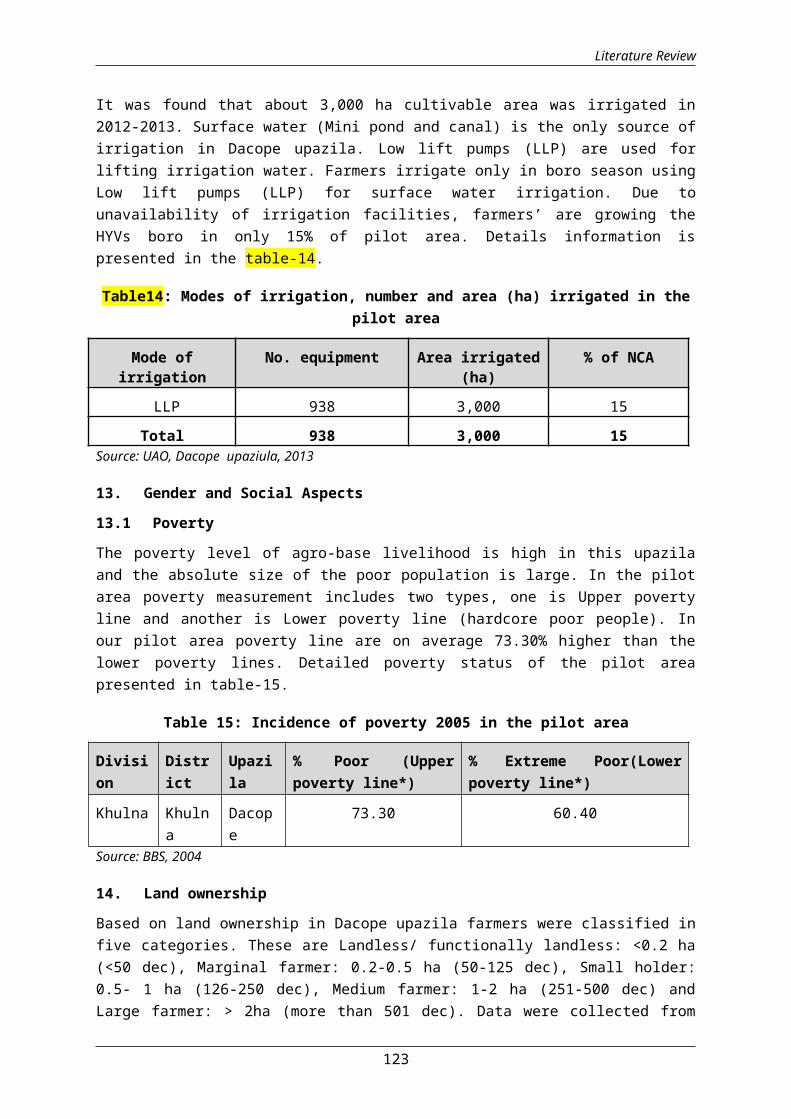
Literature Review
It was found that about 3,000 ha cultivable area was irrigated in2012-2013. Surface water (Mini pond and canal) is the only source ofirrigation in Dacope upazila. Low lift pumps (LLP) are used forlifting irrigation water. Farmers irrigate only in boro season usingLow lift pumps (LLP) for surface water irrigation. Due tounavailability of irrigation facilities, farmers’ are growing theHYVs boro in only 15% of pilot area. Details information ispresented in the table-14.
Table14: Modes of irrigation, number and area (ha) irrigated in thepilot area
Mode ofirrigation
No. equipment Area irrigated(ha)
% of NCA
LLP 938 3,000 15Total 938 3,000 15
Source: UAO, Dacope upaziula, 2013
13. Gender and Social Aspects
13.1 Poverty
The poverty level of agro-base livelihood is high in this upazilaand the absolute size of the poor population is large. In the pilotarea poverty measurement includes two types, one is Upper povertyline and another is Lower poverty line (hardcore poor people). Inour pilot area poverty line are on average 73.30% higher than thelower poverty lines. Detailed poverty status of the pilot areapresented in table-15.
Table 15: Incidence of poverty 2005 in the pilot area
Division
District
Upazila
% Poor (Upperpoverty line*)
% Extreme Poor(Lowerpoverty line*)
Khulna Khulna
Dacope
73.30 60.40
Source: BBS, 2004
14. Land ownership
Based on land ownership in Dacope upazila farmers were classified infive categories. These are Landless/ functionally landless: <0.2 ha(<50 dec), Marginal farmer: 0.2-0.5 ha (50-125 dec), Small holder:0.5- 1 ha (126-250 dec), Medium farmer: 1-2 ha (251-500 dec) andLarge farmer: > 2ha (more than 501 dec). Data were collected from
123

Literature Review
UAO, DAE of Dacope which has relevance with FAO, BARC and BBS.According to the table-14 marginal farmers (28%) are dominant whichis followed by large farmers in the pilot area. Category wisefarmers’ data is presented in table-16.
Table-16: Farmers by land ownership
Landlessfarmers
MarginalfarmersSmall farmers Medium farmers Large
farmersTotal
6,109 8,902 8,043 5,808 2,294 31,156Source: UAO, Dacope upaziula, 2013
14.1 Agriculture labour wage rateFrom the open discussion with different categories of farmers in thefield that normal agriculture labor wage rate is tk 300 per male perday in peak period (rice transplanting and harvesting) and tk. 275per male per day in the lean period. It is also varies from male tofemale. The rate for per female per day is tk. 200 in peak andtk.175 in lean period. Wage rate by different units in Dacope ispresented in table-17.
Table-17: Wage rate by different units in Dacope
Labour wage Agriculture Labourtypes
Wage rate (Taka)Village Upazila
Average agri.day labor wagein peak period
Male 300 350Female 200 250
Average agri.day labor wagein lean period.
Male 275 375Female 175 250
Source: RRA, Dacope
14.2 Agricultural and non-agricultural occupational status Data were collected from BBS and UAO of DAE, Dacope. It was analyzedand presented in table-18. Maximum HHs in this upazilas is engagedon agricultural activities. For this reasons farm household’s rateis higher than other upazilas.
Table-18: Agricultural and non-agricultural occupational status
Upazila Total
HHs
HHs entirely depending onagricultural productionfor income (farm)
(%)
HHs entirelydepending onnon- farmoccupation (nonfarm)
(%)
124

Literature Review
Dacope
36,597 23,788 65 12,809 35
Source: UAO, Dacope upaziula, 2013 and BBS, 2011
14.3 Population engaged in different activities
In Khulna District, Dacope is dominant in agriculture speciallyfruits. Agriculture sector is first priority and land preparation ismainly done by power tiller. Aman rice is covering more area thanboro rice crop, because in boro there is no scope for irrigation dueto salinity. The socio-economic condition of the livelihood systemdepends mainly on the agriculture production. Rural farmer in thepilot area is more dependent in agriculture sector. Most of thepeoples (male and female) are working in different crops andhorticulture crops field to contribute in this sector to meet up thebasic economic need for their livelihood. Detailed of the populationengaged in agriculture (7+years) activities is presented in table-19.
Table-19: Population engaged in agriculture activities (7+ years)activities
Upazila Total populationField ofActivity(7+years)
AgricultureBoth Male Female Male Female
Dacope 157,48983,193 74296 7085 365
Source: BBS, 2011
14.4 Literacy and Education14.4.1 Literacy: Literacy percentage in the pilot area is notsatisfactory. Male and female literacy percentages are presented intable-20.
Table 20: Literacy rate in the pilot area
Upazila Literacy (can write a latter) Literacy rate(%)
Both Male Female Both
Male
FemaleYes No Yes No Yes No
Dacope 75,656
59,440
42,545
25,049
33,111
34,391
56.0
62.9 49.1
Source: BBS, 2011
125

Literature Review
14.4.2 Education: All the data were collected from BBS and analyzedaccording to age, to know the status of different aged of child’sare going/not going school. Present status of education in differentaged is presented in table-21.
Table-21: Educational status in Dacope
Upazila
Population aged 3-5years
Population aged 6-10years
Population aged 11-14years
Attendingschool
Notattendingschool
Attendingschool
Notattendingschool
Attendingschool
Notattendingschool
Male Female
Male
Female Male Femal
eMale
Female
Male
Female
Male
Female
Dacope 579 616
3556 3393 6496 6384
1368 1228
5568 5443
1128 705
Source: BBS, 2011
14.5 Housing and sanitationAll the data were collected from BBS and analyzed. Most of thehouses are kutcha (87.6%) which is followed by pucca (2.9%) in thepilot area. In case of sanitary condition, 13.7% has no sanitarytoilet facilities. Details housing and sanitary status are presentedin table-22.
Table-22: Housing and sanitary status of dacope
Upazila
Numberof
Households
Type of Structure (%) Toilet Facility (%)
Pucka
Semi-
pucka
Kutcha
Jhupri
Sanitary
(water-
sealed)
Sanitary(nonwater-sealed
)
Non-sanitary
None
Dacope 36,597 2.9 5.7 87.6 3.8 45.0 22.3 18.913.7
Source: BBS 2011
15 Government and Non-Government Organizations15.1 Government organizationsThree categories-local or regional, national and international NGO’sare working in the pilot area. There are various Government and non-Government organizations working in the upazila as well. Govt.organizational setups work in District to union level. In additionto that non-Govt. organizations are also working in the pilot areawhich is presented in the table-23.
126
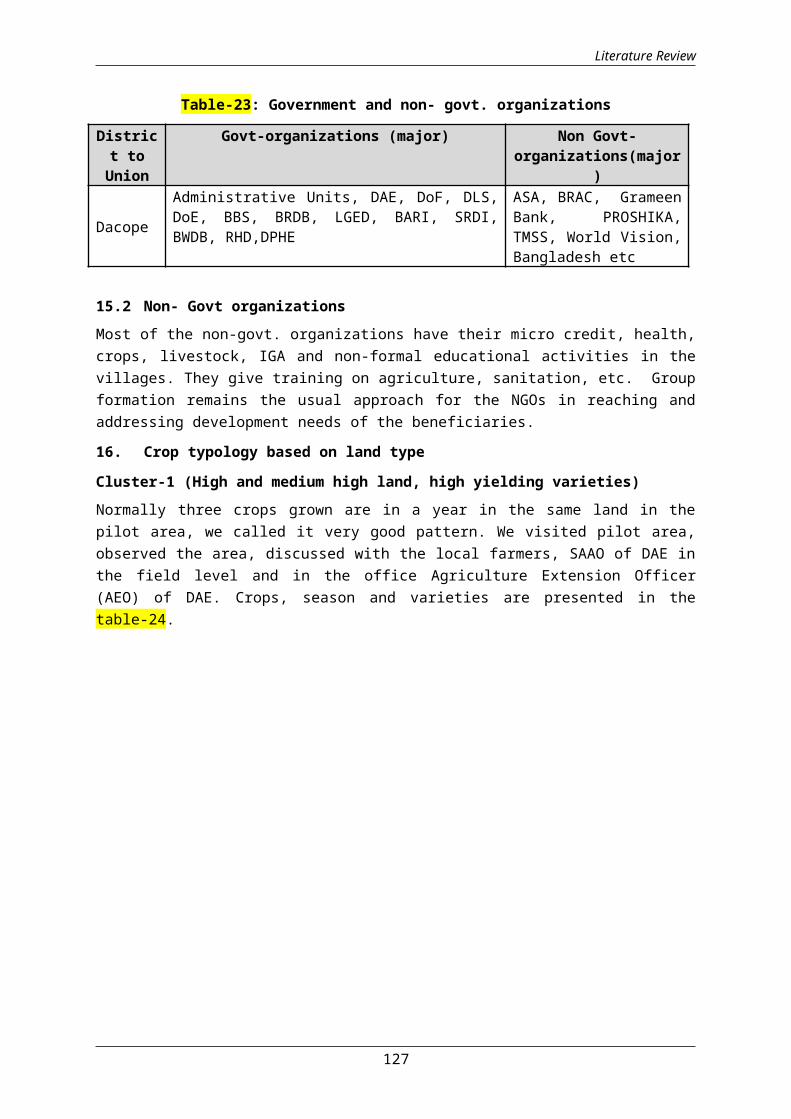
Literature Review
Table-23: Government and non- govt. organizations
District toUnion
Govt-organizations (major) Non Govt-organizations(major
)
Dacope
Administrative Units, DAE, DoF, DLS,DoE, BBS, BRDB, LGED, BARI, SRDI,BWDB, RHD,DPHE
ASA, BRAC, GrameenBank, PROSHIKA,TMSS, World Vision,Bangladesh etc
15.2 Non- Govt organizationsMost of the non-govt. organizations have their micro credit, health,crops, livestock, IGA and non-formal educational activities in thevillages. They give training on agriculture, sanitation, etc. Groupformation remains the usual approach for the NGOs in reaching andaddressing development needs of the beneficiaries.
16. Crop typology based on land type
Cluster-1 (High and medium high land, high yielding varieties)Normally three crops grown are in a year in the same land in thepilot area, we called it very good pattern. We visited pilot area,observed the area, discussed with the local farmers, SAAO of DAE inthe field level and in the office Agriculture Extension Officer(AEO) of DAE. Crops, season and varieties are presented in thetable-24.
127

Literature Review
Table 24: Crops grown in the pilot area
AEZno.
13
Crop Season Varieties
Aus Kharif-I BR-26, BRRI Dhan-27Aman Kharif-II BR-11, BR-23, BRRI Dhan-39, BRRI
Dhan-40, BRRI Dhan-41,BBRI-49 ,BINA-7Boro Rabi/Boro BRRI Dhan-28, BRRI Dhan-29, BINA-8Vegetables
Kharif-Iand Rabi
Indian spinach: BARI Pui shak-1, Lalshak: BARI Lal shak-1, Palong shak-Kapi palong, Cauli flower-BARIphulkapi-1, Snow white, Cabbage-KKcross-1,Brinjal, BARI Begun-1,BARIBegun-2,Ladies finger-Bangkim, BARIDherosh-1,Bean-BARI Sheem-1,BARISheem-2,Potato-BARIAlu-1,BARI Alu-11
Sesame Rabi BARI Til-T6,BARI-2,BARI-3Pulses Kharif-2 BARI Mung:BARI-5Spices Round the
yearBARI Peaj-2,BARI Peaj-3,BAURashun-1,Turmeric-Dimla, Chilli-Localimproved variety, Zinger-Localimproved variety
Watermelon
Rabi Glory, World queen, Big family
Example- 1: Farmers grow more Aman crops in the pilot area than Borocrops due to scarcity of fresh water during dry season. Availabilityof water source in the pilot area can be created through waterreservoir to store rain water or re-excavation of khals. It ispossible to accommodate one or two crops. Farmers will be benefitedif they become aware about growing period of crops and use ofrecommended fertilizer in time. It is also assumed that farmers willuse extra seed, labor, fertilizer and pesticide. Proper managementwill also be done. It is also expected that soil health and croppingintensity will increase. Detail existing and proposed croppingpattern for cluster 1 is presented in table-25.
128
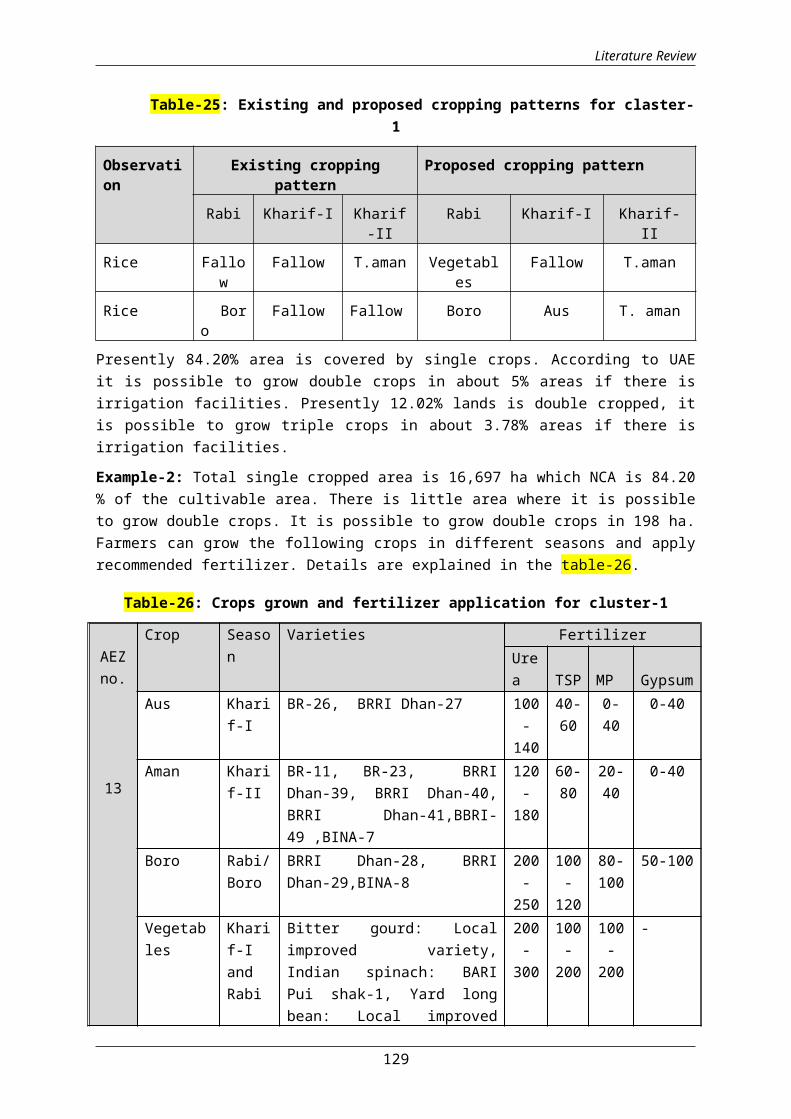
Literature Review
Table-25: Existing and proposed cropping patterns for claster-1
Observation
Existing croppingpattern
Proposed cropping pattern
Rabi Kharif-I Kharif-II
Rabi Kharif-I Kharif-II
Rice Fallow
Fallow T.aman Vegetables
Fallow T.aman
Rice Boro
Fallow Fallow Boro Aus T. aman
Presently 84.20% area is covered by single crops. According to UAEit is possible to grow double crops in about 5% areas if there isirrigation facilities. Presently 12.02% lands is double cropped, itis possible to grow triple crops in about 3.78% areas if there isirrigation facilities.
Example-2: Total single cropped area is 16,697 ha which NCA is 84.20% of the cultivable area. There is little area where it is possibleto grow double crops. It is possible to grow double crops in 198 ha.Farmers can grow the following crops in different seasons and applyrecommended fertilizer. Details are explained in the table-26.
Table-26: Crops grown and fertilizer application for cluster-1
AEZno.
13
Crop Season
Varieties FertilizerUrea TSP MP Gypsum
Aus Kharif-I
BR-26, BRRI Dhan-27 100-
140
40-60
0-40
0-40
Aman Kharif-II
BR-11, BR-23, BRRIDhan-39, BRRI Dhan-40,BRRI Dhan-41,BBRI-49 ,BINA-7
120-
180
60-80
20-40
0-40
Boro Rabi/Boro
BRRI Dhan-28, BRRIDhan-29,BINA-8
200-
250
100-
120
80-100
50-100
Vegetables
Kharif-IandRabi
Bitter gourd: Localimproved variety,Indian spinach: BARIPui shak-1, Yard longbean: Local improved
200-
300
100-
200
100-
200
-
129
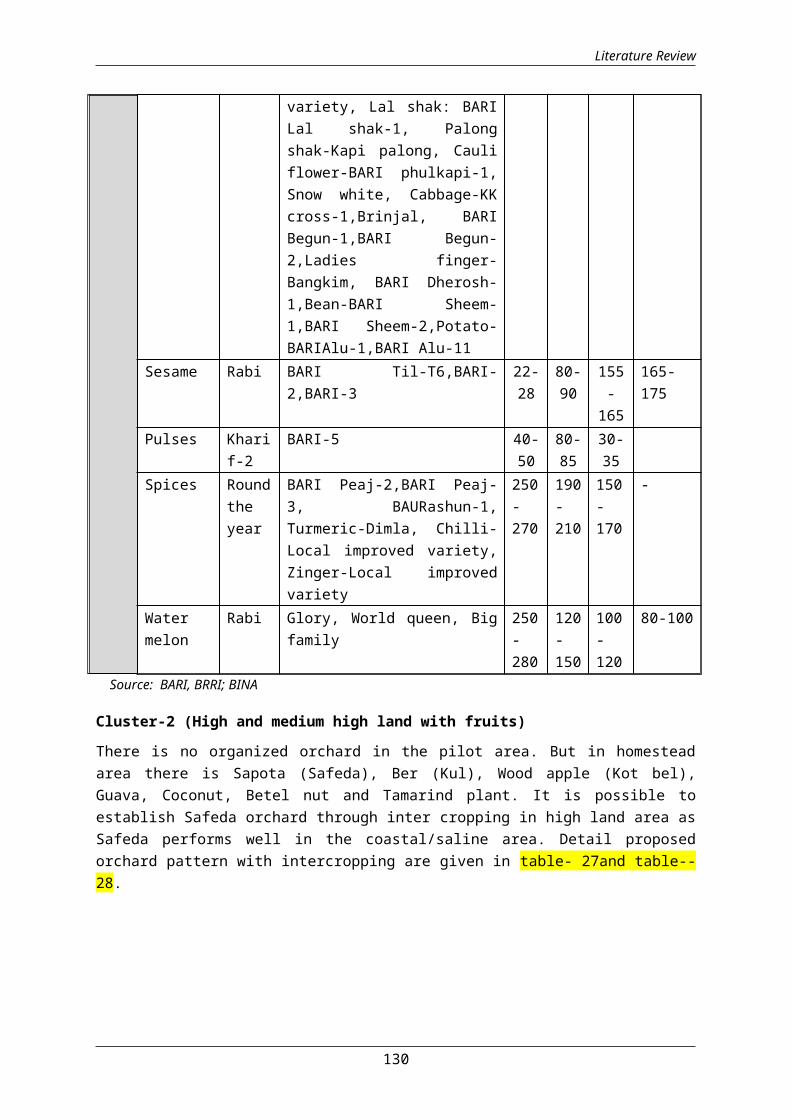
Literature Review
variety, Lal shak: BARILal shak-1, Palongshak-Kapi palong, Cauliflower-BARI phulkapi-1,Snow white, Cabbage-KKcross-1,Brinjal, BARIBegun-1,BARI Begun-2,Ladies finger-Bangkim, BARI Dherosh-1,Bean-BARI Sheem-1,BARI Sheem-2,Potato-BARIAlu-1,BARI Alu-11
Sesame Rabi BARI Til-T6,BARI-2,BARI-3
22-28
80-90
155-
165
165-175
Pulses Kharif-2
BARI-5 40-50
80-85
30-35
Spices Roundtheyear
BARI Peaj-2,BARI Peaj-3, BAURashun-1,Turmeric-Dimla, Chilli-Local improved variety,Zinger-Local improvedvariety
250-270
190-210
150-170
-
Watermelon
Rabi Glory, World queen, Bigfamily
250-280
120-150
100-120
80-100
Source: BARI, BRRI; BINA
Cluster-2 (High and medium high land with fruits)
There is no organized orchard in the pilot area. But in homesteadarea there is Sapota (Safeda), Ber (Kul), Wood apple (Kot bel),Guava, Coconut, Betel nut and Tamarind plant. It is possible toestablish Safeda orchard through inter cropping in high land area asSafeda performs well in the coastal/saline area. Detail proposedorchard pattern with intercropping are given in table- 27and table--28.
130

Literature Review
Table27: Proposed orchard for inter cropping (Pattern-I)
Landtype
PilotUpazila
Fruitcrops
Intercrops
Varietyuse
Expected yield(t/ha)
Cultivatedcost
(Tk/ha)
Totalreturn
(tk/ha)
Netreturn
(tk/ha)
1 2 3 4 5 6 7 8 (8-7)
Highlandandmedium
highland(F0 andF1)
Dacope
Safeda
BARISafeda-2
10 10,000 100,000
90,000
Turmeric
BARI-Dimla
,Sundari
2.5 17,500 25,000
7,500
Total 27,500 125000
97500
Table28: Proposed cropping pattern for inter cropping (Pattern-II)
Landtype
PilotUpazila
Fruitcrops
Inter
crops
Varietyuse
Expected yield(t/ha)
Cultivatedcost
(Tk/ha)
Totalretur
n(tk/ha)
Netretur
n(tk/ha)
1 2 3 4 5 6 7 8 (8-7)Highlandandmediumhighland(F0
andF1)
Dacope
Safeda
BARISafeda-2
10 10,000 100,000
90,000
Zinger BARI 2.5 50,000 100,0
0050,00
0
Total 60,000 200,000
140,000
131
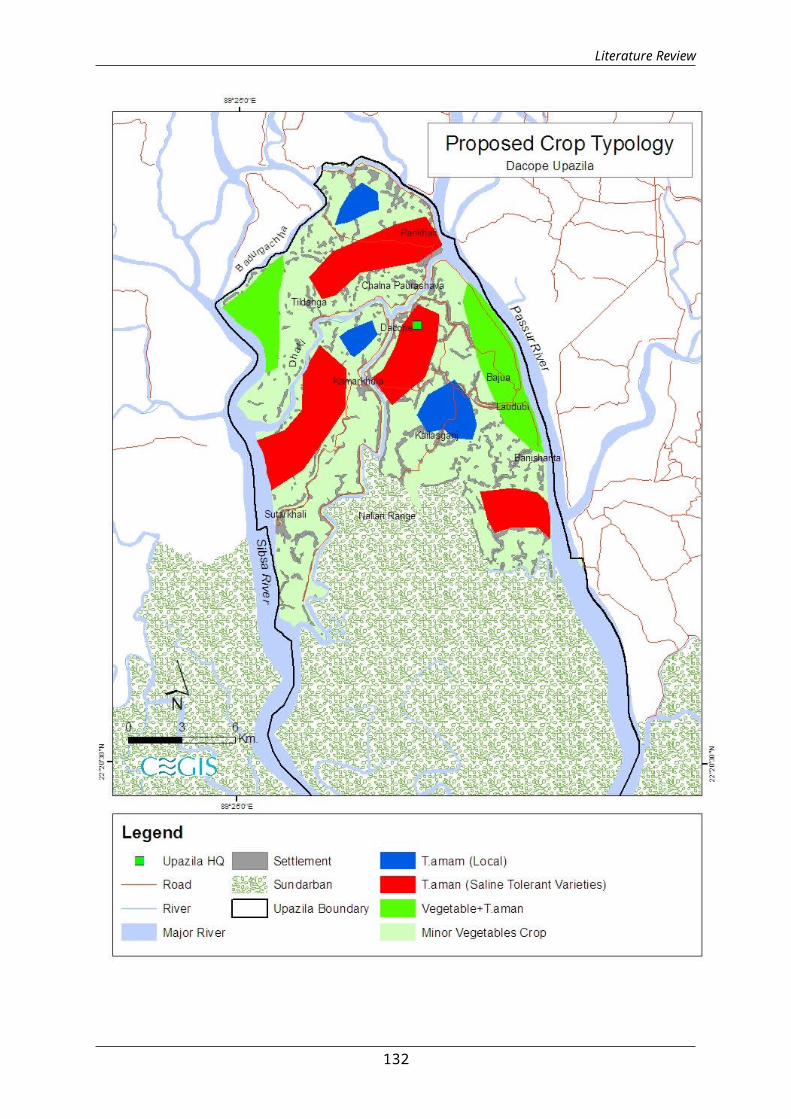
Literature Review
132

Literature Review
Cluster- 3 (High and Medium high land)
Following crops can be grown in high and medium high land.
Cereal andoilseeds cropswith differentseasons
Aus: BR-26 and BR-27
Aman: BR-11,BRRI Dhan-23, BRRI Dhan-39, BRRIDha-40, BRRI Dha-41, BINA-7,
Boro: BRRI Dhan-28, BRRI Dhan-29, BRR Dhan-47,BINA-8
Oilseeds: Sesame: BARI Til-T6, BARI-2, And BARI-3
Differentvegetables andwater meloncrops withseasons
Vegetables: Bitter gourd, Indian spinach, Yardlong bean, Lalshak, Snake gourd, Ash gourd, Bottlegourd, Sweet gourd, Sponge gourd, Spinach andAmaranthus.
Table29: Proposed cropping pattern
Cropping PatternsKharif-I Kharif-II RabiFallow Vegetables BoroFallow Vegetables PotatoAus Taman Sesame
Fallow Vegetables VegetablesCluster-4 (High and medium high land)
Following crops can be grown in different land type
Cereal, oilseedsand pulses cropswith differentseasons
Aus: BR-26 and BR-27
Aman: BR-11,BRRI Dhan-23, BRRI Dhan-39, BRRIDhan-40, BRRI Dhan-41, BINA-7,
Boro: BRRI Dhan-28, BRRI Dhan-29, BRR Dhan-47, BINA-8
Oilseeds: Sesame: BARI Til-T6, BARI-2, AndBARI-3
Pulses: BARI Mung-5
Differentvegetables andwater melon cropswith seasons
Vegetables: Bitter gourd, Indian spinach, Yardlong bean, Lalshak, Snake gourd, Ash gourd,Bottle gourd, Sweet gourd, Sponge gourd,Spinach and Amaranthus.
Water melon: Glory, World queen, Big family
133

Literature Review
Table 30: Proposed cropping pattern
Cropping PatternsKharif-I Kharif-II RabiFallow T.aman BoroAus T. Aman Water melon
Fallow T.aman PulsesVegetables Vegetables Vegetables
Cluster-5 (Rain-fed condition)
Vegetables crops: Bitter gourd, Indian spinach, Yard long bean,Lalshak, Snake gourd, Ash gourd, Bottle gourd, Sweet gourd, Spongegourd, Spinach and Amaranthus.
Rice crops:
Aus: BR-26, BR-27
Aman: BR-11, BR-23, BRRI Dhan-39, BRRI Dhan-40, BRRI Dhan-41, BINA-7
Oilseeds: Sesame: BARI Til-T6, BARI-2, and BARI-3
Table31: Proposed cropping pattern
Cropping Patterns
Kharif-I Kharif-II Rabi
Aus T. aman Sesame
Aus T. aman Fallow
Fallow Vegetables Fallow
Typology of production systems and characteristics of irrigators
Irrigation: DAE has eleven ABs of them it is possible only growcrops in five ABs, because of irrigation problems. In the pilot areafarmers are growing few vegetables and DAE is trying to implementdifferent agricultural projects (demonstrations) where irrigation isdone by LLP only, because there are no STW and DTW. Surface water(Mini pond and canal) is the only source of irrigation in the pilotarea. A project is running i.e DCRMA under CDMP they are harvestingrain water preserving in mini ponds and using for irrigation purposein HYV Boro rice by LLP. Farmers may more aware on rain waterharvest and use for irrigation purpose through local DAE.
Salinity management: Salinity is a big problem in the pilot area. In2000 and 2010, SRDI Soil prepared a map on pilot upazila and showedabout 96.6% area is strongly saline with very strongly saline which
134
Literature Review
is followed by slightly saline with some moderately saline (3%).Strongly saline with very strongly saline is in robi crop growseason. In the wet season farmers can make nine inches to one feetdeep drain two meter distance each then salinity may reduce bywashing top soil. Also farmers can grow pit crops using mulch thatwill also reduce the soil salinity. Crop rotation can also changethe salinity by growing leguminous crops.
Food SecurityIn the pilot area total population is 157,489. Total production is46,381 metric tons. If one person consumes 487 gram/day then totalrequirement is 76,697 metric tons. So, extra food needed is 30,316metric tons/ year. There are scopes to improve cropping patterns,two crops instate of one crop then food scarcity may reduce.
135

Literature Review
Pilot-2, Khagrachhari sadar upazilla, Khagrachhari1. Introduction
In Chittagonj division we selected Khagrachhari to represent hilldistrict and from Khagrachhari district we selected Khagrachharisadar upazilla as representative of hill area. There are manyopportunities to develop fruits, use of fallow land and enhancingproduction of fruit by using high yielding varieties of fruits andfield crops intensively in Khagrachhari sadar and appropriatemanagement because there is fallow medium high land and low land.
Khagrachhari zila was established in 1983. Nothing is definitelyknown about the origin of the zila name. It is said that theexisting zila headquarters is situated on the bank of the chengistream (chhara) which was full of Catkin plants means ‘Khagra’ inlocal languages. This might be the origin of the zila name asKhagrachhari. It is bounded on the north by India, on the east byRangamati zila, on the south by Chittagong and Rangamati zilas andon the west by India and Chittagong zila. It lies between 22˚38 and23˚44 north latitudes and between 91˚44 and 92˚11 east longitudes.The total area of the zila is 2,749.16 sq. km (1061.00 sq. miles) ofwhich 2242.44 sq. km is under forest. It is a hilly zila. Annualaverage temperature is maximum 34.6ºC, minimum 13ºC and rainfall3031 mm. The hills of this region are composed of folded sedimentaryrocks. Notable hill ranges Alu Tila, Bhanga Mura (416.66 m), MataiPukhiri (213.36m), Matai Lakho (274.32 m). Main Rivers are Chingri,Maini, Feni and Halda; lake Mataipukhiri (Debotar pukur). Upazilaadministrative map is shown below--
136
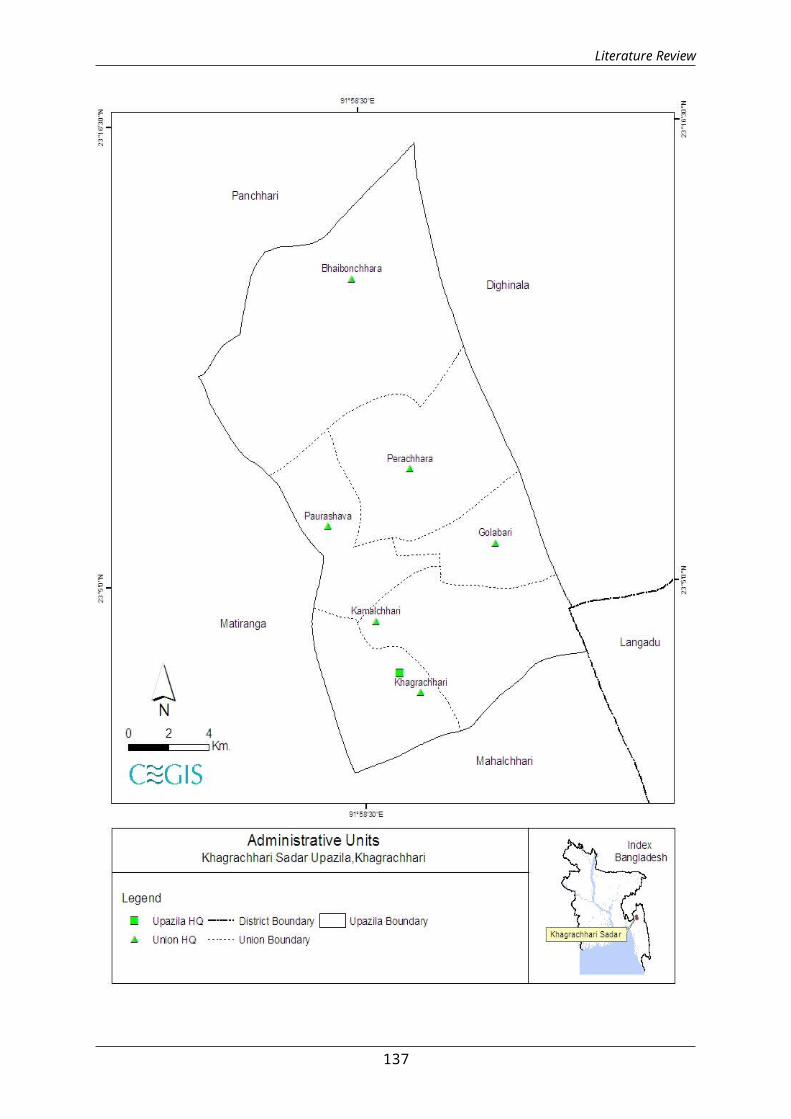
Literature Review
137

Literature Review
1.1 Geographic features of Khagrachari sadar
The upazila occupies an area of 297.91 sq. km including 277.86 sq.kmforest areas. It is located between 23°00' and 23°21' northlatitudes and between 91°55' and 92°00' east longitudes. The upazilais bounded on the north by Panchhari upazila, on the east byDighinala and Langadu upazilas of Rangamati Zila, on the south byMahalchhari upazila and on the west by Matiranga upazila.
1.2 Demographic features of Khagrachhari sadar
Data were collected from Upazila Statistical Officer of KhagrachhariSadar for 2013, and BBS, 2011. Total populations in 2011 was 111,833of which male was 58,366 and female was 53,467 whereas in 2001 totalpopulation was 92,380 where male was 50,380 and female was 42,000.The difference between ten years data is shown in the table-1.
Table-1: Population in the pilot area.
Population 2001 2011 DifferenceBoth Sex 92,380 111833 19453Male 50,380 58366 7986Female 42,000 53467 11467Source: USO, Khagrachhari Sadar 2013 and BBS, 2012
2. Meteorology2.1 Rainfall
Rainfall data of last five years (2009 to 2013), collected fromBangladesh Agriculture Research Institute (BARI) and Department ofAgricultural Extension (DAE) Khagrachhari shows significant rainfallduring the months of May to September. Only in April, 2009 rainfallwas more than other years. On the other hand, very little rainfallor no rain occurs during the period of November to March. During thelast five years, maximum rainfall was occurred in 2009 in the monthof August as shown in figure--.
138
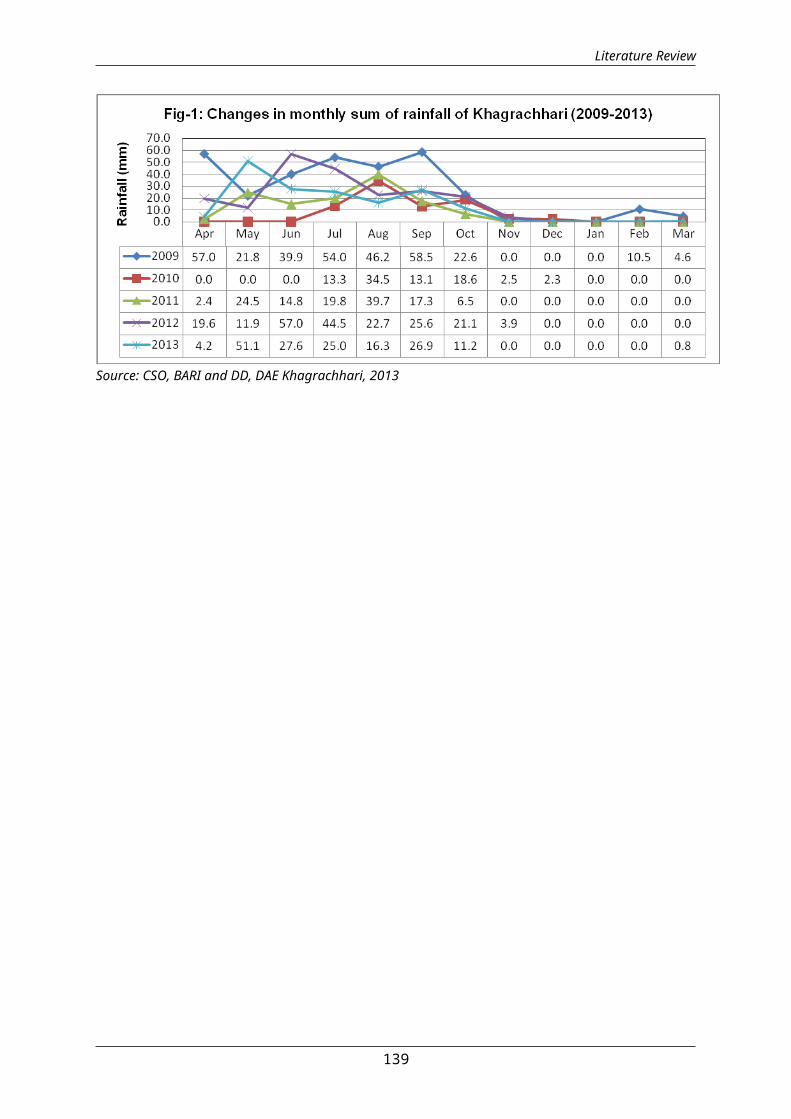
Literature Review
Source: CSO, BARI and DD, DAE Khagrachhari, 2013
139
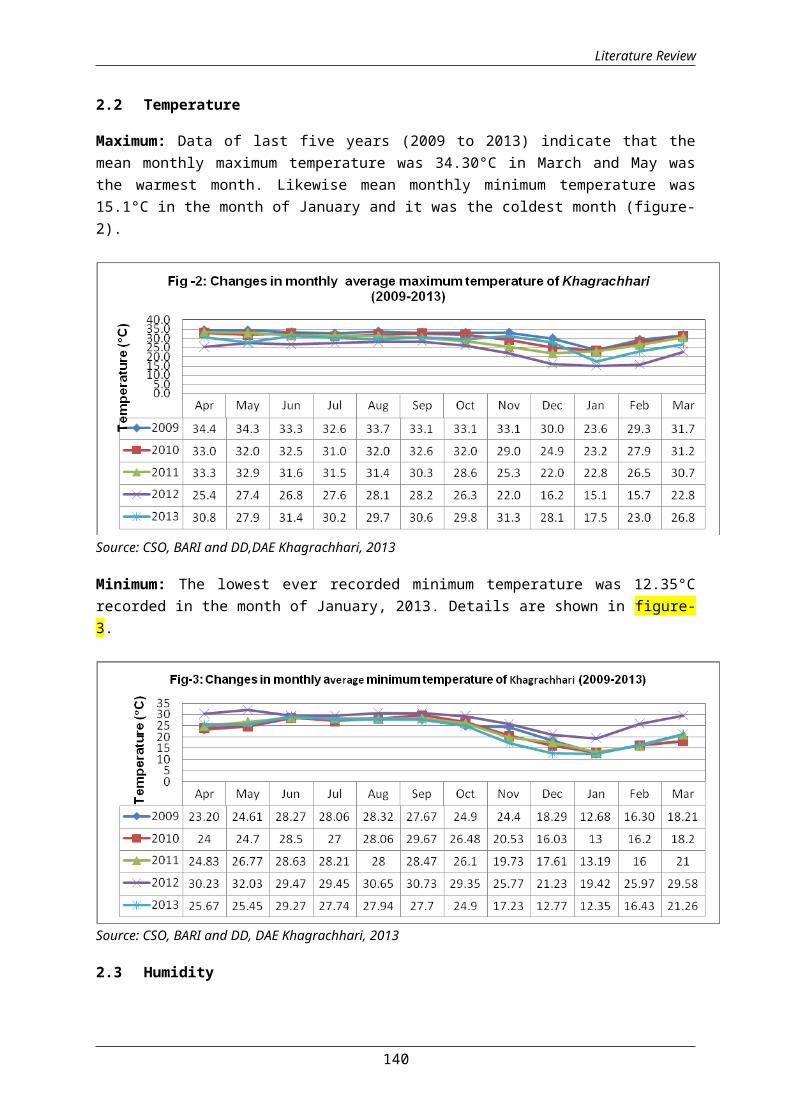
Literature Review
2.2 Temperature
Maximum: Data of last five years (2009 to 2013) indicate that themean monthly maximum temperature was 34.30°C in March and May wasthe warmest month. Likewise mean monthly minimum temperature was15.1°C in the month of January and it was the coldest month (figure-2).
Source: CSO, BARI and DD,DAE Khagrachhari, 2013
Minimum: The lowest ever recorded minimum temperature was 12.35°Crecorded in the month of January, 2013. Details are shown in figure-3.
Source: CSO, BARI and DD, DAE Khagrachhari, 2013
2.3 Humidity
140

Literature Review
The humidity data of Khagrachhari Sadar was collected from BARI andDAE Kahgrachhari (Figure-4). From the figure it is observed that inMay 2009 humidity was highest (89.1%). June, July, August,September, October and November are the maximum humid months whenaverage monthly relative humidity varies from 87.37 to 86.90%. Theminimum average humidity occurs in the period from February to Aprilwhich was in the range of 79.3 to 80.80%. The monthly averagerelative humidity of last five years (2009-2013) is shown in Figure-4
Source: CSO, BARI and DD, DAE Khagrachhari, 2013
3. Agro-Ecological Zone (AEZ)
Khagrachhari sadar upazila is within the Northern and Eastern Hills(AEZ-29) shown in map-3. Detailed description on AEZ-29 anddifferent crops grown are described in table-2.
The Northern and Eastern Hills (AEZ-29) region includes thecountry’s hill areas. Relief is complex. Hills have been dissectedto different degrees over different rocks. In general, slopes arevery steep and few low hills have flat summits. The major hill soilsare yellow-brown to strong brown, permeable, friable, loamy; verystrongly acidic and low in moisture holding capacity. However, soilpatterns generally are complex due to local differences in sand,silt and clay contents of the underlying sedimentary rocks and inthe amount of erosion that has occurred. Brown Hill soils are thepredominant General Soil Types of the area.
Table-2: Field and horticultural crops grown according to AEZs
Items Major crops Area/
141
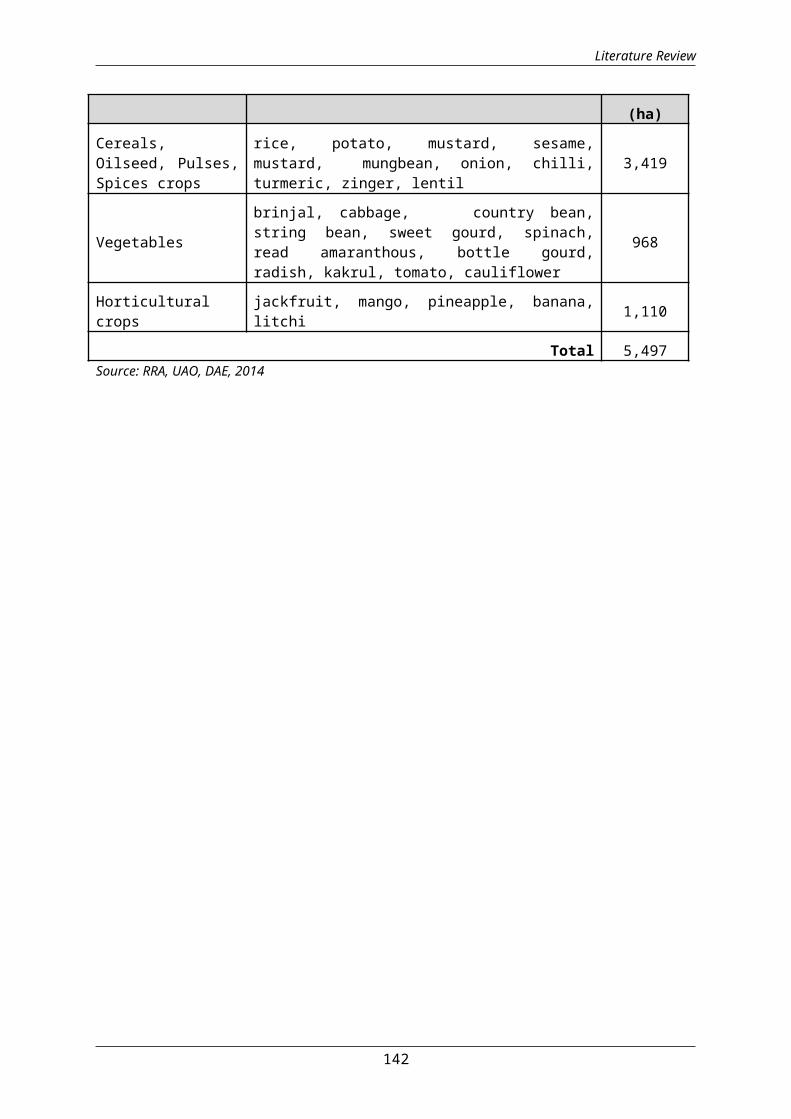
Literature Review
(ha)Cereals,Oilseed, Pulses,Spices crops
rice, potato, mustard, sesame,mustard, mungbean, onion, chilli,turmeric, zinger, lentil
3,419
Vegetables
brinjal, cabbage, country bean,string bean, sweet gourd, spinach,read amaranthous, bottle gourd,radish, kakrul, tomato, cauliflower
968
Horticulturalcrops
jackfruit, mango, pineapple, banana,litchi 1,110
Total 5,497Source: RRA, UAO, DAE, 2014
142
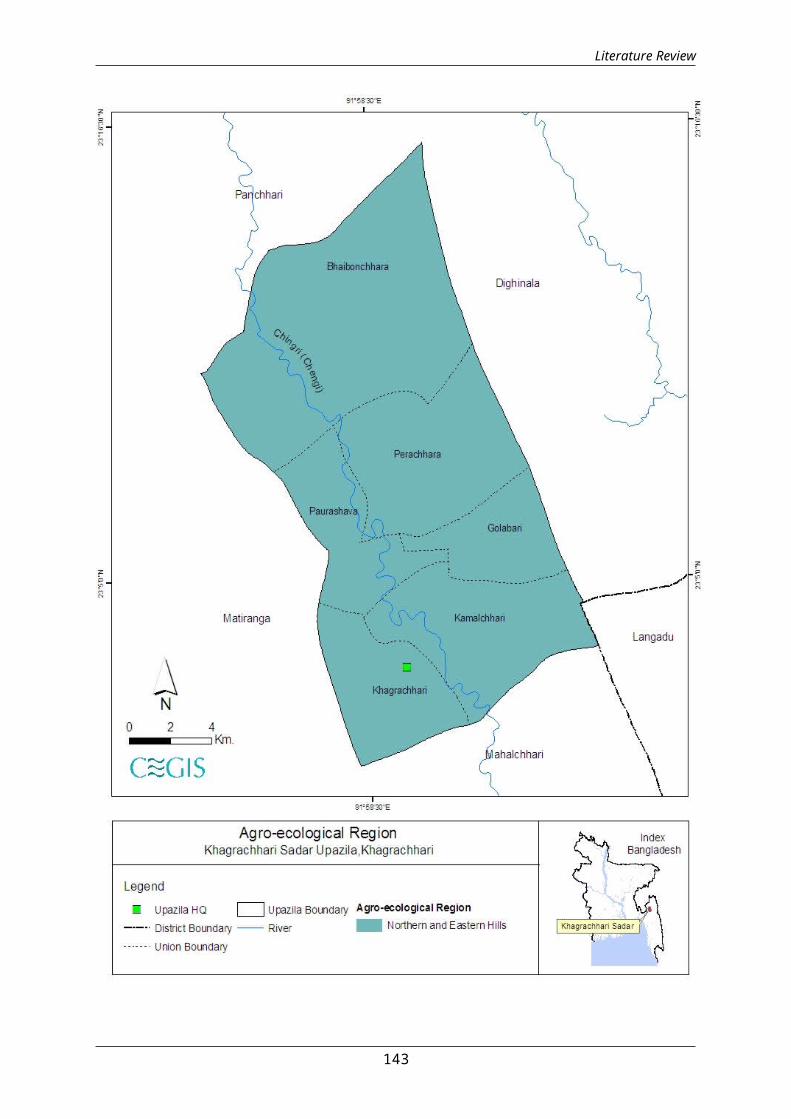
Literature Review
143
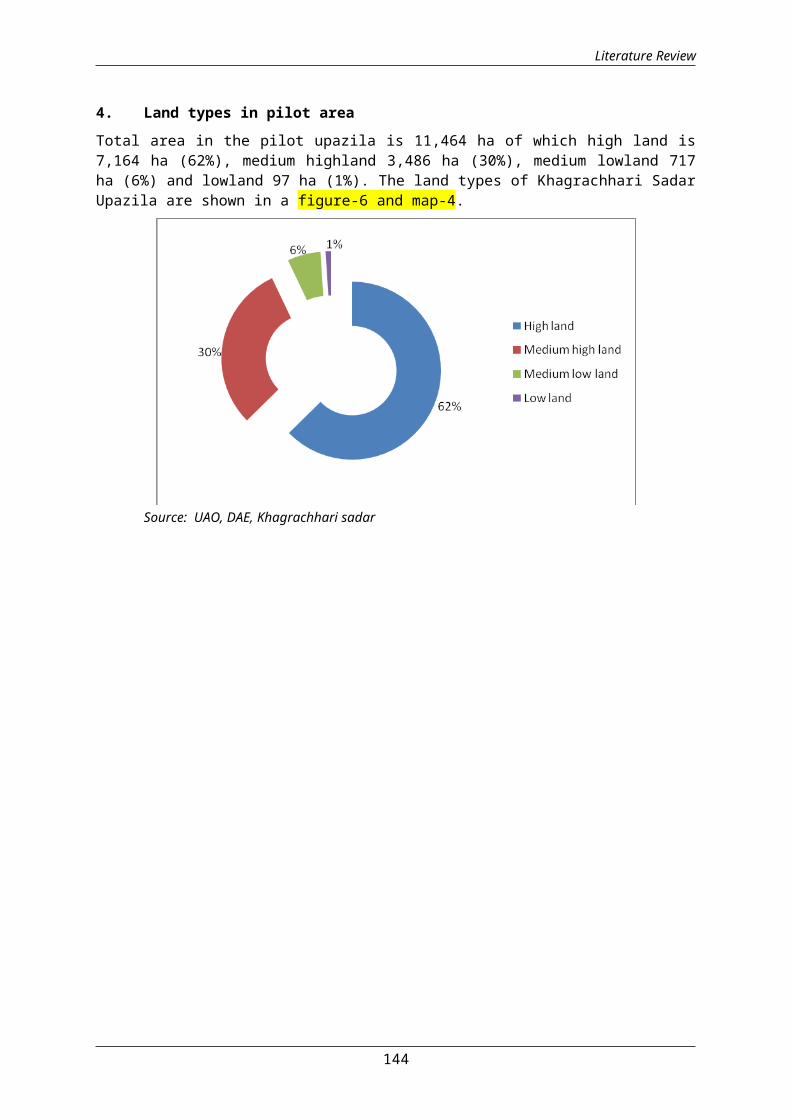
Literature Review
4. Land types in pilot area Total area in the pilot upazila is 11,464 ha of which high land is7,164 ha (62%), medium highland 3,486 ha (30%), medium lowland 717ha (6%) and lowland 97 ha (1%). The land types of Khagrachhari SadarUpazila are shown in a figure-6 and map-4.
Source: UAO, DAE, Khagrachhari sadar
144
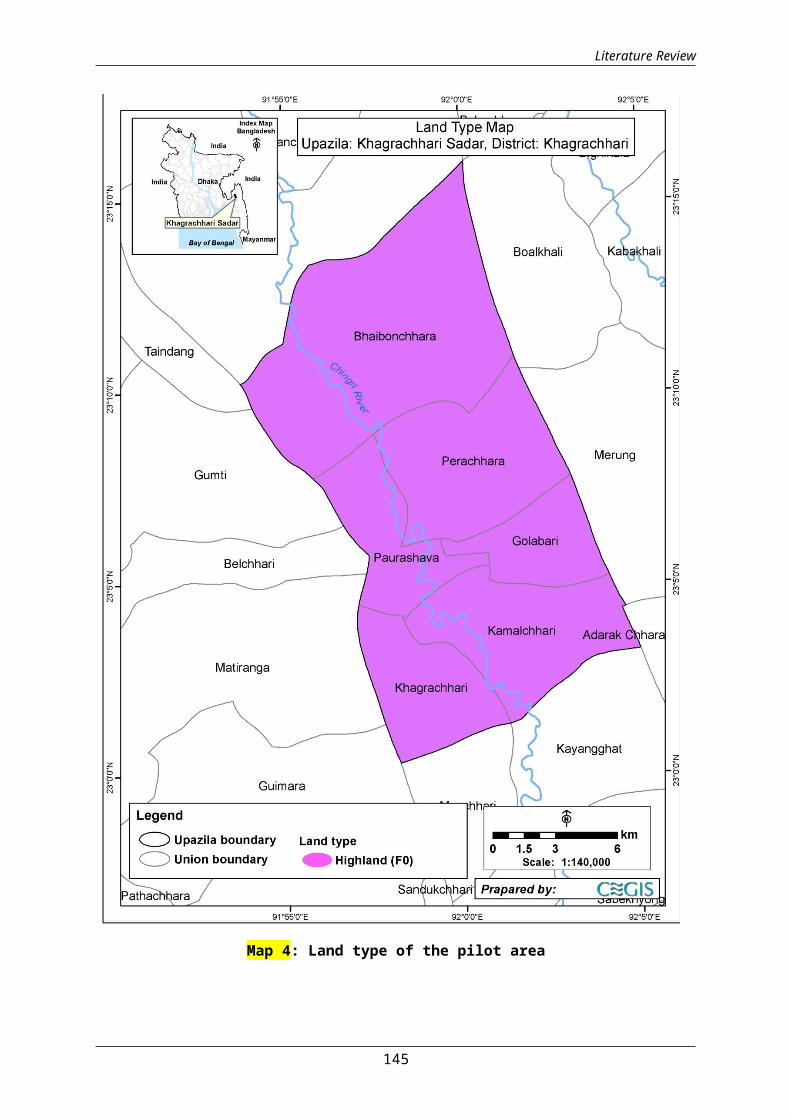
Literature Review
Map 4: Land type of the pilot area
145

Literature Review
5. Land use in the pilot area
Total pilot area is about 23,806 ha of which net cultivable land isabout 28%. Detailed distribution of land use of the pilot area ispresented in Table 3 and map-5.
Table-3: Detailed land use of the pilot area
Land use Area (ha)% ofNCA
Settlement, road, Infrastructure 2,070 8.7River, lake and chora (khal) 1,207 5.1Water bodies 111 0.5Forest 11,284 47Orchard 1,110 4.7NCA 6,778 28Fallow land 1,246 5.2Gross area 23,806 100Source: UAO, DAE, Khagrachhari Sadar
146

Literature Review
Map 5: Land use of the study area
147
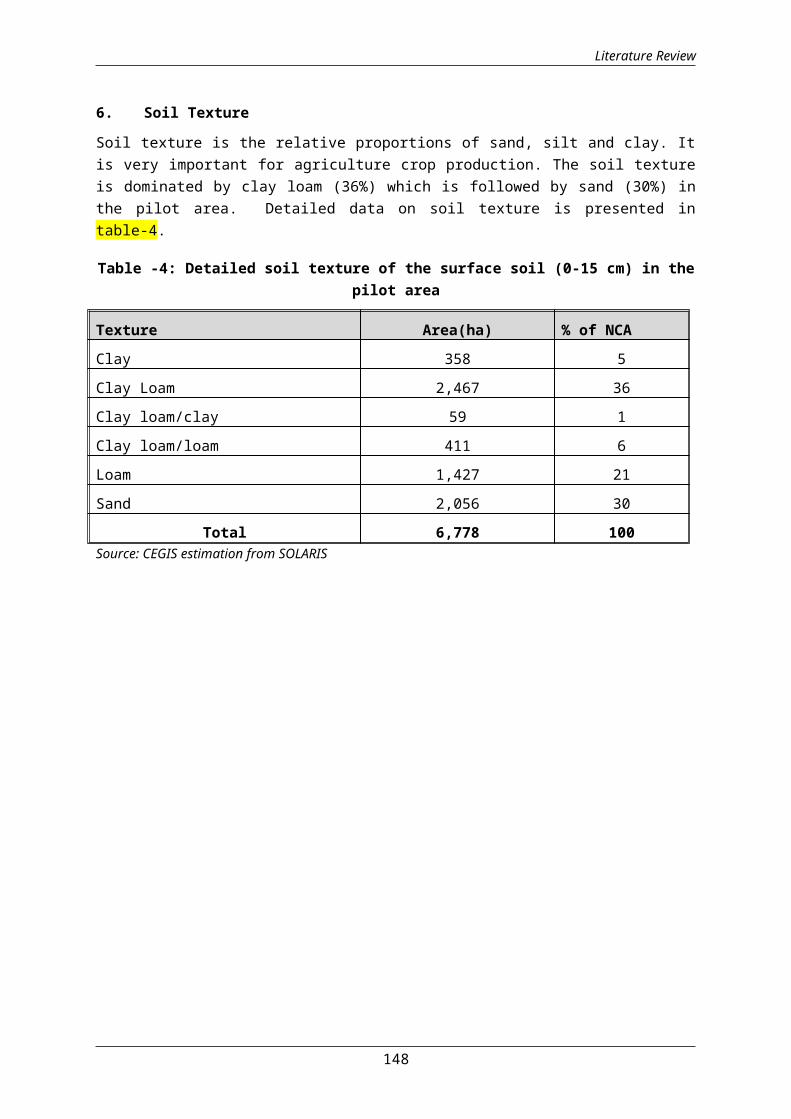
Literature Review
6. Soil Texture
Soil texture is the relative proportions of sand, silt and clay. Itis very important for agriculture crop production. The soil textureis dominated by clay loam (36%) which is followed by sand (30%) inthe pilot area. Detailed data on soil texture is presented intable-4.
Table -4: Detailed soil texture of the surface soil (0-15 cm) in thepilot area
Texture Area(ha) % of NCAClay 358 5Clay Loam 2,467 36Clay loam/clay 59 1Clay loam/loam 411 6Loam 1,427 21Sand 2,056 30
Total 6,778 100Source: CEGIS estimation from SOLARIS
148
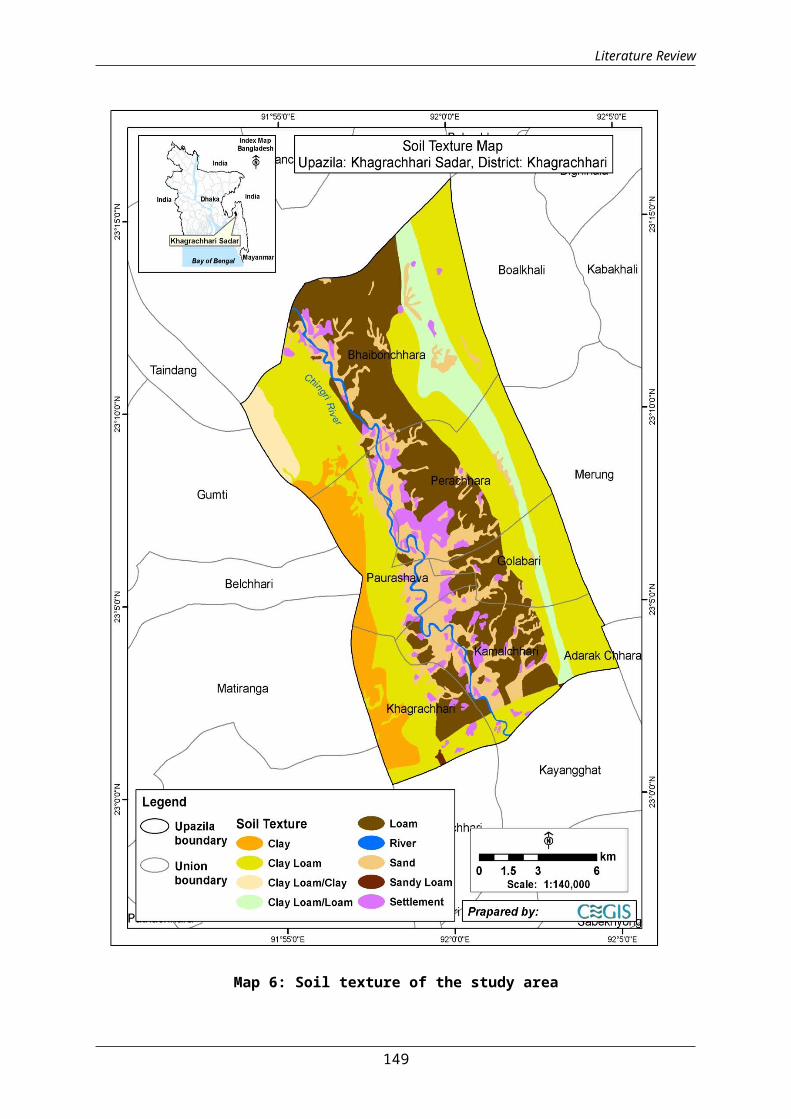
Literature Review
Map 6: Soil texture of the study area
149

Literature Review
7. Available soil moisture
According to SRDI (1988), the available soil moisture has beenclassified into four categories. The pilot area is dominated by lowlevel (96%) of available soil moisture followed by medium level (4%)of available soil moisture. Detailed distribution of available soilmoisture is presented in table-5 and map-7.
Table- 5: Detailed distribution of available soil moisture in thepilot area
Classification ofavailable soil
moistureCharacteristics Area
(ha)
%ofNCA
Low
Plant extractable soilmoisture remained in thefield level less than onemonth 6,541
96
Medium
Plant extractable soil moistureremained in field level fromone to two months 237
4
Total 6,778 100Source: CEGIS estimation from SOLARIS
150
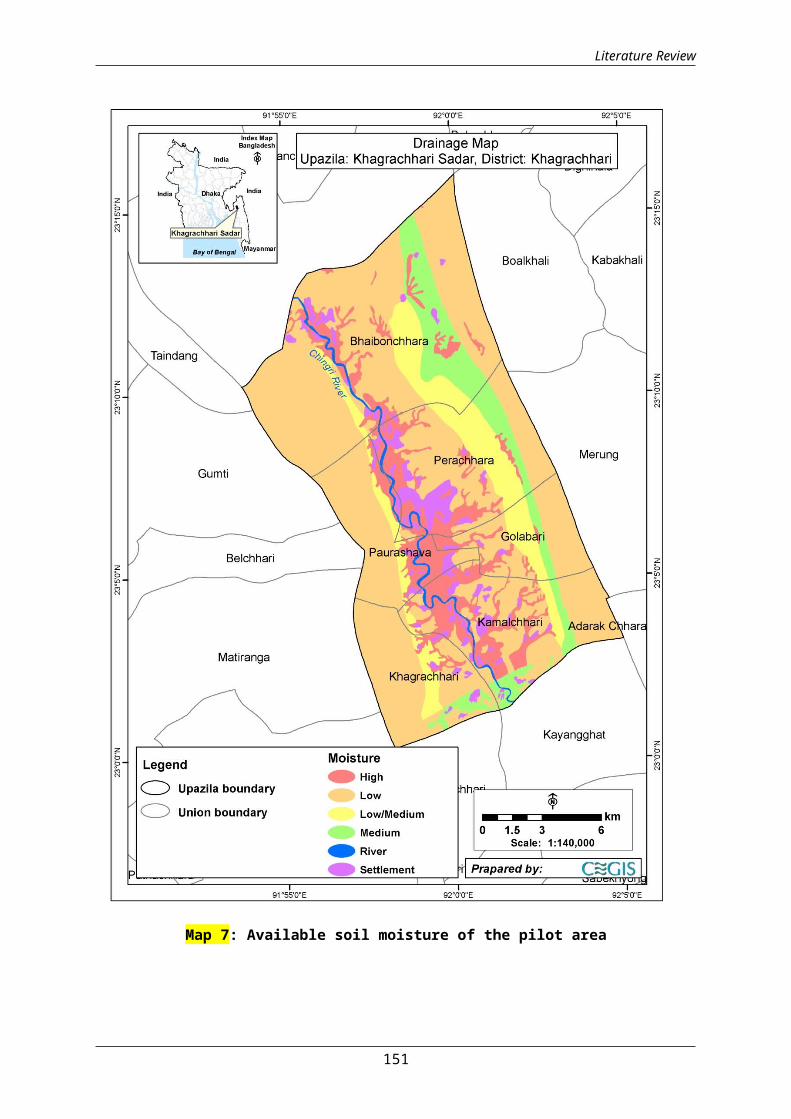
Literature Review
Map 7: Available soil moisture of the pilot area
151

Literature Review
8. Drainage Characteristics
Drainage plays a vital role in the management of soil in the projectarea. As per the SRDI (1988), the drainage characteristics have beendivided into six classes from the agriculture point of view. Most ofthe pilot area is under excessively drained condition (62%) which isfollowed by imperfectly drained (35%). Detailed information ofdrainage characteristics is presented in table-6.
Table -6: Detailed drainage characteristics of the pilot area
Drainageclassificat
ionDescription
Area(ha)
% ofNCA
Excessivelydrained
e. Water drained out rapidly from surfacesoil or soil. Water removed from soilimmediately after rainfall or applicationof irrigation water. This soil is notfavorable for field crops.
4215 62
ImperfectlyDrained
Water drained from soil badly or slowly.This soil often remains wet in rainyseason due to rainfall. In normalsituation, water does not stand on landmore than 15 days at a stretch. In rainyseason, groundwater stands within 1 metreat least for some time.
2358 35
PoorlyDrained
The soil remains under water from 15 daysto 7/8 months. Water is drained from thesoil slowly. In most cases, the landremains wet/water logged for aconsiderable period of time after therainy season.
205 3
Total 6778 100 Source: CEGIS estimation from SOLARIS
152
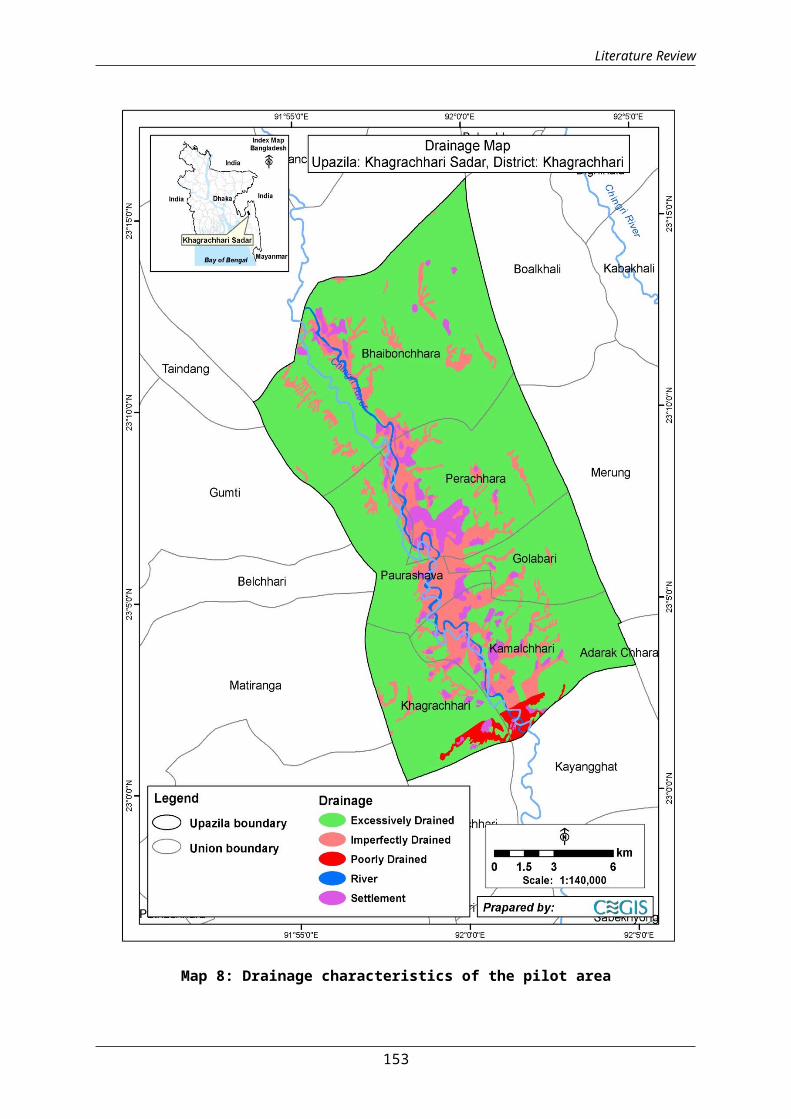
Literature Review
Map 8: Drainage characteristics of the pilot area
153
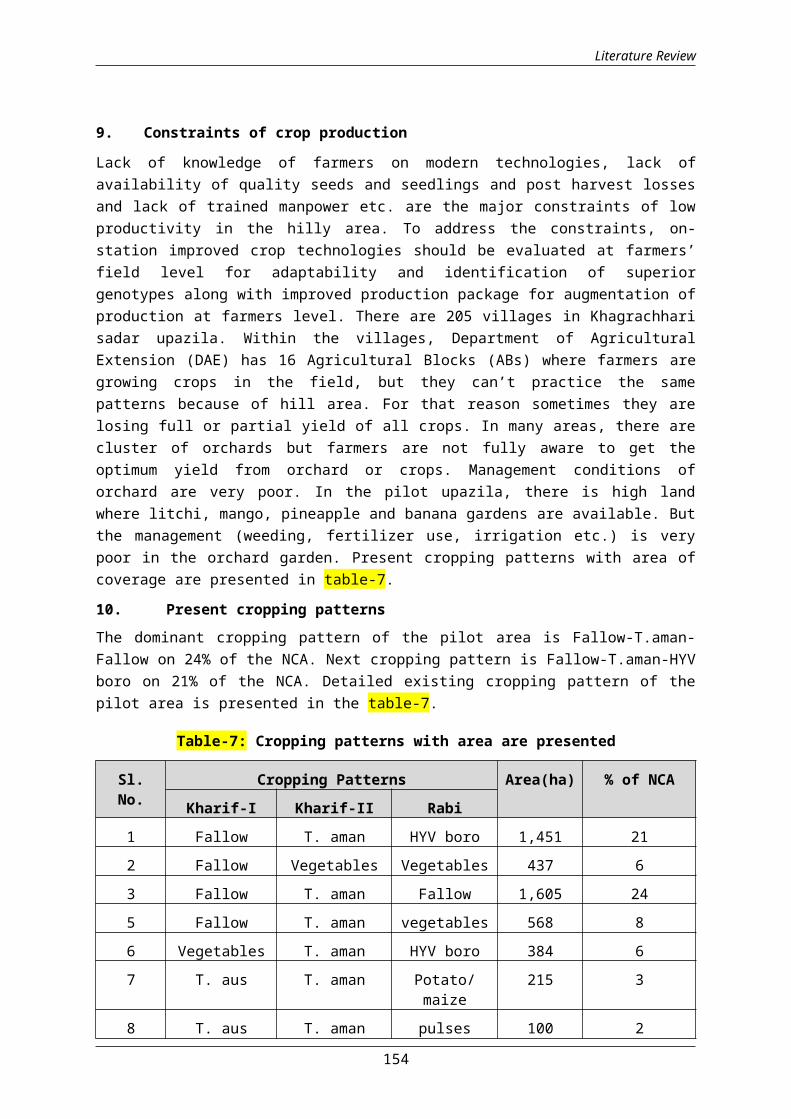
Literature Review
9. Constraints of crop production
Lack of knowledge of farmers on modern technologies, lack ofavailability of quality seeds and seedlings and post harvest lossesand lack of trained manpower etc. are the major constraints of lowproductivity in the hilly area. To address the constraints, on-station improved crop technologies should be evaluated at farmers’field level for adaptability and identification of superiorgenotypes along with improved production package for augmentation ofproduction at farmers level. There are 205 villages in Khagrachharisadar upazila. Within the villages, Department of AgriculturalExtension (DAE) has 16 Agricultural Blocks (ABs) where farmers aregrowing crops in the field, but they can’t practice the samepatterns because of hill area. For that reason sometimes they arelosing full or partial yield of all crops. In many areas, there arecluster of orchards but farmers are not fully aware to get theoptimum yield from orchard or crops. Management conditions oforchard are very poor. In the pilot upazila, there is high landwhere litchi, mango, pineapple and banana gardens are available. Butthe management (weeding, fertilizer use, irrigation etc.) is verypoor in the orchard garden. Present cropping patterns with area ofcoverage are presented in table-7.
10. Present cropping patternsThe dominant cropping pattern of the pilot area is Fallow-T.aman-Fallow on 24% of the NCA. Next cropping pattern is Fallow-T.aman-HYVboro on 21% of the NCA. Detailed existing cropping pattern of thepilot area is presented in the table-7.
Table-7: Cropping patterns with area are presented
Sl.No.
Cropping Patterns Area(ha) % of NCAKharif-I Kharif-II Rabi
1 Fallow T. aman HYV boro 1,451 212 Fallow Vegetables Vegetables 437 63 Fallow T. aman Fallow 1,605 245 Fallow T. aman vegetables 568 86 Vegetables T. aman HYV boro 384 67 T. aus T. aman Potato/
maize215 3
8 T. aus T. aman pulses 100 2
154
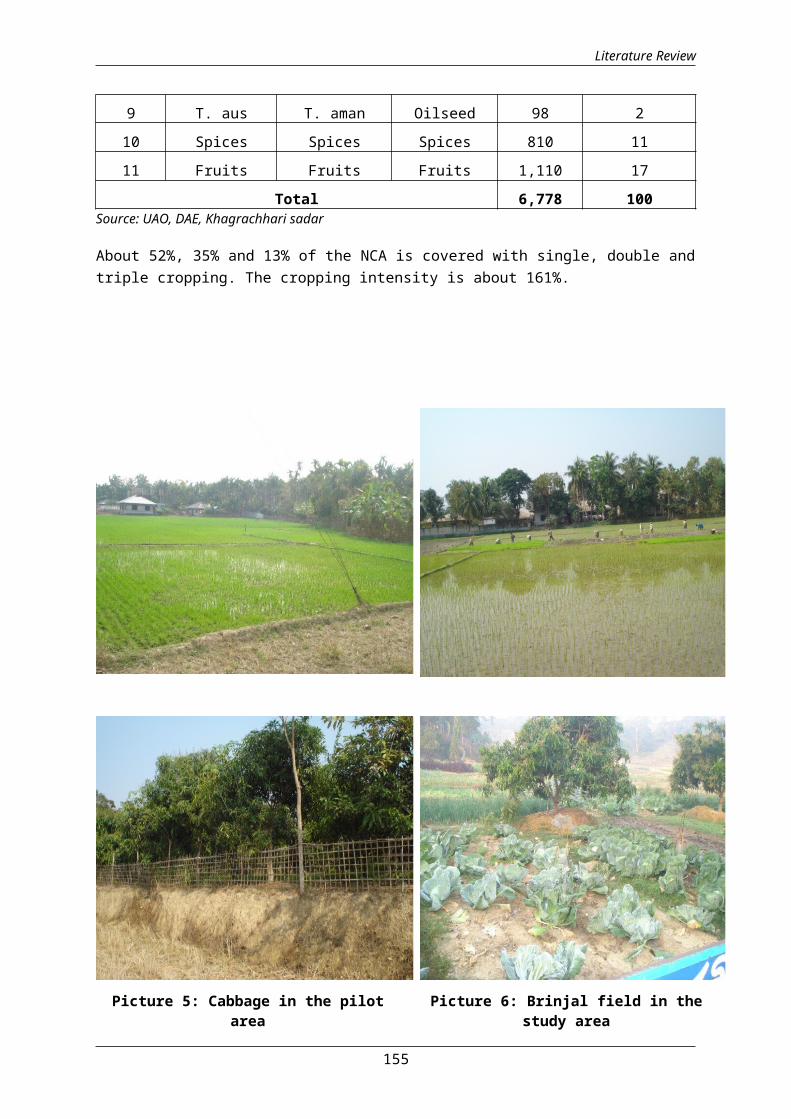
Literature Review
9 T. aus T. aman Oilseed 98 210 Spices Spices Spices 810 1111 Fruits Fruits Fruits 1,110 17
Total 6,778 100Source: UAO, DAE, Khagrachhari sadar
About 52%, 35% and 13% of the NCA is covered with single, double andtriple cropping. The cropping intensity is about 161%.
Picture 5: Cabbage in the pilotarea
Picture 6: Brinjal field in thestudy area
155

Literature Review
Picture7: Famers apply pesticidein the mango orchard
Picture 8:Mango orchard in thepilot area
11. Input Use in Khagrachhari Sadar
Inputs used in Khagrachhari pilot upazila include seed, fertilizer,pesticides and labor. Data collected on inputs used in horticulturecrops and field crops are presented in tables ? and ? respectively.
Table ?: Input used in the Khagrachhari pilot area for horticulturecrops
Crop name
Fertilizer (Gm/Pit) Pesticides
Urea TSP MP GypsumCow dung(kg/pit)
No. ofAppli.
Liq.(ml/ha)
Mango 120 80 50 00 20 3-4 300-800
Jackfruit 100 60 80 00 20 2-3 800
Pineapple 80 40 60 00 15 2-3 800
Litchi 80 60 20 00 5 2-3 100-500
Banana 20 50 - - 15 3-4 100-500Source: UAO, DAE and Farmers interviewed, Feb, 2014
156

Literature Review
Table ?: Input used in field crops in Khagrachhari pilot area
Crop name Seed(Kg/ha)
Labor(Number/ha )
Fertilizer (Kg/ha) Pesticides
Urea TSP MP Gypsum
No ofapplication
Liq.(ml/ha)
Granular/Powder
(kg/ha
HYV aus 40-50 150 60-80 15-30 0 0-1 700 7 - 8
HYV aman 40-50 150 60-100 25-30 10-35 0 1- 2 700 7 - 8
Local aman 45-60 120 80-100 20-40 0 1- 2 500 7
HYV boro 40-50 170 130-140
40.7 30-75 0 1-2 800 7 -8
Potato 1400 150 100-140
40-70 70-100
0 1-2 700 4 - 5
Maize 20 120 70-100 80-100
20-50 0 1- 2 500-600
0
Spices(turmeric +zinger)
20 100 20-40 20-Oct
0 0 1- 2 200-300
0
Oilseed 6 -8 110 20-40 40-50 20-30 0 0-1 500 5 -7
Chilli 2 - 3 100 100-180
100-120
50-60 0 1- 2 400 5 - 7
W.Vegetables
3 - 4 110 20-30 15-18 0 0 1- 2 500 4 - 5
S.Vegetables
3 - 4 120 40-60 30-60 10-30
0 3 -5 700 5 - 7
Pulses 15- 20 120 40-60 30-60 10-30 0 4 - 5 700 5 -6Source: UAO, DAE and farmers interviewed, Feb, 2014
Picture 9: Collected for Seed Picture 10: Plant selected for
157
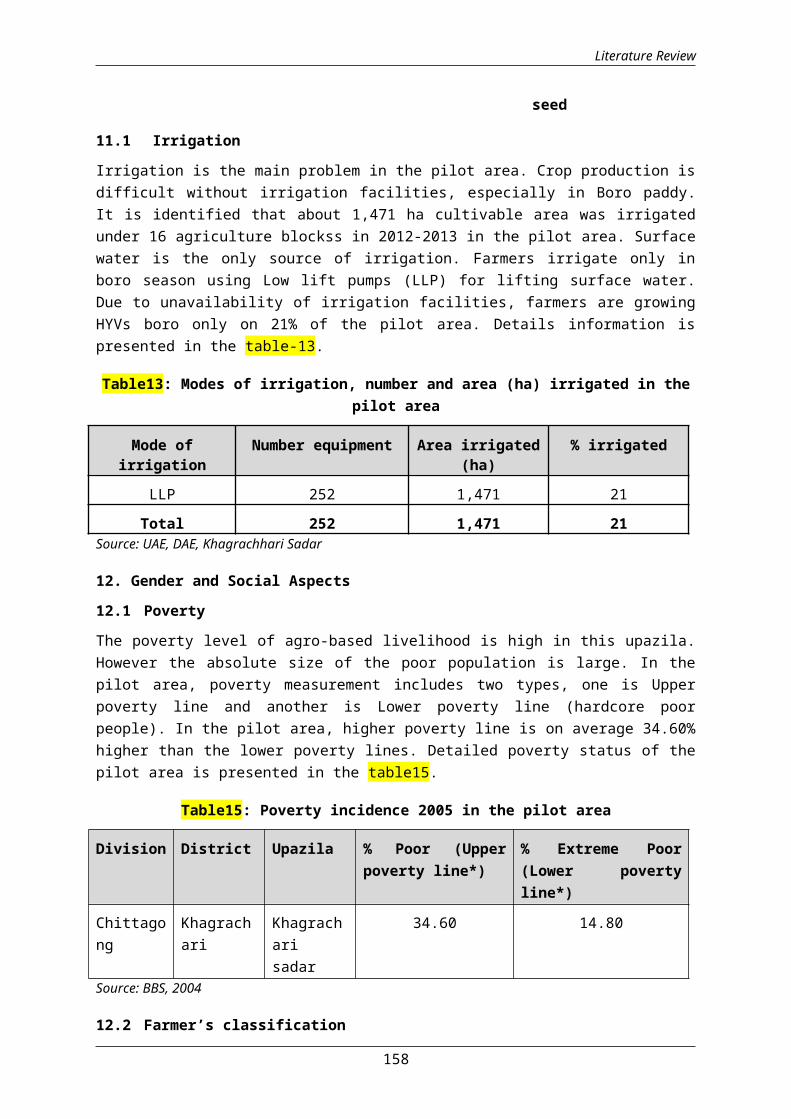
Literature Review
seed
11.1 Irrigation
Irrigation is the main problem in the pilot area. Crop production isdifficult without irrigation facilities, especially in Boro paddy.It is identified that about 1,471 ha cultivable area was irrigatedunder 16 agriculture blockss in 2012-2013 in the pilot area. Surfacewater is the only source of irrigation. Farmers irrigate only inboro season using Low lift pumps (LLP) for lifting surface water.Due to unavailability of irrigation facilities, farmers are growingHYVs boro only on 21% of the pilot area. Details information ispresented in the table-13.
Table13: Modes of irrigation, number and area (ha) irrigated in thepilot area
Mode ofirrigation
Number equipment Area irrigated(ha)
% irrigated
LLP 252 1,471 21Total 252 1,471 21
Source: UAE, DAE, Khagrachhari Sadar
12. Gender and Social Aspects
12.1 Poverty
The poverty level of agro-based livelihood is high in this upazila.However the absolute size of the poor population is large. In thepilot area, poverty measurement includes two types, one is Upperpoverty line and another is Lower poverty line (hardcore poorpeople). In the pilot area, higher poverty line is on average 34.60%higher than the lower poverty lines. Detailed poverty status of thepilot area is presented in the table15.
Table15: Poverty incidence 2005 in the pilot area
Division District Upazila % Poor (Upperpoverty line*)
% Extreme Poor(Lower povertyline*)
Chittagong
Khagrachari
Khagracharisadar
34.60 14.80
Source: BBS, 2004
12.2 Farmer’s classification
158

Literature Review
Data on land ownership were collected from UAO, DAE of Khagrachharisadar which has relevance with FAO, BARC and BBS. According to thetable15 marginal farmers (3,797) are dominant which is followed bylarge farmers (335). Category wise land ownership data are presentedin table-14.
Table-14: Different Farmers types and number
Landlessfarmers(<0.2 ha)
Marginalfarmers(0.2-0.5
ha)
Smallfarmers(0.5-1.0
ha)
Mediumfarmers (1-
2 ha)
Largefarmers (>2
ha)
Total
2,383 3,797 3,249 1,234 335 10,998
Source: UAO, DAE, Khagrachai Sadar, 2014
12.3 Agriculture labour wage rateNormal agriculture labor wage rate is tk 325 per male per day inpeak period (rice transplanting and harvesting) and tk. 275 per maleper day in the lean period. Wage rate varies from male to female.The rate for female per day is tk. 175 in peak and in lean period.Wage rate by different units in Khagrachhari sadar is shown belowtable-15.
Table-15: Wage rate by different units in Khagrachhari Sadar
Labour wage
Agriculture Labourtypes
Wage rate (Taka)Village Upazila
Average agri.day labor wagein peak period
Male 325 350Female 175 180
Average agri.day labor wagein lean period.
Male 275 300Female 175 150
Source: RRA, Khagrachhari Sadar
12.4 Agricultural and non-agricultural occupational status Data were collected from BBS and UAO of DAE, Khagrachari sadar. Ithas been analyzed and presented in table-16. Maximum HHs in thisupazila is engaged on agricultural activities.
Table-16: Agricultural and non-agricultural occupational statusUpazila
Total
HHs
HHs entirely dependingon agricultural
production. for income(farm)
(%)
HHs entirelydepending onnon- farm
occupation. (non
(%)
159
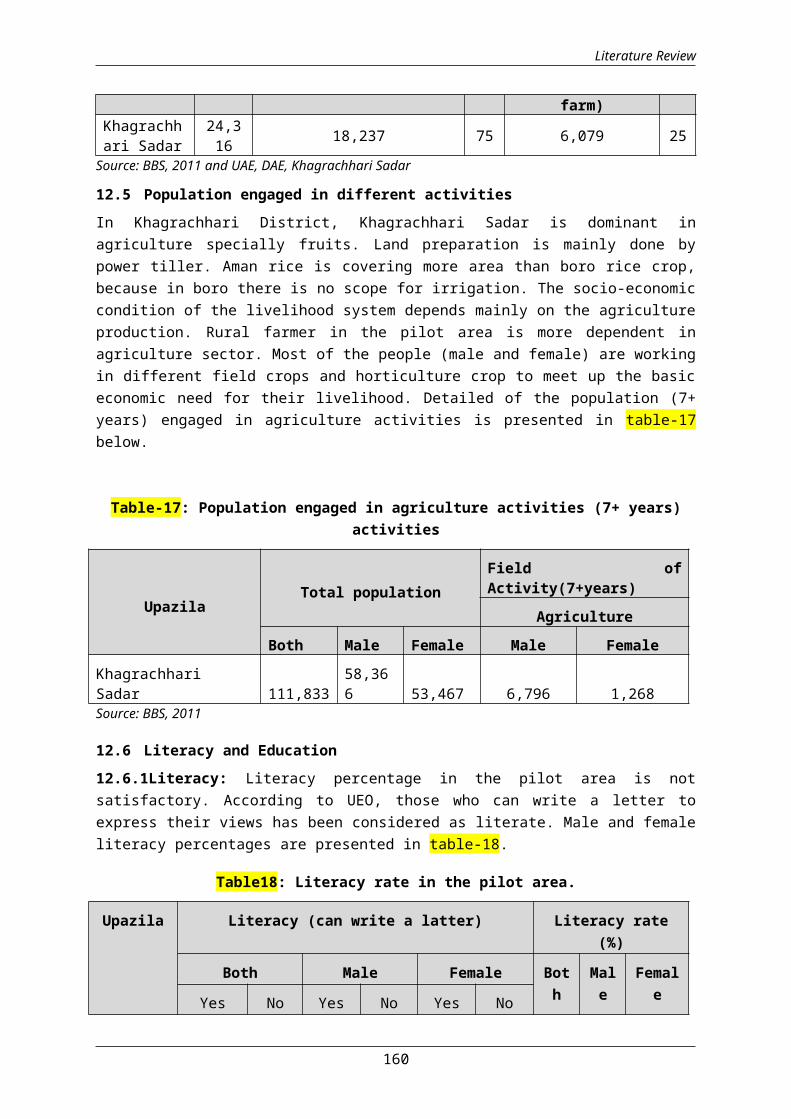
Literature Review
farm)Khagrachhari Sadar
24,316 18,237 75 6,079 25
Source: BBS, 2011 and UAE, DAE, Khagrachhari Sadar
12.5 Population engaged in different activitiesIn Khagrachhari District, Khagrachhari Sadar is dominant inagriculture specially fruits. Land preparation is mainly done bypower tiller. Aman rice is covering more area than boro rice crop,because in boro there is no scope for irrigation. The socio-economiccondition of the livelihood system depends mainly on the agricultureproduction. Rural farmer in the pilot area is more dependent inagriculture sector. Most of the people (male and female) are workingin different field crops and horticulture crop to meet up the basiceconomic need for their livelihood. Detailed of the population (7+years) engaged in agriculture activities is presented in table-17below.
Table-17: Population engaged in agriculture activities (7+ years)activities
UpazilaTotal population
Field ofActivity(7+years)
AgricultureBoth Male Female Male Female
KhagrachhariSadar 111,833
58,366 53,467 6,796 1,268
Source: BBS, 2011
12.6 Literacy and Education12.6.1Literacy: Literacy percentage in the pilot area is notsatisfactory. According to UEO, those who can write a letter toexpress their views has been considered as literate. Male and femaleliteracy percentages are presented in table-18.
Table18: Literacy rate in the pilot area.
Upazila Literacy (can write a latter) Literacy rate(%)
Both Male Female Both
Male
FemaleYes No Yes No Yes No
160
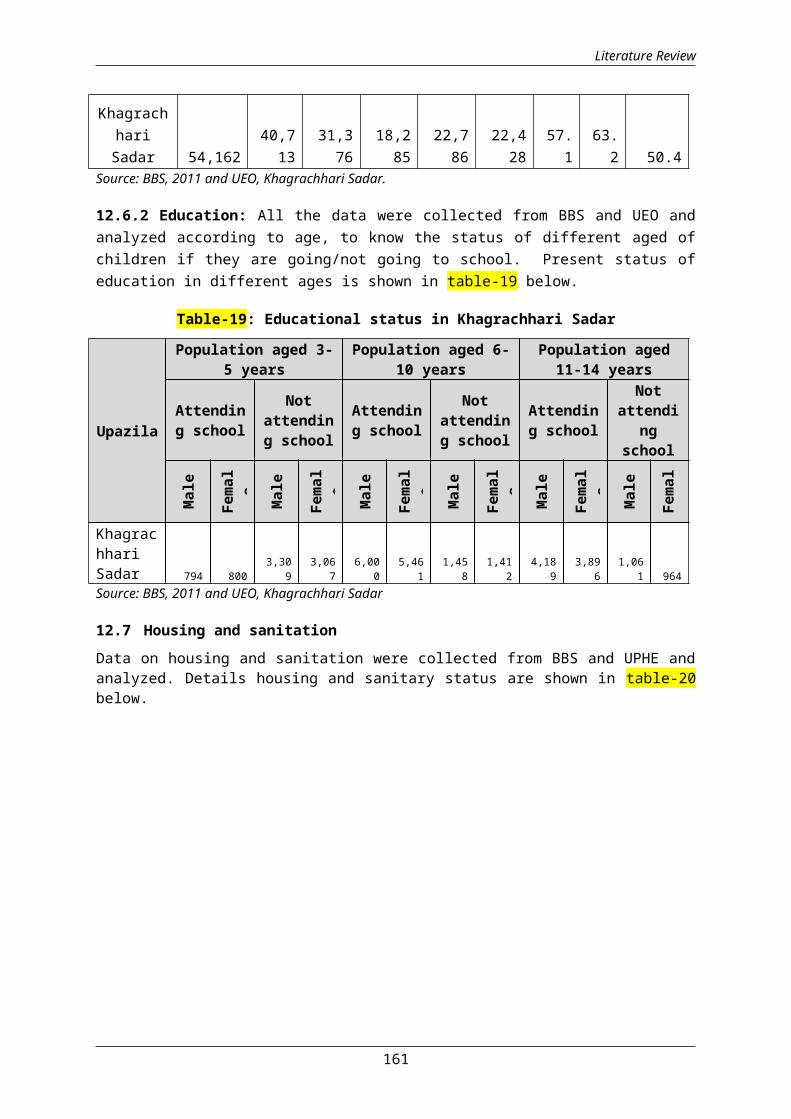
Literature Review
KhagrachhariSadar 54,162
40,713
31,376
18,285
22,786
22,428
57.1
63.2 50.4
Source: BBS, 2011 and UEO, Khagrachhari Sadar.
12.6.2 Education: All the data were collected from BBS and UEO andanalyzed according to age, to know the status of different aged ofchildren if they are going/not going to school. Present status ofeducation in different ages is shown in table-19 below.
Table-19: Educational status in Khagrachhari Sadar
Upazila
Population aged 3-5 years
Population aged 6-10 years
Population aged11-14 years
Attending school
Notattending school
Attending school
Notattending school
Attending school
Notattendi
ngschool
Male
Fema
le
Male
Fema
le
Male
Fema
le
Male
Fema
le
Male
Fema
le
Male
Fema
le
KhagrachhariSadar 794 800
3,309
3,067
6,000
5,461
1,458
1,412
4,189
3,896
1,061 964
Source: BBS, 2011 and UEO, Khagrachhari Sadar
12.7 Housing and sanitationData on housing and sanitation were collected from BBS and UPHE andanalyzed. Details housing and sanitary status are shown in table-20below.
161
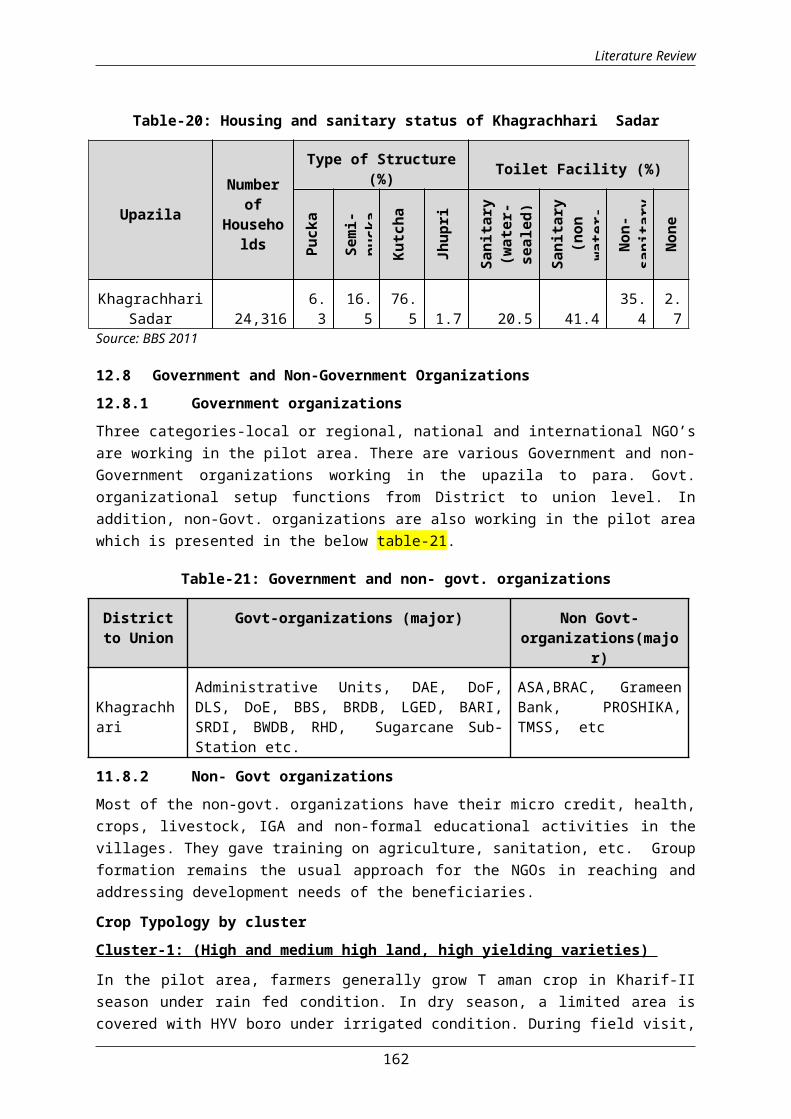
Literature Review
Table-20: Housing and sanitary status of Khagrachhari Sadar
Upazila
Numberof
Households
Type of Structure(%) Toilet Facility (%)
Pucka
Semi-
pucka
Kutc
ha
Jhup
ri
Sani
tary
(wat
er-
seal
ed)
Sani
tary
(non
wate
r-No
n-sa
nita
ryNo
ne
KhagrachhariSadar 24,316
6.3
16.5
76.5 1.7 20.5 41.4
35.4
2.7
Source: BBS 2011
12.8 Government and Non-Government Organizations12.8.1 Government organizationsThree categories-local or regional, national and international NGO’sare working in the pilot area. There are various Government and non-Government organizations working in the upazila to para. Govt.organizational setup functions from District to union level. Inaddition, non-Govt. organizations are also working in the pilot areawhich is presented in the below table-21.
Table-21: Government and non- govt. organizations
Districtto Union
Govt-organizations (major) Non Govt-organizations(majo
r)
Khagrachhari
Administrative Units, DAE, DoF,DLS, DoE, BBS, BRDB, LGED, BARI,SRDI, BWDB, RHD, Sugarcane Sub-Station etc.
ASA,BRAC, GrameenBank, PROSHIKA,TMSS, etc
11.8.2 Non- Govt organizationsMost of the non-govt. organizations have their micro credit, health,crops, livestock, IGA and non-formal educational activities in thevillages. They gave training on agriculture, sanitation, etc. Groupformation remains the usual approach for the NGOs in reaching andaddressing development needs of the beneficiaries.
Crop Typology by clusterCluster-1: (High and medium high land, high yielding varieties)
In the pilot area, farmers generally grow T aman crop in Kharif-IIseason under rain fed condition. In dry season, a limited area iscovered with HYV boro under irrigated condition. During field visit,
162

Literature Review
discussions were made with the local farmers, SAAO of DAE in theeight (8) locations with the Additional Agriculture officer (AAO) ofDAE. It was learn that DAE have initiated to improve croppingpatterns with new crop cultivars with optimum level of fertilizerapplication. This would influence to improve crop production in thepilot area.
Table-22: Crops grown in the cluster-1
Rice Kharif-II BR-11, BRRI Dhan-30, BRRI Dhan-34, BRRIDha-40
Vegetables
Rabi BARI Sheem-1,BARI Sheem-2
Spices Round theyear
Turmeric-patnai ,Zinger-Local variety
Fruits Round theyear
Banana, Papaya, Mango Litchi
Source: AAO, DAE and Farmers interviewed, Feb, 2014
Example- 1: Existing and propsed cropping patterns, presented intable 23, is based on discussion with the AAO and local farmers. Itis possible to grow one more vegetable crop in pattern number 1 and2. Farmers are growing banana on the slope of the hill, they onlyplant the sucker and later on go for harvest. Farmers agreed thatit is possible to do some management including use of improvevariety. It is also possible to grow inter crop with mango orchard.The cropping intensity would increase and also soil fertility willimprove by application of fertilizers.
Table-23: Existing and proposed major cropping patterns forcluster-1
Pattern
no.
Crop Existing croppingpattern
Proposed cropping pattern
Rabi Kharif-I Kharif-II
Rabi Kharif-I Kharif-II
1 Rice Fallow
Fallow T.aman
vegetables Fallow T.aman
2 Rice /vegetable
Fallow
Jhumaus/Vegetables
Fallow
Fallow Aus T. aman
3 Banana Banana
Banana Banana
Banana(Improvevariety +
Banana(Improvevariety +
Banana(Improvevariety +
163
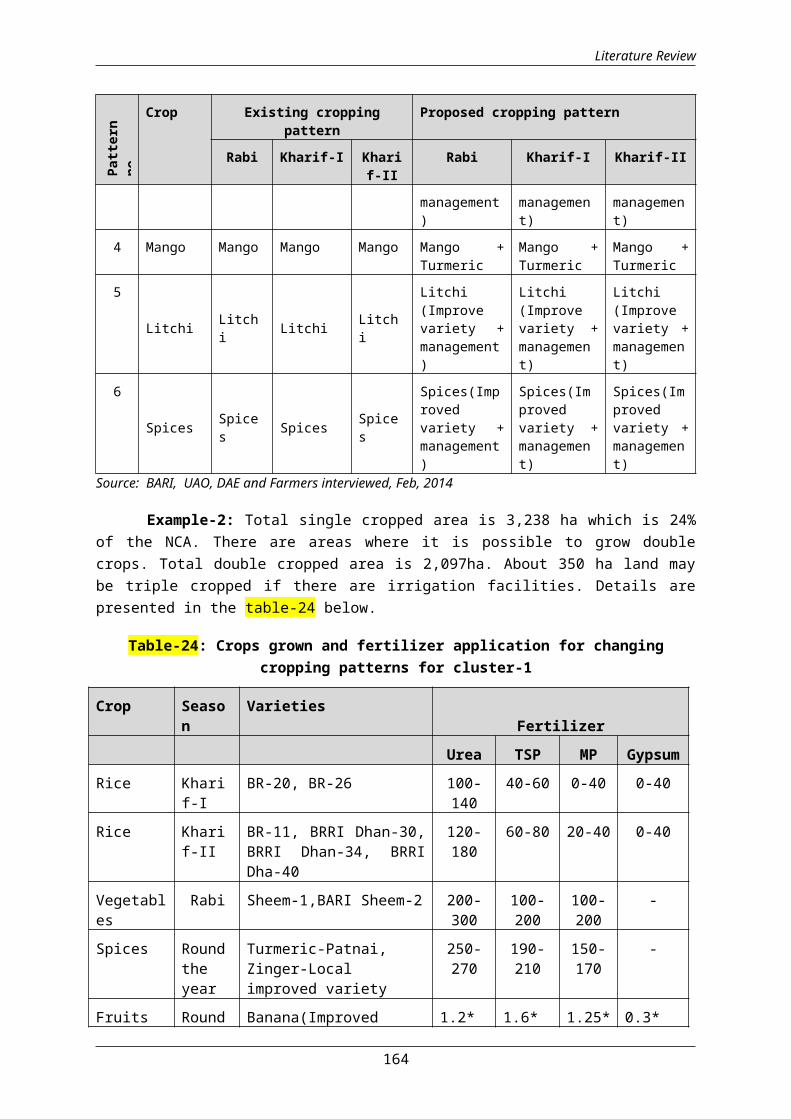
Literature Review
Pattern
no.
Crop Existing croppingpattern
Proposed cropping pattern
Rabi Kharif-I Kharif-II
Rabi Kharif-I Kharif-II
management)
management)
management)
4 Mango Mango Mango Mango Mango +Turmeric
Mango +Turmeric
Mango +Turmeric
5
Litchi Litchi Litchi Litch
i
Litchi(Improvevariety +management)
Litchi(Improvevariety +management)
Litchi(Improvevariety +management)
6
Spices Spices Spices Spice
s
Spices(Improvedvariety +management)
Spices(Improvedvariety +management)
Spices(Improvedvariety +management)
Source: BARI, UAO, DAE and Farmers interviewed, Feb, 2014
Example-2: Total single cropped area is 3,238 ha which is 24%of the NCA. There are areas where it is possible to grow doublecrops. Total double cropped area is 2,097ha. About 350 ha land maybe triple cropped if there are irrigation facilities. Details arepresented in the table-24 below.
Table-24: Crops grown and fertilizer application for changingcropping patterns for cluster-1
Crop Season
VarietiesFertilizer
Urea TSP MP GypsumRice Khari
f-IBR-20, BR-26 100-
14040-60 0-40 0-40
Rice Kharif-II
BR-11, BRRI Dhan-30,BRRI Dhan-34, BRRIDha-40
120-180
60-80 20-40 0-40
Vegetables
Rabi Sheem-1,BARI Sheem-2 200-300
100-200
100-200
-
Spices Roundtheyear
Turmeric-Patnai,Zinger-Localimproved variety
250-270
190-210
150-170
-
Fruits Round Banana(Improved 1.2* 1.6* 1.25* 0.3*
164

Literature Review
Crop Season
VarietiesFertilizer
theyear
variety)Mango-BARI-1,2,3,4,Litchi-Improved variety,Jackfruit withturmeric(HYV)
Source: BARI, BRRI * Fertilizer used in 10+ year plant
Cluster-2: (High and medium land with fruit crops)
Agro-forestry is an ancient practice, now it is becoming an integralpart of the crop farming system in our country as well as inKhagrachhari District. In the Khagrachhari upazila, traditionallydifferent fruit orchard like Mango, Litchi, Guava and Jujube isbeing grown by the farmers, however Banana is dominating andincreasing day by day for higher economic return. Farmers canconvert their field crops as inter cropping (high land) in to bananagarden in the hilly slope. At present farmers are not cultivatingany intercrops in the banana garden. Discussion with local farmers,horticulturist of BARI at Khagrachhari and AAO of sadar upazilasuggested that it is possible to grow turmeric in between the bananaplants and possible to harvest a good yield by growing intercrops.The intercrop will help to maximize the use of cultivable land.Mango is the second dominating cash crop and it is possible to growtermaric as inter crop. One analysis is given in the below table-25.
Crops: Mango, Litchi, Guava, Jujube, Pineapple, Lemon
Intercrops: Zinger, Turmeric, Pineapple, Lemon
Table-25: Existing and proposed crops production throughintercropping (pattern-II)
Land type
Pilot
Upazila
Present
crop
Yield
(t/ha)
Management
Cost
Total
return
Inter
crops
Variety
use
Expected
yield
Cultivated
cost
Total
return
(tk/ha)
Net
return
(tk/ha)
1 2 3 4 5 6 7 8 9 10 11 (11-6)
Highland
KhagrachhariSadar
Mango
10 60,000
90,000
Mango Amrapali,BARI-1,BARI-2BARI-3
12 10,000
150,000
50,000
165

Literature Review
andBARI-4
Turmeric
BARI 2.5
17,500
25,000
7,500
Total 60,000
90,000
27,500
175,000
57,500
Source: BARI, UAO, DAE and Farmers interviewed, Feb, 2014
166
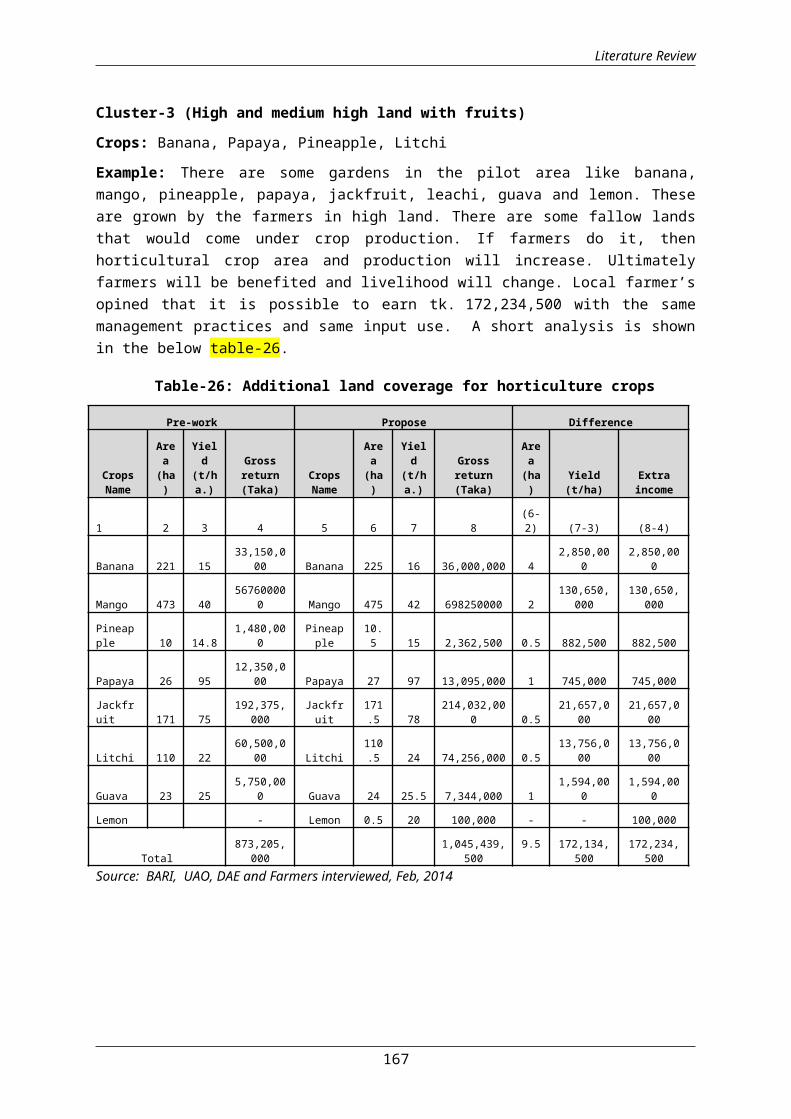
Literature Review
Cluster-3 (High and medium high land with fruits)
Crops: Banana, Papaya, Pineapple, Litchi
Example: There are some gardens in the pilot area like banana,mango, pineapple, papaya, jackfruit, leachi, guava and lemon. Theseare grown by the farmers in high land. There are some fallow landsthat would come under crop production. If farmers do it, thenhorticultural crop area and production will increase. Ultimatelyfarmers will be benefited and livelihood will change. Local farmer’sopined that it is possible to earn tk. 172,234,500 with the samemanagement practices and same input use. A short analysis is shownin the below table-26.
Table-26: Additional land coverage for horticulture crops
Pre-work Propose Difference
CropsName
Area(ha)
Yield
(t/ha.)
Grossreturn(Taka)
CropsName
Area(ha)
Yield
(t/ha.)
Grossreturn(Taka)
Area(ha)
Yield(t/ha)
Extraincome
1 2 3 4 5 6 7 8(6-2) (7-3) (8-4)
Banana 221 1533,150,0
00 Banana 225 16 36,000,000 42,850,00
02,850,00
0
Mango 473 4056760000
0 Mango 475 42 698250000 2130,650,
000130,650,
000
Pineapple 10 14.8
1,480,000
Pineapple
10.5 15 2,362,500 0.5 882,500 882,500
Papaya 26 9512,350,0
00 Papaya 27 97 13,095,000 1 745,000 745,000
Jackfruit 171 75
192,375,000
Jackfruit
171.5 78
214,032,000 0.5
21,657,000
21,657,000
Litchi 110 2260,500,0
00 Litchi110.5 24 74,256,000 0.5
13,756,000
13,756,000
Guava 23 255,750,00
0 Guava 24 25.5 7,344,000 11,594,00
01,594,00
0
Lemon - Lemon 0.5 20 100,000 - - 100,000
Total873,205,
0001,045,439,
5009.5 172,134,
500172,234,
500Source: BARI, UAO, DAE and Farmers interviewed, Feb, 2014
167

Literature Review
168

Literature Review
Cluster-4 (medium high and medium low land)
Following crops are suggested for the medium high and medium lowland types
Cereal andoilseeds cropswith differentseasons
Aus: BR-20 and BR-26Aman: BR-11, BRRI Dhan-30, BRRI Dhan-34, BRRI Dha-40, Boro: BRRI Dhan-28, BRRI Dhan-29, Chhokya panjaOilseeds: BARI Sharisha-14 Maize: BARI Maize-7, BARI hybrid maize-2
Differentvegetablescrops withseasons
Vegetables crops: Bitter gourd, Indian spinach,Yard long bean, Lalshak, Snake gourd, Ash gourd,Bottle gourd, Sweet gourd, Spinach, Amaranthus.
Presently 24% area is covered by single cropping. According to UAO,it is possible to bring additional 11% under double cropping withirrigation facilities (table-28). About 35% lands is double cropped,it is possible to grow triple crops in about 1.5% areas if there isirrigation facilities (table-29).
Table-28: Proposed cropping patterns for cluster 4.
Kharif-I Kharif-II RabiFallow Vegetables BoroMaize T.aman PotatoAus Taman MustardVegetables Vegetables Vegetables
Source: BARI, UAO, DAE and Farmers interviewed, Feb, 2014
Cluster-5 (medium high, medium low and low land)
Cereal, oilseed andpulses withdifferent seasons
Aus: BR-20 and BR-26
Aman: BR-11,BRRI Dhan-30, BRRI Dhan-34, BRRIDha-40,
Boro: BRRI Dhan-28, BRRI Dhan-29, Chhokyapanja
Oilseeds: BARI Sharisha-14
Pulses: BARI Masur-3, BARI Chhola-4, BARIMung-5
Differentvegetables crops
Vegetables crops: Bitter gourd, Indianspinach, Yard long bean, Lal shak, Snake
169
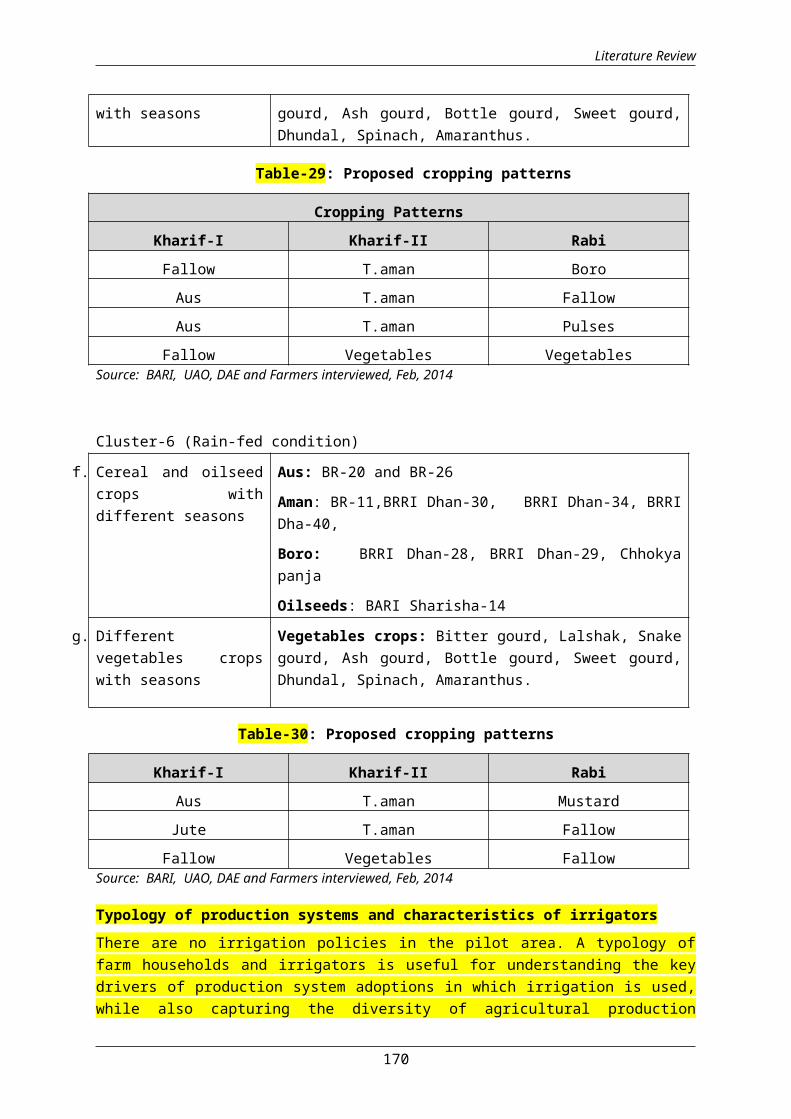
Literature Review
with seasons gourd, Ash gourd, Bottle gourd, Sweet gourd,Dhundal, Spinach, Amaranthus.
Table-29: Proposed cropping patterns
Cropping PatternsKharif-I Kharif-II RabiFallow T.aman BoroAus T.aman FallowAus T.aman Pulses
Fallow Vegetables VegetablesSource: BARI, UAO, DAE and Farmers interviewed, Feb, 2014
Cluster-6 (Rain-fed condition)
f. Cereal and oilseedcrops withdifferent seasons
Aus: BR-20 and BR-26
Aman: BR-11,BRRI Dhan-30, BRRI Dhan-34, BRRIDha-40,
Boro: BRRI Dhan-28, BRRI Dhan-29, Chhokyapanja
Oilseeds: BARI Sharisha-14
g. Differentvegetables cropswith seasons
Vegetables crops: Bitter gourd, Lalshak, Snakegourd, Ash gourd, Bottle gourd, Sweet gourd,Dhundal, Spinach, Amaranthus.
Table-30: Proposed cropping patterns
Kharif-I Kharif-II RabiAus T.aman MustardJute T.aman FallowFallow Vegetables Fallow
Source: BARI, UAO, DAE and Farmers interviewed, Feb, 2014
Typology of production systems and characteristics of irrigators There are no irrigation policies in the pilot area. A typology offarm households and irrigators is useful for understanding the keydrivers of production system adoptions in which irrigation is used,while also capturing the diversity of agricultural production
170
Literature Review
practices and economic activities, and potentially the role ofirrigation in livelihood.
Cluster Irrigation policies in the pilot area have historically supportedboth large-scale public irrigation projects and small-scale privateirrigation. In the pilot area, there are agricultural projects whichis scattered. Farmers may be aware to make the irrigation system oncluster basis
A Typology for Farmers' in Drought Management
Drought is a normal, recurrent climate feature in the pilot area.Drought is a slow-onset natural disaster. Planning at macro leveloften assumes that farmers react to and manage drought in similarways. If this assumption of homogeneity is incorrect, the potentialeffectiveness of drought mitigation efforts is likely to bedangerously inhibited. More specifically, it should be examinedwhether farmers use different strategies to mitigate drought and, ifso, whether a typology to classify their management approaches canbe developed.
Food Security
In the pilot area total population is 1,820,373. Total production is53,031.37 metric tons. If one person consumed 454 gram/day thentotal requirement is 301,654 metric tons. So, extra food needed is214,809 ton/ year. There are scopes to improve cropping patterns andintensity, as well as intercropping and timber with fruit treecombination which will reduce the vulnerability of food security foreveryone.
171
Literature Review
Pilot-3: Gazipur Sadar Upazila, Gazipur.
1 Introduction
There are many opportunities to develop and enhance production offruit and field crops intensively in Gazipur sadar, because the soilis fertile for production and employment generation. It is boundedon the north by Mymensingh and Kishoreganj districts, on the east byNarsingdi district, on the south by Dhaka district and on the westby the Tangail district. The total area of the district is 1806.36sq. km of which 17.53 sq. km is riverine and 273.42 sq.km. is forestarea. The main rivers are Old Brahmaputra, Shitalakshya, Turag,Bangshi, Balu and Banar. Gazipur district has been selected forassessing production practice and opportunity of production. PilotUpazila (Gazipur Sadar) has a lot of scopes to grow more crops usingHigh Yielding Varieties (HYVs) of field and horticultural crops,maximizing the use and intensification, intercropping in differentseasons. Upazila administrative map is shown in map ?
172
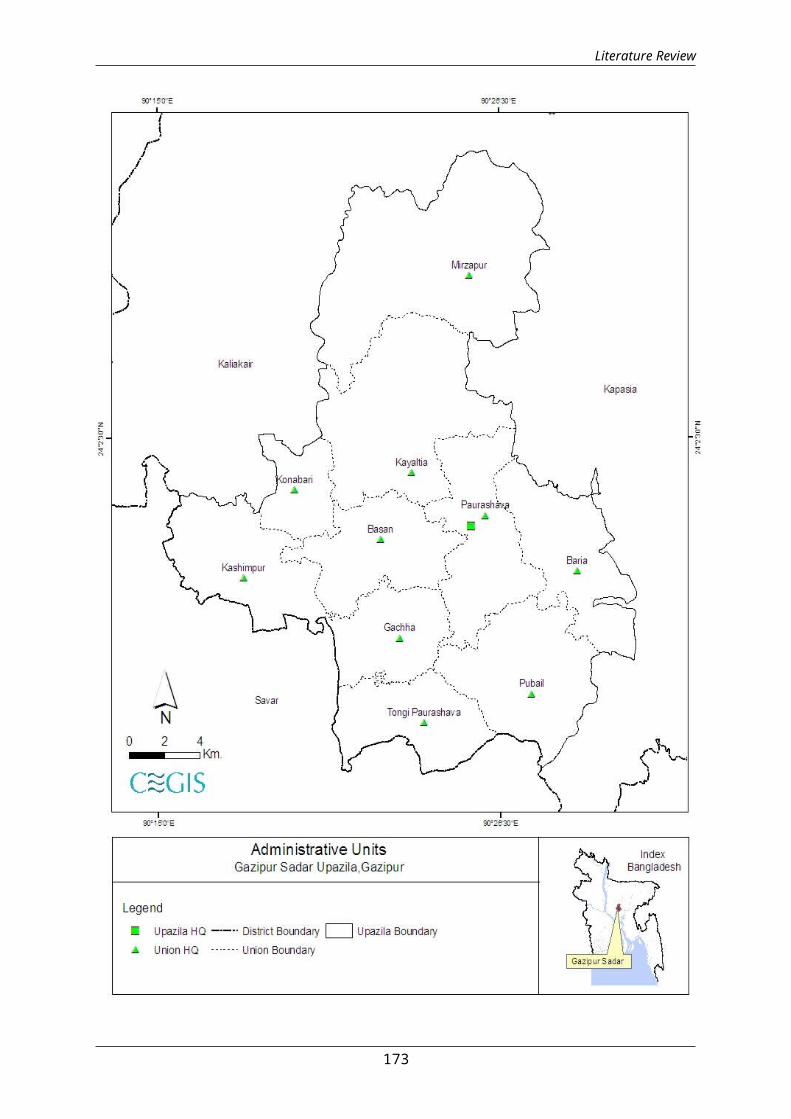
Literature Review
173

Literature Review
1.1 Geographic features
Area and Location: The upazila occupies an area of 457.67 sq. km.including 0.31 sq. km. river area and 54.52 sq. km. forest area. Itis located between 23o53' and 24o11' north latitudes and between90o20' and 92o30' east longitudes. The upazila is bounded on thenorth by Sreepur upazila, on the east by Sreepur and Kaliganjuapzilas and Rupganj upazila of Narayanganj district, on the southby Uttara Thana and Mirpur thanas of Dhaka megacity and on the westby Kaliakair and Savar upazilas.
1.2 Demographic features
Data were collected from Upazila Agriculture Officer of Gazipursadar, 2013, and BBS, 2011. Total population is 1,820,374 of whichmale is 976,683 and female is 843,691. Data presented in table ?below indicate that population is increasing day by day.
Table-1: Population in the pilot area
Population 2001 2011 DifferenceTotal 8,66,540 18,20,374 954834Male 4,71,768 9,76,683 504915Female 3,94,772 8,43,691 448919Source: UAO, DAE, Gazipur sadar 2013 and BBS, 2012
2. Meteorology
2.1 Rainfall
Data on rainfall (2009 to 2013), collected from Bangladesh RiceResearch Institute (BRRI), shows significant rainfall during themonths of May to October. On the other hand, very little rainfall orno rain occurs during the period of November to March. Last fiveyears maximum rainfall is shown in figure1.
174

Literature Review
Source: BRRI, Joydebpur, Gazipur, 2013
2.2 Temperature
Maximum: Seasonal variation of temperature is large. Mean data oflast five years from 2009 to 2013 indicate that the mean monthlymaximum temperature was 35.14°C in March and that was the warmestmonth. Likewise mean monthly minimum temperature was 23.71°C.January was the coldest month that was shown in the figure-2.
Source: BRRI, Joydebpur, Gazipur, 2013
Minimum: The highest temperature ever recorded in the last fiveyears was 27.06°C, which is found in the month of July, 2010 whilethe lowest ever recorded minimum temperature is 10.31°C recorded inthe month of January, 2011. Details are shown in figure-3.
175
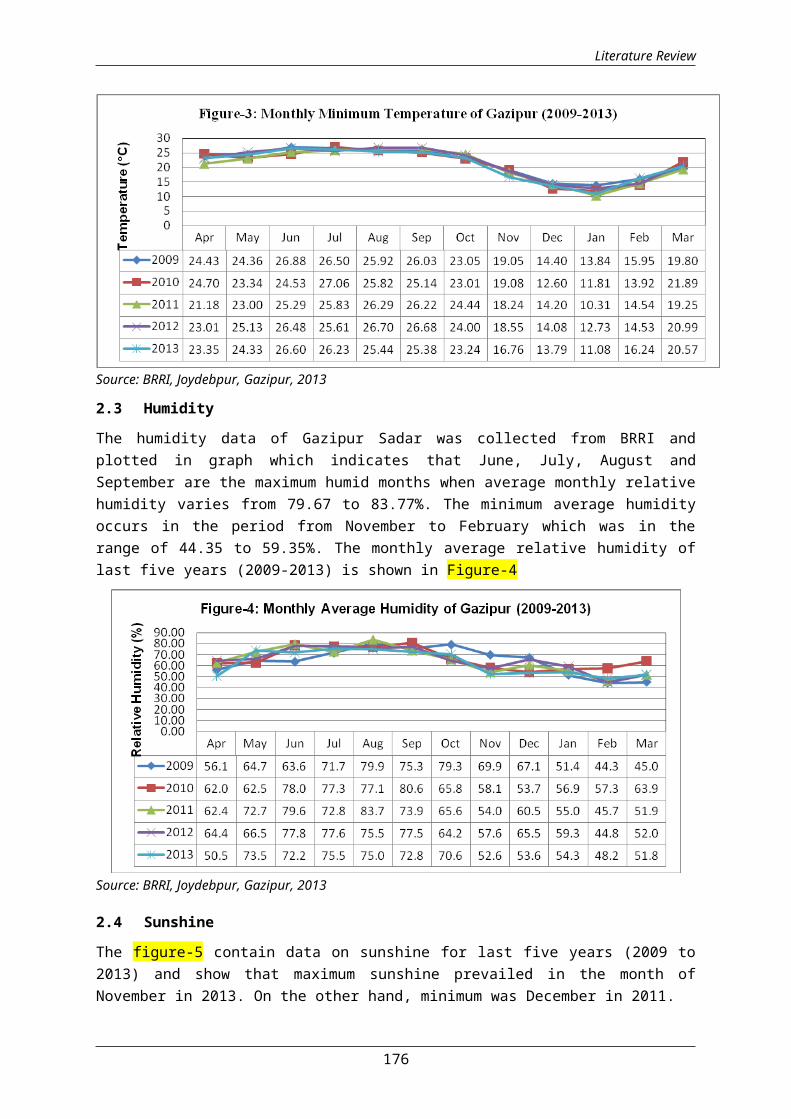
Literature Review
Source: BRRI, Joydebpur, Gazipur, 2013
2.3 Humidity
The humidity data of Gazipur Sadar was collected from BRRI andplotted in graph which indicates that June, July, August andSeptember are the maximum humid months when average monthly relativehumidity varies from 79.67 to 83.77%. The minimum average humidityoccurs in the period from November to February which was in therange of 44.35 to 59.35%. The monthly average relative humidity oflast five years (2009-2013) is shown in Figure-4
Source: BRRI, Joydebpur, Gazipur, 2013
2.4 Sunshine
The figure-5 contain data on sunshine for last five years (2009 to2013) and show that maximum sunshine prevailed in the month ofNovember in 2013. On the other hand, minimum was December in 2011.
176
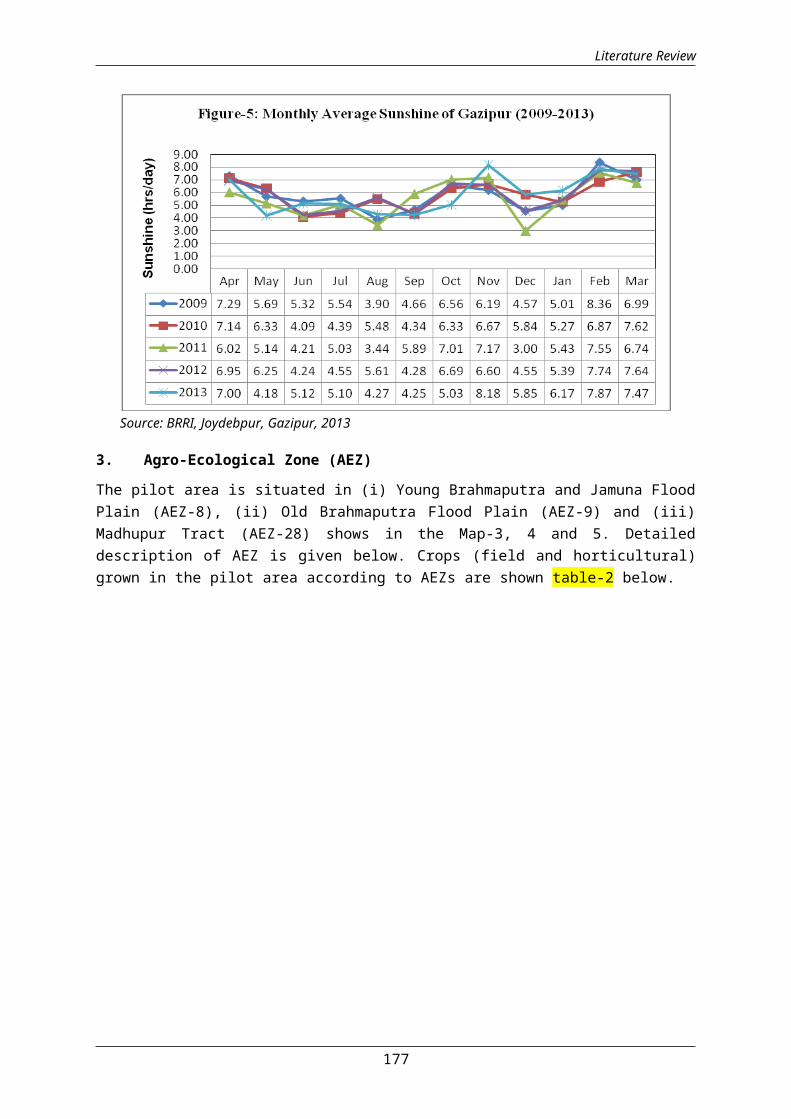
Literature Review
Source: BRRI, Joydebpur, Gazipur, 2013
3. Agro-Ecological Zone (AEZ)
The pilot area is situated in (i) Young Brahmaputra and Jamuna FloodPlain (AEZ-8), (ii) Old Brahmaputra Flood Plain (AEZ-9) and (iii)Madhupur Tract (AEZ-28) shows in the Map-3, 4 and 5. Detaileddescription of AEZ is given below. Crops (field and horticultural)grown in the pilot area according to AEZs are shown table-2 below.
177

Literature Review
178

Literature Review
Young Brahmaputra and Jamuna Flood Plain (AEZ-8)
The region comprises the area of Brahmaputra sediments. It has acomplex relief of broad and narrow ridges, inter-ridge depressions,partially in filled cut-off channels and basins. This area isoccupied by permeable silt loam to silty clay loam soils on theridges and impermeable clays in the basins; neutral to slightly acidin reaction. General soil types include predominantly greyfloodplain soils. Organic matter content is low in ridges andmoderate in basins. Soils are deficient in N, P and S but the statusof K and Zn is medium.
Old Brahmaputra Flood Plain (AEZ-9)
This region occupies a large area of Brahmaputra sediments beforethe river was diverted to its present Jamuna channel about 200 yearsago. The region has broad ridges and basins. Soils of the area arepredominantly silt loams to silty clay loams on the ridges and clayin the basins. General soil types predominantly include dark greyfloodplain soil. Organic matter content is low on the ridges andmoderate in the basins, topsoils moderately acidic and subsoilsneutral in reaction. General fertility level is low. However, thestatus of P and CEC is medium and the K status is low.
Madhupur Tract (AEZ-28)
This is a region of complex relief and soils are developed over theMadhupur Clay, The landscape comprises level upland, closely orbroadly dissected terraces associated with either shallow or broaddeep valleys.
Eleven General Soil Types exist in the area of which, Deep Red BrownTerrace, Shallow Red Brown Terrace soils and Acid Basin Clays arethe major ones. The soils on the terrace are better drained, friableclay loams to clays overlying friable clay substratum at varyingdepths. Soils in the valleys are dark grey heavy clays. They arestrongly acidic in reaction with low status of organic matter, lowmoisture holding capacity and low fertility level. The soils aremainly phosphate fixing, and low in P, K, S and B levels.
Table-2: Field and horticultural crops grown according to AEZs
No.AEZ
Name of AEZ Totalarea(ha)
Major crops grow
8 YoungBrahmaputra 5,304
Rice, wheat, jute , potato, Mustard,Sesame, Brinjal, Cabbage,
179

Literature Review
and JamunaFloodplain
sweetpotato, Mouri, Aam, Kanthal,NariKel, Supari, Jackfruit
9OldBrahmaputraFloodplain
4,001
Rice, wheat, jute , Potato,Sugarcane, Mustard, Maize, Mungbean, Grass pea, Lady's finger,Cabbage, Chickpea, Onion, Garlic,Jackfruit
28 MadhupurTract 34,058
Jackfruit, Mango, Pineapple etc.
Source: BARC, 2005
4. Land types in pilot area
Total area in the pilot upazila is 43,363 ha. The area of High landis 22,983 ha (53%), medium highland 9,106 ha (21%), medium lowland1,301 ha (3%) and lowland 9,973 ha (23%). The land types of GazipurSadar Upazila are shown in a figure-6 and map-3.
Source: UAO, DAE, Sadar, Gazipur
180

Literature Review
Map 3: Land type of the pilot area
181
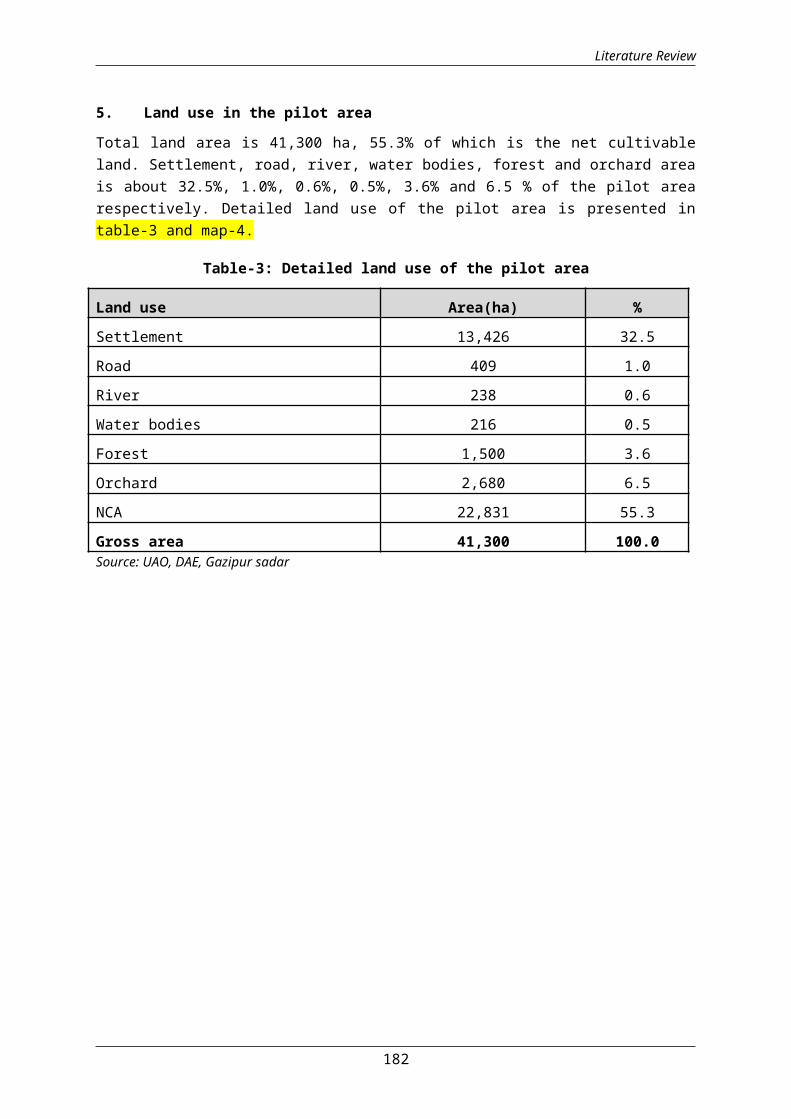
Literature Review
5. Land use in the pilot area
Total land area is 41,300 ha, 55.3% of which is the net cultivableland. Settlement, road, river, water bodies, forest and orchard areais about 32.5%, 1.0%, 0.6%, 0.5%, 3.6% and 6.5 % of the pilot arearespectively. Detailed land use of the pilot area is presented intable-3 and map-4.
Table-3: Detailed land use of the pilot area
Land use Area(ha) %Settlement 13,426 32.5Road 409 1.0River 238 0.6Water bodies 216 0.5Forest 1,500 3.6Orchard 2,680 6.5NCA 22,831 55.3Gross area 41,300 100.0Source: UAO, DAE, Gazipur sadar
182
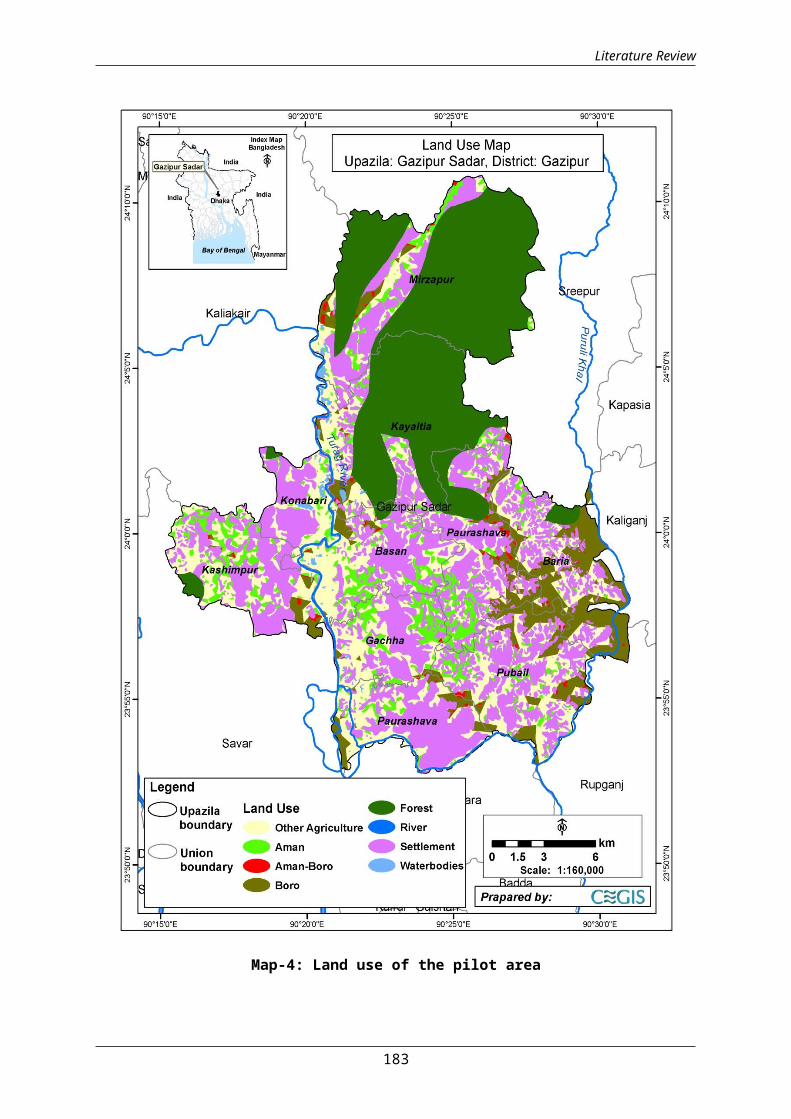
Literature Review
Map-4: Land use of the pilot area
183
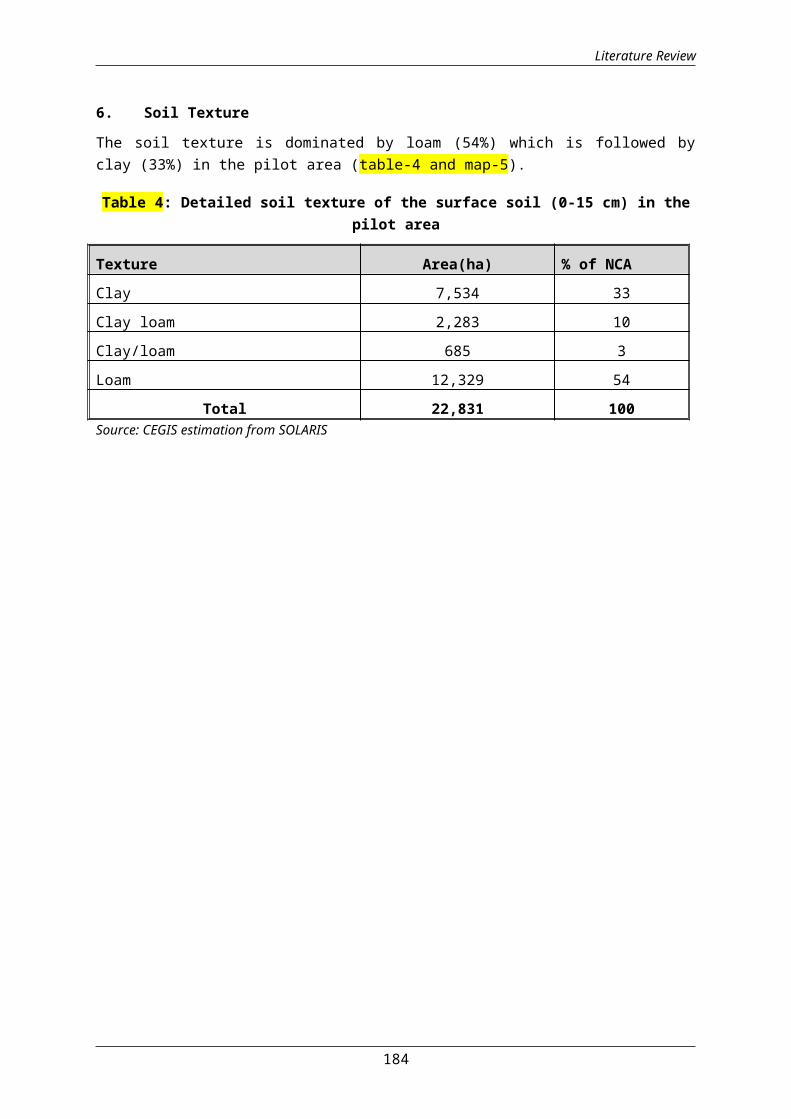
Literature Review
6. Soil Texture
The soil texture is dominated by loam (54%) which is followed byclay (33%) in the pilot area (table-4 and map-5).
Table 4: Detailed soil texture of the surface soil (0-15 cm) in thepilot area
Texture Area(ha) % of NCAClay 7,534 33Clay loam 2,283 10Clay/loam 685 3Loam 12,329 54
Total 22,831 100Source: CEGIS estimation from SOLARIS
184

Literature Review
Map 5: Soil texture of the pilot area
185
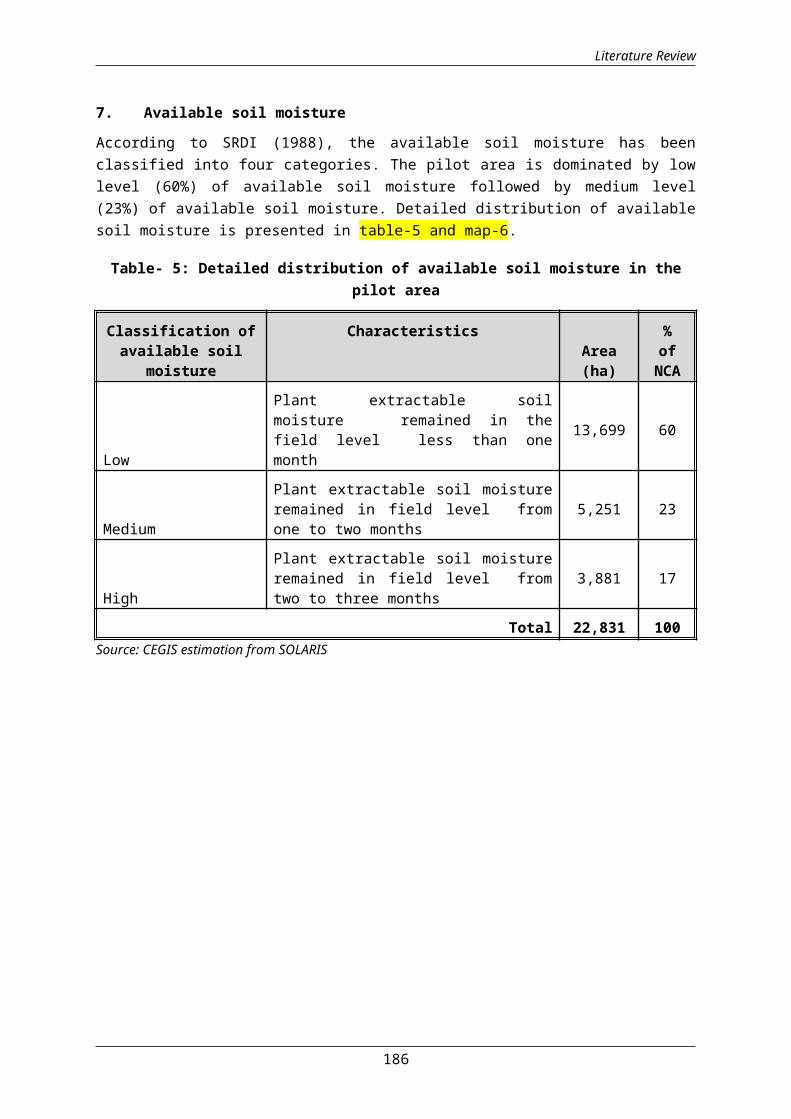
Literature Review
7. Available soil moisture
According to SRDI (1988), the available soil moisture has beenclassified into four categories. The pilot area is dominated by lowlevel (60%) of available soil moisture followed by medium level(23%) of available soil moisture. Detailed distribution of availablesoil moisture is presented in table-5 and map-6.
Table- 5: Detailed distribution of available soil moisture in thepilot area
Classification ofavailable soil
moisture
CharacteristicsArea(ha)
%ofNCA
Low
Plant extractable soilmoisture remained in thefield level less than onemonth
13,699 60
Medium
Plant extractable soil moistureremained in field level fromone to two months
5,251 23
High
Plant extractable soil moistureremained in field level fromtwo to three months
3,881 17
Total 22,831 100Source: CEGIS estimation from SOLARIS
186
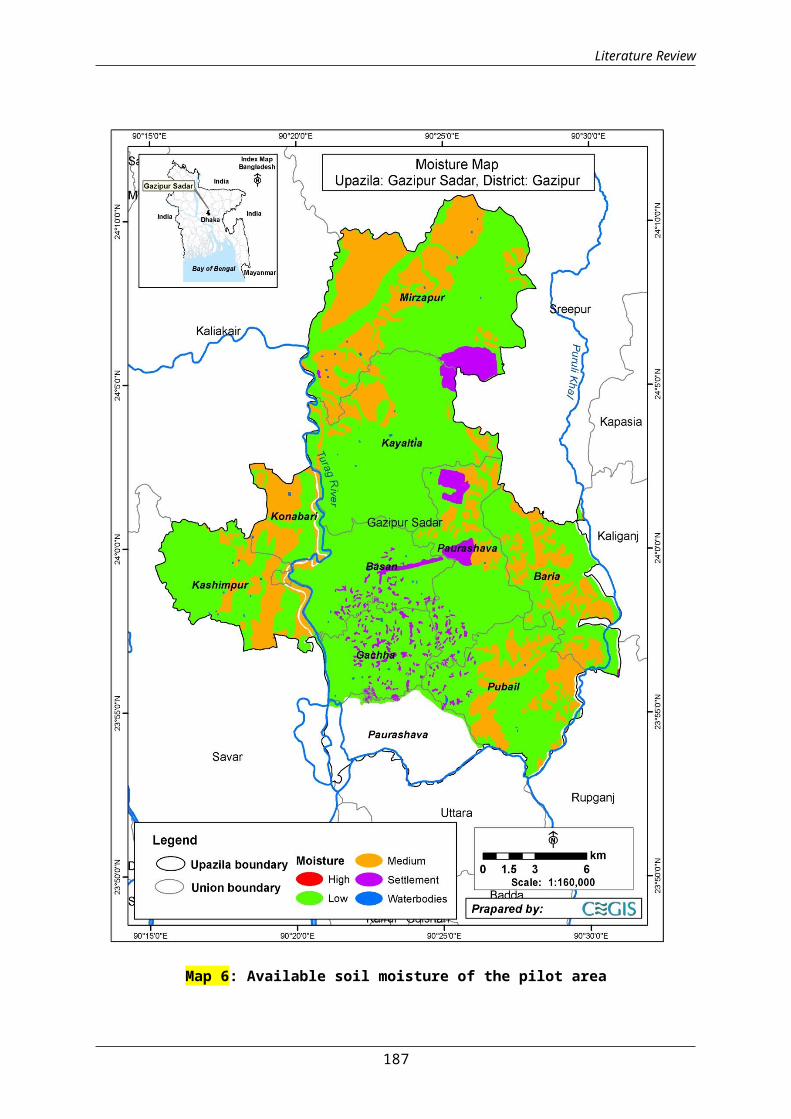
Literature Review
Map 6: Available soil moisture of the pilot area
187

Literature Review
8. Drainage Characteristics
Drainage plays a vital role in the management of soil in the projectarea. As per the SRDI (1988), the drainage characteristics have beendivided into six classes from the agriculture point of view. Most ofthe pilot area is under imperfectly drained condition (39%) which isfollowed by moderately well drained (35%). Detailed information ofdrainage characteristics is presented in table-6 and map-7.
Table 6: Detailed drainage characteristics of the pilot area
Drainageclassificat
ionDescription
Area(ha)
% ofNCA
Moderatelywell
Drained
Water drained from soil slowly. So,soil remains wet for a certain time. Inthis case, slowly permeable layer orground water remains within 1-2 metreof depth in rainy season.
7,991 35
ImperfectlyDrained
Water drained from soil badly orslowly. This soil often remains wet inrainy season due to rainfall. In normalsituation, water does not stand on landmore than 15 days at a stretch. Inrainy season, groundwater stands within1 metre at least for some time.
8,904 39
PoorlyDrained
The soil remains under water from 15days to 7/8 months. Water is drainedfrom the soil slowly. In most cases,the land remains wet/water logged for aconsiderable period of time after therainy season.
2,055 9
Very poorlydrained
h. The land remains submerged under waterfor more than 8 months and remains wetthroughout the year. 3,881 17
Total 22,831 100
Source: CEGIS estimation from SOLARIS
188
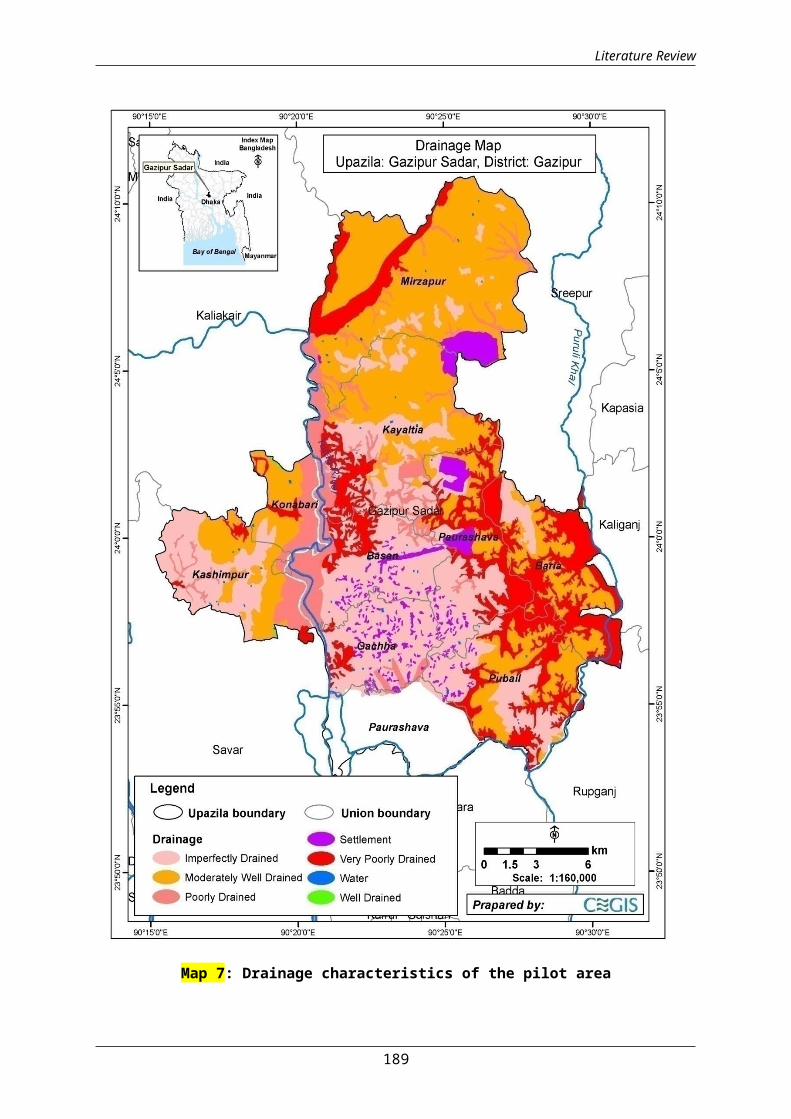
Literature Review
Map 7: Drainage characteristics of the pilot area
189

Literature Review
9. Constraint for crop production
Lowering of soil moisture in dry season, lack of organic matter andsoil nutrient, water scarcity in dry season, low water holdingcapacity, and excess permeability of water are the main constraintsfor crop production in the pilot area.
10. Present cropping patterns
There are 264 villages in Gazipur Sadar Upazila. Department ofAgricultural Extension (DAE) has 49 Agriculture Blocks (AB) wherefarmers are growing many crops in the field, but they can’t practicethe same patterns. For that reason sometimes they are losing full orpartial yield of all crops. There are cluster of fruits but farmersare not fully aware to get the optimum yield from orchard garden.There is high land where mango, pineapple, and jackfruit gardens areavailable but not well organized (hexagonal, square etc). Croppingpatterns with area of coverage are presented in table-7 below.
Dominant cropping pattern of the pilot area is Fallow-T.aman-Borowhich is practiced in 31.54% of the NCA. Next cropping pattern isFallow-Fallow-Boro which is practiced in 22.52% of the NCA. Croppingintensity is 177%. Detailed cropping pattern of the pilot area ispresented in the table-7.
Table-7: Cropping patterns with area are presented
Sl.No.
Cropping Patterns Area(ha) % of landuseKharif-I Kharif-II Rabi
1 Fallow Fallow Boro 5141 22.522 Fallow T. Aman Boro 7100 31.543 Aus T. Aman Boro 1550 6.794 Maize T. Aman Potato 65 0.285 Sugarcane Sugarcane Sugarcane 50 0.226 Vegetables T. Aman Vegetables 805 3.527 Aus T. Aman Fallow 616 2.708 Aus T. Aman Pulses 22 0.099 Aus T. Aman Oilseed 18 0.0810 Spices Spices Spices 250 1.1011 Jute T. Aman Fallow 39 0.1812 Vegetables Vegetables Vegetables 1515 6.63
190

Literature Review
13 Vegetables Fallow Vegetables 1760 7.7114 Fruits Fruits Fruits 3800 16.63
Total 22,831 100Source: UAO, DAE, Sadar, Gazipur.
Presently 40.46% area is covered by single crops. According to UAOit is possible to grow double crops about 21% areas if there isirrigation facilities. About 42.13% lands is double cropped, it ispossible to grow triple crops in about 17.41% areas if there isirrigation facilities.
Picture 1: HYV Boro crop land inthe pilot area
Picture 2:Oal kopi field in thepilot area
Picture3:Brinjal field in thepilot area
Picture4:Interculturalactivities in the HYV boro rice
field
11. Input Use in Gazipur Sadar
191

Literature Review
Inputs used for agriculture as well as horticulture crops in gazipurpilot area include seed, fertilizer, pesticide and labor (Table ?)
Table ?: Input used for horticulture crops in the Gazipur pilot area
Cropname
Fertilizer (Gm/Pit) Pesticides
Urea TSP MP Gypsum Cow dung(kg/pit)
No. ofAppli.
Liq.(ml/ha
)Mango 150 70 100 0 10 4-Mar 300-
800Litchi 0 100 0 0 5 3-Feb 100-
300Jujube 150 90 0 0 5 0 0Guava 40 90 0 0 3 0 0Jambura 150 70 60 0 3 0 0Woodapple
80 90 60 0 0 0 0
Date 50 100 50 0 0 0 0Sharifa 50 100 50 0 0 0 0Arecaplum
750 500 750 - 10 0 0
Betelnut
250 150 - - 10 0 0
Banana - 300 - - 15 4-Mar 100-200
Papaya - 400 - - 20 2-Jan 200Source: UAO, DAE and farmers interviewed, Nov, 2013
Table ?: Input used for Major field crops in the Gazipur pilot area
Cropname
Seed(Kg/ha)
Labor
(no./ha )
Fertilizer (Kg/ha) Pesticides
Urea TSP MP Gypsum
No ofapplication
Liq.(ml/ha)
Granular/
Powder(kg/ha
HYV Aus 45 120 80-100
40-60 0-40 00 0-1 600 7-8
HYVAman
45 110 40-60 - - 00 1-2 700 7-8
Lt.Aman 50 100 80-100
40-60 0-40 00 0 0 0
HYVBoro
50 140 200-250
80-100
50-75
20-30 1-2 600 7-8
Potato 1500 150 200-250
90-150
90-150
00 1-2 700 4-9
Wheat 120 100 120- 30-70 40- 00 0-1 700 7-8
192
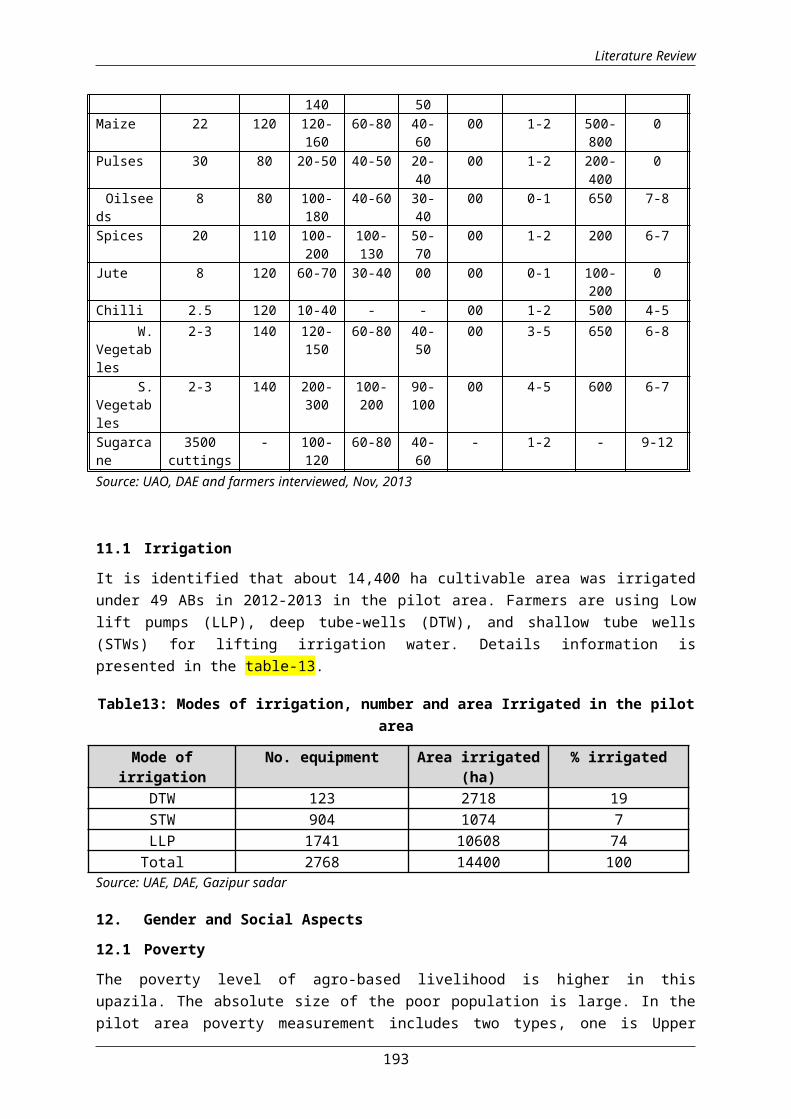
Literature Review
140 50Maize 22 120 120-
16060-80 40-
6000 1-2 500-
8000
Pulses 30 80 20-50 40-50 20-40
00 1-2 200-400
0
Oilseeds
8 80 100-180
40-60 30-40
00 0-1 650 7-8
Spices 20 110 100-200
100-130
50-70
00 1-2 200 6-7
Jute 8 120 60-70 30-40 00 00 0-1 100-200
0
Chilli 2.5 120 10-40 - - 00 1-2 500 4-5 W.Vegetables
2-3 140 120-150
60-80 40-50
00 3-5 650 6-8
S.Vegetables
2-3 140 200-300
100-200
90-100
00 4-5 600 6-7
Sugarcane
3500cuttings
- 100-120
60-80 40-60
- 1-2 - 9-12
Source: UAO, DAE and farmers interviewed, Nov, 2013
11.1 Irrigation
It is identified that about 14,400 ha cultivable area was irrigatedunder 49 ABs in 2012-2013 in the pilot area. Farmers are using Lowlift pumps (LLP), deep tube-wells (DTW), and shallow tube wells(STWs) for lifting irrigation water. Details information ispresented in the table-13.
Table13: Modes of irrigation, number and area Irrigated in the pilotarea
Mode ofirrigation
No. equipment Area irrigated(ha)
% irrigated
DTW 123 2718 19STW 904 1074 7LLP 1741 10608 74Total 2768 14400 100
Source: UAE, DAE, Gazipur sadar
12. Gender and Social Aspects
12.1 Poverty
The poverty level of agro-based livelihood is higher in thisupazila. The absolute size of the poor population is large. In thepilot area poverty measurement includes two types, one is Upper
193
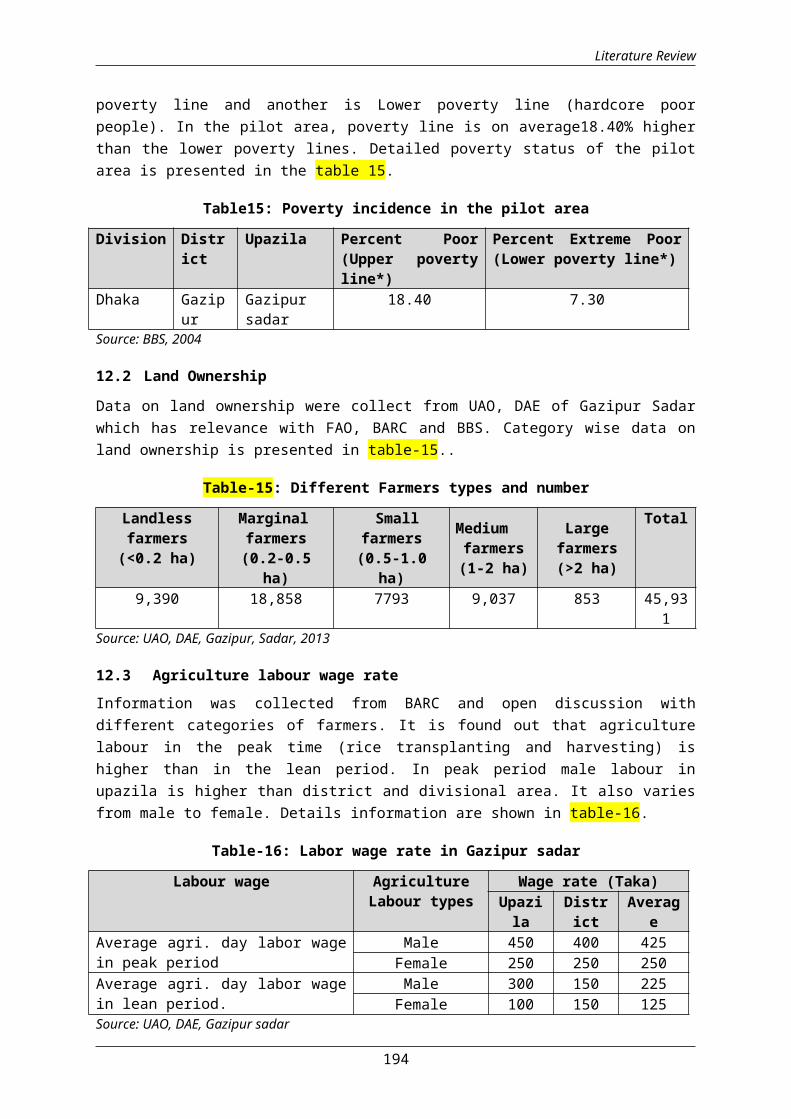
Literature Review
poverty line and another is Lower poverty line (hardcore poorpeople). In the pilot area, poverty line is on average18.40% higherthan the lower poverty lines. Detailed poverty status of the pilotarea is presented in the table 15.
Table15: Poverty incidence in the pilot area
Division District
Upazila Percent Poor(Upper povertyline*)
Percent Extreme Poor(Lower poverty line*)
Dhaka Gazipur
Gazipursadar
18.40 7.30
Source: BBS, 2004
12.2 Land Ownership
Data on land ownership were collect from UAO, DAE of Gazipur Sadarwhich has relevance with FAO, BARC and BBS. Category wise data onland ownership is presented in table-15..
Table-15: Different Farmers types and number
Landlessfarmers(<0.2 ha)
Marginalfarmers(0.2-0.5
ha)
Smallfarmers(0.5-1.0
ha)
Mediumfarmers(1-2 ha)
Largefarmers(>2 ha)
Total
9,390 18,858 7793 9,037 853 45,931
Source: UAO, DAE, Gazipur, Sadar, 2013
12.3 Agriculture labour wage rateInformation was collected from BARC and open discussion withdifferent categories of farmers. It is found out that agriculturelabour in the peak time (rice transplanting and harvesting) ishigher than in the lean period. In peak period male labour inupazila is higher than district and divisional area. It also variesfrom male to female. Details information are shown in table-16.
Table-16: Labor wage rate in Gazipur sadar
Labour wage AgricultureLabour types
Wage rate (Taka)Upazila
District
Average
Average agri. day labor wagein peak period
Male 450 400 425Female 250 250 250
Average agri. day labor wagein lean period.
Male 300 150 225Female 100 150 125
Source: UAO, DAE, Gazipur sadar
194

Literature Review
12.4 Occupational status Data on occupation were collected from BBS and UAO of DAE, Gazipuesadar. Data were analysed and shown in table-17. A lot of garmentsand industries are in sadar upazila. For this reason non-farmhouseholds is higher than other upazilas.
Table-17: Agricultural and non-agricultural occupational status
Upazila TotalHHs
HHs entirelydepending onagricultural
production. forincome (farm)
(%)
HHs entirelydepending onnon- farm
occupation. (nonfarm)
(%)
GazipurSadar
436,377 244,735 57 187,642 43
Source: BBS, 2011 and UAE, DAE, Gazipur sadar
12.5 Population engaged in different activitiesIn Gazipur District, Gazipur sadar is dominant in industry sector.Agriculture sector is third priority but a lot of scopes are thereto increase agriculture production in Gazipur upazila. The socio-economic condition of the livelihood system depends mainly on theagriculture production system, industry and services. Rural farmersin the pilot area are more dependent in agriculture sector. Most ofthe people (male and female) are working in the different industryof the southern part of the Upazila to contribute in this sector tomeet up the basic economic need for their livelihood. Detailed ofthe population (7+ years) engaged in agriculture, industry andservices activities is presented in table-18 below.
Table 18: Population engaged in agriculture, industry and services(7+ years) activities
Upazila
Total populationField of Activity(7+years)
Agriculture Industry Service
Both Male Female Male Femal
e Male Female Male Femal
eGazipurSadar
18,20,374
9,76,683
8,43,691
19,014 1,185
52,150
47,344
51,622
16,884
Source: BBS, 2011
12.6 Literacy and EducationLiteracy: Literacy percentage in the pilot area is satisfactory.According to UEO those who can write a letter to express their views
195

Literature Review
have been considered as literate. Male and female literacypercentages are presented in table-19.
196

Literature Review
Table19: Literacy rate in the pilot area
Nameof
pilotarea
Literate (can write a latter) Literacy rate(%)
Both Male Female Both
Male
FemaleYes No Yes No Yes No
Gazipur
1,067,081
531,188
609,321
253,898
455,760
277,290 67
70.75 62.6
Source: BBS, 2011 and UEO, Gazipur sadar
12.7 Education:Data were collected from BBS and UEO and analyzed according to age,to know the status of different aged childrens’ going/not going toschool. Present status of education in different aged is shown intable-20 below.
Table 20: Educational status in Gazipur sadar
Upazila
Population aged 3-5years
Population aged 6-10years
Population aged 11-14 years
Attending school
Notattendingschool
Attendingschool
Notattendingschool
Attendingschool
Notattendingschool
Male
Femal
e
Male
Femal
e
Male
Femal
e
Male
Femal
e
Male
Femal
e
Male
Femal
e
Gazipursadar
8,811
8,265
45,205
43,561
67,309
62,335
22,568
21,628
42,679
39,630
15,151
15,432
Source: BBS, 2011 and UEO, Gazipur sadar
12.8 Housing and sanitationData were collected from BBS and UPHE and analyzed. Details housingand sanitary status are shown in table-21 below.
Table-21: Sanitary and housing status of GazipurSasar
Upazila
Number ofHousehold
s
Type of Structure (%) Toilet Facility (%)
Pucka
Semi-
pucka
Kutcha
Jhupri
Sanitar
y(water-
Sanitar
y (non
water-
sealed)
Non-
sanitar
y
None
Gazipur
Sadar 436,377 16.2 57.4 24.9 1.5 37.2 52.7 9.5 0.5
12.9 Government and Non-Government Organizations
197
Literature Review
Three categories-local or regional, national and international NGO’sare working in the pilot area. There are various Government and non-Government organizations working in the upazila to village level.Govt. organizational setups is there from District to Union level.In addition, non-Govt. organizations are also working in the pilotarea which is presented in the below table-21.
198

Literature Review
Table 21: Government and non- govt. organizations
District toUnion
Govt-organizations (major) Non Govt-organizations(major)
Gazipur
Administrative Units, DAE, DoF, DLS,DoE, BBS, BRDB, LGED, BARI, BRRI, SRDI,CERDI, Seed Certification, BWDB, RHD,PKSF, Sugarcane Sub- Station DPHE, OpenUniversity, National University, BSMRAU,etc.
ASA,BRAC, GrameenBank, PROSHIKA,TMSS, GUK etc
13. Non- Govt. organizationsMost of the non-govt. organizations have their micro credit, health,crops, livestock, poultry, IGA and non-formal educational activitiesin the villages. They gave training on poultry, goat rearing,agriculture, sanitation, etc. Group formation remains the usualapproach for the NGOs in reaching and addressing development needsof the beneficiaries.
Cluster 1: High and medium high land, high yielding varieties
Normally three crops could be grown in a year in the same land inthe pilot area. We visited and observed the pilot area, discussedwith the local farmers, SAAO of DAE in the field level and in theoffice Deputy Director (DD), Training officers (TO), UpazilaAgriculture Officer (UAO), Additional Agriculture officer (AAO) andAgriculture Extension Officer (AEO) of DAE. Crops, season, andvarieties used are presented in table-22. After a long discussion itwas agreed that more new varieties of crops and recommendedfertilizer application may be adopted and improve cropping patternsis possible to fit in the pilot area.
Table 22: Crops grown in the cluster-1
Crop Season VarietiesAus Kharif-I BR-26, BRRI Dhan-42, BRRI Dhan-43, BRRI
Dhan- 48Rice Kharif-
IIBRRI Dhan-38, BRRI Dhan-39, BRRI Dha-51
Boro BRRI Dhan-28, BRRI Dhan-29, BRRI Dhan-36,BINA-7
Vegetables Kharif-I Pani kachu-Latiraj, Mukhi kachu-Bilashi,
199
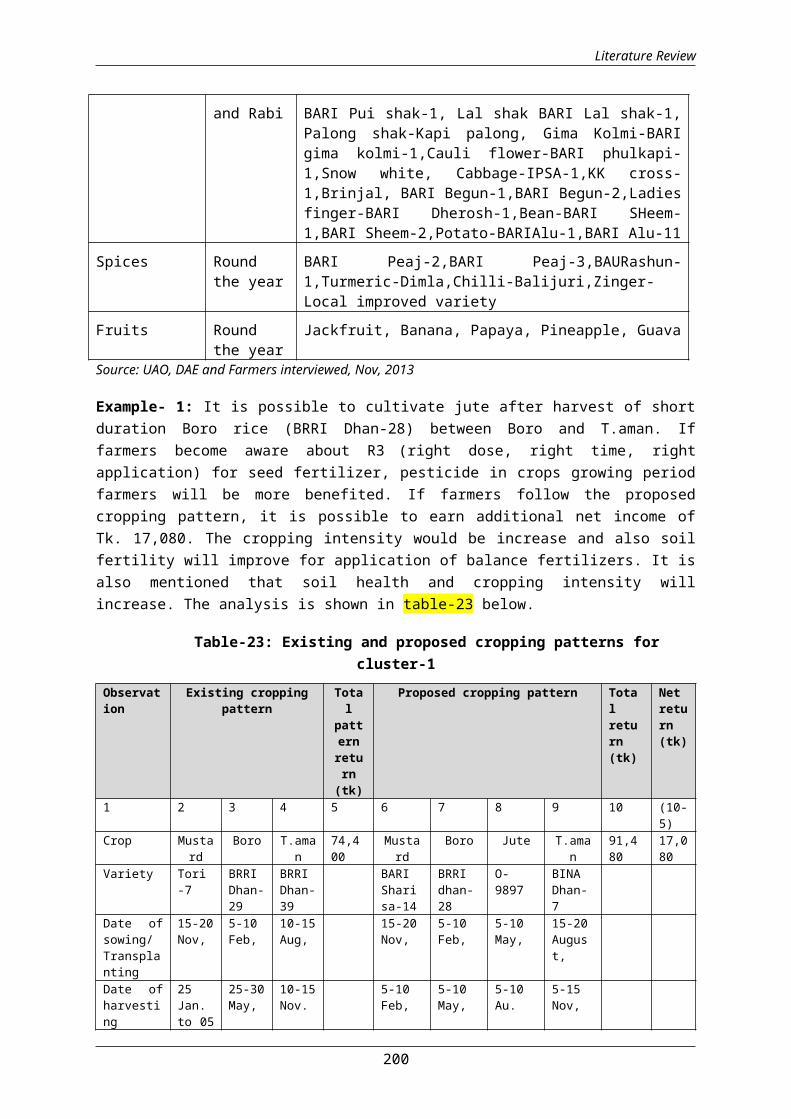
Literature Review
and Rabi BARI Pui shak-1, Lal shak BARI Lal shak-1,Palong shak-Kapi palong, Gima Kolmi-BARIgima kolmi-1,Cauli flower-BARI phulkapi-1,Snow white, Cabbage-IPSA-1,KK cross-1,Brinjal, BARI Begun-1,BARI Begun-2,Ladiesfinger-BARI Dherosh-1,Bean-BARI SHeem-1,BARI Sheem-2,Potato-BARIAlu-1,BARI Alu-11
Spices Roundthe year
BARI Peaj-2,BARI Peaj-3,BAURashun-1,Turmeric-Dimla,Chilli-Balijuri,Zinger-Local improved variety
Fruits Roundthe year
Jackfruit, Banana, Papaya, Pineapple, Guava
Source: UAO, DAE and Farmers interviewed, Nov, 2013
Example- 1: It is possible to cultivate jute after harvest of shortduration Boro rice (BRRI Dhan-28) between Boro and T.aman. Iffarmers become aware about R3 (right dose, right time, rightapplication) for seed fertilizer, pesticide in crops growing periodfarmers will be more benefited. If farmers follow the proposedcropping pattern, it is possible to earn additional net income ofTk. 17,080. The cropping intensity would be increase and also soilfertility will improve for application of balance fertilizers. It isalso mentioned that soil health and cropping intensity willincrease. The analysis is shown in table-23 below.
Table-23: Existing and proposed cropping patterns forcluster-1
Observation
Existing croppingpattern
Total
patternreturn(tk)
Proposed cropping pattern Totalreturn(tk)
Netreturn(tk)
1 2 3 4 5 6 7 8 9 10 (10-5)
Crop Mustard
Boro T.aman
74,400
Mustard
Boro Jute T.aman
91,480
17,080
Variety Tori-7
BRRIDhan-29
BRRIDhan-39
BARI Sharisa-14
BRRIdhan-28
O-9897
BINA Dhan-7
Date ofsowing/Transplanting
15-20Nov,
5-10Feb,
10-15Aug,
15-20Nov,
5-10Feb,
5-10May,
15-20August,
Date ofharvesting
25Jan.to 05
25-30May,
10-15Nov.
5-10Feb,
5-10May,
5-10Au.
5-15Nov,
200
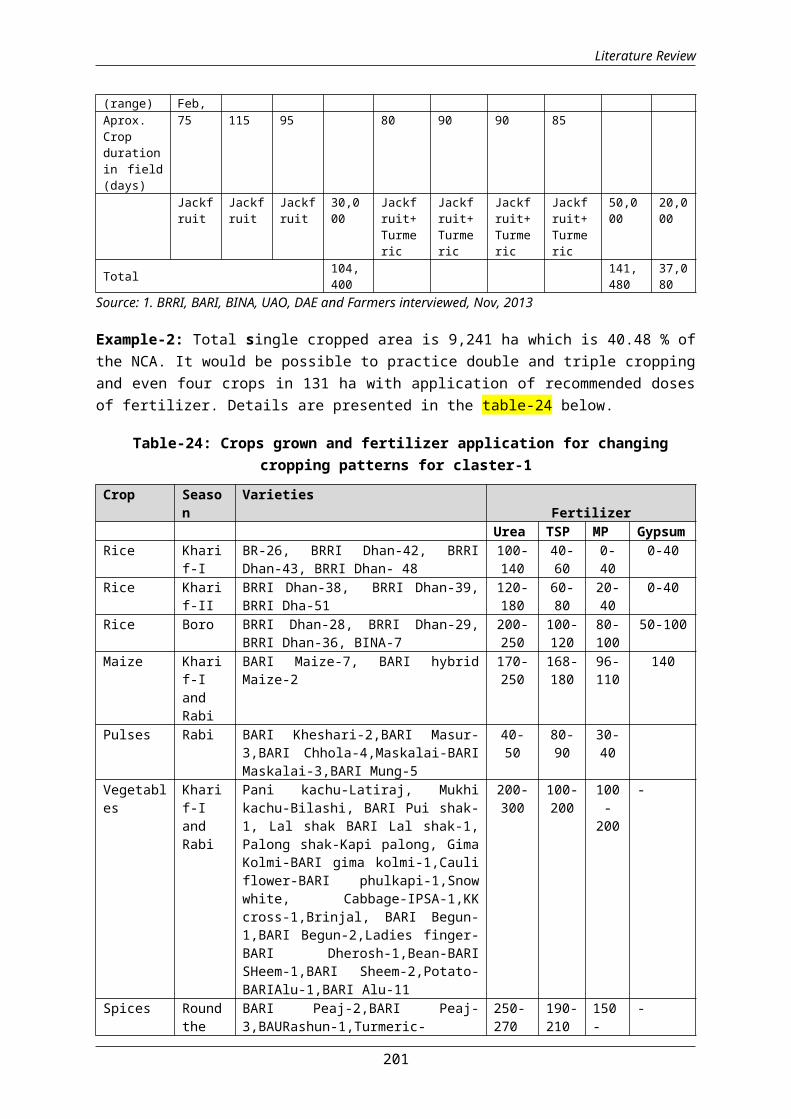
Literature Review
(range) Feb, Aprox.Cropdurationin field(days)
75 115 95 80 90 90 85
Jackfruit
Jackfruit
Jackfruit
30,000
Jackfruit+Turmeric
Jackfruit+Turmeric
Jackfruit+Turmeric
Jackfruit+Turmeric
50,000
20,000
Total 104,400
141,480
37,080
Source: 1. BRRI, BARI, BINA, UAO, DAE and Farmers interviewed, Nov, 2013
Example-2: Total single cropped area is 9,241 ha which is 40.48 % ofthe NCA. It would be possible to practice double and triple croppingand even four crops in 131 ha with application of recommended dosesof fertilizer. Details are presented in the table-24 below.
Table-24: Crops grown and fertilizer application for changingcropping patterns for claster-1
Crop Season
VarietiesFertilizer
Urea TSP MP GypsumRice Khari
f-IBR-26, BRRI Dhan-42, BRRIDhan-43, BRRI Dhan- 48
100-140
40-60
0-40
0-40
Rice Kharif-II
BRRI Dhan-38, BRRI Dhan-39,BRRI Dha-51
120-180
60-80
20-40
0-40
Rice Boro BRRI Dhan-28, BRRI Dhan-29,BRRI Dhan-36, BINA-7
200-250
100-120
80-100
50-100
Maize Kharif-IandRabi
BARI Maize-7, BARI hybridMaize-2
170-250
168-180
96-110
140
Pulses Rabi BARI Kheshari-2,BARI Masur-3,BARI Chhola-4,Maskalai-BARIMaskalai-3,BARI Mung-5
40-50
80-90
30-40
Vegetables
Kharif-IandRabi
Pani kachu-Latiraj, Mukhikachu-Bilashi, BARI Pui shak-1, Lal shak BARI Lal shak-1,Palong shak-Kapi palong, GimaKolmi-BARI gima kolmi-1,Cauliflower-BARI phulkapi-1,Snowwhite, Cabbage-IPSA-1,KKcross-1,Brinjal, BARI Begun-1,BARI Begun-2,Ladies finger-BARI Dherosh-1,Bean-BARISHeem-1,BARI Sheem-2,Potato-BARIAlu-1,BARI Alu-11
200-300
100-200
100-200
-
Spices Roundthe
BARI Peaj-2,BARI Peaj-3,BAURashun-1,Turmeric-
250-270
190-210
150-
-
201
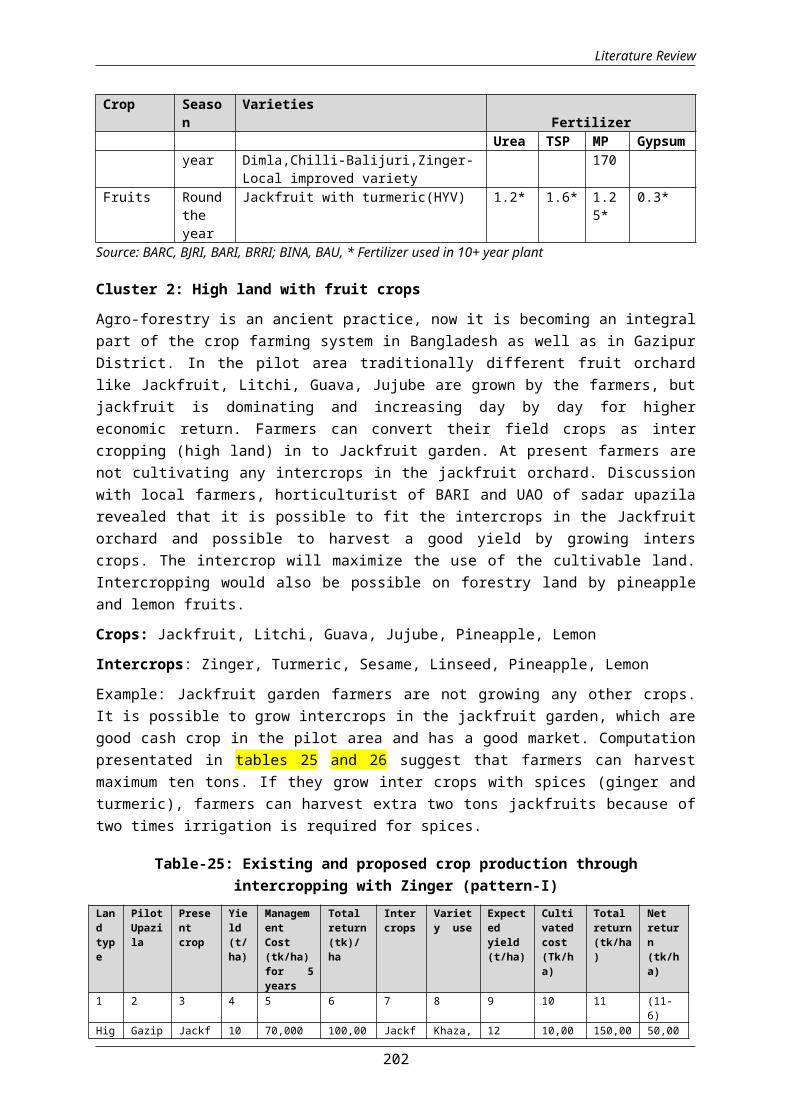
Literature Review
Crop Season
VarietiesFertilizer
Urea TSP MP Gypsumyear Dimla,Chilli-Balijuri,Zinger-
Local improved variety170
Fruits Roundtheyear
Jackfruit with turmeric(HYV) 1.2* 1.6* 1.25*
0.3*
Source: BARC, BJRI, BARI, BRRI; BINA, BAU, * Fertilizer used in 10+ year plant
Cluster 2: High land with fruit crops
Agro-forestry is an ancient practice, now it is becoming an integralpart of the crop farming system in Bangladesh as well as in GazipurDistrict. In the pilot area traditionally different fruit orchardlike Jackfruit, Litchi, Guava, Jujube are grown by the farmers, butjackfruit is dominating and increasing day by day for highereconomic return. Farmers can convert their field crops as intercropping (high land) in to Jackfruit garden. At present farmers arenot cultivating any intercrops in the jackfruit orchard. Discussionwith local farmers, horticulturist of BARI and UAO of sadar upazilarevealed that it is possible to fit the intercrops in the Jackfruitorchard and possible to harvest a good yield by growing interscrops. The intercrop will maximize the use of the cultivable land.Intercropping would also be possible on forestry land by pineappleand lemon fruits.
Crops: Jackfruit, Litchi, Guava, Jujube, Pineapple, Lemon
Intercrops: Zinger, Turmeric, Sesame, Linseed, Pineapple, Lemon
Example: Jackfruit garden farmers are not growing any other crops.It is possible to grow intercrops in the jackfruit garden, which aregood cash crop in the pilot area and has a good market. Computationpresentated in tables 25 and 26 suggest that farmers can harvestmaximum ten tons. If they grow inter crops with spices (ginger andturmeric), farmers can harvest extra two tons jackfruits because oftwo times irrigation is required for spices.
Table-25: Existing and proposed crop production throughintercropping with Zinger (pattern-I)
Landtype
PilotUpazila
Presentcrop
Yield(t/ha)
ManagementCost(tk/ha)for 5years
Totalreturn(tk)/ha
Intercrops
Variety use
Expectedyield(t/ha)
Cultivatedcost(Tk/ha)
Totalreturn(tk/ha)
Netreturn(tk/ha)
1 2 3 4 5 6 7 8 9 10 11 (11-6)
Hig Gazip Jackf 10 70,000 100,00 Jackf Khaza, 12 10,00 150,00 50,00
202

Literature Review
hland(F0)
urSadar
ruit 0 ruit Adharosha,Gala(Localimprovedvariety)
0 0 0
Zinger
BARI 2.5 50,000
100,000
50,000
Total7,0000
10,000 60,000
250,000
100,000
Source: BARI, UAO, DAE and Farmers interviewed, Nov, 2013
Table-26: Existing and proposed crops production throughintercropping with turmeric (pattern-II)
Landtype
PilotUpazila
Presentcrop
Yield(t/ha)
ManagementCost(tk/ha)for 5years
Totalreturn(tk)/ha
Intercrops
Varietyuse
Expectedyield(t/ha)
Cultivatedcost(Tk/ha)
Totalreturn(tk/ha)
Netreturn(tk/ha)
1 2 3 4 5 6 7 8 9 10 11 (11-6)
Highland(F0)
GazipurSadar
Jackfruit
10 70,000 100,000
Jackfruit
Khaza,Adharosha,Gala,Localimprovedvariety
12 10,000
150,000
50,000
Turmeric
BARI 2.5 17,500
25,000 7,500
Total 70,000 10,000 27,500
175,000
57,500
Source: BARI, UAO, DAE and Farmers interviewed, Nov, 2013
203
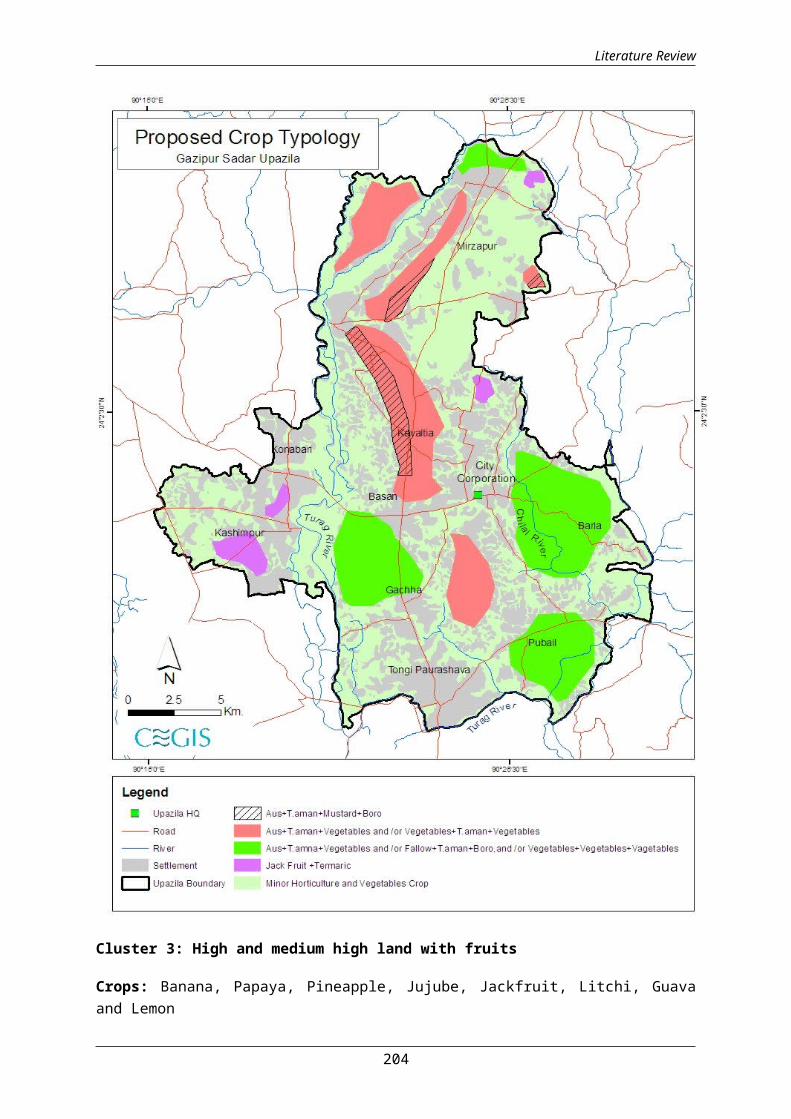
Literature Review
Cluster 3: High and medium high land with fruits
Crops: Banana, Papaya, Pineapple, Jujube, Jackfruit, Litchi, Guavaand Lemon
204

Literature Review
Example: There are some other gardens in the pilot area like Banana,Papaya, Pineapple and Jujube. There are some fallow lands that couldcome under crop production leading to increase in horticultural croparea and production. Ultimately farmers will be benefited andlivelihood will change. Local farmer’s could earn tk.375,000 withthe same management practices and same input use. A short analysisis shown in the below table 27.
Table 27: Additional land coverage for horticulture crops
Pre-work Propose Difference
Crops Name
Area (ha)
Yield (t/ha.)
Gross return(Taka)
Crops Name
Area (ha)
Yield (t/ha.)
Gross return(Taka)
Area (ha)
Yield (t/ha)
Extra income
1 2 3 4 5 6 7 8 (6-2) (7-3) (8-4)
Banana 5616.2
150,000 Banana 60 17
160,000 4 0.8
10,000
Pineapple
17.1
14.8
200,000
Pineapple
17.5 15
225,000 0.4 0.2
25,000
Papaya 1.195.5
100,000 Papaya 1.8 97
110,000 0.7 1.5
10,000
Jackfruit 9.2
78.3
100,000
Jackfruit 9.6 80
105,000 0.4 1.7
5,000
Litchi 1.723.5
200,000 Litchi 2 24
220,000 0.3 0.5
20,000
Guava 5.825.2
150,000 Guava 6
25.5
175,000 0.2 0.3
25,000
Jujube - 0.5 5 50,000 0.5 550,000
Melon 4.4 31120,00
0 Melon 5 35150,00
0 0.6 430,000
Lemon - Lemon 0.5 20200,00
0 - -200,000
Total 1,020,000
1,395,000
375,000
Source: BARI, UAO, DAE and Farmers interviewed, Nov, 2013
Cluster 4: High, medium high and medium low land
205

Literature Review
Following crops are suggested for the above land types
Cereal and oilseedscrops withdifferent seasons
Aus: BR-26, BRRI Dhan-42, BRRI Dhan-43, BRRIDhan- 48 Aman: BRRI Dhan-38, BRRI Dhan-39,BRRI Dha-51, BINA-7
Boro: BRRI Dhan-28, BRRI Dhan-29, BRRI Dhan-36
Oilseeds: Tori-7, BARI Sharisha-14
Maize: BARI Maize-7, BARI hybrid maize-2
Differentvegetables cropswith seasons
Vegetables crops: Bitter gourd, Indianspinach, Yard long bean, Lalshak, Snake gourd,Ash gourd, Bottle gourd, Sweet gourd, Dhundal,Spinach, Amaranthus.
Presently 40.46% area is covered by single crops. According to UAO,it is possible to grow double crops in about 21% areas if there isirrigation facilities. About 42.13% lands is double cropped, it ispossible to grow triple crops in 17.41% areas if there is irrigationfacilities (table-28).
Table-28: Proposed cropping patterns for cluster 4.
Cropping PatternsKharif-I Kharif-II RabiFallow Vegetables BoroMaize T.aman PotatoAus Taman Mustard
Vegetables Vegetables VegetablesSource: BRRI, BARI, UAO, DAE and Farmers interviewed, Nov, 2013
Cluster 5: Medium high, medium low and low land
Cereal, pulsesand jute cropswith differentseasons
Aus: BR-26, BRRI Dhan-42, BRRI Dhan-43, BRRI Dhan-48Aman: BRRI Dhan-38, BRRI Dhan-39, BRRI Dha-51 Boro: BRRI Dhan-28, BRRI Dhan-29, BRRI Dhan-36,BINA-7 Pulses: BARI Kheshari-2, BARI Masur-3, BARIChhola-4, Maskalai-BARI Maskalai-3, BARI Mung-5Jute: CVL-1, O-9897
206
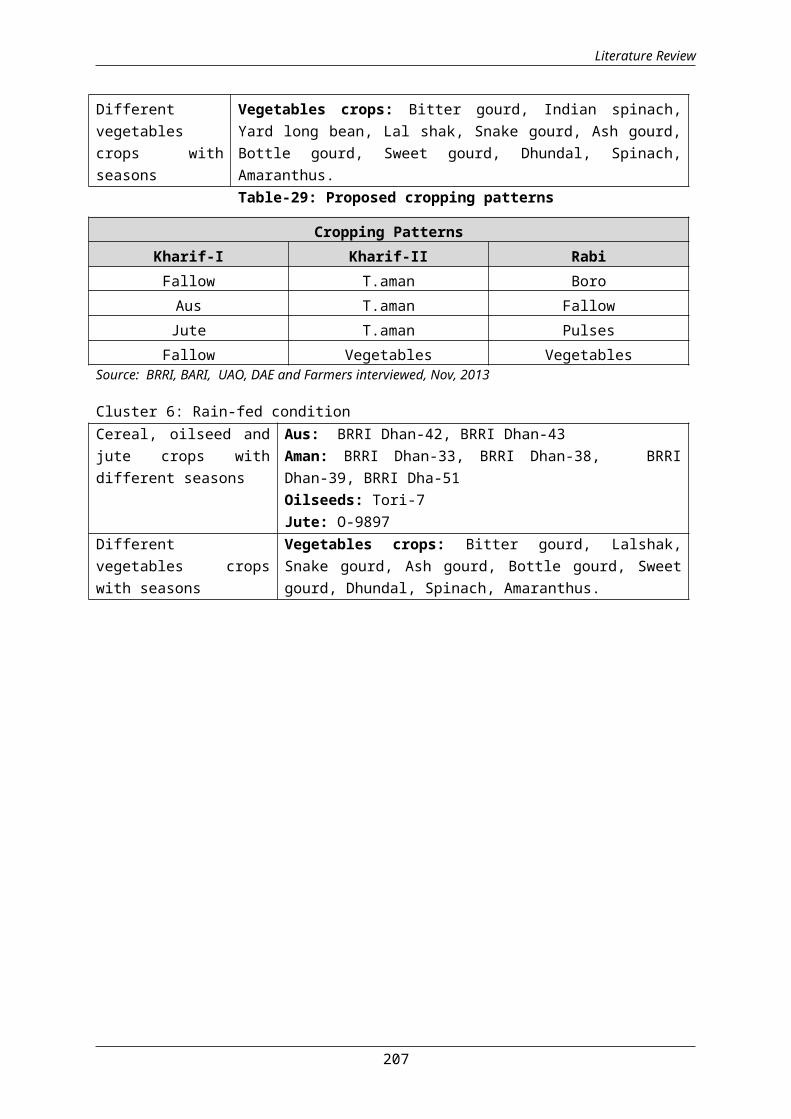
Literature Review
Differentvegetablescrops withseasons
Vegetables crops: Bitter gourd, Indian spinach,Yard long bean, Lal shak, Snake gourd, Ash gourd,Bottle gourd, Sweet gourd, Dhundal, Spinach,Amaranthus.Table-29: Proposed cropping patterns
Cropping PatternsKharif-I Kharif-II RabiFallow T.aman BoroAus T.aman FallowJute T.aman PulsesFallow Vegetables Vegetables
Source: BRRI, BARI, UAO, DAE and Farmers interviewed, Nov, 2013
Cluster 6: Rain-fed conditionCereal, oilseed andjute crops withdifferent seasons
Aus: BRRI Dhan-42, BRRI Dhan-43Aman: BRRI Dhan-33, BRRI Dhan-38, BRRIDhan-39, BRRI Dha-51 Oilseeds: Tori-7Jute: O-9897
Differentvegetables cropswith seasons
Vegetables crops: Bitter gourd, Lalshak,Snake gourd, Ash gourd, Bottle gourd, Sweetgourd, Dhundal, Spinach, Amaranthus.
207
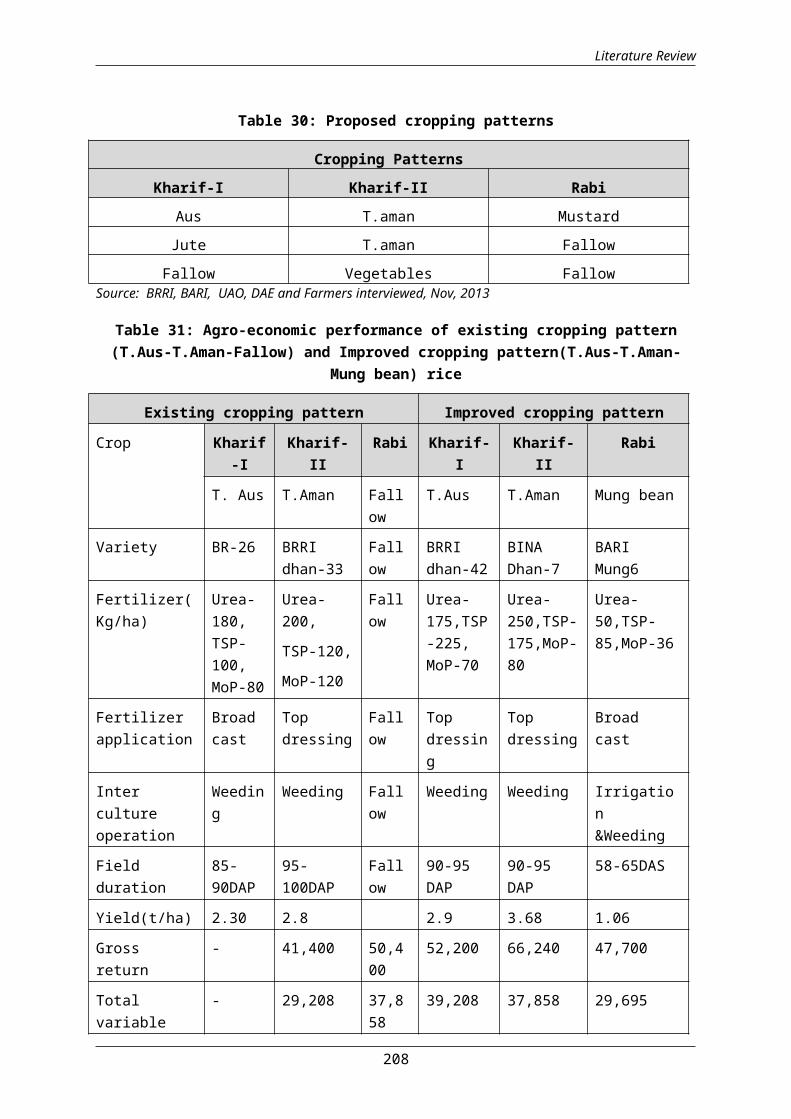
Literature Review
Table 30: Proposed cropping patterns
Cropping PatternsKharif-I Kharif-II Rabi
Aus T.aman MustardJute T.aman FallowFallow Vegetables Fallow
Source: BRRI, BARI, UAO, DAE and Farmers interviewed, Nov, 2013
Table 31: Agro-economic performance of existing cropping pattern(T.Aus-T.Aman-Fallow) and Improved cropping pattern(T.Aus-T.Aman-
Mung bean) rice
Existing cropping pattern Improved cropping pattern
Crop Kharif-I
Kharif-II
Rabi Kharif-I
Kharif-II
Rabi
T. Aus T.Aman Fallow
T.Aus T.Aman Mung bean
Variety BR-26 BRRIdhan-33
Fallow
BRRIdhan-42
BINADhan-7
BARIMung6
Fertilizer(Kg/ha)
Urea-180,TSP-100,MoP-80
Urea-200,
TSP-120,
MoP-120
Fallow
Urea-175,TSP-225,MoP-70
Urea-250,TSP-175,MoP-80
Urea-50,TSP-85,MoP-36
Fertilizerapplication
Broadcast
Topdressing
Fallow
Topdressing
Topdressing
Broadcast
Intercultureoperation
Weeding
Weeding Fallow
Weeding Weeding Irrigation&Weeding
Fieldduration
85-90DAP
95-100DAP
Fallow
90-95DAP
90-95DAP
58-65DAS
Yield(t/ha) 2.30 2.8 2.9 3.68 1.06
Grossreturn
- 41,400 50,400
52,200 66,240 47,700
Totalvariable
- 29,208 37,858
39,208 37,858 29,695
208
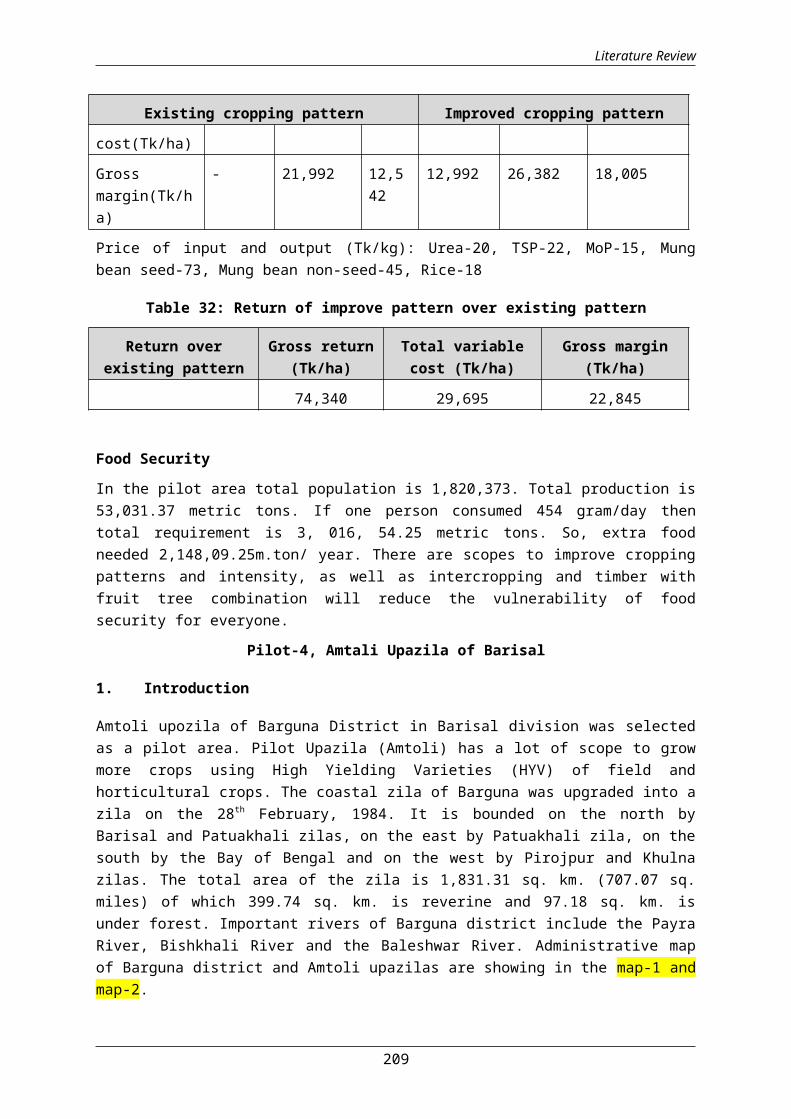
Literature Review
Existing cropping pattern Improved cropping pattern
cost(Tk/ha)
Grossmargin(Tk/ha)
- 21,992 12,542
12,992 26,382 18,005
Price of input and output (Tk/kg): Urea-20, TSP-22, MoP-15, Mungbean seed-73, Mung bean non-seed-45, Rice-18
Table 32: Return of improve pattern over existing pattern
Return overexisting pattern
Gross return(Tk/ha)
Total variablecost (Tk/ha)
Gross margin(Tk/ha)
74,340 29,695 22,845
Food Security
In the pilot area total population is 1,820,373. Total production is53,031.37 metric tons. If one person consumed 454 gram/day thentotal requirement is 3, 016, 54.25 metric tons. So, extra foodneeded 2,148,09.25m.ton/ year. There are scopes to improve croppingpatterns and intensity, as well as intercropping and timber withfruit tree combination will reduce the vulnerability of foodsecurity for everyone.
Pilot-4, Amtali Upazila of Barisal
1. Introduction
Amtoli upozila of Barguna District in Barisal division was selectedas a pilot area. Pilot Upazila (Amtoli) has a lot of scope to growmore crops using High Yielding Varieties (HYV) of field andhorticultural crops. The coastal zila of Barguna was upgraded into azila on the 28th February, 1984. It is bounded on the north byBarisal and Patuakhali zilas, on the east by Patuakhali zila, on thesouth by the Bay of Bengal and on the west by Pirojpur and Khulnazilas. The total area of the zila is 1,831.31 sq. km. (707.07 sq.miles) of which 399.74 sq. km. is reverine and 97.18 sq. km. isunder forest. Important rivers of Barguna district include the PayraRiver, Bishkhali River and the Baleshwar River. Administrative mapof Barguna district and Amtoli upazilas are showing in the map-1 andmap-2.
209
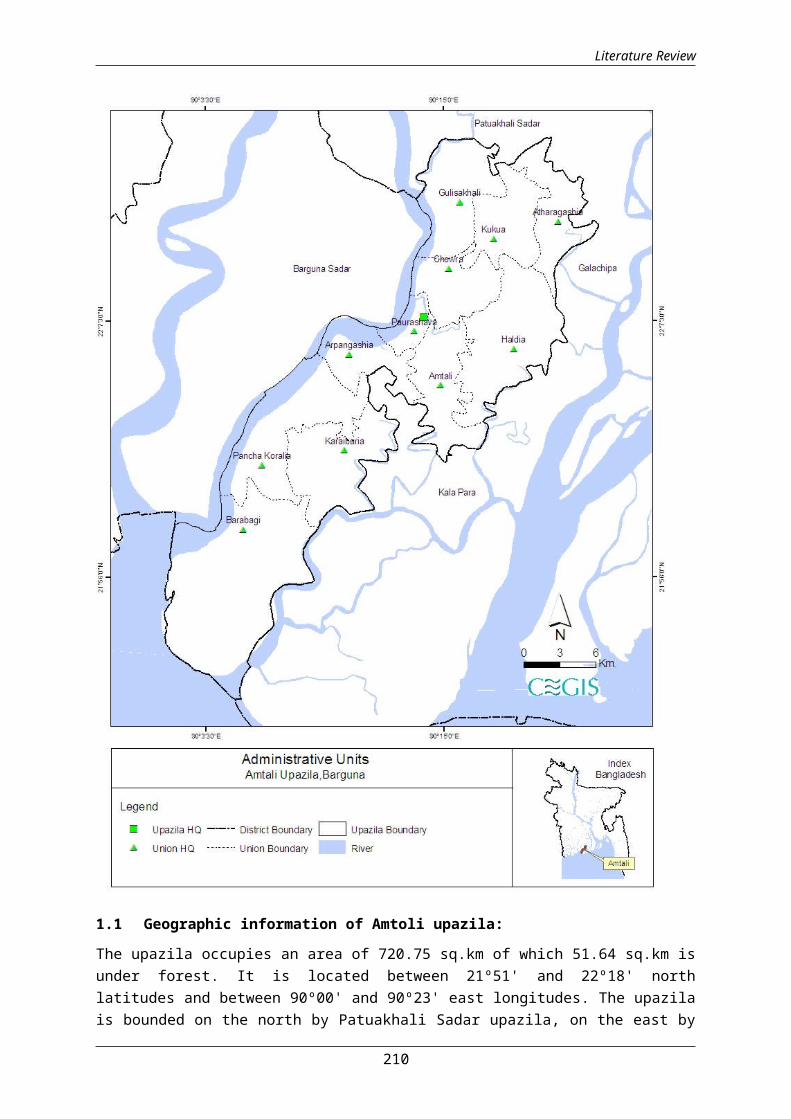
Literature Review
1.1 Geographic information of Amtoli upazila:
The upazila occupies an area of 720.75 sq.km of which 51.64 sq.km isunder forest. It is located between 21º51' and 22º18' northlatitudes and between 90º00' and 90º23' east longitudes. The upazilais bounded on the north by Patuakhali Sadar upazila, on the east by
210

Literature Review
Galachipa and Kalapara upazilas of Patuakhali zila, on the south bythe Bay of Bengal and on the west by Barguna sadar upazila andMirzaganj upazila of Patuakhali zila. (BBS, 2011).
1.2 Demographic information of Amtoli upazila:
Data were collected from Upazila Agriculture Officer, 2013 and BBS,2011. Total population in 2011 was 270,802 of them male is 132,168and female is 138,634 where as in 2001 total population was 259,757where male was 132,017 and female was 127,740. Table-1 indicatesthat population is increasing.
Table-1: Population in the pilot area
Population 2001 2011 Difference
Both Sex 2,59,757 2,70,802 11045
Male 1,32,017 1,32,168 151
Female 1,27,740 1,38,634 10894Source: UAO, Amtoli 2013 and BBS, 2011
2. Meteorology
2.1 Rainfall
Data on rainfall of last five years (2004 to 2008) were collectedfrom Bangladesh Meteorological Department (BMD) Barisal which showsignificant rainfall during the months of July to September. On theother hand, very little rainfall or no rain occurs during the periodNovember to February. Last five years maximum rainfall occurred in2004 in the month of September.
Source: BMD, Barisal
2.2 Temperature
211

Literature Review
Maximum: Below figure indicated that seasonal variation oftemperature is large. Mean data of last five years from 2006 to 2010indicated that the mean monthly maximum temperature was 34.74°C inMay and that was the warmest month (Figure-2).
Source: BMD, Barisal
Minimum:
The lowest ever recorded minimum temperature was 11.1°C recorded inthe month of January, 2007. Details are shown in figure-3.
Source: BMD, Barisal
2.3 Humidity
The humidity data of Amtali was collected from BMD and plotted ingraph shown below. From the figure it is observed that June, July,August, September, October and November are the maximum humid monthswhen average monthly relative humidity varies from 82.97 to 90.98%.The minimum average humidity occurs in the period from December toMarch which was in the range of 71.17 to 80.53 %. The monthly
212
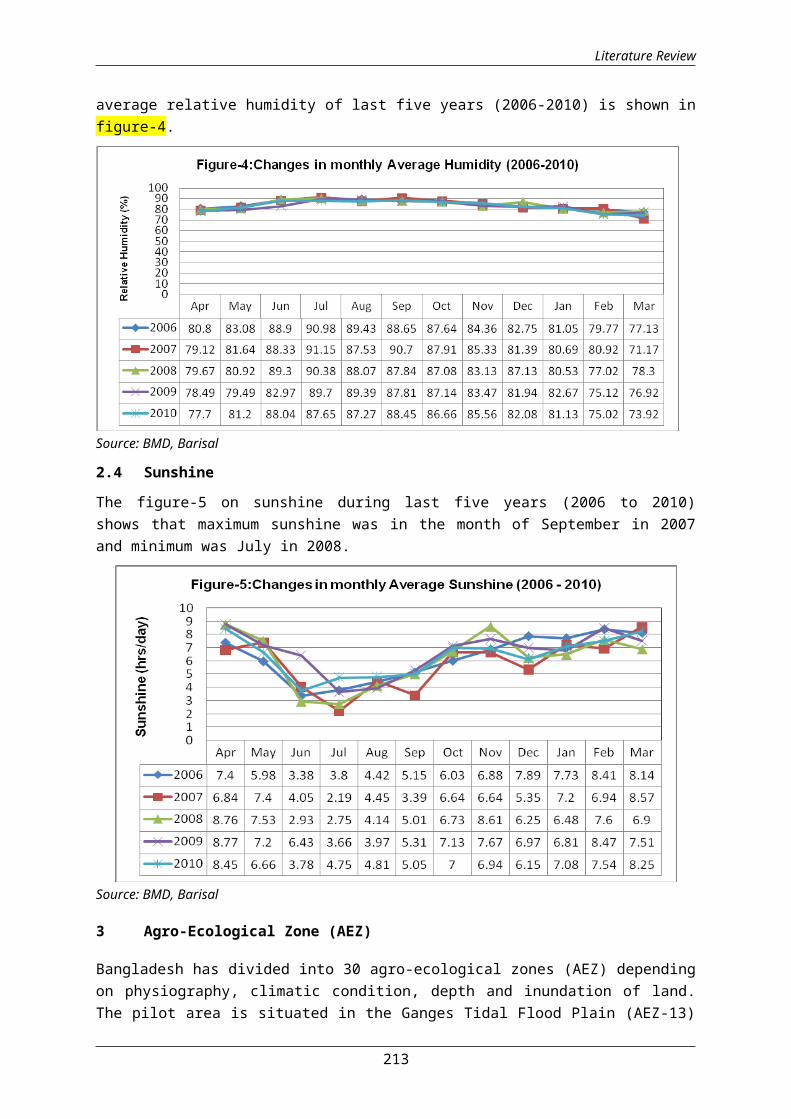
Literature Review
average relative humidity of last five years (2006-2010) is shown infigure-4.
Source: BMD, Barisal
2.4 Sunshine
The figure-5 on sunshine during last five years (2006 to 2010)shows that maximum sunshine was in the month of September in 2007and minimum was July in 2008.
Source: BMD, Barisal
3 Agro-Ecological Zone (AEZ)
Bangladesh has divided into 30 agro-ecological zones (AEZ) dependingon physiography, climatic condition, depth and inundation of land.The pilot area is situated in the Ganges Tidal Flood Plain (AEZ-13)
213

Literature Review
as shown in map-3. Details descriptions of AEZ are given below andcrops (field and horticultural) grown in the pilot area according toAEZs are presented in the table-2.
214
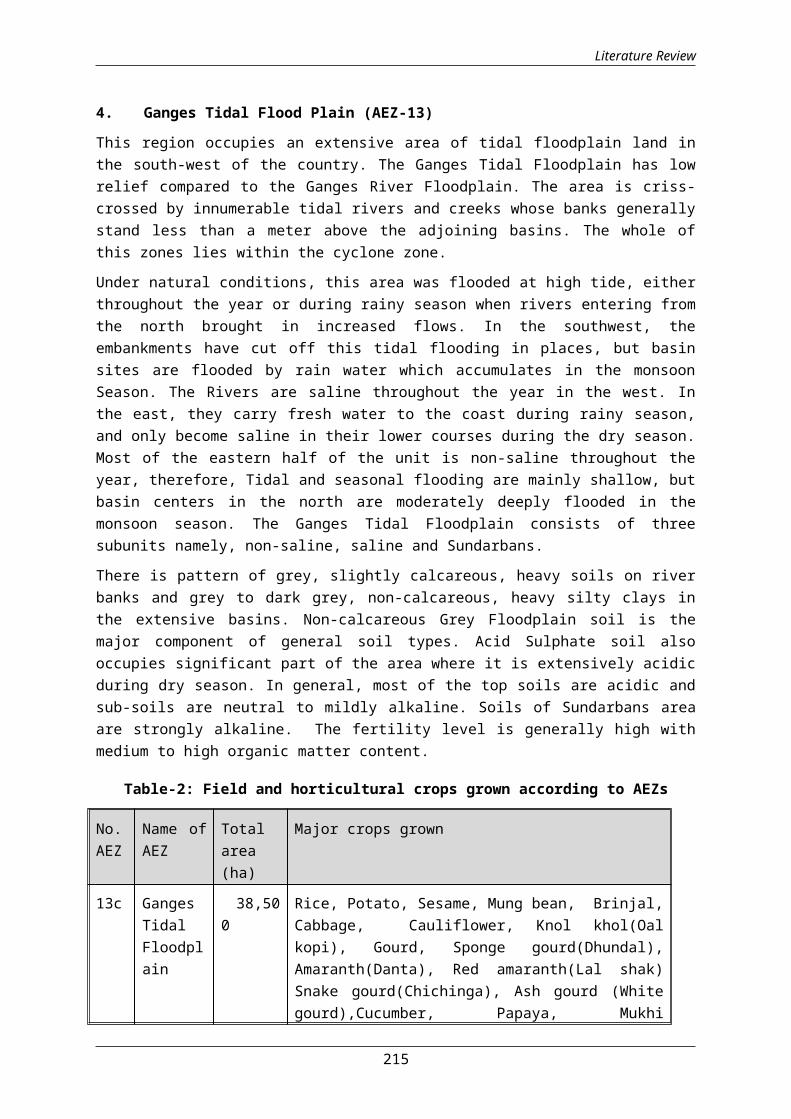
Literature Review
4. Ganges Tidal Flood Plain (AEZ-13)
This region occupies an extensive area of tidal floodplain land inthe south-west of the country. The Ganges Tidal Floodplain has lowrelief compared to the Ganges River Floodplain. The area is criss-crossed by innumerable tidal rivers and creeks whose banks generallystand less than a meter above the adjoining basins. The whole ofthis zones lies within the cyclone zone.
Under natural conditions, this area was flooded at high tide, eitherthroughout the year or during rainy season when rivers entering fromthe north brought in increased flows. In the southwest, theembankments have cut off this tidal flooding in places, but basinsites are flooded by rain water which accumulates in the monsoonSeason. The Rivers are saline throughout the year in the west. Inthe east, they carry fresh water to the coast during rainy season,and only become saline in their lower courses during the dry season.Most of the eastern half of the unit is non-saline throughout theyear, therefore, Tidal and seasonal flooding are mainly shallow, butbasin centers in the north are moderately deeply flooded in themonsoon season. The Ganges Tidal Floodplain consists of threesubunits namely, non-saline, saline and Sundarbans.
There is pattern of grey, slightly calcareous, heavy soils on riverbanks and grey to dark grey, non-calcareous, heavy silty clays inthe extensive basins. Non-calcareous Grey Floodplain soil is themajor component of general soil types. Acid Sulphate soil alsooccupies significant part of the area where it is extensively acidicduring dry season. In general, most of the top soils are acidic andsub-soils are neutral to mildly alkaline. Soils of Sundarbans areaare strongly alkaline. The fertility level is generally high withmedium to high organic matter content.
Table-2: Field and horticultural crops grown according to AEZs
No.AEZ
Name ofAEZ
Totalarea(ha)
Major crops grown
13c GangesTidalFloodplain
38,500
Rice, Potato, Sesame, Mung bean, Brinjal,Cabbage, Cauliflower, Knol khol(Oalkopi), Gourd, Sponge gourd(Dhundal),Amaranth(Danta), Red amaranth(Lal shak)Snake gourd(Chichinga), Ash gourd (Whitegourd),Cucumber, Papaya, Mukhi
215
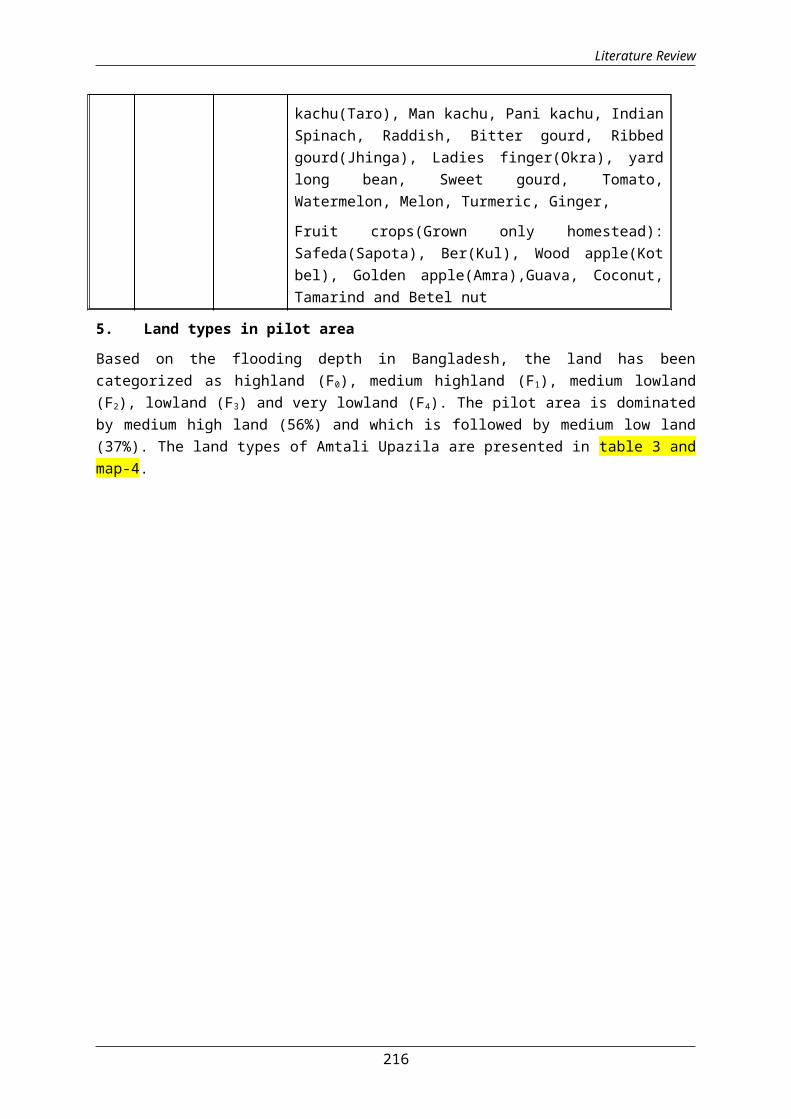
Literature Review
kachu(Taro), Man kachu, Pani kachu, IndianSpinach, Raddish, Bitter gourd, Ribbedgourd(Jhinga), Ladies finger(Okra), yardlong bean, Sweet gourd, Tomato,Watermelon, Melon, Turmeric, Ginger,
Fruit crops(Grown only homestead):Safeda(Sapota), Ber(Kul), Wood apple(Kotbel), Golden apple(Amra),Guava, Coconut,Tamarind and Betel nut
5. Land types in pilot area
Based on the flooding depth in Bangladesh, the land has beencategorized as highland (F0), medium highland (F1), medium lowland(F2), lowland (F3) and very lowland (F4). The pilot area is dominatedby medium high land (56%) and which is followed by medium low land(37%). The land types of Amtali Upazila are presented in table 3 andmap-4.
216

Literature Review
Table 3: Detailed land type of the pilot area
Land type Area(ha) % of NCA
High land (F0) 2,695 7
Medium high land (F1) 21,560 56
Medium low land (F2) 14,245 37
Total 38,500 100Source: DAE, Amtali; 2014
6. Land use in the pilot area
Total land area is 72,000 ha and net cultivable land is about 53% inthe pilot area. The Settlement, Road & Infrastructure, Water bodies,Forest and Orchard area is about 13%, 2%, 26% and 1% of the pilotarea respectively. Detailed land use of the pilot area is presentedin table-4 and map-5.
Table-4: Detailed land use of the pilot area
Land use Area (ha) Percent
Settlement 9,450 13
Road, Infrastructure & other structure 1475 2
Water bodies(beel, River) 18,755 26
Forest 700 1
Orchard 520 1
Permanent fallow 175 0
Others 475 1
Current fallow 1950 3
Net cultivated area 38,500 53
Gross area 72,000 100Source: UAO, DAE, Amtali
6. Soil Texture
The soil texture is dominated by clay loam (60%) followed by clay(40%) in the pilot area. Detailed data on soil texture is presentedin table-5.
217
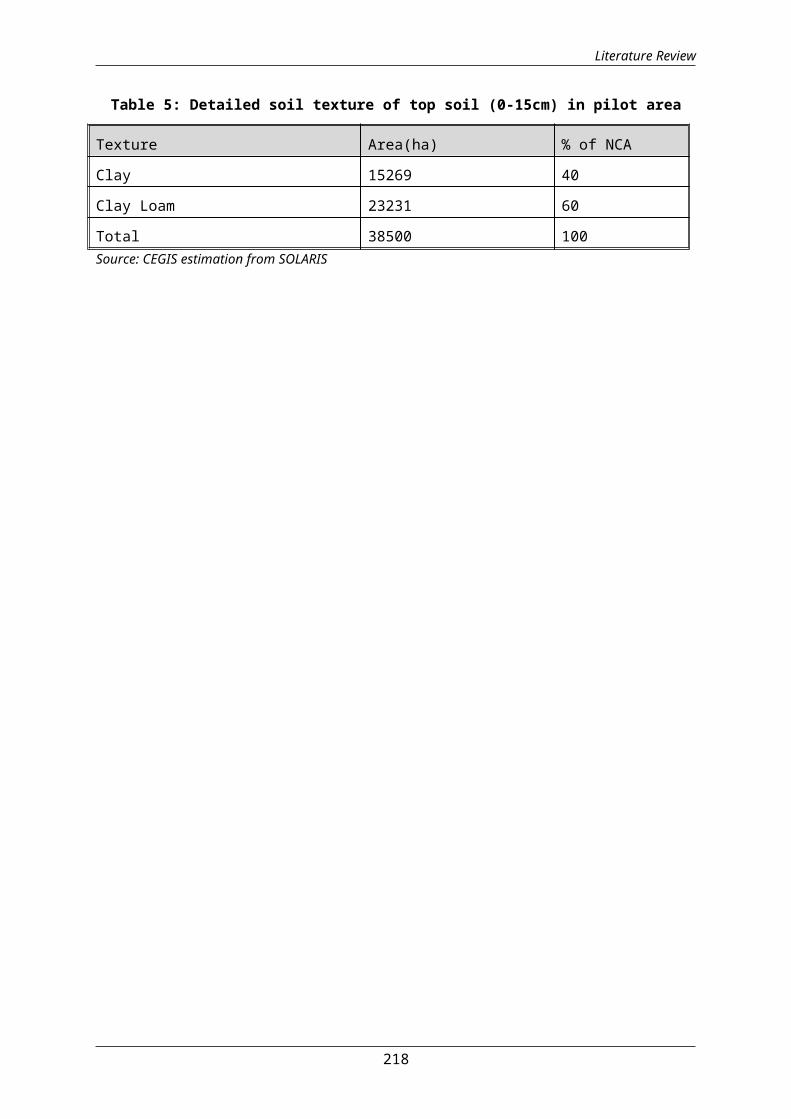
Literature Review
Table 5: Detailed soil texture of top soil (0-15cm) in pilot area
Texture Area(ha) % of NCA
Clay 15269 40
Clay Loam 23231 60
Total 38500 100Source: CEGIS estimation from SOLARIS
218
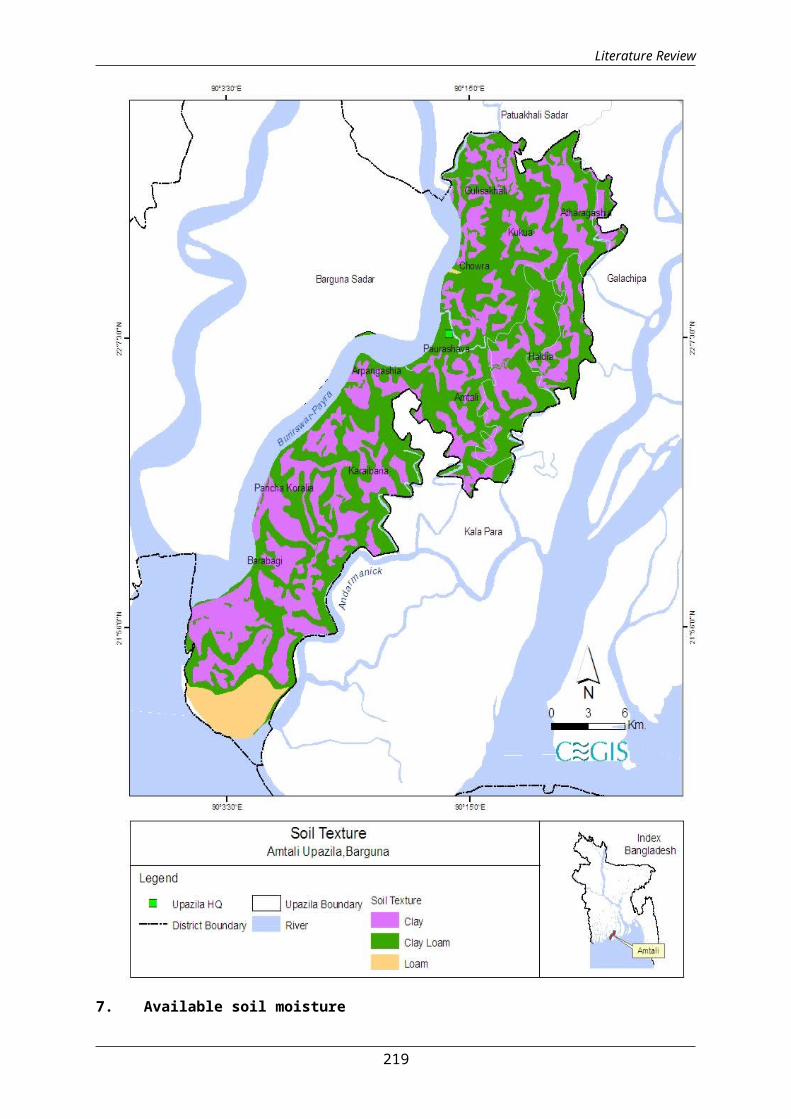
Literature Review
7. Available soil moisture
219
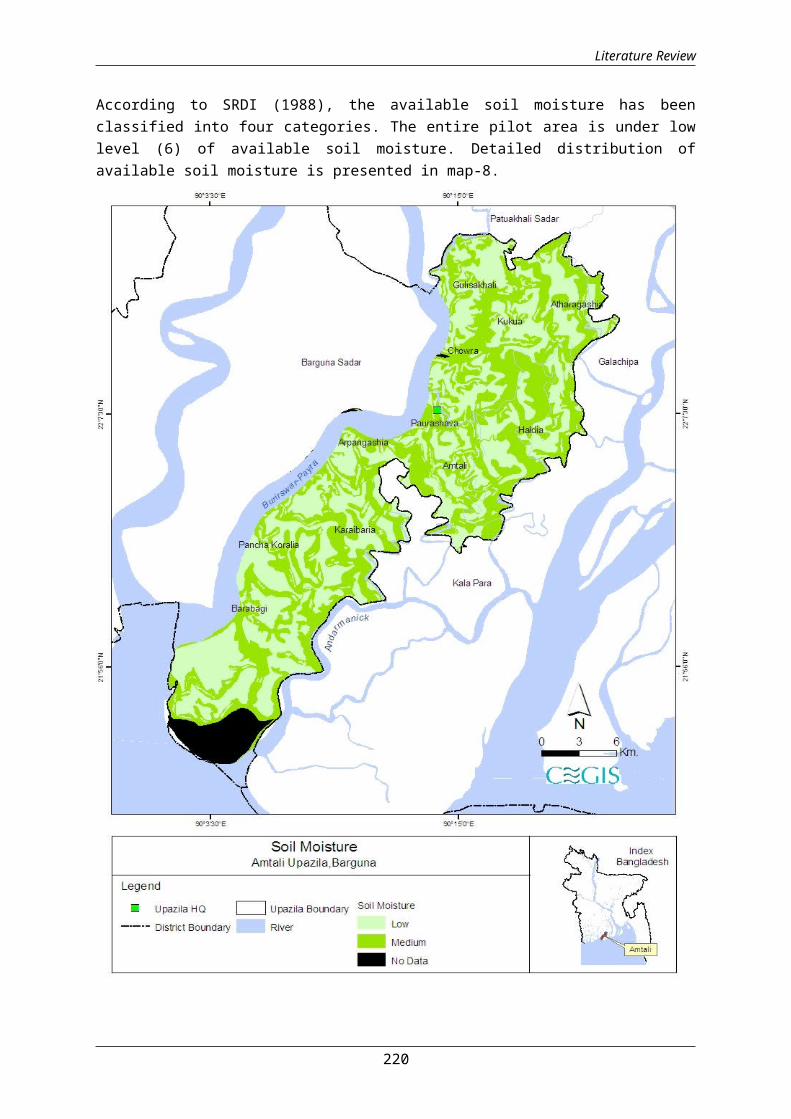
Literature Review
According to SRDI (1988), the available soil moisture has beenclassified into four categories. The entire pilot area is under lowlevel (6) of available soil moisture. Detailed distribution ofavailable soil moisture is presented in map-8.
220

Literature Review
8. Salinity:
The soils of the pilot area become saline in the dry season (Jan-May). The soil and water salinity gradually increases with drynessfrom January and reached maximum level in the month April-May andthen decreases due to onset of monsoon rainfall. Soil salinity mapprepared by the SRDI for 2000 and 2010 showed about 53% area of thePilot area belong to slightly saline with moderately saline which isfollowed by very slightly saline with some slightly saline (30.0%).Detailed soil salinity of the pilot area is presented in Table 7 andmap-9.
Table 7: Soil salinity in the pilot area
SoilSalinityclass(ECe=ds/m)
CharacteristicsSaltaffectedareas (ha)
% ofNCA
2.0-4.0 Very slightly saline with someslightly saline 11,369 30
4.1-8.0 Slightly saline with somemoderately saline 20,487 53
8.1-12.0 Moderately saline with somestrongly saline 4,803 12
12.1-15.0 Strongly saline with verystrongly saline 1,840 5
Total 38,500 100 Source: CEGIS estimation from SRDI
221
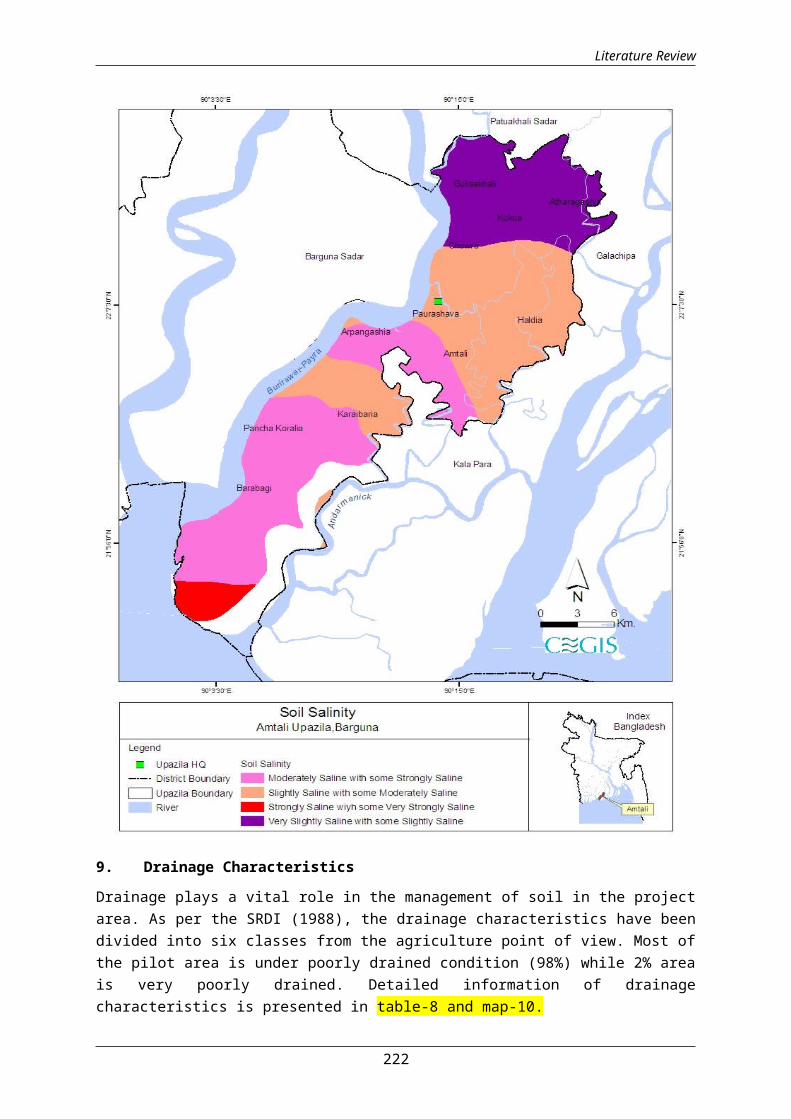
Literature Review
9. Drainage Characteristics
Drainage plays a vital role in the management of soil in the projectarea. As per the SRDI (1988), the drainage characteristics have beendivided into six classes from the agriculture point of view. Most ofthe pilot area is under poorly drained condition (98%) while 2% areais very poorly drained. Detailed information of drainagecharacteristics is presented in table-8 and map-10.
222
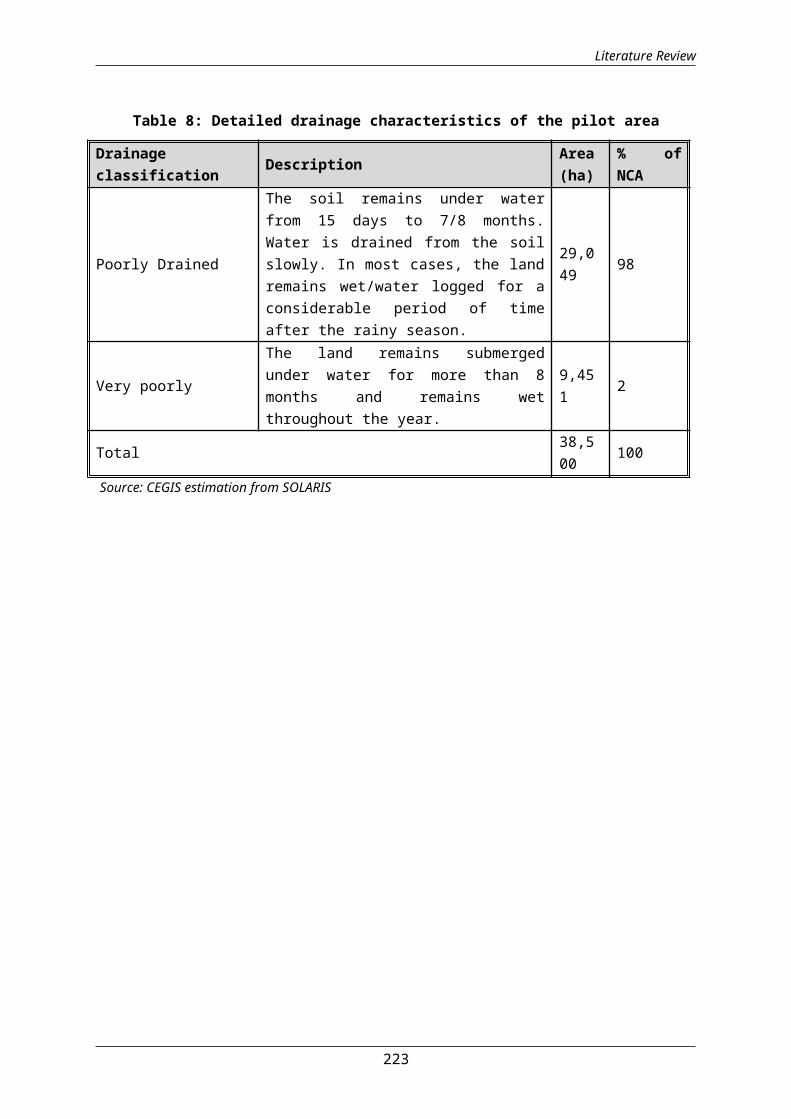
Literature Review
Table 8: Detailed drainage characteristics of the pilot area
Drainageclassification Description Area
(ha)% ofNCA
Poorly Drained
The soil remains under waterfrom 15 days to 7/8 months.Water is drained from the soilslowly. In most cases, the landremains wet/water logged for aconsiderable period of timeafter the rainy season.
29,049 98
Very poorly
The land remains submergedunder water for more than 8months and remains wetthroughout the year.
9,451 2
Total 38,500 100
Source: CEGIS estimation from SOLARIS
223

Literature Review
10. Constraint for crop production
The main constraint of the pilot area is soil and water salinity.Tidal surge also causes crop damage. Natural calamities such ashailstorm, fog, cold wave and drought etc. are also affecting normalcrop production to some extent.
11. Present cropping patterns
There are 183 villages in Amtoli Upazila. Within the villages,Department of Agricultural Extension (DAE) has 30 Agriculture Blocks(AB) where farmers are growing different crops in the field, butthey can’t do the same patterns due to salinity and tidal surge
224

Literature Review
problem. For that reason sometimes they are losing full or partialyield of all crops.
Dominant cropping pattern is Fallow-T.Aman-Fallow which is practicedin 24% of the NCA. Next cropping pattern is Fallow-T.aman-Kheshariwhich is covered about 22% of the NCA. Single, double and triplecropped area is about 24%, 56% and 20% respectively. Croppingintensity is about 196%. Detailed existing cropping patterns witharea of coverage are presented in table-9.
Table-9: Existing cropping patterns with area in the pilot area
Sl. No. Cropping Patterns Area(ha) % ofland useKharif-I Kharif-II Rabi
1 Fallow T.Aman Fallow 9,240 242 T. Aus T.Aman Fallow 6,930 183 Fallow T. Aman khesari 8,470 224 T. Aus T. Aman khesari 3,465 95 T. Aus T. Aman Mung bean 2,695 76 Fallow T. Aman Mung bean 3,465 97 Fallow T. Aman Water
melon1,540 4
8 T. Aus T. Aman Watermelon
1,540 4
9 Fallow T. Aman Ground-nut 385 110 Fallow T. Aman Chili 770 2Total 38,500 100.00
Source: UAO, Amtoli, Barguna
11. Input Use in pilot area
Seed, fertilizer, pesticide and labor are the inputs for growingdifferent crops. The level of these inputs used in Amtoli pilotupazila is presented in table ?.
Table ?: Inputs used in major field crops in the Amtoli pilot area
Cropname
Seed(Kg/ha)
Labour(No./ha)
Fertilizer (Kg/ha) Pesticides
Urea TSP MP
Gypsum
No.ofapplication
Liquid(ml/ha)
Granular/Powder(kg/ha)
HYV Aus 40 90- 70- 40 00 1-2 700 10-12
225
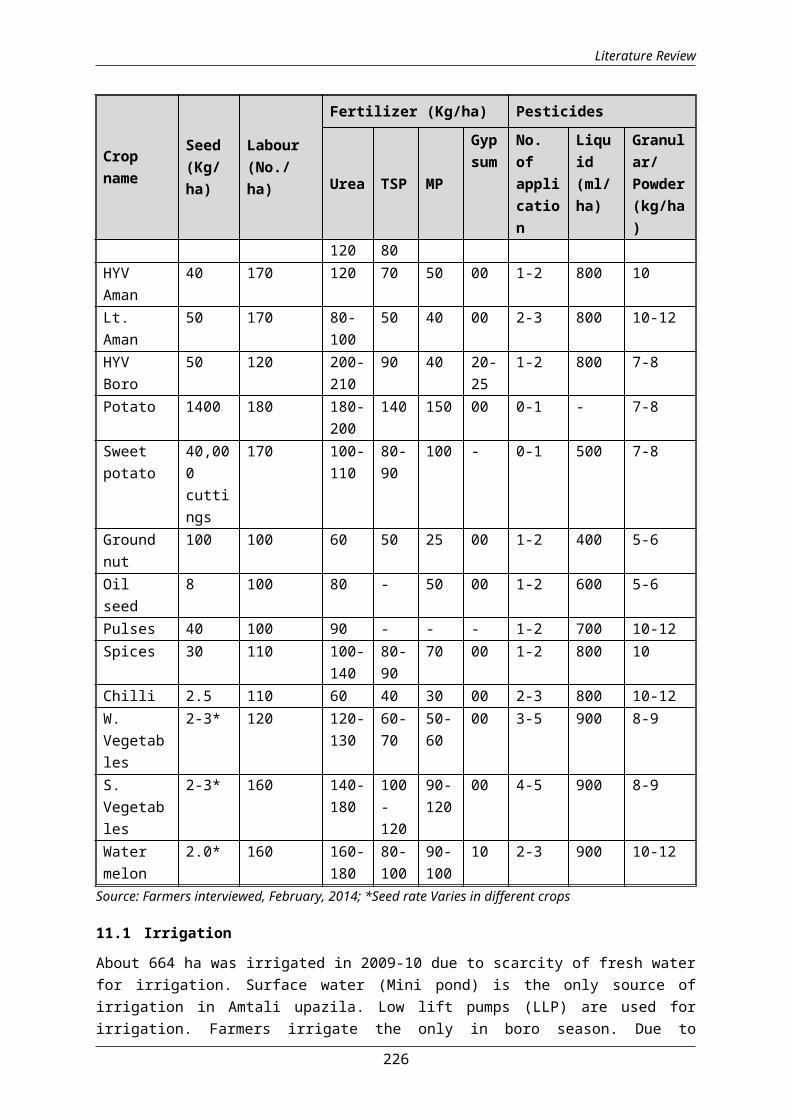
Literature Review
Cropname
Seed(Kg/ha)
Labour(No./ha)
Fertilizer (Kg/ha) Pesticides
Urea TSP MP
Gypsum
No.ofapplication
Liquid(ml/ha)
Granular/Powder(kg/ha)
120 80HYVAman
40 170 120 70 50 00 1-2 800 10
Lt.Aman
50 170 80-100
50 40 00 2-3 800 10-12
HYVBoro
50 120 200-210
90 40 20-25
1-2 800 7-8
Potato 1400 180 180-200
140 150 00 0-1 - 7-8
Sweetpotato
40,000cuttings
170 100-110
80-90
100 - 0-1 500 7-8
Groundnut
100 100 60 50 25 00 1-2 400 5-6
Oilseed
8 100 80 - 50 00 1-2 600 5-6
Pulses 40 100 90 - - - 1-2 700 10-12Spices 30 110 100-
14080-90
70 00 1-2 800 10
Chilli 2.5 110 60 40 30 00 2-3 800 10-12W.Vegetables
2-3* 120 120-130
60-70
50-60
00 3-5 900 8-9
S.Vegetables
2-3* 160 140-180
100-120
90-120
00 4-5 900 8-9
Watermelon
2.0* 160 160-180
80-100
90-100
10 2-3 900 10-12
Source: Farmers interviewed, February, 2014; *Seed rate Varies in different crops
11.1 Irrigation
About 664 ha was irrigated in 2009-10 due to scarcity of fresh waterfor irrigation. Surface water (Mini pond) is the only source ofirrigation in Amtali upazila. Low lift pumps (LLP) are used forirrigation. Farmers irrigate the only in boro season. Due to
226

Literature Review
unavailability of irrigation facilities farmers’ are growing only1.7% of the HYVs boro in the pilot area. Details information ispresented in the table-14.
Table14: Modes of irrigation, number and area (ha) irrigated in thepilot area
Mode ofirrigation
No. equipment Area irrigated(ha)
% of NCA
LLP 152 664 1.7
Total 152 664 1.7Source: BADC, 2009-10
12. Gender and Social Aspects
12.1 Poverty
The poverty level of agro-base livelihood is high in this upazilaand the absolute size of the poor population is large. Povertymeasurement includes two types, one is Upper poverty line andanother is Lower poverty line (hardcore poor people). Detailedpoverty status of the pilot area is presented in table-15.
Table15: Incidence of poverty 2005 in the pilot area
Division
District
Upazila
% Poor (Upperpoverty line*)
% Extreme Poor (Lowerpoverty line*)
Barisal
Barguna
Amtoli
67.40 50.40
Source: BBS, 2005
12 Land Ownership
Based on land ownership in Amtali upazila farmers were classified infive categories. These were Landless/ functionally landless<0.2 ha(<50 dec), Marginal farmer 0.2-0.5 ha (50-125 dec), Small holder0.5- 1 ha (126-250 dec), Medium farmer 1-2 ha (251-500 dec) andLarge farmer > 2ha (more than 501 dec). Data were collect from UAO,DAE of Amtali which has relevance with FAO, BARC and BBS. Accordingto the table-14 small farmers (39%) are dominated which is followedby large farmers (5%) in the pilot area. Categories wise farmers’data were classified in table-16.
227

Literature Review
Table-16: Different Farmers types and number
Landlessfarmers(<0.2 ha)
Marginalfarmers(0.2-0.5ha)
Smallfarmers(0.5- 1 ha)
Mediumfarmers (1-2 ha)
Largefarmers (>2ha)
Total
5,733 13,098 18,623 7,510 2,439 47,403
Source: UAO, DAE, Amtali, 2014
12.1 Agriculture labour wage rate
From the open discussion with different categories of farmers in thefield it was found that normal agriculture labor wage rate is tk 400per male per day in peak period (rice transplanting and harvesting)and tk. 450 per male per day in the lean period. The rate variesfrom male to female. The rate for per female per day is tk. 200 inpeak and tk.175 in lean period. Wage rate by different units inAmtali is presented in table-17.
Table-17: Wage rate by different units in Amtali
Labour wage Agriculture Labourtypes
Wage rate (Taka)Village Upazila
Average agri.day labor wagein peak period
Male 400 450Female 200 250
Average agri.day labor wagein lean period.
Male 350 300Female 175 200
Source: RRA, Amtali
12.2 Occupational status agricultural and non-agricultural
Data were collected from BBS and UAO of DAE, Amtali. It was analyzedand presented in table-18. Maximum HHs in this upazila is engaged inagricultural activities. For this reasons farm household’s rate ishigher than other upazilas.
Table-18: Agricultural and non-agricultural occupational status
Upazila Total
HHs
HHs entirelydependent onagriculturalproduction income(farm)
(%)
HHs entirelydepending on non-farm occupation (nonfarm)
(%)
228

Literature Review
Amtali 63,212 34,767 55 28,445 45
Source: BBS, 2011 and UAO, DAE, Amtali
12.3 Population engaged in different activities
The socio-economic condition of the livelihood system depends mainlyon the agriculture production. Rural farmer in the pilot area ismore dependent in agriculture sector. Most of the peoples (male andfemale) are working in the different crops and horticulture cropsfield almost in the Upazila to contribute in this sector to meet upthe basic economic need for their livelihood. Details of thepopulation engaged in agriculture (7+years) activities is presentedin table-19.
Table-19: Population engaged in agriculture activities (7+ years)activities
UpazilaTotal population
Field of Activity(7+years)
Agriculture
Both Male Female Male Female
Amtoli2,70,802
1,32,168
1,38,634 14,155 667
Source: BBS, 2011
13 Literacy and Education
Literacy: Literacy percentage in the pilot area is not satisfactory.Those who can write a letter to express their views have beenconsidered as literate. Male and female literacy percentages arepresented in table-20.
Table 20: Literacy rate in the pilot area
Upazila Literacy (can write a latter) Literacy rate(%)
Both Male Female Both
Male
FemaleAmtoli Yes No Yes No Yes No
120,582
107,860
60,756
49,983
59,826
57,877
52.8
54.9 50.8
Source: BBS, 2011
229

Literature Review
Education: All the data were collected from BBS and analyzedaccording to age, to know the status of different aged of child’sare going/not going school. Present status of education in differentaged is presented in table-21.
230

Literature Review
Table-21: Educational status in Amtoli
Upazila
Population aged 3-5years
Population aged 6-10 years
Population aged 11-14 years
Attending school
Notattending school
Attendingschool
Notattending school
Attending school
Notattending school
Male
Female
Male
Female
Male
Female Male
Female
Male
Female
Male
Female
Amtoli
1,253
1,332
8,766
8,566
15,325
14,745
3,660
3,355
9,906
9,524
2,330
1,586
Source: BBS, 2011
13.1 Housing and sanitation
Most of the houses are kutcha (87.4%) which is followed by pucca(1.2%) in the pilot area. In case of sanitary condition, sanitarycondition of 4.4% has no sanitary toilet facilities. Details housingand sanitary status are presented in table-22.
Table-22: Housing and sanitary status of Amtoli
Upazila
NumberofHouseholds
Type of Structure (%) Toilet Facility (%)
Pucca
Semi-pucca
Kutcha
Jhupri
Sanitary(water-sealed)
Sanitary(nonwater-sealed)
Non-sanitary
None
Amtoli 63,066 1.2 4.0 87.4 7.4 22.3 44.6 28.7 4.4Source: BBS 2011
14 Government and Non-Government Organizations
14.1 Government organizations
There are various Government and non-Government organizationsworking in the upazila to para. Govt. organizational setups are fromDistrict to unions level. In addition to that there is non-Govt.organizations who are working in the pilot area (table-23).
231
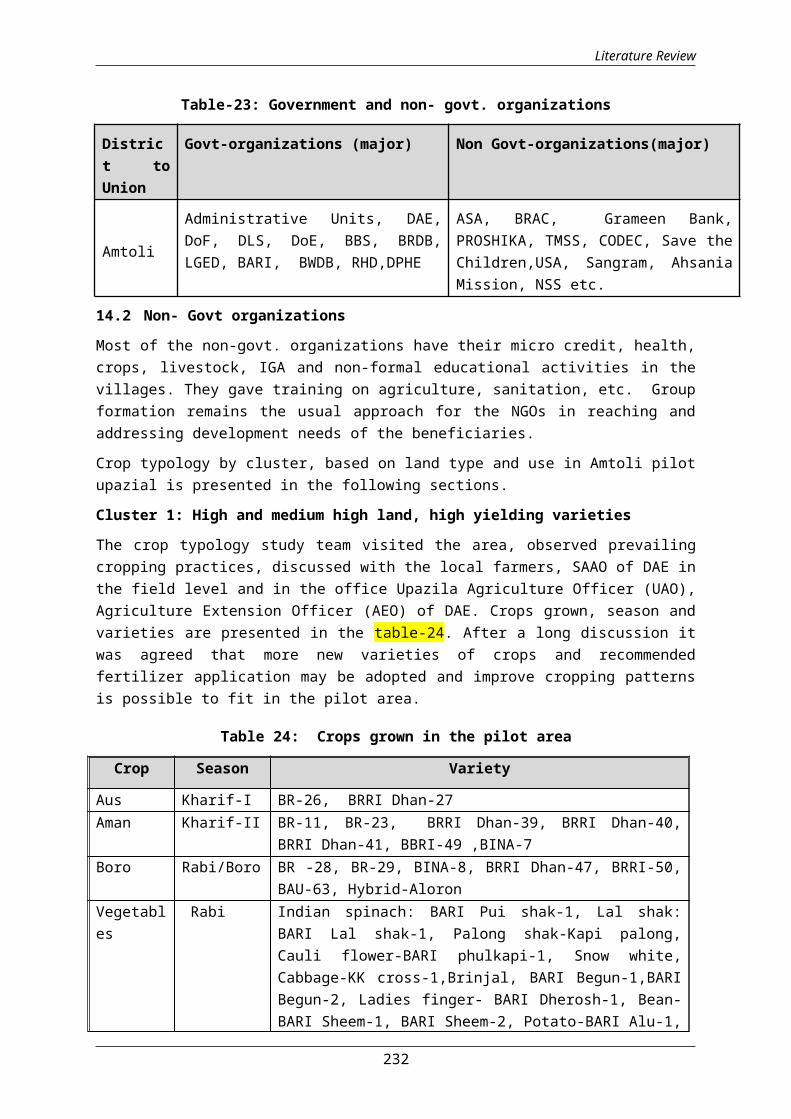
Literature Review
Table-23: Government and non- govt. organizations
District toUnion
Govt-organizations (major) Non Govt-organizations(major)
Amtoli
Administrative Units, DAE,DoF, DLS, DoE, BBS, BRDB,LGED, BARI, BWDB, RHD,DPHE
ASA, BRAC, Grameen Bank,PROSHIKA, TMSS, CODEC, Save theChildren,USA, Sangram, AhsaniaMission, NSS etc.
14.2 Non- Govt organizations
Most of the non-govt. organizations have their micro credit, health,crops, livestock, IGA and non-formal educational activities in thevillages. They gave training on agriculture, sanitation, etc. Groupformation remains the usual approach for the NGOs in reaching andaddressing development needs of the beneficiaries.
Crop typology by cluster, based on land type and use in Amtoli pilotupazial is presented in the following sections.
Cluster 1: High and medium high land, high yielding varieties
The crop typology study team visited the area, observed prevailingcropping practices, discussed with the local farmers, SAAO of DAE inthe field level and in the office Upazila Agriculture Officer (UAO),Agriculture Extension Officer (AEO) of DAE. Crops grown, season andvarieties are presented in the table-24. After a long discussion itwas agreed that more new varieties of crops and recommendedfertilizer application may be adopted and improve cropping patternsis possible to fit in the pilot area.
Table 24: Crops grown in the pilot area
Crop Season Variety
Aus Kharif-I BR-26, BRRI Dhan-27Aman Kharif-II BR-11, BR-23, BRRI Dhan-39, BRRI Dhan-40,
BRRI Dhan-41, BBRI-49 ,BINA-7Boro Rabi/Boro BR -28, BR-29, BINA-8, BRRI Dhan-47, BRRI-50,
BAU-63, Hybrid-AloronVegetables
Rabi Indian spinach: BARI Pui shak-1, Lal shak:BARI Lal shak-1, Palong shak-Kapi palong,Cauli flower-BARI phulkapi-1, Snow white,Cabbage-KK cross-1,Brinjal, BARI Begun-1,BARIBegun-2, Ladies finger- BARI Dherosh-1, Bean-BARI Sheem-1, BARI Sheem-2, Potato-BARI Alu-1,
232
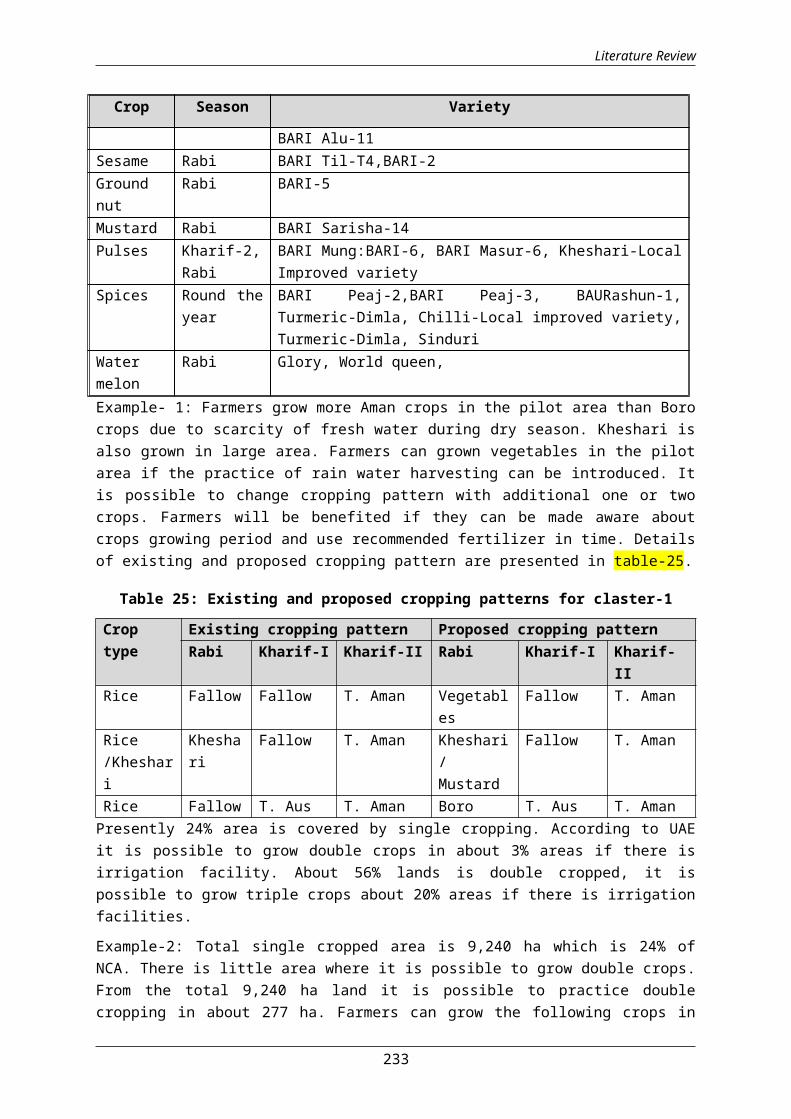
Literature Review
Crop Season Variety
BARI Alu-11Sesame Rabi BARI Til-T4,BARI-2Groundnut
Rabi BARI-5
Mustard Rabi BARI Sarisha-14Pulses Kharif-2,
RabiBARI Mung:BARI-6, BARI Masur-6, Kheshari-LocalImproved variety
Spices Round theyear
BARI Peaj-2,BARI Peaj-3, BAURashun-1,Turmeric-Dimla, Chilli-Local improved variety,Turmeric-Dimla, Sinduri
Watermelon
Rabi Glory, World queen,
Example- 1: Farmers grow more Aman crops in the pilot area than Borocrops due to scarcity of fresh water during dry season. Kheshari isalso grown in large area. Farmers can grown vegetables in the pilotarea if the practice of rain water harvesting can be introduced. Itis possible to change cropping pattern with additional one or twocrops. Farmers will be benefited if they can be made aware aboutcrops growing period and use recommended fertilizer in time. Detailsof existing and proposed cropping pattern are presented in table-25.
Table 25: Existing and proposed cropping patterns for claster-1
Croptype
Existing cropping pattern Proposed cropping patternRabi Kharif-I Kharif-II Rabi Kharif-I Kharif-
IIRice Fallow Fallow T. Aman Vegetabl
esFallow T. Aman
Rice/Kheshari
Kheshari
Fallow T. Aman Kheshari/Mustard
Fallow T. Aman
Rice Fallow T. Aus T. Aman Boro T. Aus T. AmanPresently 24% area is covered by single cropping. According to UAEit is possible to grow double crops in about 3% areas if there isirrigation facility. About 56% lands is double cropped, it ispossible to grow triple crops about 20% areas if there is irrigationfacilities.
Example-2: Total single cropped area is 9,240 ha which is 24% ofNCA. There is little area where it is possible to grow double crops.From the total 9,240 ha land it is possible to practice doublecropping in about 277 ha. Farmers can grow the following crops in
233

Literature Review
different crop season and they can apply recommended fertilizers.Details are explained in the table-26.
Table 26: Crops grown and fertilizer application for cluster-1
Crop Season Varieties FertilizerUrea TSP MP Gypsum
Aus Kharif-I
BR-26, BRRI Dhan-27 100-140
40-60
0-40
0-40
Aman Kharif-II
BR-11, BR-23, BRRIDhan-39, BRRI Dhan-40,BRRI Dhan-41,BBRI-49 ,BINA-7
120-180
60-80
20-40
0-40
Boro Rabi/Boro
BRRI Dhan-28, BRRI Dhan-29,BINA-8,BAU-63,Hybrid-Aloron
200-250
100-120
80-100
50-100
Vegetables
Kharif-I andRabi
Bitter gourd: Localimproved variety, Indianspinach: BARI Pui shak-1, Yard long bean: Localimproved variety, Lalshak: BARI Lal shak-1,Palong shak-Kapi palong,Cauli flower-BARIphulkapi-1, Snow white,Cabbage-KK cross-1,Brinjal, BARI Begun-1,BARI Begun-2,Ladiesfinger-Bangkim, BARIDherosh-1,Bean-BARISheem-1,BARI Sheem-2,Potato-BARIAlu-1,BARIAlu-11
200-300
100-200
100-200
-
Sesame Rabi BARI Til-T4 22-28
80-90
155-165
165-175
Pulses Kharif-2
BARI Mung:BARI-6,BARIMasur-6,Kheshari-LocalImproved variety,Phelon-BARI phelon-1
40-50
80-85
30-35
Ground Rabi BARI-5 20- 150 80-
234
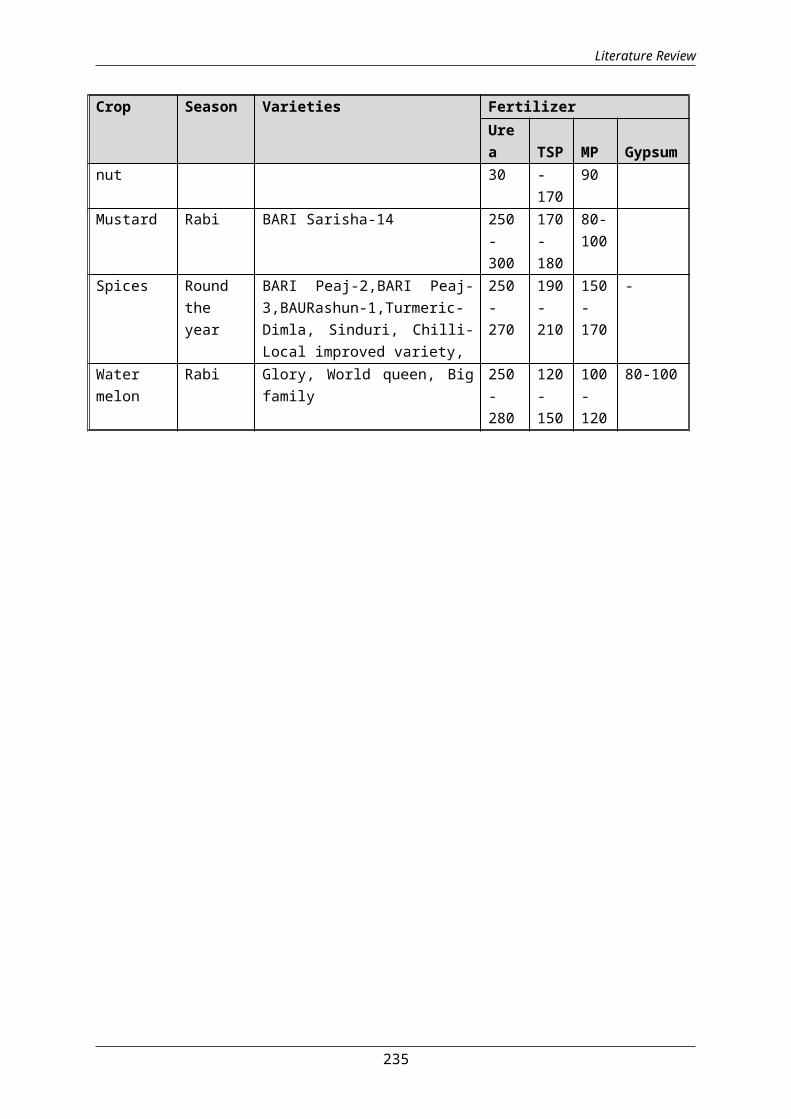
Literature Review
Crop Season Varieties FertilizerUrea TSP MP Gypsum
nut 30 -170
90
Mustard Rabi BARI Sarisha-14 250-300
170-180
80-100
Spices Roundtheyear
BARI Peaj-2,BARI Peaj-3,BAURashun-1,Turmeric-Dimla, Sinduri, Chilli-Local improved variety,
250-270
190-210
150-170
-
Watermelon
Rabi Glory, World queen, Bigfamily
250-280
120-150
100-120
80-100
235

Literature Review
Source: BARI, BRRI; BINA, BAU
236
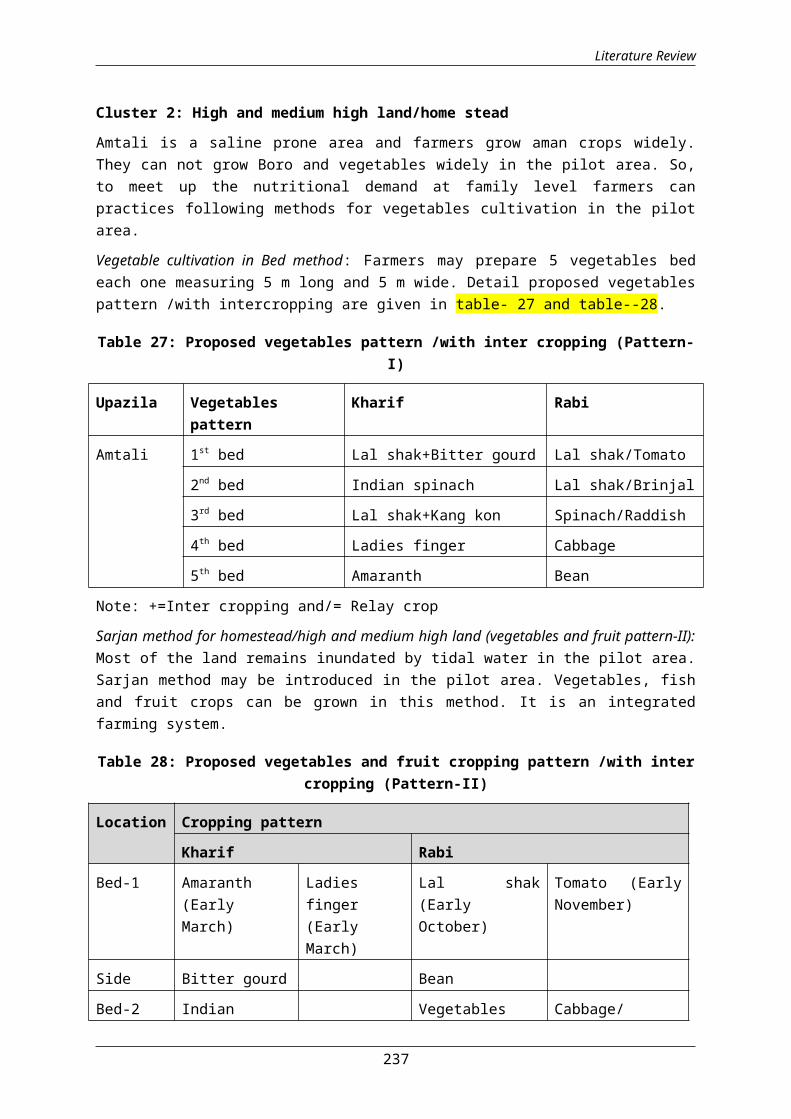
Literature Review
Cluster 2: High and medium high land/home stead
Amtali is a saline prone area and farmers grow aman crops widely.They can not grow Boro and vegetables widely in the pilot area. So,to meet up the nutritional demand at family level farmers canpractices following methods for vegetables cultivation in the pilotarea.
Vegetable cultivation in Bed method: Farmers may prepare 5 vegetables bedeach one measuring 5 m long and 5 m wide. Detail proposed vegetablespattern /with intercropping are given in table- 27 and table--28.
Table 27: Proposed vegetables pattern /with inter cropping (Pattern-I)
Upazila Vegetablespattern
Kharif Rabi
Amtali 1st bed Lal shak+Bitter gourd Lal shak/Tomato
2nd bed Indian spinach Lal shak/Brinjal
3rd bed Lal shak+Kang kon Spinach/Raddish
4th bed Ladies finger Cabbage
5th bed Amaranth Bean
Note: +=Inter cropping and/= Relay crop
Sarjan method for homestead/high and medium high land (vegetables and fruit pattern-II):Most of the land remains inundated by tidal water in the pilot area.Sarjan method may be introduced in the pilot area. Vegetables, fishand fruit crops can be grown in this method. It is an integratedfarming system.
Table 28: Proposed vegetables and fruit cropping pattern /with intercropping (Pattern-II)
Location Cropping pattern
Kharif Rabi
Bed-1 Amaranth(EarlyMarch)
Ladiesfinger(EarlyMarch)
Lal shak(EarlyOctober)
Tomato (EarlyNovember)
Side Bitter gourd Bean
Bed-2 Indian Vegetables Cabbage/
237

Literature Review
Location Cropping pattern
Kharif Rabi
spinach(EarlyMarch)
seed bed(EarlyOctober)
Cauliflower(EarlyNovember)
Side Bitter gourd Bean
Bed-3 Papaya(EarlyMarch)
Chilli(EarlyApril)
Lal shak(EarlyOctober)
Side Ribbed gourd Bean
Bed-4 Banana(EarlyMarch)
Kang kong(Gima Kolmi(EarlyOctober)
Lal shak(EarlyOctober)
Brinjal (EarlyNovember)
Side Ribbed gourd Bitter gourd
Bed-5 Banana(EarlyMarch)
Amaranth(EarlyApril)
Lal shak(EarlyOctober)
Brinjal (EarlyNovember)
Side Ribbed gourd Bitter gourd
Table29: Proposed cropping pattern through inter cropping (Pattern-4)
Landtype
PilotUpazila
fruitcrops
Intercrops
Varietyuse
Expectedyield(t/ha)
Cultivatedcost(Tk/ha)
Totalreturn(tk/ha)
Netreturn(tk/ha)
1 2 3 4 5 6 7 8 (8-7)
Highlandandmediumhighland
Amtali
Peyara
Sawarupkatipeyara(Localimproved)
10 8,000 80,000
72,000
Turmeric
BARI-Dimla,Sundari
2.5 17,500 25,000
7,500
Total 25,500 105,000
79,500
238

Literature Review
Table 30: Proposed cropping pattern through inter cropping (Pattern-IV)
Landtype
PilotUpazila
fruitcrops
Intercrops
Varietyuse
Expectedyield(t/ha)
Cultivatedcost(Tk/ha)
Totalreturn(tk/ha)
Netreturn(tk/ha)
1 2 3 4 5 6 7 8 (8-7)
Highlandandmediumhighland
Amtali
Peyara
Sawarupkatipeyara(Localimproved)
10 8,000 80,000 72,000
Zinger BARI 2.5 50,000 100,00
0 50,000
Total 58,000 180,000
122,000
Cluster- 3 (High and Medium high land)
Following crops can be grown in different land type.
Cereal andoilseeds cropsin differentseasons
Aus: BR-26 and BR-27Aman: BR-11, BRRI Dhan-23, BRRI Dhan-39, BRRI Dha-40, BRRI Dha-41, BINA-7, Boro: BRRI Dhan-28, BRRI Dhan-29,BINA-8,BAU-63,Hybrid-AloronOilseeds: Sesame: BARI Til-T4, Mustard: BARISarisha-14, Ground nut: BARI-5
Vegetablecrops indifferentseasons
Vegetables: Bitter gourd, Indian spinach, Yardlong bean, Lalshak, Snake gourd, Ash gourd, Bottlegourd, Sweet gourd, Sponge gourd, Spinach andAmaranthusTable 31: Proposed cropping pattern
Cropping Patterns
Kharif-I Kharif-II Rabi
Fallow Vegetables Boro
Aus Fallow Potato
Aus Taman Oil seed
Fallow Vegetables Boro
239

Literature Review
Presently 24% area is covered by single crops. According to UAE itis possible to grow double crops about 3% areas if there isirrigation facilities. About 56% lands is double crops, it ispossible to grow triple crops in about 20% areas if there isirrigation facilities.
Cluster 4: High, medium high and medium low land
Following crops can be grown in different land type.
Cereal, oilseedsand pulses crops indifferent seasons
Aus: BR-26 and BR-27
Aman: BR-11,BRRI Dhan-23, BRRI Dhan-39, BRRIDhan-40, BRRI Dhan-41, BINA-7,
Boro: BRRI Dhan-28, BRRI Dhan-29, BRR Dhan-47, BINA-8 Oilseeds: Sesame: BARI Til-T4,Mustard: BARI ShSarisha-14,Ground nut:BARI-5
Pulses: BARI Mung:BARI-6,BARI Masur-6,Kheshari-Local Improved variety, Phelon-BARIphelon-1
Differentvegetables andwater melon cropswith seasons
Vegetables: Bitter gourd, Indian spinach, Yardlong bean, Lalshak, Snake gourd, Ash gourd,Bottle gourd, Sweet gourd, Sponge gourd,Spinach and Amaranthus
Water melon: Glory, World queen, Big family
Table 32: Proposed cropping pattern
Cropping Patterns
Kharif-I Kharif-II Rabi
Fallow T.aman Boro
Aus T. Aman Water melon
Fallow T.aman Pulses
Vegetables Vegetables Vegetables
Cluster 5: Rain-fed condition
Vegetables crops: Bitter gourd, Indian spinach, Yard long bean,Lalshak, Snake gourd, Ash gourd, Bottle gourd, Sweet gourd, Spongegourd, Spinach and Amaranthus.
240
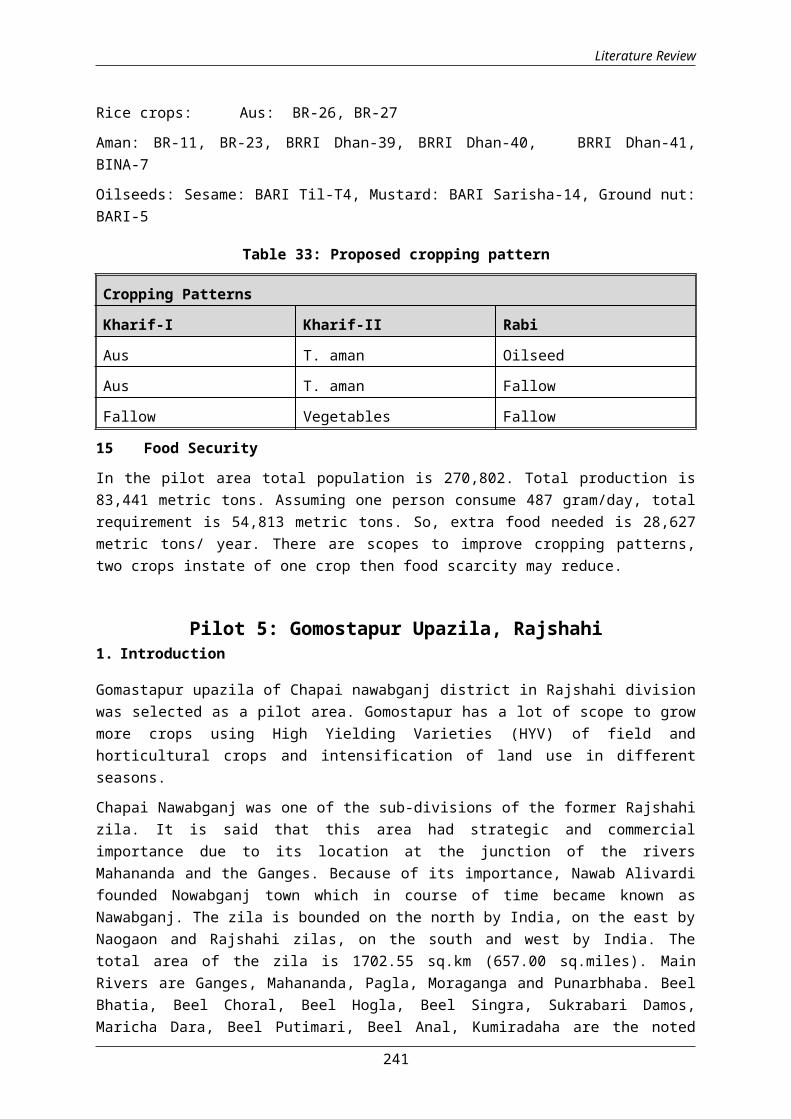
Literature Review
Rice crops: Aus: BR-26, BR-27
Aman: BR-11, BR-23, BRRI Dhan-39, BRRI Dhan-40, BRRI Dhan-41,BINA-7
Oilseeds: Sesame: BARI Til-T4, Mustard: BARI Sarisha-14, Ground nut:BARI-5
Table 33: Proposed cropping pattern
Cropping Patterns
Kharif-I Kharif-II Rabi
Aus T. aman Oilseed
Aus T. aman Fallow
Fallow Vegetables Fallow
15 Food Security
In the pilot area total population is 270,802. Total production is83,441 metric tons. Assuming one person consume 487 gram/day, totalrequirement is 54,813 metric tons. So, extra food needed is 28,627metric tons/ year. There are scopes to improve cropping patterns,two crops instate of one crop then food scarcity may reduce.
Pilot 5: Gomostapur Upazila, Rajshahi1. Introduction
Gomastapur upazila of Chapai nawabganj district in Rajshahi divisionwas selected as a pilot area. Gomostapur has a lot of scope to growmore crops using High Yielding Varieties (HYV) of field andhorticultural crops and intensification of land use in differentseasons.
Chapai Nawabganj was one of the sub-divisions of the former Rajshahizila. It is said that this area had strategic and commercialimportance due to its location at the junction of the riversMahananda and the Ganges. Because of its importance, Nawab Alivardifounded Nowabganj town which in course of time became known asNawabganj. The zila is bounded on the north by India, on the east byNaogaon and Rajshahi zilas, on the south and west by India. Thetotal area of the zila is 1702.55 sq.km (657.00 sq.miles). MainRivers are Ganges, Mahananda, Pagla, Moraganga and Punarbhaba. BeelBhatia, Beel Choral, Beel Hogla, Beel Singra, Sukrabari Damos,Maricha Dara, Beel Putimari, Beel Anal, Kumiradaha are the noted
241

Literature Review
depressions. Annual Average Temperature: Maximum 37.8°C, minimum11.2°C; annual rainfall 1862 mm(BBS 2011). Administrative map ofChapainawabganj Gomostapur upazilas are showing in the map-1.
242

Literature Review
1.1 Geographic information of Gomostapur upazila:The upazila occupies an area of 318.13 sq. km. It is located between24°44' and 24°58' north latitudes and between 88°13' and 88°58' eastlongitudes. The upazila is bounded on the north by India and Porshaupazila of Noagaon zila, on the east by Niamatpur upazila of Noagaonzila, on the south by Nachole and Shibganj upazilas and on the westby Bholahat and Shibganj upazilas and India, (BBS, 2011).
1.1.2 Demographic information of Gomostapur upazila:
Data were collected from Upazila Agriculture Officer, 2013 and BBS,2011. Total population in 2011 is 275,823 of which male is 136,321and female is 139,502. Total population in 2001 was 240,123 wheremale was 122,325 and female was 117,798. The differences between tenyears data on population is presented in Table-1 which show thatpopulation is increasing.
Table-1: Population in the pilot area
Population 2001 2011 DifferenceBoth Sex 2,40,123 2,75,823 35,700Male 1,22,325 1,36,321 13,996Female 1,17,798 1,39,502 21,704Source: UAO, Gomostapur 2013 and BBS, 2011
2. Meteorology
2.1 Rainfall
Rainfall data of last five years (2007 to 2011), collected fromBangladesh Meteorological Department (BMD) Rajshahi, showssignificant rainfall during the months of July to September. On theother hand, very little rainfall or no rain occurs during the periodNovember to February. Last five years maximum rainfall was occur in2011 in the month of September (Figure 1).
243

Literature Review
Source: BMD, Rajshahi
2.2 Temperature
Maximum: Figure 2 indicate that seasonal variation of temperature islarge. Mean data of last five years from 2006 to 2010 show that themean monthly maximum temperature was 38.33°C in April and that wasthe warmest month.
Source: BMD, Rajshahi.
Minimum: The lowest ever recorded minimum temperature is 9.38°Crecorded in the month of January, 2010. Details are shown in figure-3.
244
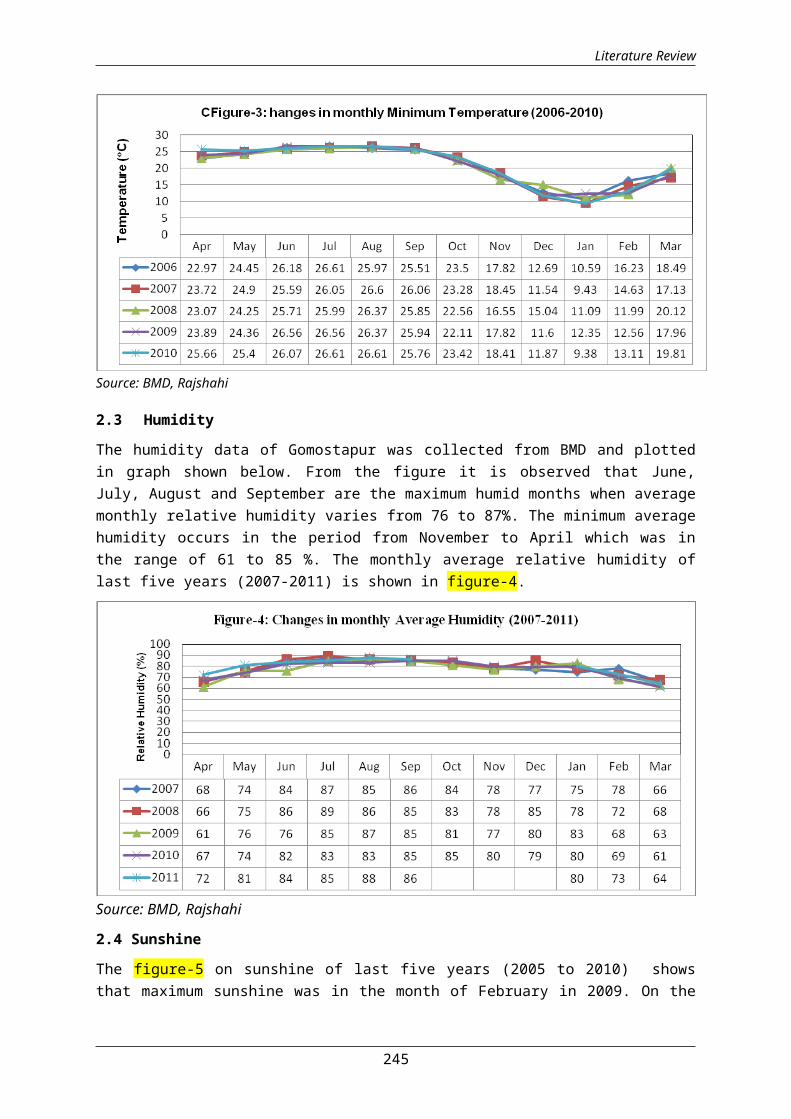
Literature Review
Source: BMD, Rajshahi
2.3 Humidity
The humidity data of Gomostapur was collected from BMD and plottedin graph shown below. From the figure it is observed that June,July, August and September are the maximum humid months when averagemonthly relative humidity varies from 76 to 87%. The minimum averagehumidity occurs in the period from November to April which was inthe range of 61 to 85 %. The monthly average relative humidity oflast five years (2007-2011) is shown in figure-4.
Source: BMD, Rajshahi
2.4 Sunshine
The figure-5 on sunshine of last five years (2005 to 2010) showsthat maximum sunshine was in the month of February in 2009. On the
245
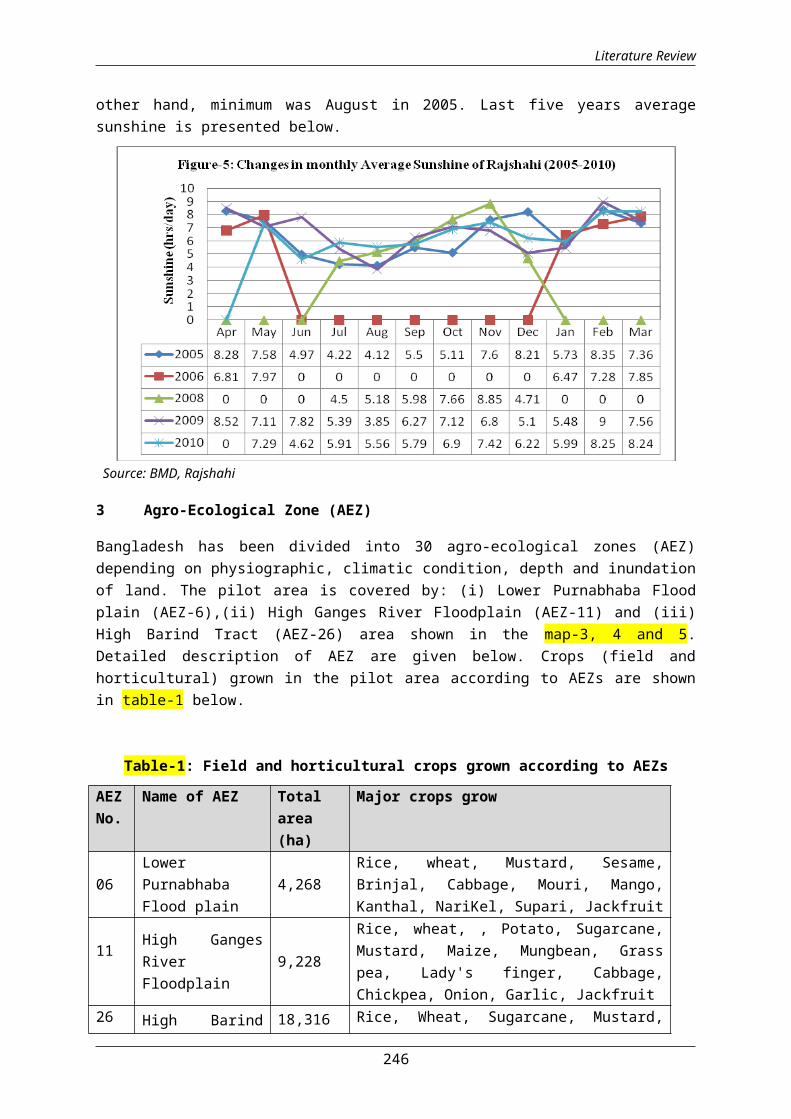
Literature Review
other hand, minimum was August in 2005. Last five years averagesunshine is presented below.
Source: BMD, Rajshahi
3 Agro-Ecological Zone (AEZ)
Bangladesh has been divided into 30 agro-ecological zones (AEZ)depending on physiographic, climatic condition, depth and inundationof land. The pilot area is covered by: (i) Lower Purnabhaba Floodplain (AEZ-6),(ii) High Ganges River Floodplain (AEZ-11) and (iii)High Barind Tract (AEZ-26) area shown in the map-3, 4 and 5.Detailed description of AEZ are given below. Crops (field andhorticultural) grown in the pilot area according to AEZs are shownin table-1 below.
Table-1: Field and horticultural crops grown according to AEZs
AEZNo.
Name of AEZ Totalarea(ha)
Major crops grow
06LowerPurnabhabaFlood plain
4,268Rice, wheat, Mustard, Sesame,Brinjal, Cabbage, Mouri, Mango,Kanthal, NariKel, Supari, Jackfruit
11 High GangesRiverFloodplain
9,228
Rice, wheat, , Potato, Sugarcane,Mustard, Maize, Mungbean, Grasspea, Lady's finger, Cabbage,Chickpea, Onion, Garlic, Jackfruit
26 High Barind 18,316 Rice, Wheat, Sugarcane, Mustard,
246
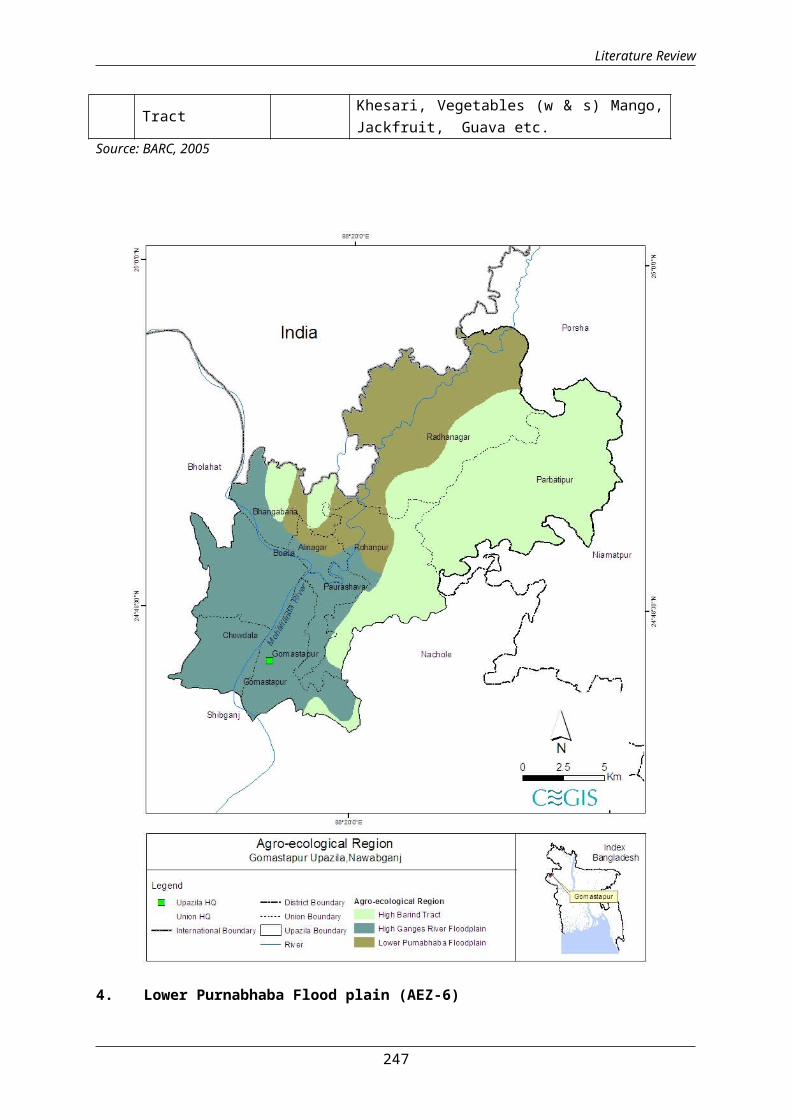
Literature Review
Tract Khesari, Vegetables (w & s) Mango,Jackfruit, Guava etc.
Source: BARC, 2005
4. Lower Purnabhaba Flood plain (AEZ-6)
247

Literature Review
This region occupies a narrow strip of floodplain land along thelower course of the Purnabhaba River in the west of Naogaon and thenorth of Chapai Nawabganj districts. The relief comprises broadridges and basins, with beels occuping the basin centres. Most ofthe areas are deeply flooded in the rainy season, and is subject toflash floods descending the Purnabhaba River and running off theadjoining High Barind Tract during periods of heavy rainfall.
The soils are heavy in nature occupying almost the whole landscape,ridges and basins alike. In this area soil are dark grey, mottledred and very strongly acid in nature. Organic matter content ismedium to high. General fertility level is medium.
High Ganges River Floodplain (AEZ-11)
This region includes the western part of the Ganges River Floodplainwhich is predominately high land and medium high land. Most areashave a complex relief of broad and narrow ridges and inter-ridgedepressions, separated by areas with smooth broad ridges and basins.
There ia an overall pattern of olive-brown silt loams and siltyclay loams on the upper parts of the floodplain ridges and darkgrey, mottled brown, mainly clay soils on ridge sites and in basins.Most ridge soils are calcareous throughout. General soil typespredominately include Calcareous Grey Floodplain soils andCalcareous Brown Floodplain soils. Organic matter content in brownridge soils is low and higher in dark grey soils. Soils are slightlyalkaline in reaction. The fertility level is generally low.
High Barind Tract (AEZ-26)
This region includes the western part of Barind Tract where theunderlying Madhupur Clay has been uplifted and cut into by deepvalleys. The High Barind Tract occupies about 10% of the wholeBarind Tract. It is underlaid by heavy Madhupur Clay which oftencontains large lime nodules.
The soils include paddled silt loam to silty clay loam in thetopsoils and porous silt loam with mottled plastic clay at varyingdepth. Deep Grey Terrace soils and Grey Valleys soils are the majorcomponents of general soil types of the area. General fertilitystatus is low having low status of organic matter.
Most of the ridge tops, valley sides and sloping valley bottoms havebeen terraced for paddy cultivation and have poorly drained greysoils with silty topsoils.
4. Land types in pilot area
248
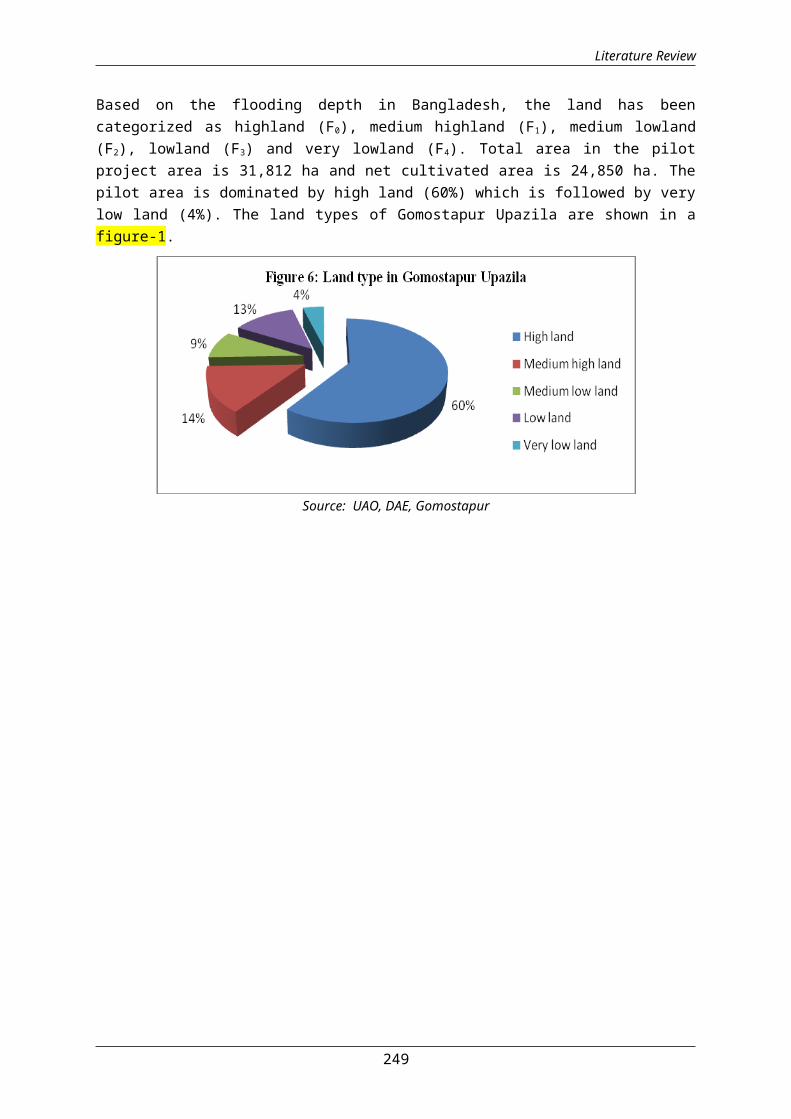
Literature Review
Based on the flooding depth in Bangladesh, the land has beencategorized as highland (F0), medium highland (F1), medium lowland(F2), lowland (F3) and very lowland (F4). Total area in the pilotproject area is 31,812 ha and net cultivated area is 24,850 ha. Thepilot area is dominated by high land (60%) which is followed by verylow land (4%). The land types of Gomostapur Upazila are shown in afigure-1.
Source: UAO, DAE, Gomostapur
249

Literature Review
5. Land use in the pilot area
Total land area is estimated about 31,812 ha and net cultivable landis 78.1% in the pilot area. The Settlement, Road, River, and Waterbodies’ area is about 13.8%, 2.4%, 0.3% and 5.4% of the pilot arearespectively. Detailed land use of the pilot area is presented intable-2.
Table-2: Detailed land use of the pilot area
Land use Area(ha) %Settlement 4,388 13.8Road 774 2.4River 90 0.3Water bodies 1,710 5.4NCA 24,850 78.1Gross area 31,812 100.0Source: UAO, DAE, Gomostapur
6. Soil Texture
Soil texture is the relative proportions of sand, silt and clay. Itis very important for agriculture crop production. The soil textureis dominated by clay loam (57%) which is followed by clay (32%) inthe pilot area. Detailed soil texture is presented in table-3.
Table 3: Detailed soil texture of the surface soil (0-15 cm) in thepilot area
Texture Area(ha) % of NCAClay 7,952 32Clay Loam 14,164 57Loam 2,734 11
Total 24,850 100Source: CEGIS estimation from SOLARIS
250

Literature Review
7. Available soil moisture
According to SRDI (1988), the available soil moisture has beenclassified into four categories. The pilot area is dominated by low
251
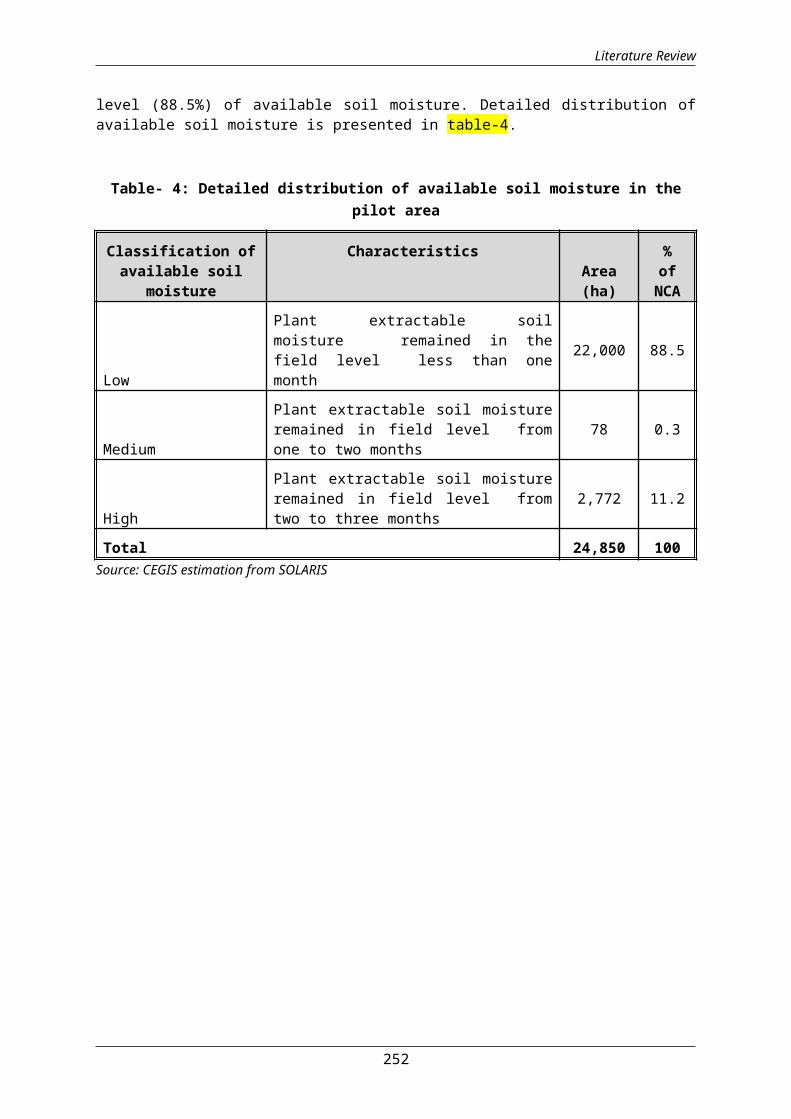
Literature Review
level (88.5%) of available soil moisture. Detailed distribution ofavailable soil moisture is presented in table-4.
Table- 4: Detailed distribution of available soil moisture in thepilot area
Classification ofavailable soil
moisture
CharacteristicsArea(ha)
%ofNCA
Low
Plant extractable soilmoisture remained in thefield level less than onemonth
22,000 88.5
Medium
Plant extractable soil moistureremained in field level fromone to two months
78 0.3
High
Plant extractable soil moistureremained in field level fromtwo to three months
2,772 11.2
Total 24,850 100Source: CEGIS estimation from SOLARIS
252
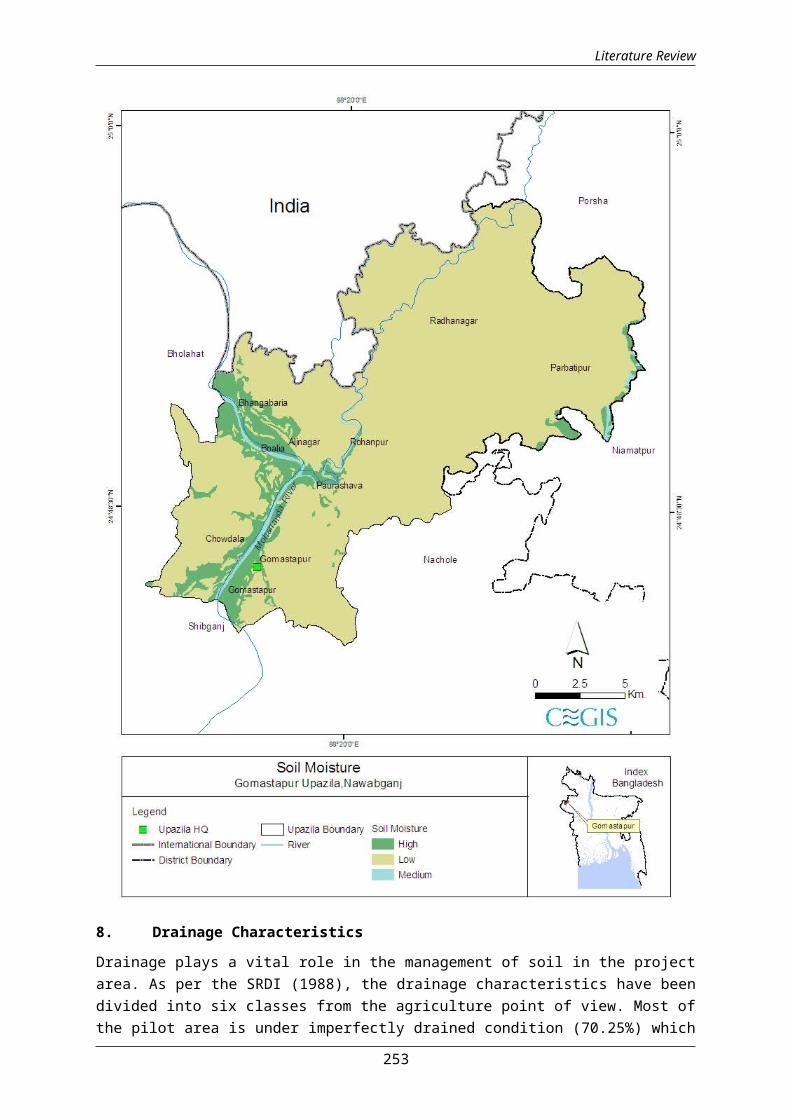
Literature Review
8. Drainage Characteristics
Drainage plays a vital role in the management of soil in the projectarea. As per the SRDI (1988), the drainage characteristics have beendivided into six classes from the agriculture point of view. Most ofthe pilot area is under imperfectly drained condition (70.25%) which
253

Literature Review
is followed by poorly drained (29.69%). Detailed information ofdrainage characteristics is presented in table-5.
Table 5: Detailed drainage characteristics of the pilot area
Drainageclassificatio
nDescription
Area(ha)
% ofNCA
ImperfectlyDrained
Water drained from soil badly orslowly. This soil often remains wetin rainy season due to rainfall. Innormal situation, water does notstand on land more than 15 days ata stretch. In rainy season,groundwater stands within 1 metreat least for some time.
17,456 70.25
Moderatelywell Drained
Water drained from soil slowly. So,soil remains wet for a certaintime. In this case, slowlypermeable layer or ground waterremains within 1-2 metre of depthin rainy season.
15 0.06
PoorlyDrained
The soil remains under water from15 days to 7/8 months. Water isdrained from the soil slowly. Inmost cases, the land remainswet/water logged for a considerableperiod of time after the rainyseason.
7,379 29.69
Total 24,850 100
Source: CEGIS estimation from SOLARIS
254
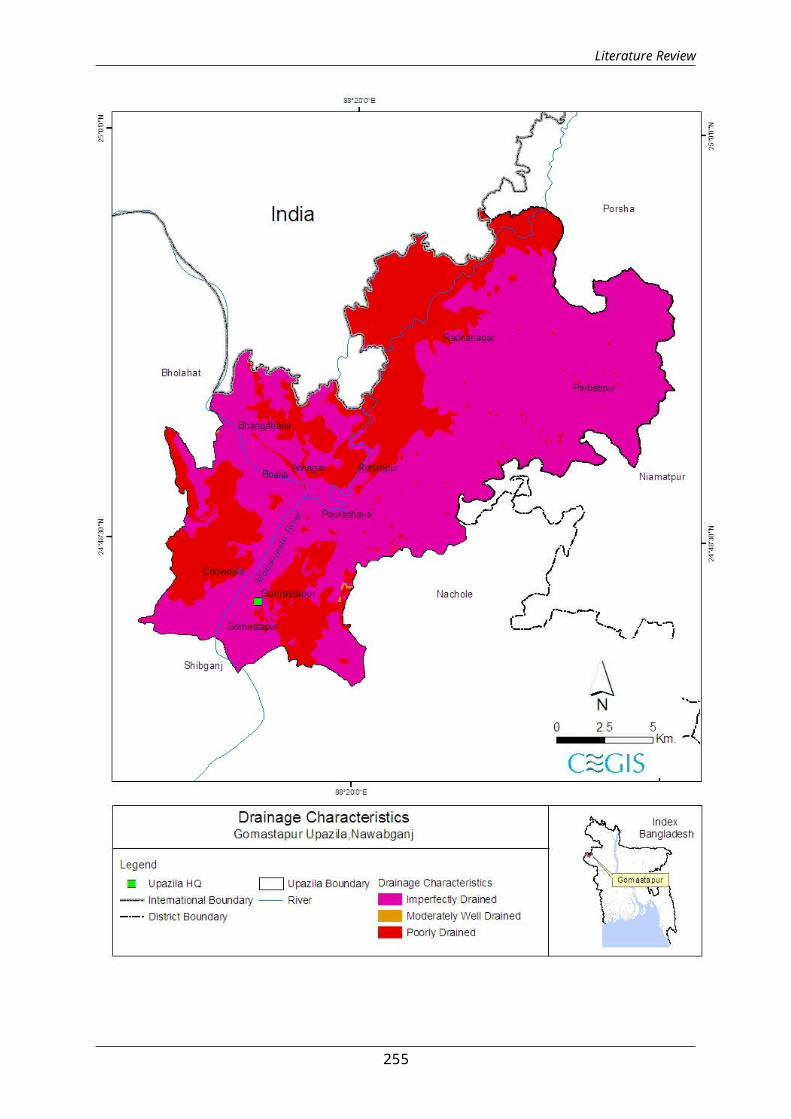
Literature Review
255
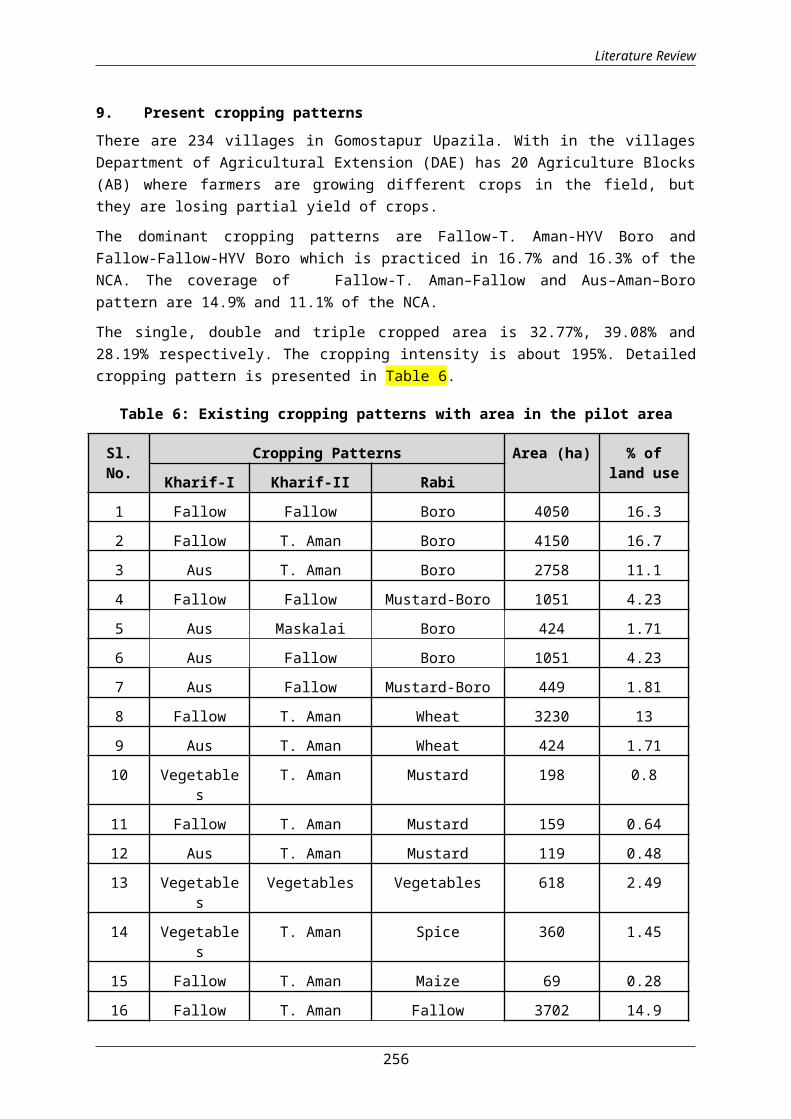
Literature Review
9. Present cropping patternsThere are 234 villages in Gomostapur Upazila. With in the villagesDepartment of Agricultural Extension (DAE) has 20 Agriculture Blocks(AB) where farmers are growing different crops in the field, butthey are losing partial yield of crops.
The dominant cropping patterns are Fallow-T. Aman-HYV Boro andFallow-Fallow-HYV Boro which is practiced in 16.7% and 16.3% of theNCA. The coverage of Fallow-T. Aman–Fallow and Aus–Aman–Boropattern are 14.9% and 11.1% of the NCA.
The single, double and triple cropped area is 32.77%, 39.08% and28.19% respectively. The cropping intensity is about 195%. Detailedcropping pattern is presented in Table 6.
Table 6: Existing cropping patterns with area in the pilot area
Sl.No.
Cropping Patterns Area (ha) % ofland useKharif-I Kharif-II Rabi
1 Fallow Fallow Boro 4050 16.32 Fallow T. Aman Boro 4150 16.73 Aus T. Aman Boro 2758 11.14 Fallow Fallow Mustard-Boro 1051 4.235 Aus Maskalai Boro 424 1.716 Aus Fallow Boro 1051 4.237 Aus Fallow Mustard-Boro 449 1.818 Fallow T. Aman Wheat 3230 139 Aus T. Aman Wheat 424 1.7110 Vegetable
sT. Aman Mustard 198 0.8
11 Fallow T. Aman Mustard 159 0.6412 Aus T. Aman Mustard 119 0.4813 Vegetable
sVegetables Vegetables 618 2.49
14 Vegetables
T. Aman Spice 360 1.45
15 Fallow T. Aman Maize 69 0.2816 Fallow T. Aman Fallow 3702 14.9
256

Literature Review
17 Mango T. Aman Mango 1250 5.0318 Maskalai Mango Mango 400 1.6119 Sugarcane Sugarcane Sugarcane 390 1.57
Total 24,850 100.0Source: UAO, Gomostapur, Chapainawabgonj
Presently 32.770% area is covered by single crops. According to UAOit is possible to grow double crops about 5% areas if there isirrigation facilities. About 39.08% lands is double cropped, it ispossible to grow triple crops in about 28.15% areas if there isirrigation facilities.
10. Input Use in Bangladesh Seed, fertilizer, pesticides and labor are the inputs used in bothhorticulture crops and field crops. The level of these inputs usedin Gomastapur pilot upazial is presented in table ?.
Table ?: Input used horticulture crops in the Gomastapur pilot area
Crop name
Fertilizer (Gm/Pit) Pesticides
Urea TSP MP GypsumCow dung(kg/pit)
No. ofAppli.
Liq.(ml/ha)
Mango 150 70 100 00 10 3-4 500-800Jackfruit 100 50 20 10 3 1-2 100-200Banana - 300 - - 15 3-4 100-200Litchi 00 100 00 00 5 2-3 100-300Guava 40 90 00 00 3 00 00Jujube 150 90 00 00 5 00 00Coconut 80 40 20 10 2 00 00Lemon 150 70 60 00 3 00 00
Source: UAO, DAE and Farmers interviewed January, 2014
Table ?: Input used in major field crops in the Gomastapur pilotarea
Crop nameSeed(Kg/ha)
Labor(No./ha )
Fertilizer(Kg/ha) Pesticides
Urea TSP MP Gypsum
No ofapplication
Liquid(ml/ha)
Gran./Pow.(kg/ha
HYV Boro 48 175 200-220
80-100
50-60 20-30 1-2 600 7-8
257

Literature Review
HYV Aman 45 165 150-160
60-70
- 00 1-2 700 7-8
Lt. Aman 50 160 80-100
40-60
0-40 00 0 0 0
HYV Aus 45 170 100-120
40-60
0-40 00 1-2 600 7-8
Mustard 8 100 100-120
40-60
30-40 00 1-2 650 7-8
Wheat 120 130 120-140
30-70
40-50 00 0-1 - 7-8
Spices 20 120 100-150
80-100
50-70 00 1-2 200 6-7
Maize 22 130 180-200
60-80
40-60 00 1-2 500-800 0
Pulses 30 100 80-100
- - 00 1-2 200-400 0
Sugarcane 3500cuttings
180 100-120
60-80
40-60 - 1-2 - 9-10
Vegetables (w)
3-4 120 120-150
60-80
40-50 00 3-5 650 6-8
Vegetables (s)
2-3 120 150-180
100-150
80-100
00 4-5 600 6-7
Source: UAO, DAE and Farmers interviewed January, 2014
11.1 Irrigation
Scarcity of irrigation water is severe in the pilot area due tolowering of ground water table in the dry season. Irrigation isprovided to HYV Boro crops. The source of irrigation water is groundwater. Irrigation is lifted with the help of Deep Tube Wells (DTWs)and Shallow Tube Wells (STWs). But, the availability of ground waterreduces in the dry season. Aus and T. Aman crop is generallypracticed under rain fed condition. Sometimes, supplementaryirrigation is provided during June-September under water tresscondition. But irrigation is occasionally provided to other cropssuch as Wheat, potato, Mustard, Vegetables, Maize, onion, garlic,chilli, lentil, orchard etc.
Table 14: Modes of irrigation, number and area (ha) irrigated in thepilot area
Mode ofirrigation
No. equipment Area irrigated(ha)
% of NCA
DTW 417 13,065 52STW 2,167 5,900 24LLP 786 5,871 24Total 3,370 24,836 100
Source: UAO, DAE, Gomostapur
12. Gender and Social Aspects
258
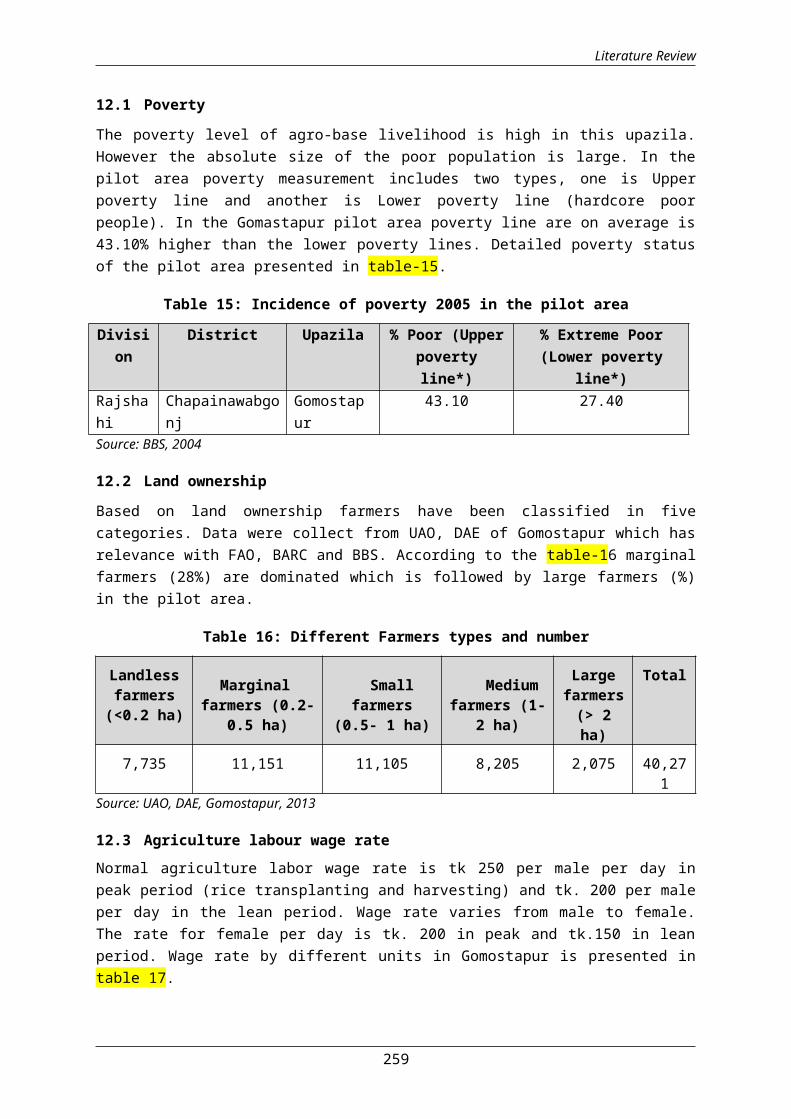
Literature Review
12.1 Poverty
The poverty level of agro-base livelihood is high in this upazila.However the absolute size of the poor population is large. In thepilot area poverty measurement includes two types, one is Upperpoverty line and another is Lower poverty line (hardcore poorpeople). In the Gomastapur pilot area poverty line are on average is43.10% higher than the lower poverty lines. Detailed poverty statusof the pilot area presented in table-15.
Table 15: Incidence of poverty 2005 in the pilot area
Division
District Upazila % Poor (Upperpovertyline*)
% Extreme Poor(Lower poverty
line*)Rajshahi
Chapainawabgonj
Gomostapur
43.10 27.40
Source: BBS, 2004
12.2 Land ownership
Based on land ownership farmers have been classified in fivecategories. Data were collect from UAO, DAE of Gomostapur which hasrelevance with FAO, BARC and BBS. According to the table-16 marginalfarmers (28%) are dominated which is followed by large farmers (%)in the pilot area.
Table 16: Different Farmers types and number
Landlessfarmers(<0.2 ha)
Marginalfarmers (0.2-
0.5 ha)
Smallfarmers
(0.5- 1 ha)
Mediumfarmers (1-
2 ha)
Largefarmers(> 2ha)
Total
7,735 11,151 11,105 8,205 2,075 40,271
Source: UAO, DAE, Gomostapur, 2013
12.3 Agriculture labour wage rateNormal agriculture labor wage rate is tk 250 per male per day inpeak period (rice transplanting and harvesting) and tk. 200 per maleper day in the lean period. Wage rate varies from male to female.The rate for female per day is tk. 200 in peak and tk.150 in leanperiod. Wage rate by different units in Gomostapur is presented intable 17.
259

Literature Review
Table-17: Wage rate by different units in Gomostapur
Labour wage Agriculture Labourtypes
Wage rate (Taka)Village Upazila
Average agri.day labor wagein peak period
Male 250 300Female 200 250
Average agri.day labor wagein lean period.
Male 200 250Female 150 200
Source: Farmers interviewed, January, 2014
12.4 Occupational status agricultural and non-agricultural Data were collected from BBS and UAO of DAE, Gomostapur. It wasanalyzed and presented in table-18. Maximum HHs in this upazilas isengaged on agricultural activities. For this reasons farmhousehold’s rate is higher than other upazilas.
Table-18: Agricultural and non-agricultural occupational status
Upazila TotalHHs
HHs entirely dependingon agricultural
production. for income(farm)
(%)
HHs entirelydepending onnon- farm
occupation. (nonfarm)
(%)
Gomostapur
62,938 59,791 95 3,147 5
Source: BBS, 2011 and UAO, DAE, Gomostapur
12.5 Population engaged in different activitiesGomostapur is dominant in agriculture especially fruits i.e mangoorchard based. Farmers practicing Mango+T. Aman and Mango+Mashkalaiinter cropping which is most popular in the pilot area. Agriculturesector is first priority and land preparation in mainly done bypower tiller. Aman rice is covering more area than Boro rice crop,because in Boro there is no scope for irrigation in the crops fielddue to irrigation crisis/ Barind Tract area. The socio-economiccondition of the livelihood system depends mainly on the agricultureproduction. Rural farmer in the pilot area is more dependent inagriculture sector. Most of the people (male and female) are workingin the different crops and horticulture crops field in the Upazilaand contributing in this sector to meet up the basic economic needfor their livelihood. Detailed of the population engaged inagriculture (7+years) activities is presented in table-19.
260
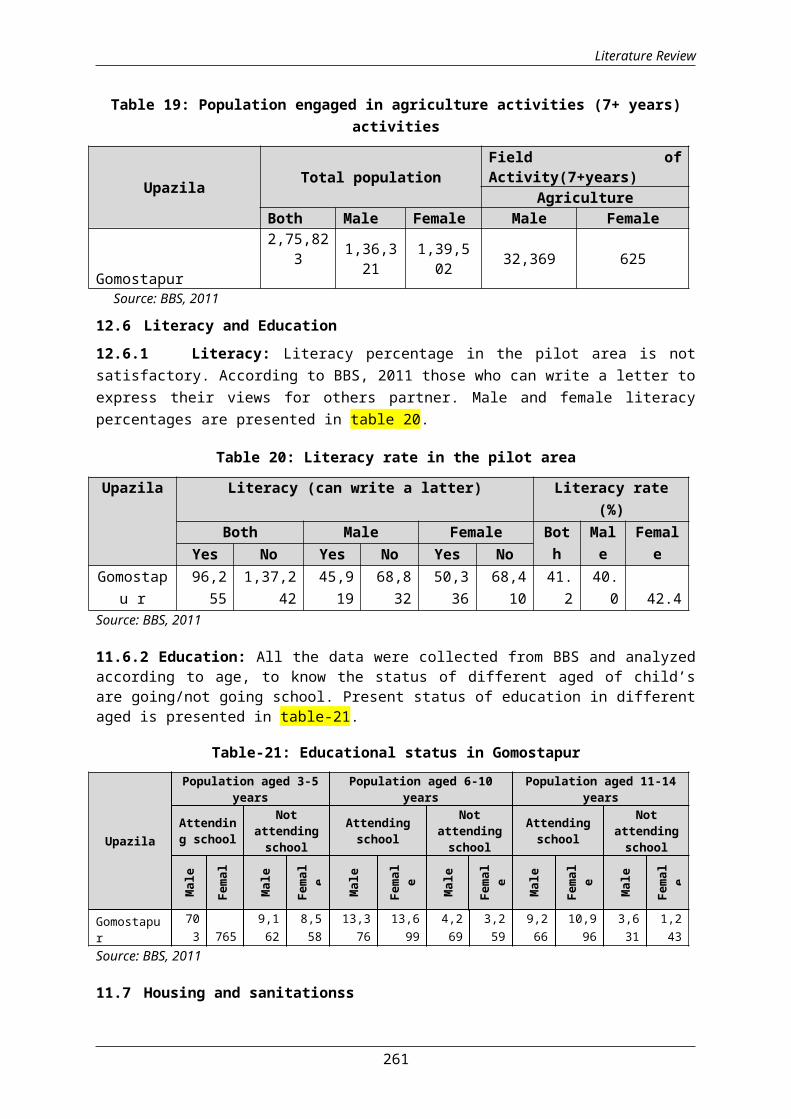
Literature Review
Table 19: Population engaged in agriculture activities (7+ years)activities
Upazila Total populationField ofActivity(7+years)
AgricultureBoth Male Female Male Female
Gomostapur
2,75,823 1,36,3
211,39,5
02 32,369 625
Source: BBS, 2011
12.6 Literacy and Education12.6.1 Literacy: Literacy percentage in the pilot area is notsatisfactory. According to BBS, 2011 those who can write a letter toexpress their views for others partner. Male and female literacypercentages are presented in table 20.
Table 20: Literacy rate in the pilot area
Upazila Literacy (can write a latter) Literacy rate(%)
Both Male Female Both
Male
FemaleYes No Yes No Yes No
Gomostapu r
96,255
1,37,242
45,919
68,832
50,336
68,410
41.2
40.0 42.4
Source: BBS, 2011
11.6.2 Education: All the data were collected from BBS and analyzedaccording to age, to know the status of different aged of child’sare going/not going school. Present status of education in differentaged is presented in table-21.
Table-21: Educational status in Gomostapur
Upazila
Population aged 3-5years
Population aged 6-10years
Population aged 11-14years
Attending school
Notattendingschool
Attendingschool
Notattendingschool
Attendingschool
Notattendingschool
Male
Femal
e
Male
Femal
e
Male
Femal
e
Male
Femal
e
Male
Femal
e
Male
Femal
e
Gomostapur
703 765
9,162
8,558
13,376
13,699
4,269
3,259
9,266
10,996
3,631
1,243
Source: BBS, 2011
11.7 Housing and sanitationss
261

Literature Review
All the data were collected from BBS and analyzed. Most of thehouses are kutcha (68.6%) which is followed by jhupri (4.3%). Incase of sanitary condition, 19.2% has no sanitary toilet facilities.Details housing and sanitary status are presented in table-22.
Table-22: Housing and sanitary status of dacope
Upazila
Numberof
Households
Type of Structure(%) Toilet Facility (%)
Pucka
Semi-
pucka
Kutcha
Jhupri
Sanitar
y(water-
Sanitar
y (non
water-
sealed)
Non-
sanitar
y
None
Gomostapur 62,938 7.7
19.4
68.6 4.3 11.7 10.7 58.4 19.2
Source: BBS 2011
13 Government and Non-Government Organizations13.1 Government organizationsThere are various Government and non-Government organizationsworking in the upazila to village level. Govt. organizational setupcover from District to unions level. In addition to that non-Govt.organizations are also working in the pilot area which is presentedin the table-23.
Table 23: Government and non- govt. organizations
Districtto Union
Govt-organizations (major) Non Govt-organizations
(major)
Gomostapur
Administrative Units, DAE, BMDA, BADC,DoF, DLS, BBS, BRDB, BARI, SRDI,BWDB, DPHE
ASA, KANTA, GrameenBank, TMSS, Care,Bangladesh etc
13.2 Non- Govt organizationsMost of the non-govt. organizations have their micro credit, health,crops, livestock, IGA and non-formal educational activities in thevillages. They gave training on agriculture, sanitation, etc. Groupformation remains the usual approach for the NGOs in reaching andaddressing development needs of the beneficiaries.
Crop Typology by cluster in Gomastapur Upazila pilot area
Cluster 1: High and medium high land, high yielding varietiesCrops, season and varieties of the Gomastapur pilot upazila arepresented in the table-24. Present practices and the possibilitieswere discussed with the local farmers, SAAO of DAE in the field
262

Literature Review
level and in the office Agriculture Extension Officer (AEO) of DAE.After a long discussion it was agreed that more new varieties ofcrops and recommended fertilizer application may be adopted andimprove cropping patterns is possible to fit in the pilot area.
Table 24: Crops grown in the pilot area
AEZno.
6,11,26
Crop Season
Varieties
Aus Kharif-I
Pariza, BR-26, BRRI Dhan-48
Rice Kharif-II
Sada Sorna, BR-23, BRRI Dhan-39, BRRIDhan-40, BRRI Dhan-41,BBRI-49 ,BINA-7
Rice Boro BR-3, BRRI Dhan-28, BRRI Dhan-29, BRRIDhan-36, BRRI Dhan-48, BINA-8
Vegetables
Kharif-IandRabi
Indian spinach: BARI Pui shak-1, Lalshak: BARI Lal shak-1, Palong shak-Kapipalong, Cauli flower-BARI phulkapi-1,Snow white, Cabbage-KK cross-1,Brinjal,BARI Begun-1,BARI Begun-2, Ladies finger-Bangkim, BARI Dherosh-1,Bean-BARI ,Potato-Cardinal, Diamond, Lalsindurkuti.
Mustard Rabi BARI 9,,BARI-14, BARI-15, Tori-7, Local
Pulses Rabi BARI Masur-5, BARI Sola-4, :BARI Sola-5,Local Khesari
Spices Roundtheyear
Taherpuri onion, Rashun-local, Chilli-Ghora, Sikrampuri, Turmeric-Dimla,Zinger-Local improved variety
Wheat Rabi Satabdi, Prodip, BARI wheat-25, BARIwheat-26
Source: UAO, DAE and Farmers interviewed, Nov, 2013
Example- 1: Farmers grow more Aman crops in the pilot area than Borocrops due to scarcity of irrigation water during dry season. It ispossible to change cropping pattern if availability of water sourcein the pilot area can be increased by creating water reservoir tostorage rain water or re-excavation of khals. Farmers will bebenefited if they are made aware about crops growing period and userecommended fertilizer in time. It is expected that farmers will useextra seed, labor, fertilizer and pesticide application. Proper
263
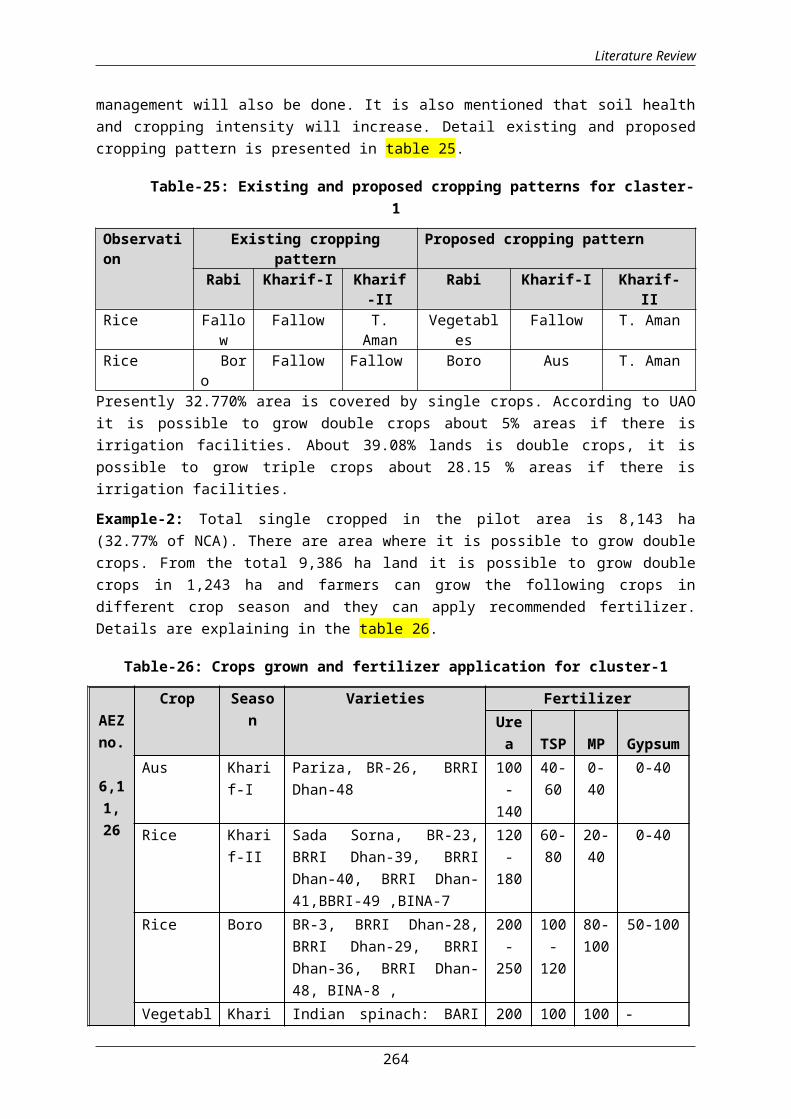
Literature Review
management will also be done. It is also mentioned that soil healthand cropping intensity will increase. Detail existing and proposedcropping pattern is presented in table 25.
Table-25: Existing and proposed cropping patterns for claster-1
Observation
Existing croppingpattern
Proposed cropping pattern
Rabi Kharif-I Kharif-II
Rabi Kharif-I Kharif-II
Rice Fallow
Fallow T.Aman
Vegetables
Fallow T. Aman
Rice Boro
Fallow Fallow Boro Aus T. Aman
Presently 32.770% area is covered by single crops. According to UAOit is possible to grow double crops about 5% areas if there isirrigation facilities. About 39.08% lands is double crops, it ispossible to grow triple crops about 28.15 % areas if there isirrigation facilities.
Example-2: Total single cropped in the pilot area is 8,143 ha(32.77% of NCA). There are area where it is possible to grow doublecrops. From the total 9,386 ha land it is possible to grow doublecrops in 1,243 ha and farmers can grow the following crops indifferent crop season and they can apply recommended fertilizer.Details are explaining in the table 26.
Table-26: Crops grown and fertilizer application for cluster-1
AEZno.
6,11,26
Crop Season
Varieties FertilizerUrea TSP MP Gypsum
Aus Kharif-I
Pariza, BR-26, BRRIDhan-48
100-
140
40-60
0-40
0-40
Rice Kharif-II
Sada Sorna, BR-23,BRRI Dhan-39, BRRIDhan-40, BRRI Dhan-41,BBRI-49 ,BINA-7
120-
180
60-80
20-40
0-40
Rice Boro BR-3, BRRI Dhan-28,BRRI Dhan-29, BRRIDhan-36, BRRI Dhan-48, BINA-8 ,
200-
250
100-
120
80-100
50-100
Vegetabl Khari Indian spinach: BARI 200 100 100 -
264

Literature Review
AEZno.
6,11,26
Crop Season
Varieties FertilizerUrea TSP MP Gypsum
es f-IandRabi
Pui shak-1, Lal shak:BARI Lal shak-1,Palong shak-Kapipalong, Cauli flower-BARI phulkapi-1, Snowwhite, Cabbage-KKcross-1,Brinjal, BARIBegun-1,BARI Begun-2,Ladies finger-Bangkim, BARIDherosh-1,Bean-BARI ,Potato-Cardinal,Diamond,Lalsindurkuti.
-300
-200
-200
Mustard Rabi BARI 9,,BARI-14,BARI-15, Tori-7,Local
80-100
60-70
40-50
-
Pulses Kharif-2
BARI Masur-5, BARISola-4, :BARI Sola-5,Local Khesari
80-100
40-50
30-35
Spices Rabi Taherpuri onion,Rashun-local, Chilli-Ghora, Sikrampuri,Turmeric-Dimla,
250-270
190-210
150-170
-
Wheat Rabi Satabdi, Prodip, BARIwheat-25, BARI wheat-26
200-
250
100-
120
80-100
50-100
Source: BARI, BRRI; BINA
265
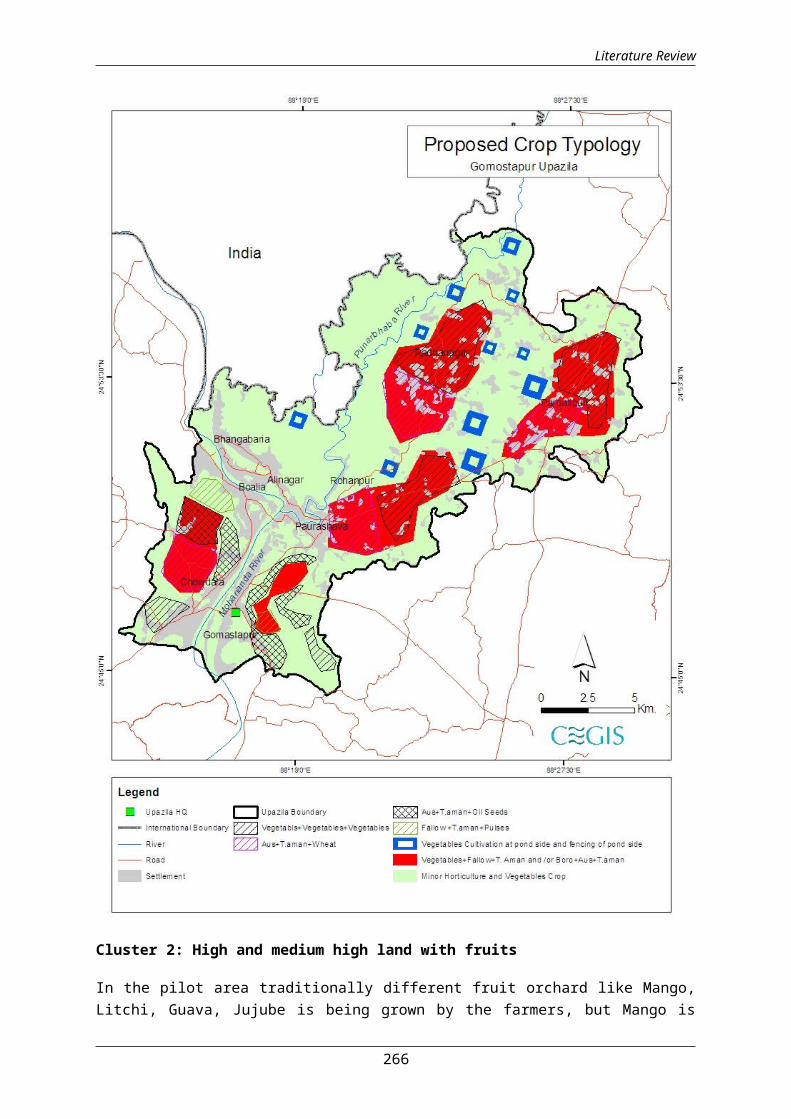
Literature Review
Cluster 2: High and medium high land with fruits
In the pilot area traditionally different fruit orchard like Mango,Litchi, Guava, Jujube is being grown by the farmers, but Mango is
266
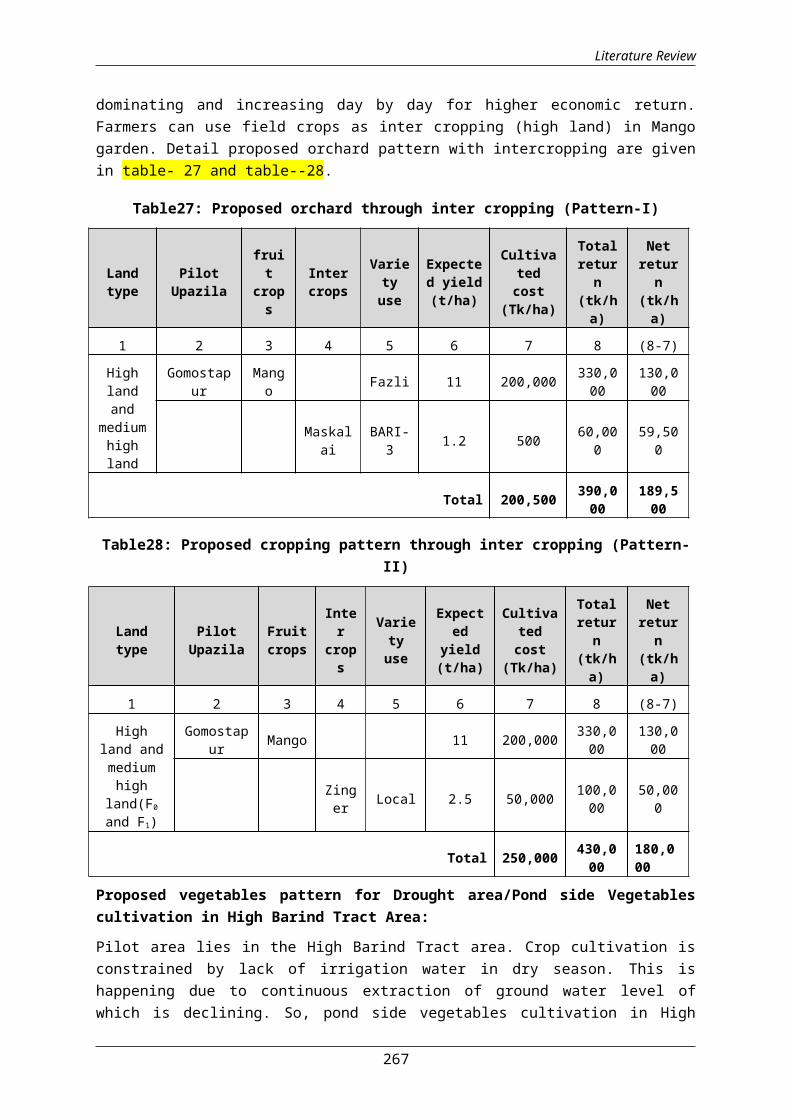
Literature Review
dominating and increasing day by day for higher economic return.Farmers can use field crops as inter cropping (high land) in Mangogarden. Detail proposed orchard pattern with intercropping are givenin table- 27 and table--28.
Table27: Proposed orchard through inter cropping (Pattern-I)
Landtype
PilotUpazila
fruit
crops
Intercrops
Varietyuse
Expected yield(t/ha)
Cultivatedcost
(Tk/ha)
Totalreturn
(tk/ha)
Netreturn
(tk/ha)
1 2 3 4 5 6 7 8 (8-7)
Highlandand
mediumhighland
Gomostapur
Mango Fazli 11 200,000 330,0
00130,000
Maskalai
BARI-3 1.2 500 60,00
059,500
Total 200,500 390,000
189,500
Table28: Proposed cropping pattern through inter cropping (Pattern-II)
Landtype
PilotUpazila
Fruitcrops
Inter
crops
Varietyuse
Expected
yield(t/ha)
Cultivatedcost
(Tk/ha)
Totalreturn
(tk/ha)
Netreturn
(tk/ha)
1 2 3 4 5 6 7 8 (8-7)
Highland andmediumhigh
land(F0
and F1)
Gomostapur Mango 11 200,000 330,0
00130,000
Zinger Local 2.5 50,000 100,0
0050,000
Total 250,000 430,000
180,000
Proposed vegetables pattern for Drought area/Pond side Vegetablescultivation in High Barind Tract Area:
Pilot area lies in the High Barind Tract area. Crop cultivation isconstrained by lack of irrigation water in dry season. This ishappening due to continuous extraction of ground water level ofwhich is declining. So, pond side vegetables cultivation in High
267

Literature Review
Barind Tract area may be introduced widely to mitigate the droughtproblem.
Table 29: Vegetables cultivation at pond side and fencing of pondside
Pond side Kharif RabiPond side Fence
(Pondside)
Pond side Fence(Pondside)
Southside
Ladiesfinger/Banana
Ribbedgourd
Brinjal/Lalsak
Bean
Northside
Kang kong(Kolmisak/Katua data
Bittergourd
Tomato/Carrot
Yard longbean
East side Wintervegetablesseedling/Bittergourd/Chilli
Ribbedgourd
Yard longbean/ Carrot
Bean
West side Sweetgourd/Chilli
Bittergourd
Spinach+ Lalsak+Chilli
Yard longbean
Table-30: Vegetables cultivation at surrounding area of pond andside of pond
Pond side Vegetables cultivation inFence at surrounding sideof pond
Vegetables cultivation atpond side
Kharif Rabi Kharif RabiSouthside
Ribbed gourd Bean Ash gourd Bottle gourd
Northside
Bitter gourd Yard longbean
Snake gourd Bottle gourd
East side Ribbed gourd Bean Snake gourd Bottle gourdWest side Bitter gourd Yard long
beanSnake gourd Bottle gourd
Cluster 3: High and Medium high land
Following crops can be grown in different land type
Cereal andoilseeds cropswith different
Aus: Pariza, BRRI Dhan-48 and BR-27
Aman: Sada Sorna, BR-23, BRRI Dhan-39, BRRI
268

Literature Review
seasons Dhan-40, BRRI Dhan-41,BBRI-49 ,BINA-7Boro: BR-3, BRRI Dhan-28, BRRI Dhan-29, BRRIDhan-36, BRR Dhan-48, BINA-7
OiOilseeds: Mustard: Tori-7, BARI-14, BARI-15
Differentvegetables
Vegetables: Bitter gourd, Indian spinach, Yardlong bean, Lalshak, Snake gourd, Ash gourd,Bottle gourd, Sweet gourd, Sponge gourd, Spinachand Amaranthus.
Table30: Proposed cropping pattern
Cropping PatternsKharif-I Kharif-II RabiFallow T. Aman FallowAus Fallow Boro
Fallow T. Aman BoroAus T.Aman Oil seeds
Presently 32.770% area is covered by single crops. According to UAOit is possible to grow double crops in about 5% areas if there isirrigation facilities. About 39.08% lands is double cropped, it ispossible to grow triple crops in about 33.15% areas if there isirrigation facilities.
Cluster 4: Medium high, medium low and low land
Following crops can be grown in different land type
Cereal, oilseedsand pulses cropswith differentseasons
Aus: Pariza, BRRI Dhan-48 and BR-27
Aman Sada Sorna, BR-23, BRRI Dhan-39, BRRIDhan-40, BRRI Dhan-41,BBRI-49 ,BINA-7
Boro: BRRI Dhan-28, BRRI Dhan-29, BRR Dhan-47, BINA-8
OiOilseeds: : Mustard: Tori-7, BARI-14, BARI-15
Pluses: BARI Mung-5
Wheat: Satabdi, Prodip, BARI wheat-25, BARIwheat-26
Differentvegetables
Vegetables: Bitter gourd, Indian spinach, Yardlong bean, Lalshak, Snake gourd, Ash gourd,Bottle gourd, Sweet gourd, Sponge gourd,Spinach and Amaranthus.
269
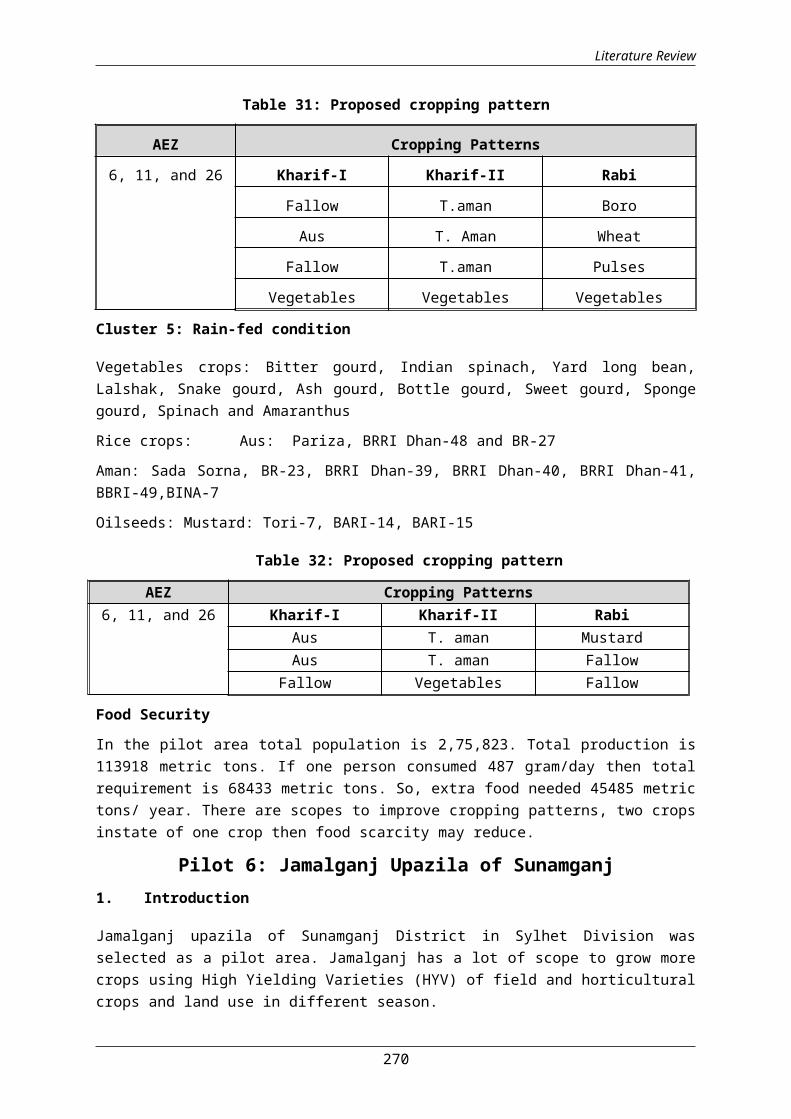
Literature Review
Table 31: Proposed cropping pattern
AEZ Cropping Patterns
6, 11, and 26 Kharif-I Kharif-II Rabi
Fallow T.aman Boro
Aus T. Aman Wheat
Fallow T.aman Pulses
Vegetables Vegetables Vegetables
Cluster 5: Rain-fed condition
Vegetables crops: Bitter gourd, Indian spinach, Yard long bean,Lalshak, Snake gourd, Ash gourd, Bottle gourd, Sweet gourd, Spongegourd, Spinach and Amaranthus
Rice crops: Aus: Pariza, BRRI Dhan-48 and BR-27
Aman: Sada Sorna, BR-23, BRRI Dhan-39, BRRI Dhan-40, BRRI Dhan-41,BBRI-49,BINA-7
Oilseeds: Mustard: Tori-7, BARI-14, BARI-15
Table 32: Proposed cropping pattern
AEZ Cropping Patterns6, 11, and 26 Kharif-I Kharif-II Rabi
Aus T. aman MustardAus T. aman Fallow
Fallow Vegetables Fallow
Food Security
In the pilot area total population is 2,75,823. Total production is113918 metric tons. If one person consumed 487 gram/day then totalrequirement is 68433 metric tons. So, extra food needed 45485 metrictons/ year. There are scopes to improve cropping patterns, two cropsinstate of one crop then food scarcity may reduce.
Pilot 6: Jamalganj Upazila of Sunamganj1. Introduction
Jamalganj upazila of Sunamganj District in Sylhet Division wasselected as a pilot area. Jamalganj has a lot of scope to grow morecrops using High Yielding Varieties (HYV) of field and horticulturalcrops and land use in different season.
270
Literature Review
Sunamganj zila emerged as a zila on the 1st March, 1984. The zila isfull of haors and baors. This might be the origin of the zila nameto be Sunamganj. It is bounded on the North by India, on the east bySylhet zila, on the south by Habiganj and Kishoreganj zilas and onthe west by Netrokona zila. It lies between 24º34' and 25º12' northlatitudes and between 90º 56' and 91º 49' East longitudes. The totalarea of the zila is 3747.18 Sq. km. (1446.00 sq. miles) of which71.28 sq. km. (27.52 sq. miles) are under forest. Annual AverageTemperature: Maximum 33.2°C and minimum 13.6°C; annual rainfall3334mm (BBS, 2011). There are many haors and beels in Sunamganj.Administrative map of Jamalganj upazila are showing in the map-.
271

Literature Review
1.1.1 Geographic information of Jamalganj upazila:The upazila occupies an area of 309.38 sq. km. It is located between24 º50´ and 25º04´ north latitudes and between 91º05´ and 91º19´east longitudes. The upazila is bounded on the north by Tahirpur andBishwambarpur upazilas, on the east by Sunamganj Sadar upazia and on
272
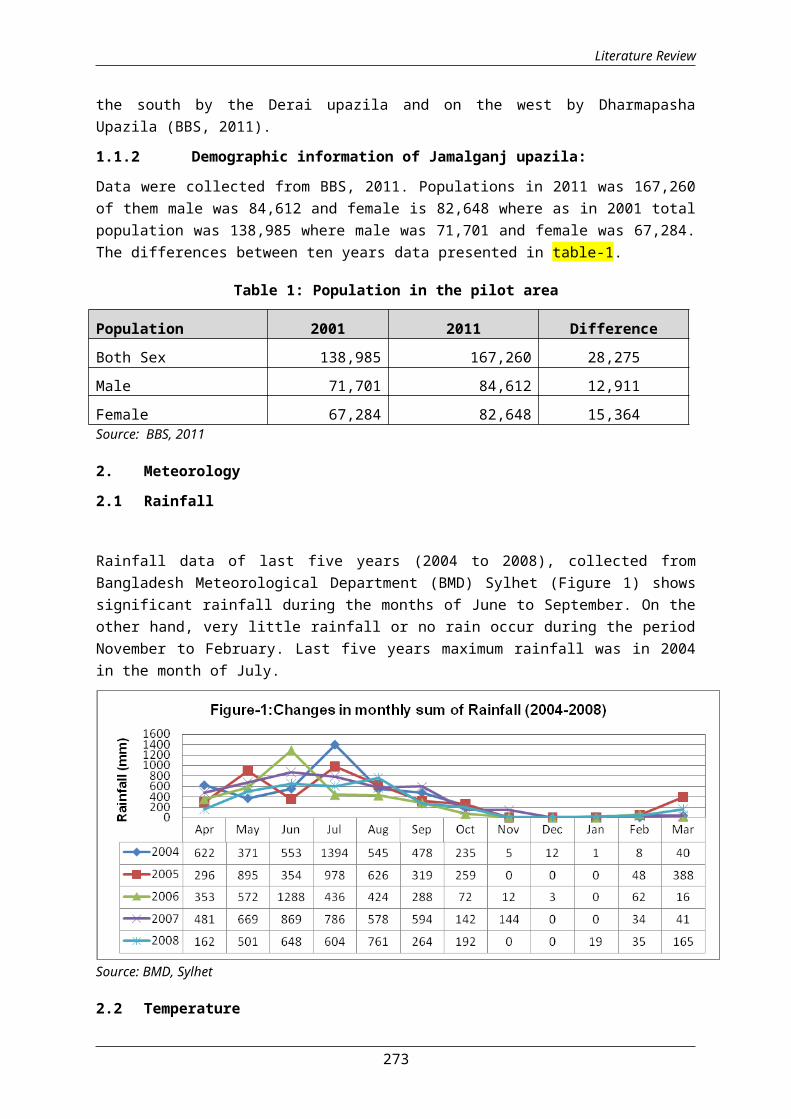
Literature Review
the south by the Derai upazila and on the west by DharmapashaUpazila (BBS, 2011).
1.1.2 Demographic information of Jamalganj upazila:
Data were collected from BBS, 2011. Populations in 2011 was 167,260of them male was 84,612 and female is 82,648 where as in 2001 totalpopulation was 138,985 where male was 71,701 and female was 67,284.The differences between ten years data presented in table-1.
Table 1: Population in the pilot area
Population 2001 2011 DifferenceBoth Sex 138,985 167,260 28,275Male 71,701 84,612 12,911Female 67,284 82,648 15,364Source: BBS, 2011
2. Meteorology
2.1 Rainfall
Rainfall data of last five years (2004 to 2008), collected fromBangladesh Meteorological Department (BMD) Sylhet (Figure 1) showssignificant rainfall during the months of June to September. On theother hand, very little rainfall or no rain occur during the periodNovember to February. Last five years maximum rainfall was in 2004in the month of July.
Source: BMD, Sylhet
2.2 Temperature
273

Literature Review
Maximum: Mean data of last five years from 2006 to 2010 indicatedthat the mean monthly maximum temperature was 33.99°C in August andthat was the warmest month (Figure 2).
Source: BMD, Sylhet
Minimum: The lowest ever recorded minimum temperature is 12.2°Crecorded in the month of January, 2007. Details are shown in figure-3.
Source: BMD, Sylhet
2.3 HumidityThe humidity data of Jamalganj was collected from BMD and plotted ingraph shown below. From the figure it is observed that June, July,August and September are the maximum humid months when averagemonthly relative humidity varies from 82.6 to 88.2%. The minimumaverage humidity occurs in the period from November to March which
274
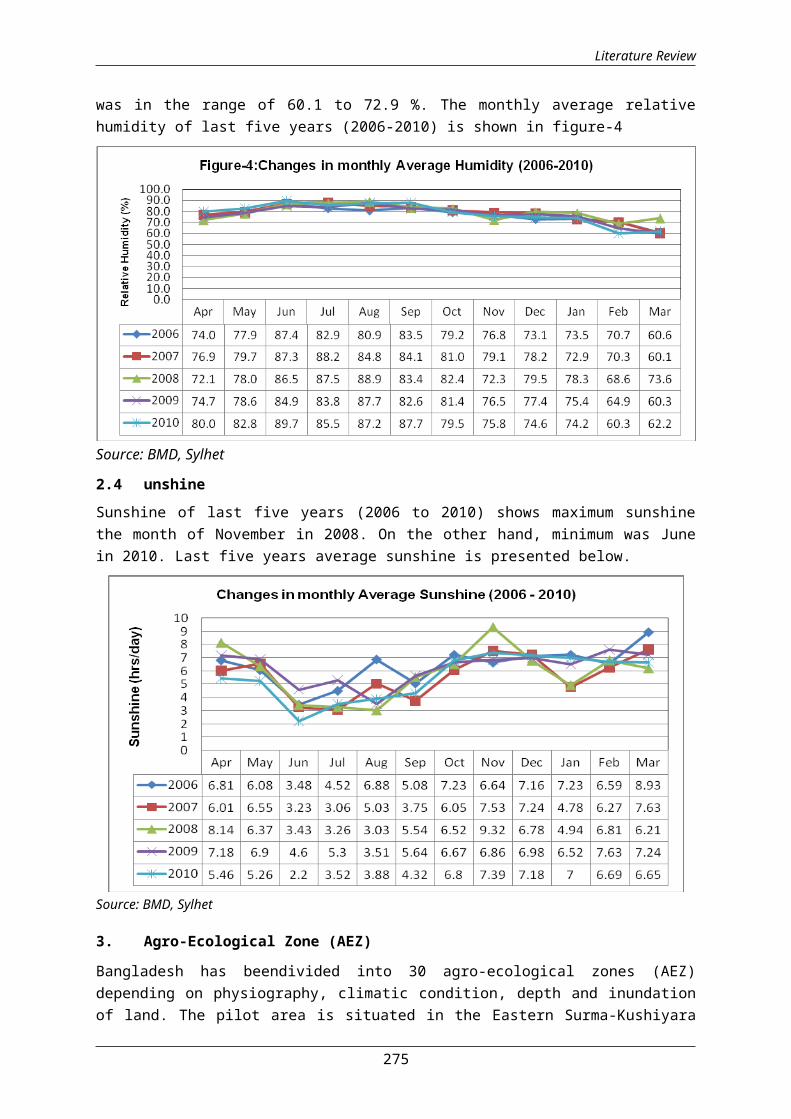
Literature Review
was in the range of 60.1 to 72.9 %. The monthly average relativehumidity of last five years (2006-2010) is shown in figure-4
Source: BMD, Sylhet
2.4 unshineSunshine of last five years (2006 to 2010) shows maximum sunshinethe month of November in 2008. On the other hand, minimum was Junein 2010. Last five years average sunshine is presented below.
Source: BMD, Sylhet
3. Agro-Ecological Zone (AEZ)
Bangladesh has beendivided into 30 agro-ecological zones (AEZ)depending on physiography, climatic condition, depth and inundationof land. The pilot area is situated in the Eastern Surma-Kushiyara
275

Literature Review
Floodplain (AEZ 20) and Sylhet Basin (AEZ 21) is shown in map-3 andmap-4. Details descriptions of AEZ are given below and crops (fieldand horticultural) grown in the pilot area according to AEZs arepresented in the table-2.
Eastern-Surma Khushiyara Floodplain (AEZ-20)
276

Literature Review
This region occupies the relatively higher parts of the Surma-Kushiyara Floodplain formed on sediments of the rivers draining intothe Meghna catchment area from the hills. The area is mainly smooth,broad ridges and basins.
This area is occupied by grey, heavy silty clay loams on the ridgesand clays in the basins. Non calcareous Grey Floodplain soils arethe only General Soil Type. Organic matter content of the soil ismoderate. Soil reaction ranges from strongly acidic to neutral.Levels of CEC and Zn are medium while the status of P, K and B islow.
Sylhet Basin (AEZ 21)
The region occupies the lower, western side of the Surma-KushiyaraFloodplain. The area is mainly smooth, broad basins with narrowridges of higher land along rivers. Soils of the area are grey siltyclay loams and clay loam on the higher parts that dry out seasonallyand grey clays in the wet basins. Non calcareous Grey Floodplainsoils and Acid Basin Clays are the major components of the generalsoil types. The soils have moderate content of organic matter andsoil reaction is mainly acidic. Fertility level is medium to highwith medium P and Zn contents.
Table 2: Field and horticultural crops grown according to AEZs
AEZNo.
Name ofAEZ
Totalarea(ha)
Major crops grown
20and21
Eastern-Surma
Khushiyara
Floodplain
6760
Rice, Brinjal, Cabbage, Cauliflower,Knol khol (Oal kopi), Gourd, Spongegourd (Dhundal), Amaranth (Danta), Redamaranth (Lal shak), Tomato, Snakegourd (Chichinga), Ash gourd, Ribbedgourd (Jhinga), Ladies finger (Okra),yard long bean, Sweet gourd, ChilliFruit crops(Grown only homestead):Safeda (Sapota), Ber (Kul), Aam, Guava,Kanthal
SylhetBasin
20290 Rice, Brinjal, Cabbage, Cauliflower,Knol khol (Oal kopi), Gourd, Spongegourd (Dhundal), Amaranth (Danta), Redamaranth (Lal shak),Tomato, Snake gourd(Chichinga), Ash gourd Ribbedgourd(Jhinga), Ladies finger (Okra),yard long bean, Sweet gourd,
277

Literature Review
Watermelon, ChilliFruit crops(Grown only homestead):Safeda (Sapota), Ber (Kul), Aam, Guava,Kanthal
Source: Local farmers
4 Land types in pilot area Total area in the pilot project is 31,331 ha and net cultivated areais 27,050 ha. The pilot area is dominated by low land (32%) andwhich is followed by medium high land (24%). The land types ofJamalganj Upazila are presented in table 3 and map-4.
Table 3: Detailed land type of the pilot area
Land type Area(ha) % of NCA
High land (F0) 2,435 9
Medium high land (F1) 5,410 20
Medium low land (F2) 6,492 24
Low land (F3) 8,656 32
Very low land (F4) 4,058 15
Total 27,050 100Source: CEGIS estimation from UAO, DAE, Jamalganj
5. Land use in the pilot area
Total land area is 31,331 ha and net cultivable land is 86.3% in thepilot area. The Settlement, Road & Infrastructure and Water bodies’area is about 1.2%, 0.2% and 12.3% of the pilot area respectively.Detailed land use of the pilot area is presented in table-4 and map-5.
Table-4: Detailed land use of the pilot area
Land use Area(ha) %Settlement 363 1.2Road, Infrastructure & other structure 77 0.2Water bodies(River, Beel, Haor and Khal) 3,841 12.3NCA 27,050 86.3Gross area 31,331 100
278

Literature Review
Source: UAO, DAE, Jamalganj and from SOLARIS-SRDI
Map6: Land use of the pilot area
6. Soil Texture
Soil texture is the relative proportions of sand, silt and clay. Itis very important for agriculture crop production. The soil textureis dominated by clay loam (49%) which is followed by clay (34%) inthe pilot area. Detailed soil texture is presented in table-5.
Table5: Detailed soil texture of top soil (0-15cm) in pilot area
Texture Area(ha) % of NCAClay 9,197 34Clay Loam 13,396 49Loam 4,579 17
Total 27,050 100Source: CEGIS estimation from SOLARIS
279

Literature Review
7. Available soil moisture
According to SRDI (1988), the available soil moisture has beenclassified into four categories. Entire pilot area is under high
280
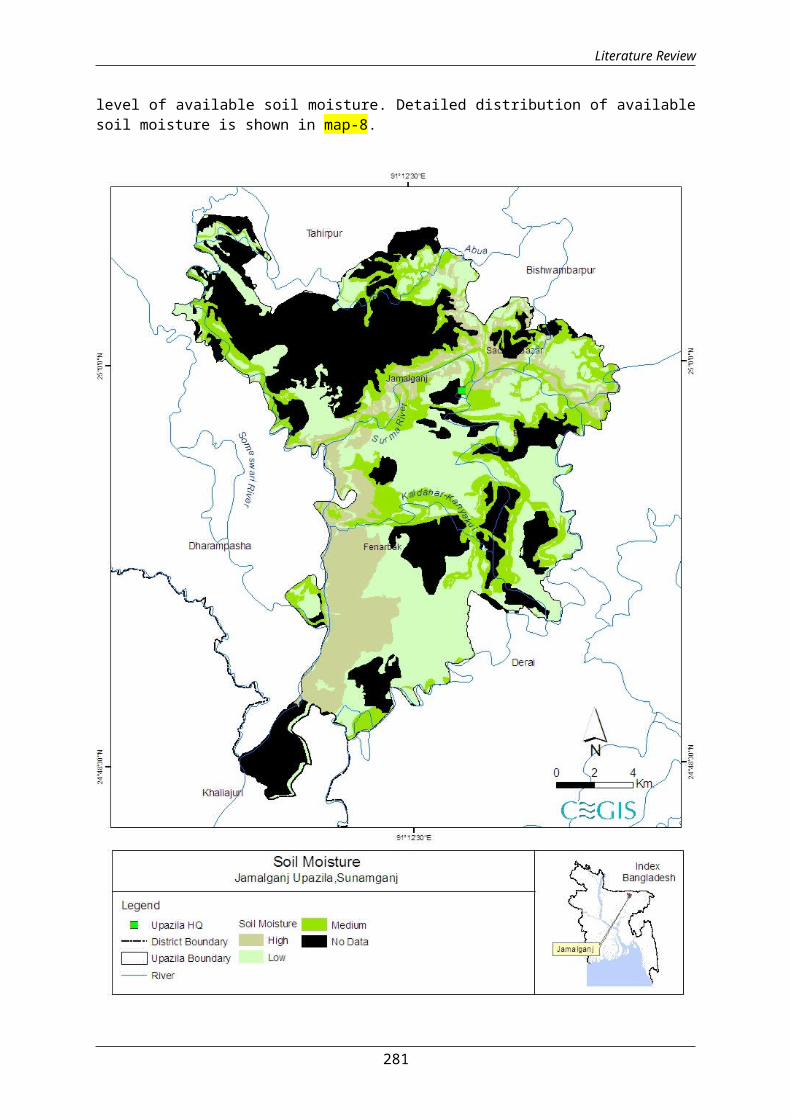
Literature Review
level of available soil moisture. Detailed distribution of availablesoil moisture is shown in map-8.
281

Literature Review
282

Literature Review
8. Drainage CharacteristicsDrainage plays a vital role in the management of soil in the projectarea. As per the SRDI (1988), the drainage characteristics have beendivided into six classes from the agriculture point of view. Entirepilot area is under poorly drained condition. Detailed drainageinformation of pilot area is shown in map-10.
283
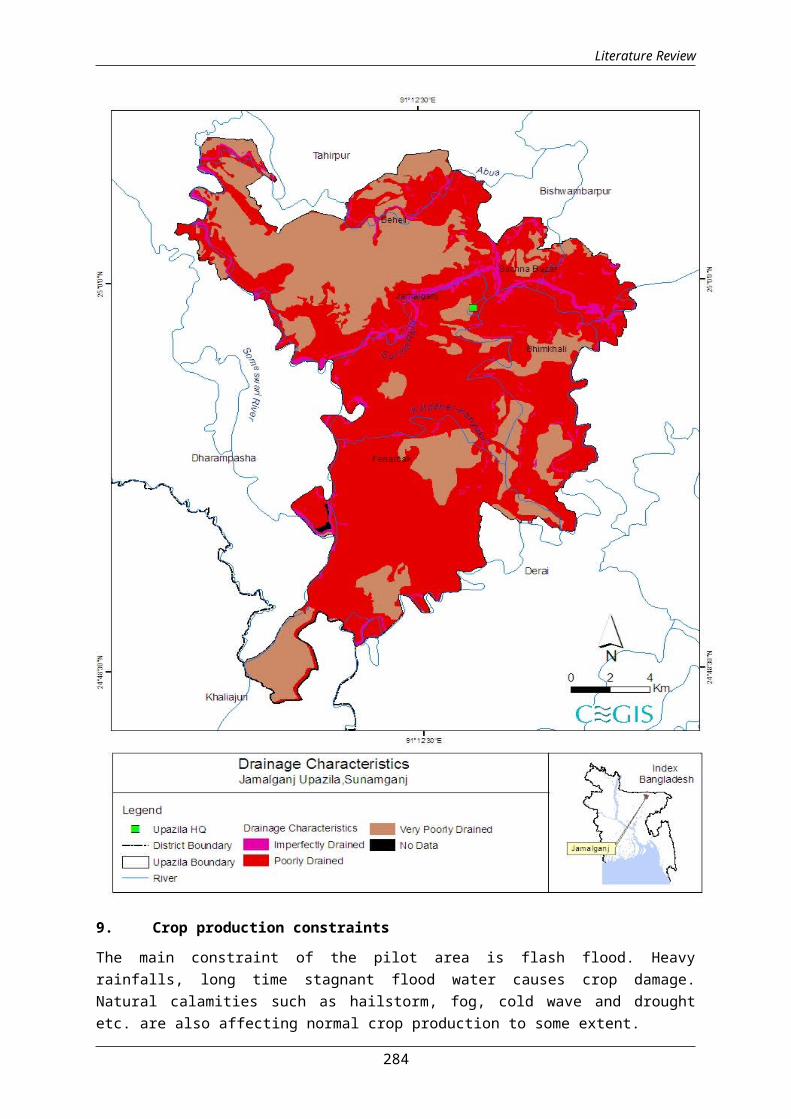
Literature Review
9. Crop production constraints
The main constraint of the pilot area is flash flood. Heavyrainfalls, long time stagnant flood water causes crop damage.Natural calamities such as hailstorm, fog, cold wave and droughtetc. are also affecting normal crop production to some extent.
284

Literature Review
10. Present cropping patternsThere are 190 villages in Jamalganj Upazila. The Department ofAgricultural Extension (DAE) has 8 Agriculture Blocks (AB) wherefarmers are growing different crops in the field, but crops areoften damaged by flash flood.
Dominant cropping pattern is Fallow-Fallow-Boro which is practicedin 65% of the NCA. Next cropping pattern is Fallow-Lt. aman-Mustardpracticed in 18% of the NCA. Cropping intensity is about 130%.Existing cropping patterns with area of coverage are presented intable-9.
Table-9: Existing cropping patterns with area in the pilot area
Sl.No.
Cropping Patterns Area(ha) % ofland useKharif-I Kharif-II Rabi
1 Vegetables Fallow Vegetables 541 22 Fallow Lt.aman Mustard 4869 183 Fallow T.aman Boro 4058 154 Fallow Fallow Boro 17583 65
Total 27050 100Source: UAO, DAE, Jamalganj
Picture 1:Brinjal field in thepilot area
Picture 2:Country bean plant inthe pilot area
285

Literature Review
Picture 3: Boro field withirrigation facilities
Picture 4: Surface waterirrigation in boro crop field in
the pilot area
Picture 5: Sweet gourd field inthe pilot area
Picture 6: Weeding in boro fieldby rice weeder
Presently 65% area is covered by single crops. According to UAO itis possible to grow double crops about 5% areas if there isirrigation facilities. About 35% lands is double crops, it ispossible to grow triple crops about 5% areas if there is irrigationfacilities.
11. Input Use in pilot area
Seed, labor, fertilizer and pesticide used in different crops inJamalgonj pilot upazila are presented in table ?.
286
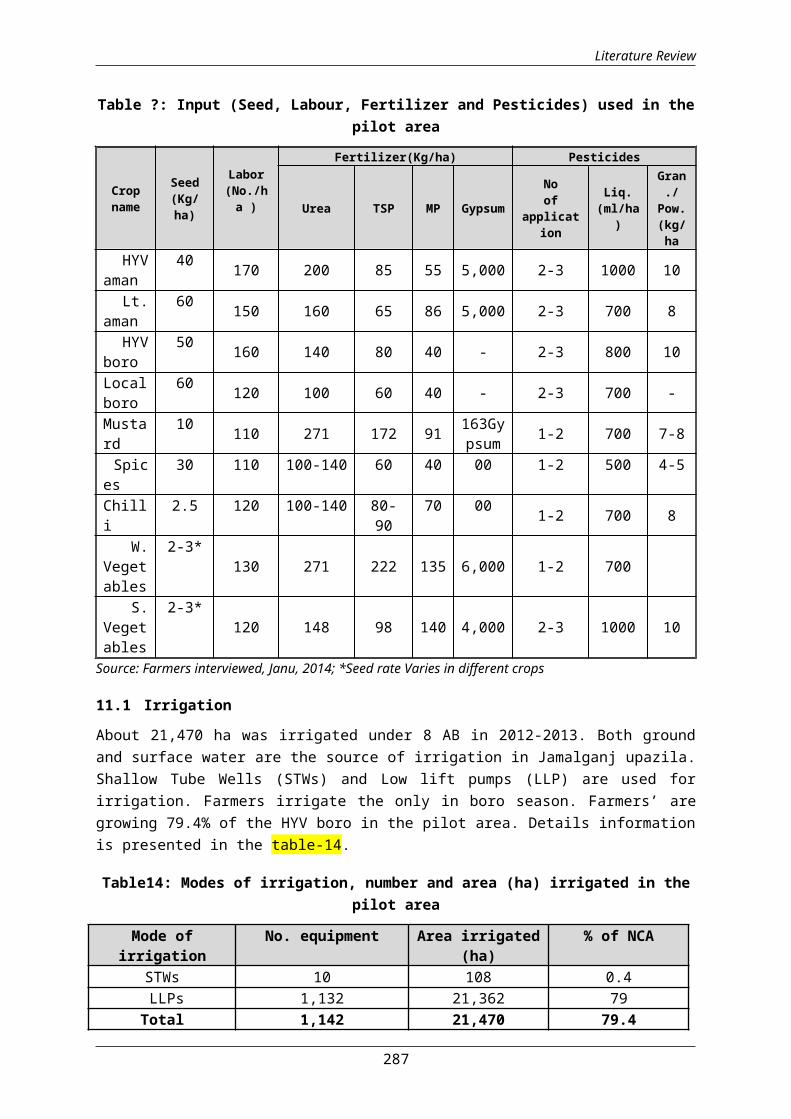
Literature Review
Table ?: Input (Seed, Labour, Fertilizer and Pesticides) used in thepilot area
Cropname
Seed(Kg/ha)
Labor(No./ha )
Fertilizer(Kg/ha) Pesticides
Urea TSP MP Gypsum
Noof
application
Liq.(ml/ha
)
Gran./
Pow.(kg/ha
HYVaman
40 170 200 85 55 5,000 2-3 1000 10
Lt.aman
60 150 160 65 86 5,000 2-3 700 8
HYVboro
50 160 140 80 40 - 2-3 800 10
Localboro
60 120 100 60 40 - 2-3 700 -
Mustard
10 110 271 172 91 163Gypsum 1-2 700 7-8
Spices
30 110 100-140 60 40 00 1-2 500 4-5
Chilli
2.5 120 100-140 80-90
70 00 1-2 700 8
W.Vegetables
2-3*130 271 222 135 6,000 1-2 700
S.Vegetables
2-3*120 148 98 140 4,000 2-3 1000 10
Source: Farmers interviewed, Janu, 2014; *Seed rate Varies in different crops
11.1 Irrigation
About 21,470 ha was irrigated under 8 AB in 2012-2013. Both groundand surface water are the source of irrigation in Jamalganj upazila.Shallow Tube Wells (STWs) and Low lift pumps (LLP) are used forirrigation. Farmers irrigate the only in boro season. Farmers’ aregrowing 79.4% of the HYV boro in the pilot area. Details informationis presented in the table-14.
Table14: Modes of irrigation, number and area (ha) irrigated in thepilot area
Mode ofirrigation
No. equipment Area irrigated(ha)
% of NCA
STWs 10 108 0.4LLPs 1,132 21,362 79
Total 1,142 21,470 79.4
287

Literature Review
Source: UAO, DAE, Jamalganj and BADC, 2010
12. Gender and Social Aspects
12.1 Poverty
In the pilot area poverty measurement includes two types, one isUpper poverty line and another is Lower poverty line (hardcore poorpeople). In the pilot area, poverty line are on average 52.10%higher than the lower poverty lines. Detailed poverty status of thepilot area presented in table 15.
Table 15: Incidence of poverty 2005 in the pilot area
Division
District Upazila % Poor (Upperpoverty line*)
% Extreme Poor (Lowerpoverty line*)
Sylhet Sunamganj
Jamalganj
52.10 29.70
Source: BBS, 2004
12.2 Land ownership
Data were collect from UAO, DAE of Jamalganj which has relevancewith FAO, BARC and BBS. According to the table 14 small farmers(33%) are dominant which is followed by large farmers (6%) in thepilot area. Categories wise land ownership data is presented intable-16.
Table-16: Different Farmers types and number
Landlessfarmers
MarginalfarmersSmall farmers Medium farmers Large
farmersTotal
4,397 8,462 9,905 5,473 1,698 29,935Source: UAO, DAE, Jamalganj, 2013
12.3 Agriculture labour wage rateOpen discussion with different categories of farmers in the fieldrevealed that normal agriculture labor wage rate is tk 350 per maleper day in peak period (rice transplanting and harvesting) and tk.250 per male per day in the lean period. Wage rate varies from maleto female. The rate for per female per day is tk. 200 in peak andtk.150 in lean period. Wage rate by different units in Jamalganj ispresented in table 17.
Table 17: Wage rate by different units in Jamalganj
Labour wage Agriculture Labour Wage rate (Taka)
288

Literature Review
types Village UpazilaAverage agri.day labor wagein peak period
Male 350 400Female 200 250
Average agri.day labor wagein lean period.
Male 250 300Female 150 200
Source: RRA, Jamalganj
12.4 Occupational status Data on occupational status were collected from BBS and UAO of DAE,Jamalganj. It was analyzed and presented in table 18. Maximum HHs inthis upazilas is engaged on agricultural activities. For thisreasons farm household’s rate is higher than other upazilas.
Table 18: Agricultural and non-agricultural occupational status
Upazila TotalHHs
HHs entirelydepending onagricultural
production. forincome (farm)
(%)
HHs entirelydepending on non-farm occupation.
(non farm)
(%)
Jamalganj
29,935 17,961 60 11,974 40
Source: BBS, 2011 and UAO, DAE, Jamalganj
12.5 Population engaged in different activitiesIn Sunamganj District, Jamalganj is definitely dominant inagriculture. Boro rice is covering more area than aman rice crop.Farmers can not grow aman due to haor/ water logged area. The socio-economic condition of the livelihood system depends mainly on theagriculture production. Rural farmer in the pilot area is moredependent in agriculture sector. Most of the peoples (male andfemale) are working in the different crops and horticulture cropsfield almost in the Upazila to contribute in this sector to meet upthe basic economic need for their livelihood. Detailed of thepopulation engaged in agriculture (7+years) activities is presentedin table 19.
289

Literature Review
Table-19: Population engaged in agriculture activities (7+ years)activities
Upazila Total populationField ofActivity(7+years)
AgricultureBoth Male Female Male Female
Jamalganj 16726084,612 82648 21492 878
Source: BBS, 2011
12.6 Literacy and Education12.6.1 Literacy: Ability of a person to write a letter has beenconsidered as the basis of literacy. Literacy Male and femaleliteracy percentages are presented in table 20.
Table 20: Literacy rate in the pilot area
Upazila Literacy (can write a latter) Literacy rate(%)
Both Male Female Both
Male
FemaleJamalgan
jYes No Yes No Yes No42,60
388,653
22,946
43,280
19,657
45,373
32.5
34.6 30.2
Source: BBS, 2011
11.6.2 Education: All the data were collected from BBS and analyzedaccording to age, to know the status of different aged of child’sare going/not going school. Present status of education in differentaged is presented in table 21.
Table 21: Educational status in Jamalganj
Upazila
Population aged3-5 years
Population aged 6-10years
Population aged 11-14 years
Attending
school
Notattending school
Attendingschool
Notattendingschool
Attendingschool
Notattendingschool
Mal e Fem
ale
Mal e Fem
ale
Mal e Fem
ale
Mal e Fem
ale
Mal e Fem
ale
Mal e Fem
ale
Jamalganj
460 520
8,650
7,991
8,377 8,478 5,062
4,361
3,996
4,354
3,522
2,495
Source: BBS, 2011
11.7 Housing and sanitation
290

Literature Review
Data on housing and sanitation was collected from BBS and analyzed.Most of the houses are kutcha (87.1%) which is followed by pucca andjhupri (each 2.2%) in the pilot area. In case of sanitary condition,9.9 % has no sanitary toilet facilities. Details housing andsanitary status are presented in table 22.
Table-22: Housing and sanitary status of Jamalganj
UpazilaNumber ofHousehold
s
Type of Structure(%) Toilet Facility (%)
Pucka
Semi-
pucka
Kutcha
Jhupri
Sanitar
y(water-
sealed)
Sanitar
y (non
water-
sealed)
Non-
sanitar
None
Jamalganj 29,935
2.2
8.6
87.1 2.2 3.5 25.0 61.6 9.9
Source: BBS 2011
13 Government and Non-Government Organizations13.1 Government organizationsThere are various Government and non-Government organizationsworking in the upazila to para. In addition, non-Govt. organizationsare also working in the pilot area which is presented in the table23.
Table 23: Government and non- govt. organizations
District toUnion
Govt-organizations (major) Non Govt-organizations(major)
Jamalganj
Administrative Units, DAE,DoF, DLS, DoE, BBS, BRDB,LGED, RHD,DPHE
ASA, BRAC, Grameen Bank,PROSHIKA, TMSS, World Vision,Bangladesh Concern worldwide,Bangladesh CARE Bangladesh andCNRS etc.
13.2 Non- Govt organizationsMost of the non-govt. organizations have their micro credit, health,crops, livestock, IGA and non-formal educational activities in thevillages. They give training on agriculture, sanitation, etc. Groupformation remains the usual approach for the NGOs in reaching andaddressing development needs of the beneficiaries.
Crop typology by cluster in Jamalgonj upozila pilot areaCluster 1: High and medium high land, high yielding varietiesFarmers are practicing two crops in a year in the same land in thepilot area. We visited pilot area, observed cropping practices,
291
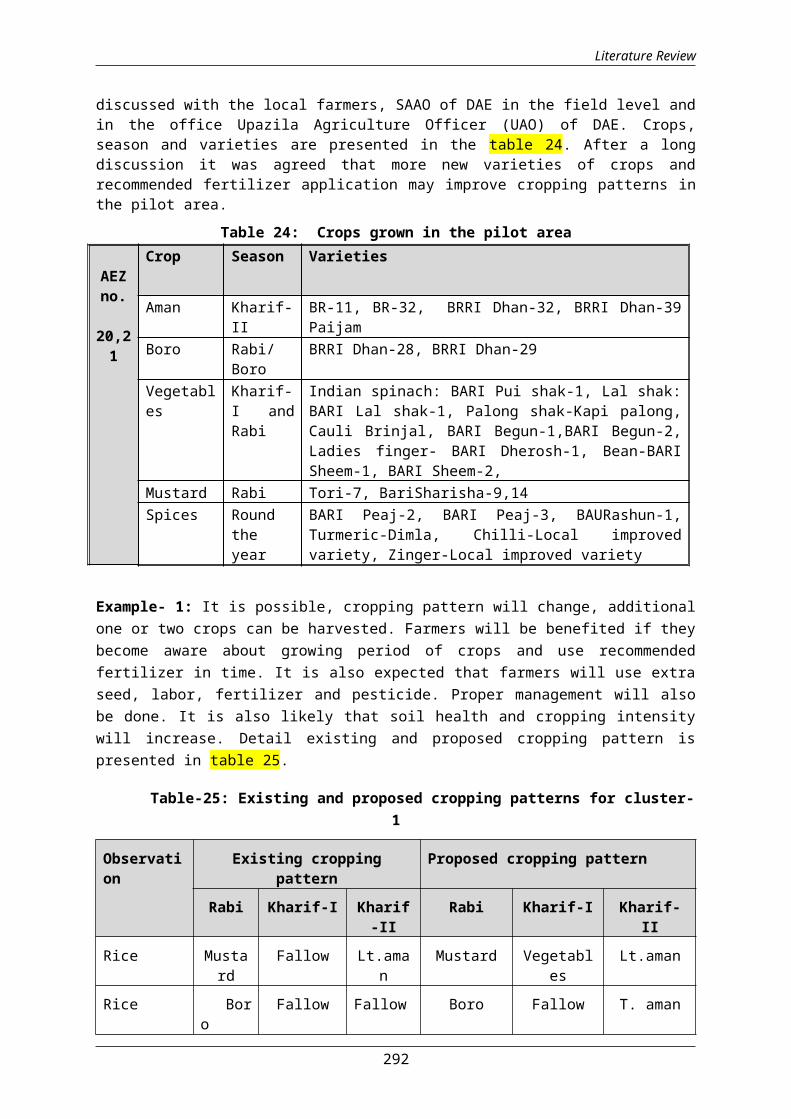
Literature Review
discussed with the local farmers, SAAO of DAE in the field level andin the office Upazila Agriculture Officer (UAO) of DAE. Crops,season and varieties are presented in the table 24. After a longdiscussion it was agreed that more new varieties of crops andrecommended fertilizer application may improve cropping patterns inthe pilot area.
Table 24: Crops grown in the pilot area
AEZno.
20,21
Crop Season Varieties
Aman Kharif-II
BR-11, BR-32, BRRI Dhan-32, BRRI Dhan-39Paijam
Boro Rabi/Boro
BRRI Dhan-28, BRRI Dhan-29
Vegetables
Kharif-I andRabi
Indian spinach: BARI Pui shak-1, Lal shak:BARI Lal shak-1, Palong shak-Kapi palong,Cauli Brinjal, BARI Begun-1,BARI Begun-2,Ladies finger- BARI Dherosh-1, Bean-BARISheem-1, BARI Sheem-2,
Mustard Rabi Tori-7, BariSharisha-9,14Spices Round
theyear
BARI Peaj-2, BARI Peaj-3, BAURashun-1,Turmeric-Dimla, Chilli-Local improvedvariety, Zinger-Local improved variety
Example- 1: It is possible, cropping pattern will change, additionalone or two crops can be harvested. Farmers will be benefited if theybecome aware about growing period of crops and use recommendedfertilizer in time. It is also expected that farmers will use extraseed, labor, fertilizer and pesticide. Proper management will alsobe done. It is also likely that soil health and cropping intensitywill increase. Detail existing and proposed cropping pattern ispresented in table 25.
Table-25: Existing and proposed cropping patterns for cluster-1
Observation
Existing croppingpattern
Proposed cropping pattern
Rabi Kharif-I Kharif-II
Rabi Kharif-I Kharif-II
Rice Mustard
Fallow Lt.aman
Mustard Vegetables
Lt.aman
Rice Boro
Fallow Fallow Boro Fallow T. aman
292

Literature Review
Example-2: Single cropped area is 17,583 ha which is 65% of the NCA.From the total 17,583 ha land it is possible to grow double croppingin 879 ha and farmers can grow the following crops in different cropseason. Details are presented in the table 26.
Table 26: Crops grown and fertilizer application for cluster-1
AEZno.
20and21
Crop Season Varieties FertilizerUrea TSP MP Gypsum
Aman Kharif-II
BR-11, BR-23, BRRIDhan-32, BRRI Dhan-39,Paijam
120-180
60-80
20-40
0-40
Boro Rabi/Boro
BRRI Dhan-28, BRRIDhan-29
200-250
100-
120
80-100
50-100
Vegetables
Kharif-I andRabi
Bitter gourd: Localimproved variety,Indian spinach: BARIPui shak-1, Yardlong bean: Localimproved variety,Lal shak: BARI Lalshak-1, Palong shak-Kapi palong,Brinjal, BARI Begun-1,BARI Begun-2,Ladies finger-BARI Dherosh-1,Bean-BARI Sheem-1,BARISheem-2
200-300
100-
200
100-
200
-
Mustard Rabi Tori-7,BariSharisha-9,14
22-28
80-90
155-
165
165-175
Spices Roundtheyear
BARI Peaj-2,BARIPeaj-3,BAURashun-1,Turmeric-Dimla,Chilli-Localimproved variety,Zinger-Localimproved variety
250-270
190-210
150-170
-
Source: BARI, BRRI
293

Literature Review
Cluster 2: High and medium high land with fruits
There is no organized orchard in the pilot area. But in homesteadarea Sapota (Safeda), Ber (Kul), Jackfruit, Guava, Coconut and Betelnut are available. It is possible to established Kul orchard through
294

Literature Review
inter cropping in high land area as Kul performs well in thecoastal/saline area. Detail proposed orchard pattern withintercropping are given in table 27and table 28.
Table27: Proposed orchard through inter cropping (Pattern-I)
Landtype
PilotUpazila
fruit
crops
Intercrops
Variety use
Expected yield(t/ha)
Cultivatedcost
(Tk/ha)
Totalreturn(tk/ha
)
Netreturn(tk/ha
)1 2 3 4 5 6 7 8 (8-7)
Highland&
medium
highland
Jamalganj Kul BAU
Kul 10 15,000 110,000
95,000
Turmeric
BARI-Dimla
,Sundari
2.5 16,500 25,000 8,500
Total 31,500 135,000
103,500
Table28: Proposed cropping pattern through inter cropping (Pattern-II)
Landtype
PilotUpazila
fruit
crops
Inter
crops
Varietyuse
Expected yield(t/ha)
Cultivatedcost
(Tk/ha)
Totalreturn
(tk/ha)
Netretur
n(tk/ha)
1 2 3 4 5 6 7 8 (8-7)
Highland&
medium
highland
Jamalganj Kul BAU
Kul 10 15,000 110,000
95,000
Zinger BARI 2.5 55,000 110,0
0055,00
0
Total 70,000 220,000
150,000
Cluster 3: High, Medium high and Medium low land
Following crops can be grown in different land types
Cereal andoilseeds cropswith different
Aman: BR-11,BRRI Dhan-23, BRRI Dhan-32, BRRIDhan-39, BRRI Dhan-51 and BRRI Dhan-52
295

Literature Review
seasons Boro: BRRI Dhan-28, BRRI Dhan-29
Mustard: Tori-7, BariSharisha-9,14
Differentvegetables cropswith seasons
Vegetables: Bitter gourd, Indian spinach, Yardlong bean, Lalshak, Snake gourd, Ash gourd,Bottle gourd, Sweet gourd, Sponge gourd,Spinach and Amaranthus.
Presently 65% area is covered by single crops. According to UAE itis possible to grow double crops about 5% areas if there isirrigation facilities. About 35% lands is double cropped, it ispossible to grow triple crops in 5% areas if there is irrigationfacilities.
Table 29: Proposed cropping pattern
Cropping PatternsKharif-I Kharif-II RabiFallow Vegetables BoroVegetables T.Aman BoroFallow Taman MustardFallow Vegetables VegetablesCluster 4: Medium low, low land and very low land
Following crops can be grown in different land types.
Cereal crops byseasons
T.aman: BRRI Dhan-51, BRRI Dhan-52Boro: BRRI Dhan-28, BRRI Dhan-29
Oil seeds andPulses
Mustard: Tori-7, BariSharisha-9, BARISharisha-14Pulses: Kheshari-BARI Kheshari-1, Localimproved variety
Table 30: Proposed cropping pattern
AEZ Cropping Patterns20 and 21 Kharif-I Kharif-II Rabi
Fallow Fallow BoroFallow T. aman MustardFallow T.aman Kheshari
Proposed Floating Gardens (Vegetable Farming) for Flash Flood ProneAreas
Jamalgonj pilot area is a flash flood/water logged area. Seedlingsof aman rice is damaged in the pilot area. Vegetables cultivation isalso a barrier in the pilot area. So, farmers can prepare floating
296
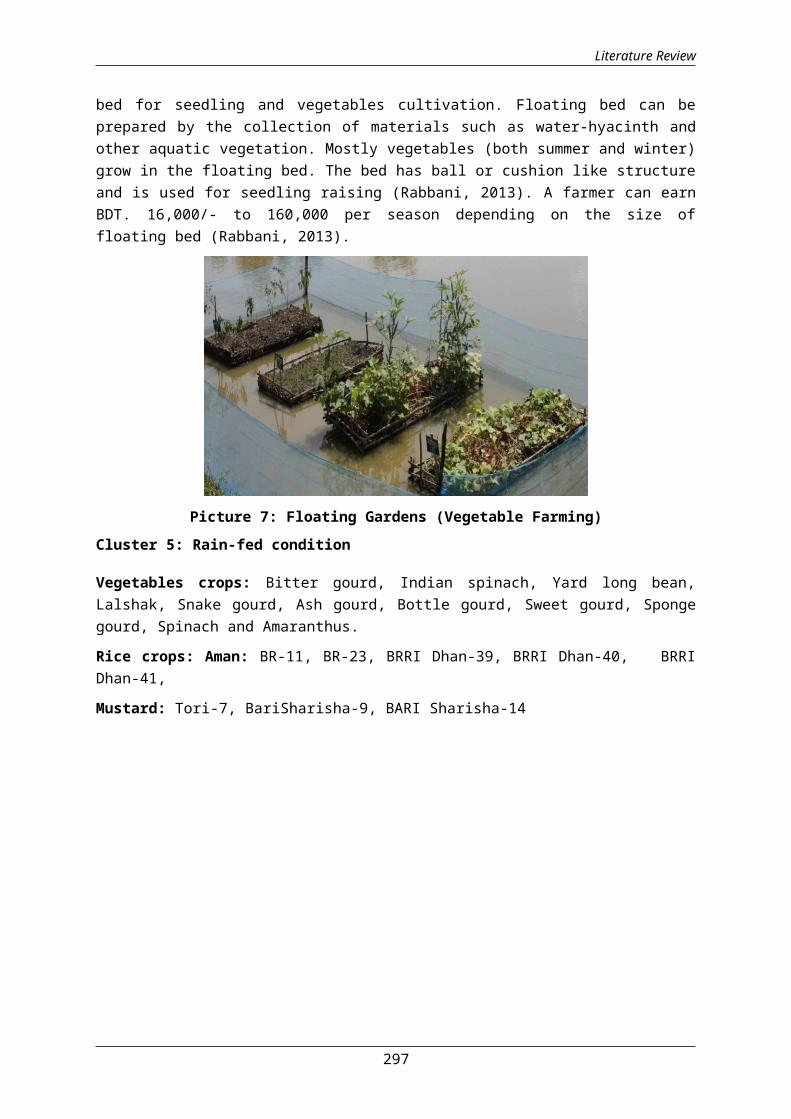
Literature Review
bed for seedling and vegetables cultivation. Floating bed can beprepared by the collection of materials such as water-hyacinth andother aquatic vegetation. Mostly vegetables (both summer and winter)grow in the floating bed. The bed has ball or cushion like structureand is used for seedling raising (Rabbani, 2013). A farmer can earnBDT. 16,000/- to 160,000 per season depending on the size offloating bed (Rabbani, 2013).
Picture 7: Floating Gardens (Vegetable Farming)Cluster 5: Rain-fed condition
Vegetables crops: Bitter gourd, Indian spinach, Yard long bean,Lalshak, Snake gourd, Ash gourd, Bottle gourd, Sweet gourd, Spongegourd, Spinach and Amaranthus.
Rice crops: Aman: BR-11, BR-23, BRRI Dhan-39, BRRI Dhan-40, BRRIDhan-41,
Mustard: Tori-7, BariSharisha-9, BARI Sharisha-14
297
Literature Review
Table 31: Proposed cropping pattern
AEZ Cropping Patterns
13 Kharif-I Kharif-II Rabi
Fallow T. aman Mustard
Fallow T. aman Fallow
Fallow Vegetables Fallow
Pilot 7: Pirgonj Upazila, Rangpur
1. Introduction
Pirgonj upazila has been selected as a pilot area. This upazila isunder in Rangpur district of Rangpur Division. It was selected forrepresenting Rangpur division in relation of where AEZs, lands andsoils as well as crops and fruits are similar. The pilot upazila(Pirgonj) has a lot of scope to grow more crops using High YieldingVarieties (HYV) with proper operation of field and horticulturalcrops and maximization of land use in different seasons. Rangpur wasthe former district and was under in Rajshahi division. It has beenformed as division in 2010. It is said that this area had strategicand commercial importance due to its location at the junction of theTeesta, Doleshshary, Dudkumar, Atrai, Jamnashry, Punarvaba, Depa,Tangon rivers.
Rangpur was conquered by the army of Raja Man Singh, a commander ofthe Mughal emperor, Akbar, in 1575, but it was only until 1686 thatit was fully integrated into the Mughal Empire. Names of places likeMughalbasa (literal meaning being a locality of the Mughals), andMughalhat (literal meaning a “local market” organized by theMughals) bear testimony to the Mughal Association and past ofRangpur and its hinterland. Later on, Rangpur passed under thecontrol of “Sarker” of Ghoraghat. During the period of the BritishEast India Company, the Sannyasi Rebellion took place.
1.1 Geographic information of Pirganj upazila:This upazila occupies an area of 411 sq. km. It is located between25.4153°N 89.3167°E. It is the southernmost upazilla of Rangpurdistrict. It is surrounded by Mithapukur upazilla of Rangpur to the
298
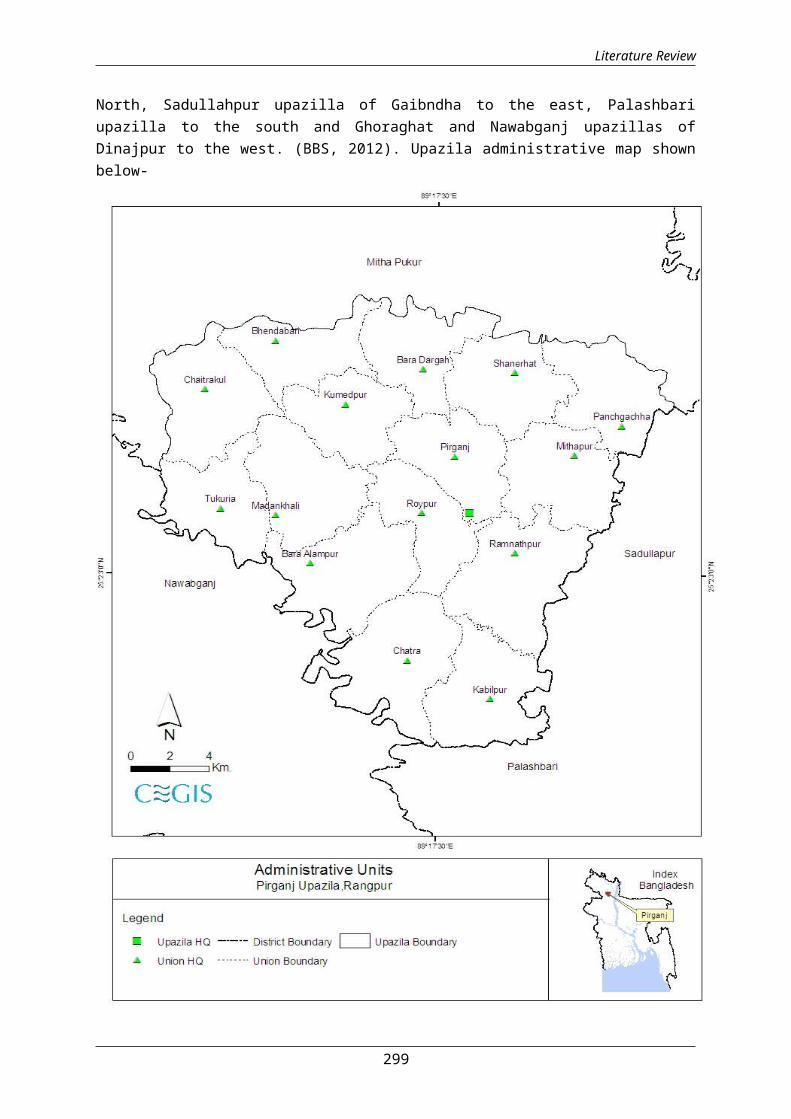
Literature Review
North, Sadullahpur upazilla of Gaibndha to the east, Palashbariupazilla to the south and Ghoraghat and Nawabganj upazillas ofDinajpur to the west. (BBS, 2012). Upazila administrative map shownbelow-
299

Literature Review
1.1.2 Demographic information of Pirganj upazila: Data have been collected from BBS upazila office’2013 and Year bookof statistics’ 2012. A total of populations male and female in 2012are 385,000 of them male is 192,000 and female is 193,000 where asin 2001 total population was 346,000 where male was 176,000 andfemale was 170,000. The population comprising between 2011 to 2001,population being increased. Detailed incremental situation ispresented in table-1
Table-1: Population in the pilot area
Population 2001(‘000) 2011(‘000)Increase/
Decrease(+/-)(‘000)
Both Sex 346 385 +39Male 176 192 +16Female 170 193 +23
Source: Upazila statistics office, BBS’2012
2. Meteorology
2.1 RainfallThe rainfall data last five years (2004 to 2008) were collected fromBangladesh Meteorological Department (BMD) Rangpur (Figure ?) whichshows significant rainfall during the months of July to September.On the other hand, very little rainfall or no rain occurs during theperiod November to February. Last five years maximum rainfalloccurred in 2011 in the month of September.
Source: BMD, Rangpur.
300

Literature Review
2.2 TemperatureMaximum: Figure 2 indicates that seasonal variation of temperatureis large. Mean data of last five years from 2006 to 2010 indicatethat the mean monthly maximum temperature was 32.50°C in May andthat was the warmest month.
Source: BMD, Rangpur
Minimum: The lowest ever recorded minimum temperature is 11.62°Crecorded in the month of January, 2010. Details are shown in figure-3.
Source: BMD, Rangpur
2.3 HumidityThe humidity data of Pirganj was collected from BMD and plotted ingraph shown below. From the figure it is observed that June, July,August and September are the maximum humid months when averagemonthly relative humidity varies from 85% to 86%. The minimum
301

Literature Review
average humidity occurs in the period from November to April whichwas in the range of 78% to 85 %. The monthly average relativehumidity of last five years (2007-2011) is shown in figure-4.
Source: BMD, Rangpur
2.4 Sunshine
Data on sunshine of last five years (2005 to 2010) shows maximumsunshine in the month of August in 2008. On the other hand, minimumwas August in 2005. Last five years average sunshine is presentedbelow.
Source: BMD, Rangpur
3. Agro-Ecological Zone (AEZ)
302
Literature Review
The pilot area comprises of (i) Tista Mender Flood plain (AEZ-3) and(ii) North Eastern Barind Tract (AEZ-27) area shown in the map-3 and4. Detailed descriptions of AEZ are given below. Crops (field andhorticultural) grown in the pilot area according to AEZs are showingtable-1 below.
303
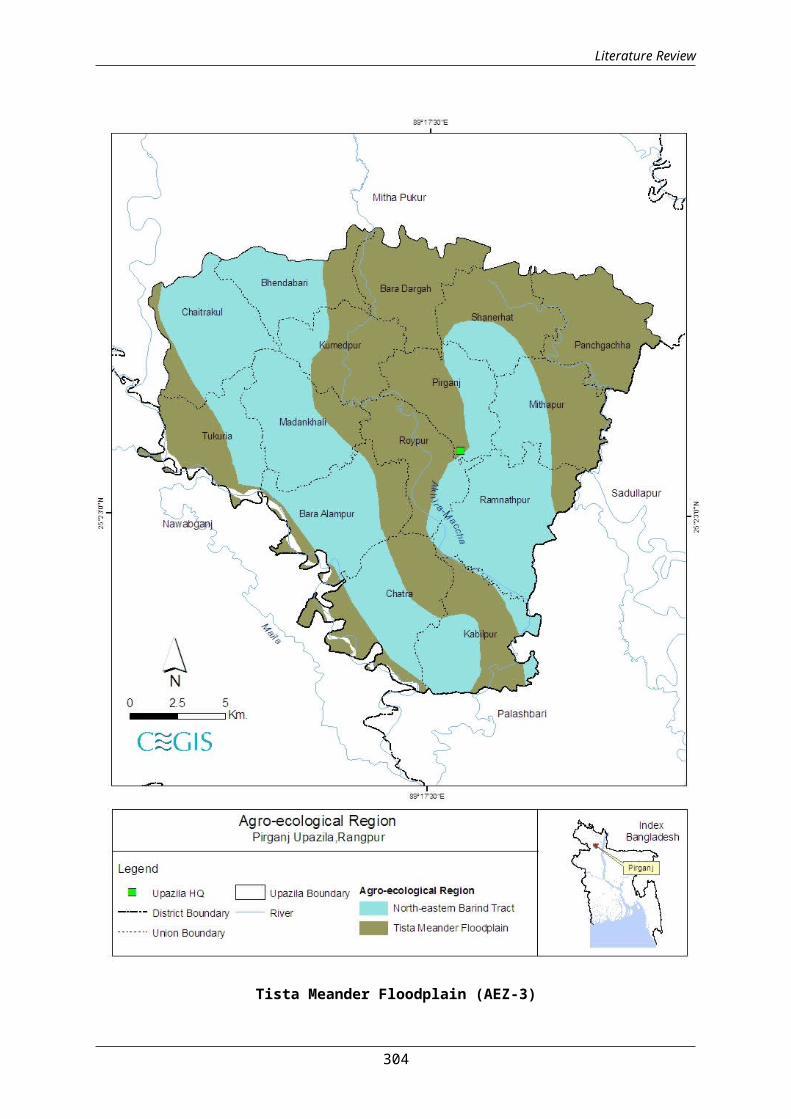
Literature Review
Tista Meander Floodplain (AEZ-3)
304

Literature Review
This region occupies most of the Tista Floodplain. It includes theAtrai, Little Jamuna, and Karatoya Floodplains, as well as the olderparts of the Dudhkumar and Gangadhar Floodplains. The boundarieswith the adjoining Active Tista and Brahmaputra –Jamuna Floodplainsare irregular and they are subject to change as the major riversencroach by erosion or by depositing new alluvium over oldersoils.In the south-east, the unit merges into the Karatoya-BangaliFloodplain.
The major portion of the areas have broad floodplain ridges andalmost level basins. There is an overall pattern of olive brown,rapidly permeable, loamy soils on the high floodplain ridges, andgrey or dark grey, slowly permeable, heavy silt loam or silty clay-loam soils on the lower land and parent materials rich in minerals.Eight general soil types occur in the region; of which,Noncalcareous Grey Floodplain and Noncalcareous Brown Floodplainsoils predominate. They are moderately acidic throughout, low inorganic matter content on the higher land, but moderate in the powerparts. Fertility level in general, is low to medium. Soils ingeneral have good moisture holding capacity.
North Eastern Barind Tract (AEZ-27)
This region occupies several discontinuous areas on the north-eastern margins of the Barind Tract. It stands slightly higher thanadjoining floodplain land.
The region has silty or loamy topsoil and clay loams to claysubsoils and grades into strongly mottled clay. The Madhupur Clayunderlying this region is deeply weathered. Deep Red Brown Terracesoils and Deep Grey Terrace soils are the major components of theGeneral Soil Types of the area. The soils are strongly acidic inreaction. Organic matter of the soils is low. General fertilitylevel is poor with medium status of Zn.
Table-1: Field and horticultural crops grown according to AEZs
No.AEZ
Name of AEZ Total area(ha)
Major crops grow
03Teesta Meander
Floodplain (AEZ-3)
21,144
Rice, Potato, Maize, Garlic,Onion, Chili, Cauliflower,Cabbage, Wheat, Chili,Mustard, Sugarcane, Jute,Pulse Mango, Jack fruit,Jujube
North Eastern 20,303 Rice, Wheat, Sugarcane,
305
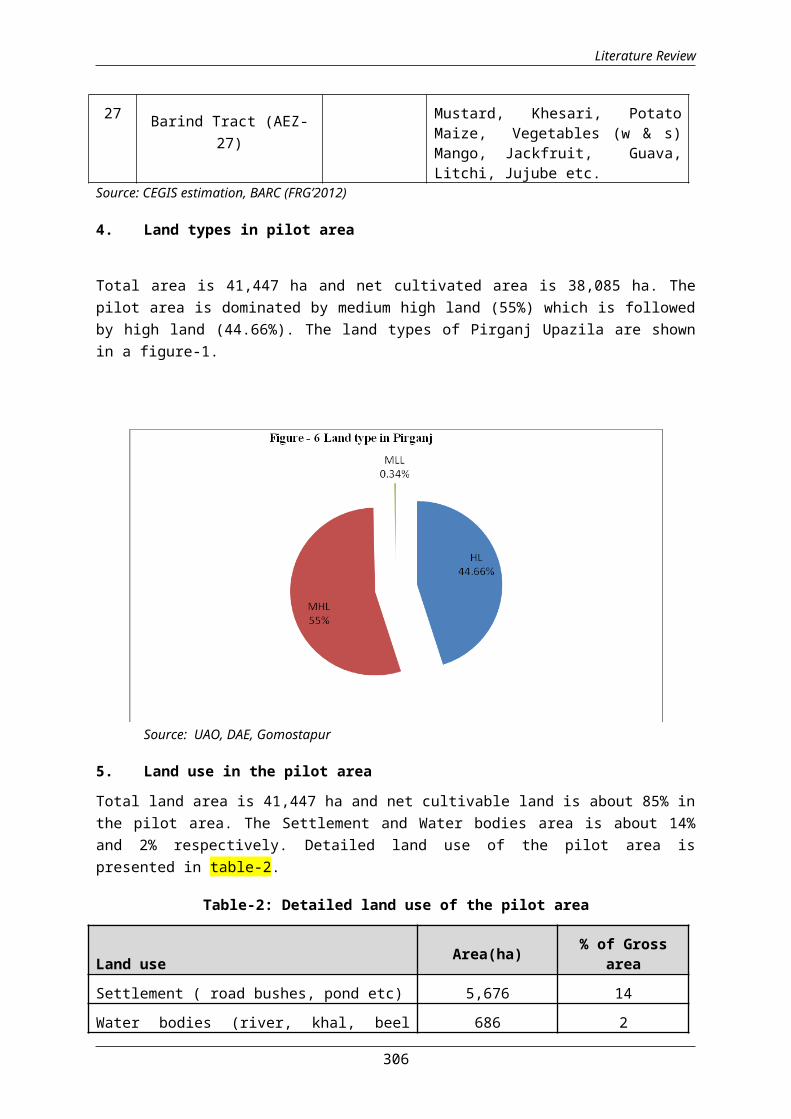
Literature Review
27 Barind Tract (AEZ-27)
Mustard, Khesari, PotatoMaize, Vegetables (w & s)Mango, Jackfruit, Guava,Litchi, Jujube etc.
Source: CEGIS estimation, BARC (FRG’2012)
4. Land types in pilot area
Total area is 41,447 ha and net cultivated area is 38,085 ha. Thepilot area is dominated by medium high land (55%) which is followedby high land (44.66%). The land types of Pirganj Upazila are shownin a figure-1.
Source: UAO, DAE, Gomostapur
5. Land use in the pilot area
Total land area is 41,447 ha and net cultivable land is about 85% inthe pilot area. The Settlement and Water bodies area is about 14%and 2% respectively. Detailed land use of the pilot area ispresented in table-2.
Table-2: Detailed land use of the pilot area
Land use Area(ha) % of Grossarea
Settlement ( road bushes, pond etc) 5,676 14Water bodies (river, khal, beel 686 2
306
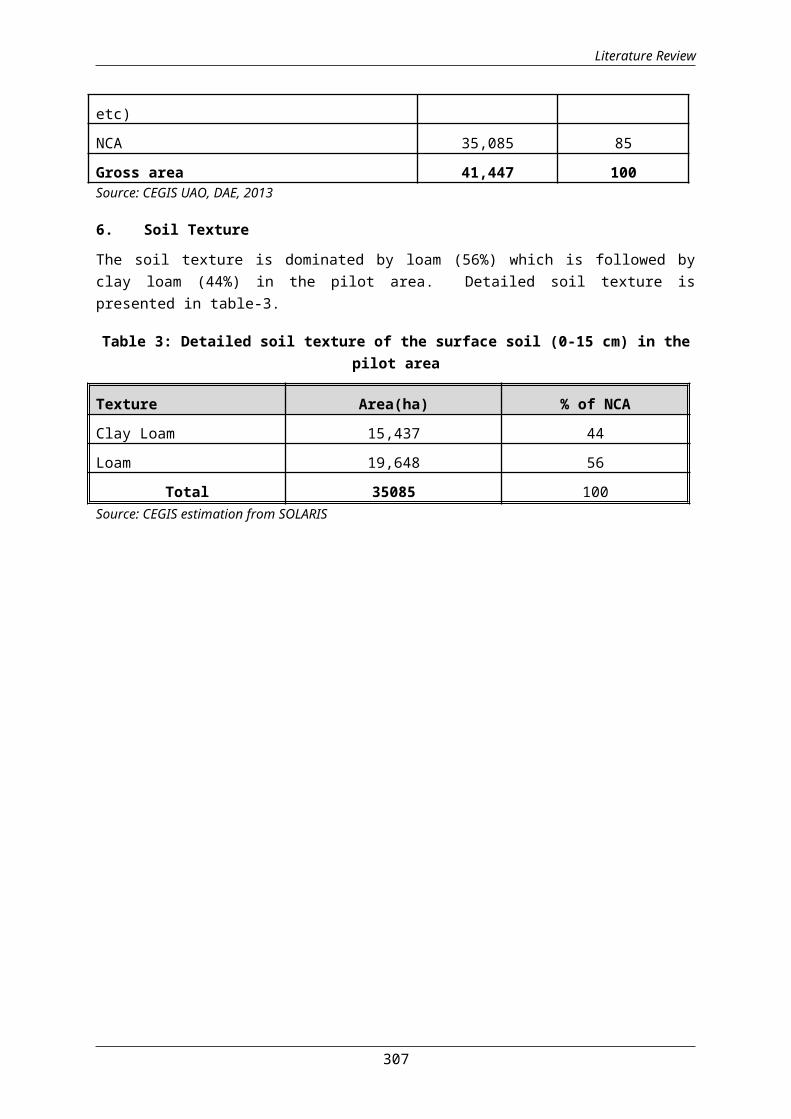
Literature Review
etc)NCA 35,085 85Gross area 41,447 100Source: CEGIS UAO, DAE, 2013
6. Soil Texture
The soil texture is dominated by loam (56%) which is followed byclay loam (44%) in the pilot area. Detailed soil texture ispresented in table-3.
Table 3: Detailed soil texture of the surface soil (0-15 cm) in thepilot area
Texture Area(ha) % of NCAClay Loam 15,437 44Loam 19,648 56
Total 35085 100Source: CEGIS estimation from SOLARIS
307
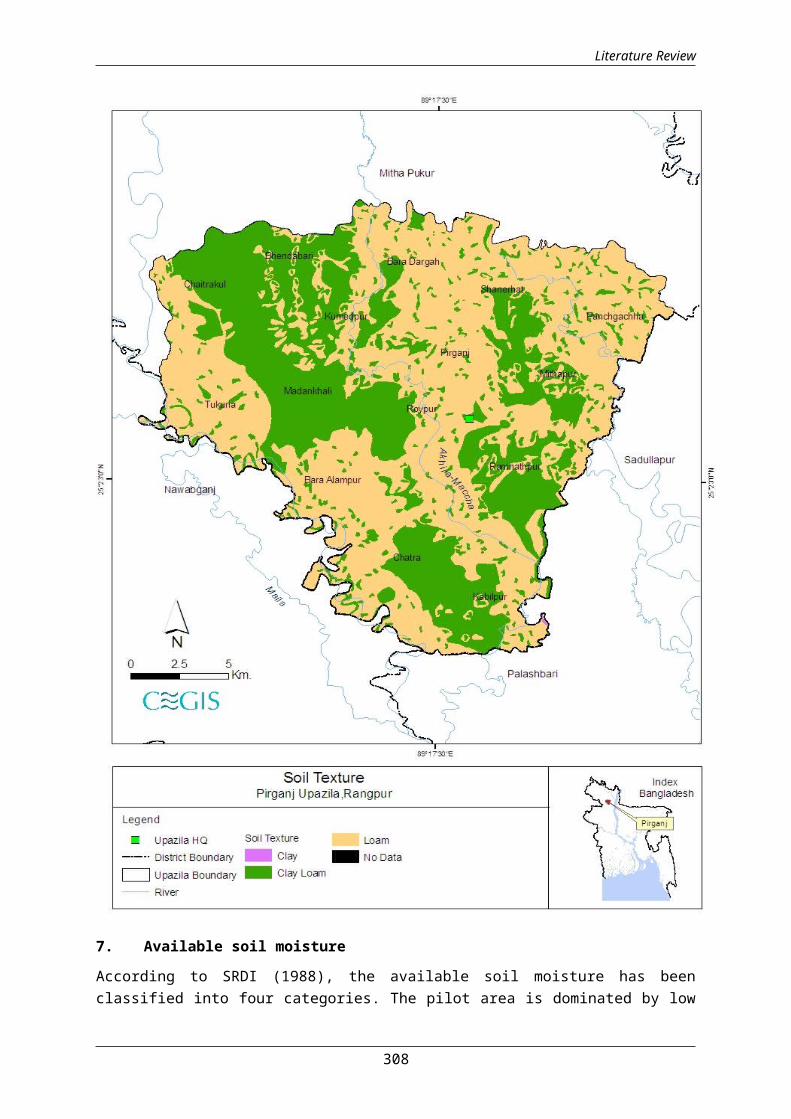
Literature Review
7. Available soil moisture
According to SRDI (1988), the available soil moisture has beenclassified into four categories. The pilot area is dominated by low
308

Literature Review
level (88.5%) of available soil moisture. Detailed distribution ofavailable soil moisture is presented in table 4.
Table 4: Detailed distribution of available soil moisture in thepilot area
Classification ofavailable soil
moisture
CharacteristicsArea(ha)
%ofNCA
Low
Plant extractable soilmoisture remained in thefield level less than onemonth 25,261 72
Medium
Plant extractable soil moistureremained in field level fromone to two months 5,263 15
High
Plant extractable soil moistureremained in field level fromtwo to three months 4,561 13
Tota 35,085 100Source: CEGIS estimation from SOLARIS
309
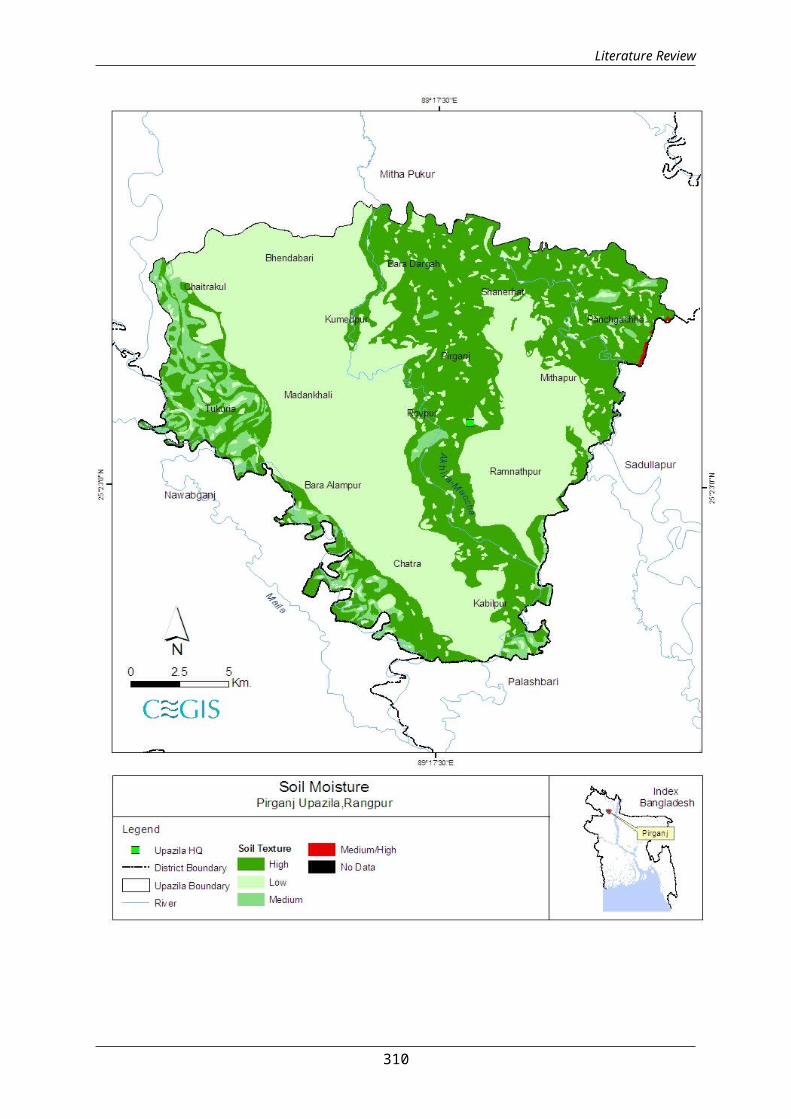
Literature Review
310

Literature Review
9. Present cropping patternsThe dominant cropping patterns are Fallow-T. Aman-HYV Boro which ispracticed in 45% of the NCA.
The single, double and triple cropped area is about 15%, 50% and 35%respectively. The cropping intensity is about 222%.Detailed croppingpattern is presented in Table 6.
Table 6: Existing major cropping patterns with area in the pilotarea
Sl. No. Cropping Patterns Area(ha) % oflanduse
Kharif-I Kharif-II Rabi
1 Vegetables Vegetables Vegetables 2,456 72 Fallow T. Aman Vegetables 1,053 33 Fallow T. Aman Boro 15,788 454 Fallow Fallow Mustard-
Boro351 1
5 Fallow T.Aman Maize/Pulses
3,509 10
6 Vegetables T.Aman Potato 6,315 187 T.Aus Fallow Onion 702 28 Sugarcane Sugarcane Sugarcane 1,754 59 Banana Banana Banana 3,509 10
Total 35,085 100Source: UAO, Pirganj, Rangpur
Presently 15% area is covered by single crops. It is possible toconvert to double crops area from single crop area about 10% areasby inter cropping. Mix cropping and inter cropping is possible inthe pilot area for good soil texture.
About 60% lands is double crops, it is possible to convert to triplecrops from double crop area about 30% areas if can be confirmedproper management. Four crops will be possible from triple crop areaabout 1% by using modern technology and proper management
10. Input Use in Pirgonj Inputs used for horticulture crops include fertilizer and pesticidewhile seed and labour are used in field crops. Data on input use inhorticulture and field crops in Pirgonj pilot upazila is presentedin table ?.
311

Literature Review
Table ?: Input used for horticulture crops in the Pirgonj pilot area
Crop name
Fertilizer (Gm/Pit) Pesticides
Urea TSP MP GypsumCow dung(kg/pit)
No. ofAppli.
Liq.(ml/ha
)Mango 150 70 100 00 10 3-4 500-
800Jackfruit 100 50 20 10 3 1-2 100-
200Banana - 300 - - 15 3-4 100-
200Litchi 00 100 00 00 5 2-3 100-
300Guava 40 90 00 00 3 00 00Jujube 150 90 00 00 5 00 00Lemon 150 70 60 00 3 00 00
Source: UAO, DAE and Farmers interviewed January, 2014
Table ?: Input used in different field crops in the Pirgonj pilotarea
Cropname
Seed(Kg/ha)
Labor(No./ha )
Fertilizer(Kg/ha) Pesticides
Urea TSP MP Gypsum
No ofapplication
Liq.(ml/ha)
Gran./Pow.(kg/ha
HYV Boro 48 170 200-220
80-100
50-60
20-30 1-2 600 7-8
T.Aman 45 135 150-160
60-70
- 00 1-2 700 7-8
T.Aus 45 170 100-120
40-60
0-40
00 1-2 600 7-8
Mustard 8 100 100-120
40-60
30-40
00 1-2 650 7-8
Spices 20 120 100-150
80-100
50-70
00 1-2 200 6-7
Maize 22 130 180-200
60-80
40-60
00 1-2 500-800
0
Pulses 30 100 80-100
- - 00 1-2 200-400
0
Sugarcan 3500 120 100- 60- 40- - 1-2 - 9-10
312
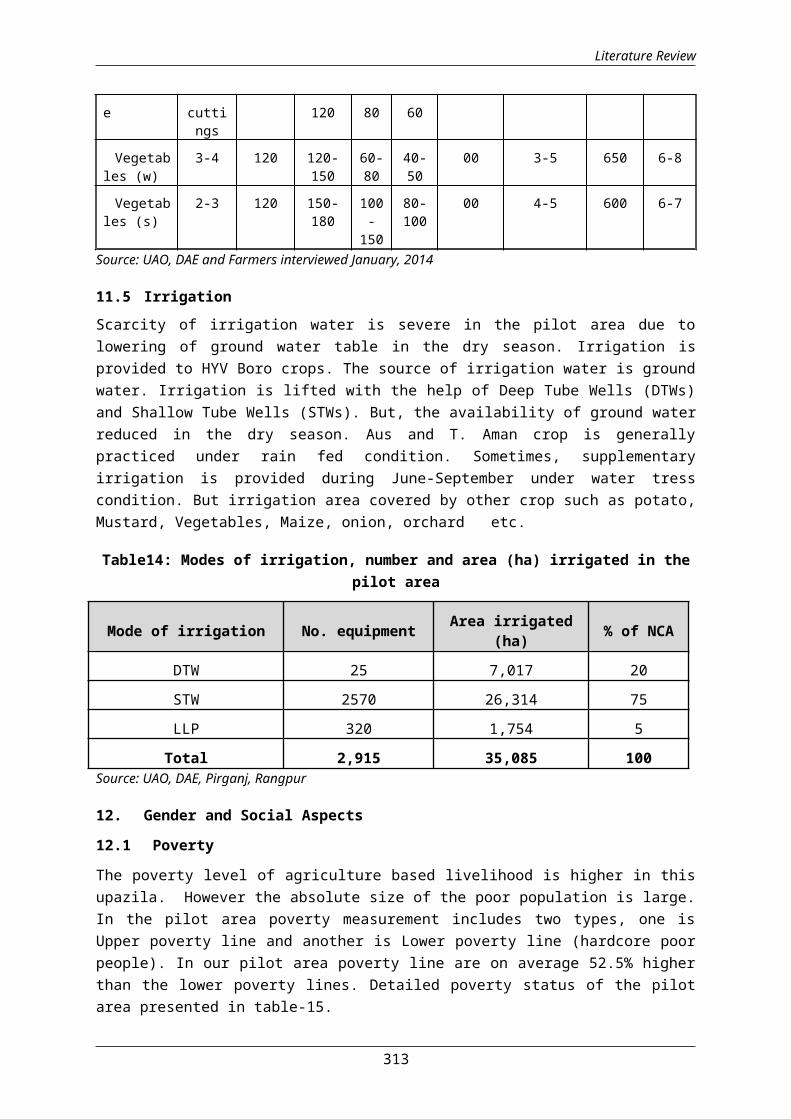
Literature Review
e cuttings
120 80 60
Vegetables (w)
3-4 120 120-150
60-80
40-50
00 3-5 650 6-8
Vegetables (s)
2-3 120 150-180
100-150
80-100
00 4-5 600 6-7
Source: UAO, DAE and Farmers interviewed January, 2014
11.5 Irrigation Scarcity of irrigation water is severe in the pilot area due tolowering of ground water table in the dry season. Irrigation isprovided to HYV Boro crops. The source of irrigation water is groundwater. Irrigation is lifted with the help of Deep Tube Wells (DTWs)and Shallow Tube Wells (STWs). But, the availability of ground waterreduced in the dry season. Aus and T. Aman crop is generallypracticed under rain fed condition. Sometimes, supplementaryirrigation is provided during June-September under water tresscondition. But irrigation area covered by other crop such as potato,Mustard, Vegetables, Maize, onion, orchard etc.
Table14: Modes of irrigation, number and area (ha) irrigated in thepilot area
Mode of irrigation No. equipment Area irrigated(ha) % of NCA
DTW 25 7,017 20STW 2570 26,314 75LLP 320 1,754 5
Total 2,915 35,085 100Source: UAO, DAE, Pirganj, Rangpur
12. Gender and Social Aspects
12.1 Poverty
The poverty level of agriculture based livelihood is higher in thisupazila. However the absolute size of the poor population is large.In the pilot area poverty measurement includes two types, one isUpper poverty line and another is Lower poverty line (hardcore poorpeople). In our pilot area poverty line are on average 52.5% higherthan the lower poverty lines. Detailed poverty status of the pilotarea presented in table-15.
313
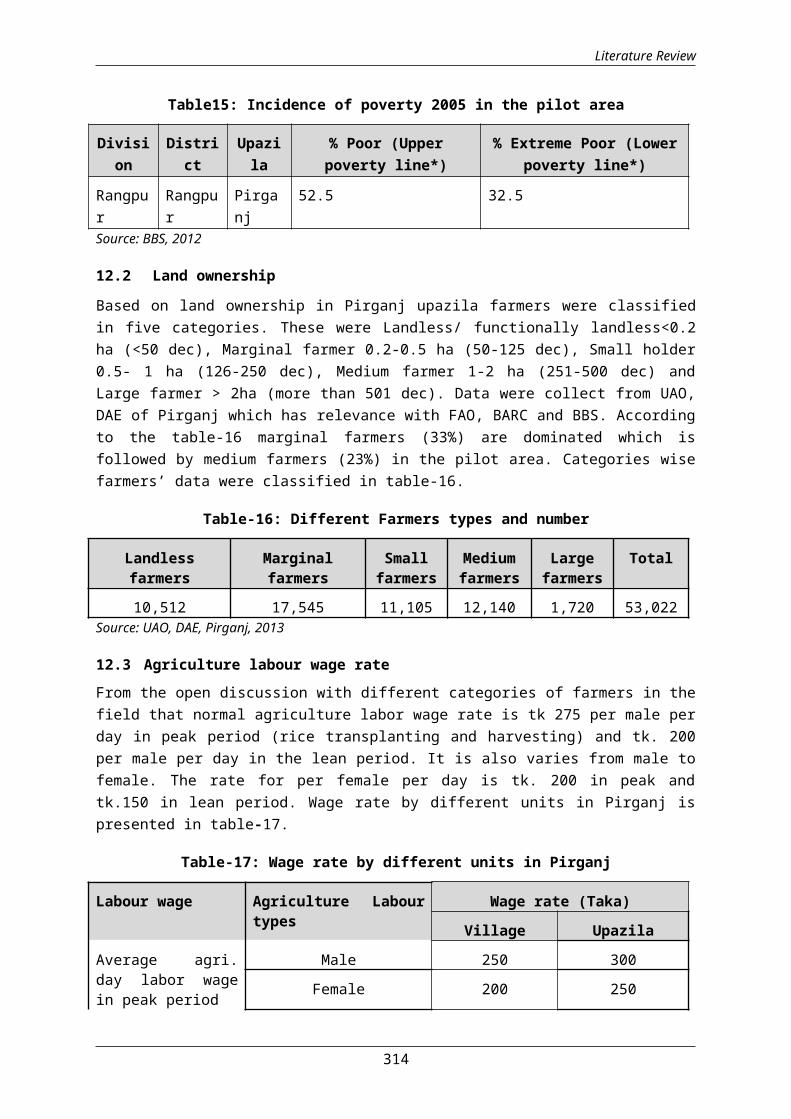
Literature Review
Table15: Incidence of poverty 2005 in the pilot area
Division
District
Upazila
% Poor (Upperpoverty line*)
% Extreme Poor (Lowerpoverty line*)
Rangpur
Rangpur
Pirganj
52.5 32.5
Source: BBS, 2012
12.2 Land ownership
Based on land ownership in Pirganj upazila farmers were classifiedin five categories. These were Landless/ functionally landless<0.2ha (<50 dec), Marginal farmer 0.2-0.5 ha (50-125 dec), Small holder0.5- 1 ha (126-250 dec), Medium farmer 1-2 ha (251-500 dec) andLarge farmer > 2ha (more than 501 dec). Data were collect from UAO,DAE of Pirganj which has relevance with FAO, BARC and BBS. Accordingto the table-16 marginal farmers (33%) are dominated which isfollowed by medium farmers (23%) in the pilot area. Categories wisefarmers’ data were classified in table-16.
Table-16: Different Farmers types and number
Landlessfarmers
Marginalfarmers
Smallfarmers
Mediumfarmers
Largefarmers
Total
10,512 17,545 11,105 12,140 1,720 53,022Source: UAO, DAE, Pirganj, 2013
12.3 Agriculture labour wage rateFrom the open discussion with different categories of farmers in thefield that normal agriculture labor wage rate is tk 275 per male perday in peak period (rice transplanting and harvesting) and tk. 200per male per day in the lean period. It is also varies from male tofemale. The rate for per female per day is tk. 200 in peak andtk.150 in lean period. Wage rate by different units in Pirganj ispresented in table-17.
Table-17: Wage rate by different units in Pirganj
Labour wage
Agriculture Labourtypes
Wage rate (Taka)Village Upazila
Average agri.day labor wagein peak period
Male 250 300Female 200 250
314

Literature Review
Average agri.day labor wagein lean period.
Male 200 250Female 150 200
Source: Farmers interviewed, January, 2014
12.4 Occupational status agricultural and non-agricultural Data were collected from BBS and UAO of DAE, Pirganj It was analyzedand presented in table-18. Maximum HHs in this upazilas is engagedon agricultural activities. For this reasons farm household’s rateis higher than other upazilas.
Table-18: Agricultural and non-agricultural occupational status
UpazilaTotalHHs
HHs entirelydepending onagricultural
production. forincome (farm)
(%)
HHs entirelydepending onnon- farm
occupation. (nonfarm)
(%)
Pirganj 102,000 88,740 87 13,260 13
Source: BBS, 2011 and UAO, DAE, Pirganj
12.5 Population engages in different activitiesIn Rangpur District, Pirganj is definitely dominant in agriculturedominant practices, especially fruits i.e mango, Jackfruit, Jujubeorchard based. Farmers practicing Jujube +Turmeric and Mango-Mashkalai inter cropping which is being popular in the pilot area.Agriculture sector is first priority but land preparation in mainlydone by power tiller. Aman rice is covering more area than Boro ricecrop. The socio-economic condition depends mainly on the agricultureproduction. Rural farmer in the pilot area is more dependent inagriculture sector. Most of the peoples (male and female) areworking in the different crops and horticulture crops field almostin the Upazila to contribute in this sector to meet up the basiceconomic need for their livelihood. Detailed of the populationengaged in agriculture (7+years) activities is presented in table-19.
Table-19: Population engaged in agriculture activities (7+ years)activities
Upazila Total population Field ofActivity(7+years)
Agriculture
315

Literature Review
Both Male Female Male Female
Pirganj 143,000 72,000 71,000 33,092 1,622
Source: BBS, 2011
12.6 Literacy and Education12.6.1 Literacy: Literacy percentage in the pilot area is notsatisfactory. According to BBS, 2011 those who can write a letter toexpress their views for others partner. Male and female literacypercentages are presented in table-20.
Table 20: Literacy rate in the pilot area
Upazila Literacy (can write ) Literacy rate(%)
Both Male Female Both
Male
FemalePirganj Yes No Yes No Yes No
96,255
1,37,242
45,919
68,832
50,336
68,410
41.2
40.0 42.4
Source: BBS, 2011
11.6.2 Education: All the data were collected from BBS and analyzedaccording to age, to know the status of different aged of child’sare going/not going school. Present status of education in differentaged is presented in table-21.
Table-21: Educational status in Pirganj
Upazila
Population aged 3-5 years
Population aged 6-10years
Population aged 11-14 years
Attending school
Notattending school
Attendingschool
Notattendingschool
Attending school
Notattending school
Male
Female
Male
Female
Male
Female
Male
Female
Male
Female
Male
Female
Pirganj
703 765 9,1
628,558
13,376
13,699
4,269
3,259
9,266
10,996
3,631
1,243
Source: BBS, 2011 11.7 Housing and sanitationsAll the data were collected from BBS and analyzed. Most of thehouses are kutcha (58.6%). which is followed by semi puckka (24.4%)in the pilot area. In case of sanitary condition, sanitary condition
316
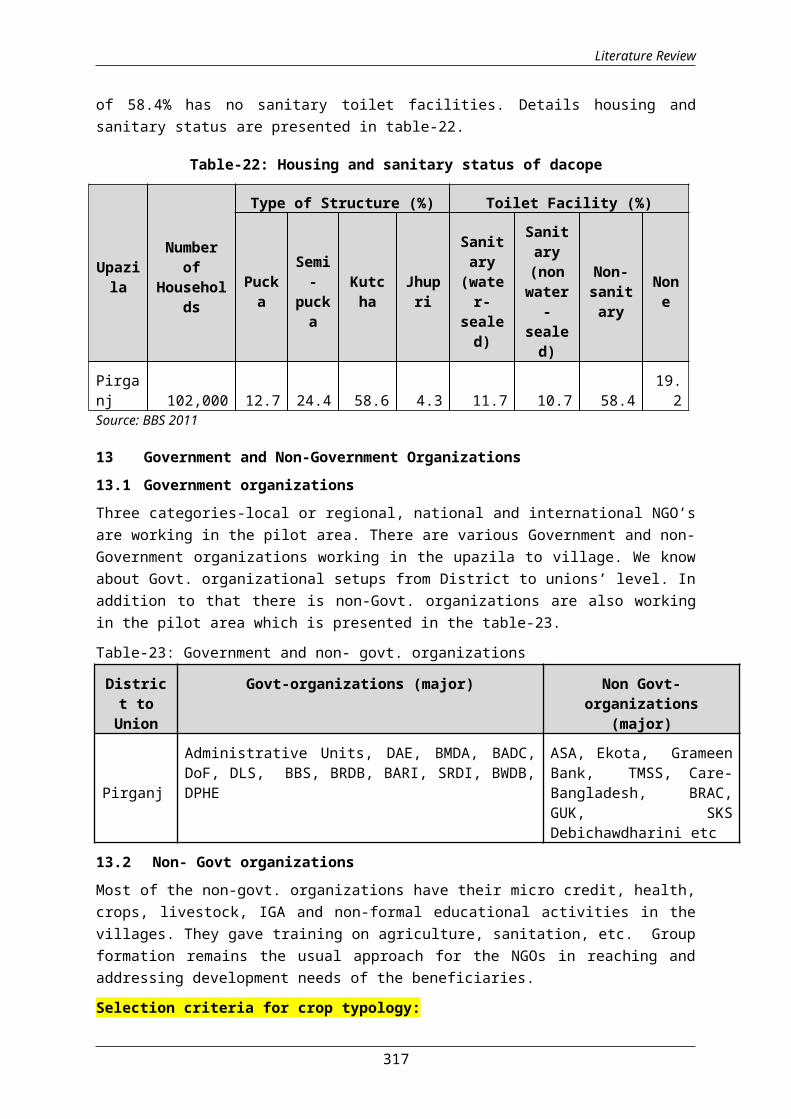
Literature Review
of 58.4% has no sanitary toilet facilities. Details housing andsanitary status are presented in table-22.
Table-22: Housing and sanitary status of dacope
Upazila
Numberof
Households
Type of Structure (%) Toilet Facility (%)
Pucka
Semi-
pucka
Kutcha
Jhupri
Sanitary
(water-
sealed)
Sanitary(nonwater
-sealed)
Non-sanitary
None
Pirganj 102,000 12.7 24.4 58.6 4.3 11.7 10.7 58.4
19.2
Source: BBS 2011
13 Government and Non-Government Organizations13.1 Government organizationsThree categories-local or regional, national and international NGO’sare working in the pilot area. There are various Government and non-Government organizations working in the upazila to village. We knowabout Govt. organizational setups from District to unions’ level. Inaddition to that there is non-Govt. organizations are also workingin the pilot area which is presented in the table-23.
Table-23: Government and non- govt. organizations
District toUnion
Govt-organizations (major) Non Govt-organizations
(major)
Pirganj
Administrative Units, DAE, BMDA, BADC,DoF, DLS, BBS, BRDB, BARI, SRDI, BWDB,DPHE
ASA, Ekota, GrameenBank, TMSS, Care-Bangladesh, BRAC,GUK, SKSDebichawdharini etc
13.2 Non- Govt organizationsMost of the non-govt. organizations have their micro credit, health,crops, livestock, IGA and non-formal educational activities in thevillages. They gave training on agriculture, sanitation, etc. Groupformation remains the usual approach for the NGOs in reaching andaddressing development needs of the beneficiaries.
Selection criteria for crop typology:
317

Literature Review
i) The development of crop typology has been provided, forthe first time in Bangladesh, an assessment of cropsuitability in terms of attainable yields of crops willbe done. Preliminary indications from the pilot areasuggest that, overall, potential sustainable crop yieldsfor major cereals may be lower than had previously beenassumed, especially for rain fed conditions in differentagro-climatic zone.
ii) Yearly rainfall, humidity, temperature will beconsidered.
iii) Soil characteristic, land type and irrigation facilities will have to be considered.
iv) To validate the improved/ modern crop productiontechnologies in drought prone district of Rangpur.
v) To test the acceptance of crop production technologiesamong different categories of drought area farmers.
vi) To identify and to solve constraints in the productionprogramme of improved crop production technologies
vii) Physical factors limiting the yield potential ofindividual crops on a particular region or agro-climaticzone.
viii) Paddy is the crop best adapted to cultivate in the Kharifseason over most of the country and considerable areas also are best suited for paddy cultivation in the rabi season in accordance of AEZs.
ix) Opportunity to increase dry land rabi crop production, with or without irrigation of pilot area.
x) The pilot area is a drought prone area and great opportunities to reduce drought by management practices and introduce different drought tolerant rice or non-ricevarieties and low requirement irrigated crops cultivate to increase crop production.
xi) The use of chemical fertilizers as supplementary sourcesof nutrients has been increasing steadily in Bangladesh,but our farmers do not practice balanced fertilization.For any crops especially in HYV’s of all crops in threeseasons about 80% of the fertilizers applied arenitrogen, 25% phosphate, and only 15% potash comparedwith the recommended ratio of 100:80:60. If farmers usefertilizer balance dozes in time yield will increaseabout 10-20% in pilot area.
318
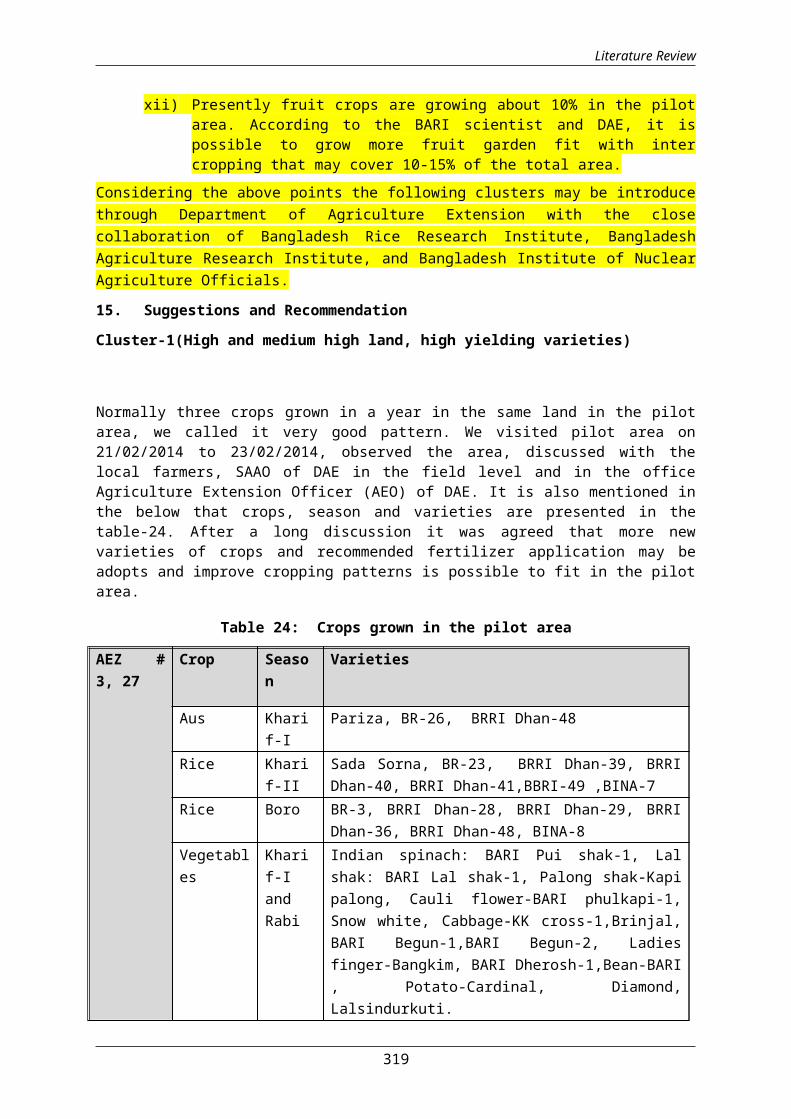
Literature Review
xii) Presently fruit crops are growing about 10% in the pilotarea. According to the BARI scientist and DAE, it ispossible to grow more fruit garden fit with intercropping that may cover 10-15% of the total area.
Considering the above points the following clusters may be introducethrough Department of Agriculture Extension with the closecollaboration of Bangladesh Rice Research Institute, BangladeshAgriculture Research Institute, and Bangladesh Institute of NuclearAgriculture Officials.
15. Suggestions and Recommendation
Cluster-1(High and medium high land, high yielding varieties)
Normally three crops grown in a year in the same land in the pilotarea, we called it very good pattern. We visited pilot area on21/02/2014 to 23/02/2014, observed the area, discussed with thelocal farmers, SAAO of DAE in the field level and in the officeAgriculture Extension Officer (AEO) of DAE. It is also mentioned inthe below that crops, season and varieties are presented in thetable-24. After a long discussion it was agreed that more newvarieties of crops and recommended fertilizer application may beadopts and improve cropping patterns is possible to fit in the pilotarea.
Table 24: Crops grown in the pilot area
AEZ #3, 27
Crop Season
Varieties
Aus Kharif-I
Pariza, BR-26, BRRI Dhan-48
Rice Kharif-II
Sada Sorna, BR-23, BRRI Dhan-39, BRRIDhan-40, BRRI Dhan-41,BBRI-49 ,BINA-7
Rice Boro BR-3, BRRI Dhan-28, BRRI Dhan-29, BRRIDhan-36, BRRI Dhan-48, BINA-8
Vegetables
Kharif-IandRabi
Indian spinach: BARI Pui shak-1, Lalshak: BARI Lal shak-1, Palong shak-Kapipalong, Cauli flower-BARI phulkapi-1,Snow white, Cabbage-KK cross-1,Brinjal,BARI Begun-1,BARI Begun-2, Ladiesfinger-Bangkim, BARI Dherosh-1,Bean-BARI, Potato-Cardinal, Diamond,Lalsindurkuti.
319
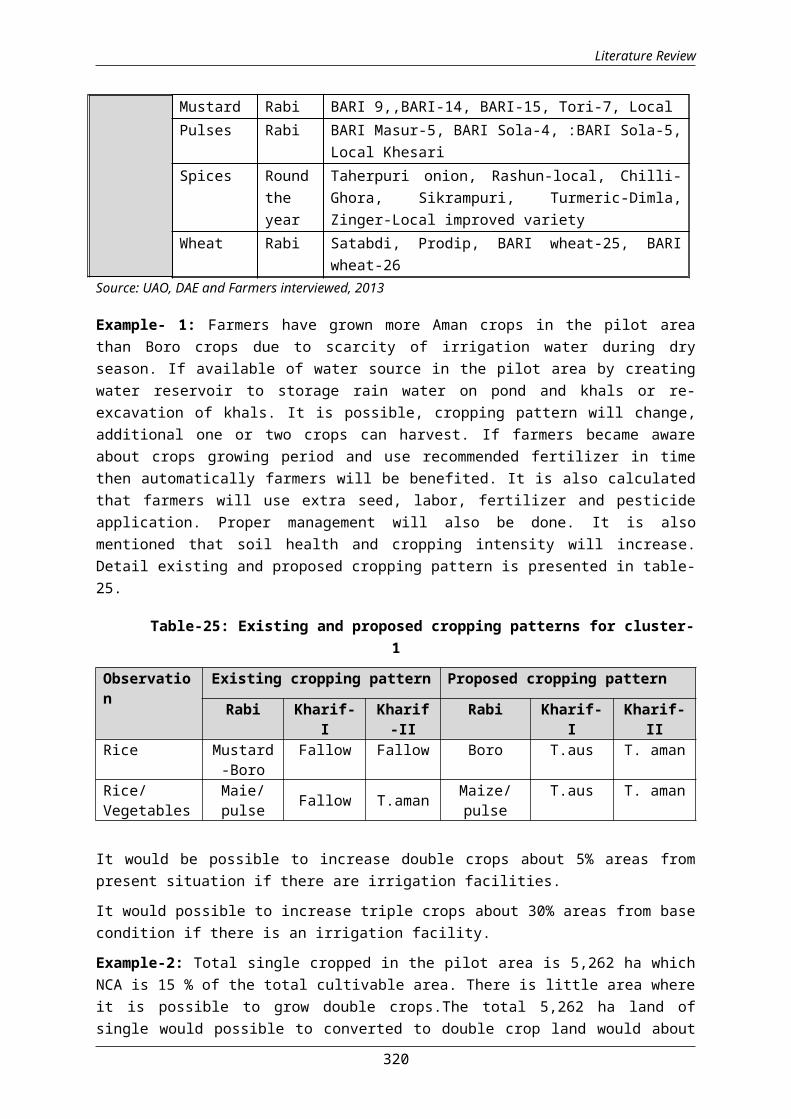
Literature Review
Mustard Rabi BARI 9,,BARI-14, BARI-15, Tori-7, LocalPulses Rabi BARI Masur-5, BARI Sola-4, :BARI Sola-5,
Local KhesariSpices Round
theyear
Taherpuri onion, Rashun-local, Chilli-Ghora, Sikrampuri, Turmeric-Dimla,Zinger-Local improved variety
Wheat Rabi Satabdi, Prodip, BARI wheat-25, BARIwheat-26
Source: UAO, DAE and Farmers interviewed, 2013
Example- 1: Farmers have grown more Aman crops in the pilot areathan Boro crops due to scarcity of irrigation water during dryseason. If available of water source in the pilot area by creatingwater reservoir to storage rain water on pond and khals or re-excavation of khals. It is possible, cropping pattern will change,additional one or two crops can harvest. If farmers became awareabout crops growing period and use recommended fertilizer in timethen automatically farmers will be benefited. It is also calculatedthat farmers will use extra seed, labor, fertilizer and pesticideapplication. Proper management will also be done. It is alsomentioned that soil health and cropping intensity will increase.Detail existing and proposed cropping pattern is presented in table-25.
Table-25: Existing and proposed cropping patterns for cluster-1
Observation
Existing cropping pattern Proposed cropping pattern
Rabi Kharif-I
Kharif-II
Rabi Kharif-I
Kharif-II
Rice Mustard-Boro
Fallow Fallow Boro T.aus T. aman
Rice/Vegetables
Maie/pulse Fallow T.aman Maize/
pulseT.aus T. aman
It would be possible to increase double crops about 5% areas frompresent situation if there are irrigation facilities.
It would possible to increase triple crops about 30% areas from basecondition if there is an irrigation facility.
Example-2: Total single cropped in the pilot area is 5,262 ha whichNCA is 15 % of the total cultivable area. There is little area whereit is possible to grow double crops.The total 5,262 ha land ofsingle would possible to converted to double crop land would about
320

Literature Review
3,508(10%) by provide irrigation support and proper management.Details are explaining in the table-26.
Table-26: Crops grown and fertilizer application for cluster-1
AEZno.
3,27
Crop Season
Varieties Fertilizer
Urea TSP MP Gypsum
Aus Kharif-I
Pariza, BR-26, BRRIDhan-48
100-
140
40-60
0-40
0-40
Rice Kharif-II
Sada Sorna, BR-23,BRRI Dhan-39, BRRIDhan-40, BRRI Dhan-41,BBRI-49 ,BINA-7
120-
180
60-80
20-40
0-40
Rice Boro BR-3, BRRI Dhan-28,BRRI Dhan-29, BRRIDhan-36, BRRI Dhan-48, BINA-8 ,
200-
250
100-
120
80-100
50-100
Vegetables
Kharif-IandRabi
Indian spinach: BARIPui shak-1, Lal shak:BARI Lal shak-1,Palong shak-Kapipalong, Cauli flower-BARI phulkapi-1, Snowwhite, Cabbage-KKcross-1,Brinjal, BARIBegun-1,BARI Begun-2,Ladies finger-Bangkim, BARIDherosh-1,Bean-BARI ,Potato-Cardinal,Diamond,Lalsindurkuti.
200-
300
100-
200
100-
200
-
Mustard Rabi BARI 9,,BARI-14,BARI-15, Tori-7,Local
80-100
60-70
40-50
-
Pulses Kharif-2
BARI Masur-5, BARISola-4, :BARI Sola-5,Local Khesari
80-100
40-50
30-35
321
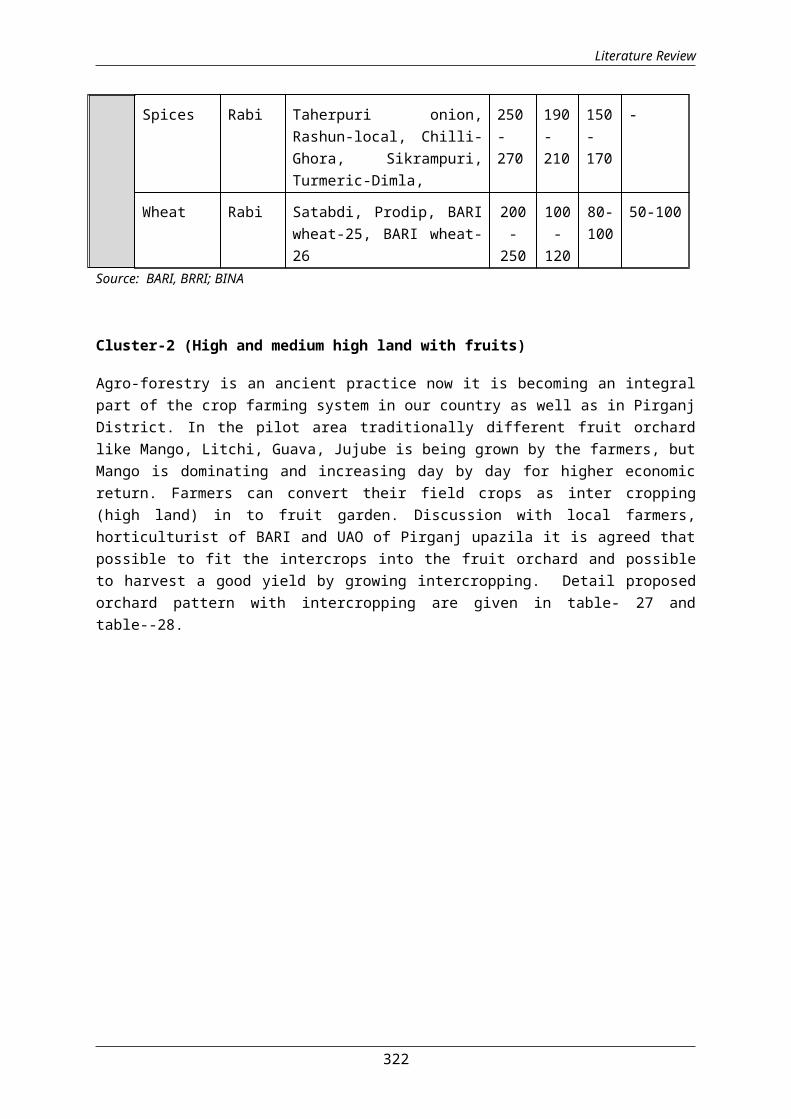
Literature Review
Spices Rabi Taherpuri onion,Rashun-local, Chilli-Ghora, Sikrampuri,Turmeric-Dimla,
250-270
190-210
150-170
-
Wheat Rabi Satabdi, Prodip, BARIwheat-25, BARI wheat-26
200-
250
100-
120
80-100
50-100
Source: BARI, BRRI; BINA
Cluster-2 (High and medium high land with fruits)
Agro-forestry is an ancient practice now it is becoming an integralpart of the crop farming system in our country as well as in PirganjDistrict. In the pilot area traditionally different fruit orchardlike Mango, Litchi, Guava, Jujube is being grown by the farmers, butMango is dominating and increasing day by day for higher economicreturn. Farmers can convert their field crops as inter cropping(high land) in to fruit garden. Discussion with local farmers,horticulturist of BARI and UAO of Pirganj upazila it is agreed thatpossible to fit the intercrops into the fruit orchard and possibleto harvest a good yield by growing intercropping. Detail proposedorchard pattern with intercropping are given in table- 27 andtable--28.
322

Literature Review
323
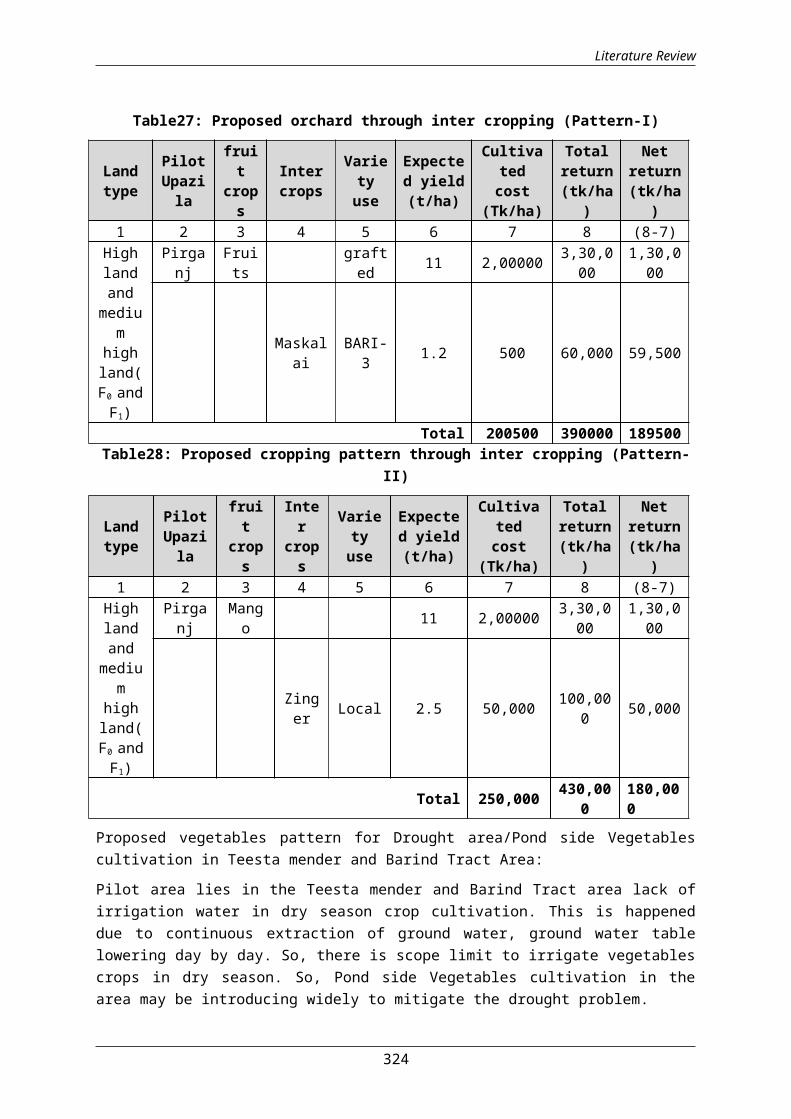
Literature Review
Table27: Proposed orchard through inter cropping (Pattern-I)
Landtype
PilotUpazila
fruit
crops
Intercrops
Varietyuse
Expected yield(t/ha)
Cultivatedcost
(Tk/ha)
Totalreturn(tk/ha
)
Netreturn(tk/ha
)1 2 3 4 5 6 7 8 (8-7)
Highlandandmediu
mhighland(F0 andF1)
Pirganj
Fruits
grafted 11 2,00000 3,30,0
001,30,000
Maskalai
BARI-3 1.2 500 60,000 59,500
Total 200500 390000 189500Table28: Proposed cropping pattern through inter cropping (Pattern-
II)
Landtype
PilotUpazila
fruit
crops
Inter
crops
Varietyuse
Expected yield(t/ha)
Cultivatedcost
(Tk/ha)
Totalreturn(tk/ha
)
Netreturn(tk/ha
)1 2 3 4 5 6 7 8 (8-7)
Highlandandmedium
highland(F0 andF1)
Pirganj
Mango 11 2,00000 3,30,0
001,30,000
Zinger Local 2.5 50,000 100,00
0 50,000
Total 250,000 430,000
180,000
Proposed vegetables pattern for Drought area/Pond side Vegetablescultivation in Teesta mender and Barind Tract Area:
Pilot area lies in the Teesta mender and Barind Tract area lack ofirrigation water in dry season crop cultivation. This is happeneddue to continuous extraction of ground water, ground water tablelowering day by day. So, there is scope limit to irrigate vegetablescrops in dry season. So, Pond side Vegetables cultivation in thearea may be introducing widely to mitigate the drought problem.
324
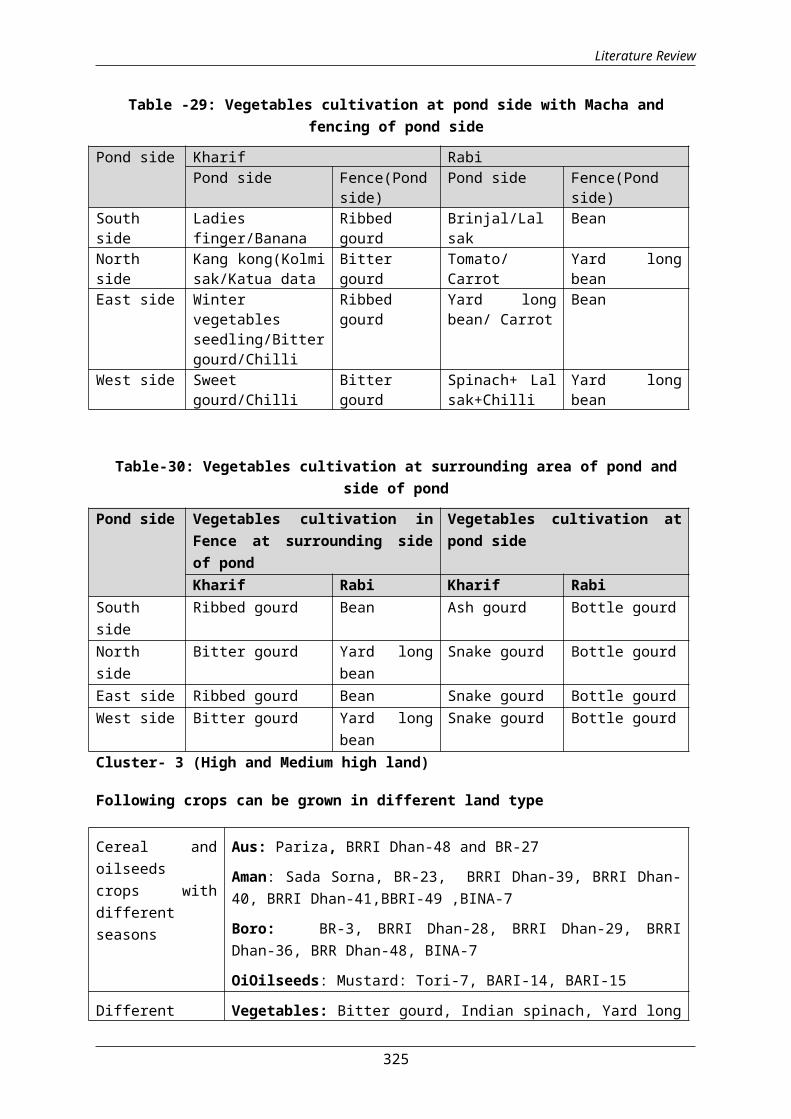
Literature Review
Table -29: Vegetables cultivation at pond side with Macha andfencing of pond side
Pond side Kharif RabiPond side Fence(Pond
side)Pond side Fence(Pond
side)Southside
Ladiesfinger/Banana
Ribbedgourd
Brinjal/Lalsak
Bean
Northside
Kang kong(Kolmisak/Katua data
Bittergourd
Tomato/Carrot
Yard longbean
East side Wintervegetablesseedling/Bittergourd/Chilli
Ribbedgourd
Yard longbean/ Carrot
Bean
West side Sweetgourd/Chilli
Bittergourd
Spinach+ Lalsak+Chilli
Yard longbean
Table-30: Vegetables cultivation at surrounding area of pond andside of pond
Pond side Vegetables cultivation inFence at surrounding sideof pond
Vegetables cultivation atpond side
Kharif Rabi Kharif RabiSouthside
Ribbed gourd Bean Ash gourd Bottle gourd
Northside
Bitter gourd Yard longbean
Snake gourd Bottle gourd
East side Ribbed gourd Bean Snake gourd Bottle gourdWest side Bitter gourd Yard long
beanSnake gourd Bottle gourd
Cluster- 3 (High and Medium high land)
Following crops can be grown in different land type
Cereal andoilseedscrops withdifferentseasons
Aus: Pariza, BRRI Dhan-48 and BR-27
Aman: Sada Sorna, BR-23, BRRI Dhan-39, BRRI Dhan-40, BRRI Dhan-41,BBRI-49 ,BINA-7
Boro: BR-3, BRRI Dhan-28, BRRI Dhan-29, BRRIDhan-36, BRR Dhan-48, BINA-7
OiOilseeds: Mustard: Tori-7, BARI-14, BARI-15
Different Vegetables: Bitter gourd, Indian spinach, Yard long
325

Literature Review
vegetables bean, Lalshak, Snake gourd, Ash gourd, Bottlegourd, Sweet gourd, Sponge gourd, Spinach andAmaranthus.
Table30: Proposed cropping pattern
Cropping PatternsKharif-I Kharif-II RabiFallow T. Aman FallowAus Fallow Boro
Fallow T. Aman BoroAus T.Aman Oil seeds
Fruits +intercropping with field cropCluster-4 (medium high, medium low and low land)
Following crops can be grown in different land type
Cereal, oilseedsand pulses cropswith differentseasons
Aus: Pariza, BRRI Dhan-48 and BR-27
Aman Sada Sorna, BR-23, BRRI Dhan-39, BRRIDhan-40, BRRI Dhan-41,BBRI-49 ,BINA-7
Boro: BRRI Dhan-28, BRRI Dhan-29, BRR Dhan-47, BINA-8
OiOilseeds: : Mustard: Tori-7, BARI-14, BARI-15
Pluses: BARI Mung-5
Wheat: Satabdi, Prodip, BARI wheat-25, BARIwheat-26
Differentvegetables
Vegetables: Bitter gourd, Indian spinach, Yardlong bean, Lalshak, Snake gourd, Ash gourd,Bottle gourd, Sweet gourd, Sponge gourd,Spinach and Amaranthus.
Table 31: Proposed cropping pattern
AEZ Cropping Patterns3,27 Kharif-I Kharif-II Rabi
Fallow T.aman BoroAus T. Aman WheatFallow T.aman PulsesVegetables Vegetables Vegetables
Cluster-5 (Rain-fed condition)
326

Literature Review
Vegetables crops: Bitter gourd, Indian spinach, Yard long bean,Lalshak, Snake gourd, Ash gourd, Bottle gourd, Sweet gourd, Spongegourd, Spinach and Amaranthus
Rice crops:
Aus: Pariza, BRRI Dhan-48 and BR-27
Aman: Sada Sorna,BR-23,BRRI Dhan-39, BRRI Dhan-40, BRRI Dhan-41, BBRI-49, BINA- 7
Oilseeds: Mustard: Tori-7, BARI-14, BARI-15
Table 32: Proposed cropping pattern
AEZ Cropping Patterns3,27 Kharif-I Kharif-II Rabi
Aus T. aman MustardAus T. aman FallowFallow Vegetables Fallow
Typology of production systems and characteristics of irrigators There are no irrigation policies in the pilot area. A typology offarm households and irrigators is useful for understanding the keydrivers of production system adoptions in which irrigation is used,while also capturing the diversity of agricultural productionpractices and economic activities, and potentially the role ofirrigation in livelihood.
Cluster Irrigation policies in the pilot area have historically supportedsmall-scale private irrigation. In the pilot area there areagricultural projects which is scattered. Farmers may be aware tomake the irrigation system on cluster method
A Typology for Farmers' in Drought Management
Drought is a normal, recurrent climate feature in the pilot area.Drought is a slow-onset natural disaster. Planning at macro leveloften assumes that farmers react to and manage drought in similarways. If this assumption of homogeneity is incorrect, the potentialeffectiveness of drought mitigation efforts is likely to bedangerously inhibited. More specifically, it examined whetherfarmers use different strategies to mitigate drought and, if so,whether a typology to classify their management approaches can bedeveloped.
327

328

5. Conclusion and Recommendation
This report is the beginning of a systematic crop typology forBangladesh, using existing information to prepare crop typology inthe pilot seven upazilas. Many gaps in knowledge remain, because noresearch was held in our country. Study on irrigation types willalso hopefully provide the foundation and framework for futurestudies and initiatives of both informal and formal systems. Fieldsurvey and analysis in the selected upazilas from seven district anddivisions indicated that crop typologies differ from upazila toupazila. In every upazila, there are single crop, double crops andtriple crops. It was identified in the field that in almost allupazilas, it is possible to grow double, triple and four crops in ayear in the same piece of land even combining field andhorticultural crops in some upazilas. In the saline prone area theresponse of plants to salinities and various constituent ions in thesoil solution varies widely according to species. The relationshipof crop yield and the concentration of salt in root medium have tobe reviewed. BRRI and other Institutions developed salt tolerantcereal and oilseed varieties. With these information cluster wasdeveloped in consultation with the local farmers, research andextensional personnel. When cluster was made we saw/found thefollowings:
Land suitable for transplanted rice, where practicalexperiences shows that water will stand for few days water
Land not suitable for transplanted rice, but suitable forgeneral dry land crops where water will not stand on the landfor few days
Land which does not stay moist enough in the root zone forseven days after a 4-inch irrigation for general dry landcrops to be grown satisfactorily, where vegetables may growwhich can pay for additional irrigation or where irrigationshould not be applied (usually, the area of such land is verysmall)
Land suitable for orchard but growing unproductive crops Pesticide, fertilizer recommendations for individual crops are
not followed by the cluster. This is because fertilizer needsvary between different soils and different parts of theupazila, and they also change with time. Therefore, SAAO
329
Literature Review
(extension staff should obtained up-to-date recommendationsfor the crops which are grown in their work area).
The classification of food insecure countries presented here wouldhelp define more precisely the group of countries that arevulnerable to food security problems, and thus enable more targetedpolicies in representative countries. Farmers could design hisspecific policies to overcome constricting factors in promotingagriculture production. In order to achieve food security withfavorable land and water conditions need to exploit their potentialto increase agricultural production and productivity through a moreconductive policy framework and increased investment in agriculturaland rural development. There are many examples of preaches, and thedegrees of involvement of the farmers differ greatly from one methodto another. For example, involves the farmers very early in hisconstruction approach, at the diagnostic stage. For our part, wechose to call in the farmers only after the constraint-determiningstage, but before the constraints had been ranked.
However, future research is needed for developing good typologythrough cluster on crop production, crop management, watermanagement, fruits garden with intercrops, and relay crops.
330

331

References
Helleiner G. K., 1965. Typology in Development Theory: The LandSurplus Economy (Nigeria). Department of Political Economy.University of Toronto.
Rao P. P., and Birthal PS., 1998. Crop-Livestock Systems Typology:India. International Crops Research Institute for the Semi-Arid Tropics (ICRISAT). Patancheru-502 324, Andhra Pradesh,India.
Hoque M. E., 2002. Crop Diversification in Bangladesh. Department ofAgriculture Extension. Ministry of Agriculture. Khamarbari.Farmgate. Dhaka. Bangladesh.
Rao P.P., Shrestha H. R., Dhamendrakar AND Basnet R., 2002. Typologyof mixed crop-livestock systems in Nepal. NARC, Nepal.
Groot R. S. D., Wilson M. A. and Boumans R. M. J., 2002. A typologyfor the classification, description and valuation of ecosystemfunctions, goods and services. International Center forIntegrated Studies (ICIS), Maastricht University andEnvironmental Systems Analysis Group, Wageningen University,PO Box 616, NL-6200. MD Maastricht, Netherlands and Center forEnvironmental Studies, Institute for Ecological Economics,University of Maryland, USA.
Rao P. P. 2003. Rainfed Agriculture Typology for DevelopmentPlanning: India. An ICRISAT Success Story. International CropsResearch Institute for the Semi-Arid Tropics (ICRISAT).Patancheru-502 324, Andhra Pradesh, India.
Poussin J.C, Imache A., Beji R., Grusse P. L. and Benmihoub A.,2008. Exploring regional irrigation water demand usingtypologies of farms and production units: an example fromTunisia. Agricultural Water Management, 95 (8): 973-983.
Reed M. S., Graves A., Dandy N., Posthumus H., Hubacek K., MorrisJ., Prell C., Quinn C.H. and Stringer L.C., 2009. Who’s in andwhy? A typology of stakeholder analysis methods for naturalresource management. Journal of Environmental Management 90(2009). 1933-1949.
Mondal M. H., 2010. Crop agriculture of Bangladesh: Challenges andOpportunities. Bangladesh J. Agril. Res. 32 (2): 235-245.
Yu B., You L. and Fan S., 2010. Toward a Typology of Food Securityin Developing Countries. Development Strategy and GovernmentDivision. International Food Policy Research Institute. IFPRIDiscussion Paper 00945.
332
Literature Review
Keshavarz M., Karami E. and Haghighi A. A. K., 2010. A Typology ofFarmers’ Drought Management. American-Eurasian J. Agric &Environ. Sci., 7 (4): 415-426.
Mamun S. A., Nusral F. and Debi M. R., 2011. Integrated FarmingSystem: Prospects in Bangladesh. J. Environ. Sci. & NaturalResources, 4(2): 127-136.
Bellec R. L., Cattan P., Bonin M. and Rajaud A., 2011. Building atypology of cropping practices from comparison with atechnical reference: first step for a relevant cropping systemredesigning process-results for tropical citrus production.Cambridge University Press: Volume: 66. Issue: 03. PP 143-159.
Mooi E. and Sarstedt M., 2011. Cluster Analysis. Chapter 9. ConciseGuide to Market Research. DOI 10.1007/978-3-642-12541-6_9.
Bellec R. L., Cattan P., Bonin M. and Rajaud A., 2011. Building atypology of cropping practices from comparison with atechnical reference: first step for a relevant cropping systemredesigning process-results for tropical citrus production.EDP Sciences. Vol. 66. P. 143-159.
Ecotrust, 2012. GIS Agricultural Land Analysis for ClackamasCountry, OR: Agricultural Investment Plan. Draft Report.Clackamas Country.
Pradeleix L., Maurel V. B., Roux P., Philippon O. and Bouarfa S.,2012. Life Cycle Assessment of Agricultural Activities atregional Scale: Characterizing Variability and Uncertainitywith the Agrarian System Diagnosis. ELSA.
Paul B., Peters M. Groot J.C.J., Herrero M. and Tittonell P., 2013.A Feed-Based Typology of Crop-Livestock Systems in EasternAfrica. International Center for Tropical Agriculture (CIAT),Tropical Forages Program, Kenya.
Takeshima H. and Hyacinth E., 2013. Typology of Farm Households andIrrigation Systems. Development Strategy and GovernmentDivision. International Food Policy Research Institute. IFPRIDiscussion Paper 01267.
333

Literature Review
334