Geographia Polonica 40 (1979) Agricultural typology - RCIN
271
POLISH ACADEMY OF SCIENCES GEOGRAPHIA POLONICA
-
Upload
khangminh22 -
Category
Documents
-
view
7 -
download
0
Transcript of Geographia Polonica 40 (1979) Agricultural typology - RCIN

P O L I S H A C A D E M Y O F S C I E N C E S
GEOGRAPHIA POLONICA

E d i t o r i a l B o a r d
S T A N I S Ł A W L E S Z C Z Y C K I ( E d i t o r - i n - C h i e f ) K A Z I M I E R Z D Z I E W O Ń S K I , J E R Z Y K O S T R O W I C K I P I O T R K O R C E L L I , J A N U S Z P A S Z Y Ń S K I T E R E S A L t J E W S K A ( S e c r e t a r y )
A d d r e s s of E d i t o r i a l Board
K R A K O W S K I E P R Z E D M I E Ś C I E 30 0 0 - 9 2 7 W A R S Z A W A P O L A N O
P r i n t e d in P o l a n d
http://rcin.org.pl

P O L I S H A C A D E M Y O F S C I E N C E S I N S T I T U T E O F G E O G R A P H Y
A N O S P A T I A L O R G A N I Z A T I O N
GEOGRAPHIA POLONICA
40
P W N — P o l i s h S c i e n t i f i c P u b l i s h e r s • W a r s z a w a 1 9 7 9
http://rcin.org.pl

A G R I C U L T U R A L T Y P O L O G Y
P R O C E E D I N G S O F T H E E I G H T H M E E T I N G OF T H E C O M M I S S I O N O N A G R I C U L T U R A L T Y P O L O G Y , I N T E R N A T I O N A L G E O G R A P H I C A L U N I O N O D E S S A , U S S R , 2 0 - 2 6 J U L Y 1 9 7 6
E d i t e d by
J E R Z Y K O S T R O W I C K I A N D W I E S Ł A W A T Y S Z K I E W I C Z
http://rcin.org.pl

ERRATA
Page/line Instead of Read
303 50-10 ha 50-100 ha 12313 pulsers pulses 127i4 (Tsv) (Tev) 15226 C5 C,5 1723i Snn Suu 174g a number a figure 24018 framework of framework typology of
Geographia Polonica 40, 1979 http://rcin.org.pl

CONTENTS
Preface 4 B. V. Andrianov: African traditional economic-cultural types and the problems
of typology of world agriculture 5 V. A. Pulyarkin: Typological study of agriculture in developing countries . 11 I. M. Kuzina, L. F. Yanvaryova: Types of world agriculture map for higher
schools 17 A. N. Rakitnikov: Développement des études sur la typologie de l'agriculture
et la planification de la production agricole 23 T. A. Solovtsova: Cartographie methods for the identification of production
types of agriculture 29 N. P. Isayenko: Classification of the production types of agricultural
enterprises 39 A. Yu. Parfenova: The territorial organization of agriculture in the Uralsk
Province 47 |I. F.~Mukomel|, K. E. Povitchannaya, S. V. Stetsenko: Production types of
farms and agricultural zoning in the Odessa Province 55 V. G. Kryuchkov: Types of agricultural regions in West Siberia and North
Kazakhstan 67 L. M. Zaltsman, S. J. Polovenko: Les mutations progressives dans la concent-
ration et typisation de l'agriculture de L'URSS 75 L. I. Gorbunova, M. V. Komleva, L. V. Shishkina: Agricultural typology of
the USSR 83 M. J. Troughton: Application of the revised scheme for the typology of world
agriculture to Canada 95 V. R. Singh: Agricultural typology of India 113 B. P. Panda: Agricultural types in Madhya Pradesh 133 J. Bonnamour, Ch. Gillette: Application des normes proposées par J. Kostro-
wicki à l'agriculture française 151 R. Szczęsny: Changing types of Austrian agriculture, 1960-1970 161 W. Tyszkiewicz: Agricultural typology of the Thracian Basin, Bulgaria as
a case of the typology of world agriculture 171 K. Bielecka, M. Paprzycki: Evaluation of taxonomic methods from the point
of view of comparability of results in space and time — in optimization aspect — 187
K. Bielecka, M. Paprzycki, Z. Piasecki: Proposal of new taxonomic methods for agricultural typology 191
J. P. Saxena, S. N. Mehrotra: Regional imbalances in the agricultural develop-ment of Madhya Pradesh, India 201
J. Singh: A new technique of delimiting agricultural production typology in foodcrop dominated economy: Haryana case study 209
S. Christiansen: 'Carrying capacity' and 'potential crop productivity' — basic concepts in cultural geography? - » . . . . 217
U. Varjo: Productivity and fluctuating limits of crop cultivation in Finland 225 J. Kostrowicki: Twelve years' activity of the IGU Commission on Agricultural
Typology 235
http://rcin.org.pl

PREFACE
This volume contains the selection of papers either presented or submitted to the 8th and the last meeting of the Commission on Agricultural Typology of the Inter-national Geographical Union held in Odessa, USSR, on July 20 to 26, 1976.
The papers are arranged so that more general problems of identification and mapping of agricultural types are discussed first, and subsequently the Soviet ap-proaches and methods concerned with the identification of production types of agriculture and their application in planning, as used by both geographers and agricultural economists, are explained and exemplified in three regional papers.
Next follows a paper, completed after the Odessa meeting, in which the princi-ples and methods recommended by the Commission were for the first time and very faithfully applied for the preparation of the agricultural typology of the whole Soviet Union.
This paper is followed by two other macro-scale agricultural typologies, namely of Canada and India, and then by another paper referring to one Indian province only.
Next there are three European papers in which the methods recommended either in the final or previous schemes of the typology of world agriculture were applied to France, Austria and Bulgaria.
In the next two papers the applicability and effectiveness of various taxonomic methods for agricultural typology are assessed.
The last three papers could be considered as a kind of transition from the subject matter dealt by the Typological Commission to that of the newly established IGU Commision on Agricultural Productivity and World Food Supplies.
Editors
http://rcin.org.pl

GEOGRAPHIA POLONICA 40, 1979
A F R I C A N T R A D I T I O N A L E C O N O M I C - C U L T U R A L T Y P E S A N D T H E P R O B L E M S O F T Y P O L O G Y O F W O R L D A G R I C U L T U R E
B . V . ANDRIANOV
Institute of Ethnography, Soviet Academy of Sciences, Moscow, USSR
The latest version of the outline typology of world agriculture was based on wide discussion, a number of different remarks sent to the Commission on Agricultural Typology (Kostrowicki 1974, 1975). Numerous studies were care-fully analysed by the author, J. Kostrowicki. Among them were not only publications resulting from the activities of the Commission on Agricultural Typology, but also other works written by geographers, agricultural economists, ethnographers, sociologists, planners, etc. The Commission has made good progress in creating a working scheme of world agricultural typology. The author's conclusion is of great importance. According to him every agricultural type is a product of historical processes, technological, economic and cultural factors typical of certain times and areas (Kostrowicki 1973, p. 590).
The above quoted general scheme does not sufficiently take into account the historical-ethnographical background. The present day diversity of human cultures and ethnic differences in the peoples' ways of life, the economic, cultural and everyday traditions handed down through generations are all results of the historical process and mankind's economic and cultural dif-ferentiation which links by invisible threads the remote past of the peoples with their present day state.
The success of geographic study of the world enabled Eduard Hahn to publish in 1892 the world's first schematic map showing the forms of economic activities. Eventually a number of such maps appeared. In 1965 a British geog-rapher David Grigg examined in detail the advantages and shortcomings of these maps (Grigg 1969). However, he failed to stress the main shortcoming, i.e., the absence of a historical genetic approch to the materials in the typological elaboration of map legends.
More than 100 years ago E. Taylor took up the issues of patterns in cultural development and the universal character of progress in social and cultural phenomena, of their evolution from the lower forms to the higher. At the turn of the century the evolutionist's ideas were subjected to criticism by the repre-sentatives of other schools who explained the world's economic and cultural diversity by migrations, diffusions and borrowings. They considered all cultu-ral phenomena in isolation from one another and divorced from the peoples themselves. However, in the course of mapping cultural phenomena there arose the idea of historical-ethnographical areas. American ethnographers A. Kroeber (in 1904 and 1923) and particularly C. Wissler (in 1917) representing the point of view of pluralism grouped various ethnographical phenomena in the life of
http://rcin.org.pl

6 B. V. Andrianov
American Indians into definite cultural areas. The pluralist tendencies of rejecting the unity of historical process in the culture of peoples of the world is clearly shown also in the works of two eminent American anthropologists M. Herskovits and J. P. Murdock who, however, did much to elaborate the cultural areas of the African continent.
An entirely different approach in explaining the causes of similarity and difference in the way of life of different peoples was proposed by Soviet ethnographers. In their analysis of economic and cultural diversity of mankind they were guided by the concept of a unified historical and gradual develop-ment of human society along definite stages of cultural progress and changes in the means of production (Levin and Cheboksarov 1955; Andrianov and Cheboksarov 1972, 1975).
Soviet ethnographers have developed an ethnographical concept of 'econo-mic-cultural types' and 'historical-ethnographic areas'. The basic conclusions are the following, (1) specific features of traditional cultural characteristics for each type are determined, first and foremost, by the direction of the peop-les' economic activities in the given ecological conditions which determine the specific traits of the peoples' material culture, i.e., the types of settlements and dwellings, food and utensils, clothing, means of transportation, etc.; (2) under similar socio-economic and natural geographic conditions, identical economic and cultural types emerged independently among peoples sometimes far removed from one another; (3) plurality of local manifestation of traditio-nal human culture was in all cases accompanied by unity of general patterns in the global historical process (Levin and Cheboksarov 1955; Andrianov and Cheboksarov 1975).
Further theoretical elaboration of this ethnographical problem paved the 1
way for mapping the economic-cultural types of the world, which was also facilitated by successes in ethnic cartography (Bruk and Kozlov 1961; Atlas
. Narodov Mira). In 1972 Sovetskaya Etnografia published a schematic map of economic-cultural types of the world (Andrianov and Cheboksarov 1972, The Map). On the map the types are grouped according to their historical-genetic characteristics (See Map).
Any further practical elaboration of problems, conducted by experts in agricultural geography, should make good use of the historical-ethnographical data, characterizing the historical development of agricultural production pat-terns of the peoples of the world, which is appropriately reflected also in the local peculiarities of modern agricultural production in the wide zone of deve-loping countries, where agriculture and livestock breeding use antiquated me-thods to a considerable extent.
In African countries colonialism left a very heavy burden and many unso-lved problems. Poor traditional agriculture and animal husbandry, i.e., subsi-tence economy is only the first of them (Svanidze 1972). In Tropical Africa traditional agriculture is the only source of means of subsistence of up to 80 per cent of the population. Therefore the modernization of agriculture is the most urgent task of young African states. Vestiges of many earliest economic--cultural types, such as wandering gatherers and hunters, have survived in the forests and savannahs of the hot belt of Africa. There have also survived semi-settled and semi-nomadic livestock breeders and farmers; nomadic cattle--raisers and hunters in the savannahs (without crop growing); agricultural economic-cultural types with hunting, food-gathering and fishing, without cat-tie-herding; settled stick-and-hoe farmers with tropical shifting agriculture; nomadic and semi-nomadic cattle-herders of the arid zone in deserts and
http://rcin.org.pl

African traditional types 7
savannahs (Andrianov 1975). The entire economic and cultural diversity re-flecting millenia of history are reduced on the map to almost three dozens of types combined into eight groups which differ in their increasingly greater productivity of labour and the growing extent of the surplus product, and hence in the level of social and economic development and the way of life and culture as a whole.
The first group comprises types in which hunting, food gathering and, partially, fishing dominate. Such patterns of the food gathering stage of the economic history of mankind have survived only in a limited number of popu-lation groups of Africa (Kung, Dorobo, Kindiga or Hadzapi etc.) and other bushmen (Man the hunter, 1968).
The next large group consists of economic-cultural types whose production economy is based on manual labour. They are, cattle-raising, agriculture, and combined agriculture and cattle-raising types. The cattle-raising group of types comprises in the hot belt nomadic cattle-raisers-and-hunters (Hottentots, Here-ro in South Africa) and semi-settled and semi-nomadic cattle-raisers-and--farmers (Nuer, Dinka, Murle, etc.).
In the hot belt of Africa, there have still survived agricultural economic--cultural types whose occupations are hunting, food gathering and fishing without cattle-raising or with little developed cattle-raising (Murdock 1959). They include semi-settled, manual or stick-and-hoe farmers and hunters of tropical forests and savannahs (Mongo, Azande and others). Agricultural and cattle-raising economic-cultural types are represented rather widely in the hot belt of Africa by a number of various types and sub-types. Their common features are, cultivation of root and tuber crops (yams, taro, sweet potatoes and other), dry rice in some places and also bananas and various kinds of palms etc., use of hoes and sticks for planting; predominant role of female labour in agriculture, permanent round or rectangular dwellings of the fra-mework-pole type, etc. There are a number of economic sub-types with shifting agriculture, with tropical intensive irrigated or non-irrigated agricul-ture on stone terraces.
The developed economic-cultural types in which plough cultivation domina-tes spread widely in North Africa (Arabs, Amhara, Berbers, etc.). Here in the arid semi-deserts and deserts there have remained highly specialised nomadic cattle herders. Nomadic cattle breeding in its developed market form is rather widely developed now among the present inhabitants of desert and semi-desert territories (Tuareg, Bedouin Arabs, Beja, etc.).
The specific feature of nomadic economy namely an extensive use of natural resources of the desert (as opposed to irrigated agriculture) and a nomadic way of life resultant from the seasonal change of pastures have both promoted a lengthly preservation of archaic social organizations of many nomadic cattle breeders and delayed the rate of their cultural development (Andrianov and Murzaev 1964; Hills 1966).
Among the important problems of contemporary Africa there is the prob-lem of transformation of the nomadic way of life of the cattle breeding tribes whose backward economy fails to satisfy the country's growing needs for animal produce. Nomad's archaic organisation blocks social progress, hampering the social, economic and cultural integration of the nomad population.
R. Capot-Rey, a French geographer, subdivided present nomads of desert Sahara into groups, nomads with seasonal migrations and nomads who move nonperiodically (Capot-Ray 1953). The first group includes the Arabs-Bedouins of Northern Sahara, who move during the summer into the steppe piedmont plains of Maghreb, and the nomads of Southern Sahara, who leave the desert
http://rcin.org.pl

8 B. V. Andrianov
in autumn and spend winter in the savannahs of Sudan reaching Senegal and Niger (Arabs of Mauritania, etc.). Very often the routes of roaming are of a definitely meridional direction. The group of nomads who migrate nonperio-dically includes Arabs and Tuaregs, the inhabitants of Central Sahara.
In Africa one can observe various stages of the processes of separation of cattle breeding from agriculture on one hand, and different phases of develop-ment of cattle breeding on the other. We observe the combination of tropical agriculture and cattle breeding in the South and East Africa. It is there that economic-cultural types of cattle-breeders-and-hunters without crop growing are spread (Masai in East Africa, Hottentots in South Africa). This type dif-fers from the classical nomadic type (characteristic of Arab nomads of North Africa). Therefore these two types cannot be included in the Nomadic herding section of the scheme of World Types of Agriculture (I) (Kostrowicki 1974, p. 30). They must be included in different types.
An improvement in the life of the people inhabiting the arid zone depends, first of all, upon a change in social conditions and economy. Researches on impetuous social-economic transformations proceeding before our eyes are of foremost theoretical and practical interest. More and more peoples, separate tribes and ethnographic groups that maintained until recently their traditions of nomadic life and archaic forms of economy, become involved into a new type of economics.
At present huge areas of Africa are involved in small-scale commodity production. An active process of diffusion of commercial economy is in prog-ress. Traditional ways of life are disappearing. However, the ancient traditional economic-cultural types are a considerable obstacle to progress. Thus their ethnographic study is a matter of great significance for various objectives, and, in particular, for the purposes of typology of the world agriculture. It is a very important problem, for "the type of agriculture is a hierarchical concept, encompassing types of various order, and also a dynamic concept changing in an evolutionary or revolutionary way along with a change of its attributes" (Kostrowicki 1976).
REFERENCES
Andrianov B. V., 1975, Problems of typology and mapping of traditional agriculture, in: C. Vanzetti (ed.), Agricultural typology and land utilization, Verona, pp. 33—39.
Andrianov B. V., Cheboksarov N. N., 1972, Khozyaystvenno-kulturniye tipy i proble-my ikh kartografirovaniya (Economic-cultural types and problems of their map-ping), Sovetskaya Etnografiya 2.
Andrianov B. V., Cheboksarov N. N., 1975, Istoriko-etnograficheskiye oblasti. Proble-mi istoriko-etnograficheskogo rayonirovaniya (Historic-ethnographical areas. Pro-blems of historic-ethnographical regionalization), Sovetskaya Etnografiya 2.
Andrianov B. V., Murzaev E. N., 1964, Nekotoriye problemy etnografii aridnoy zony (Some problems of arid zone ethnography) Sovetskaya Etnografiya, 4.
Bruk S. I., Apenchenko V. S. (eds.), 1964, Atlas narodov mira (Atlas of world peoples), Moskva.
Bruk S. I., Kozlov V. I., 1961, Osnovniye problemy etnicheskoy kartografii (Basic problems of ethnic cartography), Sovetskaya Etnografiya 5.
Capot-Ray R., 1953, Le Sahara français, Paris. Grigg D., 1969, The agricultural regions of the world: review and reflection, Econo-
mic Geography 45, 2, pp. 95-132. Hills E. S. (ed.), 1966, Arid lands. A geographical appraisal, London-Paris, UNESCO.
http://rcin.org.pl

Annex to the article by B.V. Andrlanov Geographla Polonlca 40, 1979
PWN Warszawa 1 9 7 9 Fig. 1. E c o n o m i c - c u l t u r a l types o f the w o r l d at the e n d o f 19th and the b e g i n n i n g of the 20th century
I. Economic- cultural types based on a food-gathering economy (hunting, f o o d - g a t h e r i n g , f ishing) . 1 —Roaming hunters and food-gatherers of the forests and savannahs of the hot belt, 2 — Roaming hunters and food-gatherers of the plains in the moderate and warm belts (dissappeared in the mid-19th century), S — Roaming hunters and fishermen of the taiga and tundra, 4 —The semi-settled 'harvest-pickers' and hunters (disappeared at the end of the 19th century), 5 — semi-settled food gatherers and fishermen in coastal areas, 6 — Roaming food gatherers and hunters cf the hot belt, subtypes; a) forests and humid savannahs, b) deserts and dry savan-
nahs, 7 — Semi-settled and settled fishermen, hunters and food-gatherers, subtypes: a) coastal, b) continental, 8 — Semi-settled Arctic sea-hunters, 9 — The transformed subtype of roaming taiga fur-hunters. II. Animal husbandry economic-cultural types.
10 — Nomadic cattle-raisers and hunters In the savannahs of the hot belt (without agriculture), 11 — Semi-settled and semi-nomadic livestock breeders and farmers of the hot belt, 12 — Nomadic horse-breeders and hunters of the plains and prairies in the moderate belt (disappeared In the mld-19th century), 13 — Semi-settled and semi-nomadic livestock-raisers and hunters of the taiga zone, 14 — Semi-settled reindeer-breeders and fishermen of the taiga zone, 15 — Nomadic reindeer-breeders and hunters of the tundra and forest tundra.
III . Agriculture economic-cultural types w i th hunt ing , f o o d g a t h e r i n g and f i sh ing , w i t h o u t l i v e s t o c k - h e r d i n g or w i th very little herd ing . 16 — Semi-settled stick-and-hoe farmers and hunters of the hot belt, 17 —Settled stick-and-hoe farmers and fishermen of the hot belt, sub-types: a) maritime, b) continental.
IV . Agriculture and cattle-herding economic-cultural types. 18 — Settled stick-and-hoe farms of the hot belt, sub-types: a) with tropical shifting agriculture (milpa, ladang, chitemene), b) with intensive tropical irrigated and non-irrigated agriculture, c) highland tropical agriculture, 19 — Settled stick-and-hoe farmers of the arid zone with
irrigation agriculture, 20 — Settled stick-and-hoe farmers and forest hunters of the moderate zone (disappeared In the mld-19th century). V . Developed economic-cultural types with plough cultivation.
21 — Settled plough cultivators of the hot belt, sub-types: a) with tropical shifting agriculture (milpa, ladang), b) with Intensive irrigation (Sawah agriculture) and non-irrigated agriculture, 22 — Settled plough-cultivators and nomadic herders of the arid zone (with irrigation), 23 — Set-tled plough cultivators and nomadic herders of the warm belt, sub-types: a) western, with developed horticulture and garden culture, b) eastern with intensive land-cultivation, horticulture and garden culture, c) highland, 24 — Settled plough cultivators of the moderate belt,
sub-types: a) forest and forest-and-plain, b) taiga with subsidiary forest hunting, c) maritime with subsidiary fishing. VI . Livestock-raising and land-cultivating economic-cultural types.
25 —Nomadic and semi-nomadic livestock-herders of the arid zone (hot and warm belts), sub-types a) deserts and savannahs, b) arid foothills and mountains, 26 — Nomadic and semi-nomadic livestock-herders of the arid zone (moderate belt), sub-types: a) deserts and plains, b) arid foothills and mountains, c) high mountains, 27 — Semi-settled and semi-nomadic livestock-herders and farmers of the arid zone (warm and moderate belts), sub-types: a) plains, b) highlands.
V I I . Transformed economic-cultural types. 28 — Nomadic sea fishermen and food-gatherers, 29 — Settled fishermen and livestock-herders of islands and sea coasts, 30 — Nomadic livestock-herders of the pampas.
V I I I . The present-day zones. 31 _ The zone of highly developed commercial agriculture, 32 — The zone of highly developed commercial livestock-ranching, 33 — The zone of highly developed tropical plantation agriculture, 34 — The zone with a predominantly urban, industrial population.
http://rcin.org.pl

African traditional types 9
Kostrowicki J., 1973, Zarys geografii rolnictwa (Geography of agriculture. An outline), Warszawa.
Kostrowicki J., 1974, The typology of world agriculture. Principles, methods and model types, Warsaw.
Kostrowicki J., 1975, The scheme of world types of agriculture. Some weak points and possible improvements, Warsaw (mimeographed).
Kostrowicki J., 1976, Types of world agriculture, in: XXIII International Geographical Congress. Economic geography, sec. 6., pp. 208-211.
Lee R. B., De Vore Y. (eds.), 1968, Man the hunter, Chicago pp. 13-20; 40-56. Levin M. G., Cheboksarov N. N., 1955, Khozyastvenno-kulturniye tipy i istoriko-etno-
graficheskiye oblasti (Economic-cultural types and historic-ethnographic areas), Sovetskaya Etnografiya 4.
Murdock G. P., 1959, Africa. Its peoples and their culture history, New York, Mc Graw Hill Book, pp. 271-379.
Svanidze I. A., 1972, Selskoye khozyastvo tropicheskoy Afriki (Agriculture of tropical Africa), Moskva.
http://rcin.org.pl

http://rcin.org.pl

GEOGRAPHIA POLONICA 40, 1979
T Y P O L O G I C A L S T U D Y O F A G R I C U L T U R E I N D E V E L O P I N G C O U N -T R I E S
V . A . P U L Y A R K I N
Institute of Geography, Academy of Sciences of the USRR, Moscow
Agriculture in developing countries constitutes a distinctive and complex object of study. Socio-economic studies in the field have, in the past 10 to 20 years, made major advances revealing some important inherent laws.
However, economic-geographical study of agriculture in developing count-ries has proved to be more of a challenge. Spatial structure of economy is more difficult to analyse than the social and branch production structure because it is heavily dependent on natural conditions which introduce a further dif-ferentiating factor. However, the similarity of social structure in developing countries and their subordinate role in the capitalist world economy lend certain common features to the spatial structure of production there. This makes it possible to consider developing countries as an object of economic and geographical studies.
A further common feature it that these countries are mostly situated in the tropical or, partially, subtropical belts, with common concomitant problems. As the result, two economic-geographical approaches are open in the study of young sovereign states. One is primarily concerned with the natural conditions of the countries and their favourable or unfavourable impact on development. The other covers a wider range of problems and, at least in the retrospective and perspective analysis of development trends, focuses on social and economic factors.
The latter approach is more promising in that it offers a better insight into the process of formation of the spatial structure of the economy in the Third World. It is most fruitful in small-scale surveys which are primarily concerned with the broader aspects of differences of economic spatial conditions stem-ming from the different socio-economic development levels of different groups of countries (see Lacoste, 1976; Rakitnikov, 1970).
The importance of the economic-geographical study of the natural conditions and resources in the tropics, whose diversity is well-known, is not to be denied. One could mention, in particular, the sharp distinction between the arid and humid areas and the special features resulting from sharp alternation of the rainy and dry seasons. Because in pre-capitalist societies the productive forces and production relations reveal a larger dependence on the geographical environment and historical conditions than at later stages of socio-economic development, agriculture in various natural regions of the Third World differs not only in terms of structure or intensity but also in the forms of socio-econo-mic relations.
http://rcin.org.pl
12 V. A. Pulyarkin
The more one studies the tropics the more one is struck by the diversity of forms of agriculture in these areas. Agricultural regions in individual deve-loping countries and continents often turn out to be less and less comparable as more detailed knowledge offers more sophisticated regionalization criteria.
This prompts the need for typological principles of regionalization to be based, not on the description of specific regions but on the more comprehensive and, in some ways, more revealing description of generic regions, i.e., ter-ritories with a common predominant type of agriculture or combination thereof.
It is a measure of the expanding front of scientific effort in the typology of agriculture that the International Geographical Union has set up a respective commission. Numerous works of the Commission's chairman, J. Kostrowicki, (1964, 1968, 1970) expound the theoretical significance and practical value of agricultural typological studies.
Through the joint effort of agricultural geographers of many countries the Commission on Agricultural Typology has been able to achieve some agreement in the definition of a type of agriculture. It is suggested that the term type of agriculture should refer to all the essential features of a given agriculture and should be used in a broad sense, to include all the forms of crop and livestock farming and to be used at any taxonomic level. The concept is also regarded as dynamic, i.e., the essential features on which each type is based can change.
At the same time it has justly been noted that the term system of agricultu-re should be interpreted more narrowly to refer primarily to the organizational and technical characteristics of agriculture.
Two approaches are open to the scholar in identifying and studying agri-cultural types: (1) to start from the study of individual agricultural units and micro-regions gradually building up to more general types of agriculture, i.e., proceed from the lower stages to the higher, and (2) to identify the main types of agriculture and then locate them on a global (regional, national) scale, with subsequent division of the given agricultural types as the scale of the investiga-tion increases, i.e., to proceed from the higher level to the lower.
The two approaches call for different methods of analysis. Identification of agricultural types at the lower level of generalization, which does not normal-ly deal with profound differentiation of agriculture (at least not in the socio--economic structure), is validated by the use of quantitative methods. Hence the development of a relevant statistical and mathematical apparatus is impor-tant if agricultural types are to be identified objectively. By contrast, in the deductive approach preliminary qualitative analysis of the phenomena in question is the main task, hence determination of the principles that should lie at the basis of dividing agriculture into types. This is a delicate task, for it cannot rely on solid quantitative criteria and depends heavily on the sci-entist's methodological approach.
The many-sided nature of agriculture in developing countries and its incre-asing dynamism make it a difficult object for typological study, the difficulties being compounded by the fact that tropical agriculture has not been studied sufficiently well. All this impedes attempts at the regionalization of agriculture, including the regionalization on the world scale.
Geographers concerned with the spatial aspects of agriculture in developing countries should therefore pay more attention to the typological analysis and classifications. Although opinions vary on the principles that should underlie agricultural typology, most contemporary scientists agree that agriculture itself
http://rcin.org.pl

Typological study in developing countries 13
should be the starting point. This marks a step forward as compared with the earlier typological regionalizations of agriculture. Classifications that proceed from the assessment of natural prerequisites for production are found to be wanting because it is by now universally acknowledged that similar natural conditions can support different agricultures.
Such classification was proposed, for example, by T. Engelbrecht, a pro-minent German agricultural geographer (1930), who to all intents and purposes aquated agricultural regions with agro-climatic regions, singling out 'arid borderlands of the sugar cane zone', 'desert regions', etc. While such regionaliza-tion may give useful insights into agricultural conditions, especially in the marginal natural regions, it fails to describe the actual agriculture.
A more interesting attempt was the application of the evolutionary principle to agricultural typology as proposed in the late 19th century by E. Hahn, a major German geographer (1892) and elaborated by a number of scientists (one of the latest modifications was offered by H. Gregor in 1963). The genetic approach is not irrelevant in the geography of agriculture, being particularly instrumental in understanding the relict types, formerly prevalent over vast areas but reduced in the course of history to limited territories. However, ap-plications of this approach are limited by the insufficient, for geographical purposes, differentiation of the evolutionary series and a too wide spatial spread of some agricultural types identified, i.e., economic forms. Hahn, for example, singled out plough farming as one stage of agriculture which covered North America and many parts of Latin America, South and East Asia and Western Europe.
The most widely recognized typological agricultural regionalization on a world scale was proposed in 1936 by D. Whittlesey, an American geographer. He proposed the following as the first-order diagnostic properties: (1) produc-tion structure of agriculture, (2) intensity of land use, (3) farming methods and farm technology used, (5) social structure of agriculture. This classification, based primarily on the production features of agriculture, inspired a number of imitations and modifications, whose authors elaborated and made more ac-curate the list of agricultural types proposed by Whittlesey. One could note R. S. Thoman (See Thoman, Conkling, Yeates 1968) who believes that the fol-lowing three criteria are sufficient for identifying agricultural types of the first order. They are sectoral structure, intensity of land use and the proportion of the production marketed. None of the classifications proposed so far are based on less than three criteria.
Typological agriculture regionalization networks, even when proceeding from seemingly different principles, reveal certain correspondences, as noted by D. Grigg (1969). Therefore, the same writer's insistence, expressed in another article (D. Grigg 1965), that classification and regionalization are inevitably a su-bjective research act, underrating the importance of objective reality from which an impartial scientist proceeds.
It will be seen that in the typological study of agriculture which is a many--sided field a set of properties is used to identify types. Most geographers hold that a typology cannot be developed on the basis of a single criterion.
One can go along with that point of view. Even so, at the present stage there is much to be said for minimizing the number of criteria because, if correctly chosen, they allow maximum degree of generalization and reduce the subjective element to a minimum. These considerations are all the more important in view of the insufficient knowledge about tropical agriculture and lack of relevant statistics. An attempt to take into consideration many features
http://rcin.org.pl

14 V. A. Pulyarkin
at once, i.e., to cover many aspects of the object of study, contribute to uncer-tainty, because with variability of one of the features determining spatial dif-ferentiation of agriculture, other features do not necessarily vary in the same way and within the same spatial limits.
In the systems analysis the first-order types are identified through a combi-nation of two directions of agricultural links, 'downward' and 'upward'. In the former case agrarian production is viewed as forming a system with the natu-ral environment and in the latter with the socio-economic structures. Thereby a synthesis is effected of the two afore-mentioned economic and geographical approaches in the study of developing countries. The nature-farm production system permits to identify four types of land use in the agriculture of deve-loping countries which are largely exhaustive (if one does not count interme-diate combinations which at the initial stage of typological investigation are being ignored):
(1) land used for grazing, (2) land used periodically for farming (soil fertility naturally restored), (3) permanent land cultivation (man-restored soil fertility), (4) land used to grow perennial crops. These territorial types reveal a distinct localization pattern and provide
a natural basis for historical-geographical typology of agriculture reflecting the natural differentiation of the tropical world. The first type of land use is largely confined to arid areas, the second and fourth to humid areas while the third type, most versatile ecologically, occupies an intermediate position com-peting with the other types in the areas of their prevalence.
This, of course, is a general scheme since agricultural production is not determined by the geographical environment and territories with similar natu-ral agricultural conditions are not necessarily similar in terms of agriculture.
The 'agricultural production — a socio-economic structure' system should, in our view, identify the classes of agriculture proceeding from the prevalent forms of land tenure, i.e., the predominance of (a) pre-capitalist and (b) capita-list socio-economic set-ups. Diversity of social patterns is the most striking distinguishing feature of agriculture in developing countries, with the most noticeable spatial variations revealed by pre-capitalist socio-economic set-ups.
Multi-sectoral character of agriculture in developing countries does not mean islands of antiquated modes of social relations in the midst of a certain socio--economic formation. These often represent spatially well-defined masses of heterogeneous social relations which make developing countries vivid examples of what A. Gurevich of the USSR (1965) calls the inclusion of the geographical environment in the socio-historical process.
Certain pre-capitalist forms of land tenure and the associated social institu-tions in these countries still clearly reflect the impact of geographical environ-ment on land use. Thus, in nomadic agriculture, both pastoral and land-farming, communal property and tribal institutions tend to persist. Sedentary farming, involving constant land cultivation, is marked by the prevalence of private landowner and the peasant land tenure combined with the subsistence farming.
Perennial crops are mainly grown in capitalist-type economies (the fact that trees are traditionally grown in private peasant holdings is not relevant for the purposes of classification because that is only done on a supplementary basis). Capitalist relations are dominant also in some parts of the tropical world where land is used for grazing (Latin America and Southern Africa) and for
http://rcin.org.pl

Typological study in developing countries 15
plough cultivation (a salient example being the Kenya Highlands) and are not characteristic of territories with intermittent land cultivation.
A combination of the downward and upward direction of links in the agri-culture of developing countries yields the following first-order agricultural types (the indices are the same as above).
The direction of links Type of agriculture
Down Up 1 + a Nomadic (semi-nomadic) herding 1 + b Livestock ranching
11 + a Shifting cultivation I l -b b Nonexistent in practice
I I I+ a Traditional (peasant) sedentary farming I I I+ b Commercial livestock and crop farming IV-+ a Nonexistent in practice IV+ . b Plantation agriculture
As distinct from livestock ranching and commercial farming, the remaining four types are to be found at present only in developing countries.*
It must be noted that the above typological scheme does not reflect inter-mediate forms. These might include haciendas in Latin America or West African farms combining shifting cultivation with perennial cash crop growing. Chinese commercial farms in Malaysia, almost totally committed to perennial crop cultivation (rubber trees) defy any pigeonholing. Narrow geographical localization of these farms and the owners' heavy dependence on additional income sources preclude their being singled out as a separate type (cf. Fryer and Jackson 1966).
A shortcoming, which is probably inevitable, of the proposed classification results from the fact that type Ilia namely traditional, peasant farming, is so important economically nad so wide-spread spatially as to be incommensurate with the remaining types. Hence, even in the small-scale cartography and the description of tropical agriculture, there arises the need to further subdivide this type, which is in itself a major challenge. The incommensurability of the ty-pes shows that a rigorous classification may clash with reality, a contradiction usually resolved by making amendments in a seemingly streamlined classifica-tion. In each case there must be clear awareness of the inner logic of the typo-logical classification to understand better what is being sacrificed for the sake of accomodating complex geographical realities.
REFERENCES
Fryer D. W., Jackson, J. C., 1966, Peasant producers or urban planters? The Chinese rubber smallholders of Ulu Selangor, Pacific Viewpoint, 7, 2.
Gregor H. F., 1963, Environment and economic life, Princeton. Gregor H. F., 1965, The changing plantation, Annals Assoc. Amer. Geogr., 55, 2.
* H. Gregor (1965) believes that plantations in the present-day context should not be identified solely with tropical farming. He comes to this conclusion largely on the basis of static, technical and organizational factors while ignoring the social environment in which plantations exist.
http://rcin.org.pl

16 V. A. Pulyarkin
Grigg D., 1965, The logic of regional systems, Annals Assoc. Amer. Geogr., 55, 3. Gurevich A. Y., 1955, Obshchyi zakon i konkretnaya zakonomernost v istorii (The
general law and concrete regularity in history), Voprosy Istorii, 8. Hahn Ed., 1892, Die Wirtschaftsformen der Erde, Petermann's Mitteilungen, 38. Kostrowicki J., 1964, Geographical typology of agriculture. Principles and methods.
An invitation to discussion, Geogr. Pol., 2. Kostrowicki J., 1968, Agricultural typology. Agricultural régionalisation. Agricultu-
ral development, Geogr. Pol., 15. Kostrowicki J., 1968, Agricultural typology. Summary of the activities of the IGU
Commission for the years 1964-1968, Warsaw (duplicated). Lacoste G., 1967, Le concept de sous-developpement et la geographie, Annales de
Geogr., 76, 418. Rakitnikov A. N., 1970, Geografiya selskogo khozyaystva. Problemy i metody issle-
dovaniya (Geography of agriculture. Problems and methods of research), Moskva. Thoman R. S., Conkling E. C., Yeates M. H., 1968, The geography of economic acti-
vity, New York. Whittlesey D., 1936, Major agricultural regions of the Earth, Annals Assoc. Amer.
Geogr., 26, 4.
http://rcin.org.pl

GEOOTAPHIA PO LO NICA 40, 1979
T Y P E S O F W O R L D A G R I C U L T U R E M A P F O R H I G H E R S C H O O L S
I . M . K U Z I N A , L . F . Y A N V A R Y O V A
Faculty of Geography, Moscow State University, USSR
In 1975 geographers of Moscow State University began work on a series of educational maps for higher schools. The first series of similar maps, including maps of nature and general physical maps, was published 20 years ago. Now the publication of several series of thematic and general physical maps of the world, the continents, the USSR, and other regions is envisaged. Agricultural maps are included in each territorial series. It is proposed to create world maps on land use, farming, livestock breeding and types of agriculture on a scale 1 : 15,000,000.
It will be the first time that a map of world types of agriculture will be created in the USSR. Up to now in higher schools a somewhat more up-to-date version of the map compiled by D. Whittlesey in 1936, has been used. This map can no longer satisfy the high requirements of modern scientific reference maps, neither in the criteria of identifying the types of agriculture nor in the content (I. M. Kuzina, L. F. Yanvaryova 1972). A map of world types of agricul-ture for higher schools is used in teaching many subjects at different types of establishments of higher education. This applies to the courses at the depart-ments of geography and economics at universities, and teacher's training colle-ges, such as 'Introduction to Economic Geography', 'The Economic and Political Geography of Foreign Countries', and 'The Geography of World Agriculture'. It also applies to the 'Economics, Organisation and Planning of Agriculture' and 'Economic Geography' courses at Schools of Economics and Agriculture. In all subjects the following questions are examined to a greater or a lesser extent: geography of agrarian relations, distribution of enterprises of agricultural pro-duction, farming and livestock breeding systems, territorial organisation and typology of agriculture.
The content of the map of types of agriculture should be linked with the above mentioned courses and should reflect the latest methodological and me-thodic achievements of agricultural geography. It should also show objectively the structure and distribution of world agriculture by means of typification.
A wall map of types of world agriculture should be suitable for general lec-tures in large auditoria and for specialised lectures read to small groups of stu-dents. Therefore it should contain plenty of detail, and at the same time be clear and easy to read.
Compiling such a map is based on principles, methods and criteria of classi-fication of the types of world agriculture developed by the Commission on Agri-cultural Typology of the International Geographical Union (headed by Professor J. Kostrowicki) and also on recommendations previously made by Soviet spe-cialists in agricultural geography. We do not agree with the views of some
S Geographia Polonica http://rcin.org.pl

18 I. M. Kuzina, L. F. Yanvaryova
Italian geographers (S. Monti and D. Ruocco 1976) that it is neither possible nor expedient to work out a typology of world agriculture because of sharp differences in the social and economic structure and in the functional and productive features of agriculture in various areas of the world. On the con-trary, experience gained in studies of many countries, in particular, of the USA., Canada, France, India, the USSR and others, shows that it is quite possible to create a typology of world agriculture, and that such typology and a map based on it are needed in practice.
The main principles and methods developed by the Commission on Agricul-tural Typology (J. Kostowicki 1970, 1974, 1976), are similar to the Soviet metho-dological views expressed in particular in the works of the Moscow school of economic geographers founded by Professor N. N. Baransky. Problems of agricultural typology are extensively dealt with in the lectures on the geograp-hy of world agriculture read at Moscow State University by Professor I. A. Vit-ver and Professor A. N. Rakitnikov, and in textbooks and teaching aids on the economic geography of the USSR and other countries. The views of Soviet economic geographers are reflected most fully in the works of Professor A. N. Rakitnikov (A. N. Rakitnikov 1970, 1972).
We believe that types of agriculture represent a sufficiently stable combina-tion, for a given period, of agrarian relations, of specialisation and intensity of agricultural production. This idea does, in many ways, coincide with the defi-nition of Professor J. Kostrowicki. Typological studies of various regions of the globe carried out by Soviet and foreign scientists also show that methods de-veloped by the Commission on Agricultural Typology need to be improved. The reason for this are various research tasks to be dealt with, the variety of agricultural types which do in fact exist, and the abundance of varied primary material used by the researchers.
First of all there arises the question of improving methods of classifying the socio-economic types of agriculture in the capitalist and developing countries. Diversity of the present socio-economic systems of agriculture can be generali-zed within the framework of the four social groups of first rank classified by the Commission. Obviously, socio-economic groups of second and third rank need to be worked out in conformity with the Commission's types and sub-types of world classification. Otherwise, a distorted impression is created of the so-cio-economic uniformity of vast areas, which differ, for example, in the diffe-rent level of capitalist relations in agriculture. Thus, in studying US agricul-ture according to the Commission's methods, no socio-economic types can be determined. The entire territory goes under one social type of first rank, i.e., a market economy. But even at the beginning of the twentieth century V. I. Le-nin pointed out that the USA differs "in the tremendous variety of production relations, and in the enormous wealth of shades and forms of capitalist far-ming" (V. I. Lenin, vol. 127, p. 388). Modern research on the agriculture of the USA has confirmed that there is a wide variety of types of agriculture there which differ in the level of capitalist development (I. M. Kuzina 1966). However, in order to reveal the socio-economic differences additional indices must be introduced into the group of social characteristics. Otherwise, according to the classification of the Commission, the most capitalistically developed state of the Corn Belt, Illinois, and the most backward state from an agricultural point of view, West Virginia, fall into one typological group.
Moreover it has become clear that in studying comparatively large territo-ries it is better to use the 10-type scale developed in 1974 for a number of variables. The large intervals on the five-figure scale of variables 1, 8, 9, 13, 18,
http://rcin.org.pl

World agriculture map 19
19, lead to vast areas being devoid of territorial differences. Finally, in our opinion, the number of specialisation variables needs to be extended. In the Commission's list (J. Kostrowicki 1974, 1976) there are only two such indices, making it possible to differentiate between the livestock breeding and crop growing branches without classifying the main crops and the main types of livestock.
For the purpose of further improvement of the methods of typological stu-dies on agriculture, we make the following suggestions:
(1) The group of social indices should be supplemented with variables cha-racterizing the level of development of capitalist relations in agriculture; (a) the percentage of farms using hired labour; (b) the percentage of hired labou-rers in the overall number of people employed in agriculture.
(2) Variable 17 (degree of commercialization) and variable 16 (productivity of labour) which were included in the production indices according to the 1976 version should be included in the same group of social attributes.
(3) Variables 13, 19, 20, 21, which reveal the structure of land utilization and the structure of the area under crops, should be included in the group of production attributes.
(4) It would be better to show the intensity of utilization of the cropland not as the proportion of the harvested land to the total arable land (variable 13 in the 1976 version) but with the help of a particular classification (1974 version): class I shifting farming, class 2 bush-fallow, class 3 three field fallow farming, class 4 full utilization of cropland, class 5 multi-cropping.
(5) Mechanical inclusion of double variables for the sake of balancing the type-forming influence of various groups of variables is not desirable.
(6) Groups of structural attributes showing the role of the main branches of commercial production (or the main production enterprises in a subsistence economy), should be extended.
(7) Intervals for the lower classes of variable 19 (the proportion of peren-nial crops to the tptal agricultural land), need to be decreased for example, from 10 per cent to 5 per cent for class 1.
(8) There should be envisaged in the codes of models, not just one value but an interval with two values of each variable in the code of models, i.e. the use of the 1974 version and not the 1976 version.
(9) A rule should be added about relating the territory to the model of a de-finite type with an indication that the code for the territory under study should have coinciding or similar values of the variables in all the four main groups of variables of the model code.
In elaborating a map of types of world agriculture for higher schools at Moscow State University it is proposed to use the Commission's system of typo-logical variables (1976 version) as the basis, but in a somewhat modified form, taking into account the above remarks. The authors consider that it is possible to give a more generalised common code of the type of agriculture, i.e.:
S T = -j C where S — social-economic attributes;
I — production intensity attributes of the method of agri-culture, uniting the groups of attributes O and P,
C — agricultural specialisation or the production orienta-tion in a subsistence economy.
The group of socio-economic attributes (S) includes 12 variables, 1-7, 16, and 17 of the 1976 version plus the variable 20 of the 1974 version (degree of spe-
2* http://rcin.org.pl

20 I. M. Kuzina, L. F. Yanvaryova
cialisation) and two new variables (the proportion of hired labourers to the overall number of those actively employed in agriculture, the proportion of holdings using hired labour to the total number of holdings).
The group of production intensity attributes includes 16 variables, 8-12 of the 1976 version, the variable 14 of the 1976 version or the variable 12 of the 1974 version, variables 19, 20, and 24 of the 1976 version, and five addi-tional variables (the percentage of industrial crops and all grain crops in-cluding wheat, corn and rice, of the entire sown area).
The group of structural attributes or specialisation atributes consists of 12 variables, 22 and 23 of the 1976 version, and ten new variables representing the share of the most important branches in commercial production (vegetable growing and horticulture, cotton growing, sugar cane growing, grain growing (wheat, rice), dairying, beef cattle breeding, and sheep breeding).
A typological classification should reflect three main aspects of agriculture i.e., the socio-economic structure, commercial specialisation (or the main orien-tation in subsistence production) and also the degree of intensity. In analysing each aspect a particular classification is used which is based on the above listed indices.
Accordingly, the legend of a map can be presented as a matrix-type table (Kuzina I. M., Yanvaryova L. F. 1976). The headings of the first input indicate the first rank division namely a socio-economic classification which characte-rises production relations in agriculture. The following main socio-economic groups of agricultural types have been identified:
(1) Pre-capitalist, subsistence and semi-subsistence, (a) tribal, communal; (b) peasant; (c) feudal (latifundias).
(2) Capitalist, commercial; (a) small-scale, (b) large-scale, including planta-tions, (c) developing along non-capitalist lines.
(3) Socialist, commercial; (a) developing with elements of pre-socialist rela-tions; (b) developed.
The other input contains subdivisions of the second level of classification which characterises production intensity (costs of production per unit area), farming and livestock breeding systems, and also other organisational techni-cal indices which do, first and foremost, reflect the development of productive forces. Here the particular classifications proposed by A. N. Rakitnikov (1972) are used. The following classifications are suggested: (A) Primitive, traditional agriculture
(1) food-gathering, hunting, fishing and primitive farming, (2) livestock grazing (nomadic and semi-nomadic), (3) livestock grazing with farming; (a) non-irrigated, (b) irrigated, (4) hoe farming; (a) shifting cultivation and fallow; (b) permanent non-
-irrigated; (c) permanent irrigated, (5) plough farming; (1) non-irrigated, (a) with poorly developed livestock
breeding, (b) with developed livestock breeding, (2) irrigated. (B) Developed commercial agriculture,
(1) grazing livestock breeding on natural pastures (livestock ranching), (2) grazing livestock breeding and farming, (a) non-irrigated, (b) irrigated, (3) extensive fallow farming, (4) intensive non-irrigated farming, (5) intensive non-irrigated farming with livestock breeding, (6) intensive irrigated farming; (a) horticulture and vegetable growing;
(b) other forms of farming, (7) intensive livestock breeding on the basis of improved pastures and
field forage.
http://rcin.org.pl

World agriculture map 21
Finally, the subdivision of the third level according to specialisation makes it possible to identify the following commercial branches (or the main cultures and types of livestock): (a) grain growing (wheat, rice, maize); (b) vegetable growing and horticulture; (c) sugar cane growing; (d) cotton growing; (e) pro-duction of other industrial crops in the temperate zone; (f) production of other tropical crops; (g) livestock breeding for meat (beef cattle, pigs, poultry); (h) meat-wool livestock breeding (cattle, camels, sheep, goats); (i) dairying.
Specialisation is shown in the squares of the table with the help of ad-ditional conventional signs.
All the three main groups of indices should appear consecutively in the classifications of agricultural types. The detailed system of classifying agri-cultural types suggested requires study of the primary statistics and literature by the administrative units of the first rank for most countries, for example, for the regions of the USSR, for the states of the USA., for the provinces of Canada and so forth. For a number of states, the administrative units of which cover very large areas, (USA., Canada, Australia, USSR and others) additional study of the territorial units of the second rank (county, township, district and so on) is also needed. Only in the case of small states the data for the country as a whole can be used.
The main sources of statistical information are the agricultural censuses, world-wide and by countries, which provide the fullest and most comparable data. However, the 1970 world census took in a comparatively small number of countries. Censuses of individual countries are usually taken every five or ten years in different years. Lack of a unified system makes research work very difficult.
Identification of types of agriculture on the basis of the indices suggested is an extremely labour-consuming task, especially if account is taken of the necessity of using conventional grain units and other coefficients and conven-tional units. Therefore this work can be done most efficiently with computers. The methods of identifying types of agriculture suggested by the Commission and accepted by the author, make it possible to render data processing comple-tely automatic right up to obtaining types.
The greatest problems arise in delimiting areas according to the types of agriculture, especially in insufficiently explored regions. Satellite photographs can help in this case. It is possible to form an idea of the specialisation of agriculture from the agrarian landscape, land utilisation, and the size and location of the fields. The "World Atlas of Agriculture" published in Italy (1969-1972) is helpful here. Boundaries will be defined precisely, using other types of maps, maps of the branches and types of agriculture.
Finally, we would like to say a few words about the mounting of maps. Two versions can be suggested. A qualitative background, the most impres-sive graphic means, can be used either to reflect the socio-economic type of agriculture or to show the economic systems of farming or livestock-breeding and the specialisation. In a map of the former version the three main colours will be used to depict the three main social groups of types i.e., socialist, capitalist and pre-capitalist. Production aspects will be shown by shading. This corresponds to the suggestion of the Commission on Agricultural Typolo-gy. In the latter version the production indices may be shown in colour, and the shaded background may be used to show the socio-economic indices.
http://rcin.org.pl

22 I. M. Kuzina, L. F. Yanvaryova
REFERENCES
Lenin V. I., Novye dannye o zakonakh razvitiya kapitalizma v zemledelii. Vypusk I. Kapitalizm i zemledeliye v Soyedinyonnykh Shtatakh Ameriki (New data on the laws of capitalism in agriculture, vol. 1. Capitalism and agriculture in the United States of America), Collected works, vol. 127.
Kostrowicki J., 1974, The typology of world agriculture. Principles, methods and model types, Warszawa.
Kostrowicki J., 1976, World types of agriculture, Warsaw. Kuzina I. M., 1966, Sotsialno-ekonomicheskaya karta selskogo khozaistva SShA
(Social and economic map of the agriculture of the USA), Vestnik Moskovskogo Universitieta, Geografiya, 1.
Kuzina I. M., Yanvaryova L. F., 1972, Sinteticheskiye karty selskovo khozaistva za rubezhom (Synthetic maps of agriculture abroad) in: Sinteticheskiye karty naseleniya i ekonomiki, Moskva, Moscow University Press, pp. 88-101.
Kuzina I. M., Yanvaryova L. F., 1976, World map of agriculture for higher schools. Problemy tipologii selskogo khozaistva. Vliyaniye agrarno-promyshlennoy, inte-gratsii na territorialnuyu organizatsiyu selskoi mestnosti (The problems of agri-cultural typology. The influence of agro-industrial integration on the territorial organisation of rural areas), in: XXIII International Geographical Congress, Summaries of reports, Moscow-Odessa, pp. 61-65.
Monti S., Ruocco D., 1976, Otsenka primenimosti typologii selskogo khozaistva, predlozhennoi Komissiei MGS k selskomu khozaistvu yuzhnoi Italii (Evaluation of the applicability of the agricultural typology proposed by the Commission of the International Geographical Union to the agriculture of Southern Italy), in: XXIII Mezhdunarodny Geograficheski Kongress, 6, Obshchaya ekonomiches-kaya geografiya, pp. 224-227.
Rakitnikov A. N., 1970, Geografiya selskogo khozaistwa. Problemy i metody issledo-vaniya (The geography of agriculture. Problems and methods of research), Moskva, Nauka.
Rakitnikov A. N., 1972, Kriterii i pokazateli tipologii selskogo khozaistva (The cri-teria and indices of agricultural typology, in: Aktualniye voprosy sovyetskoi geo-graficheskoi nauki, Moskva, Nauka.
Vanzetti C. (ed.), 1969-1972, World Atlas of Agriculture, Novara.
http://rcin.org.pl

GEOGRAPHIA POLONICA 40, 1979
D É V E L O P P E M E N T D E S É T U D E S S U R L A T Y P O L O G I E D E L ' A G R I -C U L T U R E E T L A P L A N I F I C A T I O N D E L A P R O D U C T I O N A G R I C O L E
A . N . RAKITNIKOV
Faculté de Géographie, Université de Moscou, URSS
La classification typologique de l'agriculture, n'étant pas un sujet nouveau pour les géographes, prend aujourd'hui un nouvel aspect, vu sa grande valeur pratique pour le progrès de la planification économique. En examinant les changements successifs des sujets et des méthodes de typologie agricole en URSS, on peut tirer les conclusions suivantes.
Il y a cinquante ans, dans de nombreuses publications concernant la typo-logie de l'agriculture, il était surtout question des critères et des indices de la •classification des exploitations et des régions agricoles (A. N. Tschelintzev, B. N. Knipovitch, G. A. Studensky, A. A. Kotov etc.) Outre l'élaboration des indices servant à caractériser la structure de l'agriculture ou le niveau d'inten-sité de l'agriculture et d'élevage, les efforts de ces auteurs étaient dirigés vers l'étude de la corrélation de divers indices, vers une recherche des procédés de délimitation des régions agricoles selon une combinaison des indices.
Plus tard, le développement de ces recherches ainsi que le propres de leur application pratique conduisirent à un rapprochement des points de vue sur les problèmes auparavant discutés. En même temps, des objectifs et des problè-mes nouveaux sont apparus qui nécessitaient l'élaboration de méthodes parti-culières qui leur correspondaient.
Une certaine identité de vues se forma. La plupart des auteurs partagent l'opinion que le classement des types régionaux de l'agriculture doit s'opérer selon les indices concernant: (1) la structure sociale; (2) la participation des exploitations dans la division spatiale du travail, c'est-à-dire leurs rapports avec l'économie nationale; (3) les modes de gestion des exploitations (du com-plexe de procédés d'utilisation du sol, de culture et d'élevage); (4) le niveau général d'intensité.
Il est évident que pour fonder des solutions pratiques de gestion et de planification de l'agriculture il est nécessaire de se servir de l'ensemble de ces différents critères.
Les principaux objectifs nouveaux qui s'imposerent au cours du dévelop-pement des recherches typologiques furent les suivants:
(1) Au cours du développement de l'économie socialiste, la planification (réalisée aux différents niveaux: de l'état, d'une région, d'une exploitation) devient un facteur de plus en plus déterminant de la formation des types de l'agriculture. La planification régionale est basée sur des concepts suivis par les services agricoles de la localisation optimale de diverses productions. Le géographe qui étudie les formes et les types de l'agriculture participe de ce fait au fondement scientifique de la planification régionale.
http://rcin.org.pl

24 A. N. Rakitnikov
(2) La valeur pratique que peut acquérir la délimitation des types de l'agri-culture (des régions agricoles) dépend du niveau de notre conception des facteur qui les forment. C'est pourquoi les services agricoles ont besoin non seulement de la division du pays par types d'agriculture, établis d'après les indices des exploitations, mais aussi d'une information sur les conditions écolo-giques et économiques, dans lesquelles ces types se développent. Aujourd'hui en URSS ils se servent le plus souvent des cartes intitulées "cartes des zones na-turelles et agricoles" (ou bien "naturelles et économiques"). En fait ce sont tantôt des cartes fondées sur les données de climatologie et de pédologie, tan-tôt des cartes représentant l'orientation de l'agriculture vers diverses produ-ctions.
(3) Le développement des études typologiques vers l'analyse des facteurs qui causent la différentiation spatiale de l'agriculture ne signifie pas que les caractéristiques des conditions naturelles, ainsi que celles du milieu écono-mique sont traitées comme critères de la typologie agricole. Cette typologie doit être fondée sur les caractéristiques de l'agriculture elle-même. Mais une étude concertée des formes de l'agriculture et du milieu est certainement néces-saire pour que les recherches soient dans leur application pratique fécondes. Au cours de pareilles recherches bilatérales, il fut reconnu que ces recherches sont nécessaires pour le progrès des études du milieu naturel lui-même. Pour savoir quels sont les facteurs du milieu naturel qui limitent la productivité agricole d'un terrain il faut disposer de données permettant d'analyser la réaction de l'agriculture aux diverses caractéristiques du milieu. Des études ainsi orientées amènent l'élaboration d'un système d'indices statistiques et de procédés de cartographie qui n'étaient pas utilisés auparavant, lorsque les études de géographie agraire et du milieu naturel étaient réalisés par des spécialistes comme sujets différents, qui ne dépendent pas l'un de l'autre. Pour délimiter les types du milieu il faut se servir d'un système d'indices rigoureux, concernant le climat, les caractéristiques du sol etc. Mais le choix de ces indices doit être motivé par leur importance par rapport à l'agriculture. Ce sont des indices d'écologie agraire et non pas de géographie physique tout simplement. L'importance relative de divers indices varie selon les plantes cultivées et les procédés technologiques. En agriculture, on n'utilise qu'une certaine partie des ressources potentielles du milieu naturel. Cette partie est plus ou moins grande selon le niveau technique et économique des exploita-tions. Aux divers degrés d'intensité de l'agriculture, dans divers types d'écono-mie rurale nous n'utilisons pas les mêmes éléments du milieu naturel.
Il s'ensuit inévitablement que la typologie du milieu naturel destinée à une utilisation pratique doit être orientée vers les formes de l'agriculture qui changent avec le temps et suivant le lieu. Conformément à ces changements doivent être choisis comme critères principaux des indices du climat, du fac-teur édaphique, du relief. Ainsi l'étude géographique des formes de l'agri-culture doit être considérée à son tour comme base d'une connaissance du caractère du milieu naturel, de la classification de ses types.
(4) Les études des rapports entre les types de l'agriculture et les types du milieu naturel sous l'aspect dont il était question contribuèrent au progrès de nos conceptions des causes des changements de la localisation des cultures et des productions animales au cours des différentes périodes historiques de l'évolution technique et économique de l'agriculture. Aux divers niveaux de cette évolution ce ne sont pas les mêmes facteurs du milieu naturel qui causent les différences spatiales dans la rentabilité des productions et par là dans la formation de différents types régionaux de l'économie rurale.
http://rcin.org.pl

Typologie de l'agriculture et planification 25
De même ces études concertées des types de l'agriculture et du milieu natu-rel servent de fondement aux prévisions à long terme des mutations des formes régionales de l'agriculture. Ces prévisions constructives ne sont pos-sibles que sur la base d'une connaissance de l'action des facteurs qui causent la différenciation régionale actuelle de l'agriculture et ses transformations historiques.
(5) Les efforts visant à la précision des nos idées sur l'interdépendance de l'agriculture et du milieu naturel amenèrent l'emploi de méthodes spéciales d'enregistrement et de cartographie de l'utilisation des terres et de l'élevage. L'emploi des indices statistiques dans les ouvrages de typologie agraire évolua vers des caractéristiques des procédés de culture, de bonification du sol, des assolements, des formes de l'élevage, de l'emploi de divers types d'affoura-gement. Furent élaborés des systèmes de classification des modes d'utilisation des terres correspondant aux buts des études en question, plus complexes que les classifications utilisées auparavant. Fut adoptée la notion de "type d'organi-sation du territoire agricole". Pour avoir des images cartographiques de l'utili-sation des terres à diverses échelles, comparables aux cartes topographiques, pédologiques, géobotaniques etc., on pratiqua des enquêtes auprès des exploi-tations. Divers types de nouvelles cartes furent dressées.
(6) Un autre problème qui n'attirait pas grande attention auparavant est actuellement objet de discussions: faut-il considérer les régions agricoles com-me aires dans lesquelles dominent des exploitations plus ou moins semblables, ou bien comme ensembles d'exploitations qui ont une structure et une orientation différentes, mais qui sont mutuellement unis par des liens économiques et pour cette raison forment un groupement spatial. L'importance de ce second aspect des études typologiques fut signalée pour la première fois dans les ouvrages de I. F. Moukomel, qui contribua beaucoup à l'étude des liens de production entre exploitations agricoles. Ce problème fut le sujet des ouvrages de K. I. Ivanov qui étudia la coopération des entreprises agricoles spécialisées dans divers stades du circuit de la production, ainsi que l'intégration agro-indu-strielle. Le progrès de la concentration et de la spécialisation de l'agriculture est cause d'un rapprochement des méthodes de production des entreprises agricoles et industrielles et du renforcement des liens qui les unissent. C'est pourquoi augmente l'importance de ces facteurs de la formation des types d'exploitations et des types de régions agricoles.
A cette analyse du développement des recherches en typologie agraire nous ajoutons quelques considérations concernant les pronostics de la structure régionale de l'agriculture en perspective. Ces considérations ne représentent que les conceptions de l'auteur de cet article.
En URSS depuis la réalisation du premier plan quinquennal et jusqu'aux années 1950 le facteur principal du progrès de la productivité de l'agriculture était la croissance de l'équipement technique et énergétique. Ce sont les régions des steppes qui en ont le plus profité, parce que c'est dans cette zone que la surface arable par rapport à la main d'oeuvre était la plus grande et qu'un accroissement considérable des rendements pouvait être obtenu par le perfec-tionnement des engins mécaniques et leur action sur le sol. Il en résultait un changement des rapports particuliers de rentabilité des exploitations agricoles entre les différentes zones et un certain déplacement du centre de gravité de la production agricole des zones d'un climat relativement plus humide et de sols acides vers la zone des steppes. Au cours de la période la plus récente le processus du développement technique de l'agriculture et de l'élevage devient plus complexe grâce au changement des objectifs, du caractère de la planifi-
http://rcin.org.pl

26 A. N. Rakitnikov
cation et d'un renforcement économique très important des exploitations agri-coles. L'approfondissement de la diversité des formes d'exploitation agricole dans les types du milieu naturel différents, leur spécialisation et la concentra-tion spatiale de la production acquièrent des traits particuliers grâce à l'inté-gration de la production agricole et industrielle, à l'essor de la coopération de production des établissements agricoles, à la rupture territoriale du circuit de la production qui auparavant s'accomplissait dans une même région et une même exploitation. 4
Par suite de l'intensification de la culture, les niveaux de rendement s'ac-croissent davantage dans les zones de climat relativement plus humide; dans des conditions hygrométriques semblables ils augmentent plus vite dans les régions plus favorisées quant aux conditions thermiques. Outre l'accroissement de l'importance économique des régions de climat humide on peut signaler le développement de ces régions principalement vers l'élevage intensif. L'on constate une augmentation du contraste des niveaux de rendement entre les terres irriguées et non irriguées. La distribution des cultures sur les terres irriguées et non irriguées évolue dans les directions suivantes. Dans les zones relativement humides la superficie des prairies irriguées augmente; dans la zone des steppes, c'est principalement la culture irriguée des céréales qui augmente, ainsi que des cultures fourragères et industrielles. Sur les terres irriguées des déserts et semi-déserts des régions méridionales à la culture du coton, des fruits et des légumes s'ajoute une grande extension des plantes fourragères.
Le progrès technique rend possible une spécialisation plus accentuée aux di-verses productions; il est cause de certains changements de motifs dans la combinaison des cultures et des productions animales. L'emploi des engrais chimiques, la bonification du sol provoquent en général une concentration spatiale plus avancée de certaines cultures. Dans les zones de climat relati-vement humide les assolements évoluent vers une intensification plus marquée. Il faut s'attendre à des transformations particulièrement considérables des types régionaux d'affouragement et d'élevage. Ce sujet exige un examen spé-cial.
En URSS la production de la viande et du lait a doublé aux cours de deux décennies. Auparavant l'élevage était basé à un grand degré sur les herbages naturels et les sous-produits des céréales et cultures industrielles, ce qui déter-minait principalement la localisation des régions ou l'élevage était le plus dé-veloppé. La dépendance de l'élevage vis-à-vis des conditions naturelles était alors relativement simple. Elle est plus compliquée aujourd'hui, puisque une partie prédominante de la récolte des plantes cultivées (près de 2/3) est destinée à servir de fourrage. En outre dans beaucoup de cas les rapports entre l'éle-vage et le milieu naturel ne se réalisent plus dans le cadre d'une même explo-itation: certaines parties du fourrage utilisé sont transportées d'autres régions. L'élevage et l'engraissage sont souvent exécutés en diverses exploitations.
La rentabilité de l'élevage dépend principalement: (1) des frais de produc-tion du fourrage, (2) de l'efficacité de la transformation des matières four-ragères en produits animaux.
Pour réduire au minimum les frais de production du fourrage il importe de localiser la production de chaque espèce de fourrage dans des régions dont les conditions naturelles et économiques sont les plus favorables. L'ensemble des ressources fourragères utilisées actuellement dans l'élevage comprend des herbages naturels et des plantes cultivées dont la localisation optimum est très différente. Cependant pour atteindre l'efficacité maximum de la transformation des matières fourragères en lait, viande ou autres produits, il est nécessaire de
http://rcin.org.pl

Typologie de l'agriculture et planification 27
prévoir, pour chaque région et chaque exploitation, des proportions déterminées entre ces diverses sources de fourrage, ainsi que leur succession suivant les saisons. Une certaine partie des matières fourragères utilisées (qui s'accroît par suite du progrès technique) subit une transformation industrielle et est trans-portée d'une exploitation vers une autre.
Les principaux moyens que l'on utilise pour obtenir une concordance des types d'affouragement et des formes de l'élevage sont les suivants: (1) le ter-ritoire de chaque exploitation comprend des terres servant à produire les dif-férentes espèces de fourrage nécessaire à l'élevage; (2) la période principale de la productivité du bétail (période de lactation, du gain de poids) est limitée par les conditions de la production du fourrage; (3) le bétail est entretenu suivant la saison dans diverses régions; (4) selon les conditions locales, certaines exploitations sont orientées vers l'élevage; les autres vers des cultures com-merçables; (5) l'élevage est spécialisé en différentes productions; (6) il est spécialisé en divers stades du circuit de la production; (7) diverses espèces de fourrage sont transportées d'une région à une autre.
Parmi ces moyens les deux premiers sont les traits distinctifs de l'époque quand l'élevage dans les régions cultivées avait une importance secondaire. Les moyens indiqués à la fin de cette liste (5, 6, 7) sont ceux dont l'importance augmente avec le progrès technique et qui causent des changements essentiels dans la structure et dans la localisation des types de l'agriculture.
Sur la carte schématique (Fig. 1) nous avons essayé de représenter, selon nos conceptions, les tendances du développement des types de l'agriculture en perspective qui nous paraissent les plus probables.
http://rcin.org.pl

http://rcin.org.pl

Fig. 1. Types de régions agricoles en perspective. I — Elevage à base de prairies naturelles. Terrains de peu d'étendue, dispersés parmi les espaces forestiers; 2a, 2b — Economie essentiellement
laitière évoluant vers les formes les plus intensives de l'élevage. Prairies cultivées, prairies naturelles, plantes fourragères. Pommes de terre, lin sur sols relativement plus fertiles. Dans la partie occidentale de cette région (2a) les plantes sarclées ont une plus grande importance, l 'agricul-ture intensive, l'élevage des porcs plus développé que dans la partie orientale (2b); 3 — Les productions principales sont les mêmes que dans la région précédente, mais la part des céréales dans les emblavures est plus grande, les assolements moins intensifs, les surfaces occupées par les prairies naturelles plus grandes; 4 — L'élevage et les cultures commerçables ont une importance à peu près égale. Assolement comprenant principale-ment céréales et cultures sarclées industrielles (essentiellement betterave à sucre). Elevage basé sur la culture de plantes fourragères. Grand développement de l'engraissage du gros bétail. Elevage de porcs, aviculture; 5 — Types d'exploitations semblables à la région précédente, sauf la culture de la betterave à sucre. Céréales, pommes de terre, chanvre, engraissage de gros bétail, élevage laitier, élevage de porcs; 6 — Agriculture principalement céréalière, emblavures de cultures intensives moins grandes. Elevage moins Intensif, superficie de prairies naturelles plus impor-tante; 7 — Exploitations orientées principalement vers les cultures commerçables. Assolement du type intensif. Céréales, plantes oléagineuses, cul-tures fourragères sarclées. Dans la partie méridionale de la région; viticulture, arboriculture fruitière. Elevage basé sur les produits de l'agricul-ture. Développement des réglons spécialisées en riziculture, en cultures maraîchères, fruitières, industrielles et fourragères grâce aux grands travaux d'irrigation; D — Economie céréalière (extensive), assolement à jachère libre sur les terres non irriguées. Culture intensive de céréales, plantes industrielles et fourragères sur les terres irriguées. Elevage basé principalement sur les produits de l'agriculture. Grandes exploitations d'engraissage de gros bétail, élevage de moutons à laine fine; 9 — Agriculture et élevage d'importance égaie. Culture de céréales; assolements à Jachère libre. Surfaces considérables de prairies naturelles, ainsi que pouvant être améliorées au moyen de drainage et de culture. Dévelop-pement de l'élevage du gros bétail plutôt vers la production de la viande, que vers la production laitière (contrairement aux tendances des périodes précédentes); 10 — Exploitations principalement agricoles, céréalières de type extenslf. Assolements à Jachère libre. Production de viande de boeuf et de mouton, de laine fine, basée sur les pâturages naturales de la steppe. Perspectives d'intensification dépendant des travaux d'irrigation; II — zone marginale du territoire cultivé. Terres arables de peu d'étendue contigties aux vastes pâturages. Elevage de moùtons et de gros bétail, culture des céréales et certaines plantes fourragères; 12 — Elevage de moutons à base de pâturages semi-désertiques. Les animaux passent selon la saison d'un type de pâturage à un autre. L'intensification de ce type d'exploitation a pour base la production sur les terres Irriguées du fourrage pouvant compléter la pâture, ainsi que l'engraissage sur les terres cultivées des animaux élevés dans les régions semi-désertiques.
Annexe à l'article A .N. Rakitnikov Geographia Polonica 40, 1979
http://rcin.org.pl

GEOGRAPHIA POLONICA 40, 1979
C A R T O G R A P H I C M E T H O D S F O R T H E I D E N T I F I C A T I O N O F P R O -D U C T I O N T Y P E S O F A G R I C U L T U R E
T . A . SOLOVTSOVA
Faculty of Geography, Moscow State University, USSR
In the modern practice of agricultural mapping in the USSR, the existing production types of agriculture are represented, territorially, by two kinds of maps. They are maps of production types of agricultural enterprises and maps of types of agricultural regions. The maps of types of agricultural regions are more widely spread both in our country and abroad. They give a generalized characterization of identified territories together with the main common fea-tures of agricultural production that these territories possess and particular type combinations of agricultural enterprises which are specific for each ter-ritory. Their compilation is based not only on generalized information regarding the types of agricultural enterprises in the region but also on a series of other maps (see further) whose compilation is, likewise, based on information about agricultural enterprises.
The study of agriculture, like any typological study, proceeds from a certain complex of criteria, the main being specialization of agricultural production, the intensity level, methods of production in the main branches of agriculture, i.e., farming and livestock breeding. Thus, characterization of production types of agriculture can be sufficiently complete and well founded only if based on a series of maps.
Peculiarities of the carthographical method allow spatial comparisons of different features of agriculture and permit to see their combinations. They make it possible to compare agricultural maps with those showing the depend-ence of production types on natural and economic factors.
The maps of agricultural types, agricultural regions as well as agricultural enterprises usually reflect one essential, in the conditions of our country, cha-racteristic of the type, namely functions of the identified areas in the national system of territorial division of labour, or their specialization as expressed by the combinations of the commercial branches of agriculture existing in one or another territory. Problems such as, how these branches are combined, what land use combination they are based on, what production links there exist be-tween the main branches of agriculture farming and livestock breeding and what methods of production they use are dealt with by other maps. They are maps of land use, maps of agricultural land utilization, maps of livestock bree-ding methods and forage base, maps of production types of individual agricul-tural enterprises, maps of intensity indices.
Let us consider the content of main maps. Compilation of land use maps is based on information obtained with the aid of air photographs, i.e., on visual characteristics. These data are used for drawing up land utilization
http://rcin.org.pl

30 T . A. Solovtsova
plans for individual agricultural enterprises and also for the registration of lands by the State according to a classification which is uniform for the entire country. In compiling land use maps methods of generalization that are used in passing from larger to smaller scales are of great importance. Preference should be given to those which produce the least distortion and offer the best possibilities in terms of the identification of interdependence between the nature of land use and the natural type of land. With regard to territories where the land use allotments, above all those of arable land, are sufficiently
Fig. 1. A Fragment of the Land Use Map Tracts of lands over 500 ha in size with inclusions of other types of lands to the extent of up
to 5 per cent, 1 — arable land, 2 — pasture land and hay meadows, 3 — forests Tracts with inclusions of other lands to the extent of from 5 to 25 per cent (total airea of tracts — over 500 ha, total area of inclusions — up to 100 ha), 4— pastures and hay meadows with inclusions of arable land, 5 — forests and open woodlands with inclusions of grasslands, 6 — forests with brushwood. Other lands, 7 — solonchaks, 8 — moss-and-lichen tundra (high hills) Combinations of lands, 9 —tracts of arable land 25-75 ha in size which alternate with ravines with overgrown slopes and gullies are used as grasslands and occupy up to 35 per cent of the total area (the combination is characteristic of meadow-steppe near-valley landscapes in hilly terrain), 10 — tracts of arable lands 25 to 50 ha in size, alternating with natural pasturelands, to the extent of 40-50 per cent (the combination is characteristic of forest-steppe landscapes with hilly rolling terrain), 11 — natural pastureland in valleys of large rivers, waterlogged, in combination with brushwood and swamps, up to 50 per cent, 12 — natural pastureland in combi-nation with forests (25-50 per cent) on valley slopes, 13 — natural pastureland in combination with open woodland Allotments of arable lands in the foothills and mountainous areas, 14 — 50 to 10 ha in size, 15 —100 to 500 ha in size Lands occupied by, 16 — human settlements, 17 — by state shelter belts, 18 — irrigation networks, 19 — ravines and gullies used as grassland for forage
production
http://rcin.org.pl

Cartographic methods 31
large as for example in the steppe zone, a slight generalization of contours is possible. In respect of territories where small contours of land use prevail it is desirable to give land use combinations. As an example there is given the legend of the land use map of the Altai Territory in Western Siberia whose area cuts across various natural zones. Large tracts of land put to various uses are shown by concrete contours. Characterization of arable land contains in this case the indication of size of crop rotation fields. Territories where land uses are identified with small contours and thus cannot be shown with the given map scale have to be identified in their various combinations (6 variants) together with their quantitative ratios and sizes of fields of arable land within the identified contours. (See Fig. 1).
Fig. 2. A fragment of the map 'Sizes of allotments of arable land' 1-4 — types of agricultural regions characterized by a different fragmentation of arable land
(for explanations see Table 1), 5 — lands included in the state forestland
The available land statistics allows for giving some additional characteris-tics of land put to various uses which can be of importance for the practice of agriculture such as the degree of fragmentation of arable land. This map shows the average size of arable fields, the number of the latter per 1,000 ha of arable land, irregularity of contours of tracts of arable land and other features. (See Fig. 2 and Table 1).
It is extremely important that characteristics of land use schemes should be as complete as possible because this kind of map represents a cartographic basis for maps of real agricultural land utilization.
As distinct from the land use maps, those of agricultural utilization of land are compiled on the basis of state economic statistics pertaining to indi-vidual agricultural enterprises. Besides use is made of materials of administra-
http://rcin.org.pl

32 T. A. Solovtsova
TABLE 1. Fragmentation of Arable Lands in Collective and State Farms
Indices of Fragmentation
c «J 22 T3
Arable lands | g ~ I - s 1 I I fe 1 c 1 of - I s a s | i 1 2
= 2 £ 's c c £ ^ j o agricultural enterprises « c « <s .2 c " " a n «
. £ 3 « «3«« 73 * 13 * i S ° JS o
2 2 J | 22 ° 3 s i - I s < "o I 2 ¿5 6 i3 S? £ 8 & Q c
1 — a single tract of land containing fields included in the crop rotation, fields are rectangular in shape 2 — several large tracts of lands, mainly rectangular in shape. Tracts contain fields included in crop rotation 3 — one or several large tracts of arable land of irre-gular shape in combination with small fields of various shape 4 — a large number of small allotments of arable land of various shape
over 200
100-200
less than 50
less than 25
less than 5
5-10
10-40
40-60
up to 5%
up to 5%
5-15%
15-70%
0.5 0.5-2
1-2 0.2-0.5
a) 0.5-1 2-3 b) 3-5
tive bodies, of data obtained in the course of surveys of typical farms which have been established on various types of soils and in various types of agri-cultural regions.
The maps of land utilization for agricultural purposes show the uses to which arable land and natural grassland are put in individual agricultural enterprises. Characterization of arable land is based on data regarding the ratios of land under various crops in rotations, regarding the use of fallow, fertilizers, land reclamation, peculiarities of agrotechnics, and so on.
As a result of processing primary data (many of them for a number of years), compiling a series of auxiliary collation maps and sketch maps and their generalization, there emerges a definite system of arable land utilization which is reflected in the legend.
Natural grassland is characterized on the maps of agricultural utilization of land according to its predominant use either for hay or grazing, and also to kinds of livestock, seasonal utilization and water supply availability. As an example the legend of the map of the territory of Northern Kazakhstan is given, (see Annexe 1). This is the main area of virgin soil reclamation, where this process has started only comparatively recently. The area is sparsely populated and the structure of production there is relatively simple. Only four types of arable land utilization can be identified in the area. Their specific features (crop patterns, crop sequences, agrotechnics) find reflection either in the peculi-arities of the soil cover (for example soils of different mechanical composition
http://rcin.org.pl

Annex to the article by T.A. Solovtsova Geographia Polonlca 40, 1979
Fig. 4. The Map of Types of Livestock Raising (Northern Kazakhstan) Types of livestock raising
Stall-cum-pasture feeding: 1 — stall-feeding period lasting over half a year for cattle and about a year for sheep. In the period of stall-feeding the main ingredients of livestock ration are crop products, silage, straw, hay and grain by-products for cattle; hay, straw, silage, grain and grain by-products for sheep. Animals are grazed on natural pasture and on stubble. Milk cows are also grazed on areas sown to forage crops and their ration is supplemented by grain and silage.
Pasture-cum-stall feeding (pasture period lasting over half a year for sheep and about half a year for cattle): 2a —grazing on natural pasture and on stubble. When cattle is stall-fed the main ingredients of a ration consist of crop products, silage, straw, grain and grain by-products with hay from native pasture making up a considerable share; for sheep hay from natural pastures with crop products (silage, grain and grain by-products) making up a considerable share, 2b — grazing on natural pasture. When animals are stall-fed their ration includes mainly hay from natural pastures with crop products (silage, straw, grain and grain by-products) making up a considerable share, 2c —grazing on natural pastures. When animals are stall-fed hay from natural pasture makes up a dominant share of their ration. The share of crop products is inconsiderable.
Pasture feeding. Sheep are maintained mainly on pastures while cattle — on pastures and in stalls, animals are grazed on natural pastures, 3a — when animals are stall-fed their ration is dominated by crop products with hay from natural pastures making up a considerable share, 3b — when animals are stall-fed hay from natural pastures makes a dominant share of their ration with a considerable amount of crop products, 3c —when animals are stall-fed hay from natural pastures makes up a dominant share of their ration while that of crop products is inconsiderable. Farms using pastures beyond their land utilization schemes, 4 — lands for summer grazing of cattle and winter grazing of horses, included In the state wood-land fund; 5 —lands of state fund and state farms (using their own pastures to a very small extent) used for summer grazing of livestock.
Orientations of seasonal livestock movement, 8 — young cattle, 7 — sheep, 8 — horses
http://rcin.org.pl

Cartographic methods 33
within the same soil zone are put to different uses) or in the period of time that has elapsed since the start of their reclamation (compared to land that have long since been reclaimed, and where the structure of production is distinguished by a higher degree of complexity the newly reclaimed lands are put to a different use) and also some other.
The most complete and concrete characteristics of land utilization are shown on maps of individual typical enterprises, which are compiled on the basis of field surveys. Such maps are compiled for various zones and agricultural regions of the territories under study. A larger scale of these maps allows for showing territorial organization in detail. Kinds of use of each type of agri-cultural land are put to (arable land, hay meadow, pasture meadow). It is also possible to show settlement patterns and at the same time to reveal to a grea-ter extent the interdependence between the use of land and type of soil or between the use of land economic conditions such as the proximity to economic centres, transportation network, and other. We give a specimen of the map of land utilization by one enterprise located in the area of pastoral livestock breeding in the desert steppe zone of Northern Kazakhstan (see Fig. 3). The map shows contours of pasteures which are used by various kinds of livestock, their seasonal utilization, also grazing cycles for some kinds of livestock (seasonal movements of livestock). The map of land used for grazing shows grazing areas, pastures used for hay-making, etc.
Thus, the map identifies the most significant features of the economy and provides a better insight into the interdependence between land uses and territorial organization of livestock breeding. At the same time it demonstrates the most pressing problems of local nature which await solution in the given type of economy. Thus, it appears that the actual use of pastures is far from conforming to the recommendations in this respect (based on the maps of grassland, on the nature of herbage) because, their use depends to a great extent on the proximity to watering places and stability of water supply in the latter. It also depends on the proximity to hay meadows (and respectively wintering sheds) and other conditions. As a result maximum stocking rate may be found on those pastures which being little suitable for summer grazing, have the advantage of lying close to watering places. On the other hand, shortage of the latter may be the reason why large tracts of pasture land more suitable for summer grazing are still little used or not used at all.
The most important features of livestock breeding in the given agricultural region, its forage base, the links between livestock breeding and farming find reflection on the map of management types in livestock breeding. This map shows, above all, extensive areas characterized by different periods of indoor and outdoor maintenance of major kinds of livestock while within these areas, it also presents differences with regard to the types of feeding livestock during indoor and outdoor periods, to the use of lands for grazing, the use of lands not included in the land utilization scheme in some season or other and di-rections of seasonal movement of livestock (see a specimen of such map Fig. 4).
The importance of natural grassland can be well illustrated by using the following indicators. One of them, which is widely used, refers to the area of natural grassland per head of livestock and it has a significant disadvantage in that it does not take account of productivity of grassland. Forage supply has to be characterized by another indicator. On the basis of the map of natural grassland which contains information on the productivity of pastures, one can calculate (taking into consideration daily feeding ratio per head of livestock) a possible length of grazing period for the given livestock population. To illus-trate the importance of hay from natural pastureland during the period of
3 Geographia Polonica http://rcin.org.pl
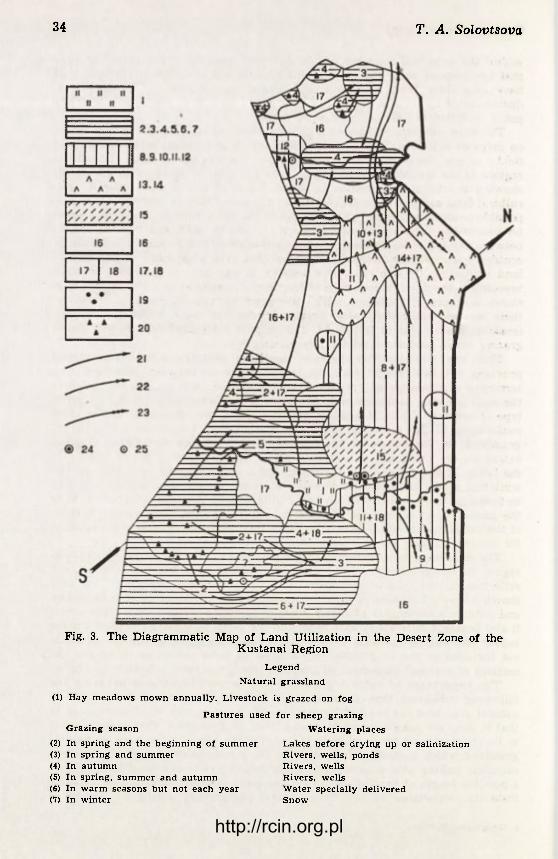
34 T. A. Solovtsova
Fig. 3. The Diagrammatic Map of Land Utilization in the Desert Zone of the Kustanai Region
Legend Natural grassland
(1) Hay meadows mown annually. Livestock is grazed on fog
Pastures used for sheep grazing Grazing season Watering places
(2) In spring and the beginning of summer Lakes before drying up or salinization (3) In spring and summer Rivers, wells, ponds (4) In autumn Rivers, wells (5) In spring, summer and autumn Rivers, wells (6) In warm seasons but not each year Water specially delivered (7) In winter Snow
http://rcin.org.pl

Cartographie methods 35
Pastures used for grazing cattle (8) In spring and the beginning Lakes, ponds before drying
Of summer up or salization (9) In spring and summer Rivers
(10) In summer and autumn Rivers (11) In autumn Rivers, wells (12) In spring, summer and autumn Rivers
Pastures used for horse grazing (13) In spring Rivers (14) In autumn and the beginning
of winter Rivers, snow
Pastures used for grazing livestock owned by workers and employees (15) In spring, summer and autumn Rivers, ponds (16) Pastures not used for grazing
Pastures used for bay-making (17) Selectively, every other or two years (steppe herbage) (18) Selectively, every other or two years (steppe herbage, with tracts of pastureland mown
annually) Winter locations for livestock
(19) Herds of cattle ' (20) Herds of sheep
Directions of seasonal movements of livestock (ZI) Sheep (22) Cattle (23) Horses
Note: directions of movement of cattle and sheep to winter locations are not shown
Permanent human settlements (24) Central estate (25) Estates of sections
indoor maintenance the indicator is used of quantity of hay produced on natu-ral pastureland by agricultural enterprises per hypothetical head of livestock and the period of time for which this quantity may be sufficient. Such indicator allows for making a quantitative assessment of the importance of natural grassland in terms of ensuring a sufficient supply of fodder both for indoor and outdoor maintenance periods.
A synthesis of all these materials may provide a sufficient basis for brea-king down the given territory into management types in the field of livestock breeding.
Maps pertaining to the management types applied in the main branches of agriculture also contain many qualitative characteristics, which find their quantitative expression in the general indicators of intensification, i.e., produc-tion cost, capital assets, gross or commercial volume of production per unit of agricultural area.
In order to identify the boundaries of agricultural regions a map of produc-tion types of individual agricultural enterprises is necessary. Maps of this kind as well as those of agricultural regions contain, in the main, characteristics of production orientation of individual enterprises, which however are supplemen-ted with some other information.
For example, the map of agricultural enterprises of Northern Kazakhstan contains a number of the following indicators: (1) production orientation (determined by the structure of commercial production), (2) differences in the level of intensity of production (cost of commercial products per ha of agri-cultural land), (3) social profile (state farms, collective farms, and other), (4) the scale of operation in terms of commercial production. Production orien-
3* http://rcin.org.pl

36 T. A. Solovtsova
tation is shown by two dominant branches which comprise a stable combina-tion and by auxiliary branches which have a subordinate function.
All these characteristics taken together point to the most important dif-ferences between types of agriculture and help to substantiate boundaries of agriculture regions. As an example the legend of the map of agricultural regions of Northern Kazakhstan is given (see Annexe 2). On this map the main types of agriculture are identified in their combination by major branches. Agricultural regions (3 regions) and subregions (over 10) are identified in accordance with differences with regard to the combination of the main bran-ches of agriculture or differences with regard to the composition of auxiliary branches.
To give a full picture of the types of agriculture, and for the appraisal of existing forms of agriculture use should be made also of their maps. These maps would characterize other aspects of agricultural production such as pro-ductivity of land and animals, productivity of labour, costs involved in the production of agricultural products, their primary cost and so on.
The most concrete expression of these features is shown in a series of maps which characterize individual branches of animal or crop production.
Annexe 1. Agricultural Land Utilization in Northern Kazakhstan Arable Land Predominant use Grain crops
Cultivation includes adoption of fallow, plowing without turning the soil and snow retention measures
(1) Wheat with some area sown to forage crops (2) Wheat with some area (15—30 per cent) sown to forage crops (3) Wheat with some area sown to forage crops on argillaceous soils; millet,
barley, oats and forage crops on sandy loam with some fallow (4) Wheat and millet with some area sown to forage crops (15—40 per cent)
with areas sown to annual crops and perennial grasses or set aside for fallow being arranged in strips
Areas under vegetable crops (5) On irrigated allotments over 50 ha in size
Natural pastureland (6) Areas set aside for hay-making
Pastures where mowing is carried out selectively Kinds of livestock Grazing seasons
(7) Cattle spring, summer, autumn (8) Cattle and sheep spring, summer, autumn (9) Cattle and horses summer
(10) Sheep and cattle spring, summer, autumn Horses all year round
(11) Sheep spring, summer, autumn and part of winter
Cattle spring, summer, autumn Horses all year round
(12) Sheep winter (13) Territories little used for grazing because of the shortage of watering
places
http://rcin.org.pl

Cartographic methods 37
Combinations of arable land and natural grassland (14) Predominance of arable land (15) Predominance of natural grassland
Woodland (16) Forests which are used for agricultural purposes little or not used at all (17) Small wooded areas used for hay-making and grazing, occupying about
half of the identified contour of lands used for agricultural purposes.
Annexe 2. Agricultural regions of Northern Kazakhstan
Region I. Grain production, beef-and-dairy and dairy-and-beef livestock breeding, pig breeding.
Subregions (1) Grain production, beef-and-dairy and dairy-and-beef cattle breeding,
f ine-wooled and semi-f ine-wooled sheep breeding and poultry breeding, but not everywhere.
(2) Dairy-and-beef cattle breeding, pig breeding, sheep breeding and poult-ry breeding not everywhere, grain production.
(3) Dairy-and-beef cattle breeding, pig breeding, grain production, vegetable growing, there are specialized state farms — pig breeding, poultry breeding and vegetable-cum-dairy.
(4) Grain production and livestock breeding on a small scale — beef-and--dairy cattle breeding, pig breeding.
Region II. Grain production, beef-cattle breeding, sheep breeding. Subregions (1) Grain production, beef-cattle breeding, semi-fine-wooled and semi-coarse-
-wooled sheep breeding, pig breeding. (2) Grain production, beef-cattle breeding, pig breeding, fine-wooled, semi-
-finerwooled and semi-coarse-wooled sheep breeding though not everywhere. (3) Grain production and livestock breeding on a small scale — beef-cattle
breeding, pig breeding, fine-wooled and semi-fine-wooled sheep breeding though not everywhere.
(4) Grain production and livestock breeding on a small scale. (5) Grain production, fine-wooled and semi-fine-wooled sheep breeding,
beef-cattle breeding. (6) Grain production, beef and dairy-and-beef-cattle breeding, fine-wooled
and semi-fine-wooled sheep breeding, pig breeding though not everywhere. (7) Grain production, fine-wooled, semi-fine-wooled and coarse-wooled sheep
breeding, beef-cattle breeding, horse breeding in droves. (8) Grain production, coarse-wooled sheep breeding, beef-cattle breeding,
horse breeding in droves. Region III. Coarse-wooled sheep breeding, beef-cattle breeding, horse bre-
eding in droves. Subregions (1) Coarse-wooled sheep breeding, beef-cattle breeding, horse breeding in
droves. (2) Coarse-wooled sheep breeding, horse breeding in droves.
http://rcin.org.pl

http://rcin.org.pl

GEOGRAPHIA POLONICA 40, 1979
C L A S S I F I C A T I O N O F T H E P R O D U C T I O N T Y P E S O F A G R I C U L T U R A L E N T E R P R I S E S
N . P . ISAYENKO
Ail-Union Research Institute of Agricultural Economics, Moscow, USSR
The whole history of the development of world agriculture has shown that definite production types of agricultural enterprises shape naturally under the effect of economic requirements and objective economic, social and natural conditions of agricultural production in different countries and natural and climatic zones.
Every production type embraces, as a rule, dozens and even hundreds of similar agricultural enterprises performing the same production functions and operating in analogous natural and economic conditions. It is clear that among the enterprises of each type there are economies that have been established completely and economies in the process of formation, there are advanced and backward economies as far as their indices are concerned. None the less all economies of one and the same production type are set up and manage their production on the same principles, standards and methods, i.e., the same general basis underlies them and they are shaped according to the same scheme or model.
The established production type of agricultural enterprises is usually cha-racterized by its common and rather stable features distinguishing it from eco-nomies of other types. But it does not mean that separate economies of the same type do not have any individual deviations. Neither should it be presu-med that the established production types are unchangeable. They are constant-ly improving in the very process of their development. But apart from such possible improvements within a given type, transformation of one type of economies into another under the influence of changed objective conditions of production cannot be excluded.
Thus, a production type of agricultural enterprises is an objectively existing reality which we must take into account when planning agriculture, distribu-ting branches and crops in the country, specialization, concentration and inten-sification of production.
Classification is an indispensable condition of any scientific research. Syste-matization and unification of production types by certain essential indices into related groups in zones and administrative units are a rather important stage of production typification.
Classification of production types of agricultural enterprises means grouping economies with regard to production conditions differing in the nature of func-tions performed by them in the general system of the social division of labour. It is designated to render aid in carrying out planning and prognostication of the development and distribution of agricultural enterprises and co-ordination
http://rcin.org.pl

40 N. P. Isayenko
of planned and account indices. Such classification makes it possible to carry out correct grouping of enterprises for scientific analysis of specialization and intereconomy relations. It makes indices comparable when evaluating economic efficiency of production activities of enterprises and of their co-operation or intereconomy relations.
Classification of agricultural enterprises will be most efficient if it is closely co-ordinated with the adopted zonal and administrative subdivision into mi-croregions and at the same time takes sufficient account of the natural division of various zones of the country into regions.
The zonal systems of the management of economy, worked out under the guidance of the Lenin All-Union Academy of Agricultural Sciences, have crea-ted a fundamental basis for the research of the distribution and characterization of production types, and also for the preparation of the starting point for their classification. But it should be noted that not in all zonal systems of the ma-nagement of economy the problems of typification have been sufficiently re-flected.
Economies belong to this or that type depending on how detailed the clas-sification is. The more types it singles out, the fewer nonbasic branches there are in every type and the smaller their share in the commodity produce. On the other hand fewer types we single out, the more diverse the composition of bran-ches in each of them.
Therefore from the very beginning of the work on the production typifica-tion of agricultural enterprises and classification of production types of collec-tive and state farms it is necessary to define how many crops and kinds of ani-mal production should be singled out as independent branches. There should also be elaborated a scientific criterion for determining optimum specialization on the basis of account of the number of branches subject for singling out within an economy when classifying production types. It is also necessary to keep in mind that each enterprise usually has one or two, rarely more basic commodity branches of crop growing or animal husbandry.
Natural conditions in which agricultural enterprises operate are substan-tially different not only within large economic regions but also within admini-strative regions (territories) and districts. Agroclimatic and soil-geographical di-vision into regions and also subdivision of the territory of the USSR into agri-cultural microregions are the most consummate form of taking account of agri-cultural resources.
Each production type of enterprises takes shape in certain production con-ditions, natural and economic, on the basis of relation and interdependence of three most important factors characterizing its peculiarities. They are, specia-lization, intensity and the size of production together with delimitation of ter-ritories of allocation and their interaction with objective natural conditions.
The production type is understood as an aggregate of enterprises of a given specialization (according to the structure of commodity production) situated in certain production conditions, natural and economic, and characterized by estab-lished sizes of production and intensity level.
A production agricultural enterprises, a collective farm, a state, farm and other state agricultural enterprises, is regarded as a classification unit.
Peculiarities of the structure of each production type of an agricultural enterprise are characterized by its parameters, which are measurable values comparable and repeated in similar conditions in collective and state farms. To these belong the system of structure indices, i.e. commodity production of branches and labour expenditures, agricultural land and sown area, basic funds and herd structure, and also groups of values reflecting the size of production,
http://rcin.org.pl

Classification of production types 41
enterprise or its production units and intensity of production, the present level of yielding capacity of agricultural crops and cattle productivity and the pros-pects of development.
The problem of enterprise type classification should not be considered only as a technical means to systematize branches and industries or as a simple se-lection and grouping of various kinds of end (or intermediate) agricultural pro-duce according to certain characteristics. Elaboration of a scientifically substan-tiated classification, the number of branches or crops to be singled out and the degree of their co-ordination are determined by the requirements of rational economic planning on the basis of establishing the most essential production relations and proportions between different crops and branches on the one hand and material and labour resources on the other. These numbers are necessary to set up an economically efficient enterprise as a whole, especially with taking account of the development of intereconomy relations and associations.
One of the most complicated and at the same time very important tasks in classifying the production types is the choice and co-ordination of indices in value and natural expression, so that it could be possible to determine the eco-nomic efficiency of branches, their intraeconomy proportions and intereconomy relations emerging in the process of reproduction.
Classification of production types of agricultural enterprises presupposes their systematic arrangement and distribution in accordance with economic and natural factors affecting the structure, size and level of agricultural pro-duction. As the basis of economy types classification there have been taken their branch characteristics with a further distribution of the types by classes, branch subclasses and zonal groups of agricultural enterprises types with due account of natural conditions of their distribution.
It should be remembered that this does not mean at all the inclusion of the indices of natural and economic conditions where agriculture is developing, into the number of typification characteristics of agricultural enterprises.
We also think it necessary to emphasize that one should avoid confusing the notion 'agriculture types' with the 'production types of agricultural enterprises'.
A classification of production types of agricultural enterprises must be stab-le for a long period. Its separate parts must gradually be filled by appropriate links along with a further division of labour in the national economy, intensi-fication of agricultural enterprises and creation of a new technical, i.e., indus-trial basis for individual branches and cultures.
On completing the work in a zone or a branch, the main indices for econo-mies of each type are included in classification tables. The selection of indices is limited by the permissible minimum of factors which characterize the main parameters of a given production type of enterprise.
Classification tables must contain recent information on the number and the main parameters of production types of economies in the country and their dis-tribution by natural zones and economic regions. Space must also be available for prospective newly arising production types which are only being created or will be created. Thus, the classification includes both the economies that are in the process of formation or have already been established, and rational eco-nomy types that are to be organized or developed in the future in the zonal or branch aspects.
The qualitatively new enterprises that are being created on an industrial basis must become an integral part of a single classification of the agricultural enterprises production types.
With deeper specialization and with a division of labour between individual agricultural enterprises within a territory, region or district, the problem arises
http://rcin.org.pl

42 N. P. Isayenko
of constant technological relations of individual types of specialized economic among themselves. In this way there are formed whole systems of interconnec-ted agricultural enterprises, for example, a breeding farm — a network of ri-productive farms — fattening farms in animal husbandry branches, operatirg on the basis of intereconomy co-operation. Possible technological relations bet-ween such types of agricultural enterprises can also be determined by classifi-cation tables.
The production type of an agricultural enterprise is determined by the share of one to four branches in the structure of commodity production. In the deno-mination of the production type of economies, branches are arranged in the o*-der of their share in the composition of commodity production. The denomina-tion is given after one or at the most two branches (crops or groups of crop?). The existence of a third or fourth branch or crop gives a denomination to a subtype.
Economies belonging to the same subtype, when sufficient in number, m&y be grouped in a different amount of groups, depending on the purpose of ana-lysis or research, e.g. by the level of production, provision with basic funds, etc. When a third and fourth branches or crops of a subtype are not prominent, it may be singled out by two or three kindred crops, for instance vegetables--and-potatoes or fruit-and-berries, or industrial crops like sugar beet, sunflo-wer or hemp, but belonging in the given zone to one and the same subclass of a branch.
Only those branches or commodity crops whose share in the commodity pro-duction is not less than ten per cent can be regarded as identifying the types or subtypes.
Since the structure of commodity production has been taken as the basis of singling out types and subtypes in a particular zone, economies of different departments and ministries may be referred to one and the same production type. A single production type may include collective and state farms, auxiliary enterprises and other production agricultural enterprises farms for growing medicinal and industrial raw materials, fruit-and-berry nurseries and mulberry nurseries, and so on.
The production designation of every agricultural enterprise production ty-pe is specifically expressed in the actual and prospective structure of commodi-ty production.
The following conditions of branch grouping have been adopted when clas-sifying production types of agricultural enterprises.
First of all agriculture as a whole is divided into two classes of branches, viz. crop growing (code number 100 000) and animal husbandry (code 200 000). The class of crop growing comprises five branch subclasses, and the class of animal husbandry — nine. Every subclass is given its own numerical code.
The five subclasses of crop growing include the following 25 branch orien-tations:
(1) grain farming (110 000) is subdivided into the following four orientation^ (a) grains (111 000), (b) rice (112 000), (c) soybeans (113 000) and (d) lupines (114 000),
(2) vegetable and potato growing (120 000), (a) vegetables (121 000), (b) pota-toes (122 000), (c) melons (123 000) and hotbed and hothouse crops (124 000),
(3) industrial and oil crops (130 000), (a) cotton (131 000), (b) flax and other fibre crops (132 000), (c) sugar beet, sugar cane and chicory (133 000), (d) tobacco and rustic tobacco (134 000), (e) aromatic oil crops (135 000), (f) drug crops (136 000) and (g) oil crops (137 000),
http://rcin.org.pl

Classification of production types 43
(4) perennial crops and floriculture (140 000), (a) fruits (141 000), (b) grapes (142 000), (c) citruses (143 000), (d) tea (144 000), (e) hop (145 000), (f) flowers (146 000), and berries (147 000),
(5) grassland farming (150 000), (a) irrigable (sowed) land (151 000), (b) allu-vial (natural) plains (152 000) and (c) rainfed or bogharic land (deserts, tundra and mountains) (153 000).
The class "animal husbandry" comprises nine branch subclasses, which con-tain 32 branch orientations:
(1) subclass cattle husbandry and deer raising (210 000) is comprised of six branch trends, (a) dairy and dairy-beef cattle breeding (211 000), (b) beef and beef-dairy cattle breeding (212 000), (c) yak breeding (213 000), (d) reindeer breeding (214 000), (e) maral breeding (215 000) and (f) buffalo breeding (216 000),
(2) sheep husbandry (220 000), (a) fine-wooled (221 000), (b) semi-fine-wooled (222 000), (c) mutton-wool-dairy (223 000), (d) sheepskin (224 000), (e) astrakhan lamb (225 000), (f) mutton-fat (thick dock) (226 000) and (g) goat breeding (227 000),
(3) horse breeding and camel breeding (230 000), (a) breeding of draught and race horses (231 000), (b) meat and dairy horse breeding (232 000) and (c) camel breeding (233 000),
(4) pig breeding (240 000), (a) fattening (241 000), and (b) reproductive (242 000),
(5) poultry breeding (250 000), (a) laying hen breeding (251 000), (b) meat chicken breeding (252 000), (c) turkey breeding (253 000), (d) geese breeding (254 000) and (e) duck breeding (255 000),
(6) fur farming and rabbit breeding (260 000), (a) fur farming (261 000) and (b) rabbit breeding (262 000),
(7) apiculture (270 000), (a) marketable honey (271 000), (b) beekeeping (272 000), and (c) honey-pollination and pollination-honey (273 000),
(8) sericulture (280 000), (a) silkworm breeding (281 000) and (b) mulberry growing (282 000),
(9) pisciculture (290 000), (a) pond-fish breeding (291 000) and (b) fish nurse-ries (hatcheries) (292 000).
In the USSR there are, according to this classification with economies in the process of formation taken account of, over 670 production types of agricul-tural enterprises. More than half of them are rare types usually comprising one or several economies. There are quite a number of narrow specialized one--branch enterprises which are increasing in number. However specialization of a vast majority of state and collective farms is nowadays determined by not one but two or three most important basic branches which for technological or organizational reasons are characteristic for a given enterprise type.
The notion 'subclass of branches' includes an independent branch or a group of kindied branches, i.e. crops. For example, the subclass 'vegetable and potato growing', besides the group of vegetable crops of open and glass-covered ground, includes potato and melon growing. The subclass 'cattle husbandry and deer raising', besides dairy and beef cattle breeding, includes yak breeding, reindeer breeding, maral breeding, buffalo breeding etc.
The notion branch orientation usually includes a homogeneous group of crops or animals with the same purpose or designation where production is si-milar ir. technology, organization of the process, implements of labour and may be a leading branch in certain types of enterprises.
Crops that are included in branch orientation may often be cultivated in different natural geographical zones, but their designation may be similar. As
http://rcin.org.pl

44 N. P. Isayenko
example we can name tobacco and rustic tobacco (134 000) or flax, hemp and other fibre crops (132 000), the melon production orientation, i.e., muskmelons, watermelons (123 000), fruit growing, i.e., apple-trees, pear-trees, plum-trees, cherry-trees, apricot-trees (141 000) and so on.
As noted above, we have adopted a six digit system of classification, in which the first digit stands for a class of a branch, the second digit stands for 'a subclass of a branch', and the third for a branch orientation. A branch orien-tation unites production types into a group where the given branch becomes the leading one in the commodity production structure. Each orientation is repre-sented by a group of production types which are distributed in a certain amo-unt of natural zones and are designated in the classification system through the fourth digit.
The shaping of zones is mainly based on soil and climatic conditions, though at the same time due account is taken of economic factors, which are to a cer-tain extent connected with natural conditions.
The system and the structure of indices applied for zoning are changeable depending on the main requirements of a given branch with respect to produc-tion conditions. As a result the number of zones where a branch orientation is allocated, i.e., the actual areal of its distribution, in accordance with the possi-bility of adaptation to different natural conditions, and also depending on eco-nomic requirements is different for different branches. For instance, the culti-vation of vegetable crops, in particular in greenhouse conditions in the severe climate of the northern districts of the Tumen region, is dictated exclusively by the necessity of their production in the areas where mineral oil and gas are extracted.
A production type of an enterprise is usually allocated in a certain natural economic microzone of a geographical zone. Such distribution is characteristic of the majority of types.
Production types organized on an industrial basis are an exception. Many of these are intrazonal.
Separate production types designated with the fifth digit in the classifica-tion system have a certain amount of subtypes which are designated with the sixth digit.
The number of natural zones and their sizes are determined on the basis of a system of characteristics such as agroclimatic belts and subbelts, the sum t > 10°C, duration of the main vegetative stage with T° over 10°C and the number of days of the frost-free period, agroclimatic zones, the annual index of moistening and the total precipitations, the severity of winter and the amount of snow-falls, the main types of soils, the share of arable land in agricultural land, etc. They also depend on the branch, i.e., crop distribution areal. Thus, for example, the zones of distributing the grain types of enterprises have been de-termined mainly according to the actual areals of their distribution established under the influence of the severity and snow-falls of winters, total precipita-tions and the moistening indices, temperature sums and the duration of the growing season, etc., which all together have determined the creation of the five grain zones.
While in the subclass 'grain economy' the grain and rice orientations have five zones each, the soya orientation has only two (the Far-Eastern territory and the south of the European part of the USSR) and the lupine orientation has only one zone. In the subclass 'cattle husbandry', the economies of the dairy and dairy-beef orientation are distributed in nine zones, those of the beef and beef-dairy orientations in six zones, of yak breeding in one, reindeer breeding in three, maral breeding in one and buffalo breeding also in one zone.
http://rcin.org.pl

Classification of production types 45
In conclusion it should be noted that the process of research, when working out prospective parameters of production types, usually consists of three stages:
(a) analysis of the production structure of individual economies and accumu-lation of mass data on the groups of economies of the same type that are actu-ally being established in a given administrative unit or zone,
(b) systematization and generalization of material, and grouping of enter-prises in types,
(c) working out of new types and their prospective parameters and deter-mination of the role and place of every type in the social production of the zone or administrative unit.
Out of the total number of over 670 enterprises actually existing and stipu-lated by the classification types, prospective parameters have already been elaborated by 45 research institutes and educational establishments for 380 ty-pes which are the commonest or newly formed ones.
Besides there have been elaborated prospective parameters of rational orga-nization of poultry farms, pig breeding complexes, complex mechanized sheep breeding farms and hothouse combines, which are being created on an indu-strial basis and may form separate enterprises or component parts (basic or supplementary) of an enterprise.
Classification of production types of agricultural enterprises makes it pos-sible to specify not only the number of types and their features but also loca-tion and distribution of economies in them. All this provides a scientific basis for working out and adopting typical solutions and will make it possible to de-termine much more reliably the prospects of development and the necessary material and technical basis for rational organization of economic activities of an enterprise.
http://rcin.org.pl

http://rcin.org.pl

GEOGRAPHIA POLO NIC A 40, 1979
T H E T E R R I T O R I A L O R G A N I Z A T I O N O F A G R I C U L T U R E I N T H E U R A L S K P R O V I N C E
A . Y u . P A R F E N O V A
Teachers' Training College, Uralsk, USSR
T Y P E S O F A G R I C U L T U R A L E N T E R P R I S E S A N D R E G I O N S
T h e typological classification of agriculture includes the elaboration of the production types of agricultural enterprises, the combination of which forms agricultural regions. T h e typological classification of collective and state farms is built upon the basis of the identification of production specialisation, farming methods which are identified on the basis of working up mass statistics data,
Fig. 1. Produc t i on types of co l lect ive and state f a r m s 1 — Grain farming and beef-and-dairy cattle raising, la — with pig breeding, 2 — Grain farming and beef-cattle raising, 3 — Grain farming, fine-fleece sheep breeding and beef cattle raising, 4 — Fine-fleece sheep breeding, beef-cattle raising and grain farming, 5 — Beef-cattle raising and grain farming, 6 — Fine-fleece sheep breeding and beef-cattle raising, 6a — with horse breeding, 7 — Fine-fleece sheep breeding and horse breeding, 8 — Semi-fine-wooled sheep breeding and beef-cattle raising, 9 — Coarse-wooled (astrakhan) and semi-fine-wooled sheep breeding, beef-cattle raising, 10 — Semi-fine-wooled sheep breeding, 11 — Dairy-and-beef cattle raising, vegetable and fruit growing, 12 — Cattle fattening, 13 — Pig fattening, 14 — Pedigree cattle breeding, 15 — Pedigree sheep breeding state farms, 16 — Poultry factory, 17 — Ex-
perimental hop growing for the long-term use of the Guriev province
http://rcin.org.pl

48 A. Yu. Parfenova
as well as on the materials of a selective investigation on land utilization and the form of territory organisation.
In the territory under review 17 production types and subtypes of agri-cultural enterprises were discerned, (see Fig. 1).
The first ten types were dominant, naturally mixing with each other where they go over from one natural zone or subzone into another. The remaining seven types (cattle fattening, pedigree cattle breeding and so forth) are repre-sented by individual enterprises which are formed as a result of the stage by stage specialization and inter-farm cooperation.
The types of agricultural enterprises differ in the composition of their main branches of crop growing and livestock breeding, and the subtypes dif-fer in the composition of the subsidiary branches.
An analysis of the location of the production types of enterprises with regard to the natural zones and regions shows that the ratio of crop growing to livestock breeding enterprises changes in connection both with the soil and climatic conditions and also with the local lithological and geomorpholo-gical features of the territory.
The most substantial differences in farming specialisation can be seen between the northern part of the region which is occupied by the heights of the Obshchi Syrt and the Priural plateau and the southern part with the primary plain of the Caspian area.
In the Syrt part of the province within the subzone of moderately arid steppe with the dark chestnut soils which in a high proportion are used as arable land, relatively more intensive grain-stock raising enterprises predo-minate with grain farming being a principal element of the production type.
In the area where the Syrts change over into the plain, livestock breeding acquires more commercial value. Here enterprises where sheep and cattle breeding is combined with grain growing predominate.
Within the plain near the Caspian Sea which is characterised by arid step-pe, semi-desert and desert landscapes, the main element of the production type is livestock breeding in various combinations of sheep breeding (primarily fine-fleece and semi-fine-wooled, more rarely coarse-wooled) and beef-cattle breeding. Grain farming of commercial significance, is a subsidiary branch only in the Ural-Verkhnekushum semi-arid natural area where crop growing in the depressions is extensively developed. Of the subsidiary branches of agriculture commercial horse breeding is developed in the semi-arid and desert zones. It is concentrated to a large extent in holdings situated on the massifs of the Urdin sands.
The correlations of branches of sheep breeding and cattle breeding within the plain changes more or less substantially depending on the irrigation of the native grazing lands and the possibilities of preparing fodder for the stall period. In the regions where depressions are most common, i.e., Torgun-Urdin and Uzen semidesert plains, and also in the holdings located in the zone of the Ural-Kushum irrigation system beef-cattle breeding becomes more impor-tant.
Poor irrigation of pastures within the Chizhin-Dyur in the arid steppe region leads to a sharp drop in the significance of commercial livestock bre-eding (10 types). On state farms of that type beef-cattle breeding amounts to about 10-15 per cent in the structure of the commercial production.
Where territorial differences in the degree of intensity of agriculture are most pronounced, i.e., when the proportion of grain in commercial production changes markedly in different summers, then in delimiting the agricultural
http://rcin.org.pl

Agriculture in the Uralsk Province 49
regions, there were used technical and economic indices which reflect the methods of farming and also the special features of territorial organisation.
The differentiation in systems of farming in the modern holdings is poorly expressed. Crop rotation with high proportion of cereals with other cultivated crops, mainly maize for silage and perennial grasses are characteristic with a large part of areas laying bare fallow.
In the methods of livestock breeding and the organisation of the fodder basis territorial differences are much more considerable, especially where the steppe zone changes over into the semidesert and desert zones. In the subzone of the moderately arid steppe and in the northern part of the arid steppe livestock breeding is primarily based on field fodder production, when 60-70 per cent of stall fodder is produced by local farming. Concentrated fodder is the most important. In the grazing period, owing to the poor supply of native grazing lands, the livestock are given additional, green fodder.
In the semidesert and desert zones livestock breeding is primarily based on pasture resources. Hay from natural hayfields predominates in the composition of the stall fodder, and the proportion of concentrated, mainly purchased fodder is considerably lower.
The system of farming and the differences in the methods of animal bre-eding depend markedly on the degree of intensity of agriculture where farming changes from sheep and cattle breeding to sheep and cattle breeding-grain growing and grain-and-stock raising types of holdings.
In the semidesert and desert zones where there is a predominance of cattle breeding on grazing on natural pasture, its cost is 10—20 roubles of the basic production fund and from 5 to 15 roubles of all the production inputs per
Fig. 2. Agricultural regions 1 — Grain farming, beef-and-dairy cattle raising and pig breeding, 2 — Grain farming, beer--and-dairy cattle raising, 3 — Grain farming, fine-fleece sheep breeding and beef-cattle raising, 4 — Fine-fleece sheep breeding, beef-cattle raising and grain farming, 5a — Fine-fleece sheep--breeding and beef-cattle raising, 5b — Fine fleece sheep breeding and beef-cattle raising with horse breeding, 6 — Semi-fine-wooled and coarse-wooled (astrakhan) sheep breeding, beef-cattle
raising, 7 — Semi-fine-wooled sheep breeding
4 Geographia Polonica http://rcin.org.pl

TABLE 1. Basic statistical indices for agricultural regions of the Uralsk Province (1970-1971)
Agricultural regions and subregions
Region 1 59,0 103.0 3.6 45.0 31.0 12.5 3.0 12.5 — 10.6 3.9 43.6 4.8 Region 2 56.0 60.8 1.8 56.2 28.9 6.4 7.8 4.6 — 8.7 4.9 72.6 5.4 Region 3 31.0 51.0 0.9 47.7 21.0 3.0 24.0 1.0 — 6.1 11.3 144.7 5.0 Region 4 18.0 26.8 0.9 25.3 26.4 0.6 48.5 0.3 — 5.6 14.6 184.0 4.5 Region 5 6.0 17.9 0.4 4.3 30.2 0.3 54.1 — 5.4 5.9 15.7 401.1 5.2 Subregion 5a 8.0 23.8 0.5 4.4 32.7 0.3 52.5 — 2.8 6.3 14.7 271.2 5.4 Subregion 5b 3.0 11.5 0.4 0.3 23.6 0.1 58.0 — 10.5 5.5 17.6 369.0 4.8 Region 6 2.8 14.0 0.6 2.2 23.8 0.2 60.2 — 30.0 4.8 20.4 301.1 4.2 Region 7 6.0 18.0 0.6 9.9 10.3 0.1 69.6 — — 6.4 14.6 264.5 5.6
Share of
arables in total
area
Input per ha of agricultural land
from main funds
(roubles)
labour inputs
Share of individual branches of commercial production
grain crop
(mandays) growing
dairy cattle cattle
breeding breed-ing
sheep pig breed- breed-
ing ing
horse breed-
ing
Heads of cattle
per 100 ha of agricul-tural land
Native grazing lands
per head of cattle (in ha)
Labour input per worker
cost of principal
agricultural means of lands (ha) production
(1,000 roubles)
http://rcin.org.pl

Agriculture in the Uralsk Province 51
hectare of agricultural land. In the subzone of arid steppe the indices of inten-sity of agriculture increase twofold, and in the subzone of moderately arid step-pe the rise is more than fourfold as compared with the semidesert zone.
An analysis of the localization of the production types of collective farms and state farms (Fig. 1), of the methods of farming and the peculiar features of the territorial organization facilitates identification of the agricultural re-gions, the distribution of which is shown in the map (Fig. 2), and the main indices are given in Table 1.
THE TERRITORIAL DIFFERENCES IN THE EFFECTIVENESS OF THE MAIN BRANCHES OF AGRICULTURE
It is important for the rational territorial organization of agriculture to reveal the comparative effectiveness of the main branches of agriculture in various types of natural environment.
The general law governing the changes in the effectiveness of grain gro-wing may be formulated in the following way. Grain growing becomes gradual-ly less effective where the subzone of arid steppe changes over into the zone of semi-desert. This observation depends primarily on the lower yields of grain crops in this orientation (Table 2).
The effectiveness of grain production also changes within the main natural zones under the influence of the landscape peculiarities of the territory. The highest effectiveness in grain production is characteristic of those natural regions of the subzone of moderately arid and zone of arid steppe where litho-logical, soil and geomorphological factors bring about the optimal physical and chemical composition of the soil and the best moisture conditions.
Territorial differences in the effectiveness of the branches of livestock bre-eding are determined to a considerable extent by the composition of the fodder base and by the system of livestock breeding which have taken shape in the different natural zones and regions.
A certain drop in the effectiveness of livestock breeding in the regions where there is most ploughed-up land is brought about by the considerable growth in production expenditure (especially expenditure on fodder) per head of both cattle and sheep in connection with the small supply of pasture forage nad the growing importance of field forage production (Table 2). The effecti-veness of sheep breeding and beef-cattle breeding rises markedly in the lands where livestock breeding is based to a considerable extent on the grazing resources of the semidesert zone and where the necessary additional indoor fodder is available.
Higher effectiveness of sheep breeding and beef-cattle breeding in the western, right-bank, parts of the semi-desert and desert zones is explained by the extensive depressions there with the productive meadow vegetation, where selective farming is used in preparing hay. All this makes the necessary combination of pasture and stall forage possible.
A comparison of the effectiveness of the main age groups of beef-cattle al-lows us to draw the conclusion that in farmed areas cattle fattening is econo-mically more efficient in comparison with rearing the young, while cattle fattening is little justified economically in the semi-desert and desert zones.
Dairy-cattle breeding is characterized by the limited area of its distribution and is concentrated primarily in the subzone of moderately arid steppe. Relative-ly higher concentrations of dairy-cattle raising have taken shape near the town of Uralsk, although the share of milk is less than one third of the value of the entire commercial agricultural production of the more specialised state farms.
4* http://rcin.org.pl

TABLE .2. Productivity, production inputs and the cost in the principal types of agricultural production en to
Zones, subzoncs, regions
Grain yield
Grain crops
All
Beef-cattle raising , All pro- Cost of Average K
Cost of a n n u a | duction 1 quintal Allinpustt of per head
Sheep breeding
inputs 1 quintal g a J n j n inputs per (per ha) p c r h a o f g r a i n weight h e a d o f w e i g h t o f c a t t l e
(roubles) (roubles) ^ ^ cattle gained (roubles)
(roubles) (roubles)
Steppe zone Subzone of moderately-arid steppe with dark chestnut soils
In various natural regions (from-to) 7.0-11.4 46-56 4.6-5.8 91-200 147-271 113-160 23-34
On average according to sub-zone 10.5 54.0
Average Cost of Average annual 1 quintal annual wool weight of weight yield from gain gain one sheep (kg) (roubles) (kg)
5.6 170 212 123 25
Subzone of arid steppe with chestnut soils In different natural regions
(from-to) 5.1-7.0 35-55 On average according to
subzone 6.2 45
5.9-8.5 57-120 96-120 101-166 20-23
7.2 100 109 110 22
Zone of semidesert with light chestnut soils In different natural regions
(from-to) 1.6-2.9 30-34 7.4-16.5 78-121 On average accordi ng t o zone 2.4
In different natural regions (from-to) 0.8
On average according to zone 0.8
32
24
24
11.5
10.2
10.2
98 99-139
113 100-135 15-22
114 19 Desert zone with brown soils
98-100 91-115 92-115 14-23
99 95 100 20
.0 71
5-7 6
4-7
49-56 52
51-68
54
Cost of 1 quintal of wool (roubles)
4-10 61-75 2.9-3.i
3.4
6-11 31-91 2.6-3.6
9 49 3.3
2.6-4.0 3.4
3.0-3.2
3
382-514
412
345-382
366
337-374 337
318-446
854
£ p
s O <5 P http://rcin.org.pl

Agriculture in the Uralsk Province 53
WAYS OF IMPROVING LAND UTILIZATION AND SPECIALIZATION IN AGRI-CULTURE
The study of the type of land utilization that has taken shape as well as the study of the differences in the effectiveness of the principal forms of agri-cultural production and also of the peculiarities of the organisation of the fodder base for livestock breeding in the various natural zones of the territory under study makes it possible to select ways of improving the territorial organization of agricultural production.
In the first place the basis of the optimal condition of crop growing and livestock breeding is needed with the rational utilization of land in the prin-cipal types of natural environment. Fuller use of the natural resources is con-nected with the completion of the irrigation system linking the Volga-Ural canal and the river Ural.
In the steppe zone and particularly in the subzone of moderately arid steppe (1 and 2 agricultural regions) the improvement in land utilization should be directed at the increased stability of grain growing which remains there the principal element of production types of agricultural enterprises (Fig. 3). In the process of improvement of the farming system in the arid regions with unstable moisture conditions the significance of bare fallow land has been heightened in order to raise the effectiveness of grain growing.
The level of development of livestock breeding in the intensively farmed lands of the subzone of moderately arid steppe and in the left-bank part of the subzone of arid steppe must be determined by the amount of the pasture resour-ces and the indoor fodder, obtained in the crop rotation, which should above all
Fig. 3. Future Agricultural Regions in the Uralsk Province 1 — Grain farming, beef-and-dairy cattle raising, pig breeding, 2 — Grain farming, beef-cattle raising, 3 — Grain farming, beef-cattle raising, fine-fleece sheep breeding, 4 — Beef-cattle raising, fine-fleece sheep breeding, 5a — Fine-fleece sheep breeding, beef-cattle raising, 5b — Fine-fleece sheep breeding, beef-cattle raising, horse breeding, 6a — Coarse wooled (astrakhan) sheep breeding and mutton-grease sheep breeding, 6b — Coarse-wooled (astrakhan) and mutton-
-grease sheep breeding, beef-cattle raising
http://rcin.org.pl

54 A. Yu. Parfenova
supply the production of commercial grain. From among all livestock breeding branches the development of beef-cattle breeding is there primarily expedient. The degree of development of dairy-cattle raising should be subordinated to the aims of satisfying the local needs of the urban population.
Thus, changes in the proportion of crop growing and livestock breeding in the direction indicated above make it possible to increase the production of commercial grain in the future in areas where grain growing is most efficient.
In the right-bank part of the subzone of arid steppe, in the semidesert and desert zones it is expedient to increase, in the future, the concentration of beef-cattle breeding and sheep breeding on the basis of fuller utilization of the pasture resources and an increase in the productivity of the hayfields when the Volga-Ural irrigation system begins to function.
Livestock breeding in poorly developed farm regions remains the basis on which agriculture will develop in the future, too. At the same time the ratio between the number of cattle and sheep would change somewhat in the direc-tion of increasing the significance of beef-cattle breeding. This is expedient first and foremost from the point of view of the rational utilization both of the natural fodder resources, and of additional field forage obtained from the local subsidiary farming. Regions with depressions are best suited for the development of beef-cattle breeding. There the favourable conditions for sum-mer pastures are supplemented by the local resources of stall fodder produc-tion.
In the regions of the semi-desert and desert zones where the officiency of wool production is low, it is expedient to intensify, in the future, the develop-ment of astrakhan and fat tailed sheep breeding and also horse breeding.
Examination of the efficiency of beef-cattle breeding, comparing two groups of cattle (cows and calves and adult cattle for fattening) has allowed us to draw the conclusion that the more rational utilization of native grazing lands and the greater efficiency of fattening are expedient to raise the efficiency of beef-cat-tle breeding. This, in turn, will also facilitate the concentration of fattening the young cattle in the pasture regions, and fattening in the developed farming regions of the subzone of moderately arid steppe on large cattle fattening holdings.
Thus, for the foundation of the optimal territorial organization of agricultu-re both the zonal and the intrazonal peculiarities of the territory must be ta-ken into account.
http://rcin.org.pl

GEOGRAPHIA POLONICA 40, 1979
P R O D U C T I O N T Y P E S O F F A R M S A N D A G R I C U L T U R A L Z O N I N G I N T H E O D E S S A P R O V I N C E
11. F . MUKOMEL,1 K . E. POVITCHANNAYA, S. V . STETSENKO
Faculty of Geography and Geology, Odessa University, USSR
An important premise for raising the productivity of agriculture is that all kinds of territorial conditions, both natural and economic, as well as further improvement of agricultural territorial organization with the formation of agro--industrial production complexes (AIPC) should be taken into consideration.
In this connection it is especially vital to study in detail both the territorial differentiation of the agricultural natural and economic conditions and the peculiarities of production within the boundaries of a region which is the basic unit in the territorial planning of national economy in the USSR.
The Chair of Economic Geography of the Odessa State University has amassed comprehensive information on agriculture of the Odessa region (about 500 farms). This information served as the basis for the Atlas of Agriculture of the Odessa Region. Basides the Chair of Economic Geograpy, the Chairs of Physical Geography, of Pedology and of Pedogeography of the Geological and Geographical Department of the Odessa State University participated in its compilation. This Atlas comprises 7 sections with the total number of maps amounting to 120. It reflects the combination of natural, social and economic conditions of agriculture in the Odessa region, its contemporary state and territorial zoning.
The Chair of Economic Geography of the Odessa State University, under the guidance of the late Professor I. F. Mukomel, has elaborated methods of distinguishing the farm types and agricultural zoning in the Odessa region. The data on farm typology and agricultural zoning of the Odessa region were later used to create special synthetic maps for the Atlas of Agriculture.
The theoretical basis for the regional investigation of agriculture and for the creation of the Atlas of Agriculture of the Odessa Region was grounded on the idea of agricultural zoning elaborated by Professor I. F. Mukomel which was the result of his studies of agriculture of the Ukraine for many years.1
1 The most important studies are: I. F. Mukomel, Opyt rayonirovaniya selskogo khozyaystva Ukrainskoy SSR v tselakh perspektivnogo planirovaniya (An attempt at the regionalization of agriculture of the Ukrainian SSR for the long term plan-ning), in: Materiały V Mezhvuzovskoy konferentsii po prirodnomu i ekonomiko-geo-graficheskomu rayonirovaniyu SSR dlia selskogo khozyaystva, Moscow 1969, Moscow University. I. F. Mukomel, Zakonomernosti jormuvaniya regionalnikh osoblivostiey silskoho hospodarstva i ioho territorialnoy organizatsii, metodika ikh doslidovaniya z metodu prognozuvaniya (Principles of the formation of regional characteristics of agriculture and its spatial organization, method of research and forecasting), Kiiv 1972, pp. 3-61. I. F. Mukomel, G. K. Grigorash, Silske hospodarstvo Podoliya (Agriculture of Podole), in: Territorialna organizatsia silskoho hospodarstva USSR, Kiiv 1972, pp. 43-63.
http://rcin.org.pl
56 I. F. Mukomel, K. E. Povitchannaya, S. V. Stetsenko
I. F. Mukomel's main scientific propositions concerning the USSR were re-ported at the Ail-Union Symposium on the Theoretical Basis of Geography in April 1974 in Simferopol in the report entitled On the System of Concepts in Agricultural Zoning.
The idea of integration of agriculture and industry is the basic concept of the agricultural zoning according to I. F. Mukomel. The main unit of agri-cultural zoning is an AIPC. The taxonomic stages are, the AIPC of national significance and the AIPC of regional significance, such as of large economic regions, Union republics, large administrative regions.
An AIPC is understood as a number of branches and spheres of activity in the national economy devoted, on the one hand, to the production of foodstuffs and other consumer goods of agricultural origin and, on the other hand, to manufacturing means of farm production and various services for agriculture.
The AIPCs of national significance are subdivided into agricultural zones; the AIPCs of an economic region in a Union republic into subzones and the AIPCs of an administrative region into microzones. Agricultural zones, subzones and microzones are forms of territorial organization of agriculture proper.
An agricultural zone is an industrial territorial complex of collective and state farms and their agro-industrial integrated units differing in composition as to the main branches of crop growing and animal husbandry. The branches define its specialization and rank in the territorial division of labour.
An agricultural subzone has the same composition of branches as the agri-cultural zone differing only is result of the local natural and economic condi-tions in having some additional branches.
A microzone is a combination of various production types of farms inter-connected by stage-by-stage production co-operation and joined by a unity of relations with an industrial enterprise. A microzone is a primitive AIPC.
The first stage of agricultural zoning is farm typology. The method of distinguishing the production types of farms was as follows.
(1) The prevailing orientation of farming, crop and livestock production, was defined according to the structure of commercial production of each farm (500 farms).
(2) Branches of specialization were defined according to the structure of commercial production, a ranked series of branches was compiled and those branches in which the index of commercial production exceeded that of their place in the ranked series were classed as particular branches of specializa-tion.
(3) The leading branches of specialization were particularly distinguished. Their number, was determined by the weighted index of the average rank of commercial production P:
Zxii p = i = i —
/=i where Xt — is the volume of commercial production, i — is the ordinal num-ber of the branch in the ranked series ranged in decreasing order of the volume * of commercial product, n — is the number of leading agricultural branches. Other branches of specialization were considered as supplementary.
(4) The orientation of farm specialization was determined according to the leading branches. The succession of a branch was indicated by the prevalence of a crop or livestock orientation of farm production.
http://rcin.org.pl

Agricultural zoning in the Odessa Province 57
(5) Generalization of farms into one production type was made according to their orientation of specialization.
Farms of 18 production subtypes united into 3 types were distinguished. Among them 11 types of crop-livestock production type, 4 subtypes of livestock--crop production type, and 3 subtypes of livestock production type (see Legend to the Map 1).
Fig. 1. The Northern Microzone. Farm types I. Crop-growing and livestock-breeding type.
Subtypes: 1 — Grain and sugar beet with sunflower, beef and dairy cattle supplemented with pig breeding, 2 — Grain and oil seeds with sugar beet, beef and dairy cattle supplemented with pig breeding, 3 — Sugar beet and grain with sunflower, beef and dairy cattle supplemented with pig breeding (poultry raising), 4 — Sugar beet and grain with fruit orchards (vegetable growing), beef and dairy cattle supplemented with pig breeding, 5 — Dairy and vegetable farming, 6 — Vegetable and fruit with viticulture, beef and dairy cattle, 7 — Viticulture and fruit orchards with grain, beef and dairy cattle, 8 — Grain and sunflower with viticulture, beef and dairy cattle supplemented with pig breeding (sheep breeding), 9 — Viticulture and vegetable farming with grain and sunflower, beef and dairy cattle supplemented with pig breeding (poultry raising), 10 — Viticulture and grain farming with sunflower, beef and dairy cattle
supplemented with pig breeding (sheep breeding), 11 — Rice growing II. Livestock-breeding and crop-growing type.
Subtypes: 12 — Beef and dairy cattle supplemented with pig breeding (poultry raising), sheep breeding, grain, sugar beet and sunflower, 13 — Dairy farming and sheep breeding, 14 — Beef and dairy cattle with pig breeding (poultry raising), sheep breeding, grain and sunflower and viticulture,
15 — Poultry raising supplemented with beef and dairy cattle, grain farming III. Livestock-breeding type.
Subtypes: 16 — Beef cattle supplemented with pig breeding, sugar beet, grain and sunflower, 17 — Pig breeding supplemented with beef and dairy cattle, sugar beet and grain, 18 — Pig and sheep
breeding with beef cattle, grain farming
http://rcin.org.pl

58 I. F. Mukomel, K. E. Povitchannaya, S. V. Stetsenko
Such types as seed-selection, grape and fruit nurseries, fish-breeding farms, etc., being rare, were distinguished separately. As a rule, the overwhelming majority of the distinguished subtypes has several branches of specialization, ranging from 3 to 5-6. This testifies to the prevalence of mixed farming. The Posmitny Collective Farm can serve as an instance of such mixed farming, that is why it has been selected as the object of an excursion during the Com-mission meeting.
A number of production subtypes is clearly localised (see Map 1). Thus, for instance, the second subtype, i.e., grain and oil seeds with sugar-beet growing, beef and dairy livestock, pig-breeding (poultry raising) is met only in the 1st microzone where it is a dominating subtype (over 2/3 of all farms). In the
Fig. 2. Agricultural zoning of the Odessa Region Agricultural microzones, I — Beet and grain growing, livestock breeding, II — Livestock breeding, grain and oil seeds, III — Suburban, IV — Viticulture and grain, livestock breeding, V — Viticulture, grain and
vegetables, livestock breeding, VI — Livestock breeding and grain
http://rcin.org.pl

Agricultural zoning in the Odessa Province 59
same microzone in the very northwest the fourth subtype is localized, i.e., beet and grain with fruit orchards, beef and dairy livestock, pig breeding (poultry raising). These two subtypes define the specialization of the 1st agricultural microzone.
Separate subtypes are scattered on the territory of the whole region and are met in all or in the greater part of the microzones. There is still a parti-cularly small number of more spacialized farms in the region, and it is for this reason that they could not be singled out and form a separate production subtype. They mainly are of an animal husbandry orientation with the stage--by-stage specialization of farms. Such farms are located in all agricultural microzones and are still at the stage of development.
The main criteria for singling out the microzones were the types of inter-farm relations within one subtype and the relations outside it with the farms of other subtypes of adjoining territories, as well as the level and character of complex relations between agriculture and industry, i.e., the type of economic relations of agricultural enterprises with one or more industrial ones (of the same industrial branch).
Within the boundaries of the Odessa region 6 microzones were distinguished from north to south (see Map 2). Microzone I consists of 7 subtypes linked with the Kotovsky and Zaplazsky sugar rafineries. Microzone II has 10 subtypes connected with the Odessa butter plant. Microzone III has 8 subtypes related to the Odessa canning company, Microzone IV has 6 subtypes connected with the Shabo and Belgorod-Dnestrovsky wineries. Microzone V has several subtypes connected with the Izmail food cannery and microzone VI consists of 5 subtypes connected with the Izmail and Artsiz meat-packing plant.
The criterion for distinguishing the microzones was also the structure of commercial production. The microzones were termed accordingly. The basic data of the branch structure of commercial production are given in Table 1. As it is clearly seen from the Table each of the six microzones differs from the others as to the structure of commercial production. Four microzones refer to the crop-growing and cattle breeding type (I, III, IV, V), 1 refers to the cattle breeding and crop-growing type (II), and 1 — to the cattle breeding type (IV).
While singling out the microzones the regional differences in natural and socio-economic conditions were taken into account, as well as the whole com-plex of characteristics of farm production including the crop yielding capacity, the cost of unit of produce, monetary terms per farm worker, gross output per ha, net income per ha and other data given in the maps of the Atlas of Agriculture of the Odessa Region.
The division of the AIPC of the Odessa region into microzones depends on the differentiation of the natural conditions within the regional territory.
The compilation of analytical maps of natural conditions such as climatic maps, relief dissection maps, soil continuum maps, etc., and of the synthetic map of physico-geographical territorial organization 2 for the Atlas of Agricul-ture of the Odessa Region showed the existence of significant territorial dif-ferences. Although the Odessa region is comparatively small in area (only 33 thousand sq. km) it is stretched longitudinally.
As it can be seen from Map 3 3 the region has two natural zones; the forest--steppe and the steppe ones with two subzones. But there are only 5 separate natural regions [I, 11(1), 11(2), III(l), 111(2)] which differ as to their entire complex of natural conditions.
2 Physico-geographical territorial organization of the Ukrainian SSR. Monography, Kiev State University, Kiev 1968.
3 Cf. footnote 2.
http://rcin.org.pl

OS o
TABLE 1. The Structure of the Commercial Production of the Agricultural Microzones of the Odessa Region 1971-1975 (%)
Micro-zones
Crop growing Animal husbandry
sugar grain keet sunflower vegetable fruits grapes others total
cattle breeding meat milk
pigs sheep poultry other total
I 17.67 19.01 7.05 2.24 1.87 0.63 6.12 54.59 15.80 14.32 12.94 0.09 0.71 1.51 45.41 11 17.54 5.01 9.20 1.52 1.59 2.63 6.49 43.98 13.53 14.43 11.40 0.26 3.76 12.64 56.02
III 8.07 — 2.61 26.81 2.66 6.13 10.02 56.30 9.67 18.33 5.32 0.15 4.55 5.68 43.70 IV 19.45 — 9.51 5.02 2.11 14.28 4.15 54.53 11.56 14.83 13.82 1.16 4.10 45.47 V 15.71 — 7.06 12.41 2.09 14.81 1.70 53.78 11.77 12.11 14.46 1.36 1.56 4.96 46.22
VI 15.56 — 8.12 1.34 1.41 7.99 2.96 37.38 12.53 14.03 24.71 2.34 1.23 7.78 62.62
S o
tq
O S. o Sr1 P S S p
J5 <
CO <T> «n m Cá cT* O http://rcin.org.pl

Agricultural zoning in the Odessa Province 61
Fig 3. Physico-geographical zoning of the Odessa Region I — forest-steppe zone, II — northern steppe subzone, III — southern steppe subzone, 1.0 — average annual precipitation, 3200 — mean daily temperature sum for the period when average
daily temperature is above 10°C
The zonal and regional differences are quite convincingly shown on the physico-geographical map by the isograms of two climatic indices particularly important for agriculture. They are, the sums of active temperatures for the period when the average daily temperature is above +10°C and G. T. Seli-vanov's hydrothermic factor.
The sums of active temperatures for the whole growing season vary from 2900-3000° in the forest-steppe zone, 3200-3400° in the northern steppe subzone and 3400-3600° in the southern steppe subzone.
http://rcin.org.pl

62 I. F. MuJcomel, K. E. Povitchannaya, S. V. Stetsenko
The figure for the sums of active temperatures during the vegetation period proves that the regional climatic conditions are characterized by considerable resources of heat permitting to cultivate such heat-loving crop as rice, grapes, southern vegetables as well as aftercrops which is an important reserve of increasing agricultural production, particularly in the southern steppe zone.
The hydrothermic factor changes with the latitude from north to south, from 1.0-0.9 in the forest-steppe zone to 0.9-0.8 in the northern steppe subzone and to 0.7 and lower in the southern steppe subzone. Low hydrothermic factor, irij the northern and especially in the southern steppe subzone are due to evident lack of soil moistening which is a limiting factor for the crop develop-ment and which decreases the yield sharply. Here irrigation is necessary in order to obtain guaranteed yields. It is exactly in the southern region that all 15 local irrigation systems of the Odessa region are located. The overall area is 111 thousand ha. It is expected to become a zone of complete irrigation in the future.
The degree of influence of the hydrothermic factor on crop yields is evident from a special chart showing the dependence of the crop yield on the hydro-thermic factor presented on one of the evaluation maps in the Atlas of Agri-culture of the Odessa Region.
To compile the map the dynamic series of crop yields from 1965 to 1974 were studied for all administrative districts (25 in number). With the use of the variation factors the following was rated: general dispersion which chara-cterises the general yield variation, the latter conditioned by the meteorologi-cal factors and by the higher level of agriculture and random dispersion characterised by the deviation of actual yield from the rated average one. Thus, the random dispersion gives generalised characteristics of the stability of yielding capacity in the quantitative aspect.
When calculating the general dispersion we took the data of real yielding capacity for 9 years (1966-1974) within the administrative districts of the region.
The data of theoretically levelled yielding capacity have been used to calculate chance (random) dispersion. The levelling of the series was done with the method of the least squares presupposing that the dependence between the yielding capacity and the meteorological factors has the following expres-sion
y = a + bt + ct2.
The coefficient of chance dispersion shows its share in general dispersion, i.e., the influence of the meteorological factor on the yielding capacity.
Our method of defining the dependence of yielding variation should not be considered the most exact one as it reflects only spatial variation of the considered proportion. This is easily proved by analysing Map 4. Thus, the least influence of the weather factor on yield variation is observed in the forest-step-pe zone with larger amount of precipitation. Here the share of hydrometeoro-logical factor in the yield is evaluated as 40%. Moving southwards the influence of the weather factor becomes more significant. In the northern steppe sub-zone its share is 60-70%, and in the southern steppe subzone it is 70-80% and over.
The only exception is the suburban zone of Odessa where the share of the weather factor is 40-50%. Here the unfavourable weather factor is to a cer-tain extent balanced by the high level of intensive farming, the higher yields on the irrigated lands included. The latter condition stresses once more an
http://rcin.org.pl
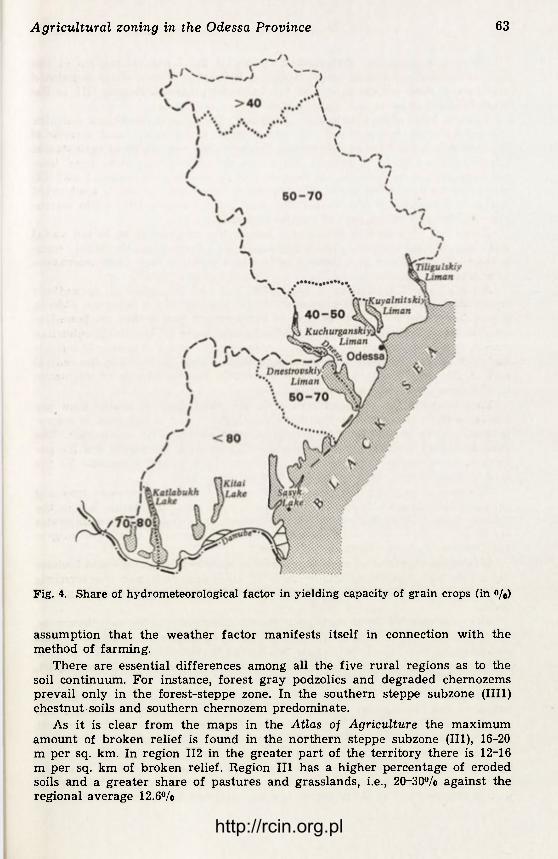
Agricultural zoning in the Odessa Province 63
Fig. 4. Share of hydrometeorological factor in yielding capacity of grain crops (in «/o)
assumption that the weather factor manifests itself in connection with the method of farming.
There are essential differences among all the five rural regions as to the soil continuum. For instance, forest gray podzolics and degraded chernozems prevail only in the forest-steppe zone. In the southern steppe subzone (III1) chestnut soils and southern chernozem predominate.
As it is clear from the maps in the Atlas of Agriculture the maximum amount of broken relief is found in the northern steppe subzone (III), 16-20 m per sq. km. In region 112 in the greater part of the territory there is 12-16 m per sq. km of broken relief. Region III has a higher percentage of eroded soils and a greater share of pastures and grasslands, i.e., 20-30% against the regional average 12.6%
http://rcin.org.pl

64 I. F. MuJcomel, K. E. Povitchannaya, S. V. Stetsenko
There is a noticeable difference between all the 5 natural regions in the hydrogeological conditions which influence the water supply of the populated area, water both for drinking and for technical purposes. Region III1 is the least favourable as to the water supply.
Thus, a lucid differentiation of 5 regions of a natural conditions complex creates different prerequisites for agricultural development and territorial organization in the form of microzones. However, the boundaries of agricultural microzones and those of natural regions do not coincide. In some cases they only approach each other (cf. microzone I and IV and natural regions I and 112) and in others they differ greatly. For instance, microzones IV and V are located within the boundaries of one and the same natural region III2, while micro-zone III occupies only a part of natural region III1.
There are considerable differences among the microzones as to the social and economic development. Thus, the supply of labour force, the ethnic com-position of population and demographic characteristics vary from microzone to microzone.
An analysis of a number of population maps of the Atlas of Agriculture shows that rural population density varies considerably within the Odessa region. The rural population density in the northern part within the boundar-ies of microzone I is maximum, i.e., 39.8 inhabitants per sq. km, in the suburban zone it is 38.2 inhabitants per sq. km, in microzone IV and V it is over 35 inhabi-tants per sq. km. The minimum rural population density is found in the central part of the Odessa region approximately within the boundaries of microzone II, 22.6 inhabitants per sq. km only.
This accounts for some differences in the mean load of arable land per annual worker engaged in agriculture. The highest load is observed in micro-zone II, i.e., up to 8-10 ha, at some farms even above 10 ha per worker. The minimum load is observed in microzone III, up to 4 ha, rarely 4-6 ha per worker. In microzone V it is 4-6 ha, sometimes 6-8 ha. In microzone VI the load increases again up to 6-8 ha and 8-10 ha per worker.
The map of migration of rural population for the period between 1959 and 1970 censuses shows a process of redistribution of rural population within the Odessa region. Thus, the two zones from which the rural population migrates are clearly seen, as well as the two zones to which the rural population migra-tes. One zone has an intermediate position.
Maximum migration of rural population is observed from microzone I where the number of inhabitants fell by 25-50%. Microzone II is also characteristic for its decrease of population, but the process is less intensive than in micro-zone I.
The maximum influx of rural population is observed into the suburban zone, microzone III. A slower influx is observed in the Danube area, microzone V and south of microzone IV. This is explained by the development of irrigation here.
A somewhat intermediate position is occupied by the Trans-Dniester part, microzone VI and north of microzone IV.
The process or redistribution of rural population influences the demographic situation and the natural increase of population within the microzones, and eventually, the presence of labour force, mechanic staff of farms, etc. The most favourable conditions are observed in microzones III and V.
The rural population increase in microzone V is explained, on the on hand, by recruitment of the Koreans from the Kazakh republic and the Ukrainians from the Western Ukraine. On the other hand, there is high natural increase in this microzone. The latter factor can be explained by a low migration rate
http://rcin.org.pl

Agricultural zoning in the Odessa Province 65
of the Bulgarians and Gagauzes who comprise the larger part of the rural po-pulation of the area and among whom there is a tendency to have large families.
The differences in ethnic composition in various microzones manifest them-selves in different working traditions and customs of the population. This determines to a great extent the orientation of specialization in microzones and higher labeur productivtiy in certain spheres of agriculture.
Considerable differences in the agricultural production proper are observed among the microzones. This aspect is shown by demonstrating the differences that exist in the structure of commercial production in six microzones (see Table 1). This also can be shown by giving the variable yield data of grain, sunflowers and grapes per ha in all 6 microzones.
I II III IV V VI
Grain 108.1 103.0 111.7 93.2 92.5 104.1 Sunflowers . . 107.5 102.0 93.5 101.5 79.5 103.0 Grapes . . 32.0 43.2 71.7 96.5 129.9 81.4
The economic indices are still more illustrative, the cost of 1 quintal of production, the cost of gross production and net income per hectare. This is all the more evident with grapes. Thus, for instance, the net income for grapes per ha in microzone V is nearly 10 times higher than in microzone I and 5 times higher than in microzones II and III, 30% above that in microzone IV and over 68% that of microzone VI.
Therefore, each of the singled out microzones has distinctive regional featu-res of its own.
Taking one of the microzones as an example let us see the inner and outer interfarm production links between the enterprises of one or more production subtypes, as well as the existing links between the farms and the leading indu-strial enterprises.
Microzone I. Six production subtypes are represented here. Besides, it has one sugar-beet seed-selection enterprise. The second subtype is evidently do-minating in this microzone (about 2/3 of all farms).
The specialization in the 6 subtypes is sugar beet growing, grain, dairy--and beef-cattle and pig breeding. They differ in their correlation and the supplementary branches.
Economic links have developed, providing seeds of such varieties that are suited for the region, delivery of youngsters to interfarm feeding centres, links with farms reproducing highbred cattle and artificial insemination centres, links with hatcheries, fodder .mills, interfarm building-material plants, etc.
Economic links necessitated by a deeper agricultural specialization have not yet developed widely. They are being developed at present between farms within one administrative district, and rarely exceeding the boundary of a district.
Closer and more regular links have been established inside the microzone between the farms and the industrial enterprises such as sugar refineries of the Kotovsky and Zaplazsky districts. The raw material base of these refineries is 39 thousand ha of sugar beet fields. 84 farms, i.e., 18% of all farms in the region, are connected with these refineries. Sugar beet is delivered to them according to a special agreement and the time-schedule of delivery is specified. The enterprise pays the farms in cash according to the buying prices and pays off also in sugar and waste: refuse and molasses. These enterprises also
5 Geographia Polonica http://rcin.org.pl

66 I. F. MuJcomel, K. E. Povitchannaya, S. V. Stetsenko
furnish seeds to the farms. The boundary of microzone I corresponds to that of the attraction area of these two refineries.
Thus, an agricultural microzone is a complex of various economic subtypes where farms have inner and outer economic links. Links with the leading indu-strial enterprises are closer. This characterises the microzone as a primitive AIPC.
An analysis of subtypes of farms and peculiarities of agricultural microzo-nes permits drawing the following conclusions.
(1) Multiple production farms, with 4-6 branches, prevail within the dist-inguished subtypes. Few are specialized which proves that specialization is insufficient.
(2) An overwhelming majority of farm subtypes are distinctly localized proving that there are different agricultural districts within the Odessa region.
(3) Industry occupies a leading position in respect to agriculture (the prima-ry AIPC is formed in microzones).
(4) Economic links between subtypes of farms are insufficiently developed within microzones, while complexes of subtypes of farms within microzones are only in the process of formation.
(5) The boundaries of agricultural microzones closely approach the physico--geographical boundaries but do not fully coincide with them, thus confirming an essential impact of natural environment on the structure of agricultural pro-duction.
(6) A comparison of microzone specialization with that of subtypes of farms permits distinguishing the more promising subtypes among the existing ones and makes it possible to outline the ways of their perfection.
http://rcin.org.pl

/
GEOGRAPHIA POLONICA 40, 1979
T Y P E S O F A G R I C U L T U R A L R E G I O N S I N W E S T S I B E R I A A N D N O R T H K A Z A K H S T A N
V . G . K R Y U C H K O V
Faculty of Geography, Moscow State University, USSR
Within the framework of a generalised classification based on the system of variables developed by Professor J. Kostrowicki for world agriculture (J. Kostrowicki 1974) the large scale socialized grain-livestock agriculture has been identified as a dominant type in the major agriculturally developed regions in West Siberia and North Kazakhstan.
A more detailed study of the territorial differentiation factors in agriculture and of the interrelation between their main parameters makes it possible to reveal the mechanism of formation of the production types of agricultural en-terprises, whose stable systems form agricultural regions. These studies are needed for defining the prospects for the development of agriculture within a precisely outlined territorial framework, within which a definite programme of economic, organisational and technical measures can be elaborated proce-eding from planning tasks and taking into account the local natural and eco-nomic resources.
In the Soviet Union's system of the territorial division of labour the regions of West Siberia and North Kazakhstan are big producers of commercial grain, meat and milk. This territory has several natural features similar to the sou-thern steppe provinces of Canada. In the 1950's the area of arable land was considerably extended there and a large part of the virgin and idle land was brought under cultivation.
The modern agricultural development of the territory depends both on the zonal climatic and soil features as well as on the lithological and geomorpholo-gical peculiarities of the areas, consequently there is a great variation in the agricultural utilization of the land.
The most developed territory from the agricultural point of view there is the relatively elevated and drained part of the West-Siberian lowland, which gra-dually changes over to the plateau-shaped area of the Kazakh low hills and Altai mountains within the steppe and partly within the arid-steppe zones. A considerable part of the arid steppe zone coincides with the massifs of low hills with their selective farming development.
The peculiarities of the farming development noted in the territory can be quite elearly seen on the map of land utilization where the large massifs of almost completely ploughed up land coincide with the areas of forest-steppe, steppe, and partly arid-steppe zones which have the best drainage (Fig. 1).
The limited agro-climatic resources (with thermal reserves up to 2300°, with short growing season and insufficient moisture) result in the relatively small range of cultivated crops, predominantly cereals, mainly spring wheat
5* http://rcin.org.pl

68 V. G. Kryuchkov
Fig. 1. Fragment of the small-scale map of agricultural land utilization 1 — Large massifs of arable land. Cultivation of grain crops with wheat prevalent, combined with perennial grasses and small amount of maize for silage. Bare fallow (up to 15-20 per cent of the arables) is practised, combined with a system of anti erosion measures, la — The same, but with sunflower cultivation in the crop rotation, with a smaller share of fallow land. 2 — Large massifs of arable land including groves of trees. Cultivation of grain crops with spring wheat prevalent combined with perennial grasses, and maize for silage. Bare fallow land (up to 10-15 per cent) is applied. On soils with an easy mechanic composition an anti--erosion crop rotation is practised. 2a — The same selection of crops, but combined with sugar-beet grown in special crop rotations. 3 — Massifs of arable land including groves of trees and pastures in the lake lowlands. Cultivation of grain crops with spring wheat prevalent combined with fodder crops. Small areas of bare fallow land (up to 10 per cent). 4 — Arable land, alternating with massifs of forests and pastures along the valleys and ravines. Spring grain crops predominate in the crop composition, combined with winter grain and fodder crops. Small amount of fibre-flax crops is found. Bare fallows are used mainly as the forerunners of winter crops (winter rye). The area sown to perennial grasses increases on the relatively steep slopes. 5 — Small areas of arable land (up to 50 hectares) combined with pastures and hayfields and forest massifs. The arable lands are used for grain and fodder crops. 6 — Meadow hayfields alternating with pastures. Primarily cattle grazing. 7 — Pastures and hayfields mixed with groves of trees. Cattle and sheep grazing with selective haymowing. 8 — Primarily spring and autumn pastures. Sheep, and partly cattle, grazing. All-year-round pastures for camels and
horses. 9 — Forests of economic significance. 10 — Marshes.
with the wide use of bare fallow. All this brings about relatively slight diffe-rences in the degree of intensity of agricultural production.
Therefore the changes in the combinations of branches of farming and stock raising, and consequently in the specialisation of agriculture, are closely linked with the ratios of arable land to pastures, which depend on the specific featu-res of the landscape of the territory and on the establishment of inter-farm organization of land exploitation. On the basis of the generalised stable com-binations of the main forms of agricultural land utilization, groups of enterpri-ses with similar features of territorial organisation have been identified. These
http://rcin.org.pl

Types of agricultural regions 69
are commonly called types of organisation of territory in the Soviet economic geography literature (Fig. 2).
A system of statistical indices characterising specialisation, farming methods, production intensity, as well as additional materials obtained from special stu-dies of typical holdings form the basis for the classification of production types of agricultural enterprises. In order to select representative indices characteri-sing the regional peculiarities of agriculture a preliminary evaluation of the initial statistical information was made with the help of mathematical statistics and factor analysis methods (V. M. Zhukovskaya, V. G. Kryuchkov, I. M. Kuzina 1975; V. G. Kryuchkov 1976).
The peculiarity of the localisation of the principal production types and subtypes of agricultural enterprises is the following (Fig. 3). In the main part of
Fig. 2. Types of organisation of territory A. Developed farming areas on f'.ie plains. Agriculture is developed primarily based on the arable land utilization in the arid steppe zone (type 1, 2) steppe zone (4) and forest-steppe zone (7, 8, 9). In the steppe zone agriculture is based on the arable land utilization combined with pastures and hayfields on the eroded terraces of the hollows of the ancient valley (Types 3, 5)
and of the water-meadows (6). B. Agricultural production is based on ploughed up land of the foothill plains combined with the pasture forage of the foothills. Agriculture is based on the utilization of the arables of the forest-steppe foothills and the pastures of the Salair mountain-ridge (types 10, 11). Agriculture is based on the utilization of the foothill steppe, the steep hilly slopes, foothills and the low
mountains of the Altai (types 12, 13, 14). .. C. The mountain-forest territories with selective agricultural and farming development. A g r i -culture is based on the utilization of the forest-steppe areas of the low mountains (type 15) and of the forest-taiga low mountains (type 16), and also combined with forest steppe and forest low mountains and mid-mountain areas (type 17, 18). Agriculture is based on utilization of the agricultural lands of the steppe hollows between the mountains and of the mid-mountain areas (types 19, 20). Agriculture is based on the lands of the desert hollows between the
mountains and the high mountain areas (types 21, 22, 23).
http://rcin.org.pl

70 V. G. Kryuchkov
the developed agricultural area of the steppe and forest-steppe zones, where arable land takes up more than half of the overall area, enterprises of the grain-livestock type predominate, including various sub-types characterising the development of subsidiary branches of crop growing or livestock breeding. Sheep breeding as a subsidiary branch is common in the subzone of arid steppe, and pig breeding in the forest-steppe. Sugar-beet growing is developed in areas with relatively more favourable agro-climatic conditions near the sugar plants.
In the developed agricultural areas of the arid-steppe zone sunflower cul-tivation is widespread, the commercial significance of which approaches the level of grain growing in a number of enterprises, especially in years when, there is insufficient moisture. In less developed farming areas with large re-sources of pasture forage sheep breeding is growing in importance, and in some places it is becoming the basic element of the production type. In extremely dry years the drop in grain crop yield led to a substantial decrease in the share of grain in the composition of the entire commercial production of agriculture, as compared with ordinary years when moisture conditions were better.
Fig. 3. Production types of agricultural enterprises A. Grain crop growing with livestock raising. 1 — Grain crop growing, dairy-and-beef cattle raising, la — with sheep breeding, lb — with pig breeding. 2 — Grain crop and sugar beet growing, dairy-and-beef cattle raising. 3 — Grain crop and sunflower growing, dairy-and-beef cattle raising, 3a — with sheep breeding. 4. Grain crop growing, fine-wool sheep and dairy-and-beef cattle raising. B. Livestock raising with grain crop growing. 5 — Dairy-and-beef cattle raising, grain crop growing, 5a with flax growing and pig breeding. 6 — Fine-wool sheep breeding and dairy-and-beef cattle raising, grain crop growing. C. Livestock raising dominant. 7 — Pig and dairy-and-beef cattle raising. 8 — Beef cattle breeding (fattening sovkhozes). 9 — Poultry and dairy-and-beef cattle raising. 10 — Beef-and-dairy cattle raising. 11 — Beef-and-dairy and beef cattle raising, sheep and maral deer breeding. 12 — Mutton-and-wool sheep raising, beef-and-dairy or beef cattle raising. 13 — Mutton-and-wool sheep raising and fine-wool goat breeding, 13a with yak breeding. 14 — Fur animals breeding. 15 — Beekeeping. 16 — Poultry farms. D. Other types. 17 — Vegetable growing. 18 — Fruit growing. 19 — State forest lands.
http://rcin.org.pl

Types of agricultural regions 71
Coming closer to the foothill-mountain areas the commercial significance of grain growing falls sharply, and livestoock breeding branches serve as the basis for the formation of production types. On the collective and state farms situated at the junction of the foothill plains and the steeply-sloping, low-hilly terrain, where arable land occupies less than one-fifth of all the agricultural land, grain growing is usually an important subsidiary branch.
In the belt of low mountains, where subsidiary farming is developed, lives-tock breeding predominates. Sheep breeding increases in importance with the change-over to the mid-mountain areas where farming possibilities are smaller, and there is more xerophyte grass in the low belts of the mountains and in the hollows between the mountains.
Cattle-sheep raising and sheep-cattle raising types of enterprises predomina-te in the mid-mountain areas. Siberian maral and deer breeding has also beco-me common as a subsidiary branch in the larch forest areas.
In the high mountain belt where livestock breeding is primarily based on the pasture resources of the territory, sheep breeding serves as the basis for the foundation of production types of enterprise and goat and yak breeding are being developed as subsidiary branches.
The boundaries of agricultural regions, which perform definite economic functions in the system of the territorial division of labour, serve as clearly
Fig. 4. Agricultural regions I — Grain growing, sunflower cultivation, dairy-and-beef cattle, sheep breeding. II — Grain growing, sheep breeding, dairy-and-beef cattle raising. Ill — Grain growing, dairy-and-beef cattle raising. Subregion Ilia — Grain growing, sugar-beet raising, cattle and pig breeding. IV — Vege-table, potato and grain growing, dairy cattle raising and poultry farming. V — Grain growing, sugar-beet raising, pig breeding, poultry farming. VI — Dairy-and-beef cattle raising and grain growing. VII — Beef-and-dairy cattle raising. Subregion Vila — Beef-and-dairy cattle raising, sheep and maral breeding. VIII — Sheep breeding and beef-and-dairy cattle raising. IX — Sheep
breeding, goat and yak breeding.
http://rcin.org.pl

72 V. G. Kryuchkov
expressed areas where the dominating production types and subtypes of agri-cultural enterprises are distributed. However, clear-cut or pronounced chan-geovers in the localisation of the main types of enterprises do not always occur. In this case, in order to reveal the boundaries of agricultural regions an ana-lytical study of the main territorial structures has to be made. These territo-rial structures take the form of systems of farming, types of livestock bree-ding, types of organisation of territory, and should be studied by means of car-tographic methods.
Within the areas of stable distribution of the various territorial structures similar methods of farming and conditions of the formation of the production types take shape on the basis of the various combinations of the predominant branches of crop growing and livestock breeding.
Thus, a definition of the agricultural regions makes it possible to realize a generalised expression for the law governing the location of various systems of production types of enterprises from the point of view of their economic functions. The agricultural regions identified by us are shown in the map (Fig. 4) and the main indices corresponding to them are given in Table 1.
Some regions are characterised by the extreme prominence of the dominant production types of enterprises, for example regions III and VII. Other regions, on the contrary, include groups of various types of enterprises (regions II and V).
In the future the boundaries between the existing agricultural regions will change very little, although the trends of development in the systems of pro-duction types of enterprises within individual regions are changing substan-tially in the process of concentrating and intensifying production.
Within region I, the territory of which lies in the arid-steppe zone and dry--steppe subzone, it is expedient to increase the economic significance of com-mercial grain growing in the intensively ploughed up areas. In the areas where crop growing is poorly developed sheep breeding should retain great economic significance. In order to ensure a guaranteed level of grain production, ratio-nalisation of the crop growing system should, above all, consist of increasing the share of bare fallow land, installing systems of rational methods of agro--technology and melioration as well as selective application of irrigation. Thus a more stable harvest of grain and other crops would be obtained.
For regions II and III where grain-cattle and grain-sheep breeding enterpri-ses predominate, the rationalisation of agriculture is closely linked with the foundation of the optimal proportions between grain growing and the branches of livestock breeding, taking into account the territorially differentiated inten-sification in various types of landscapes.
In regions IV and V the most considerable intensification of farming is to be expected, favoured both by the natural resources of the forest-steppe areas and by the economic conditions. The forthcoming considerable increase in the yield of grain and other agricultural crops on the basis of using chemical fer-tilisers will make it possible to intensify considerably the production of field forage and retain grain growing as an important commercial branch. The in-tensification of livestock breeding specialisation is furthermore expedient in the poorly developed agricultural areas, on the basis of stage by stage specia-lisation and inier-farm cooperation. Therefore the present-day differentiation in the production types of agricultural enterprises in the regions under study becomes even more pronounced.
In regions VI and VII where foothill plain, hilly foothills and low mountains prevail, the most concentrated beef-and-dairy breeding based on the considéra-
http://rcin.org.pl

TABLE 1. Basic indices for agricultural regions (1969)
Agricul-tural
regions and
subregi-ons
Share of arables in total
land area ( % )
Producti-on expen-
diture per 1 ha of agri-cultural
lands (roubles)
Share of products of individual branches in total commercial
produce ( % )
Share of crops in sown
area ( % )
Share of animals in
stock
Grain Sun-
flower
Sugar
beet
Cattle raising
Sheep bree-ding
Pig bree- Poultry ding raising
Produce
per capita Average Q f p o p u l a t i o n
grains for
Meat Total
grains
1961-1969 Wheat Cattle Sheep in
carcass
Mi lk
I 65 62 31 7 36 13 2 0 73 65 56 35 42 1.2 10
II 63 75 41 1 22 20 2 1 75 64 41 47 56 1.2 8
III 61 74 41 4 37 3 4 1 78 69 74 10 55 1.3 11
IV 52 149 16 18" 2 26 — — 19 66 48 90 — 30 1.0 11 V 52 90 28 5 36 1 10 5 71 57 75 2 45 1.5 11
VI 28 72 18 1 62 — 0 — 58 34 88 — 23 1.0 14
VII 15 50 5 — 69 5 — — 59 17 72 13 16 1.1 15
Vila 5 52 1 — 63 13 — — 41 3 67 22 4 1.0 11
VIII 6 38 0 34 47 — — 51 7 26 63 8 1.7 5
IX 0 29 0 — — 20" 70e — — — — 21" 70e 0 2.3 0
a Vegetable growing b Including yaks c Including goats
http://rcin.org.pl

74 V. G. Kryuchkov
ble pasture resources and the developed field forage production has come into being. In region VII grain growing has little commercial significance, and in region VI a more substantial commercial significance. In the future it will be expedient here to intensity beef-cattle breeding, and in places where the trans-port-geographical locations are favourable, to expand the system of cattle--fattening holdings and implement inter-farm cooperation with regard to the rearing, and fattening of cattle coming from the plain regions where pasture resources are limited and from the mountain areas where there is insufficient indoor fodder.
Rationalisation of mountain livestock breeding in the mid-mountain areas (region VIII) is connected with the foundation of the optimal proportion of cat-tle breeding and sheep breeding at various agricultural enterprises, taking into account the size and composition of the pasture resources and the possibilities of subsidiary farming. Considering the economic needs the future development of Siberian deer and maral breeding is also possible here.
Fuller utilization of pasture resources in the high-mountain belt (region IX) can be brought about by further development of yak and goat breeding as well as by obtaining concentrated fodder from other regions for the sheep population which remains there during the cold season.
Thus, the forecast of ways of developing the system of production types of enterprises in individual agricultural regions leads to the necessity of inten-sifying production links on an interregional basis. In ascertaining the optimal location for agricultural and industrial complexes and livestock breeding enter-prises of the industrial type, various ways of distributing industrial enterprises for the production of mixed fodder and the processing of agricultural products in the future, should also be examined.
REFERENCES
Kostrowicki J., 1974, The typology of world, agriculture. Principles, methods and model types, Warsaw.
Kryuchkov V. G., 1976, Modelirovaniye v issledovaniyakh territorialnoi organizatsii selskogo khozaystva (Models in studies of territorial organisation of agriculture), in: Kolichestvennye metody v geografii, International Geographical Union, Moscow.
Zhukovskaya V. M., Kryuchkov V. G., Kuzina I. M., 1975, Application of factor ana-lysis and patterns recognition methods for agricultural typology, in: Agricultural typology and land utilization, Verona, Italy.
http://rcin.org.pl

GEOGRAPHIA POLONICA 40, 1979
LES MUTATIONS PROGRESSIVES DANS LA CONCENTRATION ET TYPISATION DE L'AGRICULTURE DE L'URSS
L . M , Z A L T S M A N , S . J . P O L O V E N K O
Faculté d'Economie, Université de Moscou, URSS
I Le progrès technique entraîne inévitablement la concentration de la pro-
duction agricole et de ses branches. Mais le processus même de la concentra-tion s'effectue d'une manière différente en fonction des différentes étapes du développement de l'agriculture, ce qui est confirmé par toute l'histoire de l'agriculture de l'URSS.
Ainsi, en 1939-1940, la collectivisation de l'agriculture accompagnée d'une transition de la traction animale à la traction mécanique, a mené à la concen-tration de 25 millions d'exploitations paysannes en 240 mille kolkhozes. Ensuite, pendant la période d'après-guerre (1950-1960), la concentration ultérieure de la production agricole s'accomplissait par la voie de l'agrandissement territorial des sovkhozes et des kolkhozes avec l'accroissement simultané des dimensions des champs assolés, du cheptel dans les fermes etc. Ainsi, la surface d'ense-mencement d'un kolkhoze a passé de 500 hectares en 1940 à 2700 hectares en 1960 (en moyenne). L'augmentation territoriale s'est achevée en 1960-1970, mais la concentration de la production agricole continuait au compte de son inten-sification ultérieure.
Simultanément avec le processus de l'intensification au sein de l'exploitation agricole, s'accomplissait sa concentration menant à l'approfondissement de la spécialisation des entreprises agricoles. L'analyse a montré que la plupart des kolkhozes et des sovkhozes à branches multiples ont concentré actuellement leur production sur deux ou trois (plus rarement quatre) branches caractéris-tiques donnant au moins 70% de la production totale marchande de l'exploita-tion. Ce sont ces deux ou trois branches caractéristiques qui déterminent la spécialisation de la plupart des exploitations. En même temps un certain nom-bre de grands sovkhozes et kolkhozes à une seule branche (de culture fruitière, de viticulture, de serre, d'aviculture, d'engraissement, d'élevage des porcs etc.) sont apparus, disposant d'une base technique moderne.
Mais le processus de la concentration de la production agricole ne s'est pas arrêté là. Dans quelques régions de l'URSS il a dépassé les réserves intérieures économiques de la concentration de la production agricole. Dépassant les limi-tes de certaines entreprises agricoles, il a exigé pour son élargissement ulté-rieur la coopération d'autres exploitations. Ainsi, au cours de ces dernières années, la coopération a englobé non seulement les entreprises agricoles, mais aussi les entreprises industrielles, liées avec elles.
http://rcin.org.pl

76 L. M. Zaltsman, S.J. Polovenko
C'est ainsi qu'en URSS a commencé une nouvelle étape de la concentration de la production agricole sur la base de la coopération et de l'organisation des complexes et des associations interéconomiques agricoles et agroindustriels. Ce nouveau type de la concentration de l'agriculture correspond au progrès tech-nique et scientifique, réalisé surtout dans les petites exploitations et les exploi-tations intensives.
Mais ce serait faux de croire que la concentration de la production agricole à une étape donnée ne s'accomplit en USRR que par la voie de la coopération interéconomique des sovkhozes et des kolkhozes. Dans plusieurs régions de l'URSS, surtout dans les grandes exploitations et dans les régions peu intensi-ves, la concentration de la production sur la base de l'approfondissement de la spécialisation de l'exploitation avec l'intensification simultanée de branches, res-te encore en vigueur. Dans la plupart de grandes exploitations et des régions peu intensives du pays, il y a des réserves considérables pour la concentration de la production dans les limites d'une seule exploitation — et ces réserves sont mobi-lisées en premier lieu. Il en résulte que les grandes entreprises, tout en appro-fondissant leur spécialisation intérieure économique, se transforment en combi-nats agricoles (ou agroindustriels) avec deux-trois branches faisant partie des secteurs spécialisés de production.
Actuellement il y a deux formes de l'association interéconomique de l'acti-vité des entreprises agricoles et parfois même des entreprises industrielles: verticale et horizontale.
La coopération verticale (intégration) suppose une telle division du travail entre les entreprises associées que le produit qu'elles fabriquent passe dans les diverses entreprises des stades successifs, à mesure de sa transformation en un produit final (par exemple, la reproduction et l'engraissement du bétail, la production et le traitement industriel des matières premières agricoles, etc.)
La coopération horizontale suppose une autre division du travail. Chaque entreprise associée livre son produit final, mais certaines productions et services auxiliaires se concentrent en vue de leur meilleure organisation. Ces nouvelles entreprises spécialisées desservent toutes les entreprises (p. ex. les exploitations des semences et de race pure, les ateliers de réparation, les centres de traite-ment chimique, les usines des aliments combinés, les services de bonification, les entreprises interkolkhoziennes pour la production des matériaux de con-struction, les dépôts, les bases automobiles, etc,
Ces formes de la coopération (verticale et horizontale) prédéterminent aussi en grande partie les rapports des entreprises associées. Dans le cas d'une coopé-ration horizontale toute entreprise associée garde, en règle générale, son indé-pendance juridique. Cela concerne également les entreprises desservantes fon-dées. Dans l'intégration verticale les entreprises associées de la spécialisation étroite perdent souvent leur indépendance juridique et fusionnent avec l'entre-prise intégratrice (des sovkhozes — usines vinicoles et d'alcool, des complexes d'élevage des porcs de la reproduction et d'engraissage, des fermes avicoles). Elles fondent leur travail sur la base du rendement commercial interécono-mique.
Pourtant, lorsque dans le cadre de l'intégration verticale s'associe non pas une exploitation toute entière mais seulement une de ses branches, les branches restantes gardent leur indépendance juridique (p.ex., des exploitations des zones des matières premières des sucreries, des combinats liniers, etc.) Notons aussi que des exploitations ayant leur indépendance juridique peuvent parti-ciper non seulement à un, mais aux plusieurs systèmes coopératifs, si elles le trouvent rationnel.
http://rcin.org.pl

Mutations de l'agriculture de l'URSS 77
II
Au processus de concentration de l'agriculture, qui se réalise par la coopé-ration interéconomique des entreprises, nous avons vu apparaître diverses formes d'influence de la coopération sur la spécialisation et sur les divers types de production des entreprises coopératives.
Premièrement, il ne s'agit que d'une division du travail plus profonde parmi certaines exploitations coopératives et d'une diminution du nombre de branches dans chaque exploitation.
Deuxièmement, chaque exploitation coopérante se spécialise uniquement à un seul stade de la production finale (coopération verticale).
Troisièmement, dans le processus de la coopération des exploitations une telle ou autre branche marchande se sépare toute entière ou partiellement (c'est à dire, certains stades de production d'une branche donnée) et s'associe aux nouvelles entreprises spécialisées interéconomiques autonomes.
Et enfin, on ne s'associe pas telle ou telle branche agricole marchande aux services autonomes ou aux entreprises faisant partie du groupe des exploita-tions coopérées — mais on détache seulement quelques fonctions communes des-servant ces entreprises, ce qui ne modifie pas la spécialisation déjà acquise ou un certain type de production (p.ex., le service de chimie agricole, les répara-tions, la production des aliments composés, des matériaux de construction, etc.)
La séparation d'une branche des exploitations coopérées à la base interéco-nomique et l'organisation d'une grande entreprise autonome d'une spécialisa-tion étroite s'effectue en fonction du niveau de la concentration et de la spé-cialisation atteintes dans cette branche. En règle générale, il s'agit des bran-ches qui permettent d'organiser une grande production spécialisée sur une base industrielle. Il n'est pas rationnel du point de vue économique, de garder ces branches dans toutes les exploitations coopérées à cause de leurs petites dimen-sions qui empêchent la concentration de la production. Cela concerne d'abord les branches d'élevage, telles que l'aviculture et l'élevage des porcs, où dans l'approvisionnement dominent les aliments concentrés facilement transportés. Ainsi, plusieurs exploitations avicoles et d'élevage des porcs en s'agrandissant utilisent des aliments importés, livrés par des exploitations — membres d'une coopérative, ou des sous-produits utilisables des villes, la production de l'indu-strie des aliments composés etc. Cette particularité d'approvisionnement de l'élevage des porcs et de l'aviculture, permet d'obtenir un haut niveau de con-centration sur la base interéconomique. On sépare aussi à la base interécono-mique un élevage et l'engraissement des bovins en utilisant les déchets des betteraveries et des amidonneries en combinaison avec la livraison des four-rages par des exploitations — membres d'une coopérative. Plus rarement, à me-sure de l'organisation des pâturages culturaux irrigués et de la production sur la base interéconomique des aliments de ration complète, on organise quelque part des complexes laitiers interéconomiques. Habituellement, ils sont localisés dans de grandes exploitations qui assurent sur place la production des aliments appropriés.
On organise, dans le cadre coopératif, de grands combinats de légumes (chauds) et parfois même une grande exploitation horticole industrielle avec un réseau spécial d'irrigation. Dans ces grandes exploitations horticoles interécono-miques on utilise les procédés modernes de plantation et les variétés des arbres fruitières qui permettent de mécaniser les travaux de traitement du verger, la récolte et le stockage. En règle générale, on assure une transformation indu-strielle des fruits. Cette exploitation se transforme en une seule entreprise agricole (sovkhoze-usine). Cependant une telle concentration de la production
http://rcin.org.pl

78 L. M. Zaltsman, S.J. Polovenko
horticole, maraîchère et viticole aux dimensions optima dans les limites d'une entreprise agricole interéconomique n'est pas toujours possible. C'est pourquoi la coopération de quelques sovkhozes et kolkhozes voisins (produisant les légu-mes, les raisins, le thé, le tabac, les pommes de terre, etc.) avec une seule usine transformant leur production est largement répandue. A la distance la plus favorable par rapport à la source des matières premières, on organise aussi un complexe agroindustriel de dimension variable. Il unit deux — trois ou davanta-ge de sovkhozes et de kolkhozes avec une usine — intégratrice ayant le dégre di-fférent de l'indépendance vis-à-vis des entreprises coopérées. Dans ce complexe, la spécialisation de certaines exploitations livrant les matières premières à l'usi-ne se trouve souvent renforcée. Ainsi, les différentes exploitations maraîchères, faisant partie du complexe, se spécialisent dans la production de quelques es-pèces ou quelques sortes de légumes. On règle les délais de livraison des matiè-res premières à l'usine par des entreprises agricoles, le rythme saisonnier de la production, etc.
Les branches d'agriculture citées, une fois entrées dans la coopération agro-industrielle, couvrent, en règle générale, les petites zones de la production des matières premières. Il n'en est pas de même dans les branches d'agriculture telles que les semences de betterave et la culture du lin où les usines transfor-mant les matières premières agricoles sont plus grandes et leur zone des ma-tières premières embrasse souvent les kolkhozes et sovkhozes situés dans quel-ques régions administratives différentes.
Dans cette zone l'organisation d'un seul complexe agroindustriel est très compliquée, car la séparation des semences de la betterave sucrière et du lin en grandes exploitations autonomes d'une étroite spécialisation n'est pratique-ment pas possible. Toutes les exploitations produisant la betterave ou le lin, gardent leur spécialisation à deux ou trois branches ainsi que leur indépendan-ce juridique. On apporte aussi quelques modifications à la combinaison des branches dans certaines exploitations. Ainsi, selon les conditions locales, la part occupée par le lin ou la betterave dans la surface cultivée totale, ainsi que le pourcentage des vaches dans le cheptel bovin sont différents. Dans tout ce qui vient d'être étudie, on voit que le processus de concentration de la pro-duction agricole à la base de coopération, conduit pour la plupart des cas à des changements considérables dans la composition et dans la structure des bran-ches coopérées et des nouvelles entreprises interéconomiques. Autrement dit, la coopération amène souvent au changement des types de production existant et à l'organisation de nouveaux types de production spécialisés des entreprises agricoles. Il est nécessaire tout de même de souligner encore une autre par-ticularité du processus de la coopération interéconomique. Il s'agit de la coopé-ration différente entre les exploitations coopérées selon les conditions climati-ques et les types de production des exploitations. Avec cela, dans les zones di-verses du pays apparaissent deux types de corrélation des entreprises agricoles: a) le type principalement territorial; b) le type principalement professionnel.
L'analyse a montré que plus les conditions climatiques et économiques dans les limites d'un territoire (de la région) sont homogènes, plus les types de pro-duction le sont aussi et plus de raison il y a pour l'organisation du type territo-rial de la corrélation des exploitations coopérées (avec la séparation de certai-nes branches à la base interéconomique et avec l'organisation des services et des entreprises d'entretien territoriaux). Et, au contraire, plus les conditions climatiques et économiques dans les limites d'un territoire (de la région) sont variées, plus grandes sont les distinctions entre certains types de production,
http://rcin.org.pl

Mutations de l'agriculture de l'URSS 79
plus de raison il y a pour l'organisation du type professionnel de la corrélation des exploitations coopérées.
On peut montrer ces deux types de la corrélation sur l'exemple de la Ré-publique Socialiste Soviétique de Moldavie et de l'Estonie. Quelques régions du Caucase du Nord et de la Transcaucasie sont proches de la Moldavie par le type professionnel de la corrélation; quelques régions de la zone végétale de la RSFSR (République Socialiste Fédérative Soviétique de Russie) sont proches de l'Estonie. Les régions de la zone centrale de tchernoziom occupent une po-sition intermédiaire. Dans ces régions on peut rencontrer les deux types de la corrélation des exploitations coopérées (Tambov, Penza, Belgorod).
Les nouvelles exploitations de spécialisation étroite exigent souvent une association professionnelle non seulement dans les limites de région, mais dans celle de l'arrondissement (p.ex., les grandes fermes avicoles et d'élevage des porcs à fourrages importés, les exploitations d'élevage du bétail de race) car, dans ces exploitations, il y a des problèmes spécifiques propres à la technologie de production.
Tout de même il ne faut pas détacher ces entreprises de l'organisme écono-mique de leur région à cause de l'existence de liens territoriaux locaux. Voilà pourquoi le type essentiel de la corrélation des entreprises coopérées est le type territorial, comme le type le plus étroitement lié aux conditions climati-ques et à la terre, les moyens le plus importants de la production agricole.
Passons à l'examen des formes de la coopération interéconomique qui exer-cent une influence sur la spécialisation et les types de production des exploita-tions coopérées. On rapporte ici, comme on a déjà désigné, de telles entreprises avec services agricoles spéciales comme entreprises de construction coopérati-ves, services de chimie, fabriques d'aliments composés, ateliers de réparation, bases automobiles, etc. Ces formes de la coopération horizontale n'ont pas d'influence sur les types de production des exploitations desservantes. Elles se forment d'habitude d'après le principe territorial en associant les exploitations d'une région donnée. Cependant, ces entreprises primaires des services organi-sées sur le principe territorial exigent souvent à leur tour l'association ultér-ieure interrégionale sur le principe professionnel en prenant en considération leurs particularités spécifiques et leurs besoins dans les limites des régions et même des républiques. Elles se transforment en grandes associations co-opératives.
III
Nous avons déjà dit que dans les régions orientales et dans les autres régions moins intensives de l'URSS, les sovkhozes et kolkhozes, à la différence des régions intensives, ont de grands fonds agraires et disposent encore des réserves considérables pour l'intensification des entreprises agricoles dans les limites de leur territoire. L'intensification de la production y est possible par voie de la mécanisation de la production ultérieure, par l'emploi généralisé des procédés chimiques et l'amélioration des terres, par l'approfondissement de la division interéconomique du travail et la spécialisation de certains secte-urs de production à l'intérieur d'une grande exploitation. En résultat, dans cette exploitation, même sans coopération avec d'autres entreprises, chaque secteur de production, au fur et à mesure de son intensification, se spécialise souvent sur quelques productions à grande échelle. L'exploitation se transforme souvent en combinat à deux — trois grandes branches marchandes. Une telle transfor-mation d'une grande exploitation en grand agrocombinat (parfois en combinat agroindustriel) n'exclut pas qu'avec l'accroissement ultérieur du niveau de l'in-
http://rcin.org.pl

80 L. M. Zaltsman, S.J. Polovenko
tensité et de concentration de la production, certains secteurs spécialisés de ce combinat se détachent et se groupent en entreprises autonomes d'une étroite spécialisation. Elles peuvent ensuite former des organisations coopératives avec les autres entreprises agricoles et industrielles. Comme exemple de cette con-centration et de spécialisation de la production des grandes exploitations on peut noter des kolkhozes et des sovkhozes de Stavropol.
Les mêmes processus d'intensification et de concentration de la production agricole (qui sont montrés dans l'exemple de Stavropol) ont lieu dans des autres grandes exploitations de l'est de l'URSS (régions d'outre Volga, régions d'outre Oural, Sibérie, Kazakhstan), mais aves les particularités propres à une telle ou telle zone de l'URSS. Ainsi, dans les régions de Volga, d'Oural du Sud, de Sibé-rie, de Kazakhstan du Nord et de l'Est, les sovkhozes et kolkhozes produisant, pour la plupart, les céréales et ceux qui s'occupent de l'élevage du bétail laitier et du bétail à viande ont les plus grands poids spécifiques. Ces deux branches caractéristiques sont représentées en diverses proportions dans des exploita-tions et se combinent souvent avec l'élevage commercial des porcs ou avec l'élevage des moutons, plus rarement avec les cultures industrielles. Les explo-itations céréalières, d'élevage des moutons et d'élevage des bovins et des mou-tons, ont aussi un grand poids spécifique dans ces régions et les exploita-tions d'élevage des moutons et des bovins ont un poids spécifique plus petit. Outre cela, dans les régions d'outre Volga, de Sibérie et de Kazakhstan il y a de grandes exploitations à une branche (d'élevage des moutons, des porcs, des bovins, des chevaux).
Les fonds agraires des types des exploitations énumérées sont dans des zones différentes de 15 à 20 mille ha (pour les exploitations d'élevage des porcs et des bovins et d'élevage des porcs et les céréales) et de 100 à 200 mille ha pour les exploitations d'élevage des moutons et des chevaux. Ces exploita-tions sont les plus grandes en URSS non seulement par les dimensions des terres agricoles, mais aussi par les dimensions des branches caractéristiques (de 10 à 25 mille hectares pour les cultures de semailles, de 5 à 15 mille hectares pour le cheptel).
La plupart de ces exploitations sont des agrocombinats ayant 2-3 grandes branches des divers secteurs de production dans les limites d'une seule exploi-tation, à la base de la spécialisation intérieure économique et de la division du travail.
De tout exposé plus haut de la concentration et de la spécialisation de l'agri-culture dans les grandes exploitations de l'est du pays, on voit que dans cette étape la division intérieure économique du travail prédomine, et la concentration de la production, dans la plupart des cas, n'a pas encore dépassé les limites des grandes entreprises agricoles. A cause de cela, à présent, la coopération interéconomique des entreprises agricoles n'est pas aussi net-tement marquée que dans les régions centrales et occidentales de l'URSS. Cependant, à côté des grands agrocombinats et des complexes d'élevage à une branche apparaissent des entreprises à base coopérative, ainsi que des associa-tions d'entreprises agricoles at agroindustrielles. Cela concerne en premier lieu la coopération horizontale par la voie de l'organisation sur la base co-opérative d'une série d'entreprises de services à la production des matériaux de construction, à l'organisation des travaux de concentration et d'assainis-sement. Ici se forme aussi la coopération de culture des semences, d'élevage du bétail de race pure, on organise l'élevage industriel de volaille et des porcs, des usines d'aliments composés et des exploitations interéconomiques de fourrages.
http://rcin.org.pl

Mutations de l'agriculture de l'URSS 81
IV
Les types de production des entreprises agricoles formées ces derniers dix ans sur les nouvelles terres irriguées de Kazakhstan, des régions d'outre Volga, d'Asie Centrale, présentent un grand intérêt.
Ici, dans les régions désertiques ou semi-désertiques, dans les régions princi-palement inhabitées on irrigue de grandes superficies pour la production agri-cole. La particularité de mise en valeur des ces terres consiste en ce que des organisations spéciales d'amélioration mènent ce travail en complexe, c'est à dire elles mènent successivement non seulement tous les travaux d'améliora-tion (des canaux principaux jusqu'aux canaux d'irrigations de champs), mais, aussi, elles projètent et organisent pratiquement dans chaque massif irrigué des entreprises agricoles de certains types de production en prenant en consi-dération les conditions locales. Elles s'occupent des constructions nécessaires à cette exploitation, introduisent des assolements, des constructions et équi-pements modernes, et de tous les travaux de mise en valeur. Ainsi, ces organi-sations d'amélioration dirigent toute l'activité de production jusqu'au moment où les exploitations atteignent le niveau prévu dans le projet, après quoi les exploitations passent aux services agricoles.
Ces travaux d'aménagement intégré du territoire irrigué sont réalisés en URSS depuis 1965 et ont déjà donné des résultats positifs. Citons en exemple les entreprises de production agricoles, organisées par „Glavrizstroj" au Ka-zakhstan central et méridional.
Cette expérience d'organisation des exploitations rizicoles, cotonnières, bet-teravières, maraîchères, laitières, horticoles et vinicoles, des exploitations sub-urbaines de lait, d'élevage des porcs et d'autres exploitations d'élevage sur les terres irriguées, nous montre que ces expériences exigent les techniques et la technologie de production les plus modernes; des investissements sont grandes et des ressources de main d'oeuvre très limités. A cet égard, il faut souligner que plusieurs exploitations qu'on construit fonctionnent déjà et rapportent un grand bénéfice, même si elles n'ont pas encore atteint le niveau de production prévu.
En même temps, il est important de noter que c'est justement l'eau qui est ici l'intégrateur et le régulateur de toute la production agricole de chaque massif irrigué.
V
Nous finissons la brève description des processus de la spécialisation et de la concentration de l'agriculture de l'URSS. Le renforcement des processus de concentration et de spécialisation de l'agriculture basé sur de nouvelles techni-ques et technologies modernes mène au rétrécissement de la spécialisation de plusieurs exploitations et à la liquidation de quelques types de production des entreprises agricoles aux activités multiples.
Une spécialisation plus poussée de l'exploitation se combine d'habitude avec la concentration de la production et l'augmentation des dimensions de l'entreprise.
On peut penser que dans le processus de la concentration ultérieure de la production agricole, de petits sovkhozes et kolkhozes voisins se réuniront en combinats agraires et agroindustriels. Et au contraire, dans plusieurs grands agrocombinats, au fur et à mesure de l'intensification de leur production, quel-ques secteurs spécialisés de production se détacheront en entreprises autonomes.
6 Ceographia Polonica http://rcin.org.pl

82 L. M. Zaltsman, S.J. Polovenko
On organisera aussi de nouvelles entreprises et complexes d'Etat agricoles interéconomiques sur les terres mises en valeur.
Nous croyons que le nombre total d'entreprises agricoles en URSS pour les dix prochaines années restera le même ou diminuera, mais chaque entreprise augmentera le volume de sa production. Quant aux types de production des entreprises agricoles, l'approfondissement de la spécialisation de l'agriculture mènera sans doute à la diminution du nombre des types de production aux activités multiples (avec trois-cinq branches marchandes) et à l'augmentation parallèle du nombre des exploitations à une branche qui s'occupent soit des fonctions de service, soit de la production d'un seul produit agricole et même d'une partie de ce produit (ou du stade de sa production).
Voilà l'état réel et les tendances de la concentration et de la spécialisation ultérieure de la production agricole et la dynamique de développement des types de production des entreprises agricoles et agroindustriels de l'URSS dans la prochaine décennie.
http://rcin.org.pl

GEOGRAPHIA POLONICA 40, 1979
A G R I C U L T U R A L T Y P O L O G Y O F T H E U S S R
L . I . G O R B U N O V A , M . V . K O M L E V A , L . V . SHISHKINA
Faculty of Geography, Moscow State University, USSR
In modern agro-geographical research the regional problems of agriculture are being examined from a comparative geographical point of view, revealing territorial similarities and differences. At the same time, a comparative analy-sis of the production types of agriculture taking shape in different countries in similar natural conditions is, in this case, of great scientific and practical significance. Such a comparison is possible if the typological studies are based on unified criteria and methods. In this connection, the method of typology of world agriculture developed by the Commission of the International Geogra-phical Union, under the chairmanship of Professor J. Kostrowicki in 1976, is of particular interest. -
This paper is devoted to the identification of the types of agriculture in the USSR on the basis of the methods suggested by the Commision (J. Kostrowicki 1976) and thus forms part of the research on the typology of world agriculture. Moreover, this report presents the experience gained in using these methods in the specific conditions in individual countries.
The 1970 data on collective farm agriculture in individual republics and provinces, published in the statistical year-books, serve as the main source of information. The 24 agricultural variables envisaged in this method were calcu-lated for 140 provinces and republics covering the main agricultural territory of the Soviet Union.
The variables obtained for each area were then coded in classes of the world scale and submitted in accordance with the method in the following form, T = S C, where T — type of agriculture, S — social attributes, O — opera-tional attributes, P — production attributes, and C — structural attributes.
In this research gross production was assumed as being equal to commercial production, since we think that in our circumstances for most of the variables of this method connected with the gross production, it is more admissible to use data on the commercial production. Therefore the index of the degree of commercialization for the types of agriculture of the USSR was taken at an interval of 3-5 classes of the world scale.
In all the models of types of agriculture envisaged for the USSR the first three variables of the groups of social attributes were replaced by zero values, since in our country there is no land operated under servile or share tenancy or owned privately by an individual or a group of people.
Thus the codes of each of the administrative units have been compared with the modified codes of the most similar models of types of socialized agri-culture. Model type Se, i.e., socialized incipient mixed agriculture, envisaged for the USSR formed an exception, which we did not examine since it did not
6* http://rcin.org.pl

84 L. I. Gorbunova, M. V. Komleva, L. V. Shishkina
in its social attributes, correspond to the types of agriculture in our country. Moreover, the term 'incipient' itself obviously needs to be defined more prec-isely.
Deviations from the model were determined by the following formula (R. Szczęsny 1976),
n So = y (aki-ali),
j= l where So is the distance between the code of the given area and the model code, n — consecutive series of the variables coded in the classes of the world scale, aki — the value of the j-index of the model, ah — the value of the j-index of the given area.
In accordance with the method, each administrative unit is related to any agricultural model type if its indices do not deviate from this model by more than 10 variances. Areas where the variables deviate from the theoretical models by more than 10, are characterised by an intermediate or combined type of agriculture, and in type-forming those models from which deviation (So) was the least were examined. The models, the total deviations from which exceeded the established threshold more than twofold, were not dealt with.
Fig. 1. Types of agriculture of the USSR (according to the methods of the IGU Com-mission on Agricultural Typology)
Smm — Mixed agriculture See — Agriculture specialised in grain crop growing Sll — Extensive livestock breeding with subsidiary crop growing Srr — Specialised livestock grazing Stc — Agriculture specialised in cotton growing and other technical crops on the basis of
artificial irrigation Smc — Mixed agriculture with crop growing prevalent Stt — Agriculture specialised in tea growing
http://rcin.org.pl

Agricultural typology of USSR 85
The analysis conducted made it possible to identify 15 types of agriculture in the USSR, which are presented in Map 1. As the research was conducted on the level of comparatively large administrative units, provinces and individual republics, i.e., territories which are not internally uniform in their natural and economic conditions and type of agriculture, there were obtained characteristics which included features of several models of world agriculture. It is partly for this reason that types of agriculture specialized in vegetable and fruit gro-wing, and some others of which narrower territorial localization is typical, were not reflected in our classification.
A certain approximation of the territorial distribution boundaries of some types of agriculture in this paper does depend on the use of indices for only one year. This applies above all to the arid territories of the Soviet Union where the indices of the volume and structure of agricultural production vary greatly from year to year, depending on meteorological conditions.
The formalized characteristics of the types obtained in the form of indices of classes of agricultural attributes are given in Table 1. Moreover, the mean limits of the changes of variables in individual areas relating to the given type are indicated. Table 2 shows the values of the deviations of territorial units relating to the corresponding type models.
T A B L E 1. The extent of the deviations in the types of agriculture of the U S S R from the models of the world classification
As can be seen from Table 2, the degrees of deviations, which considerably exceed the limit envisaged by the method, are to be found in those mixed ty-pes which are characterised by models of highly specialised agriculture — See (Socialized agriculture specialized in grain crop growing), Stc (Socialized agri-culture specialized in cotton growing), and Srr (Specialized livestock grazing). This fact demonstrates that high specialization is not really typical of the ma-jority of holdings (in the given case collective farms) in the Soviet Union.
http://rcin.org.pl

86 L . I. Gorbunova, M. V. Komleva, L. V. Shishkina
TABLE 2. Formalized characteristics of the types of agriculture in the USSR
Usually, on the basis of different types of lands and of technological and other conditions, several main branches of agriculture are combined in one and the same economy. Consequently, the variables in Table 2 show indirectly that models suggested for the Soviet Union insufficiently reflect the peculiarities of large agricultural enterprises.
The type of agriculture Smm, i.e., socialized mixed agriculture, is typical of the northern half of the European USSR, which is located in the soddy-po-dzolic soil zone. A number of its indices testify to the prevalent role of lives-tock breeding. The most similar to the model Smm are the attributes of the agriculture in the western parts of the forest zones within the boundaries of the Baltic republics, Byelorussia and the north-western Ukraine and also for the territories adjoining the major industrial centres — Moscow and Leningrad. Agriculture in these regions and in the regions located more eastward differ in the comparatively high indices for the degree of intensity, in particular, inputs of mechanical power, chemical fertilization, the density of cattle popula-tion, and others.
http://rcin.org.pl

Agricultural typology of USSR 87
Attributes of agriculture in the central part of the forest zone also appeared to be very similar to type Smm, although the number of their deviations from the model slightly exceeded the limit permitted by the method (11-12). On this basis, we have identified the given territory as similar to a partcular area of type Smm, showing it on the map in a lighter shade.
In the northern parts of the taiga zone agriculture is the least intensive. Cattle breeding is primarily based on the resources of the natural grassland (type Sll/Smm). In a large part of this territory agriculture is poorly developed and only supplements hunting, fishing and other activities of the farming po-pulation.
As the forest zones change to predominantly black earth zones of the forest--steppe and steppe, the livestock breeding type of mixed agriculture of the European USSR changes to crop growing with livestock breeding types (Smm/ /Smc and Smc).
The zone with the intermediate type Smm/Smc includes most of the regions in the Ukraine and Northern Caucasus. The increased role of the branches of crop growing involving high percentage of arable land that amounts to 70-80 per cent on average. Farming is specialized in the production of industrial, i.e., sugar beet, sunflower, hemp and grain crops. Intensive livestock breeding ba-sed on field forage and waste from industrial processing of agricultural raw materials, is only second to crop growing by a small margin in the value of its commercial production.
The territory under review is not internally uniform. Its western and cen-tral parts within the bounds of the forest-steppe of the right-bank Ukraine which has the most favourable combination of heat and moisture, have high indices of the degree of intensity of agriculture. To the south and the east of this region the indices of intensity fall together with increased farming spe-cialization in grain growing and the less important role of sugar beet.
In the number of deviations several areas of the Ukraine steppe fell into type Smm, which is more typical of the western part of the forest zone.
The type of agriculture Smc is most marked in Moldavia. More than two--thirds of the value of the entire commercial production falls to crop growing specialised in the production of industrial crops, grapes and fruit.
Agriculture of the eastern parts of the forest and forest-steppe zones of the European USSR and of the forest-steppe plains of Siberia combine the features of two model types, mixed agriculture with livestock breeding prevalent (Smm) and agriculture specialised in grain crop growing (See).
An analysis of the typological codes of provinces related to the given type, reveals certain differences in the character of agriculture within the bounds of that vast region. The territories of the regions of the European forest-steppe have been most subjected to ploughing and the role of industrial crops is more marked, in connection with which farming is more varied in the composition of its branches. In the forest zone the commercial value of crop growing de-creases and increases again in the west-Siberian forest-steppe. To the east of the Urals the forms of farming and livestock breeding become more extensive, to which the relatively low indices for fertilisers and the large proportion of natural grassland in the total amount of agricultural land testify in particular.
The type of agriculture in the Volga steppe, the Southern Urals, Kazakhstan and the Altai area corresponds to a great extent to model See, i.e., socialied agriculture specialised in grain crop growing. However, the agricultural attri-butes which are in fact observed for this territory also point to the substantial role of livestock breeding.
http://rcin.org.pl

88 L. I. Gorbunova, M. V. Komleva, L. V. Shishkina
Just as in the formerly discussed area, the indices of the intensity of far-ming and livestock breeding fall markedly from west to east, and the propor-tion of hayfield and pastureland to the total agricultural land increases.
Agriculture in the regions of Kazakhstan located further south, on the bo-undary of the steppe and semi-desert zone, can be simultaneously related to two model types See and Sll (socialized agriculture specialized in grain crop growing and extensive livestock breeding with subsidiary crop growing). This is connected with the fact that in the farmed steppe areas of the given territo-ry grain growing and livestock breeding economies predominate, and in the semi-desert conditions where the extreme aridity limits farming, there are extensive livestock breeding economies similar in type to model Sll.
It should be noted that the differences in the indices of the ratio of com-mercial branches, observed within this area, is connected not only with the non-uniform nature of the landscape in individual provinces, but may, appa-rently, be determined by the particular meteorological conditions during the year, the statistical data of which have been examined in this research.
The extensive types of livestock breeding economies Sll and Srr are most common in the semi-desert and desert territories, where farming without arti-ficial irrigation is inefficient, and nine-tenths and more of the total agricultu-ral land falls to the share of pastureland.
The area of comparatively intensive livestock breeding can be identified in the southern and northern semi-desert areas around the Caspian Sea. Alt-hough farming in this area also plays a secondary role, however, thanks to the increased precipitation, and in a number of places due to artificial irrigation, it has become more productive. Resources of the natural grassland are richer than in the more southern and eastern parts of the semi-desert, and the indices for the density of livestock population are higher.
The cotton-growing areas (type Stc; i.e. socialized agriculture specialized in cotton-growing) include the territories of the republics of Central Asia and of Azerbaijan where there are large reserves of heat, as well as lands suited to cotton cultivation, and where the water resources make it possible to orga-nise large-scale artificial irrigation.
Attributes of agriculture in these areas, testify to the predominant role of highly intensive irrigated farming at oases. The degree of intensity of livestock breeding differs in various provinces in the desert territories livestock grazing is developed in the most extensive forms. Livestock breeding is most intensive in the foothill-semi-desert zone where there is irrigated farming and dry-far-ming. Here the indices for the density of the cattle population are considerably higher, although the natural grassland take up less than half the agricultural land.
The Georgian SSR is similar to the model type Stc in its attributes. In con-nection with its specialization mainly in tea growing (almost two-thirds of the value of the entire commercial production falls to the share of tea) we classify the type of agriculture in this republic by index Stt.
The areas of Kazakhstan and Kirgizia which are situated at the foot of the Tien-Shan are distinguished by a particular type of agriculture (Sll/Stc). The important role of extensive livestock breeding in this territory is brought about by the vast deserts and mountain pastures. Irrigated farming specialized in the production of southern industrial crops is quite common.
Closing this short geographical review of the types of agriculture in the USSR the following conclusions can be drawn.
(1) Application of the method of agricultural typology developed by the Com-
http://rcin.org.pl

Agricultural typology of USSR 89
mission of the IGU, has made it possible to reveal the most substantial diffe-rences in the production types of agriculture. These differences consist of the peculiarities in the combination of the main branches of agriculture, and of the attributes of the degree of intensity of agricultural production and of its effi-ciency.
(2) The picture of the territorial distribution of the types of agriculture iden-tified on the basis of the Commission's method, is not on the whole in contra-diction to the geographical differentiations in agriculture, which have in fact been observed for the Soviet Union (Rakitnikov A. N. 1972, 1973), despite the fact that comparatively large administrative units were taken into considera-tion in our research.
Moreover, it should be noted that for certain areas in our country the for-malized classification was not completely identical to the type of agriculture which actually exists. In our opinion, the results of the typology for the western half of the European part of the Soviet Union were the most successful. A con-siderable part of this territory, which is not uniform from a physico-geographi-cal point of view, was characterised by one type of agriculture Smm (socialized mixed agriculture). According to the same sum of the deviations from the mo-del, the Baltic republics and the areas of the Ukraine steppe came under this type, although they differ substantially in a number of the most important ty-pological agricultural indices, i.e. the orientation of crop growing, the combina-tion of livestock breeding and crop growing, the attributes of the degree of in-tensity of these branches, the structure of the agricultural lands and others.1
In the classification there were no types similar to the type of agriculture in the northern areas where poorly developed agriculture is combined with hunting, fishing and other non-agricultural activities.
The disparities mentioned can, obviously, be explained, firstly by the insuf-ficient number* of models, proposed for the given territory (Smm and Smc) and, secondly, by the similarity between them.
For the rest of the territory of the USSR the results of the agricultural ty-pology were more satisfactory.
An analysis of the indices for agriculture in individual provinces within the area of most of the types revealed considerable differences in the value of the attributes characterising the commercial specialisation and the degree of intensity of agriculture. This undoubtedly testifies to the fact that the major above mentioned type-form: indices of agriculture are insufficiently re-flected in the method proposed. Therefore in a number of cases we did not manage to classify the specialisation and degree of intensity of agriculture in great detail. In particular, we did not succeed in classifying types of econo-mies with particular specialisations and methods of cultivation such as flax growing and sugar beet growing. And within the grain crop growing areas, we did not manage to delimit territories with types of economies differing substan-tially in the degree of intensity, and so forth.
Proceeding from the variables of the world classification and supplementing them with a wider range of particular variables characterising the specialisation of agriculture, we have attempted to make a further differentiation of the types of agriculture in the USSR. Moreover, in accordance with the method of typo-
1 By way of example, the typological codes for Estonia 133551 j and the
Dnepropetrovsk region 114332j are given, a comparison of which confirms the above said.
http://rcin.org.pl
90 L . I. Gorbunova, M. V. Komleva, L. V. Shishkina
logy commonly accepted in our country (Rakitnikov A. N. 1970; Kuzina I. M., Yanvaryova L. F. 1976), we classified the territories which differ in the com-bination of the main economic functions of agriculture and the degree of inten-sity both of individual branches and of agriculture as a whole.
The indices of the structure of commercial production, preliminarily con-verted into the conventional grain units, proposed by the Commission, were used in characterising the specialisation. The degree of intensity was identified with the help of integral variables, calculated on the basis of certain individual variables of the method of world classification according to the following for-
1 * mula, 1= — £ aKi, where I — degree of intensity, aK¡ —the values of
f l i = l the individual indices characterising the method of management of the econo-my, which have been coded in classes of the world scale, and n — number of variables.
In determining the general degree of intensity of agriculture, the following indices were taken into account, inputs of labour and mechanical power per unit of area, chemical fertilisation per hectare of arable land, the proportion of arable land in the structure of all the agricultural lands, the proportion of irri-gated lands and the proportion of harvested land to all the arable land, the proportion of industrial crops to the entire commercial production, the density of the livestock population per 100 hectares of agricultural lands, and the value of the commercial production in conventional grain units per hectare of agri-cultural land.
To determine the degree of intensity of crop growing we took the indices for inputs of labour, mechanical power and chemical fertilizers per unit of area, the irrigation indices, the proportion of the harvested area to all the arable land and the proportion of industrial crops to the entire commercial production.
The generalised index of the degree of intensity of livestock breeding was determined as a quotient of dividing the class of index of the density of the cattle population by the value of the class of index of the proportion of natural grassland to the total agricultural land.
The results of the typology of USSR agriculture, which corresponds to our understanding of a productive type of agriculture, are reflected in Map 2.
The introduction of supplementary variables for commercial specialisation and stressing the variables for the degree of intensity of agriculture has made it possible for us to improve the results of this research to render the classifi-cation of the types of agriculture for the conditions in the Soviet Union more concrete and to delimit more correctly the area of individual types of agricul-ture on the map.
Comparison of Map 1 and Map 22 did not reveal any principle differences in the results of using typological methods. On this basis it may be concluded that the method proposed by the Commission, with a somewhat more precise definition of the models can serve as a useful tool in studying the territorial differences in agriculture. The use of this method not only facilitates the orga-nisation of large-scale statistical material and the identification of the major types of agriculture, but also provides a comparison of the results obtained in different studies.
2 For convenience of comparison, in the detailed legend to Map 2 formalized characteristics or the type of agriculture according to the method of J. Kostrowicki are given.
http://rcin.org.pl

Agricultural typology of USSR 91
Fig. 2. Types of agriculture of the U S S R
Total indices of the degree of intensity Index Typological code agriculture crop livestock
as a whole growing breeding
http://rcin.org.pl
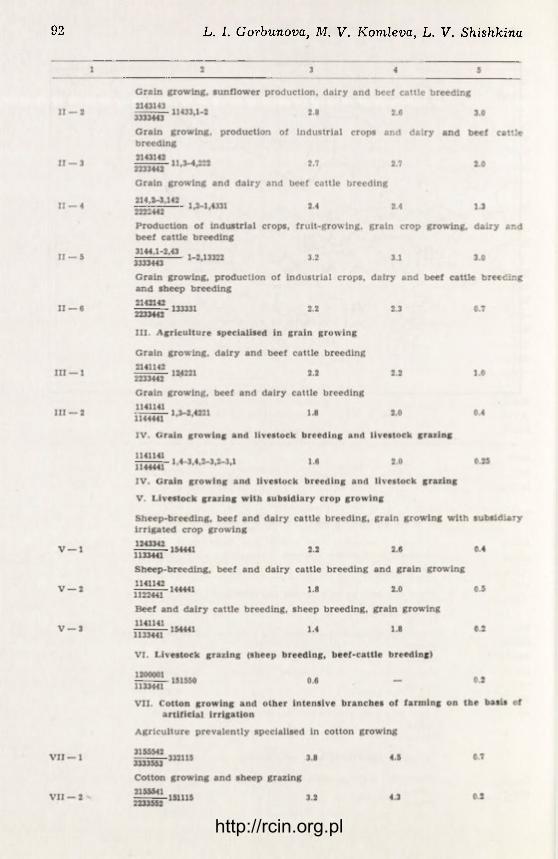
92 L . I. Gorbunova, M. V. Komleva, L. V. Shishkina
http://rcin.org.pl

Agricultural typology of USSR 93
REFERENCES
Kostrowicki J., 1976, World types of agriculture, IGU Commission on Agricultural Typology, Warsaw,
Kuzina I. M., Yanvaryova L. F., 1976, Types of world agriculture map for higher schools, in: XXIII International Geographical Congress, Commission on the Ty-pology of Agriculture (summaries of the papers), Moscow-Odessa, pp. 70-72.
Rakitnikov A. N., 1970, Geografiya selskogo khozaystva, Problemy i metody issledo-vaniya (Geography of agriculture. Problems and methods of research), Moscow.
Rakitnikov A. N., 1972, Methods of typology of agriculture and their testing in the studies carried out, in: C. Vanzetti (ed.), Agricultural typology and land utiliza-tion, Verona, pp. 315-323.
Rakitnikov A. N., 1973, Geografiya selskogo khozaystva SSSR, in: Geography of agri-culture of the USSR. Ekonomicheskaya Geografiya SSSR, Moscow, pp. 235-300.
Szczęsny R., 1976, Shifts in the territorial distribution of farming in Poland from 1960-1970, in: XXIII International Geographical Congress, Commission on the Typology of Agriculture (summaries of the papers), Moscow-Odessa, pp. 121-122.
http://rcin.org.pl

http://rcin.org.pl

GEOGRAPHIA POLONICA 40, 1979
A P P L I C A T I O N O F T H E R E V I S E D S C H E M E F O R T H E T Y P O L O G Y O F W O R L D A G R I C U L T U R E T O C A N A D A
M . J . T R O U G H T O N
Department of Geography, University of Western Ontario, London, Canada
I N T R O D U C T I O N
The paper presents preliminary results and discussion related to the appli-cation of the third version of the typology of world agriculture (Kostrowicki 1976) to Canada. As such, it represents a further stage in an iterative process, whereby successive versions of the global typology scheme are tested at the national level, in an effort to provide both substantive results and critical eva-luation of the scheme itself. Although, as Kostrowicki notes, the third version is the last for which the I.G.U. Commission has responsibility, the process will undoubtedly continue.
The first version of the typology was presented in Hamilton in 1972 (Kostro-wicki 1972) and established the principle of development and use of a set of indices relating to the internal characteristics of agriculture, as the basis of a taxonomic classification of types. The second version, which emerged after the 1974 Verona meeting (Kostrowicki 1974), and the present version have maintained this approach, despite significant modifications that have been made to the actual list of variable indices. The meetings of the Commission have also discussed methods of combining the indices into types. Although Kostrowicki, in the third version, suggests that no specific analytic technique is preferred, model types are presented upon which to base analysis of variation. The third version then, presents a revised set of 27 variables (indices), an expanded set of model types, and the guidelines for the calculation of variables and model types (Kostrowicki 1976).
This author presented an initial approach to Canadian agricultural types, based on version one, in Verona (Troughton 1974), and made a similar response to version two, in Paris (Troughton 1975). In the former paper an attempt was made to expand the set of indices, while both responses employed the techni-ques of cluster analysis to determine types. In this, initial response to version three, much stricter attention is paid to the specifics of the scheme. An attempt was made to derive the complete set of indices as specified for each Canadian agricultural unit area. Primary analysis of the array of indices directly utilized the set of model types. Cluster analysis has then been applied to the 27X253 data matrix to provide a direct comparison. Maps have been constructed of the resultant types and of some of the critical indices. The rest of the paper follows the sequence, derivation of the indices, analysis and results.
http://rcin.org.pl

96 M. J. Troughton
DERIVATION OF THE INDICES
The third version of this typology specifies 27 indices grouped in four broad categories. Three indices (15, 16 and 17) are repeated, so that there are in fact 24 separate measurements. The four broad categories are those of (1) Social Attributes, (2) Operational Attributes, (3) Production Attributes, and (4) Struc-tural Characteristics (Kostrowicki, 1976). Derivation for Canadian agriculture was based on the 253 Agricultural Census Divisions of the 1971 Census of Agri-culture; 1971 was also the base year for data. Considerable variation existed in respect of (1) availability of data, as specified in the schema, (2) in the resultant range of conditions compared to those specified at the global scale, and, (3) in the impact, therefore, of specific variables on the resultant agricultural types.
T A B L E 1. Percentage Occurrence of Canadian Agricultural Areas (Census Divisions) by Class as Specified in Typology Scheme
C L A S S E S
V A R I A B L E S (Indices) 1 2 3 4 5
1. Tenure-Traditional 100 — — — —
2. Tenure-Servile 100 — — — —
3. Tenure-Individual — — — — 100
4. Tenure-State 100 — — — —
5. Size /'Person 90 10 — — —
6. Size/Land Area < 1 6 68 25 1
7. Size/Gross Output 1 22 77 — —
8. Labour/Area 50 47 2 1 —
9. Animal Power 100 — — - - —
10. Mechanical Power — — — — 100
11. Fertilizer 12 32 32 17 7
12. Irrigation 93 4 2 1 —
13. Cropping Intensity — — 10 90 —
14. Livestock Intensity 12 27 48 10 3
15/15a G . A . O . / A r e a 2 35 49 13 1
16/16a G.A.O. /Person — 1 6 28 65
17/17a G.A .O. /Commercial — — — — 100
18. C . A . O . / A r e a < 1 20.5 41 37 1
19. Perennial Crops 99 1 — — —
20. Grassland 38 54 6 2 < 1
21. Food crops 75 16 6 3 —
22. % G . A . O . Livestock 10 19 38 28 5
23. % C . A . O . Livestock 13 17 41 25 4
24. Industrial Crops 94 6 — — —
The variables (indices) are discussed here according to the four attribute groups. A Table (1) has been constructed which gives a crude indication of the variable range within data items, and has been made the basis for choice of mapping of a selection of variables, i.e. some of those with the greatest variation and im-pact in Canada.
http://rcin.org.pl

Typology of Canada agriculture 97
SOCIAL ATTRIBUTES
The first seven indices pertain to socalled social attributes. The first four, representing perhaps the most significant departure from earlier versions of the typology, represent an attempt to specify tenure conditions. The latter three are measures of size of holding according to labour, land and output respectively.
While this author believes that it is very necessary to include tenure condi-tions within the typology on a quantified, rather than on the previous non--quantified basis, and applauds the adoption of this solution, these are not variables which contribute to variation at the national level. In Canada the proportion of agricultural land held under customary rights (Variable 1), in lan-ded bondage (Variable 2), or on a socialized basis (Variable 4) is nil or negligib-le. Similarly there are no Census Divisions where land held in 'individual ownerlike possession' (Variable 3) falls much below 100 percent. In an earlier analysis (Troughton 1974) other tenurial distinctions within Canada were ex-plored, for example the proportion of tenancy and the degree of rented land. It would be appropriate to utilise these variables at the national level when it is recognized that, in global terms, Canada's tenure variables are 1.1.5.1 overall.
Size of holding constitutes a critical set of variables, and significant distinc-tions are found across Canada, especially in terms of land area (Variable 6), but also in terms of people engaged per holding (Variable 5) and output per holding (Variable 7), although in the latter two cases the variation is masked by the very broad class intervals employed in the global scheme.
The number of people actively employed in agriculture is not available as a raw data item. An estimate was achieved by assuming a level of 1.5 occu-pied family members or operators per holding and by converting figures of 'weeks paid labour' to many-year equivalents. The total matches closely the national figure for farmer and labour populations but there may be some dis-tortion of regional variation. Some areas in Eastern Canada fall in the 2-8 class which does mask distinctions between some more labour-intensive horticultural (5-8) and less intensive holdings. Overall, only about 25 percent of Canadian farms employ the equivalent of a full-time hired labourer, and even the large Prairie farms tend to fall into Class 1 (below 2) on this scale.
Land area per holding (Variable 6) was derived using the census categories "farmed land", less "woodland". The majority of farms lie in class 3 (20-100 ha) but with 25 percent in Class 4 (100-1,000 ha), predominantly in the Prairie pro-vinces. Very large and very small average holding sizes are typical of a few census divisions.
Size measured by gross agricultural output (G.A.O.) per holding produced averages ranging from less than 100 to greater than 3,500 conventional units, although this only covers classes 1 to 3 in the scheme. Generally, increases in total output matched increasing average agricultural area per holding, with some important exceptions particularly with respect to areas producing indu-strial crops, e.g. tobacco. The derivation of gross agricultural output is discus-sed in connection with Production Attributes, below.
OPERATIONAL ATTRIBUTES
This variable group includes seven measures, the first five of which refer to what might be termed basic inputs, i.e. labour, energy, fertilizer and irriga-tion. The last two are composite measures of crop and livestock utilization. With the exception of Variable 9 (input of draft animal power) all are applicable to Canada, and result in some regional variation although, once again, the typolo-
7 Geographia Polonica http://rcin.org.pl

Fig. 1. Intensity of livestock breeding: number large animal units per 100 ha agri-cultural land (variable 14) '
http://rcin.org.pl

Typology of Canada agriculture 99
gy class intervals serve to mask this somewhat. Difficulties are found with respect to data availability, and it might be argued that measures made in fi-nancial terms might offer a better basis for record and comparison under strict-ly Canadian circumstances.
Inputs of labour per 100 ha agricultural land (Variable 8) combines varia-bles 5 and 6, with the same problem of calculating labour. Animal power (Va-riable 9) may rise above 2 units per 100 ha cultivated land (i.e. Class 2) in a few localities, but the aggregation of work and sport horses makes it impossible to derive.
Both tractors and other machinery (Variable 10) and chemical fertilizers (Va-riable 11) are typically recorded as dollar investment in Canada, so that estima-tes based on secondary information had to be used to achieve the measures as inputs of horsepower (HP) and pure nitrogen, phosphate and potassium (NPK), respectively. Mechanical inputs were universally over 90 HP per 100 ha culti-vated land, although there is considerable variation across the country within that highest class. Chemical fertilization produced results that placed individual census divisions in all five classes. On the other hand data did not allow more than a provincial average to be achieved for each of the three Prairie provin-ces. Finally, of the inputs, irrigation calculations were easily made. The classes specified, however, tend to mask the local significance of irrigation in a num-ber of divisions where the percentage of land affected is between 5 and 10 percent.
Intensities of cropland use (Variable 13) and livestock breeding (Variable 14) are both significant measures in Canada. While Canada as a whole falls into the 70-130 (or rather 70-100) percent harvested to arable range, the very large acreages of summer fallow on the Prairies produce significant areas with less than 70 percent cropland harvested in a given year. Finer division of the classes would probably provide better internal definition of both core and peripheral Prairie areas, and single out some of the few areas of significant summer fal-lowing (i.e. 10-30 percent) elsewhere in the country. Livestock breeding, on the other hand, is very well differentiated, and this variable has been mapped according to the five typology classes (Fig. 1), and may be contrasted with the proportion of productivity represented by livestock (Variable 22 and Fig. 3). Otherwise, livestock are not well represented or differentiated in the typology. This is critical in a country like Canada where livestock specialization is more common than crop specialization. «
PRODUCTION ATTRIBUTES
Four socalled production attributes are specified in this typology, but the first three are used twice, for emphasis, so that there are actually seven items in this sub-set. The basis of the data items are the calculations of gross and commercial productivity based on socalled conventional weight equivalents of both crop and livestock items. Insofar as this base is also used in the calcula-tion of Variables 7, 22 and 23, it is integral to the whole scheme. Unfortunately, the choice and calculation of weight equivalents is not easy in Canada, and some doubt exists as to the accuracy of data and, consequently to its inter-pretation.
In the introduction to the concept in the second version of the scheme (Kos-trowicki, 1974) the argument is made that the list of items for which weight equivalents are listed is generally complete and that the conventional units themselves, while artificial, represent a comparative scaling of both crop and livestock elements. Nevertheless, in practice the scheme presents problems due
7* http://rcin.org.pl

Fig. 2. Land productivity: gross agricultural output in conventional units per 1 ha agricultural land (variable 15, 15a)
http://rcin.org.pl

Typology of Canada agriculture 101
to the numerous conversions and calculations required, and some ambiguity as to what items are to be included; both to measure overall gross production and as representing a commercial basis.
The Canadian Agricultural Census records 23 field crops, 17 vegetable crops, and 12 fruit crops. Out of the over 20 animal categories, 12 were used directly, together with calculations for milk, eggs and wool. Using both federal and provincial sources, a matrix of conversion factors was constructed for each item for each of the 10 provincial units, and then applied, where appropriate to the crop and livestock totals for the 253 Census of Agriculture Divisions. This exercise, in itself provides room for error in the large set of calculations.
The question of what is legitimately gross agricultural production is not absolutely clear in the published versions (Kostrowicki, 1974, 1976). One has to assume that every hectare of every crop, converted to weight equivalents, re-presents gross plant production. For livestock, however, the question is diffi-cult and there are problems of double-counting. In this case it was decided to derive totals for milk, eggs, and meat production from different types of ani-mals. One problem is that of deriving the proportions of animals slaughtered and meshing them with animal census counts.
Given this array of plant and livestock totals as gross production, what then is commercial production? One answer might be to discount all plant materials that are converted on the farm, but this, in turn, raises the problem of mo-vement and use of feed grains and other fodder crops. On the other hand, the interpretation of 'commercial' could be that of all gross production not humanly consumed on the farm by the farm population. This also is difficult to calculate except on a broad proportional basis. In Canada one must assume that all but a very small percentage of gross production is in fact 'commercial' in this sense.
In Canada both land productivity, i.e. gross production per hectare agri-cultural land (Variable 15), and labour productivity, i.e. gross output per per-son in agriculture (Variable 16), produce considerable variation. On the other hand, degree of commercialization (Variable 17) was everywhere assumed to be over 95 percent (Class 5). On the same basis, it was assumed that commercial productivity per hectare (Variable 18) would, with minor exceptions, be the same as for gross production (Variable 15).
Because of this heavy impact, land productivity (Variable 15, 15a and 18) has been mapped (Fig. 2). As one might expect, intensity of production ranges from very low levels across the Prairies, to very high in areas of the country in which crops with high weight equivalents (e.g. tobacco, corn, horticulture) and livestock (especially pigs, broiler chickens, and dairy cattle) are found on small or medium-sized farms.
Labour productivity (Variable 16, 16a) shows less variation and its calcula-tion is still subject to the problems of calculating an agricultural population. Generally, it provides an inverse relationship to land productivity, and peaks in the extensive wheatlands of the Prairies, at levels well over 3,000 conven-tional units per person. The interrelated nature of a small number of basic pro-ductivity attributes gives the possibility that any errors in calculation or inter-pretation could be compounded in the scheme.
STRUCTURAL CHARACTERISTICS
The final six variables are termed structural items. The first three and the last (Variables 19, 20, 21 and 24) identify groups of farmland use. The question may be raised as to why crop types are specified but not livestock. The other two variables record the gross and commercial emphasis placed on livestock.
http://rcin.org.pl

Fig. 3. Gross production emphasis: proportion of animal products to total gross agricultural production (variable 22)
http://rcin.org.pl

Typology of Canada agriculture 103
Again, in Canada, there is the problem of separation. Available estimates suggest that not more than 1 -3% of gross livestock production is actually con-sumed on farms. Consequently, with a few exceptions along class boundaries, commercial livestock emphasis (Variable 23) is placed in exactly the same class as gross livestock emphasis (Variable 22).
Perennial crops (Variable 19), it was assumed, do not include grasslands; on that basis, only three census divisions were identified above the Class 1 level. Permanent grasslands (Variable 20) were identified on the basis of adding 'improved' and 'unimproved pasture' census categories, and resulted in a con-siderable range. However, the differences in enterprise and in productivity bet-ween these two grassland types, makes the aggregation and assignment of a composite grassland category of doubtful typological value in Canada. Simi-larly, primary food production (Variable 21) which, for example, separates out categories of small grain growing (wheat = food; barley = feed) despite the fact that the two are grown interchangeably under the same system over wide areas. This category also includes tree fruits which have already been identi-fied under perennial crops. With respect to industrial crops (Variable 24), in Canada most of these, notably soyabeans in eastern Canada, and rape, flax, and mustard seed in the Prairies, are grown as part of general small grain — oil seed cash crop enterprises in which there is a great deal of flexible crop substi-tution. In fact, only sugar beets and tobacco, both grown on very limited acre-ages, seem to meet the degree of specialization implied by the category.
Finally, as noted, livestock emphasis is covered in two variables (22 and 23). Variable 22, gross livestock emphasis is mapped (Fig. 3) and may be compared with the earlier map of intensity of livestock production (Fig. 1). The variations are interesting, for example, parts of the Prairies which show up as of very low intensity (Fig. 1) are revealed as having a relatively heavy livestock concentra-tion (Fig. 3), relating to the emphasis of recent years on the growing of feed grains, especially in Manitoba and Alberta.
In brief summary; the revised set of 27 variables is undoubtedly an impro-vement over earlier sets, especially as regards tenure items and the greater se-paration of operational, production and structural attributes. Nevertheless, the-re are still problems of derivation, of certain ambiguities in interpretation, and of the possibility of the compounding of errors and greater emphasis than was intended being placed on certain variables. Kostrowicki, has suggested that modifications may be made in national data sets in terms of additional variab-les (Kostrowicki 1974) and it does seem that once the global set has been applied, that this approach should be developed at the national level (see Troughton 1974).
ANALYSIS AND RESULTS x
The data on which typological analysis was based consists of the matrix of 253 Census Division units, for each of which 27 variables are recorded in one of the five classes specified in the typology scheme (Kostrowicki 1976, pp. 10-20). To date, two analyses have been performed; firstly a direct comparison with the set of model types (Kostrowicki 1976, pp. 22-35), and secondly the derivation of types through the application of cluster analysis. In each case the results have been mapped and are critically discussed. Comparison of the two appro-aches leads to suggestions for the expansion of the 'model types' in Canada, and for further analysis.
http://rcin.org.pl
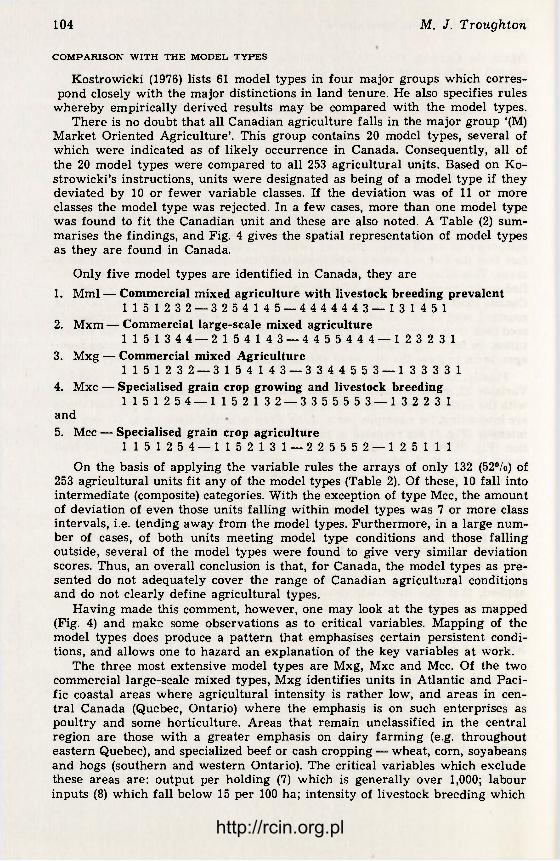
104 M. J. Troughton
COMPARISON WITH THE MODEL TYPES
Kostrowicki (1976) lists 61 model types in four major groups which corres-pond closely with the major distinctions in land tenure. He also specifies rules
whereby empirically derived results may be compared with the model types. There is no doubt that all Canadian agriculture falls in the major group '(M)
Market Oriented Agriculture'. This group contains 20 model types, several of which were indicated as of likely occurrence in Canada. Consequently, all of the 20 model types were compared to all 253 agricultural units. Based on Ko-strowicki's instructions, units were designated as being of a model type if they deviated by 10 or fewer variable classes. If the deviation was of 11 or more classes the model type was rejected. In a few cases, more than one model type was found to fit the Canadian unit and these are also noted. A Table (2) sum-marises the findings, and Fig. 4 gives the spatial representation of model types as they are found in Canada.
Only five model types are identified in Canada, they are 1. Mml — Commercial mixed agriculture with livestock breeding prevalent
1 1 5 1 2 3 2 — 3 2 5 4 1 4 5 — 4 4 4 4 4 4 3 — 1 3 1 4 5 1 2. Mxm — Commercial large-scale mixed agriculture
1 1 5 1 3 4 4 — 2 1 5 4 1 4 3 — 4 4 5 5 4 4 4 — 1 2 3 2 3 1 3. Mxg — Commercial mixed Agriculture
1 1 5 1 2 3 2 — 3 1 5 4 1 4 3 — 3 3 4 4 5 5 3 — 1 3 3 3 3 1 4. Mxc — Specialised grain crop growing and livestock breeding
1 1 5 1 2 5 4 — 1 1 5 2 1 3 2 — 3 3 5 5 5 5 3 — 1 3 2 2 3 1 and 5. Mcc — Specialised grain crop agriculture
1 1 5 1 2 5 4 — 1 1 5 2 1 3 1 — 2 2 5 5 5 2 — 1 2 5 1 1 1 On the basis of applying the variable rules the arrays of only 132 (52%) of
253 agricultural units fit any of the model types (Table 2). Of these, 10 fall into intermediate (composite) categories. With the exception of type Mcc, the amount of deviation of even those units falling within model types was 7 or more class intervals, i.e. tending away from the model types. Furthermore, in a large num-ber of cases, of both units meeting model type conditions and those falling outside, several of the model types were found to give very similar deviation scores. Thus, an overall conclusion is that, for Canada, the model types as pre-sented do not adequately cover the range of Canadian agricultural conditions and do not clearly define agricultural types.
Having made this comment, however, one may look at the types as mapped (Fig. 4) and make some observations as to critical variables. Mapping of the model types does produce a pattern that emphasises certain persistent condi-tions, and allows one to hazard an explanation of the key variables at work.
The three most extensive model types are Mxg, Mxc and Mcc. Of the two commercial large-scale mixed types, Mxg identifies units in Atlantic and Paci-fic coastal areas where agricultural intensity is rather low, and areas in cen-tral Canada (Quebec, Ontario) where the emphasis is on such enterprises as poultry and some horticulture. Areas that remain unclassified in the central region are those with a greater emphasis on dairy farming (e.g. throughout eastern Quebec), and specialized beef or cash cropping — wheat, corn, soyabeans and hogs (southern and western Ontario). The critical variables which exclude these areas are: output per holding (7) which is generally over 1,000; labour inputs (8) which fall below 15 per 100 ha; intensity of livestock breeding which
http://rcin.org.pl

Fig. 4. Identification of Canadian agricultural areas according to the World Agricul-tural Typology — 'Model types' (Kostrowicki 1976)
http://rcin.org.pl

106 M. J. Troughton
TABLE 2. Occurrence of Model Types for Canadian Agricultural Areas (Census Divisions)
Actual No. Percent
rises above 90 units per 100 ha over wide areas in eastern Canada (see Fig. 1); and levels of productivity, which tend to rise away from the margins. In addi-tion, primary food crops (Variable 21) are rarely as high as 60%. Consequently type Mxg fails to adequately represent the scale, intensity or specialization of agriculture in east-central Canada.
The other mixed type is Mxc which is identified for a number of areas in central Ontario, in Manitoba, and in Alberta. In this case the areas represented tend to be farmed more extensively relative to type Mxg, but this in itself causes classification problems. In eastern Canada several of the more extensive marginal areas in northern Quebec and Ontario fail to meet the levels of pro-ductivity specified (egs. Variables 7, 16). On the other hand, in the Prairies the-re is considerable overlap (6 units) with the even more extensive but speciali-zed grain growing type (Mcc), while no representation of extensive specialized livestock is made, for example the mountain interiors of British Columbia.
Specialized grain growing (Mcc) is perhaps the most distinctive agricultural type in Canada. However, even so the model type does not fit too well with ex-isting conditions. The critical variable is number 21 — primary food production. The model type specifies over 80 percent land use in food crops. In fact, now-here does the proportion reach 80 percent, and over wide areas it actually falls below 40 percent as barley and rapeseed replace wheat in the cooler more hu-mid areas. In addition, although Prairie holdings are the largest in Canada, they employ fewer people (Variable 5), are smaller in size (Variable 6), and average a smaller output (Variable 7), than the model type specifies. Where, as in Ma-nitoba, holding sizes decrease, or in Alberta where livestock assumes much greater importance (see Fig. 3), then the type gives way to Mxc or there is, as for six areas a composite of both types (Fig. 4).
The other model types are found in Canada in only a few small areas. Type Mxm, large scale mixed, identifies some areas in southern Ontario (as well as the Annapolis Valley apple — livestock area in Nova Scotia). However, this type, in turn fails to identify the very intensive cash cropping (i.e. on much smaller acreages than the West) in a wider area of southern Ontario (the so-
http://rcin.org.pl

Typology of Canada agriculture 107
-called Canadian 'corn belt) or other areas of specialist cash cropping, for example the potato area of northern New Brunswick. Finally, in two widely se-parated locales; the environs of Vancouver and of Quebec City, type Mml oc-curs. In Quebec there does indeed seem to be a 'european outlyer', but in Van-couver, category Mxg is also identified in this very intensive, small farm area. The net result, as Table 2 indicates, is for a partial, modified set of model types in Canada, fe
C L U S T E R A N A L Y S I S
The data matrix was used as input to a cluster analysis using the hierar-chical grouping programme MGROUP, available through the Social Science Computing Laboratory, University of Western Ontario, and specially designed to handle a large number of cases. On the basis of the error factors associated with each successive grouping of the cases (i.e. the census division units), a se-ries of sets of types was identified. With each successive clustering, the number of 'types' in the set is reduced, and the membership is more generalised. Con-sequently one is seeking to arrive at a compromise between a very large num-ber of similar but separate types and an aggregated, reduced, summary set.
Table 3. Occurrence of Agricultural Types determined by Cluster Analysis for Canadian Agri-cultural Areas (Census Divisions)
* numbers in text p. 110.
In this case four sets of 17, 11, 8 and 6 types, respectively, were identified (Table 3). These four groups were chosen on the basis of significant stages in the development of the hierarchy. The final set of six types most closely appro-ximates the derivation through model types (Fig 4), but in view of the range of conditions not covered by the model types, it was logical to seek a larger number than six types to cover the range of Canadian conditions.
The search for alternatives may be approached in two ways: one, concen-tration on areas not identified as belonging to model types, or two, use of the hierarchical grouping as a basis for an overall set of types, meeting the varia-
http://rcin.org.pl
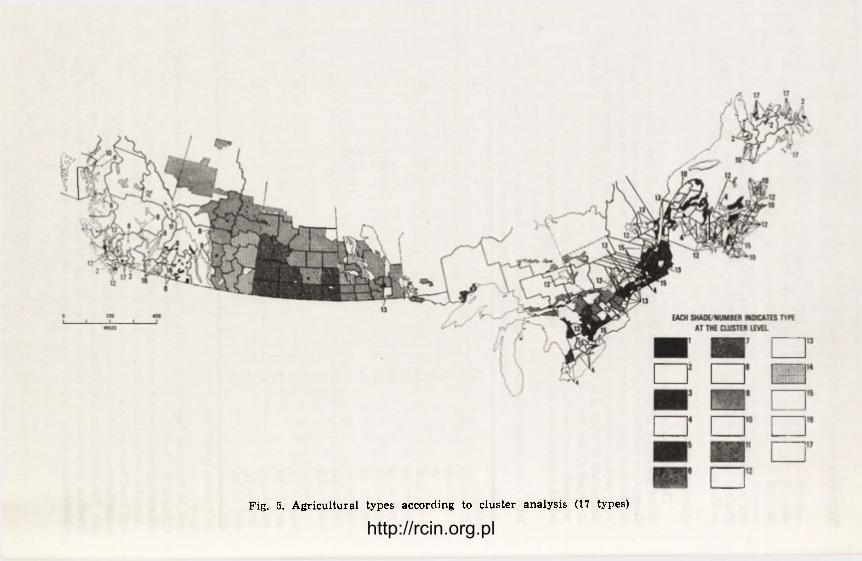
Fig. 5. Agricultural types according to cluster analysis (17 types)
http://rcin.org.pl

Fig. 5. Agricultural types according to cluster analysis (17 types)
http://rcin.org.pl

110 M . J. Troughton
tion criteria set down in the scheme. The latter approach was adopted, not least because the fit of model types was not clear in so many of the cases, and because, even at the cluster level of 17 types (Fig. 5) there are obvious discre-pancies with areas designated according to the model types.
Upon examination of the type variation scores, it is found that successive groupings down to, and including 8, maintain a situation whereby internal va-riation within groups is consistently less than the suggested 10 variable class deviations. This suggests therefore that each of the 17, 11, and 8 groups re-presents a valid typology but that 6 groups is too few. On the basis of attemp-ting to find the least number of well defined model types, selection of the 8 group set (Fig. 6) was made.
The eight types as identified by the hierarchical grouping procedure list as follows: (1) Small-scale intensive, vegetables and poultry predominant
(Newfoundland and Lower Mainland, B.C.) 1 1 5 1 1 3 2 — 2 1 5 4 4 — 3 3 4 4 5 5 4 — 1 3 1 5 5 1
(2) Extensive, medium scale, low intensity crop and livestock (Atlantic Canada and Vancouver Island) (closest to Mxg) 1 1 5 1 1 3 2 — 1 1 5 3 1 4 3 — 3 3 4 4 5 5 3 — 1 1 1 3 3 1
(3) Extensive, medium scale, moderate intensity, livestock other than dairy cattle (Western Quebec, Central Ontario) 1 1 5 1 1 3 3 — 1 1 5 3 1 4 3 — 3 3 5 5 5 5 3 — 1 2 1 3 3 1
(4) Extensive, crop and livestock, cattle (milk and beef) and hog emphasis (Eastern Townships, Western Ontario) 1 1 5 1 1 3 3 — 1 1 5 4 1 4 3 — 4 4 5 5 5 5 4 — 1 2 1 4 4 1
(5) Specialized, medium intensive cash cropping (Southern Ontario, Northern New Brunswick). 1 1 5 1 2 3 3 — 2 1 5 4 1 4 2 — 4 4 5 5 5 5 4 — 11 1 2 2 1
(6) Extensive, mixed grain and livestock (Northern Ontario, Manitoba, Western Alberta, Northern British Columbia) (closest to Mxc) 1 1 5 1 1 4 3 — 1 1 5 2 1 4 2 — 2 2 5 5 5 5 3 — 1 1 2 2 3 1
(7) Specialized, very extensive grain (food and feed) (Central Prairies and Peace River District) (closest to Mcc) 1 1 5 1 1 4 3 — 1 1 5 1 1 3 1 — 2 2 5 5 5 5 2 — 1 2 3 1 1 1
(8) Extensive livestock grazing (not true ranching) (Interior British Columbia) 1 1 5 1 1 4 3 — 1 1 5 2 3 4 2 — 1 1 5 5 5 5 2 — 1 3 1 3 3 1
The listings above are each subject to some internal variation, and some variables are particularly critical. Among the latter one should note size of holding (Variable 6), labour input (Variable 8), fertilization (Variable 11), in-tensity of livestock breeding (Variable 14), land productivity (Variable 15/15a and 18) and the combination of structural characteristics.
The eight types identify all 253 census divisions, within the range of devia-tion specified and may thus be compared with the derivation made from the list of model types. On this basis it is very tentatively suggested that conside-
http://rcin.org.pl

Typology of Canada agriculture 111
rations be made of a set of agricultural types for Canada in which the three model types which achieved some representation (i.e. Mxg, Mxc and Mcc) be supplemented by types 1, 3, 4, 5, 8 and possibly 6, from the types listed above.
COMMENT
One may conclude, however, by noting, once again that the achievement of a satisfactory typology is an interactive process. In the case of Canada three future lines of enquiry present themselves. These are:
1. A more detailed refinement of the 27 variables (indices) down to the local level, to clarify some present ambiguities.
2. A more detailed analysis of the types derived through clustering to see whether they can be meshed more closely with the model types as set forward by Kostrowicki, and a closer look at possible composite types.
3. Further work on a revised set of indices for Canada, which preserve the model as set up in the typology, but utilise more discriminating data and class intervals for application within Canada.
In conclusion, it is hoped that this critical investigation will assist in the overall work of the Commission to achieve a satisfactory typology of world agriculture.
REFERENCES
Kostrowicki J., 1972, The typology of world agriculture. A preliminary scheme, in: L. G. Reeds (ed.), Agricultural typology and land use, Proceedings of the Fifth Meeting of the Commission on Agricultural Typology, Hamilton, Ontario, pp. 2-52.
Kostrowicki J., 1974, The typology of world agriculture: Principles, methods and model types, I. G. U. Commission on Agricultural Typology, Warsaw.
Kostrowicki J., 1976, World types of agriculture, I. G. U. Commission on Agricultu-ral Typology, Warsaw.
Troughton M. J., 1974, Approaches to an agricultural typology for Canada, in: C. Van-zetti (ed.), Agricultural typology and land utilization, Proceedings of the Sixth Meeting of the Commission on Agricultural Typology, Verona, 1975, pp. 357-384.
Troughton M. J., 1975, Canadian agricultural typology and the I. G. U. world model, Paper presented to Seventh Meeting of the Commission on Agricultural Typology, Paris.
http://rcin.org.pl

http://rcin.org.pl

GEOGRAPHIA POLONICA 40, 1979
A G R I C U L T U R A L T Y P O L O G Y O F I N D I A
V . R . S I N G H
Department of Geography, Bañaras Hindu University, Varanasl, India
India has often been described as an area of subsistence agriculture. Great advances, however, have been made in the Indian agriculture in the post-inde-pendence period. The recent improvements as a consequence of land reforms, consolidation of holdings, provision of irrigational facilities, scientific advance-ments in agricultural researches, implements, use of fertilizers, manures and pesticides, have ushered the Green Revolution in large segment of the country increasing agricultural production by 62 per cent.
India covers an area of 3,267,500 km2 of which only 45 per cent is under plough, 20 per cent under irrigation and only 15 per cent under double crop-ping. Forests cover 17 per cent of the area. The cropping system is mainly food oriented as only 18 per cent of the cultivated area is devoted to commercial crops. Livestock, dairying and poultry is least developed on commercial scale. They exhibit a contrasting but inter-related physical, socio-cultural and econo-mic conditions. There are well established regional variations in agriculture, industry, irrigational and commercial activities. Large areas of tribal and other backward communities have not been affected by either the Green Revolution or by industrial, institutional and commercial activities. Only a micro level study in agricultural typology can reveal the homogeneity in agricultural attri-butes and also in the level of agriculture. This study has been undertaken at state level so that the results can be represented on the world map showing agricultural typology of India.
AGRICULTURAL CHARACTERISTICS
In the present study the 22 agricultural (see Table 1) attributes have been carefully assessed under four major heads, (1) Social and Ownership, (2) Orga-nizational and Technical, (3) Production and (4) Structural characteristics. The available primary and secondary data on state level have been considered. Some generalizations have also been made on the basis of samples and case studies so that simplification and identification of a definite typology can be possible.
(1) SOCIAL AND OWNERSHIP CHARACTERISTICS
Broadly speaking land is owned firstly in common or by feudal lord under customary rights as are found in the eastern hilly states which are mostly in-habited by tribal people, and secondly by individual persons under inheritance rights as is evident in the rest of the country. They are mostly Bhumidars, Seerdars and Asamies under different names and tenancy rights in different states. There may be some differences in land tenure systems in the country
8 Geographia Polonica http://rcin.org.pl

114 V. R. Singh
TABLE 1. AGRICULTURAL
but the general pattern is the same. In the former case land is operated in common, whereas in the latter case, sometimes the land is used by tenants on fixed rate, or free for their services in agricultural operations but mostly land is cultivated by owners or under share cropping system. This practice is pre-
http://rcin.org.pl

Agricultural typology of India
TYPOLOGY OF INDIA
115
valent because of absentee land ownership by persons engaged in other servi-ces at distant places or land owned by disabled persons who cannot work. Share cropping system is comparatively less prevalent in Punjab, Haryana, Kerala, Andhra Pradesh, Karnataka and Maharashtra.
8* http://rcin.org.pl

(Fig. 1A. Size of holdings, labour pressure per holding, actively employed per-sons/agricultural holding B. D. = Bangla Desh, D = Data not available
Fig. IB. Size of agricultural holdings (hectares/holding)
http://rcin.org.pl

Fig. 1C. Intensity of livestock (conventional animal/holding)
Fig. ID. Gross agricultural output (conventional units/holding)
http://rcin.org.pl

118 V . R. Singh
There is a more or less an inverse relationship between the nature of acti-vely employed persons per agricultural holding and gross agricultural land per holding. It is clear from figures 1A and B that most backward areas like Na-galand, Manipur, Tripura, Meghalaya and Mizoram support the largest number of people (more than 50) on smallest agricultural holdings (below 2 hectares) whereas economically advanced states such as Punjab, Haryana, Maharashtra (5 to 10 hectares size of holdings), Andhra Pradesh, Karnataka and Kerala (2 to 5 hectares) have less pressure of active population (2 to 3 per agricultural hol-ding) on bigger land holdings.
Kerala, Tamil Nadu, Assam, Arunachal and the whole of the northwestern sector support 2 to 5 large animal units per holding whereas in the thickly populated and intensively cultivated Ganga Plain, States like Madhya Pradesh, Orissa, Karnataka and Andhra Pradesh lying on the Deccan Plateau and the hilly Mizoram and Tripura states account for 1 to 2 large animal units. In Meghalaya, Manipur and Nagaland it is even less than one (Fig. 1C).
A great similarity in gross agricultural output is observed as most of the states account for 100 to 300 conventional units per holding, (Fig. ID). The ex-ceptions are Maharashtra with 900 units on one side and Nagaland, Meghalaya, Tripura, Mizoram and Rajasthan with less than 100 units on the other. (2) ORGANIZATIONAL, AND TECHNICAL CHARACTERISTICS
Nine agricultural variables are discussed under this head. The maximum labour input is found in Punjab, Uttar Pradesh, Bihar, West Bengal, Orissa, Andhra Pradesh and Kerala where more than 40 actively engaged persons are found on every 100 hectares of agricultural land. Next comes the position of Haryana, Madhya Pradesh, Karnataka and Maharashtra where 25 to 40 per-sons are actively employed per 100 hectares. The least labour input is witnessed in the eastern hilly states (excepting Assam and Arunachal) where less than 8 persons are engaged per 100 hectares of agricultural land (Fig. IE).
In respect of input of animal power the north Indian states including Mad-hya Pradesh and Orissa excel the rest of the country (Fig. IF), whereas Andhra Pradesh, Karnataka and Tamil Nadu in the south and the tiny states like Mi-zoram, Meghalaya, Tripura, Nagaland and Manipur in the north-east account for its least input.
The use of tractors, thrashers and pumping sets are more common throug-hout Punjab and Haryana where input of mechanical power ranges from 24 to 36 horse power per 100 hectares of cultivated land, though the use of primi-tive agricultural implements are still in practice. In both these states farmers are rich and progressive. In south India and Gujarat the use of improved agri-cultural appliances is also common though the degree of concentration ranges from 3 to 6 horse power per 100 hectares of cultivated land (Fig. 2A). The rich agricultural belt of the Ganga Valley, however, shows a poor response in this respect.
The use of mechanical power and irrigation have paved the way for inten-sive agriculture which demands more use of chemical fertilizers. It is quite obvious from Fig. 2B that in Punjab, Haryana, Andhra Pradesh, Kerala and Karnataka the use of chemical fertilizers is maximum (20 to 30 kg per hectare). Similar is the trend with respect to mechanical power (Fig. 2A) and irrigation (Fig. 2C). The input of chemical fertilizers is 10 to 20 kg in Maharashtra and less than 5 kg in the remaining states.
In India irrigation is essential not only during the dry season but also during rains when it is insufficient or when it comes after a long break or when the crop requires heavy watering. The intensity varies from 5 to 50 per cent of the
http://rcin.org.pl
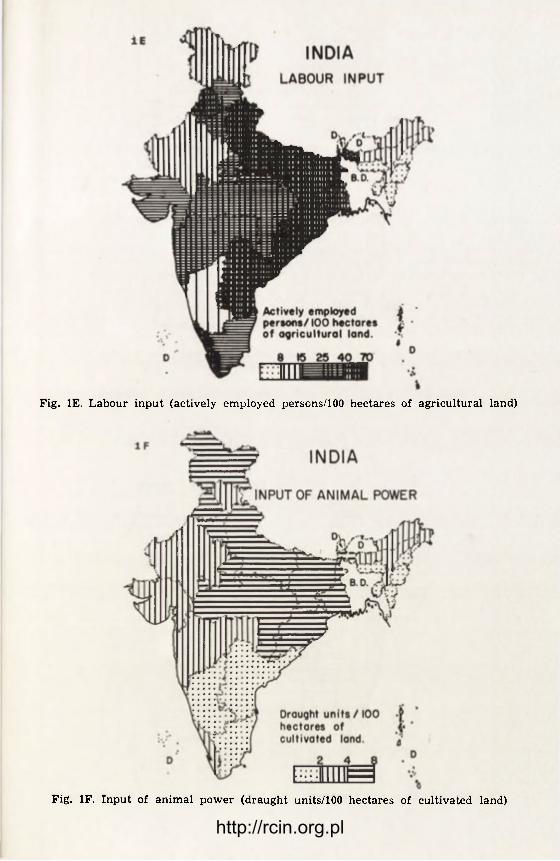
Fig. IE. Labour input (actively employed persons/100 hectares of agricultural land)
Fig. IF. Input of animal power (draught units/100 hectares of cultivated land)
http://rcin.org.pl

Fig. 2B. of cultivated land) Input of chemical fertilizers (kilograms/hectare
http://rcin.org.pl

Fig. 2D. Intensity of cropland use (percentage of net arable land)
http://rcin.org.pl
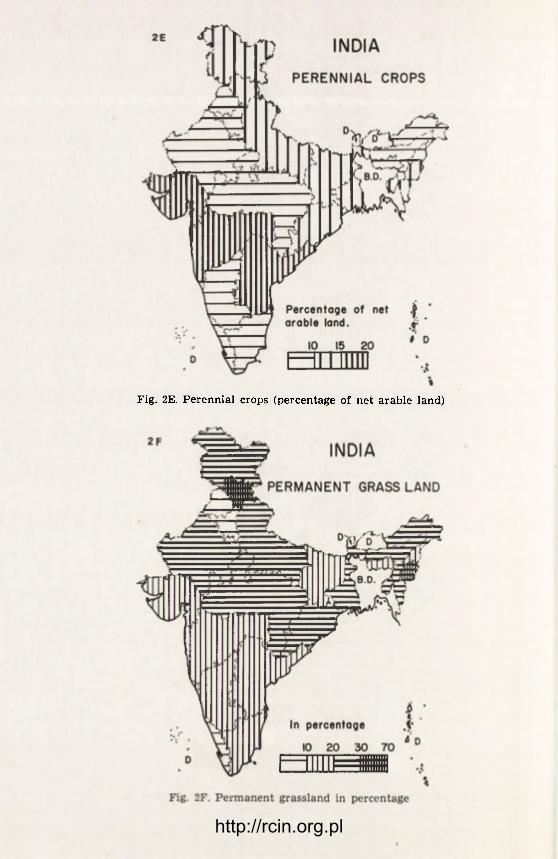
Fig. 2E. Perennial crops (percentage of net arable land)
http://rcin.org.pl

Agricultural typology of India 123
total cultivated land (Fig. 2C). It is more concentrated in the alluvial plains of Punjab, Haryana, Uttar Pradesh, Bihar and Kerala where more than 1/4 of the gross cultivated land is irrigated. Irrigation is widespread in Andhra Pra-desh, Tamil Nadu, West Bengal, Manipur and Meghalaya recording 15 to 25 per cent of the gross cultivated land.
Intensity of cropland use is similar to that of irrigation excepting Kerela which records less than 30 per cent double cropped area. Meghalaya, Mizoram, Tripura, Manipur and Nagaland also fall in this category (Fig. 2D).
Gujarat, the famous cotton growing state and Andhra Pradesh and Maha-rashtra (cotton 21 per cent) the two famous sugar-cane growing states record more than 15 per cent of areas under perennial crops. In majority of the states like Uttar Pradesh, Bihar, West Bengal, Jammu and Kashmir, Mizoram, Tri-pura and Manipur the annual growing crops, pulsers (Arhar), jute and sugar-c a n e account for 10 to 15 per cent of the gross cultivated area (Fig. 2E).
Permanent grasslands include forests closer to the settlements, permanent meadows and village commons which are used for grazing of cattle. Conside-rable stretches of sub-tropical grasslands are found in Himachal Pradesh (70 per cent), Manipur (50.64 per cent), Jammu and Kashmir and U. P. Himalayas commercially known as Himalayan meadows. In most of the northern states coarse poor quality grasses and scrubs cover bare eroded surfaces which are found on 20 to 30 per cent of the whole area (Fig. 2F).
The intensity of livestock breeding is highest (20 to 30 per 100 hectares of agricultural land) in Bihar and West Bengal and minimum in Andhra Pradesh, Meghalaya and Manipur (Fig. 3A).
(3) PRODUCTION CHARACTERISTICS
Land productivity as measured on agricultural production is highest in Pun-jab, Haryana and Kerala followed by Karnataka (Fig. 3B) and minimum in Ra-jasthan, Himachal Pradesh, West Bengal, Meghalaya, Tripura, Mizoram, Mani-pur and Nagaland. The rest of the country shows similarity in land productivity which ranges from 10 to 20 conventional units per hectare of agricultural land. A comparative study of Figures 3B and 3C postulates some similarity in the ca-se of maximum and minimum labour input and land productivity. Elsewhere labour productivity varies from 20 to 70 units of gross agricultural production per actively engaged person in agriculture.
The seven commercially advanced states, i.e., Punjab, Haryana, Kerala, Ma-harashtra, Andhra Pradesh, Karnatak and Gujarat account for more than 40 per cent to the gross agricultural production. The most densely populated sta-tes — Uttar Pradesh, Bihar and Madhya Pradesh account for less than 20 per cent as they support for the production of cereals (Fig. 3D).
Two distinct patches of high level commercialization with more than 20 units of commercial production per hectare of agricultural land have been no-ted. They include Punjab, Haryana, RajaSthan, Gujarat in the western sector and Kerala, Karnataka and Tamil Nadu in the southern. In Maharashtra, Gan-ga and Brahmaputra plains it ranges from 3 to 12 units (Fig. 3E).
In India sugar-cane, jute, cotton, oil seeds, tea, tobacco, ground nut and cas-hew-nut are the most important commercial crops as they account for more than 50 per cent of the commercial area. The highest degree of specialization is found in Andhra Pradesh, Maharashtra, Karnataka and Tamil Nadu due to sugar-cane, ground-nut and tobacco or cotton; Gujarat and Rajasthan due to cotton, ground-not and oil seeds, Kerala mostly accounts for cashew-nut and sugar-cane and Assam is famous for tea and jute.
http://rcin.org.pl

http://rcin.org.pl

Fig. 3D. Degree of commercialization expressed in proportion of commercial to gross production
http://rcin.org.pl

Fig. 3F. General commercial orientation
http://rcin.org.pl

Agricultural typology of India 127
(4) STRUCTURAL CHARACTERISTICS
In the whole of the country the rate of animal production is less than 10 per cent to the gross agricultural production except for three states viz. Himachal Pradesh, Gujarat and Orissa where it is about 20 per cent.
The rate of animal production to commercial agricultural production is poor as nowhere it accounts for more than 20 per cent. In most of the states it ran-ges from 2 to 10 per cent (Fig. 3F). In Jammu and Kashmir, Himachal Pradesh, Punjab, Rajasthan, Gujarat, Tamil Nadu, Assam and Arunachal it ranges from 18 to 20 per cent.
AGRICULTURAL TYPOLOGY
On the basis of the 22 agricultural variables and its maximum class similari-ty, as has already been discussed, Indian states can be grouped into six catego-ries. The five eastern hilly states, i.e., Nagaland, Meghalaya, Manipur, Tripura and Mizoram form the first category. The second category also includes four other hilly states like Assam, Arunachal, Jammu and Kashmir and Himachal Pradesh. The third category covers the largest area including five states — Uttar Pradesh, Bihar, West Bengal, Madhya Pradesh and Orissa. Punjab and Haryana, the two well developed states, form the fourth category. Kerala, And-hra Pradesh, Karnataka, Maharashtra on the one hand and Tamil Nadu, Gu-jarat and Rajasthan on the other form the fifth and the sixth categories respe-ctively. Even the states falling in one group do not have uniform agricultural characteristics and it is well represented in typograms (Fig. 4). But the simila-rity within the groups ranges from 13 to 20 variables (Table 1). Nagaland, As-sam, West Bengal, Punjab, Kerala and Tamil Nadu have been taken as the representative states for these groups because they have maximum similarity with respect to the international scale.
None of the states except Nagaland shows complete similarity with that of the International Scale though they do resemble some of these types. The first five categories resemble respectively the rotational bush fallow agricul-ture (Tsb), the continuous or semi-continuous subsistence or semi-subsistence crop agriculture (Tec), the labour intensive semi-subsistence non-irrigated agri-culture (Tin), the commercial small scale non-specialized agriculture (Mi) and the commercial small scale specialized agriculture (Mv). The sixth category pre-sents an intermediary characteristic as 13 to 14 variables are like that of semi--subsistence crop agriculture (Tec) whereas a dozen of these put these states under semi-commercial specialized crop agriculture (Tsv). Therefore, a new sub-category as semi-subsistence, semi-commercial specialized crop agriculture (Tev) has been recognised (Fig. 5). There are too many deviations in the variab-les in the same type as compared with the representative state (Fig. 4).
In general similarities of 16 to 22 variables are found as compared with the International Scale. Within the six established agricultural types the maximum similarity in continuous or semi-continuous subsistence or semi-subsistence crop agriculture (Tec) is observed with semi-subsistence, semi-commercial spe-cialized crop agriculture (Tev) the newly founded category and labour inten-sive semi-subsistence non-irrigated agriculture (Tin). Commercial small scale non-specialized agriculture (Mi) is similar to that of commercial small scale specialized agriculture (Mv) in 12 agricultural variables (Fig. 5, inset).
In developing nations which are undergoing a rapid agricultural change this type of intervariabilities is bound to occur until and unless the whole agri-
http://rcin.org.pl

Fie. 4. Model tvDoeram пит DUT с
http://rcin.org.pl

Agricultural typology of India 129
Fig. 5. Agricultural typology-
cultural process is developed and established on national scale. So, it is diff i -cult to identify an ideal agricultural type though it may be established on the basis of generalizations and maximum similarity. As a result the following six Indian agricultural types have been suggested and their chief agricultural cha-racteristics have been discussed:
(1) Rotational (bush fallow) agriculture (Tsb)
http://rcin.org.pl

130 V". R. Singh
This type of agriculture includes the economically backward, culturally tribal and agriculturally poor states of the country, e.g., Meghalaya, Nagaland, Manipur, Tripura and Mizoram. These states practice a distinct rotational (bush fallow) Jhooming agriculture and have almost the same indices, (19-22) whe-reas Nagaland commands all the variables. Major differences in few states, from the normal for this type are noted in the ratio of irrigated land (2), per-manent grass land (3) degree of commercialization (2-3) and specialization (2-3). The latter two variables are found in Tripura and Mizoram because of jute cul-tivation. In these states, agriculture in general is handicapped by steep, rugged and hilly terrain, climatic hazards, thin stony soil and small scattered holdings that are often terraced.
(2) Continuous or semi-continuous subsistence or semi-subsistence crop agri-culture (Tec)
3 5 6 7 2 1 - 9 1 2 1 2 2 - 3 , 2 - 3 , 1 , 1 , 1 - 2 , 3 - 4 , 1 - 2 , 1 - 2 , 1 - 2 , 3, 5 b 7, 2, . 2 , 1 - . , 1-2, 2-3,1-2,1-2,1-2,2, ~ h 1 - 2
Jammu and Kashmir, Assam, Himachal Pradesh and Arunachal present a similarity in agricultural typology representing similar values with respect to 16 to 18 variables. The agricultural landscape of these states is mostly tradi-tional, tribal and rudimentary, generally oriented to the production of cereals, tea and fruits like apples and pineapples.
The input of animal power (2-3), the degree of specialization (2 to 3) and permanent grassland (4) record higher value and the degree (1) and level of commercialization (1) and production orientation (1) narrowly lag behind the normal value. These states practise a rather comparatively inefficient and tra-ditional method of farming with limited commercial activity.
(3) Labour intensive semi-subsistence non-irrigated agriculture (Tin)
Q C ; « ' 7 o i o i i o 1 ,1 , 2 -3 , 4 - 5 , 1 - 2 , 2 -3 3, 5 - 6 - 7 , 2 , 1 - 2 , 1 , 1 - 2 ! _ 2 , i _ 2 , 1 - 2 , 1 - 2 , 1 - 2 1
This is the most important subtype which includes five densely populated states like West Bengal, Madhya Pradesh, Orissa, Bihar and Uttar Pradesh. These states occupy the largest alluvial tract of the Ganga Plain on the one hand and the rugged and dissected plateaus of the Peninsular upland (accessi-ble to cultivation) on the other. They present similarity in 17 to 18 variables. Land productivity (1-2 to 2-3) and irrigation (2 to 3-4) may be mentioned where all these states record low and high values respectively. In general the intensity of livestock breeding (1-2) and commercial production (1) show lower values.
(4) Commercial small scale non-specialized agriculture (Mi)
q fi 7 1 9 1 9 1 9 1 9 3 - 4 , 2 - 3 , 3 - 4 , 2 - 3 . 3 - 4 , 4 -5 , 1 - 2 3, 6 - 7 , 1 - 2 , 1 - 2 , 1 - 2 , 1 - 2 4_5> 2 - 3 , 3 - 4 , 3 -4 , 2 - 3 1 - 2
This agricultural subtype includes the states of Punjab and Haryana. The Green Revolution has a better impact in these states where adoption of mecha-nical power, high yielding crops, new techniques in cultivation and new irri-gational facilities have brought a phenomenal increase in land productivity (4-5) and intensity of crop land use (4-5) but with respect to the International Scale they still lag behind in the use of chemical fertilizers (2-3) and irriga-tion (3-4).
http://rcin.org.pl

Agricultural typology of India 131
(5) Commercial small scale specialized agriculture (Mv)
q « 7 1 o 1 o i o 1 o 3 - 4 , 1 - 2 , 1 - 2 , 2 - 3 , 2 - 3 , 4 , 1 - 2 , 1 , 1 3, 6 -7 , 1 - 2 , 1 - 2 , 1 - 2 , 1 - 2 4 - 5 , 1 , 4 , 3 - 4 , 4 - 5 X > 1
Similarity in commercial small scale agriculture is observed in Andhra Pra-desh, Karnataka, Maharashtra and Kerala. The first three states are generally famous for the cultivation of sugar-cane, ground-nut, cotton and oilseeds. Andhra Pradesh also produces tobacco in abundance. Kerala is famous for the production of cashew-nut and coconut in great quantity. Major variations are found in land (2 to 4-5) and labour productivity (2-3), irrigation (1 to 1-2), degree (3-4) and level of commercialization (1-2).
(6) Semi-subsistence, semi-commercial specialized crop agriculture (Tev)
, , , , , , , , , , o 2 - 3 , 1 - 2 , 1 , 1 , 2 - 3 , 3 - 4 , 1 - 2 , 1 - 2 , 1 - 2 , 3, 5 - 6 - 7 , 2 , 1 - 2 , 1 - 2 , 1 - 2 2 , 1 - 2 , 2 -3 , 3 - 4 , 4 h X " 2
Gujarat, Tamil Nadu and Rajasthan present a new sub-category as semi--subsistence and semi-commercial specialised crop agriculture (Tev). It is pro-bably due to the immense pressure of man power (2-3) on limited arable land (1-2) with one or two major commercial agricultural products which intensify the degree (2-3) and level of commercialization (3-4) and the degree of speciali-zation (4). These states respectively are famous for the cultivation of cotton-ground-nut; sugar-cane-ground-nut and oilseeds-cotton.
BIBLIOGRAPHY
Driver P. N., 1949, Problems of Zamindari and land tenure reconstruction in India, New Book Co. Ltd., Bombay.
Kostrowicki J., 1974, The types of world agriculture. Principles, methods and model types, Warsaw (mimeographed).
Kostrowicki J., 1975, The scheme of world types of agriculture: some weak points and possible improvements, Warsaw (mimeographed).
Nair K. P. (ed.), 1972, Cropping patterns in India, Indian Council of Agricultural Re-search, New Delhi.
Singh J., 1974, An agricultural atlas of India. A geographical analysis, Vishal Pu-blications, Kurukshetra.
Singh R. L., (ed.) 1971, India — a regional geography, National Geographical Society of India, Varanasi.
9* http://rcin.org.pl

http://rcin.org.pl

GEOGRAPHIA POLONICA 40, 1979
A G R I C U L T U R A L T Y P E S IN M A D H Y A P R A D E S H
B. P . PANDA
Department of Geography, K.G. Arts and Science College, Raigarh, M.R. India
Indices suggested by the IGU Commission on Agricultural Typology for determining agricultural types have not been tested on a national scale in In-dia.1 Even regional studies are very few and sketchy. The author has attempted to determine the agricultural types of Madhya Pradesh 2 on lines recommended by the Commission. The aim of the paper is to examine some of the methodo-logical problems relating to the application of criteria and indices to an under-developed region like Madhya Pradesh of India. A few general observations regarding the characteristics of regional agriculture may be made on the basis of studies made by the author.
(1) Data situation regarding social and ownership characteristics as well as organisational and technical properties of agriculture is fairly satisfactory. But data on the production characteristics especially on the degree and level and commercialisation as well as on animal production is inadequate and unsuitable for use. It ill compares with the corresponding data of the advanced countries in accuracy and detail. So reasonable estimates based on sample surveys and norms established have to be adopted.
(2) In the eastern part of the state districts are large and diverse, e.g., Bastar (39,060 sq.kms), Raipur (21,251 sq.kms), Bilaspur (19,905 sq.kms), Sur-guja (22,337 sq.kms), Shahdol (14,028 sq.kms), Mandla (13,257 sq.kms), and Rai-garh (12,910 sq.kms). With such large areas as units of study, some of the sub-types are concealed in the magnitude and diversity of agricultural condi-tions and escape identification.
(3) Due to a very low level of capital inputs and limited application of technical and scientific knowledge agriculture is very much influenced by ecological conditions. Slopes and soils, the quantum and seasonal distribution of rainfall have a great bearing on the system of land use, cropping pattern and the system of crop and land rotation. The farmers of the region adopt those systems of production and techniques of management that make the best use of available resources.
(4) Certain production and structural properties of agriculture are more potent as type forming influence than others. Production characteristics like the degree and level of commercialisation and structural characteristics such as Orientation of Agricultural Land Use expressed in cropping pattern and crop combination regions primarily distinguish the various types of the 1st and
1 The statement was true when this paper was written. The first such attempt has actually been made — see the paper by V. R. Singh in the present volume (Editors).
2 Madhya Pradesh with an area of 443,459 sq. km and a population of 41.6 mil-lions is the largest state of India. Its location in the heart of India gives it a con-tinental character.
http://rcin.org.pl
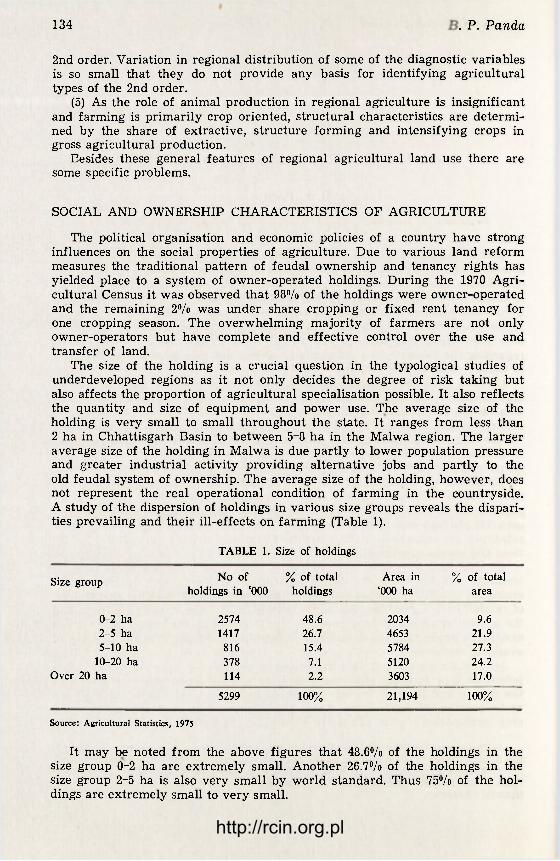
134 fi. P. Panda
2nd order. Variation in regional distribution of some of the diagnostic variables is so small that they do not provide any basis for identifying agricultural types of the 2nd order.
(5) As the role of animal production in regional agriculture is insignificant and farming is primarily crop oriented, structural characteristics are determi-ned by the share of extractive, structure forming and intensifying crops in gross agricultural production.
Besides these general features of regional agricultural land use there are some specific problems.
SOCIAL AND OWNERSHIP CHARACTERISTICS OF AGRICULTURE
The political organisation and economic policies of a country have strong influences on the social properties of agriculture. Due to various land reform measures the traditional pattern of feudal ownership and tenancy rights has yielded place to a system of owner-operated holdings. During the 1970 Agri-cultural Census it was observed that 98% of the holdings were owner-operated and the remaining 2% was under share cropping or fixed rent tenancy for one cropping season. The overwhelming majority of farmers are not only owner-operators but have complete and effective control over the use and transfer of land.
The size of the holding is a crucial question in the typological studies of underdeveloped regions as it not only decides the degree of risk taking but also affects the proportion of agricultural specialisation possible. It also reflects the quantity and size of equipment and power use. The average size of the holding is very small to small throughout the state. It ranges from less than 2 ha in Chhattisgarh Basin to between 5-8 ha in the Malwa region. The larger average size of the holding in Malwa is due partly to lower population pressure and greater industrial activity providing alternative jobs and partly to the old feudal system of ownership. The average size of the holding, however, does not represent the real operational condition of farming in the countryside. A study of the dispersion of holdings in various size groups reveals the dispari-ties prevailing and their ill-effects on farming (Table 1).
TABLE 1. Size of holdings
Size group No of holdings in '000
% of total holdings
Area in '000 ha
% of total area
0-2 ha 2574 48.6 2034 9.6 2-5 ha 1417 26.7 4653 21.9 5-10 ha 816 15.4 5784 27.3
10-20 ha 378 7.1 5120 24.2 Over 20 ha 114 2.2 3603 17.0
5299 100% 21,194 100%
Source: Agricultural Statistics, 1975
It may be noted from the above figures that 48.6% of the holdings in the size group 0-2 ha are extremely small. Another 26.7% of the holdings in the size group 2-5 ha is also very small by world standard. Thus 75% of the hol-dings are extremely small to very small.
http://rcin.org.pl

Agricultural typology of Thracian Basin 135
The distribution of ownership on the other hand is concentrated with a small minority. It may be read from the above table that 25°/o of the farming house-holds over 5 ha units own and operate 68.5% of the total arable land while 75% of the households have to earn their living from 31.5% of the arable land. Holdings over bulk of the arable land are larger in extent as compared to many states of India but this advantage is offset by the poor quality of land and very low gross agricultural production.
The preponderance of very small farms in the lowest rank creates many problems of tiny holdings and landless labourers and affects the efficiency of cropland. About 48.6% of the households (in the size group 0-2 ha) who own and cultivate 10% of the arable land are extremely poor and resourceless. They are underemployed as well. Cultivation of small plots yields such a meagre income that uncertainty of rains, lack of adequate finance or incapacity to hold on in times of depression deprives the cultivator of his holding. He sells his land fragment by fragment till he slides down to the rank of a landless labourer. A large number of these small farmers have neither the necessary implements, draught cattle or other inputs to carry on agricultural operations efficiently. The growing number of landless agricultural labourers in each census is a matter of serious concern to the planners of social and economic development in the countryside.
Fig. 1. Madhya Pradesh. India. Agricultural types
http://rcin.org.pl

136 fi. P. Panda
According to the size of holding3 in terms of agricultural area, the number of actively employed people and livestock units per holding is very small to small (1-2). As the gross agricultural output per one holding is very low the return to farmer for his labours and managerial skill is marginal.
The ceiling limit of holdings in the state has now been placed at 18 stan-dard acres4 (7,284 ha) of arable land for each family of 5 members with an allowance of 3 standard acres for each additional member. About 200 thousand hectares of arable land acquired from ceiling and cut from forest and grazing have been distributed among landless agricultural labourers in the past 2 years. Many other measures like freeing of bonded labour, liquidation of debts of small farmers, fixation of minimum wages for agricultural labour have been rigorously implemented to end exploitation in villages. Some financial help is also extended by banks to the farmers for land development, purchase of fertilizers, HYV seeds and draught animals as well as for minor irrigation. These steps should, however, be supplemented by creation of adequate jobs in industries, trade and transport to absorb the surplus of agricultural labour.
O R G A N I S A T I O N A L A N D T E C H N I C A L C H A R A C T E R I S T I C S
L A B O U R INPUTS
This characteristics of agriculture is based on the number of actively employed persons per 100 ha of agricultural land. As cropping is diversified in a village territory and most of the labour is provided by the family, it is difficult to work out the amount of labour in man-days. Labour inputs are high to very high (between 40 and 120) by world standard. Hired labour is both attached and casual. There are underemployed landless agricultural labou-rers, full time free wage earners to dwarfholding labourers of casual type. The underemployment and unemployment of agricultural labour is due to growing rural overpopulation and lack of alternative jobs in industries, transport and commerce. Agricultural labourers come mostly from backward classes and the problems associated with them are at once economic and social.
I N P U T S OF A N I M A L A N D M E C H A N I C A L P O W E R
High to very high use of animal power is a characteristic feature of agri-culture in the state. The number of draught cattle in conventional units is lower (15 to 25 units per 100 ha) in the Malwa tract where light soils and crops like wheat, jowar and cotton require less tillage than rice crops on heavy soils of Chhattisgarh and Vindhya Pradesh. Animal units in rice farming regions range between 25 to 40 per 100 ha of cultivated land.
The use of mechanical power is insignificant (one tractor for 2120 ha). Essen-tial infrastructure for the use of tractors, power tillers, harvesters and other mechanical implements are lacking in Madhya Pradesh. Mechanisation can not be regarded merely as a problem of farm economics. It is dependent on the evolution of overall agrarian pattern together with technical progress.
Use of simple, cheap and improved hand operated iron implements can be popularised to replace the age-old wooden plough in rice growing tracts while a suitable power tiller has scope both in the rice and wheat growing areas.
3 H o l d i n g s in M a d h y a P r a d e s h (and I n d i a as wel l ) are classi f ied as u n d e r 0 - 1 ha — m a r g i n a l ; 1 - 2 h a — s m a l l ; 2-A ha — s e m i - m e d i u m ; 4 - 1 0 ha — m e d i u m ; 1 0 - 2 0 h a — l a r -g e and a b o v e 20 ha — v e r y large .
4 One standard acre = one acre with perennial irrigation, two acres with seasonal irrigation, three acres of non-irrigated land.
http://rcin.org.pl

Agricultural typology of Thracian Basin 137
ORGANIC MANURING AND CHEMICAL FERTILIZERS
Supply of organic and chemical fertilizers to crops is horribly low in view of the preponderantly extractive crops raised. The amount of chemical fertili-zers used is less than 5 kg/ha of NPK in 50°/o of the area, between 5 to 10 kg/ha in 30% and 10 to 20 kg/ha in 20% of the gross cropped area. Use of rural compost is common organic manure in regions where paddy is the dominant crop. Some urban compost is also available. Nutrient added to the soil by this source is extremely small as rural compost consists mostly of household refuse and a little of cowdung.
IRRIGATION
Irrigation is an essential precondition for agricultural development in Ma-dhya Pradesh. It eliminates insecurity, variability and meagreness of rainfall and helps in raising the productivity from land. The quantum of fertilizer inputs, intensity of cropland use and the degree of specialisation depend much on the amount of water available for irrigation. The state has large potentials of irrigation from its river systems and underground water resources. Unfortu-nately very little has been done to develop them. An increase of 2.4% in ir-rigated area in 25 years of planned progress is a very poor achievement as compared to other states. The state has irrigation facilities over 8.3% of the G.C.A. which ill compares even with the national average of 24%. Among viable states of India, Madhya Pradesh is most ill served with irrigation facili-ties and ranks lowest in the percentage area irrigated. The percentage ratio of irrigated to gross cropped area is miserably low ( < 5%) over 50% of the arable land and very low « 10%) over 75% of cultivated land. Only 5 districts out of 45 in the state had medium amount of irrigation between 20% to 40% of G.C.A.
Most of the irrigation in Madhya Pradesh is of a supplemental type and is useful in protecting the paddy or wheat crop from failure of rains at crucial moments. Adequate water is not available in these sources for raising a second crop. Hardly 1% of the gross cropped area is served by perennial irrigation.
PERMANENT GRASSLAND AND INTENSITY OF LIVESTOCK BREEDING
About 7% of the total geographical area is classified under permanent pastures and other grazing lands. The portion of village territory set aside for cattle grazing is very small (less than 10%) in view of the large number of cattle population. Both feeding and breeding of cattle in the eastern part of the state are very poor. Grass cover is thin and seasonal and cattle have to subsist on stubbles, stems and husks of field crops. Generally good cattle are found in western part of the state where fodder crops are grown in plenty. The density of livestock population (in conventional animal units) is high to very high O 80 units per 100 ha) throughout the state but the purpose of tending livestock is neither breeding for sale nor for meat and milk. They are primarily kept for use in ploughing and bullock carts. The inadequacy of grazing land calls for encouraging cultivation of fodder crops particularly in the eastern part of the state. Effective measures to stop indiscriminate breeding and eliminate weaklings are also necessary to get rid of the large number of unproductive and weak cattle.
INTENSITY OF CROPLAND USE
Growing rural overpopulation and huge surpluses of man power accumula-ted in the countryside do not allow any arable land to be kept fallow for more
http://rcin.org.pl

138 fi. P. Panda
than one season. Intensity of agriculture was found to be high (between 80 and 130) in all the districts of the state. Full and continuous use of the .agricultural land is made for raising crops. Due to short supply of water double cropping is limited to an average of 12% of Net Sown Area. Pulses and oilseeds are usually rotated with paddy wherever soil moisture permits their growth. Bulk of the second crop in rotation is rain fed and grown as catch crops. Optimum use of land is retarded for lack of inputs and defective social structure of land use. There is much to be done for rationalising the use of cropland for maxi-mum return.
PRODUCTION CHARACTERISTICS OF AGRICULTURE
LAND PRODUCTIVITY
Land productivity is miserably low; and gross agricultural production in conventional weight units does not exceed 10 quintals per ha in any of the districts. The average for the state is 6 quintals per ha.
The trend lines in the adjoining graph show that the production level of rice and wheat in the state has not only been low but stagnant for the last 20 years. Large fluctuations in the actual production from year to year are directly related to weather conditions. The distribution and quantum of rain-fall are crucial questions in production of crops and there exists a strong and positive correlation between the two. It may also be observed that downward
Fig. 2. Madhya Pradesh. Production of wheat and rice, 1955-56 to 1974-75
http://rcin.org.pl

Agricultural typology of Thracian Basin 139
fluctuations are greater and more serious so as to offset the gains of better yields in good years. Oilseeds and pulses are very susceptible to weather conditions and a fairly good crop is rarely obtained in 3-5 years. This reveals the strong influence of environmental factors on the production of crops. The very low level of agricultural production can be attributed to lack of perennial irrigation facilities, scanty use of fertilizers, the dominance of local low yiel-ding seeds and insufficient plant protection measures. Paucity of adequate and assured water supply is the greatest handicap in the application of progressive farming methods and intensification of farming for raising the productivity of agriculture. Fear of loss of inputs due to the failure of crops for want of timely and sufficient rainfall does not permit the farmer to provide optimum doses of fertilizers and pesticides. For the same reasons the coverage of improved seeds is also small — 15% to 20fl/o of the cropped area in paddy and wheat. As the scale of operation is small and capital investment is meagre, the farmer's choice of alternative cropping is very limited. Farming in 92% of the arable land depends on an erratic and often treacherous monsoon. The production le-vel of crops as such remains fluctuating between the two extremes of a low nor-mal. High cost of inputs and low market prices of food grains have further re-duced the net profit of farmers in recent years.
With very small farms and low level of capital inputs, even cash crops fail to raise them above subsistence level. The author's work on the economics of cultivation of paddy and ground-nut in very small farms of Chhattisgarh Basin of Madhya Pradesh shows that net income per ha from each is almost the same, i.e., about Rs. 1000/ — ($ 125.00) per ha in a year. Cotton and sugar-cane also behave in the same way. Short staple cotton grown in the Malwa tract does not give higher net profit than a good paddy crop in the Chhattis-garh plains. Farming practices are very backward in the hilly and tribal areas of the state. External conditions of agriculture like poverty of soil, uncertain weather, lack of transport and marketing and low prices of food grains put serious limitations on the productivity in these regions.
LABOUR PRODUCTIVITY
As agriculture is mostly hand operated labour productivity is very low in all parts of the state. Average production of about 10 quintals (in conventional weight units) per labour reaches the highest of 17 quintals in Indore and the lowest of 6 quintals in the Sidhi district. The labour requirement varies with the type of crops and the system of production. There is a pronounced seasonal demand of labour at the time of weeding and harvesting. Labour force though plentiful in the countryside is ill-nourished, works short-time and is slow in operation so that return to the farmer (employer) is marginal.
DEGREE OF COMMERCIALISATION
The degree of commercialisation is determined by the percentage ratio of commercial to gross production. Commercial production consists of total pro-ducts sold or delivered off the holding per year. In a semi-subsistence peasant farming of the Indian type it is difficult to estimate accurately the degree of commercialisation as the purpose of the farmer is growing food crops for domestic consumption and only the surplus is sold out for cash. Holdings in Madhya Pradesh cannot be distinguished between commercial and non-com-mercial nor arable land reserved as such. They combine both types of produc-tion. Commercial agricultural production, therefore, consists of the amount
http://rcin.org.pl

140 fi. P. Panda
of marketable surplus of food grains on one hand and the amount of produc-tion of cash crops on the other.
The amount of marketable surplus varies according to the size of a parti-cular holding, the number and age of family members, the pattern of diet and out-turn of crops. In Madhya Pradesh holdings below 2 ha have hardly any surplus for sale while those between 2 to 4 ha have very little to offer for the market. In keeping with the fluctuations in yield and out-turn of crops, there are appreciable regional and temporal variations in the gross amount of marke-table surplus. Due to the complicated pattern of marketable surplus, accurate figures of surplus of footgrains are not available with any government or non--government agencies. Market supplies of food grains in selected markets called Mandis during the post harvest period do not constitute the total amount of surplus in each district as private agencies also purchase foodgrains from farmers in the villages for sale in the urban market. Some part of the food grains is sold to the consumers in towns directly by the farmers. Marketable surplus was, therefore, estimated by the following formula:
M = Q-R
where M = marketable surplus, Q = total production, R = retention, for var-ious purposes.
For various purposes retention consists of the following: (1) 518 grams (2250 calories) per capita per day for all agricultural popula-
tion ; 5
(2) 12.5% of total out-turn for seed, feed and wastage.6
The balance of food grains was taken as marketable surplus of the district. Besides forming a part of commercial production the amount of marketable surplus is also an indicator of food self-sufficiency.
Cash crops were included in commercial production on 100% basis. All crops other than foodgrains (i.e., cereals, millets and pulses) are classified as commercial/cash crops. As the area devoted to cash crops is small and yields low the volume of commercial production from these also remains small.
This method of determining the gross amount of commercial production though partly based on estimates has a definitive character. The results are interesting and dispel many commonly held notions about the subsistence farming in India.
The degree of commercialisation was found to be very low (0-20%) in the Vindhya Pradesh region, low (20% to 40%) in the central, eastern and north western parts and medium (40% to 60%) in the Malwa region and the Lower Narmada Basin. To be more precise the degree of commercialisation is very low when it is over 20% of cropped area, low over 30% and medium over 50% of the cultivated land. Districts with larger average size of the holding were found to have greater degree of commercialisation.
LEVEL OF COMMERCIALISATION
This symptom of agriculture is determined by the amount of commercial agricultural production in conventional units per one ha of agricultural land. As land productivity is low and the share of commercial production in gross production is small the level of commercialisation is bound to be low.
5 Figures adopted from National Sample Survey of Diets (relating to Madhya Pradesh).
6 Estimate is based on findings of National Council of Applied Economic Re-search, New Delhi regarding retention for seed, feed and wastage.
http://rcin.org.pl

Agricultural typology of Thracian Basin 141
The level of commercialisation was found to be extremely low « 1 quintal per ha) in 5 districts, very low (between 1 to 3 quintals par ha) in 33 districts and low (between 3 to 6 quintals per ha) in 7 districts of the state. Thus the level of commercialisation is very low (0—1 ) over 83.7% of the gross cropped area.
DEGREE OF SPECIALISATION
As holdings are differentiated in their enterprise orientation and commercial production is distributed in all the crops raised, they do not reflect the degree of farm specialisation but rather regional specialisation. Distinct patterns may be observed if the degree of areal concentration of crops is taken into account. A district in Madhya Pradesh grows a large number of crops in a year but the degree of concentration of emphasis on a particular crop or a group of 2 or 3 crops is a distinct phenomenon in the agricultural landscape of the state, e.g. a high degree of concentration of paddy in the Chhattisgarh plains, wheat in the Sagar-Damoh plateau, wheat and gram in the Middle Narmada Valley or wheat, gram and bajra in the Gird plains of the Gwalior Division. The domi-nance of one, two or three crops in a region exhibit areal specialisation and to a large extent the amount of commercial production in the form of 'marketable surplus' is also concentrated in these items.
AGRICULTURAL ORIENTATION
Indian agriculture is primarily crop oriented and the role of animal produc-tion is insignificant. Cropping pattern and crop combination regions provide important type forming variables of agriculture. The shape and extent of a crop area is determined primarily by environmental conditions particularly by the boundaries of soil types and isohyetes. Exogenous conditions like loca-tion, transport and market, supply and demand on agricultural produce and prices play a minor role. Food crops cover 83% of the G.C.A. leaving a small margin of 17% for non-food crops. The change in the cropping pattern is very slow in traditional agriculture and there is a remarkable stability in the area devoted to food crops from year to year. The persistence of inferior grain crops of low value and productivity over a large part of the arable land however ma-kes the region agriculturally poor. About 25% to 30% of the G.C.A. is devoted to such inferior grain crops as jowar, bajra, kodo kutki, barley, other small millets and teora in order to minimise the risk of crop failures. Very low intensity of cropping is attributed to lack of perennial irrigation and poor yield of crops, 65% of the arable land is utilised for kharif 7 crops and 35% for rabis crops. Irrigation and fertilizers could reduce much of the large amount of seasonal fallows.
Crop combination regions worked out by Kostrowicki's method with the use of successive quotients has brought about some radical changes in hither to existing generalised crop names. The role of structure forming crops like pulses and ground-nut was ignored in crop combinations of former methods. These crops share about 23% of G.C.A. and claim due recognition, Madhya Pradesh as a whole gives a crop combination of E2os,ts Sxca IjSU. Rice, wheat, gram and jowar are crops of major importance. As extractive crops claim a large share
7 Kharif = rainy season 8 Rabi = winter season
http://rcin.org.pl

142 fi. P. Panda
of the cropland and intensifying crops are rarely fertilized, soil deterioration is a normal phenomena inherent in cropping. Soils should, therefore, be libe-rally fertilized to obtain a higher growth rate in agricultural production.
AGRICULTURAL TYPES
Mapping and analysis of all the above indices give us valuable information on the nature and pattern of agriculture in the state. Agriculture in the state consists mainly of three types
(1) Semi-commercial crop agriculture with medium (40% to 60%) degree of commercialisation.
(2) Semi-subsistence crop agriculture with low (20% to 40%) degree of commercialisation.
(3) Subsistence crop agriculture with very low (0-20%) degree of commercia-lisation.
Agricultural types have been presented by the following prescribed code:
where T represents type, S = social characteristics, O = organisational, P = = production and C = structural characteristics or enterprise combinations of agriculture.
Typograms prepared for each district display various degrees of low to very low ranges on world scale signifying a very poor development of agriculture. High inputs of labour and animal power and high intensity of cropland use make the agriculture labour intensive but very low capital inputs and producti-vity do not justify it to be called an intensive type of farming. Besides super-
Fig. 3. Model-typogram
http://rcin.org.pl
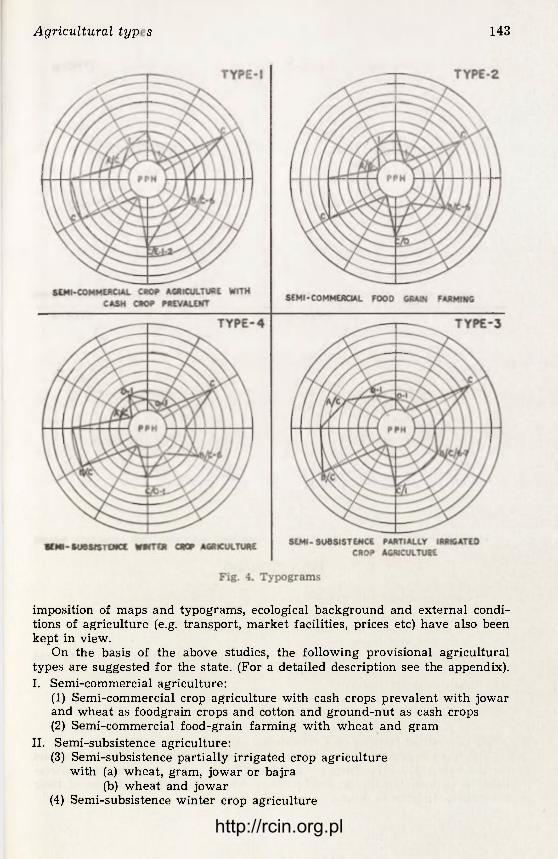
Agricultural typology of Thracian Basin 143
imposition of maps and typograms, ecological background and external condi-tions of agriculture (e.g. transport, market facilities, prices etc) have also been kept in view.
On the basis of the above studies, the following provisional agricultural types are suggested for the state. (For a detailed description see the appendix). I. Semi-commercial agriculture:
(1) Semi-commercial crop agriculture with cash crops prevalent with jowar and wheat as foodgrain crops and cotton and ground-nut as cash crops (2) Semi-commercial food-grain farming with wheat and gram
II. Semi-subsistence agriculture: (3) Semi-subsistence partially irrigated crop agriculture
with (a) wheat, gram, jowar or bajra (b) wheat and jowar
(4) Semi-subsistence winter crop agriculture
http://rcin.org.pl

144 fi. P. Panda
Fig. 5. Typograms
with (a) wheat and gram (b) wheat as dominant crop
(5) Labour intensive small scale crop agriculture with rice and teora
(6) Labour intensive non-irrigated crop agriculture with rice as dominant crop
III. Subsistence agriculture: (7) Subsistence grain crop agriculture
with (a) rice and kodo kutki as dominant and co-dominant crops (b) equal emphasis on rice and wheat.
(8) Diversified farming of a subsistence nature. The types suggested above are based on the data and agricultural situation
for the years 1970-1974. They are not static features but are subject to altera-tions in an evolutionary or revolutionary way along with a change of their basic characteristics in future.
http://rcin.org.pl

Agricultural t y p o l o g y of Thracian Basin 145
With increasing provision of perennial irrigation a shift f r o m cultivation of inferior grains and small millets to superior foodgrains and f r o m less re -munerative to more remunerative crops appears inevitable along with a rise in the level of productivity.
REFERENCES
Agricultural statistics of Madhya Pradesh, 1965-1966 to 1974-1975, Director of Land Records, M. P. Gwalior.
Agricultural statistics, 1975, Director of Agriculture, M. P. Bhopal. Applied sciences and development, 1973, vol. 2, Institute of Scientific Cooperation,
Tübingen. Grigg D. B., 1976, Population pressure and agricultural change, in: Progress in geo-
graphy, vol. 3, Edward Arnold, pp. 135-161. International Geography, 1972, vol. 2, 22nd International Geographical Congress,
Montreal. Kostrowicki J., 1974, The typology of world agriculture. Principles, methods and
model types, Warsaw. Morgan W. B., Munton R. T. C., 1971, Agricultural geography, Methuen and Co. Ltd.,
London. Panda B. P., 1972, Chhattisgarh Basin, a study in agricultural land use. Unpublished
Ph. D. Thesis, Jiwaji University, Gwalior. Reeds L. G. (ed.), 1973, Agricultural typology and land use. McMaster University,
Hamilton, Ontario, Canada. Vanzetti C. (ed.), 1972, Agricultural typology and land utilization, Academy of Agri-
cultural Sciences and Humanities, Verona, Italy.
lu Gsographia Polonica http://rcin.org.pl

http://rcin.org.pl

APPENDIX
Types of agriculture in Madhya Pradesh
(A) SEMI-COMMERCIAL AGRICULTURE
(1) SEMI-COMMERCIAL CROP AGRICULTURE WITH CASH CROPS PREVALENT
PPH 1-2, 2-3, 2-3,1 0 1 ) 0 1
Land owned and operated by small peasant proprietors with or without the help of hired workers. Average size of the holding small in terms of agricultu-ral area, no. of employed people and no. of livestock units very small in terms of gross agricultural production. Over 75% of arable land concentrated in the size-group 5-10 ha and over. High inputs of labour and medium inputs of ani-mal power. Very low capital inputs on mechanisation and irrigation. Small use of fertilizers. Full and continuous use of cultivated land. Little role of pe-rennial crops (20% of G.C.A.). High density of livestock population on very lit-tle grassland. Land productivity low and labour productivity very low by world standard. Medium degree of commercialisation makes it a distinctive type. Level of commercialisation very low to low. Low degree of specialisation. Agriculture oriented to production of food crops like jowar and wheat and cash crops like cotton and groundnut. Opium production in Mandsaur and Ratlam important for value. Role of intensifying crops significant, larger concentration of cotton, and ground-nut in Khandwa and Khargone. Districts — Rajgarh, Shajapur, Dewas, Indore, Ujjain, Dhar, Ratlam, Mandsaur,
Khandwa and Kahargone.
(2) SEMI-COMMERCIAL FOOD GRAIN FARMING
Land owned and operated by peasant proprietors with or without the help of hired labour. Average size of the holding small in terms of agricultural area, no. of actively employed people and no. of livestock units very small in terms of gross agricultural output. Over 85% of arable land concentrated in size-group 5-10 ha and over. Labour and animal inputs high. Very low capital inputs in machinery, fertilizers and irrigation. Full and continuous use of agricultural land. Very little role of perennial crop and grasslands. High density of lives-tock. Land productivity low but labour productivity very low. Medium degree of commercialisation. Level of commercialisation very small to small. Low to medium degree of specialisation. Agriculture oriented to growing of food crops like wheat and gram, crop combination E3ts Sjca. Districts — Raisen, Vidisa, Sehore.
10* http://rcin.org.pl

148 fi. P. Panda
(B) SEMI-SUBSISTENCE AGRICULTURE
(3) SEMI-SUBSISTENCE PARTIALLY IRRIGATED FOOD CROP AGRICULTURE
P P H 1 ,1 , A N M - 7 , 0 , 2 - 3 , 3 - 4 , 6 - 7 , 0 , 1 , 6 - 7 2, 0, 3 - 4 , 1 - 2 , 2 - 3
Private ownership of land, operated by peasant owners with or without the help of hired labour. Average size of holding very small in terms of agricul-tural area, no. of employed people and gross agricultural output. Labour and animal inputs high to very high. Mechanisation insignificant. Small inputs of fertilizers. Small to medium amount of irrigaton mainly by canals. Full and continuous use of crop land with very little multicropping. Role of perennial crops insignificant. Very low amount of permanent grassland. High density of livestock population. Land productivity low and labour productivity very low. Degree of commercialisation low to medium. Very low to low level of com-mercialisation; low degree of specialisation. Agriculture oriented to production of food grains like wheat, gram, jowar over most parts, wheat and jowar in the Shivpuri and Guna districts, bajra replaces jowar in Morena and Bhind districts.
Districts (a) (1) Gwalior, Datia, Tikamgarh and Chhattarpur — wheat, gram, jowar.
(2) Morena and Bhind — wheat, gram, bajra. (b) Shivpuri and Guna — wheat, jowar.
(4) S EMI-SUBSISTENCE WINTER CROP AGRICULTURE
p p h i , i - 2 , i , o - i 6 - M 2 ; ^ ; ° 1 L 6 2 ; " d - - o - i . o - i
Land owned and operated by small peasants with or without the help of hired workers. Average size of the holding very small to small in terms of agricultural area, very small in terms of a number of employed people, livestock units and gross agricultural output. High inputs of labour and animal power. Insignificant to very little capital inputs on implements, fertilizers and irriga-tion. Full and continuous use of cultivated land. Most of the arable land lies fallow in Kharif (rainy season). Role of perennial crops and grassland insigni-ficant to very little. High density of livestock population. Land productivity low but labour productivity very low. Low degree of commercialisation; level of commercialisation very low to low, low to medium degree of specialisation. Agriculture oriented to growing of wheat as preponderant crop in E group and gram as accompanying crop in S group, wheat as dominant crop in Sagar and Damoh.
Districts (a) southern part of Jabalpur, northern part of Seoni, Narsinghpur and Hoshangabad — wheat with gram,
(b) Sagar, Damoh — wheat.
(5) LABOUR INTENSIVE SMALL SCALE CROP AGRICULTURE
PPH 2,1,2, . M J g J ^ u
Land owned and operated by small peasant owners, with or without the help of hired workers. Average size of the holding very small in terms of agri-
http://rcin.org.pl

Agricultural types *
149
cultural area and gross agricultural output, small in terms of no. of employed people and livestock units, labour inputs high, very high animal inputs. Mecha-nisation and chemical fertilization both very low. Small to medium amount of irrigation by canals and tanks. Irrigation seasonal and supplemental in nature. Scope exists for great extension. Full and continuous utilisation of agricultu-ral land with multiple cropping over 20°/o to 40% of N.S.A. 2nd crops in double cropping of little economic significance as most of them are catch crops of very low productivity and value. Role of perennial crops and grasslands very little. High density of livestock population. Degree of commercialisation low. Very low level of commercialisation. Medium degree of specialisation. Agriculture oriented to growing of paddy as preponderant crop in 'E' group and teora pulse as accompanying crop in 'S' group, heavy concentration of paddy in the Kharif season.
Districts — Raipur, Durg, Rajnandgaon, Bilaspur, southern part of Raigarh, Ba-laghat and southern part of Seoni.
(6) LABOUR INTENSIVE, NON-IRRIGATED RICE FARMING —
PPH 2,1-2, 2-3, 0-1 W W y - V ! _ 2 , x _ 2
Private ownership of land operated by owners with or without the help of hired workers. Average size of the holding very small to small in terms of agri-cultural area and small in terms of actively employed people and no. of li-vestock units. Very low gross output per holding. Mechanisation, fertilizers and irrigation insignificant. Full and continuous use of arable land in Kharif; 90% to 95% of agricultural area kept fallow in winter. Very little to little amount of grass land. Land productivity low and that of labour insignificant to very low. Low degree of commercialisation, medium degree of specialisation, some attention paid to raising draught and milk cattle for sale. Heavy concen-tration of paddy, rice as dominant crop.
Districts — Bastar. Surguja and northern parts of Raigarh.
(C) SUBSISTENCE AGRICULTURE
(7) SUBSISTENCE GRAIN CROP AGRICULTURE
PPH 1 > 1 > 2 > 0 _ M . 0,0, 0 ,6,0, 0,7 ' ' ' 1 ,0 ,0 -1 ,0 -1 ,2
Land owned and operated by small peasant owners with or without the help of hired workers. Average size of the holding very small in terms of agri-cultural area, employed people and gross output. Labour inputs high and ani-mal inputs very high. Capital inputs of machinery, fertilizers and irrigation insignificant to extremely low. Very little role of perennial crops and grassland. Very high density of livestock. Land productivity very low and labour produc-tivity extremely low. Degree and level of commercialisation extremely low over most parts to very low in Mandla and Panna. Low degreee of specialisation. High pressure of population on land of very low productivity. Labour pro-ductivity insignificant. Some animal production for draught and milk in the forest areas of the Sidhi. Shahdol and Mandla districts. Agriculture oriented to
http://rcin.org.pl

150 fi. P. Panda
growing of foodgrain crops, equal role of rice and wheat in the western parts, rice and kodo kutki as dominant and co-dominant crops in the eastern part.
Districts (a) Rewa, Satna, Panna and northern parts of Jabalpur. Orientation — rice and wheat,
(b) Sidhi, Shahdol and Mandla — rice and kodo kutki.
(8) DIVERSIFIED FARMING OF SUBSISTENCE NATURE
PPH 2 1 2 2 3 Q 6. 7-8, 0 ,0,1,6, 0 -1 ,0 -1 ,6 -7 0 i 0 ! 2,1-2, 2-3, 0 i_2f 0 ,1-2 ,0-1 ,0-1
Private ownership of land, operated by owners with or without the help of hired workers. Average size of the holding very small to small in terms of agri-cultural area, small in terms of employed people and livestock units. High in-puts of labour and animal power. Capital inputs of machinery, fertilizers and irrigation insignificant to extremely low. Full and continuous use of cultivated land. Role of perennial crops and permanent grasslands very little. High den-sity of livestock population. Land productivity low but labour productivity very low. Low degree of commercialisation. Very small amount of commercial production per ha. Very low degree of specialisation, first crop 20% of G.C.A. and rest less than 10%. Farming highly diversified with full dispersal of crops. Agriculture oriented to growing of jowar, kodo kutki, wheat, gram, tur, rice and ground-nut in the Chhindwara and Betul districts; maize, jowar, rice, blackgram, horsegram, gram, ground-nut and cotton important crops of the Jhabua districts.
Districts — Chhindwara, Betul and Jhabua.
http://rcin.org.pl

CEOGRAPHIA POLONICA 40, 1979
A P P L I C A T I O N D E S N O R M E S P R O P O S É E S P A R J . K O S T R O W I C K I A L ' A G R I C U L T U R E F R A N Ç A I S E
JACQUELINE BONNAMOUR, CHANTAL GILLETTE
Ecole Normale Supérieure, Fontenay-aux-Roses, France
Les recherches proposées par le Professeur Kostrowicki depuis le Congrès de Londres ont largement contribué à la progresion de la connaissance de notre agriculture. Dans l'esprit défini par la Commission, nous avions tenté une série de travaux dont nous avons exposé les résultats aux réunions précédentes. Toutefois c'est à l'intérieur des frontières nationales que nous cherchions à étab-lir une typologie susceptible de donner de l'agriculture française une image cohérente, susceptible de ne pas trop altérer les nuances qu'une longue connais-sance de l'agriculture et de la géographie de notre pays a peu à peu imposées à nos esprits. Les travaux que nous présentons aujourd'hui sont d'une toute autre essence. Il s'agit de l'application pure et simple des propositions de J. Ko-strowicki telles qu'elles ont été redéfinies l'an dernier au colloque de Fontenay--aux-Roses en vue d'une contribution à une carte mondiale des types d'agri-culture.
I. RÉFLEXION SUR LE T R A V A I L ET ÉTAT DE CELUI-CI
L'application de la méthode de J. Kostrowicki représente une somme impor-tante de travail: collecte des données, adaptation des sources aux finalités des divers critères, calculs nombreux, vérifications etc. Ce sont deux chercheurs de notre laboratoire qui ont pris cette tâche en charge: Ch. Gillette, assistante à l'E. N. S. de Fontenay-aux-Roses, qui était déjà associée aux travaux anté-rieurs et E. Bolze, étudiant de 3ème cycle, qui a été entraîné et qui a participé à l'entreprise.
Il s'agissait en premier lieu de choisir une unité de base pour la collecte des données: le choix s'est porté sur la "petite région agricole" (P. R. A.), malgré la volonté simplificatrice de l'entreprise. L'équipe a redouté précisément d'être taxée de simplisme si les cartes établies l'étaient d'après un maillage trop large de l'espace agricole; elle a accepté le risque (et la fatigue) d'une division très fine du territoire agricole qui lève tous les scrupules des chercheurs et en der-nier ressort ne complique pas l'image du territoire si l'on utilise les coupures proposées par la Commission internationale.
A ce niveau d'analyse, Ch. Gillette et F. Bolze ont collecté les données, effectué les calculs et pris les partis qu'imposait la nature des sources; tout ce travail fait l'objet d'une description détaillée à paraître dans un prochain Ca-hier de Fontenay. Dans l'état actuel du travail, les cartes ont été établies cri-
http://rcin.org.pl

152 J. Bonnamour, Ch. Gillette
tère par critère pour une quinzaine d'entre elles 1. Une mise en perforation est en cours pour un classement par ordinateur des résultats obtenus en classes et en valeurs absolues. Ce n'est donc qu'une étape partielle de l'ensemble du travail envisagé que nous présentons aujourd'hui; même à ce stade s'imposent avec vigueur les partis pris de la Commission internationale et leur utilité fon-damentale.
II. LES CARTES DES TAILLES DES EXPLOITATIONS
Nous n'avons établi ni la carte du critère C1( la propriété privée personnelle étant quasi générale, ni la carte du critère C2 pour laquelle nous avons eu trop tardivement les données. Mais nous avons prêté une attention particulière aux quatre cartes définissant la taille des exploitations par le nombre de travail-leurs, la superficie, l'importance du cheptel et la production brute. En effet, l'habitude imposée par notre appareil statistique demande de considérer la superficie comme un critère privilégié pour définir la taille des exploitations; le développement des centres de gestion et du réseau comptable nous a entraîné à toujours évaluer la production en valeurs francs, c'est à dire à avaliser par ses résultats la politique des prix agricoles imposée sur le marché.
La démarche conforme aux instructions de la Commission nous apporte quelques renseignements nouveaux:
— Deux cartes 2 soulignent la grande uniformité de l'agriculture française, celles des travailleurs par exploitation et celles du cheptel. La carte C3 situe la France entière à l'exception des plaines au Nord de Paris, la Crau et quel-ques régions isolées dans la catégorie agricole employant moins de deux tra-vailleurs par exploitation. La carte C5 souligne l'existence quasi générale de 10 à 50 U. G. B. par exploitation sur l'ensemble du territoire à l'exception de quelques parties de Beauce, des Landes et d'un Grand Midi Méditerranéen. D'aucuns accuseront certes la classe trop large qui préside au classement, mais 11 est nécessaire de simplifier l'image de notre agriculture pour la replacer sur l 'échiquier mondial: c'est une agriculture à 1 ou 2 hommes, caractérisée par des troupeaux de taille moyenne.
— Si la carte C4 (Fig. 1) ne renouvelle pas notre vision du territoire dans la mesure où nous avons l'habitude d'opposer les petites exploitations du midi de la France, de Bretagne, du Nord et de l'Alsace, aux entreprises de plus grandes dimensions du centre du Bassin de Paris. La carte montre néanmoins l'extension des fermes de 50 à 200 ha aux marges du Berry et du Massif Cen-tral et le regroupement qui s'opère depuis quelques lustres dans la région toul-ousaine et dans les Causses, mais l'ensemble du territoire s'inscrit encore d'un point de vue mondial dans les catégories moyennes de superficie.
— Quant à la carte C6 établie d'après la production brute par exploitation, celle-ci n'étant plus évaluée en francs mais en unités-grains, elle oppose vigour-eusement une France du Nord et une France du Sud (catégorie 4). Ce qui est nouveau c'est la limite plus méridionale entre les deux unités. Celle-ci court de la Gironde à la Dordogne, au carrefour lyonnais et se situe plus au Sud que sur les cartes de productivité établies d'après la valeur francs. La zone de classe 5 englobe en effet aussi bien les plaines céréalières, le Nord polyculteur, la Bretagne et les zones d'élevage du Nord du Massif Central, rejetant en zone
1 Avec l'aide de P. Gonin et de O. Layus technicienne. 2 Parmi les 17 cartes établies pour illustrer les différents traits caractéristiques de
l'agriculture, seulement 7 d'entre elles ont été choisies pour la publication.
http://rcin.org.pl

Application des normes proposées par J. Kostroivicki 153
Fig. 1. La taille des exploitations en hectares (carte C 4) Size of farms in terms of the total amount of agricultural land per one holding in
hectares
4 les régions de haute montagne (Alpes, Pyrénées), de forêts (Landes et bordure orientale du Massif Central), une partie de l 'Alsace et sa partie agriculture.
Par rapport à l 'ensemble des types d'agriculture, le schéma français se situe à des normes assez faibles pour les critères sociaux et les critères de taille, par contre à des normes très élevées pour le critère production, ces critères peuvent être schématisés par:
III. LES CARTES DES CARACTÉRISTIQUES TECHNIQUES
Si on essaye de les regrouper d'après leurs enseignements, nous pouvons considérer trois groupes de cartes dans cet ensemble: les cartes qui contraire-ment à toutes nos distinctions habituelles nous donnent une image quasi unifor-me du territoire national, celles qui font apparaître des groupements nouveaux, celles qui répètent les nuances maintes fois décrites.
http://rcin.org.pl
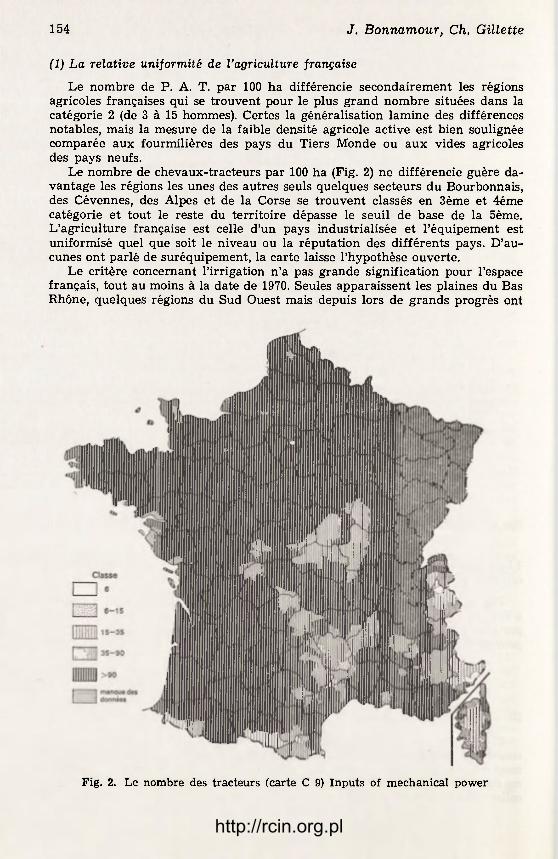
154 J. Bonnamour, Ch. Gillette
(1) La relative uniformité de l'agriculture française
Le nombre de P. A. T. par 100 ha différencie secondairement les régions agricoles françaises qui se trouvent pour le plus grand nombre situées dans la catégorie 2 (de 3 à 15 hommes). Certes la généralisation lamine des différences notables, mais la mesure de la faible densité agricole active est bien soulignée comparée aux fourmilières des pays du Tiers Monde ou aux vides agricoles des pays neufs.
Le nombre de chevaux-tracteurs par 100 ha (Fig. 2) ne différencie guère da-vantage les régions les unes des autres seuls quelques secteurs du Bourbonnais, des Cévennes, des Alpes et de la Corse se trouvent classés en 3ème et 4éme catégorie et tout le reste du territoire dépasse le seuil de base de la 5ème. L'agriculture française est celle d'un pays industrialisée et l'équipement est uniformisé quel que soit le niveau ou la réputation des différents pays. D'au-cunes ont parlé de suréquipement, la carte laisse l'hypothèse ouverte.
Le critère concernant l'irrigation n'a pas grande signification pour l'espace français, tout au moins à la date de 1970. Seules apparaissent les plaines du Bas Rhône, quelques régions du Sud Ouest mais depuis lors de grands progrès ont
Fig. 2. Le nombre des tracteurs (carte C 9) Inputs of mechanical power
http://rcin.org.pl

Application des normes proposées par J. Kostroivicki 155
été effectués; en particulier l'aspersion s'est répandue depuis lors et la séche-resse exceptionnelle de l'été contribuera sans doute encore à son extension. Les cultures perennes (Fig. 3) différencient les régions de la vallée du Rhône, du Val de Loire et de l'Aquitaine, mais celles-ci ne représentent qu'une faible superficie par rapport à l'ensemble du territoire.
(2) Deux cartes apportent des découpages différents: celle des chevaux de trait et celle des engrais.
L'originalité de la Bretagne se marque encore par l'existence de quelques unités de trait, mais en une survivance qui s'efface rapidement et ne devrait plus apparaître en 1980 (carte Ce) (Fig. 4).
La carte C10 (Fig. 5) des engrais offre des secteurs bien différenciés. Un grand ensemble Ouest/Nord Ouest s'étend au nord d'une ligne allant de la Gi-ronde à l'Ardenne caractérisée par des apports supérieurs à 80 imités de fer-tilisants purs par ha et même à 200 unités dans le bloc — Centre du Bassin de Paris et France du Nord. Sont aussi regroupées nos grandes plaines agricoles et l'Ouest qui a accompli une grande modernisation de son agriculture. Dans la partie Sud et Sud Est, on distingue une bande Sud Ouest/Nord Est allant du
http://rcin.org.pl

156 J. Bonnamour, Ch. Gillette
Fig. 4. Le nombre des chevaux de trait (carte C 8) Inputs of animal power
Bordelais à la Lorraine par le Limousin, le Bourbonnais, la Bourgog-ne où le poids d'engrais se situent au niveau 3 (entre 30 et 80 unités). Cette bande isole l'agriculture de l'Ouest/Nord Ouest utilisant énormément d'engrais, à la France du Sud et du Sud Est où s'accusent de grands contrastes: secteurs très fertilisés de la vallée du Rhône et de l'Aquitaine, secteurs peu fertilisés des Hautes Alpes, de la Corse et de quelques montagnes du centre. (3) Les cartes C14 et C15 (Fig. 6) concernant les surfaces toujours en herbe et la charge en U. G. B. demeurent conformes aux images traditionnelles de l'agri-culture française.
Les surfaces toujours en herbe caractérisent d'une part la Normandie et les marges armoricaines, d'autre part les ensembles montagneux et leurs marges mais elles ne recouvrent moins de 20% de la superficie cultivable, que dans le centre du Bassin de Paris, en Gascogne et dans le Midi méditerranéen.
http://rcin.org.pl

Application des normes proposées par J. Kostroivicki 157
Fig. 5. L'emploi des engrais chimiques (carte C 10) Chemical fertilizing
Par contre la charge en U. G. B. souligne l'orientation vers l'élevage d'un grand nombre de régions agricoles, seul le centre du Bassin de Paris et le Midi en catégorie 2 avec moins de 30 U. G. B. aux 100 ha.
L'ensemble des critères d'organisation et de technicité donne en gros au ni-weau de la France entière ces données pour la numération de la formule:
C'est à dire une agriculture qui demande plus à la machine et aux engrais qu'à l'homme; une agriculture orientée vers la production végétale annuelle dont une grande partie est utilisée pour l'élevage.
http://rcin.org.pl

158 J. Bonnamour, Ch. Gillette
Fig. 6. Le nombre de cheptel en U.G.B. (carte C 15) Intensity of livestock breeding
IV. LES CARTES DE LA PRODUCTION ET DE L'ORIENTATION DES SYSTÈMES D'EXPLOITATION
La vision nouvelle révélée par le calcul en unités-grains est évidente. Elle nous a fait prendre conscience de l'importance de la production en France par rapport à d'autres pays.
— La carte de la production brute par hectare. L'ensemble de la France se situe en classes 3-4. Il faut toutefois souligner l'hétérogénéité de la produ-ction brute par ha, sur l'ensemble du territoire.
Production brute par ha Moins 10 à 20 à 50 à 70 à Plus de en imités-grains de 10 20 50 70 100 100
Nombre de régions agricoles 3 7 279 259 110 32
http://rcin.org.pl

Application des normes proposées par J. Kostroivicki 159
Très peu de régions ont moins de 20 UG/ha: ce sont des régions aux sols très pauvres et très isolées: les Causses, les Cévennes et certains plateaux des Alpes du Sud. L'ensemble des régions produisent entre 20 et 70 UG/ha, les dis-tinctions sont dûes soit aux conditions naturelles soit à l'orientation de la pro-duction: on trouve des régions de grandes exploitations céréalières avec très peu d'élevage ou des zones de polyculture-élevage où les conditions naturelles sont moyennes et où le niveau technologique est moins avancé que dans le Bas-sin de Paris. Les régions produisant plus de 100 UG/ha sont les zones de po-lyculture intensive du Nord, de la Bretagne, du Sud Est de la France, des Pays de la Loire, les vignobles champenois, alsacien, languedocien, la vallée du Rhône et le littoral de Provence.
— La carte de la production brute par P.A.T. Pour ce critère la France se situe en classes 2-3 là aussi l'on constate une hétérogénéité encore plus grande: dans le coteau niçois un P.A.T. (ou U.T.H.) produit 150 unités-grains, dans le Plateau Picard un P.A.T. produit 2074 unités-grains.
Production brute par Moins de 200 à 500 à 700 à Plus de P.A.T. en unités-grains 200 U.G. 500 700 1000 1000 Nombre de régions agricoles 6 139 134 171 167
Les régions ayant la plus faible production, ont pour spécialités des arbres de fleurs ou de plantes de parfum. Ensuite la distribution est continue entre 200 UG/P.A.T. et 1000. Les régions où la production est plus élevée, se situ-ent plus spécialement dans les deux tuiers Nord de la France: les régions céréalières du bassin parisien, les régions de polyculture très diversifiées du Nord de la France, de Bretagne, des Pays de la Loire. Avec ce critère la dif-férenciation entre les régions Nord et les régions Sud se confirme comme nous l'avons déjà montrée à partir du critère C6 et dans une moindre mesure du critère C7.
Il ne nous a pas semblé urgent d'établir les cartes du degré de commerciali-sation et de la valeur commercialisée rapportée à l'hectare. L'autoconsommation en France représente de 2 à 5% de la production et la transformation des cultures en nourriture pour l'élevage est difficile à estimer.
Quant à la carte de spécialisation du système de production C20, elle montre à quel point la monoculture est étrangère à l'agriculture française: seul le Languedoc viticole est en classe 5; seul l'élevage normand ou presque est en classe 4; la majeure partie du territoire est partagée entre 3 pour la polyculture élevage des montagnes et de leur marge, 2 pour les ensembles de plaines. L'o-rientation de la production souligne le rôle majeur de la place de l'élevage dans notre conception de l'agriculture française (Fig. 7).
Les caractéristiques de production pour la France peuvent être schématisées comme suit:
http://rcin.org.pl

160 J. Bonnamour, Ch. Gillette
Fig. 7. Le pourcentage de la production animale en production commerciale (carte C 21) Production orientation
L'éclairage apporté par la méthode de la typologie agraire du Professeur Kostrowicki révèle le caractère très original de l'agriculture française. Si ses structures demeurent moyennes et restent marquées par un long passé de paysannerie, les capacités de production de ces petites unités rejoignent les performances de certaines grandes entreprises des pays socialistes. Cependant la méthode permet de confronter immédiatement ces résultats aux conditions de la production: ils sont obtenus au prix d'une grande intensification des systèmes et celle-ci s'apparente paradoxalement au mode de production de l'Asie du Sud Est tout en disposant d'une technologie avancée. C'est dire que l'Agricul-teur Français doit à la fois payer par son travail et s'engager dans un processus de charges financières quasi irréversibles.
Ces premiers résultats méritent dans les mois à venir d'être poursuivis par une série de travaux et d'analyses complémentaires, mais il fallait les publier dans ce premier stade de la recherche, compte-tenu de cet apport fondamental, de cette décantation des problèmes de fonds que permet la méthode adoptée.
http://rcin.org.pl

GEOGRAPHIA POLONICA 40, 1979
C H A N G I N G T Y P E S O F A U S T R I A N A G R I C U L T U R E , 1 9 6 0 - 1 9 7 0
R O M A N SZCZĘSNY
Institute of Geography and Spatial Organization, Polish Academy of Sciences, Warsaw, Poland
A number of studies have been made at the Department of Agricultural Geography of the Institute of Geography and Spatial Organization, Polish Academy of Sciences, in which the principles and methods of agricultural typology, recommended by the Commission have been applied and tested. They covered either the whole of Poland (J. Kostrowicki 1969, 1974; J. Kostrowicki and R. Szczęsny 1971, 1972, 1975, 1976; R. Szczęsny 1975, 1976; W. Tyszkiewicz 1975), some selected parts of this country (W. Stola 1970; W. Biegajło 1973; M. Matusik 1973), or some foreign countries of regions (W. Stola 1974, 1975, 1976; W. Tyszkiewicz 1976). All of them mark also subsequent stages in the development of the typological concept and method.
The present paper is based on material collected during the author's stay in Austria in 1975 for 25 agricultural production regions, Landwirtschaftliche Produktionsgebiete (LPG) for the years 1960 and 1970.
Those data served as a basis for computing 27 variables representing 24 diagnostic features expressed by codes recommended by the Commission in the final version of the typology of world agriculture (J. Kostrowicki 1976). Both the deviation and the successive products methods were applied to identify the types of agriculture.
The comparison of the codes, elaborated for individual territorial units (LPG), with the model codes of world types of agriculture (J. Kostrowicki 1976) revealed that in most cases they could be identified with the following types anticipated by those model codes and classified as either of the Type T (tradi-tional, small scale agriculture) or Type M (market oriented agriculture) of the first order.
T. Traditional agriculture Tmk — 1151212 — 4423144 — 4422223 — 122331
Semi-subsistence labour intensive mixed agriculture. Tmm — 1151222 — 3312143 — 3322332 — 123231
Semi-commercial mixed agriculture. Tml — 1151222 — 2223143 — 3333333 — 131341
Semi-commercial mixed agriculture with livestock breeding prevalent. M. Market-oriented agriculture
Mmc — 1151222 — 4244242 — 4433444 — 213222 Commercial small-scale, mixed agriculture with crop growing prevalent.
Mmm — 1151222 — 3255144 — 4444444 — 123231 Commercial small-scale mixed agriculture.
Mml — 1151232 — 3254145 — 4444443 — 131451 Commercial mixed agriculture with livestock breeding prevalent.
U Geographia Polonica http://rcin.org.pl

162 R. Szczęsny
The codes for several units exceeded however the number of 10 deviations from any of the model codes, postulated as a limit for respective agriculture to be included in the identified types.
In such a situation the author decided to group those units according to their similarities and to describe the resulting groupings as new types.
One of those types was already described by the author in an unpublished as yet study based on data for Western Poland. This is Type Tmp with a code: 1151122 — 3434143 — 4433333 — 112341, which explains that this is a traditional, private, agriculture with very small holdings in terms of the number of emp-loyed and small in terms of the acreage and gross output per 1 holding. Labour inputs are medium, inputs of animal power—high, that of mechanical power— medium. Chemical fertilization is high. Irrigation does not play any role. Intensity of cropland use is high, that of livestock breeding—medium. Land productivity is high, labour productivity and commercialization—medium. The proportion of perennial crops and permanent grassland is very low (i.e. field crop agriculture dominates), the proportion of primary food products is low. The proportion of animal products in gross agricultural production is medium, in commercial production is high. The significance of industrial crops is very small.
From the closest types it differs from Type Tmm primarily by a size of holdings in terms of the number of employed people, by a higher mechanization and chemical fertilization, but also by a higher use of animal power, as well as by a higher land and labour productivity and a higher commercial produc-tion per unit area. The proportion of primary food products is lower, and that of livestock products higher in both gross and commercial output (14 deviations).
From Type Tml it differs also by the number of employed per 1 holding, by higher inputs of labour, much higher inputs of animal power, a higher mecha-nization and fertilization, a higher land productivity, a much lower proportion of grassland, and a higher proportion of primary food products (11 deviations).
From the closest market oriented Type (Mmm) it differs not only by a smal-ler size of holdings in terms of both the number of employed people and agri-cultural acreage, by a much higher use of animal power, but also by a lower mechanization and fertilization, lower livestock density, lower labour producti-vity and commercialization, a lower proportion of permanent grassland, a lower share of primary food products, and a lower percentage of livestock products in both gross and commercial output (16 deviations).
Altogether it is a largely traditional, though rather intensive agriculture both in terms of labour and capital inputs, which because of the small size of farms are not sufficiently reflected in labour productivity and commercializa-tion; thus the type is semi-commercial, mixed with livestock (mostly pigs) breeding prevalent, based more on the use of permanent grassland than on concentrated feeds.
This type of agriculture combined with some other (Tml or Mml) has deve-loped mainly on the lowlands of Upper and Lower Austria.
The two other new types will be described on the basis of the Austrian ma-terial. (1) Type Tma with a code — 1151232 — 2243141 — 2222222 — 151351.
It is a traditional, small scale, private agriculture. The holdings are small to medium in terms of the number of actively employed per 1 holding (2.6-3.3 people), medium in terms of agricultural acreage (13-36 hectares) and small in terms of gross output (266-423 conventional units). Inputs of labour are low (9.4-13.8 people per 100 ha of agricultural land), inputs of animal power low
http://rcin.org.pl

Fig. 1. The Types of Austrian Agriculture in 1960
http://rcin.org.pl

164 R. Szczęsny
to medium (6-14 conventional horse units) inputs of mechanical power high (58-93 HP per 100 hectares of cultivated land), chemical fertilization medium (30-67 kg NPK per 1 hectare of cultivated land). There is no irrigation, the intensity of cropland use is high (0.99-1.00), the intensity of livestock bree-ding— medium. Land and labour productivity is low (10-21 or 89-125 units respectively). The degree of commercialization is low (29-38%) and so is co-mmercial production per unit area of agricultural land (3-8 units).
The proportion of land under perennial crops is negligible (0.1-0.3%), while under permanent grassland high to very high (65-86%). Primary food produc-tion— very low (12-19%). General production emphasis is mixed (43-51%). The proportion of animal products in commercial production is very high (89-99%). The proportion of industrial crops in gross production is very low.
From the closest model type (Tml) it differs by a larger size of holdings in terms of acreage, a higher mechanization and fertilization, and a much lower density of livestock population, lower productivity and commercialization, a higher proportion of permanent grassland, and a higher proportion of live-stock products in commercial output (16 deviations).
In general this is a traditional, semi-subsistence, mountain agriculture, highly oriented to livestock breeding based on an intensive use of cultivated land on a limited area and an extensive use of large tracts of permanent moun-tain pastures with disappearing nowadays seasonal grazing so characteristic of Alpine heights. (2) Type Tmh— 1151222 —3155143 —3333333 — 113121
Another form of the traditional, small-scale, mixed agriculture with crop growing prevalent. The holdings are small in terms of working people (1.7-2.1), agricultural acreage (4.4-6.8 ha) and gross output (200-770 units) per 1 holding. Labour inputs are medium (19-33 people), inputs of animal power very low (1.2-1.9 horses) inputs of mechanical power very high (200-300 HP), chemical fertilization very high (170-205 kg NPK per 1 ha). No irrigation. High intensity of cropland use (0.97-0,98%) and medium of animal breeding (41-79 LA). Land productivity is medium (40-45 units per 1 ha), labour productivity medium (126-153 units). The degree of commercialization is medium (40-53%), and so is commercial production per unit area (15-21 units).
The rate of perennial crops is very low to low (3.1-13.0%), the rate of per-manent grasslands very low (12.0-14.0%), the proportion of primary food pro-ducts— medium (40-48%), the proportion of animal products in gross produc-tion is very low (15-18%), in commercial production — low (20.3-22.8%). The proportion of industrial crops in gross production very low (13.8-17.5%).
From the closest type of traditional agriculture (Tmm) it differs by much lower inputs of animal power, a much higher mechanization and chemical fertilization, lower labour productivity, a lower proportion of permanent gras-slands and a lower rate of livestock products in both gross and commercial production (14 deviations).
From the closest types of market oriented agriculture it differs from Type Mme by lower inputs of labour and animal power, a higher mechanization and fertilization, lower land productivity and commercialization, a lower proportion of perennial crops and a lower rate of livestock products in gross production and a lower proportion of industrial crops (14 deviations).
From the Type Mmm it differs by lower inputs of animal power, a lower density of livestock population, lower productivity and commercialization, a lo-wer proportion of permanent grassland, and a lower rate of livestock products in gross and commercial production (12 deviations).
http://rcin.org.pl

Fig. 1. The Types of Austrian Agriculture in 1960
http://rcin.org.pl

166 R. Szczęsny
Altogether it is a small-scale, mixed agriculture with crop growing pre-valent, with high capital inputs but medium productivity and commercializa-tion, characteristic mainly of Burgenland. It is possible that before collectiviza-tion the same type in a less advanced form prevailed on the whole Pannonian Plain. In such a large and internally diversified aggregate, as the Austrian LPGs are, one agricultural type occurred rarely. In most cases a combination of two or more types is noted, intermingled because of either different natural and other conditions, or transitory, in space or time.
In 1960 traditional agriculture dominated in most of Austria. Except the Lo-wer Austria it was a mixed agriculture with livestock breeding prevalent. Wi-thin its framework however, various types had developed depending on diffe-ring external natural and other conditions. Type Tma reigned in the upper Alpine areas, particularly in the west, while in lower positions it was inter-mingled with Type Tml, which in turn dominated in the Upper Austria (LPG IV D), Salzburg (LPG V F), Vorarlberg (IX F), and Carinthia (LPG VII E).
In the lowlands of Upper and Lower Austria the combination of Types Tml and Tmp was more frequent, while in northern Burgenland (LPG III H) a more crop oriented combination of types Tml and Tmh, prevailed. In Southern Burgenland (C and G) and Lower Steiermark (LPG Steiermark G) very tradi-tional semi-subsistence agriculture of Type Tmk still dominated, while for Lower Austria (LPG II H) a combination of the traditional types Tmp and Tmh, prevailing over market oriented Mmc, was characteristic.
The comparison of maps for 1960 and 1970 revealed immediately that while in the mountains changes were negligible, as far as the types of agriculture we-re concerned, agriculture in lower parts changed considerably. The traditional agriculture either disappeared almost entirely, or in 1970 occurred in various combinations with various types of market-oriented agriculture. The only exception was Burgenland, where traditional semi-commercial agriculture of Type Tmh expanded to cover the whole province. In Lower Steiermark former semi-subsistence agriculture of Type Tmh was replaced by the combination of Types Tmp and Mml, in the LPG Upper Austria D, Type Tml by the combina-tion Tmli/Tmpj/Mml, and in Vorarlberg F by the combination Tml2/Mml2, in the Lower Austria D the combination Trnhj/Tmpj/Mmcj was substituted by more a commercial one Tmh1/Mmc1/Mmm2.
In the lowlands of Lower and Upper Austria instead of Tmm,/Tml, fully market oriented, similar combination Mmm2/Mml2 became dominant and in Salzburg F-Mml4.
Those changes were first of all manifested by a decrease of inputs of labour and animal power, while at the same time such capital inputs as mechanization and chemical fertilization as well as the density of livestock population increa-sed.
In result of those inputs the effects of production, particularly labour pro-ductivity and commercialization increased. Altogether those changes led in the lower parts of Austria to the transformation of traditional, semi-com-mercial agriculture into modern, market oriented and more specialized one, while in the mountains traditional, semi-commercial agriculture has persisted and sometimes even declined.
The investigation of changes in the distribution of the types of agriculture and their combinations made it possible to arrange them in four groups of combinations representing various trends in their spatial development, namely: those that already disappeared, the disappearing ones, the stable, and the new appearing ones.
http://rcin.org.pl

Types of Austrian agriculture 167
I. COMBINATIONS THAT DISAPPEARED.
The following combinations indentified in 1960 but not be found in 1970, were included in this group.
Combination Tmk4, representing traditional, semi-subsistence, mixed agri-culture that dominated in 1960 in the LPG Steiermark G and Burgenland C and G, but in 1970 was substituted in Steiermark G by a combination of Tmp2/Mml2, representing a transition to the fully commercial type of mixed agriculture with livestock breeding prevalent (Mml), and in Burgenland C and G by Type Tmh, described above representing semi-commercial, intensive, mixed agri-culture with crop growing prevalent.
Tml2/Tmp2 — combination of two very close types of traditional, semi-com-mercial mixed agriculture, which in 1960 occurred in Lower Austria F and D and Upper Austria F was replaced by the combination of two fully commercial types of agriculture Mmm2/Mml2, mixed and mixed with livestock breeding prevalent.
Combination Tmm2/Tmh2 of two types: traditional semi-commercial mixed, agriculture and the new decribed type Tmh that occurred in the LPG Burgen-land H and Vienna H, were replaced in Burgenland H by a single type Tmh described above, and in Vienna H by combination Trnhj/Mmcj in which the traditional, semi-commercial, mixed agriculture with crop growing prevalent predominated over market-oriented, mixed agriculture with crop growing prevalent.
Combination TmD,/Tmh,/Mmc,. The combination of three types, in which Type Tmh2, described above, was more frequent than any one of the remaining two types both as the traditional agriculture of Type Tmp and market oriented, mixed agriculture with crop growing prevalent Mme,. That combination was characteristic of the in LPG Lower Austria H and in 1970 was substituted by another combination Tmh1/Mmc1/Mmm2, in which market-oriented, mixed agriculture prevailed over both Tmh and commercial, mixed agriculture with crop growing prevalent.
II. DISAPPEARING COMBINATIONS.
Combinations, the extension of which was considerably reduced between 1960 and 1970, are included in this group.
Combination Tml4, representing the dominating, semi-commercial, small--scale mixed agriculture with livestock breeding prevalent was in 1960 disper-sed over all the territory, occurring in five isolated and distant from each other LPGs: Upper Austria D, Lower Austria C, Carinthia E, Salzburg F and Vorarl-berg F. It persisted until 1970 only in Carinthia, while in Upper Austria it was replaced by the combination Tml1/Tmp1/Mml2, in Lower Austria C by the Tmh4, in Vorarlberg by Tml2/Mml2 and in Salzburg by Mml4.
Combination Tma3/Tmli representing the dominance of the Alpine mountain agriculture over mixed agriculture with livestock breeding prevalent occurred in 1960 in the higher parts of the central mountains — LPGs Salzburg A and Steiermark A. It persisted until 1970 only in Salzburg A, while in Steiermark A it was replaced by the Type Tma4.
III. STABLE COMBINATIONS.
Combinations which did not change much their range between 1960 and 1970, are included in this group.
http://rcin.org.pl
168 R. Szczęsny
Tma4 — representing the most stable type of Austrian agriculture, which both in 1960 and 1970 was practiced on the same areas of Carinthia A, Tirol A and Steiermark B.
Tma2/Tml2, the transitional combination from the alpine type Tma to a more characteristic for lowlands type Tml, both with livestock breeding prevalent, occurred in 1960 and also in 1970 in Carinthia C, Steiermark G, Vorarlberg A, Salzburg B, Upper Austria B and Lower Austria B.
IV. NEW COMBINATIONS.
Types which appeared after 1960 only, are included here. In most of cases they are less traditional but more market-oriented than those that previously occurred in the same territories.
Tmh4, a new type described above, which in 1970 occupied most of Burgen-land (LPG C, G and H) replaced combination Tmk4 and Tmm2/Tmh2, occurring formerly.
Tmh2/Tml2, a transitional combination between these two types. It replaced the former combination Tml4 in LPG Lower Austria C.
Tmh3/Mmc1, a transitional combination between the traditional semi-com-mercial and commercial, mixed agriculture with crop growing prevalent, which replaced former combination Tmh2/Tmm2 in LPG Vienna H.
Tml2/Mml2, a transitional combination from traditional to market-oriented, mixed agriculture with livestock breeding prevalent, which in LPG Vorarlberg F replaced the less advanced combination Tml4.
Combination Tml1/Tmp1/Mml2, a transitional from traditional, mixed agri-culture, with livestock breeding prevalent more and less intensive to market oriented, mixed agriculture with livestock breeding prevalent, which replaced Tml4 in LPG Upper Austria D.
Tmp2/Mml2, transitional combination from a more intensive form of tradi-tional, mixed agriculture with livestock breeding prevalent to market-oriented, mixed agriculture with livestock breeding prevalent which replaced in LPG Steiermark G combination Tmk4 with semi-subsistence agriculture dominant.
Tmh1/MmCi/Mmm2, a complicated combination, in which commercial mixed agriculture, prevaling over both the traditional, mixed agriculture with crop growing prevalent of the new type, described above, and the commercial, mixed agriculture with crop growing prevalent, replaced in LPG Lowar Austria H a less advanced combination Tmp1/Tmh2/Mmc1.
Combination Mm2/Mml2 displays the characteristics of both commercial, mixed agriculture and that of mixed agriculture with livestock breeding pre-valent, replaced in LPG Lower Austria D and F and in Upper Austria F the combination Tml2/Tmc2.
Mml4, with the dominance of commercial mixed agriculture with livestock breeding prevalent, replaced the traditional analogue Tml4, in LPG Salzburg F.
As one can see from the above during the period under investigation some types of agriculture disappeared altogether, the extent of certain types shrank, some other types revealed a stability as they persisted on the same territories without any considerable change, while a number of new and more advanced types appeared. ,
REFERENCES
Biegajło W., 1973, Typologia rolnictwa na przykładzie województwa białostockiego (Sum.: Agricultural typology: a study made on the example of the Białystok voivodship), Prace Geogr., 100.
http://rcin.org.pl

Types of Austrian agriculture 169
Kostrowicki J., 1969, Typologia rolnictwa, założenia, kryteria, metody (Sum.: Agri-cultural typology. Principles, criteria, methods and techniques), Przegl. Geogr., 41, 4, pp. 599-621.
Kostrowicki J., 1974, The typology of world agriculture. Principles, methods and model types, Warsaw.
Kostrowicki J., 1976, World types of agriculture, Warsaw. Kostrowicki J., Szczęsny R., 1971, Rolnictwo (Agriculture), in: Struktura przestrzenna
gospodarki narodowej Polski, Warszawa, pp. 17-123. Kostrowicki J., Szczęsny R., 1975, Przemiany struktury przestrzennej rolnictwa
w Polsce w latach 1960-1970 (Changes in the spatial structure of Polish agriculture, 1960-1970), Biuletyn KPZK PAN, 87, pp. 91-128.
Kostrowicki J., Szczęsny R., 1978, Typy rolnictwa (Types of agriculture), in: Prze-miany struktury przestrzennej rolnictwa Polski w latach 1950-1970, Prace Geogr., 127.
Matusik M., 1973, Próba typologii i regionalizacji rolnictwa na obszarze Dolnego Powiśla (Sum.: An attempt at an agricultural typology and regionalization of Lower Powiśle, Northern Poland), Prace Geogr., 102.
Stola W., 1970, Próba typologii rolnictwa Ponidzia (Sum.: An attempt at an agricultu-ral typology of Ponidzie, Central Poland), Prace Geogr., 81.
Stola W., 1973, Rolnictwo Departamentu Vaucluse. Próba typologii (Sum.: Agriculture in the Vaucluse Department, France. A typological study), Dok. Geogr., 3.
Stola W., 1975, Zmiany w typach rolnictwa belgijskiego w latach 1950-1970 (Sum.: Changes in the types of Belgian agriculture in the years 1950-1970), Przegl. Geogr., 47, 4, pp. 715-733.
Stola W., 1977, Próba zastosowania metod typologicznych do porównania przemian rozwoju rolnictwa Belgii i Polski (Sum.: An attempt to apply typological methods in a comparative study of agricultures in Belgium and Poland), Przegl. Geogr., 49, 4, pp. 757-771.
Szczęsny R., 1975, Przemiany w układzie przestrzennym typów rolnictwa indywidual-nego w Polsce w latach 1960-1970 (Changes in the spatial pattern of individual farming types in Poland in 1960-1970), Warszawa (mimeographed).
Szczęsny R., 1976, Organizacja przestrzenna rolnictwa Polski w 1975 r. Gospodarka indywidualna (Spatial organization of Polish agriculture, 1975. Individual far-ming), Warszawa, (mimeographed).
Tyszkiewicz W., 1975, Types of agriculture in Poland as a sample of the typology of world agriculture, in: Agricultural typology and land utilisation, Verona, pp. 391-408.
Tyszkiewicz W., 1977, Typy rolnictwa Macedonii jako przykład typologii rolnictwa świata (Sum.: Agricultural types in Macedonia as a sample of the typology of world agriculture), Przegl. Geogr., 49, 4, pp. 781-805.
Tyszkiewicz W., 1979, Agricultural typology of the Thracian Basin as a case of the typology of world agriculture, Geogr. Pol., 40, pp. 171-186.
http://rcin.org.pl

http://rcin.org.pl

GEOGRAPHIA POLONICA 40, 197«
A G R I C U L T U R A L T Y P O L O G Y O F T H E T H R A C I A N B A S I N , B U L -G A R I A A S A C A S E O F T H E T Y P O L O G Y O F W O R L D A G R I C U L T U R E
WIESŁAWA TYSZKIEWICZ
Institute of Geography and Spatial Organization, Polish Academy of Sciences, Warsaw, Poland
The paper presents an attempt to apply the concept and method of agri-cultural typology, as described in the final version of the typology of world agriculture,1 to the identification of agriculture types of the Thracian Basin, Central Bulgaria.
Situated between the Stara Planina (Balkan) Mountains on the North as well as the Rhodope and Rila Mts. on the South and the West, closed by the Strandja Plateau on the East, the Thracian Basin with its fertile soils, mild cli-mate and sufficient water resources is the area of most intensive and producti-ve agriculture in Bulgaria.
After the War Bulgarian agriculture, formerly of small scale, private and largely traditional character was greatly transformed by land reform and so-cialization. The process was completed in 1959, in result of which 98 per cent of cultivated land was taken over either by collective (TKZS) or State (DS) farms. At the beginning collective farms were organized mainly based on for-mer villages which in Bulgaria were of considerable size already before the war. After some years most of the collective farms were merged with each other to form larger units. In result in 1970 there were in Bulgaria 662 collecti-ve and 158 State farms of an average size of 3800 ha. Almost 88 per cent of agricultural land of the country was then in socialized farming with remaining 12 per cent being personal lots of the collective members and workers. Only 0.6 per cent of agricultural land was still in the hands of individual farmers.2
The socialization of Bulgarian agriculture and the organization of large scale collective and state farms has enabled the modernization of agricultural practices: a rapid growth of mechanization, chemical fertilization, the develop-ment of irrigation etc. In result agricultural production per head of the country population has doubled between 1948 and 1970.
Starting in 1970 a new form of socialized agriculture had been introduced — namely the agro-industrial complexes (APK) that combined several collective
1 J. Kostrowicki, World types of agriculture, Warsaw 1976, IGU, 9 p, (mimeo-graphed).
2 Statisticheski Godishnik (Statistical Yearbook), 1969 and 1970.
http://rcin.org.pl

172 W. Tyszkiewicz
farms, industrial plants processing agricultural goods, various services etc. The total number of those units in 1971 was 170 with an average size of about 18,000 hectares.
The present paper is based on the statistical da.ta8 for 25 agro-industrial complexes of the Thracian Basin, which had combined former 124 socialized farms, as well as on the observations collected on place during field works carried on between 1966-1973 jointly by the geographical institutes of the Bulgarian and Polish Academies of Sciences.4
The author wishes to express her deep gratitude to professor T. Iordanov and other Bulgarian colleagues for their help in collecting and interpreting, the material collected.
Based on those data, according to the final version of the typology of wor ld agriculture5 24 fol lowing variables have been computed, each expressed in their world classes:
(1) The proportion of agricultural land which is owned, controlled or held in common by a group of people, under traditional customary tenure or right of usage.
(2) The proportion of agricultural land that is operated under the labour or share tenancy or any other form of landed bondage.
(3) The proportion of agricultural land that is owned or held in ownerlike possession.
(4) The rate of agricultural land operated by the consciously planned col -lective or state enterprises.
8 Agrarno-promyshlenite kompleksi prez 1971 godina. Ministerstvo na Informat-siata i Syobshtenyata. Centralno-Upravlenie, Sofia 1972, p. 274 (Agro-industrial com-plexes in 1971, edited by the Ministry of Information, Central Statistical Office). The 26th APK is a large industrialized poultry farm for which no data were available, but unquestionably it can be identified as being of the type Snn — socialized highly industrialized livestock breeding.
4 First common field works in the Thracian Basin were carried on during 8 days in 1965. Professor J. Kostrowicki, Dr. W. Tyszkiewicz and Mr. Mr. W. Gadomski and S. Hauzer from the Polish side and prof. T. Iordanov and Dr. M. Bachvarov from the Bulgarian side participated. Five collective farms situated along the North-South profile across the Thracian Basin were investigated. In 1966 the investigations were continued for 28 days with Dr. W. Biegajlo and Mr. Mr. W. Gadomski, S. Hauzer and R. Kulikowski from the Polish and Dr. V. Velev from the Bulgarian side. Nine col-lective and one state farm were investigated along another North-South profile si-tuated more to the East. Some results were published in Dokumentacja Geograficzna 5, 1969 (see W. Gadomski, R. Kulikowski, Użytkowanie ziemi i specjalizacja rolnictwa we wschodnich Rodopach na przykładzie TKZS Shiroko Polje (Sum.: Land use and agricultural specialization in Eastern Rhodopes as exemplified by the TKZS Shiroko Polje). In 1969 the field works were carried on during 15 days by Dr. W. Biegajlo, Miss B. Dorsz and Mr. R. Kulikowski from the Polish and prof. T. Iordanov and Mr. M. Kiril from the Bulgarian side. Eight collective farms and one state farm were investigated along the profile across the western part of the Basin. In 1970 field works were carried on again during 12 days by Dr. Dr. W. Tyszkiewicz, R. Szczęsny and R. Kulikowski as well as prof. T. Iordanov and Mr. M. Kiril. The investigations covered ten collective farms of the eastern part of the Bàsin. Finally in 1973 during 8 days four collective farms and one state farm were investigated. These farms were situated on the foothills of Sredna Gora in the northern part of the Thracian Basin. Dr. Dr. W. Tyszkiewicz, W. Jankowski, Miss B. Dorsz as well as prof. T. Iordanov and Mr. M. Kiril participated in the investigations. A rich and interesting material has been collected which will serve as a basis for more exten-sive study. In 1973 a preliminary study has been elaborated on "The spatial orga-nization of agriculture" by the Polish side and sent to Bulgaria. The present paper is making use of the results of all those studies as well as of the statistical data for 1971 collected by the author during her last stay in Bulgaria.
5 See note 1.
http://rcin.org.pl

Agricultural typology of Thracian Basin 173
(5) Size of holdings in terms of a number of actively employed people per one agricultural holding.
(6) Size of holdings in terms of total amount of agricultural land per one holding.
(7) Size of holdings in terms of gross agricultural output per one holding. (8) Inputs of labour in terms of a number of people actively employed in
agriculture per 100 hectares of agricultural land. (9) Inputs of animal power in terms of a number of conventional draught
units per 100 hectares of cultivated land. (10) Inputs of mechanical power in terms of a number of tractors including
harvesters and other self-propelling machinery in HP per 100 hectares of cul-tivated land.
(11) Chemical fertilizing in terms of an amount of chemical fertilizers in pure content (NPK) used per 1 hectare of cultivated land.
(12) Irrigation measured by the proportion of irrigated to the total cultivated land.
(13) Intensity of cropland use, in terms of the ratio of the harvested to the total arable land (including fallow).
(14) Intensity of livestock breeding, in terms of a number of conventional (large) animal units per 100 hectares of agricultural land.
(15) Land productivity expressed in gross agricultural output in conventio-nal units per one hectare of agricultural land.
(16) Labour productivity expressed in gross agricultural output in con-ventional units per one person actively employed in agriculture.
(17) Degree of commercialization expressed in the proportion of commercial production to gross agricultural production.
(18) Commercial production of land (level of commercialization) in terms of an amount of commercial agricultural production in conventional units per one hectare of agricultural land.
(19) The proportion of land under perennial and semi-perennial crops to the total agricultural land.
(20) The proportion of permanent grassland to total agricultural land. (21) Primary food production. Proportion of land under food crops to the
total amount of agricultural land. (22) General gross production emphasis (orientation). Proportion of animal
products to the total gross agricultural production. (23) General commercial emphasis (orientation). Proportion of animal pro-
duction to total commercial production of agriculture. (24) The proportion in gross production of industrial crops. (1, 2, 3, 4). — As the total agricultural land is actually managed by agro-
-industrial complexes the variables representing social and ownership charac-teristics have been uniformly expressed for all APK as 1115 (none or negligible role of commons — 1, tenancy — 1 and private ownership — 1, the highest class of socialized farming — 5).
(5, 6, 7). — As in all agro-industrial complexes large amount of agricultural labour (mostly members of collective farms) was employed (actually between 4.6 and 12.2 thousand persons), all of them v/ere larger (between 9.8 to 56.3 thousand hectares) than 1000 hectares and gross agricultural output per one holding in each of them exceeded 100,000 conventional units (actually 293 thousand to 2299 thousand units), in all APK, the variables representing size of holdings have been expressed by the highest classes — 5, 5, 5.
http://rcin.org.pl

174 W . Tyszkiewicz
(8). Labour inputs per unit area are more differentiated (Fig. I).6
In 1971 they varied from 10.5 (2) to 66 (4), in most cases, however, they repre-sented medium world level (3). Higher figures were characteristic for three units only, more specialized in cultivation of labour-absorbing crops (fruits, grapes, tobacco, etc.), such as Plovdiv, Pyrvenets and Novi Krichim.
(9). — The characteristic result of the socialization and technical moderniza-tion of Bulgarian agriculture has been a rapid decrease of a number of draught animals. On the territory of the Thracian Basin the amount of draught animal power measured in conventional (horse) units was mostly low, between 2.8 and 8.7 units (Fig. 2) per 100 hectares of cultivated land.
Fig. 2
6 The dispersion of some more differentiated variables has been presented on graphs, following the example of K. Rikkinen in his paper The application of world agricultural typology to Finland presented to the 7th meeting of the Commission on Agricultural Typology. To be more readable individual units have been presented in circles, in which a number is representing the number of a unit of study accor-ding to the enclosed list of APK.
LIST OF APK UNITS 1. Asenovgrad, 2. Berezovo, 3. Bratia Daskalovi, 4. Harmanli, 5. Haskovo North, 6. Haskovo South, 7. Chirpan, 8. Dimitrovgrad, 9. Gylybovo, 10. Hisar, 11. Liubinets, 12. Maritia, 13. Mlekarevo, 14. Nova Zagora, 15. Novi Krichim, 16. Panaghiurishte, 17. Pazardjik, 18. Peshtera, 19. Plovdiv, 20. Pyrvenets, 21. Pyrvomay, 22. Radnevo, 23. Semptemvri, 24. Stara Zagora, 25. Svilengrad.
http://rcin.org.pl

Agricultural typology of Thracian Basin 175
(10). — On the other hand, the amount of mechanized power was medium and high (between 24.5 and 40 HP per 100 hectares of cultivated land): classes 3 or 4 of their world range (Fig. 3).
(11). — The use of chemical fertilizers was also high (4) and little different-iated (Fig. 4), oscillating between 130 and 190 kg of pure content (NPK) per 1 hectare of cultivated land.
Fig. 4
(12). —In spite that irrigation of cultivated land has a long tradition in the Thracian Basin, it has been greatly expanded only after World War II, along-side with the socialization of agriculture. In 1971, the rate of irrigated land oscillated in various APK between 26.4 to 52.4 per cent of cultivated land (Fig. 5) —class 3.
Fig. 5
http://rcin.org.pl

176 W. Tyszkiewicz
(13). — The intensity of cropland use was high (4) in most APK (80-93 per cent of harvested to cultivable land); it was lower (64.7 to 69.2 per cent) in 4 APK (Septemvri, Novi Krichim, Harmanli, Panaghiurishte) only (Fig. 6).
(14). — Density of livestock (Fig. 7) was low or medium — 22.8 to 57.2 con-ventional units per 100 hectares of agricultural land (class 2 and 3) with highest figures in the western part of the Basin (Pazardjik, Peshtera). The following orienations of livestock breeding could be indentified: 1) sheep-cattle with pigs; 2) cattle-sheep and 3) cattle-pig with sheep. Chicken breeding is also po-pular.
Fig. 7
(15). — Land productivity (Fig. 8) in the Thracian Basin was in 1971 of me-dium level (3) and oscillated between 21.5 and 44.7 conventional units per 1 hectare of agricultural land (class 3). The highest land productivity was cha-racteristic for south-central part of the Basin, more specialized in fruit and in-dustrial crops growing (Pazardjik, Peshtera, Pyrvenets).
http://rcin.org.pl

Agricultural typology of Thracian Basin 177
(16). — Labour productivity was more differentiated. In most APK it oscil-lated between 100 and 200 conventional units per 1 person employed in agri-culture (class 3) with several cases (Svilengrad, Harmanli, Liubinets, Haskovo South, Novi Krichim) quite below 100 (class 2) and one case only (Stara Zagora) above 250 (class 4) (Fig. 9).
(17). — Degree of commercialization of agriculture (Fig. 10) in most of APK of the Thracian Basin was high (60-79 per cent — class 4). The highest degree of commercialization characterized south-central parts of the Basin (Novi Kri-chim, Pyrvenets) with more productive agriculture, oriented mainly toward fruit and industrial crop growing with a more limited role of fodder crops.
(18). — Commercial production (Fig. 11) per unit area was mostly medium (3) varying between 10.6 and 36.6 conventional units per 1 hectare. Only in two APK (Peshtera and Pyrvenets) it reached high world level (4), and in one APK only (Gylybovo) w^j low (class 2).
Fig. 11
12 Geographia Polonica http://rcin.org.pl

178 W . Tyszkiewicz
(19). — The rate of perennial and semi-perennial crops (mostly fruit trees, vineyards and cotton) in the total agricultural land varied between 5.6 percent (1) and 33.4 (3) per cent. The highest rate (over 20 per cent of agricultural land — class 3) was characteristic for south-western parts of the Basin. Grapes, peaches, apricots prevailed there. The lowest rate of perennial and semi-peren-nial crops (less than 10 per cent — class 1) characterized south-eastern part of the Basin (Fig. 12).
(20). — The rate of permanent grasslands (Fig. 13) is very low to low (class 1 or 2),7 varying between 15.2 to 27.6 per cent of the total agricultural land, extending beyond 20 per cent (class 2), mainly in northern submountainous parts of the Basin (Hisar, Berezovo, Chirpan, Stara Zagora, Asenovgrad).
(21). — In result of the high role of both fodder (maize, lucerne) and indu-strial (sunflower, cotton, tobacco, sugar beet etc.) crops the rate of primary food products (wheat, beans, vegetables, fruits) was low (class 2). In one case only (Pyrvenets) it exceeded 40 per cent of the total agricultural land (Fig. 14).
7 That may be not entirely true as the data for mery (rough pastures) are usually hardly available or unreliable. Larger tracts of such grasslands are however more characteristic for outer, submountainous APK only.
http://rcin.org.pl

Agricultural typology of Thracian Basin 179
(22). — As crop production prevails everywhere in the Thracian Basin the percentage rate of animal products in gross production (Fig. 15) was low (2) exceeding that class (3) only in one APK (Panaghiurishte).
(23). — The rate of animal production in commercial production (Fig. 16) was low or medium (2-3) reaching almost 60 per cent in one case only (Pa-naghiurishte), and falling close to 20 per cent in two other (Novi Krichim and Pyrvenets).
(24). — In spite that industrial crops play quite an important role in agri-culture of the Thracian Basin, in such large units as APK it never exceeded 20 per cent of a gross output (Fig. 17).
Sets of variables for each APK presented in codes, in which three variables representing production characteristics (15, 16, 17) were doubled, have then been compared with each other as well as with model codes for the types of world agriculture as proposed by J. Kostrowicki8.
8 See footnote 1.
12* http://rcin.org.pl

180 W. Tyszkiewicz
The comparisons have revealed very great uniformity of agriculture of the Thracian Basin, in result of which all APK could be classified as being of the type Smc — socialized mixed agriculture with crops growing prevalent. This type is characterized by the following model code
1 1 1 5 5 4 - 2 3 3 2 4 2 223221 3333443
from which no APK code had differed by more than 10 deviations. At the same time the codes for 6 APK (Haskovo North, Chirpan, Dimitrovgrad, Panaghiu-rishte, Pyrvomay, Stara Zagora) have differed by less than 11 deviations from the type Smm — socialized mixed agriculture with the following model code:
*.. i ere 2144143 1 U 5 0 5 3 3 3 3 4 4 3 1 3 2 3 4 1
Those APK can be thus treated as being (Fig. 18) of the transitional charac-ter between two types of agriculture presented above 9.
The type Smc — socialized mixed agriculture, with crops growing prevalent that dominated in the Thracian Basin is a fully socialized (1115), large scale (5, 5, 5) agriculture, with medium inputs of labour (3), low inputs of animal power (2), medium to high mechanization (3-4), high chemical fertilization (4), medium irrigation (3), full cropland use (4). Density of livestock was low to medium (2-3), land and labour productivity medium (3), high degree of com-mercialization (4) and medium level of commercialization (3). The rate of pe-rennial crops was very low to low (2~3), of permanent grassland — very low to low (2) and that of primary food products — low (2). The role of animal pro-ducts in gross production was low (2), in commercial production low to me-dium (2-3), the rate of industrial crops in gross production very low (1).
From the model code for the type Smc it differed mainly by its higher che-mical fertilization, higher irrigation, lower rate of permanent grasslands and lower rate of primary food products.
The APK transitional from the type Smc to Smm were usually characteri-zed by higher inputs of labour but lower inputs of animal power, much higher irrigation, lower density of livestock, higher rate of perennial crops but lower of permanent grasslands and in particular by lower importance of animal pro-duction than in the Smm type.
As agriculture in the Thracian Basin has been found very little differen-tiated, representing in fact one world type of the 3rd order only, an attempt has been made to identify the subtypes, i.e., the types of lower order.
9 The model code for the type Smc and the codes for individual APK have dif-fered by: 4 deviations — Berezovo, Bratia Daskalovi, 5 deviations — Radnevo, 6 deviations — Asenovgrad, Hisar, Maritsa, Nova Zagora, 7 deviations — Haskovo South, Pyrvomay, 8 deviations — Panaghiurishte, Plovdiv, Septemvri, 9 deviations — Harmanli, Chirpan, Haskovo North, Dimitrovgrad, Gylybovo, Mlekarevo, Pazardjik, Peshtera, Novi Kri-chim, Stara Zagora, Svilengrad, Liubinets, Pyrvenets. The differences from the model code for the type Smm were lower than 10 in the following APK: 8 deviations — Haskovo North, 9 deviations — Panaghiurishte, 10 deviations — Pyrvo-may, Dimitrovgrad, Stara Zagora. If one compares the deviations from both model types (Haskovo North 9/8, Panaghiurishte 8/9, Pyrvomay 7/10, Dimitrovgrad 9/10, Sta-ra Zagora 9/10) only in one APK (Haskovo North) the deviation from the type Smc was slightly greater than from Smm. The other were more or less similar to the type Smc.
http://rcin.org.pl

Fig. 18. Types of agriculture in the Thracian Basin, Bulgaria
http://rcin.org.pl

182 W . Tyszkiewicz
Two techniques have been used. The first one was based on a graph (Fig. 19 and 20) proposed by J. Szyrmer 1D in which closer similarities (= lower devia-tions) have been marked by connecting lines. It has been arbitrarily assumed that APK that differed from each other by more than 5 per cent of the total variance, i.e., by 6 deviations or more could be treated as being of the diffe-rent fourth order type. As the graph shows, no APK was in fact more distant from the closest neighbour by more than 5 deviations, while there were few cases only of more than 11 differences between the most distant ones, such as for example between No. 20 (Pyrvenets) and several other. In fact only the
Fig. 19. Number of deviations between model types
10 J. Szyrmer, Propozycja zastosowania nowej metody taksonomicznej do typo-logii rolnictwa (Sum.: The proposal of the new taxonomic method to be applied in agricultural typology), Przegląd Geograficzny 45, 1973, 4, pp. 739-756.
http://rcin.org.pl

Fig. 20. Subtypes of agriculture in the Thracian Basin, Bulgaria identified by the , graphic method
http://rcin.org.pl

Fig. 21. Subtypes of agriculture in the Thracian Basin, Bulgaria, identified by the deviation method
http://rcin.org.pl

Agricultural typology of Thracian Basin 185
same case (Pyrvenets) differed from its closest neighbours by more than 4 de-viations.
On the other hand, as one can gather from the graph, there is a central core of very similar cases and then several cases more or less distant from that cen-tral code, some of them approaching closer to two model codes presented above. None of them was, however, closer to any of the model codes than to their clo-sest neighbours.
Based on this graph the following subdivision has been made:
The result is rather complicated, difficult for interpreting and cannot be con-sidered successful.
Another attempt was a consequent extension of the deviation method. By means of a successive products (multipliers) technique used already elsewhe-re 11 to identify the proximity to various model codes (Fig. 21), the deviations from the model types have been investigated by extending the acceptable num-ber of products by 50 per cent, i.e. from 10 to 15. Using four successive pro-ducts the following groupings have been identified (with symbols for model codes substituted by big characters: A — Sec, B — Sem, C — Smc, D — Smm, E — See, F — Shv, G — Shf.
As one could see from the above the central core of the type Smc (c) is repre-sented by 7 APK with CCCD. From that core more or less numerous deviations can be observed toward either D (Smm) such as CCDD (24), toward DF (Smm and Shv) (17, 18, 19, 8), DEF (20) (Smm, See and Shv) and BD (Sem and Smm) as well as to A and D (Sec and Smm). The case No. 4 (Harmanli) represents a mixture of four types — ABCD.
11 W. Tyszkiewicz, Typy rolnictwa Macedonii jako przykład typologii rolnictwa światowego (Sum.: Types of agriculture in Macedonia as a sample of the typology of world agriculture), Przegląd Geograficzny 49, 1S77, 4, pp. 781-805.
http://rcin.org.pl

186 W. Tyszkiewicz
Interpreting that method all cases with at least two C could be treated as belonging to the same type I of the 4th order which represent various devia-tions from the central core of the type (Smc) toward other types, either less developed — incipient ones (A and B), more mixed (D) or more specialized in cereal growing (E) or in horticulture (F). The types II and III represent stron-ger deviations — the type II mainly toward the incipient agriculture of the types A and B (case 4) — Harmanli and type III toward more crop oriented cereal growing or horticultural types E and F (case 20) — Pyrvenets.
In any case both techniques point once more to the great uniformity of the Thracian Basin as far as agriculture is concerned, but the second one seems to bring more objective results easier to be interpreted.
http://rcin.org.pl

GEOGRAPHIA POLONICA 40, 1979
E V A L U A T I O N O F T A X O N O M I C M E T H O D S F R O M T H E P O I N T O F V I E W O F C O M P A R A B I L I T Y O F R E S U L T S I N S P A C E A N D T I M E
— I N O P T I M I Z A T I O N A S P E C T —
KRYSTYNA BIELECKA, MIROSŁAW PAPRZYCKI
Committee for Space Economy and Regional Planning, Polish Academy of Sciences
From the point of view of numerical taxonomy, the subject of classification is a given set of objects described by a body of diagnostic characteristics, while the aim of classification is division of that set into groups endowed with a minimum within-group and a maximum between-group variance.
Numerical taxonomy thus defined may serve as a tool in the typology of agriculture, conceived as the division of a set of multi-characteristic spatial units into groups of similar units.
By the static understanding of typology, this definition of numerical taxo-nomy is quite sufficient, but it needs to be extended by elements enabling the translation into mathematical language of the comparability condition for the results of grouping a set. The problem of method in typology will then require the introduction of a frame of reference.
Numerical taxonomy involves the following operations: 1) definition of the basic descriptive unit, 2) choice of a body of diagnostic characteristics, 3) topologization of the space of diagnostic characteristics, 4) choice of numerical taxonomy method, 5) actual classification.
From the praxeological point of view, for each of the named operations it is necessary to define beforehand the aim which a concrete classification is to serve. For it has to be remembered that the aim of taxonomy determines the choice of the metric topologizing the space of diagnostic characteristics and also the choice of the actual numerical taxonomy method to be used. Simulta-neously the mathematical apparatus applied renders the choice of the metric
Fig. 1
http://rcin.org.pl

183 K. Bielecka, M. Paprzycki
and of the numerical taxonomy method dependent on the set of objects (units) to be described and on the adopted body of diagnostic characteristics. The interrelation between the aim of typology, the research subject and elements of numerical taxonomy method is presented in the scheme (Fig. 1.).
The choice of the basic descriptive unit is related to the spatial scale of research. The research scope determines the required degree of accuracy of description, then consequently it determines the maximum size of the spatial unit. The size of spatial units must be such as to enable their differentiation with respect to the adopted body of diagnostic characteristics. This follows from the causations taking place between the measuring accuracy of diagnostic characteristics and the degree of homogeneity of statistical aggregates, such as are spatial units. Consequently, while for multiregional investigations the description may prove sufficiently accurate when the values of diagnostic characteristics are expressed in ranks, e.g., in class numbers, for investigations on regional scale more appropriate and often necessary is the use of measure-ment values in natural and monetary units.
Consequent upon the aim of investigations is the required information scope, which should be filled with suitably chosen diagnostic characteristics. In practice, the diagnostic characteristics are being chosen in an arbitrary manner on the basis of a knowledge of the morphology of the phenomenon (object) under investigation. Theory enables in this respect only the verification of the proposed set of characteristics from the point of view of its statistical properties, but it offers no method of selection of the characteristics.
The next problem to be solved is the choice of the measure of similarity of units in the space of diagnostic characteristics. The choice of the similarity measure is a problem integrally bound with the adopted body of characteris-tics describing the objects under analysis and constitutes an element suitable for posing a problem for classification. Such a measure, on purely formal grounds which condition the applicability of numerical taxonomy, must conform to the following three axioms:
Q(X, y) = 0 o x = y
(!) 6(x
>y) = 6(y>x
)
e(x
> y) + Q{y,z) > q(x
,z) where q is the real function mapping the space of diagnostic characteristics in the positive semi-axis of real numbers. Furthermore, it should correlate with the higher aims which typology is designated to serve.
When an equal ranking of the diagnostic characteristics is assumed, Euclid's metric (euclidean distance) in the space of diagnostic characteristics should be taken for the measure of similarity, or alternatively the sum of moduli of the differences on coordinates (highly approximating to Euclid's metric and at the same time easier to calculate).
When no assumptions are adopted with respect to diagnostic characteristics and we are concerned only with the information field filled by them, it is necessary to introduce Mahalanobis' metric, provided that the diagnostic cha-racteristics have a distribution approximating to the normal distribution. Mostly Mahalanobis' metric is introduced by way of constructing a linear factor model, factor analysis and calculation of factor results from the initial data.
When we have a specified conception of the structure of the space of diag-nostic characteristics an adequate metric should be found, i.e., such a function
http://rcin.org.pl

Evaluation of taxonomic methods 189
that subordinates small values to pairs of units close to each other and relati-vely high values, to pairs of units far apart. That function must in addition obey the afore-named axioms of measure (1).
The introduction of a measure is by no means a matter without consequence. From the formal point of view, any real function as long as it conforms to the axioms of measure is equally good for numerical taxonomy. But each of them gives entirely different results, which is of basic importance with regard to the substance of the problem under investigation. This is a difficult question in sofar as there are no objective measures of similarity, nor any mathematical recommendations as to the techniques of selecting them. The only informal condition which the similarity measure must satisfy, is that it should make sense and be interpretable in relation to the subject under investigation.
The next problem to be solved is the choice of a suitable numerical taxono-my method for the problem to be studied. The basic issues to be resolved here are:
1) to lay down the criterion of merit for the division of a set of units, such that would ensure internal homogeneity of groups within the meaning of the adopted similarity measure,
2) to construct an algorithm (prescribed procedure) complying in the best possible way with the criterion of division for the adopted similarity measure,
3) to estimate, both formally and in substance, the division of a set arri-ved at.
It is by no means an easy matter to resolve all these issues, since we have as yet no satisfactory mathematical theory of classification. Under the circums-tances, any numerical taxonomy method yields a division of the given set into groups but at the same time there is no guarantee that a particular division will be satisfactory with regard to the requirements set by the substance of the problem under examination. This is confirmed by the results of the at-tempts by ourselves and other research workers at applying numerical taxo-nomy methods in the typology of agriculture and in other fields; they have shown that the effectiveness of the individual numerical taxonomy methods is not universal. For this reason, the choice of a suitable numerical taxonomy method cannot possibly be arbitrary but must be the outcome of incessant confrontation of the division obtained with an assessment of how far they are serviceable with respect to the substance of the problem under investigation. In this way, by successive, ever close epproximations it should be possible to arrive at a satisfactory method for some fairly narrow, internally homogeneous group of research problems.
As far as typology of agriculture is concerned, the research scope is given by a body of diagnostic characteristics, whereas the aim of typology is defined as a description taking account of the comparability condition for the results of grouping in space and time. The aim thus posed will be realized by any method with an univocally defined algorithm, provided that the following conditions be fulfilled:
1) the possibility of values of diagnostic characteristics being obtained for all spatial units subject to analysis in arbitrary time cross-sections of interest,
2) the body of diagnostic characteristics should be so chosen as to obtain an information scope and information structure independent of space and time,
3) the method used must ensure comparability of results, i.e., a common frame of reference must be obtained, in relation to which the observational material is estimated.
A basic influence on the typology derived has the choice of the body of
http://rcin.org.pl

183 K. Bielecka, M. Paprzycki
diagnostic characteristics, which from the point of view of the method used represent the research subject. This means that making various modifications of the body of diagnostic characteristics, it is possible to obtain divisions ap-propriate to various aspects of the subject under study, in our case — agri-culture.
Making use of the method of formalization of the description of agriculture, some aspects of agricultural typology, important for the national economy, can be taken up, in other words, attempts can be made to solve problems rela-ting to selected partial objectives of the strategy of economic development. One of such objectives is optimization of agricultural development. The propo-sed solution of this problem is as follows.
If we classify diagnostic characteristics into dependent and independent characteristics, e.g., into factors of production and results of production, it will be possible to construct such a regression model that would give a measure of the influence of independent on dependent variables.
The introduction of such a measure as a similarity measure of units in numerical taxonomy should make it possible to obtain a division of a set of units into groups of units characterized by similar modes of utilisation of the production factors. This would mean that intergroup differences are in the nature of structural differences, i.e., qualitative differences, whereas the exi-sting intragroup differences would be quantitative by this approach. It would be possible to seek optimum solutions for the farming types thus constructed, using, for example, linear programming methods.
Material of this kind, that is, types of farming and the optimum solutions subordinated to them might prove a good basis for decision-making in agricul-tural policies.
http://rcin.org.pl

GEOGRAPHIA POLONICA 40, 1979
P R O P O S A L O F N E W T A X O N O M I C M E T H O D S F O R A G R I C U L T U R A L T Y P O L O G Y
KRYSTYNA BIELECKA,* MIROSŁAW PAPRZYCKI,** ZENON PIASECKI**
Committee for Space Economy and Regional Planning Polish Academy of Sciences
From the mathematical point of view typology of agriculture is understood as a division of the set of multi-characteristic objects into classes of similar objects.
Objects in the typology of agriculture are spatial units — administrative or economic ones — described by a body of diagnostic characteristics (features, properties, attributes).
A particular requirement which should be fulfilled by the quantitative method of the typology of agriculture is the comparability of results in space as well as time. Such a task requires the solving of two basic questions:
1) choice of a taxonomic method which gives the best division into groups for the given observational material,
2) construction of a method assuring the comparability of results of the grouping of sets in space and time.
The choice of a taxonomic method is not easy. This is due to the specifics of the taxonomic methods that their effectiveness may be limited. This means that there is no certainty that the taxonomic method effective in some fields will also be effective in a new one. So far the effectiveness of this method is convincing only on the basis of results obtained by its application to a set of objects which interests us. That is why in our research for the most effective taxonomic method to be utilized for the needs of the typology of agriculture we have first tested 11 'popular' methods on empirical material;1 furthermore due to the basically unsatisfactory results of the grouping of sets achieved by these methods we have undertaken work on the construction of new methods which would give better grouping results. Effects of research in this field are three methods which we shall consecutively discuss.
* economist and geographer ** mathematicians 1 The method of grouping in the system of two most significant common factors;
The method of grouping by the Q technic of the factor analysis; The Berry method — grouping based on the initial characteristics; The Berry method — grouping based on the Ho telling components: The single linkage method; The complete linkage method; The paired group method; The Hubert divisive method A; The Hubert divisive method B; The Wroclaw Taxonomy method; The FARELL method.
http://rcin.org.pl

192 K. Bielecka, M. Paprzycki, Z. Piasecki
1. THE ORLINE METHOD 1.1. CONCEPT OF THE ORLINE METHOD
The ORLINE method (linear order) elaborated by Z. Piasecki is based on the idea of the Czekanowski diagraphical method 2 the elements of which are as follows: — table of mutual distances between the objects of the analysed set, — diagram in the form of a two-dimensional table, — the principle of the ordering of a set of objects in such a way that objects referring to the pairs of characteristics of the small mutual taxonomic distan-ce are clustered around the main diagonal of the diagram.
The ORLINE method retains the above mentioned elements of the Czekano-wski method, differing only in the way of analysing, the table of distances, leading to the procurement of the ordered table-diagram. In this respect the ORLINE method differs as well from several other taxonomic methods derived from the idea of Czekanowski's diagraphical method.3
1.2. DESCRIPTION OF THE ORLINE METHOD
The ORLINE method is based on the criterium: N N
(1) F = y y (d'a-dij)2 = m i n i m u m ZJ ¿-j i= 1 j=i+l
where: N is the number of objects in the set dtj is the distance between the i-th and j-th objects calculated on the
basis of all characteristics describing these objects, that is, the di-stance in a n-dimensional space, where n is the number of descrip-tive characteristics,
d'ij is the distance between these same objects i and j projected in a one--dimensional space, i.e. on a straight line calculated from the for-mula:
( 2 ) d'l} = \Xi-Xj\. i,j= 1 , 2 , ...,N
where: XK (for k = 1, 2,..., N) is a co-ordinate of the fc-th object in a one-dimen-sional space, i.e., on a straight line.
Considering formula (2) and introducing a certain co-efficient, criterion (1) takes the form of the function (3)
N-1 N
( 3 ) F = £ V (M-XJ-J^ = m i n i m u m
2 Czekanowski J., 1909, Zur Differentialdiagnose der Neandertalgruppe, Korres-pondenz-Blatt der Deutschen Gesellschaft für Anthropologie, Ethnographie und Ur-geschichte, XL, pp. 44-47; Czekanowski J., 1913, Zarys metod statystycznych w zastoso-waniu do antropologii, Prace Towarzystwa Naukowego Warszawskiego, III Wydział Nauk Matematycznych i Przyrodniczych, 5, pp. 167-172.
3 The methodical system of the diagraphical method of Czekanowski has been developed by Polish anthropologists and mathematicians. Both the method itself and its modifications have been applied in anthropological studies and in those of nu-merous other disciplines as well, cf.: Wanke A., 1964, Sixty years of research work of Jan Czekanowski (in:) Księga Pamiątkowa dla uczczenia 60 lat pracy naukowej Jana Czekanowskiego, Materiały i prace antropologiczne, 70, pp. 19-27. Note. The bibliography in the quoted Księga Pamiątkowa... does not comprise all the research works in which the Czekanowski method or its modifications were applied, in fact it has been much more largely applied.
http://rcin.org.pl
New taxonomic methods 193
the value of which is the mean square of the deviation of distances in a one--dimensional space from real distances in a n-dimensional space.
It is easy to observe that the criterion given by formula (3) is the function of N variables Xj , X2,..., XN. For a given order of objects represented at present by the variables Xx, X2,..., XN this function will reach its minimum, due to the design of these variables, on condition that the following design of equa-tions will be fulfilled:
the components of which are co-ordinates of the optimal distribution of objects on a straight line and in a given order.
The solution of design of equations (4) is the first iteration step leading to the constructing the table-diagram.
The next iteration step consists in change of order of the objects and in repetition of the procedure of the solution of design of equations (4) and deter-mining the vector (5).
In each step, after determining the vector (5), the value of function (3) is calculated for order accepted in a given step, and to proceed further an order is chosen which corresponds with the lesser value of the test function. The order for which the calculated value of function (3) is least is considered to be optimal.
Since, in general, it is impossible to examine all possible permutations in the mentioned way, in the ORLINE method it has assumed that orders in suc-cessive iteration steps will differ from each other by the interchange of only two neighbouring objects. Therefore in accordance to criterion (1), the best order is considered to be that for which the value of function (3) is smaller than the value of this same function calculated for any order that differs from the accepted one by the interchange of only two neighbouring objects. There is no proof that for a thus determined order, function (3) assumes the value of an integral minimum. Nevertheless, all the results obtained by this method allow us to assume that no better orders can be determined.
Therefore the optimal — due to criterion (3) — linear order of objects deter-mined by the ORLINE method renders, besides a table-diagram, also the distri-bution of points on a straight line. This distribution is given by the values of the components of vector (5) for final order.
Both the table-diagram and distribution on a straight line permit the singling out of groups of alike objects if only such objects exist in the analy-zed set. The singling out of groups is based on the method given by Czekanow-ski, i.e. on the determination of clusters of 'small' distances near the main diagonal while singling out groups by the ORLINE method has an advantage over the one proposed by Czekanowski in that the ORLINE method in selec-ting the best order makes use of a complete, real table of distances. Thus, here the determining of the level of 'small' distances is unlimited, and this level can be arbitrarily fixed and gradually raised or lowered. ,
The final division of a set is achieved in the way of applying an unformal analysis of the obtained results, for example: analysis of the distribution of points on a straight line, or analysis of the table-diagram and the ordered table of distances.
( 4 ) = k — 1,2,..., N dXk
( 5 ) The solution of this design is the vector (5)
X = [XlfX2, Xs\
13 Geographia Polonlca http://rcin.org.pl

194 K. Bielecka, M. Paprzycki, Z. Piasecki
It should be emphasized as well that the table of distances initial to the ORLINE method can be freely calculated, provided that the computed values fulfill the conditions placed on the distances, namely:
1. di} 0 2. di} — dH , J 3. da = O o i = j
4. di}+dik>dik
2. THE GRAVITY METHOD
2.1. CONCEPT OF THE METHOD
The GRAVITY method elaborated by M. Paprzycki is an adaptation of the physical phenomenon of gravitation on the ground of taxonomy with the ac-ceptance of the statistical evaluation of the stability of changes within the inner structure of groups during the grouping process of a set.
2.2. DESCRIPTION OF THE METHOD
In the GRAVITY method two basic elements: 1) the way in which distances are calculated, and 2) the criterion for coupling multi-characteristic objects have been resolved
in a following manner: 1) The distance between objects is calculated in the Mahalanobis metric. 2) Two criteria have been introduced for adding object to group:
1) the criterion for the increase of variance, and 2) the criterion for the displacement of the group's center of gravity. The algorithm of the method presents itself as follows:
Step 1. Calculate the distance matrix between the set's objects in the Maha-lanopis metric.
(1) D = [«/„]
(2) d{ j = l/ixt-xifc-^xt-xi)
where: c - 1 is the inverse of a matrix to the variance-covariance matrix be-tween factors
x i — [xu> xi2> •••> xim\ is 'the vector of component scores for the i-th object TO is the number of factors
Step 2. Find for each object of a set a minimal distance from the remaining objects of this set.
•̂ min = [^min,]
dmim = min (dij) \ieJ\ I
where: J = (1, 2,..., m) . TO is the number of factors
Step 3. For successive objects of a set, beginning from the first we test one of the conditions a, b, c, d; depending if the object under the study and
http://rcin.org.pl

New taxonomic methods 195
the one nearest to it in the sense of a Dmin vector belong to some group or not, and then realize an appropriate step towards grouping.
Condition a. The object under study and the object nearest to it according to the Mahalanobis metric (2) do not belong to any group.
dav is the average distance k is the number of objects
then join z-th object with its nearest neighbour thus forming a new group. Otherwise create two one-element groups. Condition b. One of the objects: the one under study and its neighbour ac-
cording to Mahalanobis metric (2) creates an one-element group while another one does ont belong to any group, or both form one-element groups.
Apply an analogous procedure as in the case of condition a. Condition c. At most only one of the objects: the one under study and its
nearest neighbour according to the Mahalanobis metric (2) belong to a multi-element group.
Then check if the arithmetic average of points belonging to the group will undergo essential change after coupling with a new object, or if the interobject, intragroup variance (i.e. calculated seperately for each factor between objects) apart from any factor will grow substantially after joining a new object. If so, form a new one-element group. Otherwise, attach the object to the group.
Compare the variance according to the formula:
(4) S ± - F a U J - D si
where: sf is the variance in the group following the i-th factor before the joining to the group a new object
s-2 is the variance in the group following the i-th factor after the joining to the group of a new object
j is the numerability in the group before the joining of a new object Fa (j, j — 1) is the critical value of test F for vx = j, v2 = j — 1 and si-
gnificance level « Compare the arithmetic averages according to the formula:
http://rcin.org.pl
196 K. Bielecka, M. Paprzycki, Z. Piasecki
where: xt is the vector of component scores for i-th object belonging to the group
x is the vector of component scores for an object which is going to be joined to the group
x is the center of gravity of the group x ' is the center of gravity of the group after the joining of a new
object ||x-x'||M is the distance between the new and old center of gravity in
the Mahalanobis metric £a(2j — 1) is the critical value of the t-Student test for the 2j — 1 degrees
of freedom and level of significance «. If conditions (4) and (5) are not fulfilled the difference is insignificant and the object is added to the group. Attention: if a variance, due to a coordinate, equals zero, then it is assumed that the difference due to this coordinate is insignificant. Condition d. Both objects: the one under study and its nearest neighbour ac-
cording to the Mahalanobis metric (2) belong to some one-ele-ment group.
If these groups are different check if the difference between them due to the variance as well as the center of gravity is statistically insignificant. If not, then join these groups into a new one. After the realization for all the objects in the set of step 3 pass to the next activity. Step 4. Consecutively compare the groups between themselves in succession of
the growing distances between them. It should be repeated this step as long as the following survey of all the pairs of groups does not give a coupling. In this step points b, c, d are applied from the previous step, the only difference being that in point b the average distance between objects dav is replaced by the average distance in the Mahala-nobis metric (2) between the centers of gravity of groups dgav modified each time after the realization of a complete survey of all pairs. Also the intergroup distance matrix is modified after every complete survey of all pairs.
3. THE FARELL-MOD METHOD
3.1. CONCEPT OF THE METHOD
The concept of the FARELL method which has been elaborated at the Novosibirsk University is an attempt at simulation of methods which would have been used by man if he had had divided visually the set of points in a two-dimensional space into internally homogeneous groups.
The modification of the FARELL method by M. Paprzycki is based on the introduction to this method of the condition that to every xi object and to all groups without Xi object following condition should be fulfilled: g(xt center of gravity of group Ak) ) g(xt center of gravity of group B) where: q is the euclidean distance
B is the group to which belongs object xt Ak is any kind of group different from group B
http://rcin.org.pl

New taxonomic methods 197
3.2. DESCRIPTION OF THE METHOD
The algorithm of the FARELL-mod method is as follows: Step 1. Calculate the center of gravity of the set of objects (as the average
of the sum of objects on coordinates). Step 2. Calculate the measure of dispersion of the set of objects (as the
average of the sum of standard deviation on coordinates). Step 3. Calculate the radius of the set of objects (as the maximal distance of
objects from the center of gravity). Step 4. Give the iteration radius — the maximal radius of the group under-
stood in accordance with step 3. (for the given radius the division is undertaken according to the method described in the following steps).
Step 5. Choose for the main iteration element the first free element of the set. If such an element is not present that denotes the end of the iteration and pass on to step 12.
Step 6. Determine the sub-set of objects situated at a distance from the main element which is not larger than the radius of iteration and not be-longing to any group.
Step 7. Calculate the center of gravity of the sub-set of objects determined in step 6.
Step 8. Compare if the center of gravity determined in step 7 coincides with the main element of iteration; if not then accept the center of gravity as the main element of iteration and return to step 6.
Step 9. A new group has been determined which is the sub-set of objects from step 6.
Step 10. Determine a common part, the crosscut and surrounding of the group as well as its measure of dispersion.
Step 11. Go to step 5. Step 12. Check if there exists the group Ai for which a set of points 'the com-
mon part' is not an empty set. If it does not exist pass over to step 16. Step 13. Allocate points belonging to the 'common parts' to that group to which
center they are the closest. Step 14. Determine for every group:
— a new common part, a new crosscut, a new surrounding, and a new measure of dispersion.
Step 15. Go over to step 12. Step 16. Check if the following iteration should be realized with a new radius
of iteration, if so return to step 4. Step 17. The END Def. 1: Object xeB belongs to the common part of group B with another group
if there exists such an i that: Q (x, center of gravity of group < Q (X, center of gravity of group B).
Def. 2: Object aeB belongs to the crosscut of group B with another group if there exists such an i that: q (x, center of gravity of group (x, center of gravity of group
Def. 3: Object xeB belongs to the surrounding of group B if: r < g ( x , center of gravity of group B ) < a ( r + ^ )
where: B is the set of objects belonging to the studied group r is the radius of iteration a, (} are a priori established coefficients (larger or equal to zero).
http://rcin.org.pl

198 K. Bielecka, M. Paprzycki, Z. Piasecki
As it is apparent on the basis of obtained results of application of the pro-posed new taxonomic methods— each of them is more effective than the anali-zed 'popular' methods. But, so far, we do not have univocal view point which of these three methods is the most efficient (efficiency in the praxlological sense). For explanation of this question it is necessary to undertake work on elaborating a method of formal evaluation of the quality of taxonomic methods.
It is necessary to underline that none of these three methods, similarly to the 'popular' ones fulfills the comparability condition of the results of grouping in space and time. This is due to the character of these methods, which causes that the results of division are dependent from the analized set of objects; removal from the. set of a few objects can bring about an essential change in its division, thus, the division is unchangeble due to the accepted set of objects. Also- the transformations of characteristics describing an object, such as: nor-malization, passing to common factors, or ranging, applied independently for various sets of objects described by the same set of characteristics, do not as-sure the comparability of the results of groupings of these sets — by a given method.
We have taken these ascertainments under consideration during the cons-truction of the proposed IDWER method.
4. THE IDWER METHOD
4.1. CONCEPT OF THE METHOD
In the elaborated by Z. Piasecki IDWER (identification-verification) method there are two new basic elements:
1) transformation of characteristics describing an object leading to the acquisition of angular values,
2) classification of objects based on the principle of identification of objects of a given set with the frame of reference.
Angular values are independent from the level of studied characteristics and exemplify the structural interdependence between them. Such a peculiari-ty of angular values allows for the comparison of analysis results carried out on observational material concerning different objects in time and space for short time periods (defined by political economy), described by the same set of characteristics.
The frame of reference named in the IDWER method the 'basic set' is in its theoretical assumption a set of representatives of different types of agri-culture which can be distinguished.
The classification of objects with the appliance of the basic set as a model can be carried out on sets with a very numerous, theoretically unlimited, num-ber of objects, denoting on unclosed sets.
In the concept of the IDWER method the comparability in time is equipon-derant to the comparability in space, because every object, described in two separate time sections, can be formally treated as two objects differentiated spatially.
4.2. DESCRIPTION OF THE METHOD
4.2.1. Transformation of characteristics describing an object The transformation of the initial values of characteristics into angle values
begins with the construction of a polygon for each object. The vertices of a po-lygon are defined by the initial values of the consecutive characteristics des-
http://rcin.org.pl

New taxonomic methods 199
cribing the object, while the angles of the polygon are values of the new 'angu-lar' characteristics.
We commence the procedure of calculating these values by calculating the central angle 9? (Fig. 1) by the formula:
(1) (p — Injn, ..:-„•
where: n is the number of those diagnostic characteristics taken into con-sideration.
The diagram shows the fragment of the polygon where the length of the segment OAt is equal to the value xx of the i-th (i = 1, 2,..,, n) diagnostic cha-racteristic. The value of the i-th angular Characteristic a¡ aré calculated as the sum: •
(2) a, = fl{jl.+ á u i , 2 , / = 1 , 2 , . . . , « , 'where: • . •
(3) a0.2 = a„,2V * Hence, to determine the values of angular characteristics for a given object,
the values of the components in (2) should first be calculated for i = 1, 2, ...,n. Applying the cosin theorem for each triangle atOAt+1 the segment d, can
be obtained as follows:
(4) df = xf + xf+! - 2 x¡xi+! cos (p, i = 1 ,2 , . . . , « , Where:, ,
(5) -Xn + i =
Next by using the same theorem, the function of the angle au can be cal-culated thus:
(6) c o s « , = ^ j - A -
By inserting the values (4) into the above and after some transformations, we obtain:
¡x¡-xi+lcos <p\ <7) cosan = |
and subsequently Xi~ Xi+iCOS(p
(8) a,i = arc cos di
Using the property of the sum of the angles in the triangle, the value of the second angle a12 is calculated as follows:
(9) a i 2 = j r - 9 ? - a u .
http://rcin.org.pl

200 K. Bielecka, M. Paprzycki, Z. Piasecki
The angles corresponding to the following pairs of variables are calculated in analogous manner.
4.2.2. Measure of homology The angular values belong to the interval 0,2. Hence, the measure of homo-
logy between objects has been assumed to be the common Euclidean distance calculated by the formula:
(10) A J = 1 / ¿£ ( a f - o c ) ) 2 , i J = 1 , 2 , N
where: N is the number of objects taken into consideration; Dtj is the distance between the z-th and j-th objects a* is the value of the fc-th (k = 1,2, ... n) angular characteristic for the i-th object.
4 . 2 . 3 . M e t h o d of c l a s s i f i c a t i o n The algorithm of method is as follows:
Step 1. Order the accepted basic set according to the ORLINE method. Step 2. Calculate the angular values of a new introduced object described by
initial values of characteristics. Step 3. Calculate the distance according to the formula (10) of the newly in-
troduced object from objects encompassed in the basic set. Step 4. Place according to the ORLINE method of newly introduced objects in-
to the basic set. Step 5. Identify of a newly introduced object, applying a criterion which
makes use of the values on the straight line of the images co-ordinates of the analyzed objects. This criterion implies that if the set under analysis has no clusters (i.e. is not divisible into classes) the images of its continuent objects will distribute uniformly on the straight line. Thus, for any ordered N-element set determine the value of the 'range' between images as follows:
(11) d = 1 ^ - ^ 1 / ( ^ - 1 )
where: xx is the co-ordinate of the image of the first object in the ordered set xN is the co-ordinate of the image of the last object in that order. Now, divide the set into the classes in such a manner that a class is being composed of objects whose image co-ordinates fulfill the con-
I dition: (12) \xi-xi+l\<d. i = 1,2 JV-1
This criterion may be challenged on the ground that it presupposes the ana-lyzed set of objects to be accurately orderable i.e., that the set of points is as-sumed to be a set in the one-dimensional space. Indeed, when a set of perfectly random objects is analyzed it may happen that the resulting division of this set deviates rather significantly from what an analysis of the ordered table of distances may suggest. But in case of using the IDWER method, which has its point of departure for the classification procedure in a purposefully selected basic set, the adopted criterion is fully satisfactory.
http://rcin.org.pl

GEOGRAPHIA POLONICA 40, 1979
R E G I O N A L I M B A L A N C E S I N T H E A G R I C U L T U R A L D E V E L O P M E N T O F M A D H Y A P R A D E S H , I N D I A
J . P . SAXENA
Professor of Geography, M.L.B. Arts and Commerce College, Gwalior, India
S . N . MEHROTRA
Joint Director of Education, M.P., Bhopal, India
Madhya Pradesh is agriculturally a backward State as compared with such progressive States of India as Punjab, Uttar Pradesh, Tamilnadu, Kerala etc. Since independence was gained there has been a consistent effort on the part of the Government of Madhya Pradesh and also the Centre, to improve the agri-cultural situation in different parts of Madhya Pradesh. Since 1951 Madhya Pradesh has seen four Five Year Plans, during which much has been done to develop agriculture on the regional basis by making available to the farmer a substantial quantity of chemical fertilizers, improved variety of seeds and facilities of irrigation and power. However, it has to be admitted that neither the geographical conditions nor the attitudes of peasant community in different parts of the State permit uniform development of agriculture. There are im-balances in the regional development and the authors have attempted to pin--point these imbalances in this article.
METHODOLOGY
Now the problem how best the regional imbalances in the agricultural deve-lopment could be ascertained. For this purpose the authors have based the study on twelve selected district indicators 1 which may be grouped into six categories namely, (i) demographic (ii) land use features (iii) agricultural prac-tices and resources (iv) agricultural credits (v) agricultural output and (vi) cropping pattern.
(i) DEMOGRAPHIC
(a) Rural population as percentage to total population This indicator is important in thes sense that after all the benefits of plan-
ning and development of agriculture must reach the peasant community which lives in the rural villages. If the size of the community is large and benefits of
1 The number of indicators may vary from region to region depending on their relative significance.
http://rcin.org.pl

202 J. P. Saxena, S. N. Mehrotra
planning and development are small, the result will be nil for the people. The indicator therefore signifies that the planning and development of agriculture must be in direct proportion to the size of the community. The small district--wise ratio therefore would represent less development in the district and vice--versa.
(b) Agricultural workers as percentage to total workers This indicator is meant for assessing the nature and the degree of the rural
employment. A higher value of this indicator shows greater agricultural deve-lopment and little rural unemployment. Where this ratio is small it indicates either the diversion of rural working force to the nearby urban centers or in activities other than agriculture or the extreme poverty of the land, where there is not much scope for agricultural development.
(ii) LAND USE PATTERN
(a) New area sown per capita of total population This is a very important indicator and points out to the availability of per
capita arable land. A smaller per capita arable area indicates a greater pressure of population on the land and in such a case the region may have subsistence farming. Extensive or commercial farming is generally carried out in the re-gion where per capita agricultural land is sufficient. .,
(b) Double cropped area as percentage to gross cropped area This indicator is significant in the sense that it points out to the possibility
of utilizing the arable land more than once in the same agricultural session. It also shows whether a region has sufficient irrigation potential or not, becau-se in India double cropping is not possible without proper irrigational facilities.
<iii) AGRICULTURAL RESOURCES AND PRACTICES
(a) Working cattle per 100 hectares of net area sown This indicator refers to whether the area under crops is properly cultivated
or not. Normally the field has to be ploughed and harrowed several times be-fore the seed is planted and this is done with the help of animal power. In a region where working cattle are less, the fields are either insufficiently pre-pared or left fallow. This ultimately affects the crops and their yields. In nor-mal practice this ratio is calculated as number of working cattle per 100 hec-tare net sown area.
(b) Irrigated area as percentage to gross cropped area In a country like India, which is climatically hot, augmentation of agricul-
tural production depends greatly on the availability of irrigational facilities in a given area. Hence this is a very important indicator.
(c) Number of ploughs per 100 hectares of net sown area Like the indicator (iii-a), i.e. working cattle, it is also significant for agri-
cultural development to know what types of plough (iron, wooden or tractor) and their numbers are available in the region. All these indicate the manner and the degree of preparation of arable land for a harvest.
(d) Fertilizer per hectare of gross cropped area in lbs The use of chemical fertilizers is a recent phenomenon. Even now a large
number of farmers use cow-dung for manuring the field, but we do not have accurate data on the quantity of cow-dung manure applied into the fields and
http://rcin.org.pl

Regional imbalances 203
farms. Chemical fertilizers are generally distributed through co-operative so-cieties. For agricultural development, therefore, the quantity (in weight) of fertilizer used in the region is a good indicator.
<iv) AGRICULTURAL CREDIT (CO-OPERATIVE)
(a) Credit in rupees per hectare of gross cropped area Like the previous indicator this is also a measure for agricultural develop-
ment. Money is generally advanced to the farmers by various agencies, but the rural co-operative banks are now assuming a major role.
<V) AGRICULTURAL OUTPUT
(a) Gross output in rupees per hectare of gross cropped area It has to be seen whether the measures taken by the government or the
farmer for the development of regional agriculture are sufficient or not, and this has to be measured in terms of gross output in rupees per hectare of gross cropped area. Naturally the higher the output the greater the agricultural de-velopment. and vice-versa. . «
<vi) CROPPING PATTERN
(a) Yield rates per hectare in Kg This indicator is important because it shows whether the district lags behind
the State average or not. Though high yield rates are the result of several fac-tors like fertile soil, irrigation facility or any other such reason, yet these in-dicate not only the degree of utilization of arable land but also the level of agricultural development attained by the farmers.
(b) Cropping intensity This important indicator expresses the intensification of agriculture and
reflects the productive capacity of the cultivated land. It shows the nature of the cropping pattern and indirectly it throws light on the possibilities of in-creasing production through multiple cropping.
CO-EFFICIENT FOR MEASURING AGRICULTURAL DEVELOPMENT
Various methods are known for measuring agricultural development. For example, yield per hectare or gross output in rupees per hectare of gross crop-ped area alone may be considered for this purpose. Input-output ratio, though very good, is impossible to work out for each district of the State. However, the authors have approached the problem as first initiated by Kendall and later on used by Dudley Stamp 2 and M. Shafi.3 The technique is called 'The Ranking Co-efficient'. The ranking co-efficient provides 'ranks' and therefore, it is of utmost importance for the present purpose. Besides, simplicity is its best re-commendation. The aim of the authors in the present study is to identify the regions and to allot them a proper rank with regard to the agricultural deve-lopment. ,
For measuring imbalances in agricultural development, the previously dis-cussed twelve district indicators directly concerned with agricultural develop-ment were derived and used for calculating an index. The procedure is like
2 L. D. Stamp, Our developing world, Faber and Faber, London, p. 53. 8 M. Shafi, Measurement of agricultural efficiency in Uttar Pradesh, Economic
Geography 36(1960), 4, pp. 295-305.
http://rcin.org.pl

204 J. P. Saxena, S. N. Mehrotra
this. Each district has been assigned its proper place value or the rank value of each indicator. Thus if a particular district ranks first with regard to all the indicators, it has the value of one in each column of individual indicator. A district which is at the bottom, has the highest numerical value (lowest po-sition) of the indicator in each column. At the end all the ranks are summed up and divided by the number of indicators used. (2r/n where r is rank and n the number of indicators used) this gives the required index. According to the range available in the present study these indices are grouped into four main categories. They are,
Levels Index
(1) Well Developed 8-12 (2) Developed 12-16 (3) Less Developed 16-20 (4) Least Developed 20-24
On the basis of individual indicator, the above categories have been shown on the map of Madhya Pradesh.
WELL DEVELOPED AREAS
The map shows that much of Chattisgarh plain districts of Morena and Tikamgarh are agriculturally well developed. The index for these districts varies from 8 to 12. It is obvious that Chattisgarh area, Morena and Tikamgarh should stand out from the rest of the districts in view of the development of irrigation in these parts. While Chambal canal serves Morena district, Chattis-garh basin has got a large number of medium and major irrigational projects, and the region is well served by canals. Raising of two rice crops is a normal feature of this region, while in some parts, three harvests can be raised, so that per hectare gros value of agricultural produce is relatively high. Likewise in the Tikamgarh district, tank irrigation is very popular and double cropping is very common. The highest index for agricultural development as per ranking co-efficient formula, however, comes for the Balaghat district (8.58). This dis-trict is first in indicators No. (ii-b) and (iii-b) and second in indicator No. (i-b). No other district of Madhya Pradesh gets this position in agricultural develop-ment.
DEVELOPED AREAS
This region consists of the districts of Ratlam, Mandsaur, Gwalior, Shivpuri, Chhatarpur and Raigarh. The index value for these districts varies from 12 to 16.
Ratlam and Mandsaur are districts covered with black and red and black mixed soils and do not need much irrigation. Cash crops such as cotton and opium are grown in this region. Therefore the government have provided many agricultural facilities and the result is that such districts as Mandsaur and Ratlam have shown considerable agricultural development. In much of the Gwalior, Shivpuri and Bhind districts, agriculture is already developed. More attention is now being paid to industrial development and as such agricultural development slightly lags behind. Moreover much of this area is dry and the facilities of canal irrigation are now being extended to cover much of this area.
http://rcin.org.pl

Regional imbalances 205
Well irrigation still plays an important role where canal irrigation is not avail-able. Chhatarpur has the index number of 15. In this region also, irrigation is less developed, but a large number of cattle are grazed in forests. The same is true in the case of the Raigarh district, the northern part of which is hilly but the plain area is suitable for rice cultivation.
LESS DEVELOPED AREAS
The agriculturally less developed region of Madhya Pradesh covers much of the area of Malwa and Vindhyan plateaus, the Satpura region and the Bag-helkhand region. Another less developed region is that of the Bastar district. For all these areas, the index value varies from 16 to 20. It is somewhat surpri-sing that the Malwa plateau should be agriculturally less developed, because this area is covered with fertile black soils, which do not require much irriga-tion and in historical perspective the Malwa region had seldom faced famines. But indicators do suggest that agriculture is less developed. This is definitely so because this region is highly industrialised and much attention is being paid to industrial output rather than agricultural output (except for cotton). The
http://rcin.org.pl

AGRICULTURAL DEVELOPMENT IN MADHYA PRADESH (INDIA), 1970-1971
APPENDIX Rank Orders of the Districts Acording to Various Agricultural Indicators
District (1)* (2) (3) (4) (5) (6) (7) (8) (9) (10) (11) (12) Total Coefficiei
Raipur 23 7 21 3. 9 5 4 22 1 17 • 17 3 132 11.00 Durg 31 10 15 2 13 9 6 5 13 24 12 1 141 11.75 Bastar 12 2 12 31 5 31 4 32 9 38 27 27 230 19.16 Bilaspur 17 5 22 5 11 11 5 7 3 27 8 6 127 10.58 Raigarh 5 4 17 27 10 31 4 3 5 34 13 25 179 14.91 Sarguja 6 3 17 14 5 33 2 34 15 42 13 13 197 16.41 Jabalpur 38 20 » 23 10 1 23 6 9 18 30 17 11 206 17.16 Balaghat 7 2 23 1 3 1 8 23 2 20 11 2 103 8.58 Chindwara 23 7 10 29 14 17 4 8 22 23 19 23 199 16.58 Sagar 34 11 10 36 17 27 8 15 25 7 14 27 231 19.25 Narsimhpur 25 20 8 37 4 22 8 24 24 18 28 13 231 19.25 Seoni 6 15 6 22 16 14 12 15 19 32 29 18 204 17.00 Damoh 26 3 10 23 15 26 8 21 26 11 22 20 211 17.58 Mandla 6 18 10 9 31 35 7 21 36 36 24 9 242 20.16 Rewa 8 7 20 7 8 32 6 27 27 41 32 5 220 18.33 Sidhi 1 2 16 4 9 35 3 29 40 39 8 10 196 16.33 Satna 15 12 20 11 9 30 4 30 31 40 24 4 230 19.16 Panna 9 11 11 18 9 21 5 29 30 33 20 17 213 17.75 Chhattarpur 18 14 14 15 2 6 2 31 29 22 3 11 167 13.91 Tikamgarh 3 7 19 6 6 2 1 8 16 29 26 7 130 10.83 Shahdol 36 7 14 16 7 34 3 33 39 43 11 13 256 21.33 Indore 41 22 24 20 29 14 9 10 4 1 5 18 197 16.41 Ratlam 22 14 11 13 28 13 11 8 14 13 23 15 185 15.41 Ujjain 37 16 8 30 30 24 12 23 8 3 31 8 229 19.08
http://rcin.org.pl

Mandsaur 32 12 8 8 26 10 9 19 11 2 18 22 177 14.75 Dewas 30 11 5 34 25 25 11 28 17 5 22 11 224 18.66 Dhar 14 5 5 19 22 15 10 14 23 26 25 19 196 16.33 Jhabua 10 1 9 17 12 29 6 23 38 31 16 20 212 17.66 Khargon 28 6 10 24 18 15 10 6 21 19 26 26 218 18.16 Khandwa 40 11 10 33 17 20 10 1 12 10 25 24 213 17.75 Gwalior 35 21 23 32 20 3 7 4 6 9 2 27 189 15.75 Bhind 12 5 15 41 23 8 3 10 10 8 26 29 190 15.83 Morena 16 8 - 18 12 16 4 6 11 20 12 1 14 138 11.50 Shivpuri 20 7 9 16 14 7 10 33 30 35 2 12 186 15.50 Guna 24 10 3 35 17 26 7 25 36 6 10 29 228 19.00 Datia 29 13 9 40 22 12 7 26 35 26 30 33 282 23.50 Sehore 39 19 13 38 21 19 4 8 28 14 7 27 237 19.75 Raisen 4 17 2 43 25 31 5 16 34 15 4 30 226 18.83 Vidisha 27 13 8 39 24 36 7 17 37 25 6 31 220 18.33 Hoshangabad 33 16 6 42 19 28 5 12 32 28 4 32 257 21.41 Betul 11 6 7 21 15 13 7 15 26 37 24 16 193 16.08 Rajgarh 13 9 4 30 27 18 11 20 33 21 15 21 222 18.50 Shajapur 19 10 8 28 28 16 10 32 7 4 21 18 200 16.66
• Indicator No. (1) Rural population as percentage of total population (2) Agricultural workers as percentage of total workers (3) Net sown area per capita of total population (4) Double cropped area as percentage of gross cropped area (5) Working cattle per 100 ha of net area sown (6) Irrigated area as percentage of gross cropped area (7) Number of ploughs per 100 ha of net sown area (8) Fertilizers per ha of gross cropped area in Lbs (9) Gross output in rupees per ha of gross cropped area (10) Credit in rupees per ha of gross cropped area (11) Yield rates per ha in Kg (12) Cropping intensity
http://rcin.org.pl

208 J. P. Saxena, S. N. Mehrotra
Vindhyan plateau east of Malwa, is an area of escarpments, uneven relief, sandy soils and uncertain rainfall and it is not surprising to find this area agri-culturally less developed. Development is low in the Bastar district because much of the population is tribal and their techniques of cultivation are unscien-tific. They generally insist on their traditional grains like rice, kodon-kutki and maize.
LEAST DEVELOPED AREAS
The districts of Datia, Shahdol, Mandla and Hoshangabad, are according to indicators considered, at the bottom of agricultural development in Madhya Pradesh. Datia suffers from granite boulders, dolerite dykes and quartz reefs which criss-cross the area. Big boulders, half buried and half exposed, are found strewn everywhere. Tank-beds are generally cultivated for cereals. Irrigation facilities are few. Soils are generally mixed red and black and rainfall is scanty. Shahdol and Mandla are also backward with a large area under hill ranges covered with 'sal' and 'teak' forests in which a large number of tribal people are found.
Hoshangabad, situated in the Narmada valley, has also dissected relief with Vindhyan and Satpura escarps facing each other. The entire plateau area is covered by teak forests. Narmada has not formed a very broad flood plain. Besides, there is extensive soil erosion, south of the river Narmada and the lo-wer flood plain suffers most by water-logging as the soils are deep black.
The accompanying map prepared on the basis of district indicators provides some basis for further action in the development of agriculture in Madhya Pradesh. The first step in this direction should be to provide facilities to de-veloped districts of Ratlam, Mandsaur, Shivpuri, Gwalior, Bhind, Chhatarpur and Raigarh so that these may become agriculturally well developed districts. From the list of indicators it is clear that more fertilizer and more agricultural credit should be provided to the Ratlam and Mandsaur districts. The Gwalior and Bhind districts need greater facilities for the supply of fertilizers and high yielding varieties of seeds and development of irrigation. This would in-crease not only the gross output but would also permanently increase the area under multiple cropping. Arable land can further be increased by recla-mation of ravines and culturable waste lands (18°/o) in these districts for which the World Bank has been providing financial assistance. In fact the farmers have now already become aware of these things and in the area around Gohad and Dabra, we have now a section of rich peasant community. In the Chhatar-pur district, particularly in Laundi tehsil, which is rich in soil resources, deve-lopment of irrigation (through medium and minor irrigational projects) can positively improve agricultural situation. The same is true of the Raigarh dis-trict. ,
The less developed region should endeavour to secure the place in the deve-loped areas, but the entire region is difficult to rank as developed because of physical and institutional constraints. The Malwa plateau perhaps has got enough potentiality for agricultural development. Where irrigation potentials are available or where these can be extended, cash crops like sugar cane and cotton should be given priority over others. Land around big cities (like Indore, Ujjain, Mhow) is now being diverted to urban uses. This should be restricted and surrounding land should be reserved for horticulture. Acknowledgement
The authors are thankful to Km. Chandrika Thussu and R. K. Sharma for necessary assistance in preparing the text.
http://rcin.org.pl

GEOGRAPHIA POLON1CA 40, 1979
A N E W T E C H N I Q U E O F D E L I M I T I N G A G R I C U L T U R A L P R O D U C T I O N T Y P O L O G Y I N F O O D C R O P D O M I N A T E D E C O N O M Y :
H A R Y A N A C A S E S T U D Y
J A S B I R S I N G H
Department of Geography, Birendra Narayan Chakravarty University, Kurukshetra. India
Major changes in the use of agricultural land in India took place during the Plan Periods, particularly after 1951. Some of these were due to the organized technical advances in agriculture, some to changes in the profitability of dif-ferent agricultural enterprises, some to the receptivity and response of the as-siduous farming communities, and the significant one mainly to the expansion of irrigation facilities — a size neutral leading land-augmenting input or mo-ther factor. These changes improved the use of the agricultural land and in-creased the yield per hectare, placing the agricultural progress on a permanent footing. In spite of this, there still are weaker areas in India covering her vast spread where the level of agricultural production is much below the 'National Index'. This is a common feature of the areas where farming depends on rain. Before we delimit such areas and suggest any remedial steps to increase agri-cultural productivity in these marginal and potential ones, we ought to evolve some technique to measure the present level of farm production — an agricul-tural characteristics which is the expression of many attributes of agriculture.
On account of its multitudinous utility many scholars in the field of agricul-tural geography and agricultural economics have long been engaged in evol-ving methods to measure the level of agricultural production (agricultural effi-ciency) in the various parts of the world. There seem to be several methods adopted for computing levels in agricultural production per unit area per unit of time. These fall within nine broad approaches, namely (a) assessing the value of agricultural production per unit area, (b) measuring production per unit of farm labour, (c) determining output in relation to input or input-output ratio and profitability of farming measured in terms of the return for the sum-total of human effort or paid-out cost in relation to the output (Khusro 1964), (d) ex-pressing production of agriculture in terms of grain equivalents per head of population (Buck 1967; E. de Vries 1967; Clark and Haswell 1967), (e) conside-ring output per unit area per hectare after grading it in ranking order, thereby deriving the Ranking Coefficient (Kendall 1939; Stamp 1960; Shafi 1960), (f) gi-ving weightage to the ranking order of the output per unit area with the per-centage share under crops (Ganguli 1938; Sapre and Deshpande 1964; Bhatia 1967), (g) using the carrying capacity of land in terms of population (Stamp 1958), (h) determining an index of productivity (Enyedi 1964 and Shafi 1972 and 1974), and (i) calculating the index number of agricultural efficiency by expressing the per unit area carrying capacity (in terms of population) of the component enumeration unit as a percentage of the per unit area carrying ca-
14 Geographia Polonica http://rcin.org.pl

210 J. Singh
pacity for the entire region (Singh 1972 and 1974), which involves lengthy and complicated calculations.
Evaluation of the various approaches (Singh, 1972) to measure the agricul-tural performances reveals that most of them suffer from some noted weaknes-ses. Keeping this in view, a new technique of measuring the level of agricul-tural production is adopted, i.e., the Crop Yield and Concentration Indices Ran-king Coefficient.
The level of agricultural production, as a concept, means the degree to which the economic, cultural, technical and organizational variables (i.e. the man-made frame) are able to exploit the abiotic resources of the area for agri-cultural production. The spatial variations in physical output from the soil are the result partly of natural and environmental circumstances and partly of the combinations of human activities. The regional differences in yield per unit area per unit of time reflect the magnitude and the direction of the inter-play of a multitude of factors. Furthermore, the level of agricultural production is a dynamic concept, as any modification in the physical and improvement in the non-physical bases of farming, both effect increase in agricultural produc-tion per hectare. The spatio-temporal characteristics of the level of agricultural production provide a rational base for future orientation in agicultural plan-ning. The pattern of change, in relative terms, is a valid index of the agricultu-ral development in the past. Further, it can be used as an effective measure for delimiting the 'Areas' where even during the Plan Periods agrarian deve-lopments could not bring about significant changes and modifications in crop--structure and hence in agricultural production, and which may thereby be termed as the 'Weaker Areas' practising subsistence type of agriculture.
In order to estimate the regional differences in 'Levels of Agricultural Production', to delimit the areas of positive and negative anomalies in agricul-tural sector and to proceed with régionalisation for agricultural planning, it is enough to take into account the important foodcrops in countries where farming is a way of life for subsistence, since they are the dominant, primary and se-condary crops in terms of agricultural land occupance. In exceptional cases the non-foodcrops may also be considered when their percentage strength is quite sufficient to give them a dominant or a primary or secondary status.
The average crop yields and proportions of these crops in the gross cropped area (preferably harvested area) need to be used as twin elements for measuring the index of the level of agricultural production. For an objective measurement of the level, the relative crop yield and concentration indices arranged into ranking order and computed into average ranking coefficient would give a me-asure which we may call the Crop Yield and Concentration Indices Ranking Coefficient. The procedure may be expressed as,
= 100 1 ar
where Yt is the crop yield index, Y0e is the average yield per hectare for crop a in the component enumeration unit and Yar is the average yield of the crop a in the entire region.
Ci = • 100 "a,
where Ct is the crop concentration index, Pae is the percentage strength of the crop a in the gross harvested area in an enumeration unit, and Par is the percentage strength of the crop a in the gross harvested area in the entire region.
http://rcin.org.pl

A new technique 211
Crop Yield and Concentration Indices thus derived for all the enumeration units and for the crops considered are ranked separately. Yield and concentra-tion ranks for individual crops are added and thereafter divided by 2, thus giving the Crop Yield and Concentration Indices Ranking Coefficient. The equation is:
Crop Yield Index Crop Concentration Crop Yield and Ranking of Crop a + Index Ranking of Concentration Indices Crop a Ranking Coefficient for the crop a ~ ~ ^
The results thus derived will give us an idea of the level of agricultural production, the lower the ranking coefficient, the higher the level of agricul-tural production, and vice-versa.
Ranking coefficients for individual crops are arranged in ascending order and the coefficients are divided into four or six categories, i.e. two or three above and two or three below the 'Regional Ranking Coefficient', giving four or six grades of the level of agricultural production, namely considerably high, very high, high, low, very low and considerably low. The same procedure can be adopted for the rest of the crops. The overall ranking coefficients can be derived by adding the ranking coefficients of all the crops for each enumera-tion unit and dividing by n, where n means the number of crops considered. The results thus derived can be mapped with the help of the choropleth me-thod emphasizing the regional imbalances in levels of production which can be correlated with the salient characteristics of the influents, viz. physical and non-physical.
The typology should not be confused with regionalization as the concept of type is of a systematic or taxonomic character, while that of region — of a spatial or territorial one (Kostrowicki 1976). The suggested technique follows the preceding premises because primarily, it classifies the enumeration units or farms systematically or taxonomically by considering agricultural producti-vity and arable land occupance, and consequently, the results can be mapped highlighting regional patterns. The régionalisation is the consequence of typolo-gy based on certain quantitative principles. Finally, the technique can help in the classification of four-unit or six-unit agricultural production typology which is much more useful from 'Geoagercultura' and agricultural planning point of view.
HARYANA AS A CASE STUDY
Before an attempt is made to evaluate the pattern of four-unit agricultural production typology, it is worthwhile to examine the setting of general environ-mental conditions which influence the level of agricultural productivity. Harya-na lies in-between the latitudes of 27°83' and 31°09' north and longitudes of 74°05' and 77°06' east in the northwestern semi-arid and arid parts of India.
Physiographically, Haryana is dominated by the Yamuna-Chaggar Plain spreading from the northeast to the southwest lying between a narrow hilly belt in the extreme northeast and a fairly extensive undulating sandy terrain to the south and southwest. The general direction of slope is from the northeast to the west and southwest, and mostly the heights vary between 180 m and 270 m a.s.l. Topographically most of Haryana is suited to farming. The state is covered by a variety of soils which are closely related to climatic characteristics,
14» http://rcin.org.pl

212 J. Singh
geological and morphological formations, and surfacial deposits. Based on textural grades the soils of the High and Low Hills and more dissected Pied-mont Plain in the northeast vary generally from stony, sandy to clayey, of Yamuna-Chaggar Up-Plain (Bhangar) vary from sandy loam to loam, of Yamu-na, Chaggar and Markanda Low-Plain (flood plain or khaddar) are silty loam to silty clay, of the south and southwest sandy undulations (Bagar) are from loamy sand to sandy, and of low-lying areas (tals) in the Bagar are sandy loam. The soils respond differently to irrigation because of their varying physical, chemical and biological properties. By and large, over the major parts in the south and southwest underground water is saline and brackish, unfit for crop husbandry.
Climatically Haryana is affected by the monsoon. On the whole, the climate of Haryana can be classed as a 'Sub-Tropical Continental Monsoon Climate' possessing the following characteristics, (a) seasonal rhythm, (b) hot summer, (c) cool winter, (d) great annual range of temperature, (e) adequate warmth and sunshine, (f) mostly dry except for two to three months (July to September) and (g) meagre and highly unreliable rainfall. Seasonal rhythm in temperature is responsible for two cropping seasons, i.e., summer (kharif) and winter (rabi) growing tropical/subtropical and temperate crops respectively. There is ade-quate warmth and sunshine throughout the year to provide ripening conditions for food, oilseeds, and fibre crops. As of meagreness, insecurity and variability, the rainfall is the simple dominant weather parameter and a climatic hazard, influencing agricultural productivity. The nearly complete aridity on the confines of Rajasthan desert and semi-aridity in the south and southwest prevail, and the degree of aridity decreases as one proceeds towards the north-east where in a narrow belt dry subhumid climate is encountered on the High and Low Hills and, the Piedmont Plain.
Socio-economically, first, with the introduction of canal and tube-well ir-rigation in general and from the Bhakra-Nangal Scheme in particular, secondly, with the improvement of water allowances in the existing flow irrigation systems, and thirdly, with the colonization of the cultivable wasteland on an enormous scale during the 1950s and early 1960s, most parts of Haryana exper-ienced an agricultural upheaval of high magnitude and population on move at inter-district as well as inter-state levels. The new irrigational facilities as-suring agricultural water to the formerly rainfed areas attracted streams of inmigrants from the heavily populated areas of the composite Punjab. With these new-comers and their familiarity with irrigated farming and also with the extension of irrigation to virgin lands, a new leaf has been turned in the socio-economic history of the then marginal lands of the State. The overwhel-mingly subsistence farm economy, precarious and inferior, gave place to an increasingly superior agricultural economy, thereby increasing agricultural pro-ductivity. Yet still there are weaker areas practising subsistence type of agri-culture within the borders of the State.
Haryana belongs climatically to the arid and semi-arid zone but is endowed with human motivation and attitudes favourable for rapid agricultural growth. However, these qualities would remain fruitless without massive private and public investments made in irrigation in those areas backward from agricultural productivity point of view. The persistence of regional differences in agricul-tural productivity per unit area, may be attributed to the extreme disparities in resource endowments—usually the outcome of the complex process of socio--economic development over a very long period—which cannot be reduced in a short span of time. Although there would be considerable scope for reducing,
http://rcin.org.pl

A new technique 2 1 3
if not eliminating these disparities altogether, in the course of time. First of all, the disparities need to be measured, mapped and interpreted. Figure 1 is an attempt towards these goals.
Fig. 1. Haryana. Four-unit agricultural production typology (data by development blocks), 1970-1973 average
http://rcin.org.pl

214 J. Singh
Figure 1 attempts to show the average of 'Clubbed Crop Yield and Con-centration Indices Ranking Coefficients' of selected foodcrops, thus giving the patterns of four-unit agricultural production typology. Regional differences can be explained by reference to the divergencies in abiotic, socio-economic, cultural and techno-organizational variables. In areas of ideal conditions the level of farm production is very high, i.e. above the State Index, while in areas of handicaps it falls correspondingly. In the former there is surplus which can be traded, thereby the farming has commercial orientation in terms of input and output. In the latter, the level of production is very low, conse-quently the farming is of subsistence type. Interpretation of Figure 1 follows.
It will be seen on this map that agriculture is most inefficient having subsistence character — that is to say, the production per harvested hectare is low to very low — in the northeastern, southern and southwestern parts of the State, where soil is less fertile than in the rest of the region. In addition, the relief is undulating, consisting of sand-dimes, deserted river beds, sandy undulations, hills, rocky surfaces and piedmont plain, unfavourable to produc-tive agriculture. In addition to the aforesaid abiotic controls, these areas lack assured and controlled irrigation facilities needed for utilizing the soil potential under arid, semi-arid and dry sub-humid truant rainfall conditions. These are the weaker areas of Haryana where there lies an exorbitant scope for the agricultural colonization of the sand-dunes, loamy-sandy undulations and piedmont plain.
The level of farm production is high and very high in the eastern and central parts of the State. The level of production per unit area is above the State. Index and farm production is semi-commercial as well as commercial oriented depending upon the size of the net operational holdings. The agricul-tural prosperity results from of well developed, assured canal and controlled tube-well irrigation, sandy loam to loamy soils and highly organised farm ma-nagement. Most of the crops are raised with irrigation and careful crop-hus-bandry by the enterprising farmers. They are particularly chary of high-yiel-ding varieties of wheat and paddy. In addition, they are astute decision-ma-kers when it comes to the selection of foodcrop-enterprises. The dominant crops are wheat, rice (paddy) and sugar cane. Further, crop-structure is superior and specialisation in a few commercial food crops is a common feature.
CONCLUSION
From the foregoing division of Haryana, the situation of levels of farm production as exhibited in Figure 1 can be summed up in four-unit agricultural production typology, viz. areas of very high, high, low and very low levels of agricultural productivity. The levels of farm production with reference to national as well as regional index can conveniently be used as a sound criterion for the delimitation of weaker areas practising subsistence type of farming. Areas having low and very low levels of farm production are the weaker areas of the State, which need the attention of the agricultural scientists, plant breeders, regional planners and other state or central agencies connected with integrated agricultural development programmes.
Finally, the hypothesis is that the weaker areas of the State have all the potential of raising food production. It is a well-accepted fact that the State has great variation in agroclimatological, agromorphological, agropedological, agrohydrogeological, socio-economical, cultural, and techno-organizational con-ditions, and production potential. The operation of various parameters, of pro-
http://rcin.org.pl

A new technique 215
duction naturally varies f rom region-to-region leading to four-unit agricultu-ral production typology. Therefore, it is suggested that the classification of agri-cultural land in Haryana according to agricultural production conditions and potential may be used for evolving the agricultural developmental programmes. Agricultural lands may be classified as, (a) areas with an assured and control -led, both in volume and time, water supply f r o m canals and tube wells, (b) areas with uncertain supply of agricultural water either f r o m irrigation or rainfall, and (c) areas with undependable seasonal irrigation or significantly l o w proportion of intensity of irrigation or very high proportion of rainfed farming, where rainfall is meagre and truant.
REFERENCES
Bhatia S. S., 1967, A new measure of agricultural efficiency in Uttar Pradesh, India, Economic Geography 43, 3, pp. 244-260.
Buck J. L., 1967, Land utilization in China, vol. 1, University of Nanking. Clark C. and Haswell M., 1967, The economics of subsistence agriculture, London,
Macmillan, pp. 66-73. Enyedi G. Y., 1964, Geographical types of agriculture, in: Applied geography in
Hungary, Budapest. Ganguli B. N., 1938, Trends of agriculture and population in the Ganges valley,
London, pp. 93-94. Kendall M. G., 1939, The geographical distribution of crop productivity in England,
Journal of the Royal Statistical Society 162, pp. 24-28. Khusro A. M., 1964, Returns to scale in Indian agriculture, Indian Journal of Agri-
cultural Economics 19, pp. 52-53. Kostrowicki J., 1976, World types of agriculture, Warsaw, IGU Commision on Agri-
cultural Typology. Sapre S. G. and Deshpande V. D., 1964, Inter-district variations in agricultural e f -
ficiency in Maharashtra state, Indian Journal of Agricultural Economics 19, 1, pp. 242-252.
Shafi M., 1960, Measurement of agricultural efficiency in Uttar Pradesh, Economic Geography 36, 4, pp. 296-305.
Shafi M., 1972, Measurement of agricultural productivity in the Great Plains, The Geographer 19, 1.
Shafi M., 1974, Perspective on the measurement of agricultural productivity, The Geographer 21, 1, pp. 6-8.
Singh J., 1972, A new technique for measuring agricultural productivity in Haryana (India), The Geographer 19, pp. 15-33.
Singh J., 1974, An agricultural atlas of India: A geographical analysis, Kurukshetra, Vishal Publications, pp. 252-254 and 347-350.
Stamp L. D., 1958, The measurement of land resources, Geographical Review 48, 1, pp. 1-9.
Stamp L. D., 1960, Our developing world, London, Faber and Faber, pp. 108-109. Vries de, E. Referred by Clark C. and Haswell M. (1967), pp. 60-61, and quoted by
Bhatia S. S, (1967), p. 246.
http://rcin.org.pl

http://rcin.org.pl

GEOGRAPHIA POLONICA 40, 1979
' C A R R Y I N G C A P A C I T Y ' A N D ' P O T E N T I A L C R O P P R O D U C T I V I T Y ' — B A S I C C O N C E P T S I N C U L T U R A L G E O G R A P H Y ?
SOFUS CHRISTIANSEN
DEPARTMENT OF GEOGRAPHY, UNIVERSITY OF COPENHAGEN, DENMARK
Concern for the man/land relation is of long tradition in geography. Already the French school of geography initiated by Vidal de la Blache was aware that properties of the environment were limiting the activities of man and thus influenced for example density of population. Such ideas had been touched upon by earlier geographers, but they were centered upon by authors as J. JBrunhes (1925). More recently P. Gourou (1958) and — in more detail — P. Beguin (1964) again drew attention to the topic.
A special formulation of the man/land theme: carrying capacity for popu-lation was probably coined in analogue to a similar concept in biological eco-logy. In African geography 'carrying capacity' has been worked upon with devoted interest. For some researchers as C. C. Trapnell (1943) and W. Allan (1949) the concept was the pivot for some pioneering works of great influence on the development of geographical thinking. In other areas of the world similar ideas have been applied by, e.g., in South America: B. Meggers (1954) and R. Carneiro (1960); Asia: H. C. Conklin (1959); Africa: C. Clark, and M. Haswell (1964), and Oceania: H. C. Brookfield, and D. Hart (1971).
Generally there was, however, a period of declining interest in the man/land theme in geography after World War II. Main concern was for a long time at-tached to the 'quantitative revolution', especially in Anglo-American geography. Quantification meant a huge step forward, and it is believed that it has create ed a basis of better methodology instrumental for interest in the classical the-me. The rise of ecology and an increased interest in the developing countries seem to warrant new advances in 'ecological geography'.
To promote this resurrection a rethinking of basic ideas may probably be useful. In this paper both 'carrying capacity' (CC) and 'potential crop producti-vity' (PCP) will be considered. Both might prove practical, the CC-concept mainly when dealing with subsistence economies of the developing countries and of the total world, and the — related — PCP-concept of a more general application though still in need of more shaping to be ready for use.
The various definitions of the CC-concept have one thing in common: the existence of a limit in a given area, determined by the production achieved, for its size of population. Strictly speaking, this limit is only defined for condi-tions of subsistence, i.e., for an isolated area or for the globe as a whole. Furt-hermore, it implies that time intervals of constant stores should be considered. Evidently, these restrictions make the concept hard to handle and might neces-sitate corrections to compensate for imports (exports and increases) decreases in stores.
http://rcin.org.pl

218 S. Christiansen
Another difficulty to make the concept operative is, however, to find a com-mon denominator for needs and yields. With subsistence economies, money cannot properly be used for a unit of value. It is here suggested that energy units are used instead when dealing more specifically with feeding capacity of a subsistence agricultural system for a human population.
Generally, we get for a subsistence system with unchanging stores: Produc-tion = Consumption; or: A = P-c, where A is the given, 'closed' area, y the (uniform) yield per area unit, P the population (in standard units), and c the minimum consumption per capita. If the expression A*y = P-c is rearranged,
P Y
it is seen that density of population depends on Quite often, the maximum P value of is termed the critical density of population; this is, according to P.
Gourou, one of the most pertinent geographical characteristics of an area (and of its productive system). Maximum carrying capacity understood as the max-imum population that can be sustained by the local production of a given area is found similarly as: . . Y
^(max) ~ 7T -A -. . : ... ^ (min)
A • Y It can of course also be written: P(max) ~— (m*x) ^(min)
By his efforts to make the CC usable for practical purposes, W. Allan (1967) sharpened the definitions for the elements of the expression above. He used a slightly different formulation:
P(max) ~ (A'Cp'Lf) : Cc
where A is the total area considered, Cp the 'cultivable percentage', Lf the 'land use factor', and Cc the 'cultivation factor'. The cultivable percentage understood as 'such land as would normally be included in the cropping se-quence and land rotation of the balanced system unaffected by pressure' must be found by detailed analyses. Usually the land use factor is easy to find by field surveys. It is understood as 'the relationship between the duration of cultivation on each of the land or soil units used in classification and the period of subsequent rest required for the restoration of fertility'. Through sampling the cultivation factor may be estimated; it is 'the average acreage under culti-vation per head of population at any one time'.
The 'cultivable percentage' assumes local agriculturists to be able to distin-guish properly between cultivable and uncultivable land, an assumption to be dealt with in the following. Allan's use of the 'land use factor' brought about a very useful classification of land use systems into broad main categories, such as permanent cultivation land and shifting cultivation land. Other writers, P. H. Nye and D. J. Greenland (1961) and H. Ruthenberg (1971) use a more generalized classification system. The latter uses an R-value: the number of years of cultivation expressed as percent of total length of the cycle of land rotation, and he bases a classification of agricultural system on these R-values. There is a special finesse by estimating the cultivation factor in the way Allan prescribes. The amount of land is determined as to include an area large enough to deliver a sufficient yield every year. This means that the subsistence cultiva-tor usually acquires a 'normal surplus', which — by the way — probably ex-
http://rcin.org.pl

Carrying capacity 219
plains why immediate and encouraging exports can be obtained when transport is extended into subsistence farming areas.
In the defined way, Allan's 'cultivation factor' includes an allowance for the work spent in the agricultural production itself. This raises some questions: Is the amount of work involved in production of the calculated yields a fixed one or not? Unless it is, it might be risky to calculate with a fixed cultivation factor. Also it might be advisable, if critical population density is considered, to distinguish the absolute necessary consumption from 'luxury consumption'.
To decide if a fixed amount of work can be expected to be assigned to agri-cultural production, the normal production curve may be considered. Very little can be told about its quantitative proportions, but the form of the curve must at least feature the levelling off as shown in Fig. 1. If this and the general form can be assumed, there is a maximum production. Then there is also an amount of inputs below which production is irrational for 'economic man', namely at the point where the curves for marginal and average production intersect. (At lower inputs any added unit will add to the average and thus to the total output/input ratio). As it is revealed by the curve, there is no single point by which CC may be instantly defined.
If it is assumed that both inputs and outputs are measured in the same units, the analysis may be pursued a little further. Assuming a given area and looking aside from other costs (they are normally negligible in a subsistence society) total costs may be depicted by an extra curve (see Fig. 1). Here this curve is shown as a straight line, as the 'cost' of extra work is thought to be proportional to the working hours.
http://rcin.org.pl

220 S. Christiansen
In this case, there is one point at which maximum CC may be defined; at the intersection of the marginal production and the marginal cost surves. Under normal conditions one definite point of maximum capacity, understood as the maximum surplus production after deduction of production costs, can thus be found. The determination of the maximum point is irrespective of how 'cost' is defined. Cost can be regarded in two different ways: as energy expenditure used in food production, or as including the extra energy expenditure for the lifetime of the people involved in food production.
Closely attached to the definition of a maximum CC is the problem of 'conservatism' in agricultural production. Many observations indicate that the combinations of area and work to produce a given quantity of food form a curve as shown in Fig. 2. The theoretical reasons to believe this are based on the decreasing results of a substitution of both work for area and area for work. The curve explains the 'conservatism' well in the case of critical, maximum CC, as it shows that a given production can be sustained with very little work as long as there are abundant areas to cultivate. For the production of 2, 3 and more tons, curves similar to that of Fig. 2 but with higher inputs of both work and areas may be found. On each of these curves there is normally one point at which the work-area combination is at an optimum. The production curve in Fig. 1 is thought to contain exactly all these points; this means that the point at which CC was defined is exactly the point that gives the largest sur-plus of gained food energy over energy used in production.
Fig. 2
Another assumption for the definition of CC must shortly be mentioied: the possibility of assigning a fixed value for consumption. FAO/WHO (1973) have given certain minimum requirements of food energy for a populatioi of a given size and sex/age composition. This value may be useful, thougi it must be borne in mind that it is defined on this basis, and it is probably just as tenable to define it on a basis of 'standard metabolism' — that is at the lowest possible consumption. Since such a definition would leave no :ood energy for anything else than to be kept alive and work for food this raises the problem of lowest acceptable standard of living.
Whereas the previous considerations apply to food suppy under subsistence or global conditions (i.e. total systems) the CC-concept must be modified when dealing with market-oriented or planned economy conditions. Generally, for
http://rcin.org.pl

Carrying capacity 221
the production of the commodity n we have: An • yn ~ P • cn ± export/import. Supplies of a given commodity for a population P depend thus on the area ascribed to it, An, the area yield yn and export/import:
n
In material accounting, this can be used for calculation of the amount of area needed to supply a given population with a given commodity given its yields per area unit and its consumption per capita. The needs for a given population P is:
or:
/ = 1
For the sake of simplicity, export/import has been left out in the last expres-sions. This type of accounting implies further analysis of the properties of areas with respect to their yielding capacities for a range of given commodities. Very few existing geographical works are specific enough to be valuable in this respect. No doubt investigations on potential production of a range of speci-fic commodities are of increasing interest.
Very few calculations e.g. of areas involved in total supply of a nation exist in Western nations presently.
The definition of potential crop productivity, PCP, is from a plant physiolo-gical point of view most conveniently made in terms of the net primary produc-tion level, that is gross primary production less respiration losses during a given time interval. This is almost similar to 'maximum harvestable production of dry matter per annum'. To develop the definition further, it is necessary to consider the constraints on plant productivity. They encompass: (1) the plant chosen, (2) the light, both quantity and quality considered, (3) temperature, (4) water, (5) plant nutrient ions, and (6) a variety of other, more haphazardly influencing factors such as diseases.
Clearly the plant chosen has a bearing on the obtainable harvest of dry matter. The productivity differs greatly within plant species or even within smaller taxa. Possibly plants delivering products of similar chemical composi-tion yield similarly, as seems to be the case with the very effective so-called C4-plants. Corn (maize) and sugar cane are both relatively good gauges for potential yield. It is probably still necessary to define PCP for carbohydrates as well as for proteins. A plant used for measuring production should, howe-ver, not only have production figures related to actually cultivated plants, but also be of widespread occurrence. Possibly a 'laboratory plant' as the green algae Chorella might be useful. In practice, measurements could be carried out on this plant according to prescriptions analogous to those given by E. Ste-emann Nielsen (1965) for oceanographic work.
Unfortunately, no plant has a constant productivity during its life cycle. It is hence necessary to define the stage of development at which the producti-vity should be measured. A plant developing in a similar way as one or more important cultivated plants might be used to give a measure for the photo-synthetically active plant tissue developed at any point of time. The leaf area
http://rcin.org.pl

222 S. Christiansen
developed is the basis for the daily production to be added. In practice this measure is, however, difficult to use and may tend to mask a potential for development (as with plants able to utilize a longer period of growth). A more promising approach is therefore to measure production related to a standardi-zed leaf area. Such measurements may only relate directly to special agricultu-ral practices such as production of grass, when the grass is browsed to an extent that will let an almost constant leaf area standing.
If the model of plant productivity has been decided upon, a consideration of the other constraints remain. Of main interest are two different strategies. According to one of them, only two constraints, received light and temperature, are taken into account. The reason is that these factors are the most difficult of all to influence upon in normal agriculture, whereas the others can be changed to some extent within usual economic possibilities. Another strategy is to con-sider as many constraints as possible of the natural environment, at least also to consider the water constraint, because it usually is of paramount importance. In modern agriculture there is less reason to deal with deficits of mineral ions as an enhancement; they are easily adducted though with efficiencies depending on soil properties.
Regrettably few attempts have been made to develop the PCP-concept. (An early survey of the possibilities for this was made by P. W. Porter 1970). No doubt this stems not only from the considerable amount of work necessary to do, but also from the sore lack of relevant observations.
Among the first attempts to assess potential productivity, though in this case of forest areas, is that of S. S. Paterson (1956). By analysing a large mate-rial he found a high correlation between maximum timber productivity and some selected climatic elements (average temperature for the warmest month, annual range of temperature between means of coldest and warmest months, precipitation, length of growing season, and solar radiation as proportion of radiation at the poles). On this basis a world map of productivity was construc-ted. By similar correlation methods many other assessments can and have been derived. Two recent and interesting approaches have been presented by H. Lieth (1973). Much refinement can be incorporated into correlation methods, but there is always a risk that they involve other factors (and in aberrant ways) than those of direct functional relationship to plant productivity. New methods chosen should preferably apply results from plant physiological research.
An interesting attempt to work along these lines has been published by Jen-hu Chang (1970). It differs mainly from the ideas expressed above by its assumptions of models for development of biomass.
As the PCP-concept may be a help for more sophisticated analyses of world agricultural potential, it seems worth while to develop it further. To ease this, it might be a great advantage to decide upon a uniform strategy to follow. Probably a model should be recommended that involves assumptions of: con-stant photosynthetically active biomass, production of carbohydrate in natural conditions of light and temperature but disregarding the difficult water- and mineral ion factors. It is a simple definition and it gives possibilities for both theoretical simulation-work and direct biological observations.
— o o o o — The intention of this paper has been to recommend that the concepts Car-
rying Capacity for Population and Potential Crop Production are both conside-red as future tools in cultural geography and that uniform definitions are agreed on. In case of extending relevant observation work an agreement on definitions is important.
http://rcin.org.pl

Carrying capacity 223
REFERENCES
Allan W., 1949, Studies in African land usage in N. Rhodesia, Rhodes-Livingstone Papers, 15.
Allan W., 1967, The African husbandman, London. Bequin P., 1964, Modeles géographiques ... Bruxelles. Brookfield H. C., Hart D., 1971, Melanesia. A geographical interpretation of an island
world, London. Brunhes J., 1925, La géographie humaine, vol. I-II, Paris. Carneiro R., 1960, Slash- and burn agriculture: A closer look at its implications for
settlement patterns, 5th Intern. Congr. of Anthrop. and Ethn. Sci., Philadelphia. Chang Jen-hu, 1970, Potential photosynthesis and crop productivity, Ann. Ass. Amer.
Geogr. 60, 1, pp. 92-101. Conklin H. C., 1957, Hanunôo agriculture. A report on an integral system of shifting
cultivation on the Philippines, FAO, Rome. Clark C., Haswell M., 1966, The economics of subsistence agriculture, London. FAO/WHO, 1973, Food energy and protein requirements, Rome. Gourou P., 1958, The tropical world, London. Lieth H., 1973, Primary production. Terrestrial ecosystems, Human Ecology 1, 4. Meggers B., 1954, Environmental limitations to the development of culture, Amer.
Anthrop., 56, 5, pp. 801-824. Nielsen Steemann E., 1963, Fertility of the ocean, in: M. N. Hill (ed.), The sea... vol.
II, pp. 129-164, New York. Nye P. H., Greenland D. J., 1961, The soil under shifting cultivation, Commonw.
Agric. Bur. Reading. Paterson S. S., 1956, The forest area of the world and its potential productivity,
Gôteborg. Porter P. W., 1970, The concept of environmental potential..., in: V Zelinsky (ed.),
Geography and a crowding world, Oxford. Prothero Mansell R., 1972, People and land in Africa South of the Sahara, London. Ruthenberg H., 1971, Farming systems in the tropics, Oxford. Trapnell C. C., 1943, The soils, vegetation and agriculture of NE Rhodesia, Lusaka.
http://rcin.org.pl

http://rcin.org.pl

GEOGRAPHIA POLONICA 40, 1979
P R O D U C T I V I T Y A N D F L U C T U A T I N G L I M I T S O F C R O P C U L T I V A T I O N I N F I N L A N D
UUNO VARJO
Department of Geography, University of Oulu, Finland
It is characteristic of a country such as Finland, located at the northern extremity of agriculture-based settlement, that it should be crossed by the limits of cultivation of numerous crops, and it is inevitable that such a mar-ginal agricultural region should be hit by crop failure from time to time. So it is in Finland that observations covering several centuries have shown that out of every ten years two are years of crop failure and three have poor harvests. Total crop failure is extremely rare, however; normally different crops are af-fected in different years, and the region involved fluctuates from year to year, though the north of the country is affected more often than the south. As a result of this, agriculture tends to be highly diversified in order to prevent overall failure, although this is really only possible in Southern Finland and to a certain extent in Central Finland, as in the north only a small number of species thrive in any case.
Harvest yields are generally bound to climatic factors, with temperature decisive at higher latitudes and rainfall further south (Fig. 1). This means that the effects of climatic fluctuations on economic life assume different forms at different latitudes, and also show some variation in a longitudinal direction. This must be taken into consideration when attempting any global comparison of variations in the frequency of seed years, certain animal species, etc, which are dependent on climatic variations (Hustich 1950, pp. 17-18).
Fig. 1. The varying size of the 'hazard coefficient' at low and high latitudes
But what is the role of climate in the fluctuating limits of crop cultivation in Finland? Kerânen (1931) studied the correlation between the average tempe-rature of the spring and summer months and the yields of wheat, rye, barley, oats, mixed crops and potatoes in the period 1886-1925. An examination of his tables readily reveals that temperature conditions are of decisive importance,
15 Geographia Polonica http://rcin.org.pl

226 U. Varjo
especially for wheat and rye. Barley and oats show a distinct correlation with early-summer precipitation in the southern part of Finland, but a more marked correlation still with May temperatures in the central and northern parts of the country. If we restrict ourselves to these cereals, we find that the highest correlation coefficients in the various provinces for the different spring and summer months apply throughout to the connection between temperature and yield. After Hustich (1952, p. 101) the average correlation coefficient of the series rye crop for the period 1861-1939 in the areas of Helsinki and Oulu du-ring June-August was 0.56 ±0.08 and during September-August 0.71 ±0.05, which appears to indicate that the correlation between temperature series and the relative values of rye crop has grown increasingly distinct in the period 1921-1939.
Figure 2 compares the relative yields of winter wheat, spring wheat and rye in 1921-1948 with the temperature series for Helsinki-}-Oulu (June-August). This can be interpreted to mean that the great increase in yield of rye per hectare in the period 1921-1939 must be ascribed to a large extent to the mar-ked favourable climatic fluctuation in the 1920s and 1930s (Hustich 1952, p. 101).
Fig. 2. The relative yields of winter wheat (1), spring wheat (2) and rye (3), 1921-1948, compared with the temperature series Helsinki + Oulu (June-August (C°)
In Finland, farming generally varies both quantitatively and qualitatively between different parts of the country, since the colder the climate during the growing season, the greater the risk involved in arable farming. The climatic 'hazard coefficient' for rye in North Finland, for example, has roughly double that found in Southern Finland during the 1940s (Hustich 1952, pp. 103-104). Consequently, the climatic amelioration in Finland during the 1930s and cor-responding deterioration from the 1940s onwards have served to shift the limits of cultivation first northwards and later southwards again (Fig. 3). In 1950 barley, oats and rye were grown almost throughout Finland as far as North Lapland, and spring wheat was cultivated generally at Tervola. Since this time the limit for barley has not altered appreciably, but by 1959 that for rye was located around Rovaniemi and Suomussalmi, and by 1969 it lay to the south of Kainuu. In 1950 oats still accounted for 12% of the field area in Kittila, and an average of 4% in North Lapland generally, whereas by 1959 it was no longer cultivated at all in Kittila, and only occupied 0.6% of the field area in North Lapland, having its limit of regular cultivation passing through the southern part of Lapland and the county of Kainuu. By this time the limit for the wi-despreaded cultivation of wheat had shifted to a line about 100-150 km south of the southern boundary of the province of Oulu, and even further south on the west coast. Violent movements in the cultivation limits were thus ex-
http://rcin.org.pl

Fig. 3. Changes in the northern limit of general cultivation of certain crops in 1930-1969
15* http://rcin.org.pl

228 U. Varjo
perienced during the 1960s, movements which obviously cannot be explained by any deterioration in the climate, because this has not changed since the 1950s (see Fig. 4). ,
The influence of man deserves most serious attention in this connection. One may well ask what importance there is to be attached to plant breeding, increased mechanization, the greater quantities of fertilizers used, improved seed treatment, and other major developments in agriculture. Agriculture being dominated by marketing considerations, plant cultivation has naturally be-come bound to the profitability of agriculture, since cultivation is only possible where the value of the harvest covers production costs. This value depends, of course, not only on the yield but also on the cultivation costs and on the price paid to the producer. If the price per kilo is doubled, for example, while the variable expenditure remains constant, the lower limit for a profitable har-vest yield per hectare drops to a half, while similarly if prices remain con-
Fig. 4. The average temperature for June-October in Turku and Sodankyla and the differences between them in the period 1950-1968 after Rapeli (1969)
stant but the variable expenditure rise is doubled, the lower limit for a pro-fitable yield is raised to double. In other words, with constant harvests the pro-fitability of cultivation remains the same only when costs and producer prices increase proportionally.
Recent trends in Finland for spring wheat, barley and oats may be seen in Table 1, which shows prices in 1966, 1972 and 1974 expressed in the 1974 mo-netary level. One general feature here is that while producer prices have fal-len, the variable expenditure has increased, leading to a sharp decline in pro-fitability, as may be seen in Fig. 5. In 1966 a yield of about 700 kg per hectare for spring wheat sufficed to cover costs, but in 1974 a yield of 1600 kg/ha was needed. Corresponding figures for barley (Fig. 6) were 800 kg/ha in 1966 and 1760 kg/ha in 1974, and for oats (Fig. 7) 860 kg/ha and 1750 kg/ha respectively. The consequence of this has been a shift in the limit at which the spring wheat
TABLE 1. Prices and variable expenditures of certain crops (MKJ 518; MLK 1972 and 1974
Crop Producer price (p/kg) Variable expenditure (mk/ha) 1966 1972 1974 1966 1972 1974
Spring wheat Barley Oats
94 57 55
75 50 47
67 51 47
660 915 1060 470 760 875 470 735 865
http://rcin.org.pl

Limits of crop cultivation 229
harvest succeeded in covering its variable costs from South Lapland in 1966 to Central Finland (Fig. 8), while the limit for barley has moved from North Lapland to a line Seinajoki-Nurmes, and that for oats from Central Lapland to approximately the same line. These values are calculated from the average harvests yields for 1967-1969 (Varjo 1976).
Fig. 5. Changes in the profitability for the cultivation of spring wheat with varying cost level and producer prices
Fig. 6. Changes in the profitability for the cultivation of barley with varying cost levels and producer prices
On closer examination of these limiting values, we see, however, that the variable expenditure figures used do not include the farmer's own wage, so that the real limits of profitability are nowadays located very much further south. Poor profitability, for its part, may well lead to an attempt to cut back on costs, so that cultivation might provide at least some actual income to the far-mer. Since no economies can be made in seed, this saving must be concentra-ted elsewhere, principally in fertilization. The extent to which this is being
http://rcin.org.pl

230 U. Varjo
done, especially in Northern Finland, is shown by trends observed in the use of fertilizers. According to Turkka (1972, p. 48) the heaviest application of ferti-lizers takes place in the southern part of the country, in Varsinais-Suomi and Hame, but even so their use has also increased most rapidly in these areas, as in Southern Finland in general. The increase between 1962 and 1972 was es-pecially sharp in Satakunta. In the central areas of the country and in Bothnia the use of fertilizers increased during the 1960s by an average on 70 units/ha, a very much smaller rise than in Southern Finland. The trend in Lapland dif-
vels and producer prices
TABLE 2. Application of artificial fertilizers (f. unit/ha) in 1962-71 (Turkka 1972, Appendix II)
Agricultura! district 1962 1965 1968 1971
Uusimaa (1) and Uusimaa Swed. (2) 80 112 126 176 Varsinais-Suomi (3) and Aland (4) 115 127 158 216 Satakunta (5) 63 98 114 167 Háme (6) 81 121 130 180 Pirkanmaa (7) 56 82 98 118 Eastern Háme (8) 68 97 117 155 Kymi (9) 87 106 116 152 Mikkeli (10) 66 84 93 127 Kuopio (11) 60 88 96 134 North Karelia (12) 72 97 95 133 Central Finland (13) 62 81 89 139 Southern Bothnia (14) {* 89 94 131 Bothnia Swed. (15)
{* 64 70 111
Middle Bothnia (16 a) 65 83 94 | 125 Oulu (16 b) 73 96 94
| 125
Kajaani (17) 90 114 127 152 Lappi (18) 100 100 102 106
http://rcin.org.pl

Fig. 8. Limits of harvests yields of spring wheat, barley and oats sufficient to meet production costs in 1966 and 1974
http://rcin.org.pl

Fig. 9. Agricultural Centre districts and the provinces of Finland. The numbers of the centre districts are shown in the Table 2
http://rcin.org.pl
Limits of crop cultivation 233
fers in that although this area boasted, excluding Varsinais-Suomi and Aland, the most intensive application of fertilizers in the country in the 1950s, the rate of fertilization is now not so intensive as in Central Finland or even in Bothnia. Since deficient fertilization may result in poorer harvests, one may easily app-reciate that agriculture in North Finland has slipped into a downward spiral as a result of detrimental pricing policies, and it is this that has led to a noticeable decline in arable farming in the area in recent decades. It is similarly reflected in the limits of cultivation for the crops themselves, which have continued to move southwards (Fig. 8).
REFERENCES
Aario, L., 1966, Suomen maantiede, II edit., Helsinki. Hustich, I., 1950, Yields of cereals in Finland and the recent climatic fluctuation,
Fennia 73, 3. Hustich, I., 1952, Agricultural production in Finland and the recent climatic fluctu-
ation, Fennia 75. Keränen, J., 1931, Uber die Abhängigkeit der Ernteerträge von der Temperaturen
und Regenmengen während der Vegetationszeit in Finnland (Orig. Finnish), Acta Agraria Fennica 23, 1.
MKJ 518, Katetuottomenetelmän mukaisia mallilaskelmia. Maatalousseurojen kes-kusliiton julkaisuja 518.
MKL 1972, 1974, Katetuottomenetelmän mukaisia mallilaskelmia. Maatalouskeskusten Iii t to.
Rapeli, P., 1969, Ilmaston muutoksista Lapissa itsenäisyytemme aikana (On clima-tological changes in Lapland 1908-1967), Lapin tutkimusseura, Vuosikirja X-1969.
Turkka, A., 1972, Väkilannoitteiden käyttö ja satotaso maassamme, Karjatalous 2. Varjo, U., 1976, Arable farming in Finland: Types and economics, Nordia 1.
http://rcin.org.pl

http://rcin.org.pl

GEOGRAPHIA POLONICA 40, 1979
T W E L V E Y E A R S ' A C T I V I T Y O F T H E I G U C O M M I S S I O N O N A G R I C U L T U R A L T Y P O L O G Y
JERZY KOSTROWICKI
Institute or Geography and Spatial Organization Polish Academy of Sciences
The idea to organize the international cooperation in the field of agricultural classification arose from the vivid discussion held on the paper read by the present author in 1960 at one of the sectional meetings of the XIX Internatio-nal Geographical Congress (Kostrowicki 1960). One of the participants in the discussion was N. Helburn, who had just published an article on the bases of classification of world agriculture (Helburn 1957). The idea to organize the IGU Commission to deal with those matters sprouted the following year from a discussion with him during the present author's visit to Bozeman, Montana, USA. It was decided then that world geographers interested in agricultural problems should be consulted. Proposals contained in letters dispatched to them, as well as to the IGU National Committees found considerable support, and eventually caused that an official proposal was submitted by four National Committees (Australia, Belgium, Poland and the USA) to the IGU Executive Committee to establish the IGU Commission on Agricultural Typology. The problem was also thoroughly discussed and supported by the participants of the Symposium on Agricultural Geography held in Liverpool and Nottingham, Britain, in 1964, just before the XXth International Geographical Congress, following a paper by J. Kostrowicki (Simpson 1965). The same paper was also read at the meeting of the Economic Geography section of the Congress (Ko-strowicki 1964).
Because of confusion created by a simultaneous proposal to establish the commission on agricultural terminology the proposal was eventually approved by the General Assembly of the International Geographical Union by a slight majority of votes only.
The newly appointed regular members1 of the Commission met first in London just after the Congress closing session. The principal tasks of the Com-mission were then determined as follows: (1) to establish common principles, criteria, methods and techniques of agricultural typology; (2) to initiate, pro-mote and coordinate regional studies aimed at the identification of agricultural types of various order on the basis of criteria and methods recommended by the Commission; (3) to elaborate the typological and regional classification of world agriculture (Kostrowicki 1968b, 1970b).
To reach the first objective two questionnaires were successively distribu-ted among persons supposed to be interested in agricultural typology. The first questionnaire contained questions on the principles, basic concept and criteria;
1 For the list of the Commission regular and corresponding members in each of the four-year terms see the appendix.
http://rcin.org.pl

236 J. Kostrowicki
the second on the methods and techniques of agricultural typology. Over fifty individual answers were received, as well as two summarized reports of discus-sions held at special meetings organized in France and the Soviet Union.
The answers to the questionnaires brought rich and interesting material, a wealth of stimulating ideas, remarks and criticisms. Some of the answers gave so comprehensive and elaborate analyses of the problems concerned that they alone could serve as a basis for discussion.
The answers to both questionnaires arranged and commented by the Com-mission chairman (Kostrowicki 1966a, Kostrowicki and Helburn 1967) were distributed among the correspondents and other interested persons. They also were used to draw preliminary conclusions as to the principles and methods of agricultural typology (Kostrowicki 1966; Kostrowicki and Helburn 1967).
The conclusions together with three following papers: (1) J. Kostrowicki (Poland). Geographical Typology of World Agriculture.
Principles and methods. (2) O. Ribeiro (Portugal). Consideraçoes em torno duma tipologia da paisa-
gem rural Americana. (3) J. W. Birch (Great Britain). Some properties of farming systems and their
relevance to economic development (in the absence of the author read only by title) served as a basis for discussion at the 2nd meeting of the Commission held in Mexico City, in August 1966 (Union ... 1966) during the IGU Latin American Regional Conference.
The discussion partly confirmed, partly questioned the presented concept. That eventually led to some new solutions.
The following program for the next two years was outlined in the resolu-tion (Kostrowicki 1968b, 1970b):
(1) topical studies on methodological problems of agricultural typology should be continued;
(2) as many as possible case studies of various scale and level, testing the proposed criteria, methods and techniques of agricultural typology, should be undertaken;
(3) the results of both kinds of studies should be presented to the 3rd mee-ting of the Commission in 1968.
According to that resolution a number of testing studies were undertaken and carried on in various countries. Some of them such as:
(1) J. Kostrowicki (Poland). Essai préliminaire de la typologie de l'agricultu-re polonaise,
(2) W. Stola (Poland). Procédé typologique de l'agriculture à l'example du bassin de Nida, Pologne méridionale,
(3) Z. Hoffmann (Czechoslovakia). Problems of geographical regionalization and typology of agriculture in Czechoslovakia,
(4) T. Iordanov (Bulgaria). Factors and criteria determining the zonal distri-bution of agriculture,
(5) I. VriSer (Yugoslavia). The systems of agrarian utilization of land in the Socialist Republic of Slovenia, were presented among other papers at the meeting of the Regional Subcom-mission for East Central Europe of the other IGU Commission, that on World Land Survey, held in October 1968 in Maribor, Yugoslavia (Vojvoda 1975). It was then decided to extend the scope of work in the subcommission to include agricultural typology. The subcommission was eventually dissolved in 1971.
Due to high travel costs and rather inconvenient period of time a number of studies completed between 1966 and 1968 could not be presented on the 3rd mee-
http://rcin.org.pl

IGU Commission 237
ting of the Commission held in New Delhi, India in December 1968, during the XXI International Geographical Congress. However, the following 22 papers were presented and discussed at four paper sessions, two of which were orga-nized jointly with the other IGU Commissions (Kostrowicki and Tyszkiewicz 1970a).
(1) C. W. Olmstead (USA). The phenomena, functioning units and systems of agriculture: a provisional model,
(2) J. Kostrowicki (Poland). Types of agriculture in Poland. A preliminary attempt at a typological classification,
(3) W. Biegajło (Poland). Types of agriculture in North Eastern Poland. Białystok Voivodship,
(4) W. Stola (Poland). Agricultural typology of a micro-region as exemplified by Ponidzie, Central Poland.
(The last two papers were presented as an exemplification of his paper on Poland by J. Kostrowicki),
(5) A. B. Tschudi (Norway). The problem of farm size as a critérium of iden-tifying types of agriculture,
(6) P. P. Courtenay (Australia). An approach to the definition of the plan-tation,
(7) F. Ueno (Japan). Agricultural combination types in Japan, (8) P. Flatrès (France). Les travaux de géographie rurale en France depuis
1964, (9) C. Vanzetti (Italy). Land use and types of farming, (10) G. Enyedi (Hungary). The land of Hungary and types of its utilization, (11) H. Ishida (Japan). A conceptual model of four types of world agriculture, (12) S. Bhatia (India—USA). A new approach to the study of changes in
cropland use: a case study of Uttar Pradesh, India, (13) J. Kostrowicki (Poland). Land use studies as a basis for agricultural ty-
pology of East-Central Europe, (14) G. Benneh (Ghana). The Huza strip pattern system of the Krobo in
Ghana. (15) Kardono Darmojuwono (Indonesia). Preliminary studies on agricultural
typology of Indonesia, (16) R. D. Hill (Singapore). Peasant systems of rice cultivation with some
Malaysian examples, (17) Chung-Myun Lee (S. Korea — Malaysia). Agricultural regions of South
Korea, (18) A. H. Kampp (Denmark). The time factor and the agricultural regions
of Denmark. (19) K. Ivanićka (Czechoslovakia). Sub-types of agriculture in the area of
Bratislava, Slovakia, (20) E. Ahmad (India). Spatial association between kharif and rabi crops, (21) J. Kostrowicki (Poland). Agricultural typology, agricultural regionali-
zation, agricultural development (Kostrowicki 1964). In the absence of their authors the following papers submitted to the Com-
mission meeting were read only by title: (22) A. N. Duckham (Great Britain). Farming systems of the world, (23) H. Shirahama (Japan). Geographical investigations of the characteristics
of Japanese agriculture from the point of view of typology. Some papers in agricultural typology and/or regionalization were also sub-
mitted to the sectional meetings: S. A. Agboola (Nigeria). Food crop regions in Lagos and Western Nigeria, J. W. Birch (Great Britain). Agricultural typology on a world scale,
http://rcin.org.pl

238 J. Kostrowicki
A. C. Mascarenhas (Tanzania). Modification of a plantation system in Tan-zania,
B. K. Roy (India). Regionalization of types of farming in India. K. V. Sundaram (India). Regionalization of agriculture in Madhya Pradesh. As the General Assembly of the IGU almost unanimously (all votes but one)
decided for the continuation of the Commission activity, the program for the next four years was discussed on the special session with the following points accepted:
(1) Topical studies on some as yet unsolved methodological problems should be continued. In particular the most suitable technique of grouping agricultu-ral units characterized by sets of indices representing various agricultural at-tributes should be selected and checked out. Then the method of measuring agricultural intensity should be elaborated for use in spatial studies. Units of measuring agricultural production should be agreed upon, and the method of defining specialization of agriculture established.
(2) Sample studies of various scale and order, testing the proposed criteria, methods and techniques of agricultural typology, should be continued and ex-tended over as many countries and regions as possible.
(3) Making use of the accumulated material the outline typology of world agriculture, based on the criteria and methods already adopted, should be ela-borated as a provisional framework for further regional studies. The outline ty-pology should be submitted to a broad discussion before acceptance.
(4) An instruction on the use of the criteria, methods and techniques of agricultural typology in the investigations of various scale and order should be worked out and submitted for discussion.
(5) On the basis of both the outline typology and instruction, regional stu-dies in agricultural typology should be initiated and carried out in individual countries and regions under the supper vision of the Commission. Those studies would eventually serve as a basis for the final multi-level world agricultural typology. Several regional subcommissions should be organized to proceed with those studies.
(6) Special attention should be paid to the practical applicability of typo-logical studies in general, and in programming agricultural development in particular. Therefore, it was deemed desirable to establish closer contacts with FAO.
The methodological problems and testing studies were widely discussed at the 4th meeting of the Commission held in September 1970 in Verona, Italy, organized by professor C. Vanzetti and his team. The discussion was based on the selected methodological material (Kostrowicki and Tyszkiewicz 1970b) prepared in advance. Over 60 persons from 18 countries participated. At the five paper sessions the following 25 papers were presented and discussed, the remaining 14 were in the absence of their authors distributed among the par-ticipants (Vanzetii 1972).
(1) F. Lechi (Italy). Farm and region in agricultural typology with particu-lar reference to the problems of agricultural economics,
(2) J. Birch (Great Britain). Farming systems as resource systems. (In the absence of the author read by R. J. C. Munton),
(3) R. D. Laird (USA). The impact of farm size and management upon pro-duction efficiency in Soviet and Eastern European agriculture,
(4) D. Christodoulou (FAO). Towards a typology of land tenure and land reform,
(5) I. Crkvencic, V. Klemenćić (Yugoslavia). The social-geographical factors
http://rcin.org.pl

IGU Commission 239
in forming the types of land utilization on some examples from the north-wes-tern part of Yugoslavia,
(6) H. Bowen-Jones (Great Britain). The measurement of land and labour productivity. Case study from the Middle East, ,
(7) S. Kawakatsu (FAO). Crop production index numbers and their additive explanatory components,
(8) H. J. C. Munton (Great Britain). Farm systems classification, a use of multivariate analysis,
(9) E. Coelho de Souza Keller (Brazil). Factor analysis in identifying types of agriculture in Parana,
(10) J. W. Aitchison (Great Britain). The farming systems of Wales, a study of spatial and economic variability,
(11) G. Benneh (Ghana). Types of traditional agriculture in Ghana, (12) H. F. Gregor (USA). Plantation farming on the subtropical margins —
a model farm approach, (13) H. Ishida (Japan). Peasant agriculture in India, (14) M. Ishii (Japan). Factors affecting the changing regional patterns of
Japanese agriculture, (15) S. Odingo (Kenya). Observations on typological problems in a changing
subsistence agriculture in Kenya, (16) J. Kostrowicki, R. Szczęsny (Poland). A new approach to the typology
of Polish agriculture, (17) J. Bonnamour (France). Typologie agraire en France, (18) W. Stola (Poland). La typologie agricole d'une mésoregion. Comparaison
des résultats obtenus par deux méthodes diverses, (19) I. Velcea (Romania). La régionalisation viticole de la Roumanie, (20) G. Brasseur (France). L'exploitation agricole dans les pays de savane
de l'Afrique de l'Ouest, (21) J. I. Romanowski (USA). The IGU agricultural typology: an application
to mid-western and north-western farm regions of the United States and re-commendations for further modifications,
(22) V. Varjo (Finland). Farming in Lapland, Finland and its devolopment after World War II,
(23) A. I. Soares Sorabia (Mexico). Preliminary study of the agricultural typology of the Mexican ejido,
(24) M. Aceves Garcia (Mexico). Preliminary study of the typology of the landed property with 5 or less hectares,
(25) V. Bonuzzi (Italy). Method changes in the classification of types of farming.
In the absence of their authors the following papers were distributed among the participants:
(26) A. N. Rakitnikov (USSR). Methods of typology of agriculture and their testing in the studies carried out,
(27) L. M. Zaltsman, S. I. Polovenko (USSR). Certain methodological aspects of the typology of agriculture,
(28) O. K. Zamkov, K. V. Zvorykin (USSR). Types of agriculture in their relation to the natural environment, with special reference to the Orel Province of the RSFSR,
(29) I. F. Mukomel, T. I. Kozachenko (USSR). Agricultural district division of the Ukrainian SSR — aims, criteria, results,
(30) J. T. Coppock (Great Britain). Types of farming in Britain, a research project. Summary,
http://rcin.org.pl
240 J. Kostrowicki
(31) J. D. Momsen (Canada). Classification of agriculture — a case study from the Caribbean,
(32) P. Scott (Australia). Types of agriculture in Australia, (33) J. A. Felizola Diniz, J. Olivio Ceron (Brazil). An experiment in using
formulas to determine orientation of agriculture in Brazil, (34) A. Olivio Ceron (Brazil). The classification of agricultural specialization, (35) M. Lutovac (Yugoslavia). Irrigation, nature de sol et culture des plantes
en Yougoslavie, (36) B. Floyd (Jamaica). Land development in Jamaica, (37) B. K. Roy (India). Determination of land use changes, arable land poten-
tials and land use development in West Bengal — an analytical investigation in agricultural typology.
(38) S. P. Garg (India). Agricultural patterns in the Bhabar Tract. Case stu-dies of villages Rahna and Lalwala Khalsa, District Saharanpur, U. P. India,
(39) Tran-dinh Gian (Rép. Dém. du Vietnam). Problèmes de spécialisation, de régionalisation et de typologie en République Démocratique du Vietnam.
In the discussion at the business meeting it was decided that the Commis-sion should first of all concentrate in the years 1970-1972 on the framework of world agriculture. The following program was accepted:
(1) selection and adoption of a limited set of indices, best expressing cri-teria which should be used in agricultural typology;
(2) elaboration of a preliminary scheme of world agricultural typology based on the adopted minimum list of indices; ,
(3) elaboration of a scheme for more detailed work on regional entities; (4) development of quantitative methods adopted for various needs of agri-
cultural typology; (5) continuation of regional studies to test the proposed criteria, methods and
techniques in various countries and regions; (6) pursuance of topical research on partial typologies, such as classifications
of land tenure systems, cropping systems, systems of livestock breeding, etc.; (7) application of typological methods and techniques for programming agri-
cultural development. The participants expressed also a wish that the contacts — already establis-
hed with the FAO, whose delegates for the first time were represented and actively participated in the Commission meeting — were intensified.
In accomplishment of this programme the questionnaire no. 3 with a list of selected variables representing most important characteristics of agricultu-re together with their world ranges and thresholds was distributed among the Commission regular and corresponding members as well as other interested people. 26 answers from 30 authors arrived. Most of the respondents simply un-derlined in the questionnaire the acceptable solutions; a number of them, however, added valuable comments to their answers. Moreover, conclusions from a discussion held on special meetings of the Soviet geographers and agri-cultural economists, in which 17 persons representing 11 universities and in-stitutes took part, was accepted as a joint reply. Valuable comments were also received from FAO.
Following all those answers the list of proposed variables was revised and the preliminary scheme of the typology of world agriculture was prepared on its basis.
The scheme was first presented for discussion (Kostrowicki 197 2d) at the Symposium on Agricultural Typology and Rural Settlements, held in August 1971 in Szeged and Pecs, Hungary, just after the IGU Regional European Con-ference. A number of other papers in agricultural typology were also read
http://rcin.org.pl
IGU Commission 241
(Krajko and others 1972) such as: (1) I. Berenyi (Hungary). Geographical typology of viticulture in South-
-Eastern Europe, , (2) B. Hofmeister (West Berlin). Four types of agriculture with the predo-
minant olive growing in Southern Spain, (3) G. Karouzis (Cyprus). Land tenure in Cyprus — a powerful typological
criterion, (4) M. Shafi (India). Measurement of agricultural productivity of the Great
Indian Plains, (5) I. Stefanescu (Romania). Geographical types of agriculture and their
evolution in the Roumanian Sub-Carpathians between Suçita and Buzau, with the following two read only by title:
(6) W. Biegajlo (Poland). Orientations de l'utilisation des terres arables. Étude comparative sur l'exemple de la Pologne, de la Tchécoslovaquie et de l'Hongrie,
(7) K. Rikkinen (Finland). Typology of farms in Central Finland. With the results of the discussion taken into account a preliminary scheme
of the typology of world agriculture was revised and sent in an abridged form to the Organizing Committee of the XXII International Geographical Congress to be held in Montreal, Canada in August 1972 (Kostrowicki 1972a), and in full to the organizers of the 5th Commission meeting (Kostrowicki 1973).
The 5th meeting of the Commission took place in Hamilton, Ontario, Canada in August 1972, organized by Professor L. G. Reeds, just before the Internatio-nal Congress. 38 persons participated plus 18 partial participants attending also the meetings of other Commissions. 22 papers were presented and discus-sed on five paper sessions (Reeds 1973):
(1) J. Kostrowicki (Poland). A preliminary attempt at the typology of world agriculture,
(2) H. F. Gregor (USA). Terminology in typology — the problem of planta-tion,
(3) V. Bonuzzi (Italy). Indices for agricultural typology, (4) J. Bonnamour (France). Typologie des systèmes d'exploitation en France.
Essai méthodologique, (5) J. Klatzmann (France). La typologie des regions agricoles françaises.
Problèmes méthodologiques, (6) C. Vanzetti (Italy). Land use and natural vegetation, (7) U. Varjo (Finland). Regional differentiation in the productivity of field
cultivation in Finland, (8) A. H. Kampp (Denmark). Tendencies in the development of Danish agri-
culture, (9) Chung-Myun Lee (USA). Some aspects of agricultural regionalization of
South Korea, (10) J. R. Anderson (USA). Towards a typology of agriculture in the Ameri-
can South, , (11) H. A. Wood (Canada). A classification of tropical agricultural land use
for development planning, (12) M. Sundstrom (Canada). Towards a planning-oriented agricultural typo-
logy for Niagara-on-the-Lake, Ontario, (13) J. Felizola Diniz (Brazil). Systems approach to a sugar cane type of
agriculture, (14) B. Hofmeister (West Berlin). Progress report on the preparation of
agricultural typology bibliography,
16 Geographia Polonica http://rcin.org.pl

242 J. Kostrowicki
(15) J. Henshall Momsen (Canada). A model for agricultural change in de-veloping areas,
(16) J. P. Saxena and B. P. Panda (India). Crop combination regions of the Chhatisgarh Basin (India),
(17) S. A. Agboola (Nigeria). Agricultural typology in Nigeria: Problems and prospects,
(18) R. S. Odingo (Kenya). Some typological considerations on Kenya's subsi-stence farming areas,
(19) A. Olivio Ceron (Brazil). Agricultural space and experience in classifica-tion,
(20) W. C. Found and C. D. Morley (Canada). Land-use classification in rural sections of Metropolitan regions,
(21) R. Ryerson (Canada). Aerial photographs: their application to the clas-sification and analysis of agricultural land use,
(22) Cheng-siang Chen (Hong Kong). Changes in the agricultural landscape in China,
Besides, in the absence of their authors, the following submitted papers were read by title:
(23) A. N. Duckham (Great Britain). The tropical agricultural spectrum, (24) B. K. Roy (India). A method to determine the misuse of land in some
selected villages of Ganga plain. A model in agricultural typology, (25) M. Soma (Japan). Changing Japanese agriculture. Special discussion was organized on the preliminary scheme of the typology
of world agriculture. Although a number of critical remarks and comments were offered a general consensus was reached as to the way how to elaborate and formulate the typology. At the same time the discussion revealed that after eight years of the Commission activity a group of people had already been formed thinking more or less in the same way and working along the same line.
The participants of the business meeting agreed that to complete its task the activity of the Commission should be extended for the next four years. They also agreed that during these years the activity of the Commission should concentrate on the identification and mapping of world types of agriculture.
The following program was adopted: (1) The preliminary scheme of the typology of world agriculture as presen-
ted by the Commission Chairman was accepted as a basis, subject to revision resulting from both the discussion and written statements sent to him, the revised scheme to be recommended as a framework for regional studies in agricultural typology;
(2) A map of world types of agriculture, based on this scheme, should be drawn and presented for discussion at the XXIII International Geographical Congress;
(3) In order to complete the map of world types of agriculture and to de-velop regional typologies of agriculture a number of regional sub-commissions should be organized;
(4) Investigations should be continued to work out more accurate methods and techniques which could be applied in detailed agricultural typologies;
(5) On the basis of the scheme of the typology of world agriculture and numerous experiences drawn from methodological and regional studies carried out by the Commission, guidelines on methods and techniques of agricultural typology should be produced to serve further regional studies;
(6) An annotated bibliography of agricultural typology publications should be prepared to facilitate further studies;
http://rcin.org.pl

IGU Commission 243
(7) Special attention should be given at this stage of the Commission acti-vity to the implementation of typological methods in programming or planning agricultural development.
Some most representative papers from the Hamilton meeting were also selected to be read at the business meeting of the Commission held in Montreal during the Congress.
Several other papers on agricultural typology were submitted to the sectio-nal meeting of the XXIIIth International Geographical Congress:
J. R. Anderson (USA). Possibilities for typological studies of American agriculture.
H. F. Gregor (USA). The quasi-plantation, a conceptual model. H. J. Nitz (GFR). Types of agricultural land. A. Pecora (Italy). Types of agriculture in Ecuador. A. N. Rakitnikov (USSR). Criteres et indices de la typologie de l'agriculture
mondiale. M. Shafi (India). Delimitation of food productivity regions in India. M. Rahman (Pakistan). Irrigation agriculture in Sind, Pakistan. U. Varjo (Finland). Calculation of gross margin in agriculture and the pro-
ductivity of arable farming, Finland. D. A. Innis (USA). The efficiency of tropical, small farm agricultural prac-
tices. The General Assembly of the IGU approved by a great majority of votes
(37 out of the total of 41) the extension of the Commission activity for the following four years.
The period of 1972 to 1974 was mostly used for both practical implementa-tion of the typological methods and further improvement of the preliminary scheme of world agriculture.
The possibility of the practical application of agricultural typology has already been outlined by the present author in his paper read at the joint me-eting of several IGU Commissions in New Delhi (Kostrowicki 1968a). The first attempts of practical implementation of typological methods in program-ming agricultural development were undertaken between 1970 and 1972. The Shell Company, whose representatives had attended the Verona conference in 1970, in 1971 organized in their experiment station in Borgo a Mozzano, Italy, a discussion on typological methods which could be applied in programming agricultural development. Several members of the Commission, including the present author, were invited to submit their views.
The same problem was discussed in 1971 in Rome at the meeting organized by FAO, of the group of experts on methodology of rural planning. Finally, within the research project 'Bases of Spatial Development of the Country', organized and coordinated by the Institute of Geography, Polish Academy of Sciences, an attempt was made to apply typological methods in forecasting and programming the transformation of spatial structure of Polish agriculture for the years 1970-1980-1990. The results of the study concerned were discussed with leading Polish agricultural economists and then presented for discussion in several national meetings as well as to the 4th French-Polish Seminar on the Modernization of Rural Areas, held in Poland in September 1973 (Kostro-wicki 1974a). The method used was also published elsewhere (Kostrowicki 1975a, 1975b, 1976a). Investigations of this problem are continued.
The sixth meeting of the Commission was held in September 1974 once more in Verona and Professor Carlo Vanzetti was again the host. Over 60 persons participated, 26 following papers were presented at the six half-day sessions:
16» http://rcin.org.pl

244 J. Kostrowicki
(1) P. Scott (Australia). The application of world agricultural typology in Australia,
(2) H. F. Gregor (USA). A typology of agriculture in Western United States in world perspective,
(3) M. Troughton (Canada). Approaches to an agricultural typology for Canada,
(4) A. B. Tschudi (Norway). Measuring productivity in types 23 and 24 of the scheme of world agricultural typology,
(5) C. Soto Mora and A. Soto Mora (Mexico). Agricultural typology in the Republic of Mexico. Fundamental characteristics,
(6) W. Tyszkiewicz (Poland). Types of agriculture in Poland as a sample of the typology of world agriculture.
(7) I. Velcea (Romania). Les types et regions agricoles de la Roumanie. (8) K. Bielecka, M. Paprzycki, Z. Piasecki (Poland). The evaluation of ap-
plicability of selected mathematical methods for the typology of agriculture, (9) Z. Piasecki (Poland). A proposal of a new identification-verification
method, (10) J. W. Aitchison (Great Britain). Cluster analysis, regionalization and
the agricultural enterprises of Wales, (11) O. Langtvet (Canada). The energy approach to the study of an agricul-
tural system. The method and its application to SE Norway, (12) F. Hung (Canada). General system of tea culture: an attempt at a dy-
namic study of the typology of tea culture, (13) J. Schultz (GFR). Land use map of Zambia. Classification and mapping
of basically traditional farming systems, (14) B. Belec (Yugoslavia). On the typology and regional spatial transforma-
tion of the viticultural country of the Socialist Republic of Slovenia, Yugoslavia, (15) M. Klemenćić (Yugoslavia). Types of social fallow in Slovenia, (16) J. Bonnamour (France). Méthode d'études du dynamisme des systèmes
d'exploitation, (17) J. Kostrowicki (Poland). An attempt to apply typological methods for
forecasting and/or programming changes in the spatial organization of agri-culture,
(18) R. M. Aceves Garcia (Mexico). The utilization of land in the national and regional planning.
(19) Chung-Myun Lee (USA). An application of ERTS-1 imagery to the mapping of world agriculture,
(20) M. Fuller (Canada). Toward a typology of part-time farming; a concep-tual framework and the case of the Val Nure, Italy,
(21) M. A. Guerrero Gonzales (Mexico). Carte de rendement de la culture à la pluie (temporaire) comme indicateur de la typologie agricole,
(22) A. A. Kampp (Denmark). Standardized land use maps, (23) A. R. Stobbs (Great Britain). The land use survey of Malawi, (24) Ch. Christians (Belgium). La typologie de l'agriculture en Belgique.
Méthodes, problèmes, résultats, (25) L. R. Singh (India). Agricultural typology in India. Methods and tech-
niques, (26) U. Varjo (Finland). Input-output relationship and the productivity of
agriculture; an example from Finnish Lapland. The following papers in the absence of their authors were read only by title:
(27) E. Ahmad (India). Changing landscape in north-western Bihar, (28) B. V. Andrianov (USSR). Problems of typology and mapping of tradi-
tional agriculture,
http://rcin.org.pl
IGU Commission 245
(29) A. M. Coleman (Great Britain). The typology of land use patterns, (30) J. Dongmo (Cameroun). Typologie de l'agriculture camerounaise, (31) A. Gil Crespo (Spain). Les transformations agraires et agricoles du
plateau du Duero (1953-1973), (32) B. K. Roy (India). Economie levels of broad agricultural typological
regions in India, (33) I. Kamosawa (Japan). Rural settlement in Sawauchi-Mura, (34) V. M. Zhukovskaya, V. G. Kryuchkov, I. M. Kuzina (USSR). Application
of factor analysis and patterns recognition methods for agricultural typology. The first business meeting of the new established IGU Working Group on
Rural Planning and Development took also place during the meeting of the Commission.
The resolution adopted required that the last two years of the Commission activity were devoted especially to the compilation of maps of agricultural types for individual countries. First cartographic solutions of the map of world types of agriculture were to be discussed at the next, i.e. the 7th meeting of the Commission to be held in France in the Fall of 1975, and the method of cartographic presentation was to be determined there. Instructions for more detailed typological studies within individual countries ought also be elaborated. Finally, the bibliography of world literature on agricultural typology which had already been started was to be completed.
As it was already felt that some of the tasks of the Commission could not be realized before 1976, the discussion included also future prospects of their completion (Kostrowicki 1975c).
The second, improved version of the typology of world agriculture appeared a few weeks after the Verona meeting (Kostrowicki 1974b). The discussion of that version, based on a present author's paper (Kostrowicki, in press), was organised on the 7th meeting of the Commission on Agricultural Typology, held jointly with the IGU Working Group on Rural Planning and Development in Fontenay-aux-Roses, France in September 1975. Professor Jacqueline Bon-namour was its chief organizer. Over 60 persons, representing 19 countries, participated. Out of 32 papers presented there the following 15 were on agricultural typology:
(1) P. Scott (Australia). The typology of Australian agriculture, (2) J. W. Aitchison (Great Britain). Gower's general coefficient of similarity
and the problem of case identification in agricultural typology, (3) M. J. Troughton (Canada). Canadian agricultural typology and IGU
world model, (4) W. Tyszkiewicz (Poland). Types of agriculture in Macedonia. A sample
study on the typology of world agriculture, (5) B. Belec (Yugoslavia). An attempt at a complex viticultural typology
in the Socialist Republic of Slovenia, (6) W. Stola (Poland). Etudes typologiques comparatives sur l'exemple de
l'agriculture belge et polonaise, (7) A. B. Tschudi (Norway). Norwegian farming identified by adapting the
typogram method. Notes on the problem of establishing specialization, (8) S. Christiansen (Denmark). On terminology for high-order classes in
agricultural typology, (9) K. Rikkinen (Finland). Mapping of types of world agriculture in Fin-
land. (10) Z. Piasecki (Poland). A typology of Poland's agriculture. A study of
application of the 'IDVER' method,
http://rcin.org.pl

246 J. Kostrowicki
(11) J. Guermond (France). Les types d'exploitations agricoles en Normandie, (12) J. Bonnamour (France). Application des normes de la typologie inter-
nationale à l'exemple français, (13) J. Kostrowicki (Poland). The scheme of world types of agriculture.
Some weak points and possible improvements, (14) G. Brasseur (France). L'exploitation agricole en Guyane française (15) J. Hall (Canada). Agricultural productivity and land use planning.
Menonite agriculture in the tropical environment of Belize. The proceedings of the meeting entitled Agricultural Typology and F.ural
Development are in print under the editorship of J. Bonnamour. The resolution adopted emphasized that the first objective was to complete
work carried out by the Commission. Although the revised typology of vorld agriculture, published in 1974, was a considerable improvement of the first typology prepared in 1972, there still remained scope for further improvenent. The next, improved version of the world typology, in which the discussion and further comments were taken into account, should therefore be published as soon as possible. It was further recommended that in 1976 work should con-centrate on its application and the mapping of world agricultural types. But after July 1976, when the Commission ends its activity, there would renain further work to be done on both the methodology and on the mapping of vorld types of agriculture. Such activities should be incorporated in other IGU programs of rural studies. Two possibilities were discussed. The first one was: to include those tasks in the program of the Working Group on Rural Plan-ning and Development, which ought to be converted into a full-fledged :om-mission. The second one was: to include them in the program of the new Com-mission on World Food Problems, the establishment of which had already been proposed by several IGU National Committees and supported by a nunber of other.
Following that resolution the final version of the typology of agricuture was published in February 1976 (Kostrowicki 1976c).
The 8th and last meeting of the Commission was organized jointly witl the IGU Working Group on Rural Planning and Development. The progran of the meeting was prepared by Prof. A. N. Rakitnikov and Dr. Y. M. Kizina from the Moscow University. The local organizers included the representaives of the Odessa University. 75 persons from 17 countries participated; out o the total of 69 papers submitted and presented,2 32 submitted and 25 presented were concerned with agricultural typology.
Just after the opening ceremony a paper on Agriculture in the Odessc ad-ministrative Region, present state, problems, and projected development was read by V. A. Kovalenko, vice-chairman of the Odessa Regional Council o the Deputies of the Working People. Subsequently, the Chairman of the Commis-sion outlined the most important features of the final version of the typdogy in his paper (1) entitled Types of World agriculture (Kostrowicki 1976c); The following papers on agricultural typology were presented at the four sessiois:
(2) N. P. Isayenko (USSR). Classification of production types of agriculural enterprises in the USSR,
2 The summaries of most of submitted papers (short papers) were publishtd in English or French (Rakitnikov 1976a) or in Russian (Rakitnikov 1976b). The Russian version contains also papers on rural planning and development, and a summay of the last version of the typology of world agriculture. The English summaries of most papers on rural development were published in Hungary (see G. Enyedi, ed., Airar-ian-industrial complexes in the modern agriculture, Budapest 1976).
http://rcin.org.pl

IGU Commission 247
(3) M. J. Troughton (Canada). Application of the revised scheme for the typology of world agriculture to Canada,
(4) Y. M. Kuzina and L. F. Yanvaryova (USSR). The world types of agri-culture map for higher schools,
(5) A. A. Nikonov (USSR). Evolution of agricultural enterprises under mo-dern conditions,
(6) B. V. Andrianov (USSR). African traditional economic-cultural types and problems of typology of world agriculture,
(7) J. Bonnamour (France). Application des normes proposées par J. Kostro-wicki à l'agriculture française,
(8) V. R. Singh (India). Agricultural typology of India, (9) T. A. Solovtsova (USSR). Cartographic methods of identification of
production types in agriculture, (10) U. Varjo (Finland). Productivity and fluctuating limits of crop culti-
vation in Finland, (11) V. A. Smirnova (USSR). Estimation of natural factors in evaluating
a forecast of the development and distribution of agricultural production, (12) A. E. Osetrov and S. G. Pokrovsky (USSR). The influence of quality of
arable lands and geographical location of farms on certain aspects of agricul-ture,
(13) L. M. Zaltsman and S. L. Polovenko (USSR). Natural thanges in the concentration, cooperation and typology of agriculture in the USSR,
(14) W. Tyszkiewicz (Poland). Agricultural typology of the Thracian Basin, Bulgaria, as a case of the typology of world agriculture,
(15) I. F. Mukomel, K. E. Povitchannaya, K. E. Stetsenko (USSR). Produc-tion types of farms and agricultural zoning in the Odessa region,
(16) A. N. Rakitnikov (USSR). Développement des études typologiques de l'économie rurale et planification de la production agricole,
(17) R. K. Voon (Malaysia). Crop combination regions in the Peninsular Malaysia,
(18) N. I. Jouravskaia (USSR). Types des regions agricoles de la RSS de Biélorussie,
(19) R. M. Aceves Garcia (Mexico). Determination of changes in the use of soils. Quantitative study of types of agriculture in the State of Morelos, Mexico,
(20) S. Christiansen (Denmark). Potential of plant raising production, (21) L. S. Dimitrieva, A. V. Suchkova and A. V. Shvebs (USSR). Odessa re-
gion agriculture-climatic resources, (22) A. Y. Parfenova (USSR). Types of agricultural regions in the arid-step-
pe and semi-desert zones (Uralsk province), (23) R. A. Kasmasov (USSR). Travaux complexes d'aménagement des ter-
ritoires nouvellement irrigués et d'organisation des Sovkhozes du Kazakhstan, (24) K. Bielecka and M. Paprzycki (Poland). Texonomic methods in agri-
cultural typology. Evaluation based on comparability in space and time, (25) A. E. Bereznoy (USSR). The geographical concentration of agriculture
in the Krasnoyarsk territory. Besides the mentioned above the following papers were submitted by the
authors and published as short papers (A. N. Rakitnikov ... 1976c): (26) V. A. Pulyarkin (USSR). Typological study of agriculture in develop-
ing countries, (27) J. Singh (India). A new technique of delimiting agricultural production
typology in subsistence farm economy, (28) V. G. Kryuchkov (USSR). Types of agricultural regions in West Siberia
and North Kazakhstan,
http://rcin.org.pl

248 J. Kostrowicki
(29) K. P. Kosmachov and G. P. Petrova (USSR). An analysis of trends in the development of territorial systems of agricultural regions,
(30) E. V. Mironova (USSR). Modern tendencies of development of agricul-tural regions of England and Wales,
(31) V. Singh and J. Panday (India). Land use pattern in Seryupar plain (India); an analytical investigation in agricultural typology,
(32) A. K. Ilyichev (USSR). Zonal farming systems in the USSR: improved methods for their development,
(33) J. P. Saxena and S. N. Mehrotra (India). Regional imbalances in the agricultural development of Madhya Pradesh, India,
(34) R. Szczęsny (Poland). Shifts in the territorial distribution of types of agriculture in Poland 1960-1970.
In the resolution accepted, besides a brief characterization of the meeting, it was pointed out that although the Commission has accomplished a great deal, including an agreement upon a scheme for the world agricultural typological representation, certain tasks remained unfinished, for example the "actual preparation of a world map of agricultural types, including further work on the hierarchy of units and decisions on the scale and format of the mapping. There are directions which have received considerable attention within the Commission and which, it is hoped, will continue to provide a fruitful basis for research and discussion (...) It is resolved that, arising from the work of the Commission on Agricultural Typology and the Working Group on Rural Planning and Development, the successor Commissions be established to con-tinue and enlarge the work..." Moreover, the resolution explained that: ... "Publications of the proceedings of the Symposium will be in two parts, as follows: 1. the typological papers will be published in Poland under the direction of Prof. Kostrowicki, 2. the rural development papers will be publis-hed in the German Democratic Republic (GDR) by Prof. Roubitschek, aided by Prof. Enyedi".
"The Symposium noted with regret the absence of some members who in the past have made valuable contributions. It is particularly regretted that the representative of FAO was absent, but it is hoped that cooperation between FAO and the IGU Commissions dealing with agriculture and rural develop-ment, so useful in the past, will be resumed at future meetings."
Some papers concerning agricultural typology were also submitted or pre-sented to the sectional meeting on general economic geography, subsection agricultural geography, during the XXIII International Geographical Congress (Gerasimov 1976);
0 . K. Zamkov and A. N. Rakitnikov (USSR). Le milieu naturel des types d'exploitations agricoles,
S. Monti and D. Ruocco (Italy). L'appréciation de l'application de la typologie agricole, proposée par La Commission de L'UGI à l'agriculture méridionale,
T. Iordanov (Bulgaria). Critères permettants de déterminer la zonalité de l'agriculture en vue de sa planification,
N. Hanzlikova (Czechoslovakia). Application of multifactor analyses in geo-graphical research of agriculture,
1. Iordan and I. Ianos (Romania). An outline of the geographical types of Romanian agriculture by the typogram method,
B. Belec (Yugoslavia). Types of viticultural regions in the Socialist Republic of Slovenia (Yugoslavia),
F. Zigrai (Czechoslovakia). Regionalization of the land use as a part of the territorial planning on the example of the Liptov Basin.
http://rcin.org.pl

IGU Commission 249
The principles of the typology of world agriculture were also presented by the Commission chairman to the section on General Problems of Economic Geography (Gerasimov 1976, sec. 6).
Another paper (Kostrowicki 1976a) was read by the author at the General Symposium 2, Scientific Recommendations for Regional Development and Rational Location of Economic Activities.
Complying with the resolutions of the 6th, 7th and 8th meetings of the Commission on Agricultural Typology held together with the 1st and 2nd meetings of the Working Group on Rural Planning and Development, the General Assembly of the International Geographical Union decided to convert the Working Group into the Commission on Rural Development, under the chairmanship of Prof. G. Enyedi and to establish a new IGU Commission on Agricultural Productivity and World Food Supplies with Prof. J. Kostrowicki in the chair.
Summarizing the twelve years of the activity of the IGU Commission on Agricultural Typology, the following balance-sheet can be presented.
(1) First of all the Commission succeeded in drawing attention to and in initiating and promoting the discussion on theoretical problems, criteria, met-hods and techniques of agricultural classification.
(2) Following those discussions, the common principles, criteria, methods and techniques of agricultural typology were proposed and tested in a number of case-studies carried out in various countries and regions.
(3) A scheme of world types of agriculture was elaborated, discussed, tested and finally accepted by the Commission to serve as a framework for more detailed regional studies.
(4) A number of regional studies aimed at the identification of agricultural types on a national or regional scale were initiated, promoted and carried out.
(5) Some dynamic studies of changes in the agricultural types were also initiated and carried on in certain territories.
(6) An attempt was made to apply typological methods for forecasting, programming or planning further changes in the spatial organization of agri-culture.
These and other achievements were due mostly to the close co-operation of a considerable number of excellent research workers of different backgrounds, generations and countries. Although geographers clearly predominated, it was a success of the Commission to attract several outstanding agricultural econo-mists, ethnologists, sociologists, planners, etc.
The list of the Commission regular and corresponding members (see the Appendix) contains 137 names. As there was a custom to appoint the corres-ponding members at the end of each term, on the basis of their contribution, there is no figure-heads among them, but the people who really contributed to the Commission activities, either by answering the Commission question-naires, or by offering papers to the Commission meetings, or by any other way. In fact there were much more people that took part in the Commission meet-ings either as participants or debaters. Their number cannot be even estimated as some meetings of the Commission were organized during the larger con-gresses or conferences, where anybody could enter or leave freely any of the meetings held by the Commission.
Although the number of the Commission corresponding members changed from term to term, there were some who cooperated during the whole period of its activity. Their names should be mentioned here. First of all, this is Professor A. N. Rakitnikov, the only regular member of the Commission who served as such during the entire twelve years, always actively involved, in
17 Geographia Polonica http://rcin.org.pl
250 J. Kostrowicki
spite of the fact that he was never able to attend the meetings except the last one, of which he was a host and chief organizer. Moreover, there are two other persons who also served the Commission all the time, either as corresponding or regular members; namely Mme Jacqueline Bonnamour and Peter Scott. Finally one should mention as the most faithful among the corresponding members who directly or undirectly served the Commission from its start to the end, the following persons: G. Enyedi, H. P. Gregor, A. H. Kampp, E. Molnar, L. G. Reeds, H. Shirahama, J. E. Spencer, A. B. Tschudi, C. Vanzetti and U. Varjo as well as the late Professors I. F. Mukomel and W. Van Royen who, to our sorrow, unexpectedly and unwillingly had to leave the Commission before its end. Special mention should be made of Professor Carlo Vanzetti, who very successfully organized two meetings of the Commission and edited two big volumes of their proceedings. All of them deserve sincere words of grati-tude. Thanks are also due to all other people who in one or another way contri-buted to carry into effect the Commission tasks.
The Commission members represented 45 countries of six continents. Over 80 people from over 30 countries took part in the discussion on the
concept and method of agricultural typology, they answered the Commission questionnaires, often in a very extensive and profound way. Over 125 papers were presented for discussion on its meetings plus about 40 additional ones read only by title, prepared by the representatives of more than 30 countries; papers on agricultural typology submitted to other meetings within the IGU are not included.
The five volumes of the proceedings of the Commission meetings (Kostro-wicki and Tyszkiewicz 1970b, Vanzetti 1972, Reeds 1973, Vanzetti 1975, Bon-namour — in print) together with the present one, will contain altogether over 150 papers and over 10 other items. Several other studies were also published by the Commission (see references). Finally, a great number of studies on agricultural typology were published during the last twelve years elsewhere; whether elaborated within, inspired, or provoked by the activity of the Commission.
An important factor contributing to the success of the Commission was its cooperation with FAO. Started as early as in 1965, the contacts at first were limited to those with some FAO experts. After some years the liaison officers between FAO and the Commission were appointed, and they put at the service of the Commission their experience by replying its questionnaires, taking part in its meetings, etc. When the liaison status with FAO was granted to the International Geographical Union in 1970 the contacts became more frequent and systematic. The representatives of the Commission were invited to attend various meetings organized by FAO, and vice versa the participance of the FAO representatives at the Commission meetings became a normal practice. Slowly FAO became interested not only in the activities of the Commission on Agricultural Typology but also in the future activities of the International Geographical Union in the realm of rural, agricultural and food problems. From that cooperation a new working group on rural planning and develop-ment emerged in 1972, which was eventually converted into a full-fledged Commision in 1976. Following suggestions of FAO another IGU Commission on agricultural production and world food supplies was also established.
Those are its assets, the Commission has however also some liabilities. (1) First of all, because of delay in the elaboration of the final version of
the typology of world agriculture, work on the mapping of world types of agriculture has not passed beyond its initial stage. Though the typologies for such large countries as the USSR, Canada, Australia and India as well as for
http://rcin.org.pl

IGU Commission 251
several European countries form a sound starting point for such a map, its cartographic image is limited to the proposed legend and only a few maps testing its application.
(2) In consequence regional subcommissions which had to organize and supervise the mapping of agricultural types for individual world regions have never been called into being. ,
(3) Work on methodological guidelines for agricultural typology designed to serve more detailed studies has not been started.
(4) Although work on annotated bibliography on agricultural typology has been advanced, it could not been completed because of gaps resulting from failures in the delivery by some countries of respective material to its editor Prof. B. Hofmeister.
Those liabilities resulted mainly from: (1) the inability of the Commission to organize necessary discussions more
often than once in two years. More frequent discussion would certainly precipi-tate the elaboration of both the general concept and method of agricultural typology and the scheme of world types of agriculture, the method of mapping and the mapping itself, as well as the preparation of the guidelines. Those tasks proved to be impossible both because of very limited allowances that the International Geographical Union was able to grant to the Commission and because the Commission failed in getting additional means from other sources;
(2) the inability of the Commission Chairman, particularly after 1972 when he was unexpectedly burdened by a heavy load of administrative duties in his own country, to cope rapidly enough with synthetizing a great amount of material provided by the studies initiated by the Commission, or generated elsewhere, that could serve as a basis for the typology of world agriculture.
The Commission ended its activity in July 1976. It is hoped that its uncom-pleted tasks will be continued within one or another of the new commissions. In any case its work has to be completed.
REFERENCES
Adams, W. P., Helleiner, F. M. (eds.), 1972, International Geography, Papers submit-ted to the 22nd International Geographical Congress, Canada, Montreal v. 2, pp. 695-788 and 1087-1114.
Bonnamour, J. (ed.) (in press), Agricultural typology and rural development, Paris. Gerasimov, I. P. (ed.), 1976, International Geography, Papers submitted to the XXIII
International Geographical Congress, Sections 6, 8, 12, Moskva. Helburn, N., 1957, The bases for a classification of world agriculture, The Profes-
sional Geographer, 9, 2, pp. 2-7. Kostrowicki, J., 1960, Land utilization survey as a basis for geographical typology
of agriculture, Przegl. Geogr., 32, Supplement, pp. 169-183. Kostrowicki, J., 1964, Geographical typology of agriculture. Principles and methods.
An invitation to discussion, Geogr. Pol. 2, pp. 159-167. Kostrowicki, J., 1966a, Principles, basic notions and criteria of agricultural typology.
Conclusions from the answers to the Commission's Questionnaire No. 1, Warsaw, 38 p. (mimeographed).
Kostrowicki, J., 1966b, Tipologia geográfica de la agricultura mundial. Principos y métodos, Union Geográfica Internacional, Conferencia Regional Latino-Ameri-cana, Mexico D. F., v. 2, pp. 793-807.
Kostrowicki, J., 1968a, Agricultural typology, agricultural regionalization, agricultural development, Geogr. Pol. 14, pp. 265-274.
17* http://rcin.org.pl

252 J. Kostrowicki
Kostrowicki, J., 1968b, Commission on Agricultural Typology, The IGU Newsletter 19, 2, pp. 60-62.
Kostrowicki, J., 1969, Commission on Agricultural Typology, IGU Bulletin de l'UGI, 20, 2, pp. 36^0.
Kostrowicki, J., 1970a, (Commission on) Agricultural Typology, IGU Bulletin de l'UGI, 21, pp. 69-70.
Kostrowicki, J., 1970b, Agricultural typology. Summary of the activities of the IGU Commission for the years 1964-1968, Geogr. Pol. 19, pp. 11-29.
Kostrowicki, J., 1970c, Third Conference on land use held by the East-Central Euro-pean Geographers, Maribor, Yugoslavia, October 7-11, 1969, IGU Bulletin de l'UGI, 21, 1, pp. 48-52.
Kostrowicki, J., 1971, Commission on Agricultural Typology, IGU Bulletin de l'UGI, 22, 1, pp. 16-21.
Kostrowicki, J., 1972a, A preliminary attempt at a typology of world agriculture, (in) W. P. Adams, F. M. Helleiner (eds.), International Geography 1972, v. 2, Montreal pp. 1097-1100.
Kostrowicki, J., 1972b, Commission on Agricultural Typology, IGU Bulletin de l'UGI, 23, 1, pp. 55-59.
Kostrowicki, J., 1972c, Report of the Agricultural Typology Commission for the period 1960-71, Hamilton, Ontario, 8 p. (mimographed).
Kostrowicki, J., 1972d, The methodological bases for the typology of world agri-culture, (in) G. Krajko, I. Penses, J. Toth (eds.), Symposium of agricultural ty-pology and agricultural settlements, Szeged-Pécs 1971, Szeged, pp. 141-173.
Kostrowicki, J., 1973, The typology of world agriculture. A preliminary scheme, (in) L. G. Reeds (ed.), Agricultural typology and land use, Hamilton, Ontario, pp. 2-52.
Kostrowicki, J., 1974a, Les transformations dans la repartition spatiale des types d'agriculture en Pologne et essai du pronostic de l'évolution ultérieure, Geogr. Pol. 29, pp. 331-342.
Kostrowicki, J., 1974b, The typology of world agriculture. Principles, methods and model types, Warsaw, 74 p. + tables (mimographed).
Kostrowicki, J., 1975a,'An attempt at the determination of transformation trends on the spatial organization of agriculture in Poland between 1960 and 1990, Geogr. Pol. 32, pp. 27-42.
Kostrowicki, J., 1975b, The IGU Commission on Agricultural Typology, Report for the years 1972-1974 and the assessment of future prospects, (in) C. Vanzetti (ed.), Agricultural Typology and Land Utilization, Verona, pp. 401^186.
Kostrowicki, J., 1975c, An attempt to apply typological methods for forecasting and/ /or programming further changes in the spatial organization of agriculture, (in) C. Vanzetti (ed.), Agricultural Typology and Land Utilization, Verona, pp. 239--252.
Kostrowicki, J., 1975d, Commission on Agricultural Typology, IGU Bulletin de l'UGI, 26, 1-2, pp. 35-37.
Kostrowicki, J., 1976a, Agricultural typology as a tool in planning spatial organiza-tion of agriculture, Geoforum, 7, 3, pp. 241-250.
Kostrowicki, J., 1976b, Commission on agricultural typology 1972-1976, IGU Bul-letin de l'UGI, 27, 1, pp. 55-59.
Kostrowicki, J., 1976c, World types of agriculture, Warsaw, 49 pp. + tables (mimo-graphed).
Kostrowicki, J., 1977, Agricultural typology. Concept and method, Agricultural Sys-tems, 2, pp. 33-45.
Kostrowicki, J., (in press) The scheme of world types of agriculture. Some weak points and possible improvements, in: Agricultural typology and rural develop-ment, Fontenay-aux-Roses.
http://rcin.org.pl

IGU Commission 253
Kostrowicki, J., Helburn, N., 1967, Agricultural typology, principles and methods. Preliminary conclusions, Boulder, Colorado, pp. 27 + 12 p. (mimographed).
Kostrowicki, J., Tyszkiewicz, W., (eds.), 1970a, Agricultural typology. Selected metho-dological materials, Dokumentacja Geograficzna 1, 60 p.
Kostrowicki, J., Tyszkiewicz, W., (eds.), 1970b, Essays on Agricultural Typology and Land Utilization. Proceedings of the Third Meeting of the Commission on Agri-cultural Typology, Geogr. Pol. 19, 290 p.
Krajko, G., Pénzes, I., Tóth, J., (eds.), 1972, Agricultural typology and agricultural settlements, Papers of Symposium held in Szeged and Pécs (15-19 August 1971), Szeged, 415 p.
Rakitnikov, A. N., Kuzina, I. M., and Pyzhov, V. G., (eds.), 1976a, The problem of agricultural typology. Commission on Agricultural Typology, XXIII International Geographical Congress (Odessa), 138 p.
Rakitnikov, A. N., Kuzina, I. M., and Pyzhov, V. G., (eds.), 1976b, Probierni tipologii selskogo khozyaystva (The problems of agricultural typology), XXIII Mezhdu-narodniy Geograficheskiy Kongress (Odessa), 219 p.
Reeds, L. G., (ed.), 1973, Agricultural typology and land use. Proceedings of the Agricultural Typology Commission Meeting, Hamilton, Ontario, 350 p., McMaster University.
Simpson, E. S., (ed.), 1965, Agricultural geography, IGU Symposium, Liverpool, pp. 59-74, Dept. of Geography, Research Paper No. 3.
Union Geografica International, Conferencia Regional Latino-Americana, 1966, Mex-ico D. F., v. 2, pp. 793-819.
Vanzetti, C., (ed.), 1972, Agricultural typology and land utilization, Verona 1972, 448 p.
Vanzetti, C., (ed.), 1975, Agricultural typology and land utilization, Verona 1975, 498 p.
Vojvoda, M., (ed.), 1975, Land utilization in East-Central European countries, Con-ference of sub-committee of land utilization in East-Central European countries, Maribor, October 7th to 11th 1969, Geographia Slovenica 4, 126 p.
http://rcin.org.pl

http://rcin.org.pl
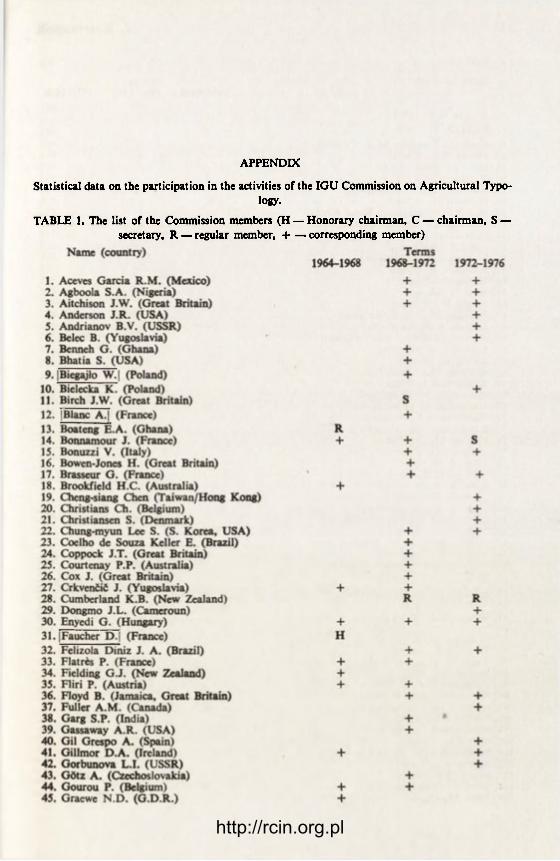
APPENDIX
Statistical data on the participation in the activities of the IGU Commission on Agricultural Typo-logy.
TABLE 1. The list of the Commission members (H — Honorary chairman, C — chairman, S — secretary, R — regular member, + — corresponding member)
http://rcin.org.pl

256 J. Kostrowicki
http://rcin.org.pl

IGU Commission 257
http://rcin.org.pl

258 J. Kostrowicki
TABLE 2. Number of the Commission members by countries and by terms 1964-1968 1968-1972 1972-1976
Austria 1 1 Belgium 1 1 1 Bulgaria — 1 —
Czechoslovakia 1 5 1 Denmark 1 1 2 Finland 1 3 2 France H + 4 4 S + 4 G.D.R. 1 1 —
G.F.R. 1 — 2 Great Britain 2 S + 6 3 Hungary 1 1 1 Ireland 1 — 1 Italy 2 4 4 Netherlands 1 — —
Norway 1 1 1 Poland C C + 4 C + 4 Rumania 2 2 2 Spain — 1 1 West Berlin — 1 1 USSR R + 2 R + 4 R + 9 Yugoslavia 2 3 2 EUROPE 18/28 17/46 17/44 Cameroun — — 1 Ghana R 1 —
Kenya — 1 R Nigeria — 1 1 AFRICA 1/1 3/3 3/3 Argentina 1 — —
Brazil — 3 2 Canada 1 2 8 Cuba 1 — —
Jamaica — 1 —
Mexico — 2 3 USA S + 5 R + 8 5 AMERICA 4/9 5/17 4/18 Cyprus — — 1 Hong Kong — — 2 India 1 R + 3 2 Indonesia — 1 —
Israel 1 — —
Japan R + l 5 3 Malaysia — — 1 Philippines 1 — —
Singapore — 1 —
South Korea — 1 —
Vietnam D.R. — 1 —
ASIA 4/5 6/13 5/13 Australia R + l 2 1 New Zealand 1 R R AUSTRALIA and OCEANIA 2/3 2/3 2/2
Total 29/46 33/82 31/80
http://rcin.org.pl

IGU Commission 259
TABLE 3. Total Number of the Commission regular and corresponding members by countries
Austria 1 Argentina 1 Belgium 2 Brazil 3 Bulgaria 1 Canada 8 Czechoslovakia 6 Cuba 1 Denmark 2 Jamaica 1/2 Finland 3 Mexico 4 France 10 USA 13 1/2 G.D.R. 2 AMERICA 7 31 G.F.R. 3 AMERICA 7
Great Britain 7 1/2 Cyprus 1 Hungary 1 Hong Kong 1 1/2 Ireland 1 India 9 Italy 5 Indonesia 1 Netherlands 1 Israel 1 Norway 1 Japan 5 Poland 6 Malaysia 1 Rumania 3 Philippines 1 Spain 2 South Korea 1/2 USSR 10 Singapore 1/2 West Berlin 1 Vietnam 1 Yugoslavia 5
ASIA 11 221/2 EUROPE 21 73 1/2
ASIA 11 221/2
Cameroun 1 Australia 3 Cameroun 1 N. Zealand 2 Ghana 2 N. Zealand
Kenya 1 AUSTRALIA and OCEANIA 2 5 Nigeria 1
Total 45 137 AFRICA 4 5
TABLE 4. Number of the replies to Austria 2 Belgium 2 Czechoslovakia 3 Denmark 3 Finland 2 France 5 G.D.R. 1 G.F.R. 1 Great Britain 5 Hungary 1 Ireland 1 Italy 2 Netherlands 1 Norway 2 Poland 1 Rumania 4 USSR 7 West Berlin 3 Yugoslavia 2 EUROPE 19 47
Argentina 1 Brasil 1 Canada 3 Cuba 1 USA 10 AMERICA 5 16
Commission questionnaires by countries Hong Kong 1 India 4 Israel 2 Japan 1 Philippines 1 Singapore ASIA 6 11
Australia 1 N.Zealand AUSTRALIA and OCEANIA 2 3 FAO 2
Total 32 78
plus joint French and Soviet replies
http://rcin.org.pl

260 J. Kostrowicki
TABLE 5. Number of papers submitted to the Commission meetings by countries Belgium 1 Czechoslovakia 1 Denmark 5 Finland 5 France 9 G.F.R. 1 Great Britain 11 Hungary 1 Italy 5 Poland 20 Rumania 2 Spain 1 USSR 26 West Berlin 1 Yugoslavia 5 EUROPE 16 97
Cameroun 1 Ghana 2 Kenya 2 Nigeria 1 AFRICA 4 6
Brasil 4 Canada 13 Jamaica 1 Mexico 6 USA 9 AMERICA 5 33
Hong Kong 1 India 12 Indonesia 1 Japan 7 Malaysia 1 Singapore 1 Vietnam D.R. 1 ASIA 7 24 Australia 4 AUSTRALIA and OCEANIA 1/4 FAO 2
Total 33 166
http://rcin.org.pl

CONTENTS OF VOLUMES
http://rcin.org.pl

Subscription orders for the GEOGRAPHIA POLONICA should be placed with FOREIGN TRADE ENTERPRISE ARS POLONA —RUCH
Warszawa, Krakowskie Przedmieście 7, Poland Cables, ARSPOLONA, Warszawa
http://rcin.org.pl

http://rcin.org.pl

http://rcin.org.pl


![Vocabulos indigenas na geographia riograndense [J-Y]](https://static.fdokumen.com/doc/165x107/633af5539a9d0b87cc0c7b0c/vocabulos-indigenas-na-geographia-riograndense-j-y.jpg)