A Twenty-Two Story Class A Office Building 111 Livingston ...
323
APPRAISAL REPORT A Twenty-Two Story Class A Office Building 111 Livingston Street Brooklyn, New York 11201 REQUESTED BY Mr. Avrumie Furst The Leser Group 1481 47th Street Brooklyn, New York 11219 PREPARED BY BBG, Inc. 112 Madison Avenue, 11th Floor New York, New York 10016 DATE OF VALUE ESTIMATE Effective Date of Value December 31, 2017
-
Upload
khangminh22 -
Category
Documents
-
view
0 -
download
0
Transcript of A Twenty-Two Story Class A Office Building 111 Livingston ...

A P P R A I S A L R E P O R T
A Twenty-Two Story Class A Office Building
111 Livingston Street
Brooklyn, New York 11201
R E Q U E S T E D B Y
Mr. Avrumie Furst
The Leser Group
1481 47th Street
Brooklyn, New York 11219
P R E P A R E D B Y
BBG, Inc.
112 Madison Avenue, 11th Floor
New York, New York 10016
D A T E O F V A L U E E S T I M A T E
Effective Date of Value
December 31, 2017

March 12, 2018
Mr. Avrumie Furst
The Leser Group
1481 47th Street
Brooklyn, New York 11219
Re: Appraisal File No. 118000076
A Twenty-Two Story Class A Office Building
111 Livingston Street
Brooklyn, New York 11201
Dear Mr. Furst:
In accordance with your request, the undersigned has prepared an appraisal in narrative format of
the above-captioned property for the purpose of estimating the fair value of the subject property's
leased fee estate as of December 31, 2017 in accordance with IFRS-13.
We have appraised the above referenced property, the conclusions of which are set forth in the
attached appraisal report. This is an Appraisal Report that is intended to comply with the reporting
requirements set forth under Standards Rule 2-2 of USPAP and the Code of Professional Ethics
and the Standards of Professional Appraisal Practice of the Appraisal Institute. In addition, this
appraisal has been prepared in compliance with IFRS 13 (International Financial Reporting
Standards 13-fair value measurement). The depth of analysis discussed in this report is specific to
the needs of the client and for the intended use stated in the report.
This appraisal is to be used to aid the Company in the preparation of Financial Statements to be
published in Tel Aviv Stock Exchange in the first quarter of 2018. We confirm that we have given
our full consent to the inclusion of the Appraisal Report in its entirety within The Leser Group
Limited's financial statements for year-end 2017, to be published in the Tel Aviv Stock Exchange
Ltd. in March 2018. The Leser Group (“TLG”) is also an intended user of this report.

Mr. Avrumie Furst
Page 2
March 12, 2018
The subject property consists of a twenty-two story, plus lower levels, Class A office building.
According to New York City records, the building contains approximately 459,100 square feet of
gross building area, and a net leasable area of 418,131 square feet, of which 414,740 square feet
is upper floor office space, and 3,391 square feet is ground floor retail space. The improvements
were constructed in 1969 and renovated in 2001, and are in good overall condition. The property
is currently 97.54% leased and occupied by approximately 11 tenants, including Legal Aid
Society, City University of New York, Northrop Grumman, OTDA and Workers Compensation.
The two basement levels consist of an underground parking garage with a capacity of 250 cars.
There is currently a 10,270 square foot vacant office unit on the seventeenth floor available for
lease.
The subject property is located on the northwest corner of Livingston Street and Boerum Place, in
the Downtown Brooklyn office submarket of Kings County, City and State of New York. The site
contains 32,542± square feet of land area and is situated in a C5-4 Commercial zoning district
within a DB, Downtown Brooklyn Special Purpose District as designated by the City of New York.
The site is identified on the tax maps of Kings County as Block 266, Lot 1. The street address is
111 Livingston Street, Brooklyn, New York 11201.
Our analyses, opinions and conclusions were developed, and this report has been prepared, in
conformance with the in accordance with appropriate Federal regulatory authority guidelines
specifically the appraisal requirements outlined in Title XI of the Federal Financial Institutions
Reform, Recovery, and Enforcement Act of 1989 (FIRREA) as revised and amended and the
Interagency Appraisal and Evaluation Guidelines.
The highest and best use of the subject property "as improved" is its present use. This conclusion
is based, in part on historical and current trends, the demand for office and retail space in the
subject market area, and the conformity of the subject to neighboring buildings.
All of the approaches to value have been considered in this report; however, the Income
Capitalization and Sales Comparison Approaches have been employed to derive an estimate of the
fair value. The Cost Approach was not considered appropriate to the particular appraisal problem
at hand for reasons cited within the report. The reported value represents cash or its equivalent
value and assumes a marketing time of one year or less.
After carefully considering all available information concerning the subject property and all
apparent factors affecting value, is the opinion of the appraisers that the “as is” fair value of the subject property's leased fee estate as of December 31, 2017 is:
TWO HUNDRED THIRTY TWO MILLION DOLLARS $232,000,000

Mr. Avrumie Furst
Page 3
March 12, 2018
The opinion of value expressed herein is subject to the certification, assumptions, limiting
conditions, and all other information contained in the following narrative appraisal report.
Thank you for the opportunity to serve you.
Sincerely,
Joel Leitner, MAI, CRE Philip Ginsberg
Managing Director Senior Appraiser
State Certified General Appraiser #46-3011 (212) 682-2969

TABLE OF CONTENTS
INTRODUCTION ........................................................................................................................ 1
IDENTIFICATION OF THE SUBJECT PROPERTY .............................................................1
PURPOSE OF THE APPRAISAL .........................................................................................1
FUNCTION OF THE APPRAISAL/INTENDED USER ..........................................................1
PROPERTY RIGHTS APPRAISED ......................................................................................2
DATE OF VALUE ESTIMATE ..............................................................................................2
SUBJECT PROPERTY HISTORY .......................................................................................2
DEFINITION OF FAIR VALUE .............................................................................................2
DEFINITION OF REAL ESTATE-RELATED FINANCIAL TRANSACTION ..........................3
EXPOSURE TIME ................................................................................................................3
ESTIMATE OF REASONABLE MARKETING TIME ............................................................3
LIMITING CONDITIONS AND SPECIAL ASSUMPTIONS ...................................................3
EXTRAORDINARY ASSUMPTIONS ...................................................................................3
HYPOTHETICAL CONDITIONS...........................................................................................4
SCOPE OF THE APPRAISAL ..............................................................................................4
COMPETENCY ....................................................................................................................4
CURRENT ECONOMIC CONDITIONS ....................................................................................... 5
REGIONAL ANALYSIS - BROOKLYN ........................................................................................ 8
NEIGHBORHOOD DESCRIPTION ........................................................................................... 23
OFFICE MARKET ANALYSIS ................................................................................................... 31
DOWNTOWN BROOKLYN SUBMARKET ANALYSIS .............................................................. 40
SUBMARKET ANALYSIS ......................................................................................................... 47
BROOKLYN RETAIL MARKET ................................................................................................. 58
ZONING SUMMARY ................................................................................................................. 62
ASSESSED VALUE AND REAL ESTATE TAXES .................................................................... 65
SITE DESCRIPTION................................................................................................................. 68
SUBJECT PROPERTY PHOTOS ............................................................................................. 70
HIGHEST AND BEST USE ....................................................................................................... 99
APPRAISAL VALUATION PROCESS ..................................................................................... 103
COST APPROACH ................................................................................................................. 104
INCOME CAPITALIZATION APPROACH ............................................................................... 105
SURVEY OF COMPARABLE OFFICE RENTALS ........................................................... 119
COMPARABLE AVENUE RETAIL RENTALS .................................................................. 123

PARKING GARAGE RENTALS ....................................................................................... 125
OPERATING EXPENSE ANALYSIS ................................................................................ 128
ESTIMATED OPERATING EXPENSES........................................................................... 131
DISCOUNT RATE ............................................................................................................ 135
SUMMARY OF DISCOUNTED CASH FLOW ASSUMPTIONS ....................................... 139
DIRECT CAPITALIZATION .............................................................................................. 144
SALES COMPARISON APPROACH ...................................................................................... 148
SALES ADJUSTMENT GRID ........................................................................................... 164
RECONCILIATION AND FINAL VALUE ESTIMATE ............................................................... 166
ADDENDA .............................................................................................................................. 167
ARGUS RENT ROLL ........................................................................................................ 168
SENSITIVTY ANALYSIS .................................................................................................. 171
LETTER OF ENGAGEMENT ........................................................................................... 172
ASSUMPTIONS AND LIMITING CONDITIONS ............................................................... 174
CERTIFICATION .............................................................................................................. 179
QUALIFICATIONS ............................................................................................................ 181
LICENSE .......................................................................................................................... 183

PHOTOGRAPH OF THE SUBJECT PROPERTY

SUMMARY OF FACTS AND CONCLUSIONS
Subject Property: A Twenty-Two Story Class A Office Building
111 Livingston Street
Brooklyn, New York 11201
Location: The subject property is located on the northwest corner
of Livingston Street and Boerum Place, in the
Downtown Brooklyn office submarket of Kings
County, City and State of New York.
Tax Map Number: Block 266, Lot 1
Property Description: The subject property consists of a twenty-two story,
plus lower levels, Class A office building. According
to New York City records, the building contains
approximately 459,100 square feet of gross building
area, and a net leasable area of 418,131 square feet, of
which 414,740 square feet is upper floor office space,
and 3,391 square feet is ground floor retail space. The
improvements were constructed in 1969 and renovated
in 2001, and are in good overall condition. The
property is currently 97.54% leased and occupied by
approximately 11 tenants, including Legal Aid
Society, City University of New York, Northrop
Grumman, OTDA and Workers Compensation. The
two basement levels consist of an underground parking
garage with a capacity of 250 cars. There is currently
a 10,270 square foot vacant office unit on the
seventeenth floor available for lease.
Gross Building Area: 459,100± square feet
Gross Leasable Area: 418,131± square feet
Gross Leasable Area Breakdown: 414,740± square feet – office space
3,391± square feet – ground floor retail
Current Occupancy: 97.54% leased and occupied by 10± tenants and 1
parking garage tenant.
Year Built: 1969/Renovated 2001
Site Area: 32,542± square feet

Zoning: C5-4 Commercial within a DB Downtown Brooklyn
Special Purpose District.
Highest And Best Use: As Vacant – mixed use.
As Improved – existing office and retail use.
Flood Zone: The property is located within Zone X, a 500-year
flood area, according to the FIRM flood hazard map,
Community Panel #3604970203F, dated September 5,
2007. Flood insurance is generally not required.
Exposure Time: Within one year.
Marketing Time: Within one year.
Date of Valuation: December 31, 2017
Date of Inspection: January 23, 2018
Property Rights Appraised: Leased Fee Interest
FAIR VALUE ESTIMATES
Cost Approach: Not Used
Income Capitalization Approach: $232,000,000
Sales Comparison Approach: $232,000,000
Final Fair Value Estimate: $232,000,000
INTRODUCTION
BBG, INC. 1 0118000076
INTRODUCTION
IDENTIFICATION OF THE SUBJECT PROPERTY
The subject property is located on the northwest corner of Livingston Street and Boerum Place, in
the Downtown Brooklyn office submarket of Kings County, City and State of New York. The site
contains 32,542± square feet of land area and is situated in a C5-4 Commercial zoning district
within a DB, Downtown Brooklyn Special Purpose District as designated by the City of New York.
The site is identified on the tax maps of Kings County as Block 266, Lot 1. A metes and bounds
legal description of the site is presented as follows:
PURPOSE OF THE APPRAISAL
The purpose of the appraisal is to estimate the fair value of the subject property’s leased fee interest
of as of December 31, 2017 in accordance in accordance with IFRS 13.
FUNCTION OF THE APPRAISAL/INTENDED USER
The type and definition of value sought in the appraisal of the subject was an “as is” Fair Value opinion for the leased fee interest in the property as of December 31, 2017, subject to the general
underlying assumptions and limiting conditions cited herein, and in compliance with IFRS 13
(International Financial Reporting Standards 13-fair value measurement). According to the
International Financial Reporting Standard 13, Fair Value is defined as: “The price that would be
received to sell an asset or paid to transfer a liability in an orderly transaction between market
participants at the measurement date.”
This appraisal is to be used to aid the Company in the preparation of Financial Statements to be
published in Tel Aviv Stock Exchange in the first quarter of 2018. We confirm that we have given
our full consent to the inclusion of the Appraisal Report in its entirety within The Leser Group

INTRODUCTION
BBG, INC. 2 0118000076
Limited's financial statements for year-end 2017, to be published in the Tel Aviv Stock Exchange
Ltd. in March 2018. The Leser Group (“TLG”) is also an intended user of this report.
PROPERTY RIGHTS APPRAISED
The existence of leases within the subject property indicates that the property should be appraised
on the basis of a leased fee estate (encumbered). A leased fee estate is an ownership interest held
by a landlord with the right of use and occupancy conveyed by lease to others; the rights of the
lessor (the leased fee owner) and the lessee (leaseholder) are specified by contract terms contained
within the lease.
DATE OF VALUE ESTIMATE
The date of the “as is” valuation is December 31, 2017. The property was inspected on January
23, 2018 by Philip Ginsberg.
SUBJECT PROPERTY HISTORY
According to New York City records, the current owner of the property is 111 Livingston Street
LLC (The Leser Group), which has owned the property since December 1995. There have been
no arm’s length transfers of ownership over the past 5 years. To the best of our knowledge, the
property is not currently marketed or offered for sale.
DEFINITION OF FAIR VALUE
IFRS 13 defines fair value as the price that would be received to sell an asset or paid to transfer a
liability in an orderly transaction between market participants at the measurement date (i.e. an exit
price). That definition of fair value emphasis that fair value is a market-based measurement, not
an entity-specific measurement.
When measuring fair value, an entity uses the assumptions that market participants would use
when pricing the asset or liability under current market conditions, including assumptions about
risk. As a result, an entity’s intention to hold an asset or to settle or otherwise fulfil a liability is
not relevant when measuring fair value.
The IFRS explains that a fair value measurement requires an entity to determine the following:
(a) the particular asset or liability being measured;
(b) for a non-financial asset, the highest and best use of the asset and whether the asset is
used in combination with other assets or on a stand-alone basis;
(c) the market in which an orderly transaction would take place for the asset or liability; and
(d) the appropriate valuation technique(s) to use when measuring fair value. The valuation
technique(s) used should maximize the use of relevant observable inputs and minimize

INTRODUCTION
BBG, INC. 3 0118000076
unobservable inputs. Those inputs should be consistent with the inputs a market participant
would use when pricing the asset or liability.
DEFINITION OF REAL ESTATE-RELATED FINANCIAL TRANSACTION1
Any transaction involving:
1. The sale, lease, purchase, investment in or exchange of real property, including interests
in property, or the financing thereof; or
2. The refinancing of real property or interests in real property; or
3. The use of real property or interests in property as security for a loan or investment, including mortgage-backed securities.
EXPOSURE TIME
Exposure time has been defined as the estimated length of time the real property interest appraised
would have been offered in the market prior to the hypothetical consummation of a sale at fair
value on the effective date of appraisal; a retrospective estimate based on an analysis of past events
assuming a competitive and open market.
Exposure time is always presumed to precede the effective date of appraisal. It is our opinion that
a normal exposure time for the subject property is 12 months. This conclusion is predicated on
interviews with brokers and other real estate industry sources and on information obtained in the
verification process. The value reported herein presumes such an exposure time.
ESTIMATE OF REASONABLE MARKETING TIME
Given the subject's location and the marketing times for similar properties in the area, we estimate the
marketing time for the subject to be within one year. According to the PricewaterhouseCoopers
Korpacz survey for the Fourth Quarter 2017, marketing time for Central Business District (CBD)
office properties have ranged between 2 and 18 months, with an average of 6.8 months, which is
similar to 6.8 months from the prior quarter and above 6.4 months from one year ago.
LIMITING CONDITIONS AND SPECIAL ASSUMPTIONS
Information, estimates and opinions furnished to the appraiser and contained in the report were
obtained from sources considered reliable and believed to be true and correct. However, no
responsibility for accuracy of such items furnished the appraiser can be assumed by the appraiser.
Extraordinary Assumptions
An extraordinary assumption is defined by the Uniform Standards of Professional Appraisal
Practice as “an assumption, directly related to a specific assignment, which, if found to be false,
1 12 U.S.C. 3350(5) (FIRREA section 1121(5)

INTRODUCTION
BBG, INC. 4 0118000076
could alter the appraiser’s opinions or conclusions. Extraordinary assumptions presume as fact
otherwise uncertain information about physical, legal or economic characteristics of the subject
property; or about conditions external to the property, such as market conditions or trends; or about
the integrity of data used in an analysis.” In the development of our opinion of value, we have
applied the following Extraordinary Assumptions: None.
Hypothetical Conditions
According to The Dictionary of Real Estate Appraisal (6th Edition), a Hypothetical Condition is
"that which is contrary to what exists but is supposed for the purpose of analysis. Hypothetical
conditions assume conditions contrary to known facts about physical, legal, or economic
characteristics of the subject property; or about conditions external to the property, such as market
conditions or trends; or about the integrity of data used in an analysis." In the development of our
opinion of value, we have applied the following Hypothetical Conditions: None.
SCOPE OF THE APPRAISAL
BBG, Inc. has been retained by The Leser Group ("TLG"), to prepare a fair valuation of the subject
property. Within the course of this assignment, the following analyses were prepared:
1. Analyzed various population, labor, and economic growth statistics, development
patterns, and recent real estate activity and competition and related these factors to their impact on the Downtown Brooklyn and surrounding competitive office and retail markets.
2. Determined the Highest and Best Use of the subject property based on an analysis of all relevant factors.
3. Researched and ascertained various support information (e.g., rental data, land and improved comparable sales, market and area demographics, etc.) in deriving a current fair value estimate. Inspected the property.
4. Projected occupancy based on the subject's present occupancy and neighborhood market conditions. Additional consideration was given to present supply and demand factors and current occupancy ratios in the subject area, as well as the availability of alternative office and retail space in competitive areas.
5. Determined a 2017/2018 annual rent (as encumbered), projected occupancy, and forecasted operating expenses. The appraiser utilized actual income and expense information at the subject property and evaluated rentals and expenses of several nearby office buildings in order to determine the subject's income potential in deriving a current fair value estimate.
6. Estimated the “as is” fair value of the subject property’s leased fee interest as of December 31, 2017.
COMPETENCY
We have specific knowledge of appraisal methods and practices to complete the assignment
competently and have extensive experience in appraising similar properties.

CURRENT ECONOMIC CONDITIONS
BBG, INC. 5 0118000076
CURRENT ECONOMIC CONDITIONS
At a time when one might have expected the New York City economy to stop growing due to a
shortage of space and workers, it appears to be growing faster. According to household-based data
from the U.S. Bureau of Labor Statistics (BLS), which record the employment status of those
living in the city, including the self-employed and those who commute out, the number of
employed residents of New York City increased by 101,760 (2.6%) in the year to August 2017,
but the local labor force increased by 88,730 (2.1%).
With crowding increasing and housing costs rising, the labor force had increased by just 18,730
over 24 months from August 2014 to August 2016, but it appears workers are somehow moving
to New York City in large numbers once again. From August 2007 to August 2017, New York
City added 371,800 workers and 360,250 employed residents, gains of 9.6% and 9.8%,
respectively. Meanwhile, Moody’s Economy.com reports the city’s total population increased by
just 37,140 (0.4%) in the year to the third quarter of 2017, and the number of households increased
by 19,810 (0.6%). Household average income was up 2.1% from a year earlier.
Recently released American Community Survey (ACS) data from the U.S. Census Bureau provide
a longer-term perspective on the economic characteristics of NYC residents. From 2006 to 2016,
according to this source, the number of city residents age 16 or more increased by 435,320 (6.7%);
but the number in the civilian labor force increased by 387,400 (9.6%), and the number employed
rose by 401,440 (10.8%). The number of workers commuting by public transportation increased
by 318,245 (16.3%), with 40,135 (11.3%) more walking to work and 31,860 (22.4%) more
working at home—but just 27,105 (3.2%) more were driving alone, offset by fewer people
carpooling. The additional jobs are at the high and low end, with an increase of 322,630 (23.8%)
in city residents working in management, business, science, and arts occupations and 122,910
(15.0%) working in service occupations. The median work earnings of all workers increased 0.2%
after adjustment for inflation, to $36,871, but the median work earnings of males working full-
time year-round increased 3.9% to $51,487, and the median work earnings of females working
full-time year round increased 10.1%, to $50,234. The mean NYC household work earnings rose
to $101,177 in total in 2016, up 10.7% from a decade earlier after adjustment for inflation. This
includes roommates, as high rents cause people to squeeze into housing units. Median household
income for all households rose 6.4% to $58,856, and the city’s poverty rate fell from 19.2% to
18.9%.
Current Employment Statistics (CES) data from the BLS on the number of people holding wage
and salary jobs in New York City (including those who commute in) show an increase of 90,800
(2.1%) in the year to August 2017, including a gain of 90,300 (2.4%) for the private sector, about
the same as in the previous 12 months. CES data by sector for the office-based segments were
mixed in the year to August 2017. The Finance and Insurance sector added 2,600 jobs (0.8%) in
the year to August, including an increase of 1,500 (0.8%) in the high-paid Securities, Commodity
Contracts, and Other Financial Investments industry. The Professional and Business Services
sector added 25,100 jobs (3.4%), but a key industry in this sector in the city’s recent boom, Computer Systems Design and Related Services, added just 100 jobs (0.1%). The Information
sector lost 5,600 jobs (2.8%), including a decrease of 1,700 (3.1%) in the Motion Picture and
Sound Recording industry. The city’s sizable and largely government-funded Health Care and

CURRENT ECONOMIC CONDITIONS
BBG, INC. 6 0118000076
Social Assistance sector added 24,700 jobs (3.6%) in the year to August 2017, due to soaring
employment in the Home Health Care industry (up 14,700 or 11.0%). The Colleges and
Universities industry added 5,900 jobs (4.5%). The Arts, Entertainment, and Recreation sector was
up 3,400 jobs (4.0%).
The local economy is also growing as the sectors cited above bring more money into the city. The
Accommodation and Food Services sector added 13,000 jobs (3.7%), with Construction and
related sectors up 5,200 (3.5%), but Retail Trade lost 3,200 jobs (0.9%) despite a gain of 1,000
(1.3%) in the Food and Beverage Store industry.
Outlook
Moody’s Economy.com predicts population growth will remain limited to about 40,000 (0.5%) per year going forward, but the number of households is forecast to rise faster as moderating
housing costs allow more people to move out on their own. The number of households is
anticipated to rise 146,600 over five years. But employment growth is projected to slow to just
40,420 (0.9%) in 2018 and stall out entirely in 2020.

AREA MAP
BBG, INC. 7 0118000076
REGIONAL MAP

AREA AND MARKET ANALYSIS
BBG, INC. 8 0118000076
REGIONAL ANALYSIS - BROOKLYN
The New York Metropolitan Statistical Area (MSA) consists of the city of New York's five
counties and the counties of Westchester and Rockland. The subject property is located in
Brooklyn, which is a borough of the city of New York. Brooklyn is also known as Kings County.
New York City's five boroughs cover 309 square miles. New York City is the nation's center for
finance, the arts, media, fashion, telecommunications, and corporate headquarters.
The city's other boroughs are Manhattan (New York County), which forms the central political,
financial, and cultural core of the city and is the economic growth engine for the greater New York
region; the Bronx (Bronx County); Queens (Queens County); and Staten Island (Richmond
County). Brooklyn and Queens have the largest economies behind Manhattan.
Geographically, Brooklyn is situated at the western tip of Long Island and is bounded to the north
and east by Jamaica Bay and Queens County, to the west by Upper and Lower New York Bays
and the East River, and to the south by the Atlantic Ocean.
Population
According to 2016 estimates, Brooklyn has a total population of 2,668,187. This represents an
increase of 6.50% from the 2010 population level. Summarized below are population statistics for
the five boroughs and all of New York City over the past five decades.
NEW YORK CITY TOTAL POPULATION 1970-2022
1970 1980 1990 2000 2010 Est. 2017 Est. 2022
Overall 7,894,862 7,071,639 7,322,564 8,008,278 8,175,133 8,645,259 8,944,519
% Change N/A -10.4% 3.5% 9.4% 2.1% 5.8% 3.5%
Bronx 1,471,701 1,168,972 1,203,789 1,332,650 1,385,108 1,475,915 1,534,568
% Change N/A -20.6% 3.0% 10.7% 3.9% 6.6% 4.2%
Brooklyn 2,602,012 2,230,936 2,300,664 2,465,326 2,504,700 2,668,187 2,767,532
% Change N/A 14.3% 3.1% 7.2% 1.6% 6.5% 3.7%
Manhattan 1,539,233 1,428,285 1,487,536 1,537,195 1,585,873 1,656,943 1,703,058
% Change N/A 7.2% 4.1% 3.3% 3.2% 4.5% 2.8%
Queens 1,986,473 1,891,325 1,951,598 2,229,379 2,230,722 2,367,950 2,445,385
% Change N/A 4.8% 3.2% 14.2% 0.6% 6.2% 3.7%
Staten Island 295,443 352,121 378,977 443,728 468,730 476,264 483,976
% Change N/A 19.2% 7.6% 17.1% 5.6% 1.6% 1.6%
Source: 1970-2010, US Census 2017 Nielsen Segmentation Solutions
New York City is home to over 8.6 million people in nearly 3.3 million households. Brooklyn is
the most populous borough with 31% of the City’s population. Manhattan’s 1.65 million residents, at over 57,000 residents per square mile, make it one of the most densely populated residential
areas in the nation. While the 1970’s and 1980’s saw the continuing trend of ex-migration of city

AREA AND MARKET ANALYSIS
BBG, INC. 9 0118000076
residents to neighboring suburbs, due primarily to high housing costs and density of living, the
total population is bolstered by the large number of immigrants arriving in the city each year.
BROOKLYN DEMOGRAPHIC TRENDS (2010-2022)
Description
2010
Census
2017
Estimate
% Change
2010-2017
2022
Projection
% Change
2017-2022
Population 2,504,700 2,668,187 6.53% 2,767,532 3.72%
Households 916,856 987,963 7.76% 1,030,126 4.27%
Families 573,363 615,135 7.29% 640,322 4.09%
Housing Units 1,000,293 1,073,342 7.30% 1,116,811 4.05%
Source: Nielsen Segmentation Solutions
From 1990 to 2000, the population in Brooklyn increased by 164,662 persons, which amounts to
24% of the total increase for New York City, as a whole. From 2000 to 2010, the population in
Brooklyn increased by 39,374 persons, which also amounts to 24% of the total increase for New
York City, as a whole. Brooklyn population increases exceeded 6.5% from 2010 to 2017.
New York City Economic Overview – Historical
The economy of New York City is the largest regional economy in the United States. Anchored
by Wall Street, in Lower Manhattan, New York City has been characterized as the world's premier
financial center and is home to the New York Stock Exchange and NASDAQ, the world's largest
stock exchanges by market capitalization and trading activity. In 2015, the New York City
Metropolitan Statistical Area generated a gross metropolitan product (GMP) of over $1.60 trillion,
while the Combined Statistical Area produced a GMP of over $1.83 trillion, both ranking first
nationally by a wide margin and behind the GDP of only nine nations and seven nations,
respectively. The city's economy accounts for the majority of the economic activity in the states
of New York and New Jersey.
New York is distinctive for its high concentrations of advanced service sector firms in fields such
as law, accountancy, banking and management consultancy, and is the top global center for the
advertising industry, which is metonymously referred to as "Madison Avenue"; while Silicon
Alley, metonymous for New York's broad-spectrum high technology sphere, continues to expand.
Many major corporations are headquartered in New York City, including 45 Fortune 500
companies. New York is also unique among American cities for its large number of foreign
corporations. One out of ten private sector jobs in the city is with a foreign company. New York
City has been ranked first among cities across the globe in attracting capital, business, and tourists.
The financial, insurance, health care, and real estate industries form the basis of New York's
economy. The city is also the most important center for mass media, journalism and publishing in
the United States, and is the preeminent arts center in the country. Creative industries such as
digital media, advertising, fashion, design and architecture account for a growing share of
employment, with New York City possessing a strong competitive advantage in these industries.

AREA AND MARKET ANALYSIS
BBG, INC. 10 0118000076
New York City Economic Overview – Current
Private sector jobs in New York City rose over the year by 65,200, or 1.7 percent, to 3,936,000 in
December 2017. Gains were greatest in educational and health services (+23,500), professional
and business services (+16,600), financial activities (+14,000), natural resources, mining and
construction (+10,100), leisure and hospitality (+9,400), and other services (+4,700). Losses were
seen in information (-7,000) and trade, transportation and utilities (-5,700).
The city’s over-the-year picture remained positive, with six sectors adding jobs for the 12 months
through December 2017 while two lost jobs and manufacturing was little changed. The city’s over-the-year private sector growth rate (+1.7 percent) was above the comparable rate for the state
(+1.4 percent) and similar to that of the nation (+1.7 percent).
The city’s seasonally-adjusted unemployment rate was 4.3 percent in December 2017, down 0.4
of a percentage point from November 2017 and 0.6 of a percentage point from December 2016.
New York State’s rate was 4.6 percent in December 2017. The share of the city’s working age population (16+) who were employed was 58.4 percent in December 2017.
The following economic overview of New York City’s economy was provided by the Employment
in New York State Newsletter (March 2017) prepared by the New York State Department of Labor,
the most recent report available for the New York City market.
Overview In 2016, New York City’s annual average private sector job count grew by 83,600, or 2.3%, to 3,788,800, a new all-time high. This marked the city’s seventh consecutive year of job growth and its second-longest job growth streak on record. During this seven-year period, the city added more than 644,000 private sector jobs, while its unemployment rate dropped from 9.3% to 5.2%. NYC’s Factory Sector is Growing The city’s educational and health services sector added 33,300 jobs in 2016. It is the largest source of private sector employment in the city, with more than 930,000 jobs. This sector accounts for just under 25% of the city’s private sector jobs. Employment in this sector tends to grow at a moderate, but steady, pace. Growth is largely driven by long-term demographic and sociological trends, such as an aging population and an increase in the number of people seeking college degrees. The professional and business services sector, which includes everything from law offices to building maintenance firms, added more than 23,000 jobs in 2016. During the current expansion, the sector has emerged as an engine of job growth. Its growth was spurred in part by expanding corporate profit margins. Notable areas of employment growth in this sector include the computer systems design and advertising services industries. Strength in both leisure and business travel helped the city’s leisure and hospitality sector add 9,800 jobs in 2016, its seventh straight year of growth. The sector also reached a new employment high of 437,600 in 2016. This robust growth was due in part to a number of positive recent developments, including new hotel openings, especially in Brooklyn and the Long Island City portion of Queens. Another factor was a rise in restaurant and bar openings, which added 6,200 jobs in 2016.
AREA AND MARKET ANALYSIS
BBG, INC. 11 0118000076
The city’s construction sector also performed very well in 2016, rising by 7,000 jobs to 146,300, an all-time high. Solid job gains were registered by both the construction of buildings (+2,300) and specialty trade contractor (+4,000) industries. With a number of mega projects in the pipeline and continued growth in residential and commercial building, private sector developers and investors maintain a bullish outlook for the city’s construction sector in 2017. Employment in the financial activities sector grew by 6,500 in 2016. The securities, commodities and investments industry, which is home to most “Wall Street” jobs, was a bright spot last year, adding 3,800 jobs. However, uncertainties at home and abroad, as well as continued automation and consolidation of operations, presented a challenge to many of the city’s financial institutions. As a result, employment in the city’s retail banking industry was relatively flat. Hampered by losses in cable television and declines in traditional radio and television broadcasting, employment in the information sector only rose by 3,600 in 2016. While the city remains home to most major television networks in the nation, a number of cable TV services and several large magazine publishers, its media and entertainment industry continues to transition from an “old” to a “new” business model. In one positive sign for the overall sector, publishing industries stemmed the flow of job losses, posting a slight job gain for the second time in the last three years. Summary Over the last seven years, New York City has staged an impressive recovery from the employment levels of the last recession, adding more than 644,000 private sector jobs from 2009 to 2016. In fact, the city’s 20.5% rate of private sector job growth over this seven-year period was almost twice the comparable U.S. rate. As we enter the eighth year of the current expansion, the city’s private sector job count is at an all-time high and is poised for ongoing above-average growth. A diverse array of industry sectors continues to exhibit strength. If current trends continue, New York City’s private sector job count could reach a new all-time high and match its record of eight consecutive years of private sector job growth.
New York City Employment
As of December 2017, New York City’s unemployment rate decreased to 3.9%, down from
previous year averages. The trend has been similar for the Borough of Brooklyn. Unemployment
has fluctuated in New York State as well over the past few months. Overall, the average
unemployment rate for 2016 was lower than the 2015 and 2014 year averages for city and state
levels. Throughout 2016 and 2017, the unemployment rate has trended downward on local, state
and national levels; however, the numbers are affected by a shrinking workforce over this time
period. The following table illustrates historical and current unemployment rates:

AREA AND MARKET ANALYSIS
BBG, INC. 12 0118000076
UNEMPLOYMENT RATES
Year Brooklyn New York City New York State USA
2002
2003
2004
2005
2006
2007
2008
2009
2010
2011
2012
2013
2014
2015
2016
Dec. 2017
8.6%
9.1%
7.6%
6.2%
5.4%
5.4%
6.0%
9.9%
9.9%
9.6%
9.8%
9.4%
7.6%
5.9%
5.3%
4.0%
8.0%
8.3%
7.1%
5.8%
5.0%
5.0%
5.6%
9.3%
9.5%
9.1%
9.3%
8.8%
7.2%
5.7%
5.2%
3.9%
6.1%
6.4%
5.8%
5.0%
4.5%
4.6%
5.4%
8.3%
8.6%
8.3%
8.5%
7.7%
6.3%
5.3%
4.8%
4.4%
5.8%
6.0%
5.5%
5.1%
4.6%
4.6%
5.8%
9.3%
9.6%
8.9%
8.1%
7.4%
6.2%
5.3%
4.9%
4.1%
New York State Department of Labor, Bureau of Labor Statistics
New York City’s employment base has historically enjoyed the distinction as an international center of business, commerce, tourism, and culture. The FIRE (finance, insurance, and real estate)
and services (including the professions of legal, engineering services, consulting, tourism,
recreation, health care, computers and data processing) segments are considered the primary
sources of “white collar,” or office prone, employment in the region.
TOP NON-GOVERNMENT EMPLOYERS NEW YORK CITY (EMPLOYEES)
Employer # of Area Employees
Mount Sinai Health System 36,000
New York City Health and Hospitals Corp. 35,044
JPMorgan Chase & Co. 29,000
North Shore-Long Island Jewish Health System 27,125
New York-Presbyterian Hospital 21,992
Montefiore Medical Center 18,320
Citigroup Inc. 17,552
Macy's Inc. 17,000
New York University 16,021
Columbia University 15,420
Bank of America 14,000
Memorial Sloan Kettering Cancer Center 13,440
Consolidated Edison Inc. 11,668
Verizon Communications Inc. 10,300
Source: Crain’s Book of Lists +

AREA AND MARKET ANALYSIS
BBG, INC. 13 0118000076
Between 2009 and 2011, there had been significant job losses within Citigroup and JPMorgan
Chase, as well as within a number of other financial institutions; companies such as Bear Stearns
and Lehman Brothers ceased operations in 2009. Subsequently, financial firms had cut tens of
thousands of jobs because of a slowdown in the mortgage business, the sluggish economy, the
growth of online banking and new regulations.
New York City’s largest employers are a diverse group of multinational corporations spanning a variety of industries including financial services/banking, telecommunications, health care,
insurance, and pharmaceuticals. Businesses in New York City can capitalize on the synergy
created from the presence of more than 200,000 companies, the access to investment capital and
consumers, and the City’s attractive quality of life.
From 2008 to 2016, the largest increases in the private employment of New York City were seen
in Education and Health Services (193,900); Leisure and Hospitality (127,400) and Professional
and Business Services (120,000). There were decreases in other sectors, the largest of which was
Manufacturing (19,300) and Government (11,700). Overall, the New York City economy has
added nearly 530,000 jobs between 2008 and 2016. Consistent with other large metropolitan areas,
the manufacturing sector continues to decline, while construction has rebounded. Financial
Activities jobs have also declined marginally. The following table illustrates historical and current
employment by sector statistics within New York City:
NEW YORK CITY EMPLOYMENT BY INDUSTRY (000’S)
2008 2009 2010 2011 2012 2013 2014 2015 2016 2008-16
Sector Change
Construction 132.7 120.8 112.5 112.3 116.1 122.2 129.2 139.3 146.3 10.2%
Manufacturing 95.6 81.6 76.3 75.7 76.3 76.4 76.6 77.8 76.3 -20.2%
Trade, Transportation, and Utilities
574.6 552.7 559.7 575.6 590.5 605.0 620.6 630.2 629.4 9.5%
Information 169.5 165.3 165.9 170.8 175.7 179.6 185.0 189.0 192.6 13.6%
Financial Activities 464.6 433.9 428.3 439.1 438.8 437.5 449.2 459.3 465.8 0.3%
Professional and Business Services
603.4 569.2 575.3 597.5 619.3 642.9 669.0 700.0 723.4 19.9%
Education and Health Services
736.3 752.6 771.6 789.2 805.6 831.1 866.4 896.9 930.2 26.3%
Leisure and Hospitality
310.2 308.5 322.2 342.2 365.7 385.4 408.5 427.8 437.6 41.1%
Other Services 160.8 160.3 160.6 165.2 170.4 174.9 180.2 185.0 187.3 16.5%
Government 564.1 567.0 558.0 550.6 546.1 544.4 545.4 549.9 552.4 -2.1%
Total 3811.8 3711.9 3730.4 3818.2 3904.5 3999.4 4130.1 4255.2 4341.3 13.9%
Source: New York State Department of Labor
Office-using employment amounts to approximately 30% of total New York City employment,
reflective of the financial and services orientation of the local economy. New York City’s prime office inventory is concentrated in Manhattan, south of Central Park, within the two major
submarkets of Downtown and Midtown. Brooklyn’s central business district in Downtown Brooklyn is anchored by Brooklyn Borough Hall and MetroTech Center, a 16-acre urban corporate

AREA AND MARKET ANALYSIS
BBG, INC. 14 0118000076
campus. Long Island City in Queens is located across the East River from Midtown Manhattan
and has long been a center of manufacturing, distribution, and industrial services.
Brooklyn Economy and Employment
Brooklyn's job market is driven by three main factors: the performance of the national/city
economy, population flows, and the borough's position as a convenient back office for New York's
businesses.
Forty-four percent of Brooklyn's employed population, or approximately 550,000 people, work in
the borough; more than half of the borough's residents work outside its boundaries. As a result,
economic conditions in Manhattan are important to the borough's jobseekers. Strong international
immigration to Brooklyn generates jobs in services, retailing, and construction. In recent years,
Brooklyn has benefited from a steady influx of financial back office operations from Manhattan,
the rapid growth of a hi-tech/entertainment economy in DUMBO, and strong growth in support
services such as accounting, personal supply agencies and computer services firms.
Over the past decade, Brooklyn has expanded at a rapid pace by attracting new businesses and
residents. Downtown Brooklyn is New York City’s largest business district outside of Manhattan, and there are a number of other important economic centers in the borough, including the Brooklyn
Navy Yard, Sunset Park, Williamsburg and Greenpoint.
Since 2003, the number of businesses in Brooklyn has grown by 21 percent, a much faster rate of
growth than in the rest of the City. Job growth has also been strong (19.8 percent), nearly twice as
fast as in the rest of New York City. Health care and retail account for almost half of the jobs in
Brooklyn, but many of these jobs offer modest salaries. Professional and business services are
growing rapidly, technology and creative firms are expanding, and manufacturing is reviving.
These industries are helping to increase opportunities for better-paying jobs. Brooklyn is also home
to world-class cultural and academic institutions, which are integral parts of the local economy
and the quality of life. With its many restaurants, growing nightlife and diverse neighborhoods,
Brooklyn is attracting young professionals, many of whom work in Manhattan, in large numbers.
With its excellent transportation network, Brooklyn is easily accessible to other parts of New York
City.
The following information is excerpted from the Economic Assessment of the Brooklyn Economy
2017 Update prepared by the Brooklyn Chamber of Commerce, the most recent report prepared
by the agency:
Brooklyn’s job growth continues. In 2016, Brooklyn netted more than 26,000 new private sector jobs. In percentage terms, it surpassed the rest of the city and state by significant margins.
Brooklyn’s unemployment rate is at its lowest in a generation, at 4.9 percent. Brooklyn now has
54 months of year‐ on‐ year declines in unemployment since 2012. On a monthly basis,
unemployment in June 2017 was the lowest it has been in 15 years.

AREA AND MARKET ANALYSIS
BBG, INC. 15 0118000076
Brooklyn’s job growth has changed since 2015, when the most significant growth sector was the
information industry. Currently, health care and social assistance, and tourism and entertainment
dominate employment and net new jobs in Brooklyn.
Though the national retail sector is struggling, Brooklyn’s is strong and the second largest
employer with 74,800 jobs, and 10,000 net new. Furthermore, local retail jobs account for more
than half of the net new jobs. If the current rate of job growth continues, Brooklyn could add over
150,000 net new private sector jobs by 2022.
In terms of population growth, Brooklyn continued growing at a robust pace in 2016, surpassing
New York State’s rate of growth by a significant margin. The senior citizen population growth in
Brooklyn is now the highest among the five boroughs with an annual growth rate that has almost
quadrupled since 2011. This population has a combined $8.9 Billion in purchasing power.
Home sharing has become a large part of Brooklyn’s economy. It provides Brooklyn residents
with another form of income, while also presenting competitive nightly prices, increasing tourism
to the borough. Local economies have seen an increase in the percentage of money spent in those
areas with home sharing. For example, 57 percent of visitors’ money was spent in the
neighborhood they stayed in; Bedford-Stuyvesant saw $14.5 million spent locally.
The following five industries are Brooklyn’s strongest, accounting for 70,600 (68 percent) of Brooklyn’s 103,900 net new jobs created from 2012‐ 2016.
Health Care & Social Assistance – Accounts for a third of private sector jobs in Brooklyn and
added the most jobs to the local economy (33,000 net new jobs) since 2012. The industry is
projected to continue growing at a robust pace (2.16 percent per year) in New York City through
2024, adding nearly 172,000 net new jobs to the regional economy. Brooklyn is well positioned to
capture a large share of those new jobs. One potential red‐ flag is that average wages have been
declining. Wage declines have been driven by declines in the Ambulatory Care and Services sub‐industry.
Tourism & Entertainment – Accounts for almost 10 percent of jobs in Brooklyn. Employment
has grown at an astounding 9.9 percent per year since 2012, adding nearly 16,900 net new jobs to
the local economy. The industry is projected to continue to grow at a very healthy rate of 2.2
percent per year in New York City, and add nearly 100,000 net new jobs by 2024. Brooklyn is also
very well positioned to capture a significant share of those new jobs. The industry experienced the
second highest wage increase among Brooklyn industries, growing at approximately 5.2 percent
per year.
Retail Trade – Consists of 74,800 jobs and is Brooklyn’s second largest industry. It accounts for
nearly 13 percent of all private sector jobs in the borough – a share that has been declining. It
added 2,600 net new jobs to the local economy since 2012. Given current trends in the retail
industry, the outlook for the industry nationwide is pessimistic. Projected growth citywide is weak
going forward (one percent per year through 2024). However, most of the growth (58 percent)
observed in Brooklyn over the past few years is due to local competitive advantages. So, even as
the industry as a whole struggles, Retail in Brooklyn appears to buck the trends. Wages are also

AREA AND MARKET ANALYSIS
BBG, INC. 16 0118000076
low at $31,100 per year, however, they have been increasing at a relatively strong pace of 2.2
percent per year in real terms and offer an important source of entry level jobs.
Professional, Scientific, and Technical Services – In 2013, PSTS surpassed the Transportation
and Warehousing industry in number of jobs in Brooklyn, and in 2016, it surpassed the
Manufacturing industry. PSTS is now Brooklyn’s ninth largest industry with 21,400 jobs in 2016
(3.6 percent of total private sector jobs). It has been growing at a very robust rate of 5.4 percent
per year, with approximately half of that growth attributable to local competitive advantages. The
industry is projected to continue experiencing healthy growth of 2.19 percent per year through
2024, adding approximately 91,900 net new jobs in NYC. If job growth in this industry continues
as projected, it could soon surpass Wholesale Trade as Brooklyn’s 8th largest industry. Brooklyn
is not highly specialized in this industry, but that trend is reversing as the industry grows. The
industry has the fourth highest average wages in Brooklyn and they have been increasing at an
impressive 3.1 percent per year in real terms since 2012.
While Manhattan is still the economic center of New York City, Brooklyn has arrived as the most
populous and fastest‐ growing borough, continuing to outpace the rest of the city and state in job
creation and growth. In the not so distant past, Brooklyn was known for back office and
manufacturing jobs. Now, companies like JPMorgan Chase are moving hundreds of front line
employees from Manhattan to Brooklyn. While finance and tech job growth may receive more
headlines, retail and construction, two sectors that provide important entry ways into the workforce
are experiencing momentous employment and wage growth.
DECEMBER 2017 LABOR FORCE DATA
Area Labor Force
(000’s) Employed
(000’s) Unemployed
(000’s) Unemployment
Rate (%)
New York City 4,160.4 3,998.3 162.2 3.9%
Bronx County 610.9 577.5 33.4 5.5%
Kings County 1,228.0 1,179.5 48.6 4.0%
New York County 925.2 892.9 32.3 3.5%
Queens County 1,174.1 1,134.7 39.4 3.4%
Richmond County 222.2 213.8 8.5 3.8%
Source: New York State Department of Labor

AREA AND MARKET ANALYSIS
BBG, INC. 17 0118000076
New York City Personal Income
Average household income in New York City increased by 53.46% between 2000 and 2017, or
from $57,645 to $88,462. This increase is above the 48.32% increase experienced by New York
State, which has slightly higher average and median household income levels. Average and median
household income figures for New York City are anticipated to increase by 6.88% and 6.82%,
respectively, between 2017 and 2022. The projections are based upon statistical models forecast
by Nielsen Segmentation Solutions, a demographic service provider.
New York City (5 Boroughs) New York State
2000
Census
2017
Estimate
2022
Forecast
2000
Census
2017
Estimate
2022
Forecast
Average Household Income $57,645 $88,462 $94,550 $61,489 $91,198 $97,478
Median Household Income $38,846 $56,226 $60,003 $44,138 $62,222 $65,981
Source: Nielsen Segmentation Solutions
Manhattan is the most affluent borough in New York City, with a 2017 estimated average
household income level of $134,059. The next highest borough in terms of average household
income is Staten Island at $94,071. The following table illustrates average and median income
figures for New York City and the various boroughs.
NEW YORK CITY HOUSEHOLD INCOME
Average Household
Income 2017
Median Household
Income 2017
Manhattan $134,059 $77,932
Brooklyn $77,180 $50,530
Queens $79,982 $60,760
Bronx $51,078 $34,959
Staten Island $94,071 $73,481
New York City $88,462 $56,226
New York State $91,198 $62,222
United States $80,853 $57,462
Source: Nielsen Segmentation Solutions
As evident, Manhattan exhibits the highest average income among the New York City boroughs,
and is nearly twice the level of the United States overall. The above trends indicate that income
growth is projected to remain consistent over the next 5 years, with average annual growth rates
of approximately 1% expected in New York City.
Culture and Recreation
New York City offers an unsurpassed variety of cultural activities, containing hundreds of
museums, art galleries, theaters, restaurants, and retail stores.

AREA AND MARKET ANALYSIS
BBG, INC. 18 0118000076
The City is home to such musical institutions as the New York City Symphony, Carnegie Hall,
Lincoln Center, Brooklyn Academy of Music, and Metropolitan Opera and, with its many
Broadway and off-Broadway plays and musicals, is the performing arts capital of the world.
Several world famous dance troupes are located in New York including the Alvin Ailey Company
and Dance Theater of Harlem.
Brooklyn is home to the Brooklyn Academy of Music (BAM) in the Fort Greene section of
Downtown as well as the Mark Morris Dance Company which recently built a new headquarters
of Lafayette Avenue. BAM is comprised of two opera houses, an independent and repertory movie
theater, and a cafe. The former director of BAM, Harvey Lichtenstein, recently formed the BAM
Local Development Corporation, an organization devoted to revitalizing the area surrounding the
Brooklyn Academy of Music into the "BAM Cultural District." Their plans for the area involve
creating market rate and affordable new housing, retail space, offices for arts organizations, and
performance spaces.
World class museums include the Metropolitan Museum of Art, Museum of Modern Art, The
Guggenheim, and Museum of Natural History. Other attractions include the Statue of Liberty, New
York Aquarium, Bronx Zoo, Brooklyn Botanical Gardens, Empire State Building, United Nations,
New York Stock Exchange, and many others, which draw millions of visitors each year. Brooklyn
is home to the Brooklyn Museum and Brooklyn Botanical Gardens on Eastern Parkway in Prospect
Heights as well as the Brooklyn Children's Museum at Brooklyn Avenue and St. Marks Place in
Crown Heights. The New York Aquarium is located in Coney Island.
According to the Brooklyn Chamber of Commerce, about 15 million visitors came to the borough
last year, contributing to the economy by spending on hotels, restaurants and other attractions. To
support this growing trend, 13 new hotels were completed in recent years, and nine more are slated
for completion within the next two years.
Brooklyn contains 4,480 acres of parkland and green space. Prospect Park, designed by Central
Park creators Frederick Law Olmsted and Calvert Vaux, draws 10 million visits a year. In 2013,
Prospect Park opened its $74 million Lakeside facility, which features two large ice skating rinks
and other amenities. Nearby, the well-known Brooklyn Botanic Garden covers 52 acres with more
than 12,000 varieties of plants.
The Brooklyn Heights Promenade has drawn visitors to the borough’s waterfront for years. More recently, Brooklyn Bridge Park has become a major new draw to the area. The park, which covers
85 acres of Brooklyn waterfront, includes soccer fields, picnic areas and walkways with views of
New York Harbor.
Coney Island’s attractions include three miles of beach and boardwalk, and its famous amusement parks. The two newest parks, Luna Park and Scream Zone, opened in 2010 and 2011, respectively.
The Brooklyn Cyclones, a minor-league baseball team, play 32 home games a year at nearby MCU
Park.
The New York Aquarium, remains a draw. A massive new expansion comprising its extensive
addition, Ocean Wonders: Sharks! has broken ground in January 2014, and is scheduled to open

AREA AND MARKET ANALYSIS
BBG, INC. 19 0118000076
in 2018. This expansion was originally scheduled to break ground in November 2012, and open in
2015, but construction was delayed by Hurricane Sandy.
The Barclays Center arena, part of the Atlantic Yards development project, opened in September
2012 and is home to the Brooklyn Nets, the borough’s first professional basketball team, and the New York Islanders hockey team which relocated here in 2015. With a capacity for audiences of
19,000, it is also a major concert venue.
Educational and Professional Facilities
New York City has 173 schools of higher education including 21 two-year colleges, 45 four-year
colleges, professional schools, law schools, and vocational schools. Manhattan is home to some of
the most prominent educational institutions in the nation including Columbia University, New
York University, The Juilliard School, and Manhattan School of Music. The CUNY (City
University of New York) system offers an affordable education in its 6 community colleges and
11 campuses with 4-year and graduate programs across all 5 boroughs. Notable colleges and
universities located outside Manhattan include Pratt Institute in Brooklyn—a well-recognized
school of art and architecture; St. John’s University and Queens College in Queens; and Fordham University in the Bronx. New York City also has two of the most highly regarded public high
schools in the nation—Stuyvesant and Bronx Science. As in most urban areas, the City’s public primary and secondary education system is considered only fair overall with a wide range in
quality of education from district to district.
More than 20 higher education institutions have campuses in Brooklyn, including four City
University of New York (CUNY) schools: Brooklyn College, Kingsborough Community College,
Medgar Evers College, and the New York City College of Technology. Two State University of
New York (SUNY) schools have campuses in Brooklyn: SUNY Empire College and SUNY Health
Science Center of Brooklyn (known as SUNY Downstate Medical Center). In addition, Brooklyn
is home to many private colleges and universities. NYU-Polytechnic, founded in 1854, is one of
the nation’s premier schools for engineering, science and technology. It also operates three
business incubators for start-up technology firms. Long Island University Brooklyn has one of the
nation’s oldest pharmacy schools. Brooklyn is also the home of Brooklyn Law School, founded in 1901. Other Brooklyn colleges include St. Francis College in Brooklyn Heights, St. Joseph’s College and Pratt Institute in Clinton Hill, and Touro College with various locations in the
borough.
Of the over 270 hospitals in New York State, New York City has 62 acute care general hospitals,
many of which are affiliated with local professional universities. World famous research hospitals
include NYU-Cornell, Rockefeller, Columbia, and New York Hospital. Other highly ranked
hospitals include Memorial Sloan-Kettering Cancer Center, Mount Sinai Hospital, New York Eye
and Ear Infirmary, and New York Presbyterian Hospital.
Transportation
New York City is served by the most diverse transportation system in the United States. The
region’s transportation network links the area to the regional, national, and global commerce and
trade. A brief synopsis of the area’s transportation system follows:

AREA AND MARKET ANALYSIS
BBG, INC. 20 0118000076
RAIL SYSTEM
⋅ NYC Subway System: a 688-mile subway line (including Staten Island) servicing approximately 5.67 million passengers on an average weekday and over 1.767 billion passengers a year. NYC Transit operates approximately 6,429 rail cars 24 hours a day throughout Manhattan, Queens, Brooklyn, the Bronx and Staten Island. The 25 subway routes are interconnected, and many lines feature express trains, across-the-platform transfers to local trains, and “skip-stop” express service. There are 469 subway stations and 22 rail stations.
⋅ Metro North: Based in the landmark Grand Central Terminal in Midtown Manhattan, the MTA Metro North Railroad is the second largest commuter line in the United States, providing approximately 289,596 customer trips each weekday and some 86.0 million trips per year. With 384 route miles and 787 miles of track, Metro North goes to 123 stations distributed in seven counties in New York State–Dutchess, Putnam, Westchester, Bronx, New York (Manhattan), Rockland, and Orange–and two counties in the state of Connecticut–New Haven and Fairfield. The system employs 1,268 total rail cars.
⋅ Long Island Railroad: This commuter line runs from the eastern tip of Long Island to Pennsylvania Station in Manhattan and to Atlantic Terminal in Brooklyn. The MTA Long Island Rail Road is the busiest commuter railroad in North America, carrying an average of 304,848 customers each weekday. Annual ridership is approximately 87.6 million persons per year. In 1998, the LIRR completed a 10-year, $2.1 billion investment in improvements including the transformation of Penn Station into a modern, safe and attractive facility with a newer 34th Street entrance. The system has 594 track miles, employs 1,161 total rail cars and has 124 rail stations.
⋅ (PATH) Port Authority Trans-Hudson Subway System: The PATH carries 70% of all passengers entering New York City from New Jersey. Approximately 269,087 commuters use the PATH each weekday. The annual passenger trips for 2012 were 72.6 million, with over 72.8 million in 2013, approximately 73.7 million in 2014, 76.6 million in 2015, and 78.5 million in 2016.
BUS SYSTEM
⋅ New York City Transit: Regularly scheduled bus service in New York City’s five boroughs handles over 125.5 million annually via 82 bus routes. The system has 812 total route miles and employs 1,255 buses.
⋅ Port Authority Bus Terminal: This is the largest bus terminal in the United States. Regional bus lines serve about 537,000 people on an average weekday and more than 162 million people a year. The system employs more than 3,700 buses.
AIRPORTS
⋅ Newark Airport: The Port Authority of New York and New Jersey has operated Newark Liberty International Airport (EWR) under a lease with the City of Newark since March 22, 1948. EWR is located in Essex and Union Counties between the New Jersey Turnpike (accessible from Exits 13A and 14), U.S. Routes 1 & 9, and I-78. The airport is about 16 miles from Midtown Manhattan. EWR consists of about 2,027 acres. In 2016, Newark Airport handled more than 40.3 million passengers and over 792,000 tons of air cargo and mail.

AREA AND MARKET ANALYSIS
BBG, INC. 21 0118000076
⋅ LaGuardia Airport: LaGuardia Airport (LGA) has been operated by The Port Authority of New York and New Jersey under a lease with the City of New York since June 1, 1947. LGA consists of 680 acres and 76 aircraft gates. In 2000, the combined Port Authority and airline investment for LaGuardia’s Redevelopment Program was $830 million. The redevelopment program includes expanding and modernizing the Central Terminal Building, reconfiguring and widening roadways, improving runways and taxiways, a passenger terminal in the east end, airline modernization of gate areas and passenger service areas, and other rehabilitation projects. In 2016, LaGuardia Airport handled nearly 29.8 million passengers and 8,276 tons of air cargo and mail.
⋅ John F. Kennedy Airport: John F. Kennedy International Airport (JFK) is operated by The Port Authority of New York and New Jersey under a lease with the City of New York since June 1, 1947. JFK is located in the southeastern section of Queens County, New York City, on Jamaica Bay. It is 15 miles by highway from midtown Manhattan. JFK consists of 4,930 acres, including 880 acres in the Central Terminal Area (CTA). The airport has more than 30 miles of roadway. In 2016, John F. Kennedy Airport handled nearly 59 million passengers and 1,409,533 million tons of air cargo and mail.
Summary
The New York City metropolitan area has several key competitive advantages, including access
to talent, customers, partners, and investors, which will drive long-term employment growth.
Knowledge-based industries, such as finance, legal services, and consulting, benefit from the
area’s key strengths.
In the last two decades, Brooklyn has emerged as a destination for art, commerce, and industry.
As it has moved away from its blue-collar roots, the borough has developed a thriving services
sector, a diverse manufacturing base, and an increasing number of public and private cultural
institutions that continue to lend cachet to Brooklyn. Major public-private initiatives, such as the
Atlantic Yards complex, the redevelopment of the East River waterfront, and the continued
expansion of the Brooklyn Navy Yard Industrial Park, all suggest that the City’s efforts are oriented around broadening the borough’s economic base, and improving the quality of life for residents, including an increasing number of high-income earners.
Recently completed and planned economic development projects will further strengthen the
borough’s economy. While there has been a housing boom in Brooklyn in recent years, helping to
transform some neighborhoods, there remains a shortage of affordable housing. In the long run,
Brooklyn’s public and private sectors, working alongside its academic and cultural institutions,
are helping to create a favorable environment for economic growth.

AREA AND MARKET ANALYSIS
BBG, INC. 22 0118000076
NEIGHBORHOOD MAP

AREA AND MARKET ANALYSIS
BBG, INC. 23 0118000076
NEIGHBORHOOD DESCRIPTION
The subject property is located in the Downtown section of Brooklyn which borders the
neighborhood of Brooklyn Heights and Fort Greene. This area is bounded on the south by Atlantic
Avenue, the west by Clinton Street, the east by Flatbush Avenue, and the north by Tillary Street.
Downtown Brooklyn is the business and governmental center of the Borough. The subject
neighborhood and its environs are predominantly middle class residential communities which have
seen a great deal of gentrification and luxury growth and development in recent years.
Downtown Brooklyn is the third largest business district in New York City and one of the oldest
commercial districts in the nation. Recent developments in the area, such as MetroTech and
Renaissance Plaza, have produced new, Class A office space, and generated thousands of new jobs
in the borough. Borough Hall, the municipal buildings, the Supreme Court Building and the
business center of Brooklyn are all within the Downtown area.
Downtown Brooklyn is located within Brooklyn Community District 2 which includes Fort
Greene, the Brooklyn Navy Yard, Clinton Hill, Boerum Hill and Brooklyn Heights. District 2 is
bounded by the East River to the north and west, Bedford Stuyvesant to the east, and Cobble Hill
to the south.
Each year, the City of New York publishes compendiums of information on local neighborhoods
in each of the five boroughs. These volumes are known as "Community District Needs." Data
published by the 2016 Community District Needs for Brooklyn indicates that population for

AREA AND MARKET ANALYSIS
BBG, INC. 24 0118000076
District 2 has rebounded in recent years after experiencing substantial decline during the 1970's.
Between 1970 and 1980, the population of District 2 fell by 15.9%. However, between 1980 and
1990, a 1.9% increase in population was observed. During the 1990 to 2000, period population
exhibited a growth rate of 4.3 % which is generally similar to the overall growth rate of Brooklyn
over the same period. Between 2000 and 2010, population increased by only 997 persons, or 1.0%,
which is contrast to the 1.6% growth in population in Brooklyn as a whole over the same time
period.
While Community District 2 has a strong residential base, transportation and utility and
institutional uses have played a large part in the area’s development. Today, 23.3% of Community District 2's land use is devoted to multi-family residential uses while 17.2% and 15.2% are
dedicated to transportation/utility and institutional uses, respectively. Commercial and office uses
comprise only 7.2% of the land use, while industrial uses only comprise 3.3% despite the presence
of the Brooklyn Navy Yard in the northern section of the district. Land use in Brooklyn
Community District 2 is broken down as follows (most recent published information):
Some 36 public, private, and parochial schools are located in Community District 2. Houses of
worship can be found throughout the area. District 2 offers several parks and recreation areas, the
largest of which is the 30-acre Fort Greene Park. District 2 is served by 2 police precincts and 5
fire department houses. Seven senior citizen centers serve the elderly population of this area. The
major medical facility in the district is the Brooklyn Hospital Center.
In 2014, 19.0% of the population in Brooklyn Community District 2 received some form of public
assistance, down from 21.8% in 2005. This is well below 39.6% within the entire county receiving
public assistance. In Kings County, income demographics differ substantially between the
northwestern and northeastern parts of the Borough.

AREA AND MARKET ANALYSIS
BBG, INC. 25 0118000076
The subject neighborhood benefits from its proximity to business and shopping centers within the
Borough of Brooklyn as well as its easy access to Manhattan. Numerous banks, government
offices, and courthouses are situated in proximity to the subject in the Downtown Brooklyn,
Borough Hall, and Court Street areas. The subject is also within a convenient distance of the
Fulton Street Mall, Renaissance Plaza and the Marriott Hotel, which opened in 1998. Major local
retail activity in the subject's neighborhood is centered on Atlantic Avenue, Flatbush Avenue and
Fulton Street. Due to the success of the Barclay’s Center at the intersection of Atlantic Avenue,
Flatbush Avenue, and 4th Avenue, the retail along these corridors is improving dramatically.
Cadman Plaza West, which leads north to the Brooklyn Bridge, includes the Brooklyn Business
Public Library and Pierrepont Plaza, home to JPMorgan Chase. Numerous banks, government
offices, and courthouses are situated in proximity to the neighborhood in Downtown Brooklyn,
Borough Hall, and Court Street areas. The neighborhood is also near the Fulton Street Pedestrian
Mall, Renaissance Plaza, and the Marriott Hotel. The areas surrounding Downtown Brooklyn are
primarily residential.
Another component of the ongoing transformation of the subject's neighborhood into a more
mixed-use area involves proposed changes for Atlantic Avenue. Atlantic Avenue is a major two-
way, six-lane thoroughfare that runs east-west the length of Brooklyn into Queens and connects
with major highways leading to Long Island, Staten Island, Manhattan, Queens and the Bronx.
Atlantic Avenue will connect the subject's neighborhood with Brooklyn Bridge Park, currently
under construction along the waterfront, and the BAM (Brooklyn Academy of Music) Cultural
District, planned around the Atlantic Center Terminal in Fort Greene and Boerum Hill. Local
groups seek to make the avenue more pedestrian-friendly and to promote the retail nature of the
strip.
The area is relatively close to numerous schools and universities, including NYU-Poly, NYC College
of Technology, Long Island University Brooklyn Campus, CUNY City Tech, Brooklyn Law School
and several top-rated prep schools, such as St. Ann’s School and Packer Collegiate Institution. NYU-
Poly is a school of engineering, applied sciences, technology and research. The institution was
founded in 1854 and is the nation’s second-oldest private engineering school. In addition to its main

AREA AND MARKET ANALYSIS
BBG, INC. 26 0118000076
campus at MetroTech Center, it also offers programs at sites throughout the region and around the
globe.
As a result of these renewal efforts, Brooklyn has several major projects that have helped to rejuvenate
the area. Most of these projects are located in Brooklyn Community District 2 and include the
following:
⋅ MetroTech - This project was developed by Forest City Enterprises and represents the cornerstone to Brooklyn's rebirth. The Metro Tech Center is a 16-acre, high-rise business and educational center that occupies ten blocks of Downtown Brooklyn, and represents the bulk of Brooklyn’s office space occupied by high-technology business and back office operations. It includes 4.7 million square feet of space within 12 buildings. Major tenants include JPMorgan Chase, the New York City Fire Department, National Grid, NYU Tandon School of Engineering, MakerBot, Brooklyn Nets, the Ms. Foundation for Women, New York City Fire Department, Empire Blue Cross and Tough Mudder. The complex is integrated with NYU-Poly, New York City College of Technology, and Long Island University. The Brooklyn Marriott is a part of the development, and benefits from demand generated by tenants of the adjacent office buildings.
⋅ Brooklyn Renaissance Plaza - a 30±-story, 850,975 square foot, Class A office building and hotel complex located opposite the Supreme Court Building (Columbus Plaza) between Adams and Jay Streets. The development includes a 1,100-car parking garage and 40,000 square feet of ground floor retail and was subsidized by the New York City Public Development Corporation. The 376-room New York Marriott Brooklyn occupies the first seven floors of the 32-floor Renaissance Plaza and includes 27,000 square feet of convention and meeting space, an 18,000 square foot Grand Ballroom, a restaurant, bar and lounge, and an 8,000 square foot health club with swimming pool. The New York Marriott at the Brooklyn Bridge recently completed a 24 story tower adjacent to the existing hotel, which contains an additional 280 rooms and some spectacular harbor and city skyline views. This expansion brings the overall number of rooms at the New York Marriott at the Brooklyn Bridge to the current 660 rooms. Office tenants include United Federation of Teachers, NYCER, United States Secret Service, AlphaCare Holdings, LTK Consulting Services and the Executive Offices of the Kings County District Attorney.
⋅ Atlantic Center - In the fall of 1996, a development known as Atlantic Center opened at the intersection of Atlantic and Flatbush Avenues. The three-story, L-shaped shopping mall contains 399,000 square feet of national retail including Stop & Shop Supermarket, Burlington Coat Factory, Marshalls, Best Buy, Department of Motor Vehicles, and Old Navy. The center has created over 1,500 permanent jobs and brought record volumes of sales for some of its national retailers. Due to the success of Atlantic Center, the developer opened a second strip called the Shops at Atlantic Center diagonally across the street. Its tenants are PCRichard & Son and Modell’s.
⋅ Atlantic Terminal Mall – As a follow-up to Atlantic Center Mall, Forest City Enterprises constructed Atlantic Terminal Mall in 2004, a 371,333 square foot mall built above the Long Island Railroad and subway terminal at Atlantic and Flatbush Avenues in front of the existing Atlantic Center complex. The anchor tenant is a 199,364 square foot Target store. Other retailers include Payless Shoe Source, DSW Shoes, Bath & Body Works, Guitar Center, Men’s Wearhouse, Children’s Place, Chuck E. Cheese, Victoria’s Secret, and CVS Drugs.

AREA AND MARKET ANALYSIS
BBG, INC. 27 0118000076
This development also includes a 400,000 square foot, 12-story office tower above the mall levels with 7 stories occupied by The Bank of New York Mellon and Online Trading Academy.
⋅ Atlantic Yards/Barclays Center - The $4.9 billion Atlantic Yards project includes the Barclays Center, a world-class 19,000± seat sports and entertainment arena which opened in September 2012, as well as 6,430± residential units, 628,000± square feet of commercial space, 256,000± square feet of retail space, and a 180-unit hotel. Barclays Center is the home of the relocated NBA Brooklyn Nets (formerly the New Jersey Nets), and the New York Islanders hockey team, and is also a noted concert and recreation venue.
⋅ City Point – The City Point project is a $1 billion, multi-phase mixed use development built in conjunction with Extell Development Company, and will ultimately comprise approximately 1.8 million square feet of new construction, including retail and commercial space and a mixture of affordable and market-rate housing. Three multi-family high rise buildings have been completed, as has a four story, 650,000 square foot retail and lifestyle center, with tenants including Trader Joes, Century 21, Target, Dekalb Market and Alamo Drafthouse Cinema. Tower 3 (450 units) is slated for completion by 2020.
Overall, Brooklyn Community District 2 (notably Downtown Brooklyn) has witnessed significant
retail growth in the past 2 years, making the neighborhood a true destination and adding to the vitality
and amenity base of the area, and contributing to the increase in land value. Fulton Mall has revitalized
from a low-end stretch of retail to a high-profile retail destination.
Downtown Brooklyn is extremely convenient to mass transit, with every major subway line (A,
B, C, D, F, G, N, R, 2, 3, 4, and 5) and the Long Island Railroad converging around the Atlantic
Terminal and Borough Hall hubs. Lower Manhattan is accessible within ten to fifteen minutes on
the various subway lines serving the neighborhood. Local bus service is available along Atlantic
Avenue, Flatbush Avenue, Dean Street, Bergen Street, Third Avenue and Fourth Avenue.

AREA AND MARKET ANALYSIS
BBG, INC. 28 0118000076
DEMOGRAPHIC OVERVIEW – 11201 ZIP CODE
The following table illustrates the population within the 11201 zip code; this also coincides with the
general boundary of the northwestern section/corner of Brooklyn, including Downtown and Brooklyn
Heights. The population has grown by approximately 14.54% between 2010 and 2018; this growth
is expected to slow to a still strong 4.39% through 2023. Household trends generally mirror
population growth, but indicate stronger increases.
Source: Claritas

AREA AND MARKET ANALYSIS
BBG, INC. 29 0118000076
Source: Claritas
Household income averaged $185,694 in 2018 (projected). In comparison to other neighborhoods in
Brooklyn, this is a relatively affluent area.
Source: Claritas
Source: Claritas
As reported, the median value of owner-occupied housing units is $954,863; over 47% of the single
family housing stock is valued at over $1,000,000.
Subject Specific Location
The subject property is located on the northwest corner of Livingston Street and Boerum Place, in
the Downtown Brooklyn office district of Kings County. The immediate neighborhood features a
mix of uses including large apartment complexes, office buildings, along with retail and mixed use

AREA AND MARKET ANALYSIS
BBG, INC. 30 0118000076
properties. Within the vicinity, there is a strong influence of new construction. In general, the
neighborhood is densely populated and most improvements are adequately maintained.
The subject is located within a few blocks of the Civil Court of the City of New York and the
Criminal Court of the City of New York. It is within a quarter of a mile from the Municipal
Building, the Supreme Court of the State of New York and the Court Street/Montague Street hub
of the Central Business District. The property is also a few blocks from the United States District
Court, The United States Bankruptcy Court, the main Post Office for Brooklyn, MetroTech and
the Morgan Stanley Building. The Marriott Hotel is located within walking distance as is the very
upscale neighborhood of Brooklyn Heights. The Fulton Mall is in the immediate vicinity, just a
few blocks northwest, while the Barclays Center is located approximately 1 mile to the southeast.
Downtown Brooklyn is extremely convenient to mass transit, with every major subway line (A,
B, C, D, F, G, N, R, 2, 3, 4, and 5) and the Long Island Railroad converging around the Atlantic
Terminal and Borough Hall hubs. Almost all of the city's subway lines stop here, many of them
only one stop from Manhattan. The Long Island Rail Road stops at the Atlantic Terminal at the
intersection of Atlantic and Flatbush Avenues. Lower Manhattan is accessible within ten to fifteen
minutes on the various subway lines serving the neighborhood. Local bus service is available
along Atlantic Avenue, Flatbush Avenue, Dean Street, Bergen Street, Third Avenue and Fourth
Avenue.
Summary
Overall, the subject's location provides good access to neighborhood shops and services.
Downtown Brooklyn is a highly desirable, thriving mixed use neighborhood with near Manhattan
level residential real estate pricing due to its proximity to Brooklyn Heights. The planned retail,
residential, and park developments in Downtown Brooklyn and surrounding neighborhoods will
further enhance the viability of Northwestern Brooklyn as a whole.

AREA AND MARKET ANALYSIS
BBG, INC. 31 0118000076
OFFICE MARKET ANALYSIS
The New York City Outer Boroughs Office Market is divided into four submarkets – Bronx,
Brooklyn, Queens and Staten Island. The Brooklyn office market is delineated into three
submarkets – Downtown Brooklyn, North Brooklyn and South Brooklyn. The subject is situated
within the Downtown Brooklyn submarket. The following information was taken from the CoStar
Property New York Outer Boroughs Office Market Report for the Fourth Quarter 2017.

AREA AND MARKET ANALYSIS
BBG, INC. 32 0118000076
Overview
The New York Outer Boroughs Office market ended the fourth quarter 2017 with a vacancy rate
of 7.2%. The vacancy rate was up over the previous quarter, with net absorption totaling negative
800,653 square feet in the fourth quarter. Vacant sublease space increased in the quarter, ending
the quarter at 465,547 square feet. Rental rates ended the fourth quarter at $34.74, an increase over
the previous quarter. A total of four buildings delivered to the market in the quarter totaling
104,941 square feet, with 5,456,444 square feet still under construction at the end of the quarter.
Absorption
Net absorption for the overall New York Outer Boroughs office market was negative 800,653
square feet in the fourth quarter 2017. That compares to positive 1,031,988 square feet in the third
quarter 2017, positive 275,439 square feet in the second quarter 2017, and positive 343,874 square
feet in the first quarter 2017.
Tenants moving out of large blocks of space in 2017 include Met Life moving out of 266,070
square feet at 27-01 Queens Plaza North also known as 1 QPN Brewster Building as it continues
to consolidate operations back to 200 Park Avenue--the MetLife Building; Fisher Landau Center
moving out of 49,166 square feet at 38-27 30th Street and Tightan Gym moving out of 23,750
square feet at 31-21 31st Street as both the art center and gym permanently closed their doors.
Tenants moving into large blocks of space in 2017 include Success Academy moving into 115,200
square feet at 878 Brooks Avenue, which will be the school’s first Bronx location; 2U moving into 79,500 square feet at 55 Prospect Street as it relocates its headquarters from Manhattan’s Chelsea Piers; and Carrot Creative moving into 49,811 square feet at 55 Washington Street as it expands
its footprint relocating from neighboring building, 45 Main Street.
The Class-A office market recorded net absorption of negative 331,521 square feet in the fourth
quarter 2017 compared to positive 649,650 square feet in the third quarter 2017, positive 19,708
in the second quarter 2017, and negative 105,297 in the first quarter 2017.
The Class-B office market recorded net absorption of negative 547,167 square feet in the fourth
quarter 2017 compared to positive 347,251 square feet in the third quarter 2017, positive 295,559
in the second quarter 2017, and positive 475,012 in the first quarter 2017.
The Class-C office market recorded net absorption of positive 78,035 square feet in the fourth
quarter 2017 compared to positive 35,087 square feet in the third quarter 2017, negative 39,828 in
the second quarter 2017, and negative 25,841 in the first quarter 2017.
Vacancy
The office vacancy rate in the New York Outer Boroughs market area increased to 7.2% at the end
of the fourth quarter 2017. The vacancy rate was 6.3% at the end of the third quarter 2017, 6.6%
at the end of the second quarter 2017, and 6.6% at the end of the first quarter 2017.

AREA AND MARKET ANALYSIS
BBG, INC. 33 0118000076
Class-A projects reported a vacancy rate of 9.3% at the end of the fourth quarter 2017, 7.6% at the
end of the third quarter 2017, 9.3% at the end of the second quarter 2017, and 8.7% at the end of
the first quarter 2017.
Class-B projects reported a vacancy rate of 8.0% at the end of the fourth quarter 2017, 6.8% at the
end of the third quarter 2017, 6.7% at the end of the second quarter 2017, and 6.9% at the end of
the first quarter 2017.
Class-C projects reported a vacancy rate of 4.2% at the end of the fourth quarter 2017, 4.4% at the
end of third quarter 2017, 4.5% at the end of the second quarter 2017, and 4.4% at the end of the
first quarter 2017.
Largest Lease Signings
The largest lease signings occurring in 2017 included the 115,200-square-foot lease signed by
Success Academy at 878 Brooks Avenue in the Bronx market; the 79,500-square-foot deal signed
by 2U at 55 Prospect Street in the Brooklyn market; and the 70,000-square-foot lease signed by
Brooklyn Nets at 148 39th Street in Industry City in the Brooklyn market. A listing of the top
lease signings in 2017 within the New York City Outer Boroughs office market is presented as
follows:

AREA AND MARKET ANALYSIS
BBG, INC. 34 0118000076
Sublease Vacancy
The amount of vacant sublease space in the New York Outer Boroughs market increased to
465,547 square feet by the end of the fourth quarter 2017, from 413,121 square feet at the end of

AREA AND MARKET ANALYSIS
BBG, INC. 35 0118000076
the third quarter 2017. There was 371,971 square feet vacant at the end of the second quarter 2017
and 400,741 square feet at the end of the first quarter 2017.
New York Outer Borough’s Class-A projects reported vacant sublease space of 249,909 square
feet at the end of fourth quarter 2017, down from the 306,740 square feet reported at the end of
the third quarter 2017. There was 294,267 square feet of sublease space vacant at the end of the
second quarter 2017 and 332,625 square feet at the end of the first quarter 2017.
Class-B projects reported vacant sublease space of 188,527 square feet at the end of the fourth
quarter 2017, up from the 106,281 square feet reported at the end of the third quarter 2017. At the
end of the second quarter 2017, there was 76,264 square feet and, at the end of the first quarter
2017, there was 60,316 square feet vacant.
Class-C projects reported increased vacant sublease space from the third quarter 2017 to the fourth
quarter 2017. Sublease vacancy went from 100 square feet to 27,111 square feet during that time.
There was 1,440 square feet at the end of the second quarter 2017, and 7,800 square feet at the end
of the first quarter 2017.
Rental Rates
The average quoted asking rental rate for available office space, all classes, was $34.74 per square
foot per year at the end of the fourth quarter 2017 in the New York Outer Boroughs market area.
This represented a 2.1% increase in quoted rental rates from the end of the third quarter 2017,
when rents were reported at $34.03 per square foot.
The average quoted rate within the Class-A sector was $44.84 at the end of the fourth quarter 2017,
while Class-B rates stood at $35.18, and Class-C rates at $29.77. At the end of the third quarter
2017, Class-A rates were $44.17 per square foot, Class-B rates were $34.69, and Class-C rates
were $28.46.
Deliveries and Construction
During the fourth quarter 2017, four buildings totaling 104,941 square feet were completed in the
New York Outer Boroughs market area. This compares to nine buildings totaling 707,332 square
feet that were completed in the third quarter 2017, four buildings totaling 238,979 square feet
completed in the second quarter 2017, and 107,472 square feet in four buildings completed in the
first quarter 2017.
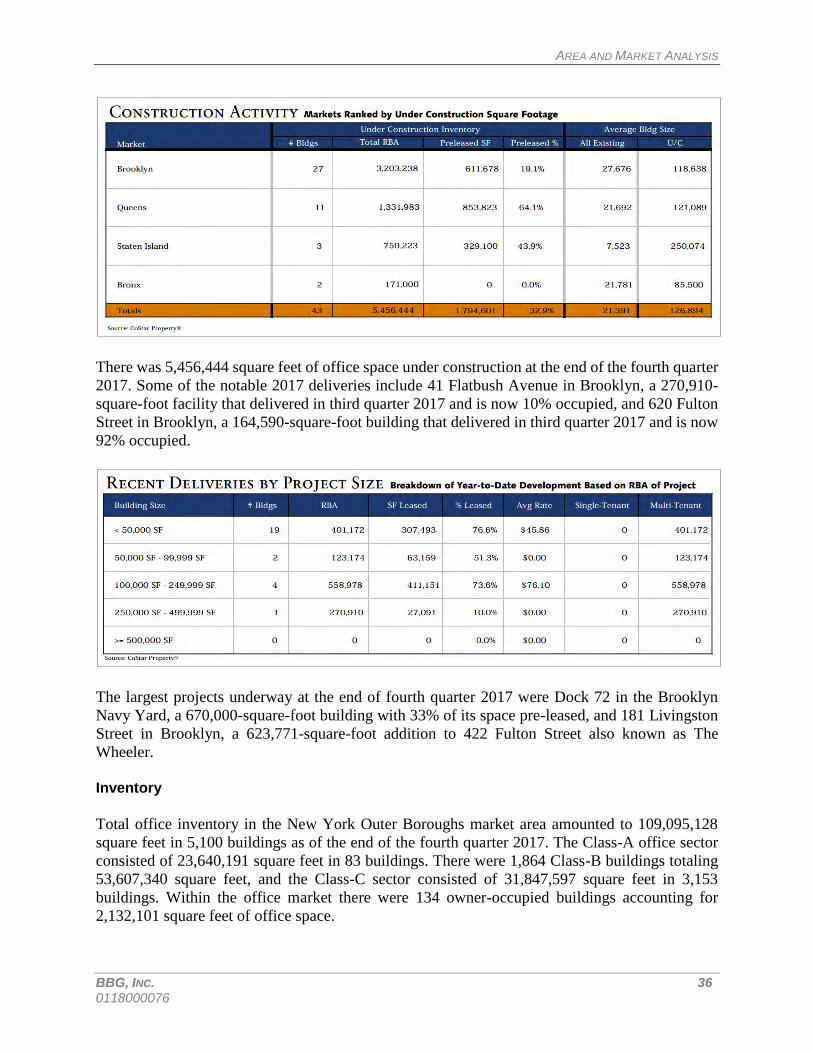
AREA AND MARKET ANALYSIS
BBG, INC. 36 0118000076
There was 5,456,444 square feet of office space under construction at the end of the fourth quarter
2017. Some of the notable 2017 deliveries include 41 Flatbush Avenue in Brooklyn, a 270,910-
square-foot facility that delivered in third quarter 2017 and is now 10% occupied, and 620 Fulton
Street in Brooklyn, a 164,590-square-foot building that delivered in third quarter 2017 and is now
92% occupied.
The largest projects underway at the end of fourth quarter 2017 were Dock 72 in the Brooklyn
Navy Yard, a 670,000-square-foot building with 33% of its space pre-leased, and 181 Livingston
Street in Brooklyn, a 623,771-square-foot addition to 422 Fulton Street also known as The
Wheeler.
Inventory
Total office inventory in the New York Outer Boroughs market area amounted to 109,095,128
square feet in 5,100 buildings as of the end of the fourth quarter 2017. The Class-A office sector
consisted of 23,640,191 square feet in 83 buildings. There were 1,864 Class-B buildings totaling
53,607,340 square feet, and the Class-C sector consisted of 31,847,597 square feet in 3,153
buildings. Within the office market there were 134 owner-occupied buildings accounting for
2,132,101 square feet of office space.

AREA AND MARKET ANALYSIS
BBG, INC. 37 0118000076
Sales Activity
Tallying office building sales of 15,000 square feet or larger, New York Outer Boroughs office
sales figures rose during the third quarter 2017 in terms of dollar volume compared to the second
quarter of 2017.
In the third quarter, seven office transactions closed with a total volume of $68,287,559. The seven
buildings totaled 207,642 square feet, and the average price equated to $328.87 per square foot.
That compares to five transactions totaling $30,150,000 in the second quarter 2017. The total
square footage in the second quarter was 199,029, for an average price per square foot of $151.49.
Total office building sales activity in 2017 was up compared to 2016. In the first nine months of
2017, the market saw 20 office sales transactions with a total volume of $790,680,971. The price
per square foot averaged $463.24. In the same first nine months of 2016, the market posted 22
transactions with a total volume of $329,453,961. The price per square foot averaged $273.84.
Cap rates have been higher in 2017, averaging 7.17% compared to the same period in 2016 when
they averaged 5.15%. One of the largest transactions that has occurred within the last four quarters
in the New York Outer Boroughs market is the portfolio sale of four office buildings in Brooklyn.
This 770,530-square-foot portfolio sold for $408,468,512, or $702.70 per square foot. The
property sold on March 31, 2017.
Brooklyn Overview
The subject property is located in the Brooklyn office market within the broader New York City
Outer Boroughs, one of four such markets. The Brooklyn office market is the largest of the four
New York City Outer Boroughs office markets and consists of 51.9 million square feet in 1,876
properties. Approximately 28.0% of all office space in Brooklyn is classified as Class C, while
Class B space comprises 48.2%, and Class A space 23.8%. Brooklyn is comprised of three
submarkets: Downtown Brooklyn, North Brooklyn and South Brooklyn. The following chart
summarizes the status of the Brooklyn Office Market as of the end of the fourth quarter 2017.
BROOKLYN OFFICE MARKET

AREA AND MARKET ANALYSIS
BBG, INC. 38 0118000076
The subject is specifically within the Downtown Brooklyn submarket. The following exhibit
indicates the boundaries of the Downtown Brooklyn office market:
Downtown Brooklyn Submarket Overview
The subject property is located in the Downtown Brooklyn submarket of the broader Brooklyn
office market, which is the largest office submarket in the New York City Outer Boroughs office
market in terms of net rentable area. The following chart depicts the current conditions of the
Downtown Brooklyn submarket as compared to the other Brooklyn office submarkets.
Existing Inventory Vacancy Quoted
Submarket # Bldgs Total RBA Direct SF Total SF % Rates
Downtown Brooklyn 201 24,131,609 1,228,989 1,318,106 5.5% $46.18
North Brooklyn 690 11,219,559 1,320,033 1,324,683 11.8% $39.21
South Brooklyn 985 16,568,671 1,138,558 1,214,602 7.3% $30.86
Totals/Average 1,876 51,919,839 3,687,580 3,857,391 7.4% $37.44
Source: Costar Property 4th Qtr 2017

AREA AND MARKET ANALYSIS
BBG, INC. 39 0118000076
As indicated in the chart, the Downtown Brooklyn submarket is currently outperforming the
overall Brooklyn market in terms of vacancy and has the highest average rental rates by a
significant margin in comparison to North and South Brooklyn submarkets.
Conclusion
The subject property is a good quality, Class A office building located within Downtown Brooklyn
submarket in Brooklyn. Vacancy rates within the Brooklyn office market have remained relatively
stable over the past few years, ranging from the high 5% to the mid 7% range. Market indications
are that Downtown Brooklyn remains a strong secondary choice for businesses requiring new
office space outside of Manhattan and more cost effective, and the long term outlook for the
Downtown Brooklyn office market remains positive through 2018 and beyond.
As market psychology becomes more favorable, landlords are likely to seek opportunities to
increase revenue by reducing concessions, thereby boosting net effective rents. In addition, over
the long term, indicators are that industries (FIRE, legal, media or non-profit, among others) still
have a very strong desire to locate to Downtown Brooklyn, owing to ongoing revitalization.

AREA AND MARKET ANALYSIS
BBG, INC. 40 0118000076
DOWNTOWN BROOKLYN SUBMARKET ANALYSIS

AREA AND MARKET ANALYSIS
BBG, INC. 41 0118000076

AREA AND MARKET ANALYSIS
BBG, INC. 42 0118000076

AREA AND MARKET ANALYSIS
BBG, INC. 43 0118000076

AREA AND MARKET ANALYSIS
BBG, INC. 44 0118000076

AREA AND MARKET ANALYSIS
BBG, INC. 45 0118000076

AREA AND MARKET ANALYSIS
BBG, INC. 46 0118000076

AREA AND MARKET ANALYSIS
BBG, INC. 47 0118000076
SUBMARKET ANALYSIS
The subject property consists of a twenty-two story, plus lower levels, Class A office building.
containing approximately 459,100 square feet of gross building area, and a net leasable area of
418,131 square feet. Through the use of CoStar Property Services as well as other third party sources,
we have surveyed a total of 16 Class A office buildings (excluding the subject) between 164,590 and
1,387,607 square feet within the Downtown Brooklyn submarket Manhattan that are considered to be
competitive with the subject property. The properties are a mix of pre-war and post-war, multi-
tenanted office buildings.
All relevant physical and financial information on each competitive property was ascertained by the
appraiser based on available property data through various reporting services, as well as conversations
with ownership or management of these properties where necessary. The building survey, which
consists of multi-tenanted properties, is summarized on the following pages.

AREA AND MARKET ANALYSIS
BBG, INC. 48 0118000076
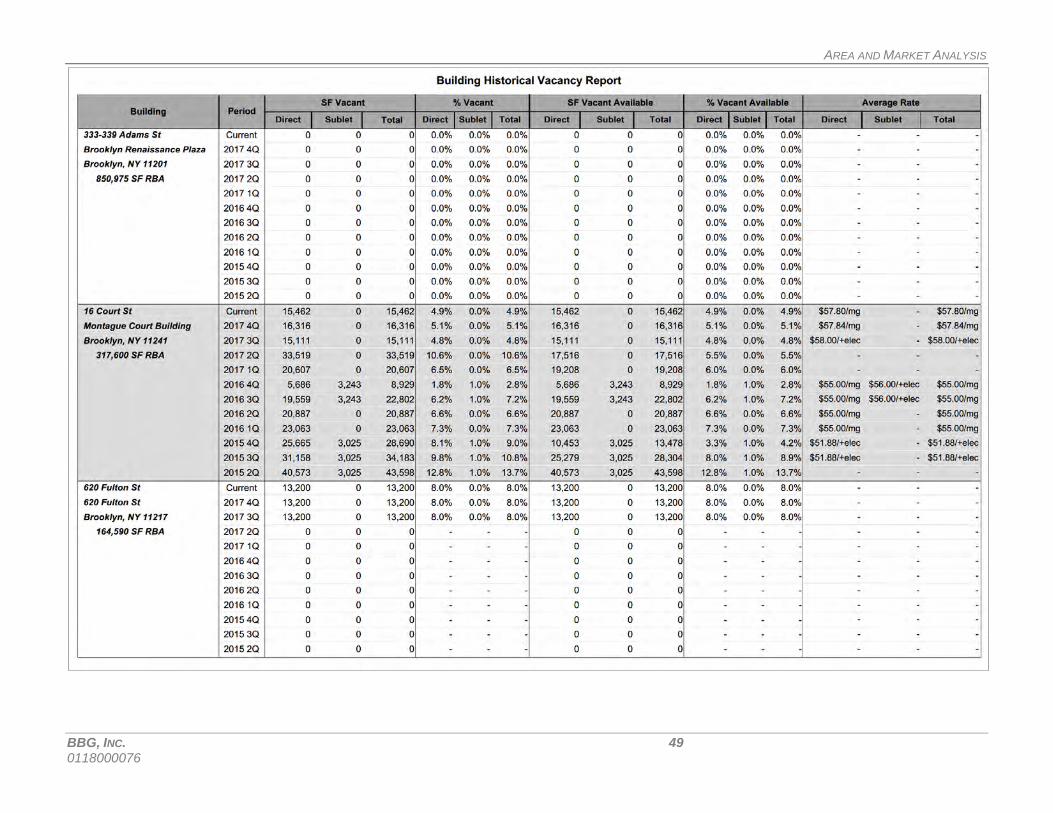
AREA AND MARKET ANALYSIS
BBG, INC. 49 0118000076

AREA AND MARKET ANALYSIS
BBG, INC. 50 0118000076

AREA AND MARKET ANALYSIS
BBG, INC. 51 0118000076

AREA AND MARKET ANALYSIS
BBG, INC. 52 0118000076

AREA AND MARKET ANALYSIS
BBG, INC. 53 0118000076

AREA AND MARKET ANALYSIS
BBG, INC. 54 0118000076

AREA AND MARKET ANALYSIS
BBG, INC. 55 0118000076
Inventory/Vacancy Rates
The subject's competitive submarket consists of 10,074,881 square feet of space within 16 buildings.
The submarket consists of competitive Class A office buildings located within the Downtown
Brooklyn submarket as classified by CoStar Property Services. The properties are situated between
the northern and western East River boundary and Atlantic Avenue to the south, extending to Flatbush
Avenue to the east. The buildings include a mixture of pre and post war construction and range from
average to very good condition. The buildings range in size from 164,590 to 1,387,607 square feet,
averaging 629,680 square feet. All of the buildings are generally 10 stories or higher.
At present, the 16 building competitive set has a current direct available vacancy rate of 1.8% and an
overall available vacancy rate of 2.3%. The available vacancy rate is well below the Downtown
Brooklyn submarket vacancy rate of 5.5%, and below the Downtown Brooklyn Class A office
vacancy rate of 3.5%. The competitive buildings exhibit vacancy rates of 0.0% to 14.9%, with 8 of
the 16 buildings at a reported 100% occupancy.
Within this subset of properties, overall vacancy rates have fluctuated since the second quarter of
2015. Vacancy rates have fluctuated, ranging between the current low of 2.3% to a high of 6.7% over
the past 11+ quarters. Sublet space historically was not prevalent within the subset and there is
minimal sublease space available at this time (approximately 0.5% as of the fourth quarter 2017).
Rental Rates
Offering rents for the competitive set of buildings within the subject's submarket generally range from
the $45.00 to $60.00 range per square foot or higher for premium spaces. Market rents had trended
upward through 2015 and 2016, but have declined and leveled somewhat through the end of 2017.
The current average asking rental rate of $57.30 per square foot is similar to the prior quarter level of
$57.13 per square foot. Rental rates reported are full service (typically the tenant reimburses the land
lord for real estate tax increases over a base year and pay their own electric). An operating expense
reimbursement may also be applicable to the tenants based upon the leasing structure of the particular
building.
The following table illustrates historical and current average asking rental rates within the subject
competitive set. We note that not all of the surveyed properties report average rental rates, and that
the rents typically represent office space.

AREA AND MARKET ANALYSIS
BBG, INC. 56 0118000076
HISTORICAL AVERAGE RENTAL RATES
Period
Direct Average
Asking Rate
Sublet Average
Asking Rate
Total Average
Asking Rate
Current $57.75 $45.45 $57.30
2017 4Q $57.75 $43.25 $57.13
2017 3Q $57.75 $43.57 $57.38
2017 2Q $57.47 $39.60 $55.06
2017 1Q $64.73 $45.10 $63.98
2016 4Q $64.73 $53.71 $64.33
2016 3Q $64.86 $56.00 $64.80
2016 2Q $64.86 $30.23 $64.36
2016 1Q $67.77 N/A $67.77
2015 4Q $67.45 $15.00 $66.99
2015 3Q $67.45 $15.00 $66.99
2015 2Q $67.45 $18.74 $66.83
Source: CoStar
Tenant workletters are a typical feature within the New York City Outer Boroughs office market. A
tenant workletter is paid by the landlord in order to finish the space according to individual tenant
requirements. The cost of the landlord’s tenant workletter will fluctuate directly with the negotiated contract rent and lease term. Tenant workletters within the subject's submarket typically range from
$25.00 to $75.00 or higher per square foot. Lower tenant workletters are evident for smaller space
users under shorter term leases. Conversely, the largest and most comprehensive tenant workletters
are evident within the longer term, large space leases. Recently however, landlords have been offering
larger free rent and tenant workletter packages for smaller spaces with shorter term leases. Tenant
workletters on renewals range from re-carpeting and re-painting to full buildouts. Historical leasing
at the subject suggests that standard Class A workletters are offered. Rent concessions in the subject's
submarket typically range from zero to twelve months or more, depending on the length of the lease
and the quality of tenant.
Competitive Position of the Subject Property
Location: Specific office demand for a particular building or submarket is also driven by tenant
preferences for particular building types or locations. In terms of location, the subject and its direct
competition are located in Downtown Brooklyn within easy access of numerous subway lines. The
subject itself is situated on the northwest corner of Livingston Street and Boerum Place, within close
proximity to other major office buildings, MetroTech Center and Borough Hall.
Buildings located on side streets with no direct avenue frontage are not considered to be as desirable
as avenue addresses. Taller buildings with panoramic views and plenty of natural light are more
desirable than low floors on side streets. The subject fronts on two roadways across from and
surrounded by comparatively low rise buildings and therefore receives plentiful natural light. Based
on the foregoing, the subject falls at the middle to upper end of the comparable range.

AREA AND MARKET ANALYSIS
BBG, INC. 57 0118000076
Functional Utility and Condition: Another consideration in preference comes from building
prestige and decor. In addition to lobby appearance, avenue location has contributory impact on
appeal. From a physical standpoint, the buildings in the subject's submarket are generally older
buildings that are in good condition. The subject building was constructed in 1969 and renovated
in 2001, and has been well maintained. Common areas and tenant spaces were observed to be in
good condition and have quality finishes. The construction quality, interior finish and amenities
offered are consistent with other post-war, Class A facilities.
Conclusions
To summarize issues of product preference, the subject falls within the range of available space within
the submarket. Within the submarket, items like natural light, security, unit layout, building quality
and location will have the greatest impact on the appeal of the space. Given all of the items impacting
competition, it is our opinion that the subject falls at the middle of the range with regard to location,
quality of space and overall building condition.
Market players expect 2018 to remain stable for the New York City Outer Boroughs office markets.
Based on the foregoing, market rent is projected to increase at 3.0% per annum throughout the holding
period. Our 3.0% per annum increases take into account long term averages which center around
3.0%. Future occupancy levels will likely be substantially influenced by property maintenance, rent
levels, and concessions in order to compete well within the market. The subject's good condition and
natural light, coupled with the tenant improvements are projected to put the subject in a competitive
position for the future.

AREA AND MARKET ANALYSIS
BBG, INC. 58 0118000076
BROOKLYN RETAIL MARKET Occupancy Rates
According to CoStar Property Services, Kings County has a total retail inventory (retail stores and
shopping centers) of approximately 92.8 million square feet as of the end of December 2017. We
note that not all retail properties in the county are tracked by CoStar, and that some of the inventory
may also include mixed use properties with residential of office space. This retail space is
contained within 15,827 buildings, most of which are exclusively retail properties, although some,
as noted, may include upper level office or residential space. The overall retail market in Brooklyn
has been relatively strong over the past several years, as occupancy has exceeded 95% since 2014.
Vacancy rates remained relatively consistent over the past few years due to limited additions of
space to the overall market. The fourth quarter 2017 vacancy rate is 3.3%, which is just above the
rate reported for the third quarter 2017 (3.0%).
In order to illustrate pertinent retail market statistics for the subject's trade area, we have also
analyzed inventory and occupancy rates of retail properties within a 0.75-mile radius of the subject
property. The following table illustrates current Kings County (Brooklyn) and subject specific
location retail market statistics:
Retail Space
Kings County
Retail Market
Retail Submarket
0.75 Mile Radius Retail
Number of Buildings 15,851 873
Total Inventory SF 93,082,899 7,382,660
Occupied SF 89,967,600 7,081,925
Vacant SF 3,115,299 300,735
Vacancy % (Direct) 3.3% 3.7%
Vacancy % (Sublet) 0.1% 0.4%
Vacancy % (Total) 3.3% 4.1%
Average Rental Rate $46.41 $84.58
Source: CoStar Property Services
While the broader Kings County retail market indicates a relatively low vacancy rate of 3.3%,
retail stores and shopping centers within a 0.75-mile of the subject report a higher vacancy rate of
4.1%. The average property size for retail properties within a 0.75-mile radius of the subject is
approximately 8,457 square feet. Market rents for those properties that reported rental rates are
indicated at $84.58 per square foot for the immediate market competition and $46.41 per square
foot for the broader market. The 0.75-mile radius rental rate is higher as a portion of the Fulton
Mall is included within the survey; properties along this stretch of Fulton Avenue have among the
highest retail rentals rates in Brooklyn.
Current and Historical Trends
Historical retail inventory and vacancy rates as taken from the CoStar Property Fourth Quarter
2017 New York City Outer Boroughs retail market report are presented as follows:

AREA AND MARKET ANALYSIS
BBG, INC. 59 0118000076

AREA AND MARKET ANALYSIS
BBG, INC. 60 0118000076
As indicated, vacancy rates for the broader Brooklyn retail market have remained relatively
constant over the past few years, ranging from 2.7% to 4.8%; the vacancy rate has remained
between 2.7% and 3.3% over the past several quarters. Additions to the market have been limited
over the past few years, and there 28 buildings currently under construction totaling 815,851
square feet which represents 0.9% of the total Brooklyn retail inventory.
Rental Rate Trends
CoStar indicates that the current average lease rate in Kings County as of the end of the fourth
quarter 2017 was $46.69 per square foot, which represents a slight decrease from prior quarters.
Rental rates had exceeded $40.00 per square foot since early 2014 and have ticked upward
measurably since early 2013. High value corridors and locations such as the Fulton Mall, Atlantic
Terminal, Barclays Center, Downtown Brooklyn and Brooklyn Heights have maintained relatively
high area retail rental rates over the past several years, typically exceeding $200.00 per square foot
along prime corridors including Fulton Street, Bedford Avenue and Montague Street. Larger
shopping center rents have historically remained consistent.
Conclusion
Based on prevailing occupancy rates over the past several quarters, it is reasonable to conclude
that the Kings County retail market remains strong, with nominal vacancy rates, particularly within
a 0.75 mile radius of the subject property. As an urban, fully built up community, new retail space
will only come on the market as a result of redevelopment of existing and alternative use facilities.
The combination of the subject area tenant mix, superior visibility and access, location close to
Downtown Brooklyn, and relatively limited potential for additional development should make the
subject property a viable property for the foreseeable future.

PROPERTY DATA
BBG, INC. 61 0118000076
ZONING MAP

PROPERTY DATA
BBG, INC. 62 0118000076
ZONING SUMMARY
The subject is located within a "C5-4" Commercial zoning district as amended by the City of New
York. C5 is a restricted central commercial district intended primarily for retail uses which serve
the metropolitan region and for areas where continuous retail frontage is desired. The retail area
of Fifth Avenue in Manhattan is zoned C5. The districts are typically developed with department
stores, large office buildings, and mixed buildings with residential space above office or
commercial floors. Home maintenance services, auto rental establishments and other uses such as
bowling alleys are not permitted because they are not in character with the district. The district is
mapped in Mid- and Lower Manhattan, Downtown Brooklyn and in Long Island City in Queens.
The property is also located within a Special Downtown Brooklyn (DB) zone. The "Special
Downtown Brooklyn District" is designed to promote and protect public health, safety and general
welfare. These general goals include strengthening the business core of Downtown Brooklyn by
improving the working and living environments; foster development and provide direction and
incentives for further growth where appropriate; create and provide a transition between the
Downtown commercial core and the lower-scale residential communities of Fort Greene, Boerum
Hill, Cobble Hill and Brooklyn Heights; to encourage the design of new buildings that are in
character with the area; to preserve the historic architectural character of development along
certain streets and avenues and the pedestrian orientation of ground floor uses, and thus safeguard
the vitality of Downtown Brooklyn. The DB district imposes additional restrictions with regard
to new developments including tower height regulations.
Summary of Bulk Regulations – C5-4 Commercial
Maximum Floor Area Ratio Residential Facilities – 10.0 (12.0 with bonus)
Community Facilities – 10.0 (12.0 with bonus)
Commercial – 10.0 (12.0 with bonus)
Minimum Lot Size 1,700 square feet
Minimum Width 18 feet
Front Yard Setback None
Minimum Rear Yard 30 feet - residential
20 feet - commercial
Maximum Dwelling Units
Per Acre 581

PROPERTY DATA
BBG, INC. 63 0118000076
Summary of Use Regulations
The following uses are permitted in C5 districts:
Category Permitted Uses
Use Group 1 Single-family detached residences.
Use Group 2 Residences of all kinds including apartment hotels and non-profit residences for the elderly.
Use Group 3 Community facilities which include colleges or universities, libraries, museums, non-commercial art galleries, trade schools, nursing homes, and health related facilities.
Use Group 4 Churches, medical offices.
Use Groups 5, 6, 9, 11 Retail and commercial uses including retail stores, art galleries and eating and drinking establishments (with restrictions on entertainment).
Parking
All commercial uses in high density areas (C5 districts) are exempt from parking requirements
because public transportation is easily available.
Conformity
The subject site has a maximum buildable area of 390,504 square feet (32,542 square foot site x
12.0) for commercial uses, assuming that a plaza would be incorporated as part of the development;
the subject property has an existing plaza. The gross building area of 459,100 square feet exceeds
the maximum allowable area. However, approximately 75,000 square feet consists of below grade
area (two level parking garage and power plant), with an estimated above grade GBA of 384,100
square feet. The property was originally constructed in 1969 and predates the existing zoning
ordinance. The subject appears to be a legal use and complying bulk of the existing zoning
ordinance.
It should be noted that we are not experts in the interpretation of complex zoning ordinances, but
the subject property appears to be a conforming use. The determination of compliance, however,
is beyond the scope of a real estate appraisal. We know of no deed restrictions, private or public,
that further limit the subject's use. The research required to determine whether or not such
restrictions exist, however, is beyond the scope of this appraisal assignment. Deed restrictions are
a legal matter, and only a title examination by an attorney or title-company can usually uncover
such restrictive covenants. Thus, we recommend a title search to determine if any such restrictions
do exist.

PROPERTY DATA
BBG, INC. 64 0118000076
TAX MAP LOCATION

PROPERTY DATA
BBG, INC. 65 0118000076
ASSESSED VALUE AND REAL ESTATE TAXES
The subject property is designated on the tax maps of the City of New York, Borough of Brooklyn
(Kings County), as Block 266, Lot 1. The 2017/2018 assessed values for the subject property are
presented as follows:
BLOCK 266, LOT 1
Actual Transitional
Land $2,839,500 $2,839,500
Building + $35,611,200 $30,637,441
Total $38,450,700 $33,476,941
Assessments
Increases in assessed value for commercial properties are phased in over a five-year transitional
period. The "Transitional" assessed value represents the phased-in, and the "Actual" assessed value
represents the future or target assessment when the transitional or phase-in period is over. The tax
rate is applied to the lower of the transitional or actual assessed values.
Tax Assessment Comparables
The subject's actual assessment of $38,450,700 projects to $83.75 per square foot based upon a
gross building area of 459,100 square feet. In order to determine the reasonableness of the subject's
assessment and taxes, we have provided tax assessment comparables from office buildings within
the general area of the subject property.
Assess.
Block Lot Address Street Built Bldg SqFt Act Total /SqFt
2058 17 339 Bridge Street 1990 457,966 $34,541,100 $75.42
154 28 32 Smith Street 1959 193,195 $15,610,500 $80.80
19 1 20 Jay Street 1911 500,000 $40,980,600 $81.96
148 7 100 Myrtle Avenue 1989 598,232 $49,206,600 $82.25
204 1 29 Columbia Heights 1924 304,650 $25,463,250 $83.58
26 50 55 Water Street 1900 395,071 $34,118,550 $86.36
147 4 351 Jay Street 1990 978,544 $85,193,100 $87.06
266 20 65 Court Street 1963 308,053 $28,615,050 $92.89
239 1 135 Pierrepont Street 1987 725,991 $67,509,450 $92.99
AVERAGE $84.81
The tax comparables range from $75.42 to $92.99 per square foot with an average of $84.81 per
square foot. The subject's actual combined assessed value of $83.75 per square foot conforms to
the comparable range, and the subject is therefore, considered reasonably assessed.
Tax Rate
The City of New York has four tax categories for real properties. The subject property consists of
a Class 4 tax property. The following chart indicates the historical tax rates for New York City.

PROPERTY DATA
BBG, INC. 66 0118000076
REAL ESTATE TAX RATES, NEW YORK CITY 2000-2018
Year Class 1 Class 2 Class 3 Class 4
2000/2001 11.255 10.847 10.540 9.768
2001/2002 11.609 10.792 10.541 9.712
First-Half 2002/2003 11.936 10.564 10.607 9.776
Second-Half 2002/2003 14.160 12.517 12.565 11.580
2003/2004 14.550 12.620 12.418 11.431
2004/2005 15.094 12.216 12.553 11.558
2005/2006 15.746 12.396 12.309 11.306
2006/2007 16.118 12.737 12.007 10.997
2007/2008 14.434 11.928 11.577 10.059
2008/2009 (1st Half) 15.605 12.139 11.698 9.870
2008/2009 (2nd Half) 16.787 13.053 12.577 10.612
2008/2009 Average 16.196 12.596 12.137 10.241
2009/2010 17.088 13.241 12.743 10.426
2010/2011 17.364 13.353 12.631 10.312
2011/2012 18.205 13.433 12.473 10.152
2012/2013 18.569 13.818 12.477 10.288
2013/2014 19.191 13.145 11.902 10.323
2014/2015 19.157 12.855 11.125 10.684
2015/2016 19.554 12.883 10.813 10.656
2016/2017 19.991 12.892 10.934 10.574
2017/2018 20.385 12.719 11.891 10.514
Source: Historical Rates Provided by New York City Department of Finance for 2000/2001 through 2017/2018
For Class 2 properties, the overall tax rate has decreased by 1.34% from the 2016/2017 rate to
$12.855 per $100 of assessed value. The Class 1 rate has increased by 1.97% and has been on an
annual increasing trend. The Class 3 rate has also increased by 8.75% over the 2016/2017 rate, a
relatively large increase as compared to prior years. The Class 4 tax rate has decreased by 0.57%
over the prior year, and by 1.33% from 2015/2016.
2017/2018 Tax Liability Calculation
The Class 4 tax rate has fluctuated over the past few years and has shown both increases and
decreases from year to year. Therefore, based on the recently released 2017/2018 tax rate of
10.514% and the 2017/2018 current transitional assessments, current annual real estate taxes are
estimated as follows:
Taxable AV Tax Rate Tax Liability GBA (SF) Taxes/SF
$33,476,941 x 10.514% = $3,519,766 459,100 $7.67
PROPERTY DATA
BBG, INC. 67 0118000076
We will project the subject’s real estate tax payment to increase at 3% per annum throughout the holding period.
Business Improvement District Taxes
The property is also subject to the Downtown Brooklyn Business Improvement District (BID)
taxes. The BID tax is a supplemental real estate tax levied on commercial buildings located within
certain districts established throughout Brooklyn (and other boroughs). Typically, private
commercial real estate owners pay a nominal supplemental tax used to augment public services
and provide special amenities to the area. The most recent BID taxes paid was $32,203.62 which
typically reflects a 6 month period. We will therefore project upcoming BID taxes at $64,407 for
the next 12 month period.
Total real estate and BID taxes are forecast to be $3,584,173.

PROPERTY DATA
BBG, INC. 68 0118000076
SITE DESCRIPTION
The subject property is located on the northwest corner of Livingston Street and Boerum Place, in
the Downtown Brooklyn office submarket of Kings County, City and State of New York. The site
contains 32,542± square feet of land area and is situated in a C5-4 Commercial zoning district
within a DB, Downtown Brooklyn Special Purpose District as designated by the City of New York.
The site is identified on the tax maps of Kings County as Block 266, Lot 1. The street address is
111 Livingston Street, Brooklyn, New York 11201. The following is a brief description of the
underlying site:
Size: The size of the lot is 32,542± square feet.
Shape: The subject site is mostly rectangular in shape.
Zoning: The site is situated in a C5-4 Commercial zoning district
within a Special Downtown Brooklyn District.
Frontage/Depth: The subject site has approximately 213.65± feet of frontage
on the north side of Livingston Street, and 166.50± feet of
frontage along the west side of Boerum Place.
Paving: Streets are paved with asphalt and have concrete curbing.
Streets are drained with catch basins emptying into the City
sewer system. Streets and sidewalks are lit by means of
New York City lighting standards.
Curbing: The curbs on are concrete or stone, and appeared to be in
good condition. All streets have concrete sidewalks.
Street Drainage: Street drainage is collected with the utilization of
recessed catch basins. The catch basins empty by gravity
into the New York City sewer storm system mains.
Street Lighting: Street lighting consists of standard New York City type
lighting fixtures which are 400-watt, sodium vapor
fixtures and controlled by photo cells. The lighting
fixtures are post mounted as per New York City
Department of Highway requirements.
Street Orientation and Parking: Livingston Street is a bi-directional, multi-lane, east-west
thoroughfare with parking lanes. Boerum Place is a
divided, bi-directional, multi-lane thoroughfare which
travels north-south. This thoroughfare also has parking
lanes subject to metering at various times.

PROPERTY DATA
BBG, INC. 69 0118000076
Utilities Water Supply: Domestic water is provided to the building via water
mains.
Sanitary and Storm Sewer System: The building sanitary and storm systems discharge by
gravity into the combined City sewer mains.
Gas Service: Gas is supplied by National Grid.
Electrical: The serving utility company is Consolidated Edison of
New York; however, the subject property generates its
own electricity via a power plant.
Telephone: Telephone service enters the building at the basement
level and is provided by Verizon.
Flood Hazard Status: The property is located within Zone X, a 500-year flood
area, according to the FIRM flood hazard map,
Community Panel #3604970203F, dated September 5,
2007. Flood insurance is generally not required.
Sub-Soil Conditions: The appraisers are not aware of any adverse sub-soil
conditions affecting the property.
Conclusion: The subject site is comparable to other lots located in the
immediate subject vicinity. The site conforms to
neighboring standards in most respects, and there are no
negative external factors affecting the site. Based upon
the current use of the site, all aspects of the property are
functionally adequate.

PROPERTY DATA
BBG, INC. 70 0118000076
SUBJECT PROPERTY PHOTOS
SUBJECT PROPERTY

PROPERTY DATA
BBG, INC. 71 0118000076
SUBJECT PROPERTY

PROPERTY DATA
BBG, INC. 72 0118000076
SUBJECT PROPERTY

PROPERTY DATA
BBG, INC. 73 0118000076
SUBJECT PROPERTY

PROPERTY DATA
BBG, INC. 74 0118000076
SUBJECT FACADE – LIVINGSTON STREET
SUBJECT FACADE – BOERUM PLACE

PROPERTY DATA
BBG, INC. 75 0118000076
LIVINGSTON STREET – VIEW EAST
LIVINGSTON STREET – VIEW WEST

PROPERTY DATA
BBG, INC. 76 0118000076
BOERUM PLACE – VIEW NORTH
BOERUM PLACE – VIEW SOUTH

PROPERTY DATA
BBG, INC. 77 0118000076
LOBBY
LOBBY

PROPERTY DATA
BBG, INC. 78 0118000076
LOBBY (ELEVATORS)
LOBBY (ELEVATORS)

PROPERTY DATA
BBG, INC. 79 0118000076
LOBBY RETAIL SPACE
LOBBY RETAIL SPACE (USED AS OFFICE)

PROPERTY DATA
BBG, INC. 80 0118000076
TYPICAL OFFICE SPACE
TYPICAL OFFICE SPACE

PROPERTY DATA
BBG, INC. 81 0118000076
TYPICAL OFFICE SPACE
TYPICAL OFFICE SPACE

PROPERTY DATA
BBG, INC. 82 0118000076
TYPICAL OFFICE SPACE
TYPICAL OFFICE SPACE

PROPERTY DATA
BBG, INC. 83 0118000076
7 TYPICAL OFFICE SPACE
TYPICAL CORRIDOR

PROPERTY DATA
BBG, INC. 84 0118000076
PARKING GARAGE
PARKING GARAGE

PROPERTY DATA
BBG, INC. 85 0118000076
PARKING GARAGE
PARKING GARAGE

PROPERTY DATA
BBG, INC. 86 0118000076
PARKING GARAGE ENTRY
PARKING GARAGE PLACARD

PROPERTY DATA
BBG, INC. 87 0118000076
MECHANICALS
MECHANICALS

PROPERTY DATA
BBG, INC. 88 0118000076
MECHANICALS
MECHANICALS

PROPERTY DATA
BBG, INC. 89 0118000076
ELECTRICAL
ELECTRICAL

PROPERTY DATA
BBG, INC. 90 0118000076
POWER PLANT BOILERS
POWER PLANT BOILERS

PROPERTY DATA
BBG, INC. 91 0118000076
POWER PLANT BOILERS
BACK UP BOILER

PROPERTY DATA
BBG, INC. 92 0118000076
ROOF
ROOF

PROPERTY DATA
BBG, INC. 93 0118000076
ROOF
ROOF – COOLING TOWER

PROPERTY DATA
BBG, INC. 94 0118000076
DESCRIPTION OF THE IMPROVEMENTS
The subject property consists of a twenty-two story, plus lower levels, Class A office building.
According to New York City records, the building contains approximately 459,100 square feet of
gross building area, and a net leasable area of 418,131 square feet, of which 414,740 square feet
is upper floor office space, and 3,391 square feet is ground floor retail space. The improvements
were constructed in 1969 and renovated in 2001, and are in good overall condition. The property
is currently 97.54% leased and occupied by approximately 11 tenants, including Legal Aid
Society, City University of New York, Northrop Grumman, OTDA and Workers Compensation.
The two basement levels consist of an underground parking garage with a capacity of 250 cars.
There is currently a 10,270 square foot vacant office unit on the seventeenth floor available for
lease. The following is a brief description of the property's characteristics:
Construction Details Structural System: Construction consists of masonry foundation walls and
floor slabs, brick masonry walls and steel joists.
Building Exterior: The building façade is comprised of masonry/concrete
with glass panels.
Entrances: The main entrance to the lobby of 111 Livingston Street
is located on the Livingston Street side and is set back
via a plaza. The main entry consists of a combination of
swing out and revolving glass doors set in metal frames.
There is an additional entrance (swing out glass/metal
frame) for the retail space on the Livingston Street side.
The building also has auxiliary entrances on the Boerum
Place side, including an exclusive entrance for the
C.U.N.Y. school, which has a canopy entry.
Roof and Roof Structures: The roof is flat with a bituminous sealed membrane
covering and crushed stone ballast. The roof houses a
cooling tower and elevator machine rooms. There is a
low rise masonry parapet wall surrounding the roof
perimeter. The roof appears to have been updated /
replaced within the past several years.
Stairs: There are two stairwells which access all floors.
Stairwells have concrete treads with metal railings.
Windows: Windows are insulated fixed pane, full length panels set
in aluminum frames. The ground floor façade has full
length windows (tinted and anodized).
Mechanical Systems Heating/Air Conditioning: The building has a dedicated power plant located in the
sub-basement (25,000± square foot space). The power

PROPERTY DATA
BBG, INC. 95 0118000076
plant contains 5 mechanical generator units – 2 natural
gas powered and 3 diesel fuel powered. The power plant
is utilized to generate electricity. As a byproduct, the
waste heat from the generator units is harnessed to
provide heating to the building (i.e. a waste heat boiler
system). The generated waste heat is harnessed through
heat exchangers and then furnished to the building via
forced air duct system.
The building has a dedicated cooling tower (air cooled)
located on the roof providing cooled air through ceiling
ducts.
Plumbing and Drainage: The building sanitary and storm systems discharge by
gravity into the combined City sewer mains. The
exposed domestic water supply piping consists of
copper tubing and galvanized iron. Drainage piping
consists of cast iron.
Electrical Service: As indicated, electric is generated via a dedicated power
plant in the sub-basement.
Life Safety: The building is sprinklered with a wet system. There is
a standpipe on each floor of each building. In addition,
there are smoke detectors and emergency lighting.
Elevators: The subject property has 11 total elevators. There are
two banks of 4 elevators (3,000 pound capacity each)
which access the lower and upper floors. In addition,
there is 1 hydraulic automatic freight elevator accessing
all floors. The C.U.N.Y. School space has its own
dedicated hydraulic elevator which access floors 1, 2
and 3 within their space.
Lavatories: Restrooms have commercial quality porcelain and
stainless steel fixtures. Vanities consist of concrete cast
sinks. Walls and floors are tiled with high quality
durable tile. Toilet partitions are stainless steel. There
are multiple restrooms per floor.
Security: The lobby is attended with security guards on a rotating
shift basis.
Interior Finishes Lobby Finishes: The lobby is of a generic finish with marble flooring and
marble and paneled walls with attached lighting fixtures.

PROPERTY DATA
BBG, INC. 96 0118000076
The ceiling has tiles with suspended lighting fixtures.
There is also a concessions / snack shop in the lobby
area.
Office Finishes: Office finishes vary from tenant to tenant. Offices are
finished with vinyl asbestos tile, carpeted or wood
floors, painted gypsum board walls, and acoustic
ceilings with recessed fluorescent lighting. Office
finishes were found to be in good condition. Some
offices have conference rooms and employee
lounges/kitchenettes. The school space has an
institutional finish with tiled flooring and multiple
classrooms.
Retail Finish: The primary retail space is located on the ground floor
and is accessed from the lobby; however, there is a
separate street entrance from the plaza. The space at one
time was leased and occupied by a bank. At present, the
space is configured for office use with tiled and carpeted
flooring, painted sheetrock walls and acoustic ceilings
with recessed fluorescent lighting. The unit also
includes some mezzanine space.
Basement / Garage: The parking garage comprises virtually the entire two
levels below grade, as well as a portion of the vaulted
sidewalk area. In total, the two level parking garage
reportedly comprises approximately 50,000 square feet.
The licensed or legal capacity is 150 cars; however, the
garage can accommodate up to 250 cars based upon its
size.
Below the parking garage is a sub-basement that
comprises the power plant. The power plant contains
five generator units, a backup boiler, and maintenance
offices and support areas.
Utility
From a utility standpoint, the subject is well laid out and adequately accommodates its present
utilization. The subject benefits from its desirable location in an active commercial district. The
subject property is able to accommodate its existing office / retail tenants.
The subject building’s gross building area is approximately 459,100± square feet, but an estimated
384,100 square feet above grade. The subject’s current leasable area is 418,131 which is 7.4%
more than the gross building area above grade. As per ownership, current tenant leases do not
include significant add on factors. Within the subject’s market, add-on factors typically range

PROPERTY DATA
BBG, INC. 97 0118000076
from 0% to 25% with some building’s having add-on factors up to 27%. Based on the foregoing,
the subject property’s leasable area appears reasonable, with potential to increase rentable area via
REBNY standards going forward.
Layout
The subject property is improved with a twenty-two story office building. The following chart
shows the use for each floor.
Floor Use
Sub-Basement Power plant.
Sub-Basement Parking garage.
Basement Parking garage.
Grade Level Office lobby, retail space.
2nd - 23rd Floors Office and institutional space (mechanicals on the 12th floor).
Condition
At the time of inspection the subject property was found to be in good overall condition, having
been maintained as necessary. No significant items of deferred maintenance were noted upon our
inspection. The property is typical of other Class A properties within its submarket. The property
has an estimated remaining economic life of at least 40 years. Future capital investment will serve
to improve the asset productivity and extend its life during the holding period.
Building Management
The building is currently managed by ownership (The Leser Group/Cogen Corporation). There
are a total of 7-8 on-site employees including engineers and security at one time. In total, there
are 19 total personnel on a rotating basis. This appraisal is made subject to the assumption that
the property is operating under prudent management.
Conclusion
To summarize, the subject property conforms to its immediate area with no evidence of unusual
external negative forces foreseeable over the near future. It is the appraiser's opinion that the
subject property will continue as a viable office/retail building benefiting from its favorable
location in a desirable commercial district.
The information contained in the sections entitled "Site Description" and "Building Analysis" was
obtained from the following sources:
1. Formal field inspection, January 23, 2018;
2. Subject property ownership (The Leser Group);
3. CoStar Property Services;

PROPERTY DATA
BBG, INC. 98 0118000076
4. Prior appraisal report of the property prepared by Colliers International;
5. New York City Planning, Zoning, and Assessment records;
6. Sanborn Land Book.

HIGHEST AND BEST USE
BBG, INC. 99 0118000076
HIGHEST AND BEST USE
According to The Dictionary of Real Estate Appraisal, Sixth Edition (2015), a publication of the
Appraisal Institute, the highest and best use is defined as:
“The reasonably probable and legal use of vacant land or an improved property, which is physically possible, appropriately supported, financially feasible, and that results in the highest value. The four criteria the highest and best use must meet are legal permissibility, physical possibility, financial feasibility, and maximum profitability.” Highest and Best Use Criteria
We have evaluated the sites’ highest and best use both as currently improved and as if vacant. In
both cases, the property’s highest and best use must meet four criteria: 1. legally permissible;
2. physically possible;
3. financially feasible; and,
4. maximally productive.
Legally Permissible
The first test concerns permitted uses. The zoning code is the main law regarding the legality of
development.
Physically Possible
The second test is what is physically possible. Size, shape, street layout are all factors that may or
may not inhibit development.
Financial Feasibility and Maximal Productivity
The third and fourth tests are, respectively, what is feasible and what will produce the highest net
return. After analyzing the physically possible and legally permissible uses of the property, the
highest and best use must be considered in light of financial feasibility and maximum productivity.
For a potential use to be seriously considered, it must have the potential to provide a sufficient
return to attract investment capital over alternative forms of investment. A positive net income or
acceptable rate of return would indicate that a use is financially feasible.

HIGHEST AND BEST USE
BBG, INC. 100 0118000076
As Vacant Legally permissible: The subject property is zoned "C5-4" Commercial
within a special purpose Downtown Brooklyn District
with permissible uses for new construction including
residential and a full range of commercial uses including
office, retail and hotel. No known zoning changes to
uses other than these are currently being considered or
anticipated. The mixed use nature of the area, combined
with the generally good condition of the area's
improvements and the current and expected trends in
supply and demand, all support the current zoning. It is
our opinion that the site, if vacant, could be developed
for the above legally permitted uses, within conformance
and the context of the Downtown Brooklyn District.
Physically possible: The subject site, containing 32,542 square feet, has all
necessary available utilities, and no apparent easements
or encroachments that would hinder or prevent
development. The site has good street frontage and
exposure. Drainage for the site appears to be adequate.
The subject's site size falls within the range of improved
sites in the area and is not considered to restrict the utility
of the subject in relation to competing sites. The above
legally permitted uses, therefore, are considered
physically possible.
Financially feasible: The subject zoning allows a maximum FAR of 10.0 for
a commercial or community facility building (12.0 with
plaza bonuses) and 10.0 for a residential building (12.0
with plaza bonus). The surrounding improvements
within the subject area and the allowable zoning
requirements indicate that the subject site is well suited
for residential development due to its adequate frontage,
corner exposure and surrounding uses. Within the
Downtown Brooklyn market, there remains a continued
demand for housing as evidenced by the number of
recently constructed residential and mixed use properties
that are prevalent. A new 36-story condominium tower
is planned for Cadman Plaza West which will have 134
units and commercial and parking space.
Commercial use including hotel and office/retail may
also be financially feasible due to location within
Downtown Brooklyn and proximity to Manhattan.

HIGHEST AND BEST USE
BBG, INC. 101 0118000076
Based upon the foregoing, given the resurgence in the
local housing in this area, a residential development with
a ground floor/basement commercial component is
considered to be the most financially feasible use of the
site as if vacant given the available FAR, in conjunction
with recent residential condominium pricing in
Downtown Brooklyn, Brooklyn Heights and nearby
neighborhoods.
Maximally productive/ highest and best use:
All legally permissible, physically possible, and
financially feasible uses of the subject property, as
vacant, have been presented and examined. It is our
opinion that, the highest and best use of the subject site,
as vacant, is for residential/mixed use development (for
sale condominiums).

HIGHEST AND BEST USE
BBG, INC. 102 0118000076
As Improved Legally permissible: The subject conforms to the applicable zoning
requirements and represents a legal and complying
structure in terms of use. However, the improvements
exceed the allowable commercial FAR. Given the mixed
use nature of the subject neighborhood and prevalent
multi-story surrounding uses, it is anticipated that
properties such as the subject will continue under their
present use and that no change in permitted uses will
occur to the detriment of the subject property as
improved.
Physically possible: The subject improvement is physically possible as a
result of its existence. In addition, the presence of
similar improvements in the immediate area attests to the
physical possibility of such improvements. The existing
improvements are well suited for its present office and
retail use.
Financially feasible: The estimated fair value of the property is higher than
the value of the land as vacant. The property represents
a financially feasible use as it continues to add value to
the land. Therefore, it would be considered unreasonable
to demolish the existing improvements, as the subject
maintains value based upon its continued use. Therefore,
the highest and best use of the site is as improved.
Maximally productive/ highest and best use:
In conclusion, it is our opinion that the highest and best
use of the subject property, as improved, is its existing
use as an office/retail building.
APPRAISAL VALUATION PROCESS
BBG, INC. 103 0118000076
APPRAISAL VALUATION PROCESS
In estimating the fair value of the leased fee interest of the subject property, the appraiser has
considered the three primary approaches to real estate valuation: the Cost Approach, the Sales
Comparison Approach, and the Income Capitalization Approach.
The Cost Approach is based on the principle of substitution, which affirms that a prudent and
informed purchaser will pay no more for a specific property than the cost of producing a substitute
property of equal or similar desirability and utility. It is particularly applicable when the property
is new or involves relatively new improvements with little, if any, accrued depreciation, and there
is an active market in undeveloped land. It is also relevant in estimating the value of special
purpose or use properties for which there is limited or no sale or rental market.
This approach is a method of valuation consisting of four basic steps:
1. Estimation of the property’s land value, as if vacant.
2. Estimation of the current cost of replacing or reproducing the existing improvements.
3. Estimation and deduction of accrued depreciation from all causes.
4. Adding an entrepreneurial profit, the value of the land, and the depreciated value of the improvements.
The Income Capitalization Approach is predicated on the assumption that there is a definite
relationship between the amount of income that a property is capable of producing and its value.
The Income Capitalization Approach is based on the theory of anticipation, which affirms that
value may be defined as the present worth of all rights to future benefits. In the Income
Capitalization Approach, earning potential is forecast over a typical investor holding period, and
appropriate deductions are made for expenses and vacancy and collection loss resulting in the net
operating income.
In the Sales Comparison Approach, fair value is estimated by comparing the subject property to
sales of similar properties. This Approach is based on the principle of substitution and contribution
which states that a knowledgeable investor will pay no more for a property than would be paid for
a comparable substitute property. This approach produces a value indication by comparing the
subject with sales of similar properties.
Finally, the approaches to value are reconciled into a final fair value estimate. The strengths and
weaknesses of each approach are discussed, and a final value estimate is established.

COST APPROACH
BBG, INC. 104 0118000076
COST APPROACH
The Cost Approach is a set of procedures through which a value indication is derived for the fee
simple interest in the subject property by estimating the current cost to construct a reproduction of
(or replacement for) the existing structure, including an entrepreneurial incentive, deducting
depreciation from the total cost, and adding the estimated land value. Adjustments may then be
made to the indicated leased fee value of the subject property to reflect the value of the property
interest being appraised.”
The procedure for applying the Cost Approach within the appraisal framework for the subject
property is as follows:
1. A land value estimate is derived.
2. An estimate of replacement cost new is estimated after a physical inspection of the improvements or a review of the architectural drawings. Replacement cost is defined as:
The estimated cost to construct, at current prices as of the effective appraisal date, a building with utility equivalent to the building being appraised, using modern materials and current standards, design, and layout.
3. From replacement cost new, any accrued depreciation is deducted. These items can be
segregated into physical, functional, and economic obsolescence.
4. Additional cost items would include indirect costs, developer's profit, and any other extraordinary items.
5. The final value via the Cost Approach is the sum of the land value and the depreciated cost of the improvements.
Although substantially renovated, the subject improvements were originally constructed circa
1969. As such, accrued physical depreciation that has occurred to the structure as a result of age
and normal wear, and functional obsolescence resulting from inadequacies in designs that are less
than current market standards are difficult to estimate. This fact tends to make the Cost Approach
a less effective and unreliable tool for estimating market value. Further, investors in the subject
market do not typically use the cost approach as a primary indication of value. The Cost Approach,
therefore, has not been utilized in this report.

INCOME CAPITALIZATION APPROACH
BBG, INC. 105 0118000076
INCOME CAPITALIZATION APPROACH
The Income Capitalization Approach is predicated on the assumption that there is a definite
relationship between the amount of income that a property is capable of producing and its value.
This Approach considers the ability of a property to produce income and recognizes that value is
the present worth of future benefits resulting from ownership of the property. The basic steps of
the Income Capitalization Approach are to estimate the gross income the property is capable of
generating, deducting vacancies and any rent deficiencies, which leaves effective gross income.
The estimated annual expenses are then deducted from the effective gross income. The result is
the indication of net operating income before debt service. The net operating income is capitalized
into an indication of value by the use of a capitalization rate, or it is projected into the future over
a selected but appropriate holding period and discounted along with the anticipated reversion (sale
price at the end of the holding period) at the investor's or market discount rate in order to arrive at
the net present value for the subject property.
Both income methods have been utilized by the appraiser in arriving at a value by the Income
Capitalization Approach. Argus software has been used in making cash flow projections.
Income
The subject property consists of a twenty-two story, plus lower levels, Class A office building.
According to New York City records, the building contains approximately 459,100 square feet of
gross building area, and a net leasable area of 418,131 square feet, of which 414,740 square feet
is upper floor office space, and 3,391 square feet is ground floor retail space. The improvements
were constructed in 1969 and renovated in 2001, and are in good overall condition. The property
is currently 97.54% leased and occupied by approximately 11 tenants, including Legal Aid
Society, City University of New York, Northrop Grumman, OTDA and Workers Compensation.
The two basement levels consist of an underground parking garage with a capacity of 250 cars.
There is currently a 10,270 square foot vacant office unit on the seventeenth floor available for
lease.
The subject rent roll is summarized as follows (the complete rent roll is presented in the
addendum):

INCOME CAPITALIZATION APPROACH
BBG, INC. 106 0118000076
Floor
Location Tenant Name SQ. FT. $ Per SF Lease Begin. Lease End.
Monthly
Rent Annual Rent Electric
Part 19th Central Medical Services 2,375 $32.75 3/1/2011 2/29/2012 $6,481.77 $77,781.24
$33.33 3/1/2012 2/28/2013 $6,596.56 $79,158.72
$33.92 3/1/2013 2/28/2014 $6,713.65 $80,563.80
$34.52 3/1/2014 2/28/2015 $6,833.07 $81,996.84
$35.14 3/1/2015 2/29/2016 $6,954.89 $83,458.68
$35.77 3/1/2016 2/28/2017 $7,079.15 $84,949.80
$36.41 3/1/2017 2/28/2018 $7,205.89 $86,470.68
$37.06 3/1/2018 2/28/2019 $7,335.16 $88,021.92
$37.73 3/1/2019 2/29/2020 $7,467.02 $89,604.24
$38.41 3/1/2020 2/28/2021 $7,601.51 $91,218.12
Part Ground Pasternack 3,391 $69.01 6/1/2014 5/31/2015 $19,499.92 $233,999.04 $989.94
Lobby $70.39 6/1/2015 5/31/2016 $19,889.92 $238,679.04
$71.79 6/1/2016 5/31/2017 $20,287.72 $243,452.64
$73.23 6/1/2017 5/31/2018 $20,693.47 $248,321.64
$74.69 6/1/2018 5/31/2019 $21,107.34 $253,288.08
Part 1st, 2nd C.U.N.Y 45,000 $29.00 9/1/2007 8/31/2008 $108,750.00 $1,305,000.00
& 3rd $29.73 9/1/2008 8/31/2009 $111,468.75 $1,337,625.00
$30.47 9/1/2009 8/31/2010 $114,255.47 $1,371,065.63
$31.23 9/1/2010 8/31/2011 $117,111.86 $1,405,342.27
$32.01 9/1/2011 8/31/2012 $120,039.65 $1,440,475.82 $123,750.00
$36.81 9/1/2012 8/31/2013 $138,040.64 $1,656,487.72 $10,312.50
$37.73 9/1/2013 8/31/2014 $141,491.66 $1,697,899.91
$38.67 9/1/2014 8/31/2015 $145,028.95 $1,740,347.41
$39.64 9/1/2015 8/31/2016 $148,654.67 $1,783,856.09
$40.63 9/1/2016 8/31/2017 $152,371.04 $1,828,452.50
$49.50 9/1/2017 8/31/2018 $185,625.00 $2,227,500.00 $0.00
$50.43 9/1/2018 8/31/2019 $189,112.50 $2,269,350.00 $0.00
$51.38 9/1/2019 8/31/2020 $192,669.75 $2,312,037.00
$52.35 9/1/2020 8/31/2021 $196,298.15 $2,355,577.74
$53.33 9/1/2021 8/31/2022 $199,999.11 $2,399,989.29
$54.34 9/1/2022 8/31/2023 $203,774.09 $2,445,289.08
$55.37 9/1/2023 8/31/2024 $207,624.57 $2,491,494.86
$56.41 9/1/2024 8/31/2025 $211,552.06 $2,538,624.76
$57.48 9/1/2025 8/31/2026 $215,558.10 $2,586,697.25
$58.57 9/1/2026 8/31/2027 $219,644.27 $2,635,731.20
Legal Aid (New Lease) 96,700 $37.00 11/1/2017 10/31/2019 $298,158.33 $3,577,900.00 $26,189.58
$38.00 11/1/2019 10/31/2020 $306,216.67 $3,674,600.00
$38.00 1/1/2019 10/31/2019 $306,216.67 $3,674,600.00
$38.00 11/1/2019 10/31/2020 $306,216.67 $3,674,600.00
$38.00 11/1/2020 10/31/2021 $306,216.67 $3,674,600.00
$39.00 11/1/2021 10/31/2022 $314,275.00 $3,771,300.00
$39.00 11/1/2022 10/31/2023 $314,275.00 $3,771,300.00
$40.00 11/1/2023 10/31/2024 $322,333.33 $3,868,000.00
$40.00 11/1/2024 10/31/2025 $322,333.33 $3,868,000.00
$41.00 11/1/2025 10/31/2026 $330,391.67 $3,964,700.00
$41.00 11/1/2026 10/31/2027 $330,391.67 $3,964,700.00
$42.00 11/1/2027 10/31/2028 $338,450.00 $4,061,400.00
$42.00 11/1/2028 10/31/2029 $338,450.00 $4,061,400.00
$43.00 11/1/2029 10/31/2030 $346,508.33 $4,158,100.00
$43.00 11/1/2030 10/31/2031 $346,508.33 $4,158,100.00
$44.00 11/1/2031 10/31/2032 $354,566.67 $4,254,800.00
$44.00 11/1/2032 10/31/2033 $354,566.67 $4,254,800.00
$45.00 11/1/2033 10/31/2034 $362,625.00 $4,351,500.00
$45.00 11/1/2034 10/31/2035 $362,625.00 $4,351,500.00
$46.00 11/1/2035 10/31/2036 $370,683.33 $4,448,200.00
$46.00 11/1/2036 10/31/2037 $370,683.33 $4,448,200.00
111 Livingston LLC RENT ROLL

INCOME CAPITALIZATION APPROACH
BBG, INC. 107 0118000076
Floor
Location Tenant Name SQ. FT. $ Per SF Lease Begin. Lease End.
Monthly
Rent Annual Rent Electric
Part 6th Legal Aid 6,000 $37.00 6/1/2015 10/31/2016 $18,500.00 $222,000.00 $1,625.00
7th, 8th, 9th, $37.00 11/1/2016 12/31/2017 $18,500.00 $222,000.00
10th, 11th $37.00 1/1/2018 12/31/2018 $18,500.00 $222,000.00
$37.00 1/1/2019 10/31/2019 $18,500.00 $222,000.00
$38.00 11/1/2019 10/31/2020 $19,000.00 $228,000.00
$38.00 11/1/2020 10/31/2021 $19,000.00 $228,000.00
$39.00 11/1/2021 10/31/2022 $19,500.00 $234,000.00
$39.00 11/1/2022 10/31/2023 $19,500.00 $234,000.00
$40.00 11/1/2023 10/31/2024 $20,000.00 $240,000.00
$40.00 11/1/2024 10/31/2025 $20,000.00 $240,000.00
$41.00 11/1/2025 10/31/2026 $20,500.00 $246,000.00
$41.00 11/1/2026 10/31/2027 $20,500.00 $246,000.00
$42.00 11/1/2027 10/31/2028 $21,000.00 $252,000.00
$42.00 11/1/2028 10/31/2029 $21,000.00 $252,000.00
$43.00 11/1/2029 10/31/2030 $21,500.00 $258,000.00
$43.00 11/1/2030 10/31/2031 $21,500.00 $258,000.00
$44.00 11/1/2031 10/31/2032 $22,000.00 $264,000.00
$44.00 11/1/2032 10/31/2033 $22,000.00 $264,000.00
$45.00 11/1/2033 10/31/2034 $22,500.00 $270,000.00
$45.00 11/1/2034 10/31/2035 $22,500.00 $270,000.00
$46.00 11/1/2035 10/31/2036 $23,000.00 $276,000.00
$46.00 11/1/2036 10/31/2037 $23,000.00 $276,000.00
Legal Aid 7,450 $37.00 1/1/2015 10/31/2019 $22,970.83 $275,650.00 $2,017.71
$38.00 11/1/2019 10/31/2020 $23,591.67 $283,100.00
$38.00 11/1/2020 10/31/2021 $23,591.67 $283,100.00
$39.00 11/1/2021 10/31/2022 $24,212.50 $290,550.00
$39.00 11/1/2022 10/31/2023 $24,212.50 $290,550.00
$40.00 11/1/2023 10/31/2024 $24,833.33 $298,000.00
$40.00 11/1/2024 10/31/2025 $24,833.33 $298,000.00
$41.00 11/1/2025 10/31/2026 $25,454.17 $305,450.00
$41.00 11/1/2026 10/31/2027 $25,454.17 $305,450.00
$42.00 11/1/2027 10/31/2028 $26,075.00 $312,900.00
$42.00 11/1/2028 10/31/2029 $26,075.00 $312,900.00
$43.00 11/1/2029 10/31/2030 $26,695.83 $320,350.00
$43.00 11/1/2030 10/31/2031 $26,695.83 $320,350.00
$44.00 11/1/2031 10/31/2032 $27,316.67 $327,800.00
$44.00 11/1/2032 10/31/2033 $27,316.67 $327,800.00
$45.00 11/1/2033 10/31/2034 $27,937.50 $335,250.00
$45.00 11/1/2034 10/31/2035 $27,937.50 $335,250.00
$46.00 11/1/2035 10/31/2036 $28,558.33 $342,700.00
$46.00 11/1/2036 10/31/2037 $28,558.33 $342,700.00
Legal Aid 1,750 $37.00 1/1/2017 10/31/2019 $5,395.83 $64,750.00 $5,687.50
$38.00 11/1/2019 10/31/2020 $5,541.67 $66,500.00 $473.96
$38.00 11/1/2020 10/31/2021 $5,541.67 $66,500.00
$39.00 11/1/2021 10/31/2022 $5,687.50 $68,250.00
$39.00 11/1/2022 10/31/2023 $5,687.50 $68,250.00
$40.00 11/1/2023 10/31/2024 $5,833.33 $70,000.00
$40.00 11/1/2024 10/31/2025 $5,833.33 $70,000.00
$41.00 11/1/2025 10/31/2026 $5,979.17 $71,750.00
$41.00 11/1/2026 10/31/2027 $5,979.17 $71,750.00
$42.00 11/1/2027 10/31/2028 $6,125.00 $73,500.00
$42.00 11/1/2028 10/31/2029 $6,125.00 $73,500.00
$43.00 11/1/2029 10/31/2030 $6,270.83 $75,250.00
$43.00 11/1/2030 10/31/2031 $6,270.83 $75,250.00
$44.00 11/1/2031 10/31/2032 $6,416.67 $77,000.00
$44.00 11/1/2032 10/31/2033 $6,416.67 $77,000.00
$45.00 11/1/2033 10/31/2034 $6,562.50 $78,750.00
$45.00 11/1/2034 10/31/2035 $6,562.50 $78,750.00
$46.00 11/1/2035 10/31/2036 $6,708.33 $80,500.00
$46.00 11/1/2036 10/31/2037 $6,708.33 $80,500.00
111 Livingston LLC RENT ROLL

INCOME CAPITALIZATION APPROACH
BBG, INC. 108 0118000076
Floor
Location Tenant Name SQ. FT. $ Per SF Lease Begin. Lease End.
Monthly
Rent Annual Rent Electric
Legal Aid 5,300 $37.00 1/1/2017 10/31/2019 $16,341.67 $196,100.00
$38.00 11/1/2019 10/31/2020 $16,783.33 $201,400.00 $1,435.42
$38.00 11/1/2020 10/31/2021 $16,783.33 $201,400.00
$39.00 11/1/2021 10/31/2022 $17,225.00 $206,700.00
$39.00 11/1/2022 10/31/2023 $17,225.00 $206,700.00
$40.00 11/1/2023 10/31/2024 $17,666.67 $212,000.00
$40.00 11/1/2024 10/31/2025 $17,666.67 $212,000.00
$41.00 11/1/2025 10/31/2026 $18,108.33 $217,300.00
$41.00 11/1/2026 10/31/2027 $18,108.33 $217,300.00
$42.00 11/1/2027 10/31/2028 $18,550.00 $222,600.00
$42.00 11/1/2028 10/31/2029 $18,550.00 $222,600.00
$43.00 11/1/2029 10/31/2030 $18,991.67 $227,900.00
$43.00 11/1/2030 10/31/2031 $18,991.67 $227,900.00
$44.00 11/1/2031 10/31/2032 $19,433.33 $233,200.00
$44.00 11/1/2032 10/31/2033 $19,433.33 $233,200.00
$45.00 11/1/2033 10/31/2034 $19,875.00 $238,500.00
$45.00 11/1/2034 10/31/2035 $19,875.00 $238,500.00
$46.00 11/1/2035 10/31/2036 $20,316.67 $243,800.00
$46.00 11/1/2036 10/31/2037 $20,316.67 $243,800.00
Part Ground OTDA 82,280 $21.05 3/1/2010 5/31/2010 $144,332.83 $1,731,994.00
Part 4th $26.50 6/1/2010 5/31/2011 $181,701.67 $2,180,420.00
5th $26.50 6/1/2011 5/31/2012 $181,701.67 $2,180,420.00
Part 6th $27.56 6/1/2012 5/31/2013 $188,969.73 $2,267,636.80
14th, 15th, 16th $27.56 6/1/2013 5/31/2014 $188,969.73 $2,267,636.80
Part 17th $28.66 6/1/2014 5/31/2015 $196,528.52 $2,358,342.27
$28.66 6/1/2015 5/31/2016 $196,528.52 $2,358,342.27
$29.81 6/1/2016 5/31/2017 $204,389.66 $2,452,675.96
$29.81 6/1/2017 5/31/2018 $204,389.66 $2,452,675.96
$31.00 6/1/2018 5/31/2019 $212,565.25 $2,550,783.00
$31.00 6/1/2019 5/31/2020 $212,565.25 $2,550,783.00
OTDA 39,265 $31.00 4/1/2011 5/31/2011 $101,434.58 $1,217,215.00
$31.00 6/1/2011 5/31/2012 $101,434.58 $1,217,215.00
$32.24 6/1/2012 5/31/2013 $105,491.97 $1,265,903.60 $0.00
$32.24 6/1/2013 5/31/2014 $105,491.97 $1,265,903.60
$33.53 6/1/2014 5/31/2015 $109,711.65 $1,316,539.74
$33.53 6/1/2015 5/31/2016 $109,711.65 $1,316,539.74
$34.87 6/1/2016 5/31/2017 $114,100.11 $1,369,201.33
$34.87 6/1/2017 5/31/2018 $114,100.11 $1,369,201.33
$36.27 6/1/2018 5/31/2019 $118,664.12 $1,423,969.39
$36.27 6/1/2019 5/31/2020 $118,664.12 $1,423,969.39
18th Northrop Grumman 20,500 $48.75 8/1/2016 7/31/2017 $83,281.25 $999,375.00 $7,260.42
$49.50 8/1/2017 7/31/2018 $84,562.50 $1,014,750.00
$50.25 8/1/2018 7/31/2019 $85,843.75 $1,030,125.00
$51.00 8/1/2019 7/31/2020 $87,125.00 $1,045,500.00
$51.75 8/1/2020 7/31/2021 $88,406.25 $1,060,875.00
Part 19th Workers Comp. 50,225 $27.85 4/1/2001 3/31/2003 $116,563.85 $1,398,766.20
22nd, 23rd $29.85 4/1/2003 3/31/2006 $124,934.69 $1,499,216.28
$31.85 4/1/2006 9/30/2008 $133,305.52 $1,599,666.24
$33.85 10/1/2008 3/31/2011 $141,676.35 $1,700,116.20
$45.00 2/1/2017 1/31/2019 $188,343.75 $2,260,125.00
Lobby Workers Com News Stand 4/1/2008 5/31/2010 $858.00 $10,296.00 Rent Inclusion
Garage Workers Com Parking 2/1/2017 1/31/2019 $900.00 $10,800.00 $67,803.75
111 Livingston LLC RENT ROLL

INCOME CAPITALIZATION APPROACH
BBG, INC. 109 0118000076
Floor
Location Tenant Name SQ. FT. $ Per SF Lease Begin. Lease End.
Monthly
Rent Annual Rent Electric
Garage Livingston Street Parking 2/1/2002 1/31/2004 $64,583.33 $775,000.00
2/1/2004 1/31/2006 $67,150.00 $805,800.00
2/1/2006 1/31/2008 $69,819.33 $837,832.00
2/1/2008 1/31/2010 $72,595.42 $871,145.00
2/1/2010 1/31/2012 $75,482.58 $905,791.00
2/1/2012 1/31/2014 $78,486.00 $941,832.00
2/1/2014 1/31/2016 $81,607.92 $979,295.00
2/1/2016 1/31/2017 $84,855.58 $1,018,267.00
2/1/2017 1/31/2020 $108,333.33 $1,300,000.00
2/1/2020 1/31/2023 $114,833.33 $1,378,000.00
2/1/2023 1/31/2026 $121,723.33 $1,460,680.00
2/1/2026 1/31/2029 $129,026.73 $1,548,320.80
2/1/2029 1/31/2032 $136,768.34 $1,641,220.05
Part 19th New York Energy 2,500 $28.00 8/1/2007 7/31/2009 $5,833.33 $69,999.96
$28.70 8/1/2009 7/31/2010 $5,979.17 $71,750.00
$29.42 8/1/2010 7/31/2011 $6,128.65 $73,543.75
$30.15 8/1/2011 7/31/2012 $6,281.86 $75,382.34 $972.92
$30.91 8/1/2012 7/31/2013 $6,438.91 $77,266.90
$31.68 8/1/2013 7/31/2014 $6,599.88 $79,198.57
$32.47 8/1/2014 7/31/2015 $6,764.88 $81,178.56 $972.92
$33.28 8/1/2015 7/30/2016 $6,934.00 $83,208.00
$34.12 7/31/2016 7/30/2017 $7,107.35 $85,288.20
$34.97 7/31/2017 7/30/2018 $7,285.03 $87,420.36
Part 19th Berkaman Law 4,125 $29.00 11/1/2008 4/30/2011 $9,968.75 $119,625.00 $11,343.72
$30.45 5/1/2011 10/31/2013 $10,467.19 $125,606.28 $945.31
$31.97 11/1/2013 4/30/2016 $10,989.69 $131,876.28
$33.57 5/1/2016 10/30/2018 $11,539.69 $138,476.28
20th, 21st Brooklyn Law 41,000 $51.00 2/1/2017 1/31/2018 $174,250.00 $2,091,000.00
$51.00 2/1/2018 1/31/2019 $174,250.00 $2,091,000.00 $12,812.50
$52.00 2/1/2019 1/31/2020 $177,666.67 $2,132,000.00
$52.00 2/1/2020 1/31/2021 $177,666.67 $2,132,000.00
$53.25 2/1/2021 1/31/2022 $181,937.50 $2,183,250.00
$54.00 2/1/2022 1/31/2023 $184,500.00 $2,214,000.00
$54.75 2/1/2023 1/31/2024 $187,062.50 $2,244,750.00
$55.50 2/1/2024 1/31/2025 $189,625.00 $2,275,500.00
$56.25 2/1/2025 1/31/2026 $192,187.50 $2,306,250.00
$57.00 2/1/2026 1/31/2027 $194,750.00 $2,337,000.00
$57.75 2/1/2027 1/31/2028 $197,312.50 $2,367,750.00
$58.50 2/1/2028 1/31/2029 $199,875.00 $2,398,500.00
$59.25 2/1/2029 1/31/2030 $202,437.50 $2,429,250.00
$60.00 2/1/2030 1/31/2031 $205,000.00 $2,460,000.00
$60.75 2/1/2031 1/31/2032 $207,562.50 $2,490,750.00
Part 17th Vacant 10,270 N/A N/A N/A $0.00 $0.00
Totals 418,131 $1,469,453.10 $17,633,437.25 $274,593.14
111 Livingston LLC RENT ROLL

INCOME CAPITALIZATION APPROACH
BBG, INC. 110 0118000076
Office Income – Lease Summary
Rent Roll - Office Summary
111 Livingston StreetSize Lease Lease Current TOTAL Rent Per
Tenant SF Start Expiration Monthly Rent YEARLY Sq. Ft.
Central Medical Services 2,375 3/1/2011 2/28/2021 $7,205.89 $86,470.68 $36.41
C.U.N.Y School 45,000 9/1/2007 8/31/2027 $185,625.00 $2,362,500.00 $52.50
Legal Aid (Extension/New Lease) 117,200 2015-2017 10/31/2037 $361,366.67 $4,336,400.00 $37.00
OTDA 121,545 3/1/2010 5/31/2020 $318,489.77 $3,821,877.29 $31.44
Brooklyn Law 41,000 2/1/2017 1/31/2032 $174,250.00 $2,091,000.00 $51.00
Northrop Grumman 20,500 8/1/2016 7/31/2021 $84,562.50 $1,014,750.00 $49.50
Workers Comp. 50,225 4/1/2001 1/31/2019 $188,343.75 $2,260,125.00 $45.00
New York Energy 2,500 8/1/2007 7/30/2018 $7,285.03 $87,420.36 $34.97
Berkaman Law 4,125 11/1/2008 10/30/2018 $11,539.69 $138,476.28 $33.57
Vacant 10,270 N/A N/A $0.00 $0.00 $0.00
Totals/Average (Occupied) 414,740 $1,338,668.30 $16,199,019.61 $40.05
The subject building is leased to multiple office tenancies comprising multiple floors. In total,
there are 9 total office tenants including the C.U.N.Y. School, which comprises 3 levels. There is
one vacant space on the 17th floor available for lease. The 12th floor is utilized for mechanical
areas; there is no 13th floor.
The largest tenant is OTDA (Office of Temporary and Disability Assistance), which occupied
multiple floors. Legal Aid also comprises multiple floors and is the second largest tenant. The
current contract rents range from $31.44 to $52.50 per square foot, with a weighted overall average
of $40.05 per square foot. Most of the subject office leases are seasoned deals, although Legal
Aid recently signed an expansion lease at $37.00 per square foot. The other most recent leases are
to Brooklyn Law, which has a lease term commencing in 2017 at $51.00 per square foot, and
Northrop Grumman, which signed a lease in 2016 starting at $49.50 per square foot.
Lease terms are typically 5 to 20 years with annual or periodic rent increases. Tenants typically
pay an electric inclusion. Recoveries typically consist of tenants paying their pro rata share of
increases in real estate taxes and operating expenses above a base year. The Workers Comp and
OTDA tenants have clauses in their leases for below market electric reimbursement charges as
defined by New York State.
Market Rent
In order to estimate the market rental rate for the vacant space and the leased space upon expiration,
we have gathered comparable rental data in the general market area. The following rents have
been utilized in estimating market rent. Typically, the market comparable rentals pay for their
own electric plus their proportionate share of real estate taxes above base year most with additional
periodic step-ups; some may pay operating expense escalations.

INCOME CAPITALIZATION APPROACH
BBG, INC. 111 0118000076
COMPARABLE OFFICE RENTALS MAP

INCOME CAPITALIZATION APPROACH
BBG, INC. 112 0118000076
COMPARABLE OFFICE RENTAL PHOTOGRAPHS
OFFICE RENTAL 1 16 COURT STREET BROOKLYN, NY

INCOME CAPITALIZATION APPROACH
BBG, INC. 113 0118000076
COMPARABLE OFFICE RENTAL PHOTOGRAPHS
OFFICE RENTAL 2 185 MONTAGUE STREET BROOKLYN, NY

INCOME CAPITALIZATION APPROACH
BBG, INC. 114 0118000076
COMPARABLE OFFICE RENTAL PHOTOGRAPHS
OFFICE RENTAL 3 55 WASHINGTON STREET BROOKLYN, NY

INCOME CAPITALIZATION APPROACH
BBG, INC. 115 0118000076
COMPARABLE OFFICE RENTAL PHOTOGRAPHS
OFFICE RENTAL 4 186 JORALEMON STREET BROOKLYN, NY

INCOME CAPITALIZATION APPROACH
BBG, INC. 116 0118000076
COMPARABLE OFFICE RENTAL PHOTOGRAPHS
OFFICE RENTAL 5 50 COURT STREET BROOKLYN, NY

INCOME CAPITALIZATION APPROACH
BBG, INC. 117 0118000076
COMPARABLE OFFICE RENTAL PHOTOGRAPHS
OFFICE RENTAL 6 1 PIERREPONT PLAZA BROOKLYN, NY

INCOME CAPITALIZATION APPROACH
BBG, INC. 118 0118000076
COMPARABLE OFFICE RENTAL PHOTOGRAPHS
OFFICE RENTAL 7 77 SANDS STREET BROOKLYN, NY

INCOME CAPITALIZATION APPROACH
BBG, INC. 119 0118000076
SURVEY OF COMPARABLE OFFICE RENTALS
Term Direct/
Sublease
1 6/17 MaGrann Associates
16 Court Street
Built 1928 Class A 18th 3,243 4 yrs Direct $55.00 N/A N/A
2 3/17 Lindamood-Bell Learning
185 Montague Street
Built 1929 Class B 3rd 2,300 N/A Direct $50.00 N/A N/A
3 12/16 Two Bulls
55 Washington Street
Built 1908 Class A 2nd 3,200 1 yr Direct $50.00 N/A N/A
4 10/16 Cornell University
186 Joralemon Street
Built 1934 Class B 9th 2,620 10 yrs Direct $50.57 N/A N/A
5 6/16
New York Presbyterian
Medical Group
50 Court Street
Built 1913 Class B 6th 15,881 15 yrs Direct $50.00 N/A 2
6 5/16
Dimes Savings Bank of
Willamsburgh
1 Pierrepont Plaza
Built 1988 Class A 8th 42,017 11 yrs Direct $48.50 $40.00 12
7 7/16 Wipro/Designit
77 Sands Street
Built 1962 Class B 11th 18,807 10 yrs Direct $57.00 $65.00 8
Bldg
No.
Lease
Date Tenant
Address Free Rent
(Mos.)Floor
Unit Size
(SF)
Base Rent
(PSF) TI (PSF)
Source: Field survey compiled by BBG, Inc.

INCOME CAPITALIZATION APPROACH
BBG, INC. 120 0118000076
Summary and Market Rent Conclusion
The office rents range from $48.50 to $57.00 per square foot, with an average of $51.58 and a
median of $50.00 per square foot. All of the comparable rentals are located in Downtown
Brooklyn, and consist of high-rise, Class A and B office buildings including both pre-war and post
war facilities. Rentals 3 and 7 are located within the desirable DUMBO / DUMBO Heights section
of Northwestern Brooklyn. These sections are typically less congested, and some properties have
the benefit of a waterfront amenity and views. Office Rentals 1, 2, 4, 5, and 6 are located within
the heart of Downtown Brooklyn, within a few blocks of the subject property. All of the
comparable rentals have proximate accessibility to area subways and local bus stops. Rentals 1, 3
and 6 are Class A buildings, while Rentals 2, 4, 5 and 7 are Class B properties which typically
offer similar to slightly inferior amenities and finishes in comparison to Class A properties in the
Downtown Brooklyn market. In addition, Rentals 1, 2, 3, 4 and 5 are older (pre-war) buildings,
while Rental 6 is newer (built in 1988); Rental 7 is similar in age to the subject.
Based on the foregoing, and with reference to ownership asking rents for various floor sections in
conjunction projections for tenant improvements and free rent, the appraiser concluded at the
following market rent for each floor tier:
Office Market Rent PSF Range
Floors 2-6 $45.00
Floors 7-19 $50.00
Floors 20-23 $52.50
The preceding market rent conclusion represents the average market rents for each floor and
building tier. Market rent may be higher or lower based on factors including unit size, floor level
and location within the building.
Lease terms are estimated to be 10 years, with 3.0% annual rent increases. New and renewal
tenants are assumed to pay increases in real estate taxes and operating expenses over a base year,
as well as an electric inclusion. Market rent is projected to increase by 3.0% per annum.
The majority of the comparable office rental data did not indicate the workletters. Consistent with
ownership practice, a tenant workletter of $40.00 per square foot will be forecast for new office
leases, with $15.00 per square foot projected for lease renewals. Although ownership has
historically not given a significant amount of free rent, we have projected a free rent abatement
period of 6 months for new tenants, and 3 months for renewals.
Correlation with Contract Rent (Office)
The average in place office rent is approximately $40.05 per square foot which is generally below
our market rent projections. We note that newer office leases at the subject (2016 and 2017) are
generally in the $50.00 per square foot range. Many of the office tenant leases are seasoned deals,
having been signed prior to 2010. Therefore, there appears to be some upside potential as leases
expire to move the office space closer to market levels over the next several years.

INCOME CAPITALIZATION APPROACH
BBG, INC. 121 0118000076
Retail Space
The subject facility has one ground floor unit that is currently configured as an office. However,
in addition to an interior entrance from the lobby, the space also has an entrance fronting on the
plaza on the Livingston Street side, and also has storefront type windows. Thus, the space can be
utilized as retail space, and would be ideal for a bank branch use. The current subject retail rent
roll is presented as follows:
Rent Roll - Retail Summary
111 Livingston StreetSize Lease Lease Current TOTAL Rent Per
Tenant SF Start Expiration Monthly Rent YEARLY Sq. Ft.
Pasternack 3,391 6/1/2014 5/31/2019 $20,693.47 $248,321.64 $73.23
Totals/Average (Occupied) 3,391 $20,693.47 $248,321.64 $73.23 Retail Rent Analysis
The current tenant is Pasternack Tilker Ziegler Walsh Stanton & Romano LLP, a company which
represents clients for workman’s compensation claims. The tenant has been in occupancy since 2014, and pays a current contract rental rate of $73.23 per square foot on a modified gross basis.
Market Rent
In order to estimate the market rental rate for the subject ground floor retail space, we have
analyzed comparable rental data in the general market area. The following rents have been utilized
in estimating market rent. We note that all of the retail rentals are typically semi-net, with the
tenants responsible for their pro rata share of increases in real estate taxes above a base year and
direct utilities. The comparable retail rentals are presented as follows:

INCOME CAPITALIZATION APPROACH
BBG, INC. 122 0118000076
COMPARABLE AVENUE RETAIL RENTALS MAP

INCOME CAPITALIZATION APPROACH
BBG, INC. 123 0118000076
COMPARABLE AVENUE RETAIL RENTALS
Comp
#
Address
Location
Tenant
Area
(sq. ft.)
Levels
Start
Date
Term
(yrs)
Base Rent
PSF Other Terms
1. 301 Atlantic Avenue
Brooklyn, NY
Kohler Co.
3,760 Ground 11/17 N/A $75.00 Tenant pays pro rata R.E. tax increases over base year; direct utilities. Annual rent increases.
2. 90 Furman Street
Brooklyn, NY
Poe Yoga
1,259 Ground 05/17 5 $100.00 Tenant pays pro rata R.E. tax increases over base year; direct utilities. Annual rent increases.
3. 384 Bridge Street
Brooklyn, NY
138 Willably LLC
3,468 Ground 05/17 N/A $85.00 Tenant pays pro rata R.E. tax increases over base year; direct utilities. Annual rent increases.
4. 86-88 Livingston Street
Brooklyn, NY
Lavatera Bistro
1,300 Ground 01/17 10 $100.00 Tenant pays pro rata R.E. tax increases over base year; direct utilities. Annual rent increases.
5. 198-202 Livingston Avenue
Brooklyn, NY
Century Medical & Dental
5,589 Ground 11/16 15 $87.00 Tenant pays pro rata R.E. tax increases over base year; direct utilities. Annual rent increases.
6. 81 Fleet Place
Brooklyn, NY
God Coast Bank
1,762 Ground 06/16 10 $75.00 Tenant pays pro rata R.E. tax increases over base year; direct utilities. Annual rent increases.
Average $87.00
Source: Field survey compiled by BBG, Inc.
Summary and Market Rent Conclusion – Retail
The comparable retail rentals indicated an unadjusted range from $75.00 to $100.00 per square
foot, with an average of $87.00 per square foot. Rentals 1, 3, 4 and 5 are located within a few
blocks of the subject, within the Downtown Brooklyn core. Rental 2 is located at the northern
fringe of the Brooklyn Heights neighborhood, close to the waterfront. Rental 6 is located east of
Flatbush Avenue, or just outside the Downtown Core and would require an nominal upward
adjustment. In terms of rentable area, Rentals 2, 4 and 6 are smaller units and would require
downward adjustments, while Rental 5 is a larger demised space and would require an upward
adjustment.
All of the retail rentals have good frontage and exposure. The subject has slightly inferior exposure
due to the setback of the space on the building plaza. Based upon the subject unit size, its degree

INCOME CAPITALIZATION APPROACH
BBG, INC. 124 0118000076
of mezzanine area, location and plaza set back, we have concluded to the following market rent
for the subject’s ground floor / mezzanine retail unit:
Retail Market Rent PSF Range
Ground Floor Retail $75.00
It is assumed that retail tenants will pay their pro rata share of real estate tax increases over base
year, and be sub-metered for electric usage. Lease terms are estimated to be 10 years, with 3.0%
annual increases. There will be six months free rent for retail leases. No tenant improvement
allowance will be forecast for retail leases.
Parking Garage Space
The subject facility has a two level, subterranean parking garage that comprises approximately
50,000 square feet (25,000 square feet per level). The indicated legal capacity is 150 spaces;
however, due to the size of the parking area, the garage can accommodate 250 or more vehicles.
The space is leased to Icon Parking under a long term agreement. The lease terms are summarized
as follows:
Rent Roll - Parking Summary
111 Livingston StreetActual Lease Lease Current TOTAL Rent Per
Tenant Spaces Start Expiration Monthly Rent YEARLY Actual Space
Icon Parking 250 2/1/2002 1/31/2004 $64,583.33 $775,000.00 $3,100.00
2/1/2004 1/31/2006 $67,150.00 $805,800.00 $3,223.20
2/1/2006 1/31/2008 $69,819.33 $837,832.00 $3,351.33
2/1/2008 1/31/2010 $72,595.42 $871,145.00 $3,484.58
2/1/2010 1/31/2012 $75,482.58 $905,791.00 $3,623.16
2/1/2012 1/31/2014 $78,486.00 $941,832.00 $3,767.33
2/1/2014 1/31/2016 $81,607.92 $979,295.00 $3,917.18
2/1/2016 1/31/2017 $84,855.58 $1,018,267.00 $4,073.07
2/1/2017 1/31/2020 $108,333.33 $1,300,000.00 $5,200.00
2/1/2020 1/31/2023 $114,833.33 $1,378,000.00 $5,512.00
2/1/2023 1/31/2026 $121,723.33 $1,460,680.00 $5,842.72
2/1/2026 1/31/2029 $129,026.73 $1,548,320.80 $6,193.28
2/1/2029 1/31/2032 $136,768.34 $1,641,220.05 $6,564.88
The lease was recently renewed and the lease term reportedly based upon the actual number of
spaces (250) rather than the legal number (150). The tenant also pays electric charges which equate
to approximately $0.05 to $0.06 per square foot of total gross building area.
In order to determine the reasonableness of the contract rent, the following parking garage
comparable rentals were referenced. Due to the lack of recent garage lease activity within the New
York City Outer Boroughs and the high density nature of Downtown Brooklyn, comparable rental
data from nearby Manhattan were analyzed.

INCOME CAPITALIZATION APPROACH
BBG, INC. 125 0118000076
PARKING GARAGE RENTALS
Lease Term # of Rent/
No. Address Date Years Spaces Space Comments
1 670 Pacific
670 Pacific Street
Brooklyn, NY
Aug-16 15 86 $4,942 Gross lease. Annual rent increases. Lower
level garage within a newly constructed
apartment building.
2 866 United Nations
Plaza
East 49th Street
New York, NY
Jul-16 10 175 $8,000 Gross lease. Annual CPI increases. 2-level
garage at the base of a mixed-use property
across from the United Nations.
3 The Marc
260 West 54th Street
New York, NY
Jan-16 5 355 $6,831 Gross lease. 2% annual rent steps. 4-level
garage at the base of an apartment building
in Midtown.
4 41-47 East 21st Street
New York, NY
Jan-15 10 175 $10,377 Real Estate tax increases over base year.
3% annual rent steps. A four-story parking
facility in the Flatiron district.
Average $7,538
The parking garage rentals are located in Brooklyn and Manhattan, and indicate a range of $4,942
to $10,377 per space, averaging $7,538 per space. The rentals located in Manhattan would all
require downward adjustments (Rentals 2, 3 and 4). Based upon the preceding data, it appears that
the subject current rental rate of $5,200 per parking space appears reasonable. We note that the
current lease rate for the subject Icon Parking tenant is effective as of 2017 (negotiated).
Newsstand
The subject facility also has a newsstand and concessions space in the lobby. The lease is tied to
the OTDA and Worker’s Comp. leases. The current rent is $10,296 per annum with 3.0% annual
rent increases. The lease terms are on a gross basis.
Miscellaneous / Other Income
In addition to the parking garage lease, parking garage electric and newsstand lease, the subject
facility generates miscellaneous income from other sources. These include parking income for the
Worker’s Comp. tenant ($900.00 per month), and a rooftop license income of $32,818 per annum with 3.0% annual rent increases. Total parking and miscellaneous income is summarized as
follows:
Icon Parking Garage Rent $1,300,000
Icon Parking Garage Electric $22,327
Workers Comp. Parking $10,800
Newsstand Rental $10,296
Rooftop License $32,818
Total Other Income $1,376,241
The Workers Comp lease expires in 2019 and therefore the parking income would also expire at
that time.

INCOME CAPITALIZATION APPROACH
BBG, INC. 126 0118000076
Including reimbursement income, which consists of tenants paying a proportion of real estate tax
and operating expenses over a predetermined base year, and electric charges, total reimbursement
and other income was reported to be $1,977,212 in 2013, $2,044,084 in 2014, $3,178,069 in 2015,
$2,805,407 in 2016 and $3,113,990 in 2017. Based upon the discounted cash flow analysis, total
reimbursement and miscellaneous income is forecast to be $3,170,944 in Year 1 of the model.
Lease Up of Vacant Office Space
The subject facility currently has a 10,270 square foot vacant unit available for lease which is
located on the 17th floor. We will therefore apply market rent of $50.00 per square foot to this
space, under the assumption of a 10 year lease. Based upon the relative strength of the local
market, we will assume lease up within a 6 month period. Lease up will be subject to a full leasing
commission and tenant improvement allowance, as well as 6 months free rent. We note that this
is arbitrary, and that actual vacant office unit could lease up sooner or later than indicated.
Lease Options
Two of the subject occupancy tenants have lease options – Workers Comp. and OTDA (82,280
square foot primary space). The Workers Comp. option appears to be slightly above market; we
will therefore assume that this space rolls to market. The OTDA tenant has a 10 year option at
95% of fair market rent; we will assume that the tenant exercises the option.
Renewal Probability
According to the PricewaterhouseCoopers Korpacz (PwC) Investors Survey for the Fourth Quarter
2017, tenant retention (renewal probability) ranges from 50% to 85% within the National CBD
office market. Based upon current market conditions for office space within the market, we
estimate a renewal probability factor of 70% for office and retail space which is consistent with
ownership projections. We have assumed that all tenant spaces will roll to market upon current
lease expiration.
Downtime Between Leases (Space Absorption)
According to the PricewaterhouseCoopers Korpacz (PwC) Investors Survey for the Fourth Quarter
2017, downtime modeled between leases typically ranges from 6 to 12 months. The subject facility
is comprise of office, retail and parking garage space. Based upon the current relative strength of
the local market and ownership projections, downtime between leases is estimated at 8 months for
all tenant spaces.
Leasing Fees and Tenant Improvements
For the subject property, a tenant workletter of $40.00 per square foot will be granted for new
office lease deals, with renewal workletters of $15.00 per square foot. Minimal improvement
allowances are provided for retail tenants which is typical of the market; retail tenant spaces are
often leased on an “as is” basis, with the tenant responsible for the buildout. Therefore, no
workletter will be forecast for the subject retail space.

INCOME CAPITALIZATION APPROACH
BBG, INC. 127 0118000076
Conversations with New York real estate brokers have revealed that they receive 40% on a 10-
year lease as follows: Year 1, 6.25%; Year 2, 5%; Years 3, 4 and 5; 4.375%, Years 6 through
10; 3.125%. For renewals, the commission schedule totals roughly 16% of the effective gross
lease with percentage allocations as follows: Year 1, 2.5%; Year 2, 2%; Years 3, 4 and 5; 1.75%,
Years 6 through 10; 1.25%. The leasing expenditures were analyzed on a lease-by-lease basis.
Commissions are to be paid throughout the term of occupancy.
Holding Period
According to the PricewaterhouseCoopers (PwC) Investors Survey for the Fourth Quarter 2017
typical holding periods range from 5 to 12 years, averaging 8.5 years. A typical holding period is
ten-years, with the reversionary value based upon the net operating income in Year 11. As the
10th year of the discounted cash flow represents stabilized occupancy, we have utilized a 10-year
holding period with the reversion based on Year 11 net operating income (stabilized).
Vacancy and Collection Loss
According to CoStar Property Services, the office vacancy rate in the New York Outer Boroughs
market area increased to 7.2% at the end of the fourth quarter 2017. The vacancy rate was 6.3% at
the end of the third quarter 2017, 6.6% at the end of the second quarter 2017, and 6.6% at the end
of the first quarter 2017. Class-A projects reported a vacancy rate of 9.3% at the end of the fourth
quarter 2017, 7.6% at the end of the third quarter 2017, 9.3% at the end of the second quarter 2017,
and 8.7% at the end of the first quarter 2017.
A competitive set of 16 Class A buildings within the subject market has a current direct available
vacancy rate of 1.8% and an overall available vacancy rate of 2.3%. The available vacancy rate is
well below the Downtown Brooklyn submarket vacancy rate of 5.5%, and below the Downtown
Brooklyn Class A office vacancy rate of 3.5%. The competitive buildings exhibit vacancy rates of
0.0% to 14.9%, with 8 of the 16 buildings at a reported 100% occupancy.
According to CoStar Property Services, the New York Outer Borough’s retail vacancy rate increased in the fourth quarter 2017, ending the quarter at 3.4%. Over the past four quarters, the
market has seen an overall increase in the vacancy rate, with the rate going from 3.0% in the first
quarter 2017, to 3.2% at the end of the second quarter 2017, 3.3% at the end of the third quarter
2017, to 3.4% in the current quarter.
The subject property is 97.54% leased and occupied with primarily government and institutional
tenancies. Based on a blending of occupancy rates exhibited in comparable neighboring buildings
and the subject property's present occupancy rate and expiration schedule, vacancy and collection
loss has been estimated at 5.0% throughout the holding period, with 3.5% allocated to vacancy
and 1.5% allocated to collection loss. Vacancy and collection loss has been excluded from the
following government and institutional entities: Legal Aid, C.U.N.Y. School, ODTA, Northrop
Grumman and Workers Comp.

INCOME CAPITALIZATION APPROACH
BBG, INC. 128 0118000076
OPERATING EXPENSE ANALYSIS
An analysis of the subject's existing use and occupancy was utilized in conjunction with market-
derived findings and information provided by the buyer. The subject expenses are analyzed on the
basis of gross building area of 459,100± square feet. Historical information was provided for 2013,
2014, 2015, 2016 and 2017.
The historical information was cross checked with respective market trends as compared to other
similar office buildings located in the subject's market area. Expenses are analyzed on a per square
foot basis. Each expense comparable consists of an office building located in Brooklyn or Queens.
All expense comparables are based upon New York City RPIE (real property income and expense)
record filings for 2015 and 2016.
The appraiser's reconstructed operating expense analysis was projected over the next 12 months
from the effective date of valuation and is presented on the following pages.

INCOME CAPITALIZATION APPROACH
BBG, INC. 129 0118000076
GROSS BUILDING AREA (SF) 459,100
Actual 2015 Actual 2016
Total Per SF Total Per SF Total Per SF Total Per SF Total Per SF
POTENTIAL GROSS REVENUE
Base Rental Income $13,920,390 $30.32 $14,121,372 $30.76 $14,328,989 $31.21 $15,700,094 $34.20 $15,904,201 $34.64
Total Reimbursement and Other Income $1,977,212 $4.31 $2,044,084 $4.45 $3,178,069 $6.92 $2,805,407 $6.11 $3,113,990 $6.78
TOTAL POTENTIAL GROSS REVENUE $15,897,602 $34.63 $16,165,456 $35.21 $17,507,058 $38.13 $18,505,501 $40.31 $19,018,191 $41.42
OPERATING EXPENSES
Insurance $192,127 $0.42 $168,689 $0.37 $247,840 $0.54 $156,340 $0.34 $210,649 $0.46
Utilities $2,875,834 $6.26 $3,147,037 $6.85 $2,975,934 $6.48 $2,944,307 $6.41 $3,152,646 $6.87
Water and Sewer $45,688 $0.10 $43,646 $0.10 $45,000 $0.10 $180,000 $0.39 $220,000 $0.48
Payroll $245,111 $0.53 $374,017 $0.81 $393,431 $0.86 $352,825 $0.77 $485,974 $1.06
Repairs & Maintenance $740,180 $1.61 $940,228 $2.05 $942,876 $2.05 $1,086,362 $2.37 $1,160,532 $2.53
General and Administrative $149,366 $0.33 $47,666 $0.10 $51,095 $0.11 $16,706 $0.04 $47,159 $0.10
Legal and Professional Fees $130,138 $0.28 $130,081 $0.28 $107,766 $0.23 $15,876 $0.03 $28,785 $0.06
Rent $21,840 $0.05 $20,020 $0.04 $24,010 $0.05 $18,790 $0.04 $14,649 $0.03
Management $372,476 $0.81 $418,639 $0.91 $469,992 $1.02 $552,618 $1.20 $478,043 $1.04
Subtotal $4,772,760 $9.98 $5,290,023 $11.16 $5,257,945 $10.91 $5,323,825 $11.60 $5,798,437 $12.17
Real Estate Taxes/BID Taxes $2,594,011 $5.65 $2,807,786 $6.12 $3,234,800 $7.05 $3,242,929 $7.06 $3,419,683 $7.45
TOTAL EXPENSES $7,366,771 $16.05 $8,097,809 $17.64 $8,492,746 $18.50 $8,566,753 $18.66 $9,218,120 $20.08
NET OPERATING INCOME $8,530,831 $18.58 $8,067,647 $17.57 $9,014,312 $19.63 $9,938,748 $21.65 $9,800,071 $21.35
Actual 2013
111 Livingston Street
INCOME & EXPENSE ANALYSIS
Actual 2017Actual 2014

INCOME CAPITALIZATION APPROACH
BBG, INC. 130 0118000076
COMP NO. 1 2 3 4 5 6 7 Min Max Avg.
Building Address146 Concord
Street
175 Remsen
Street
46-50 Court
Street351 Jay Street
32 Smith
Street
30-30
Thomson
Street
80-02 Queens
Boulevard
Location Brooklyn, NY Brooklyn, NY Brooklyn, NY Brooklyn, NY Brooklyn, NY Queens, NY Queens, NY
GBA (SF) 309,952 129,520 128,000 978,544 193,195 625,000 514,975
Expense Year 2016/2017 2016/2017 2015/2016 2015/2016 2015/2016 2015/2016 2015/2016
OPERATING EXPENSES
Insurance $0.73 $0.60 $0.81 $0.17 $0.77 $0.86 $0.55 $0.17 $0.86 $0.64
Utilities $1.43 $2.50 $2.39 $2.37 $3.96 $3.01 $2.51 $1.43 $3.96 $2.60
Water and Sewer $0.52 $0.39 $0.15 $0.31 $0.35 $0.36 $0.28 $0.15 $0.52 $0.34
Payroll/Security $2.66 $2.26 $3.04 $3.43 $2.22 $4.67 $2.93 $2.22 $4.67 $3.03
Repairs & Maintenance $3.75 $2.33 $4.88 $1.99 $2.18 $1.38 $3.62 $1.38 $4.88 $2.88
General, Administrative, Professional $1.16 $3.11 $1.88 $0.54 $0.61 $2.18 $1.61 $0.54 $3.11 $1.58
Management $1.33 $1.12 $1.89 $1.11 $1.50 $0.45 $0.06 $0.06 $1.89 $1.07
TOTAL EXPENSES EXCL. RE TAXES $11.58 $12.31 $15.04 $9.92 $11.59 $12.91 $11.56 $9.92 $15.04 $12.13
111 Livingston Street
EXPENSE COMPARABLES

INCOME CAPITALIZATION APPROACH
BBG, INC. 131 0118000076
ESTIMATED OPERATING EXPENSES
The preceding expense pro forma for the subject property is based on operating projections
effective over the next twelve months. The following is a summary of our expense estimates as
applied to the subject property:
Real Estate Taxes/BID Taxes: The subject's real estate tax payment was based on the
current projected tax payment of $3,519,766 or $7.67 per
square foot. Based on tax comparables (see "Assessed Value
and Real Estate Taxes" section), the subject's tax burden
appears reasonable. Business Improvement District (BID)
taxes are projected to be $64,407 for 2018. Total real estate
and BID taxes are projected to be $3,584,173.
Insurance: Insurance costs vary by the type of coverage. Costs are
generally lower for larger buildings (on a per square foot
basis) or multi-building policies. The subject’s historical expense for this item has ranged from $0.34 to $0.54 per
square foot, with an average of $0.43 per square foot. The
expense comparables indicate a wide range of $0.17 to $0.86
per square foot, averaging $0.64 per square foot. Based upon
the foregoing, given the subject’s proven history, we will
project an insurance expense of $0.45 per square foot, which
translates to $206,595 per annum.
Utilities: This category includes all utilities associated with the
property, including common and tenant electric and gas/fuel.
The subject facility has a powerplant that generates its own
heating and electricity. The subject’s combined utilities
expenses ranged from $6.26 to $6.87 per square foot,
averaging $6.58 per square foot. The expense comparables
indicate a wide range from $1.43 to $3.96 per square foot
with an average of $2.60 per square foot, which is below the
subject historical range as the power plant operation is more
costly to operate. The subject power plant has 5
boiler/generators which operate on both gas and diesel fuel.
Based upon the foregoing, given the subject history, we have
projected total utilities expenses at $6.85 per square foot,
which translates to $3,144,835 per annum. We note that
certain government tenants reimburse the landlord for
electric charges based upon a fixed, below market formula.
Water and Sewer: The subject water and sewer charges have fluctuated
significantly between 2013, 2014 and 2015, and 2016 and
2017. The average expense for the first three years stated
was $0.10 per square foot, while the average cost for this
category in 2016 and 2017 was $0.44 per square foot. The

INCOME CAPITALIZATION APPROACH
BBG, INC. 132 0118000076
expense comparables indicate a wide range of $0.15 to $0.52
per square foot, averaging $0.34 per square foot.
Considerate of the expense for the most recent years (2016
and 2017), we will project water and sewer expenses of $0.40
per square foot, which translates to $183,640 per annum.
Payroll: Payroll expenses including salaries have historically ranged
$0.53 to $1.06 per square foot, averaging $0.81 per square
foot. The expense comparables ranged from $2.22 to $4.67
per square foot with an average of $3.03 per square foot.
Given the level of staffing at the subject facility, and based
upon the historical expense for this category, we have
projected this expense at $1.00 per square foot or $459,100
per annum for payroll. Separate security expenses
projections will be forecast.
Repairs and Maintenance: This expense varies depending on the age and quality of each
building, management philosophy, services provided, and
accounting methodology. Some management companies
expense items which typically are included as a capital cost.
In addition, repairs and maintenance costs may change from
year to year; in some cases, repairs that require attention may
be postponed due to cash flow considerations. In projecting
a repairs and maintenance cost for the upcoming year, we
considered the age and condition of the building as well as
services provided.
The subject’s historical expense for this item has ranged from $1.61 to $2.53 per square foot, averaging $2.12 per
square foot. The expense comparables have indicated a wide
range from $1.38 to $4.88 per square foot with an average of
$2.88 per square foot. Based on the foregoing and given the
age and condition of the subject, we will project a repairs &
maintenance expense of $2.50 per square foot of GBA, or
$1,147,750 annually.
General and Administrative: This category includes computer expenses, transportation,
employee training, telephone, office expenses, and other
sundry items. The subject’s historical expense for this item has ranged from $0.04 to $0.33 per square foot, averaging
$0.14 per square foot.
The expense comparables range from $0.54 to $3.11 with an
average of $1.58 per square foot; however, this category also
included professional fees and other non-reimbursable
expenses.

INCOME CAPITALIZATION APPROACH
BBG, INC. 133 0118000076
Based upon the subject’s history, a projection of $0.30 per
square foot ($137,730 per annum) has been forecast; this
item is non-recoverable. This includes an annual rental
payment that the subject property incurs of approximately
$0.05 per square foot. We will forecast separate expenses
for professional fees and other non-reimbursable items in
separate sections.
Legal and Professional Fees: Professional fees include legal fees, consultant fees, permits
and engineering fees. The subject historical expense ranged
from $0.03 to $0.28 per square foot, averaging $0.18 per
square foot. The expenses comparables included this expense
are part of total miscellaneous expenses. Based upon the
consistent subject history, we have forecast this expense at
$0.10 per square foot, which translates to $45,910 per
annum. This item is non-recoverable.
Total general, administrative and legal and professional fees
are projected at $0.40 per square foot, or $183,640 per
annum, which is below the range of the expenses
comparables.
Management: Fees charges by local management companies for similar
office properties are usually 2% to 5% of effective gross
revenue (including recoveries). Ownership has applied a
market oriented management expense of approximately
2.30% to 2.70% per annum based upon effective gross
income. The subject historical expense has ranged from
$0.81 to $1.20 per square foot, averaging $1.00 per square
foot.
We will therefore project management at 2.50% of total
effective gross revenue (including recoveries). This fee does
not include leasing commissions. The 2.50% management
fee translates into $518,015 in the first year of our analysis
or $1.13 per square foot (non-recoverable). The projection
is within the comparable range of $0.06 to $1.89 per square
foot with an average of $1.07 per square foot and is
consistent with historical operations.
Operating expenses are projected as follows:

INCOME CAPITALIZATION APPROACH
BBG, INC. 134 0118000076
Insurance
Insurance $206,595 $0.45
Utilities $3,144,835 $6.85
Water and Sewer $183,640 $0.40
Payroll $459,100 $1.00
Repairs & Maintenance $1,147,750 $2.50
General and Administrative $137,730 $0.30
Legal and Professional Fees $45,910 $0.10
Management $518,015 $1.13
Subtotal $5,843,575 $12.73
Real Estate Taxes/BID Taxes $3,584,173 $7.81
TOTAL EXPENSES $9,427,748 $20.54 Expense Growth Rates
Real estate taxes are projected to increase at 3.0% per annum. With the exception of the
management expense, which is a percentage of effective gross income, the balance of the operating
expenses are projected to escalate at a rate of 3.0% per annum. The 3.0% appreciation is consistent
with general historical increases in the marketplace.
Reserves
Reserves provide for the periodic replacement of building components that wear out more rapidly
than the building itself and that must be replaced periodically during the building's economic life.
This item is estimated at $0.20 per square foot of gross building area.

INCOME CAPITALIZATION APPROACH
BBG, INC. 135 0118000076
DISCOUNT RATE
In order to develop an indication of value by the Income Capitalization Approach, discounted cash
flow analysis, it is necessary to establish an acceptable yield rate to discount the annual cash flows
and the reversion value.
Typical investors require a rate of return for investment quality property such as the subject, which
is greater than the safe, or "riskless" rates offered for long term treasury notes and bonds or high
grade corporate bonds. The difference between an investor's required rate of return and the safe
rate is basically the premium necessary to compensate the investor for the added risks of inflation,
management, and lack of liquidity offered by a real estate investment. The following rates have
been used as market indicators (Ycharts.com, St. Louis Fed, Moody’s and Bloomberg websites, December 2017):
SURVEY OF COMPETITIVE RATES
Federal Funds Rate 1.16%
Prime Rate 4.25%
10-year Treasury Notes 2.37%
20-year Treasury Notes 2.57%
30-year Treasury Notes 2.77%
Corporate Bonds (Aaa) 3.57%
Corporate Bonds (Baa) 4.27%
State and Local Bonds 2.74%
Source: YCharts.com, St. Louis Fed, Moody’s, Bloomberg December 2017
The Federal Funds Rate is a foundational rate determining the cost of funds by Federal Reserve
banks to depository institutions. The Prime Rate is a base rate posted by large banks for loans to
corporations. Long term issues such as 10, 20 and 30-year Treasury Bonds are guaranteed by the
federal government. Corporate Bonds are long term securities protected by the creditworthiness of
the issuer. Municipal Bonds are free of tax liabilities and, therefore, the return is typically less than
investment opportunities which are taxable.
Another source of anticipatory yield rates is provided by the Real Estate Research Corporation's
and PricewaterhouseCoopers' investment surveys, which summarize expected rates of return,
including capitalization rates and income and expense growth rates, from a representative sample
of institutional investors. The rates reflect acceptable expectations of yields desired by investors
currently in the market place. The rates reflect acceptable expectations of yields desired by
investors currently in the market place. Situs R.E.R.C. and PricewaterhouseCoopers (PwC) report
pre-tax yields for CBD (central business district) and New York City office buildings ranging from
5.50% to 9.00% with an average between 6.90% and 7.50%.

INCOME CAPITALIZATION APPROACH
BBG, INC. 136 0118000076
Survey Property Type Discount Rate
PricewaterhouseCoopers (PwC) National CBD 5.50% to 9.00%
Fourth Quarter 2017 Office Market 7.05% average
Situs R.E.R.C. National CBD 6.50% to 8.50%
Fourth Quarter 2017 (Flash) Office Market 7.50% average
Situs R.E.R.C. New York City 6.90% average
Third Quarter 2017 Office Market
Liquidity, asset management and risk are concerns to all investors. Of all the property types, most
credit is available for residential transactions, though the capital markets have recovered somewhat
for "Core-class" projects with strong tenancy. These effects are measured below, as overall yields
for real estate are compared to those of less-risky alternatives, which generally greater offer greater
liquidity and require less management attention.
After setting a low in mid-2007 to 2008, spreads over 10-years Treasuries reached a peak of 670
basis points in late 2009 early 2010. The increasing spreads were the result in the general
perception of fear in the capital markets as virtually every class of investment has been damaged.
By 2010-2011, the variance of yields has begun to tighten, as the spread over the 10 year bond
tightened to 580 basis points, increasing back to 680 in the fourth quarter 2012. However, there
is a mood of optimism in the most recent four years, as the spread has remained between 5.5%and
5.8%.

INCOME CAPITALIZATION APPROACH
BBG, INC. 137 0118000076
In selecting an appropriate discount rate, we have considered the foregoing yields as well as the
subject property's location, age, and average condition relative to competing properties. We have
also taken into consideration its current leasing status. In the development of the discount rate for
the subject property, consideration was given to the risk, liquidity, and the time and expense of
asset management inherent with income-producing property investment. The summation approach
was utilized to account for yield expectations associated with these investment considerations.
A 3.50% basic rate was used based on the return exhibited by corporate and municipal bonds. The
3.50% basic rate is increased by 100 basis points for liquidity, 100 basis points for asset
management, and 100 basis points for risk. This results in a 6.50% yield rate. Based on the
foregoing, it is our opinion that a 6.50% before tax discount or yield rate would be required by a
typical investor for an office building like the subject.
The consensus of those actively engaged in the marketplace for office buildings is that internal
rates of return (based upon forecasting techniques and assumptions similar to those utilized herein)
fall within a broad range depending upon numerous risk factors, including, among others:
⋅ Location: the better the location, the lower the IRR. The subject is well located within the heart of the Downtown Brooklyn office submarket. Accessibility and linkages are considered to be above average. Downtown Brooklyn has emerged as prime office submarket within the New York City Outer Boroughs. The immediate area has very high pedestrian traffic. Given the appeal of this location, investors consider this a “core” location.
⋅ Physical Characteristics of the Subject Property: the newer the property, the higher the quality of construction and finishes, and the better the design and layout of the physical plant, the lower the IRR. The subject is an older facility (1969) that has been well maintained, having been renovated and updated as necessary.
⋅ Degree of Forecasted Cash Flow Growth: the greater the growth forecasted, the higher the IRR. The degree of cash flow growth is based on historic trends and current economic conditions.
⋅ Amount of Equity Investment Required: the greater the required equity investment (that portion of the total acquisition cost not typically funded by conventional financing), the higher the IRR. Today's capital market allows for relatively low degrees of equity.
⋅ Length of Projection Period: the longer the projection period, the higher the IRR. We have utilized a slightly longer typical holding period in our analysis.
⋅ Type of Investment: the riskier the perceived return on investment for a particular type of real estate, the higher the IRR. The subject is a good quality Class A office property leased primarily by government and institutional tenancies. As such, national and international institutional investors would consider acquisition. Since these investors have access to broad capital markets, their costs of capital are generally lower than regionals, leading them to accept lower rates of return.
In our opinion, due to the subject property's: (a) quality Downtown Brooklyn submarket location;
(b) good condition; (c) the caution used in forecasting rental rates and vacancy; (d) the relatively
low amount of equity that would be required in today's economic climate; (e) relatively typical

INCOME CAPITALIZATION APPROACH
BBG, INC. 138 0118000076
holding period; and (f) average market risk due to quality tenancy in place including below market
rents, we believe that a 6.50% discount rate is appropriate for the subject property.
Terminal Capitalization Rate and Estimated Reversion
Survey Property Type Terminal Capitalization Rate
PricewaterhouseCoopers (PwC) National CBD 4.75% to 8.00%
Fourth Quarter 2017 Office Market 6.16% average
Situs R.E.R.C. National CBD 5.50% to 7.50%
Fourth Quarter 2017 (Flash) Office Market 6.60% average
Situs R.E.R.C. New York City 5.70% average
Third Quarter 2017 Office Market
As indicated in the investment surveys, terminal capitalization rates for CBD and New York City
office properties typically range from 4.75% to 8.00% for institutional quality investments, with
the predominant rates between 5.70% and 6.60%.
As described above in our development of the overall IRR, the subject property represents a very
good quality, Class A office property within a desirable Downtown Brooklyn office submarket.
Therefore, we will utilize a 5.50% terminal capitalization rate to capitalize the reversionary year's
projected net operating income into a reversion value. From this reversion we have deducted a
5.00% sales cost which includes commissions and transfer taxes.

INCOME CAPITALIZATION APPROACH
BBG, INC. 139 0118000076
SUMMARY OF DISCOUNTED CASH FLOW ASSUMPTIONS
Building Areas: 459,100 square feet - gross unit area
418,131 square feet – net rentable area
Market Rents - Office: Office Market Rent PSF Range
Floors 2-6 $45.00
Floors 7-19 $50.00
Floors 20-23 $52.50
Market Rents- Retail: Retail Market Rent PSF Range
Ground Floor Retail $75.00
Market Rent Growth Rate: 3.0% per annum
Discount Rate: 6.50%
Terminal Capitalization Rate: 5.50%
Market Lease Terms: 10 years – office and retail
Lease Conditions: Current leases will be entered as written. New office
leases will have 3% annual rent increases. Tenants
will reimburse their pro rata share of real estate and
operating expenses (office tenants) increases above
a base year and pay and electric inclusion.
Renewal Probability: 70% for all tenant spaces.
Lag Vacancy: We assumed an 8-month vacancy between office and
a retail spaces.
General Vacancy /Collection Loss: A 3.5% factor for vacancy and 1.5% for collection
loss has been forecast (5.0% total). Vacancy and
collection loss is excluded for government and
institutional tenants.
Free Rent: A free rent abatement period of 6 months is projected
for new office tenants and 3 months for renewals.
For retail tenants, 6 months free rent is forecast for
new lease deals (none for renewals).
Expenses: Year 1 expenses will be entered according to the
forecast summarized earlier.
Expense Growth Rate: 3.0%

INCOME CAPITALIZATION APPROACH
BBG, INC. 140 0118000076
Tax Growth Rate: 3.0%
Management Costs: 2.5%
Tenant Improvements: $40.00 per square foot workletter for new office
tenants and $15.00 per square foot for office
renewals.
No workletter will be forecast for the ground floor
retail space.
Leasing Commissions: Brokerage commissions in the New York City Outer
Borough are based upon the following schedule for
new office and retail space leases with 10 year terms:
Year 1, 6.25%; Year 2, 5%; Years 3, 4 and 5;
4.375%, Years 6 through 10; 3.125%. For renewals,
the commission schedule totals roughly 16% of the
effective gross lease with percentage allocations as
follows: Year 1, 2.5%; Year 2, 2%; Years 3, 4 and 5;
1.75%, Years 6 through 10; 1.25%.
Holding Period: 10 years
Cost of Sales: 5.0%
Market Value (Rounded): $232,000,000

INCOME CAPITALIZATION APPROACH
BBG, INC. 141 0118000076
DISCOUNTED CASH FLOW
Year 1 Year 2 Year 3 Year 4 Year 5 Year 6 Year 7 Year 8 Year 9 Year 10 Year 11
For the Years Ending Dec-2018 Dec-2019 Dec-2020 Dec-2021 Dec-2022 Dec-2023 Dec-2024 Dec-2025 Dec-2026 Dec-2027 Dec-2028
___________ ___________ ___________ ___________ ___________ ___________ ___________ ___________ ___________ ___________ ___________
Potential Gross Revenue
Base Rental Revenue $18,052,617 $18,965,945 $18,105,204 $20,401,338 $22,286,803 $22,766,696 $23,264,951 $23,687,540 $24,278,653 $24,714,120 $25,212,452
Absorption & Turnover Vacancy (55,208) (496,312) (312,422) (208,301) (440,361) (143,015)
Base Rent Abatements (288,000) (1,000,383) (609,222) (322,183) (84,003) (440,361) (656,625)
___________ ___________ ___________ ___________ ___________ ___________ ___________ ___________ ___________ ___________ ___________
Scheduled Base Rental Revenue 17,709,409 17,469,250 17,183,560 19,870,854 22,202,800 22,766,696 23,264,951 23,687,540 24,278,653 23,833,398 24,412,812
Expense Reimbursement Revenue
Real Estate Taxes 1,569,622 1,314,276 1,382,213 1,448,234 1,538,056 1,657,622 1,780,780 1,907,630 2,038,287 2,172,863 2,307,070
Operating Expenses 452,663 468,741 519,909 545,047 583,740 655,844 730,112 806,606 885,397 966,550 1,043,818
Electric 1,072,418 1,153,224 1,217,256 1,260,284 1,279,388 1,293,944 1,308,938 1,324,380 1,340,288 1,347,225 1,437,046
___________ ___________ ___________ ___________ ___________ ___________ ___________ ___________ ___________ ___________ ___________
Total Reimbursement Revenue 3,094,703 2,936,241 3,119,378 3,253,565 3,401,184 3,607,410 3,819,830 4,038,616 4,263,972 4,486,638 4,787,934
Icon Parking Electric 22,327 22,997 23,687 24,397 25,129 25,883 26,660 27,459 28,283 29,132 30,006
Workers Comp Parking 10,800
Newwstand Rental 10,296 10,605 10,923 11,251 11,588 11,936 12,294 12,663 13,043 13,434 13,837
Rooftop License 32,818 33,803 34,817 35,861 36,937 38,045 39,186 40,362 41,573 42,820 44,105
___________ ___________ ___________ ___________ ___________ ___________ ___________ ___________ ___________ ___________
Total Potential Gross Revenue 20,880,353 20,472,896 20,372,365 23,195,928 25,677,638 26,449,970 27,162,921 27,806,640 28,625,524 28,405,422 29,288,694
General Vacancy (95,834) (5,024) (287,560) (594,342) (617,936) (636,657) (655,627) (677,914) (274,330) (651,816)
Collection Loss (63,904) (91,351) (131,362) (209,387) (254,718) (264,830) (272,853) (280,983) (290,535) (299,691) (338,496)
___________ ___________ ___________ ___________ ___________ ___________ ___________ ___________ ___________ ___________ ___________
Effective Gross Revenue 20,720,615 20,381,545 20,235,979 22,698,981 24,828,578 25,567,204 26,253,411 26,870,030 27,657,075 27,831,401 28,298,382
___________ ___________ ___________ ___________ ___________ ___________ ___________ ___________ ___________ ___________ ___________
Operating Expenses
Real Estate Taxes 3,584,173 3,691,698 3,802,449 3,916,523 4,034,018 4,155,039 4,279,690 4,408,081 4,540,323 4,676,533 4,816,829
Operating Expenses
Insurance 206,595 212,793 219,177 225,752 232,524 239,500 246,685 254,086 261,708 269,560 277,646
Utilities 3,144,835 3,239,180 3,336,355 3,436,446 3,539,539 3,645,726 3,755,097 3,867,750 3,983,783 4,103,296 4,226,395
Water and Sewer 183,640 189,149 194,824 200,668 206,688 212,889 219,276 225,854 232,630 239,609 246,797
Payroll 459,100 472,873 487,059 501,671 516,721 532,223 548,189 564,635 581,574 599,021 616,992
Repairs and Maintenance 1,147,750 1,182,183 1,217,648 1,254,177 1,291,803 1,330,557 1,370,474 1,411,588 1,453,935 1,497,553 1,542,480
___________ ___________ ___________ ___________ ___________ ___________ ___________ ___________ ___________ ___________ ___________
Total 5,141,920 5,296,178 5,455,063 5,618,714 5,787,275 5,960,895 6,139,721 6,323,913 6,513,630 6,709,039 6,910,310
General and Administrative 137,730 141,862 146,118 150,501 155,016 159,667 164,457 169,391 174,472 179,706 185,098
Legal and Professional 45,910 47,287 48,706 50,167 51,672 53,222 54,819 56,464 58,157 59,902 61,699
Management 518,015 509,539 505,899 567,475 620,714 639,180 656,335 671,751 691,427 695,785 707,460
___________ ___________ ___________ ___________ ___________ ___________ ___________ ___________ ___________ ___________ ___________
Total Operating Expenses 9,427,748 9,686,564 9,958,235 10,303,380 10,648,695 10,968,003 11,295,022 11,629,600 11,978,009 12,320,965 12,681,396
___________ ___________ ___________ ___________ ___________ ___________ ___________ ___________ ___________ ___________ ___________
Net Operating Income 11,292,867 10,694,981 10,277,744 12,395,601 14,179,883 14,599,201 14,958,389 15,240,430 15,679,066 15,510,436 15,616,986
___________ ___________ ___________ ___________ ___________ ___________ ___________ ___________ ___________ ___________ ___________
Leasing & Capital Costs
Tenant Improvements 467,050 1,284,010 937,265 562,413 1,321,083 386,140
Leasing Commissions 246,062 796,373 466,949 311,329 658,168 213,751
Reserves 91,820 94,575 97,412 100,334 103,344 106,445 109,638 112,927 116,315 119,804 123,398
___________ ___________ ___________ ___________ ___________ ___________ ___________ ___________ ___________ ___________ ___________
Total Leasing & Capital Costs 804,932 2,174,958 1,501,626 974,076 103,344 106,445 109,638 112,927 116,315 2,099,055 723,289
___________ ___________ ___________ ___________ ___________ ___________ ___________ ___________ ___________ ___________ ___________
Cash Flow Before Debt Service $10,487,935 $8,520,023 $8,776,118 $11,421,525 $14,076,539 $14,492,756 $14,848,751 $15,127,503 $15,562,751 $13,411,381 $14,893,697
& Taxes =========== =========== =========== =========== =========== =========== =========== =========== =========== =========== ===========
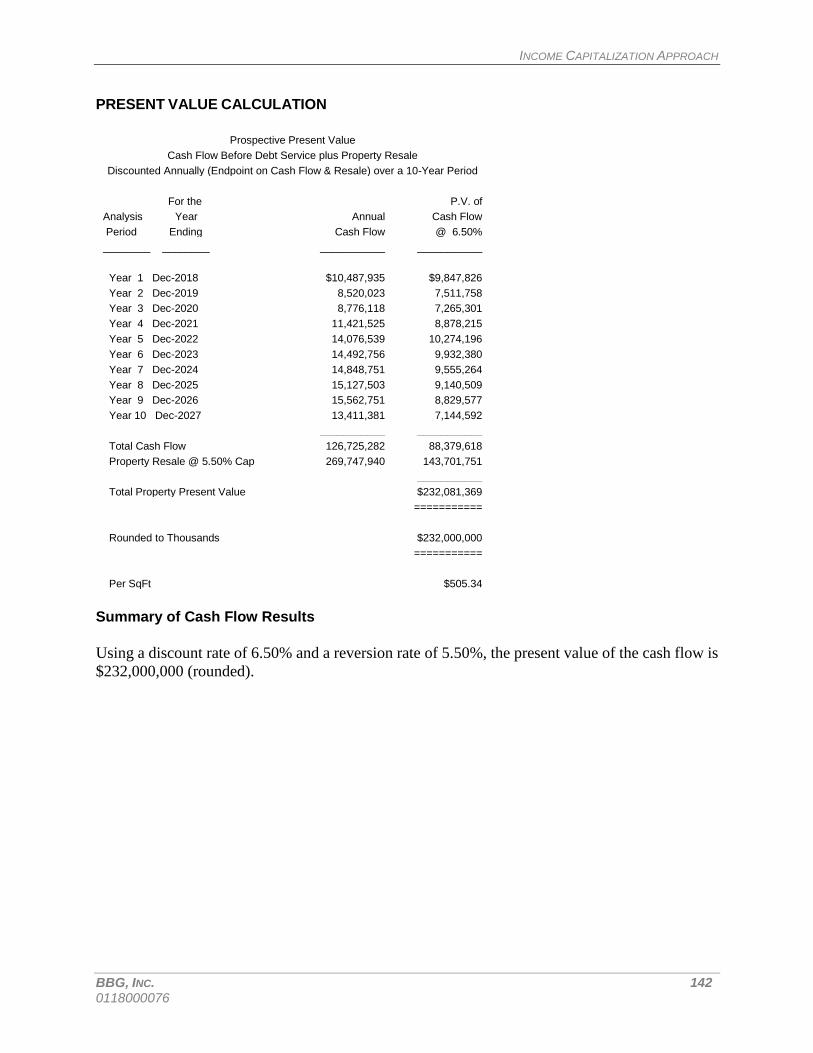
INCOME CAPITALIZATION APPROACH
BBG, INC. 142 0118000076
PRESENT VALUE CALCULATION
Prospective Present Value
Cash Flow Before Debt Service plus Property Resale
Discounted Annually (Endpoint on Cash Flow & Resale) over a 10-Year Period
For the P.V. of
Analysis Year Annual Cash Flow
Period Ending Cash Flow @ 6.50%
________ ________ ___________ ___________
Year 1 Dec-2018 $10,487,935 $9,847,826
Year 2 Dec-2019 8,520,023 7,511,758
Year 3 Dec-2020 8,776,118 7,265,301
Year 4 Dec-2021 11,421,525 8,878,215
Year 5 Dec-2022 14,076,539 10,274,196
Year 6 Dec-2023 14,492,756 9,932,380
Year 7 Dec-2024 14,848,751 9,555,264
Year 8 Dec-2025 15,127,503 9,140,509
Year 9 Dec-2026 15,562,751 8,829,577
Year 10 Dec-2027 13,411,381 7,144,592
___________ ___________
Total Cash Flow 126,725,282 88,379,618
Property Resale @ 5.50% Cap 269,747,940 143,701,751
___________
Total Property Present Value $232,081,369
===========
Rounded to Thousands $232,000,000
===========
Per SqFt $505.34
Summary of Cash Flow Results
Using a discount rate of 6.50% and a reversion rate of 5.50%, the present value of the cash flow is
$232,000,000 (rounded).

INCOME CAPITALIZATION APPROACH
BBG, INC. 143 0118000076
STABILIZED INCOME & EXPENSE STATEMENT
The Discounted Cash Flow method most accurately accounts for the variation in net operating income
over a typical holding period. However, Income Capitalization will be used as support for the value
derived via discounted cash flow. The first year of the discounted cash flow statement is presented
below. The rent abatement amount will then be deducted from the capitalized fair value.
STABILIZED INCOME AND EXPENSES (YEAR 1)
Year 1
For the Years Ending Dec-2018
___________
Potential Gross Revenue
Base Rental Revenue $18,052,617
Absorption & Turnover Vacancy ($55,208)
Base Rent Abatements ($288,000)
___________
Scheduled Base Rental Revenue $17,709,409
Expense Reimbursement Revenue
Real Estate Taxes $1,569,622
Operating Expenses $452,663
Electric $1,072,418
___________
Total Reimbursement Revenue $3,094,703
Icon Parking Electric $22,327
Workers Comp Parking $10,800
Newwstand Rental $10,296
Rooftop License $32,818
Total Potential Gross Revenue $20,880,353
General Vacancy ($95,834)
Collection Loss ($63,904)
___________
Effective Gross Revenue $20,720,615
___________
Operating Expenses
Real Estate Taxes $3,584,173
Operating Expenses
Insurance $206,595
Utilities $3,144,835
Water and Sewer $183,640
Payroll $459,100
Repairs and Maintenance $1,147,750
___________
Total $5,141,920
General and Administrative $137,730
Legal and Professional $45,910
Management $518,015
___________
Total Operating Expenses $9,427,748
___________
Net Operating Income $11,292,867

INCOME CAPITALIZATION APPROACH
BBG, INC. 144 0118000076
DIRECT CAPITALIZATION Mortgage Equity Technique
The method of deriving a capitalization rate employed in this report is the mortgage-equity technique
commonly referred to as the Ellwood method. This technique considers the return of equity, including
any potential appreciation or depreciation in property value over the income projection period, as well
as the effects of financing through mortgage amortization and equity benefits. The following criteria
were used to determine the capitalization rate for the subject property.
Financing: Lending institutions typically lend at a 60% to 80% loan
to value ratio. Interest rates, in a recent period of time,
ranged from 3.00% to 5.00% with loan terms at five
years with twenty- to twenty-five-year payout schedules.
We have selected a 75% loan to value ratio, a 3.75%
interest rate, and a 30-year payout. The mortgage
constant is 5.56%.
Holding Period: Most investors/purchasers intend to hold a property for
a period that typically ranges from five to fifteen years.
We have selected a period of ten years.
Equity Yield: This is a competitive rate of return reflecting the inherent
risks, illiquidity, potential benefits, and availability of
tax shelter of property ownership relative to prospective
rates of return for alternative investment opportunities.
Based on our previous discussion of yield rates within
the discounted cash flow analysis, we have selected a
9.00% yield rate which is 250 basis points higher than
the discount rate utilized in the Discounted Cash Flow
model as it is reflective of the additional return an
investor seeks on the equity portion of the investment.
Change in Value: Based upon historical and current trends in the subject
area, an appreciation factor of 5% will be forecast over
the holding period. This is considerate of below market
rents in place.
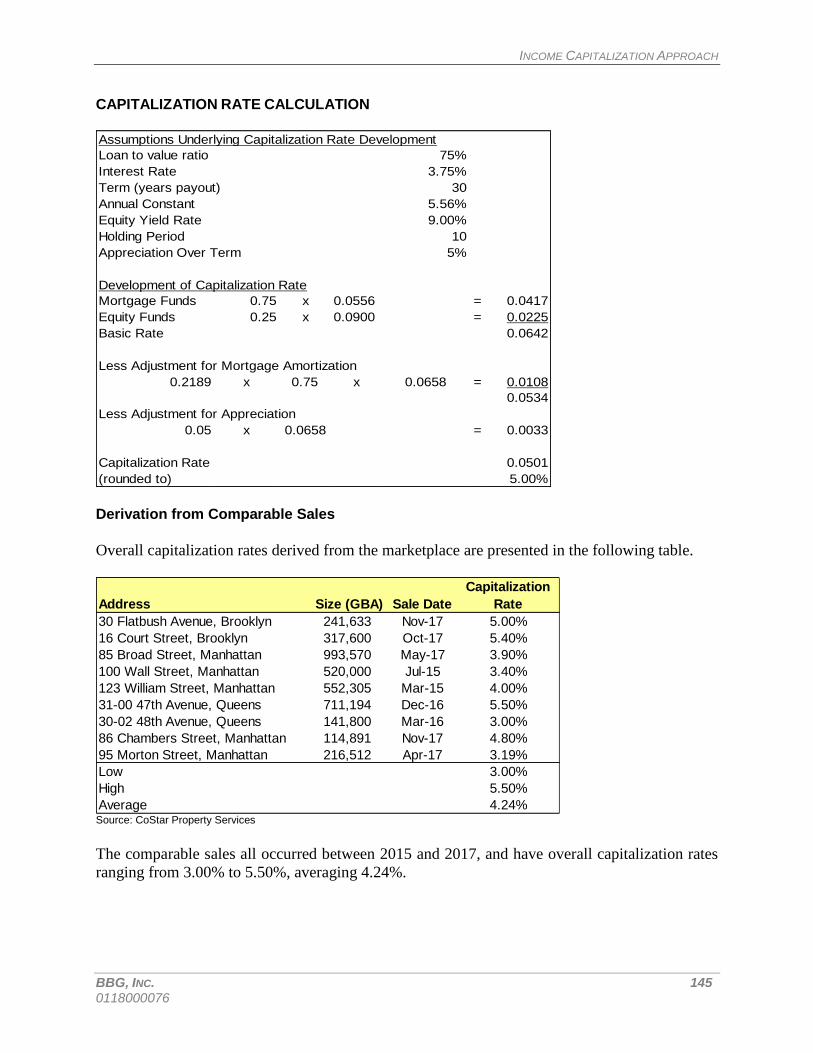
INCOME CAPITALIZATION APPROACH
BBG, INC. 145 0118000076
CAPITALIZATION RATE CALCULATION
Loan to value ratio 75%
Interest Rate 3.75%
Term (years payout) 30
Annual Constant 5.56%
Equity Yield Rate 9.00%
Holding Period 10
Appreciation Over Term 5%
Mortgage Funds 0.75 x 0.0556 = 0.0417
Equity Funds 0.25 x 0.0900 = 0.0225
Basic Rate 0.0642
Less Adjustment for Mortgage Amortization
0.2189 x 0.75 x 0.0658 = 0.0108
0.0534
Less Adjustment for Appreciation
0.05 x 0.0658 = 0.0033
Capitalization Rate 0.0501
(rounded to) 5.00%
Assumptions Underlying Capitalization Rate Development
Development of Capitalization Rate
Derivation from Comparable Sales
Overall capitalization rates derived from the marketplace are presented in the following table.
Address Size (GBA) Sale Date
Capitalization
Rate
30 Flatbush Avenue, Brooklyn 241,633 Nov-17 5.00%
16 Court Street, Brooklyn 317,600 Oct-17 5.40%
85 Broad Street, Manhattan 993,570 May-17 3.90%
100 Wall Street, Manhattan 520,000 Jul-15 3.40%
123 William Street, Manhattan 552,305 Mar-15 4.00%
31-00 47th Avenue, Queens 711,194 Dec-16 5.50%
30-02 48th Avenue, Queens 141,800 Mar-16 3.00%
86 Chambers Street, Manhattan 114,891 Nov-17 4.80%
95 Morton Street, Manhattan 216,512 Apr-17 3.19%
Low 3.00%
High 5.50%
Average 4.24% Source: CoStar Property Services
The comparable sales all occurred between 2015 and 2017, and have overall capitalization rates
ranging from 3.00% to 5.50%, averaging 4.24%.

INCOME CAPITALIZATION APPROACH
BBG, INC. 146 0118000076
Investor Surveys
Another source of going-in capitalization rates is provided by the PricewaterhouseCoopers' and
Real Estate Research Corporation's investment surveys which summarize going-in capitalization
rates. These rates are a representative sample of institutional investors. The rates reflect acceptable
expectations desired by investors currently in the marketplace. The rates are illustrated below.
Survey Property Type Overall Capitalization Rate
PricewaterhouseCoopers (PwC) National CBD 3.50% to 8.00%
Fourth Quarter 2017 Office Market 5.73% average
Situs R.E.R.C. National CBD 4.50% to 6.50%
Fourth Quarter 2017 (Flash) Office Market 5.80% average
Situs R.E.R.C. New York City 5.00% average
Third Quarter 2017 Office Market
As indicated in the investment surveys, overall capitalization rates for CBD and New York City
office properties typically range from 3.50% to 8.00% for institutional quality investments, with
the predominant rates between 5.00% and 5.80%.
Conclusion
Based on the Ellwood method and investment surveys, it is our opinion that a going-in
capitalization rate of 5.00% is appropriate for the subject property, at the middle to low end of the
range of the investment surveys primarily due to the quality tenancy (government and institutional)
with some below market leasing in place. As noted, average contract rent in place for the office
space is at or below market, indicating some future upside potential.
Applying a 5.00% overall capitalization rate to the subject's stabilized net operating income results
in a value as follows:
CAPITALIZATION
NET OPERATING
INCOME CAP RATE VALUE ROUNDED
$11,292,867 ÷ 5.00% = $225,857,340 $226,000,000

INCOME CAPITALIZATION APPROACH
BBG, INC. 147 0118000076
Correlation of Income Values
The indicated values by the methods utilized are:
⋅ Discounted Cash Flow $232,000,000
⋅ Capitalization of Net Income $226,000,000
The values derived by the two income valuation methods are similar (within 3%). Less reliance is
typically placed on the value arrived at by capitalizing net income since this method does not
adequately reflect expected changes in income levels or resale value. Additionally, the Discounted
Cash Flow method most closely approximates the investment criteria and motivations of an
investor for an income-producing building such as the subject. Further, the presence of long-term
leased space gives further credence to the Discounted Cash Flow.
Therefore, with most reliance placed on the Discounted Cash Flow method, the current “as is” fair
value via the Income Capitalization Approach, as of December 31, 2017 is:
TWO HUNDRED THIRTY TWO MILLION DOLLARS $232,000,000

SALES COMPARISON APPROACH
BBG, INC. 148 0118000076
SALES COMPARISON APPROACH
“In the Sales Comparison Approach, fair value is estimated by comparing the subject property to
similar properties that have been sold recently or for which offers to purchase have been made. A
major premise of the sales comparison approach is that the fair value of a property is directly
related to the prices of comparable, competitive properties.”
The Sales Comparison Approach is based on the principle of substitution. This implies that a
knowledgeable investor will pay no more for a property than would be paid for a substitute
property of similar utility and desirability. The procedure involved is to research the market for
sales of improved properties similar to the subject, verify the information, select appropriate units
of comparison, compare each sale to the subject property, adjust the sales to the subject, and
reconcile the various value indicators into a single indication of value for the subject property.
As indicated in a previous section, the highest and best use of the subject site as improved is
considered to be its continued use as an office building.
Unit of Comparison
In order to analyze the comparable sales, it is generally considered necessary to alter the sale prices
by an appropriate unit of comparison. The effect of this process is to make the sale prices more
manageable as well as to adjust for differences among the sales. For this report, the comparable
sales will be analyzed on the basis of sale price per square foot of gross building area above grade
which is considered to be the most commonly used unit of comparison for similar office buildings
in the subject market area. The subject property will be valued via the Sales Comparison Approach
based upon its gross building area of 459,100± square feet.
Research revealed several sales of office buildings considered to be comparable to the subject
property. Due to a lack of recent comparable data of similar Class A office buildings within the
subject’s immediate market, it was necessary to analyze older transactions, as well as sales of
comparable properties within similar market such as Long Island City. The sales represent the
most recent comparable office building transactions and are described later in this section of the
report. Included is a map indicating the location of each sale in relation to the subject, a photograph
of each sale, a grid outlining the adjustments for each sale price, and the resultant indicated values
for the subject property.

SALES COMPARISON APPROACH
BBG, INC. 149 0118000076
COMPARABLE SALES MAP

SALES COMPARISON APPROACH
BBG, INC. 150 0118000076
Comparable Sale 1

SALES COMPARISON APPROACH
BBG, INC. 151 0118000076
Comparable Sale #1
Comparable Sale 1
Address: 16 Court Street
Location: Brooklyn, NY
Legal Identification: Block 250, Lot 44
Site Area (SF): 12,500
Gross Leasable Area (SF): 317,600
Gross Building Area (SF) 290,440
Property Description: This is the sale of a 36-story Class A, pre-war office building located in
Downtown Brooklyn and known as the Montague Court Building. The
building was constructed in 1928 and renovated in 2017. At the time of
sale, the property was approximately 95.2% leased by 68 tenants. The
facility also contains 15,940 square feet of retail space. The property
has corner frontage and exposure, and is located to area subways.
Year Built: 1928
Sale Date: October 10, 2017
Grantor: 16 Court Street Owner LLC (SL Green Realty)
Grantee: CIM Group LP
Sale Price: $171,000,000
Document Number: 2017000379749
Terms: Conventional financing (mortgage from Citigroup Global Markets Realty
Corp.)
Price PSF GBA: $589
Cap Rate: 5.40%
NOI PSF: $29.07
Current Asking Rent: N/A

SALES COMPARISON APPROACH
BBG, INC. 152 0118000076
Comparable Sale 2

SALES COMPARISON APPROACH
BBG, INC. 153 0118000076
Comparable Sale 2

SALES COMPARISON APPROACH
BBG, INC. 154 0118000076
Comparable Sale #2
Comparable Sale 2
Address: 55 Prospect Street, Et Al
Location: Brooklyn, NY
Legal Identification: Block 76, Lot 1, Block 77, Lot 1, Block 63, Lot 1, and Block 64, Lot 25
Site Area (SF): 64,357
Gross Leasable Area (SF): 770,530
Gross Building Area (SF) 751,647
Property Description: This is the sale of a portfolio of 4, Class B office buildings located in the
Downtown Brooklyn/DUMBO submarket. The buildings were
constructed in 1909, 1927, 1962 and 1967 and all renovated in 2014.
The buildings range in heights from 8 to 12 stories. At the time of sale,
the aggregate occupancy was approximately 83.7%. Primary tenants
include WeWork, Etsy and 2U. The building addresses are 55 Prospect
Street, 77 Sands Street, 117 Adams Street and 81 Prospect Street.
Year Built: 1909-1967
Sale Date: March 31, 2017
Grantor: IMRF Watchtower Member, LLC
Grantee: RFR Realty LLC
Sale Price: $408,468,512
Document Number: 2017000144849, 2017000144850, 2017000144851, 2017000144852
Terms: Conventional financing (mortgages from Citibank NA).
Price PSF GBA: $543
Cap Rate: N/A
NOI PSF: N/A
Current Asking Rent: N/A

SALES COMPARISON APPROACH
BBG, INC. 155 0118000076
Comparable Sale 3

SALES COMPARISON APPROACH
BBG, INC. 156 0118000076
Comparable Sale #3
Comparable Sale 3
Address: 57 Willoughby Street
Location: Brooklyn, NY
Legal Identification: Block 147, Lot 36
Site Area (SF): 16,525
Gross Leasable Area (SF): 123,974
Gross Building Area (SF) 96,586
Property Description: This is the sale of a 6-story Class C office building known as the
MetroTech Center. The property is located in Downtown Brooklyn. the
improvements were constructed in 1929 and renovated in 2008. At the
time of sale, the property was 87.5% leased by 18 tenants, primarily in
the health care industry, and the property contains approximately 18,500
square feet of ground floor retail space. The subject property has excess
development potential and was purchased for a long range
redevelopment.
Year Built: 1929
Sale Date: December 22, 2016
Grantor: Hellen Keller Services for the Blind
Grantee: Meadow Partners
Sale Price: $54,000,000
Document Number: 2017000005361
Terms: Conventional financing (loan from Mile Square Capital).
Price PSF GBA: $559
Cap Rate: N/A
NOI PSF: N/A
Current Asking Rent: N/A

SALES COMPARISON APPROACH
BBG, INC. 157 0118000076
Comparable Sale 4

SALES COMPARISON APPROACH
BBG, INC. 158 0118000076
Comparable Sale #4
Comparable Sale 4
Address: 31-00 47th Avenue
Location: Long Island City, NY
Legal Identification: Block 281, Lot 1
Site Area (SF): 120,000
Gross Leasable Area (SF): 711,194
Gross Building Area (SF) 568,000
Property Description: This is the sale of a Class B office building located in Long Island City.
The property, built in 1920, contains 711,194 square feet of rentable
area. At the time of sale, the property, which is known as the Falchi
Building, was 90.0% leased and occupied by 42 total tenants. The
building was constructed in 1920 and fully renovated in 2014. At the time
of sale, the property was undergoing major renovations including new
elevators, lobby and facade.
Year Built: 1920
Sale Date: December 23, 2016
Grantor: Jamestown
Grantee: Savanna Real Estate Fund
Sale Price: $255,000,000
Document Number: 2016000462181
Terms: Conventional financing (loans from PARLEX 5 FINCO, LLC).
Price PSF GBA: $449
Cap Rate: 5.50%
NOI PSF: $19.72
Current Asking Rent: N/A

SALES COMPARISON APPROACH
BBG, INC. 159 0118000076
Comparable Sale #5

SALES COMPARISON APPROACH
BBG, INC. 160 0118000076
Comparable Sale #5
Comparable Sale 5
Address: 180 Livingston Street
Location: Brooklyn, NY
Legal Identification: Block 164, Lots 1001, 1002 and 1003
Site Area (SF): 35,000
Gross Leasable Area (SF): 257,000
Gross Building Area (SF) 246,162
Property Description: This is the sale of a three Class B office condominium units which
comprise an entire office building. the property was constructed circa
1900 and is located in Downtown Brooklyn, and contains a total of
246,162 square feet. At the time of sale, the units were fully leased, with
the largest tenant being the New York Metropolitan Transit Authority.
The property was last renovated in 2002, and a full renovation is planned
by the buyers. The property has excess development potential (air
rights).
Year Built: 1900
Sale Date: October 15, 2015
Grantor: The Brooklyn Tabernacle
Grantee: Thor 180 Livingston LLC (Thor Equities)
Sale Price: $136,000,000
Document Number: 2015000406671 and 2015000406672
Terms: Market financing from a private lender.
Price PSF GBA: $552
Cap Rate: N/A
NOI PSF: N/A
Current Asking Rent: N/A

SALES COMPARISON APPROACH
BBG, INC. 161 0118000076
SUMMARY OF COMPARABLE SALES
No. Address Site Area GBA Sale Date Sale Price Price PSF OAR
1 16 Court Street 12,500 290,440 Oct-17 $171,000,000 $589 5.40%
2 55 Prospect Street, Et Al 64,357 751,647 Mar-17 $408,468,512 $543 N/A
3 57 Willoughby Street 16,525 96,586 Dec-16 $54,000,000 $559 N/A
4 31-00 47th Avenue 120,000 568,000 Dec-16 $255,000,000 $449 5.50%
5 180 Livingston Street 35,000 246,162 Oct-15 $136,000,000 $552 N/A
Adjustments for the comparable sales have been considered based on comparison to the subject
for financing terms, conditions of sale, market conditions (time), location, size, utility, and
age/condition.
Property Rights Appraised: The purpose of this adjustment is to account for
differences in the property rights which were transferred
with the sale. The subject sand comparable sales are all
encumbered by leases, and the interests identified herein
represent that of leased fee estates. Accordingly, no
adjustments are noted.
Financing Terms: The purpose of adjusting for financing terms is to
determine cash equivalent sale prices for the comparable
sales in accordance with the definition of market value
for this report. All of the sales were sold all cash to the
seller or financed at market rates by a disinterested third
party, a including private lender (Sale 5). No adjustment
for financing terms was considered appropriate.
Conditions of Sale: Conditions of sale refer to the motivations of the buyer
and seller involved in a particular transaction. All of the
comparable sales appear to be arm's length transactions
and do not require adjustments.
Market Conditions (Time): The comparable sales utilized herein sold between
October 2015 and February 2017. At present, the
investment market for New York City Outer Borough
office properties has remained fairly stable after a
significant decline in 2008 and 2009. Transactional
activity has increased through 2016 and 2017, although
many deals remain partial interest transfers and
recapitalizations, while others are reported as distress
type sales. As the comparable sales all occurred within
the past 2+ years, no time adjustments have been
processed.
Location: The subject is located within the Downtown Brooklyn
submarket on Livingston Street, also fronting on

SALES COMPARISON APPROACH
BBG, INC. 162 0118000076
Boerum Place. This is a readily accessible area within
the downtown core, close to the courthouses and other
municipal buildings. The subject immediate area is
accessible via a multitude of public transportation
options.
Comparable Sale 1 is located a few blocks northwest of
the subject within Downtown Brooklyn and is not
adjusted.
Comparable Sale 2 is located within the superior
Dumbo/Dumbo Heights section of Downtown Brooklyn
and is adjusted downward.
Comparable Sale 3 is located a few blocks east of the
subject within Downtown Brooklyn and is not adjusted.
Comparable Sale 4 is located within the desirable
Hunters Point section of Long Island City; however, this
location is considered inferior to Downtown Brooklyn
in terms of office and retail rental rates. An upward
adjustment is noted.
Comparable Sale 5 is located a few blocks east of the
subject within Downtown Brooklyn and is not adjusted.
Size: This adjustment accounts for the difference in size
between each of the comparable sales and the subject
property. The comparable sales range in size from
96,586 to 751,647± square feet. The subject property
contains 459,100± square feet of gross building area.
Typically, a smaller building will sell at a higher price
per square foot level than a similar larger sized building
(area/unit ratio). However, this is less of a consideration
with regard to multi-tenanted properties. Downward
adjustments in varying degrees are noted to Sales 1, 3
and 5 which are smaller properties.
Utility: This adjustment reflects building height or number of
stories, retail to building ratio, views, exterior appeal,
and the interior finishes, design and layout of each
comparable as compared to the subject property. The
subject property is a good quality, 22-story Class A
office building with good frontage and exposure
characteristics. Comparable Sale 1 is a comparable
Class A building that is similar in amenities and finishes
and is not adjusted. Comparable Sales 2, 4 and 5 are

SALES COMPARISON APPROACH
BBG, INC. 163 0118000076
Class B properties but are competitive with Class A
facilities within the immediate submarket in terms of
finishes, amenities and rental rates. No adjustments are
noted to Sales 2, 4 and 5. Although Comparable Sale 3
is a low rise Class C property, the property is benefitted
with a larger proportion of retail space, and also has
excess development potential. Therefore, no adjustment
is noted due to offsetting attributes.
Occupancy: The subject facility is approximately 97.5% leased with
primarily governmental and institutional tenancies.
Comparable Sale 1 is over 95% leased and is not
adjusted. Comparable Sale 2 is approximately 84%
leased and is adjusted upward. Comparable Sale 3 has a
lower occupancy rate (87.5%) and has been adjusted
upward. Comparable Sale 4 was 90.0% leased and has
been adjusted upward. Comparable Sale 5 was 100%
leased and is not adjusted.
Age/Condition: The subject building was constructed 1969 and
renovated in 2001, and has been well maintained.
Although Comparable Sale 1 is an older pre-war
building constructed in 1928, the property was
renovated in 2017 and therefore is adjusted downward.
Comparable Sale 2 consists of older and newer buildings
that have been updated and is not adjusted. Comparable
Sale 3 is an older pre-war building constructed in 1929
and renovated in 2008 and is not adjusted. Comparable
Sale 4 was constructed in 1920 and renovated in 2014
and has been adjusted downward. Comparable Sale 5 is
an older facility that was under renovation at the time of
sale and has been adjusted upward.
The comparable sales adjustment grid is presented on the following page:
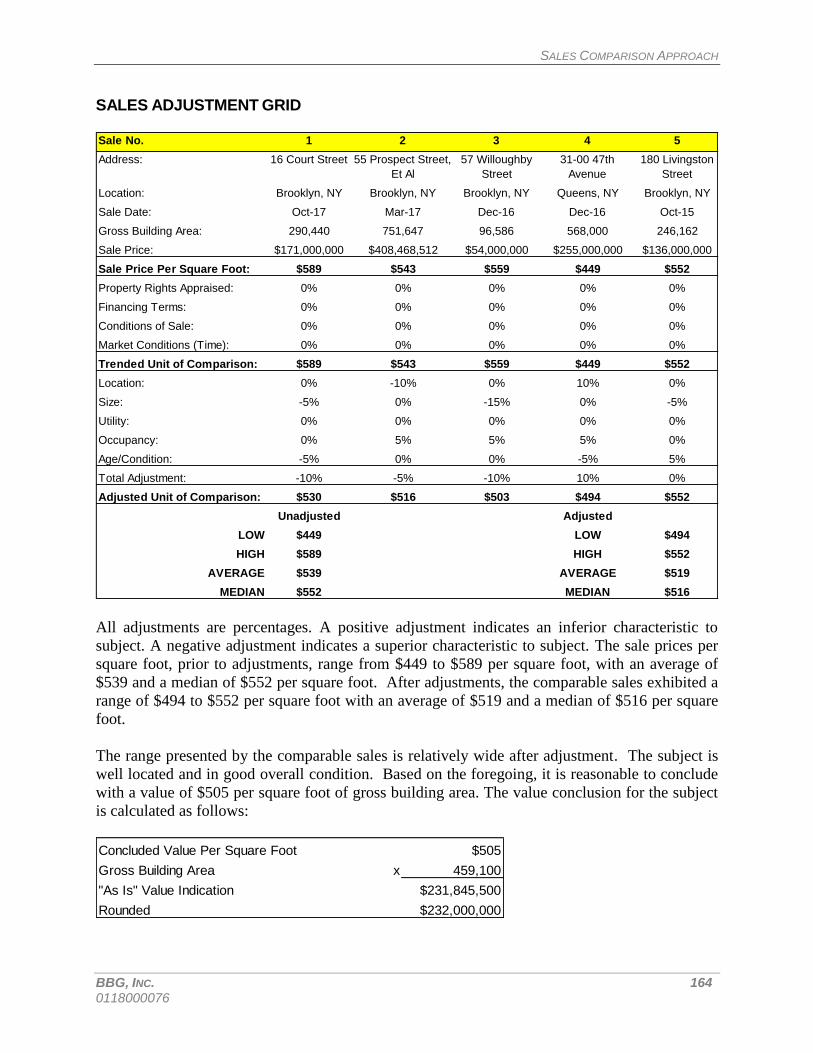
SALES COMPARISON APPROACH
BBG, INC. 164 0118000076
SALES ADJUSTMENT GRID Sale No. 1 2 3 4 5
Address: 16 Court Street 55 Prospect Street,
Et Al
57 Willoughby
Street
31-00 47th
Avenue
180 Livingston
Street
Location: Brooklyn, NY Brooklyn, NY Brooklyn, NY Queens, NY Brooklyn, NY
Sale Date: Oct-17 Mar-17 Dec-16 Dec-16 Oct-15
Gross Building Area: 290,440 751,647 96,586 568,000 246,162
Sale Price: $171,000,000 $408,468,512 $54,000,000 $255,000,000 $136,000,000
Sale Price Per Square Foot: $589 $543 $559 $449 $552
Property Rights Appraised: 0% 0% 0% 0% 0%
Financing Terms: 0% 0% 0% 0% 0%
Conditions of Sale: 0% 0% 0% 0% 0%
Market Conditions (Time): 0% 0% 0% 0% 0%
Trended Unit of Comparison: $589 $543 $559 $449 $552
Location: 0% -10% 0% 10% 0%
Size: -5% 0% -15% 0% -5%
Utility: 0% 0% 0% 0% 0%
Occupancy: 0% 5% 5% 5% 0%
Age/Condition: -5% 0% 0% -5% 5%
Total Adjustment: -10% -5% -10% 10% 0%
Adjusted Unit of Comparison: $530 $516 $503 $494 $552
Unadjusted Adjusted
LOW $449 LOW $494
HIGH $589 HIGH $552
AVERAGE $539 AVERAGE $519
MEDIAN $552 MEDIAN $516
All adjustments are percentages. A positive adjustment indicates an inferior characteristic to
subject. A negative adjustment indicates a superior characteristic to subject. The sale prices per
square foot, prior to adjustments, range from $449 to $589 per square foot, with an average of
$539 and a median of $552 per square foot. After adjustments, the comparable sales exhibited a
range of $494 to $552 per square foot with an average of $519 and a median of $516 per square
foot.
The range presented by the comparable sales is relatively wide after adjustment. The subject is
well located and in good overall condition. Based on the foregoing, it is reasonable to conclude
with a value of $505 per square foot of gross building area. The value conclusion for the subject
is calculated as follows:
Concluded Value Per Square Foot $505
Gross Building Area x 459,100
"As Is" Value Indication $231,845,500
Rounded $232,000,000

SALES COMPARISON APPROACH
BBG, INC. 165 0118000076
Therefore, the current “as is” fair value via the Sales Comparison Approach, as of December 31,
2017 is:
TWO HUNDRED THIRTY TWO MILLION DOLLARS $232,000,000

RECONCILIATION AND FINAL VALUE ESTIMATE
BBG, INC. 166 0118000076
RECONCILIATION AND FINAL VALUE ESTIMATE
The estimated values arrived at by the approaches to value used in this report are as follows:
Value Estimates
Cost Approach Not Used
Income Capitalization Approach $232,000,000
Sales Comparison Approach $232,000,000
The Cost Approach is traditionally a good indicator of value when properties being appraised are
new or close to new. The subject improvements were constructed in 1969 and suffer from accrued
physical depreciation as a result of age and normal wear. The improvements also suffer from
functional obsolescence due to inadequacies in design that are less than current market standards.
Difficulty in estimating all forms of accrued depreciation limits the reliability of this Approach.
Further, the subject only represents a portion of a larger building. The Cost Approach, therefore,
has not been utilized in this report.
The Income Capitalization Approach is considered to be a good indicator of value when market
rents, stabilized expenses, capitalization rates, discount rates and vacancy rates are based on
reliable market data. For our analysis, income and expenses were derived from actual and market
figures and were considered reliable. Vacancy rates were based on a neighborhood survey and
were considered to be reflective of market demand for the subject property. The capitalization and
discount rates were derived from reliable market surveys of investor criteria.
The Sales Comparison Approach is considered a reliable indicator of value when few differences
exist between the sales and the subject, and the sales data collected is considered to be reliable and
accurate. The sales used to estimate the value of the subject property were considered to be
comparable in most respects, although adjustments were required. Overall, the indicated value
estimate by this Approach is considered to be a good indicator and is given secondary weight in
the final value estimate.
Overall, the Income Capitalization Approach is considered a better indicator of value than the
Sales Comparison Approach. The value indicated by the Income Capitalization Approach is a
reflection of a prudent investor's analysis of an income-producing property. Since the subject
property is income-producing by nature, an analysis of income, expenses, overall capitalization
rates and yield rates is considered to be an appropriate method. The presence of long-term leased
space in the subject increases the need to analyze income as it relates to value.
With greatest consideration, therefore, given to the Income Capitalization Approach to value, it is
the opinion of the appraiser that the fair value of the subject property's leasehold estate as of
December 31, 2017 is:
TWO HUNDRED THIRTY TWO MILLION DOLLARS $232,000,000

ADDENDA
ADDENDA
⋅ ARGUS RENT ROLL
⋅ SENSITIVITY ANALYSIS
⋅ LETTER OF ENGAGEMENT
⋅ CONTINGENT AND LIMITING CONDITIONS
⋅ CERTIFICATION
⋅ QUALIFICATIONS

ADDENDA
ARGUS RENT ROLL
Tenant Name Floor Rate & Amount Description of Assumption about
Type & Suite Number SqFt per Year Changes Changes Operating Expense subsequent terms
Lease Dates & Term Bldg Share per Month on to Reimbursements for this tenant
_____________________ ___________ _____________ _________ ______ __________________ ________________
1 Icon Parking Lease $1,300,000.00 Feb-2017 $108,333.00 Full Service: Market
Storage, Suite: Garage 1 $108,333 Feb-2020 $114,833.33 Pays no expense See assumption:
Feb-2002 to Jan-2032 0.00% Feb-2023 $121,723.33 reimbursement. Parking
360 Months Feb-2026 $129,026.73
Feb-2029 $136,768.34
2 Central Medical Servi $32.75 Mar-2012 $33.33 See method: Market
Office, Suite: 19th 2,375 $77,781 Mar-2013 $33.92 Central Medical See assumption:
Mar-2011 to Feb-2021 0.57% $2.73 Mar-2014 $34.52 Services Office 7-19
120 Months $6,482 Mar-2015 $35.14
Mar-2016 $35.77
Mar-2017 $36.41
Mar-2018 $37.06
Mar-2019 $37.73
Mar-2020 $38.41
3 Pasternack $69.01 Jun-2015 $70.39 See method: Market
Retail, Suite: 1st 3,391 $234,013 Jun-2016 $71.79 Pasternack See assumption:
Jun-2014 to May-2019 0.81% $5.75 Jun-2017 $73.23 Retail
60 Months $19,501 Jun-2018 $74.69
4 C.U.N.Y. $0.00 Sep-2017 $49.50 See method: Market
Office, Suite: 1st,2nd 45,000 $0 Sep-2018 $50.43 C.U.N.Y. See assumption:
Sep-2007 to Aug-2027 10.76% $0.00 Sep-2019 $51.38 Office 2-6
240 Months $0 Sep-2020 $52.35
Sep-2021 $53.33
Sep-2022 $54.34
Sep-2023 $55.37
Sep-2024 $56.41
Sep-2025 $57.48
Sep-2026 $58.57
5 Legal Aid $0.00 Jun-2017 $37.00 See method: Legal Market
Office, Suite: 6th 14,700 $0 Nov-2019 $38.00 Aid 6 See assumption:
Jun-2015 to Oct-2037 3.52% $0.00 Nov-2021 $39.00 Office 2-6
269 Months $0 Nov-2023 $40.00
Nov-2025 $41.00
Nov-2027 $42.00
Nov-2029 $43.00
Nov-2031 $44.00
Nov-2033 $45.00
Nov-2035 $46.00
6 Legal Aid $37.00 Jun-2017 $37.00 See method: Legal Market
Office, Suite: 7th-11t 102,500 $3,792,500 Nov-2019 $38.00 Aid 7-11 See assumption:
Jun-2015 to Oct-2037 24.51% $3.08 Nov-2021 $39.00 Office 7-19
269 Months $316,042 Nov-2023 $40.00
Nov-2025 $41.00
Nov-2027 $42.00
Nov-2029 $43.00
Nov-2031 $44.00
Nov-2033 $45.00
Nov-2035 $46.00

ADDENDA
7 OTDA $31.00 Jun-2012 $32.24 See method: OTDA Market
Office, Suite: 4th/5th 39,265 $1,217,215 Jun-2014 $33.53 4-5 See assumption:
Apr-2011 to May-2020 9.39% $2.58 Jun-2016 $34.87 Office 2-6
110 Months $101,435 Jun-2018 $36.27
8 ODTA $21.05 Jun-2010 $26.50 See method: OTDA Option
Office, Suite: 1/6/14- 82,280 $1,731,994 Jun-2012 $27.56 Multiple See assumption:
Mar-2010 to May-2020 19.68% $1.75 Jun-2014 $28.66 Office 7-19
123 Months $144,333 Jun-2016 $29.81
Jun-2018 $31.00
9 Northrop Grumman $48.75 Aug-2017 $49.50 See method: Market
Office, Suite: 18th 20,500 $999,375 Aug-2018 $50.25 Northrop Grumman See assumption:
Aug-2016 to Jul-2021 4.90% $4.06 Aug-2019 $51.00 Office 7-19
60 Months $83,281 Aug-2020 $51.75
10 Workers Comp. $45.00 - - See method: Market
Office, Suite: 19th,22 50,225 $2,260,125 Workers Comp See assumption:
Apr-2001 to Jan-2019 12.01% $3.75 Office 20-23
214 Months $188,344
11 New York Energy $34.97 - - See method: New Market
Office, Suite: 19th 2,500 $87,425 York Energy See assumption:
Aug-2007 to Jul-2018 0.60% $2.91 Office 7-19
132 Months $7,285
12 Berkaman Law $33.57 - - See method: Market
Office, Suite: 19th 4,125 $138,476 Berkaman Law See assumption:
Nov-2008 to Oct-2018 0.99% $2.80 Office 7-19
120 Months $11,540
13 Brooklyn Law $51.00 Feb-2019 $52.00 See method: Market
Office, Suite: 20th/21 41,000 $2,091,000 Feb-2021 $53.25 Brooklyn Law See assumption:
May-2017 to Jan-2032 9.81% $4.25 Feb-2022 $54.00 Office 20-23
177 Months $174,250 Feb-2023 $54.75
Feb-2024 $55.50
Feb-2025 $56.25
Feb-2026 $57.00
Feb-2027 $57.75
Feb-2028 $58.50
Feb-2029 $59.25
Feb-2030 $60.00
Feb-2031 $60.75
14 Vacant $50.00 Jun-2019 $51.50 See method: New Market
Office, Suite: 17th 10,270 $513,500 Jun-2020 $53.05 Tenant See assumption:
Jun-2018 to May-2028 2.46% $4.17 Jun-2021 $54.64 Office 7-19
120 Months $42,792 Jun-2022 $56.28
Jun-2023 $57.96
Jun-2024 $59.70
Jun-2025 $61.49
Jun-2026 $63.34
Jun-2027 $65.24
Total Occupied SqFt 407,862
Total Available SqFt 10,269

ADDENDA

ADDENDA
SENSITIVTY ANALYSIS
Discount Terminal Occupancy Fair Value
Rate Cap Rate Rate (Rounded)Baseline 6.50% 5.50% 98.71% $232,000,000
Discount Rate Change + 0.25% 6.75% 5.50% 98.71% $227,600,000
Discount Rate Change - 0.25% 6.25% 5.50% 98.71% $236,600,000
Terminal Cap Rate Change + 0.25% 6.50% 5.75% 98.71% $225,800,000
Terminal Cap Rate Change - 0.25% 6.50% 5.25% 98.71% $238,900,000
Discount Rate Change + 0.50% 7.00% 5.50% 98.71% $223,300,000
Discount Rate Change - 0.50% 6.00% 5.50% 98.71% $241,300,000
Terminal Cap Rate Change + 0.50% 6.50% 6.00% 98.71% $220,000,000
Terminal Cap Rate Change - 0.50% 6.50% 5.00% 98.71% $246,500,000

ADDENDA
LETTER OF ENGAGEMENT

ADDENDA

ADDENDA
ASSUMPTIONS AND LIMITING CONDITIONS
This appraisal report has been made with the following general assumptions:
1. Any legal description or plats reported herein are assumed to be accurate. Any sketches,
surveys, plats, photographs, drawings or other exhibits are included only to assist the intended user to better understand and visualize the subject property, the environs, and the competitive data. We have made no survey of the property and assume no responsibility in connection with such matters.
2. The appraiser has not conducted any engineering or architectural surveys in connection with this appraisal assignment. Information reported pertaining to dimensions, sizes, and areas is either based on measurements taken by the appraiser or the appraiser’s staff or was obtained or taken from referenced sources and is considered reliable. No responsibility is assumed for the costs of preparation or for arranging geotechnical engineering, architectural, or other types of studies, surveys, or inspections that require the expertise of a qualified professional.
3. No responsibility is assumed for matters legal in nature. Title is assumed to be good and marketable and in fee simple unless otherwise stated in the report. The property is considered to be free and clear of existing liens, easements, restrictions, and encumbrances, except as stated.
4. Unless otherwise stated herein, it is assumed there are no encroachments or violations of any zoning or other regulations affecting the subject property and the utilization of the land and improvements is within the boundaries or property lines of the property described and that there are no trespasses or encroachments.
5. BBG, Inc. assumes there are no private deed restrictions affecting the property which would limit the use of the subject property in any way.
6. It is assumed the subject property is not adversely affected by the potential of floods; unless otherwise stated herein.
7. It is assumed all water and sewer facilities (existing and proposed) are or will be in good working order and are or will be of sufficient size to adequately serve any proposed buildings.
8. Unless otherwise stated within the report, the depiction of the physical condition of the improvements described herein is based on visual inspection. No liability is assumed for the soundness of structural members since no engineering tests were conducted. No liability is assumed for the condition of mechanical equipment, plumbing, or electrical components, as complete tests were not made. No responsibility is assumed for hidden, unapparent or masked property conditions or characteristics that were not clearly apparent during our inspection.
9. If building improvements are present on the site, no significant evidence of termite damage or infestation was observed during our physical inspection, unless so stated in the report. No termite inspection report was available, unless so stated in the report. No responsibility is assumed for hidden damages or infestation.
10. Any proposed or incomplete improvements included in this report are assumed to be satisfactorily completed in a workmanlike manner or will be thus completed within a reasonable length of time according to plans and specifications submitted.

ADDENDA
11. No responsibility is assumed for hidden defects or for conformity to specific governmental requirements, such as fire, building, safety, earthquake, or occupancy codes, except where specific professional or governmental inspections have been completed and reported in the appraisal report.
12. Responsible ownership and competent property management are assumed.
13. The appraisers assume no responsibility for any changes in economic or physical conditions which occur following the effective date of value within this report that would influence or potentially affect the analyses, opinions, or conclusions in the report. Any subsequent changes are beyond the scope of the report.
14. The value estimates reported herein apply to the entire property. Any proration or division of the total into fractional interests will invalidate the value estimates, unless such proration or division of interests is set forth in the report.
15. Any division of the land and improvement values estimated herein is applicable only under the program of utilization shown. These separate valuations are invalidated by any other application.
16. Unless otherwise stated in the report, only the real property is considered, so no consideration is given to the value of personal property or equipment located on the premises or the costs of moving or relocating such personal property or equipment.
17. Unless otherwise stated, it is assumed that there are no subsurface oil, gas or other mineral deposits or subsurface rights of value involved in this appraisal, whether they are gas, liquid, or solid. Nor are the rights associated with extraction or exploration of such elements considered; unless otherwise stated. Unless otherwise stated it is also assumed that there are no air or development rights of value that may be transferred.
18. Any projections of income and expenses, including the reversion at time of resale, are not predictions of the future. Rather, they are our best estimate of current market thinking of what future trends will be. No warranty or representation is made that these projections will materialize. The real estate market is constantly fluctuating and changing. It is not the task of an appraiser to estimate the conditions of a future real estate market, but rather to reflect what the investment community envisions for the future in terms of expectations of growth in rental rates, expenses, and supply and demand. The forecasts, projections, or operating estimates contained herein are based on current market conditions, anticipated short-term supply and demand factors, and a continued stable economy. These forecasts are, therefore, subject to changes with future conditions.
19. Unless subsoil opinions based upon engineering core borings were furnished, it is assumed there are no subsoil defects present, which would impair development of the land to its maximum permitted use or would render it more or less valuable. No responsibility is assumed for such conditions or for engineering which may be required to discover them.
20. BBG, Inc. representatives are not experts in determining the presence or absence of hazardous substances, defined as all hazardous or toxic materials, wastes, pollutants or contaminants (including, but not limited to, asbestos, PCB, UFFI, or other raw materials or chemicals) used in construction or otherwise present on the property. We assume no responsibility for the studies or analyses which would be required to determine the presence or absence of such substances or for loss as a result of the presence of such substances. Appraisers are not qualified to detect such substances. The client is urged to retain an expert in this field.

ADDENDA
21. We are not experts in determining the habitat for protected or endangered species, including, but not limited to, animal or plant life (such as bald eagles, gophers, tortoises, etc.) that may be present on the property. We assume no responsibility for the studies or analyses which would be required to determine the presence or absence of such species or for loss as a result of the presence of such species. The appraiser hereby reserves the right to alter, amend, revise, or rescind any of the value opinions based upon any subsequent endangered species impact studies, research, and investigation that may be provided.
22. No environmental impact studies were either requested or made in conjunction with this analysis. The appraiser hereby reserves the right to alter, amend, revise, or rescind any of the value opinions based upon any subsequent environmental impact studies, research, and investigation that may be provided.
23. The appraisal is based on the premise that there is full compliance with all applicable federal, state, and local environmental regulations and laws unless otherwise stated in the report; further, that all applicable zoning, building, and use regulations and restrictions of all types have been complied with unless otherwise stated in the report; further, it is assumed that all required licenses, consents, permits, or other legislative or administrative authority, local, state, federal and/or private entity or organization have been or can be obtained or renewed for any use considered in the value estimate.
24. Neither all nor any part of the contents of this report or copy thereof, shall be conveyed to the public through advertising, public relations, news, sales, or any other media, without the prior written consent and approval of the appraisers. This limitation pertains to any valuation conclusions, the identity of the analyst or the firm and any reference to the professional organization of which the appraiser is affiliated or to the designations thereof.
25. Although the appraiser has made, insofar as is practical, every effort to verify as factual and true all information and data set forth in this report, no responsibility is assumed for the accuracy of any information furnished the appraiser either by the client or others. If for any reason, future investigations should prove any data to be in substantial variance with that presented in this report, the appraiser reserves the right to alter or change any or all analyses, opinions, or conclusions and/or estimates of value.
26. If this report has been prepared in a so-called “public non-disclosure” state, real estate sales prices and other data, such as rents, prices, and financing, are not a matter of public record. If this is such a “non-disclosure” state, although extensive effort has been expended to verify pertinent data with buyers, sellers, brokers, lenders, lessors, lessees, and other sources considered reliable, it has not always been possible to independently verify all significant facts. In these instances, the appraiser may have relied on verification obtained and reported by appraisers outside of our office. Also, as necessary, assumptions and adjustments have been made based on comparisons and analyses using data in the report and on interviews with market participants. The information furnished by others is believed to be reliable, but no warranty is given for its accuracy.

ADDENDA
27. The American Disabilities Act (ADA) became effective January 26, 1992. The appraiser has not made a specific compliance survey or analysis of the property to determine whether or not it is in conformity with the various detailed requirements of ADA. It is possible that a compliance survey of the property and a detailed analysis of the requirements of the ADA would reveal that the property is not in compliance with one or more of the requirements of the act. If so, this fact could have a negative impact upon the value of the property. Since the appraiser has no direct evidence relating to this issue, possible noncompliance with the requirements of ADA was not considered in estimating the value of the property.
28. This appraisal report has been prepared for the exclusive benefit of the client. It may not be used or relied upon by any other party. Any other party who is not the identified client within this report who uses or relies upon any information in this report does so at their own risk.
29. The dollar amount of any value opinion herein rendered is based upon the purchasing power and price of the United States Dollar as of the effective date of value. This appraisal is based on market conditions existing as of the date of this appraisal.
30. The right is reserved by the appraiser to make adjustments to the analyses, opinions, and conclusions set forth in this report as may be required by consideration of additional or more reliable data that may become available. No change of this report shall be made by anyone other than the appraiser or appraisers. The appraiser(s) shall have no responsibility for any unauthorized change(s) to the report.
31. If the client instructions to the appraiser were to inspect only the exterior of the improvements in the appraisal process, the physical attributes of the property were observed from the street(s) as of the inspection date of the appraisal. Physical characteristics of the property were obtained from tax assessment records, available plans, if any, descriptive information, and interviewing the client and other knowledgeable persons. It is assumed the interior of the subject property is consistent with the exterior conditions as observed and that other information relied upon is accurate.
32. The submission of this report constitutes completion of the services authorized. It is submitted on the condition the client will provide reasonable notice and customary compensation, including expert witness fees, relating to any subsequent required attendance at conferences, depositions, and judicial or administrative proceedings. In the event the appraiser is subpoenaed for either an appearance or a request to produce documents, a best effort will be made to notify the client immediately. The client has the sole responsibility for obtaining a protective order, providing legal instruction not to appear with the appraisal report and related work files and will answer all questions pertaining to the assignment, the preparation of the report, and the reasoning used to formulate the estimate of value. Unless paid in whole or in part by the party issuing the subpoena or by another party of interest in the matter, the client is responsible for all unpaid fees resulting from the appearance or production of documents regardless of who orders the work.
33. Use of this appraisal report constitutes acknowledgement and acceptance of the general assumptions and limiting conditions, special assumptions (if any), extraordinary assumptions (if any), and hypothetical conditions (if any) on which this estimate of fair value is based.
34. If provided, the estimated insurable value is included at the request of the client and has not been performed by a qualified insurance agent or risk management underwriter. This cost estimate should not be solely relied upon for insurable value purposes. The appraisers are not familiar with the definition of insurable value from the insurance provider, the local

ADDENDA
governmental underwriting regulations, or the types of insurance coverage available. These factors can impact cost estimates and are beyond the scope of the intended use of this appraisal. The appraisers are not cost experts in cost estimating for insurance purposes.

ADDENDA
CERTIFICATION The appraisers certify that:
⋅ Philip Ginsberg has personally inspected the property and prepared the analysis concerning the real estate that is the subject of this appraisal report.
⋅ Joel Leitner, MAI, CRE has reviewed the analyses, opinions and conclusions concerning the real estate contained in this appraisal report and fully concurs with the final fair value conclusion.
⋅ The statements of fact contained in this report are true and correct.
⋅ The appraisal assignment was not based on a requested minimum valuation, a specific valuation, or the approval of a loan.
⋅ The reported analysis, opinions and conclusions are limited only by the reported assumptions and limiting conditions and are our personal, unbiased professional analyses, opinions and conclusions.
⋅ The undersigned have no bias with respect to the property that is the subject of this report or to the parties involved with this assignment.
⋅ Our compensation is not contingent on an action or event resulting from the analysis, opinions or conclusions in, or the use of, this report.
⋅ Our analyses, opinions and conclusions were developed and this report has been prepared in conformity with the requirements of the Code of Professional Ethics and the Standards of Professional Practice of the Appraisal Institute.
⋅ No one provided significant professional assistance to the persons signing this appraisal report.
⋅ The undersigned have not performed services, as an appraiser or in any other capacity, regarding the subject property within the 3-year period immediately preceding this assignment.
⋅ The use of this report is subject to the requirements of the Appraisal Institute relating to review by its duly authorized representatives.
⋅ The undersigned’s engagement in this assignment was not contingent upon developing or reporting pre-determined results.
⋅ Our compensation for completing this assignment is not contingent upon the development or reporting of a pre-determined value or direction in value that favors the cause of the client, the amount of the value opinion, the attainment of a stipulated result, or the occurrence of a subsequent event directly related to the intended use of this appraisal.

ADDENDA
⋅ Joel Leitner, MAI, CRE is currently certified under the continuing education program of the Appraisal Institute. He is also certified by the State of New York as a General Real Estate Appraiser.
______________________________ _________________________________
Philip Ginsberg Joel Leitner, MAI, CRE
Senior Appraiser Managing Director
State Certified General Appraiser #46-3011

ADDENDA
QUALIFICATIONS

ADDENDA

ADDENDA
LICENSE

A P P R A I S A L R E P O R T
Medical And Office Building 699 92nd Street and 9012 7th Avenue Brooklyn, NY 11228 R E Q U E S T E D B Y
Mr. Avrumie Furst The Leser Group ("TLG") 1481 47th Street Brooklyn, NY 11219 P R E P A R E D B Y
BBG, Inc. 112 Madison Avenue, 11th Floor New York, NY 10016 D A T E O F V A L U E
December 31, 2017

N E W Y O R K
+ CORPORATE OFFICE
P + 212.682.0400
F + 212.682.2233
112 MADISON AVE. + FLOOR 11
NEW YORK, NY 10016
B B G R E S . C O M
March 14, 2018 Mr. Avrumie Furst The Leser Group ("TLG") 1481 47th Street Brooklyn, NY 11219 Re: Appraisal File No. 0118000070
Medical And Office Building 699 92nd Street and 9012 7th Avenue Brooklyn, NY 11228
Dear Mr. Furst: In accordance with your request, we have completed an appraisal of above-captioned property for the purpose of advancing an opinion of the fair value of the Leased Fee estate in accordance with IFRS-13. The subject consists of two lots and four interconnected medical buildings, ranging from one to seven stories, totaling 179,315 sf of gross building area, of which 163,106 sf are net rentable. The site is situated on 51,928 sf of land. The subject is 100% occupied and leased by the Northwell Healthcare Inc. The adjacent block/lot 6094/26 to the north is additional amenity in tenant's lease and offered for off-street parking use. The tenant has signed a 15-year triple net lease (with three additional renewal options) for the property. The tenant has signed a sublease agreement with SUNY Downstate Medical Center. 699 92nd Street and 9012 7th Avenue is 179,315± gross square feet and is situated on a 51,928± square foot parcel in an R4B zone. 699 92nd Street and 9012 7th Avenue is at the intersection of 92nd Street and 7th Avenue in the Sunset Park neighborhood of Brooklyn, NY. It is identified on Kings County tax maps as Block(s) 6094, Lot(s) 1 & 26. The highest and best use of 699 92nd Street and 9012 7th Avenue is as a medical and office building. This conclusion is based on its zoning, physical characteristics, location, and forecasted economic conditions. Our analyses, opinions and conclusions were developed, and this report has been prepared, in conformance with the Standards of Professional Practice and Code of Professional Ethics of the Appraisal Institute, the Uniform Standard of Professional Appraisal Practice (USPAP), and Title XI (with amendments) of the Financial Institutions Reform, Recovery and Enforcement Act of 1989 (FIRREA).

Mr. Avrumie Furst Page 2 March 14, 2018 We have appraised the above referenced property, the conclusions of which are set forth in the attached appraisal report. This is an Appraisal Report that is intended to comply with the reporting requirements set forth under Standards Rule 2-2 of USPAP and the Code of Professional Ethics and the Standards of Professional Appraisal Practice of the Appraisal Institute. In addition, this appraisal has been prepared in compliance with IFRS 13 (International Financial Reporting Standards 13-fair value measurement). The depth of analysis discussed in this report is specific to the needs of the client and for the intended use stated in the report. We confirm that we have given our full consent to the inclusion of the Appraisal Report in its entirety within The Leser Group Limited's financial statements for year-end 2017, to be published in the Tel Aviv Stock Exchange Ltd. in March 2018. The Leser Group ("TLG") is also an intended user of this report. After carefully considering all available information and factors affecting value, our opinion is: Value Date Conclusion
Fair Value "As Is" December 31, 2017 $99,000,000 The opinions of value expressed herein are subject to the certification, assumptions and limiting conditions, and all other information contained in the following written appraisal report. Thank you for the opportunity to serve you. Sincerely,
_____________________________ _________________________________ Jon DiPietra, MAI Joel Leitner, MAI, CRE Director Managing Director State Certified General Appraiser #46-46386 State Certified General Appraiser #46-3011 (212) 682-5360 [email protected]

SUMMARY OF SALIENT FACTS AND CONCLUSIONS Subject Property: Medical And Office Building
699 92nd Street and 9012 7th Avenue
Brooklyn, NY 11228
Building Description: The subject consists of two lots and four interconnected medical buildings, ranging from one to seven stories, totaling 179,315 sf of gross building area, of which 163,106 sf are net rentable. The site is situated on 51,928 sf of land. The subject is 100% occupied and leased by the Northwell Healthcare Inc. The adjacent block/lot 6094/26 to the north is additional amenity in tenant's lease and offered for off-street parking use. The tenant has signed a 15-year triple net lease (with three additional renewal options) for the property. The tenant has signed a sublease agreement with SUNY Downstate Medical Center. 699 92nd Street and 9012 7th Avenue is 179,315± gross square feet and is situated on a 51,928± square foot parcel in an R4B zone.
Location: The subject is at the intersection of 92nd Street and 7th Avenue in the Sunset Park neighborhood of Brooklyn, NY.
Block/Lot: Block 6094, Lot(s) 1 & 26
Year Built:
Census Tract:
1918
310.00
Site Area: 51,928± square feet
Zoning: R4B
Flood Hazard Status: Zone X, an area of minimal flooding per Flood Insurance Rate Map #3604970332F, effective September 5, 2007
Marketing Time: Between six months and one year.
Exposure Time: Between six months and one year.
Property Rights Appraised: Leased Fee
Date of Inspection: January 29, 2018
Fair Value Opinion:
Value Date Conclusion
Fair Value "As Is" December 31, 2017 $99,000,000

TABLE OF CONTENTS
INTRODUCTION .......................................................................................................................... 1
Property Identification ....................................................................................................... 1
Purpose of the Appraisal ................................................................................................... 1
Competency ...................................................................................................................... 1
Function Of The Appraisal/Intended User ......................................................................... 1
Property Rights Appraised ................................................................................................ 2
Date of Value Opinion ....................................................................................................... 2
Property History ................................................................................................................ 2
Exposure Time .................................................................................................................. 3
Estimate of Reasonable Marketing Time .......................................................................... 3
Definition of Real Estate-Related Financial Transaction ................................................... 4
Scope of the Appraisal ...................................................................................................... 4
Data Sources .................................................................................................................... 5
ECONOMIC OUTLOOK ................................................................................................................ 6
MEDICAL OFFICE AND HEALTH CARE REPORT BY CBRE RESEARCH ............................. 38
NEIGHBORHOOD DESCRIPTION ............................................................................................ 45
Location Identification ..................................................................................................... 45
Dyker Heights Overview .................................................................................................. 45
ZONING SUMMARY ................................................................................................................... 51
ASSESSED VALUE AND REAL ESTATE TAXES ..................................................................... 53
SITE DESCRIPTION .................................................................................................................. 55
FLOOD MAP ............................................................................................................................... 57
ASSET PHOTOS ........................................................................................................................ 58
BUILDING DESCRIPTION ......................................................................................................... 79
HIGHEST AND BEST USE ......................................................................................................... 82
APPRAISAL VALUATION PROCESS ........................................................................................ 85
INCOME APPROACH ................................................................................................................ 86
Base Rental Income ........................................................................................................ 87
Vacancy/Collection Loss Factor ...................................................................................... 91
Effective Gross Income ................................................................................................... 91
Operating Expense Analysis ........................................................................................... 92
Stabilized Income and Expenses .................................................................................... 94
SALES COMPARISON APPROACH ........................................................................................ 100
RECONCILIATION AND FINAL VALUE OPINION ................................................................... 108
ADDENDA ................................................................................................................................ 109

LETTER OF ENGAGEMENT ........................................................................................ 110
INSURABLE VALUE ..................................................................................................... 112
CONTINGENT AND LIMITING CONDITIONS .............................................................. 113
CERTIFICATION ........................................................................................................... 118
QUALIFICATIONS ........................................................................................................ 120
LICENSES .................................................................................................................... 124

INTRODUCTION
BBG, INC. 1 0118000070
INTRODUCTION PROPERTY IDENTIFICATION The subject consists of two lots and four interconnected medical buildings, ranging from one to seven stories, totaling 179,315 sf of gross building area, of which 163,106 sf are net rentable. The site is situated on 51,928 sf of land. The subject is 100% occupied and leased by the Northwell Healthcare Inc. The adjacent block/lot 6094/26 to the north is additional amenity in tenant's lease and offered for off-street parking use. The tenant has signed a 15-year triple net lease (with three additional renewal options) for the property. The tenant has signed a sublease agreement with SUNY Downstate Medical Center. 699 92nd Street and 9012 7th Avenue is 179,315± gross square feet and is situated on a 51,928± square foot parcel in an R4B zone. 699 92nd Street and 9012 7th Avenue at the intersection of 92nd Street and 7th Avenue in the Sunset Park neighborhood of Brooklyn, NY. It is identified on Kings County tax maps as Block(s) 6094, Lot(s) 1 & 26. PURPOSE OF THE APPRAISAL The purpose of the appraisal is to estimate the fair value as of the subject property’s Leased Fee interest in accordance with IFRS 13. COMPETENCY We have experience appraising similar properties, and possess the knowledge and competency to produce a credible value opinion. IDENTIFICATION OF THE CLIENT The Leser Group ("TLG") has engaged us and is our client for this assignment. FUNCTION OF THE APPRAISAL/INTENDED USER The type and definition of value sought in the appraisal of the subject was an “as is” Fair Value opinion for the leased fee interest in the property as of December 31, 2017, subject to the general underlying assumptions and limiting conditions cited herein, and in compliance with IFRS 13 (International Financial Reporting Standards 13-fair value measurement). According to the International Financial Reporting Standard 13, Fair Value is defined as: “The price that would be received to sell an asset or paid to transfer a liability in an orderly transaction between market participants at the measurement date.” The appraisals are to be used by The Leser Group ("TLG") in preparation of IFRS financial statements in connection with a potential TASE offering.

INTRODUCTION
BBG, INC. 2 0118000070
We confirm that we have given our full consent to the inclusion of the Appraisal Report in its entirety within The Leser Group Limited's financial statements for year-end 2017, to be published in the Tel Aviv Stock Exchange Ltd. in March 2018. The Leser Group ("TLG") is also an intended user of this report. PROPERTY RIGHTS APPRAISED The existence of a lease within the subject property indicates that the property should be appraised on the basis of a leased fee estate (encumbered). A leased fee estate is an ownership interest held by a landlord with the right of use and occupancy conveyed by lease to others; the rights of the lessor (the leased fee owner) and the lessee (leaseholder) are specified by contract terms contained within the lease. DATE OF VALUE OPINION The valuation date of this appraisal is as of December 31, 2017. Anthony Legotti, Jon DiPietra and Joel Leitner inspected the asset and its environs on January 29, 2018. PROPERTY HISTORY 699 92nd Street and 9012 7th Avenue 9012 7th Avenue is owned by SUNSET LG REALTY LLC.
Address Block/Lot Sale Date Sale Price Grantor Grantee
699 92nd Street and 9012
7th Avenue6094/ 1 & 5 9/1/2009 $44,900,000
Victory Memorial
Hospital
Dormitory Authority of the
State of New York
691 92nd Street 6094 / 5 10/21/2010 $20,000,000The Bradford Charitable
TrustHamilton Park Realty, LLC
9012 7th Avenue 6094 / 26 2/18/2015 $1,300,000 MVP 8 LLC 9012 7th Ave LLC
The sponsor acquired former Victory Memorial Hospital on 9/1/2009 for $44,900,000 . On 10/21/2010, the owner sold the adjacent Nursing Care Facility situated on Block / Lot 6094 / 5 to Hamilton Park Realty, LLC. On 2/18/2015 acquired an adjacent lot 6094 / 26 to the north for $1,300,000 to offer off-street parking space to Northwell Healthcare, Inc.. The subject is 100% triple-net leased to Northwell Healthcare, Inc., a major healthcare nationwide provider. The tenant has signed a 15-year triple net lease that commenced on 7/1/2017 and is set to expire on 6/30/2032. The lease shows three renewal options extending the term to 49 years. The owner acquired the land to the immediate north of the subject in order to offer parking to Northwell Healthcare Inc. We are unaware of any options to purchase, bids, or offers of this asset.

INTRODUCTION
BBG, INC. 3 0118000070
EXPOSURE TIME Exposure time has been defined, as the estimated length of time the real property interest appraised would have been offered in the market prior to the hypothetical consummation of a sale at fair value on the effective date of appraisal; a retrospective estimate based on an analysis of past events assuming a competitive and open market. Exposure time is always presumed to precede the effective date of appraisal. It is our opinion that a normal exposure time for the subject property is between six months and one year. This conclusion is predicated on interviews with brokers and other real estate industry sources and on information obtained in the verification process. The value reported herein presumes such an exposure time. ESTIMATE OF REASONABLE MARKETING TIME Given the subject's present condition and location and the marketing times for similar assets in New York City, we estimate the marketing time for the subject to be between six months and one year. GENERAL ASSUMPTIONS Information, estimates and opinions furnished to us and contained in the report were obtained from sources considered reliable and believed to be accurate. The opinions of value stated herein are based on this assumption. EXTRAORDINARY ASSUMPTIONS According to The Dictionary of Real Estate Appraisal (6th Edition), an Extraordinary Assumption is "An assumption, directly related to a specific assignment, which, if found to be false, could alter the appraiser's opinions or conclusions. Extraordinary assumptions presume as fact otherwise uncertain information about physical, legal, or economic characteristics of the subject property; or about conditions external to the property such as market conditions or trends; or about the integrity of data used in an analysis." In the development of our opinions of value, we have applied the following extraordinary assumptions: None. HYPOTHETICAL CONDITION According to The Dictionary of Real Estate Appraisal (6th Edition), a Hypothetical Condition is "that which is contrary to what exists but is supposed for the purpose of analysis. Hypothetical conditions assume conditions contrary to known facts about physical, legal, or economic characteristics of the subject property; or about conditions external to the property, such as market conditions or trends; or about the integrity of data used in an analysis." In the development of our opinions of value, we have applied the following Hypothetical Condition: None. DEFINITION OF FAIR VALUE

INTRODUCTION
BBG, INC. 4 0118000070
IFRS 13 defines fair value as the price that would be received to sell an asset or paid to transfer a liability in an orderly transaction between market participants at the measurement date (i.e. an exit price). That definition of fair value emphasis that fair value is a market-based measurement, not an entity-specific measurement. When measuring fair value, an entity uses the assumptions that market participants would use when pricing the asset or liability under current market conditions, including assumptions about risk. As a result, an entity’s intention to hold an asset or to settle or otherwise fulfil a liability is not relevant when measuring fair value. The IFRS explains that a fair value measurement requires an entity to determine the following:
(a) the particular asset or liability being measured;
(b) for a non-financial asset, the highest and best use of the asset and whether the asset is
used in combination with other assets or on a stand-alone basis;
(c) the market in which an orderly transaction would take place for the asset or liability; and
(d) the appropriate valuation technique(s) to use when measuring fair value. The valuation
technique(s) used should maximize the use of relevant observable inputs and minimize
unobservable inputs. Those inputs should be consistent with the inputs a market participant
would use when pricing the asset or liability.
DEFINITION OF REAL ESTATE-RELATED FINANCIAL TRANSACTION1 Any transaction involving: The sale, lease, purchase, investment in or exchange of real property, including interests in
property, or the financing thereof; or
The refinancing of real property or interests in real property; or
The use of real property or interests in property as security for a loan or investment, including mortgage-backed securities.
SCOPE OF THE APPRAISAL BBG, Inc., has been retained by Mr. Avrumie Furst of The Leser Group ("TLG") to prepare a market valuation of the subject property. Within the course of this assignment, we have: Researched and investigated the location in terms of its economic activity, development
patterns, and future trends and related their impact on the market.
1 12 U.S.C. 3350(5) (FIRREA section 1121(5)

INTRODUCTION
BBG, INC. 5 0118000070
Determined the Highest and Best Use of the subject property based on an analysis of all relevant factors.
Conducted a market survey of rent and vacancy levels of similar buildings.
Projected the net operating income (as encumbered) under stabilized operation and applied a market-derived income capitalization rate to develop an opinion of value by the income approach.
Researched and analyzed sales of competitive assets and applied the techniques of the sales comparison approach in advancing an opinion of value.
Advanced an opinion of the fair value of the identified interest, as of December 31, 2017.
DATA SOURCES The data contained within this appraisal was compiled from market analysis utilizing the following sources (unless otherwise noted): NYC Department of Finance, NYC Department of Buildings, NYC Department of Planning Zoning & Land Use, Claritas, CoStar, Genesis GenPAD, Federal Reserve, FEMA, and Reis. When possible, we have confirmed the reported data with parties to the transactions or those who are intimately familiar with their critical details.

AREA AND MARKET ANALYSIS
BBG, INC. 6 0118000070
ECONOMIC OUTLOOK Overview The national economy continues to grow sluggishly but persistently with the current expansion becoming the third longest in the post-WWII period. While the results of the presidential election raised expectations of stronger growth due to proposed tax cuts, looser regulatory oversight, and infrastructure spending, these projections have now been tempered due to the initial difficulties encountered by the new administration. Real GDP in 2016 grew at the slowest pace in 5 years, supported by consistent consumption spending but impeded by weak investment and a drag from net exports. Growth is projected to rebound, however, with the pace accelerating in 2017 and 2018. While survey-based sentiment measures such as consumer confidence have been enthusiastic—with many indicators hitting cyclical highs—the “hard” data has been more ambiguous. With the economy near full employment, job gains are slowing, potentially limiting growth ahead. The unemployment rate is now at a 10-year low and stands just above the trough of the housing boom expansion. However, the absence of stronger wage growth continues to be a puzzle with compensation plateauing in the most recent data. Judging from durable goods ordered, the path of business spending has not changed yet either, offering little evidence that investment is picking up. The tight labor market and signs of building inflation motivated another Fed rate hike in March following its last action in December. With the Fed’s preferred inflation measure now passing its 2% target in the first quarter, the central bank is likely to maintain a tighter monetary stance for the next few years. Two more quarter point hikes are expected this year followed by three in 2018. The bump that financial markets experienced after Election Day faded with small bap and banking shares—which surged in December—suffering losses at the start of 2017. At the same time, volatility dropped to near record lows. Bond yields, which jumped at the end of 2016, have retracted some of the gains. The low rate environment extended the boom in corporate bond issuance as firms lock in cheap borrowing. The favorable conditions in 2016 supported Wall Street banks, which generated their highest profits in 5 years. Initial evidence from first quarter earnings reports suggests that these conditions persisted into 2017. The New York City economy continues to grow robustly, albeit with signs of slowing. In 2016, total employment gains exceeded 2% for the sixth consecutive year. However, like the nation, recent data for the first quarter of 2017 indicates a deceleration of job growth due to tighter labor markets. This slowdown is projected to continue through the forecast horizon. Despite strong hiring in 2016, wage growth was sluggish due to declines in bonuses in the securities and professional & business services sectors. However, compensation should strengthen in the near future, driven by compensation for workers, a rebound in bonuses, and a boost from the State minimum wage law. Wage growth should more than offset slower hiring, resulting in accelerating wage earnings growth over the next 2 years. Other sectors of the New York City economy are also decelerating. Residential real estate activity slowed in 2016 with the first decline in transactions since 2011, driven by drops in condo

AREA AND MARKET ANALYSIS
BBG, INC. 7 0118000070
and co-op sales. Nevertheless, average prices are still growing strongly, skewed by the outsized influence of gains in luxury condo prices while co-op prices declined. Commercial rent growth also softened in 2016, although leasing activity at the start of 2017 appears to be strong with corresponding declines in vacancy rates. Tourism continues to be a major contributor to the local economy with growing room nights sold but falling average room rates. While international tourism is expected to contract in 2017 for the first time since the recession, strength from domestic visitors is projected to help support the industry. The U.S. Economy The national economy lumbered out of March—the 93rd month of expansion—securing the position as the third longest recovery in the post WWII period. The latest available GDP estimates (for the fourth quarter 2016) reported growth of just 2.1%, constrained by a drag from net exports and continued weakness in non-residential fixed investment. Full year 2016 growth was only 1.6%, the slowest pace in 5 years. On the bright side, the American consumer persisted as the engine of the expansion with consumption contributing over 1.9 percentage points to GDP growth. However, this annual growth was eroded by negative contributions totaling nearly -0.4 percentage points due to declines in investment and net exports. Looking forward, the pace of real GDP is projected to pick up to 2.3% in 2017 and accelerate further to 2.5% in 2018. The weak fourth quarter results were partly an artifact of the unexpected jump in net exports in the third when U.S. agricultural exports soared due to crop failures in Latin America. Since the boost was temporary, a resulting payback occurred in the fourth quarter when net exports contracted by -4.5%. Excluding this external volatility, domestic activity was robust. Growth in gross domestic purchases, which omit net exports, was 3.9% in the fourth quarter. More concerning, however, is the ongoing weakness in non-residential investment which grew only 0.9% in the fourth quarter, extending the deceleration of investment spending exacerbated by the 2014 tumble in energy prices. As a result, most of the growth in fourth quarter investment came from residential investment and inventory changes. The former grew 9.6%, rebounding from 2 quarters of contraction and contributing 0.35 percentage points to growth. Changes in private inventories provided a full percentage point boost, but this temporary tailwind is expected to flip to a small headwind in 2017. The election of President Trump initially prompted forecasters to raise their projections due to proposed cuts in corporate and other taxes and to looser regulatory oversight on industry and finance. In addition, the proposed increase in infrastructure spending was expected to provide a fiscal boost. However, the events of the first quarter have started to temper these projections. As a result, estimated of first quarter 2017 growth are being revised down. The Blue Chip and Wall Street Journal consensus estimates both fell from above 2% in December to 1.4% in April. Likewise, real time GDP trackers at the New York Fed and Atlanta Fed have slumped over the same period. Recent economic data is reflecting the ambiguity about the economy’s near-term direction. While survey-based sentiment data has been extremely positive, “hard” quantifiable data such as durable goods orders and retail sales has been much more muted. The most commonly reported gauges of consumer outlooks, the University of Michigan consumer sentiment index, and

AREA AND MARKET ANALYSIS
BBG, INC. 8 0118000070
Conference Board consumer confidence index have recently jumped. Since the election, the consumer sentiment index has hit 98 or higher in 3 months (and has only been this elevated on one other occasion in the current expansion). Likewise, the consumer confidence index surged to a 16-year high at the end of March. The Small Business Optimism index has soared to levels not seen since the height of the housing boom, hitting a 12-year high in January. However, the hard data has diverged from these enthusiastic views. Consumer spending has been stable, but nowhere as strong as consumer confidence would imply. First quarter growth in retail sales rose 4%, down from 7.8% in the fourth quarter of 2016 and slightly below the 6-year average of 4.4%. Particularly problematic is the fact that auto sales appear to have peaked. After 2 consecutive record years in 2015 and 2016, first quarter light vehicle sales declined to a seasonally adjusted 17.2 million, down from 18 million in the prior quarter. Business spending has also had an ambiguous start in 2017. Manufacturers’ new durable goods orders climbed at a monthly average of 2% in the first 2 months of the year, much stronger than the average 0.1% monthly pace of 2016. However, the core measure of new orders, which is a proxy for business investment spending, was flat in January and February compared to a 0.25% monthly average in 2016. Nevertheless, the ISM purchasing managers index jumped from an average of about 51.5 in 2016—just above the 50-mark dividing expansion from contraction—to a 6-year high of 57 in the first quarter. The most recent employment data has also been indecisive. Job growth has been fairly consistent for several years with monthly gains averaging 187,000 in 2016. In the first quarter, this pace dropped slightly to 178,000 due to a weak report of 98,000 in March. Part of this deceleration was attributed to winter weather during the survey period. At the same time, the unemployment rate fell to a 10-year low of 4.5%, just 0.1 percentage point away from the lowest level of the last expansion and below the Fed’s projected long-rum median rate of 4.7%. However, given the tight labor market, the lack of stronger wage growth remains a puzzle. From 2011 through 2015, average hourly earnings growth hovered around 2% (year over year). Thereafter, compensation started to climb, hitting 2.7% by mid-2016. However, it has plateaued at that pace and, with headline CPI inflation running at about 2.4%, real wage growth has been weak. Given the demographics, job growth is projected to slow over the forecast horizon, dropping from 1.8% in 2016 to 1.6% (2.2 million jobs), in 2017. The Federal Reserve is implicitly assuming that the rate of job growth will decline as labor markets approach full employment. In the FOMC summary economic projections released in March, the forecasted median unemployment rate remains unchanged at 4.5% over the next 3 years. According to the Atlanta Fed’s jobs calculator, assuming no changes to growth in immigration, population, and labor force participation rates, this implies a monthly gain in payroll employment of about 120,000. With the current job market expanding faster than this pace, the Fed felt comfortable raising its benchmark Federal Funds Rate by 25 basis points in its March meeting to the range of 0.75% to 1%. The rate hike in March comes on the heels of December’s increase (also of 25 basis points) and is only the third rate increase since the global financial crisis and the ensuing quantitative easing program.

AREA AND MARKET ANALYSIS
BBG, INC. 9 0118000070
Until recently, global energy prices and a strong U.S. dollar kept domestic price levels suppressed—the first half of 2016 saw average PCE inflation of 0.9% and average core inflation (excluding energy and food prices) of 1.6%. Energy prices have made a partial recovery but remain well below their pre-2015 levels. Nevertheless, domestic prices for items such as shelter, transportation, and medical care have risen and helped push PCE inflation (the Fed’s preferred measure) above 2% in February for the first time in almost 5 years. In its March statement, the FOMC noted it expects inflation to stabilize around its 2% target over the medium terms. Businesses largely agree with the Atlanta Fed’s Business Inflation Expectations survey indicating firms expect 1.9% inflation one year from now. Consumers, however, are anticipating inflation to overshoot the 2% target—the New York Fed’s survey of consumer expectations put expected inflation 12 months ahead at 2.7%. Market-based measures of expected inflation are less sanguine. The 10-year breakeven inflation rate—the expected inflation rate measured by the gap between 10-year Treasury yields and their inflation-based counterparts—recently fell to 1.85% after fluctuating above 2% for most of the first quarter. With economic activity on the rise, a tightening labor market, and projections of stable inflation, the Fed is maintaining an accommodative policy stance in the months ahead. The FOMC vows to remain data dependent going forward but has noted it will likely raise rates by 25 basis points at least twice more this year with some committee members calling for a third increase should inflation overshoot for an extended period. In April, market estimates from the fed funds futures market show that investors expect between one and two additional rate changes this year with no hikes until July or September. New York City’s Office of Management and Budget (“OMB”) forecast assumes 2 more rate hikes this year followed by 3 in 2018. The enthusiasm that animated financial markets after the presidential election has faded in the beginning of 2017, despite evidence that corporate profits are on the mend. Between Election Day and the end of 2016, the S&P 500 and Dow Jones Industrial Average jumped 5% and 8.2%, respectively. Even more revealing was the pattern of price gains that reflected the new administration’s promises for tax cuts and regulatory rollbacks. Financial stocks soared with the S&P 500 bank sector index gaining 23% through the end of 2016. Shares of small cap firms in the Russell 2000 index also jumped nearly 14% over the same period. However, uncertainty on the scope and speed of the policy changes has increased. While the S&P has continued to gain 4% year to date through mid-April, the banking component of the S&P 500 dropped 3.2% over the same period with much of the losses occurring in march when the health care bill failed in Congress. Likewise, the Russell 2000 is down nearly a full percentage point year to date. Nevertheless, despite the uncertainty during President Trump’s first 3 months, equity markets have been composed. Expected volatility in the S&P 500, measured by the Chicago Board Options Exchange’s volatility index (“VIX”) dropped to 11.7% in the first quarter, the second lowest quarterly average since the start of the index in 1990. The only quieter period was the fourth quarter of 2006 during the height of the housing market boom when the VIX averaged 11. Likewise, the share of trading days with S&P index swings in excess of 1%--the trading days ratio—dropped to just 3.2% in the first quarter, well below the 25-year average of 26%.

AREA AND MARKET ANALYSIS
BBG, INC. 10 0118000070
Judging from flows of funds into mutual funds and ETF’s, investor sentiment was initially cautious prior to the election but switched to a riskier stance in November. According to the Investment Company Institute, from January through October 2016, $117 billion was withdrawn from equity funds. Much of this was recycled into safer bond funds with inflows of $208 billion over the same period. However, after the election, equity fund flows rebounded strongly, adding an estimated $127 billion in the 5 months through March while flows into fixed income slowed. The early data from April shows signs that this may have flipped yet again after the failed health care vote. Equity mutual funds and ETFs suffered outflows of $1.5 billion in the first 2 weeks of April while bond funds added $15 billion. Washington politics notwithstanding, the recent path of corporate profits is supportive of further price growth. After suffering from 5 consecutive quarters of year over year contraction, corporate profits turned the corner in the third quarter of 2016 with a 2.1% expansion. This strength persisted in the fourth quarter, accelerating to 9.3% growth. Furthermore, fourth quarter profit statistics were lowered by BEA by about $20 billion to account for the one-time Volkswagen buyback deal, effectively shaving off a full percentage point from the earnings figures. The S&P earnings data also reflects the rebound. Earnings per share jumped from 9.3% (year over year) in the third quarter to over 29% in the fourth. The first quarter earnings season has just begun, but earnings estimates published by S&P point to further strength in 2017. Bond markets have benefitted from the relatively low interest rates and gradually increasing trading volumes. Corporations continue to lock in cheap borrowing ahead of anticipated rate increases. Over the past 5 consecutive years, corporate debt has set new records for issuance, and the trend appears to be continuing into 2017 despite the 60 basis point jump in 10-year Treasury yields just after the election. In the first quarter, companies sold $469 billion of new debt, up 17.9% from a year ago and the highest quarterly level in the current expansion. Average trading volume has likewise grown, up 3.1% from first quarter 2016. Favorable conditions helped Wall Street finish 2016 on a strong note. NYSE member firms earned profits of $2.3 billion in the fourth quarter, bringing full year profits to $17.3 billion, the highest since 2012. This was a jump of 21.1% over 2015 profits, which were suppressed by a slowdown in the second half of the year. The robust results continue to depend on strict cost controls. Revenue growth in 2016 was 2.9% while expenses grew by only 1.2%, due primarily to a drop in compensation (down 1.6%) and other expenses (down 6.2%). This latter category includes legal expenses which have been declining steeply as litigation stemming from the housing crash tapers off. First quarter 2017 results for Wall Street will not be available until the conclusion of the earnings season now getting underway. However, early evidence from the Big Five banks is suggesting a strong start. First quarter net income is up nearly 11% from the fourth quarter of 2016 and jumped 57% compared to the (weak) first quarter a year ago. With the administration proposing looser financial market regulations, banks could see a potential acceleration of earnings. However, they could still face potential headwinds in 2017. Longer term Treasury yields have retracted some of last year’s increases with the 10-year Treasury dropping by 38 basis points from the 2017 high in March through mid-April. At the same time, the Fed has raised short-term rates twice and is signaling that more hikes are likely. As a result, the benefits from the steeper yield curve that banks enjoyed at the end of last year

AREA AND MARKET ANALYSIS
BBG, INC. 11 0118000070
have all but vanished. The yield spread between 10-year and 3-month Treasuries peaked at 2.09 percentage points in mid-December, but has since dropped to 1.43 in April, 2 basis points below the spread on Election Day. Another potential pothole is a worrisome drop in business lending. The total volume of loans and leases made by commercial banks has dropped from an annual pace of 7.3% growth just prior to the election to just 3.8% at the end of March. Potential factors behind the slowdown include the displacement of bank loans by corporate bond borrowing, a decline in energy company loans as energy prices remain soft, and a slowdown in commercial real estate lending. The New York City Economy In 2016, the New York City economy posted another strong year of growth. Total employment grew by over 2% for the sixth consecutive year, continuing the best period of job growth in the City’s history. There are, however, signs of slowing. Job growth decelerated significantly from the breakneck pace in 2014 and 2015 while wages, pulled down by weak bonuses, are expected to increase by just 1.1%. Total residential transactions declined for the first time since 2011, and primary market office asking rents increased modestly by 2.2%, down from 4.1% in 2015. Nevertheless, tourism posted another record year with 60.3 million visitors, and Wall Street finished 2016 with pre-tax profits of $17.3 billion—highest since 2012. Looking ahead, the City’s economy is projected to grow moderately in line with recent data and an economy with little slack. The City’s labor market added 342,300 total jobs over the last 3 years—the second strongest 3-year period in history. Additionally, the unemployment rate hit a multi-decade low of 4% in March 2017. While the City’s job growth exceeded the country’s for the tenth straight year, gains have decelerated more recently. After averaging annual growth of 2.3% through the first 3 quarters of 2016, year over year employment growth slowed to 1.2% and 1.5% in the fourth quarter of 2016 and the first quarter of 2017, respectively. This trend is expected to continue in the short run, and New York City OMB projects total job growth of 1.2% and 1% in 2017 and 2018, respectively. A decline in bonuses in the securities and professional & business services sectors pulled down wages in the first half of 2016. Through the first 3 quarters of 2016, total average wages increased by 0.7% and are expected to finish the year up 1.1%. Going forward, wage growth will improve due to several factors. First, bonuses are projected to return to positive territory after declining for 2 straight years. Second, the unemployment rate is at a record low, and labor force participation rates are near record highs. This suggests that there is little slack in the job market, which will put upward pressure on wages. Furthermore, the minimum wage increased to $11.00 per hour from $9.00 per hour in December of last year, a 22.2% increase that will benefit a significant portion of the City’s workforce. These three factors are expected to result in 2.8% wage growth in 2017 and 3.7% in 2018. Thus, wages will offset the deceleration of employment growth resulting in wage earnings growth of 4.1% and 4.7% in 2017 and 2018, respectively.

AREA AND MARKET ANALYSIS
BBG, INC. 12 0118000070
From 2014 to 2016, all major industries except manufacturing added jobs. However, gains were concentrated in three sectors: professional & business services, education & health services, and leisure & hospitality. In 2016, these industries accounted for nearly 80% of the private sector job gains and nearly 70% over the last 3 years. In the short run, these industries will continue to drive the City’s job growth. Health care employment has been propelled by an aging population and a rising insured population. In 2016, the sector added 28,000 jobs and over 70,000 from 2014 to 2016. The Affordable Care Act (“ACA”) has benefitted New Yorkers by reducing the number of uninsured in the City. Based on data from the American Community Survey (“ACS”), the share of New York City residents in 2009 with any type of insurance was 86%. By 2015, that number increased to 91%. But uncertainty over the future of the ACA poses a downside risk for future employment growth in the industry. New York City OMB projects employment growth to decelerate to 7,000 in both 2017 and 2018. One industry that came to a standstill in 2016 was retail trade. From 2010 through 2014, the industry added an average of 11,600 jobs per year before slowing to just 1,800 in 2015 and shrinking by 3,000 in 2016. Lat year’s decline is consistent with the performance of the retail sector in the nation as online competition has started to pressure brick and mortar stores. Additionally, high operating costs have contributed to weakness in the sector. In the short run, rising consumption should help retail employment growth return to positive territory, but it is not expected to return to the levels seen during 2010 to 2014. Unlike retail trade, the securities industry was a positive surprise in 2016—adding 3,800 new jobs for its third consecutive year of growth. Employment grew in the industry despite a 1.6% decline in compensation at NYSE member firms. Looking forward, there are many uncertainties facing the industry including the future of Dodd-Frank, corporate tax reform, and Brexit. These could benefit or hinder future employment growth. Deregulation could result in higher but more volatile profits leading to more cyclical employment changes. Lower corporate tax rates would reduce costs faced by financial firms and could lead to new hires. Prospects for tax reform, however, are uncertain. Brexit could benefit the financial sector if firms decide to move certain operations from London to their New York City offices. Cognizant of these uncertainties, New York City OMB expects the industry to grow moderately, remaining below its 2007 peak until 2021. Although employment growth in the securities industry is picking up, professional & business services remains the engine of office using employment growth. Over the last 6 years, job gains have averaged nearly 25,000 per year. In 206, the sector added 23,000 positions. With domestic and global growth expected to accelerate in the near term, the sector is projected to continue driving office using employment growth with 19,000 jobs this year and 14,000 in 2018. In the first quarter, office using employment (comprising financial activities, professional & business services, and information) was up 1.8% from a year earlier. This was a gain of 9,800 office using jobs, about 15% higher than the same period in 2016. Accordingly, commercial real estate leasing activity has seen a strong start to the year. Data from Cushman & Wakefield shows that new leasing activity is up 5.9 million square feet in the first 2 months of the year, a

AREA AND MARKET ANALYSIS
BBG, INC. 13 0118000070
35% increase on a year over year basis. The primary market Manhattan vacancy rate fell 0.3 percentage points in January and 0.1 percentage points in February while the occupancy rate rose 0.6% and 0.4%, respectively. Likewise, asking rents were up by an average of 0.9% over the 2 months. Office using employment gains are expected to decelerate over the next few years. In addition, a substantial inventory expansion will affect the market—between 2016 and 2020, approximately 13 million square feet of new office space in Manhattan alone will become available (mostly in the World Trade Center and Hudson Yards), putting upward pressure on vacancy rates and suppressing asking rents. Total inventory is expected to rise by 1.5 million square feet, 4 million square feet, and 6 million square feet in the period 2017 to 2019. As a result, asking rents are estimated to rise mildly in 2017 (2%) and fall in 2018 and 2019 (by 0.4% and 0.5%, respectively). Similar to commercial and labor markets, activity in the residential market slowed in 2016. Transactions declined for the first time since 2011, falling by 1.2% to 51,941. Co-op sales were a significant drag, declining by 7.6% while condos fell by 1.5% and Class 1 sales increased by 3.3%. Despite the decline in sales, average prices increased by 6.2%. Growth, however, was skewed by a 13.6% increase in average condo prices. Furthermore, many of the ultra-luxury condo sales that closed last year were legacy contracts negotiated in prior years. Class 1 average prices also increased, rising by 3.4%, down from 6.4% in 2015. Average co-op sale prices, however, declined by 2.9%--the second consecutive annual decline. The residential market has been hampered by inventory constraints. Furthermore, new developments have been biased toward the luxury market due to high land and construction costs while demand is stronger for more affordable, middle market properties. This mismatch is one factor behind strong sales in the suburbs surrounding New York City. Supply constraints are expected to mitigate over the next 2 years as some of the 56,000 permits issued in 2015 start to hit the market. The growth in supply and higher wages will boost demand for real estate. Thus, sales are projected to grow by 0.7% in 2017 and 1.5% in 2018 while average prices are projected to increase by 0.4% in both 2017 and 2018. Since the recession, tourism has been a pillar of the New York City economy. However, the new political environment is creating unforeseen risks and challenges ahead for New York City’s tourism sector. The new administration’s travel ban, along with anti-immigrant and anti-trade rhetoric, has resulted in negative perceptions of travel to the U.S. among foreign visitors, particularly Europeans. The first few weeks of the new administration were accompanied by a drop in flight searches to the U.S. from abroad in all but a few countries. Even after accounting for seasonal factors, the drop in interest for U.S. travel has been significant. As a result of these pressures, NYC & Co., the City’s tourism marketing agency, recently lowered its forecast for international visitors to New York City in 2017 by 2.1% to 12.4 million. This would be the first decline in international visitors to the City since 2009 (during the global

AREA AND MARKET ANALYSIS
BBG, INC. 14 0118000070
financial crisis). The outlook remains robust for domestic travel, however, with an estimated 49.3 million U.S. visitors expected to visit the City in 2017. While the estimate for total travelers (61.7 million) would represent yet another record year, there are economic repercussions to a drop in international visitors. As foreign tourists tend to stay longer and spend more on each visit than domestic visitors, NYC & Co. estimates that the drop in foreign visitors would result in a total (direct, indirect, and induced) decline in economic activity of $900 million in the City. So far, however, the most recent data seems to indicate that 2017 is off to a strong start. The leisure & hospitality employment category added an average of 3,100 jobs in the first 3 months of the year on a seasonally adjusted basis, a notable improvement on the 1,100 jobs created in the same period of 2016. In addition, hotel figures for January and February have been favorable, with the average number of room nights sold at 3.1 million (seasonally adjusted), 5.2% higher than the month average for 2016 of 2.9 million. Despite this increase in demand, a higher supply of hotel rooms coming on the market has continued putting downward pressure on room rates. The average room rate in January and February was $267.00 on a seasonally adjusted basis, 5% below the $282.00 average in 2016. Going forward, the average number of occupied rooms per night is expected to drop slightly in 2017, partially recover in 2018, and remain stable in 2019. In addition, new hotel inventory will keep average nightly room rates below $300.00. Domestically, policy uncertainty remains a key risk to the forecast. The forecast assumes the new administration will follow through on promises to lower both the corporate and personal tax rates. A Blue Chip poll places even odds on corporate or personal tax reform by the end of 2017. If tax reform does not meet expectations, there could be significant backlash in financial markets and a lower path of domestic growth. Congressional deadlock continues to be a concern under the new administration despite the GOP’s majority in the House and Senate. Republicans failed to unite over health care reform and have still not agreed to raise the debt ceiling. Additionally, the administration’s stance on trade has become increasingly opaque, recently softening its rhetoric on China. If the administration enacts protectionist policies, such as the proposed Border Adjustment Tax, relationships with major trading partners may become strained, and domestic firms dependent on imports will be adversely affected. Overseas, elections in France and Germany could threaten the future stability of the European Union.

AREA AND MARKET ANALYSIS
BBG, INC. 15 0118000070
BROOKLYN REGIONAL ANALYSIS The New York Metropolitan Statistical Area (MSA) consists of the City of New York's five counties and the counties of Westchester and Rockland. The subject property is located in the City of New York, Kings County (Brooklyn). New York City's five boroughs cover 309 square miles. New York City is the nation's center for finance, the arts, media, fashion, telecommunications, and corporate headquarters. The City's other boroughs are Manhattan (New York County), which forms the central political, financial, and cultural core of the City and is the economic growth engine for the Greater New York region; the Bronx (Bronx County); Queens (Queens County); and Staten Island (Richmond County). Brooklyn and Queens have the largest economies behind Manhattan. Geographically, Brooklyn is situated at the western tip of Long Island and is bounded to the north and east by Jamaica Bay and Queens County, to the west by Upper and Lower New York Bays and the East River, and to the south by the Atlantic Ocean. POPULATION NYC TOTAL POPULATION, 1980-2022
1980 1990 2000 2010 2017 Est 2022
Overall 7,071,639 7,322,564 8,008,278 8,175,133 8,645,259 8,944,519
% Change 3.55% 9.36% 2.08% 5.75% 3.46%
Bronx 1,168,972 1,203,789 1,332,648 1,385,108 1,475,915 1,534,568
% Change 2.98% 10.70% 3.94% 6.56% 3.97%
Brooklyn 2,230,936 2,300,664 2,465,323 2,504,700 2,668,187 2,767,532
% Change 3.13% 7.16% 1.60% 6.53% 3.72%
Manhattan 1,428,285 1,487,536 1,537,201 1,585,873 1,656,943 1,703,058
% Change 4.15% 3.34% 3.17% 4.48% 2.78%
Queens 1,891,325 1,951,598 2,229,379 2,230,722 2,367,950 2,455,385
% Change 3.19% 14.23% 0.06% 6.15% 3.69%
Staten Island 352,121 378,977 443,728 468,730 476,264 483,976
% Change 7.63% 17.09% 5.63% 1.61% 1.62%
Source: 1980-2010, US Census; 2017 The Nielsen Company
New York City is home to more than 8 million people in over 3 million households. Brooklyn is the most populous borough with 31% of the City's population. Manhattan's 1.65 million residents, at approximately 57,000 residents per square mile, make it one of the most densely populated residential areas in the nation. While the 1970's and 1980's saw the continuing trend of migration of city residents to neighboring suburbs, due primarily to high housing costs and density of living, the total population is bolstered by the large number of immigrants arriving in the city each year. The 5.75% increase in the City’s census population from 2010 to 2017 can be attributed to the decrease in unemployment rate as well as increasing appeal of the City over the time period. In addition, more accurate Census counts may have benefited New York during this Census period. The City’s population is expected to grow over the next 5 years at a slightly slower pace than that exhibited in the previous 5 years. New York City was one of the nation’s few major cities to experience an increase in its population during the past decade. The City’s population now totals

AREA AND MARKET ANALYSIS
BBG, INC. 16 0118000070
43% of the state’s total population. Except for Staten Island, each of New York City’s five boroughs has a population greater than 1,000,000. BROOKLYN POPULATION TRENDS 2010-2022
Description 2010 Census 2017% Change 2010-
20172022 Projection
% Change 2017-
2022
Population 2,504,700 2,668,187 6.53% 2,767,532 3.72%
Households 916,856 987,963 7.76% 1,030,126 4.27%
Families 573,363 615,135 7.29% 640,322 4.09%
Source: The Nielsen Company Claritas estimates the 2017 population for Brooklyn at 2,668,187 and projects 3.72% increase by 2022. The number of households in Brooklyn is also projected to increase 4.27% between 2017 and 2022 from 987,963 to 1,030,126. These statistics are reflective of a stable, mature market. NEW YORK CITY ECONOMY AND EMPLOYMENT The economy of New York City is the biggest regional economy in the United States and is home to the New York Stock Exchange and NASDAQ, the world's largest stock exchanges by market capitalization and trading activity. New York is distinctive for its high concentrations of advanced service sector firms in fields such as law, accountancy, banking, and management consultancy. Likewise, creative industries such as new media, advertising, fashion, design, and architecture account for a growing share of employment, with New York City possessing a strong competitive advantage in these industries. New York City’s employment base has historically enjoyed the distinction as an international center of business, commerce, tourism, and culture. The FIRE (finance, insurance, and real estate) and services (including the professions of legal, engineering services, consulting, tourism, recreation, health care, computers and data processing) segments are considered the primary sources of “white collar,” or office prone, employment in the region. NEW YORK CITY’S LARGEST EMPLOYERS Employer # of Employees
Verizon Communications, Inc. (VZ) 177,300
J.P.Morgan Chase & Co. (JPM) 241,359
International Business Machines Corp. (IBM) 379,592
Citigroup Inc. (C) 241,000
Philip Morris International (PM) 82,500
MetLife Inc. (MET) 68,000
PepsiCo Inc. (PEP) 271,000
American International Group Inc. (AIG) 65,000
Prudential Financial Inc. (PRU) 48,331
Pfizer Inc. (PFE) 78,300
Source: Crain’s Book of Lists 2016
New York City’s largest employers are a diverse group of multinational corporations spanning a variety of industries including financial services/banking, telecommunications, health care, insurance, and pharmaceuticals.

AREA AND MARKET ANALYSIS
BBG, INC. 17 0118000070
Businesses in New York City can capitalize on the synergy created from the presence of more than 200,000 companies, the access to investment capital and consumers, and the City’s attractive quality of life. Companies in New York City include headquarters and regional offices of leading world companies including 52 Fortune 500 firms—the second highest of any city in the United States followed by California which has 54 Fortune 500 firms—making New York one of the nation’s headquarters capital. NYC EMPLOYMENT BY INDUSTRY (000'S)
2006 2007 2008 2009 2010 2011 2012 2013 2014 2015 20162017
(Oct)
Construction 115.7 118.5 119.7 124.4 118.1 107.4 104.4 120.8 133.6 138.3 146.3 158.9
M anufacturing 107.1 101.0 89.1 81.8 79.9 73.3 74.2 76.0 76.5 78.0 76.3 74.4
Trade, Transportation, and Utilities 550.7 576.6 562.5 578.8 556.8 584.5 584.1 593.7 622.4 629.0 629.4 626.0
Information 163.1 165.9 160.1 168.8 159.3 160.6 174.8 178.6 185.1 189.1 192.6 192.0
Financial Activities 453.5 467.9 430.4 456.7 434.2 434.9 444.6 434.0 450.4 459.7 465.8 477.1
Professional and Business Services 564.5 591.4 578.7 600.9 583.5 606.1 639.3 639.4 672.4 699.8 723.4 751.8
Education and Health Services 701.0 707.0 756.4 738.5 764.1 781.9 763.9 819.9 845.3 869.4 930.2 974.5
Leisure and Hospitality 281.7 297.0 310.8 307.0 320.5 339.3 365.9 379.6 413.6 425.7 437.6 451.3
Other Services 153.3 158.1 162.3 164.0 167.0 157.5 171.1 174.1 179.8 184.8 187.3 192.4
Government 554.7 559.2 557.1 564.6 538.2 544.4 585.0 545.5 540.5 549.9 552.4 556.4
Total 3,645.3 3,742.6 3,727.1 3,785.5 3,721.6 3,789.9 3,907.3 3,961.6 4,119.6 4,223.7 4,341.3 4,454.8
Source: New York State Department of Labor
From 2006 to October 2017, decreases in private employment in the city were seen in only a few of the sectors. There were increases in most sectors, the largest of which were Education and Health Services, Professional and Business Services, and Leisure and Hospitality. Manufacturing has been hit the hardest by the financial crisis and recession. Office-using employment amounts to approximately 30% of total New York City employment, reflective of the financial and services orientation of the local economy. New York City’s prime office inventory is concentrated in Manhattan, south of Central Park, within the two major submarkets of Downtown and Midtown. Brooklyn’s central business district in Downtown Brooklyn is anchored by Brooklyn Borough Hall and MetroTech Center, a 16-acre urban corporate campus. Long Island City in Queens is located across the East River from Midtown Manhattan and has long been a center of manufacturing, distribution, and industrial services. BROOKLYN ECONOMY AND EMPLOYMENT
Brooklyn's job market is driven by three main factors: the performance of the national/city economy, population flows, and the borough's position as a convenient back office for New York's businesses. Since 2003, the number of businesses in Brooklyn has grown at a much faster rate of growth than in the rest of the City. Job growth has also been strong, nearly twice as fast as in the rest of New York City. Jobs in the borough have traditionally been concentrated in manufacturing, but since 1975, Brooklyn has shifted from a manufacturing-based economy to a service-based economy. Over the past decade, Brooklyn has expanded at a rapid pace by attracting new businesses and residents. Downtown Brooklyn is New York City’s largest business district outside of Manhattan, and there are a few other important economic centers in the borough, including the Brooklyn Navy Yard, Sunset Park, Williamsburg and Greenpoint.

AREA AND MARKET ANALYSIS
BBG, INC. 18 0118000070
The Greater Downtown Brooklyn area is the borough’s largest business district, accounting for 17 percent of the jobs in the borough. With its proximity to Manhattan, lower-cost Class A office space and excellent transportation options, Downtown Brooklyn has attracted sizable job concentrations in business and professional services, finance and education. Brooklyn is becoming popular with high-tech and creative firms, as well as online retailers such as Etsy. Many of these firms are locating in Downtown Brooklyn, Dumbo and the Brooklyn Navy Yard, an area known as the Brooklyn Tech Triangle. The Brooklyn Navy Yard, one component of the Brooklyn Tech Triangle, is a 300-acre industrial park with 4 million square feet of leasable space. The Navy Yard has more than 330 businesses (including manufacturers, artists, distributors, a distillery, food processors, filmmakers and a medical lab) that employ nearly 7,000 people. The Navy Yard has been undergoing an expansion, with new or renovated buildings to include a sustainable design center, a green manufacturing center, new film and television studio facilities, and a new 240,000-square-foot medical lab. Nearly 8 percent of the jobs in Brooklyn are in Sunset Park. Sunset Park is a major manufacturing center, with activity clustered in three facilities. Industry City, is a shipping and manufacturing terminal dating from the 1890s. It is New York’s largest privately held manufacturing property, with 6 million square feet in 16 buildings on 30 acres. The property is seeking to attract a growing group of manufacturers in food, clothing and technology. MakerBot, a manufacturer of 3-D printers, opened a 50,000-square-foot factory at the site in 2013. Nearby is the Brooklyn Army Terminal, a 97-acre City-owned former military depot which has been converted to commercial and manufacturing uses. The City plans to invest $100 million in the Terminal to create new commercial space. The third facility is the South Brooklyn Marine Terminal, an 88-acre site along the Bay Ridge Channel. In 2012, the New York City Economic Development Corporation completed $115 million in renovations to help reactivate maritime freight services. The site also has the City’s first large recycling facility, completed in 2013, which is a state-of-the-art design with a rooftop solar array. Currently health care and retail account for almost half of the jobs in Brooklyn. In recent years, Brooklyn has benefited from a steady influx of financial back office operations from Manhattan, the rapid growth of a hi-tech/entertainment economy in DUMBO, and strong growth in support services such as accounting, personal supply agencies and computer services firms. The following table summarizes the labor force statistics of Brooklyn compared to the other boroughs of New York City.

AREA AND MARKET ANALYSIS
BBG, INC. 19 0118000070
OCTOBER 2017 LABOR FORCE DATA Labor Force Employed Unemployed Unemployment
(000’s) (000’s) (000’s) Rate
Bronx County (Bronx) 624.1 583.7 41.3 6.6%
Kings County (Brooklyn) 1,251.8 1,192.9 63.0 5.0%
New York County (Manhattan) 939.6 903.2 41.4 4.4%
Queens County (Queens) 1,193.9 1,147.3 51.4 4.3%
Richmond County (Staten Island) 227.7 216.1 11.2 5.9%
New York City 4,237.1 4,043.2 208.3 4.9%
Source: NYS Department of Labor
UNEMPLOYMENT RATES
As of October 2017, Brooklyn's unemployment rate was 5.0% which is relatively the same as the New York City (4.9%), and slightly above the New York State (4.6%) and the country overall (3.9%). These statistics indicate a continued decrease and as of last year, stabilization in unemployment rate in Brooklyn as the city has rebounded from the recession. While historically, employment in Brooklyn has lagged that of New York City the gap is beginning to close with unemployment lower than pre-recession levels. The following table illustrates historical and current unemployment rates: UNEMPLOYMENT RATES
Year Brooklyn Bronx Queens Manhattan NYC NYS USA
2002 8.6% 9.7% 7.1% 7.6% 8.0% 6.1% 5.8%
2003 9.1% 10.6% 7.4% 7.5% 8.3% 6.4% 6.0%
2004 7.6% 9.2% 6.3% 6.2% 7.1% 5.8% 5.5%
2005 6.2% 7.6% 5.2% 5.1% 5.8% 5.0% 5.1%
2006 5.4% 6.7% 4.5% 4.3% 5.0% 4.5% 4.6%
2007 5.4% 6.8% 4.5% 4.3% 5.0% 4.6% 4.6%
2008 6.0% 7.6% 5.0% 4.9% 5.6% 5.4% 5.8%
2009 9.9% 12.0% 8.4% 8.4% 9.3% 8.3% 9.3%
2010 9.9% 12.0% 8.6% 8.6% 9.5% 8.6% 9.6%
2011 9.6% 11.9% 8.1% 7.8% 9.1% 8.3% 8.9%
2012 9.8% 12.4% 8.3% 8.0% 9.3% 8.5% 8.1%
2013 9.3% 11.7% 7.7% 7.5% 8.8% 7.7% 7.4%
2014 7.6% 9.7% 6.3% 6.1% 7.2% 6.3% 6.2%
2015 5.9% 7.7% 5.0% 4.8% 5.7% 5.3% 5.5%
2016 4.5% 6.2% 3.9% 3.9% 5.2% 4.5% 4.5%
2017 (Oct.) 5.0% 6.6% 4.3% 4.4% 4.9% 4.6% 3.9%
Source: NYS Department of Labor, Bureau of Labor Statistics

AREA AND MARKET ANALYSIS
BBG, INC. 20 0118000070
UNEMPLOYMENT TRENDS
0.0%
2.0%
4.0%
6.0%
8.0%
10.0%
12.0%
14.0%
Brooklyn
Bronx
Queens
Manhattan
NYC
NYS
USA
Average household income in New York City increased by 53.5% between 2000 and 2017 from $57,645 to $88,462 . NYC AND STATE HOUSEHOLD INCOME
2000 Census 2017 Estimate 2000 Census 2017 Estimate
Average Household Income $57,645 $88,462 $61,489 $91,198
Median Household Income $38,846 $55,536 $44,138 $62,222
New York City New York State
Source: The Nielsen Company
The following table illustrates per capita income figures for New York City and the various boroughs. NEW YORK CITY HOUSEHOLD INCOME
% Change
2000-2017
Bronx $38,885 $51,078 31.36%
Brooklyn $46,279 $77,180 66.77%
Manhattan $83,976 $134,059 59.64%
Queens $54,663 $79,982 46.32%
Staten Island $67,698 $94,071 38.96%
New York City $57,645 $81,401 41.21%
Average Household
Income 2000
Average Household
Income 2017 (Est)
Source: The Nielsen Company, U.S. Census While Brooklyn exhibits the second lowest average household income among the New York City boroughs, it has experienced the highest income growth since 2000.

AREA AND MARKET ANALYSIS
BBG, INC. 21 0118000070
CULTURE AND RECREATION New York City offers an unsurpassed variety of cultural activities, containing hundreds of museums, art galleries, theaters, restaurants, and retail stores. The City is home to such musical institutions as the New York City Symphony, Carnegie Hall, Lincoln Center, Brooklyn Academy of Music, and Metropolitan Opera and, with its many Broadway and off-Broadway plays and musicals, is the performing arts capital of the world. Several world-famous dance troupes are located in New York including the Alvin Ailey Company and Dance Theater of Harlem. World class museums include the Metropolitan Museum of Art, Museum of Modern Art, The Guggenheim, and Museum of Natural History. Other attractions include the Statue of Liberty, New York Aquarium, Bronx Zoo, Brooklyn Botanical Gardens, Empire State Building, United Nations, New York Stock Exchange, and many others, which draw millions of visitors each year. Brooklyn is home to the Brooklyn Museum and Brooklyn Botanical Gardens on Eastern Parkway in Prospect Heights as well as the Brooklyn Children's Museum at Brooklyn Avenue and St. Marks Place in Crown Heights. The New York Aquarium is located in Coney Island. Brooklyn also has a vibrant arts and culture scene, with more than 350 arts organizations, including musical, theatre and dance companies as well as museums and historical sites. These range from large, internationally known organizations through small avant-garde groups. A 2010 survey by the Downtown Brooklyn Arts Alliance found that 21 arts organizations served 2.7 million people had a payroll of $36.2 million and yielded $10.6 million in tax revenues. The Brooklyn Museum, founded in 1895, is the City’s second-largest in physical size (after the Metropolitan Museum of Art). It features a renowned Egyptian collection, and traditional American, Asian, and Islamic art as well as modern and contemporary artworks. Brooklyn has more than 230 performing arts spaces. The Brooklyn Academy of Music (BAM) is the country’s oldest performing arts center (it was 156 years old in 2017), and includes a 2,109- seat opera house and an 874-seat theater. Nearby, the Theater for a New Audience opened its new 27,000-square-foot home at the Polansky Shakespeare Center in 2013. This is the first new venue for classical theater in the City since the completion of Lincoln Center in 1965. New York City has significant parkland including Central Park, an 843-acre oasis in Manhattan; Prospect Park in Brooklyn; and Jamaica Bay National Wildlife Refuge in Queens. New York City has teams in every major professional sport. The real estate developer Bruce Ratner purchased the New Jersey Nets basketball team and relocated the team to Brooklyn. The Barclays Center opened in 2012 and is located above Atlantic Yards at the intersection of Flatbush and Atlantic Avenues in Downtown Brooklyn.

AREA AND MARKET ANALYSIS
BBG, INC. 22 0118000070
EDUCATIONAL AND PROFESSIONAL FACILITIES
New York City has 173 schools of higher education including 21 two-year colleges, 45 four-year colleges, professional schools, law schools, and vocational schools. Manhattan is home to some of the most prominent educational institutions in the nation including Columbia University, New York University, The Juilliard School, and Manhattan School of Music. The CUNY (City University of New York) system offers an affordable education in its 6 community colleges and 11 campuses with 4-year and graduate programs across all 5 boroughs. Notable colleges and universities located outside Manhattan include Pratt Institute in Brooklyn—a well-recognized school of art and architecture; St. John’s University and Queens College in Queens; and Fordham University in the Bronx. New York City also has two of the most highly regarded public high schools in the nation—Stuyvesant and Bronx Science. As in most urban areas, the City’s public primary and secondary education system is considered only fair overall with a wide range in quality of education from district to district. Brooklyn is also home to world-class cultural and academic institutions, which are integral parts of the local economy and the quality of life. Brooklyn's primary institutions of higher learning include Brooklyn College, Pratt Institute, and Brooklyn Law School. Brooklyn is also home to Kingsborough Community College. Brooklyn's premier public school is Brooklyn Technical, considered along with Stuyvesant and Bronx Science to be in the top three public high schools. Brooklyn is also home to many notable private schools include Packer Collegiate Institute and St. Ann's in Brooklyn Heights, The Friends School in Boerum Hill, Berkeley Carroll in Park Slope, and Poly Prep Country Day School in Dyker Heights. New York City has 75 short-term general hospitals, many of which are affiliated with local professional universities. World famous research hospitals include NYU-Cornell, Rockefeller, Columbia, and New York Hospital. Other highly ranked hospitals include Memorial Sloan-Kettering Cancer Center, Mount Sinai Hospital, New York Eye and Ear Infirmary, and New York Presbyterian Hospital. Brooklyn is home to Long Island College Hospital, New York Methodist Hospital, Maimonides Hospital, Brooklyn Hospital, and Downstate Medical Center, among others. TRANSPORTATION
New York City is served by the most diverse transportation system in the United States. The region’s transportation network links the area to the regional, national, and global commerce and trade. A brief synopsis of the area’s transportation system follows: RAIL SYSTEM
NYC Subway System: 710-mile subway line servicing 4.5 million passengers on an
average weekday and approximately 1.4 billion passengers a year. NYC Transit operates approximately 6,400 cars 24 hours a day throughout Manhattan, Queens, Brooklyn, and the Bronx. The 25 subway routes are interconnected, and many lines feature express trains, across-the-platform transfers to local trains, and "skip-stop" express service.

AREA AND MARKET ANALYSIS
BBG, INC. 23 0118000070
Metro North: Based in the landmark Grand Central Terminal in Midtown Manhattan, the MTA Metro North Railroad is the second largest commuter line in the United States, providing approximately 250,000 customer trips each weekday and some 73,000,000 trips per year. With 384 route miles and 775 miles of track, Metro North goes to 120 stations distributed in seven counties in New York State--Dutchess, Putnam, Westchester, Bronx, New York (Manhattan), Rockland, and Orange--and two counties in the state of Connecticut--New Haven and Fairfield.
Long Island Railroad: This commuter line runs from the eastern tip of Long Island to Pennsylvania Station in Manhattan and Atlantic Terminal in Brooklyn. The MTA Long Island Rail Road is the busiest commuter railroad in North America, carrying an average of 274,000 customers each weekday on 730 daily trains. In 1998, the LIRR completed a 10-year, $2.1 billion investment in improvements including the transformation of Penn Station into a modern, safe and attractive facility with a new 34th Street entrance.
(PATH) Port Authority Trans-Hudson Subway System: The PATH carries 70% of all passengers entering New York City from New Jersey. Approximately 220,000 commuters use the PATH each weekday.
BUS SYSTEM
New York City Transit: Regularly scheduled bus service in New York City’s five boroughs handles 2.5 million riders daily and 762 million annually. 181 local and 38 express bus routes operate in the five boroughs, covering 2,109 miles.
Port Authority Bus Terminal: Regional bus lines serve approximately 55 million passengers a year, with most service to and from New Jersey.
AIRPORTS
Newark Airport: The Port Authority of New York and New Jersey has operated Newark
Liberty International Airport (EWR) under a lease with the City of Newark since March 22, 1948. EWR is located in Essex and Union Counties between the New Jersey Turnpike (accessible from Exits 13A and 14), U.S. Routes 1 & 9, and I-78. The airport is about 16 miles from Midtown Manhattan and consists of about 2,027 acres.
LaGuardia Airport (LGA) has been operated by The Port Authority of New York and New Jersey under a lease with the City of New York since June 1, 1947. LGA consists of 680 acres and 72 aircraft gates. By the end of 2000, the combined Port Authority and airline investment for LaGuardia's Redevelopment Program was $830 million. The redevelopment program includes expanding and modernizing the Central Terminal Building, reconfiguring and widening roadways, improving runways and taxiways, a passenger terminal in the east end, airline modernization of gate areas and passenger service areas, and other rehabilitation projects.

AREA AND MARKET ANALYSIS
BBG, INC. 24 0118000070
John F. Kennedy Airport (JFK) has been operated by The Port Authority of New York and New Jersey under a lease with the City of New York since June 1, 1947. JFK is located in the southeastern section of Queens County on Jamaica Bay. It is 15 miles by highway from Midtown Manhattan and consists of 4,930 acres, including 880 acres in the Central Terminal Area (CTA). The airport has more than 30 miles of roadway.
SUMMARY
In the last two decades, Brooklyn has emerged as a destination for art, commerce, and industry. As it has moved away from its blue-collar roots, the borough has developed a thriving services sector, a diverse manufacturing base, and an increasing number of public and private cultural institutions that continue to lend cachet to Brooklyn. Major public-private initiatives, such as the Atlantic Yards complex, the redevelopment of the East River waterfront, and the continued expansion of the Brooklyn Navy Yard Industrial Park, all suggest that the City’s efforts are oriented around broadening the borough’s economic base, and improving the quality of life for residents, including an increasing number of high-income earners. Recently completed and planned economic development projects will further strengthen the borough’s economy. Brooklyn’s public and private sectors, working alongside its academic and cultural institutions, are helping to create a favorable environment for economic growth.

AREA AND MARKET ANALYSIS
BBG, INC. 25 0118000070
HOSPITAL MARKET OVERVIEW The most current IBIS World Industry report – 62211 Hospitals in the US, dated March 2017, was utilized for the analysis below.
As a primary provider of healthcare in the United States, revenue for the Hospitals industry is expected to grow an annualized 3.0% to $1.0 trillion over the five years to 2017, with an expected increase of 2.3% in 2017 alone. This traditionally fragmented industry has recently begun consolidating, largely due to the pressures of healthcare reform. Demand for industry services has steadily grown over the past five years, as healthcare reform legislation broadened insurance coverage and the sinking unemployment rate increased disposable income.
To maintain an advantaged position in this competitive industry, hospitals seek the most skilled and specialized healthcare professionals, thereby effectuating high labor costs. However, hospitals have also come up against nurse and physician shortages and have struggled to recruit qualified personnel. As a result, wages’ share of industry revenue has fallen over the five years to 2017. Wages are expected to rise over the next five years as hospitals increase salaries and provide other employment incentives.
Industry profitability has generally risen over the past five years due to increases in service prices. As the Patient Protection and Affordable Care Act (PPACA) continues to increase the number of insured Americans, demand for industry services will likely continue to increase and the number of uninsured patients that hospitals treat will drop. As a result, IBISWorld expects industry revenue to grow at an annualized rate of 3.3% to $1.2 trillion over the five years to 2022. Average industry profit, however, is projected to remain relatively steady during the same period because of increased purchase and labor costs, rising from 7.9% of revenue in 2017 to only 8.0% in 2022. Due to the high risks associated with electronic medical records, hospitals will need to invest in IT security and cyber consultants to protect themselves from hackers, resulting in a steady increase in purchase costs over the next five years. In addition, a shortage of highly skilled nurses and staff will likely result in hospitals increasing wages to attract the best employees. Reimbursement from Medicaid and Medicare will be strained while the federal government seeks to finance healthcare reform and individual states deal with budget deficits.

AREA AND MARKET ANALYSIS
BBG, INC. 26 0118000070
CURRENT PERFORMANCE
The Hospitals industry is expected to grow at an annualized rate of 3.0% over the five years to 2017. Demand has been high in recent years and hospitals have been challenged to provide quality care while dealing with rising costs and increased competition for patients. Moderate improvements in the economy and further implementation of the Patient Protection and

AREA AND MARKET ANALYSIS
BBG, INC. 27 0118000070
Affordable Care Act (PPACA) are expected to help boost revenue 2.3% over 2017 to $1.0 trillion. However, changes in reimbursement rates and a shortage of qualified personnel continue to challenge hospitals. KEY EXTERNAL DRIVERS NUMBER OF PEOPLE WITH PRIVATE HEALTH INSURANCE
People covered by private health insurance typically use healthcare services more frequently, and their insurers often pay more for a hospital procedure than public insurers. As more of the US population is covered by private health insurance, demand and spending on health services will rise. The number of people with private health insurance is expected to increase in 2017.
FEDERAL FUNDING FOR MEDICARE AND MEDICAID
Federal and state healthcare funding, as well as the government-determined terms of access to Medicare and Medicaid, affect industry demand and prices. Increased government healthcare funding will increase reimbursement for industry services, thereby raising industry revenue. Federal funding for Medicare and Medicaid is expected to increase during 2017; however, planned cuts to Medicare Disproportionate Share Hospital (DSH) payments, which provide compensation to providers that treat a disproportionate number of uninsured patients, may pose a threat to some industry hospitals.
NUMBER OF ADULTS AGED 65 AND OLDER
An increase in the number of elderly Americans positively affects hospitals because people over the age of 65 generally need more medical care. The per capita healthcare spending in this age group is three- to five-times higher than that of people under the age of 65, according to major companies’ annual reports. The number of adults aged 65 and older is expected to increase in 2017.

AREA AND MARKET ANALYSIS
BBG, INC. 28 0118000070
PER CAPITA DISPOSABLE INCOME
People with higher incomes typically spend more on healthcare (including hospital services) and are more likely to have private health insurance to provide coverage for hospital services, boosting industry demand. Furthermore, people with higher disposable incomes are more likely to pay their hospital bills. Disposable income is expected to increase during 2017, presenting a potential opportunity for the industry. HEALTHY REVENUE AND PROFIT
Advances in healthcare have helped people live longer lives. According to the Centers for Disease Control and Prevention, the average US citizen is currently expected to live more than 78 years. However, a longer life is generally accompanied by increased healthcare expenditure. As the median age of the US population has increased, so has total domestic spending on healthcare. Hospital care is the largest single category of healthcare expenditure in the United States, so the aging population has generally contributed to industry revenue growth.
Over the five years to 2017, people began to visit hospitals more frequently as a result of recovering disposable income and an increase in the number of people with health insurance. However, the regulatory costs of healthcare services have increased due to the PPACA. As a result, the input costs for industry operators have risen over the past five years, causing profit margins to fall from 9.4% in 2012 to 7.9% in 2017. PHYSICIAN AND NURSE SHORTAGE
Hospitals must hire qualified physicians and nurses to increase or maintain the breadth of specialized services they offer, which has become an industry-wide challenge because of the national shortage in both professions. Hospitals have increased salaries to attract new hires, but industry employment has only grown at an annualized rate of 0.9% to 5.6 million employees over the five years to 2017, whereas wages have grown an annualized 2.3% to $358.8 billion.
The nurse and physician shortage is due to a variety of challenges, including a scarcity of relevant education programs. According to a report from the American Association of Colleges of Nursing, US nursing schools turned away 78,089 qualified applicants from baccalaureate and graduate nursing programs in 2013 due to budget constraints and insufficient faculty, clinical sites, classroom space and clinical preceptors. In addition, many physicians are getting older and have already retired or will do so in coming years. INDUSTRY OUTLOOK Over the five years to 2022, the Hospitals industry will have to address a wide variety of issues, including healthcare reform, reimbursement trends, threats from hackers and continued personnel shortages. However, revenue growth will be supported by both the aging population and impending healthcare reform, which will likely continue to increase the number of insured patients.

AREA AND MARKET ANALYSIS
BBG, INC. 29 0118000070
Overall, IBISWorld expects industry revenue to increase at an annualized rate of 3.3% to $1.2 trillion over the five years to 2022, including growth of 2.2% in 2018. Although rising labor costs are likely to hinder industry profitability, the growing number of Americans with access to health insurance will ultimately offset these trends and drive continued industry growth.
EFFECTS OF REFORM
The implementation of the Patient Protection and Affordable Care Act (PPACA) will continue to affect the industry in the five years to 2022. The total number of Americans with private health insurance is expected to grow an annualized 0.5% over the next five years, while funding for Medicare and Medicaid is expected to grow at an annualized rate of 6.2% during the same period. Hospitals may not benefit from more Medicaid patients unless these programs increase their reimbursement, which is often less than the cost of providing care.
The regulatory environment of this industry has the potential to change significantly over the next five years. In 2017, the Republican Party released plans for the American Health Care Act, which would cut funding for Medicare and reduce the number of people with health insurance. This law could potentially change throughout the legislative process and cause fluctuations in the total number of people with health insurance. Industry-wide adoption of electronic health record (EHR) systems is expected to both help and hurt the industry. EHR systems will continue to be standard practice across the healthcare sector over the next five years. While these systems have already begun increasing efficiency in hospitals, they have also created opportunities for hackers because they have the potential for remote access, contain private information about patients and are necessary to hospital operations. Over the next five years, hospitals will continue to invest in IT security software and cybersecurity consultations to prevent hackers from using malware against them.

AREA AND MARKET ANALYSIS
BBG, INC. 30 0118000070
ACQUISITIONS AND EMPLOYMENT
Nonprofit hospitals, which are unable to borrow money for needed improvements in facilities and equipment, will likely seek for-profit benefactors over the five years to 2022, while for-profit hospital operators and investment firms will look to the nonprofit sector for growth opportunities. Healthcare reform will also pose new challenges to nonprofit operators. Section 9007 of the PPACA expands requirements for charitable hospitals to become, or remain, exempt from federal taxation, including performance of periodic community needs assessments and development of a policy on financial assistance to patients.
These changes will trigger further consolidation between nonprofit and for-profit operators in the industry. For-profit acquisitions of nonprofits are expected to grow over the next five years, increasing the number of industry enterprises at an annualized rate of 1.4% to reach a projected 3,017 companies in 2022. Unfilled faculty positions at nursing colleges, a shortage of students preparing to be faculty and attrition will each pose a threat to the nursing education workforce over the next five years. In light of healthcare reform and the subsequent demand for nursing services, the shortage of nurses will adversely affect the industry. Hospitals will likely raise wages and benefits to recruit and retain nurses and other medical support personnel, in addition to relying more on temporary and contract employees to meet seasonal and unanticipated needs. As a result, IBISWorld expects industry spending on wages to increase an annualized 3.0% over the next five years to $416.3 billion. INDUSTRY LIFE CYCLE Despite its long-standing presence in the US economy, the Hospitals industry is in the growth phase of its life cycle. Industry value added (IVA), which measures an industry’s contribution to the overall economy, is forecast to grow an annualized 2.5% over the 10 years to 2022. This increase is faster than the projected annualized growth of US GDP (2.0%) during the same period, which is characteristic of an industry in its growth phase.
The aging US population will contribute to growing demand for hospital services, and the healthcare reform legislation of 2010 will increase the number of people with medical insurance, thus increasing the market for industry services. Most of the newly insured patients, however, will be covered under Medicaid, which typically reimburses hospitals less than the actual cost of care. While new technologies will broaden the array of services that hospitals offer, these innovations can also reduce patients’ average length of stay. This trend may slightly restrain industry revenue growth and result in a shift toward outpatient services from other healthcare providers. Budget cuts have also driven federal and state governments to cut healthcare expenditures, which will somewhat stifle profitability. Managed-care organizations, which are consolidating and growing in size, will attempt to reduce cost growth for hospital services. In response, industry operators will likely consolidate to maintain bargaining power over service prices. However, industry consolidation is also occurring in response to growth opportunities; for example, for-profit operators are increasingly acquiring nonprofit hospitals because of the rise in the number of insured individuals created by healthcare reform.

AREA AND MARKET ANALYSIS
BBG, INC. 31 0118000070
PRODUCTS AND MARKETS PRODUCTS AND SERVICES
There are three basic types of hospitals in the United States: proprietary (for-profit) hospitals, nonprofit hospitals and charity or government-supported hospitals. The services within these institutions vary considerably and are usually organized according to the basic mission or objectives of the institution. Proprietary hospitals include general and specialized hospitals, usually as part of a healthcare network, which may be corporately owned and aim to make a profit from the services provided. Nonprofit teaching or community hospitals serve several purposes, including training interns and residents and offering services to patients who cannot afford them, combining service, teaching and profitability without a corporate or private owner. These hospitals, like the University of California, San Francisco Medical Center and the Mayo Clinic, also attempt to maintain some degree of profitability to preserve and update facilities. Government-supported hospitals include tax-supported hospitals for counties, communities and cities, while charity hospitals (community or voluntary hospitals) are run by a board of citizen administrators who serve without pay. This type of hospital’s main objective is to provide healthcare for a community or geographic region.
INPATIENT CARE
Most hospitals offer both inpatient and outpatient care, depending on patient need. Inpatient care has been decreasing in terms of its total value to the industry: inpatient services were estimated to account for 56.0% of total industry revenue in 2012, according to the American Hospital Association; between 2011 and 2014 (latest available data), this estimation dropped to 54.0%. In 2017, IBISWorld projects that inpatient services will account for 51.3% of revenue. This shift is partially a result of new technologies that enable previous inpatient services to be provided on an outpatient basis. Typically, inpatient services are more rarely provided than outpatient services, but they generate more revenue per patient. As hospitals look to keep costs down amid

AREA AND MARKET ANALYSIS
BBG, INC. 32 0118000070
decreasing reimbursements from Medicare and Medicaid, inpatient care’s share of industry revenue will likely continue to decrease over the five years to 2022.
OUTPATIENT CARE
Outpatient care refers to any type of service that does not involve an overnight stay in a medical facility, including a typical visit to a doctor’s office and a same-day hospital surgery. Blood tests, lab work, X-rays and mammograms are usually outpatient but may also be performed on those who are hospitalized. Similarly, a same-day surgery can become inpatient if complications arise and the patient must be hospitalized overnight.
Over the five years to 2017, the number of outpatient and alternative healthcare services has increased for patients without acute illnesses, and IBISWorld estimates that outpatient services will account for 48.7% of industry revenue in 2017. This growth has occurred primarily through regulatory and technological changes, a shift toward outpatient solutions and an increasing supply of out-of-hospital physicians. For example, hospitals used to regularly admit people for conditions like pneumonia, but improved drug treatments mean fewer patients need to stay overnight unless they have particularly aggressive pneumonia or other serious conditions. Many surgical procedures, such as pacemaker implantation, were once performed solely as an inpatient service, but are now often done in an outpatient setting; similarly, refinements in medicine, like improved surgical techniques and anesthesiology, have led to a reduction in the types of surgeries that require overnight hospital care. Moreover, the quality of rest and care is often better at a patient’s home than in a hospital setting. Cost has also driven the increase in outpatient services, as overnight hospitalization costs a hospital more than sending a patient home. Decreased inpatient care also saves room in already crowded hospitals for patients who require more extensive care. Major payers like Medicare, Medicaid and managed-care companies are also up against higher pressure to reduce admission rates and length of stays, and to maximize outpatient and alternative healthcare delivery where possible. As a result, the share of total industry revenue generated by outpatient services will likely continue to increase over the five years to 2022. DEMAND DETERMINANTS
Demand for the Hospitals industry is affected by the general health of the population, demographic trends, healthcare technologies and the cost, affordability and availability of hospital care. Public and privately funded programs can increase the overall level of public health by promoting healthy lifestyles and increasing safety on the road, in the workplace and in other areas. The size, growth and age distribution of the population also influence demand for hospital services, as older adults and women of childbearing ages tend to be major users of hospital services.
New technologies can increase the range of treatments available in hospitals (increasing demand) or in other medical settings (reducing demand), while also reducing the length of stay in hospitals (diminishing demand). Technological advancements enable patient treatment on a less-costly outpatient basis (e.g. day surgery), leading payers to demand a shift to ambulatory or outpatient care wherever possible. People with higher incomes tend to spend more on healthcare

AREA AND MARKET ANALYSIS
BBG, INC. 33 0118000070
and often have private health insurance. Therefore, demand for hospital services tends to rise in response to growth in disposable income. Private and public health insurance can reduce the direct cost to patients, and higher rates of insurance coverage can promote overall demand in the Hospitals industry. Since the implementation of the Patient Protection and Affordable Care Act, the number of people with health insurance has steadily increased, making people more likely to visit hospitals. Several other factors strengthen demand for hospital services, including the range of services provided and the extent to which hospital procedures are conducted in general medical and surgical hospitals relative to specialist hospitals. Additional services within hospitals can include radiology, pharmacy, physiotherapy and laboratory procedures. Ancillary services and therapy programs ordered by physicians and provided to patients also affect hospital revenue. MAJOR MARKETS
Hospital revenue depends on inpatient occupancy levels, the medical and ancillary services physicians order and provide to patients, the volume of outpatient procedures and the charges or payment rates for these services. Charges and reimbursement rates for inpatient services vary significantly depending on the type of payer, the type of service (e.g. medical or surgical, intensive care or psychiatric) and the hospital’s geographic location. Inpatient occupancy levels fluctuate for various reasons, including demographic trends and the intensity of the flu season. GOVERNMENT INSURANCE
Hospitals receive payment for patient services from the federal government under the Medicare program, from state governments under Medicaid or similar programs. Medicare is a federal program that provides certain hospital and medical insurance benefits to people aged 65 and

AREA AND MARKET ANALYSIS
BBG, INC. 34 0118000070
older, some disabled people, people with end-stage renal disease and people with Lou Gehrig’s disease (ALS). Medicaid is a federal-state program that states administer, and it provides hospital and medical benefits to qualifying individuals who cannot afford healthcare. Amounts received for services provided under Medicare and Medicaid programs are significantly less than established hospital gross charges. Payments from government insurance programs are expected to account for 38.2% of industry revenue in 2015 (latest available data).
PRIVATE INSURANCE
Major health insurance companies provide private insurance from employment benefits for those who do not qualify for government insurance. Private insurance accounted for 45.2% of industry revenue in 2015 (latest available data), according to the US Census Bureau. This segment is expected to grow as more consumers gain access to private healthcare from the healthcare exchanges created by the Patient Protection and Affordable Care Act (PPACA).
OUT OF POCKET PAYMENTS
Consumers can opt out of health insurance, but the PPACA requires people without health insurance to pay a fee for patient care, providing an incentive for consumers to purchase health insurance. This PPACA mandate is expected to lower the portion of revenue accounted for by out-of-pocket payments. In 2015 (latest available data), out-of-pocket payments accounted for 3.6% of industry revenue.
BUSINESS LOCATIONS
Hospital locations in the United States are largely determined by the same factors that drive demand for hospitals in general: the size of the regional population and the demographic features that inform its healthcare needs, such as the age of the population or its general level of health. Accordingly, regions with larger (and older) populations will generally have a larger share of the country’s hospitals. The states that account for the most establishments, Texas (8.8%), California (8.0%) and Florida (4.7%) also account for the highest portions of the population, with 8.5%, 12.2% and 6.3%, respectively. Other factors, such as regional fluctuations in the birthrate or disposable income, will also affect a region’s demand for healthcare.
The regions with the largest share of industry activity include the Southeast (26.5%), the Great Lakes (15.0%) and the Plains (13.5%). The Southeast region’s share of hospitals slightly outpaces its share of the US population, largely due to the prevalence of persistent health problems, such as obesity. In addition, a disproportionately high number of senior citizens live in the Southeast, particularly in Florida, which is the US state with the third-highest number of hospitals. Fewer hospitals are needed in rural areas due to their lower urban population densities, such as the Rocky Mountains and New England. Rural hospitals typically serve more uninsured or low-income patients, so for-profit hospitals will often avoid these regions in favor of more affluent areas. Additionally, urban and more prosperous areas have inordinately high proportions of the country’s skilled healthcare workforce.

AREA AND MARKET ANALYSIS
BBG, INC. 35 0118000070
MARKET SHARE CONCENTRATION
Despite widespread consolidation in recent years, the Hospitals industry remains fragmented. No player accounts for more than 5.0% of industry revenue, and the four largest companies combined are estimated to account for 10.8% of industry revenue in 2017. Hundreds of providers of various sizes are spread throughout the country and concentrations vary among geographic markets. For example, Hospital Corporation of America, concentrated in Florida and Texas, holds 20.0% to 40.0% market share in most of the areas in which it operates. Universal Health Services seeks leadership in growth markets and concentrates on medium-size cities with populations of up to 500,000 people, avoiding larger cities with many competitors. Community Health Systems has similarly focused on markets outside metropolitan areas, and a large proportion of their hospitals are in markets where there are no competitors.
The implementation of healthcare reform will likely accelerate consolidation in coming years, thereby altering the hospital business. Healthcare reform will likely lower industry prices and enforce reimbursement models with powerful incentives to form large systems of care, including bundled payments, payments for quality and accountable care organizations. As a result of these changes, reform is expected to increase both the number and size of industry mergers.

AREA AND MARKET ANALYSIS
BBG, INC. 36 0118000070
COMPETITIVE LANDSCAPE COST STRUCTURE BENCHMARKS WAGES
Total industry spending on labor is estimated to account for 35.1% of industry revenue in 2017, down from 36.3% in 2012, though this percentage varies by hospital type. In some markets, the availability of nurses and medical support personnel has become a significant operating issue. To improve retention, recruiting and productivity, hospitals have enhanced wages and implemented new benefit plans for employees or contract and temporary personnel. As a result, labor costs are expected to increase over the five years to 2022. Labor unions often represent hospital employees. Potential changes in federal labor laws, including the proposed Employee Free Choice Act, may increase the likelihood of employee unionization attempts. If a significant portion of the industry employee base unionizes, wage costs would increase materially. In addition, several states will likely adopt mandatory nurse-patient ratios, which could significantly affect labor costs and negatively affect revenue if hospitals need to limit patient admissions to meet the required ratios. PROFIT
Profit, measured as earnings before interest and taxes, is expected to account for 7.9% of revenue for an average hospital in 2017. Over the past five years, the number of for-profit hospitals has increased as a percentage of total operators in the industry, while the number of nonprofit and government-run hospitals has moderately decreased; this has driven profit increases over the past five years. Hospital profit margins are expected to continue rising over the five years to 2022 due to increases in prices for hospital care. However, profit growth has been somewhat limited as occupancy stagnated and uncompensated care rose slightly. Moreover, some hospitals experienced losses since Medicaid reimbursement does not fully cover the cost of care. The industry-wide trend toward consolidation will further limit profit margins as companies incur costs associated with new business acquisition and integration. PROVISION OF DOUBTFUL ACCOUNTS
Payment collections from Medicare, managed-care payers, patients and other third-party payers are the main sources of industry revenue. Primary collection risks relate to uninsured patient accounts, including patient accounts wherein the primary insurance carrier has paid the amount the agreement covers, but failed to pay the responsibility amount (deductibles and co-payments). Provision for doubtful debts can represent more than 10.0% of revenue for some companies, though the percentage can change from year to year and from company to company depending on payer profiles, management policies and bad and doubtful debt estimates. Large industry companies, such as Ascension and Tenet Healthcare Corporation, average between 7.0% and 8.0% of revenue as provision for doubtful accounts, whereas this cost accounts for more than 11.4% of annual revenue for the Hospital Corporation of America. The total provision for doubtful accounts is based on a company’s assessment of historical write-offs and expected net

AREA AND MARKET ANALYSIS
BBG, INC. 37 0118000070
collections, business and economic conditions, trends in federal, state and private employer healthcare coverage and other collection indicators. Certain trends can make it difficult to reduce doubtful debts as a percentage of revenue, including payer mix shifts to managed care with greater co-payments and deductibles, a larger amount of services provided to uninsured and under-insured patients and an increase in unemployment. Doubtful debt is expected to have decreased over the five years to 2017, and will likely continue to decrease over the five years to 2022, as people become better able to pay their hospital bills due to the improving economy and healthcare reform legislation. OTHER COSTS
Other major expenses include the purchase of supplies (e.g. medical equipment and devices and pharmaceutical supplies), which accounts for an estimated 19.0% of industry revenue. Depreciation and amortization (mainly buildings and medical equipment) account for an estimated 4.6% of revenue. Other expenses include repair and maintenance, consulting, marketing, malpractice insurance and information systems. INDUSTRY GLOBALIZATION
The Hospitals industry has a low level of globalization, partly because of the presence of US-based government and nonprofit hospitals, which account for nearly 90.0% of industry revenue. US-based companies predominantly control for-profit private hospital groups due to significant regulatory requirements relating to the healthcare sector and the relatively low profitability of the industry. Telemedicine has enabled hospitals to use professional services, such as diagnostic imaging, outside the United States, sometimes from providers that offer low prices compared with domestic providers. The Centers for Medicare and Medicaid Services (CMS) has proposed new rules on credentialing and privileging processes for physicians and other healthcare professionals who provide telemedicine services. Current CMS regulations require all hospitals, including those certified as critical-access hospitals, to privilege each physician who provides telemedicine services to a hospital’s patients as if the physician were on-site. The proposed regulations permit the governing body of a hospital whose patients receive telemedicine services to grant privileges based on recommendations from its medical staff. In turn, the medical staff would rely on information provided by the distant-site hospital. The CMS proposal drives the advancement of telemedicine worldwide while still protecting the health and safety of patients. CONCLUSION Revenue growth over the next five years to 2022 will be supported by both the aging population and impending healthcare reform. New technologies will increase the number of services that hospitals offer but can also reduce patients' average length of stay. The hospital industry's contribution to the overall economy is forecasted to grow an annualized 2.5% to 2022 as the industry is in the growth phase of its life cycle.

AREA AND MARKET ANALYSIS
BBG, INC. 38 0118000070
MEDICAL OFFICE AND HEALTH CARE REPORT BY CBRE RESEARCH2 The aging U.S. population and increase in the number of people insured under the Affordable Care Act (ACA) boosted demand for medical office properties by both tenants and investors in recent years. As of this writing, it is uncertain whether the ACA will be repealed and replaced, and if so how any new legislation may affect the MOB market. Although these potential policy changes have created uncertainty within the industry, the aging baby boomer population will be a positive driver of health care demand through the long term. The U.S. Census Bureau estimates that the 65+ population will nearly double between 2015 and 2055 to more than 92 million and comprise nearly 23% of the country's total population by that time. Demand for health care services increases significantly with age; the average annual number of physician office visits for the 65+ population is nearly double that of the next oldest (45- to 64-year-old) cohort.' Thus, the steep increase in both the 65+ population and anticipated greater need for in-office physician services by this group signals a continued increase in demand for health care services and medical office space in the decades ahead. The aging population will likely continue to drive health care-related employment through the long term in both fast-growing metro areas in the Sun Belt and more established population centers in the Northeast and Midwest. Following the housing bust and recession, which hit the Sun Belt particularly hard, strong job and population growth have resumed. The region's moderate climates and affordable living costs are once again attracting both retirees and working professionals, and thus overall population gains, including a growing number of older residents, are expected to fuel strong health care employment growth going forward. Health care job gains will likely be more moderate in the East and Midwest. However, many of these slower-growth metros have the highest concentrations of health care employment relative to the total employment base, as well as clusters of highly regarded hospitals and health care research institutions. The well-established health care networks and infrastructure in these two regions will remain appealing to both landlords and investors. Thus, while fast-growing metros will provide more opportunities for expansion and new product, many slower-growing metros offer large, reliable tenant pools and more value-add investment opportunities. Large metros and well-established health care markets grow more slowly than metros that needed to ramp up health care employment in response to rapid population growth. Health care providers are facing increasing pressure to improve health outcomes and cut costs. According to the Kaiser Family Foundation, national health expenditures have increased every year since at least 1960, averaging 9.0% annually from 1960 to 2016 and 5.9% during the more recent period of 2000¬2016. Health care spending growth moderated during and immediately following the recession, slowing to a 2.9% annual rate in 2013, but accelerated to an average of 5.3% annually between 2014 and 2016—well above annual inflation rates during this period.
2 http://www.cbre.us/real-estate-services/real-estate-industries/healthcare-capital-markets

AREA AND MARKET ANALYSIS
BBG, INC. 39 0118000070
The ACA placed a greater focus on the cost-effectiveness of health care services, as it significantly increased the number of people utilizing health care services and placed some new constraints on the amount of compensation providers could expect to receive. Other factors influencing this shift to cost effectiveness include more information available to consumers about health care costs and the success rates of various treatments. This transparency has made consumers more conscious of how they choose to spend on health care, especially given the rising number of high-deductible health insurance plans. Adopting new technologies is one way that health providers can improve both health care outcomes and communication with patients. Although such investments will help cut costs in the long term, the upfront capital required means that costs must either increase or be trimmed elsewhere. One key way in which health care providers are attempting to increase cost-effectiveness is to move more patient volume away from hospitals—the highest-cost facilities—and into lower-cost outpatient facilities, including medical office buildings and urgent-care facilities. Another cost-cutting trend that impacts health care real estate is a significant uptick in M&A activity, with hospitals acquiring physician and specialist practices, and small physician groups combining their practices to save on real estate and overhead costs. Consolidation among physician medical groups has been particularly strong, with deal volume surging by 19% in 2016 and 109% year-over-year in Q1 2017. Regardless of any changes to health care policy, these trends are expected to continue. Providers remain focused on cost-cuffing in the face of declining reimbursement rates from both Medicare and private insurance companies, as well as the continued need for investment in new technology. Health care systems' real estate strategies will reflect these trends, both in terms of providing services in the lowest-cost environment possible and as a preference for modern medical office product capable of accommodating complex, evolving technologies. U.S. MEDICAL OFFICE MARKET TRENDS INVENTORY SET
CBRE Research has developed a unique medical office inventory set on which the following analysis is based. Our building set was limited to higher-quality Class A and Class B properties with at least 10,000 sq. ft. of rentable area that are specifically designated as medical office. We focused on buildings that house general practice, dental, surgical or special practitioners/services. Properties such as hospitals, urgent-care/retail and skilled-nursing facilities were excluded from our data set. Also, our CBRE Health care Services brokerage team members shared their local knowledge and input for developing the local datasets in many of the markets. ACCELERATING VACANCY RATE DECREASES IN RECENT QUARTERS The U.S. MOB vacancy rate decreased by a modest average of 10 basis points (bps) per quarter between Q1 2010 and Q1 2017, declining or remaining unchanged in all but one quarter despite the consistent addition of speculative new supply throughout this period. The overall vacancy rate was 8.0% in Q1 2017, down by nearly 300 bps from Q1 2010.

AREA AND MARKET ANALYSIS
BBG, INC. 40 0118000070
The pace of vacancy rate decrease accelerated in recent quarters due to stronger user demand, likely driven by the aging U.S. population and increase in the ranks of the insured. The national vacancy rate decreased by the same amount during the past nine quarters (140 bps) as during the prior four years. This acceleration occurred despite a slight increase in new medical office supply during the past few years. Across almost all of the markets tracked in this report, direct vacancy rates have decreased since the beginning of 2010. Only two markets did not have a decline in vacancy over the past seven years: New York3 and the Greater Washington, D.C. area.4 New York did not have much room for further declines as it was already the tightest market in Q1 2010 with a 2.9% vacancy rate. Only recently has Nashville overtaken that benchmark with a lower vacancy rate of 2.8% as of Q1 2017, reflecting that metro area's vibrant health care sector and robust population growth. Conditions are generally tight across the markets we examined, with single-digit vacancy rates in more than 60% of them in Q1 2017. The five markets with the lowest Q1 vacancy rates were Nashville (2.8%), New York (3.2%), the San Francisco Bay Area (4.2%), Louisville (4.9%) and Kansas City (5.5%). Nashville registered the strongest medical job growth and New York the fifth strongest over the past five years, contributing to their low availability rates. Little or no medical office construction is underway in the Bay Area and New York, where high construction costs and a limited supply of available land make new development challenging, which likely will help to maintain tight market conditions in the near term. Development generally remains low in the other three markets as well, with less than 300,000 sq. ft. currently under construction in each, signaling little supply relief for tenants and a likely continuation of low vacancy rates in the near term. RENT GROWTH FLAT OVERALL BUT STEEP IN SUPPLY-CONSTRAINED MARKETS
Overall asking rents for medical office properties have remained relatively flat for the past seven years, ranging between $22 and $23 per sq. ft. per year. This trend reflects sustained demand for health care despite the recession, as well as the relative stability of the medical office tenant base. Specifically, the high cost of tenant build-outs, as well as the importance of proximity to a provider's patient base and ancillary medical services, compels many tenants to remain in place for long periods of time. Unlike those of the traditional office market, in which gross asking rents decreased by nearly 15% from the peak to the trough of the most recent recession, medical office rents were much more stable. Rent trends varied significantly across markets, however, depending on each metro area's unique supply and demand variables. Some markets with low availability and development activity have recorded significant rent increases since 2010. The average rent for New York grew by an astounding 83% since Q1 2010, and at over $68 per sq. ft. as of Q1 2017 was by far the highest among the markets tracked. The closest competitor for long-term rent growth was the San Francisco Bay Area at 25%. Rent growth rates were among the highest in the country in many of the other California markets as well, with Los Angeles, Orange County and San Diego each recording increases of 9% or more since 2010. Single-digit vacancy rates, coupled with low levels of new supply in recent years, have fueled rent growth in these markets. San Diego, the San Francisco Bay Area and Los Angeles ranked as the most expensive U.S. medical office

AREA AND MARKET ANALYSIS
BBG, INC. 41 0118000070
markets after New York as of Q1 2017. Among lower-cost, less supply-constrained markets, Louisville and Tampa featured solid rent growth at 16% and 14%, respectively, with increases also fueled by low availability rates and steady health care employment growth. Looking at rent growth over the past year, almost all of the 30 markets we examined registered increases. Boston, Los Angeles and Orange County all posted year-over-year rent growth of more than 10% in Q1 2017—far outpacing the rest of the tracked markets. Health care jobs increased by 3.6% or more in each of these markets in 2016, driving demand for space. According to the CBRE U.S. Health care Capital Markets Group's 2017 Investor & Developer Survey, investors in medical office buildings are projecting anywhere from 1% to 3% rent growth in 2017. This is a wider range than reported in 2016, when a larger share of projections was concentrated in the 2%-to-3% range ABSORPTION INCREASINGLY OUTPACES NEW SUPPLY
Nationally, net absorption has been positive on a quarterly basis since at least Q1 2010 and has picked up substantially in recent years. Net absorption totaled 59.3 million sq. ft. between 2010 and 2014, slightly exceeding completions (54.1 million sq. ft.) and resulting in a fairly flat vacancy rate trend. However, in mid-2015, net absorption started to greatly outpace deliveries; net absorption totaled 35.4 million sq. ft. between 2015 and Q1 2017-38% higher than completions of 25.6 million sq. ft. during the same period. This supply-demand imbalance helped to accelerate the national decrease in vacancy. On a yearly basis, net absorption has been increasing since 2011 when it totaled 8.1 million sq. ft. Since that time, annual absorption has grown by 114% to 17.2 million sq. ft. in 2016. Robust population growth is driving demand for medical office space in the Sun Belt. Four of the five markets with the most positive net absorption in 2016 were located in the South or West: Houston (436,300 sq. ft.), Tampa (413,800 sq. ft.), Phoenix (314,400 sq. ft.) and South Florida (310,703 sq. ft.). Indianapolis was the lone top market not located in the Sun Belt, ranking third with 383,700 sq. ft. of positive absorption. Not only did these markets feature significant absorption levels, but they were also among the top markets for absorption as a percentage of existing net rentable area (NRA), with Tampa the highest among all markets at 5.9%. Fueled by their expanding local populations, strong health care employment growth was an important driver of demand for medical office space in all of these markets; the total number of health care jobs increased by 3.4% or greater in 2016 and 10% or greater since 2011 in each. CONSOLIDATION AND TECHNOLOGY DRIVE NEW CONSTRUCTION
Construction activity has increased since the recession, with the amount of space under construction rising from approximately 10 million sq. ft. in 2010 to more than 13 million sq. ft. in 2013. Development activity has ticked down slightly in recent quarters but remains well above recession-era levels, with 12.5 million sq. ft. underway nationally as of Q1 2017. Consolidation has been a major driver of new medical office construction in recent years, as many markets lacked enough large blocks of space to meet the requirements of newly expanded health care provider groups, particularly within close proximity to hospital campuses. Also,

AREA AND MARKET ANALYSIS
BBG, INC. 42 0118000070
health care systems' focus on value-based care rather than a fee-for-service approach has amplified the need for effective communication across provider teams, driving the need for efficient space that facilitates collaboration. The evolution of medical technologies also is boosting demand for newer product with the infrastructure capable of handling cutting-edge devices and systems. Regardless of any health care policy changes, medical office space that helps providers minimize costs and maximize outcomes, including buildings that support collaboration and can accommodate new technologies that help them achieve these goals, will likely remain in favor. CAPITAL MARKET TRENDS
As investor appetite for health care-related real estate has grown, medical office buildings have emerged as the most popular property type within the niche. In addition to industry-wide factors that are driving investor confidence—demographic trends, increased health care utilization and shifts toward more outpatient facilities—the medical office sector is also benefiting from cyclical dynamics. As yields for traditional real estate asset classes have compressed in recent years, new capital sources—including foreign capital—have entered the medical office sector in search of higher yield and a relatively safe investment alternative. As a result, investment in the U.S. medical office sector increased substantially over the past seven years. Total U.S. investment volume in medical office buildings of at least 10,000 sq. ft. rose from just under $4 billion in 2010 to $10.2 billion in 2016.5 Moreover, total investment in 2016 exceeded the prior annual peak of $7.3 billion in 2006, reflecting increased optimism in medical office and not simply improvement from the Great Recession. The trailing 12-month investment volume was up by 5% year-over-year in Q1 2017, boosted by exceptionally strong investment in Q4 2016. On a quarterly basis, investment was down in Q1 relative to quarterly totals over the past two years, likely a reflection of greater uncertainty stemming from potential changes to U.S. health care policy, though it is too soon to tell whether this trend will persist. Investment volume in medical office properties is closely tied to major population centers, with the Southeast and the Western regions capturing a combined 44% of total medical office investment since 2010. Investment in the Southeast is fairly diversified throughout the region, with the two top markets—Atlanta and South Florida—accounting for a combined 28% investment share. California has the majority of investment in the West, making up 56% of total investment for the region, with Greater Los Angeles (L.A., Orange County and Inland Empire) alone representing 37%. If California were its own region, it would have seen the fifth largest amount of medical office investment since 2009 ($6.4 billion), ahead of both the Northeast ($5.4 billion) and the Mid-Atlantic ($4.7 billion) regions. Uncertainty surrounding U.S. health care policy, and payment models in particular, have reinforced the preference for medical office over other health care assets, as providers working in medical office buildings are much less reliant on Medicare and Medicaid reimbursements than providers in hospitals and nursing facilities. Ninety-seven percent of investors surveyed in 2017 were most interested in medical office properties among all health care-related real estate that met their investment criteria.6 Additionally, 78% of respondents expect to be net buyers of medical office properties this year, and only 2% expect overall demand for medical office to be

AREA AND MARKET ANALYSIS
BBG, INC. 43 0118000070
lower in 2017 than it was in 2016. Nearly half of respondents (45%) expect demand for medical office properties to be higher than last year, while only 23% of respondents expect supply to increase. This potential imbalance may weigh on investment volume but will likely keep pricing aggressive. CAP RATES NEAR RECORD LOWS
Competition for high-quality medical office assets remains strong. The overall U.S. medical office cap rate was 6.8% as of Q1 2017, up slightly from a record low of 6.7% in Q3 2016, but still down by 30 bps year-over-year.' Since mid-2010, medical office cap rates have consistently decreased from a high of 8.3%. On a regional basis, average cap rates have been lowest in the West over the past seven years, below the U.S. average by about 60 bps. However, the spread between the highest and the lowest regional cap rates remained relatively tight during this period, as industry-wide trends have a similar impact across the various markets. These comparatively moderate regional differences are another attractive feature of medical office as an investment class. Because there is demand for health care everywhere, investors are generally more willing to look outside the primary markets compared with traditional office investment, and this is apparent in pricing metrics. Class-A medical office properties are often priced more aggressively than the overall U.S. cap rates suggest, particularly for on-campus assets associated with a hospital system. Just under half of all surveyed investors in health care assets indicated that a market capitalization rate for multi-tenant Class-A on-campus product would be below 6.0% in 2017.8 For multi-tenant Class-A off-campus product, only 16% of respondents indicated that cap rates would be below 6.0%. However, the spread between average on- and off-campus cap rates narrowed relative to the 2016 survey, reflecting the growing trend among health care providers to shift care away from hospital systems and into high-quality, stand-alone, medical office buildings located closer to where patients live. Overall, the cap rate range identified by the largest share of surveyed investors in 2017 was 50 bps lower than the most commonly identified range last year for both types of Class-A product. Medical office is a resilient sector, able to weather economic downturns and the major political and technological changes that have shaken up the health care industry in recent years. The medical office vacancy rate has tightened steadily since 2010, and the current rate of 8.0% is not only a record low for the segment, but also well below the vacancy rate for the U.S. office market overall (13.0% in Q1 2017). Similarly, sustained demand kept national medical office rents relatively stable throughout the post-recession recovery years, and rents in most of the large markets are now at multi-year highs. Restrained construction activity has helped keep fundamentals strong, with new supply coming on line primarily in response to the need for larger blocks of space and modern buildings capable of accommodating technologically advanced systems. The attractive operating conditions in the medical office leasing market have contributed to increased investor confidence in the sector. Though transaction volume decreased in the first

AREA AND MARKET ANALYSIS
BBG, INC. 44 0118000070
quarter, pricing remains competitive and most health care investors expect to see continued demand for medical office product and further cap rate compression this year. As U.S. health care legislation continues to be debated, uncertainty surrounding what a new plan may include will continue to affect decision-making among health care providers in the near term. In the long run, however, demographic trends, technological advances and an emphasis on cost-efficiency will all sustain demand for health care services generally, and medical office space specifically, regardless of any regulatory changes that are eventually enacted.

AREA AND MARKET ANALYSIS
BBG, INC. 45 0118000070
NEIGHBORHOOD DESCRIPTION LOCATION IDENTIFICATION
DYKER HEIGHTS OVERVIEW Dyker Heights is a residential neighborhood in the southwest corner of the borough of Brooklyn in New York City, US. It is on a hill between Bay Ridge, Bensonhurst, Borough Park, and Gravesend Bay. The neighborhood is officially bounded by 7th and 14th avenues, 61st Street, and the Belt Parkway on the west, east, north, and south, respectively. Dyker Heights is in Brooklyn Community Board 10. Dyker Heights real estate is primarily made up of medium sized (three or four bedroom) to small (studio to two bedroom) small apartment buildings and townhomes. Most of the residential real estate is occupied by a mixture of owners and renters. Many of the residences in the Dyker Heights neighborhood are relatively historic, built no later than 1939, and in some cases, quite a bit earlier. A number of residences were also built between 1940 and 1969. Real estate vacancies in Dyker Heights are 7.0%, which is lower than one will find in 62.8% of American neighborhoods. Demand for real estate in Dyker Heights is above average for the U.S., and may signal some demand for either price increases or new construction of residential product for this neighborhood. Dyker Heights median real estate price is $969,808, which is more expensive than 90.7% of the neighborhoods in New York and 96.9% of the neighborhoods in the U.S.

AREA AND MARKET ANALYSIS
BBG, INC. 46 0118000070
The average rental price in Dyker Heights is currently $1,947. The average rental cost in this neighborhood is higher than 66.6% of the neighborhoods in New York. DEMOGRAPHIC OVERVIEW The following demographic profile, assembled by Nielson, Inc, a nationally recognized compiler of demographic data, reflects the 11228-zip code. The area is projected to have a 2017 population of 43,466 in 16,138 household units. The current projections, as forecasted by Nielson, are as follows: UNIVERSE TOTALS
Description
2017
Estimate
% Change
2011-2017
% Change
2017-2022
2017
Estimate
% Change
2011-2017
% Change
2017-2022
Universe Totals
Population 43,466 3.81% 2.54% 8,645,259 5.75% 3.46%
Households 16,138 3.83% 2.55% 3,304,103 6.25% 3.68%
Families 11,133 3.85% 2.57% 1,961,737 6.03% 3.60%
Housing Units 18,802 3,577,854
11228 New York City
HOUSEHOLD INCOME The estimated average household income is $96,600, while the median income is $69,709. Approximately 18.7% of households have an income of less than $25,000, while 18.0% of the households earn over $150,000 per year. HOUSEHOLD INCOME
Households by Household Income 11228
% of
Total
New York
City
% of
Total
2017 Est. Households by Household Income 16,138 3,304,103
Income < $15,000 1,415 8.8% 529,526 16.0%
Income $15,000 - $24,999 1,605 9.9% 341,323 10.3%
Income $25,000 - $34,999 1,211 7.5% 282,640 8.6%
Income $35,000 - $49,999 1,737 10.8% 376,562 11.4%
Income $50,000 - $74,999 2,665 16.5% 489,881 14.8%
Income $75,000 - $99,999 1,887 11.7% 359,777 10.9%
Income $100,000 - $124,999 1,509 9.4% 262,674 7.9%
Income $125,000 - $149,999 1,205 7.5% 174,826 5.3%
Income $150,000 - $199,999 1,367 8.5% 197,805 6.0%
Income $200,000 - $249,999 628 3.9% 89,672 2.7%
Income $250,000 - $499,999 693 4.3% 116,558 3.5%
Income $500,000+ 216 1.3% 82,859 2.5%
2017 Est. Average Household Income $96,600 $88,462
Forecasted 2020 Average Income
2017 Est. Median Household Income $69,709 $56,226
Forecasted 2020 Median Household Income

AREA AND MARKET ANALYSIS
BBG, INC. 47 0118000070
POPULATION CHARACTERISTICS The neighborhood has an average age of 41 and a median age near 41. 30.61% of the area population is aged 54 and over, while 19.85% is younger than 18 years old. AGE CHARACTERISTICS
2017 Est. Population by Age 11228
% of
Total
New York
City
% of
Total
Age 0-17 8,628 19.85% 1,857,025 21.48%
Age 18-34 9,333 21.47% 2,243,562 25.95%
Age 35-54 12,198 28.06% 2,342,747 27.10%
54 and above 13,307 30.61% 2,201,925 25.47%
2017 Est. Median Age 41 37
2017 Est. Average Age 41 38 In terms of household size, 26.9% of households are single persons, 28.0% have two persons, and 17.6% have 3 persons. Only 12.4% of households have five or more. HOUSEHOLDS BY SIZE
2017 Est. Households by Household Size 11228
% of
Total
New York
City
% of
Total
1-person 4,340 26.9% 1,066,406 32.3%
2-person 4,519 28.0% 907,865 27.5%
3-person 2,835 17.6% 530,055 16.0%
4-person 2,435 15.1% 395,545 12.0%
5-person 1,146 7.1% 209,964 6.4%
6-person 496 3.1% 101,232 3.1%
7-or-more-person 367 2.3% 93,036 2.8% EDUCATIONAL ATTAINMENT The population is relatively under educated. 23.0% have not earned a high school diploma in contrast to 18.98% with a bachelor's degree and 11.9% with advanced degrees.
Educational Attainment 11228
% of
Total
New York
City
% of
Total
2017 Est. Pop Age 25+ by Edu. Attainment 31,452 6,036,469
Less than 9th grade 4,219 13.41% 613,164 10.16%
Some High School, no diploma 3,028 9.63% 575,129 9.53%
High School Graduate (or GED) 8,908 28.32% 1,471,098 24.37%
Some College, no degree 3,683 11.71% 856,496 14.19%
Associate Degree 1,891 6.01% 388,543 6.44%
Bachelor's Degree 5,969 18.98% 1,259,250 20.86%
Master's Degree 2,612 8.30% 612,773 10.15%
Professional School Degree 844 2.68% 177,049 2.93%
Doctorate Degree 298 0.95% 82,967 1.37%

AREA AND MARKET ANALYSIS
BBG, INC. 48 0118000070
EMPLOYMENT DYNAMICS According to Nielson 18.52% of workers are characterized as "blue collar," while 61.17% are engaged in "white collar" activities. 20.30% of the employed population works in the service and farm sectors. Within these broad categories, the largest employment sectors in the city are Office/Admin. Support (13.6%), Sales/Related (10.3%), and Management (8.7%). OCCUPATION CLASSIFICATION
Occupation Classification 11228
% of
Total
New York
City
% of
Total
2017 Est. Pop 16+ by Occupation Classif ication 19,401 3,971,814
Blue Collar 3,594 18.52% 587,256 14.79%
White Collar 11,868 61.17% 2,458,551 61.90%
Service and Farm 3,939 20.30% 926,007 23.31% OCCUPATION BREAKDOWN
Occupation 11228
% of
Total
New York
City
% of
Total
2017 Est. Civ. Employed Pop 16+ by Occupation 26,300 100.0% 3,918,125
Architect/Engineer 239 1.23% 37,170 0.01
Arts/Entertainment/Sports 544 2.80% 186,340 0.05
Building Grounds Maintenance 540 2.78% 186,508 0.05
Business/Financial Operations 1,067 5.50% 224,881 0.06
Community/Social Services 274 1.41% 78,685 0.02
Computer/Mathematical 453 2.33% 94,186 0.02
Construction/Extraction 1,454 7.49% 169,520 0.04
Education/Training/Library 1,500 7.73% 247,488 0.06
Farming/Fishing/Forestry 29 0.15% 2,926 0.00
Food Prep/Serving 1,452 7.48% 240,258 0.06
Health Practitioner/Technician 1,096 5.65% 196,715 0.05
Healthcare Support 626 3.23% 188,363 0.05
Maintenance Repair 323 1.66% 73,951 0.02
Legal 335 1.73% 79,854 0.02
Life/Physical/Social Science 60 0.31% 31,995 0.01
Management 1,679 8.65% 379,254 0.10
Office/Admin. Support 2,630 13.56% 492,429 0.12
Production 807 4.16% 110,099 0.03
Protective Services 604 3.11% 109,985 0.03
Sales/Related 1,991 10.26% 409,554 0.10
Personal Care/Service 688 3.55% 197,967 0.05
Transportation/Moving 1,010 5.21% 233,686 0.06 TRANSIT DYNAMICS There are good links to employment centers via public transport and the local highway network. Based on its urban location, roughly 32.15% of the employed drove alone to work. Given strong public transit service, 47.35% traveled by public transportation. The average travel time is roughly 48 minutes. Within this, roughly 9.6% of workers travel less than 15 minutes, while 28% live within 30 minutes of their jobs. The remaining workers travel in excess of a half hour. 33.9% work an hour or more away from home.
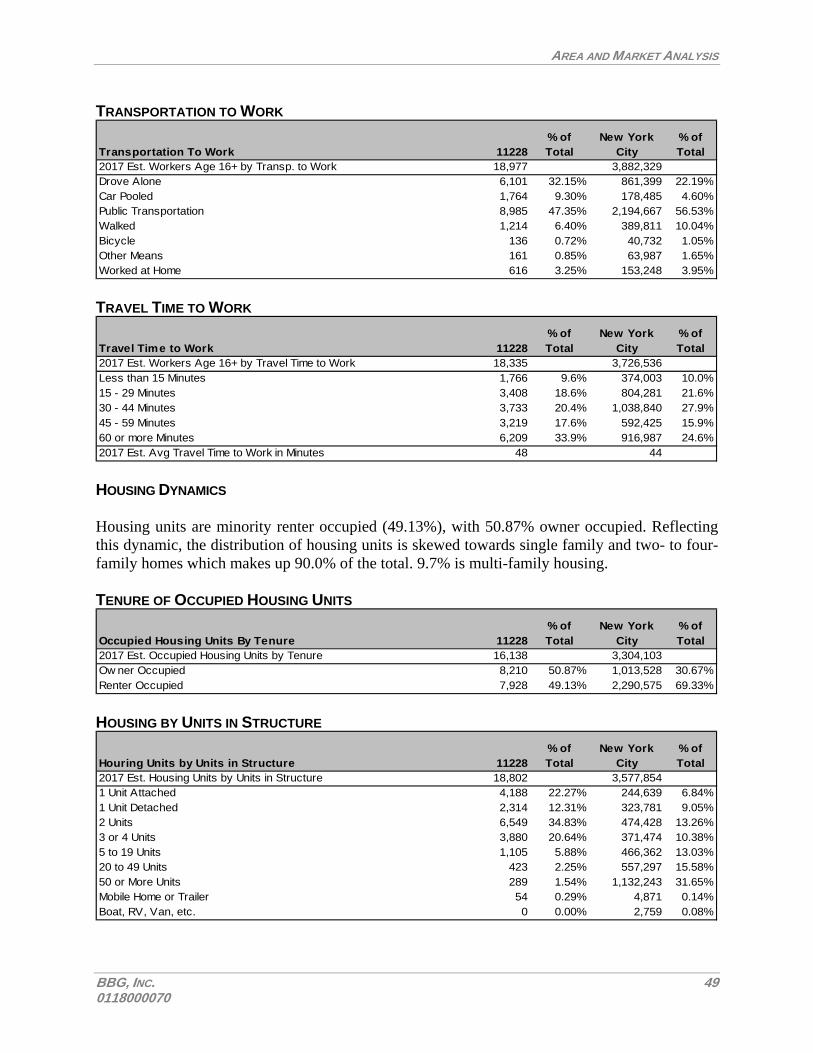
AREA AND MARKET ANALYSIS
BBG, INC. 49 0118000070
TRANSPORTATION TO WORK
Transportation To Work 11228
% of
Total
New York
City
% of
Total
2017 Est. Workers Age 16+ by Transp. to Work 18,977 3,882,329
Drove Alone 6,101 32.15% 861,399 22.19%
Car Pooled 1,764 9.30% 178,485 4.60%
Public Transportation 8,985 47.35% 2,194,667 56.53%
Walked 1,214 6.40% 389,811 10.04%
Bicycle 136 0.72% 40,732 1.05%
Other Means 161 0.85% 63,987 1.65%
Worked at Home 616 3.25% 153,248 3.95% TRAVEL TIME TO WORK
Travel Time to Work 11228
% of
Total
New York
City
% of
Total
2017 Est. Workers Age 16+ by Travel Time to Work 18,335 3,726,536
Less than 15 Minutes 1,766 9.6% 374,003 10.0%
15 - 29 Minutes 3,408 18.6% 804,281 21.6%
30 - 44 Minutes 3,733 20.4% 1,038,840 27.9%
45 - 59 Minutes 3,219 17.6% 592,425 15.9%
60 or more Minutes 6,209 33.9% 916,987 24.6%
2017 Est. Avg Travel Time to Work in Minutes 48 44 HOUSING DYNAMICS Housing units are minority renter occupied (49.13%), with 50.87% owner occupied. Reflecting this dynamic, the distribution of housing units is skewed towards single family and two- to four-family homes which makes up 90.0% of the total. 9.7% is multi-family housing. TENURE OF OCCUPIED HOUSING UNITS
Occupied Housing Units By Tenure 11228
% of
Total
New York
City
% of
Total
2017 Est. Occupied Housing Units by Tenure 16,138 3,304,103
Ow ner Occupied 8,210 50.87% 1,013,528 30.67%
Renter Occupied 7,928 49.13% 2,290,575 69.33% HOUSING BY UNITS IN STRUCTURE
Houring Units by Units in Structure 11228
% of
Total
New York
City
% of
Total
2017 Est. Housing Units by Units in Structure 18,802 3,577,854
1 Unit Attached 4,188 22.27% 244,639 6.84%
1 Unit Detached 2,314 12.31% 323,781 9.05%
2 Units 6,549 34.83% 474,428 13.26%
3 or 4 Units 3,880 20.64% 371,474 10.38%
5 to 19 Units 1,105 5.88% 466,362 13.03%
20 to 49 Units 423 2.25% 557,297 15.58%
50 or More Units 289 1.54% 1,132,243 31.65%
Mobile Home or Trailer 54 0.29% 4,871 0.14%
Boat, RV, Van, etc. 0 0.00% 2,759 0.08%

AREA AND MARKET ANALYSIS
BBG, INC. 50 0118000070
New development in the neighborhood represents 3.90% of the total stock added in this period. Given the overwhelming presence of older housing stock, the median year built is 1939. HOUSING BY YEAR STRUCTURE BUILT
Housing Units by Year Structure Built 11228
% of
Total
New York
City
% of
Total
2017 Est. Housing Units by Year Structure Built 18,802 3,577,854
Housing Units Built 2010 or later 733 3.90% 242,100 6.77%
Housing Units Built 2000 to 2009 533 2.83% 220,018 6.15%
Housing Units Built 1990 to 1999 357 1.90% 120,440 3.37%
Housing Units Built 1980 to 1989 329 1.75% 153,725 4.30%
Housing Units Built 1970 to 1979 655 3.48% 243,746 6.81%
Housing Units Built 1960 to 1969 906 4.82% 432,218 12.08%
Housing Units Built 1950 to 1959 1,823 9.70% 461,119 12.89%
Housing Units Built 1940 to 1949 2,439 12.97% 357,170 9.98%
Housing Unit Built 1939 or Earlier 11,027 58.65% 1,347,318 37.66% The median owner-occupied home value is $784,892, with 95% of homes valued at $300,000 or more. OWNER OCCUPIED HOUSING VALUES
Owner-Occupied Housing Units by Value 11228
% of
Total
New York
City
% of
Total
2017 Est. Ow ner-Occupied Housing Units by Value 8,210 1,013,528
Value Less than $20,000 59 0.72% 21,784 2.15%
Value $20,000 - $39,999 28 0.34% 12,543 1.24%
Value $40,000 - $59,999 22 0.27% 8,440 0.83%
Value $60,000 - $79,999 66 0.80% 6,460 0.64%
Value $80,000 - $99,999 45 0.55% 6,382 0.63%
Value $100,000 - $149,999 65 0.79% 23,543 2.32%
Value $150,000 - $199,999 33 0.40% 29,671 2.93%
Value $200,000 - $299,999 132 1.61% 77,660 7.66%
Value $300,000 - $399,999 165 2.01% 125,747 12.41%
Value $400,000 - $499,999 338 4.12% 149,370 14.74%
Value $500,000 - $749,999 2,782 33.89% 261,622 25.81%
Value $750,000 - $999,999 2,651 32.29% 131,593 12.98%
Value $1,000,000 or more 1,824 22.22% 158,713 15.66%
2017 Est. Median All Ow ner-Occupied Housing Value $784,892 $543,158

PROPERTY DATA
BBG, INC. 51 0118000070
ZONING SUMMARY
The subject is located in the R4B zoning district. R4B ZONING BREAKDOWN
Primarily a contextual rowhouse district limited to low-rise, one- and two-family attached residences, R4B districts also permit detached and semi-detached buildings. However, the floor area ratio (FAR) of 0.9 and maximum building height of 24 feet typically produce a two-story, flat-roofed rowhouse. Parts of Bay Ridge in Brooklyn and Middle Village and Brookville in Queens are mapped R4B. To maintain the characteristic rowhouse streetscape of R4B districts, the front yard of a new house must be at least five feet deep and at least as deep as one adjacent front yard but no deeper than the other, although it need not exceed a depth of 20 feet. Detached houses must have two side yards totaling at least eight feet; there is no minimum width for a side yard but there must be at least eight feet between buildings on adjacent zoning lots. Zero lot line buildings require only one eight-foot side yard and semi-detached buildings require one side yard at least four feet wide. One off-street parking space is required for each dwelling unit, although parking is waived when only one space is required. Front yard parking is not allowed. Curb cuts are prohibited on zoning lot frontages that are less than 40 feet.

PROPERTY DATA
BBG, INC. 52 0118000070
CONFORMITY
Based on the maximum effective FAR of 0.90, 46,735 square feet of bulk development is permitted on the site. Thus, with 179,315 square feet of GBA above grade the subject is of legal, non-complying bulk. This is due to the fact that the subject has been grandfathered in to previous zoning regulations. Finally, the property conforms in terms of age, condition, and construction to surrounding improvements within the immediate neighborhood.

PROPERTY DATA
BBG, INC. 53 0118000070
ASSESSED VALUE AND REAL ESTATE TAXES
ASSESSMENTS
699 92nd Street and 9012 7th Avenue is designated on the Kings County tax maps as Block(s) 6094, Lot(s) 1 & 26. The assessed value is as follows: ASSESSED VALUE
Actual Transitional
Land $1,159,200 $1,159,200
Building + $13,475,250 + $11,741,299
Total $14,634,450 $12,900,499
6094 / 1 & 26
TAX RATES
The City of New York has four tax categories for real properties, of which the subject is Class 4. The following is a historical analysis of tax rates:

PROPERTY DATA
BBG, INC. 54 0118000070
REAL ESTATE TAX RATES Year Class 1 Class 2 Class 3 Class 4
2008/2009 16.196 12.596 12.137 10.241
2009/2010 17.088 13.241 12.743 10.426
2010/2011 17.364 13.353 12.631 10.312
2011/2012 18.205 13.433 12.473 10.152
2012/2013 18.569 13.181 12.477 10.288
2013/2014 19.191 13.145 11.902 10.323
2014/2015 19.157 12.855 11.125 10.684
2015/2016 19.554 12.883 10.813 10.656
2016/2017 19.991 12.892 10.934 10.574
2017/2018 20.385 12.719 11.891 10.514
Source: New York City Department of Finance
The applicable rate is applied to the assessment: TAX LIABILITY FORECAST
$12,900,499
Tax Rate x 10.514%
Tax Liability $1,356,358
Per Square Foot $7.56
Taxable Assessed Value
In order to support the forecasted real estate tax liability, we surveyed those of comparable buildings in the area: COMPETITIVE RE TAX LIABILITIES
Year Built Square Feet Taxes/SF
585 Schenectady Avenue 1975 / 2010 297,200 $9.05
622 Winthrop Street 1920 635,994 $6.78
681 Albany Avenue 1937 / 2006 379,664 $7.48
2661 Ocean Parkway 1931 / 2008 637,100 $8.22
3201-33 Kings Highway 1947 / 2000 151,720 $7.32
Min: $6.78
Average: $7.77
Max: $9.05
Address
The comparables range from $6.78 to $9.05 per square foot and average $7.77 per square foot. The subject property’s non-exempt taxes per square foot fall within the market range. Thus, we will apply the current liability in our analysis.

PROPERTY DATA
BBG, INC. 55 0118000070
SITE DESCRIPTION
Location: The subject is situated at the intersection of 92nd Street and 7th
Avenue in the Sunset Park neighborhood of Brooklyn, NY.
The subject is located within Sunset Park on a mixed use street and is across the street from Dyker Beach Golf Course. There are good ties to I-278 and Belt Parkway. It has good access to public transit via the R train from 95th Street station. Finally, there are numerous restaurants, bars, shops, and other entertainment options within walking distance.
Site Area: 51,928± Square Feet
Shape: Irregular.
Frontage: Street Frontage
92nd Street 167.44
7th Avenue 425.69
Topography: Generally level at street grade.
Drainage: Assumed adequate.
Access: The property is accessed from 92nd Street and 7th Avenue.

PROPERTY DATA
BBG, INC. 56 0118000070
Paving: All roads are paved with asphalt and are in satisfactory condition.
Street Drainage: Street drainage is collected with the utilization of recessed catch basins. The catch basins empty by gravity into the local sewer storm system mains.
Street Lighting: Adequate
Utilities + Services: Water/Sewer and Refuse - City
Police & Fire Protection - City
Gas & Electric – Con Ed
Hazardous Substances: We observed no evidence of toxic or hazardous substances during our inspection of the site. However, we are not trained to perform technical environmental inspections and recommend the services of a professional engineer for this purpose.
Flood Hazard Status: Located in "Zone X" on the National Flood Insurance Program Rate Map dated September 5, 2007 Community Panel #3604970332F. Zone X is an area of minimal flooding. Flood insurance is not required for properties in this zone.
Conclusion: The site is similar to others in the vicinity, and there are no negative external factors. Based on its current use, it is functionally adequate.

PROPERTY DATA
BBG, INC. 57 0118000070
FLOOD MAP Flood Map Panel: 3604970332F

PROPERTY DATA
BBG, INC. 58 0118000070
ASSET PHOTOS BUILDING FAÇADE
REAR OF THE BUILDING

PROPERTY DATA
BBG, INC. 59 0118000070
ENTRANCE
7TH AVENUE

PROPERTY DATA
BBG, INC. 60 0118000070
7TH AVENUE
92ND STREET

PROPERTY DATA
BBG, INC. 61 0118000070
92ND STREET
DRIVEWAY

PROPERTY DATA
BBG, INC. 62 0118000070
DRIVEWAY
ELEVATOR

PROPERTY DATA
BBG, INC. 63 0118000070
STAIRCASE
HALLWAY – FIRST FLOOR

PROPERTY DATA
BBG, INC. 64 0118000070
FIRST FLOOR - INTERIOR
FIRST FLOOR - INTERIOR

PROPERTY DATA
BBG, INC. 65 0118000070
FIRST FLOOR - INTERIOR
SECOND FLOOR - INTERIOR

PROPERTY DATA
BBG, INC. 66 0118000070
SECOND FLOOR - INTERIOR
SECOND FLOOR - INTERIOR

PROPERTY DATA
BBG, INC. 67 0118000070
SECOND FLOOR - INTERIOR
THIRD FLOOR - INTERIOR

PROPERTY DATA
BBG, INC. 68 0118000070
THIRD FLOOR - INTERIOR
THIRD FLOOR - INTERIOR
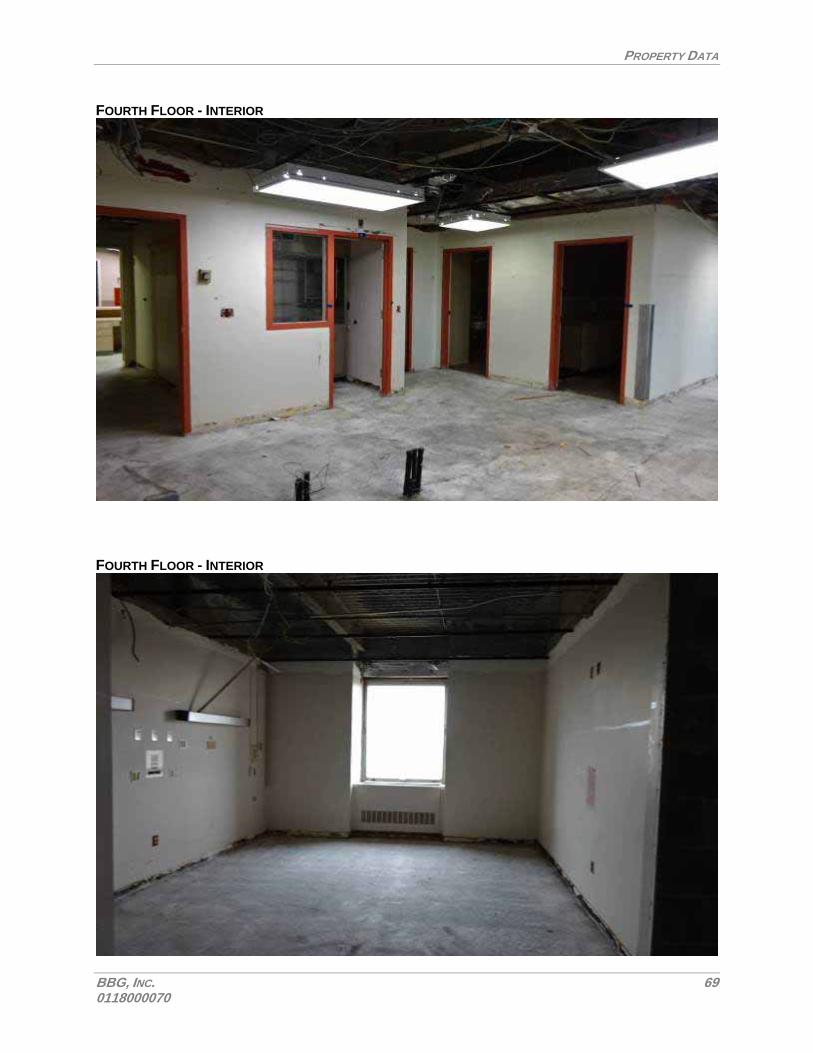
PROPERTY DATA
BBG, INC. 69 0118000070
FOURTH FLOOR - INTERIOR
FOURTH FLOOR - INTERIOR

PROPERTY DATA
BBG, INC. 70 0118000070
FOURTH FLOOR - INTERIOR
FIFTH FLOOR - INTERIOR

PROPERTY DATA
BBG, INC. 71 0118000070
FIFTH FLOOR - INTERIOR
FIFTH FLOOR - INTERIOR

PROPERTY DATA
BBG, INC. 72 0118000070
SIXTH FLOOR - INTERIOR
SIXTH FLOOR - INTERIOR

PROPERTY DATA
BBG, INC. 73 0118000070
SIXTH FLOOR - INTERIOR
SIXTH FLOOR - INTERIOR

PROPERTY DATA
BBG, INC. 74 0118000070
G FLOOR - INTERIOR
G FLOOR - INTERIOR

PROPERTY DATA
BBG, INC. 75 0118000070
G FLOOR - INTERIOR
HVAC

PROPERTY DATA
BBG, INC. 76 0118000070
GAS BOILERS
COOLING TOWER

PROPERTY DATA
BBG, INC. 77 0118000070
AC HANDLER
WATER HEATER

PROPERTY DATA
BBG, INC. 78 0118000070
ROOF
ROOF

PROPERTY DATA
BBG, INC. 79 0118000070
BUILDING DESCRIPTION The subject consists of two lots and four interconnected medical buildings, ranging from one to seven stories, totaling 179,315 sf of gross building area, of which 163,106 sf are net rentable. The site is situated on 51,928 sf of land. The subject is 100% occupied and leased by the Northwell Healthcare Inc. The adjacent block/lot 6094/26 to the north is additional amenity in tenant's lease and offered for off-street parking use. The tenant has signed a 15-year triple net lease (with three additional renewal options) for the property. The tenant has signed a sublease agreement with SUNY Downstate Medical Center. The property was built in 1918. The building is in good condition. LAYOUT The following is a summary of the construction characteristics of the improvements. STRUCTURAL Foundation: The foundation is concrete block.
Structural System: Masonry and structural steel.
Exterior Walls: Brick/masonry.
Roof: The roof appeared to be in good condition, while we recommend a roof certification. There is a cooling tower on the roof.
Windows: Casement windows.
Access: The property has multiple entrances and driveways. The site is accessible from 92nd Street and 7th Avenue.
Parking: There is an adjacent parking lot to the north of the medical office property that is available to park cars.
MECHANICALS Heating/Cooling Systems/Hot water:
There is HVAC system in place for heat and air conditioning. There are gas boilers and water heater for hot water.
Electric: Electric and gas meter is in the mechanical room.
Elevators: Yes
Plumbing: PVC, copper, and black iron.
Sprinklers: Fully sprinkled.

PROPERTY DATA
BBG, INC. 80 0118000070
INTERIOR LAYOUT AND FINISH Basement: The basement contains water heater, gas boiler, HVAC
system, and finished below grade space used for medical office needs.
Stairwells: There are multiple staircases running from the first to the mezzanine level.
Typical Finishes: The property includes 163,106 sf of net rentable area, of which 34,794 sf are in the cellar, 35,727 sf are on the first floor, 25,520 sf are on the second floor, 25,520 sf are on the third floor, 17,367 sf are on the fourth floor, 12,089 sf are on the fifth floor, and 12,089 sf are on the sixth floor.
The allowed uses at the property include
- Emergency services and/or an urgent care center
- Diagnostic imaging
- Ambulatory surgery
- Medical offices
- Centralized medical, administrative, and support services, including but not limited to equipment sterilization, pharmacy, laboratory, offices, locker rooms, and storage
- At Tenant’s option, any State of New York Department of Health approved use under NYCRR Title 10, Article 28.
- It is expected for urgent care facility to be on the lower floor of the building, with the other uses spread throughout the floors of the building.
CONDITION
Based on our inspection, the subject is in good condition, while floor on upper levels are under renovations by the tenant. The tenant is responsible for maintaining the property. The owner has tripled net leased the entire property to Northwell Healthcare, Inc. since 7/1/2017, who is responsible for finishing the space for appropriate use and maintaining the property in optimal condition. The owner did not incur any expenses or charges since the commencement of triple-net lease. There is HVAC system, gas boilers and water heaters that are in good condition; structural systems appear to be in good condition.

PROPERTY DATA
BBG, INC. 81 0118000070
While 699 92nd Street and 9012 7th Avenue 9012 7th Avenue was originally constructed in 1918, we estimate the effective age to be 10 years (given the site improvements), and given a usable life of 60 years, the remaining economic life of the building is 50 years. SUMMARY
The information contained in the sections entitled "Site Description" and "Building Description" was obtained from our field inspection on January 29, 2018, information provided by ownership, and NYC planning, zoning and assessment records.

HIGHEST AND BEST USE
BBG, INC. 82 0118000070
HIGHEST AND BEST USE The following definition of Highest and Best Use is set forth in The Dictionary of Real Estate Appraisal 6th edition sponsored by the Appraisal Institute. Highest and Best Use is:
1. The reasonably probable use of property that results in the highest value. The four criteria that the highest and best use must meet are legal permissibility, physical possibility, financial feasibility, and maximum productivity.
2. The use of an asset that maximizes its potential and that is possible, legally permissible, and financially feasible. The highest and best use may be for continuation of an asset’s existing use or for some alternative use. This is determined by the use that a market participant would have in mind for the asset when formulating the price that it would be willing to bid.
3. The highest and most profitable use for which the property is adaptable and needed or likely to be needed in the reasonably near future.
In determining highest and best use, we have considered the following:
The current trends of supply and demand on the market.
Current zoning regulations and other possible restrictions.
Neighboring land uses.
It is to be recognized that in cases where a site has existing improvements on it, the highest and best use may very well be determined to be different from the existing use. The existing use will continue, however, unless and until land value in its highest and best use exceeds the total value of the property in its existing use. In estimating highest and best use, alternative uses are considered and tested for the subject site. Possible Use - An analysis to determine those uses of the subject which can be deemed
physically possible;
Permissible Use - An investigation into existing zoning regulations, lease terms, and deed restrictions on the site to determine which uses are legally permitted;
Feasibility - An analysis to determine which of those uses deemed possible and legal can provide a net return to the owner of the site;
Highest and Best Use - Among the feasible uses, which use will provide the highest net return or highest present worth.

HIGHEST AND BEST USE
BBG, INC. 83 0118000070
AS VACANT Legally Permissible The parcel is an R4B zoning district, which permits
residential and community uses as of right. No known zoning change is anticipated and there are no public or private deed restrictions that preclude development.
Our analysis of the market indicates that the subject location supports the current zoning. It is our opinion that the site, if vacant, could be developed for the above legally permitted (and assumed) uses
Physically Possible The site is of good size and has good street access. All necessary utilities are available, and there are no apparent easements or encroachments that would hinder development. Its size falls within the range of improved sites in the area and is not considered to restrict the utility of the subject in relation to competing sites. Any of the above legally permitted uses, therefore, are considered physically possible.
Financially Feasible The subject is located within a predominantly mixed-use commercial and community facility use section of its neighborhood where there is a continuing demand for residential and community facility use properties yielding minimal vacancy. Thus, market conditions are such that new market-oriented residential or community use construction is feasible as the value exceeds the cost.
Maximally Productive/Highest and Best Use
All legally permissible, physically possible and financially feasible uses of the site, as vacant, have been presented and examined. In conclusion, it is our opinion that the highest and best use of the subject, as vacant, is community facility use and/or residential development.

HIGHEST AND BEST USE
BBG, INC. 84 0118000070
AS IS Legally Permissible Located in an R4B zoning district, which permits
residential and community use facility uses as of right. In terms of age, condition, size and construction, the subject property conforms to surrounding improvements within the immediate neighborhood.
No known zoning change is currently being considered or anticipated. We are not aware of any public or private deed restrictions that preclude development on the site. Our analysis of the market indicates that the subject location supports the current zoning. It is our opinion that the site, if vacant, could be developed for the above legally permitted (and assumed) uses.
Physically Possible The subject is of good size and has good street access. All necessary utilities are available, and there are no apparent easements or encroachments that would hinder or prevent development. The size falls within the range of improved sites in the area and is not considered to restrict the utility in relation to competing sites. Any of the above legally permitted uses, therefore, are considered physically possible.
Financially Feasible The subject's block is characterized as predominantly mixed-use residential and community facility use. As improved, the subject has the potential to generate net cash flow if leased, and an adequate return to the owners. Therefore, the current use is financially feasible.
Maximally Productive/Highest and Best Use
All legally permissible, physically possible and financially feasible uses of the subject “as is” have been presented and examined. In summary, our opinion is that the highest and best use of the subject property, as improved, is continued use as a medical and office building.

APPRAISAL VALUATION PROCESS
BBG, INC. 85 0118000070
APPRAISAL VALUATION PROCESS In advancing an opinion of the value of the subject, we considered the three primary approaches to real estate valuation: Cost, Income, and Sales Comparison. The Cost Approach is traditionally a good indicator of value when properties being appraised are new or close to new. The subject building was constructed in 1918 and has notable physical and economic depreciation. Difficulty in estimating all forms of accrued depreciation limits the reliability of this approach. This fact tends to make the Cost Approach a less effective and unreliable tool for estimating market value. In addition, the Cost Approach gives only indirect consideration of the income-producing capabilities of a property such as the subject. Real estate investors today give little consideration to the Cost method of estimating value for investment-type properties such as the appraised property. Therefore, we have not applied the Cost Approach. The Income Approach is a strong indicator of value when market rents, vacancy rates, stabilized expenses, capitalization/discount rates are based on reliable market data. In this case, given the depth of the market, there are numerous transactions from which to glean points of analysis, lending credibility to the results of the approach. Further, given community use properties are generally acquired for their capacity to generate a return on and of capital, this is the methodology primarily applied by investors. The Sales Comparison Approach is reliable when few differences exist between the comparable sales and the subject, and the sales data collected is credible and accurate. Similar property types in competitive locations tend to sell within a consistent range, and this factor makes valuation on a per square foot basis a strong predictor of value. Finally, the relative strengths and weaknesses of each approach are discussed, and a final value opinion is offered.

INCOME APPROACH
BBG, INC. 86 0118000070
INCOME APPROACH In the Income Capitalization Approach, a property's capacity to generate future benefits is analyzed; the forecasted income is capitalized into an indication of present value. Commonly used measures of anticipated benefits are: Potential Gross Income: the total potential income attributable to the real property at full occupancy
before operating expenses are deducted. It may refer to the level of rental income prevailing in the market or that contractually determined by existing leases.
Effective Gross Income: the anticipated income from all operations of real property adjusted for vacancy and collection losses.
Net Operating Income: the anticipated net income remaining after all operating expenses are deducted from effective gross income.
Equity Dividend: the portion of net income that remains after debt service is paid; this is returned to the equity position.
Reversion: A lump-sum benefit an investor expects to receive upon the termination of the investment.
DIRECT VS. YIELD CAPITALIZATION
The income capitalization approach supports two methodologies: direct and yield capitalization. Direct capitalization: A method used to convert an estimate of a single year's net operating income
expectancy into an indication of value in one direct step, either by dividing the income estimate by an appropriate rate or by multiplying the income estimate by an appropriate factor. This technique employs capitalization rates and multipliers extracted from sales. Only the first year's income is considered. Yield and value change are implied, but not identified overall. This method is most useful when the property is already operating on a stabilized basis.3
Yield Capitalization: The capitalization method used to convert future benefits into present value by discounting each future benefit at an appropriate yield rate. This method explicitly considers a series of cash flows (net income over a holding period) over time together with any reversion value or resale proceeds. Since this technique explicitly reflects the investment's income pattern, it is especially suited to multi-tenant properties with varying leasing schedules as well as properties that are not
operating at stabilized occupancy.4
CONCLUSION
The subject is fully leased by a single tenant, the Northwell Healthcare, Inc. Given that market oriented leases reflect a level stream of income, it is appropriate to apply the income capitalization method which converts a single year's income into an indication of value.
3 The Appraisal of Real Estate, 14th edition (Chicago, IL: Appraisal Institute 2013): 66 4 The Appraisal of Real Estate, 14th edition (Chicago, IL: Appraisal Institute 2013): 493

INCOME APPROACH
BBG, INC. 87 0118000070
BASE RENTAL INCOME The subject consists of two lots and four interconnected medical buildings, ranging from one to seven stories, totaling 179,315 sf of gross building area, of which 163,106 sf are net rentable. The site is situated on 51,928 sf of land. The subject is 100% occupied and leased by the Northwell Healthcare Inc. The adjacent block/lot 6094/26 to the north is additional amenity in tenant's lease and offered for off-street parking use. The tenant has signed a 15-year triple net lease (with three additional renewal options) for the property. The tenant has signed a sublease agreement with SUNY Downstate Medical Center. The lease commenced in July 2017 with the first year’s annual rent of $6,300,000 and the second year’s annual income of $6,457,500.00. Thus, the annual rent applied is 50% of 2017-2018 period and 50% of 2018-2019 period. The existing rent roll is summarized below: RENT ROLL
Tenant SF
Lease Start
Date Monthly Rent Annual Rent
Rent
PSF Details
Northwell Healthcare, Inc. 163,106 7/1/2017 $531,563 $6,378,750 $39.11 Lease
Expiration:
6/30/2032
incl. parking facility at Block/Lot: 6094 / 26 Taxes: Tenant
112,452 Electric: Tenant
21,673 Insurance: Tenant
21,673 Maint: Tenant
21,673
Rent
Increase:
2.5% annual
increase
21,673
21,673
Other: The tenant is
subleasing
portion of the
space to SUNY
Medical Center
Northwell Health, founded in 1997, is a not-for-profit healthcare network that includes hospitals, The Feinstein Institute for Medical Research, rehabilitation and skilled nursing facilities, a home care network, a hospice network and progressive care centers offering a range of outpatient services. Northwell is an 18-controlled hospital system generating over $10 billion in revenue. In addition to hospitals, physician practices and related healthcare services, the system operates a major research division and labs, among other business lines. Northwell also operates two health insurance companies and has announced plans to close these businesses in 2018. Headquartered in New Hyde Park, New York, Northwell Health is the largest integrated health system in New York State, based on patient revenue, and the 14th largest healthcare system in the United States. Its service area encompasses more than eight million people throughout the New York metropolitan area. With more than 66,000 employees, Northwell is the largest private employer in New York State.

INCOME APPROACH
BBG, INC. 88 0118000070
CREDIT RATING FOR NORTHWELL HEALTH
Moody's Investors Service assigned an A3 rating to Northwell Health's (NY) Taxable Bonds, Series 2017A to be issued in an amount of approximately $1 billion. The expected final maturity is 2047. Moody Investors Service affirmed the A3 rating on $2 billion of outstanding debt. The rating outlook is stable. Assignment and affirmation of the A3 rating reflects Northwell's strong market position across the New York metro area, including very strong market share in certain markets. The A3 is further attributable to the system's modest, but profitable consolidated operating performance, continued market share growth across many of its markets, and demonstrated track record of incorporating acquisitions into the larger system. Additionally, we view the recent decision to exit the health insurance market positively, although we expect further losses before the plans are fully closed. These strengths are balanced against modest balance sheet measures, continued large capital plans, and several large and active pension plans.5 S&P Global Ratings has assigned an "A-" long-term rating to New Hyde Park, N.Y.-based Northwell Health's $500 million of series 2016 bonds. The rating on Northwell reflects its strong enterprise profile, which is anchored by its leading market position in a sizable and diverse service area, coupled with a good financial profile ... [and] stable, albeit modest, operational performance in the past several years, with expectations for continued slightly positive operations in fiscal 2016. The outlook is stable, reflecting S&P's view of Northwell's dominant market position and expansive footprint in the New York metropolitan and Long Island service areas. The tenant pays the set annual rent of $6,378,750, and this annual rent also includes the adjacent parcel to the north 6094 / 26 used for parking by the tenant. In order to determine if the current rent is at market levels, we have surveyed recently leased similar office spaces in the subject’s periphery:
5 https://www.moodys.com/research/Moodys-assigns-A3-to-Northwells-NY-Ser-2017A-Outlook-stable--PR_904193118#

INCOME APPROACH
BBG, INC. 89 0118000070
COMPARABLE RENTALS MAP
COMPARABLE RENTALS
Address Floor Start Date Sq. Ft. Base Rent
1600 Community Drive
Manhasset, NY
North Shore LIJ
Health SystemMar-15 252,000 $38
2313 43rd Street
Brooklyn, NY
Regent Medical
Properties, LLCSep-16 18,752 $28
3857 S Oyster Bay Rd
Bethpage, NY
Charles Evans Health
Services CenterJul-14 10,894 $42
4240 Jericho Turnpike
Syosset, NY
North Shore LIJ
Health SystemApr-15 21,495 $33
5730 64th Street
Brooklyn, NY
Davita New
Chinatown DialysisAug-16 10,500 $39
Min: 10,500 $28
Avg: 62,728 $36
Max: 252,000 $42
Lease Terms
Modified Gross
NNN
NNN / 15-year lease of the entire
building
NNN
NNN / 34 years.
The comparables range from 10,500 to 252,000 square feet with an average of 62,728 square feet. They rent between $28 and $42 per square foot annually with an average of $36 per square foot.

INCOME APPROACH
BBG, INC. 90 0118000070
ADJUSTMENTS TO COMPARABLE SPACE
Time The comparable leases were signed starting Jul-14. The
healthcare market has improved since 2014 and has stabilized as of late. Thus, leases signed in 2014 and 2015 received positive adjustment.
Location The subject is located along in the Sunset Park neighborhood in a mixed-use commercial and community-use neighborhood. All comparables are in similar location, therefore adjustments were not required.
Size Smaller rental spaces tend to rent for more per square foot than large spaces. The comparables range in size from 10,500 to 252,000 square feet of leasable area. The rental activity of large medical/health centers is sparse in the immediate neighborhood; thus, we have included the most recent and proximate rental activity in the office market. The subject currently features 179,315± square feet of leasable area. Comparables 2 through 5 are smaller than the subject and received downward adjustment.
Utility/Condition This adjustment reflects the views, floor location, interior finishes, design, and layout of each comparable to the subject property. The subject is a corner lot with multiple entrances, driveway, and a parking lot. Comparable 2 does not have off-street parking available, thus received upward adjustment. All other comparables are similar in set up.
All comparables are similar in set up – thus did not require any adjustments.
Comparable 5 was in brand new condition, therefore received downward adjustment to account for superior condition.
Lease Terms/Conditions This adjustment reflects leasing conditions and terms. The subject’s single tenant has signed the lease under triple net lease terms, meaning the tenant has agreed to cover full real estate tax liability and all utilities in exchange for lower rent. Comparables 1 through 4 have been singed under triple net lease terms and did not require adjustments. Comparable 5 was signed under modified gross lease terms and received downward adjustment.

INCOME APPROACH
BBG, INC. 91 0118000070
RENT COMPARABLES- ADJUSTED
Rent PSF Time Time Adj. Location Condition Size Utility
Leasing
Terms Total Adj.
Adjusted
Rent PSF
1 $38 5% $40 0% 0% 0% 0% 0% 0% $40
2 $28 0% $28 0% 0% -10% 5% 0% -5% $27
3 $42 10% $47 0% 0% -10% 0% 0% -10% $42
4 $33 5% $34 0% 0% -10% 0% 0% -10% $31
5 $39 0% $39 0% -10% -10% 0% -5% -25% $29
Min: $28 Min: $27
Avg: $36 Avg: $34
Max: $42 Max: $42 RECONCILIATION
The comparables ranged from $28 to $42 per square foot and an average of $36 per square foot. Following adjustments, they ranged from $27 to $42 per square foot with an average of $34 per square foot and a median of $31 per square foot under terms discussed. Based on the subject’s size, layout, condition, and recognizing complimentary use of adjacent excess land to the north of the site, we conclude that the subject’s contract rent of $39.11 per square foot is within market parameters. The subject is leasing under triple net lease terms and reimburses the owner for full real estate tax liability. All other utilities are billed directly to tenant. REAL ESTATE TAX REIMBURSEMENT Real Estate Reimbursement
Tenant Base Year
Current Year
Taxes
Base Year
Taxes Increase
Reimb.
Share
Annual
Reimb.
Northwell Healthcare, Inc. 2013/2014 $1,356,358 - $0 = $1,356,358 x 100.00% = $1,356,358
Total Reimbursement: $1,356,358
VACANCY/COLLECTION LOSS FACTOR
Our review of occupancy rates of comparable buildings (including our comparable sales) indicates an occupancy rate range between 90% and 100%. CoStar submarket analysis shows that Class-C projects reported a vacancy rate of 4.5 % at the end of the third quarter 2017, 4.6% at the end of the second quarter 2017, 4.5% at the end of the first quarter 2017, and 4.3% at the end of the fourth quarter 2016. Based on the subject’s use, good condition, long-term lease with one of the most reliable tenants, Northwell Healthcare, Inc., we have applied a 3% rate for vacancy and collection loss, which considers the lease expiration date of 6/30/2032 and three renewal options extending the term to 49 years. EFFECTIVE GROSS INCOME Commercial Income $6,378,750
RE Tax Reimbursement $1,356,358
Potential Gross Income $7,735,108
Less Commercial V/C Loss @ 3% -$232,053
Effective Gross Income $7,503,055

INCOME APPROACH
BBG, INC. 92 0118000070
OPERATING EXPENSE ANALYSIS The subject property is 100% leased and occupied by a single tenant. The Northwell Healthcare, Inc. lease commenced on 7/1/2017 and since commencement the owner did not incur any expenses. The sponsor-provided 2017 annual income and expense statement shows that expenses for the first six months, with $0.00 charges incurred after Northwell Healthcare, Inc. took over the lease and property. Nevertheless, the owner also incurs minor expenses on the property. The expenses are forecasted on a per square foot basis are based upon a total area of 179,315 square feet. SPONSOR-PROVIDED 2017 STATEMENT Operating Expenses
Real Estate Taxes $660,756
Insurance $72,764
Electric $456,252
Fuel
Water and Sewer
Repairs and Maintenance $151,462
Payroll $126,881
Management Fees
Total Operating Expenses (Excl. Taxes) $813,819
2017
Operating Expenses PSF
Real Estate Taxes $3.68
Insurance $0.41
Electric $2.54
Fuel
Water and Sewer
Repairs and Maintenance $0.84
Payroll $0.71
Management Fees
Total Operating Expenses PSF (Excl. Taxes) $4.54
2017

INCOME APPROACH
BBG, INC. 93 0118000070
PROJECTED OPERATING EXPENSES
Based on our knowledge of similar properties, our operating expense analysis is presented below based on triple-net lease terms: Real Estate Taxes – As stated in the "Assessed Value and Real Estate Taxes" section of the report, the projected real estate taxes for the subject are $1,356,358 or $7.56 per square foot. The real estate tax liability is reimbursed to the owner by the tenant. Insurance – Based on the in-place lease terms the landlord is responsible for this expense. Therefore, we have deferred to historical operating statements and forecast this expense at $0.30 per square foot, which equates to $53,795 annually. Utilities – As a single-tenant triple-net leased building, utilities such as heat, electric, water/sewer charges are billed and paid directly by the tenant and thus no expense is projected. Reserves/Repairs and Maintenance – Based on lease terms, the tenant is responsible for maintenance of the property. Nevertheless, we expect for the landlord to continue to put aside reserves and/or invest in maintaining the structural integrity of the property. Thus, we forecast, the reserves, repair and maintenance expense at $0.25 per square foot of GBA or $44,829 per year. Miscellaneous – We project that the landlord will incur miscellaneous expenses over the stabilized year at $0.25 per square foot of GBA or $44,829 annually. Management and Administration – Typically, management expenses for office spaces range from 1% to 5% of potential gross income. Thus, we project management and administration at 1% of potential gross income, $0.42 per square foot, or $75,031 annually.

INCOME APPROACH
BBG, INC. 94 0118000070
STABILIZED INCOME AND EXPENSES $ PSF
Income
Commercial Income $6,378,750 $35.57
RE Tax Reimbursement $1,356,358 $7.56
Potential Gross Income $7,735,108 $43.14
Less Commercial V/C Loss @ 3% -$232,053 -$1.29
Effective Gross Income $7,503,055 $41.84
Operating Expenses
Real Estate Taxes $1,356,358 $7.56
Insurance $53,795 $0.30
Reserves/ Repairs and Maintenance $44,829 $0.25
Miscellaneous $44,829 $0.25
Management & Administration $75,031 $0.42
Total Operating Expenses $1,574,841 $8.78
Total Expenses Excluding RE Taxes $218,483 $1.22
Net Operating Income $5,928,214 $33.06
Operating Expense Ratio 21%

INCOME APPROACH
BBG, INC. 95 0118000070
INCOME CAPITALIZATION
The method of capitalization employed in this report is the mortgage-equity technique commonly referred to as the Akerson formula of the Ellwood method. This technique considers the return of equity including any potential appreciation or depreciation in property value over the income projection period as well as the effects of financing through mortgage amortization and equity benefits. The following criteria were used to determine the capitalization rate for the subject property. As previously mentioned, yield capitalization measures a single year's anticipated income in order to determine its capital sum by means of an overall capitalization rate. This appropriate rate considers risk, debt, and equity goal requirements. This analysis relies on existing (or projected) income and market expenses in order to determine annual net operating income levels. The net operating income is capitalized to a present market value. Financing Lending institutions typically lend at a 70% to 80% loan to value
ratio. Interest rates, in a recent period of time, ranged from 4.5% to 5.5% with loan terms at five years and with twenty- to thirty-year payout schedules. We projected a 75% loan to value ratio, a 5.00% interest rate, and a 30-year payout. The mortgage constant is 0.0644.
Holding Period Most investors/purchasers intend to hold a property for a period that typically ranges from five to twenty years. We have selected a period of 10 years.
Equity Yield This is a competitive rate of return reflecting the inherent risks, illiquidity, potential benefits, and availability of tax shelter of property ownership relative to prospective rates of return for alternative investment opportunities. Typical investors require a rate of return for investment quality property such as the subject which is greater than the safe or "risk-less" rates offered for long-term treasury notes and bonds or high-grade corporate bonds. The difference between an investor's required rate of return and the safe rate is basically the premium necessary to compensate the investor for the added risks of lack of liquidity offered by a real estate investment.
Survey of Competitive Rates
Federal Funds Rate 1.41%
Prime Rate 4.50%
10-year Treasury Bond 2.35%
30-year Treasury Bond 2.71%
Corporate Bonds (AAA) 2.87%
Municipal Bonds 2.80% Source: Federal Reserve Statistical Release
The Federal Funds Rate is a foundational rate determining the cost of funds by Federal Reserve banks to depository institutions.

INCOME APPROACH
BBG, INC. 96 0118000070
The Prime Rate is a base rate posted by large banks for loans to corporations. It is a rate for business loans to banks' most creditworthy customers. It is no longer a lending rate per se, but a base rate from which other rates are adjusted.
The 10- and the 30-year Treasury Bonds are long-term obligations that are guaranteed by the federal government.
Corporate Bonds with AAA credit exhibit a minimal amount of risk.
Municipal Bonds are free of tax liabilities and, therefore, the return is typically less than investment opportunities which are taxable.
In selecting an appropriate yield rate, we have considered the foregoing yields as well as the property's location, age, and condition relative to competing properties. In the development of the yield rate for the subject property, consideration was given to the risk, liquidity, and the time and expense of asset management inherent with income-producing property investment. The summation approach was utilized to account for yield expectations associated with these investment considerations as applied to a leased fee property. A 3% basic rate was used based on the return exhibited by the rates reflective of a “safe” alternative investment. The safe rate is adjusted for asset management, liquidity, and risk, resulting in a 14.00% equity yield rate.
Two other sources of anticipatory yield rates are provided by the PwC Real Estate and the Real Estate Research Corporations' (R.E.R.C.) investment surveys which summarize expected rates of return, including capitalization rates and income and expense growth rates, from a representative sample of institutional investors. The rates reflect acceptable expectations of yields desired by investors currently in the marketplace. We note that there is no measure of community use facility buildings in the investor surveys. The most appropriate measure was for Medical Office Buildings (PwC) and office buildings (RERC).
Survey Type of Product
PwC National Medical Office 5.75% to 11.00%
Third Quarter 2017 Buildings Market 7.80%
R.E.R.C. National Medical Office 6.30% to 8.20%
Third Quarter 2017 Buildings Market 7.20%
IRR
average
average

INCOME APPROACH
BBG, INC. 97 0118000070
For investment grade office properties, the real estate investment surveys range from 5.75% to 11.00%, with an average discount rate between 7.20% and 7.80%, which supports the built up method indicator. Our equity yield rate is marginally higher than average property yields due to the additional risk associated with the equity position.
Change in Value The subject property is located in a growing residential area. Therefore, we have concluded at an increase of 30% over the holding period.
Using these components, calculation of the capitalization rate is presented: CAPITALIZATION RATE CALCULATION
Loan to value ratio 75%
Interest Rate 5.00%
Term (years payout) 30
Annual Constant 0.0644
Equity Yield Rate 14.00%
Holding Period 10
Appreciation Over Term 30%
Mortgage Funds 0.75 x 0.0644 = 0.0483
Equity Funds 0.25 x 0.1400 = 0.0350
Weighted Rate 0.0833
Less Adjustment for Mortgage Amortization
0.1866 x 0.75 x 0.0517 = 0.00724
Basic Rate 0.0761
Less Adjustment for Appreciation
0.3 x 0.0517 = 0.0155
Capitalization Rate 0.0606
(rounded to) 6.00%
Assumptions Underlying Capitalization Rate Development
Development of Capitalization Rate
The Ellwood method of developing an overall capitalization rate suggests a rate of 6.00%. COMPARABLE OVERALL RATES
Competition for high-quality medical office assets remains strong. The overall U.S. medical office cap rate was 6.8% as of Q1 2017, up slightly from a record low of 6.7% in Q3 2016, but still down by 30 bps year-over-year.' Since mid-2010, medical office cap rates have consistently decreased from a high of 8.3%. The spread between the highest and the lowest regional cap rates

INCOME APPROACH
BBG, INC. 98 0118000070
remained relatively tight during this period, as industry-wide trends have a similar impact across the various markets. These comparatively moderate regional differences are another attractive feature of medical office as an investment class. Because there is demand for health care everywhere, investors are generally more willing to look outside the primary markets compared with traditional office investment, and this is apparent in pricing metrics. Medical office is a resilient sector, able to weather economic downturns and the major political and technological changes that have shaken up the health care industry in recent years. Similarly, sustained demand kept national medical office rents relatively stable throughout the post-recession recovery years, and rents in most of the large markets are now at multi-year highs. Restrained construction activity has helped keep fundamentals strong, with new supply coming on line primarily in response to the need for larger blocks of space and modern buildings capable of accommodating technologically advanced systems.
We analyzed sales of comparable medical and office buildings within the subject’s periphery and they exhibit overall capitalization rates from 5.89% to 6.47% with an average of 6.05%. The PwC Real Estate and Real Estate Research Corporation's investment surveys summarize the expectations of institutional investors. As indicated, the going-in capitalization rates range from 4.75% to 10.00%, with an average between 6.00% and 6.71%. Survey
PwC 4.75% to 10.00%
Third Quarter 2017 6.71%
R.E.R.C. 5.00% to 7.00%
Third Quarter 2017 6.00%
Developed Rate 6.00%
average
Overall Cap Rate
average
CAPITALIZATION RATE CONCLUSION Overall capitalization rates are influenced by numerous factors, of which the most influential are: investors’ perception of risk, the potential for net income growth, and the market for competitive assets. As indicated by the local comparable sales, assets in the submarket tend to trade for going-in returns near the low end of the national range. In terms of its position within the market range, it is our view that an investor would accept a return near the middle of the comparable range. Competition for high-quality medical office assets remains strong. The overall U.S. medical office cap rate was 6.8% as of Q1 2017, up slightly from a record low of 6.7% in Q3 2016, but still down by 30 bps year-over-year.' Since mid-2010, medical office cap rates have consistently decreased from a high of 8.3%. We base our developed capitalization rate on the fact that capitalization rates for New York commercial assets are typically lower than the national average as shown in the comparable cap rate rates above.

INCOME APPROACH
BBG, INC. 99 0118000070
In terms of its position within the market range, it is our view that an investor would accept a return towards the lower end of the direct comparable range. There is a long-term lease in place by the tenant with the strong record of operational performance. Further, the owner has limited expenses. These dynamics reduce the perception of risk and the cap rate an investor would accept. Still, as the subject is projected to derive its income from a market oriented lease, there is limited potential for income spikes. Overall, the subject is in good condition and the property is situated in a desirable location for healthcare and medical office space. SENSITIVITY ANALYSIS
NOI OAR Indicated Value Final Value (RD)
$5,928,214 5.50% $107,785,713 $108,000,000
$5,928,214 5.75% $103,099,377 $103,000,000
$5,928,214 6.00% $98,803,570 $99,000,000
$5,928,214 6.25% $94,851,427 $95,000,000
$5,928,214 6.50% $91,203,295 $91,000,000 The attractive operating conditions in the medical office leasing market have contributed to increased investor confidence in the sector. Though transaction volume decreased in the first quarter, pricing remains competitive and most health care investors expect to see continued demand for medical office product and further cap rate compression this year. Balancing these factors, it is our view that a 6.00% overall rate would be required by an investor. CALCULATION OF VALUE NOI $5,928,214
OAR 6.00%
Indicated Value $98,803,570
Final Value Opinion (RD) $99,000,000 VALUE VIA THE INCOME APPROACH "AS IS" DECEMBER 31, 2017 $99,000,000

SALES COMPARISON APPROACH
BBG, INC. 100 0118000070
SALES COMPARISON APPROACH In the Sales Comparison Approach, an opinion of fair value is advanced by comparing the subject property to transactions of competitive assets. A major premise is the principle of substitution which holds fair value is directly related to the prices of comparable properties as a knowledgeable investor will pay no more for a substitute. The procedure involved in this Approach is to research the market for sales of improved properties which are comparable, select appropriate units of comparison, adjust the sale prices to the subject, and then reconcile the range of adjusted sale prices into an opinion of value. UNIT OF COMPARISON
In order to analyze comparable sales, it is necessary to convert the sale prices to an appropriate unit of comparison, a process which facilitates price comparisons between properties of different sizes, and it also enables adjustment for qualitative differences. Since investors typically purchase community use buildings in terms of value per square foot, we have applied this unit of comparison. COMPARABLE SALES

SALES COMPARISON APPROACH
BBG, INC. 101 0118000070
COMPARABLE SALE 1: 150 PARK AVENUE
SALE NO: 1
LOCATION: 150 Park Avenue
Florham Park, NJ
BLOCK/LOT: 1401 / 1.08
GBA (ABOVE GRADE): 129,400
PROPERTY DESCRIPTION: This is the sale of a Healthcare Facility with 129,400 square feet of gross building
area located in Florham Park, NJ. The property, built in 2016, has square feet of
land. The building most recently sold for $69,600,000. Toledo-based Welltower
acquired a newly delivered medical center from developer Rockefeller Group
Development for $69.6 million. THe property was a BTS for a partnership between
Summit Medical Group (SMG) and the University of Texas MD Anderson Cancer
Center, who in April 2016 had announced the two would open this new location as
an extension of MD Anderson Cancer Center at Cooper in Camden. It is adjacent
to Summit Medical Group's new facility at 140 Park Avenue. There is a parking
ratio of 4.00/1,000 sf.
SALE DATE: December 28, 2017
YEAR BUILT: 2016
GRANTOR: Rock GW, LLC
GRANTEE: EPC Park Avenue LLC
SALE PRICE: $69,600,000
PRICE PER SF: $538
NOI: Not Reported
CAP RATE: Not Reported

SALES COMPARISON APPROACH
BBG, INC. 102 0118000070
COMPARABLE SALE 2: 1200 ROUTE 300 - CRYSTAL RUN HEALTH CARE
SALE NO: 2
LOCATION: 1200 Route 300 - Crystal Run Health Care
Newburgh, NY
BLOCK/LOT: 334600-097-000-0003-006.220-0000334800-004-000-0001-072.200-0000
GBA (ABOVE GRADE): 66,000
PROPERTY DESCRIPTION: This is the sale of a Healthcare Facility with 66,000 square feet of gross building
area located in the Newburgh neigborhood of Newburgh, NY. The property, built in
1946, has 278,784 square feet of land. The building is in contract for sale for
$32,575,000.
SALE DATE: January 31, 2017
YEAR BUILT: 1946
GRANTOR: HP Newburgh 300 LLC
GRANTEE: CRH Realty Viii LLC
SALE PRICE: $32,575,000
PRICE PER SF: $494
NOI: Not Reported
CAP RATE: Not Reported

SALES COMPARISON APPROACH
BBG, INC. 103 0118000070
COMPARABLE SALE 3: 3617 PARSONS BLVD
SALE NO: 3
LOCATION: 3617 Parsons Blvd
Queens, NY
BLOCK/LOT: 5014 / 4
GBA (ABOVE GRADE): 101,640
PROPERTY DESCRIPTION: This is the sale of a Healthcare Facility building with 101,640 square feet of gross
building area located in the Flushing neigborhood of Queens, NY. The property,
built in 1997, has 25,215 square feet of land. The building most recently sold for
$46,921,500. The Benenson Rehabilitation Pavilion is a 10-story rehabilitation
center that features masonry construction and consists of 302 beds. The property
is in R6 zoning district, which allows for 3.0 FAR and the property does not have
air rights.
SALE DATE: August 5, 2015
YEAR BUILT: 1997
GRANTOR: 36-17 Parsons Realty, LLC
GRANTEE: 3617 BH Parsons Realty, LLC
SALE PRICE: $46,921,500
PRICE PER SF: $462
NOI: Not Reported
CAP RATE: Not Reported

SALES COMPARISON APPROACH
BBG, INC. 104 0118000070
COMPARABLE SALE 4: "201 NORTH MOUNTAIN ROAD - THE HARTFORD HEALTHCARE CANCER INSTITUTE"
SALE NO: 4
LOCATION: 201 North Mountain Road -the Hartford Healthcare Cancer Institute
Plainville, CT
BLOCK/LOT: PLAI-000033-A000000-000001
GBA (ABOVE GRADE): 72,022
PROPERTY DESCRIPTION: This is the sale of a Healthcare Facility building with 72,022 square feet of net
leaseable area located in the Plainville neigborhood of Plainville, CT. The
property, built in 2014, has 817,626 square feet of land. The building most recently
sold for $30,250,000. The Hartford Healthcare Cancer Institute initially hit the
market for sale in late October 2016. The property was completed in 2014. The
property was around 95 % leeased to Hartford Healthcare and Orthopedic
Associates of Hartford.
SALE DATE: January 11, 2017
YEAR BUILT: 2014
GRANTOR: North Mountain Land LLC
GRANTEE: DOC-201 North Mountain Road MOB, LLC
SALE PRICE: $30,250,000
PRICE PER SF: $420
NOI: $1,588,125
CAP RATE: 5.25%

SALES COMPARISON APPROACH
BBG, INC. 105 0118000070
COMPARABLE SALES SUMMARY
Address Sale Date SF Sale Price Sale Price Per SF NOI Per SF
1 150 Park Avenue Dec-17 129,400 $69,600,000 $538 N/A
2 1200 Route 300 - Crystal Run Jan-17 66,000 $32,575,000 $494 N/A
3 3617 Parsons Blvd Aug-15 101,640 $46,921,500 $462 N/A
4 201 North Mountain Road -the Jan-17 72,022 $30,250,000 $420 $22
Adjustments for the comparable sales have been considered based on comparison to the subject for financing terms, conditions of sale, market conditions (time), income level (if applicable), location, size, utility, and age/condition. Property Rights Appraised The purpose of this adjustment is to account for differences in
the property rights transferred with the sale. The subject and comparable sales are transactions of the leased fee interest.
Financing Terms The purpose of adjusting for financing terms is to determine cash equivalent sale prices for the comparable sales in accordance with the definition of fair value for this report. All of the sales were reportedly sold all cash to the seller or financed at market rates by a disinterested third party. No adjustment for financing terms was applied.
Conditions of Sale Condition of sale refers to the motivations of the buyer and seller involved in a particular transaction. All sales appear to be arm's length transactions.
Market Conditions (Time) All of the sales were transacted since August 5, 2015. As investor appetite for health care-related real estate has grown, medical office buildings have emerged as the most popular property type within the niche. As yields for traditional real estate asset classes have compressed in recent years, new capital sources—including foreign capital—have entered the medical office sector in search of higher yield and a relatively safe investment alternative. As a result, investment in the U.S. medical office sector increased substantially over the past seven years. Total U.S. investment volume in medical office buildings of at least 10,000 sq. ft. rose from just under $4 billion in 2010 to $10.2 billion in 2016.5 Moreover, total investment in 2016 exceeded the prior annual peak of $7.3 billion in 2006, reflecting increased optimism in medical office and not simply improvement from the Great Recession. Therefore, all sales received upward adjustment.

SALES COMPARISON APPROACH
BBG, INC. 106 0118000070
Location The subject is located in the Sunset Park area of Kings county.
Comparable 4 is in an inferior location and is therefore adjusted up to account for this discrepancy. Specifically, Comparable 4 is in interior Connecticut, which is inferior to the subject in sales activity.
Size This adjustment accounts for the difference in size between each of the comparables and the subject property. The sales range in size from 66,000 to 145,390 square feet, while the subject property is 179,315 square feet. We note that there is an inverse relationship between size and price per square foot, such that smaller buildings will sell for a higher price per square foot and vice versa. The subject and all of the comparables are within a reasonable size range, thus no adjustments are necessary.
Utility This adjustment reflects building height or number of stories, land to building ratio, views, exterior appeal, and the interior finishes, design and layout of each comparable as compared to the subject property. The subject is a single tenant building located on the corner with multiple frontages and without air rights. The subject and all of the comparables have similar utility, thus no adjustments are necessary.
Condition / Tax Exemption The subject building was constructed in 1918 and is in good condition. The property is 100% leased to Northwell Healthcare, Inc. that is responsible for maintaining the property. Comparable 1 and 4 are newly constructed, therefore received downward adjustment.
Comparables sales do not receive real estate tax exemptions.

SALES COMPARISON APPROACH
BBG, INC. 107 0118000070
COMPARABLE SALES ADJUSTMENT GRID Sale No. 1 2 3 4
Address: 150 Park Avenue 1200 Route 300 -
Crystal Run
Health Care
3617 Parsons
Blvd
201 North
Mountain Road -
the Hartford
Healthcare
Cancer Institute
Sale Date: 12/28/2017 1/31/2017 8/5/2015 1/11/2017
No. SF 129,400 66,000 101,640 72,022
Sale Price: $69,600,000 $32,575,000 $46,921,500 $30,250,000
Price Per SF: $538 $494 $462 $420
Property Rights: 0% 0% 0% 0%
Financing Terms: 0% 0% 0% 0%
Conditions of Sale: 0% 0% 0% 0%
Market Conditions (Time): 3% 10% 15% 10%
Trended Price Per SF: $554 $543 $531 $462
Location: 0% 0% 0% 10%
Size: 0% 0% 0% 0%
Utility: 0% 0% 0% 0%
Condition / Tax Exemption: -5% 0% 0% -5%
Total Adjustments: -5% 0% 0% 5%
Adjusted Price Per SF: $526 $543 $531 $485
ADJUSTED
LOW $420 LOW $485
HIGH $538 HIGH $543
AVERAGE $478 AVERAGE $521
MEDIAN $478 MEDIAN $529
UNADJUSTED
RECONCILIATION All adjustments are percentages. A positive adjustment indicates an inferior characteristic to subject. A negative adjustment indicates a superior characteristic to subject. The indicated unadjusted range of the comparable sales is from $420 to $538 per square foot, with an average of $478 and a median of $478 per square foot. After adjustments, the comparable sales exhibited a range between $308 and $543 per square foot with an average of $479 and a median of $526 per square foot. All comparables are good indicators of value, and we have placed equal weight on all sales. Thus, considering the elements of comparison noted above, our opinion of fair value is $525 per square foot; calculated: VALUE PER SQUARE FOOT Concluded Value Per SF $525
SF 179,315
Value $94,140,375
Final Value Opinion (Rounded) $94,000,000 SALES COMPARISON APPROACH "AS IS" DECEMBER 31, 2017 $94,000,000

RECONCILIATION AND FINAL VALUE OPINION
BBG, INC. 108 0118000070
RECONCILIATION AND FINAL VALUE OPINION The estimated values arrived at by the approaches to value used in this report are as follows: Approach Value Date Conclusion
Cost Approach Fair Value "As Is" N/A Not Applied
Income Approach Fair Value "As Is" December 31, 2017 $99,000,000
Sales Approach Fair Value "As Is" December 31, 2017 $94,000,000 The Cost Approach has not been applied. The Income Approach is a strong indicator of value when market rents, vacancy rates, stabilized expenses, capitalization/discount rates are based on reliable market data. In this case, given the depth of the market, there are numerous transactions from which to glean points of analysis, lending credibility to the results of the approach. Further, given community facility use assets are generally acquired for their capacity to generate a return on and of capital, this is the methodology primarily applied by investors. Balancing these factors, most weight is placed on the opinion developed by the Income Approach. The Sales Comparison Approach is reliable when few differences exist between the comparable sales and the subject, and the sales data collected is credible and accurate. Similar property types in competitive locations tend to sell within a consistent range, and this factor makes valuation on a per square foot basis a strong predictor of value. The sales used to advance an opinion of value of the subject property were comparable in most respects and were good indicators of value. However, given the physical and/or locational differences of the comparables, required adjustments were made accordingly. Thus, since the quantitative adjustments were largely drawn from elements of the income approach, investors give this analysis less weight. Therefore, the Sales Comparison Approach is largely used as secondary support for our opinion developed in the application of the Income Approach. Our final value opinion is: Value Date Conclusion
Fair Value "As Is" December 31, 2017 $99,000,000

ADDENDA
ADDENDA LETTER OF ENGAGEMENT
INSURABLE VALUE
CONTINGENT AND LIMITING CONDITIONS
CERTIFICATION
QUALIFICATIONS

ADDENDA
LETTER OF ENGAGEMENT

ADDENDA

ADDENDA
INSURABLE VALUE
Base Unit Cost New PSF $159.00
Add Sprinklers + $3.00
Adjusted Base Unit Cost New PSF $162.00
Current Cost Multiplier 1.06
Height Multiplier 1.00
Local Multiplier x 1.44
Total Multiplier x 1.53
Adjusted Replacement Cost New PSF $247.28
Area x 179,315
Replacement Cost New $44,340,439
Total Replacement Cost New $44,340,439
0.00% $0.00
3.30% $1,463,234.50
0% $0.00
0% $0.00
6.40% $2,837,788.12
0% $0.00
TOTAL EXCLUSIONS 9.70% $4,301,023
$40,039,417
Rounded: $40,000,000
Offices, Medical and Public Buildings - Section 15, Page 17 Class C Good, manual dated February 2017.
Indicated Insurable Value
Exclusions
Excavation
Foundations
Site Improvements
Site Work
Architect’s Fees
Underground Piping

ADDENDA
CONTINGENT AND LIMITING CONDITIONS This appraisal report has been made with the following general assumptions: 1. Any legal description or plats reported herein are assumed to be accurate. Any sketches,
surveys, plats, photographs, drawings or other exhibits are included only to assist the intended user to better understand and visualize the subject property, the environs, and the competitive data. We have made no survey of the property and assume no responsibility in connection with such matters.
2. The appraiser has not conducted any engineering or architectural surveys in connection with this appraisal assignment. Information reported pertaining to dimensions, sizes, and areas is either based on measurements taken by the appraiser or the appraiser’s staff or was obtained or taken from referenced sources and is considered reliable. No responsibility is assumed for the costs of preparation or for arranging geotechnical engineering, architectural, or other types of studies, surveys, or inspections that require the expertise of a qualified professional.
3. No responsibility is assumed for matters legal in nature. Title is assumed to be good and marketable and in fee simple unless otherwise stated in the report. The property is considered to be free and clear of existing liens, easements, restrictions, and encumbrances, except as stated.
4. Unless otherwise stated herein, it is assumed there are no encroachments or violations of any zoning or other regulations affecting the subject property and the utilization of the land and improvements is within the boundaries or property lines of the property described and that there are no trespasses or encroachments.
5. BBG, Inc. assumes there are no private deed restrictions affecting the property which would limit the use of the subject property in any way.
6. It is assumed the subject property is not adversely affected by the potential of floods; unless otherwise stated herein.
7. It is assumed all water and sewer facilities (existing and proposed) are or will be in good working order and are or will be of sufficient size to adequately serve any proposed buildings.
8. Unless otherwise stated within the report, the depiction of the physical condition of the improvements described herein is based on visual inspection. No liability is assumed for the soundness of structural members since no engineering tests were conducted. No liability is assumed for the condition of mechanical equipment, plumbing, or electrical components, as complete tests were not made. No responsibility is assumed for hidden, unapparent or masked property conditions or characteristics that were not clearly apparent during our inspection.
9. If building improvements are present on the site, no significant evidence of termite damage or infestation was observed during our physical inspection, unless so stated in the report. No termite inspection report was available, unless so stated in the report. No responsibility is assumed for hidden damages or infestation.
10. Any proposed or incomplete improvements included in this report are assumed to be satisfactorily completed in a workmanlike manner or will be thus completed within a reasonable length of time according to plans and specifications submitted.

ADDENDA
11. No responsibility is assumed for hidden defects or for conformity to specific governmental requirements, such as fire, building, safety, earthquake, or occupancy codes, except where specific professional or governmental inspections have been completed and reported in the appraisal report.
12. Responsible ownership and competent property management are assumed.
13. The appraisers assume no responsibility for any changes in economic or physical conditions which occur following the effective date of value within this report that would influence or potentially affect the analyses, opinions, or conclusions in the report. Any subsequent changes are beyond the scope of the report.
14. The value estimates reported herein apply to the entire property. Any proration or division of the total into fractional interests will invalidate the value estimates, unless such proration or division of interests is set forth in the report.
15. Any division of the land and improvement values estimated herein is applicable only under the program of utilization shown. These separate valuations are invalidated by any other application.
16. Unless otherwise stated in the report, only the real property is considered, so no consideration is given to the value of personal property or equipment located on the premises or the costs of moving or relocating such personal property or equipment.
17. Unless otherwise stated, it is assumed that there are no subsurface oil, gas or other mineral deposits or subsurface rights of value involved in this appraisal, whether they are gas, liquid, or solid. Nor are the rights associated with extraction or exploration of such elements considered; unless otherwise stated. Unless otherwise stated it is also assumed that there are no air or development rights of value that may be transferred.
18. Any projections of income and expenses, including the reversion at time of resale, are not predictions of the future. Rather, they are our best estimate of current market thinking of what future trends will be. No warranty or representation is made that these projections will materialize. The real estate market is constantly fluctuating and changing. It is not the task of an appraiser to estimate the conditions of a future real estate market, but rather to reflect what the investment community envisions for the future in terms of expectations of growth in rental rates, expenses, and supply and demand. The forecasts, projections, or operating estimates contained herein are based on current market conditions, anticipated short-term supply and demand factors, and a continued stable economy. These forecasts are, therefore, subject to changes with future conditions.
19. Unless subsoil opinions based upon engineering core borings were furnished, it is assumed there are no subsoil defects present, which would impair development of the land to its maximum permitted use or would render it more or less valuable. No responsibility is assumed for such conditions or for engineering which may be required to discover them.
20. BBG, Inc. representatives are not experts in determining the presence or absence of hazardous substances, defined as all hazardous or toxic materials, wastes, pollutants or contaminants (including, but not limited to, asbestos, PCB, UFFI, or other raw materials or chemicals) used in construction or otherwise present on the property. We assume no responsibility for the studies or analyses which would be required to determine the presence or absence of such substances or for loss as a result of the presence of such substances. Appraisers are not qualified to detect such substances. The client is urged to retain an expert in this field.

ADDENDA
21. We are not experts in determining the habitat for protected or endangered species, including, but not limited to, animal or plant life (such as bald eagles, gophers, tortoises, etc.) that may be present on the property. We assume no responsibility for the studies or analyses which would be required to determine the presence or absence of such species or for loss as a result of the presence of such species. The appraiser hereby reserves the right to alter, amend, revise, or rescind any of the value opinions based upon any subsequent endangered species impact studies, research, and investigation that may be provided.
22. No environmental impact studies were either requested or made in conjunction with this analysis. The appraiser hereby reserves the right to alter, amend, revise, or rescind any of the value opinions based upon any subsequent environmental impact studies, research, and investigation that may be provided.
23. The appraisal is based on the premise that there is full compliance with all applicable federal, state, and local environmental regulations and laws unless otherwise stated in the report; further, that all applicable zoning, building, and use regulations and restrictions of all types have been complied with unless otherwise stated in the report; further, it is assumed that all required licenses, consents, permits, or other legislative or administrative authority, local, state, federal and/or private entity or organization have been or can be obtained or renewed for any use considered in the value estimate.
24. Neither all nor any part of the contents of this report or copy thereof, shall be conveyed to the public through advertising, public relations, news, sales, or any other media, without the prior written consent and approval of the appraisers. This limitation pertains to any valuation conclusions, the identity of the analyst or the firm and any reference to the professional organization of which the appraiser is affiliated or to the designations thereof.
25. Although the appraiser has made, insofar as is practical, every effort to verify as factual and true all information and data set forth in this report, no responsibility is assumed for the accuracy of any information furnished the appraiser either by the client or others. If for any reason, future investigations should prove any data to be in substantial variance with that presented in this report, the appraiser reserves the right to alter or change any or all analyses, opinions, or conclusions and/or estimates of value.
26. If this report has been prepared in a so-called “public non-disclosure” state, real estate sales prices and other data, such as rents, prices, and financing, are not a matter of public record. If this is such a “non-disclosure” state, although extensive effort has been expended to verify pertinent data with buyers, sellers, brokers, lenders, lessors, lessees, and other sources considered reliable, it has not always been possible to independently verify all significant facts. In these instances, the appraiser may have relied on verification obtained and reported by appraisers outside of our office. Also, as necessary, assumptions and adjustments have been made based on comparisons and analyses using data in the report and on interviews with market participants. The information furnished by others is believed to be reliable, but no warranty is given for its accuracy.

ADDENDA
27. The American Disabilities Act (ADA) became effective January 26, 1992. The appraiser has not made a specific compliance survey or analysis of the property to determine whether or not it is in conformity with the various detailed requirements of ADA. It is possible that a compliance survey of the property and a detailed analysis of the requirements of the ADA would reveal that the property is not in compliance with one or more of the requirements of the act. If so, this fact could have a negative impact upon the value of the property. Since the appraiser has no direct evidence relating to this issue, possible noncompliance with the requirements of ADA was not considered in estimating the value of the property.
28. This appraisal report has been prepared for the exclusive benefit of the client. It may not be used or relied upon by any other party. Any other party who is not the identified client within this report who uses or relies upon any information in this report does so at their own risk.
29. The dollar amount of any value opinion herein rendered is based upon the purchasing power and price of the United States Dollar as of the effective date of value. This appraisal is based on market conditions existing as of the date of this appraisal.
30. The right is reserved by the appraiser to make adjustments to the analyses, opinions, and conclusions set forth in this report as may be required by consideration of additional or more reliable data that may become available. No change of this report shall be made by anyone other than the appraiser or appraisers. The appraiser(s) shall have no responsibility for any unauthorized change(s) to the report.
31. If the client instructions to the appraiser were to inspect only the exterior of the improvements in the appraisal process, the physical attributes of the property were observed from the street(s) as of the inspection date of the appraisal. Physical characteristics of the property were obtained from tax assessment records, available plans, if any, descriptive information, and interviewing the client and other knowledgeable persons. It is assumed the interior of the subject property is consistent with the exterior conditions as observed and that other information relied upon is accurate.
32. The submission of this report constitutes completion of the services authorized. It is submitted on the condition the client will provide reasonable notice and customary compensation, including expert witness fees, relating to any subsequent required attendance at conferences, depositions, and judicial or administrative proceedings. In the event the appraiser is subpoenaed for either an appearance or a request to produce documents, a best effort will be made to notify the client immediately. The client has the sole responsibility for obtaining a protective order, providing legal instruction not to appear with the appraisal report and related work files and will answer all questions pertaining to the assignment, the preparation of the report, and the reasoning used to formulate the estimate of value. Unless paid in whole or in part by the party issuing the subpoena or by another party of interest in the matter, the client is responsible for all unpaid fees resulting from the appearance or production of documents regardless of who orders the work.
33. Use of this appraisal report constitutes acknowledgement and acceptance of the general assumptions and limiting conditions, special assumptions (if any), extraordinary assumptions (if any), and hypothetical conditions (if any) on which this estimate of fair value is based.
34. If provided, the estimated insurable value is included at the request of the client and has not been performed by a qualified insurance agent or risk management underwriter. This cost estimate should not be solely relied upon for insurable value purposes. The appraisers are not

ADDENDA
familiar with the definition of insurable value from the insurance provider, the local governmental underwriting regulations, or the types of insurance coverage available. These factors can impact cost estimates and are beyond the scope of the intended use of this appraisal. The appraisers are not cost experts in cost estimating for insurance purposes.

ADDENDA
CERTIFICATION I certify that, to the best of my knowledge and belief:
The statements of fact contained in this report are true and correct.
Anthony Legotti and Jon DiPietra made a personal inspection of the property that is the subject of
this report
Jon DiPietra prepared the analysis concerning the real estate that is the subject of this appraisal
report.
Joel Leitner reviewed the analyses, opinions and conclusions concerning the real estate contained in this appraisal report and fully concurs with the final market value conclusion.
Inna Babakulieva assisted in the preparation of this report, conducting research and report
production tasks.
The reported analyses, opinions, and conclusions are limited only by the reported assumptions
and limiting conditions and are my personal, impartial, and unbiased professional analyses,
opinions, and conclusions.
I have no present or prospective interest in the property that is the subject of this report and no
personal interest with respect to the parties involved.
I have not performed a prior appraisal of the subject property within the three-year period
immediately preceding acceptance of this appraisal assignment.
I have no bias with respect to the property that is the subject of this report or to the parties
involved with this assignment.
My engagement in this assignment was not contingent upon developing or reporting
predetermined results.
My compensation for completing this assignment is not contingent upon the development or
reporting of a predetermined value or direction in value that favors the cause of the client, the
amount of the value opinion, the attainment of a stipulated result, or the occurrence of a
subsequent event directly related to the intended use of this appraisal.
My analyses, opinions, and conclusions were developed, and this report has been prepared, in
conformity with the Uniform Standards of Professional Appraisal Practice.
No one provided significant real property appraisal assistance to the person signing this
certification.
The appraisal has been prepared in conformance with Title XI of the Financial Institute Reform, Recovery and Enforcement Act of 1989 (FIRREA), the Uniform Standards of Professional Appraisal Practice (USPAP) as promulgated by the Appraisal Standards Board of the Appraisal

ADDENDA
Foundation, Standards of Professional Appraisal Practice of the Appraisal Institute, the Interagency Appraisal and Evaluation Guidelines dated December 2010.
The use of this report is subject to the requirements of the Appraisal Institute relating to review by
its duly authorized representatives.
As of the date of this report, Joel Leitner and Jon DiPietra have completed the continuing
education program for Designated Members of the Appraisal Institute.
______________________________ ______________________________
Jon DiPietra Joel Leitner, MAI, CRE
Director Managing Director
State Certified General Appraiser #46-46386 State Certified General Appraiser #46-3011
______________________________ _____________________________
Inna Babakulieva Anthony Legotti, CSA-G
Analyst State Certified General Appraiser #46-45471

ADDENDA
QUALIFICATIONS

ADDENDA

ADDENDA

ADDENDA
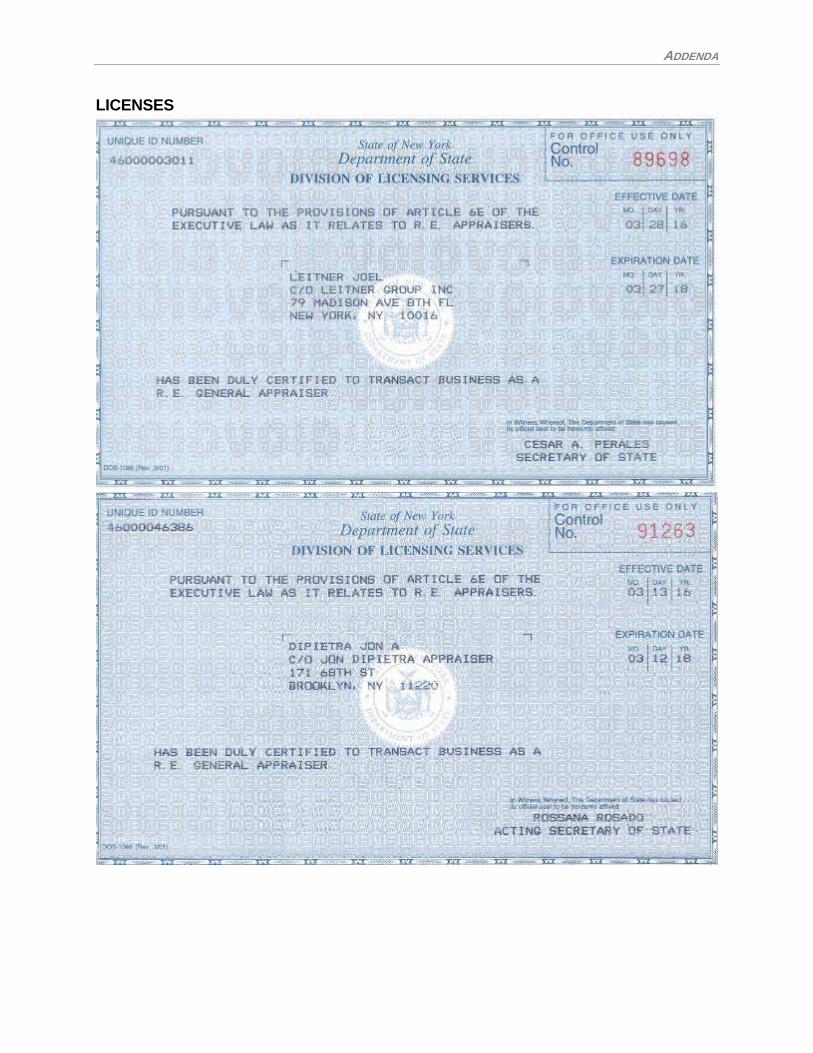
ADDENDA
LICENSES

ADDENDA