European Transition at Twenty
39
Copyright © UNU-WIDER 2010 *European Bank for Reconstruction and Development: [email protected]; [email protected]; [email protected]; [email protected]; [email protected]; [email protected] This study has been prepared for the UNU-WIDER conference Reflections on Transition: Twenty Years after the Fall of the Berlin Wall, directed by Gérard Roland. UNU-WIDER gratefully acknowledges the financial contributions to the research programme by the governments of Denmark (Royal Ministry of Foreign Affairs), Finland (Ministry for Foreign Affairs), Sweden (Swedish International Development Cooperation Agency—Sida) and the United Kingdom (Department for International Development—DFID). ISSN 1798-7237 ISBN 978-92-9230-329-7 Working Paper No. 2010/91 European Transition at Twenty Assessing Progress in Countries and Sectors Erik Berglöf, Lise Bruynooghe, Heike Harmgart, Peter Sanfey, Helena Schweiger, and Jeromin Zettelmeyer* August 2010 Abstract This study gauges the status of transition in the formerly centrally planned economies of Eastern Europe and Central Asia, using a broad approach that compares countries with respect to their business environment, competition, and managerial practices; and assesses transition progress at the level of 13 economic sectors. The largest transition gaps remain in Central Asia and some Eastern European and Western Balkans countries. However, significant reform needs also remain in some Central European and Baltic countries, particularly in energy efficiency, transport, and in the financial sector where regulatory regimes require strengthening and local capital markets need to be developed. Keywords: transition, economic reform, managerial practices, competition, business environment JEL classification: P20, P23, M1, L4
Transcript of European Transition at Twenty

Copyright © UNU-WIDER 2010 *European Bank for Reconstruction and Development: [email protected]; [email protected]; [email protected]; [email protected]; [email protected]; [email protected] This study has been prepared for the UNU-WIDER conference Reflections on Transition: Twenty Years after the Fall of the Berlin Wall, directed by Gérard Roland.
UNU-WIDER gratefully acknowledges the financial contributions to the research programme by the governments of Denmark (Royal Ministry of Foreign Affairs), Finland (Ministry for Foreign Affairs), Sweden (Swedish International Development Cooperation Agency—Sida) and the United Kingdom (Department for International Development—DFID). ISSN 1798-7237 ISBN 978-92-9230-329-7
Working Paper No. 2010/91 European Transition at Twenty Assessing Progress in Countries and Sectors Erik Berglöf, Lise Bruynooghe, Heike Harmgart, Peter Sanfey, Helena Schweiger, and Jeromin Zettelmeyer* August 2010
Abstract
This study gauges the status of transition in the formerly centrally planned economies of Eastern Europe and Central Asia, using a broad approach that compares countries with respect to their business environment, competition, and managerial practices; and assesses transition progress at the level of 13 economic sectors. The largest transition gaps remain in Central Asia and some Eastern European and Western Balkans countries. However, significant reform needs also remain in some Central European and Baltic countries, particularly in energy efficiency, transport, and in the financial sector where regulatory regimes require strengthening and local capital markets need to be developed. Keywords: transition, economic reform, managerial practices, competition, business environment JEL classification: P20, P23, M1, L4

The World Institute for Development Economics Research (WIDER) was established by the United Nations University (UNU) as its first research and training centre and started work in Helsinki, Finland in 1985. The Institute undertakes applied research and policy analysis on structural changes affecting the developing and transitional economies, provides a forum for the advocacy of policies leading to robust, equitable and environmentally sustainable growth, and promotes capacity strengthening and training in the field of economic and social policy making. Work is carried out by staff researchers and visiting scholars in Helsinki and through networks of collaborating scholars and institutions around the world. www.wider.unu.edu [email protected]
UNU World Institute for Development Economics Research (UNU-WIDER) Katajanokanlaituri 6 B, 00160 Helsinki, Finland Typescript prepared by Lorraine Telfer-Taivainen at UNU-WIDER The views expressed in this publication are those of the author(s). Publication does not imply endorsement by the Institute or the United Nations University, nor by the programme/project sponsors, of any of the views expressed.
Acknowledgements
This study is an adaptation of Chapter 5 of the 2009 Transition Report (EBRD 2009). The authors gratefully acknowledge contributions from Elisabetta Falcetti, Utku Teksoz, Stephen Jeffrey, and Natalie Weisshaar.

5
1 Introduction
As Central and Eastern Europe is marking the end of communism and the commencement of the process of transition towards democracy and market economy, it is natural to ask how far they have progressed relative to the objectives set at the time. How different is the transition region still to that of other countries at comparable levels of economic prosperity? Are there major differences within the transition region in this regard? In which countries and sectors, in particular, does the transition agenda remain incomplete? What should be the main priorities for future reforms? An initial answer to these questions is provided by the European Bank for Reconstruction and Development (EBRD) transition indicators; see Figure 1 for the aggregate indicators (including upgrades in 2009) and Table A4 in the Appendix for sector indicators. These indicators assess the progress towards a defined well-functioning market economy. The problem is that the understanding of what is a well-functioning market economy, and how to measure progress towards this objective, has evolved. Moreover, the availability and quality of data, particularly at the micro level has improved tremendously. This study complements the assessment of the transition indicators in three important respects. First, it takes a broad view of transition objectives that emphasises not only market mechanisms and private sector development, but also complementarities between the state and the private sector, and the role and quality of state institutions. Second, as far as the data allow, the analysis emphasises comparisons with countries outside the transition region (the transition indicators are only available for the transition countries in the EBRD region). Finally, and most importantly, the study draws on several new data sources and studies at the sector and firm levels. The analysis begins with a summary of how the concept of transition has evolved since the mid 1990s, and what this implies for transition measurement. It then reviews transition through four perspectives:
• the latest (2008/09) Business Environment and Enterprise Performance Survey (BEEPS IV), which the EBRD and World Bank jointly undertake every three to four years
• a new EBRD-World Bank survey of management practices • a sector-level comparison of competition across countries • a comprehensive analysis of remaining transition challenges across 13 specific
sectors. The concluding section considers whether the transition region is still different to other countries at comparable stages of development, and indicates priorities for future reform.

6
Figure 1
EBRD Transition Indicators
-2
-1
0
1
2
3
4
Cro
atia
Esto
nia
Hun
gary
Latv
ia
Lith
uani
a
Pola
nd
Slov
ak R
ep.
Slov
enia
Alb
ania
Bos
nia
and
Her
z.
Bul
garia
FYR
Mac
edon
ia
Mon
tene
gro
Rom
ania
Serb
ia
Rus
sia
Turk
ey
Arm
enia
Aze
rbai
jan
Bel
arus
Geo
rgia
Mol
dova
Ukr
aine
Kaz
akhs
tan
Kyr
gyz
Rep
.
Mon
golia
Tajik
ista
n
Turk
men
ista
n
Uzb
ekis
tan
-2
-1
0
1
2
3
4
Upgrades Downgrades Average transition score (right axis)
Upgrades Average transition score
CEB SEE Russia Turkey EEC CA
Source: Based on EBRD Transition Indicators.
2 Transition to where?
Since the early 1990s, the word ‘transition’ has been used to describe the evolution from a planned economy to a well-functioning market economy. In the light of the overwhelming role of the state at the start of the process, the questions of what exactly constitutes a well-functioning market economy and what part the state should play in it were initially given less attention. The imperatives were to reduce state ownership and direct state intervention and to build market mechanisms. However, as the transition process and economic thought evolved during the decade, it became increasingly clear that this approach was too simplistic—to the point where it could be misleading as a yardstick for reforms—for two reasons. First, moving from central planning to an ‘optimal’ role of the state is not just a matter of reducing state interference and control, but also involves developing certain state activities. Transition is not just (and perhaps not even primarily) about the size of the state’s ‘footprint’ in the economy, but about where and how the state treads—that is, what the state does to affect economic outcomes and how it attempts to do so. The consensus in the early 1990s was that it was not the business of the state to set prices or directly control or interfere with production and allocation decisions. That remains the overwhelming view. However, in order to function properly, the private sector needs market-supporting public institutions and policies.1 These include: a functioning legal system to enforce contractual obligations; regulation to deal with external effects and incentive problems; safety nets to allay concerns
1 See Besley et al. (2009).

7
about social cohesion; physical and intellectual property rights protection; and competition policy. Second, the quality of institutions emerged as a critical dimension of transition. State institutions with similar objectives—for example, enforcing laws, collecting taxes, or supervising the financial sector—can have vastly different impacts in terms of their effectiveness (whether laws are actually enforced and taxes collected) and the burden that state activities impose on the private sector. The effectiveness of institutions depends on two factors: technical capacity, which is related to information and human capital, and incentives. The latter will depend not only on the design of economic institutions, but also on the political structure and on complementary civil society institutions that promote transparency and accountability. The quality dimension is also important with respect to non-state institutions. Markets do not function well if they are not competitive or there are barriers to entry. Corporations do not function well if corporate governance is poor and minority investors are not protected. In large part, these quality differences are driven by the presence (or absence) and effectiveness of supporting state institutions, such as legal frameworks and competition authorities. However, the functioning of market institutions may also depend on such factors as values, attitudes, and practices. Unwritten rules—for example, on what constitutes acceptable behaviour within a firm or in the political arena by government officials—may be as important in practice as explicit rules. Transition should therefore be about redefining the state as opposed to simply minimizing it, and about improving the quality of state and private institutions and ensuring that they work together well. Defining transition in this way poses significant challenges—or rather it makes challenges that are hidden in simpler definitions of transition explicit.
• If the objective is to redefine the role of the state rather than simply maximize the scope of private activity, there must be a clear idea of what that role should be. Beyond some general principles (identified previously), this is likely to be possible mainly at the level of specific sectors.
• Even at the sector level, it will rarely be possible to define a uniquely ‘optimal’ role of the state. This is due partly to differences in political cultures and traditions. In addition, the desirable role of the state could depend on the quality of state and market institutions. For example, poor state performance in the provision of certain public goods could be an argument for a greater private sector input. Conversely, lack of competition or high barriers to entry could justify a temporarily greater or more heavy-handed role of the state in certain markets.
These challenges both confront a policymaker who is weighing reforms and complicate any attempt to take stock of transition. The following analysis tries to address them in three ways: by characterizing two critical dimensions of institutional quality—the business environment and the quality of managerial practices—that cut across sectors; by taking the analysis to the sector level, focusing on competition, market structure and institutions; and through the methodology of this sector analysis, which accommodates a range of visions of what the sector-level goal of transition should be. Together, these building blocks give a reasonably complete and consistent picture of the status of transition and the challenges ahead.

8
3 Business environment
One way in which the state can enable markets to function properly is by creating a favourable business environment. To understand how far the transition region has come in this respect, and where its stands compared to other countries, this section presents the main results of the BEEPS IV—a survey of perceptions and enterprise operations based on face-to-face interviews with the owners or senior managers of randomly chosen companies.2 Comparisons are drawn with earlier rounds of the survey and with similar recent surveys carried out elsewhere.
3.1 Main obstacles
The main purpose of the BEEPS is to identify problems that affect the operations of enterprises. Many questions in the survey asked respondents to rate the severity of different obstacles to doing business on a five-point scale—0 (no obstacle), 1 (minor obstacle), 2 (moderate obstacle), 3 (major obstacle) or 4 (very severe obstacle)—thereby allowing the construction of simple averages across firms for each obstacle. In addition, owners or managers were given a list of 15 different obstacles in the business environment and asked to identify the biggest one faced by their firm.
Table 1 presents the average score for the 15 obstacles for the whole transition region, as well as for the sub-regions (including Russia and Turkey). It also shows the percentage of firms that considered a given obstacle as the ‘most serious’ facing their operations (using the same regional breakdown). Three obstacles stand out for the region as a whole and across almost all sub-regions. Tax rates is the only obstacle with an average score above 2.0, and also ranks highest among the ‘most serious’ obstacles. While it is not surprising that businesses complain about taxes being too high, it is striking that this outweighs any other obstacle in importance. Political instability is the next highest ranked obstacle according to average score. Unsurprisingly, this features in countries such as Bosnia and Herzegovina, Georgia, Serbia, Turkey, and Ukraine, but also in some less likely countries such as Hungary and Lithuania. The sub-region that emphasises political instability the least is Central Asia, which perhaps reflects the authoritarian nature of the prevailing regimes. Access to finance is also a significant obstacle, with more than 15 per cent of firms identifying it as their biggest problem—even though most firms were surveyed before the full effects of the global financial crisis were felt.
.
2 Earlier rounds of the BEEPS were conducted in 1999, 2002 and 2005, and have been analysed in the EBRD Transition Reports published in those years. BEEPS IV is the most ambitious round to date, covering nearly 12,000 firms in 29 countries of the transition region (compared to around 9,000 firms in 27 countries in 2005). Most interviews were carried out in 2008 or early 2009. Unlike in previous survey rounds, which concentrated mainly on small and medium-sized enterprises, the aim has been to construct a representative sample of all types of company. About 25 per cent of the enterprises in BEEPS IV are large. Virtually all firms in the sample are privately owned (and mostly private from their inception rather than privatised) with only just over 1 per cent still majority state-owned. Firms that were 100 per cent state-owned were not eligible for inclusion in the survey.

9
Table 1 BEEPS IV (2008/09) summary results, by region
Average obstacle score Per cent identifying constraint as ‘most serious’ All
transition countries
CEB
SEE
EEC
Russia
Central
Asia
Turkey
All transition countries
CEB
SEE
EEC
Russia
Central
Asia
Turkey Access to finance 1.5 1.3 1.6 1.7 1.9 1.7 1.0 14.7 11.2 18.5 10.1 16.9 17.6 25.9 Access to land 1.2 0.9 1.0 1.7 2.0 1.3 0.4 2.5 1.7 2.1 4.0 5.7 1.7 0.4 Business licensing and permits 1.3 1.1 1.2 1.3 1.5 1.3 1.4 4.7 3.3 3.4 8.0 8.0 6.7 2.5 Corruption 1.8 1.4 1.8 1.9 2.2 1.8 2.0 6.6 4.6 7.1 8.9 11.2 9.9 2.0 Crime, theft and disorder 1.4 1.3 1.2 1.7 1.9 1.7 0.7 2.8 3.3 3.0 3.7 1.7 1.6 1.0 Customs and trade regulations 0.9 0.6 0.9 1.2 1.0 1.1 0.8 1.9 1.7 1.1 4.5 0.9 2.2 2.0 Electricity 1.6 1.4 1.3 1.7 2.0 1.9 1.1 2.9 3.5 1.6 2.1 2.0 6.7 3.0 Functioning of the judiciary 1.3 1.2 1.4 1.3 1.3 1.2 1.1 2.1 3.7 1.3 1.9 0.2 0.6 0.2 Inadequately educated workforce 1.7 1.5 1.3 1.7 2.4 1.8 1.5 12.0 12.3 14.0 8.0 15.4 9.1 9.1 Labor regulations 0.9 1.2 1.0 0.8 0.9 0.6 0.9 4.2 6.0 4.1 0.9 4.4 1.4 2.0 Political instability 1.9 1.8 1.9 2.0 2.0 1.6 2.5 10.7 9.8 10.0 15.7 8.1 3.0 17.5 Practices of competitors (informal sector ) 1.6 1.4 1.6 1.7 1.3 1.5 1.7 10.5 12.5 8.6 9.2 6.1 9.1 14.7 Tax administration 1.5 1.5 1.5 1.5 1.5 1.4 1.4 4.2 5.8 4.3 3.0 2.2 6.0 0.3 Tax rates 2.2 2.2 1.9 2.2 2.4 2.1 2.4 19.1 19.3 19.3 19.2 17.2 23.3 18.2 Transport 1.2 1.0 0.9 1.3 1.6 1.3 0.9 1.2 1.3 1.7 1.0 0.1 1.2 1.1
Source: Based on BEEPS IV survey, EBRD and World Bank; see text.

10
In other cases, there are larger differences in obstacle ratings across countries and sub-regions. For the transition region as a whole, corruption is viewed as fairly serious (1.7), but more so in Russia (2.2) than in Central Eastern Europe and the Baltic states (CEB, 1.4). Only in Russia did more than 10 per cent of respondents regard corruption as the ‘most serious’ obstacle.3 In contrast, competition from the informal sector is viewed as a relatively minor problem in Russia, but as more serious in most other regions. Lack of education in the workforce is perceived as a major problem in countries that have grown rapidly in recent years, such as Estonia, Romania and Russia.4
For most obstacles—access to finance, access to land, business licensing and permits, corruption, courts, crime, theft and disorder, electricity, workforce, education, and transport infrastructure—Russia, Eastern Europe and the Caucasus (EEC) and Central Asia tend to have higher average obstacle scores than in CEB and South-Eastern Europe (SEE). Since all of these sub-regions contain fast- and slower-growing economies, this finding is likely to reflect broad differences in the quality of infrastructure and institutions rather than differences in the importance that firms attach to particular obstacles. This is confirmed by more objective measures of business obstacles, based on the BEEPS itself5 and on the World Bank’s Doing Business survey (some of the indicators in which overlap conceptually with BEEPS).6
3.2 Comparison over time
How have perceptions of obstacles to doing business changed over time? Figure 2 shows how responses to 11 business environment elements have changed on average since 1999 by plotting the percentage of firms in the latest and previous BEEPS rounds that reported a non-zero score for each obstacle—that is, those seeing the problem as being of at least minor importance for their operations.7 Three interesting findings emerge.
3 The ranking of countries on the corruption score is fairly similar to that of Transparency International (rank correlation coefficient: 0.65). 4 The average scores reported in Table 1 are not adjusted for firm or country characteristics; in particular, whether or not firms or countries have been growing in recent years. As a result, differences in reported obstacles could reflect differences in demand for certain public goods, such as education, in addition to a lack of supply of such goods. See Carlin et al. (2007). 5 Within the BEEPS, there are a number of questions about infrastructure services. For example, respondents are asked about the number of power outages they experienced, and their severity in terms of length and extent of losses caused by them. These answers can then be related to the subjective perceptions as a cross-check on the validity of the latter. 6 This statement applies to the comparison of EEC, Russia and Central Asia on the one hand and CEB and SEE on the other. The correlation of corresponding BEEPS and Doing Business indicators on a country-by-country basis is lower, albeit positive (depending on the indicator, between 0 and 0.5). For the relative merits of objective and subjective indicators of the business environment see Bertrand and Mullainathan (2001), Gelb et al. (2007), and Gaelle and Scarpetta (2004). 7 Focusing on the percentage of firms reporting a non-zero score avoids having to rescale the scores of surveys to achieve comparability over time, in the light of changes in the scale. A rescaled average score would give broadly similar results. The main exception is the variable ‘functioning of the judiciary’ which rises, rather than falls, in the 2008/09 BEEPS round if an average score is used.

11
Figure 2 Business obstacles across time (% of respondents reporting obstacles in 11 areas)
0 10 20 30 40 50 60 70 80 90 100
Transport
Telecommunications
Tax rates
Tax administration
Labour regulations
Functioning of the judiciary
Electricity
Customs and trade regulations
Corruption
Business licence/permits
Access to finance
1999 2002 2005 2008 / 09Percentage of firms reporting in 11 fields
Based on BEEPS IV survey, EBRD and World Bank; see text.
First, there are several categories—customs and trade regulations, functioning of the judiciary, tax administration—where there appears to be a consistent improvement over time. Second, some obstacles—such as tax rates, access to finance, corruption—recorded a significant drop between 1999 and 2002, but have remained more or less the same since then. Lastly, perceived obstacles related to infrastructure—transport, telecommunications, electricity—significantly increased in the latest round compared to the previous two rounds.8 The infrastructure findings may seem surprising, as the EBRD infrastructure reform indicators suggest that there has been continued progress in these areas in recent years. However, a heightened perception of problems could be an indication of a growing economy where firms wishing to expand their operations have run into difficulties that were not binding constraints beforehand. Given the strong growth that the transition region experienced between 2005 and early 2009, it is likely that the demands on infrastructure services grew more rapidly than the supply (even when improving) could cope with.9 This demonstrates the need for continued investment and upgrading of these services across the board.
8 Questions about perceived obstacles to infrastructure were not asked in the 1999 BEEPS round. 9 This conclusion is supported by a detailed analysis by Carlin and Schaffer (2009), summarized in World Bank (2009: Chapter 5).

12
3.3 Comparison across countries
In recent years the World Bank (sometimes in collaboration with other international organizations) has sponsored a wide range of business environment surveys around the world. These differ to some extent from BEEPS, and the timing also varies across countries. However, there is sufficient overlap to allow some comparison to be made about how perceptions of the business climate differ between the transition region and other emerging markets. Is the business environment worse in the transition region than in other regions of similar gross domestic product (GDP) per capita? Indicators based on subjective perceptions are not well suited to answer this question as there may be systematic differences in the propensity of firms to report obstacles across countries.10 Nonetheless, it is possible to come up with a worldwide ranking by constructing an average obstacle score for each country. This suggests that the transition group is not very different, on average, from non-transition developing countries. However, the variation within the transition group is very wide.11 If the transition countries are separated along geographical lines into CEB, SEE and Turkey on the one hand and EEC, Russia, and Central Asia on the other, it turns out that there are statistically significant differences across these two groups. On average, business obstacles in the former are as low as, or lower than, in any other developing country region, while in the latter they are higher than in most regions (see Table 2).
Table 2 BEEPS rankings and mean obstacle score, by country group
Group
Number of countries
Mean rank
Mean score
CEB + SEE + Turkey 17 33 1.27 EEC + Russia + Central Asia 12 49 1.50 Latin America 14 50 1.50 Africa 27 33 1.29 Other1 8 44 1.47 Note: 1Consists of a group of Asian and Middle Eastern countries. Based on BEEPS IV survey, EBRD and World Bank; see text.
Aside from the overall rankings, does the nature of perceived business obstacles still differ between the transition region and non-transition countries? Figures 3(A) and 3(B) plot country mean obstacle scores against purchasing power-adjusted per capita income for eight selected obstacle categories. Transition and non-transition countries are coloured differently, and each group is fitted with a line which shows the relationship between the obstacle score and per capita income. If the obstacle plays a bigger role in the transition region, the line fitted to the transition group will be shifted up from the non-transition line. In the light of the results in Tables 1 and 2, comparisons with non-transition countries are shown for the entire transition group in BEEPS IV—left-hand column—and for the EEC countries, Russia, and Central Asian countries (EEC+R+CA) only—right-hand column.
10 In particular, firms in a generally bad business environment may take a more restrictive view on when to call an obstacle ‘very serious’ compared to those in a generally good environment, so that average obstacle scores may understate differences across countries. 11 This ranges from Estonia (ranked 3rd worldwide) to Ukraine (ranked 73rd out of 76).
13
Figure 3(A) Business obstacles: comparison between transition and non-transition countries
Comparison with all transition countries Comparison with EEC + R + CA Tax rates
0.0
0.5
1.0
1.5
2.0
2.5
3.0
3.5
0 5,000 10,000 15,000 20,000 25,000 30,000 35,000
GDP/cap PPP
Average obstacle
Non-transition countries Transition countries Linear (Non-transition countries) Linear (Transition countries)
0.0
0.5
1.0
1.5
2.0
2.5
3.0
3.5
0 2,000 4,000 6,000 8,000 10,000 12,000 14,000 16,000 18,000
GDP/cap PPP
Average obstacle
Non-transition countries EEC+R+CA Linear (EEC+R+CA) Linear (Non-transition countries)
Access to finance
0.0
0.5
1.0
1.5
2.0
2.5
3.0
3.5
0 5,000 10,000 15,000 20,000 25,000 30,000 35,000
GDP/cap PPP
Average obstacle
Non-transition countries Transition countries Linear (Non-transition countries) Linear (Transition countries)
0.0
0.5
1.0
1.5
2.0
2.5
3.0
3.5
0 2,000 4,000 6,000 8,000 10,000 12,000 14,000 16,000 18,000
GDP/cap PPP
Average obstacle
Non-transition countries EEC+R+CA Linear (EEC+R+CA) Linear (Non-transition countries)
Political instability
0.0
0.5
1.0
1.5
2.0
2.5
3.0
3.5
4.0
0 5,000 10,000 15,000 20,000 25,000 30,000 35,000
GDP/cap PPP
Average obstacle
Non-transition countries Transition countries Linear (Non-transition countries) Linear (Transition countries)
0.0
0.5
1.0
1.5
2.0
2.5
3.0
3.5
4.0
0 2,000 4,000 6,000 8,000 10,000 12,000 14,000 16,000 18,000
GDP/cap PPP
Average obstacle
Non-transition countries EEC+R+CA Linear (EEC+R+CA) Linear (Non-transition countries)
Competitors in the informal sector
0.0
0.5
1.0
1.5
2.0
2.5
3.0
0 5,000 10,000 15,000 20,000 25,000 30,000 35,000GDP/cap PPP
Average obstacle
Non-transition countries Transition countries Linear (Non-transition countries) Linear (Transition countries)
0.0
0.5
1.0
1.5
2.0
2.5
3.0
0 2,000 4,000 6,000 8,000 10,000 12,000 14,000 16,000 18,000
GDP/cap PPP
Average obstacle
Non-transition countries EEC+R+CA Linear (EEC+R+CA) Linear (Non-transition countries)
Source: See text.

14
Figure 3(B) Business obstacles: comparison between transition and non-transition countries
Comparison with all transition countries Comparison with EEC + R + CA Functioning of the judiciary
0.0
0.5
1.0
1.5
2.0
2.5
0 5,000 10,000 15,000 20,000 25,000 30,000 35,000GDP/cap PPP
Average obstacle
Non-transition Transition Linear (Non-transition) Linear (Transition)
0.0
0.5
1.0
1.5
2.0
2.5
0 2,000 4,000 6,000 8,000 10,000 12,000 14,000 16,000 18,000
GDP/cap PPP
Average obstacle
Non-transition EEC+R+CA Linear (EEC+R+CA) Linear (Non-transition)
Crime
0.0
0.5
1.0
1.5
2.0
2.5
0 5,000 10,000 15,000 20,000 25,000 30,000 35,000
GDP/cap PPP
Average obstacle
Non-transition Transition Linear (Non-transition) Linear (Transition)
0.0
0.5
1.0
1.5
2.0
2.5
0 2,000 4,000 6,000 8,000 10,000 12,000 14,000 16,000 18,000
GDP/cap PPP
Average obstacle
Non-transition EEC+R+CA Linear (EEC+R+CA) Linear (Non-transition)
Business licenses and permits
0.0
0.5
1.0
1.5
2.0
2.5
0 5,000 10,000 15,000 20,000 25,000 30,000 35,000
GDP/cap PPP
Average obstacle
Non-transition Transition Linear (Non-transition) Linear (Transition)
0.0
0.5
1.0
1.5
2.0
2.5
0 2,000 4,000 6,000 8,000 10,000 12,000 14,000 16,000 18,000GDP/cap PPP
Average obstacle
Non-transition EEC+R+CA Linear (EEC+R+CA) Linear (Non-transition)
Corruption
0.0
0.5
1.0
1.5
2.0
2.5
3.0
3.5
0 5,000 10,000 15,000 20,000 25,000 30,000 35,000GDP/cap PPP
Average obstacle
Non-transition Transition Linear (Non-transition) Linear (Transition)
0.0
0.5
1.0
1.5
2.0
2.5
3.0
3.5
0 2,000 4,000 6,000 8,000 10,000 12,000 14,000 16,000 18,000
GDP/cap PPP
Average obstacle
Non-transition EEC+R+CA Linear (EEC+R+CA) Linear (Non-transition)
Source: See text.
15
Two facts are worth noting at the outset. First, as expected, the dispersion within the transition economy group is generally quite high—for the most part as high as, or higher than, the dispersion within the 45 non-transition developing countries in the sample. Second, in the transition group as a whole the average obstacle scores are generally negatively correlated with per capita income, although this relationship is reversed in the EEC, Russia, and Central Asia group. Richer countries in this group tend to have higher perceived business obstacles. One possible interpretation for this is that the richer EEC+R+CA countries are large commodity exporters, which tend to have weaker institutions (see EBRD 2009: Chapter 4). Figure 3(A) plots four categories of business obstacles scores—tax rates, access to finance, political instability, competitors in the informal sector—for which there is no statistically significant difference between the non-transition and transition groups (either as a whole or just EEC+R+CA). (The same is true for the categories of transport, customs and trade regulations, and tax administration, which are not shown in the figure.) This suggests that in some areas that reflected high state interference—particularly tax rates, tax administration, customs and trade regulations—the transition region has indeed converged. Tax rates continue to receive a higher average obstacle score in the transition region, particularly in EEC+R+CA, but the difference is no longer statistically significant. Figure 3(B) shows four categories for which there are statistically significant differences with respect to non-transition countries. In the functioning of the judiciary and crime categories this is true for the comparison with the transition group as a whole, but the figure indicates that the differences are driven by higher obstacles in the poorer transition countries, and particularly in EEC+R+CA. (The same pattern arises for the telecommunications, access to land, and workforce education categories, which are not shown on the figure.) In the case of business licenses and permits, only the EEC+R+CA group does significantly worse, on average, than non-transition economies. Lastly, the transition region overall scores significantly better than the non-transition sample on corruption, but there is no statistical difference between the non-transition group and EEC+R+CA. The same is true for electricity as an obstacle (not shown on the figure). To conclude, for the transition region as a whole, the business environment appears to be no worse than in other developing countries. However, there is large heterogeneity within the region. CEB countries tend to have a better business environment than other emerging market regions, while Russia and countries in EEC and Central Asia tend to have weaker environments (despite their lower per capita incomes). In some categories—such as access to land, some infrastructure constraints, workforce education—comparatively high average obstacle scores are a new phenomenon, and are likely to reflect fast recent growth rather than the legacy of central planning. For the most part, however, the weaknesses are in areas in which the transition economies have traditionally lagged, and in which the EEC+R+CA countries continue to lag.
4 Management practices
The previous section has focused on the environment that firms face in their daily operations—but how well are firms managed and organized in the transition region, and how do they compare in this respect to firms in non-transition countries? Recent research suggests that management practices have a strong effect on firm performance. A study of 7,000 medium-sized manufacturing firms across Asia, Europe, North and South America found that there are large differences in management practices across firms as well as countries, and that these practices are strongly associated with firm-level productivity and other performance measures such as profitability and

16
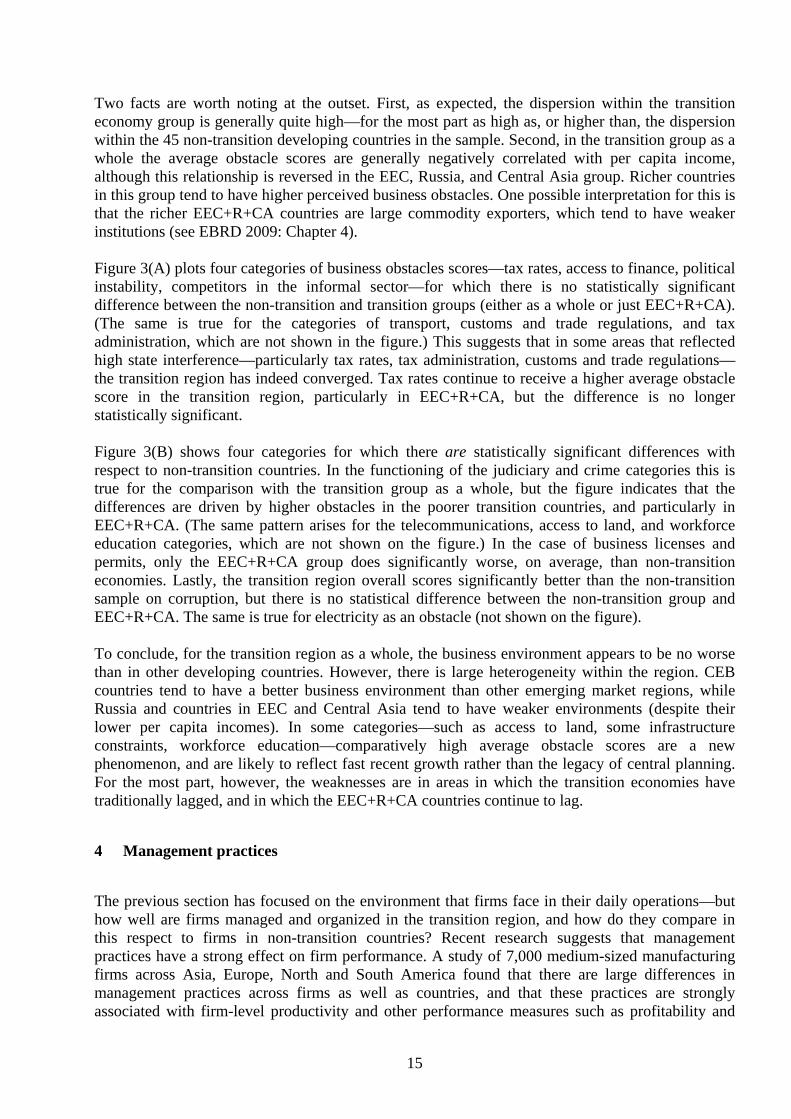
survival rates.12 The USA had the best overall management practices, although Germany, Japan, and Sweden did better in operations management. Multinational firms tended to be well run everywhere, even in developing countries. Importantly, differences in management practices were found to be larger between firms in the same country than across countries, suggesting that firm and sector-specific factors are at least as important as the general business environment in shaping managerial performance. Differences in management practices were found to be related to competition, labour market flexibility, education and also ownership structure (with dispersed ownership being associated with better performance than state- or family-run firms). This section reports on the results of a new Management, Organization and Innovation (MOI) survey that applies this line of research to transition economies for the first time. The survey focused on practices in four core management areas—operations, monitoring, targets and incentives (see Annex 1)—conducting 1,669 face-to-face interviews with factory managers in ten transition countries (Belarus, Bulgaria, Kazakhstan, Lithuania, Poland, Romania, Russia, Serbia, Ukraine, and Uzbekistan) as well as Germany as an advanced country benchmark. It therefore covered a geographically diverse sample that includes the largest transition countries, with a wide variation in transition progress.
4.1 How different is the transition region?
Like previous studies performed in non-transition countries, the MOI survey suggests a strong positive link between management scores and firm performance, as measured by labour productivity, size, sales growth and innovation (for example the introduction of new products). The magnitude of the link can be estimated with econometric techniques: an improvement in an average firm’s management practices from the mid-point (or median) to the top 10 per cent is associated with an 18.3 per cent increase in labour productivity when differences in the country where the firm is located, the firm’s sector and the size of the firm are controlled for.13 The effect is smaller, but still significant, when a range of other factors are accounted for.
The ranking in Figure 4 of surveyed countries in terms of average management practices shows Germany on top and Uzbekistan at the bottom (although this does not mean that Germany has no firms with bad management practices or that Uzbekistan has no good ones). Figure 5 shows that there is a wide spread of management scores in every country. Because of the overlaps in the distribution of management scores across countries, the differences in average scores shown in Figure 5 are often small. Indeed, the average scores of Belarus, Bulgaria, Lithuania, Poland, Serbia, and Ukraine are not statistically significantly different from each other; nor are there statistically significant differences between the average scores of Kazakhstan, Romania, Russia, and Ukraine.
12 See Bloom and Van Reenen (2007, 2010). 13 An increase of this magnitude represents approximately 1 standard deviation in the estimated sample.

17
Figure 4 Average management scores across countries
-0.8 -0.6 -0.4 -0.2 0.0 0.2 0.4 0.6
Uzbekistan
Kazakhstan
Russia
Romania
Ukraine
Belarus
Serbia
Lithuania
Bulgaria
Poland
Germany
Average management score
Source: Based on the MOI survey; see text.
Figure 5 Distribution of firm-level management scores
Belarus Bulgaria
0
0.1
0.2
0.3
0.4
0.5
0.6
0.7
-4 -2 0 2
Management scores
Density
0
0.1
0.2
0.3
0.4
0.5
0.6
0.7
-4 -2 0 2 Management scores
Density
Germany Kazakhstan
0
0.1
0.2
0.3
0.4
0.5
0.6
0.7
-4 -2 0 2 Management scores
Density
0
0.1
0.2
0.3
0.4
0.5
0.6
0.7
-4 -2 0 2 Management scores
Density

18
Lithuania Poland
0
0.1
0.2
0.3
0.4
0.5
0.6
0.7
-4 -2 0 2 Management scores
Density
0
0.1
0.2
0.3
0.4
0.5
0.6
0.7
-4 -2 0 2 Management scores
Density
Romania Russia
0
0.1
0.2
0.3
0.4
0.5
0.6
0.7
-4 -2 0 2 Management scores
Density
0
0.1
0.2
0.3
0.4
0.5
0.6
0.7
-4 -2 0 2Management scores
Density
Source: Based on the MOI survey; see text.
Figure 6 shows country rankings for each of the four sub-components of management practices (operations, monitoring, targets, and incentives). In line with the overall rankings, Germany is in the top three in three out of the four categories, while Uzbekistan is consistently in the bottom two. However, there are also some interesting differences across categories. While many firms interviewed in Belarus and Bulgaria, for example, excel at monitoring—that is, frequently collecting data on several production performance indicators, showing it to factory managers and workers, and regularly reviewing the production performance indicators—they are less adept at translating monitoring into operations. Firms in Belarus also tend to be good at targets management (which is perhaps a legacy of meeting planned production targets). However, this is not the case in Kazakhstan and Uzbekistan. The most eclectic ranking emerges on incentives management, although differences across countries are smaller in this category than in others and often not statistically significant. It is nevertheless striking that Germany and Lithuania join Uzbekistan in the bottom three, perhaps reflecting a continental European management culture that de-emphasises high-powered incentives.

19
Figure 6 Average management scores by sub-component
Source: Based on the MOI survey; see text.
4.2 How different is the transition region?
Although the MOI survey did not include non-transition countries (except for Germany), a broader international comparison is possible using average management scores from related studies of non-transition countries (see Figure 7).14 Two facts are striking. First, six out of the ten transition economies studied in the MOI—Belarus, Bulgaria, Lithuania, Poland, Serbia, and Ukraine—are statistically indistinguishable in terms of average scores from more advanced EU countries such as Greece, Ireland, and Portugal. Second, the remaining transition countries—Kazakhstan, Romania, Russia, Uzbekistan—are at the bottom of the ranking (and below China). 14 See Bloom and Van Reenen (2010). This is a rough and ready comparison as there are methodological differences between the Bloom and Van Reenen (2007, 2010) studies and the MOI survey (see Annex 5.1). The comparison exploits the fact that some of the firms in Germany and Poland participated in both surveys, with relatively high and statistically significant correlations between the management scores across both. The scores from the surveys in non-transition countries were benchmarked to these firms.
Operations Monitoring
-0.8 -0.6 -0.4 -0.2 0 0.2 0.4 0.6
Germany
Poland
Lithuania
Serbia
Bulgaria
Romania
Kazakhstan
Russia
Belarus
Ukraine
Uzbekistan
Average score -0.8 -0.6 -0.4 -0.2 0 0.2 0.4 0.6
Bulgaria
Belarus
Germany
Lithuania
Kazakhstan
Ukraine
Serbia
Russia
Poland
Uzbekistan
Romania
Average score
Targets Incentives
-0.8 -0.6 -0.4 -0.2 0 0.2 0.4 0.6
Belarus
Germany
Ukraine
Poland
Lithuania
Serbia
Bulgaria
Russia
Romania
Kazakhstan
Uzbekistan
Average score -0.8 -0.6 -0.4 -0.2 0 0.2 0.4 0.6
Ukraine
Serbia
Bulgaria
Belarus
Romania
Russia
Poland
Kazakhstan
Germany
Uzbekistan
Lithuania
Average score

20
Like the MOI economies, China was a centrally planned economy during most of its post-war history. However, it started the process of transition to a market-based system at least ten years earlier than those countries in the MOI sample (beginning with an initial set of economic reforms in 1978, followed by a second phase in 1982 aiming to introduce market institutions). China’s better management practices could also be related to foreign direct investment (FDI) and foreign ownership. Previous research15 shows that foreign-owned firms tend to have better management practices than domestically-owned enterprises. While Kazakhstan and Russia (but not Uzbekistan) enjoy considerable FDI, it is mostly concentrated in the natural resources sector rather than in manufacturing. In contrast, FDI in China has targeted the manufacturing industry, potentially benefiting the management practices of a larger set of firms.
Figure 7 Management scores across countries
-0.8 -0.6 -0.4 -0.2 0.0 0.2 0.4 0.6
Uzbekistan
Kazakhstan
Russia
Romania
China*
Greece*
Ukraine
Portugal*
Belarus
Ireland*
Serbia
Lithuania
Bulgaria
Poland
Northern Ireland*
Great Britain*
Italy*
France*
Australia*
Canada*
Japan*
Germany
Sweden*
USA*
Average management Source: Based on the MOI survey; see text.
4.3 Explaining differences across firms
Three factors may help to explain the differences in firm-level management scores.16 First, managers’ self-reported measure of the number of competitors is positively and significantly related to management practices. The importance of competitive intensity in improving productivity and management is a robust finding from a wide range of economic studies. Stronger competition can drive out poorly managed firms, but can also change the behaviour of incumbent managers who have to lift their performance in order to survive and prosper. (Lack of competition may partly explain the relative paucity of well-managed firms in Uzbekistan.) 15 See Bloom and Van Reenen (2007, 2010). 16 See Bloom et al. (2010).

21
Second, ownership matters. Firms belonging to foreign owners from non-transition countries have the best management practices (suggesting that openness to foreign investment is key to spreading best practice) while state-owned firms tend to have the worst. There are at least two possible explanations for this: managers of state-owned firms might have been selected because of political or bureaucratic connections rather than managerial ability; and state-owned firms need to worry less about surviving in the market.17 Lastly, privatized (formerly state-owned) firms have similar management practices to enterprises that were privately owned from the beginning, suggesting that privatization is an effective medium-term means of improvement. Given the importance of privatization in transition countries, this is an encouraging result. Furthermore, the quality of management practices is not significantly associated with the number of years since privatization. This suggests that, while privatization does tend to improve management, the magnitude of improvement over the years probably depends on the new owners.
5 Competition
Having highlighted cross-country differences in the business environment and managerial practices, both within the transition region and compared to benchmarks outside, the remainder of this study focuses on cross-country differences at the sector level, beginning with competition. Previous EBRD research has shown that levels of product market competition in transition economies (measured in terms of average profit mark-ups) have increased substantially since the beginning of the 1990s. However, they remain below the Organization for Economic Cooperation and Development (OECD) average, and there is generally less competition in the EEC+R+CA and SEE countries than in the CEB region.18 However, these cross-country differences cannot necessarily be interpreted in terms of product market regulation or barriers to entry. Some sectors, such as commodities or pharmaceuticals, tend to have intrinsically higher profit mark-ups, and so a proportion of the differences in observed average mark-ups could reflect differences in sector composition. It is therefore important to compare competition measures at the sector level. Table 3 gives a comparison of mark-ups across defined manufacturing sectors based on data from 2005-07 for 25,000 firms in ten transition countries as well as Germany, India, Indonesia, and the United Kingdom.19 The table shows that manufacturing firms in transition economies—even in CEB countries—generally have rather higher profit margins, indicating a lower degree of competition than for firms in Germany or the United Kingdom. However,
17 Previous research found that family-owned firms with non-professional managers were the most poorly managed on average. Interestingly, this does not appear to be the case for family-owned firms in transition countries, perhaps because family-owned firms tend to be relatively young and do not carry the legacy of central planning. 18 See Aghion et al. (2008). 19 Unfortunately, data coverage precludes most CIS countries—either firm-level data are not available or information on sales and costs is missing.

22
Table 3 Competition in the manufacturing sector
Sector average1 Central Europe and the Baltic states SEE Other Comparator countries
Estonia Hungary Latvia Poland Slovenia Bosnia and Herz.
Romania Serbia Turkey Ukraine India Indonesia Germany UK
Food 0.08 0.09 0.08 0.07 0.08 0.08 0.18 0.09 0.09 0.09 0.07 0.09 0.08 0.07 0.08 Beverages 0.12 0.15 0.14 n.a. 0.11 n.a. 0.20 0.12 0.14 n.a. 0.09 0.09 n.a. 0.14 0.15 Tobacco 0.10 n.a. N.a. n.a. 0.08 n.a. n.a. 0.10 0.13 n.a. 0.13 0.10 0.07 0.02 0.10 Textiles 0.12 0.11 0.11 n.a. 0.11 0.07 0.19 0.14 0.13 n.a. 0.09 0.13 0.10 0.08 0.08 Wearing apparel 0.11 0.10 0.09 n.a. 0.08 0.08 0.29 0.14 0.12 n.a. 0.08 0.10 0.07 0.06 0.06 Leather 0.11 0.08 0.10 n.a. 0.10 0.06 0.24 0.13 0.11 n.a. 0.06 0.11 0.06 0.07 0.08 Wood 0.11 0.11 0.13 0.10 0.10 0.10 0.15 0.13 0.10 n.a. 0.08 0.11 0.06 0.08 0.07 Paper 0.10 0.11 0.09 n.a. 0.10 0.10 0.20 0.11 0.11 n.a. 0.10 0.11 0.15 0.09 0.09 Printing 0.13 0.15 0.13 0.16 0.13 0.12 0.24 0.18 0.14 n.a. 0.10 0.17 n.a. 0.12 0.10 Petroleum refineries 0.10 n.a. N.a. n.a. 0.14 n.a. 0.08 0.09 0.11 n.a. 0.05 0.09 n.a. 0.07 0.14 Chemicals 0.11 0.11 0.09 n.a. 0.11 0.10 0.13 0.15 0.11 n.a. 0.06 0.12 0.05 0.09 0.11 Pharmaceutical products
0.14 0.30 0.16 n.a. 0.14 n.a. 0.24 0.17 0.16 n.a. 0.12 0.13 0.06 0.12 0.14
Rubber and plastic 0.11 0.10 0.10 n.a. 0.11 0.14 0.21 0.12 0.11 n.a. 0.08 0.12 0.11 0.08 0.09 Other mineral 0.13 0.16 0.12 n.a. 0.15 0.10 0.22 0.14 0.12 0.15 0.10 0.14 0.19 0.10 0.13 Basic metals 0.09 n.a. 0.09 n.a. 0.08 n.a. 0.13 0.10 0.10 n.a. 0.07 0.10 0.04 0.08 0.09 Fabricated metal 0.11 0.11 0.11 n.a. 0.10 0.14 0.23 0.13 0.13 n.a. 0.08 0.12 0.09 0.09 0.10 Furniture 0.10 0.11 0.08 0.10 0.08 0.15 0.21 0.11 0.11 n.a. 0.08 n.a. 0.09 0.07 0.07 Other manufacturing 0.12 0.17 0.08 n.a. 0.13 0.11 0.30 0.17 0.15 n.a. 0.12 0.11 n.a. 0.10 0.11 All manufacturing mean 0.11 0.11 0.10 0.10 0.10 0.11 0.19 0.12 0.11 0.12 0.08 0.11 0.09 0.09 0.10
standard deviation 0.10 0.09 0.09 0.06 0.08 0.09 0.18 0.10 0.10 0.08 0.07 0.11 0.07 0.08 0.09
Note: 1Indicates the difference between value added and the total wage bill expressed as a share of gross output. The index varies between 0 and 1 with higher values indicating less competition. Source: EBRD staff calculations based on Orbis data.

23
the differences between the CEB countries (and Ukraine) on the one hand and non-transition countries on the other disappear when the comparison is extended to emerging markets such as India. In contrast, profit margins in the three SEE countries (Bosnia and Herzegovina, Romania, and Serbia) are generally higher. There is significant heterogeneity in this comparison: in some sectors, such as pharmaceuticals or rubber and plastics, profit margins are substantially higher in transition countries, while in other sectors, such as food, they are in line with Germany or the United Kingdom (except in the case of Bosnia and Herzegovina). Apart from cross-country differences in average profit margins, Table 3 also shows substantial variation in the degree of competition between manufacturing sectors within a country. Companies operating in Poland face tougher competition if they operate in the food industry than if they produce refined petroleum products. This may reflect differences in barriers to entry, the degree of specialization or research and development (R&D) intensity between these sectors. There are also significant differences in mark-ups in the same sector across countries—from very low in basic metals manufacturing to large in beverage production—suggesting that incumbent market power may play a role in this respect.
Figure 8 Competition in the manufacturing sector
0.00
0.05
0.10
0.15
0.20
0.25
0.30
0.35
0 0.5 1 1.5 2 2.5 3 3.5 4
EBRD Competition Policy Indicator (average 2001-04)
FoodBeveragesTobaccoTextilesWearing apparelLeatherWoodPaperPrintingPetroleum refineriesChemicalsPharmaceutical productsRubber and plasticOther mineralBasic metalsFabricated metalFurnitureOther manufacturingCountry AverageLinear (Country Average)
Lerner index
Sources: Lerner Index calculations based on information from the Orbis dataset; EBRD transition indicators on competition policy (country averages for 2001-04).
Research shows that cross-country differences in mark-ups reflect a variety of factors,20 including stages of development of certain industries. The relatively lower degree of competition in the pharmaceutical industry, for example, might be explained by the comparatively low level of development of this high-technology sector in transition countries (as also evidenced by the low number of registered patents or R&D investments). Differences
20 See Aghion et al. (2008, 2010).

24
in tariffs and trade regimes—including World Trade Organization (WTO) pre-accession reforms—and changes in corporate tax levels also matter, as they influence barriers to entry and therefore competitive pressure on incumbents. A further important determinant of actual product market competition is the efficiency and effectiveness of competition policy. Figure 8 shows that countries that rank higher on the EBRD competition policy indicator do indeed seem to have lower firm mark-ups. This relationship holds true across virtually all manufacturing sectors in the transition region (with the exception of pharmaceuticals, which are not very competitive even if the overall policy environment is conducive to competition).
6 Remaining transition challenges: a sector approach
This section moves from cross-country comparisons to perhaps the most important question posed at the beginning of this study—what are the principal reform and institutional development challenges that remain in transition countries? This can be considered at the sector level using the summary findings of a detailed internal EBRD study, the 2009 Assessment of Remaining Transition Challenges, encompassing 13 specific sectors in 29 countries.21 The study defines a set of transition benchmarks, and measures the gap between where countries stand to date and the ‘end-zone’ of transition in terms of two components:
• market structure—the balance between the private sector and the state and the extent of competition
• market-supporting institutions and policies—the regulatory and policy framework underpinning the functioning of the market in a given sector.
6.1 Report methodology
For every country, each of the 13 sectors was rated on a four-point scale (negligible, small, medium, or large remaining transition challenges) for the two components, and also given an overall rating. Rating the transition challenge in each sector and country involved a four-step process.
• First, for each sector, EBRD economists defined a broad vision of what constitutes good market structure and strong market-supporting institutions. Each was typically defined in terms of three or four criteria related to principles such as efficiency, competition, accountability, transparency and competence.
• Second, a set of indicators was identified to help rate countries on each of these criteria (typically on a 10-point scale), based where possible on data from publicly available sources.
• Third, a scoring and weighting scheme was applied at three levels in order to: generate scores for each of the main three to four criteria underlying the market structure and market-supporting institutions categories; weight these criteria to establish overall market structure and market-supporting institutions ratings; and average these two main components (usually applying 50-50 weights, but with variations—for example, 45-55 or 60-40—in some cases).
21 See Table 5 for a full list of countries and sectors.

25
• Fourth, a judgmental check was applied to ensure tp. hat the interaction between market structure and institutions was appropriately reflected. In some cases this led to modifications in the final rating, particularly where there was a large discrepancy between the two component ratings. When the institutions rating was below the market structure rating, the final score was usually adjusted downward on the presumption that a good supporting institutional framework is critical for the proper functioning of markets.
Table 4 shows an example of the full methodology (except for the judgmental step) in the general industry sector. The weights assigned to the components and criteria are indicated in square brackets.
Table 4 Rating transition challenges in the general industry sector
Components Criteria Data
Market structure [60%]
Market determined prices [20%]
Competitive business environment [40%]
Productivity and efficiency [40%]
- Price liberalization (EBRD Transition Report 2008)
- Subsidies in per cent of GDP (CEIC database, data for 2007)1
- Energy intensity (Enerdata database, data for 2007)2
- MFN trade weighted tariff (World Bank Doing Business Database, data for 2008)
- Lerner index (EBRD calculation from UNIDO statistical database, data for 2006)3
- Large-scale privatization (EBRD Transition Report 2008)
- R&D in per cent of GDP (UNESCO database report on science and technology, data for 2007 and 2006)4
- Value added per employee (UNIDO statistical database, data for 2006)3; (CEIC database, data for 2007)1
- Knowledge Index on Knowledge Economy (World Bank, data for 2008)5
Market-supporting institutions and policies [40%]
Facilitation of market entry and exit [40%]
Enforcement of competition policy [30%] Corporate governance and business standards [30%]
- Doing Business—starting a business (World Bank Doing Business Database, data for 2008)
- Doing Business—closing a business (World Bank Doing Business Database, data for 2008)
- Enterprise surveys—percentage of firms identifying permits and licenses as major constraint6
- Competition index (EBRD Transition Report 2008)
- Quality of legislation in corporate governance (EBRD Legal Transition Team survey 2007)
- ISO 9001 and ISO 14001 (ISO survey 2007)7
Source: Based on EBRD data, see text; 1http://www.ceicdata.com/; 2http://www.enerdata.net/enerdatauk/; 3http://www.unido.org/index.php?id=1000309; 4http://stats.uis.unesco.org/unesco/TableViewer/tableView.aspx?ReportId=1782; 5http://info.worldbank.org/etools/kam2/KAM_page5.asp; 6https://www.enterprisesurveys.org/; 7http://www.iso.org/iso/about/iso_members/iso_member_participation_tc.htm?member_id=1597.

26
A consequence of this approach is that two countries may have similar gaps or challenges, as measured by the value of the overall index, as a result of very different combinations of strengths and weaknesses in market structure and market-supporting institutions and policies. This supports the perception that there is not a unique transition path and that countries can embrace different market models and institutions that deliver outcomes of comparable quality.
6.2 Results
Table 5 shows the assessments made for transition gaps for all sectors and countries. Out of a total of 377 sector/country ratings, there are 284 medium or large challenges as against 93 small or negligible ones. There are just three negligible ratings overall (in general industry in CEB).
• In Central Asia there are large transition gaps in nearly all sectors, while large or medium gaps dominate in EEC, Russia and Turkey. Market development in these countries is seriously hampered by state interference in various sectors, the lack of an adequate legal framework (or its effective implementation) and an unfavourable business environment.
• In SEE there is a mix of small, medium and large challenges (with small challenges prevalent in the two EU countries of Bulgaria and Romania). Despite a gradual alignment of regulation with EU standards, further work is needed in most countries to implement international best practice and strengthen the implementation capacity of regulatory authorities.
• In CEB transition gaps are mainly small, with the exceptions of sustainable energy, transport and financial institutions where medium challenges remain. All countries have aligned their institutional frameworks with EU norms, and the remaining challenges relate mainly to improving efficiency, productivity and competition.
At the sector level, transition gaps are smallest in the corporate group of sectors, with agribusiness, general industry and telecommunications having the highest concentration of small and/or negligible ratings. Within the energy and infrastructure group, the challenges are greatest in sustainable energy and in transport, where 23 and 26 countries face medium and large challenges, respectively. In the financial institutions group 28 and 26 countries have medium and large challenges in the small business finance and private equity and capital markets sectors, respectively. The sections below summarize the results for each of the three broad groups of sectors.

27
Table 5 Assessment of transition challenges by country and sector: summary of results
Corporate Energy and infrastructure Financial institutions Agribusiness General
industry Property and tourism
Telecoms Municipal and environmental infrastructure
Natural resources
Power Sustainable energy
Transport Banking Non-bank financial institutions
MSMEs Private equity and capital markets
Central Europe and the Baltic states 2.00 1.63 2.13 2.00 2.13 2.13 2.13 2.50 2.63 2.13 2.13 2.88 2.75
Croatia 2 2 3 2 3 2 3 3 3 2 2 3 3
Estonia 2 1 2 2 2 2 2 3 2 2 2 3 3
Hungary 2 1 2 2 2 2 2 2 2 2 2 3 2
Latvia 2 2 2 2 2 2 2 3 3 3 2 3 3
Lithuania 2 2 2 2 2 2 2 2 3 2 2 3 3
Poland 2 2 2 2 2 3 2 2 2 2 2 3 2
Slovak Republic 2 1 2 2 2 2 2 3 3 2 2 2 3
Slovenia 2 2 2 2 2 2 2 2 3 2 3 3 3 South-Eastern Europe 3.00 3.00 3.29 2.71 3.00 2.71 3.14 3.14 3.14 2.86 3.00 3.00 3.57
Albania 3 3 3 3 4 3 3 3 4 3 4 3 4
Bosnia and Herzegovina 3 4 4 3 4 3 4 4 3 3 3 3 4
Bulgaria 3 2 3 2 2 2 2 2 3 2 2 3 3
FYR Macedonia 3 3 3 3 3 3 3 3 3 3 3 3 4
Montenegro 3 4 4 3 3 3 4 4 3 3 4 3 4
Romania 3 2 3 2 2 2 2 2 3 3 2 3 3
Serbia 3 3 3 3 3 3 4 4 3 3 3 3 3 Turkey 3 3 2 3 3 3 3 3 3 3 3 3 2 Eastern Europe and the Caucasus 3.17 3.50 3.67 3.33 3.83 3.50 3.50 3.67 3.50 3.50 3.83 3.50 4.00
Armenia 3 3 3 3 3 3 3 3 3 3 4 3 4
Azerbaijan 3 4 4 4 4 3 4 4 3 4 4 4 4
Belarus 4 4 4 4 4 4 4 4 4 4 4 4 4
Georgia 3 3 3 3 4 4 3 3 3 3 4 3 4
Moldova 3 4 4 3 4 3 3 4 4 4 4 3 4
Ukraine 3 3 4 3 4 4 4 4 4 3 3 4 4

28
Russia 3 3 3 3 3 4 3 4 3 3 3 4 3 Central Asia 3.50 4.00 3.83 3.50 4.00 3.83 3.83 4.00 3.83 3.83 3.83 4.00 3.83
Kazakhstan 3 4 3 3 4 4 3 4 3 3 3 4 3
Kyrgyz Republic 3 4 4 3 4 3 4 4 4 4 4 4 4
Mongolia 3 4 4 3 4 4 4 4 4 4 4 4 4
Tajikistan 4 4 4 4 4 4 4 4 4 4 4 4 4
Turkmenistan 4 4 4 4 4 4 4 4 4 4 4 4 4
Uzbekistan 4 4 4 4 4 4 4 4 4 4 4 4 4 EBRD region 2.96 3.04 3.21 2.93 3.25 3.11 3.18 3.39 3.32 3.11 3.21 3.43 3.54
Note: 1 = negligible challenge; 2 = small challenge; 3 = medium challenge; 4 = large challenge. Source: EBRD.

29
6.3 Corporate sectors
The remaining transition challenges in the corporate group of sectors—agribusiness, general industry, telecommunications and property and tourism—are smaller than in the other groups, but medium and large transition gaps remain in all sub-regions other than CEB (see Figure 9).
Figure 9 Transition challenges in the corporate sector
0
1
2
3
4
Agribusiness General industry Property and tourism Telecommunications
CEB SEE Turkey EEC Russia CA
Transition challenge
Source: EBRD.
General industry still faces issues related to the restructuring of sensitive industries (such as shipbuilding in Croatia and chemicals in Poland) and a continued high level of state involvement, which have hampered improvements in efficiency and competition. Hurdles remain particularly in business start-up and bankruptcy procedures, and corporate governance and business standards remain weak. Ukraine’s accession to the WTO should give further impetus to enterprise reform, although close links between business and politics, weak governance and transparency, and significant barriers to market entry and exit remain key challenges for the country. In the telecommunications sector, lack of competition and inadequate tariffs (pricing) have led to an investment backlog in many countries, and, in many cases, deterioration in infrastructure. In the CEB countries the main outstanding challenges relate to the legal framework (for example, intellectual property rights), regulatory capacity and infrastructure. In Central Asia and most EEC countries, challenges are much larger. Many countries still need to liberalize their markets, and penetration rates are generally low. State-owned incumbents hamper competition and commercial incentives and regulation suffers from strong political influence.

30
In the agribusiness sector the development of efficient private farms remains a challenge, particularly in Central Asia and EEC, due to unclear property rights, land fragmentation and the lack of active land markets. State support measures in the meat, dairy products, sugar, and tobacco segments distort the market, while lack of infrastructure contributes to lower yields and prevents countries from realizing their full agricultural potential. Quality and hygiene standards also need to be improved. Clearer ownership rights and simpler procedures for land registration and building permits are critical for a balanced longer term development of the property and tourism sector. Although this sector has witnessed rapid growth in recent years in many countries, investments have been concentrated in the capital cities, leaving regional centers under funded. With the exception of Georgia, the property sectors of nearly all Central Asian and EEC countries remain underdeveloped, endure a difficult business environment, and need further regulatory reform.
6.4 Energy and infrastructure sectors
Remaining transition challenges are concentrated in Central Asia and EEC and particularly in the infrastructure sectors. In CEB and SEE regions the process (or prospect) of EU accession (involving the harmonization of legislation and regulations) has been a key driver of reforms in these countries, leading to greater market conformity and stronger institutions. In Russia large challenges remain in the natural resources and sustainable energy sectors, which are increasingly dominated by state-owned, energy-intensive enterprises (see Figure 10).
Figure 10 Transition challenges in the energy and infrastructure sectors
0
1
2
3
4
MEI Natural resources Power Sustainable energy Transport
CEB SEE Turkey EEC Russia CA
Transition challenge
Source: EBRD.
Key challenges in municipal and environmental infrastructure include improving tariff systems, promoting contractual arrangements that foster commercialization and widening

31
regulatory autonomy. This is applicable particularly to non-EU countries in SEE, where municipal services have been decentralized and corporative but financial performance is still generally weak and private sector participation limited. In Central Asia and EEC financial and operational performance remains poor. There needs to be tariff reform (as water and district heating tariffs barely cover operating costs) and improvements in governance, regulation and transparency of contractual arrangements. In the transport sector the implementation of successful public–private partnerships remains a challenge in CEB, although new efforts are underway in Latvia and the Slovak Republic. Transport operation and policy functions have been separated in the CEB and SEE regions, and road construction and maintenance have generally been contracted out. However, full commercialization of the railways has yet to be achieved and road concession policies and financing arrangements generally remain below EU standards. In Russia, the private sector has played an increasing role in transport services accounting for a major part of port terminal expansion and rail fleet renewal, but the restructuring and commercialization of state-owned entities needs to be addressed. In the Central Asian countries, core railway businesses continue to operate under state control (except in Kazakhstan), and the road sector remains largely unreformed with no private sector participation, limited commercial financing, and a rudimentary institutional framework. In the natural resources sector, breaking the monopoly of largely unreformed and non-transparent state-owned oil and gas companies and improving corporate governance and environmental conduct are key challenges in countries like Azerbaijan, Kazakhstan, Russia, Turkmenistan, and Uzbekistan. In the CEB, SEE and resource-importing EEC countries, remaining challenges include diversifying energy sources and suppliers, granting third-party access to transmission networks, and promoting greater competition and entry into the downstream power supply industry. Coal sector reform is an important outstanding issue in those countries with substantial reserves, such as Poland where a medium transition gap remains. In the power sector, low energy tariffs and slow progress in enterprise restructuring have hampered progress towards energy efficiency across the transition region. In many countries, domestic gas and electricity prices are not cost-reflective and do not provide incentives to use energy efficiently and invest in renewable sources. With the exception of the new EU member states (where liberalization, private sector participation and regulation have advanced), transition challenges in the rest of the EBRD countries of operation remain formidable. Power sectors are still vertically integrated, state-owned, and only partially unbundled. Transmission and distribution losses are high, regulators are not fully independent, there are affordability constraints on tariff reform, and the legal and institutional capacity for implementing sustainable energy initiatives is low. In the light of the implications of global climate change, measuring progress towards meeting energy efficiency targets for countries in the transition region (in terms of institutions, policies and outputs) is increasingly important. The EBRD’s Index of Sustainable Energy (ISE) suggests that 23 transition countries still face medium or large challenges in this area.22 The legacy of central planning in terms of inefficient use of resources is still prevalent, and much remains to be done to improve market structures and supporting institutions to secure energy sustainability.
22 See EBRD (2008b).

32
6.5 Financial institution sectors
Transition challenges in these sectors reflect unfinished financial deepening and capital market development reforms, particularly in Central Asia and EEC. In addition, shortcomings in supervisory and regulatory institutions have been exposed by the global financial crisis, even in CEB countries (see Figure 11).
Figure 11 Transition challenges in the Financial Institution sectors
0
1
2
3
4
Banking Non-banking financialinstitutions
Micro, small and medium-sized enterprises
Private equity and capitalmarkets
CEB SEE Turkey EEC Russia CA
Transition challenge
Source: EBRD.
In the banking sector, the credit boom over the period 2004-08 widened access to finance for many borrowers and broadened the range of available products and services. However, the crisis that engulfed the region from late 2008 revealed the full extent of the remaining transition challenges in terms of supervision, internal bank governance and risk management. With a few exceptions, such as in Poland and the Slovak Republic, bank supervision generally did not effectively address excessive credit growth or foreign currency exposures by unhedged borrowers. In addition, the crisis exposed an excessive concentration of bank assets in a limited number of areas (for example, construction, and real estate and mortgage lending), suggesting that the risk management of banks was less sophisticated than previously thought. In some countries, notably Kazakhstan, the crisis highlighted an over-reliance on wholesale funding. Russia’s fragmented banking sector (with its underdeveloped segments such as mortgages and lending in the more remote regions) was also exposed—although the authorities have initiated a number of regulatory reforms to facilitate mergers and raise capital requirements. For the micro, small, and medium enterprises (MSME) sector, the crisis has shown that the improved access to funding was to some extent the product of the credit boom, and it remains to be seen how the sector recovers after the crisis recedes. In many Central Asian and EEC countries and in Russia, small business lending continues to be hampered by structural

33
impediments. Improved credit information services, better enforcement of bankruptcy laws and the establishment of a central collateral registry are necessary to strengthen lending on a sustainable basis. The non-bank financial institutions sector (incorporating services such as leasing, insurance and asset management) remains underdeveloped. Given the demographic make-up of the transition region, the establishment of privately funded and managed pension systems based on capital accumulation is a central challenge. The problems arising both from cross-border wholesale lending and foreign exchange bank funding (see EBRD 2009: Chapters 2 and 3) have underlined the importance of developing local currency money and bond markets. Only Hungary, Poland, Russia and Turkey have such markets, but there remains scope for making these deeper and more liquid, particularly at longer maturities. Regarding the private equity and capital markets sector, domestic equity markets are generally small and relatively illiquid (with the exception of Hungary, Poland, Russia, and Turkey). In many Central Asian, EEC, and some smaller SEE countries, regional financial integration may make more sense than building domestic securities markets—a strategy already adopted by many of the smaller CEB countries. Private equity has played an important role in firm restructuring and as a source of risk-oriented capital in more advanced transition countries. It could also be an important substitute for public equity markets in less advanced transition countries, but this will require stronger shareholder rights and better corporate governance and accounting practices.
7 Conclusion
This study has analyzed the status of transition from four perspectives: the business environment, competition, managerial practices, and an examination of 13 specific sectors. Although quite different in emphasis, they give rise to a consistent picture. The most striking finding, in all four analyses, is the heterogeneity of the transition region. This impression arises not only when the region is considered on its own, as in the sector assessment of transition challenges, but also in comparison with other regions. In terms of business environment, competition and managerial practices, countries in the CEB region appear at about the same level as large emerging market countries such as China. However, this is not true for transition countries in other regions.
• On average, firms in Eastern Europe and the Caucasus, Russia, and Central Asia rate their business environment as worse than in other emerging market regions (or about the same as that reported by Latin American firms).
• The nature of the main reported obstacles in the EEC+R+CA region is also different, with more complaints about the judiciary, crime, business permits, and workforce education compared to the CEB, SEE and non-transition developing countries. In contrast, the only obstacle that is rated higher in CEB compared to other regions is labour regulations.
• With respect to managerial practices, the Central Asian countries and Russia lag behind not only Western benchmarks but also China, while the CEB countries rate similarly with countries such as Greece, Ireland, and Portugal.

34
• Regarding competition, lack of data precludes sector-level comparisons that include most EEC+R+CA countries. However, data for three SEE countries for the 2001-04 period suggest that these countries lagged behind CEB, Ukraine and other developing country benchmarks.
• Sector-level analyses show small transition gaps in a majority of sectors in CEB countries, medium gaps in Armenia, Georgia, Kazakhstan, Russia and most SEE countries (except Bulgaria and Romania) and predominantly large gaps elsewhere.
In light of these results, the question at the start of this study—of how different the transition region still is to other countries—has no clear-cut answer. It may be more useful to ask how large the group of transition countries still is. The answer will depend on the sector and the aspect of transition that is emphasised. In general, the analysis of this paper indicates that most countries in Central Asia, EEC and SEE still face challenges that distinguish them from other countries at comparable income levels. In contrast, most new EU member states now appear to have more in common with non-transition emerging market countries (or even other EU countries) than with the less advanced transition economies. Even within the group of new EU member states, however, significant transition challenges remain in some sectors. This is particularly so in respect of sustainable energy and energy efficiency, and also the financial sector where regulatory and supervisory regimes require strengthening, small business finance needs to be further improved and local capital markets need to be developed. The large transition gaps in most Central Asian and EEC countries beg the question of why these countries have failed to catch up. EBRD (2009, Chapters 3 and 4) suggests partial answers. Integration into the EU—a powerful motor of reform—has not been an option for some more distant countries. In addition, institutional reform (which facilitates reform more generally) is much more difficult in resource-rich countries. These points may help to explain why the Central Asia-EEC group as a whole has reformed less vigorously and why some countries within the group—such as Armenia or Georgia—have done better. Nonetheless, it remains a puzzle as to why progress in reform in some other countries that do not suffer from a resource curse has remained slow, and why some resource-rich countries have advanced much less than other equally resource-rich peers. A better understanding of these questions will be critical in determining how countries can avoid the ‘low reform trap’ that may compromise their prospects for development far into the future.

35
Appendix 1: Management practices in Eastern Europe and Central Asia
To estimate how firm management practices relate to performance in the MOI survey sample, the following firm-level production function has been devised:
itcitciitcnitckitclitc uZMnkly +++++= 'γβααα where y is the natural logarithm of sales, l the natural logarithm of labor, k the natural logarithm of capital, and n the natural logarithm of intermediate inputs (materials) of firm i in country c at time t. The Zs are a number of other controls that will affect productivity, such as workforce characteristics (employees with a completed university degree and the average weekly hours worked), firm characteristics (firm age and whether it is listed on the stock market), a set of three-digit industry dummies, and country-year (or only country) dummies. M is the variable of interest, average management quality. It is calculated based on a scoring of each of 13 individual management practices, averaged over the variables included in each of the four core areas of management practices, and finally averaged over these four areas (see Annex 5.1 for details). Table A1 summarizes the findings. Column 1 reports an OLS specification with only labor, three-digit industry and country*time dummies as controls. The management score is strongly and statistically significantly associated with higher labour productivity. The magnitude of the effect is comparable with the one reported in previous research.23 Adding further controls—such as workforce, and firm and interviewer characteristics—reduces the coefficient only slightly (column 2). Adding a measure of materials in column 4 almost halves the management coefficient, along with reducing the sample size, but it remains statistically and economically significant. An improvement in an average firm’s management practices from the mid-point (or median) to the top 10 per cent is associated with an increase in productivity of between 6.9 per cent (column 4) and 18.3 per cent (column 1).24 Better management practices are also positively and significantly associated with the likelihood both of introducing new products or services (column 6) and of incidence of spending on R&D (column 7). Nonetheless, little or no evidence was found of a link between management practices and either the percentage of annual sales accounted for by new products and services, or the amount of R&D spending (results not shown). This could possibly reflect greater measurement error in these variables, which are harder for the manager to estimate than incidence.
23 Bloom and Van Reenen (2007). 24 The performance of firms is also positively and significantly associated with most of the underlying 13 management practices as well as all of the four subcomponents of management practices (operations, monitoring, targets and incentives). See Bloom et al (2010).

36
Table A1
Firm performance and management practices
(1) (2) (3) (4) (5) (6) (7) Estimation method OLS OLS OLS OLS OLS Probit Probit Firms All All All All All All All Dependent variable Ln(Y)
Labor productivity
Ln(Y) Labor
productivity
Ln(Y) Labor
productivity
Ln(Y) Labor
productivity
Ln(Y) Sales
New products in last three years?
Research and
development activities in
2007? Management z-score 0.1831*** 0.1400*** 0.1263*** 0.0688** 0.1383*** 0.0462*** 0.0709*** (0.0338) (0.0362) (0.0355) (0.0281) (0.0384) (0.0112) (0.0123) Ln(N) Labor 0.0999*** 0.1571*** -0.0004 -0.2916*** 0.9623*** 0.0379** 0.0783*** (0.0335) (0.0400) (0.0466) (0.0440) (0.0524) (0.0152) (0.0146) Ln(N) Capital 0.1524*** -0.0583** (0.0244) (0.0236) Ln(N) Materials 0.4939*** (0.0271) Country*time effects yes yes yes yes yes no no Country effects no no no no no yes yes Industry effects yes yes yes yes yes yes yes Firm controls no yes yes yes yes yes yes Firms 834 763 761 627 776 1,458 1,405 Observations 3,469 3,193 3,179 2,590 3,321 1,458 1,405 Notes: ***significant at 1 per cent level; **significant at 5 per cent level; *significant at 10 per cent level; In all columns, standard errors are in parentheses under coefficient estimates and allow for heteroscedasticity and serial correlation. Firm controls include natural logs of firm age, average hours worked by production/non-production workers, share of production/non-production workers with a university degree; a dummy variable for stock exchange listing; and a series of ‘noise controls’ that capture differences across managers who responded to the interview and the interview setting. All regressions include a full set of three-digit industry dummies and country dummies interacted with a full set of time dummies (except columns 6 and 7 which use cross sectional data). The dependent variables in columns 6 and 7 are dummy variables that take the value 1 if the firm answers ‘yes’ to the relevant question and 0 otherwise. Source: Estimations based on MOI survey; see text.

37
Appendix 2: Management, Organization and Innovation (MOI) survey
From October 2008 to March 2009 the EBRD conducted the first MOI survey in collaboration with the World Bank. The survey covered almost 1,700 manufacturing firms with between 50 and 5,000 employees in ten transition countries—Belarus, Bulgaria, Kazakhstan, Lithuania, Poland, Romania, Russia, Serbia, Ukraine, and Uzbekistan—and Germany (see Table A2). The sampling frame, from which these firms were picked randomly with equal probability, was based on Bureau Van Dijk’s Orbis database (as available in August 2008) with the exception of Kazakhstan and Uzbekistan, which Orbis does not cover. The sampling frame in Kazakhstan was the official list of establishments obtained from the Agency of Statistics of the Republic of Kazakhstan, and in Uzbekistan the Uniform State Register of Enterprises and Organizations published by the State Department of Statistics of the Republic of Uzbekistan. In Poland and Germany several establishments that participated in a previous survey on management practices25 were re-interviewed as well. All regions within a country had to be covered (with the exception of the far east in Russia) and the percentage of the sample in each region was required to be equal to at least one half of the percentage of the sample frame population in each region. The types of firms taking part in the survey are described in detail in Table A3. The survey was targeted at factory, production or operations managers, who are close to the day-to-day operations of the firm, but are at the same time senior enough to have an overview of management practices.26 Interviews were conducted face-to-face in the manager’s native language by interviewers employed by the market research companies hired to implement the MOI survey. Each interview took on average 50 minutes. The average response rate to the survey was 44 per cent and this appeared to be uncorrelated with productivity or profitability. There was some evidence that larger firms were more likely to respond, which is why the regressions typically control for this variable to offset any potential sample selection bias. In the initial contact with the firm, the interview was introduced as part of a study that would not discuss the firm’s financial position or its accounts, making it relatively non-controversial for managers to participate. The questionnaire comprised seven sections organized by topic. The first asked questions about the characteristics of the firm, such as legal status, ownership and number of years in operation. This was followed by sections on management practices, organization of the firm, innovation and R&D, degree of competition, and also labour. Data on the location and size of the firm, interview start and end times, and interviewer and interviewee characteristics were also collected. The MOI questionnaire was developed and tested in two pilot surveys prior to its implementation in the field. The concept of ‘good’ or ‘bad’ management needs to be translated into a measure applicable to different firms across the manufacturing sector. In contrast to previous questionnaires on
25 See Bloom and Van Reenen (2010). 26 Factory managers are usually responsible for the efficient operation, maintenance and budgetary control of production. Production/operations managers ensure that goods are produced efficiently, at the right quality, quantity and cost, and that they are produced on time.

38
management practices, the MOI survey consisted mostly of closed-ended questions,27 in which the options offered to interviewees were based on the most common responses from previous surveys. Management practices were grouped into four areas: operations (one question), monitoring (seven questions), targets (two questions) and incentives (three questions). The operations question focused on how the establishment handled a process problem, such as machinery breakdown. The monitoring questions covered collection, monitoring, revision and use of production performance indicators. The targets questions focused on the time-scale and realism of production targets, and the incentives questions covered promotion criteria, practices for addressing poor employee performance, and rewarding production target achievement. As the scaling varied across management practices, the scores were converted to z-scores by normalizing each practice (that is, question) to mean zero and standard deviation 1. To avoid putting the most emphasis on the monitoring aspect of management practices, the unweighted average was first calculated across z-scores for a particular area of the four management practices. An unweighted average was then taken across the scores for the four practices, and finally a z-score of the measure obtained was calculated.28 This means that the average management practices across all firms in all countries in the sample are equal to zero, and the actual management practices of the firm deviate from zero either to the left (‘bad’ practices) or to the right (‘good’ practices). Firm-level performance data—balance sheets and income and loss statements—were obtained from Bureau Van Dijk’s Orbis database for the countries covered and matched to the sample of completed interviews. The MOI questionnaire and full dataset are published on the EBRD’s web site www.ebrd.com.
27 Closed-ended questions have a finite number of answers—for example: ‘Are employees promoted on merit?’ [yes/no]—while an open-ended question has no set of pre-defined answers (for example: ‘How are employees promoted?’). 28 This is an accepted way of calculating index numbers—see Bresnahan et al. (2002).
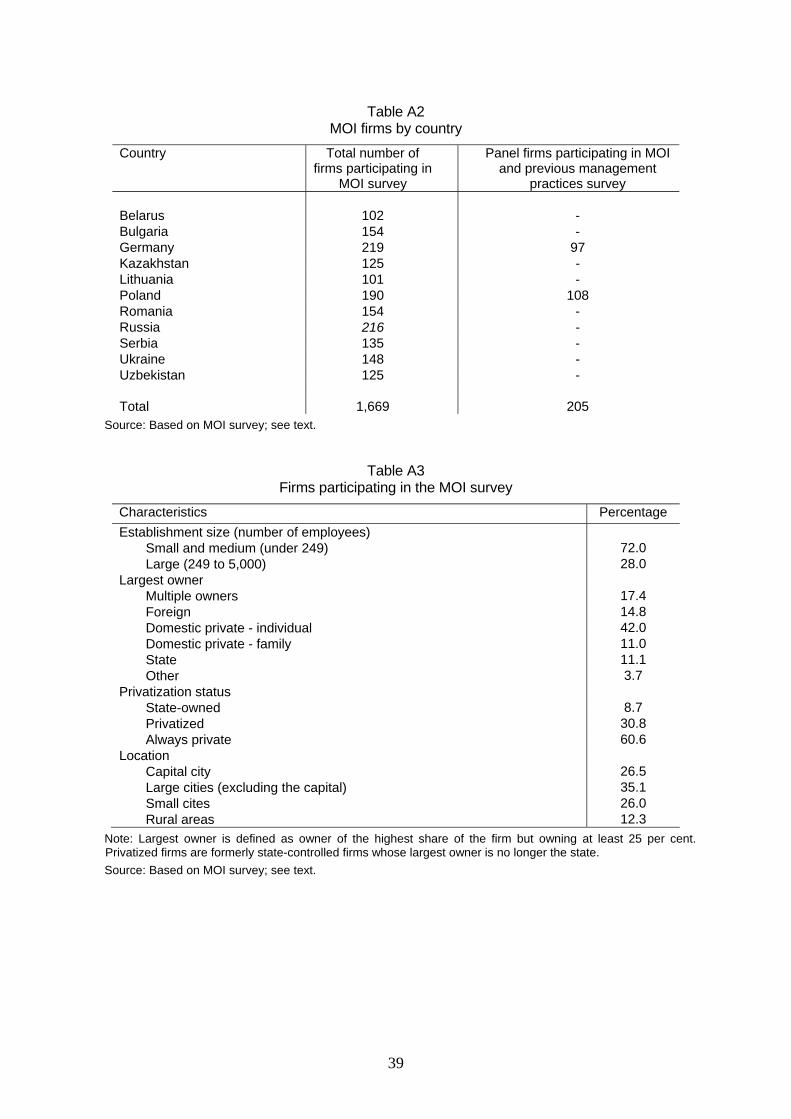
39
Table A2 MOI firms by country
Country Total number of firms participating in
MOI survey
Panel firms participating in MOI and previous management
practices survey Belarus 102 - Bulgaria 154 - Germany 219 97 Kazakhstan 125 - Lithuania 101 - Poland 190 108 Romania 154 - Russia 216 - Serbia 135 - Ukraine 148 - Uzbekistan 125 - Total 1,669 205
Source: Based on MOI survey; see text.
Table A3
Firms participating in the MOI survey Characteristics Percentage Establishment size (number of employees)
Small and medium (under 249) 72.0 Large (249 to 5,000) 28.0
Largest owner Multiple owners 17.4 Foreign 14.8 Domestic private - individual 42.0 Domestic private - family 11.0 State 11.1 Other 3.7
Privatization status State-owned 8.7 Privatized 30.8 Always private 60.6
Location Capital city 26.5 Large cities (excluding the capital) 35.1 Small cites 26.0 Rural areas 12.3
Note: Largest owner is defined as owner of the highest share of the firm but owning at least 25 per cent. Privatized firms are formerly state-controlled firms whose largest owner is no longer the state. Source: Based on MOI survey; see text.

40
References
Aghion, P., H. Harmgart, and N. Weisshaar (2008). ‘Fostering Growth in Transition Economies’, EBRD Transition Report 2008: Chapter 3, 49-63, European Bank for Reconstruction and Development: London.
Aghion, P., H. Harmgart, and N. Weisshaar (2010). ‘Competition and Growth in Emerging Markets: Firm-Level Evidence’, mimeo.
Bertrand, M., and S. Mullainathan (2001). ‘Do People Mean What They Say? Implications for Subjective Survey Data’, American Economic Review, 91(2): 67-72.
Besley, T., M. Dewatripont, and S. Guriev (2009). Transition and Transition Impact. A Review of the Concept and Implications for the EBRD, report prepared for the European Bank for Reconstruction and Development, available at: http://www.ebrd.com/pages/research/publications/essay/besley.shtml.
Bloom, N., and J. Van Reenen (2007). ‘Measuring and Explaining Management Practices Across Firms and Countries’, Quarterly Journal of Economics, 122(4): 1351-408.
Bloom, N., and J. Van Reenen (2010). ‘Why Do Management Practices Differ Across Firms and Countries?’, Journal of Economic Perspectives, 24(1): 203-24.
Bloom, N., H. Schweiger, and J. Van Reenen (2010). ‘Management Practices in Transition Countries’, mimeo.
Bresnahan, T., E. Brynjolfsson, and L. Hitt (2002). ‘Information Technology, Workplace Organisation, and the Demand for Skilled Labor: Firm-Level Evidence’, Quarterly Journal of Economics, 117(1): 339-76.
Carlin, W., M. Schaffer, and P. Seabright (2007). ‘Where are the Real Bottlenecks? Evidence from 20,000 Firms in 60 Countries about the Shadow Costs of Constraints to Firm Performance’, Institute for the Study of Labor Discussion Papers, No. 3059.
Carlin, W., and M. Schaffer (2009). ‘Public Infrastructure Constraints on Growth in the Transition Economies: The Legacy of Communism and Evidence from Enterprise Surveys 1999–2008’, Background Paper, World Bank: Washington DC.
EBRD (1999). Transition Report 1999: Ten Years of Transition, European Bank for Reconstruction and Development: London.
EBRD (2008a). Transition Report 2008: Growth in Transition, European Bank for Reconstruction and Development: London.
EBRD (2008b). Securing Sustainable Energy in Transition Economies, European Bank for Reconstruction and Development: London.
EBRD (2009). Transition Report 2009: Transition in Crisis?, European Bank for Reconstruction and Development: London.
Gaelle, P., and S. Scarpetta (2004). ‘Employment Regulations Through the Eyes of Employers: Do They Matter and How Do Firms Respond To Them?’, World Bank Policy Research Working Papers, No. 3463, World Bank: Washington DC.

41
Gelb, A., V. Ramachandran, M. Kedia-Shah, and G. Turner (2007). ‘What Matters to African Firms? The Relevance of Perceptions Data’, World Bank Policy Research Working Papers, No. 4446, World Bank: Washington DC.
World Bank (2009). Turmoil at Twenty: Recession, Recovery and Reform in Central and Eastern Europe and the Former Soviet Union, World Bank: Washington DC.