Hypersegregation in the twenty-first century
14
Demography, Volume 41-Number 1, February 2004: 23–36 23 S HYPERSEGREGATION IN THE TWENTY-FIRST CENTURY* RIMA WILKES AND JOHN ICELAND We used metropolitan-level data from the 2000 U.S. census to analyze the hypersegregation of four groups from whites: blacks, Hispanics, Asians, and Native Americans. While blacks were hypersegregated in 29 metropolitan areas and Hispanics were hypersegregated in 2, Asians and Native Americans were not hypersegregated in any. There were declines in the number of metropoli- tan areas with black hypersegregation, although levels of segregation experienced by blacks remained significantly higher than those of the other groups, even after a number of factors were controlled. Indeed, although socioeconomic differences among the groups explain some of the dif- ference in residential patterns more generally, they have little association with hypersegregation in particular, indicating the overarching salience of race in shaping residential patterns in these highly divided metropolitan areas. egregation can be conceptualized as consisting of five dimensions: evenness, expo- sure, concentration, clustering, and centralization (Massey and Denton 1988; Massey, White, and Phua 1996). Evenness refers to the differential distribution of groups across neighborhoods, exposure measures the probability of interaction between groups, concentration refers to the amount of physical space occupied by the minority group, centralization indicates the distance to the center of the urban area, and clustering indi- cates the degree to which minorities live in areas that adjoin one another. Despite the fact that segregation is a multifaceted social phenomenon, most research- ers have considered only one or perhaps two dimensions—usually evenness or isolation. This practice of considering only one dimension may misrepresent the nature of segrega- tion in U.S. metropolitan areas and, in the case of blacks, understate its severity. It has been argued that “as high levels of segregation accumulate across dimensions, the deleterious effects of segregation multiply because isolation intensifies . . . . Not only are blacks more segregated than other groups on any single dimension of segregation, they are also more segregated across all dimensions simultaneously” (Massey and Denton 1989:373–74). When a group is highly segregated on several dimensions of segregation in a given metropolitan area, it can be considered to be hypersegregated (Massey and Denton 1989, 1993). To date, the only racial group that can be characterized as hypersegregated in U.S. metropolitan areas is blacks (Massey and Denton 1989). Blacks were hypersegregated in 16 metropolitan areas in 1980 and in 29 metropolitan areas in 1990 (Denton 1994; Massey and Denton 1989, 1993). 1 This pattern of hypersegregation *Rima Wilkes, Department of Anthropology and Sociology, University of British Columbia, 6303 N.W. Marine Drive, Vancouver, British Columbia, Canada V6T 1Z1; E-mail: [email protected]. John Ice- land, Sociology Department, University of Maryland, College Park. 1. In 1980, these hypersegregated metropolitan areas were Atlanta; Baltimore; Buffalo; Chicago; Cleve- land; Dallas–Fort Worth, Texas; Detroit; Gary, Indiana; Indianapolis; Kansas City, Kansas and Missouri; Los Angeles–Long Beach, California; Milwaukee; New York; Newark, New Jersey; Philadelphia; and St. Louis (Massey and Denton 1989:382, 1993:76). In the 1990s, these hypersegregated cities were Albany, Georgia; Baltimore; Baton Rouge, Louisiana; Beaumont–Port Arthur, Texas; Benton Harbor, Michigan; Birmingham, Alabama; Buffalo; Chicago; Cincinnati; Cleveland; Detroit; Flint, Michigan; Gary; Indianapolis; Kansas City; Los Angeles–Long Beach; Miami, Florida; Milwaukee; Monroe, Louisiana; New Orleans; New York; Newark; Oakland; Philadelphia; Saginaw, Michigan; Savannah; St. Louis; Trenton; and Washington, DC (Denton 1994).
Transcript of Hypersegregation in the twenty-first century

Hypersegregation in the Twenty-First Century 23
Demography, Volume 41-Number 1, February 2004: 23–36 23
S
HYPERSEGREGATION IN THE TWENTY-FIRST
CENTURY*
RIMA WILKES AND JOHN ICELAND
We used metropolitan-level data from the 2000 U.S. census to analyze the hypersegregation offour groups from whites: blacks, Hispanics, Asians, and Native Americans. While blacks werehypersegregated in 29 metropolitan areas and Hispanics were hypersegregated in 2, Asians andNative Americans were not hypersegregated in any. There were declines in the number of metropoli-tan areas with black hypersegregation, although levels of segregation experienced by blacksremained significantly higher than those of the other groups, even after a number of factors werecontrolled. Indeed, although socioeconomic differences among the groups explain some of the dif-ference in residential patterns more generally, they have little association with hypersegregation inparticular, indicating the overarching salience of race in shaping residential patterns in these highlydivided metropolitan areas.
egregation can be conceptualized as consisting of five dimensions: evenness, expo-sure, concentration, clustering, and centralization (Massey and Denton 1988; Massey,White, and Phua 1996). Evenness refers to the differential distribution of groups acrossneighborhoods, exposure measures the probability of interaction between groups,concentration refers to the amount of physical space occupied by the minority group,centralization indicates the distance to the center of the urban area, and clustering indi-cates the degree to which minorities live in areas that adjoin one another.
Despite the fact that segregation is a multifaceted social phenomenon, most research-ers have considered only one or perhaps two dimensions—usually evenness or isolation.This practice of considering only one dimension may misrepresent the nature of segrega-tion in U.S. metropolitan areas and, in the case of blacks, understate its severity. It has beenargued that “as high levels of segregation accumulate across dimensions, the deleteriouseffects of segregation multiply because isolation intensifies . . . . Not only are blacks moresegregated than other groups on any single dimension of segregation, they are also moresegregated across all dimensions simultaneously” (Massey and Denton 1989:373–74).
When a group is highly segregated on several dimensions of segregation in a givenmetropolitan area, it can be considered to be hypersegregated (Massey and Denton 1989,1993). To date, the only racial group that can be characterized as hypersegregated inU.S. metropolitan areas is blacks (Massey and Denton 1989). Blacks werehypersegregated in 16 metropolitan areas in 1980 and in 29 metropolitan areas in 1990(Denton 1994; Massey and Denton 1989, 1993).1 This pattern of hypersegregation
*Rima Wilkes, Department of Anthropology and Sociology, University of British Columbia, 6303 N.W.Marine Drive, Vancouver, British Columbia, Canada V6T 1Z1; E-mail: [email protected]. John Ice-land, Sociology Department, University of Maryland, College Park.
1. In 1980, these hypersegregated metropolitan areas were Atlanta; Baltimore; Buffalo; Chicago; Cleve-land; Dallas–Fort Worth, Texas; Detroit; Gary, Indiana; Indianapolis; Kansas City, Kansas and Missouri; LosAngeles–Long Beach, California; Milwaukee; New York; Newark, New Jersey; Philadelphia; and St. Louis(Massey and Denton 1989:382, 1993:76). In the 1990s, these hypersegregated cities were Albany, Georgia;Baltimore; Baton Rouge, Louisiana; Beaumont–Port Arthur, Texas; Benton Harbor, Michigan; Birmingham,Alabama; Buffalo; Chicago; Cincinnati; Cleveland; Detroit; Flint, Michigan; Gary; Indianapolis; Kansas City;Los Angeles–Long Beach; Miami, Florida; Milwaukee; Monroe, Louisiana; New Orleans; New York; Newark;Oakland; Philadelphia; Saginaw, Michigan; Savannah; St. Louis; Trenton; and Washington, DC (Denton 1994).

24 Demography, Volume 41-Number 1, February 2004
persisted even when differences in group socioeconomic characteristics and metropolitancontext were controlled for (Massey and Denton 1989).
In American Apartheid, Massey and Denton (1993:2) contended that these patterns ofsegregation have dire consequences: “[Segregation] systematically undermines the socialand economic well-being of blacks in the United States. Because of racial segregation, asignificant share of black America is condemned to experience a social environment wherepoverty and joblessness are the norm . . . where educational failure prevails, and wheresocial and physical deterioration abound. Through prolonged exposure to such an envi-ronment, black chances for social and economic success are drastically reduced.”
Our study makes several contributions to the research on hypersegregation inU.S. metropolitan areas. First, the literature on hypersegregation considers only blacks andHispanics (in relation to whites). Given that there are over 10 million Asians in the UnitedStates (Grieco and Cassidy 2001) and that the urbanized Native American population hasalso grown dramatically in recent decades (Snipp 1992), these groups should also be in-cluded in any discussion of hypersegregation. Therefore, we considered not only the seg-regation among blacks, Hispanics, and whites but also the segregation among Asians,Native Americans, and whites.
Second, the literature on hypersegregation is based on 1980 and 1990 census data. Anupdate is urgently needed, especially given Denton’s (1994) observation that in some cit-ies, hypersegregation may be increasing. The dramatic growth of the Hispanic and Asianpopulations in the 1990s may also have affected the patterns of various groups (Frey andFarley 1996). Although studies that used 2000 data showed that blacks continue to be moresegregated than are other groups (Iceland, Weinberg, and Steinmetz 2002; Lewis MumfordCenter 2001), they did not address the question of hypersegregation in particular. More-over, only Iceland et al. (2002), using newer data, produced indexes for all dimensions.
Third, research that has used multivariate analysis to understand hypersegregationhas been based on a limited number of metropolitan areas. Massey and Denton’s (1989)analyses of the city and group characteristics associated with hypersegregation in the1980s were based on 60 metropolitan areas (the 50 largest plus 10 with large Hispanicpopulations). Although Denton (1994) was able to measure levels of hypersegregationdirectly for all 318 metropolitan areas during the 1990s, she was able to conduct multi-variate analysis only on a sample of 41. In this study, we conducted multivariate analysisfor metropolitan areas that had at least 1,000 minority-group members for the group inquestion (see Frey and Myers 2002)—a far larger number of metropolitan areas than hasbeen used in past studies on this issue.
Fourth, although Massey and Denton (1988, 1989) calculated indexes that representedseveral dimensions of segregation, they did not focus specifically on whether segregationacross dimensions and racial/ethnic groups were differentially affected by contextual fac-tors. That is, it is not known if some contextual factors are more important for some typesof segregation and not for others, or if they are more important for some groups than forothers. To understand the factors that may affect the different types of segregation amonggroups, we drew on the spatial-assimilation and metropolitan-context models.
According to the spatial-assimilation model, all ethnic/racial groups start their met-ropolitan experiences in central cities. As they make gains in socioeconomic status (suchas through increases in income, education, and English-language proficiency) they trans-late these gains into improvement of their spatial location (Massey and Bitterman 1985;Massey and Denton 1985). These spatial improvements typically involve moves toneighborhoods that are located farther from the central city and are populated by thedominant majority group, which in the United States is native-born whites (see Masseyand Denton 1985). Studies have documented a strong and consistent association betweensocioeconomic status and residential location (Alba, Logan, and Crowder 1997; White,Biddlecom, and Guo 1993).
Hypersegregation in the Twenty-First Century 25
However, research has also found that the spatial-assimilation model does not seemto hold for all groups, especially blacks (Fong 1994; Logan and Alba 1995; Massey andMullan 1984). Although segregation is the highest among blacks with the lowest socio-economic status, it remains high among blacks of all socioeconomic levels (Darden 1987;Darden and Kamel 2000; St. John and Clymer 2000). One important reason why certaingroups, especially blacks, have had difficulty translating socioeconomic resources intoimprovements in spatial environment is discrimination. Discriminatory practices includeracial steering by real estate agents; unfair mortgage-lending patterns; and, in some cases,physical attacks when these groups have moved into white neighborhoods (Galster,Freiberg, and Houk 1987; Gotham 1998; Massey and Denton 1993).
According to the metropolitan-context model, discriminatory practices take placemore often or less often in certain types of urban environments (Farley and Frey 1994;Fong and Shibuya 2000; Krivo and Kaufman 1999). The regional location, economicspecialization, and characteristics of the population and housing of urban areas all playan important role in increasing or decreasing racial/ethnic residential segregation. Forexample, large cities tend to be more segregated, as do cities with a high proportion ofminorities. The proportion of the minority population that is black also increases thesegregation of blacks (Farley and Frey 1994). Massey and Denton (1993) posited thatthis association exists because blacks are more likely to be tolerated as neighbors whenthey constitute a small share of the population. That is, when there are relatively fewblacks, an open-housing market is more likely to yield a neighborhood composition thatis acceptable to whites.
The age of the metropolitan area’s housing stock and the type of economy in the areahave also been found to be associated with segregation. Farley and Frey (1994) argued thatnewer housing is associated with lower levels of segregation because housing that wasconstructed after 1969 was subject to federal laws that prohibited discrimination. Theyalso noted that university, governmental, and military communities tend to have lowerlevels of segregation because many of the people in these areas may view their residentiallocation as either temporary or have had their location selected for them. Furthermore,these institutions attempt to promote integration in a way that others may not. Conversely,retirement and manufacturing-based economies tend to be more segregated because fewerminorities (especially blacks) can either afford to move into retirement communities or outof declining manufacturing areas (Farley and Frey 1994; White, Fong, and Cai 2003).
Finally, levels of segregation vary by region. Generally speaking, segregation ishigher in metropolitan areas in the Midwest and the Northeast. This pattern tends to applynot only to segregation between whites and blacks but of other groups as well (Iceland etal. 2002; Wilkes 2003).
DATA
The data for this study were obtained from the U.S. Census 2000 Summary File 1 (SF1)and Summary File 3 (SF3) files. We used SF1 data on population counts to calculateresidential segregation indexes and SF3 data for more detailed characteristics of metro-politan areas used in the regression analysis. We present data for independent metropolitanareas and primary metropolitan areas using boundaries that were defined by the Office ofManagement and Budget (OMB) on June 30, 1999. Town- and city-based metropolitanareas were used in New England.
The indexes (described later) for each minority group were calculated for all metro-politan areas that had at least 1,000 members of that group because segregation indexesfor metropolitan areas with small minority populations are less reliable than are thosewith larger ones. Random factors and geocoding errors are more likely to play a large rolein determining the settlement pattern of group members when fewer members are present,causing these indexes to contain greater variability. The 1,000 group population cutoff,

26 Demography, Volume 41-Number 1, February 2004
although inevitably arbitrary, is one that has been used in some other studies (Frey andMyers 2002; Glaeser and Vigdor 2001). This selection criterion yielded indexes for 298metropolitan areas for blacks, 305 metropolitan areas for Hispanics, 176 metropolitanareas for Native Americans, and 262 metropolitan areas for Asians.
MEASURES
Residential Segregation
Using data from the 2000 census, we calculated 19 segregation indexes compiled byMassey and Denton (1988) between non-Hispanic whites and blacks, Hispanics, Asians,and Native Americans. We used the single-race-only category from the census, a choicethat is justifiable on several bases, including the facts that almost 98% of the populationselected single-race only (Grieco and Cassidy 2001) and the other variables of interestthat are included in our models (i.e., income) were available only for single races in SF3.In all the calculations of segregation, non-Hispanic whites are considered the “majority”(reference) population. The effect of using single-race versus the “alone or in combina-tion” criteria is small on the segregation scores for blacks and Asians and moderate on thescores for Native Americans (Iceland et al. 2002).
In our analysis, we focused on residential segregation in metropolitan areas (as ismost commonly done) because they are reasonable approximations of housing markets.We used census tracts as the units of analysis because tracts are designed to representneighborhoods and are the unit that is most often chosen by other researchers.
Massey and Denton (1988) conducted an extensive literature search and cluster analy-sis to identify various indexes of segregation and to classify them into five key dimensionsof segregation (see also Iceland et al. 2002; Massey et al. 1996). These five dimensions areevenness, exposure, concentration, centralization, and clustering. For ease of interpreta-tion, we selected a single index for each type of segregation.2
Evenness involves the differential distribution of the subject population. The indexeswithin this dimension include dissimilarity, gini, entropy (or information theory), andthree different Atkinson indexes. Our analysis focused on dissimilarity, which measuresthe percentage of a group’s population that would have to change residence for each neigh-borhood to have the same percentage of that group as the metropolitan area overall. Theindex ranges from 0 (when no group members have to move, or complete integration) to1 (complete segregation).
The second dimension, exposure, measures potential contact between groups. We cal-culated three exposure indexes: interaction, isolation, and the correlation ratio (also knownas eta-squared). Our analysis focused on the isolation index, which indicates where theaverage member of the minority group in question lives. The index ranges from 0 (noexposure) to 1 (only minority residents).
The third dimension, concentration, refers to the relative amount of physical spaceoccupied by the minority group. Minority groups of the same relative size who occupyless space would be considered more concentrated and consequently more segregated.The indexes in this dimension include delta, absolute concentration, and relative concen-tration. We focused on delta, which computes the proportion of minority-group memberswho are residing in census tracts with an above-average density of minority-group mem-bers. The index gives the proportion of a group’s population that would have to moveacross census tracts to achieve a uniform density. It ranges from 0 (no group membermoves) to 1 (all group members move).
2. We selected indexes that were highlighted by Iceland et al. (2002). Iceland et al.’s choice was based, inturn, on an “assessment of the indexes, Massey and Denton’s recommendations, and earlier research” (p. 8). Thevalues for all 19 indexes are available from us on request.

Hypersegregation in the Twenty-First Century 27
The fourth dimension of segregation, centralization, indicates the degree to which agroup is located near the center of an urban area. We calculated two indexes, relativecentralization and absolute centralization, although our analysis focused on the latter. Ab-solute centralization examines the distribution of the minority group around the urbancenter and varies between –1 and 1. Positive values indicate that minority-group mem-bers are more likely to reside near the city center, while negative values indicate that theylive on the periphery more than does the reference group. A score of zero means that agroup has a uniform distribution throughout the metropolitan area. We used the popula-tion centroid to represent the metropolitan area’s center.
The fifth dimension, clustering, measures the degree to which minority-group mem-bers live disproportionately in contiguous areas. A high degree of clustering indicates aracial or ethnic enclave. There are five clustering indexes: absolute clustering, relativeclustering, spatial proximity, distance-decay interaction, and distance-decay isolation. Ouranalysis focused on spatial proximity, which measures the extent to which neighborhoodsthat are inhabited by minority-group members adjoin one another. Spatial proximity equals1 if there is no differential clustering between minority- and majority-group members. Itis greater than 1 when members of each group live nearer to one another than to membersof the other group, and it is less than 1 in the rare case that minority-group members livenearer, on average, to non-minority-group members than to members of their own group.Following Massey and Denton (1989), given that the spatial proximity index generallyvaried from 1 to 2 in our data, we subtracted 1 from each index to produce a measure thatmostly varied between 0 and 1.
Group Socioeconomic Status
A group’s socioeconomic characteristics were measured as the group’s mean income as apercentage of the mean income of non-Hispanic whites and the percentage of the groupwho were native born. We also considered including measures of education and language,but for some groups, education was highly correlated with income and language washighly correlated with nativity.
Metropolitan Context
The metropolitan context was measured by variables indicating the composition of thearea’s population, economic and housing characteristics, and region. Composition wasmeasured by three variables: the log of the size of the metropolitan-area population, thepercentage of the population that was minority, and the group’s percentage of the population.
Economic variables included the percentage of the employed civilian populationaged 16 and older who worked in the manufacturing industry and the percentage whoworked in public administration (government). We also included an indicator of the per-centage of those aged 16 and older in the labor force who were in the armed forces.University enrollment was measured by the percentage of the population aged 3 andolder who were enrolled in college, graduate school, or professional school. Theretirement-age population was measured as the percentage of the total population aged65 and older. Our housing measure represented the percentage of the houses in a metro-politan area that were constructed between 1990 and 2000 (see Farley and Frey 1994).Region was indicated by dummy variables indicating whether a metropolitan area is lo-cated in the Northeast, Midwest, or South, with West as the omitted category (Frey andFarley 1996; Krivo and Kaufman 1999).
METHODS
The initial part of our analysis involved identifying hypersegregated metropolitan areas.First, we identified metropolitan areas with high segregation for the various groups foreach of the five types of segregation. Next, to determine which metropolitan areas could

28 Demography, Volume 41-Number 1, February 2004
be classified as hypersegregated, we used Massey and Denton’s (1993) and Massey etal.’s (1996) criteria that a metropolitan area must score at least .60 on four out of the fiveindexes. The final portion of the analysis involved using multivariate models to gauge theeffect of metropolitan characteristics on each type of segregation in 2000. Multivariatemodels were estimated for evenness, exposure, concentration, centralization, clustering,and hypersegregation. For the first five types of segregation, we followed Massey andDenton’s (1989) strategy of pooling the groups and including dummy variables for eachgroup comparison. Because the same metropolitan areas were therefore included severaltimes in the equation (each metropolitan area has an index for each group that meets theselection criteria), we produced corrected standard errors that account for the fact that theindependent variables have a correlated error structure. For hypersegregation, we fit asingle logistic regression model.
RESULTS
Highly Segregated and Hypersegregated Metropolitan Areas
Table 1 lists the 10 most segregated metropolitan areas and the associated mean scores bygroup and dimension of segregation. Because the populations of the groups varied con-siderably across metropolitan areas, we included both weighted and unweighted means.The weighted means are uniformly higher, indicating that metropolitan areas with largerminority-group populations have higher levels of segregation than metropolitan areas withsmaller minority-group populations (by definition, the former carry more weight inweighted calculations). Weighted means can be interpreted as referring to the level ofsegregation experienced by the average minority-group member, while unweighted meansrefer to segregation in the average metropolitan area.
The results indicate that blacks continue to be the most segregated from whites,irrespective of the dimension of segregation we considered. Indeed, there is an almostlinear decrease in the range of mean scores for blacks, Hispanics, Asians, and NativeAmericans, respectively.
In terms of the segregation levels in specific metropolitan areas, it is clear that someareas have consistently high levels of black-white segregation on the evenness, exposureand clustering dimensions: Cleveland, Newark, Chicago, Gary, and Detroit. The high lev-els of Hispanic isolation in McAllen and Laredo, Texas, are particularly noteworthy: theseareas have scores of .904 and .952, respectively—the highest for any group. However, thepopulations of these metropolitan areas are almost entirely composed of Hispanics:McAllen is 88% Hispanic, and Laredo is 94% Hispanic (see also Massey 2001:53). Thesemetropolitan areas have long had substantial Hispanic populations and are likely to beinitial entry points for many immigrants from Mexico. Asians and Native Americans haverelatively high segregation scores on the evenness dimension but are not especially iso-lated or clustered in space.
The patterns for concentration and centralization differ from the other three dimen-sions in two ways. First, a different set of cities have high levels of concentration andcentralization. Many are located in the West. Reno and Las Vegas, Nevada; Yuma,Arizona; and Fargo, North Dakota, stand out because they have high scores for three or,in some cases, all four racial categories. Second, the gap between blacks and the otherthree groups does not appear as striking. Rather, all four minority groups are highlyconcentrated and centralized (compared to whites) in U.S. metropolitan areas. This find-ing suggests that in the sprawling metropolitan areas in the West, non-Hispanic whitesare considerably more likely to live in low-density and outlying suburban areas than areall other groups, whose residential patterns on these dimensions differ less.
When the scores on the five indexes were combined to determine which metropolitanareas could be classified as having hypersegregation (scores of above .60 on at least four

Hypersegregation in the Twenty-First Century 29
of the five dimensions, using Massey and Denton’s 1993 criteria), we found that therewere no instances of Asian or Native American hypersegregation in 2000. Two metropoli-tan areas had Hispanic-white hypersegregation on four dimensions: Los Angeles and NewYork City. This is an important finding, given that no study has previously documentedthe presence of Hispanic hypersegregation in these or any other metropolitan areas. Thisnew phenomena may be a result of the enormous growth in the Hispanic population of theUnited States over past decades and the fact that a large portion of the Hispanic popula-tion are new immigrants who are more likely to settle in ethnic enclaves (see also Logan,Stults, and Farley 2004).
However, Hispanic hypersegregation is much less common than is blackhypersegregation. Twenty-nine metropolitan areas could be classified as having black-white hypersegregation in 2000.3 Hypersegregated metropolitan areas (on all five dimen-sions) were Chicago, Cleveland, Detroit, Milwaukee, Newark, and Philadelphia.Hypersegregated metropolitan areas on four dimensions were Albany, Georgia; Atlanta;Baltimore; Baton Rouge; Beaumont–Port Arthur; Birmingham; Buffalo–Niagara Falls;Dayton–Springfield, Ohio; Flint; Gary; Houston; Jackson; Kankakee, Illinois; LosAngeles–Long Beach; Miami; Memphis; Mobile; Monroe, Louisiana; New Orleans; NewYork; Saginaw–Bay City, Michigan; St. Louis; and Washington, DC. Although the metro-politan areas with the most extreme black hypersegregation are all located in the North-east and especially in the Midwest, it is also important to note that 14 places on the longerlist are located in the South.
Most of the metropolitan areas that were hypersegregated in 2000 were alsohypersegregated in 1990.4 To make our results comparable with those of Denton (1994),who produced the 1990 list of hypersegregated metropolitan areas, we conducted addi-tional analyses (not shown) using relative concentration (RCO, an index that Denton used)instead of delta (our other indexes are the same). Using RCO, we found that the number ofmetropolitan areas that were hypersegregated declined from 29 in 1990 to 23 in 2000. Ninemetropolitan areas dropped off the list by 2000: Benton Harbor, Cincinnati, Indianapolis,Kansas City, Miami, New Orleans, Oakland, Savannah, and Trenton. Nevertheless, someof these metropolitan areas continued to have relatively high levels of segregation.5 Mean-while, three metropolitan areas—Atlanta, Dayton, and Mobile—became newlyhypersegregated in 2000 (again using RCO).6
Our results suggest that while the number of hypersegregated metropolitan areas isdeclining, the decline is taking place somewhat slowly. In 2000, almost half the
3. Differences in the extent of hypersegregation across racial/ethnic groups did not differ much when othercutoffs than .60 were used, although more-stringent cutoffs yielded fewer hypersegregated metropolitan areasthan did more-lenient ones. For example, the following are the number of metropolitan areas that could beconsidered hypersegregated using alternative criteria: (1) segregation at least .70 for 4–5 dimensions: 9 black, 0Hispanic, 0 Asian, 0 Native American; (2) segregation at least .65 for 4–5 dimensions: 20 black, 1 Hispanic, 0Asian, 0 Native American; (3) segregation at least .55 for 4–5 dimensions: 46 black, 5 Hispanic, 0 Asian, 0Native American; (4) segregation at least .50 for 4–5 dimensions: 63 black, 15 Hispanic, 0 Asian, 0 NativeAmerican.
4. Some caution should be used in interpreting these comparisons. Some tracts had geographic changesbetween 1990 and 2000, and the changes to the race variable in 2000 may have affected segregation indexes.Nevertheless, given that most of our calculated index values are lower than those provided for the 1990s andmirror the general trend of segregation among blacks found by others (Iceland et al. 2002), we believe that ourestimates are conservative—that is, we are not overstating the extent of hypersegregation.
5. If either delta or RCO were used, Cincinnati, Indianapolis, Kansas City, and Savannah would behypersegregated if the cutoffs were .55, rather than .60. Trenton would be hypersegregated with a cutoff of .50.Benton Harbor, Michigan, and Oakland each had at least two dimensions that scored below .50. Using RCO,Miami and New Orleans would be hypersegregated if the cutoffs were .50.
6. The six metropolitan areas that were hypersegregated using delta, our preferred measure, rather thanRCO, were Miami, New Orleans, Jackson (Mississippi), Kankakee (Illinois), Memphis, and Houston—all butone which are in the South.

30 Demography, Volume 41-Number 1, February 2004
Tabl
e 1.
Met
ropo
lita
n A
reas
Wit
h th
e H
ighe
st S
egre
gati
on, b
y G
roup
and
Mea
sure
: 200
0
Even
ness
DE
xpos
ure
xPx*
Con
cent
rati
onD
elta
Cen
tral
izat
ion
AC
EC
lust
erin
gSP
XY
Bla
ck-W
hite
Det
roit
.855
New
Yor
k.8
29La
s Veg
as, N
V, a
nd A
Z.9
66La
s Veg
as, N
V, a
nd A
Z.9
62D
etro
it.8
31
Gar
y, I
N.8
47D
etro
it.8
19C
heye
nne,
WY
.964
Fort
Way
ne.9
55N
ewar
k, N
J.8
31
Milw
auke
e.8
33G
ary,
IN
.807
Farg
o, N
D, a
nd M
N.9
48Pu
eblo
, CO
.949
Chi
cago
.752
New
Yor
k.8
25M
iam
i.7
93Pu
eblo
, CO
.938
Peor
ia, I
L.9
38Ph
ilade
lphi
a, P
A, a
nd N
J.6
84
Chi
cago
.810
Chi
cago
.786
Ren
o, N
V.9
35Si
oux
Falls
, SD
.936
Cle
vela
nd.6
75
New
ark,
NJ
.809
New
ark,
NJ
.784
Fort
Way
ne.9
23R
eno,
NV
.936
Milw
auke
e.6
61
Cle
vela
nd.7
81M
emph
is.7
49Si
oux
Cit
y, I
A, a
nd N
E.9
23B
loom
ingt
on, I
L.9
32Lo
s A
ngel
es.5
85
Buf
falo
.781
New
Orl
eans
.738
Peor
ia, I
L.9
23Sp
ring
field
, IL
.932
Flin
t, M
I.5
73
Flin
t, M
I.7
77C
leve
land
.731
Blo
omin
gton
, IL
.921
Dec
atur
, IL
.931
Bal
tim
ore
.532
Sagi
naw
–Bay
Cit
y, M
I.7
51A
lban
y, G
A.7
31St
. Jos
eph,
MO
.919
Abi
lene
, TX
.929
Gar
y, I
N.5
18
Unw
eigh
ted
mea
n.5
29U
nwei
ghte
d m
ean
.342
Unw
eigh
ted
mea
n.7
92U
nwei
ghte
d m
ean
.691
Unw
eigh
ted
mea
n.1
62
Wei
ghte
d m
eana
.653
Wei
ghte
d m
ean
.597
Wei
ghte
d m
ean
.797
Wei
ghte
d m
ean
.721
Wei
ghte
d m
ean
.384
His
pani
c-W
hite
Rea
ding
, PA
.718
Lare
do, T
X.9
52La
s Veg
as, N
V, a
nd A
Z.9
50R
eno,
NV
.953
Nap
les,
FL
.459
Prov
iden
ce.6
88M
cAlle
n–E
dinb
urg,
TX
.904
Cas
per,
WY
.932
Las V
egas
, NV,
and
AZ
.922
Chi
cago
.423
New
Yor
k.6
66B
row
nsvi
lle, T
X.8
75R
eno,
NV
.932
Pueb
lo, C
O.9
21N
ewar
k, N
J.3
84
New
ark,
NJ
.650
El P
aso,
TX
.854
Che
yenn
e, W
Y.9
28O
mah
a, N
E, a
nd I
A.9
12Sa
linas
, CA
.381
Har
tfor
d.6
34M
iam
i.7
91Si
oux
Cit
y, I
A, a
nd N
E.9
16Si
oux
Falls
, SD
.906
Fres
no, C
A.3
81
Spri
ngfie
ld, M
A.6
32Lo
s A
ngel
es.7
81Pu
eblo
, CO
.896
Rea
ding
, PA
.901
Bak
ersf
ield
, CA
.380
Los
Ang
eles
.631
Salin
as, C
A.7
35Yu
ma,
AZ
.890
Tucs
on, A
Z.8
98V
entu
ra, C
A.3
75
Alle
ntow
n, P
A.6
24La
s C
ruce
s, N
M.7
18G
rand
Junc
tion
, CO
.886
Am
arill
o, T
X.8
96O
rang
e C
ount
y, C
A.3
74
Lanc
aste
r, PA
.619
New
Yor
k.7
09Po
cate
llo, I
D.8
85A
bile
ne, T
X.8
95Ph
ilade
lphi
a, P
A, a
nd N
J.3
65
Chi
cago
.611
San
Ant
onio
.704
Gre
at F
alls
, MT
.883
San
Ang
elo,
TX
.892
Los
Ang
eles
.350
Unw
eigh
ted
mea
n.3
73U
nwei
ghte
d m
ean
.213
Unw
eigh
ted
mea
n.7
17U
nwei
ghte
d m
ean
.619
Unw
eigh
ted
mea
n.0
77
Wei
ghte
d m
ean
.509
Wei
ghte
d m
ean
.552
Wei
ghte
d m
ean
.763
Wei
ghte
d m
ean
.686
Wei
ghte
d m
ean
.232

Hypersegregation in the Twenty-First Century 31A
sian
-Whi
teA
nn A
rbor
, MI
.619
Hon
olul
u.7
74La
s Veg
as, N
V, a
nd A
Z.9
66La
s Veg
as, N
V, a
nd A
Z.9
59Lo
s A
ngel
es.2
39
Lafa
yett
e, I
N.5
74Sa
n Jo
se, C
A.5
16Fa
rgo,
ND
, and
MN
.933
Ren
o, N
V.9
40V
alle
jo–F
airf
ield
.170
Am
arill
o, T
X.5
72Sa
n Fr
anci
sco
.515
Ren
o, N
V.9
25Fr
esno
, CA
.938
San
Jose
, CA
.166
Bea
umon
t, T
X.5
65Lo
s A
ngel
es.4
98A
mar
illo,
TX
.921
Eug
ene,
OR
.925
Stoc
kton
–Lod
i, C
A.1
65
Atla
ntic
–Cap
e M
ay, N
J.5
55St
ockt
on–L
odi,
CA
.421
Yum
a, A
Z.9
12Fo
rt C
ollin
s, C
O.9
19O
rang
e C
ount
y, C
A.1
65
Wau
sau,
WI
.537
New
Yor
k.4
21A
ncho
rage
, AK
.909
Blo
omin
gton
, IL
.915
Oak
land
.163
Bat
on R
ouge
, LA
.530
Oak
land
.418
Riv
ersi
de, C
A.9
04Ph
oeni
x–M
esa,
AZ
.915
San
Die
go.1
55
Mob
ile, A
L.5
23V
alle
jo–F
airf
ield
, CA
.370
Phoe
nix–
Mes
a, A
Z.9
04A
lbuq
uerq
ue, N
M.9
12Sa
n Fr
anci
sco
.155
Sacr
amen
to, C
A.5
22O
rang
e C
ount
y, C
A.3
61Tu
cson
, AZ
.902
Prov
o–O
rem
, UT
.911
Sacr
amen
to, C
A.1
45
Pitt
sbur
gh.5
22Je
rsey
Cit
y, N
J.3
61A
lbuq
uerq
ue, N
M.9
02Tu
scal
oosa
, AL
.909
Hou
ston
, TX
.130
Unw
eigh
ted
mea
n.3
82U
nwei
ghte
d m
ean
.086
Unw
eigh
ted
mea
n.7
69U
nwei
ghte
d m
ean
.688
Unw
eigh
ted
mea
n.0
28
Wei
ghte
d m
ean
.441
Wei
ghte
d m
ean
.296
Wei
ghte
d m
ean
.757
Wei
ghte
d m
ean
.692
Wei
ghte
d m
ean
.105
Nat
ive
Am
eric
an-W
hite
New
Yor
k.6
66Fo
rt S
mit
h, A
R, a
nd O
K.1
81Fa
rgo,
ND
, and
MN
.908
Ren
o, N
V.9
20H
oum
a, L
A.2
00
Fort
Sm
ith,
AR
, and
OK
.579
Flag
staf
f, A
Z, a
nd U
T.1
75La
s Veg
as, N
V, a
nd A
Z.9
02B
illin
gs, M
T.8
93Fo
rt S
mit
h, A
R, a
nd O
K.1
69
New
ark,
NJ
.537
Rap
id C
ity,
SD
.157
Anc
hora
ge, A
K.9
02Si
oux
Falls
, SD
.892
Mob
ile, A
L.0
77
Nas
sau–
Suff
olk,
NY
.522
Hou
ma,
LA
.149
Ren
o, N
V.9
01B
ism
arck
, ND
.891
Law
ton,
OK
.059
Siou
x C
ity,
IA
, and
NE
.508
Anc
hora
ge, A
K.1
45B
ism
arck
, ND
.901
Farg
o, N
D, a
nd M
N.8
89R
apid
Cit
y, S
D.0
46
Ber
gen–
Pass
aic,
NJ
.507
Alb
uque
rque
, NM
.110
Rap
id C
ity,
SD
.891
Yum
a, A
Z.8
89Fl
agst
aff,
AZ
, and
UT
.040
Dec
atur
, AL
.492
New
Yor
k.1
08Yu
ma,
AZ
.872
Rap
id C
ity,
SD
.880
Dec
atur
, AL
.038
Prov
iden
ce.4
85Tu
lsa,
OK
.104
Siou
x C
ity,
IA
, and
NE
.870
Anc
hora
ge, A
K.8
72A
ncho
rage
, AK
.035
Phoe
nix–
Mes
a, A
Z.4
76La
wto
n, O
K.1
03B
illin
gs, M
T.8
67G
reat
Fal
ls, M
T.8
72A
lbuq
uerq
ue, N
M.0
31
Bur
lingt
on, V
T.4
64Tu
cson
, AZ
.097
Siou
x Fa
lls, S
D.8
64O
mah
a, N
E, a
nd I
A.8
71V
inel
and–
Mill
ville
, NJ
.029
Unw
eigh
ted
mea
n.3
00U
nwei
ghte
d m
ean
.026
Unw
eigh
ted
mea
n.6
62U
nwei
ghte
d m
ean
.573
Unw
eigh
ted
mea
n.0
08
Wei
ghte
d m
ean
.325
Wei
ghte
d m
ean
.045
Wei
ghte
d m
ean
.687
Wei
ghte
d m
ean
.617
Wei
ghte
d m
ean
.013
Sour
ce: C
alcu
lati
ons
base
d on
Cen
sus
2000
, Sum
mar
y Fi
le 1
dat
a.a W
eigh
ted
mea
ns a
re w
eigh
ted
by g
roup
siz
e. T
he N
for
the
blac
k-w
hite
mea
n is
298
; for
the
His
pani
c-w
hite
mea
n, 3
05; f
or th
e A
sian
-whi
te m
ean,
262
; and
for
the
Nat
ive
Am
eric
an-w
hite
mea
n, 1
76.
32 Demography, Volume 41-Number 1, February 2004
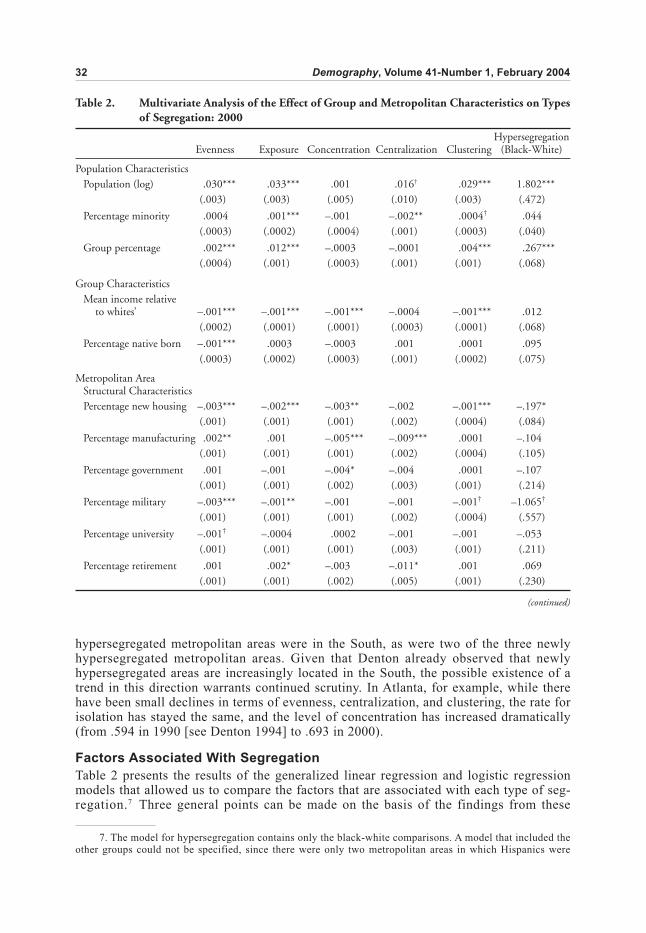
hypersegregated metropolitan areas were in the South, as were two of the three newlyhypersegregated metropolitan areas. Given that Denton already observed that newlyhypersegregated areas are increasingly located in the South, the possible existence of atrend in this direction warrants continued scrutiny. In Atlanta, for example, while therehave been small declines in terms of evenness, centralization, and clustering, the rate forisolation has stayed the same, and the level of concentration has increased dramatically(from .594 in 1990 [see Denton 1994] to .693 in 2000).
Factors Associated With Segregation
Table 2 presents the results of the generalized linear regression and logistic regressionmodels that allowed us to compare the factors that are associated with each type of seg-regation.7 Three general points can be made on the basis of the findings from these
Table 2. Multivariate Analysis of the Effect of Group and Metropolitan Characteristics on Typesof Segregation: 2000
HypersegregationEvenness Exposure Concentration Centralization Clustering (Black-White)
Population CharacteristicsPopulation (log) .030*** .033*** .001 .016† .029*** 1.802***
(.003) (.003) (.005) (.010) (.003) (.472)
Percentage minority .0004 .001*** –.001 –.002** .0004† .044(.0003) (.0002) (.0004) (.001) (.0003) (.040)
Group percentage .002*** .012*** –.0003 –.0001 .004*** .267***(.0004) (.001) (.0003) (.001) (.001) (.068)
Group CharacteristicsMean income relative
to whites’ –.001*** –.001*** –.001*** –.0004 –.001*** .012(.0002) (.0001) (.0001) (.0003) (.0001) (.068)
Percentage native born –.001*** .0003 –.0003 .001 .0001 .095(.0003) (.0002) (.0003) (.001) (.0002) (.075)
Metropolitan AreaStructural CharacteristicsPercentage new housing –.003*** –.002*** –.003** –.002 –.001*** –.197*
(.001) (.001) (.001) (.002) (.0004) (.084)
Percentage manufacturing .002** .001 –.005*** –.009*** .0001 –.104(.001) (.001) (.001) (.002) (.0004) (.105)
Percentage government .001 –.001 –.004* –.004 .0001 –.107(.001) (.001) (.002) (.003) (.001) (.214)
Percentage military –.003*** –.001** –.001 –.001 –.001† –1.065†
(.001) (.001) (.001) (.002) (.0004) (.557)
Percentage university –.001† –.0004 .0002 –.001 –.001 –.053(.001) (.001) (.001) (.003) (.001) (.211)
Percentage retirement .001 .002* –.003 –.011* .001 .069(.001) (.001) (.002) (.005) (.001) (.230)
(continued)
7. The model for hypersegregation contains only the black-white comparisons. A model that included theother groups could not be specified, since there were only two metropolitan areas in which Hispanics were

Hypersegregation in the Twenty-First Century 33
models. First, the factors specified in the literature helped explain variation in levels ofevenness; isolation; and, to a lesser extent, clustering. For example, metropolitan areasin which a group’s mean income relative to whites’ was higher tended to have lowerlevels of segregation along these dimensions—lending support to the spatial-assimilationmodel. Metropolitan areas with larger populations also tended to have higher levels ofsegregation, providing support for the metropolitan-context model. These findings aregenerally consistent with those of other recent studies on these issues that focused on theevenness dimension (see Logan et al. 2004).
Second and, by contrast, these models provide far less insight into processes thataccount for centralization and, to some extent, concentration, in which the relationshipbetween segregation and region and the characteristics of the city’s population was eithernonexistent or in the opposite direction than was expected. Neither income nor nativityappears to be associated with centralization. Indeed, as others have noted (Logan 2001;Singer et al. 2001), by 2000, the foreign born were less likely to settle in dense areas nearthe urban core. Given that these two types of segregation were high for all the groups,greater attention clearly needs to be paid to discovering the reasons for this phenomenon.
(Table 2, continued)
HypersegregationEvenness Exposure Concentration Centralization Clustering (Black-White)
Groupa
Hispanic –.177*** –.095*** –.083*** –.055** –.072***(.011) (.010) (.010) (.020) (.008)
Asian –.170*** –.081*** –.028 .052 –.071***(.020) (.018) (.021) (.044) (.015)
Native American –.185*** –.173*** –.145*** –.141*** –.107***(.011) (.011) (.008) (.014) (.012)
Regionb
Northeast .089*** .029** –.104** –.159** .018†
(.011) (.010) (.019) (.052) (.010)
Midwest .062*** .027** –.020 .017 .020* 3.228**(.010) (.008) (.014) (.037) (.008) (1.173)
South .032*** .013* –.090** –.066* .007(.007) (.006) (.012) (.031) (.005)
Intercept .284*** –.194*** 1.096*** .880*** –.232*** –38.123*(.067) (.057) (.090) (.213) (.060) (14.845)
Log-Likelihood 1,111.54 1,188.4 1,080.23 273.67 1,229.78 62.64
Notes: Models for evenness to clustering were estimated using generalized linear regression. The hypersegregation model wasestimated using logistic regression. The magnitude of coefficients for hypersegregation is not directly comparable to other formsof segregation.
aOmitted category is black.bOmitted category is West.†p < .10; *p < .05; **p < .01; ***p < .001
hypersegregated and none in which other groups were hypersegregated. We also restricted the region variable tolocation in the Midwest because there were not enough cases in some of the other regions to have separatedummy variables.

34 Demography, Volume 41-Number 1, February 2004
Finally, these results also provide continued support for Massey and Denton’s(1989) claim that black segregation is unique. In the five models containing the racedummy variables, almost all8 are all significant and negative, indicating that the ex-tremely high levels of segregation experienced by blacks exist independently of eithergroup characteristics or the type of cities in which most of the group members are lo-cated. Furthermore, in the model for hypersegregation, neither income nor nativity isassociated with segregation—indicating that the spatial-assimilation model does not helpus understand why some metropolitan areas have high levels of segregation while othersdo not. Indeed, the percentage in the military is the only city structural characteristic(other than housing) that is associated with the lower hypersegregation of blacks.
CONCLUSION
A number of researchers have observed a general, although modest, trend toward decreas-ing segregation over the past decades (see, e.g., Iceland et al. 2002), and our researchshows that the overall number of metropolitan areas in which blacks are hypersegregatedhas also declined. There is some cause for optimism in the finding that nine of the metro-politan areas that Denton (1994) identified as hypersegregated in 1990 were no longerhypersegregated in 2000.
Nevertheless, the hypersegregation of blacks remains common enough to warrant con-tinued attention. Using comparable indexes, we found that most of the metropolitan areasthat were hypersegregated in 2000 were also hypersegregated in 1990, suggesting thatany declines in segregation that may have taken place were not large enough to offsetpersistent hypersegregation (Denton 1994). Six metropolitan areas with a large number ofblacks (Chicago, Cleveland, Detroit, Milwaukee, Newark, and Philadelphia) continued tobe hypersegregated on all five dimensions of segregation.
It is notable that two of the three metropolitan areas that became newlyhypersegregated were in the South (Atlanta and Mobile). One explanation is that the ris-ing population size and associated shifts in the demographic makeup of many southerncities has decreased the relative size of the white population. This decrease in the size ofthe white population would, by definition (and other factors being equal), increase one ofthe dimensions of segregation: isolation. The presence of larger minority-group popula-tions has also been associated with greater segregation because of the social dynamicsthat are associated with it. For example, Massey and Denton (1993) argued that blacksare more likely to be accepted as neighbors when they constitute a smaller share of thepopulation. Further research is clearly needed to ascertain which explanation is the mostsalient one.
Our research affirms Massey and Denton’s (1989) claim that blacks are especiallydisadvantaged in U.S. metropolitan areas. Although Hispanics were hypersegregated intwo metropolitan areas, we believe that higher Hispanic segregation, in general, is more aresult of differences in contextual factors and group characteristics. That is, when wecontrolled for factors such as income, nativity, region, and economic activity, we foundthat blacks continued to be significantly more segregated than Hispanics (and NativeAmericans) on all five dimensions of segregation and were more segregated than wereAsians on three out of five dimensions. Contrary to what some may posit, income differ-entials do not explain levels of hypersegregation, even though they help explain more-general patterns of segregation. Rather, the significant factors that are associated withlower black hypersegregation—the presence of new housing and of the military—suggestthat expanding metropolitan areas and those with enforced integration, as by the military,are ones that may see declines in hypersegregation in the future.
8. The exception is Asians for concentration and centralization.

Hypersegregation in the Twenty-First Century 35
REFERENCES
Alba, R.D., J.R. Logan, and K. Crowder. 1997. “White Ethnic Neighborhoods and Assimilation:
The Greater New York Region, 1980–1990.” Social Forces 75:883–912.
Darden, J.T. 1987. “Socioeconomic Status and Racial Residential Segregation: Blacks and Hispan-
ics in Chicago.” International Journal of Comparative Sociology 8:1–13.
Darden, J.T. and S.M. Kamel. 2000. “Black Residential Segregation in the City and Suburbs of
Detroit: Does Socioeconomic Status Matter?” Journal of Urban Affairs 22:1–13.
Denton, N. 1994. “Are African Americans Still Hypersegregated?” Pp. 49–81 in Residential Apart-
heid: The American Legacy, edited by R. Bullard, C. Lee, and J.E. Grigsby. Los Angeles: UCLA
Center for Afro-American Studies.
Farley, R. and W.H. Frey. 1994. “Changes in the Segregation of Whites From Blacks During the
1980s: Small Steps Toward a More Integrated Society.” American Sociological Review 59:
23–45.
Fong, E. 1994. “Residential Proximity Among Racial Groups in U.S. and Canadian Neighbor-
hoods.” Urban Affairs Quarterly 30:285–97.
Fong, E. and K. Shibuya. 2000. “The Spatial Separation of the Poor in Canadian Cities.” Demog-
raphy 37:449–59.
Frey, W.H. and R. Farley. 1996. “Latino, Asian, and Black Segregation in U.S. Metropolitan Areas:
Are Multiethnic Metros Different?” Demography 33:35–50.
Frey, W.H. and D. Myers. 2002. “Neighborhood Segregation in Single-Race and Multirace
America: A Census 2000 Study in Cities and Metropolitan Areas.” Working Paper. Washington,
DC: Fannie Mae Foundation.
Galster, G., F. Freiberg, and D.L. Houk. 1987. “Racial Differentials in Real Estate Advertising
Practices: An Exploratory Case Study.” Journal of Urban Affairs 9:199–215.
Glaeser, E.L. and J. Vigdor. 2001. “Racial Segregation in the 2000 Census: Promising News.”
Center on Urban and Metropolitan Policy, Brookings Institution. Available on-line at
http://www.brook.edu/es/urban/census/glaeser.pdf
Gotham, K.F. 1998. “Race, Mortgage Lending and Loan Rejections in a U.S. City.” Sociological
Focus 31:391–405.
Grieco, E. and R.C. Cassidy. 2001. Overview of Race and Hispanic Origin: 2000. U.S. Census
Bureau, Census 2000 Brief C2KBR/01-1, Washington, DC: U.S. Government Printing Office.
Iceland, J., D.H. Weinberg, and E. Steinmetz. 2002. Racial and Ethnic Residential Segregation in
the United States: 1980–2000. U.S. Census Bureau, Census Special Report, CENSR-3.
Washington, DC: U.S. Government Printing Office.
Krivo, L.J. and R.L. Kaufman. 1999. “How Low Can It Go: Declining Black-White Segregation in
a Multiethnic Context.” Demography 36:93–109.
Lewis Mumford Center, University at Albany. 2001. “Ethnic Diversity Grows, Neighborhood Inte-
gration Lags Behind.” Available on-line at http://mumford1.dyndns.org/cen2000/WholePop/
WPreport/MumfordReport.pdf
Logan, J. 2001. “The New Ethnic Enclaves in America’s Suburbs.” Report by the Lewis Mumford
Center, University at Albany. Available on-line at http://mumford1.dyndns.org/cen2000/subur-
ban/SuburbanReport/page1.html
Logan, J. and R.D. Alba. 1995. “Who Lives in Affluent Suburbs? Racial Differences in Eleven
Metropolitan Regions.” Sociological Focus 28:353–64.
Logan, J., B. Stults, and R. Farley. 2004. “Segregation of Minorities in the Metropolis: Two De-
cades of Change.” Demography 41:1–22.
Massey, D.S. 2001. “Residential Segregation and Neighborhood Conditions in U.S. Metropolitan
Areas.” Pp. 389–482 in America Becoming: Racial Trends and Their Consequences, edited by
N. Smelser, W.J. Wilson, and F. Mitchell. Washington, DC: National Academy Press.
Massey, D.S. and B. Bitterman. 1985. “Explaining the Paradox of Puerto Rican Segregation.”
Social Forces 64:307–31.

36 Demography, Volume 41-Number 1, February 2004
Massey, D.S. and N.A. Denton. 1985. “Spatial Assimilation as a Socioeconomic Outcome.” Ameri-
can Sociological Review 50:94–106.
———. 1988. “The Dimensions of Residential Segregation.” Social Forces 67:281–315.
———. 1989. “Hypersegregation in U.S. Metropolitan Areas: Black and Hispanic Segregation
Along Five Dimensions.” Demography 26:373–93.
———. 1993. American Apartheid: Segregation and the Making of the Underclass. Cambridge,
MA: Harvard University Press.
Massey, D.S. and B.P. Mullan. 1984. “Processes of Hispanic and Black Spatial Assimilation.”
American Journal of Sociology 89:836–73.
Massey, D.S., M.J. White, and V. Phua. 1996. “The Dimensions of Segregation Revisited.” Socio-
logical Methods and Research 25:172–206.
Singer, A., S. Friedman, I. Cheung, and M. Price. 2001. “The World in a Zip Code: Greater Wash-
ington, D.C. as a New Region of Immigration.” Policy Report. Washington, DC: Brookings
Institution. Available on-line at http://www.brook.edu/es/urban/immigration/zipcode.htm
Snipp, C.M. 1992. “Sociological Perspectives on America Indians.” Annual Review of Sociology
18:351–71.
St. John, C. and R. Clymer. 2000. “Racial Residential Segregation by Level of Socioeconomic
Status.” Social Science Quarterly 81:701–15.
White, M.J., A.E. Biddlecom, and S. Guo. 1993. “Immigration, Naturalization, and Residential
Assimilation Among Asian Americans in 1980.” Social Forces 72:93–117.
White, M.J., E. Fong, and Q. Cai. 2003. “The Segregation of Asian-Origin Groups in the United
States and Canada.” Social Science Research 32:148–67.
Wilkes, R. 2003. “The Residential Segregation of Native Americans in U.S. Metropolitan
Areas.” Sociological Focus 36:127–41.