A thesis submitted in partial fulfilment of the requirements of ...
203
AN EVALUATION OF THE DISSOLUTION BEHAVIOUR OF POORLY SOLUBLE ACIDIC AND BASIC DRUGS IN BIORELEVANT MEDIA UTPAL SHAH A thesis submitted in partial fulfilment of the requirements of Liverpool John Moores University for the degree of Doctor of Philosophy This research programme was carried out in collaboration with the Royal Pharmaceutical Society of Great Britain and AstraZeneca J1T1J School of Pharmacy and Chemistry April 2006
-
Upload
khangminh22 -
Category
Documents
-
view
1 -
download
0
Transcript of A thesis submitted in partial fulfilment of the requirements of ...

AN EVALUATION OF THE DISSOLUTION
BEHAVIOUR OF POORLY SOLUBLE
ACIDIC AND BASIC DRUGS IN
BIORELEVANT MEDIA
UTPAL SHAH
A thesis submitted in partial fulfilment of the requirements of Liverpool John Moores University for the degree of Doctor of
Philosophy
This research programme was carried out in collaboration with
the Royal Pharmaceutical Society of Great Britain and AstraZeneca
J1T1J School of Pharmacy and Chemistry
April 2006

AN EVALUATION OF THE DISSOLUTION BEHAVIOUR OF POORLY SOLUBLE ACIDIC AND BASIC DRUGS IN
BIORELEVANT MEDIA
ABSTRACT
The utility of the dissolution test has broadened from a simple quality control tool to have a more developmental and predictive role. Consequently, it has been realised that compendial dissolution media may not adequately represent the environment in the gastro-intestinal tract (GIT), resulting in poor in vitro-in vivo correlations (IVIVC). Biorelevant media are being developed in which oral dosage forms may be studied. Of particular interest is the effect of biorelevant media on poorly soluble and highly permeable drugs (Biopharmaceutics Classification System Class II), which may suffer from dissolution rate-limited bioavailability. In addition to pH and secretory changes between the fasted and fed state, the composition of the ingested meal may influence drug dissolution through surfactant, complexation and micellization effects.
The dissolution behaviour of the acidic drugs ibuprofen and naproxen was investigated in compendial media, in 50/50 milk/O. IN HCI mixtures and, where appropriate, in mono component media based on milk (4.8% w/v lactose, 1.475% w/v casein). The dissolution of the basic drug loratadine was investigated in a pH-shift experiment (pH 1.2 - 7.3) using buffer media and in Fasted state simulated intestinal fluid (FaSSIF) and Fed state simulated intestinal fluid (FeSSIF). Loratadine solubility was assessed in a range of surfactant media in an attempt to develop less expensive replacement media for FaSSIF and FeSSIF. Consequently dissolution tests were carried out using varying concentrations of sodium dodecyl sulphate (SDS) and hexadecyltrimethyl ammonium bromide (CTAB) media to match profiles obtained from the biorelevant media. The dissolution of a second basic drug, trimethoprim, was investigated in phosphate buffer pH 6.8.
Tablet dissolution tests were performed using the USP 28 Apparatus 2 under test conditions of 37°C, 50 rpm and 500mL (gastric) or 1000mL (intestinal) volume. Intrinsic dissolution rate (IDR) studies were carried out for ibuprofen and naproxen using the USP28 Rotating Disk Method fitted with 10 mm dies. 24 h solubility studies were completed for all the drugs in the relevant media and disintegration tests were performed on ibuprofen, naproxen and loratadine tablets. All samples were analysed by HPLC.
The solubility of ibuprofen and naproxen was improved in the milk media. Casein, the major bovine milk protein, was identified as a food component that increased the release of ibuprofen and naproxen from tablets through interactions with the excipients. The amount of loratadine dissolved in the dissolution vessel decreased when the pH was increased from 1.2. to 7.3. The dissolution profiles of three loratadine tablet brands (A, B and C) containing the same excipients differed significantly in FeSSIF over lh and in FaSSIF over 4h. The neutral and zwitterionic surfactants tested were poor solubilisers of loratadine. The dissolution profiles in FaSSIF and in FeSSIF were matched for one product (Brand B) by using SDS and CTAB media but the profile similarity was not maintained when another product (Brand C) was tested in the same media. Variations in the manufacturing formulae and processes of these brands may be implicated in the differences observed. Despite being placed in BCS Class II, trimethoprim dissolution in phosphate buffer pH 6.8 was high (100% in 15min).
The use of milk as a biorelevant gastric medium highlighted a food effect on drug solubility and dissolution from tablets for ibuprofen and naproxen. Loratadine solubilisation in both biological and synthetic surfactant systems appears to be sensitive to formulation factors. The BCS criteria for solubility classification are inappropriate for trimethoprim in the physiologically relevant pH range 1.2-6.8,
ii

"It is the mark of an educated mind to be able to entertain a thought without accepting it. "
Aristotle (384BC -- 322BC)
111

This thesis is dedicated to my family:
Upen, Nirupa, Niraj and Snehal
for their continuous love, support and encouragement and for the difficult years apart.
iv

ACKNOWLEDGEMENTS
I would like to convey my deepest gratitude to my supervisor, Dr Mark Dyas, who has been very supportive throughout the three years. His attention and assistance
ensured that this project stayed on track. He has been a great mentor from whom I
have learnt so much and his encouragement and friendship kept me motivated
through the difficult periods. I can only hope that I was not the cause of much stress
and that I lived up to any (good! ) expectations he had coming into this supervisory
role. Mark, I hope you enjoyed the journey!
Heartfelt thanks also go to Prof Jim Ford, my second supervisor. His wisdom and
experience lent much assistance to this project and his comments and advice were
always appreciated. Thank you also for always making time for discussions despite
the many obligations of your new role as Director and especially in the interim
handover period.
I would also like to express my gratitude to my industrial supervisors Gorkhn
Sharma-Singh and George Kirk at AstraZeneca (Alderley Park) for their input and helpful comments. Their industrial perspectives in this area of research were invaluable. They, together with everyone in the Preformulation and Biopharmaceutics department, were very welcoming and helpful during my
placement, which I thoroughly enjoyed. Thanks to Gorkhn for his daily efforts
whilst I was at Alderley Park and his assistance in the labs to ensure my work did
not stop.
A generous donation of trimethoprim drug substance was made by Alpharma Ltd (Barnstaple, U. K) and of loratadine drug substance by Ranbaxy Laboratories Ltd (Hamachal Pradesh, India).
Paul Wright and his engineering team at JMU were exceptionally helpful in
providing technical assistance and in troubleshooting equipment related issues,
without which my work would have been significantly delayed. I am indebted to the
V
team in the workshop. Thank you all for engaging in discussion with me and not
ultimately pulling down the shutters when you saw me approaching!
Dr John Satherley at the University of Liverpool was very gracious in allowing me
to use their surface tension measuring equipment. He gave up his time in training
me how to use the equipment and run the software as well as engaging in useful discussion. Much appreciated.
Nicola Dempster, Senior Research Officer at JMU, was always extremely
accommodating, provided technical assistance at short notice and helped to ensure
my work was not delayed, undoubtedly at times, at the cost of hers. Nicola, your kindness will never go unnoticed.
Thanks to Giles Edwards, Alan Ricketts, Carole Savage and Jimmy Wilson for all
their assistance over the three years.
I was also very fortunate to be able to rekindle old friendships and form new ones during this PhD. In this respect I would like to thank Matthew Roberts, Melissa
Pasquali, Philip Denton and Philip Riby. Their friendship, support, encouragement, lunchtime humour and corridor comic relief was truly the source of my energy. I
will miss them all immensely.
To Paresh Lad and Paul Shaughnessy, thank you so much for constantly coming to
my rescue regarding hardware and software issues and for answering my late night
calls. Thank you also for putting up with my preoccupations and absences over the last few years and being great friends.
Finally, I would like to express my gratitude to the Royal Pharmaceutical Society of Great Britain and AstraZeneca who co-sponsored this PhD project. This work could not have been carried out without their financial support.
V1
CONTENTS
Title Page
Abstract
Quote
Dedication
Acknowlegements
Content
List of Figures
List of Tables
List of Abbreviations
Chapter 1. Introduction
1.1. Drug Dissolution 1.1.1. Solubility and dissolution
1.1.2. Thermodynamics of dissolution
1.1.3. Mechanisms of dissolution
1.1.4. Intrinsic Dissolution Rate (IDR)
1.1.4.1. Factors affecting the intrinsic dissolution rate 1.1.4.1.1. Polymorphism and salvation 1.1.4.1.2. Wetting
1.1.4.1.3. Solubilisation
1.1.4.1.4. Complexation
Tldonor/ITacceptor complexes Cyclodextrin complexes
1.1.4.1.5. The effect of pK,, pH and buffer capacity
11
iii iv
V
vii
xv xx
xxiii
1
1
1
3
4
8
9
10
11
13
14
14
14
15
vii
1.1.4.1.6. Salt form of the drug 16
1.1.4.1.7. Electrolytes in the dissolution medium and the common ion 17
effect
1.1.4.1.8. Experimental variations 17
1.1.4.1.9. Physiological factors affecting IDR 18
1.1.4.2. Method of determining IDR 18
1.1.4.2.1. Intrinsic dissolution method (USP <1087>) 18
1.2. Disintegration as a prerequisite for dissolution from solid oral dosage forms 21
1.2.1. Tablet disintegration 21
1.2.2. Disintegration Testing 22
1.3. Dissolution Testing 24 1.3.1. Compendia) Testing Methods 25
1.3.1.1. Basket Apparatus (USP Apparatus 1) 25
1.3.1.2. Paddle Apparatus (USP Apparatus 2) 27
1.3,1.3. Reciprocating Cylinder Apparatus (USP Apparatus 3) 28
1.3.1.4. Flow-through Cell Apparatus (USP Apparatus 4) 29
1.3.1.5. Reciprocating Holder Apparatus (USP Apparatus 7) 32
1.3.2. Sample Collection and Analysis 32
1.3.2.1. Sample collection 32
1.3.2.2. Assay methods 34
1.3.2.2.1. Fibre-optic technology 34
1.3.3. Data Presentation and Interpretation 35
1.3.4. Operational factors that may affect the dissolution test 37
1.3.4.1. Vibration 37
1.3.4.2. Alignment of the Stirrer Shaft 38
1.3.4.3. Vessel Design and Construction 38
1.3.4.4. Sampling Procedures 39 1.3.4.5. Temperature Control 40 1.3.4.6. Deaeration of the Dissolution Medium 40
viii

1.3.4.7. Variation in Speed of Agitation
1.3.5. Standardisation and Calibration
1.3.6. Other Variables In Compendial Methods
1.3.7. Dissolution Media
1.3.8. Dissolution Testing of Selected Dosage Forms
1.3.8.1. Dissolution Testing Versus Drug Release Testing
1.3.8.2. Immediate-release Tablets and Capsules
1.3.8.3. Delayed-release (Enteric-coated) Tablets and Capsules
1.3.8.4. Drug Release From Modified-release Dosage Forms
1.3.8.5. Granules and Suspensions
1.3.9. Robotics and Automation
1.4. In Vitro -In Vivo Correlation
1.5. Biopharmaceutics Classification System (BCS) 1.5.1. The Impact of the BCS Solubility and Dissolution Rate Criteria on
Drug Discovery and Development
1.6. Regulatory Developments
1.7. Harmonisation
1.8. Aims and Objectives
Chapter 2. Materials and General Methods
2.1. Materials 2.1.1. Drug substances 2.1.2. Marketed drug products 2.1.3. Ingredients used in solubility screens and dissolution media
41
41
42
43
45
45
45
46
47
49
50
50
51
54
56
56
56
58
58
58
59
60
ix

2.1.4. Drug extraction and mobile phase solvents 2.1.5. Filters
2.2. General Experimental Methods
2.2.1. Solubility determinations 2.2.1.1 Ibuprofen and naproxen 2.2.1.2. Loratadine
2.2.1.3. Trimethoprim
2.2.2. Disintegration testing
2.2.3. Dissolution testing
2.2.4. Intrinsic dissolution rate determinations
2.2.5. Drug extraction from dissolution media
2.2.5.1. Extraction of ibuprofen
2.2.5.2. Extraction of naproxen
2.3. Analytical Methodology 2.3.1. HPLC
2.3.1.1. Ibuprofen
2.3.1.2. Loratadine
2.3.1.3. Naproxen
2.3.1.4. Trimethoprim
Chapter 3. Determination of the surface tensions of the
dissolution media investigated
3.1. Introduction
3.2. Methods 3.2.1. Density measurements 3.2.2. Surface tension measurements
62
62
63
63
63
63
64
64
65
65
66
66
67
67
67
67
68
68
69
70
70
71
71
71
X

3.3. Results 74
3.4. Discussion 75
Chapter 4. Ibuprofen 77
4.1. Introduction 77
4.2. Materials and Methods 78 4.2.1. Materials 78
4.2.2. Methods 79
4.3. Results and discussion 80
4.3.1. Dissolution in compendial media 80
4.3.2. Effect of milk based media and milk components on the dissolution of
ibuprofen tablets 82
4.3.2.1. Effect of lipid content 82
4.3.2.2. Effect of soluble non-lipid components 84
4.3.2.3. Effect of lactose 87
4.3.2.4. Effect of casein 87
4.3.3. Intrinsic dissolution rate, solubility and disintegration studies 90
4.4. Conclusion 96
Chanter 5. Naproxen 97
5.1. Introduction 97
R1

5.2. Materials and Methods
5.2.1. Materials 5.2.2. Methods
5.3. Results and Discussion
5.3.1. Solubility Data 5.3.2. IDR Determinations
5.3.3. Tablet dissolution studies
5.4. Conclusion
Chapter 6. Loratadine
6.1. Introduction
6.2. Materials and Methods
6.2.1. Materials 6.2.2. Methods
6.3. Results and Discussion 6.3.1. pH-solubility profile and pH shift experiments 6.3.2. Solubility and dissolution in FaSSIF, FeSSIF and constituents 6.3.3. Solubility screen and dissolution in surfactant based media 6.3.4. Disintegration behaviour of different tablet brands
6.3.5. Dissolution profile matching using loratadine brands B and C
6.4. Conclusion
98
98
98
99
99
100
105
109
110
110
111
111
111
114
114
118
121
127
128
136
X11

Chapter 7. Trimethoprim
7.1. Introduction
7.2. Materials and Methods 7.2.1. Materials
7.2.2. Methods
7.3. Results and Discussion
7.4. Conclusion
Chapter 8. General Discussion
8.1. Dissolution testing in physiological conditions
8.2. Surface tension of dissolution media
8.3. Dissolution of ibuprofen and naproxen tablets in milk-based
media
8.4. Loratadine dissolution
8.5. Development of biorelevant intestinal media
8.6. Solubility categorization of drugs in the BCS
137
137
138
138
138
138
142
143
143
144
145
146
147
147
X111

Chapter 9. General Conclusions and Future Work 149
9.1. General Conclusions 149
9.2. Recommendations for Future Work 150
References
Appendices
153
xxvii
xiv
LIST OF FIGURES
CHAPTER 1 Page
Figure 1.1. Schematic illustration of the dissolution of a drug particle in
gastrointestinal fluids 5
Figure 1.2. Illustration of the forces acting on a solid partially immersed in liquid 11
Figure 1.3. Schematic of rotating disk IDR apparatus (Woods apparatus) 19
Figure 1.4. Schematic of a stationary disk IDR apparatus
Figure 1.5. Tooling used to produce disks for IDR testing
Figure 1.6. Mechanism of the drug release process from a tablet by disintegration
and dissolution
19
20
22
Figure 1.7. Schematic of the basket rack assembly of the Disintegration Test
apparatus 24
Figure 1.8. The basket stirring element of USP 28 (Apparatus 1)
Figure 1.9. The paddle stirring element of USP 28 (Apparatus 2)
26
27
Figure 1.10. Typical sinker designs. (a) 3-prong sinker, (b) JP basket sinker, (c) helical-spring sinker 28
Figure 1.11. The reciprocating cylinder apparatus of USP 28 (Apparatus 3) 29
Figure 1.12. Schematic diagram of a flow-through dissolution cell 30
xv

Figure 1.13. Typical apparatus set-up for on-line UV measurement of dissolution 33
Figure 1.14. Hypothetical dissolution profile showing the determination of tro% tso%,
t70% and t85% 36
CHAPTER 3
Figure 3.1. Schematic of pendant drop shape apparatus to measure surface tension 73
CHAPTER 4
Figure 4.1. The chemical structure of ibuprofen
Figure 4.2. The effect of three typical dissolution media (O. 1N HCI, HCl-SDS and SIF) on the dissolution of ibuprofen 400mg tablets (n=6)
Figure 4.3. The effect of 50/50 milk/HCl mixtures, HCI pH 1.2, HCI pH 2.5 and HCI-0.017% w/v SDS (pH 2.5) media on the dissolution of ibuprofen
400mg tablets (n=6)
Figure 4.4. The effect of skimmed milk, 50/50 skimmed milk/water, 50/50
skimmed milk/HCl pH 2.5 and SIF on the dissolution of ibuprofen
400mg tablets (n=6)
Figure 4.5. The effect of HCl pH 2.5,4.8% w/v lactose, 1.475% w/v casein and 1.475%w/v casein filtrate in HCl pH 2.7 on the dissolution of ibuprofen
400mg tablets (n=6)
Figure 4.6. Comparison of fluorescence and UV detection in the liquid
chromatographic determination of ibuprofen
77
81
83
86
89
90
xvi

Figure 4.7. The effect of 50/50 milk-HCI mixtures, 1.475% w/v casein filtrate in
HCI pH 2.7, HCI-0.017% w/v SDS pH 2.7 and HCI pH 1.2 on the
dissolution of ibuprofen from compressed disks (n=6)
CHAPTER 5
92
Figure S. I. The chemical structure of naproxen 97
Figure 5.2. The effect of 50/50 milk/HCI mixtures, 1.475% w/v casein filtrate in
HCl pH 2.7, HCl-0.017% w/v SDS pH 2.7 and 0.1N HCl media on the
dissolution of naproxen from compressed disks (n=6)
Figure 5.3. Example illustrations of the linear regression fit applied to dissolution
data from rotating disks of naproxen in HCl-0.017% w/v SDS pH 2.7,
0.1N HCl pH 1.2 and 50/50 semi-skimmed milk/HCl to calculate the
IDR
Figure 5.4. Effect of 50/50 milk/HCl mixtures, 1.475% w/v casein filtrate in HCl
pH 2.7, HCl-0.017% w/v SDS and 0.1N HCl media on the dissolution
of Naproxen 250mg tablets (n=6)
CHAPTER 6
Figure 6.1. The chemical structure of loratadine
Figure 6.2. Effect of NaSIF, HCl-0.017% w/v SDS pH 1.2 and 2.5, O. 1N HCl (with
pH shifted from 1.2 to 7.3) and HCl-0.25% w/v SDS (with pH shifted from 1.2. to 7.3) on the dissolution of Loratadine 10mg tablets
(BrandA) (n=6)
103
104
106
110
116
xvii

Figure 6.3. The effect of Fasted state simulated intestinal fluid (FaSSIF), Fed state
simulated intestinal fluid (FeSSIF) and 0.825% w/v sodium
taurocholate (NaTC) media on the dissolution of loratadine 10mg
tablets (Brand A) (n=6) 120
Figure 6.4. Effect of CHAPSO concentration on the solubility of loratadine in
FeSSIF blank (pH 5.0) and FaSSIF blank (pH6.5) (n=2) 124
Figure 6.5. The effect of proposed biorelevant media (FaSSIF and FeSSIF) and
synthetic surfactant media (CTAB, SDS and Cremophor EL) on the
dissolution of loratadine 10 mg tablets (Brand A) 126
Figure 6.6. Effect of FaSSIF and FeSSIF media on the dissolution of three
loratadine 10 mg tablet brands (A, B and C) (n=3) 129
Figure 6.7. Effect of FaSSIF, FeSSIF and CTAB media on the dissolution of Brand
B loratadine 10 mg tablets (n=3) 130
Figure 6.8. Effect of FaSSIF, FeSSIF and SDS media on the dissolution of Brand B
loratadine 10 mg tablets (n=3) 131
Figure 6.9. Effect of FaSSIF, FeSSIF and CTAB media on the dissolution of Brand
C loratadine 10 mg tablets (n=3) 133
Figure 6.10. Effect of FaSSIF, FeSSIF and SDS media on the dissolution of Brand C
loratadine 10 mg tablets (n=3)
Figure 6.11. Chemical structures of surfactants used in FaSSIF, FeSSIF, CTAB and SDS dissolution media
134
135
xviii
CHAPTER 7
Figure 7.1. The chemical structure of trimethoprim 137
Figure 7.2. Effect of phosphate buffer (pH 6.8) on the dissolution of trimethoprim
from a 200mg tablet brand and 200mg of drug substance (API) (n=6) 140
xix

LIST OF TABLES
CHAPTER 1
Table 1.1. Quantitative description of commonly used solubility terms
Table 1.2a. Typical FaSSIF Medium
Table 1.2b. Typical FeSSIF Medium
Table 1.3. The Biopharmaceutics Classification System
CHAPTER 2
Table 2.1. Drug substances used
Table 2.2. Marketed drug products used
Table 2.3. List of materials used
Table 2.4. Drug extraction and mobile phase solvents used
Table 2.5. Filters used for sample collection procedures
CHAPTER 3
Table 3.1. Density and surface tension data for dissolution media investigated
Page
2
44
45
53
58
59
60
62
62
74
xx

CHAPTER 4
Table 4.1. IDR of ibuprofen in various media
Table 4.2. Solubility determinations of ibuprofen in various media at 37°C
Table 4.3. Disintegration times for ibuprofen 400mg tablets in various media
CHAPTER 5
Table 5.1. Solubility determinations of naproxen in various media at 37°C
Table 5.2. IDR of naproxen in various media
Table 5.3. Disintegration times for naproxen 250mg tablets in various media
CHAPTER 6
Table 6.1. Concentrations of the surfactants used in the loratadine solubility study
and their cmc values
Table 6.2. pH-related solubility determinations of loratadine at 37°C
Table 6.3a. Solubility of loratadine in fasted state media at 37°C
Table 6.3b. Solubility of loratadine in fed state media at 37°C
Table 6.4a. Solubility of loratadine in FaSSIF blank- surfactant media
93
93
94
99
101
107
113
114
119
119
122
xxi

Table 6.4b. Solubility of loratadine in FeSSIF Blank- surfactant media
Table 6.5. Solubilising capacity of synthetic surfactants for loratadine at 37°C
based on 24h solubility data
Table 6.6. Disntegration times of three marketed loratadine tablet brands at various
pH values
Table 6.7. Comparison of the cost of dissolution testing media
CHAPTER 7
Table 7.1. pH related solubility determination of trimethoprim at 37°C
122
123
127
128
139
xxii

LIST OF ABBREVIATIONS
% percent
w/v weight per volume
w/w weight per weight
°C degree Celsius
® Registered Tradename
ý? _ greater than or equal to
5 less than or equal to
approximately
p density
II pi
7 surface tension
? s/A solid surface tension
Ys/, solid-liquid interfacial tension
? uA liquid surface tension
0 contact angle
AHs enthalpy of solution
AG Gibbs free energy
AS change in entropy
v kinematic viscosity
angular velocity
A surface area ADME absorption, distribution, metabolism and excretion ANDA abbreviated New Drug Application
BA bioavailability
BE bioequivalence
BP British Pharmacopoeia
BCS Biopharmaceutics Classification System
C concentration
xxiii

CCD charge-coupled device
cm centimetre
cmc critical micelle concentration Co intrinsic solubility CS saturation solubility CDs Cyclodextrins
CTAB hexadecyltrimethyl ammonium bromide
dm/dt change in mass with time
D diffusion coefficient. DSC differential scanning calorimetry EMEA European Medicines Agency
FaSSIF Fasted state simulated intestinal fluid
FeSSIF Fed state simulated intestinal fluid
FDA Food and Drug Administration
g gram GI gastro-intestinal GIT gastro-intestinal tract hi thickness of boundary layer
h hour
HCl hydrochloric acid HPLC high performance liquid chromatography HPMC hydroxypropyl methylcellulose ICH International Conference on Harmonisation
IDR intrinsic dissolution rate IR immediate-release
IVIVC in vitro-in vivo correlation k intrinsic dissolution rate constant kl effective interfacial rate constant k2 cube root dissolution rate constant Ka ionisation constant kilogram kg
pH negative log of the hydrogen ion concentration
pKa negative log of the ionisation constant JP Japanese Pharmacopoeia
xxiv
L litre
LOD limit of detection
M Molar
MCC microcrystalline cellulose
RL microlitre
Rm micrometer
mg milligram
min minute
mL millilitre MLGM milk lipid globule membrane
mm millimetre
mOsm milliOsmol
mm millimole
mN/m milliNewtons per metre N Normal
NaSIF sodium based simulated intestinal fluid
NaTC sodium taurocholate
NDA New Drug Application
nm nanometer NMR nuclear magnetic resonance NSAID non-steroidal anti-inflammatory drug
PVP polyvinylpyrrollidone Q the minimum percentage-dissolved at time stipulated in monograph. QC quality control
q. s. quantum sufficit (as much as suffices) R&D research and development
rpm revolutions per minute
s second S mean rate of production of fresh surface SANS small-angle neutron scattering SDS sodium dodecyl sulphate SIF simulated intestinal fluid
SUPAC scale up and post approval changes
xxv

T temperature
TRFQ time-resolved fluorescence quenching
tX , time taken for x% to dissolve
USP United States Pharmacopoeia
UV ultraviolet
WO initial weight of a particle
w weight of a particle
xxvi

1. INTRODUCTION
The process of dissolution and the methods of dissolution testing are fundamental
topics that need to be appreciated in order to further probe dissolution phenomena
occurring in pharmaceutical compounds. Scientific and technological advances in
discovery and development programmes in the industry have instigated a need to
characterise dissolution behaviour earlier in the product development lifecycle.
Such information could lead to the synthesis of more soluble compounds or the
formulation of more soluble products to improve bioavailability. From a viewpoint
of dissolution, the aims are to assess changes in the dissolution behaviour and hence
potential bioavailability of candidate drugs, to formulate a drug product from which
drug absorption is not dissolution rate limited, and further, to be able to predict in
vivo drug dissolution performance using in vitro methods. This chapter introduces
the basic concepts and theory of dissolution and dissolution testing, together with
the factors that affect them and related issues, leading to the aims and objectives of
this research project.
1,1. Drug dissolution
1.1.1. Solubility and dissolution
Unless a drug is administered directly into the blood stream intravenously, it must be absorbed into the systemic circulation from its site of administration. On reaching
the systemic circulation a drug may partition between erythrocytes and blood
plasma. Furthermore, the drug in blood plasma may bind to plasma protein or
remain in plasma water. The unbound drug is free to be distributed to tissues and
sites of action (Proudfoot, 1988a). The absorption, and thus bioavailability, of drugs
from oral dosage forms depend on a variety of drug and formulation factors as well
as the physiological condition of the gastro-intestinal tract (GIT). Essentially, for a drug to be absorbed into the blood stream it must first dissolve in the gastric or intestinal fluid and then cross the mucosal membrane via para- or trans-cellular
1

mechanisms that range from passive diffusion to complex carrier mediated transport. Thus, the dissolution rate of a drug in these fluids can be the rate-limiting
step to absorption, especially for poorly water-soluble drugs.
Before considering the factors that affect dissolution, it is important to clarify what is meant by solubility and to understand the dissolution process itself. Solubility can be defined as the number of molecules or ions that move from the solid state into
solution until equilibrium is reached under a given set of experimental conditions. The process of transfer is termed dissolution. Carstensen (2001) confirmed concerns
about the definition of solubility, assuming that when solubility is referred to, it is
meant to be the equilibrium solubility. This is when a solid and solvent are agitated together for a sufficiently long period of time for the concentration of solute in the
solvent to have reached a constant level.
Solubility is temperature dependent and small fluctuations in the experimental temperature can affect the solubility results for a compound. Also, solubility may be
a function of the particle size (surface area increases with decreasing particle size) (Atkinson et al., 1962; Fincher, 1968) and the existence of polymorphs and
amorphates (Shaw et al., 1973). Literature also refers to degrees of solubility e. g.
poorly soluble. What does this mean? The United States Pharmacopoeia 28 (2005)
describes some of these subjective terms (Table 1.1).
Table 1.1. Quantitative description of commonly used solubility terms
Solubility term weight of solvent (g) required to dissolve 1g of solute
Very soluble <1 Soluble 10-30 Sparingly soluble 30-100 Slightly soluble 100-1000 Very slightly soluble 1000-10 000 Practically insoluble >10 000
2
Aqueous solubility is a function of the ability of a non-ionic compound to form
hydrogen bonds with water molecules and generally is directly proportional to the
number of bonds that can be formed with water (Martinez et al., 2002).
Dissolution requires bond-breaking and bond-forming processes to allow drug
molecules to move away from the solid structure and interact with the solvent. The
energy changes associated with such processes are the thermodynamic basis of
dissolution.
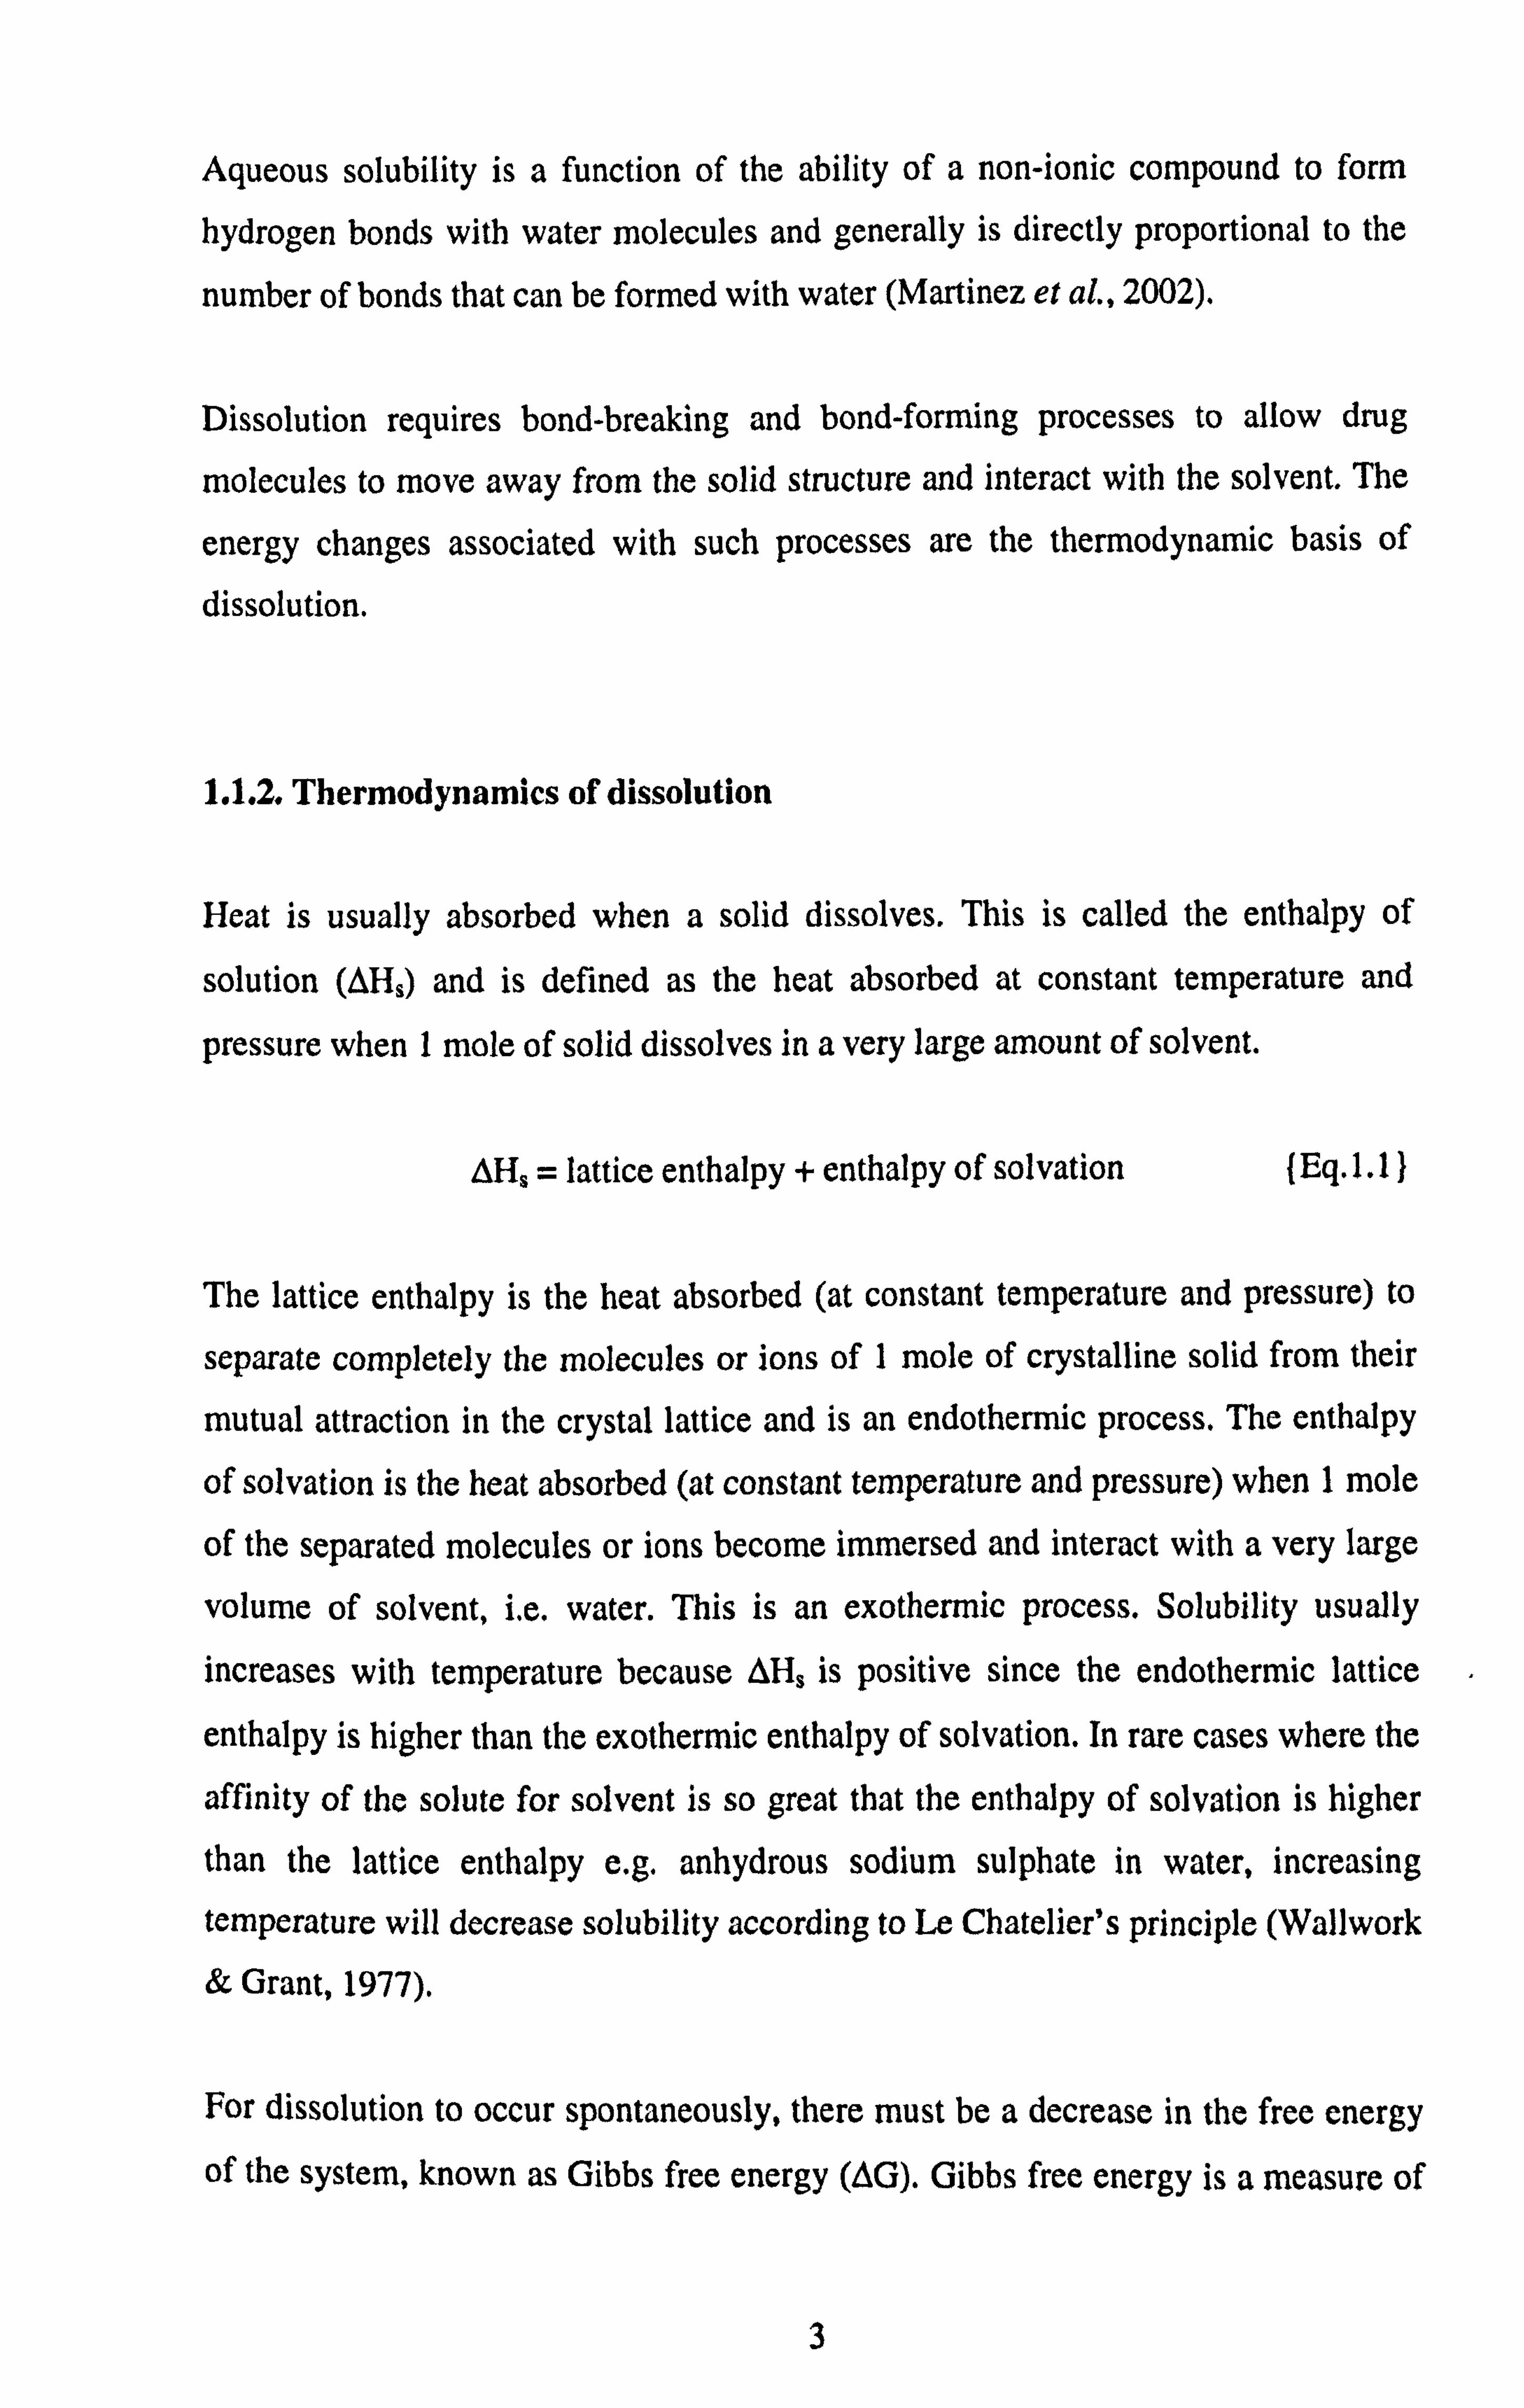
1.1.2. Thermodynamics of dissolution
Heat is usually absorbed when a solid dissolves. This is called the enthalpy of
solution (AHs) and is defined as the heat absorbed at constant temperature and
pressure when 1 mole of solid dissolves in a very large amount of solvent.
AH, = lattice enthalpy + enthalpy of solvation (Eq. 1.1}
The lattice enthalpy is the heat absorbed (at constant temperature and pressure) to
separate completely the molecules or ions of I mole of crystalline solid from their
mutual attraction in the crystal lattice and is an endothermic process. The enthalpy
of solvation is the heat absorbed (at constant temperature and pressure) when 1 mole
of the separated molecules or ions become immersed and interact with a very large
volume of solvent, i. e. water. This is an exothermic process. Solubility usually
increases with temperature because AH, is positive since the endothermic lattice
enthalpy is higher than the exothermic enthalpy of solvation. In rare cases where the
affinity of the solute for solvent is so great that the enthalpy of solvation is higher
than the lattice enthalpy e. g. anhydrous sodium sulphate in water, increasing
temperature will decrease solubility according to Le Chatelier's principle (Wallwork
& Grant, 1977).
For dissolution to occur spontaneously, there must be a decrease in the free energy
of the system, known as Gibbs free energy (AG). Gibbs free energy is a measure of
3

the energy available in a system to do work (Richards, 1988). In this case it would be the work done to overcome the lattice energy of a solid,
OG = OH$ -TAS { Eq. 1.2 }
where T is the thermodynamic temperature and AS is the change in entropy. Entropy
is a measure of the randomness of the system and for a process like dissolution,
where molecules are no longer held in a solid structure, the randomness increases. It
follows then that if AG has to be negative for spontaneity and AS is positive for
dissolution then AH, must be negative, zero or very slightly positive (Aulton, 2002).
At a molecular level, if a solute is to be soluble in a solvent, the intermolecular
attractive forces between solute and solvent must be equivalent to or stronger than
the attractive forces between solute-solute and solvent-solvent molecules
themselves. Ionic compounds and salts dissolve in polar solvents because the
dielectric constant of the solvent weakens the attractive forces between oppositely
charged solute ions. Furthermore, the permanent dipole of the solvent results in the
introduction of new electrostatic attractions such that the ions will be surrounded by
interacting solvent molecules. In cases where non-ionic compounds have shown
aqueous solubility it is the result of hydrogen bonding of the -OH, -NH2 and -COOH groups with the solvent with the possibility of dipole-dipole attractions at other parts
of the molecule (Wallwork & Grant, 1977).
1.1.3. Mechanisms of dissolution
Dissolution experiments were first cited in the work by Noyes and Whitney (1897)
who expressed the law : "The rate at which a solid substance dissolves in its own solution is proportional to the difference between the concentration of that solution
and the concentration of the saturated solution. "
Further investigations by various workers led to the theories of dissolution described below.
4

Film Theory (Nernst & Brunner, 1904). This is a widely utilised theory in literature.
It states that if a solid is immersed in an agitated liquid and allowed to dissolve, bulk
liquid will move past the solid at a certain velocity but a layer of liquid, with
thickness hi, will surround the solid (Figure 1.1). This boundary layer is static due to
intermolecular forces at the solid/liquid interface. The concentration in the boundary
layer adjacent to the solid is the saturation solubility C and that in the bulk solution
is C. Hence, there is a concentration gradient across this layer, which obeys Fick's
first law of diffusion. This theory is the basis of the Nernst-Brunner equation that
has been extensively used in dissolution rate studies and which is described later in
this section.
Static boundary layer with thickness h,
0
1)illmiun ul dlssulred drug mulceulc Blood
lhnnilh the ssmantcunud enm ", circulation
z I
N
ýýý
Gastrointestinal membrane (site of absorption)
Figure I. I. Schematic illustration of the dissolution of a drug particle in
gastrointestinal fluids
Sur/We Renewal Theory/ Penetration Theory (Danckwerts, 1951). In the event that
the reaction rate at the solid surface is the rate-limiting step to dissolution, then the
concentration at the solid/liquid interface will actually be less than the Cs. This led
Danckwerts (1951) to disregard the existence of a stagnant boundary layer and
propose that turbulence reaches the solid surface, which is then continually being
replaced with fresh liquid. Carstensen (1974) suggested that this renewal could be
looked at as solvent molecules from the bulk diffusing through the boundary layer
5

as being the rate-limiting step. The Danckwerts equation equivalent to the Nernst-
Brunner equation is:
dC/dt = A. Sv'. Dv' . (CS-C) {Eg. l. 3 }
where dC/dt is the change in concentration with time; A is the surface area of the
solid; S is the mean rate of production of fresh surface and D is the diffusion
coefficient (Higuchi, 1967).
Interfacial Barrier Theory. In the case where the interfacial reaction at the solid
surface is much slower than the transport process to the bulk solution, the
dissolution rate is `surface controlled'. It is difficult to derive a relationship for the
dissolution rate in this situation since different crystal faces will have different
interfacial barriers (Higuchi, 1967). A general equation can be presented as:
dC/dt = A. kj. (Cs - C) {Eg. 1.4)
where k1 is the effective interfacial rate constant (Higuchi, 1967)
Double Barrier Theory. When both the interfacial reaction rate and transport rate are
of similar magnitude both processes may control the dissolution rate. Combining the
interfacial barrier and boundary layer concepts gives the equation:
dC/dt = A. D. (C1-C) {Eq. 1.5} hl. [1 +D/hiklj
where h, is the boundary layer thickness (Higuchi, 1967)
Combining the interfacial barrier and surface penetration concepts gives the
equation:
dC/dt = SV2. D". (Cs- .Q{
Eq. 1.6 } [1 + (S". Dy')/kt]
6

Returning to the film theory, the Nernst-Brunner equation (Nernst & Brunner, 1904)
can be used to describe the diffusion-controlled dissolution of a solid:
dC = D. A (C, - C) {Eq. 1.7 } dt h,
It follows then, that the factors which influence the terms of this equation will
consequently affect the dissolution rate.
During dissolution the surface area of dissolving particles will continuously change.
Hixson and Crowell (1931) derived a law which related the dissolution rate to
surface area and concentration. They expressed the particle surface as proportional
to weight and introduced the Hixson-Crowell cube root law equation (Hixson &
Crowell, 1931). For a spherical particle under sink conditions (see below) the
equation is written as:
k2t = Woiý_Wýh {Eq. l. 8}
where wo is the initial weight of the particle, w is the weight of the particle at time t
and k2 is the cube root dissolution rate constant.
Plotting the cube root difference (wo 1/3 - w) against time shows a linear
relationship, the slope of which gives the constant k2. For non- spherical particles
the assumptions are:
a) The dissolution characteristics of all the crystal faces are identical i. e. particles
dissolve in an isotropic fashion
b) Particles are isometric, which implies that the shape factor (a) of a particle is
independent of time.
If the bulk concentration (C) is less than 10 % of the saturated concentration i. e.
when the solute is removed from the dissolution medium at a faster rate than it
passes into solution or when the dissolution volume is sufficiently large, then `sink'
7

conditions are said to operate (Richards, 1988). The Nernst-Brunner equation (Equation 1.7) can then be approximated to:
dC = D. A. Cý (Eg. 1.9) dt ht
However, during the dissolution of tablets, disintegration, deaggregation and dissolution causes the effective surface area to continuously change therefore the dissolution rate is measured as the total amount of drug dissolved per unit time
(mg/min) (Wells & Aulton, 1988).
1.1.4. Intrinsic Dissolution Rate
The intrinsic dissolution rate (IDR) of a pure substance is the rate at which it
dissolves from a constant surface area whilst the temperature, agitation, pH and ionic strength of the dissolution medium are kept constant. Thus, for a drug
substance, the IDR is independent of formulation factors and measures the inherent
dissolution rate of the drug in the dissolution medium. IDR determinations can be
used to characterise bulk drug substances and excipients and to test the chemical
equivalence of active pharmaceutical ingredients synthesised by different processes. They can also provide an important insight into the dissolution behaviour of a drug
in physiological conditions or distinguish whether changes in the dissolution profile
of a drug product in various biorelevant media are due to interactions between the
medium and formulation excipients or medium and drug substance or both. Subsequently, this test has a place in the screening of drug candidates for further
development. Yu et al (2004) discussed the feasibility of using IDR (as opposed to
saturation solubility data) to place drugs in a Biopharmaceutics Classification System (BCS) class (see Section 1.5) since in vivo drug dissolution is a dynamic rate controlled process rather than an equilibrium process.
The IDR is a key indicator of the potential bioavailability of a candidate drug before formulation, where an IDR z1. Omg/min/cm2 suggests that drug dissolution will not be the rate-limiting step to absorption whilst an IDR 50.1mg/min/cm2 suggests that
8

drug dissolution will be the rate-limiting step to absorption. An intermediate value
suggests that drug dissolution ma be the rate-limiting step to absorption. This guide
is based on stirring at 50 rpm, 37°C, pH 1-8 under sink conditions (Kaplan, 1974).
Maintenance of a constant surface is a critical requirement for IDR studies. Levy
and Sahli (1962) fixed a flat disk perpendicular to a rotating shaft exposing a single
surface to the dissolution medium. An improved rotating disk apparatus was
introduced by Wood et al (1965) and is described in Section 1.1.4.2.1.
The transport of solute in a moving liquid is governed by molecular diffusion due to
concentration differences and also by entrainment of solute molecules in the moving liquid (Levich, 1962). Combination of the two mechanisms is termed convective diffusion of a solute in a liquid. Levich (1962) proposed a convective diffusion
theory for the rate of mass transport to and from the face of a rotating disk. Fluid in
the dissolution vessel moves towards the rotating disk and a thin layer adjacent to
the disk surface acquires a rotating motion with angular velocity equal to that of the
rotating disk. Also, the thickness of the diffusion boundary layer is constant over the
disk surface such that transport of matter to and from any point on the disk is
identical (Levich, 1962). The Levich equation for the IDR is:
IDR = 0.62. Dý. (oy'. Cý
t) 1/6
tEq. 1.10}
where w is the angular velocity of the rotating disk and u is the kinematic viscosity
of the medium.
1.1.4.1. Factors affecting the intrinsic dissolution rate
The IDR assumes a constant surface area and boundary layer thickness. Hence, the Nernst-Brunner equation (Equation 1.7) simplifies to:
IDR = D. C5 } Eq. 1.11 }
Therefore, the properties of the dissolution medium that influence diffusivity and C.
will determine the IDR.
9

It is well established that the conditions in the GIT such as pH, buffer capacity,
surfactant concentration, viscosity, etc. affect the dissolution rate of drugs and
changes to these conditions including the presence of food consequently affect
absorption of a drug. Pharmacopoeial dissolution tests are not realistic
representations of the in vivo environment and there has been a move towards the
development of biorelevant media for use in dissolution testing to improve in vitro- in vivo correlations (IVIVC) (Dressman et al., 1998; Galia et al., 1998). This is
discussed further in Section 1.3.5. The factors that influence the IDR of drugs based
on the film theory of dissolution are discussed below.
1.1.4.1.1. Polymorphism and solvation
The existence of different crystal lattices for a particular drug (polymorphism) can have important consequences on bioavailability, especially if the drug is poorly
water-soluble. In a monotropic system, only one polymorph is stable below the
melting point of the drug, therefore reversible transitions between polymorphic forms are not observed below the melting point. Conversely in an enantiotropic
system, reversible transitions occur at a specific transition temperature below the
melting point, because different polymorphic forms are the most stable above and below the transition temperature (Grant, 1999). For an enantiotropic system, the
most stable polymorph at room temperature usually has the lowest solubility and
slowest dissolution rate, however, when little energy is required to convert from one form to another it is likely that these will interconvert in vivo such that
administration of either form will not impact upon the bioavailability of the drug
(Florence & Atwood, 1988).
An appropriate metastable polymorph with suitable solubility can be acquired by
manipulation of the recrystallisation process and choice of solvent but it must be
emphasised that an enhanced dissolution rate does not necessarily translate to improved bioavailibility (Haleblian et al., 1971) .A major problem with the use of metastable polymorphs is the risk of interconversion during manufacture and storage (Horter & Dressman, 2001). Manufacturing processes such as recrytallisation, comminution, granulation, drying and compaction can change the
10

crystal structure of a drug and its solubility (Brittain & Fiese, 1999). For example,
milling digoxin increases the surface area and the drug becomes amorphous, both of
which increase the saturation solubility of the drug. (Florence & Salole, 1976).
Anhydrous crystals show greater solubility and increased dissolution rates compared
to hydrates because in the hydrate the drug has already interacted intimately with
water and the energy released for crystal break-up is less when the hydrate is in
contact with the water (Florence & Atwood, 1988). Non-aqueous solvates tend to be
more soluble in water than non-solvates e. g. the n-amyl alcohol solvate of fludrocortisone is five times more soluble than the parent compound (Shefter &
Higuchi, 1963).
1.1.4.1.2. Wetting
Prior to dissolution the solvent must wet the surface of solid particles. When the
solid is first immersed in the liquid the initial wetting is referred to as ̀ immersional
wetting'. The extent of this wetting is measured by the contact angle between the
solid and liquid (Figure 1.2). For complete wetting the contact angle will be zero. This occurs when the attractive forces between solid and solvent are equal to or
greater than the attractive forces between the solvent and solvent (Florence &
Atwood, 1988). The attractive surface forces are referred to as surface tensions. The
solid surface tension (ys/A) in Figure 1.2 will tend to spread the liquid but this will be
opposed by the solid-liquid interfacial tension ('Ysn. ) and the surface tension of the
liquid in the plane of the solid (? UA).
TS/A
liquid
S
Figure 1.2. Illustration of the forces acting on a solid partially immersed in liquid.
11

This gives rise to Young's equation:
7S/A ='YS/L +'YUA COSB
where 0 is the contact angle.
IEq. 1.12)
According to Florence and Attwood (1988) once the solid is submerged in the
solvent `spreading wetting' becomes important, during which the liquid will spread
over the solid.
Surfactants are important wetting agents that can increase the solubility of drugs.
They work by lowering the surface tension of the liquid and also by adsorbing onto the powder surface thus reducing the surface tension of the solid. Both these events
reduce the contact angle (Florence & Atwood, 1988).
According to the Nernst-Brunner equation a decrease in particle size and the
subsequent increase in surface area will result in an increase in the dissolution rate. However, this may not be the case if the drug is hydrophobic and/or the dissolution
medium has poor wetting characteristics. In such situations a decrease in particle
size causes a decrease in effective surface area (Finholt, 1974). Air is adsorbed onto the hydrophobic surface of a drug powder, which then remains floating on the top of the dissolution medium. If the surface tension of the dissolution medium is reduced by the presence of surface-active components in the GIT or by the addition of synthetic surfactants then the contact angle between the drug particle and liquid
medium is reduced and the drug particle is more readily wetted. Finholt and Solvang
(1968) illustrated an increase in the dissolution rate of paracetamol using polysorbate 80 as a surfactant. They found that increasing polysorbate 80
concentration from 0.001 to 0.1% w/v had little effect on the solubility of paracetamol. The improved dissolution rate was mainly due to the ability of polysorbate 80 to reduce the interfacial tension between the solid and liquid and due
only to a small extent to the solubilising power of the surfactant. For hydrophilic drugs (e. g. aspirin) addition of a surfactant to the dissolution medium only increased
the dissolution rate when the particle size was small (0.2-0.3mm) (Finholt, 1974).
12
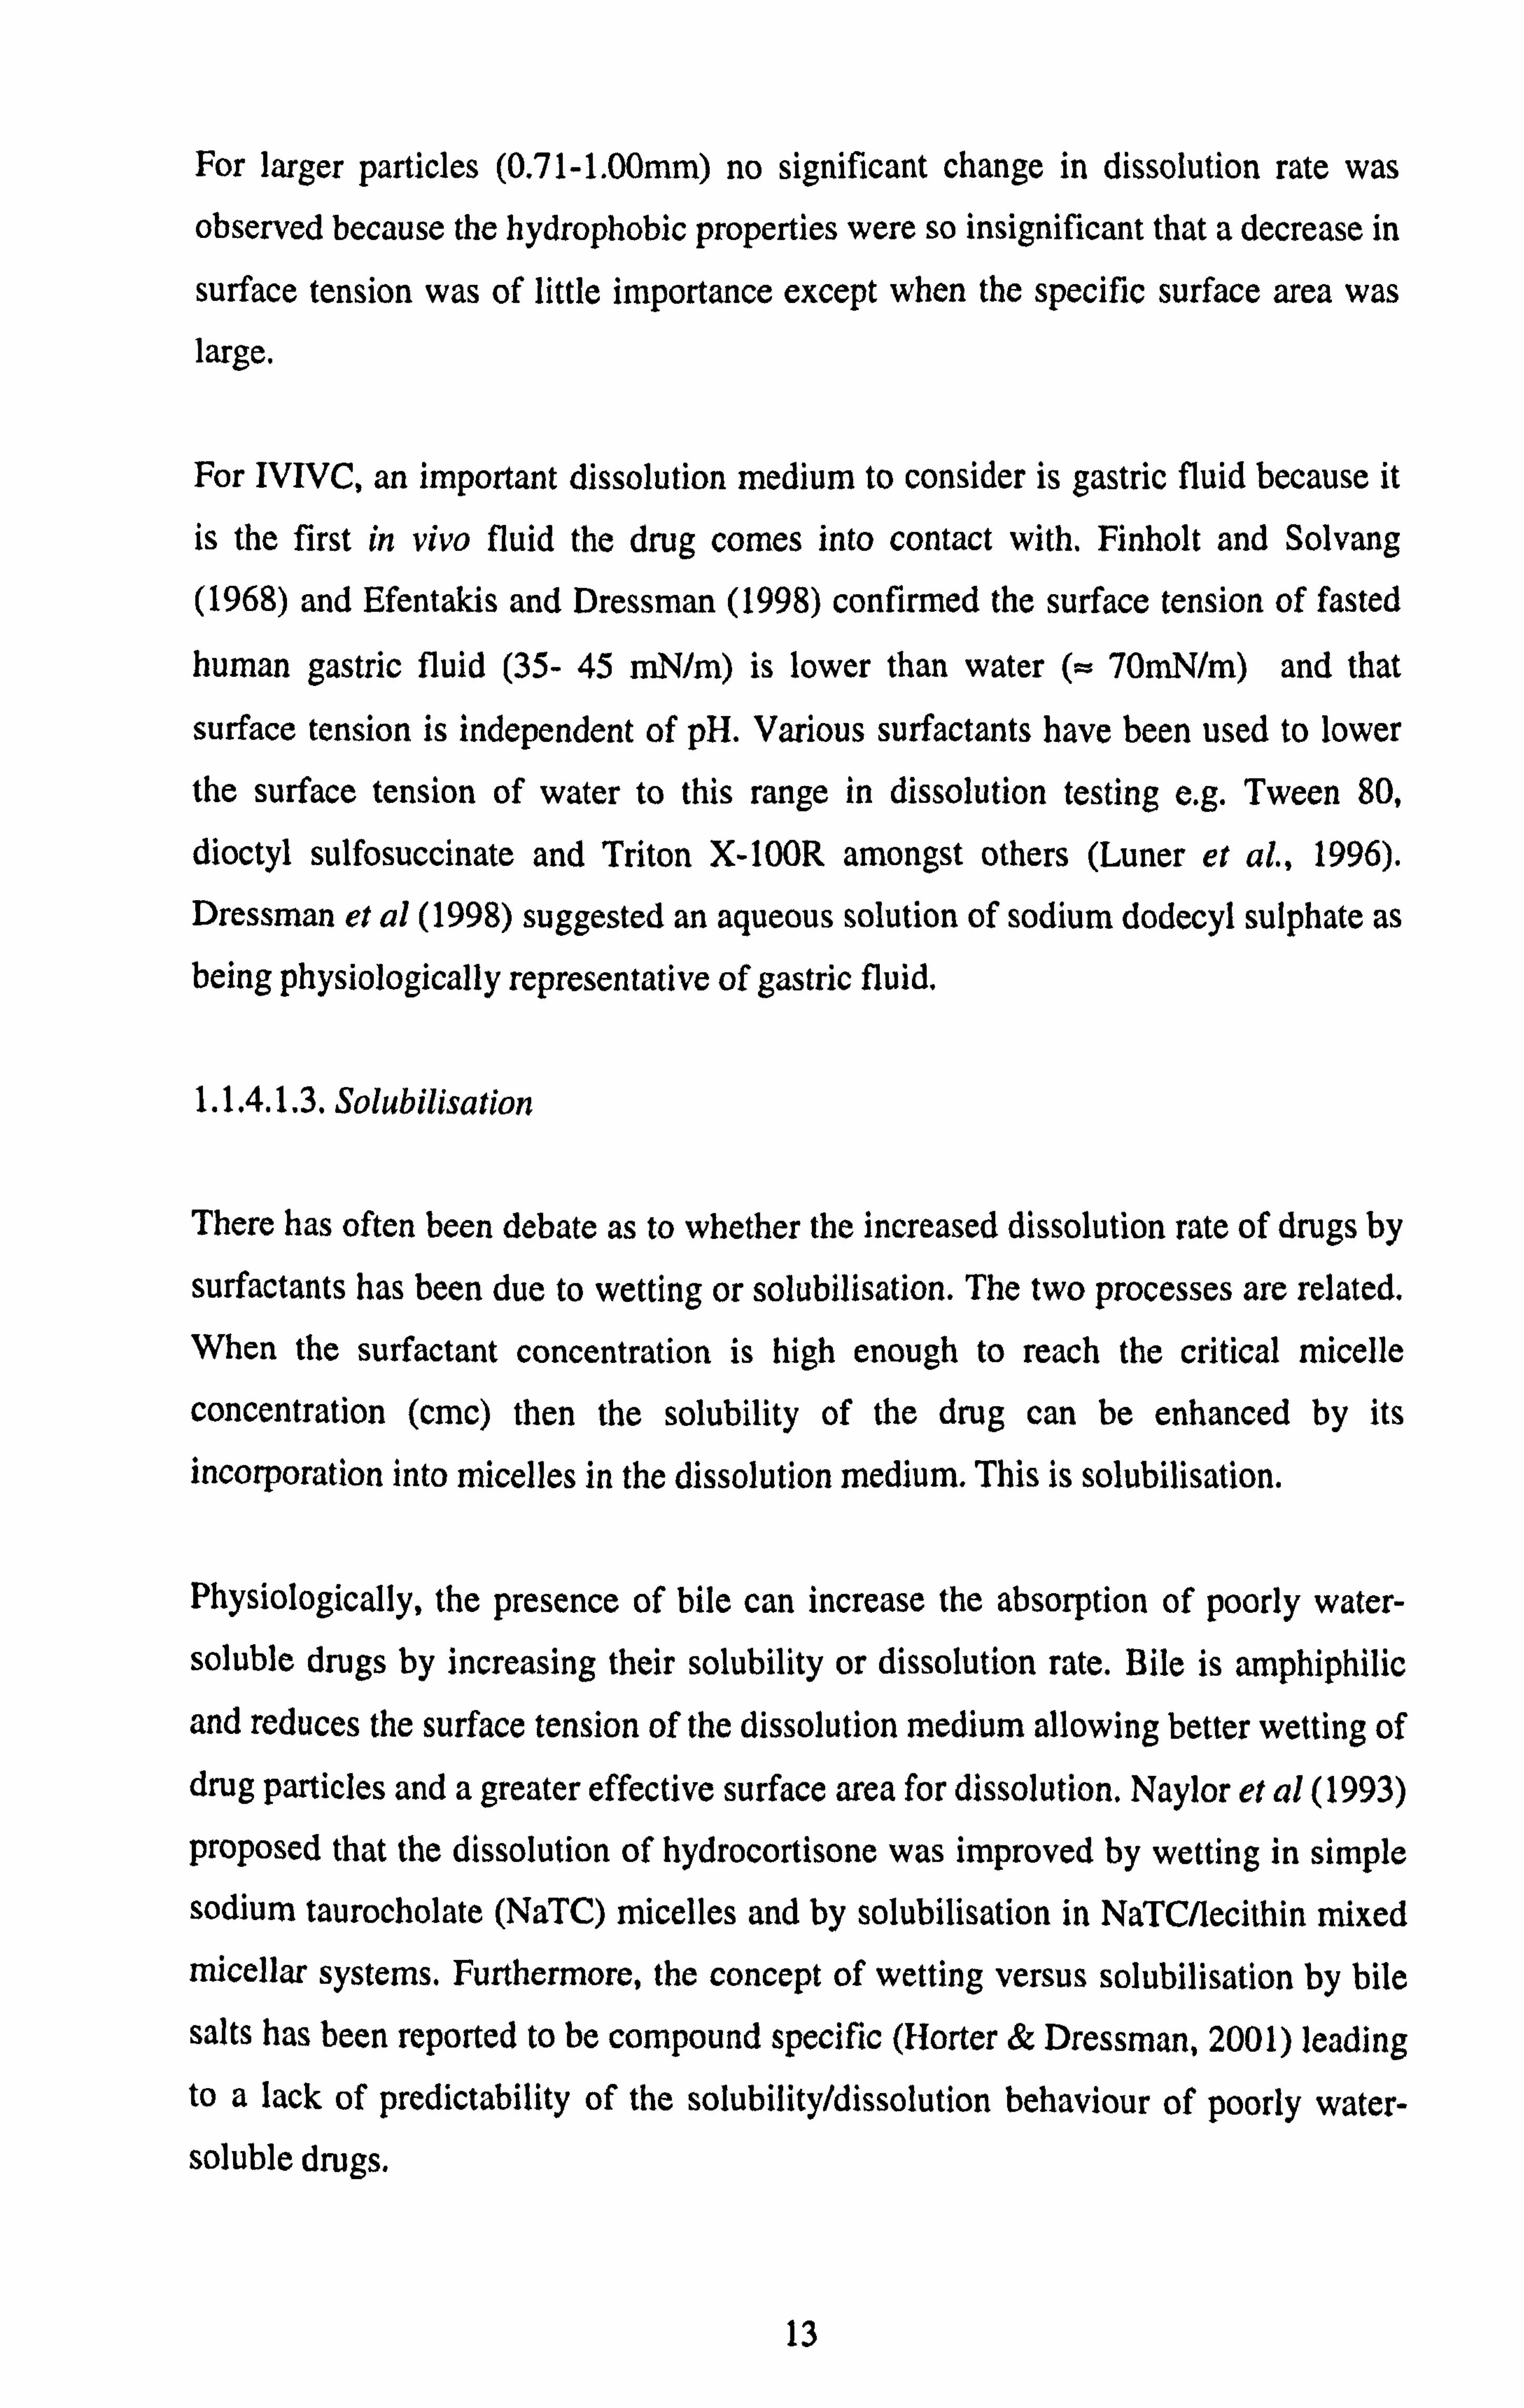
For larger particles (0.71-1.00mm) no significant change in dissolution rate was
observed because the hydrophobic properties were so insignificant that a decrease in
surface tension was of little importance except when the specific surface area was large.
For IVIVC, an important dissolution medium to consider is gastric fluid because it
is the first in vivo fluid the drug comes into contact with. Finholt and Solvang
(1968) and Efentakis and Dressman (1998) confirmed the surface tension of fasted
human gastric fluid (35- 45 mN/m) is lower than water (= 70mN/m) and that
surface tension is independent of pH. Various surfactants have been used to lower
the surface tension of water to this range in dissolution testing e. g. Tween 80,
dioctyl sulfosuccinate and Triton X-100R amongst others (Luner et al., 1996).
Dressman et al (1998) suggested an aqueous solution of sodium dodecyl sulphate as being physiologically representative of gastric fluid.
1.1.4.1.3. Solubilisation
There has often been debate as to whether the increased dissolution rate of drugs by
surfactants has been due to wetting or solubilisation. The two processes are related. When the surfactant concentration is high enough to reach the critical micelle
concentration (cmc) then the solubility of the drug can be enhanced by its
incorporation into micelles in the dissolution medium. This is solubilisation.
Physiologically, the presence of bile can increase the absorption of poorly water-
soluble drugs by increasing their solubility or dissolution rate. Bile is amphiphilic
and reduces the surface tension of the dissolution medium allowing better wetting of drug particles and a greater effective surface area for dissolution. Naylor et al (1993)
proposed that the dissolution of hydrocortisone was improved by wetting in simple sodium taurocholate (NaTC) micelles and by solubilisation in NaTC/lecithin mixed micellar systems. Furthermore, the concept of wetting versus solubilisation by bile
salts has been reported to be compound specific (Horter & Dressman, 2001) leading
to a lack of predictability of the solubility/dissolution behaviour of poorly water- soluble drugs.
13

1.1.4.1.4. Complexation
This is a method used to enhance the solubility/dissolution rate of poorly soluble drugs (Truelove et al., 1984; Tinwalla et al., 1993). The question that arises here is
at what stage of the dissolution process do these different complexing agents take
effect. In terms of the intrinsic dissolution rate, complexing agents that actively
remove molecules from the solid surface and take them into the bulk solution are of
particular interest. Unfortunately there is little differentiation as to whether the
interactions proposed are occurring between the complexing agent and solid surface,
such that there is a direct effect on the intrinsic solubility (C0), or between
complexing agent and drug particles in the boundary layer, such that there is an
increase in Cs. Two types of complexes, II donor/ 11 acceptor and cyclodextrin
complexes, are discussed below.
Ildonorl Tlacceptor complexes These are charge transfer interactions where one molecule is usually aromatic and
the other has a lone pair of electrons (donor atom) or an acidic hydrogen (acceptor
atom). Nicotinamide, a 11 acceptor, increased the solubility of poorly soluble
diazepam and progesterone via a 1TI donor/ 11 acceptor complex (Rasool et al., 1991). The greater solubilisation of benzoic acid by caffeine compared to
theophylline implicated the role of the methylated imidazole nucleus to form
hydrophobic bonds with the other component as a factor in the interaction (Higuchi
& Zuck, 1952,1953).
Cyclodextrin complexes Cyclodextrins (CDs) have received a great deal of attention over the last 20 years (Tokumura et al., 1986; Okada et al., 1988; Woodcock et al., 1993; Loftsson, 2002; Magnusdottir et al., 2002; Loftsson et al., 2003; Loftsson & Masson, 2004). The
parent compounds consist of glucose molecules arranged in a a-1,4-linked toroid,
where the hydrophilic hydroxyl groups are arranged around the outside of the
molecule whilst the internal cavity is essentially hydrophobic. Cyclodextrins form inclusion complexes with poorly soluble drug by taking up a guest molecule into the
central cavity (Loftsson & Brewster, 1996; Horter & Dressman, 2001). The drug-
14
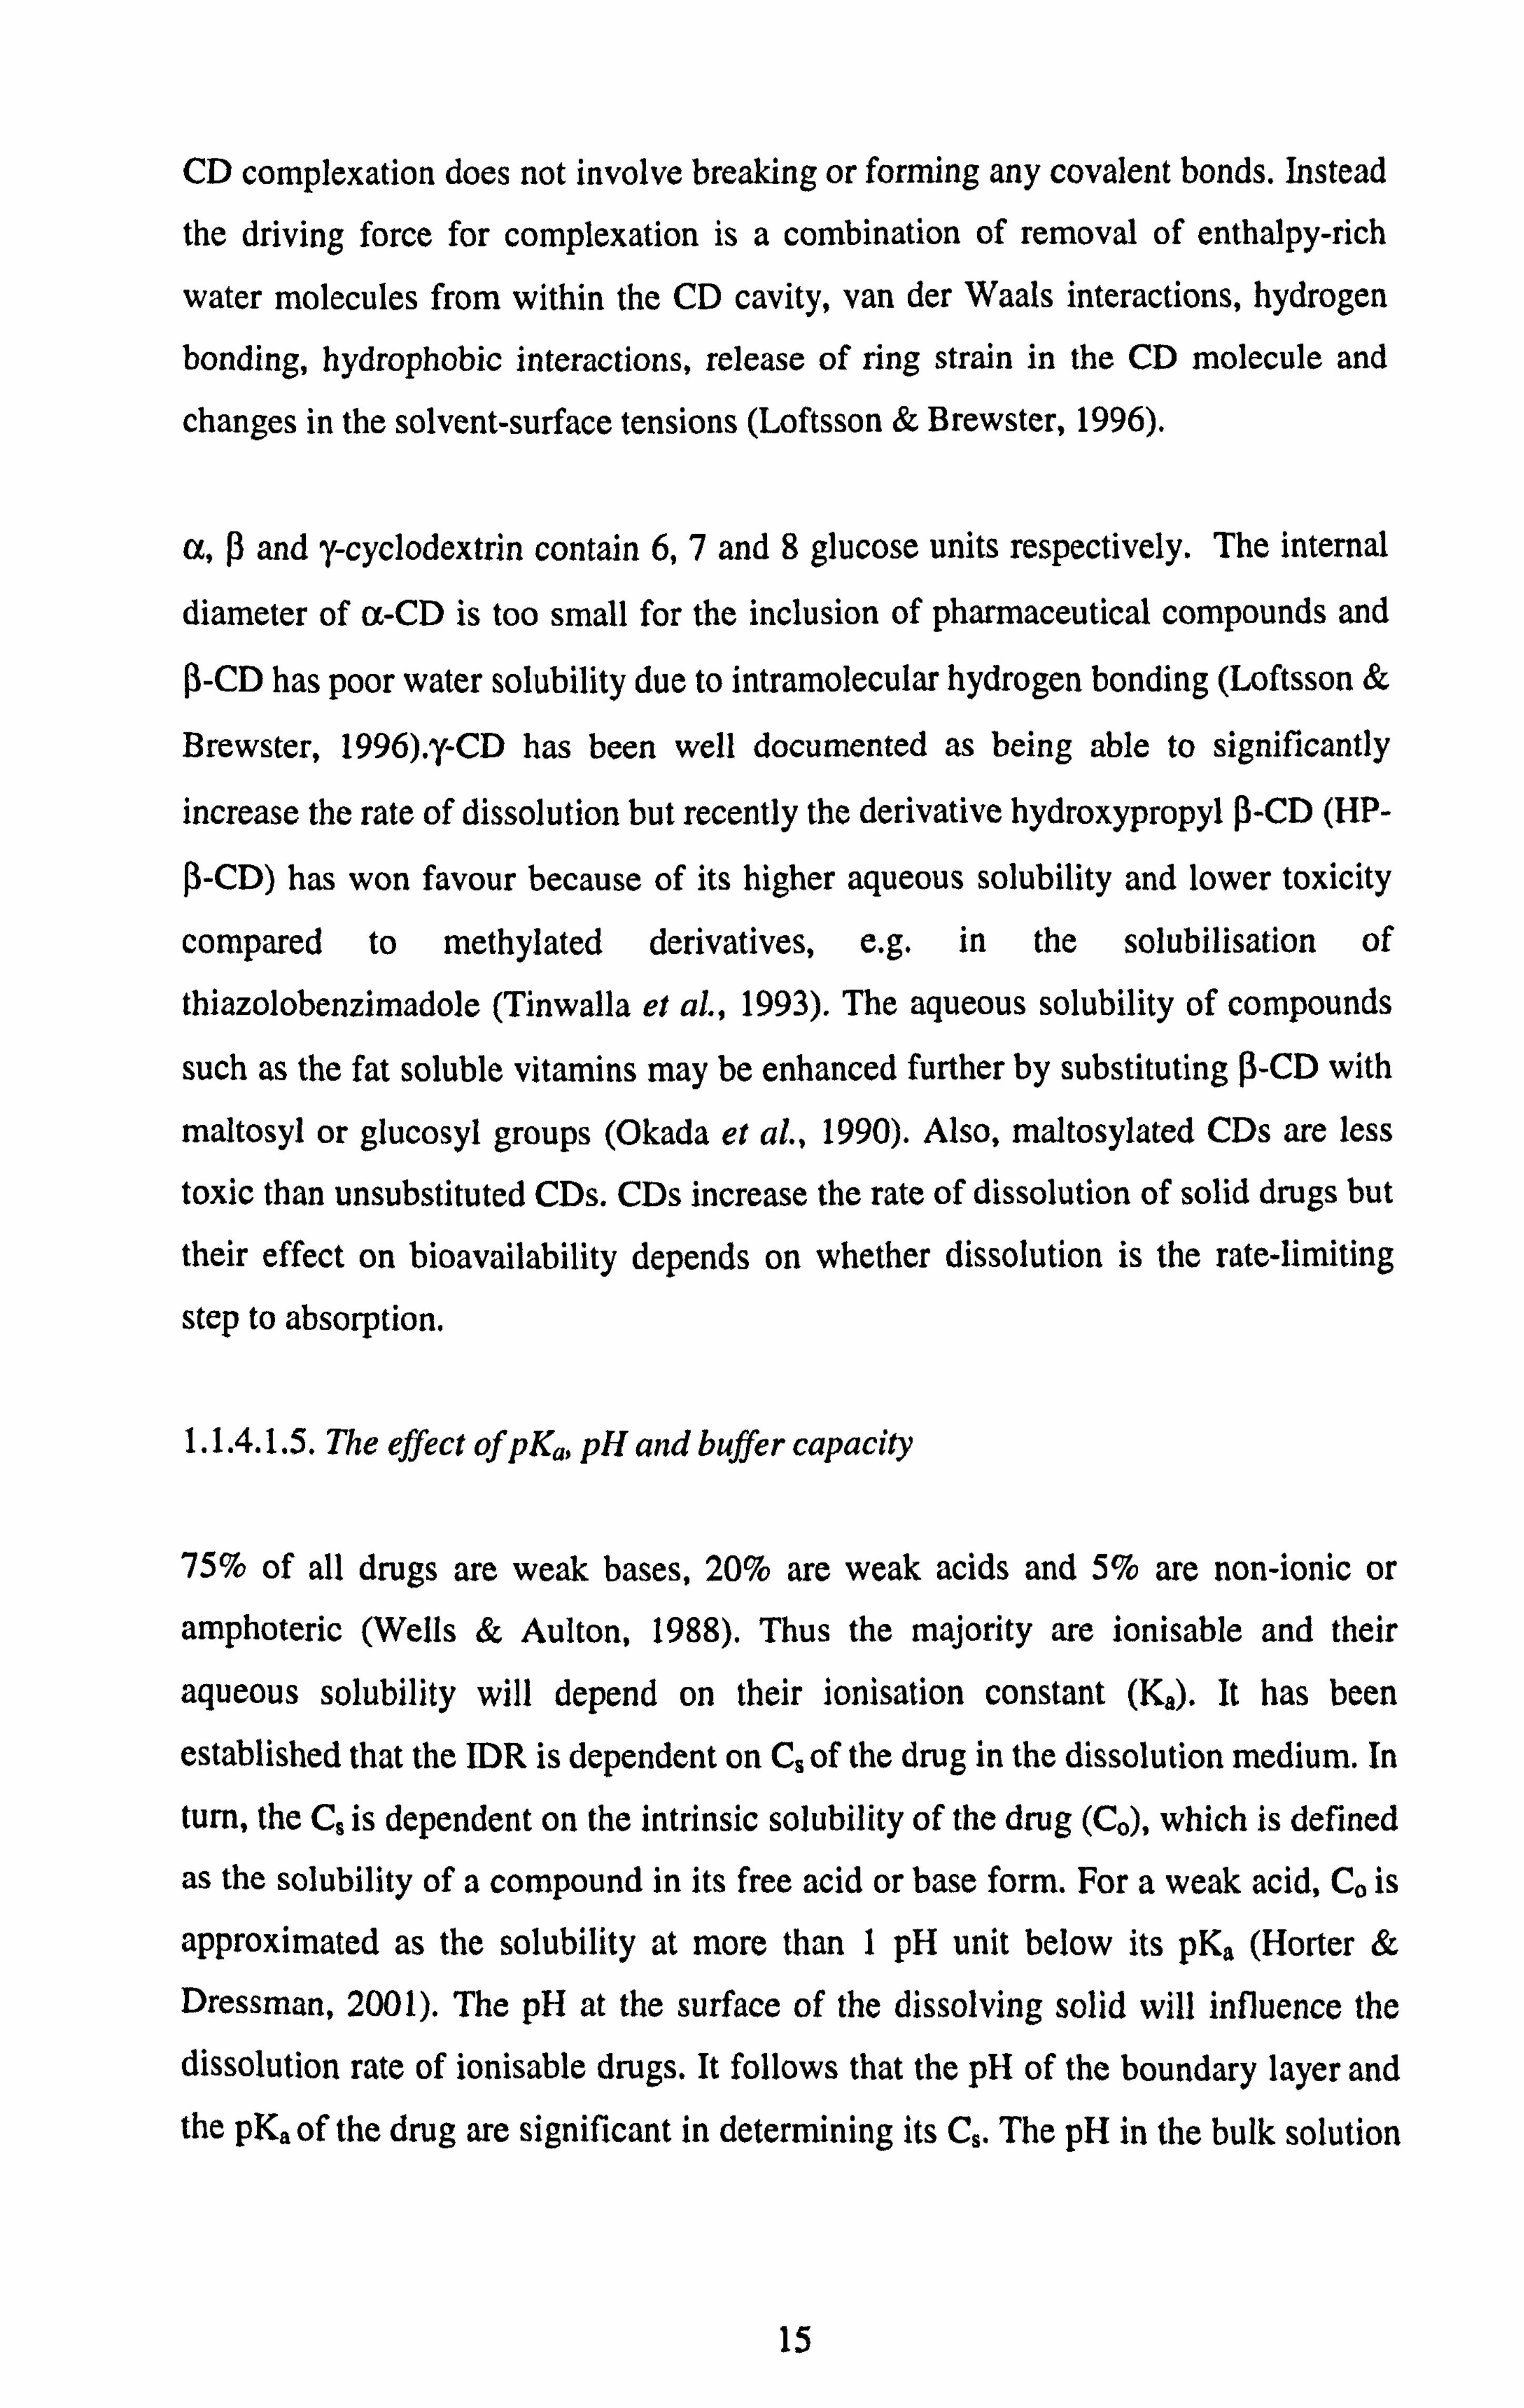
CD complexation does not involve breaking or forming any covalent bonds. Instead
the driving force for complexation is a combination of removal of enthalpy-rich
water molecules from within the CD cavity, van der Waals interactions, hydrogen
bonding, hydrophobic interactions, release of ring strain in the CD molecule and
changes in the solvent-surface tensions (Loftsson & Brewster, 1996).
a, ß and y-cyclodextrin contain 6,7 and 8 glucose units respectively. The internal
diameter of a-CD is too small for the inclusion of pharmaceutical compounds and
ß-CD has poor water solubility due to intramolecular hydrogen bonding (Loftsson &
Brewster, 1996). y-CD has been well documented as being able to significantly
increase the rate of dissolution but recently the derivative hydroxypropyl ß-CD (HP-
ß-CD) has won favour because of its higher aqueous solubility and lower toxicity
compared to methylated derivatives, e. g. in the solubilisation of
thiazolobenzimadole (Tinwalla et al., 1993). The aqueous solubility of compounds
such as the fat soluble vitamins may be enhanced further by substituting ß-CD with
maltosyl or glucosyl groups (Okada et al., 1990). Also, maltosylated CDs are less
toxic than unsubstituted CDs. CDs increase the rate of dissolution of solid drugs but
their effect on bioavailability depends on whether dissolution is the rate-limiting
step to absorption.
1.1.4.1.5. The effect of pKQ, pH and buffer capacity
75% of all drugs are weak bases, 20% are weak acids and 5% are non-ionic or
amphoteric (Wells & Aulton, 1988). Thus the majority are ionisable and their
aqueous solubility will depend on their ionisation constant (Ka). It has been
established that the IDR is dependent on C$ of the drug in the dissolution medium. In
turn, the CS is dependent on the intrinsic solubility of the drug (CO), which is defined
as the solubility of a compound in its free acid or base form. For a weak acid, Co is
approximated as the solubility at more than 1 pH unit below its pKa (Hotter &
Dressman, 2001). The pH at the surface of the dissolving solid will influence the dissolution rate of ionisable drugs. It follows that the pH of the boundary layer and the pKa of the drug are significant in determining its C. The pH in the bulk solution
15

can be considerably different to that in the boundary layer depending on the Co and
pKa of the drug and the buffer capacity of the bulk solution,
Ozturk et al (1988) demonstrated that the pH at the surface of dissolving drug
particles was considerably different to the pH in the bulk solution using the three
weak acids indomethacin, 2-napthoic acid and benzoic acid in unbuffered media.
An increase in the Co of the drug (weak acid in this case) suppresses the pH at the
surface of the dissolving drug.
Horter and Dressman (2001) commented that intestinal juice contains such a
significant amount of bicarbonate buffer that in-vitro testing in unbuffered or
weakly buffered medium does not reflect in-vivo dissolution of ionisable drugs. An
increase in the buffer concentration would increase the solubility of weakly acidic drugs because the pH at the drug surface would be nearer to the bulk lumenal pH. McNamara et al (2003) were able to maintain stable bicarbonate buffer media at pH 5.0 and 6.8 by continuous gas sparging of CO2 into the media
1.1.4.1.6. Salt form of the drug
The pH in the boundary layer (microclimate pH) around drug particles is affected by
a) the pKa and Co of the drug
b) the pKa and Co of the buffers in the bulk solvent/GI fluids
It is also known that the dissolution rate of weakly acidic drugs in the gastric fluid
will be relatively low (Proudfoot, 1988b). If the pH in the boundary layer were increased then C. and dissolution rate would increase. This can be done by changing
the weakly acidic drug from the free acid to basic salt e. g. Na+ or K' salts, which have a strong neutralising effect and would increase the pH to 5-6. However, as the drug diffuses through the boundary layer and arrives at the bulk solution of lower
pH, it may precipitate (Proudfoot, 1988b). The extent of this precipitation depends
on the Co of the drug. The precipitated free acid drug usually consists of very fine
wetted particles that aid rapid re-dissolution as soon as more gastric fluid is
available. This occurs when:
16

a) drug is absorbed, therefore the gastric fluid is no longer saturated b) precipitated particles move into the intestine
c) additional fluid enters the stomach
For weakly basic drugs, a salt of a strongly acidic anion can be made e. g. Cl-. This
ensures dissolution occurs prior to gastric emptying. If absorption is fast enough,
precipitation in the intestine will not occur and bioavailability will not be affected. Unfortunately, the Cl- ions already present in the stomach may cause a common ion
effect, competing for hydration by the gastric fluid therefore suppressing drug
dissolution.
1.1.4.1.7. Electrolytes in the dissolution medium and the common ion effect
Electrolytes in the dissolution medium can impact on various aspects of the ionic
dissolution process (Wells & Aulton, 1988). They may alter the pH of the medium,
which as discussed earlier, might affect the solubility of weak acids and bases based
on the drugs' pKa values and the buffer capacity of the medium. Electrolytes can
also reduce the solubility of salts through the common ion effect. This drives the dissociation equilibrium of the salt in the opposite direction such that precipitation (salting out) or reduced solubility occurs. Various inorganic ions can be arranged in
a series based on their ability to `salt out' different proteins which depends on ion
characteristics such as size, hydration and charge. For univalent cations the series
order was K+ < Na+ < Li' and common anions followed the order CNS" < I'< Br '< N03" < Cl'< S04 < PO43- (Heyman et al., 1938)
1.1.4.1.8. Experimental variations
The IDR will be affected by experimental parameters such as temperature, speed of agitation and turbulence. For IVIVC, these variables need to mimic the GI
conditions as closely as possible.
17

1.1.4.1.9. Physiological factors affecting IDR
Brief references have been made to physiological conditions that will affect the
IDR. Considerations for IVIVC include the changing pH down the GIT and the
effect of co-ingested food on transit time, pH and solubilisation capacity of the
stomach and intestine. Drugs whose physicochemical properties are affected by
these changes will result in changes in the rate and extent of absorption. The effect
of age and disease states on the gastric secretions also needs to be considered.
1.1.4.2. Methods of determining the IDR
1.1.4.2.1. Intrinsic Dissolution Method (USP <1087>)
Two variations of the IDR apparatus exist - the rotating disk apparatus (Woods
Apparatus, Figure 1.3) and the stationary disk apparatus (Figure 1.4). Both types of
apparatus employ a compacted pellet of pure drug, produced by compressing an
aliquot of powder in a stainless steel punch & die (Figure 1.5). The die is mounted
onto a smooth polished base plate and the punch is driven into the die using a hydraulic press. The United States Pharmacopoeia states a compression dwell time
of I min at the minimum compression force required to form a non-disintegrating
compacted pellet. The base plate is then detached to expose a smooth and constant
pellet surface at the face of the die and it is this pellet surface that is subjected to the
dissolution test.
In the rotating disk apparatus the die is then inverted and screwed onto a customised
shaft on a dissolution tester, which is then lowered into the dissolution medium until
the face pellet is 2.54 cm from the bottom of the vessel (Figure 1.3). The shaft is
then rotated in the same way as the USP apparatus I and 2. In the stationary disk
apparatus the die containing compressed pellet is placed face up into a flat-
bottomed dissolution-vessel (Figure 1.4), prefilled with the appropriate volume of dissolution medium. The medium is stirred by means of a rotating paddle (e. g. USP
apparatus 2) positioned 6 mm above the pellet surface.
18

Dissolution Vessel ('ý (Round Bottom)
Figure 1.3. Schematic of rotating disk IDR apparatus (Woods apparatus).
Flat-bottomed Vessel 'ý--º
Paddle
Dissolution medium
c Drug pellet (in die)
Figure 1.4 Schematic of a stationary disk IDR apparatus
19

s. s-10.1 w4na anwa
I
Dl" Underslds
8wfäco Plage 1. a .. ý . ýý IM srn w
iAmm daRrUf
T-
(r''ýf \y!
63A6-LI. 4 m du+. rr
12.7 own
i
101 mro
Surface Plaw ley. -++. rd. o. a rd bat. h" r»L
ýÖs tÖº ý
Figure 1.5. Tooling used to produce disks for IDR testing. From United States
Pharmacopoeia 28 (USP, 2005)
Disadvantages of the rotating disk apparatus include the risk of air bubbles forming
on the surface of pellet, which could affect the dissolution rate, and heat loss of
approximately 2°C through the shafts when the dies are first lowered into the
dissolution medium. Using the stationary disk apparatus significantly reduces the formation of air bubbles, whilst heat losses are eliminated since the dies are totally
submerged in the dissolution medium (Viegas et al., 2001).
The IDR is calculated by plotting the cumulative amount of substance dissolved per
unit area of the exposed pellet surface against time until 10% of the drug pellet has
dissolved (limit of sink conditions). Linear regression should be applied to data
points up to this point and the slope of the regression line gives the IDR of the
substance under test in mg/min/cm2 (United States Pharmacopoeia 28,2005).
However, this compendial calculation may prove difficult to apply to poorly soluble compounds where 10% dissolution may not be achieved. In these instances, it may
20

be practical to use an analytical method with sufficiently high sensitivity to be able
to plot 6-8 data points before 10% dissolution and apply linear region.
1.2. Disintegration as a prerequisite for dissolution from solid oral dosage forms
The IDR of a drug substance is a measure of the inherent drug solubility and does
not take into account formulation factors that may affect dissolution (Section 1.1.4).
During the determination of the IDR, maintenance of a constant surface of the
exposed disk is required. Conversely, for solid oral dosage forms such as tablets and
capsules, drug exposure to the dissolution medium requires the collapse of the unit. The disintegration of tablets and the disintegration test method are described in this
section.
1.2.1. Tablet disintegration
The disintegration of a tablet is a fundamental requirement for release of the drug
from the dosage form and to promote dissolution. When immersed in liquid, the
solid surface is wetted and liquid penetrates the tablet pores causing a break up of
the dosage form. In practice, this process is usually aided by the addition of a disintegrating agent to the formulation, which performs its function by swelling,
capillary action or generation of a gas (Lowenthal, 1973). The initial fragments
produced may be large agglomerates that disintegrate further into primary drug
particles. Deaggregation into these primary drug particles provides the largest
surface area for dissolution (Wagner, 1969; Wells & Rubinstein, 1976). The
mechanism is related to dissolution diagrammatically in Figure 1.6.
21

Increase in effective surface area of drug exposed to gastrointestinal fluids
ý-----ý
Intact tablet
ý0»
O0 ýe°eee Disintegration O(ý ^0 Deaggregation 00 öö ö:
O ° eö° O O Oc2Q ö" 00 00
" Dp po oe0e o0°0 ý C. %ivýo 'OCY
00 Granules
\I/ Primary drug
particles
Low rate of Moderate rate Relatively rapid drug dissolution of rate of drug
drug dissolution dissolution
ýlr Drug in solution in gastrointestinal
fluids
4 Absorption
l Drug In blood
Figure 1.6. Mechanism of the drug release process from a tablet by disintegration and dissolution. From Rubinstein (1988)
1.2.2. Disintegration Testing
The pharmacopoeia) disintegration test for tablets and capsules determines whether these dosage forms disintegrate within the time prescribed in the individual
monograph. The test is not intended for sustained release and chewable dosage
forms. The United States Pharmacopoeia 28 and British Pharmacopoeia (2004)
22

describe a similar apparatus for disintegration testing. The description below is
taken from the British Pharmacopoeia 2004.
The apparatus consists of a basket-rack assembly (Figure 1.7) holding six
cylindrical transparent tubes 75.0 to 80.0 mm long, 21.5 mm in internal diameter
and with a wall thickness of about 2 mm. The tubes are held vertically by two
separate and superimposed rigid plastic plates 90 mm in diameter and 6 mm thick,
perforated by six holes. The holes are equidistant from the centre of the plate and are
equally spaced from one another. Attached to the under side of the lower plate is a
piece of woven gauze made from stainless steel wire 0.635 mm in diameter and having mesh apertures of 2.00 mm. The plates are held rigidly in position and 77.5 mm apart by vertical metal rods at the periphery and a metal rod is also fixed to
the centre of the upper plate to enable the assembly to be attached to a mechanical device capable of raising and lowering it smoothly through a distance of 50 to
60 mm at a constant frequency of between 29 and 32 cycles per minute. The
assembly is suspended in the specified liquid medium in a 1000-m1 beaker. The
volume of liquid is such that when the assembly is in the highest position the wire
mesh is at least 15 mm below the surface of the liquid and when the assembly is in
the lowest position the wire mesh is at least 25 mm above the bottom of the beaker
and the upper open ends of the tubes remain above the surface of the liquid. The
temperature of the liquid is maintained at 35° to 39°. The design of the basket-rack
assembly may be varied provided that the specifications for the tubes and wire mesh
are maintained. Where stated in the monograph, a plastic disk may be added to each tube to aid immersion of floating dosage forms. The disk specifications are described in the pharmacopoeias.
To run a test, one tablet or capsule is placed into each of the six tubes, the assembly is suspended in the beaker containing the specified liquid and the apparatus operated for the specified time. The tablets or capsules pass the test if all six have
disintegrated. The United States Pharmacopoeia 28 defines complete disintegration
as: "that state in which any residue of the unit, except fragments of insoluble coating or capsule shell, remaining on the screen of the test apparatus is a soft mass having no palpably firm core. "
23

Stainless steel gauze (mesh apertures 2.00mm)
Liquid medium held between 35-39°C ýý
Figure 1.7. Schematic diagram of the basket rack assembly of the Disintegration Test apparatus.
1.3. Dissolution Testing
Dissolution tests are one of the most commonly used tests in the characterization
and quality control (QC) of oral dosage forms. They are vital if dissolution is the
rate-limiting step in drug absorption, e. g. in rapidly disintegrating tablets or
capsules. From a QC perspective, dissolution testing is mainly used to confirm batch-to-batch consistency, site and manufacturer variation, product stability and to
identify good and bad formulations (Hanson, 1991a). Dissolution tests are used to
confirm compliance with compendial specifications and are therefore needed as part
of a marketing authorisation. Additionally, they are used during product development and stability testing as part of the development specification for the
product. Critically, from an R&D perspective, there is the potential to correlate in
vitro dissolution data with in vivo bioavailability, which would greatly facilitate
product development.
24

1.3.1. Compendia) Testing Methods
The general principle of dissolution tests is that the powder or solid dosage form is
tested under uniform agitation, which is accomplished by either passing the medium
over the sample or by agitating the sample in the medium. Two general methods,
using the basket or paddle apparatus, are currently included in the United States
Pharmacopoeia 28 and the British Pharmacopoeia 2004 to measure dissolution from
immediate-release oral tablets and capsules whilst there are several variants used in
the testing or modified-release oral dosage forms and other, non-oral types of dosage form. The compendial dissolution tests for oral dosage forms are described
below.
1.3.1.1. Basket Apparatus (USP Apparatus 1)
Essentially, in this method, the dosage form is placed in a basket that is lowered
into the dissolution medium and rotated at a specified speed.
The apparatus consists of a motor, a metallic drive shaft, a cylindrical basket and a
covered vessel made of glass or other inert transparent material. The latter should be
made of materials that do not sorb or react with the sample tested. The contents are held at 37 ± 0.5°C. There should be no significant motion, agitation, or vibration
caused by anything other than the smoothly rotating stirring element. Ideally, the
apparatus should provide observation of the stirring element and sample. The vessel is cylindrical with a hemispherical bottom and sides that are flanged at the top. It is
160 to 175 mm high and has an inside diameter of 98 to 106 mm, and a nominal
capacity of 1000 mL. A fitted cover may be used to retard evaporation but should
provide sufficient openings to allow ready insertion of a thermometer and allow
withdrawal of samples for analysis. The shaft is so positioned that its axis is no
more than 2 mm at any point from the vertical axis of the vessel and should rotate smoothly, without significant wobble. The shaft rotation speed should be
maintained within ± 4% of the rate specified in the individual monograph. The shaft
and basket should be constructed of stainless steel, type 316 or equivalent. Other
specifications for the basket apparatus are given in Figure 1.8. A 2.5 tm thick gold coating on the basket may be used for acidic media. For testing, a dosage unit is
25

placed in a dry basket at the beginning of each test. The distance between the inside
bottom of the vessel and the basket is 25 ±2 mm (Ford & Rajabi-Siahboomi, 2002).
vent hde 10 t 0.5 mm demeter
adentlon sprUq wäh 9 unps an 120' tanlers
Nam-M&anlum . ibwaws nuiait atA' Is 11.0 mm when tte part is rdsted an rtsds wArh psekd nnuMed
Screen with welded seam: 40 X 40 mesh, 0.26-mm win diameter with wire openings of 0.40 a 0.04 mm; where 20- mesh screen Is specilled, use 20 X 20 mash, 0.40-mm win diameter with win openings o 0.90 * 0.09 mm jNoTE- Aner welding. the screen may be slightlyatlered. )
Figure 1.8. The basket stirring element of USP 28 (Apparatus 1)
Apart from apparatus design, certain practical issues can potentially be problematic. For example, corrosion of the wire basket when placed in acidic media; obstruction
of fluid flow through the basket mesh due to adhering substances; variation in
agitation conditions produced by the rotating basket leading to poor reproducibility
and the risk of particles falling from the basket to the bottom of the vessel and
consequently being subjected to different agitation conditions to those within the
basket (Hanson, 1991b; Ford & Rajabi-Siahboomi, 2002). Finally, there is the
possibility of dissolution being accelerated due to abrasion of the surface of the
dosage form as it rubs against the basket mesh, the so-called ̀ cheesegrater effect'.
26

1.3.1.2. Paddle Apparatus (USP Apparatus 2)
In Apparatus 2, the paddle apparatus, a paddle is used as the source of agitation. As
with the basket apparatus, the shaft should position no more than 2 mm at any point
from the vertical axis of the vessel and rotate without significant wobble. Figure 1.9
gives the shaft specification. The paddle should be rotated at a fixed depth of 25 ±2
mm from the bottom of the vessel throughout the test. The metallic blade and shaft
may be coated with a protective inert coating to prevent corrosion. The dosage form
is dropped into the vessel and the paddle rotated when the dosage form has reached
the bottom of the vessel.
NOTES- (U Shalt and Gads materaA
303 (or equivalenU srohless stall.
(2) A and 0 Wmensions are not to vary more than 0.3 mm when part I. rotated on S ax/s.
(3) To/smnns are f 10 mm, unless cdww/ss stated.
ý--- 420mm---ý
I0tº0mm
[ýT '-ý- ý. -c- 1---
--- 74.0 mm to 73 0 mm ----º)
Figure 1.9. The paddle stirring element of USP 28 (Apparatus 2)
In the case of hard-gelatin capsules and other floating dosage forms, a `sinker' is
required to weight the sample down until it disintegrates and releases its contents at
the bottom of the vessel. The sinker has to hold the capsule in a reproducible and
stable position directly below the paddle, but it needs to be constructed in such a fashion that it does not significantly affect hydrodynamic flow within the vessel nor
should it appreciably reduce the surface area of the capsule available to the
27

dissolution medium. Two designs have predominated, the three-fingered clip and
the helical spring. The former comprises a small circular disc with three short,
parallel rods sticking out from it, into which the capsule is wedged. The device is
typically plastic, but the disc contains metal, which gives it the necessary weight to
fall to the bottom of the vessel. The latter is a stainless steel or plastic-coated
stainless steel helix (coil, spring) down the middle of which the capsule is inserted.
However, with this design, as the thickness of the wire used and the number of turns
in the spring increase, the available surface area of the capsule decreases, leading to
a concomitant decrease in the observed rate of dissolution (Soltero et al., 1989;
Avgoustakis et al., 1992). The United States Pharmacopoeia allows for `a small,
loose piece of non-reactive material such as not more than a few turns of wire
helix... ' whilst the Japanese Pharmacopoeia (JP) actually prescribes a specific
sinker (Figure 1.10).
(a) 3-Prong sinker (b) JP Basket Sinker (c) Helical-spring sinker
Figure 1.10. Typical sinker designs. (a) 3-prong sinker, (b) Japanese
Pharmacopoeia basket sinker, (c) helical-spring sinker
1.3.1.3. Reciprocating Cylinder Apparatus (USP Apparatus 3)
An apparatus comprising vertically reciprocating tubes, sealed with mesh discs at
each end to restrain the dosage form is official in United States Pharmacopoeia 28
as the Reciprocating Cylinder Apparatus. This has been commercially developed as
the Bio-Dis apparatus® which allows tubes containing the sample to be plunged up
and down in a small vessel containing the dissolution medium (Figure 1.11). It has
been designed to allow the tubes to be dipped sequentially in up to six different
28

media vessels, using programmes that vary the speed and duration of immersion. It
allows automated testing for up to 6 days and the manufacturers advocate its use in
the testing of extended-release dosage forms (Dyas & Shah, 2006).
+1
m 8
il C.,
a-26
Air holes 3.9 ± 0.1 diameter
Evaporation cap
-- 6-8 diameter ..
ý_- 3e. 1t1
Type 316 stainless stsa
Air holes 3.91 0.1 diameter
r-I .y` Mesh screen
ý 8
-41 m
ý
ý ý
f1
2
Figure 1.11. The reciprocating cylinder apparatus of USP 28 (Apparatus 3)
1.3.1.4. Flow-through Cell Apparatus (USP Apparatus 4)
The previously described limited-volume apparati operate under non-sink
conditions, which can restrict the study of poorly soluble drugs. A flow-through
system and reservoir may be used to provide sink conditions by continually
removing solvent and replacing it with fresh solvent. Alternatively, continuous re-
circulation may be used when sink conditions are not required. The disadvantages
of limited-volume apparati (Tingstad & Riegelman, 1970) are [1] lack of flexibility,
[2] lack of homogeneity, [3] the establishment of concentration gradients, [4] their
semi-quantitative agitation, [5] the obscuring of details of the dissolution processes
and [6] their variable shear.
29
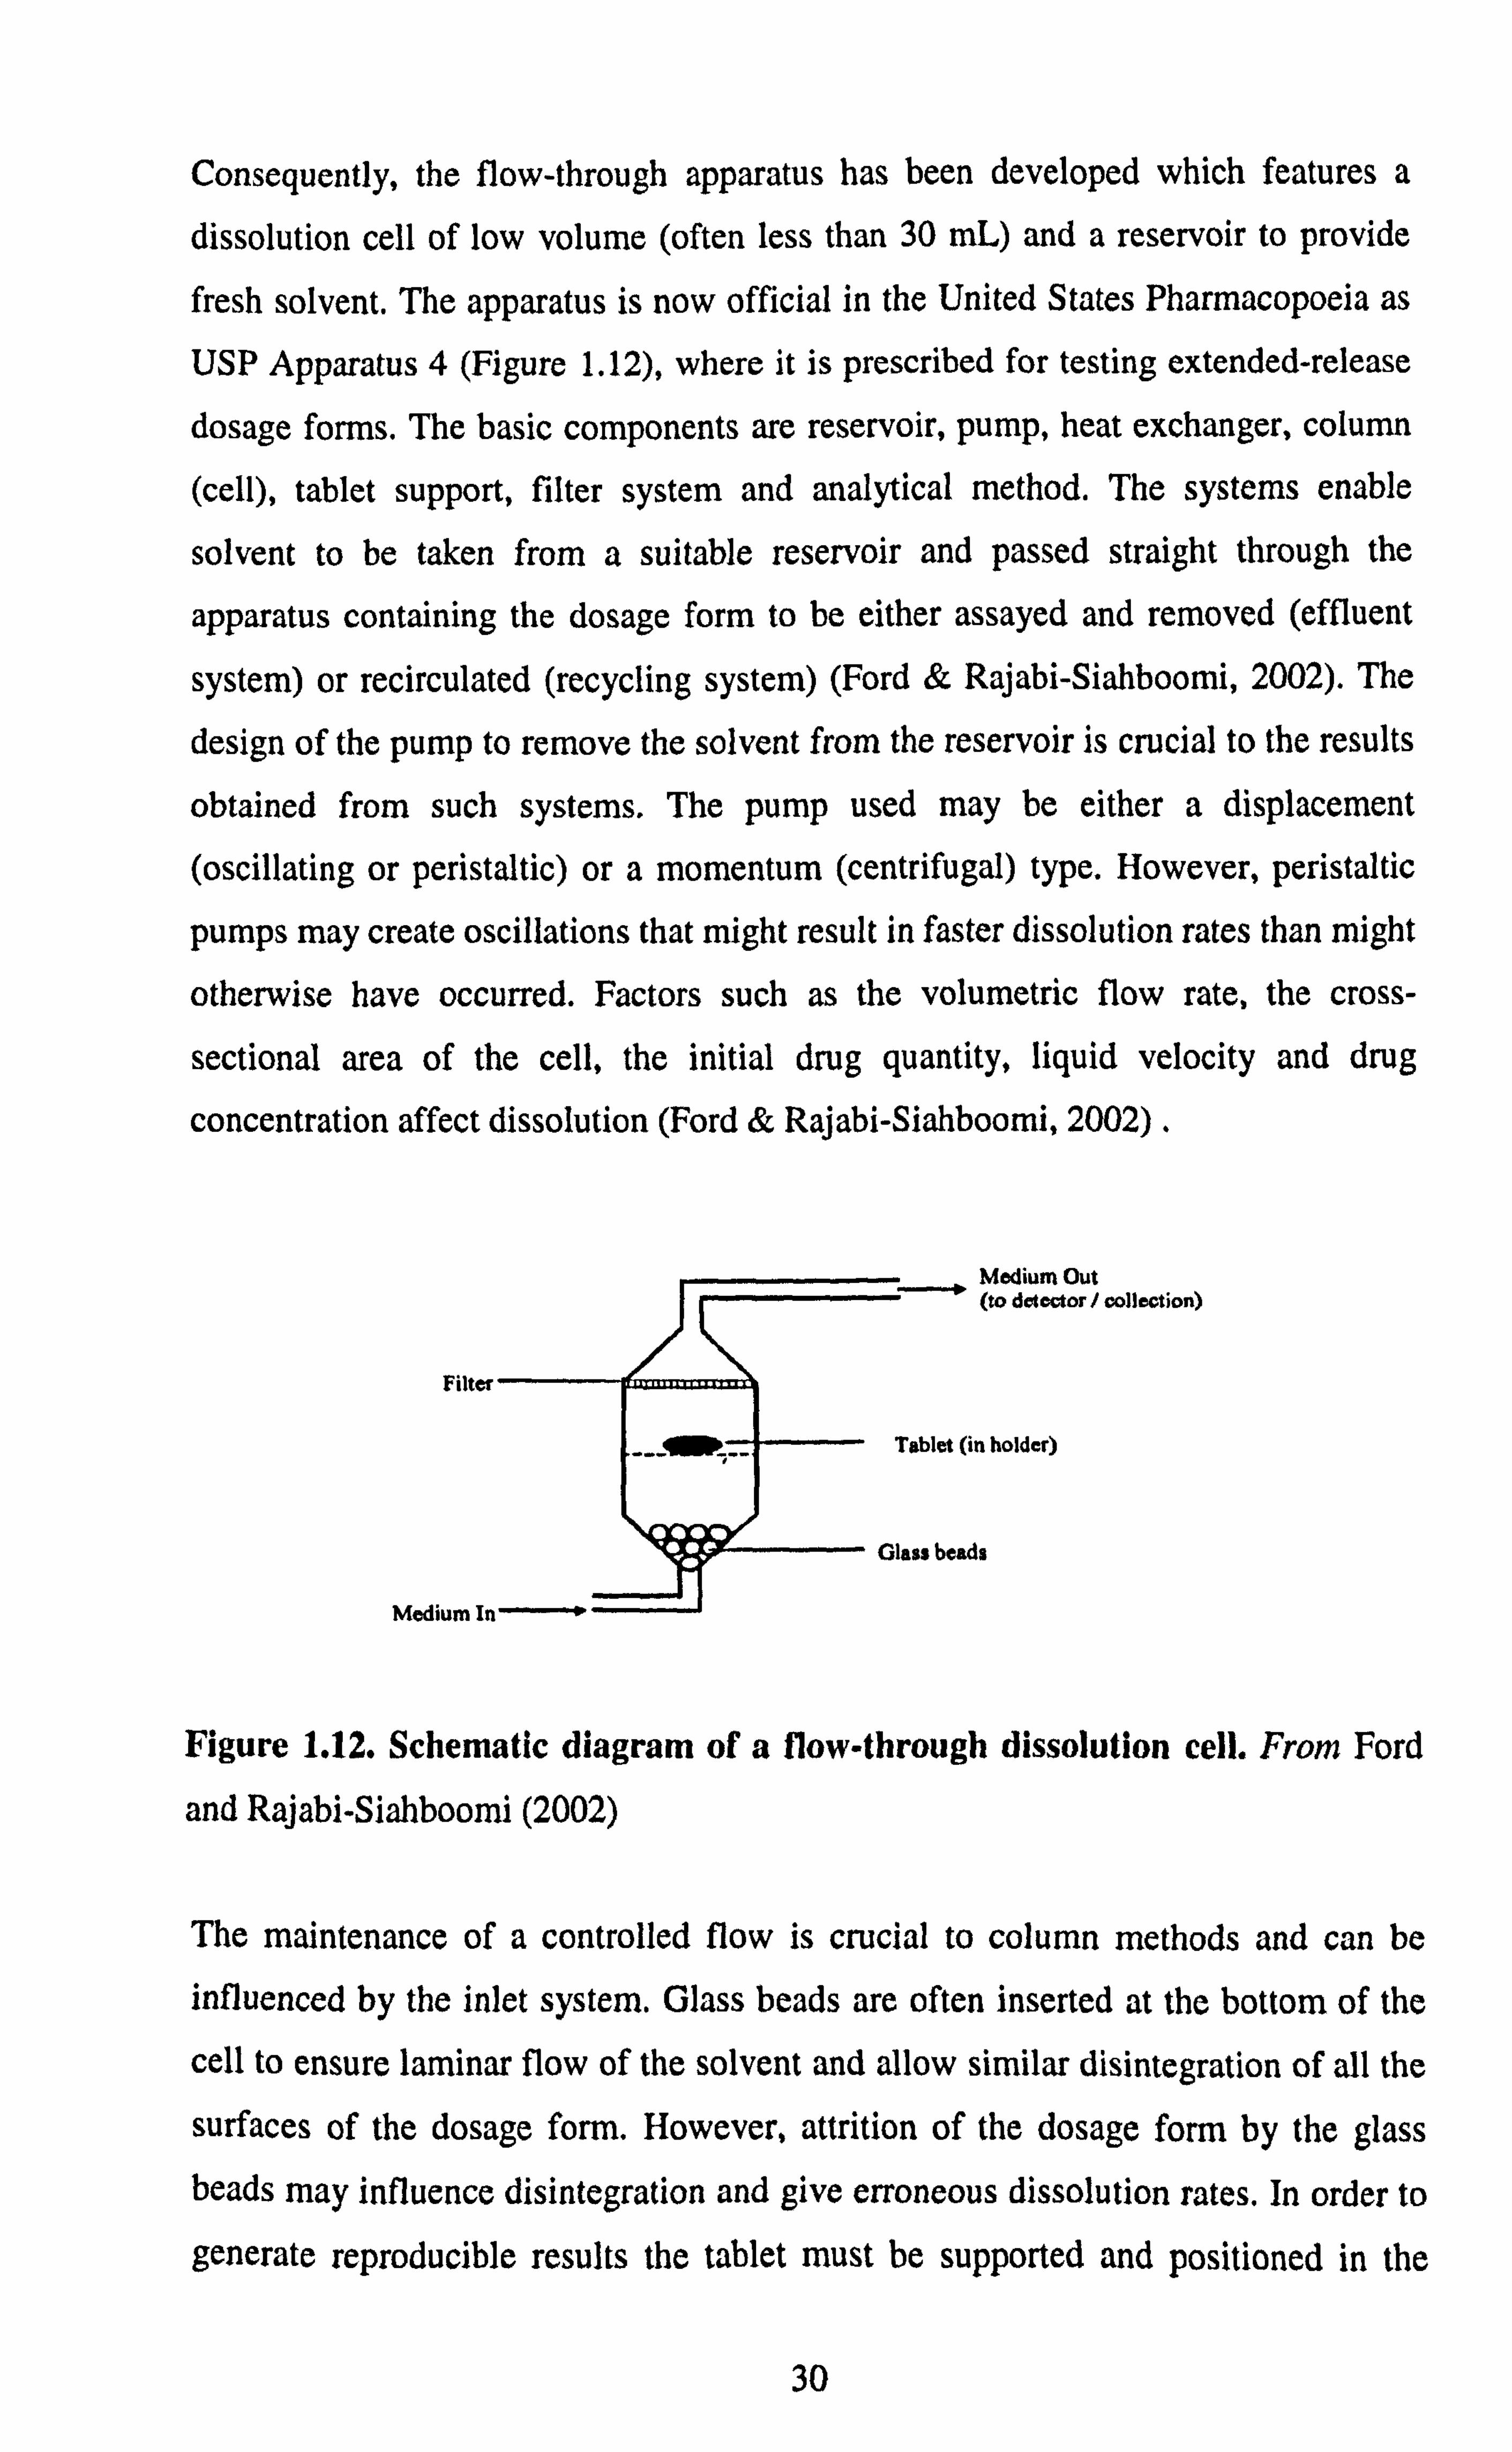
Consequently, the flow-through apparatus has been developed which features a
dissolution cell of low volume (often less than 30 mL) and a reservoir to provide
fresh solvent. The apparatus is now official in the United States Pharmacopoeia as
USP Apparatus 4 (Figure 1.12), where it is prescribed for testing extended-release
dosage forms. The basic components are reservoir, pump, heat exchanger, column
(cell), tablet support, filter system and analytical method. The systems enable
solvent to be taken from a suitable reservoir and passed straight through the
apparatus containing the dosage form to be either assayed and removed (effluent
system) or recirculated (recycling system) (Ford & Rajabi-Siahboomi, 2002). The
design of the pump to remove the solvent from the reservoir is crucial to the results
obtained from such systems. The pump used may be either a displacement
(oscillating or peristaltic) or a momentum (centrifugal) type. However, peristaltic
pumps may create oscillations that might result in faster dissolution rates than might
otherwise have occurred. Factors such as the volumetric flow rate, the cross-
sectional area of the cell, the initial drug quantity, liquid velocity and drug
concentration affect dissolution (Ford & Rajabi-Siahboomi, 2002) .
Figure 1.12. Schematic diagram of a flow-through dissolution cell. From Ford
and Rajabi-Siahboomi (2002)
The maintenance of a controlled flow is crucial to column methods and can be
influenced by the inlet system. Glass beads are often inserted at the bottom of the
cell to ensure laminar flow of the solvent and allow similar disintegration of all the
surfaces of the dosage form. However, attrition of the dosage form by the glass beads may influence disintegration and give erroneous dissolution rates. In order to
generate reproducible results the tablet must be supported and positioned in the
30

fluid flow in a consistent manner. Consequently, attempts have been made to set the
tablet in glass wool or glass beads.
Laminar flow conditions are typically used for tablets, hard gelatin capsules,
powders and granules. Suppositories and soft gelatin capsules are placed in the cell
without beads for turbulent flow. Nicolaides et al (2000) reported differences in the
dissolution rate of a poorly soluble drug, tiaglitazone, from an immediate release
tablet formulation based on the presence or absence of a tablet holder and/or beads
in the flow through cell.
Flow-through facilities can be constructed from cylindrical chromatographic
columns with flow-rates as low as 1 mUmin. Ascending flow minimises the
problems associated with air bubbles and allows laminar flow of the solvent and
ascending columns are the most common types of flow-through apparatus. The
columns may be short with tapered inlet and outlet sections but generally are long
sections of straight-sided tubing to provide hydrodynamic stability to the liquid
flow. The material under test is placed in the vertically mounted dissolution cell
which permits solvent at 37° ± 0.5 °C to be pumped in from the bottom. The cell
type selected is dependent on the dosage form being tested. Standard cells used for
tablets and capsules have an internal diameter of 12mm but may show a higher
dissolution rate when compared to 26mm cells due to higher flow velocity. For
testing powders and granules a modified cell containing 2 screen plates is used
where the sample is placed between the screen plates.
The flow rate of the dissolution medium through the cell must be specified for each
product. The USP recommends a flow rate between 4-16mUmin with an allowance
of ±5%. Manual operation and sampling for this type of test can be tedious and the
system can be automated to control the pump, heat exchanger and test procedure and deliver samples to a fraction collector. The system can be programmed to
switch between different media at predetermined time points to allow pH changes during the test.
31

Further advantages of the flow through method (Looney, 1996) include (1] selection
of laminar or turbulent solvent flow conditions, [2] simple manipulation of medium
pH to match physiological conditions, [3] application to a wide range of dosage
forms e. g. tablets, hard and soft gelatin capsules, powders, granules, implants and
suppositories.
Whilst the applicability of the flow through apparatus to biorelevant dissolution
tests still requires further investigation and optimisation, a Level A IVIVC has been
reported with this apparatus using physiologically relevant media and a flow rate of 8 mUmin (Sunesen et al., 2005).
1.3.1.5. Reciprocating HolderApparatus (USP Apparatus 7)
There are several variants to this apparatus, which is based on a sample holder that
oscillates up and down in the medium vessel. The sample holder may take the form
of a disk, cylinder or a spring on the end of a stainless steel or acrylic rod, or it may
simply be the rod alone. The sample is attached to the outside of the sample holder
either by virtue of being self-adhesive (e. g transdermal delivery system) or is glued in place using a suitable adhesive. This apparatus may be used for transdermal
products, coated drug delivery systems or other suitable products (e. g osmotic pump devices). It is prescribed for the drug-release testing of Psuedoephedrine
hydrochloride extended-release tablets USP where the tablets are enclosed in a5 cm
x5 cm square of nylon, which is then attached to the rod (Dyas & Shah, 2006).
1.3.2. Sample Collection and Analysis
1.3.2.1. Sample collection
The United States Pharmacopoeia 28 and the British Pharmacopoeia 2004 both state that samples should be drawn from a region equidistant between the surface of the dissolution medium and the top of the rotating basket or paddle, not less than 1 cm from the vessel wall. The volume of sample withdrawn should be replaced with an
32

equal volume of fresh medium or the reduced volume should be accounted for in
the dissolution calculation. Samples taken should be filtered using appropriate inert
filters that do not adsorb the drug nor liberate materials that could interfere with the
analytical procedures. The filter pore size should not be greater than 1 µm. When
capsule shells interfere with the analysis, the contents of a minimum of six capsules
should be removed as completely as possible and the shells dissolved in the
dissolution medium. This allows calculation of correction factors, which should be
no greater than 25% of the labelled content.
The advent of sophisticated, programmable autosamplers allows samples to be
removed automatically into tubes or vials for off-line spectroscopic or
chromatographic analysis. However, care has to be taken to ensure in-line filters do
not become blocked after repeated use. Autosamplers that can pump liquid samples from the dissolution vessel through a spectrophotometer and back into the vessel
offer combined on-line sampling and analysis. Again, care has to be taken to ensure
particles do not enter the tubing system and cause blockage. Also, excessive lengths
of tubing can lead to a significant lag-time before the sample reaches the
spectrophotometer or pools of cool, stagnant fluid causing precipitation of dissolved
solute. A typical on-line UV dissolution system is depicted in Figure 1.13.
Figure 1.13. Typical apparatus set-up for on-line UV measurement of dissolution. From Ford and Rajabi-Siahboomi (2002)
33

1.3.2.2. Assay methods
Whatever assay technique is chosen, it must be specific to the drug being studied.
For single-drug entities, UV spectroscopy is often the method of choice as it is
quick, simple and easily lends itself to on-line automation. The use of UV
photodiode array spectrophotometry has become popular in the testing of multidrug
dosage forms. Where analytical sensitivity or selectivity is an issue, HPLC assays
are commonly resorted-to as these allow low-level quantitation of high-potency
(low-strength) drugs. In the case of multidrug dosage forms, more complicated
assay techniques may be required, which makes HPLC useful since more than one
drug can be analysed in the same chromatogram. Whilst HPLC can be automated it
is essentially off-line and on-line strategies are often preferred.
1.3.2.2.1. Fibre-optic technology
Fibre optic technology for in-situ UV assay has received particular interest as it
offers significant labour, time and cost savings by eliminating the sampling and filtering stages of the dissolution test (Martin, 2003). A fibre optic probe is
positioned in each vessel in the same fashion as a sampling probe. Light is then
transmitted from a linked spectrophotometer into an open-sided reflectance cell in
the vessel, reflecting back to the detector where absorbance is measured (Bynum &
Kraft, 1999). The dissolution profiles are calculated in real time allowing the direct
scrutiny of product performance. This technology is also capable of rapid
measurements of a series of vessels allowing intervals of less than 1 min between
sampling time points during a dissolution run. A multiplexing arrangement is
required to selectively transmit the signal from each vessel, in turn, to the
spectrophotometer.
Proposals for a new general chapter on dissolution in the USP (Gray et al., 2001)
have highlighted the use of this technology and a regulatory perspective has also been published (Gray, 2003). These developments suggest that fibre optic technology is likely to emerge as a common analytical tool as long as the following
considerations are addressed:
34

1. The spectrum of each component of the formulation needs to be evaluated to
ensure there is no excipient interference. Spectra should be determined in the
dissolution media to be used and at concentrations expected in the dissolution
vessel. (Minor interference can be corrected for using software algorithms. )
2. The absorbance of the active ingredient at 100% release from the dosage
form being tested must be below the photometric range maxima since sample dilutions are not possible, A shorter path-length cell will be required if the
absorbance is too high.
3. The limit-of-detection for fibre optics is higher than for conventional
spectrophotometry because the loss of signal down the fibre decreases the Signal: Noise ratio. This loss of sensitivity may be overcome with a longer path length cell.
4. Turbidity and light scattering caused by undissolved drug or excipients interfere with spectral measurement and increases noise (Martin, 2003). The
interference should be limited to 2-3% and if this is not achievable,
conventional discrete sampling and off-line measurement may be required.
5. Formation of air bubbles on the fibre optic probe can affect the accuracy of the analysis (Lu et al., 2003). The dissolution medium should always be
properly degassed prior to the test.
Furthermore, prolonged transmission of far-UV radiation leads to degradation of the fibre and increasing opacity whilst fouling of the external surface of the fibre by
some media components e. g. enzymes, surfactants etc. can be a problem in some cases.
1.3.3. Data Presentation and Interpretation
The data generated from dissolution tests are usually presented as dissolution
profiles of the amount released plotted as a function of time. Drug release is
35

monitored at several time-points or, where possible, continuously until 100% of the
dose is dissolved. Values equivalent to the times for 10,50,70 or 85% drug release
are often cited as t10%, t50%, t70%, or t85% (Figure 1.14). The dissolution profiles from
tablets and capsules are often sigmoidal in shape.
Whilst pharmacopoeias do not require a dissolution profile to be generated, they do
state the amount of drug that must dissolve (or not dissolve in the case of enteric-
coated products) within a specified time. When a single-time specification is stated,
the test can be stopped earlier if the requirement for a minimum amount dissolved is
met. If two or more times are specified, then the samples should be withdrawn with
a tolerance of ± 2% of the stated time.
Ioo-,
90-
so- 70-
I 60-
cn-J eo
4
30-
20-
lo-ý
110% tso% ýab tas%
Time (min)
Figure 1.14. Hypothetical dissolution profile showing the determination of tjo% t5O% t70% and tss%
The United States Pharmacopoeia 28 assesses dissolution in a three-stage series of tests with the amount of drug dissolved after a specified time being expressed as a percentage of the nominal content of the dosage form. The time at which the sample is to be tested is specified in the monograph as is the so-called Q-value, the
minimum percentage-dissolved at that time. In the first stage (Si), six units are tested and the pass criteria are that the amount of drug dissolved from each unit at the specified time should be no less than Q+ 5%. Failure at Si requires a second
36

stage test (S2) to be performed on an additional six units. To pass the test at this
stage the average content dissolved, from the combined two stages (i. e. 12 units)
should be equal to or greater than Q with no unit being less than Q-15%. Failure
leads to stage 3 where a further 12 units are tested. These results are combined with
the results from the previous stages. The average of the total of the 24 units thus
tested should be equal to or greater than Q. No more than two units should be less
than Q- 15% and no unit should be less than Q- 25% (USP, 2005)
In the testing of delayed-release products there is a similar three-tiered approach for
both the acid-dissolution (Al, A2 & A3) and buffer-dissolution (B1, B2 & B3)
stages. For extended-release the levels are denoted Li, L2 and L3.
1.3.4. Operational factors that may affect the dissolution test
The British Pharmacopoeia 2004 and the United States Pharmacopoeia 28 each give
considerable guidance about external factors that may affect dissolution. The more
significant factors are referred to in this section.
1.3.4.1. Vibration
Vibration is a source of energy that is transmitted to the dissolution medium and can
therefore significantly affect dissolution data. It was Beyer and Smith (1971) who first reported a six fold increase in the dissolution rate of tolbutamide tablets due to
increased vibration of the dissolution vessel. Therefore, to minimize the effects of
vibration, the distance from the stirring drive motor to the stand supporting it and
the distance from the rotating basket to the point connecting the shaft to the
dissolution motor should be specified. Vibrations may arise from various sources including equipment such as the water bath and pump. There is anecdotal evidence
that vibration transmitted through building fabric (floors, walls) and furnishings
(benches) from more distant sources such as lifting-gear, air-conditioning and heating systems may also have an effect. The net result is that equipment should be
heavily insulated and clamped into position to effectively increase the mass of the
vessels and thereby decrease vibration.
37

1.3.4.2. Alignment of the Stirrer Shaft
Misalignment of the stirring element can be the cause of variation in the dissolution
rate of a drug. According to compendial limits, the shaft should be positioned such
that its axis is no more than 2 mm at any point from the vertical axis of the vessel. Significant wobble should also be eliminated. Bending of the stirring rod has been
reduced by increasing the acceptable diameter from 6.0 to 6.5 mm to approximately 10 mm. Minor changes in physical alignment of the paddle may produce large
variations in results.
1.3.4.3. Vessel Design and Construction
Rosalia et al (1972) discovered that flask shape affected the hydrodynamics of the
system through differences observed in the dissolution rate of hydrochlorthiazide
tablets using flasks from two manufacturers. The use of a hemispherical flask
allows some variation in construction. Minor changes in vessel shape may
considerably alter the dissolution rates determined by the paddle method (Cox et al., 1982) due to changes in the hydrodynamics created by the different shapes. Plastic
vessels provide closer dimensional tolerances than glass vessels (Cox & Furman,
1984) and should be preferred to glass vessels so long as drug does not sorb to them
and that the dissolution fluid does not interact with the plastic (Cox et al., 1982).
However, plastic vessels also have practical disadvantages. Plastic has a lower
thermal conductivity than glass, therefore, the warm up time for the medium is
longer and the temperature of the medium may be difficult to maintain as heat may
radiate faster from the surface of the medium than from the vessel wall (Hanson,
1991b). During dissolution, some tablets may become more centred in glass vessels than in plastic vessels, which is probably attributable to friction between the tablet
and the wetted vessel surface being greater for plastic than for glass. Even the
method of cleaning the vessel may result in different dissolution properties. Differences have been obtained from glass containers when cleaned with soap and water or 95% ethanol, the former method leaving a residual film (Cox & Furman, 1984).
38

1.3.4.4. Sampling Procedures
Flow-through facilities usually allow on-line ultraviolet (UV) analysis of drug
dissolved or collection of samples for subsequent analysis. The sample must be
filtered prior to analysis to reduce turbidity problems caused by undissolved drug
and excipients and to help eliminate false results caused by particles dissolving
following removal.
A sampling probe used for continuous sampling must not disturb the
hydrodynamics of the system. When continuous monitoring is accomplished by
flow-through systems, the flow rate should not be too high or some of the
suspended drug will adhere to the filter, resulting in a percolation effect and
artificially high estimates of the amount of drug released (Ford & Rajabi-
Siahboomi, 2002). The sampling probe should be as small as possible because the
displacement volume of the probe may modify dissolution rates. Savage and Wells
(1982) described an apparatus that allows removal of the probes giving a maximum
of 40 s immersion in the dissolution fluids. Capillary sampling probes of 1.5 mm diameter were used, their size being reduced to minimize their influence on fluid
hydrodynamics.
Adsorption of the drug onto the filter should be avoided when sampling and the
release of iso-octylphenoxypolyethoxyethanol, which is often included in
membrane filters as a wetting agent, may be a potential problem as this surfactant has significant absorption in the range 220 to 240 nm. Hence, selection of an
appropriate filter material is important to avoid selective loss of drug through
adsorption. Selection of a suitable pore size is also important, as it should be small
enough to retain undissolved particles of a significant size but without restricting flow and impeding sample withdrawal. Replacement of sampled fluid must be by
fluid of the same temperature as that inside the dissolution vessels.
39

1.3.4.5. Temperature Control
The Unites States Pharmacopoeia directs that the thermometer should be removed
before the test and that the temperature should be checked periodically. The
dissolution fluids should be maintained at 37 ± 0.5°C as even slight temperature
variations may have a significant effect on tablet dissolution (Hanson, 1991c). It is
important, therefore, to prevent evaporation of the medium both to reduce heat loss
and maintain the volume of the liquid for dissolution. This is accomplished through
the use of plastic covers, placed over the opening of the vessels.
1.3.4.6. Deaeration of the Dissolution Medium
Cox et al (1983) investigated the dissolution of prednisolone tablets in water
presaturated with air. These authors found that the higher air content in the medium
resulted in more drug being dissolved using the paddle method. In water
presaturated with air, air bubbles attached to particles of the disintegrating tablets
owing to sorption of air. Instead of sinking to the bottom of the vessel, the particles
were suspended by the air bubbles and thus subjected to greater conditions of
agitation.
Failure to deaerate media used with the basket apparatus results in the clogging of
the pores of the basket by air, causing different flow characteristics (Cartwright,
1979) and often a decrease in dissolution rates. This has even greater influence
when gel forming extended release dosage forms are being tested (Ford & Rajabi-
Siahboomi, 2002). Bubbles attached to tablets or capsules may cause the dosage
form to relocate near to the top of the basket, thereby reducing dissolution rates or
amounts dissolved (Cartwright, 1979). The basket is intended to hold the tablet in a fixed position. Disintegration of the dosage form will occur in the basket and fluid
must flow through the basket sufficiently to disperse the tablets and sweep dissolved drug into the bulk of the dissolution fluid (Ford & Rajabi-Siahboomi,
2002).
40

The United States Pharmacopoeia 28 and the British Pharmacopoeia 2004 each
state that media should be deaerated before use. The United States Pharmacopoeia
recommended method of heating the medium and filtering under vacuum is labour
intensive and time consuming and other validated methods may be used. Inert gas
purging is a popular alternative. Current media preparation stations available can
dispense heated and deaerated medium based on the vacuum principle. They also
reduce foaming problems encountered during deaeration when surfactants are used
in the media. Degenhardt et al (2004) compared these methods of deaeration and
found helium sparging to be the most effective and efficient. They recommended
that media be sparged for 30 s per litre of container volume at a helium flow rate of
40 mLls, using an inlet filter pore size between 2 and 10 µm.
However, there is a risk of re-aeration when the medium is transferred to the
dissolution vessels. A 275% increase in the level of oxygen has been reported after
deaeration and dispensing of media into dissolution vessels (Diebold & Dressman,
1998). An alternative approach to deaeration would be to sparge the medium in-situ
with helium. Dissolution testers with an on-line deaeration facility are available
commercially.
1.3.4.7. Variation in Speed of Agitation
Agitation speed must be kept constant during the test. The compendia specify a
speed tolerance of ± 4%. Technological advancements have led to electronic control
of motors that allows speed to be checked throughout the test period by means of a digital display.
1.3.5. Standardisation and Calibration
All apparati must be calibrated and the variables standardized and known. Variation
in dissolution data between individual vessels and between experimental runs can be determined through appropriately designed experiments. Errors in experimental
set-up are minimised by using mean dissolution times and partial balancing.
41

Standardization of equipment and experimental conditions should remove all
variable factors.
The United States Pharmacopoeia 28 specifies apparatus suitability tests, based on
the operating conditions, involving the USP Dissolution Calibrator, Disintegrating
Type or the USP Dissolution Calibrator, Non-disintegrating Type. The apparatus is
deemed suitable if the obtained results are within the accepted range stated for that
type of calibrator.
Equipment problems such as chain looseness, tilting of stirrer motor, excessive
vibration, or misalignment of the flasks with the stirrers have been identified using
calibrators (Hanson, 1991d). Non-disintegrating calibrators are composed of 300
mg salicylic acid, whereas disintegrating calibrators contain 10 mg prednisone. The
dissolution rates obtained from the calibrants should fall within established ranges
at both 50 and 100 rpm.
There has been a growing realisation of late that modern dissolution testers are high-performance instruments, which if subjected to a regular programme of
maintenance and mechanical calibration, can perform very accurately and precisely. This has led to a growing body of opinion that appropriate electromechanical
calibration regimes may offer far more confidence than chemical calibrators (Shah,
2004).
1.3.6. Other Variables in Compendia] Methods
The British Pharmacopoeia 2004 usually specifies 900 mL of dissolution fluid, but
for digoxin tablets the volume is 600 mL. Variation in the volume of dissolution
medium to be used is more prevalent in the United States Pharmacopoeia 28, for
example, 500 mL for alprazolam tablets, 750 mL for metyrosine capsules, 900 mL for ampicillin capsules and 1000 mL for dicumarol tablets. In addition, different
volumes may be specified for various strengths of the same product, as in the case
of phentermine hydrochloride capsules, where 500 mL of medium is used if the
strength is 15 mg or less, but 900 mL is used for preparations containing in excess
42

of 15 mg. The same volumes are specified for prednisone tablets where the cut-off
point is 10 mg and for cinoxacin capsules where 500 mL is used for capsules
containing 250 mg or less but 1000 mL is used for capsules containing in excess of
250 mg.
1.3.7. Dissolution Media
The selection of an appropriate dissolution medium is a critical stage of the
dissolution test. As previously described the dissolution test has numerous roles that
must be taken into account during media selection. For the quality control of a drug
product, the chosen medium must be able to distinguish between batch-to-batch
variability, scale up and post approval changes (SUPAC) and stability issues. This
discriminating ability is built in during dissolution test method development. In
general, physiological media are preferred to water-organic solvent mixtures or
solutions incorporating surfactants. For a New Drug Application (NDA) it is
recommended that, during dissolution method development, dissolution profiles in
at least 3 media should be generated i. e. pH 1.2,4.5 and 6.8. Water can be used as
an additional medium. If the drug is poorly soluble, appropriate concentrations of
surfactants are recommended (CDER, 2003). All the in vitro and in vivo data
generated can then be used to select a dissolution medium (and agitation speed)
with adequate discriminating ability.
Ideally, a dissolution medium should be formulated as close as possible to that pH
anticipated in in vivo fluids; for example, dissolution media based on 0.1N HC1 are
used to mimic gastric pH. Simulated gastric fluid is similarly used. Food can increase the gastric pH to as high as 3 to 5. Many compendia) dissolution fluids are
at a pH near neutral despite the fact that tablets, when swallowed, will meet a lower
gastric pH. Both the United States Pharmacopoeia 28 and the British
Pharmacopoeia 2004 indicate that the pH of dissolution fluid should be within 0.05
of that specified in the relevant monograph. The use of surfactants and enzymes
may also be a coarse approximation of the intestinal fluids, although surfactants
may be included to increase drug solubility by solubilization into micelles.
43

Complex biorelevant media are being used more frequently during the drug
development stages to mimic the physicochemical characteristics of the
gastrointestinal tract in the fasted and fed states. The aims are to highlight potential bioavailibility issues and attempt to achieve IVIVC that would aid candidate
selection and predict product performance without resorting to in vivo studies. Thus
far, it has not proved viable to extend their utility to quality control applications. Klein et al (2004) characterised the physicochemical properties of homogenised
standard breakfasts administered during pharmacokinetic studies and compared
them to several commercially available liquid meals in an attempt to propose a biorelevant medium. Examples of biorelevant media include fasted state and fed
state simulated intestinal fluids (FaSSIF and FeSSIF) consisting of bile salt-
phospholipid mixed micelle systems (Tables 1.2. a and 1.2. b), which significantly increase the cost of the test. Bovine milk has also been investigated (Macheras et
al., 1987; Galia et al., 1998). Diluted Intralipid® emulsions have been suggested as
an alternative to milk because they are not subjected to biological variation. Aiache
et al (1989), suggested that drug release from controlled-release formulations
should be studied following a2h contact with peanut oil by a dissolution test
involving increases in pH (peanut oil resembles a heavy fatty food).
Table 1.2a. Typical FaSSIF Medium. From Vertzoni et al (2004)
Component Content
Sodium taurocholate 3 mM
Lecithin 0.75 mM
NaOH (pellets) 0.174 g
NaH2PO4. H20 1.977 g
NaC1 3.093 g
Purified water q. s. 500 mL
Medium pH = of 6.50; osmolality - 270 mOsm/kg
44

Table 1.2b. Typical FeSSIF Medium. From Vertzoni et al (2004)
Component Content
Sodium taurocholate 15 mM
Lecithin 3.75 mM
NaOH (pellets) 4.04 g
Glacial acetic acid 8.65 g
NaCI 11.874 g
Purified water q. s. 1000 mL
Medium pH = 5.00; osmolality - 635 mOsm/kg
1.3.8. Dissolution Testing of Selected Dosage Forms
1.3.8.1. Dissolution Testing versus Drug Release Testing
The United States Pharmacopoeia distinguishes dissolution from drug-release.
Dissolution testing is applied to dosage forms where the drug content is considered
to be readily available for dissolution, i. e. the dosage forms have not been
formulated to retard the passage of the drug into solution in any substantial way. In
contrast to this, products that have been formulated to retard the dissolution in
specific media or for a pre-determined period of time are considered to be modified
release products and are subjected to drug release testing. Modified release products include extended-release (sustained or slow-release) products and delayed-release
(enteric-coated) products. The former are described as allowing at least a twofold
reduction in the dosing frequency as compared with that drug presented as a
conventional dosage form. A delayed-release product is one that releases the drug at
a time other than promptly after administration.
1.3.8.2. Immediate-release Tablets & Capsules
For immediate-release tablets and capsules, the only barrier to drug release is a
simple disintegration or erosion stage, which is generally accomplished in less than
45

1 h. For such dosage forms the dissolution test is based on the straightforward
basket or paddle apparatus with a single sample being taken before quantitation.
The United States Pharmacopoeia test specification is typically Q= 75% in 45 min
although this may vary. For example, for Calcium Carbonate Tablets USP the time
specificed is 30 min but for Calcium Gluconate Tablets USP it is 45 min. Nitrofurantoin Capsules USP present a special case where capsules containing
macrocrystals dissolve slowly (to reduce GI irritation) and Q at 1,3 and 8h is
between 20-60%, ? 45% and >_60% respectively. Capsules containing both
macrocrystals and the monohydrate form are subjected to a two phase test in an
acidic then basic medium as described in the relevant monograph (United States
Pharmacopoeia 28,2005).
For immediate-release formulations of highly water-soluble drugs (e. g. BCS Class
I) the United States Pharmacopoeia monograph may omit the dissolution test and
rely solely on disintegration testing. This is the case for a number of well-
established preparations such as Apomorphine Hydrochloride Tablets USP.
Otherwise, the only practical modification that may be required for immediate-
release drugs is for floating dosage forms where a sinker is required (Figure 1.10)
1.3.8.3. Delayed-release (Enteric-coated) Tablets & Capsules
For enteric-coated (gastroresistant) dosage forms designed not to release their drug
content in an acidic environment, a two-stage test is prescribed in both the United
States Pharmacopoeia and British Pharmacopoeia, which can take one of two forms.
In Method A, the dosage form is tested using the basket or paddle apparatus initially
containing 750 ml of 0.1 N hydrochloric. After 2h exposure a sample is removed for analysis and 250 ml of phosphate buffer is immediately added and the mixed
contents of the dissolution vessel adjusted to a pH of 6.8 ± 0.05. The test is
continued for 45 min, or whatever time is prescribed in the relevant monograph before a further sample is taken for analysis.
In Method B, the dosage form is tested using the basket or paddle apparatus
containing 1000 ml of 0.01 N hydrochloric acid. After 2h exposure a sample is
removed for analysis and the remaining contents of the vessel are discarded and 1000 ml of a phosphate buffer having a pH of 6.8 ± 0.05 added. The test is
46
continued for 45 min, or whatever time is prescribed in the relevant monograph
before a further sample is taken for analysis.
In both instances, six units are initially tested and no more than 10% of the labelled
content of drug should be released after 2 h. If these conditions are not met, a further six units are examined; the average released for the 12 units tested should
not exceed 10% with no individual unit being greater than 25%. Failure leads to
testing of a further 12 units; the average of the 24 units tested should not exceed
10% released and no unit should exceed 25%. For the studies at pH 6.8, none of the
initial six units tested should release less than Q+ 5% after the prescribed time;
failure leads to testing a further six units where the average of the 12 tested is equal
to or greater than Q and no unit is less than Q- 15%. Failure leads to the evaluation
of another 12 units; of the 24 units examined, the average must be equal to or
greater than Q; no more than 2 units can be less than Q- 15%, and no unit can be
less than Q- 25%. Here Q is defined as the total amount of active ingredient
dissolved in both the acid and buffer stages expressed as a percentage of labelled
content.
The official tolerances for delayed-release products have been given above and
commercial manufacturers will have their own in-house specifications. Standards
for enteric-coated forms ensure the integrity of the coat, but consideration should be
given to a pH change method for evaluating extended-release medications. This
evaluation should ensure that dose dumping does not occur at a specific pH, as
might be a problem with certain delayed-release dosage forms, for example those
using hydroxypropylmethylcellulose phthalate as a coat.
1.3.8.4. Drug Release From Modified-release Dosage Forms
Various methods have been used to study the influence of pH changes on drug
dissolution, e. g. media change from 0.1 N HCl to pH of 7.5 or a progressive rise from pH 1.5,4.5,6.9,7.2 to 7.5 over 22 h. Such methods are aimed at mimicking the pH changes that a dosage form is subjected to during transit through the
gastrointestinal tract. Skelly et al (1986) developed topographic profiles of the
matrix tablets to determine the dissolution profiles at a variety of pHs where an
47

apparent three-dimensional profile of amount released versus time versus pH was
produced. Such information may help to identify the pH range over which the drug
dissolution rate is faster than intended, thus avoiding the problem of dose dumping
at a particular narrow pH range. Additionally, they lead to the suitable single pH for
testing; for example, phosphate buffer pH 5.4 was most meaningful for quinidine
gluconate controlled-released products
Apart from being used for QC purposes, dissolution testing can also be used as a
predictive tool during the development of modified release dosage forms to
discriminate the in vivo effect of good and bad formulations. Therefore, one needs
to understand the mechanism of drug release from the dosage form in order to
utilise the dissolution testing effectively. For extended-release reservoir
formulations, where the drug is dissolved and released by diffusion through a
barrier coat, factors such as the influence of medium on solubility of the drug needs
to be established (Ford & Rajabi-Siahboomi, 2002).
Drug release from hydrophilic matrix sustained release formulations occurs via
diffusion through and erosion of the hydrated viscous surface polymer (Alderman,
1984; Ford et al., 1987). Factors that hinder these processes or provide additional
support to the surface polymer must be minimised to avoid false results. For
example, dissolution testing of a large swelling matrix using the basket apparatus
may be inappropriate because the basket wall may support the matrix, which, when
combined with a slow speed of rotation, leads to unrealistically slow drug release
(Ford & Rajabi-Siahboomi, 2002). Conversely in vivo, faster drug release may
occur due to gut contractions and the presence of food enhancing matrix erosion. A
second example involves matrix-sustained release tablets sticking to the walls of the
dissolution vessel, resulting in a reduction in the surface area exposed to the
dissolution medium. Hence, the choice of apparatus is critical and a discriminating
dissolution test would aid the accomplishment of the desired in vivo drug release
profile, through manipulation of the formulation variables.
Osmotic pump devices, where a microscopic orifice is laser-drilled into the surface
of the tablet coating, are not suitable for testing by USP dissolution Apparati 1-4
as the tablet may lie in such an orientation as to obscure the hole, In this case, drug
48

release is determined using USP Apparatus 7 with the tablet glued onto the end of a
reciprocating rod.
Pellets, beads and other particulate systems intended to provide prolonged release
are probably best tested by column methods that facilitate changes in pH or
dissolution fluids. With compendial apparati, problems arise; for instance, it is
difficult to capture dispersed particles when the paddle method is used, and small
particles may pass through the mesh of the basket in the basket method (Ford &
Rajabi-Siahboomi, 2002).
Moore and Flanner (1996) described a simple model using mathematical indices to
define a similarity factor f2, to compare dissolution profiles as in Equation 1.8:
f2=50 log {[1+1/n Et`1 (Rt - Tt)2] °. 5 X 100} {Eq. 1.13 }
where R, and Tt are percent dissolved at each time point for the reference product
and the test product, respectively. Using the f2 values, dissolution profiles are
considered dissimilar if these values were less than 50 with average difference
between any dissolution samples not being greater than 50%. The similarity factor
and similarity testing have been recommended for dissolution profile comparison in
the FDA's Guidance for Industry (CDER, 1995,1997a, b).
1.3.8.5. Granules & Suspensions
Release of drug from particles in granules and suspensions is usually intended to
occur rapidly in vivo and testing of such dosage forms is not common. However,
United States Pharmacopoeia 28 includes dissolution testing of Flunixin Meglumine
Granules (Apparatus 2, Q= 75% in 60 min), Cefuroxime Axetil for Oral suspension (Apparatus 2, Q= 60% in 30 min) and Indomethacin Oral Suspension (Apparatus 2,
Q= 80% in 20 min). The flunixin granules are tipped into the filled vessel, the indomethacin suspension is simply poured onto the surface of the dissolution
medium whilst the cefuroxime powder is reconstituted before being poured onto the
medium.
49

1.3.9. Robotics and Automation
Dissolution testing by manual methods is very labour-intensive and time-
consuming, particularly during critical stages of product development, such as
stability studies or plant trials and also when modified or sustained-release dosage
forms are involved. It is also costly to implement on a 24 hour-a-day, 7 day-a-week
basis. Therefore, computerised systems have been developed which control many features of the test procedure, from sample introduction, through instrument
operation to data capture and reporting. The additional cost of such systems is easily
justified where the test may take up to 24 h. The use of robotic systems is
particularly valuable in busy development laboratories where the robot can also
remove samples for off-line testing. Complicated samples may require off-line
clean-up by liquid-liquid extraction or solid-phase extraction followed by
chromatographic analysis. Rapid insertion and withdrawal of a small sample probe
controlled robotically, produces minimum disturbance of the hydrodynamic
conditions, with a sampling time as low as 40 s. The use of robotics increases the
speed of assay, the throughput and the productivity of dissolution testing although
the speed of assay may then be the rate-limiting step to productivity. Consequently,
short (2 -5 cm) HPLC columns may be used to increase assay speed, increasing
productivity by as much as 75%.
1.4. In Vitro - In Vivo Correlation
The QC functions of dissolution tests were established in Section 1.3. In addition,
one may consider the in vitro dissolution test as a prognostic tool for in vivo
performance during the drug development stages. In this respect, dissolution tests
are used at preformulation stages to characterise candidate drug properties and
select suitable excipients to optimise drug release. Dissolution testing is then
applied to candidate formulations to determine which formulation produces the
most desirable and reproducible dissolution profile (Dressman et at., 1998). Later in
the development life cycle dissolution test data are used to establish in vitro - in
vivo correlations (IVIVC) between drug release from the dosage form and absorption. In such studies the dissolution test conditions must be physiologically
50

relevant otherwise the prediction of which drug and which dosage form will provide the most favourable release profile in vivo will be invalid (Dressman et al., 1998).
In situations where in vitro results do not adequately predict in vivo performance of
a drug product, the size and number of clinical trials have to be increased, at
significant cost.
For poorly soluble drugs where dissolution is the rate-limiting step to absorption, the presence of food may improve bioavailability. However, current pharmacopeial dissolution tests do not account for this. The dissolution test should mimic the
conditions in the G1T as closely as possible to be meaningful (Anon., 1997). In
relation, a crucial factor that needs to be considered is the composition of the dissolution medium and its biorelevance (see Section 1.3.7).
For some drugs, simple test conditions have allowed dissolution rate to be related to bioavailability. Kingsford (1984) showed a linear relationship between the
percentage frusemide dissolved from tablets in 30 min and drug bioavailability
relative to an oral solution when frusemide was examined using the rotating basket
apparatus and buffer at pH 5.0. Therefore, in certain cases, it may be appropriate to
apply dissolution testing data to evaluate biopharmaceutical implications of a
product change rather than an automatic bioequivalence study (CDER, 1995).
1.5. Biopharmaceutics Classification System (BCS)
Biopharmaceutics is the study of how the physico-chemical properties of drugs and formulations and the physiology of the route of administration affect the rate and extent of drug absorption. Bioavailibility and bioequivalence are two elementary terms used in biopharmaceutics.
Bioavailablity can be defined as "the rate and extent to which the active drug ingredient or therapeutic moiety is absorbed from a drug product and becomes
available at the site of drug action" (Lobenberg & Amidon, 2000), or " ... the extent
51

and the rate to which a substance or its therapeutic moiety is delivered from a
pharmaceutical form into the general circulation" (EMEA).
Bioequivalence is "the absence of a significant difference in the rate and extent to
which the active ingredient or active moiety in pharmaceutically equivalent dosage
forms becomes available at the site of action when administered at the same molar dose under similar conditions in an appropriately designed study in human
subjects" (Kanfer, 2002), or "two medical products are considered to be
bioequivalent when their concentration vs. time profiles, from the same molar dose,
are so similar that they are unlikely to produce clinically relevant differences in
therapeutic and/or adverse effects" (Anon, 1994).
As part of the safety and efficacy assessment of a generic drug product, regulatory
agencies require a bioavalability (BA) study and a bioequivalence (BE) study
versus the innovator product whose safety and efficacy will have been established through expensive clinical trials. Such studies require in vivo comparisons of the
plasma drug concentration in healthy human subjects between the test and reference
products. As a result, the BCS was introduced with guidance from the FDA. The
regulatory aim of the BCS is to make the drug development and review process
more efficient by recommending a strategy for replacing certain BE studies with
surrogate in vitro dissolution tests. In addition, biowavers that exempt a product from in vivo BA and BE studies may be granted for lower strengths of immediate
release (IR) and modified release (MR) drug products, based on formulation
proportionality and dissolution profile comparison (CDER, 2000a).
The three major factors that determine the rate and extent of drug absorption from
solid oral dosage forms are solubility, dissolution rate and permeability. Solubility
and permeability are recognised in the BCS, which categorises drugs into four
classes based on their aqueous solubility and intestinal permeability (Table 1.3). Dissolution rate is recognised in the BCS biowaver criteria.
52

Table 1.3. The Biopharmaceutics Classification System
BCS CLASS DRUG SOLUBILITY DRUG PERMEABILITY
I High High
II Low High
III High Low
IV Low Low
The following ranges are required when estimating the drug solubility and
permeability classification as high or low in Table 1.3 (CDER, 2000b):
>A drug substance is considered HIGHLY SOLUBLE when the highest dose
strength is soluble in 5 250m1 water over a pH range 1 to 7.5.
>A drug substance is considered HIGHLY PERMEABLE when the extent of
absorption in humans is determined to be > 90% of an administered dose, based
on mass-balance or in comparison to an intravenous reference dose.
At present, biowavers for in vivo BA and BE studies can be requested if the drug
falls into BCS Class 1, is formulated as an IR solid oral dosage form and shows
rapid and comparable dissolution (f2 similarity factor > 50) in pH 1.2,4.5,6.8 with
the innovator product (Lennernas & Abrahamsson, 2005). The BCS definition for
`rapid' dissolution is as follows (CDER, 2000b):
AA drug product is considered to be RAPIDLY DISSOLVING when z 85% of
the labelled amount of drug substance dissolves within 30 min using USP
apparatus 1 (100rpm) or apparatus 2 (50rpm) in a volume S 900m1 of 0.1N HCl
or simulated gastric fluid, pH 4.5 buffer and pH 6.8 buffer or simulated intestinal fluid.
However, certain restrictions are applied when applying for a biowaiver:
I. The drug must have a wide therapeutic index;
53

2. The drug must be chemically stable in the gastrointestinal tract;
3. Excipients used must have previously been used in FDA approved IR dosage
forms and must not have a significant effect on the rate and extent of oral drug
absorption;
4. The product must not be designed for absorption from the buccal cavity.
1.5.1. The Impact of the BCS Solubility and Dissolution Rate Criteria on Drug Discovery and Development
The BCS provides criteria for determining the rate-limiting factor for drug
absorption from oral dosage forms. Therefore, it may influence the choice of drug
candidate(s) for further development, the prediction and elucidation of food
interactions, the choice of formulation and IVIVC in the dissolution testing of oral dosage forms.
Furthermore, pharmacokinetic factors such as absorption, distribution, metabolism
and excretion (ADME) affect drug bioavailability, efficacy and safety and thus are
vital considerations in the selection process of oral drug candidates in development
pipelines. Since solubility, permeability and the fraction of dose absorbed are fundamental BCS parameters that affect ADME, their knowledge should prove
useful in drug discovery and development. In particular, the classification can be
used to make the development process more efficient (Yazdanian et al., 2004). For
example, in the case of a drug placed in BCS Class II where dissolution is the rate- limiting step to absorption, formulation principles such as polymorph selection, salt
selection, complex formation and particle size reduction (i. e. nanoparticles) could be applied earlier in development to improve bioavailability.
However, it must be acknowledged that the current BCS class boundaries are too
conservative in certain aspects, which could lead to the loss of promising
compounds in early development stages or prevent biowavers from being granted
54

for drugs that exhibit Class I behaviour in physiologically relevant conditions (Polli,
2004).
Suggestions have been made to further improve the applicability of the BCS in
industry and were summarised in a BCS workshop report by Polli et al (2004). Of
particular importance to the topic of this thesis are the suggestions that are likely to
affect the future solubility and dissolution classifications of the BCS. They are as follows:
1. The pH range for solubility studies should be limited to only include pH 1.2,4.5
and 6.8.
2. The solubility of amphoteric compounds should be determined at the isoelectric
point if it occurs between pH 1.2 and 6.8.
3. An intermediate solubility class should be introduced given the tendency of many
acids and bases to be highly soluble at pH 6.8 and 1.2 respectively.
4. The dose: solubility ratio for determining the solubility class boundary should be
increased from 250 mL to 500 mL, particularly at pH values of 4.5 and 6.8 which
are representative of the small intestine where the fluid volume is greater than in the
stomach.
5. The dissolution classification should be broadened from at least 85% dissolved in
30 min to at least 85% dissolved in 60 min.
The implementation of BCS guidance to utilise in vitro dissolution tests as a
surrogate for in vivo BE studies and the incorporation of the BCS into drug
development strategies exemplifies the rapidly evolving function of the dissolution
test.
55

1.6. Regulatory Developments
The previously contrasting views of dissolution testing held by pharmaceutical
scientists and regulators led to constant development and review of the technology.
The industrial drive has been to improve the IVIVC, so speeding up the
identification and development of new therapeutic products and elimination of
unworkable drug candidates, whilst the regulatory focus was traditionally on the use
of dissolution testing as a quality control tool to confirm product safety & efficacy.
However, regulatory perspectives are now changing, signalled by the emergence of
the dissolution test as a surrogate in vitro bioequivalence test. Several aspects of
dissolution testing are receiving particular attention in various industry-government
fora (Williams et al., 2004)
1.7. Harmonisation
Discussions within the Pharmacopoeial Discussion Group under the auspices of the
International Conference on Harmonisation (ICH) process have led to some harmonization of compendia) approaches. There is an agreement by all to adopt the
United States Pharmacopoeia three-tiered system of testing and specification where
appropriate. However, some differences are further from resolution. For example,
the Japanese Pharmacopoeia does not recognise USP Apparatus 3 and maintains a different approach to delayed release products. The European Pharmacopoeia (2001)
prescribes three apparatuses for oral solid dosage forms, the basket, the paddle and
the flow-through along with a flow-through device for suppositories and three
systems for testing transdermals which equate to the USP paddle-over-disk, diffusion cell and rotating cylinder.
1.8. Aim and Objectives
The overall aim of this project is to gain a better understanding of the effect of the dissolution medium on the drug release profile in vitro, so that in vitro dissolution
testing can be used more effectively in the early stages of formulation development.
56

This aim is to be achieved through in vitro dissolution testing of drugs using media
that are a closer representation of the gastric and intestinal environment than
compendial media. Consequently, insight into possible interactions between drugs
and/or excipients and biorelevant media would be useful to understand some of the
physicochemical factors affecting dissolution into these complex media. Hence, a
more accurate prediction of in vivo dissolution performance would be provided,
progressing to the concept of achieving IVIVC.
In order to discriminate between differences in drug dissolution in various media,
the model drugs selected in this project have to be poorly soluble. Also, to
investigate drug dissolution as a barrier to drug absorption the chosen drugs must be
highly permeable for absorption to be dissolution rate limited. According to the
BCS these criteria would fall under Class H. Drugs that are acids will be poorly
soluble in an acidic environment such as the stomach but on movement into the
intestinal region, where the pH is higher, rapid dissolution is likely occur. Conversely, basic drugs will be more readily soluble in the stomach with the
possibility of precipitation in the fed state or as the stomach contents empty into the
small intestine.
The Objectives of this project are to:
> Investigate the dissolution of two acidic BCS Class II drugs in milk, which is a more realistic representation of the fed state stomach, in comparison to
compendial media > Devise and conduct a pH shift experiment (from acidic to neutral) using
simple media to assess the extent of any reprecipitation of a basic drug on
exposure to intestinal pH and the utility of such a test > Investigate the dissolution of two basic BCS Class II drugs in the proposed
FaSSIF and FeSSIF media and their constituents in comparison to
compendial media > Compose and assess the use of alternative, less expensive, surfactant based
media to replace FaSSIF and FeSSIF media.
57

2. MATERIALS AND GENERAL METHODS
2.1. Materials
A list of the materials and suppliers used throughout the project is provided below.
Where necessary, specific details are described in the relevant chapter.
2.1.1. Drug substances
As stated in Section 1.8, the model drugs chosen for investigation in this project
would have to be poorly soluble so that differences in the dissolution behaviour of
each drug in various media could be distinguished. Also, for drug dissolution to be
the rate-limiting step to absorption, drug permeability through the gut wall would have to be high. Consequently, two acidic drugs (ibuprofen and naproxen) and two
basic drugs (loratadine and trimethoprim) were selected (Table 2.1. ). All four drugs
are categorised in BCS Class II, i. e. they are poorly soluble and highly permeable.
Table 2.1. Drug substances used. Drug Source Batch
Number
Ibuprofen Knoll Pharma Chemicals, Nottingham, 453408 (particle size 25 µm) U. K.
Loratadine Kindly donated by Ranbaxy Laboratories 1459651
(particle size 10 µm) Ltd, Hamachal Pradesh, India.
Naproxen Sigma-Aldrich Chemie GmbH, Steinheim, 02230LB-024
(particle size 20 µm) Germany.
Trimethoprim Kindly donated by Alpharma Ltd, 39423
(particle size 50 µm) Barnstaple, U. K.
58

2.1.2. Marketed drug products
Tablets are the most common and preferred oral dosage form. It was decided to
investigate a marketed tablet formulation of each drug for its dissolution behaviour
in various media. Brand selection was random. However, for loratadine, poor disintegration of the selected product (Brand A) in biorelevant media led to the
investigation of two further products (Brand B and Q. The products selected are listed in Table 2.2.
Table 2.2. Marketed drug products used. Marketed Product Source Batch Number
Ibuprofen 400mg tablets The Boots Company PLC, 1SS
Nottingham, U. K.
Loratadine 10mg tablets Ranbaxy (UK) Ltd, London, U. K. 140 9665
(Brand A)
Loratadine 10mg tablets APS Ltd, Eastbourne, U. K. 4T27LT
(Brand B)
Loratadine 10mg tablets Boots Brand, PL Holder Schering- 05B 1607
(Brand C) Plough Ltd, Hertfordshire, U. K.
Naproxen 250mg tablets Roche Products Ltd, Hertfordshire, El 171
(Naprosyn®) U. K.
Trimethoprim 200mg Alpharma Ltd, Barnstaple, U. K. TG 424
tablets
59

2.1.3. Ingredients used in solubility screens and dissolution media
All the materials used in the preparation of the dissolution media and the surfactants
investigated for their solubilising capacity for loratadine are listed in Table 2.3
below.
Table 2.3. List of materials used. Material Source Batch Number
Brij 35. Polyoxyethylene Sigma-Aldrich Chemie GmbH, 025KO055
23 lauryl ether. Steinheim, Germany.
Casein (Technical grade) Sigma-Aldrich Chemie GmbH, 013KO162
Steinheim, Germany.
CHAPSO. 3- [(3- Sigma-Aldrich Chemie GmbH, 015K5315
Cholamidopropyl) Steinheim, Germany.
dimethylammoniol -2- hydroxyl -1- propanesulfonate (98%)
Cremophor EL®. Castor oil Sigma-Aldrich Chemie GmbH, 103K2521
polyoxyethylene ether Steinheim, Germany.
CTAB. Hexadecyltrimethyl Sigma-Aldrich Chemie GmbH, 113KO092
ammonium bromide. Steinheim, Germany.
DDAO. N, N- Sigma-Aldrich Chemie GmbH, 063K2607
Dimethyldodecylamine N- Steinheim, Germany.
Oxide.
Glacial acetic acid (-100%, BDH, Poole, U. K. K23898917
AnalaR®)
Hydrochloric Acid (GPR®) BDH, Poole U. K. K32540451 343
Lactose (Lactopress®, Borculo Domo Ingredients, 204022
spray dried monohydrate, Chester, U. K.
USP)
Continued.........
60

Table 2.3 (contd). List of materials used.
Material Source Batch Number
Lecithin. Lipoid GmbH, Ludwigshafen, 108015-1/88;
Egg phosphatidylcholine. Germany 108015-1/124;
(EPC S) 108015-1/911
Potassium dihydrogen Rectapur®, Prolabo, Bois, 1188
phosphate France.
Skimmed, Semi-Skimmed ASDA, Liverpool, U. K. -- and Whole Milk
Sodium acetate (AnalaR®) BDH, Poole, U. K. K91214705 339
Sodium chloride Rectapur®, Prolabo, Bois, N020
France.
Sodium dihydrogen BDH, Poole, U. K. A856721
orthophosphate (AnalaR®)
Sodium dodecyl sulphate BDH, Poole, U. K. 6744110
Sodium hydroxide pellets GPR®, BDH, Poole, U. K. 260494H16S
Sodium Taurocholate Sigma-Aldrich Chemie GmbH, 084K5301
(95%) Steinheim, Germany.
Sodium Taurocholate Alfa Aesar, Lancaster, U. K. 10109329
hydrate (97%)
Triton® X100. Sigma-Aldrich Chemie GmbH, 024KO025 Polyethylene glycol tert- Steinheim, Germany.
octylphenyl ether (Sigma
Ultra)
Tween®80 Sigma-Aldrich Chemie GmbH, 052KO144
Polyoxyethylenesorbitan Steinheim, Germany.
Monooleate (Sigma Ultra)
61

2.1.4. Drug extraction and mobile phase solvents
Organic solvents used to extract drug from milk-based media and in the preparation
of mobile phases fro HPLC analyses are listed in Table 2.4.
Table 2.4. Drug extraction and mobile phase solvents used.
Solvent Source
Acetonitrile (HiPerSolv for HPLC®) BDH, Poole, U. K.
Cyclohexane (HiPerSolv for HPLC®) BDH, Poole, U. K
Ethyl acetate (HiPerSolv for HPLC®) BDH, Poole, U. K
Methanol (HiPerSolv for HPLC®) BDH, Poole, U. K.
Orthophosphoric acid (85%) J. T. Baker, Deventer, Holland.
Sodium perchlorate BDH, Poole, U. K.
Water (HiPerSolv for HPLC®) BDH, Poole, U. K.
2.1.5. Filters
Samples collected during solubility, dissolution and intrinsic dissolution rate
experiments were passed through the appropriate filters listed in Table 2.5.
Table 2.5. Filters used for sample collection procedures. Filter size and type Source
0.45µm syringe filters Millipore Corp, Bedford, U. S. A
Millex®-LCR, PTFE, 25mm
20µm cannula filters Science Marketing International Ltd,
Erweka style, UHMW polyethylene Maisemore, U. K.
62

2.2. General Experimental Methods
2.2.1. Solubility determinations
2.2.1.1. Ibuprofen and naproxen
10 mg of drug substance was placed into a 20 x 42 mm screw cap vial followed by 6
mL of medium. The vial was then capped and agitated in a heated shaker (Model
AM89B, Dynex Technologies Ltd, Worthing, U. K) for 24 h at 37°C. At 1,5 and 24
h 1.5 mL of the bulk suspension was sampled and passed through a 0.45 gm filter,
into a2 mL glass autosampler vial. For solubility studies in milk media, the samples
were excessively particulate for filtration and therefore, 1.5 mL of sample was
transferred to a2 mL Eppendorf tube instead and spun at 14,000 rpm (G force = 9878 g) for 1h in a mini centrifuge (Model Z160M, Hermle Labortechnik,
Wehingen, Germany). 1 mL of the supernatant was then removed and added to 1
mL of cylohexane (ibuprofen) or to 1 mL of ethylacetate (naproxen) in a test tube.
This mixture was then shaken for 20 s before 500 µL of the organic layer was
removed, mixed with 1 mL of phosphate buffer pH 10 and shaken for 20 s. 800 µL
of the phosphate buffer was then transferred to a2 mL glass autosampler vial for
analysis. The pH of the bulk suspension was measured at 1,5 and 24 h using a digital pH meter (Delta 350, Mettler Toledo, Leicester, U. K. ).
2.2.1.2. Loratadine
10 mg of drug substance was placed into a 20 x 42 mm screw cap vial followed by 2
mL of medium. A magnetic stirrer bar was then inserted into the vial containing the bulk suspension and the vial capped before being placed in a Variomag Telemodul
40CT heated stirrer (H+P Labortechnik GmbH, Oberschleissheim, Germany) at 37°C for 24 h. 600 µL samples were withdrawn from the vial at 1,5 and 24 h and transferred to an Eppendorf tube using an auto pipette and spun at 40,000 rpm (G force = 80,640 g) for 15 min in a Beckman Optima TL ultracentrifuge (Beckman
Coulter Inc, California, USA). 450 µL of the supernatant was transferred to a second Eppendorf tube and spun again at 40,000 rpm for a further 15min. 300µL of the
63

supernatant was then transferred to a2 mL glass autosampler vial for dilution or
direct analysis. The pH of the bulk suspension was measured at 1,5 and 24 h using a
digital pH meter.
2.2.1.3. Trimethoprim
100 mg of drug substance was placed into a 20 x 42 mm screw cap vial followed by
4 mL of medium. The vial was then capped and a similar procedure as ibuprofen
and naproxen was used except that 1 mL samples were removed from the bulk
mixture instead of 1.5 mL and no extractions were required, as milk media were not
used.
The samples were assayed as described in Section 2.3.
N. B. Whilst samples were assayed at 1,5 and 24h, where drug `solubility' is
referred to throughout this thesis it is with reference to 24h data.
2.2.2. Disintegration testing
A Pharma Test PTZ (Pharma Test Apparatebau GmbH, Hainburg, Germany)
disintegration tester was used throughout. Three tablets were placed in the basket
rack assembly without disks (see Section 1.2.2) and lowered into the relevant
medium held at 37°C. The tester was operated and the time taken for complete disintegration of all the tablets was noted.
For ibuprofen and naproxen, tablet disintegration tests were carried out in 0. IN HCI,
0.003N HCI containing 0.017%v/w sodium dodecyl sulphate, the filtrate of 1.475%
w/v dispersion of casein in O. O1N HCI and in 50/50 mixtures of O. 1N HC1 with whole, semi-skimmed or skimmed milk (see Section 4.2.2 for media preparation).
For loratadine, tablet disintegration tests were carried out in O. 1N HCI, FaSSIF blank and FeSSIF blank (see Section 6.2.2 for media preparation).
64

Disintegration tests were not conducted for trimethoprim for reasons explained in
Chapter 7.
2.2.3. Dissolution testing
Experiments were conducted in a Pharmatest PTW S2C (Pharma Test Apparatebau
GmbH, Hainburg, Germany) or a Distek 2100C (Distek Inc, New Jersey, USA)
dissolution tester using Apparatus 2 (paddle method) described in General Chapter
<711> of the United States Pharmacopoeia 28 (see Section 1.3.1.2). Six tablets were
tested for each experiment. 500 mL or 1000 mL of dissolution medium was placed in each of six vessels, the paddles lowered to 25 mm from the base of the vessels
and the vessels covered with plastic lids. After lowering, the paddles were rotated at 50 rpm to agitate the dissolution medium. The dissolution medium was heated to
37°C by a water bath. Each tablet was then dropped into a separate vessel containing
the dissolution medium. 5 mL samples were taken at 15,30,45,60,90 and 120 min
or designated time points using 0.45 µm syringe filters for non- particulate media
and 20 µm cannula filters for milk media. The pH of the medium was measured at
the start and end of the test using a digital pH meter (Delta 350, Mettler Toledo,
Leicester, U. K. ).
2.2.4. Intrinsic dissolution rate determinations
IDR was measured by the rotating disk method of the United States Pharmacopoeia
28, using the Woods apparatus (Figure 1.3). The test preparation was as follows:
Each stainless steel die (10 mm diameter) was bolted to a base plate made from
hardened polished steel. 200 mg of ibuprofen or 400 mg of naproxen drug substance
was weighed and added to each die. The drug powder was then compressed into a disk using a hydraulic press (Model M-30, Research and Industrial Instrument
Company, London, England) and hardened steel punch (Figure 1.5) at a
65

compression force of 8x 10⁶ N/m2 (80 bar). The base plate was removed after
compression to expose a smooth drug surface. Screw threads on the top of the die
allowed attachment to a specially designed shaft that could be interchanged with the
paddle on the Pharmatest PTW S2C dissolution apparatus. Experimental conditions
and sampling times were identical to those used for tablet dissolution tests (see
Section 2.2.3).
2.2.5. Procedures for drug extraction from milk based media
A significant challenge to dissolution testing in food-based media was the extraction
of dissolved drug into a suitable matrix for analysis, which can be both time and labour intensive. For HPLC, the dissolved drug had to be extracted from the various
milk media (50/50 mixtures of whole, semi-skimmed or skimmed milk with 0.1N
HCl) into an aqueous medium that could be injected directly onto the column. A
back extraction method was developed and applied to each drug as described below.
2.2.5.1. Extraction of ibuprofen
Dissolution and solubility studies: After removal and filtering, 2 mL of the sample
solution was mixed with 2 mL of cyclohexane and the mixture was shaken for 20 s. The mixture was allowed to settle before 1 mL of the (upper) cyclohexane layer was transferred to a second tube and 2 mL of phosphate buffer pH 10 added. This
mixture was shaken for 20 s, allowed to settle and 1 mL of the (lower) aqueous layer
transferred to a2 mL glass autosampler vial for analysis. Method validation studies
using each of the three milk-HCI media spiked with an ibuprofen standard (n = 6) indicated this process recovered >90% of the available ibuprofen in the sample. For
solubility studies, a similar procedure was used except that it was scaled down such that half of all the volumes stated above were used.
IDR studies: After removal and filtering, 2 mL of the sample solution was mixed with 2 mL of cyclohexane and the mixture was shaken for 20 s. The mixture was allowed to settle before 1 mL of the (upper) cyclohexane layer was transferred to a second tube and 1 mL of phosphate buffer pH 10 added. This mixture was shaken
66

for 20 s, allowed to settle and 800 µL of the (lower) aqueous layer transferred to a2
mL glass autosampler vial for analysis.
2.2.5.2. Extraction of naproxen
Dissolution and solubility studies: After removal and filtering, 2 mL of the sample
solution was mixed with 2 mL of ethyl acetate and the mixture was shaken for 20 s.
This mixture was allowed to settle before 500 µL of the (upper) ethyl acetate layer
was transferred to a second tube and 2 mL of phosphate buffer pH 10 added. This
was shaken for 20 s, allowed to settle and 1 mL of the (lower) aqueous layer
transferred to a 2mL glass autosampler vial for analysis. Method validation studies
using each of the three milk-HCI media spiked with a naproxen standard (n=6)
indicated this process recovered >85% of the available naproxen in the sample. For
solubility studies, a similar procedure was used except that it was scaled down such
that half of all the volumes stated above were used.
IDR studies: After removal and filtering, 2 mL of the sample solution was mixed
with 2 mL of ethyl acetate and the mixture was shaken for 20 s. The mixture was
allowed to settle before 500 pL of the (upper) ethyl acetate layer was transferred to a
second tube and 1 mL of phosphate buffer pH 10 added. This mixture was shaken for 20 s, allowed to settle and 800 µL of the (lower) aqueous layer transferred to a2
mL glass autosampler vial for analysis.
2.3. Analytical Method
2.3.1. HPLC
2.3.1.1 Ibuprofen
For dissolution and solubility studies, quantitation was carried out using a Hewlett
Packard HP1090 liquid chromatograph (Agilent Technologies U. K. Ltd, Stockport, U. K. ). 25 µL of sample for assay was injected into a mobile phase consisting of
67

0.3% v/v orthophosphoric acid, 24.7% v/v water and 75% v/v methanol flowing
through the column at a rate of 1 mU min. A 5µm Nucleosil C18 column (25 cm x 4.6 mm) (Hichrom Ltd, Reading, U. K. ) was used and eluting peaks were detected at
a wavelength of 264 nm. Quantitation was based on the use of an external ibuprofen
calibration standard and peak area measurement.
For IDR studies, quantitation was carried out using a Waters 2695 liquid
chromatograph connected to a Waters 474 fluorescence detector (Waters S. A. S.,
Cedex, France). The injection volume, mobile phase and flow rate were unchanged from the dissolution and solubility studies. A5 pm Hypersil C18 column (10 cm x 4.6 mm) (Hichrom Ltd, Reading U. K. ) was used fitted with a Phenomenex C18
guard cartridge (4 mm x3 mm) (Macclesfield, U. K. ). Eluting peaks were detected at
excitation and emission wavelengths of 222 nm and 285 nm respectively. Quantitation was based on the use of an external ibuprofen calibration standard and
peak area measurement.
2.3.1.2. Loratadine
Quantitation was carried out using either a Hewlett Packard HP1090 or Agilent
1100 (Agilent Technologies U. K. Ltd, Stockport, U. K. ) liquid chromatograph. 10
µL of sample was injected into a mobile phase consisting of 1% v/v orthophosphoric
acid, 8%v/v potassium dihydrogen phosphate (0.5M), 44%v/v acetonitrile and 48%
v/v water flowing through the column at a rate of 1.8 mUmin. A5 . tm Hypersil
BDS C18 column (15 cm x 4.6 mm) (Hichrom Ltd, Reading, U. K. ) fitted with a Phenomenex C18 guard cartridge (4 mm x3 mm) was used and eluting peaks were detected at a wavelength of 200 nm. Quantitation was based on the use of an external loratadine calibration standard and peak area measurement.
2.3.1.3. Naproxen
Dissolution samples were analysed using a Hewlett Packard HP 1090 liquid
chromatograph whilst solubility and IDR samples were analysed using an Agilent
68

1100 liquid chromatograph. 25 µL of sample was injected into a mobile phase
consisting of 32% v/v orthophosphoric acid (0.01M) and 68% v/v methanol flowing
through the column at a rate of 1.5 mL/min. A5 µm Spherisorb C18 column (10 cm
x 4.6 mm) (Hichrom Ltd, Reading, U. K. ) fitted with a Phenomenex C18 guard
cartridge (4 mm x3 mm) was used and eluting peaks were detected at a wavelength
of 262 nm. For IDR studies, the injection volume was increased to 50 gL for all
media tested except O. 1M HCl where the injection volume was increased to 100 µL. Quantitation was based on the use of an external naproxen calibration standard and
peak area measurement.
2.3.1.4. Trimethoprim
Dissolution samples were analysed using a Hewlett Packard HP1090 liquid
chromatograph whilst solubility samples were analysed using an Agilent 1100 liquid
chromatograph. 5µl of sample was injected into a mobile phase consisting of 30%
v/v methanol and 70%v/v sodium perchlorate (0.01M), adjusted to pH 3.6 with
phosphoric acid, flowing through the column at a rate of 1.3 mlJmin. A5 µm Hypersil BDS C18 column (15 cm x 4.6 mm) (Hichrom Ltd, Reading, U. K. ) was
used and eluting peaks were detected at a wavelength of 280 nm. Quantitation was based on the use of an external trimethoprim calibration standard and peak area
measurement.
69

3. DETERMINATION OF THE SURFACE TENSIONS
OF THE DISSOLUTION MEDIA INVESTIGATED
3.1. Introduction
As previously explained in Section 1.1.4.1, the surface tension of the
solvent/dissolution medium can affect the dissolution of a drug particle through its
influence on the wetting phenomena at the solid surface. Hence, it is an important
parameter to consider when comparing the effect of different media on drug
dissolution. For example, Chen et al (2003) found that decreasing the surface
tension of 0.1N HCl by addition of Tween 80 reduced the IDR of the hydrophobic
drug, CI-1041. The lower surface tension promoted nucleation of the insoluble
chloride salt onto the disk surface causing the reduction in IDR. Also, the
dissolution rate of the poorly soluble drug, griseofulvin, from a solid dispersion was
correlated to the surface tensions of carrier aqueous solutions (Saito et al., 2002). An
assessment of the wetting properties of physiological concentrations of bile salt
solutions versus compendial media was conducted by Luner (2000). The study
revealed that the bile salt solutions had lower surface tensions and contact angles
compared to compendial media and that individual bile salts differed in surface
tension lowering effect and contact angles. These findings are important in
establishing an IVIVC for drug dissolution because they illustrate that drug wetting
may differ between compendial media and physiological fluids.
In terms of tablet formulations, wetting of the tablet surface is an elementary
requirement for disintegration, therefore, the surface tension of the medium can influence the drug release rate. Anwar et al (2005) investigated tablet disintegration
in relation to the liquid penetration rate, which is dependent on the surface tension
and viscosity of the liquid, the contact angle and the tablet pore size.
The purpose of this chapter is to obtain definitive in-house surface tension data for
the variety of dissolution media used throughout the project. No literature values
70

were available for some of the unique media used whilst those reported for other
media were inconsistent. Also, by using the same method and conditions for all the
media, more accurate and meaningful comparisons of surface tensions were possible
through reduced experimental variability.
3.2. Methods
3.2.1. Density measurements
For the method used to determine surface tension, the densities of the dissolution
media were required to resolve their surface tensions. The densities of the all the dissolution media were determined using a Paar Model DMA 55 density meter (Anton Parr Ltd, Hertford, U. K. ). The measurement is based on the oscillating U-
tube principle whereby the resonant frequency of the sample is inversely
proportional to the square root of its mass. Since the volume of the U-tube is
standardised, the resonant frequency measured is used to automatically calculate and display the density (p) of the sample. The instrument was first calibrated using two
fluids of accurately known densities at the same temperature and pressure to be used for the unknown samples. 17.53% w/v sodium chloride solution (p = 1.1058 g/cm3)
and methanol (p = 0.7866 g/cm3) were used for this purpose. After calibration, a
sample of medium was injected into the U-tube and the density at 25°C recorded. The mean of three determinations was used for the surface tension calculation.
3.2.2. Surface tension measurements
The drop shape technique was used to determine surface tension (Satherley et al., 1990; Miller et al., 2001; Miqueu et al., 2001). Fundamentally, the opposing forces
of surface tension and gravity determine the shape assumed by a pendant drop of liquid. Surface tension makes the drop spherical while gravitational forces elongate the drop. Advances in video digital techniques have allowed highly accurate
71

detection of the droplet edge enabling drop profile coordinates to be mapped by
computer programmes. Hence working backwards from the acquired droplet shape
and known force of gravity, the surface tension can be determined.
A pendant drop of the sample medium was formed at the tip of a capillary
positioned inside a glass cell with optically flat windows (Figure 3.1). Zoom lens
and a silicon charge-coupled device (CCD) camera were used to capture an image of
the drop and a digital image processor captured the profile coordinates of the drop.
Axisymmetric drop shape diagnostic software utilised the Laplace-Young equation (Equation. 3.1) and the measured sample density to compute the surface tension:
ep gh=y (1/Rl + 1/R2) { Eq. 3. l}
where Ap is density difference between the droplet and substance surrounding it, g is the acceleration due to gravity, h is the height in the drop measured from its apex,
y is the surface tension and R1 and R2 are radii of curvature determined from the
drop profile coordinates.
A schematic diagram of the apparatus is shown in Figure 3.1. For each medium tested, three drops were analysed and the results reported in Table 3.1. For each drop, the software reported the mean data from 10 simultaneously captured images.
72

ý rý uý -;
1
2 :. .
ý0 C A.
" 21 vi
--------------- I
c- "..
I. L
I-1 ------------
uC Z C+
w`
Y Em E v+ ý
O0y
YZ
ý
iý w GL
ýc a .x
ae
sE 'S
�S
I
ý ý ý x «. a C
L
E .., �;
C[S
eC
C3.
Y C1.
E Gf.
CJ
. -ý rL
GIi
73

3.3. Results
The density and surface tension measurements for the media used are presented in
Table 3.1 below. Numerous SDS concentrations were used in the project. 2.5
mg/mL SDS was used to lower the surface tension of 0.1M HC1 to that of gastric fluid. 0.17 mg/mL SDS was used to lower the surface tension of 0.003M HCl to
match that of the 50/50 milk/HCl mixtures (Chapter 4 and 5) but as determined in
Table 3.1. Density and surface tension data for dissolution media investigated.
Medium Density (g/cm3)
@ 25°C
Mean Surface
tension (mN/m)
n=3
± S. D.
(mN/m)
Purified water (Milli Q®) 0.99262 66.02 0.13
Distilled water 0.99268 68.08 0.40
0.1M HCl 0.99424 68.48 2.99
O. 1M HCl + 2.5 mg/mL SDS 0.99461 32.03 0.16
0.003M HC1 0.99230 67.43 0.33
0.003M HCl + 0.17 mg/mL SDS 0.99256 40.35 1.26
Simulated Intestinal Fluid (SIF) 0.9980 63.35 0.22
50150 Whole milk/0.1M HC1 1.00670 47.80 0.83
50/50 Semi-skimmed milk/0.1M HCl 1.00800 47.94 0.27
50/50 Skimmed milk/0.1M HCl 1.00873 47.52 0.74
Casein filtrate in 0.01M IICI 0.99358 48.95 0.78
FaSSIF Blank 0.99957 66.98 0.74
FaSSIF 0.99984 49.28 0.53
FeSSIF Blank 1.00491 65.95 0.99
FeSSIF 1.00683 46.12 0.49
CTAB 1.82 mg/mL 1.00493 33.42 0.11 CTAB 0.1365 mg/mL 0.99965 35.29 0.12
SDS 1 mg/mL 1.00543 27.66 0.10
SDS 0.225 mg/mL 0.99982 31.90 0.94
74

Table 3.1 the surface tension of this medium was lower than the 50/50 milk/HCl
media. The 1 mg/mL and 0.225 mg/mL SDS media at the bottom of Table 3.1 were
used to match loratadine dissolution profiles in FeSSIF and FaSSIF respectively (Chapter 6).
3.4. Discussion
The surface tension of pure water is reported as 72 mN/m at 25°C (Weast, 1976).
Repeated determinations using 2 different sources of Milli-Q® purified water (John
Moores University and University of Liverpool) gave similar results (- 66. N/m).
Satherley, J (personal communication) revealed that his group saw the same
discrepancy. It is believed that there is some impurity passing through the Milli-Q
filtration system that is responsible for the reduced surface tension, and it is not an
error in the experimental procedure. The surface tension recorded for distilled water
was slightly higher at 68 mN/m. i. e. the disparity in surface tension with literature
values is related to the source of the water used.
Table 3.1. shows that the milk and casein filtrate media had similar surface tensions
to each other and therefore differences in drug dissolution between these media
should not be attributed to this factor. It must be noted that complete wetting of solid
particles may not be governed solely by the surface tension of the liquid phase. Fell
and Mohammad (1995) and Luner et al (1996) demonstrated differences in the
wetting of solid surfaces by different media at similar surface tensions. The nature
of the surface-active components and their interaction at the liquid-vapour and solid- liquid interfaces may control wetting as opposed to surface tension itself (Luner & VanDer Kamp, 2001)
FaSSIF and FeSSIF blanks (i. e. without bile salt and lecithin) had surface tensions
approximately 19mN/m higher than the complete FaSSIF and FeSSIF media. The difference can be explained by the addition of the surface-active components
75
sodium taurocholate (NaTC) and lecithin to the complete media. Interestingly, there
was only a small difference in surface tension between FaSSIF and FeSSIF (Table
3.1. ) despite large differences in concentration of NaTC and lecithin between the
two media. The critical micelle concentrations (cmcs) of NaTC and lecithin are 1.6
mg/mL and 0.076 ng/mL respectively (Leng et al., 2003). Lecithin does not form
micelles easily in aqueous media and floats on the liquid surface until it can form
mixed micelles. This implies that at the concentrations of NaTC and lecithin used
mixed miceller systems were formed. Consequently, dissolution enhancements from
tablets observed in these media are probably micelle solubilisation effects as
opposed to improved wetting effects.
CTAB and SDS-containing media had lower surface tensions than FaSSIF and FeSSIF media. For the SDS media, the two concentrations used were well below the
cmc of SDS, which is 2.37 mg/mL. For the CTAB media (cmc = 0.36 mg/mL) only
the higher of two concentrations used was above the cmc. The fact that these
synthetic surfactant media were able to match dissolution profiles generated by
FaSSIF and FeSSIF suggests that profile matching was the result of improved
wetting of the drug. In support of this, Luner and VanDerkamp (2001) found that
0.25% w/v SDS and 0.1% w/v Triton X-100 were significantly better wetting agents for a model surface, poly(methyl methacrylate), than various physiologically
representative media.
The data generated show there were no significant surface tension differences
between the aqueous media without surfactants i. e. Water, HCI, SIF, FaSSIF blank
and FeSSIF blank. Hence it can be postulated that factors other than surface tension,
such as pH and other variables, may account for any differences observed in drug
dissolution using these media.
76

4. IBUPROFEN
4.1. Introduction
Ibuprofen ((RS)-2-(4 isobutylphenyl) propionic acid) is a widely used non-steroidal
anti-inflammatory drug (NSAID) with analgesic and antipyretic properties (Figure
4.1). It used in the clinical management of mild to moderate pain, in the treatment of
arthritic and soft tissue disorders and in primary dysmenorrhoea.
H3C
Figure 4.1. The chemical structure of ibuprofen
Ibuprofen is a poorly soluble acidic drug with a pKa of 4.4 (Clarke, 1986) and Log P
of 3.50 (Fini et al., 1995). The intrinsic solubility of the drug is 21 µg/mL at 37°C
(Table 4.2). It is considered highly permeable based on oral bioavailability being > 90% compared to a reference intravenous dose (Martin et al., 1990). Ibuprofen has
been classified as a BCS Class II drug (Lindenberg et al., 2004). The drug is usually
administered as the free acid form. It was chosen as a model drug to investigate
because the low stomach pH in the fasted state (approx pH 1.2 - 2.0) is likely to hinder the solubility of ibuprofen in the upper GI-tract and hence result in dissolution rate-limited bioavailability in this region. The time to peak plasma levels
of 1-2h (Davies, 1998) and scintigraphic monitoring of an orally administered formulation (Parr et al., 1987) show that ibuprofen absorption occurs in this region. Levine et al (1992) showed that the presence of food increased the absorption rate of ibuprofen, probably due to increased in vivo dissolution.
77
Thus it can be expected that in vitro dissolution tests using simple compendial
media may not accurately predict the in vivo behaviour. The aim of these
investigations was to carry out in vitro dissolution testing in more realistic media to
assess the physicochemical factors affecting drug dissolution in the presence of meal
components. This would aid the predictive nature of in vitro dissolution testing prior to expensive in vivo studies to ascertain an IVIVC.
Dissolution tests on ibuprofen 400mg tablets were initially carried out in 0.1N HCI
pH1.2, simulated intestinal fluid (SIF) pH 6.8 and O. 1N HCI + 0.25%w/v sodium dodecyl sulphate (HCI+SDS). This provided baseline dissolution profiles for
subsequent comparison with more complex media. For the HCI+SDS experiment, 0.25%w/v SDS was added to bulk HCI to lower the surface tension to that of gastric fluid (-35mN/m) (Finholt & Solvang, 1968; Dressman et al., 1998; Efentakis &
Dressman, 1998). Various media have been advocated to mimic the fed state
conditions in the GIT (Dressman et al., 1998; Galia et al., 1998). Milk was put forward as being nutritionally balanced (appropriate ratio of fats: proteins:
carbohydrates) and therefore a relevant dissolution medium (Dressman et al., 1998).
Ibuprofen is also known to be a GI irritant and is commonly taken with milk. Hence,
a mixture of 50% milk and 50% O. 1N HCI was used as a `realistic' medium to
mimic the fed state stomach. The fat content of the medium was varied by using
skimmed, semi-skimmed and whole milk. Lactose and casein based media were also investigated given that they are significant components of milk. IDR, solubility and disintegration tests were carried out in the specified media and the results discussed
in light of the dissolution data.
4.2. Materials and Methods
4.2.1. Materials
Details of all materials used in the preparation of the dissolution media and in
performing the experiments are listed in section 2.1.
78

4.2.2. Methods
Media preparation SIF was prepared in accordance with United States Pharmacopoeia 28 (2005) in a5 L volumetric flask.
HCI + SDS (0.25% w/v) was prepared by addition of 12.5 g of SDS to a5L
volumetric flask and making up to volume with O. 1N HCI. The pH of the medium
was 1.2.
For the milk media, 250 mL of the specified milk was mixed with 250 mL 0.1N HCl
in the dissolution vessel. The pHs of the media were approximately 2.7.
The lactose medium was composed of 4.8% w/v lactose monohydrate in 0.003N
HCI adjusted to pH 2.7. The medium was prepared by adding 240g of lactose
monohydrate to a5L volumetric flask and making up to volume with 0.003N FICI.
The casein medium was a dispersion of 1.475%w/v bovine casein in O. OIN HC1(pH
2.7) to match the casein concentration in the 50/50 milk/HC1 mixtures (see Section
4.3.2.4. ). 7.375 g of casein was accurately weighed and transferred to each dissolution vessel and 500 mL of 0.01N HCl added separately.
A further medium (casein filtrate) was prepared by filtering 5L of a 1.475% w/v dispersion of casein in 0.01N HC1, pH 2.7, under vaccum using the buchner
apparatus fitted with a Whatman No. 2 filter paper (Whatman International Ltd,
Maidstone, England).
0.003N HCl containing 0.017%w/v of the surfactant sodium dodecyl sulphate (0.017% w/v SDS), pH 2.7, was used as a medium to match the surface tension and pH of the milk mixtures. The medium was prepared by addition of 850 mg of SDS
to a5L volumetic flask and making up to volume with 0.003N HHC1.
79

Dissolution testing
The dissolution tests were performed according to the method described in Section
2.2.3 using 500 mL of dissolution medium.
Intrinsic dissolution rate determinations
See Section 2.2.4.
Solubility determinations
See Section 2.2.1.
Disintegration testing
See Section 2.2.2.
4.3. Results and Discussion
4.3.1. Dissolution in compendial media
The dissolution of ibuprofen tablets in 500mL 0. IN IICI at p'I 1.2 (non-sink
conditions) did not meet the typical compendial criteria for immediate release (IR)
dosage forms of 70% in 45 min (BP) or 75% in 45 min (USP) as the medium became saturated with drug (Figure 4.2). At more than 1 pH unit below its pKa, an
acidic drug is less than 10% ionised leading to a pH dependent solubility issue. The
addition of SDS as surfactant to the dissolution medium, to match the surface
tension of gastric fluid, increased ibuprofen dissolution but saturation was reached at 60 min and the amount of drug dissolved was still below the required amount for IR
dosage forms. Conversely, 94% ibuprofen dissolved within 15 min from tablets
exposed to 500 mL of SIF at pH 6.8, where the drug is fully ionised. As anticipated, these results confirm that the presence of surfactant and medium pIi affect the dissolution of an acidic drug such as ibuprofen. The United States Pharmacopoeia
28 (2005) criteria for the dissolution of ibuprofen tablets state that not less than 80% ibuprofen should dissolve in 60 min using apparatus 2 at 50 rpm. But the specified
80

II
ii
Ö0)00000 (D In It CM CV
panJossiQ %
Q0 T
0 N
LO 0
0 Q)
LO
r
0 CD
ý
ý
O CY)
C .ý
... a,
_E 1-
00 (6 2 a LL U)
N
1- 2 Q ý 0 ý
U 2 ý
N
I d
U
81

medium is 900m1 of pH 7.2 phosphate buffer, which may not accurately reflect in
vivo dissolution in the stomach where the fluid volume, pH and surface tension are
significantly lower.
4.3.2. Effect of milk-based media and milk components on the dissolution of ibuprofen tablets
4.3.2.1. Effect of lipid content
Figure 4.3 illustrates ibuprofen dissolution profiles in 500mL of the various
milk/HCl media under non-sink conditions but media saturation was not reached
within the 2h test. The mean amounts (± S. D. ) of ibuprofen dissolved at each time
point are plotted. The mean amounts of ibuprofen dissolved after 60 min in the
various media were compared. A one-way analysis of variance showed there was no
significant difference between the amounts of ibuprofen dissolved in the 3 types of
milk after 60 min (p>0.05). However, a 2-sample T-test between 0.1N HCI and each type of milk showed a significant difference in mean dissolution after 60 min in
each case (p<0.05).
These results suggest that the use of O. IN HCI as a dissolution medium may not
adequately represent real fed stomach conditions for the dissolution of ibuprofen.
Although the milk/HCl media were coarse representations of the fed state stomach
environment significant differences in the dissolution profiles were evident. The
0.1N HCl had a pH of 1.2 whereas all three milk-HC1 mixtures had pH values close
to 2.5 (at 37°C). Whether it was solely the increased pH that improved dissolution
was investigated by using diluted hydrochloric acid adjusted to pH 2.5. The
dissolution of ibuprofen was slightly lower at this pH.
The reported surface tension of whole milk of 52N/m (Fox & McSweeney, 1998b) is more than 100-fold higher than gastric fluid. Theoretically, mixing milk with gastric fluid in the stomach may alter the overall surface tension of the stomach contents, further influencing the dissolution of ibuprofen compared to O. iN IUCI. Indeed, Table 3.1 shows that the surface tension of all 3 milk/IUC1 mixtures was approximately 48mNlm, some 20mN/m lower than that of 0.1N HC!.
82

v s ý c 0
N
2 a ý lii
s0>
}}
O c0
C .ý
ý a> E H
U I
-Nil
E E `° YN U) I "- C.
3
ý ý r, 0
"ri ý
ý. U x N
a)O C/)2
ä
*4 ý ý v c.
ý .r x
lf) 0 ý NN 0
T
panJossia %
83
Li) O
U TZ
0
E ý2a
Cl) 2
4,
.ý
Üý .. ýý
_ý .ý_
oc
U
aý a
eri c ý
aý o
wý

An interesting finding was the non-significant difference in dissolution after 60 min between the three types of milk. The different milks were similar in composition and
surface tension except that, according to supplier information, the lipid content in
skimmed, semi-skimmed and whole milk was 0.1%, 1.7% and 3.6% w/v
respectively. Thus, increasing the lipid concentration in the dissolution medium did
not increase the dissolution of ibuprofen. For a drug with poor water solubility, increased dissolution was anticipated with increasing lipophilicity of the medium. The unexpected result could be attributed to the complex structure of milk, which is
also susceptible to change during processing and storage.
Milk lipids exist as emulsified globules coated with a membrane called the milk lipid globule membrane (MLGM). 25-60% of the membrane weight consists of
proteins, lipids and hexoses whilst other minor constituents make up the remaining
weight (Keenan & Patton, 1995). Hence the composition of the MLGM may hinder
the lipid solubilisation of ibuprofen. Furthermore, processes such as homogenisation
lead to the adsorption of casein micelles onto the lipid globules. Approximately 30%
of casein in homogenised milk is associated with lipid globules (Keenan & Patton,
1995). Agitation of the milk media by the paddles may cause random additional loss
of MLGM and some denuding of the lipid core, which could account for the large
variation in dissolution results between the six vessels at each sampling time point
although test conditions were kept constant.
The dissolution profiles in Figure 4.3 suggest that some constituent of milk other than the lipid content is improving dissolution, Milk contains proteins and
carbohydrates as other significant components and their effect on the dissolution of ibuprofen was investigated. Prior to this, a gross assessment of the effect of the other components in milk, such as dissolved salts, minerals and enzymes was carried out as described below.
4.3.2.2. Effect of soluble non-lipid components
To assess the effect of the other components present in milk, further dissolution tests on ibuprofen tablets were attempted using skimmed milk, which is virtually fat free.
84

The experiment involved increasing the milk content of the dissolution medium from 50% to 100% to avoid dilution of the soluble components while maintaining a
pH of 2.5 by acidifying the medium with hydrochloric acid. The experiment was
unsuccessful due to significant precipitation of protein that separated the milk into
an aqueous whey layer with a heavy precipitate settling to the bottom of the vessel
that clogged the sampling filters.
An alternative experiment was to assess the effect of diluting skimmed milk on the
dissolution profile of ibuprofen tablets. The pH of 100% skimmed milk was 6.8 at 37°C. The effect of dilution was investigated using 50% skimmed milk and 50%
water as a medium (pH 6.7 at 37°C). The dissolution profiles of ibuprofen 400 mg
tablets in the various media are compared in Figure 4.4. Again, non-sink conditions
caused media saturation with drug by 15 min at pH 6.8.
The clear improvement in the initial dissolution profile of the skimmed milk/water
medium compared to the skimmed milk/HC1 medium (Figure 4.4) may be attributed
to a more favourable pH for ionisation (pKa of ibuprofen = 4.4. ). However, at
similar pH values, milk concentration did not appear to have a significant effect on dissolution (p>0.05). This suggests that the component(s) in milk that improved
ibuprofen dissolution is/are capable of a similar extent of reaction at half their
original concentration, such that the mechanism of interaction is almost saturated at 50% dilution of the reactant(s) in milk. In terms of IVIVC, if skimmed milk was to be used as a biorelevant medium, dilution with water in the GIT is not likely to hinder the effect of the milk on ibuprofen tablets. The rapid dissolution (94% in 15
min) in SIF may be due to potassium and sodium salt formation in the phosphate buffer. The strong neutralising effect of Na' and K+ cations raises the microclimate
pH around the acidic drug particles thus aiding dissolution. This result should caution against the possible positive deviation from true intestinal dissolution of acidic drugs when using SIF as an in vitro dissolution medium.
85

000 0 00 c0 0 ý
panIossia %
86
0 CV 0
0 N
ý
LO cD ýn O=N
Q
LT ` `Q
ý CZ U 3: 2 YY
Q) Q)
LO
r-
0 CD
LO
it
0 CO
LO
C .ý
... m E H
OD cý 2 CL
4)
E E
Y
O
E E -Ný C/)
0 0 LO
cý 2 a LL Fn

4.3.2.3. Effect of lactose
Whether the dissolution profiles seen in milk/HCl are due to a drug interaction or
excipient interaction has yet to be determined. If the component(s) in milk
responsible can be identified first, then the nature of the interaction can be studied
using the isolated components allowing easier manipulation of experiments and
analyses. The major carbohydrate in milk is lactose. The typical lactose content of
bovine milk is 4.8%w/v (Fox & McSweeney, 1998a). The milk/HCl experiment was
repeated replacing milk with the appropriate concentration of lactose dissolved in
0.003N HCl maintaining a pH of 2.7.
Figure 4.5 shows the mean amount of ibuprofen dissolved after 60 min in the lactose
medium was 3.60% (S. D. ±0.24%). Thereafter, the lactose medium was saturated
with drug similarly to the HCI pH 2.5 medium. The non-significant increase in
dissolution of ibuprofen compared to HCI pH 2.5 (p>0.05) up to 60 min suggests
that the presence of lactose in milk is not responsible for the improved dissolution
seen in milk media.
4.3.2.4. Effect of casein
Since casein is the major protein in bovine milk (Swaisgood, 1995), it was used to
mimic the milk/HCJ experiment replacing the milk. A potential limitation to this
experiment was the precipitation of casein in HCl but protein was seen to precipitate in the milk/HCl experiments as well, therefore, any interaction between protein
precipitate and the tablets that may have occurred previously would be expected to
occur in this casein investigation. The typical total casein concentration in bovine
milk is 2.95% w/v (Swaisgood, 1995).
The dissolution profile of ibuprofen tablets in the casein medium (Figure 4.5)
showed approximately 9% (S. D. ± 0.84%) was dissolved after 60 min. This result falls within the error ranges for the dissolution data from milk/HCI experiments indicating that casein plays a role in the improved dissolution seen in milk media. Casein in bovine milk exists as micelles that are colloidal complexes of proteins and
salt, mainly calcium (Farrell et al., 1990). In the absence of calcium as in this
87

experiment, protein submicelles are still produced. These subunits form large
spherical casein micelles via hydrophobic interactions (Jensen et al., 1995). A
possible explanation for the increased dissolution of ibuprofen is the solubilisation
of the unionised drug in the casein micelles.
The possibility that the enhanced dissolution arose from a physical erosion of the
tablet by suspended particles of undissolved casein (casein is poorly soluble at pH 2.5) was assessed by filtering the medium prior to use. Paradoxically, using the
casein filtrate resulted in an increase in the rate and amount of ibuprofen dissolved
over 30 min (Figure 4.5). This phenomenon remains unexplained. The dissolution
profile plateau in the casein filtrate at 30 min suggests saturation was reached
whereas the lower dissolution and later plateau at 90 min in the unfiltered casein
medium suggests limited ibuprofen release from the tablets in the latter medium.
Having identified casein as the likely component in milk improving the dissolution
of the ibuprofen tablets used, the next stage of the investigation was to determine
whether the interaction was one with the drug or formulation excipients or both.
88

I
It N0 TT 1
Co (D ýt NO
panJossiQ %
89
LO
0 r-
O O)
LO r-
. ý. C
.ý
.ý ý E
0 (C)
tn n
ti LO
0 M
r- CV I Q
U I
c
N
ro
ý
NU 2ö a Un -r Uý 2r
ý s ý C O
N N
x a Ü
x ý ý .ý ý L
r. + Zº.
C .ý ý Cý u > 3
ý Ln n '1: ý
c ýý-
ý c .ý ý ý u ý 3
ý
`.. ° N
N=
=a
U2b =c
aý N rV Gr
O cý0 xi
U aý
^ xg oR w1 lý ýoc
F., a..
ý: r v= ý- Dý oný
Gz+ 'C
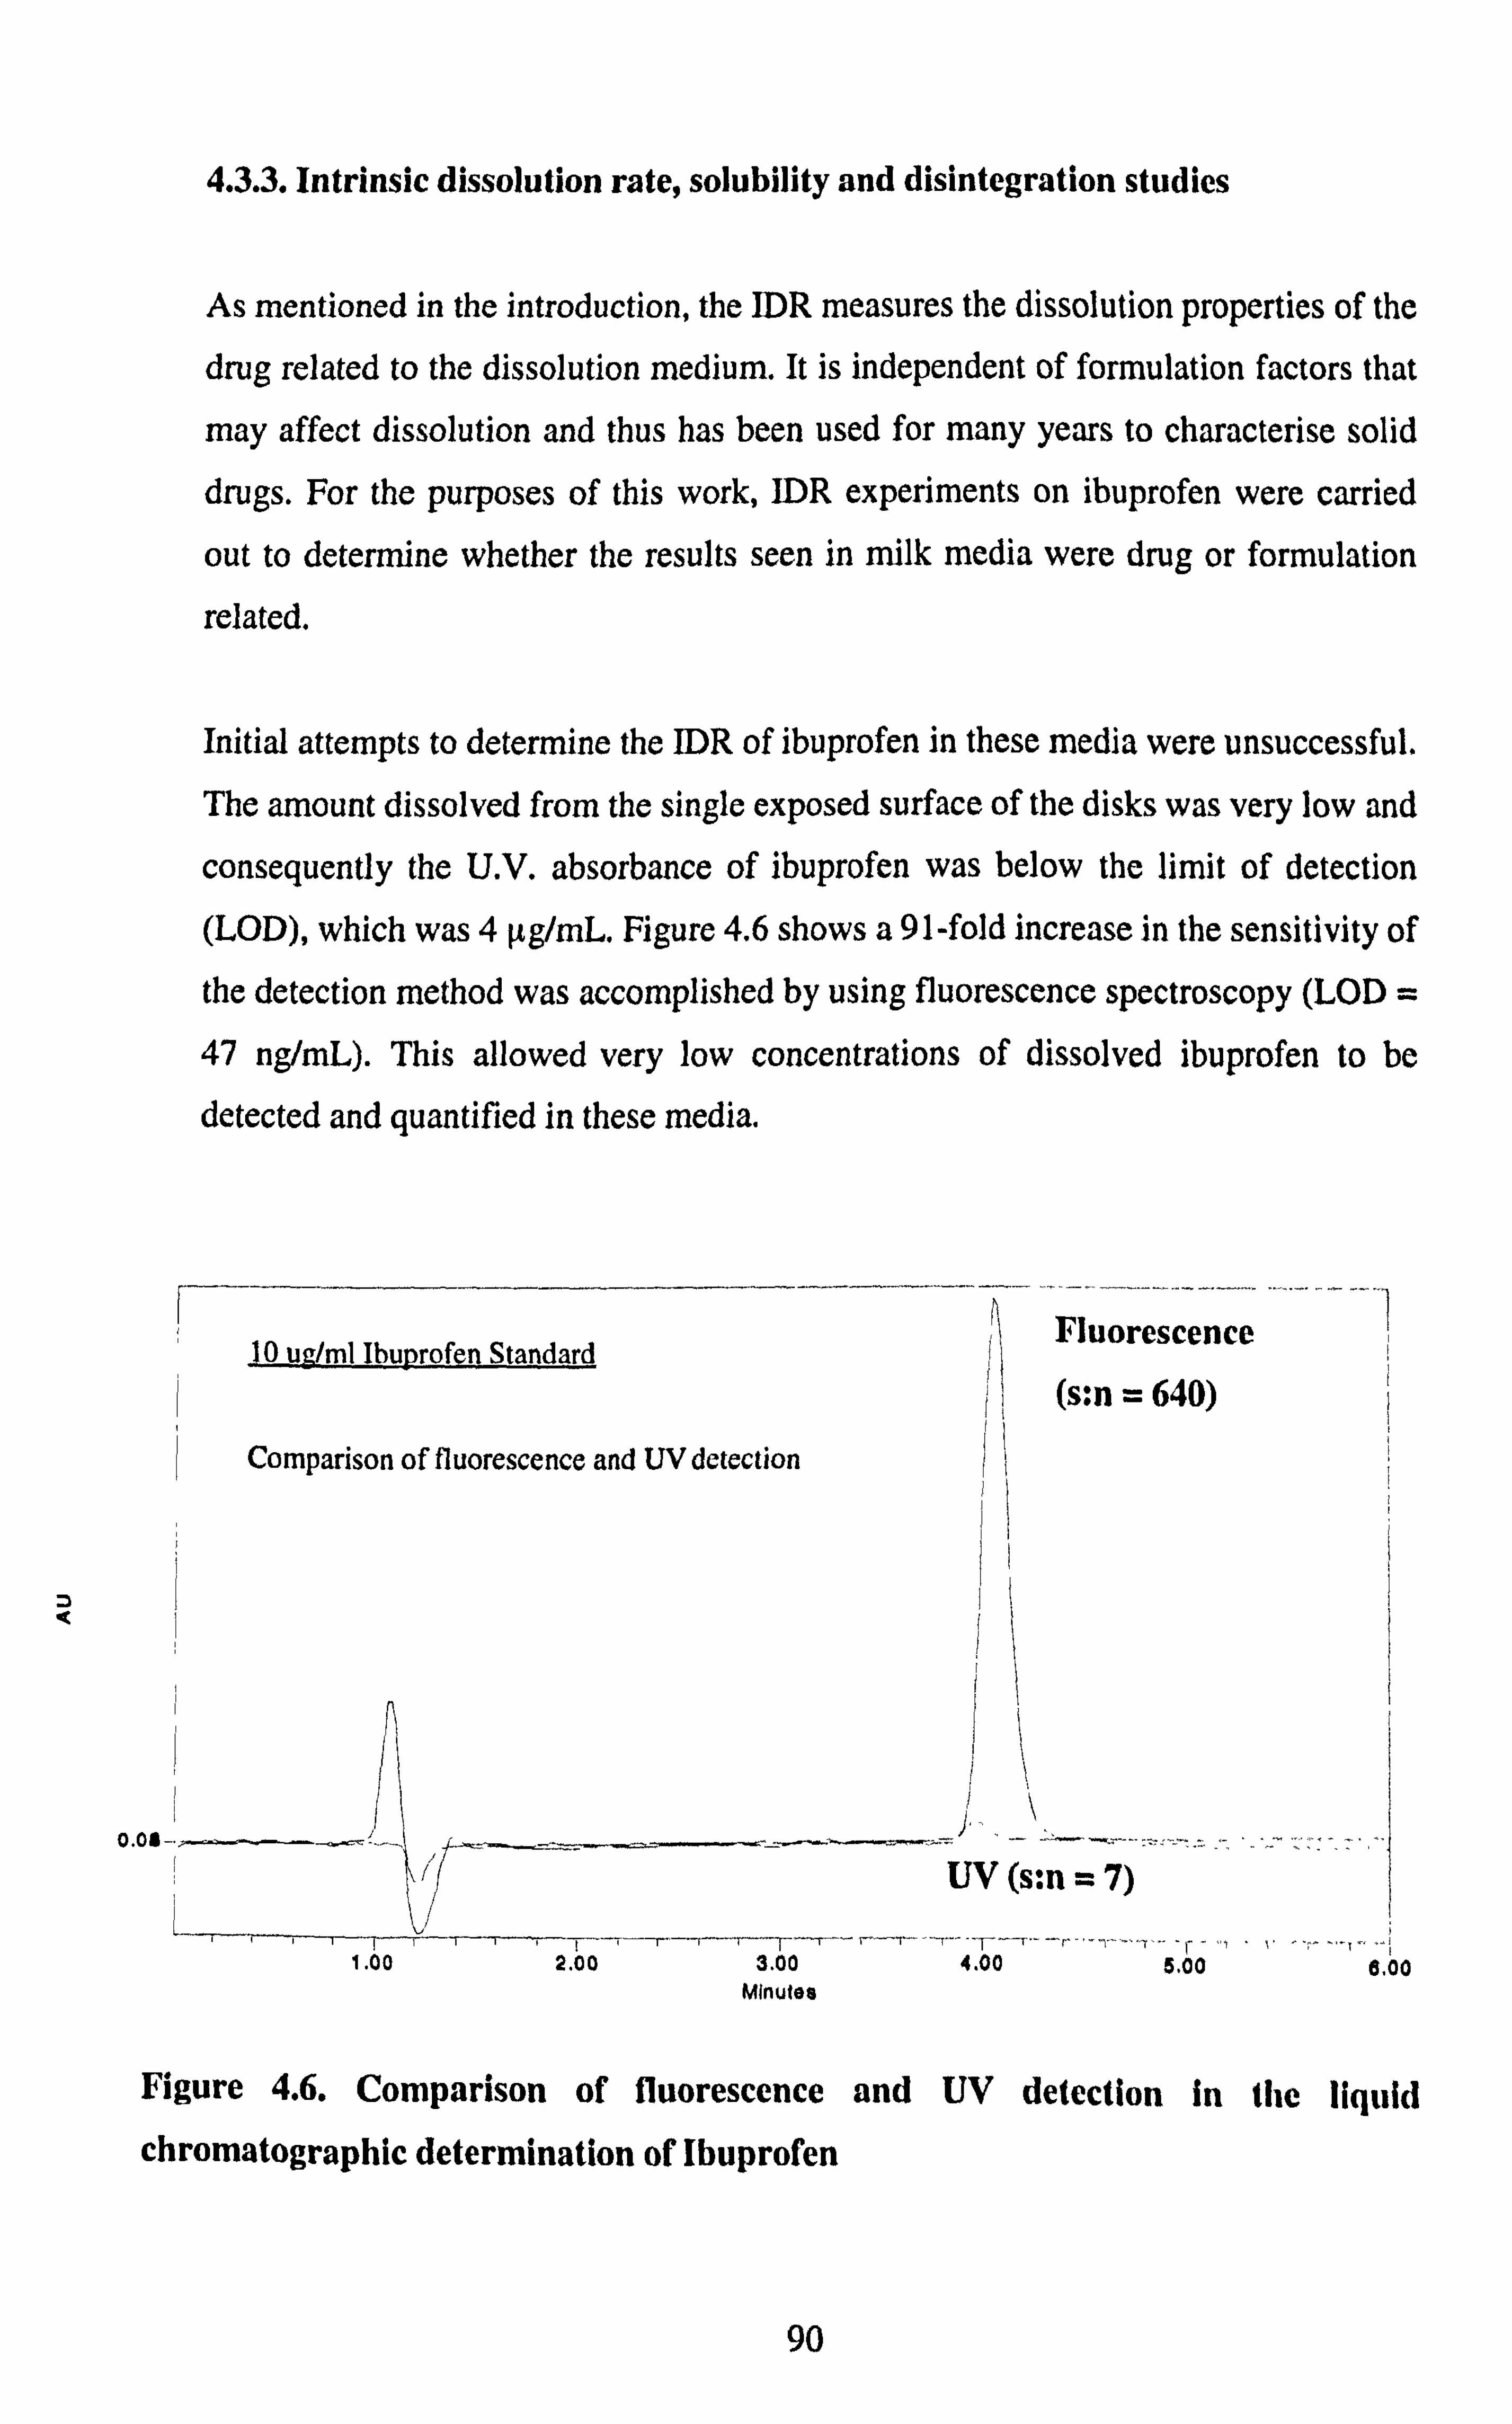
4.3.3. Intrinsic dissolution rate, solubility and disintegration studies
As mentioned in the introduction, the IDR measures the dissolution properties of the
drug related to the dissolution medium. It is independent of formulation factors that
may affect dissolution and thus has been used for many years to characterise solid drugs. For the purposes of this work, IDR experiments on ibuprofen were carried
out to determine whether the results seen in milk media were drug or formulation
related.
Initial attempts to determine the IDR of ibuprofen in these media were unsuccessful. The amount dissolved from the single exposed surface of the disks was very low and
consequently the U. V. absorbance of ibuprofen was below the limit of detection
(LOD), which was 4 µg/mL. Figure 4.6 shows a 91-fold increase in the sensitivity of
the detection method was accomplished by using fluorescence spectroscopy (LOD
47 ng/mL). This allowed very low concentrations of dissolved ibuprofen to be
detected and quantified in these media.
10 ug/ml Ibuprofen Standard
Comparison of fluorescence and UV detection
3.00 Minutes
Fluorescence
,+ (s: n = 644)
I
I ý!!
1
UV(s: n=7)
4.00 a. oo 6,00
Figure 4.6. Comparison of fluorescence and UV detection in the liquid
chromatographic determination of Ibuprofen
90

Ibuprofen release was expressed as the amount of ibuprofen dissolved per unit area
plotted versus time in Figure 4.7. In addition, linear regression analysis was applied
to the dissolution profiles between 15 and 90 min to determine the IDRs in Table
4.1, calculated as the slope of the regression line. The data generated enabled the
effects of the various media on the dissolution of drug substance to be evaluated.
The dissolution from the disks during the first 15 min was not considered in the IDR
determinations because only a single sample was taken at 15 min. Also the initial
ibuprofen dissolution rate in the whole milk/HCl medium was >10 fold higher than
in the other media. However, the higher initial dissolution in the whole milk/HCl
medium did not impact upon the IDR between 15 and 90 min, which was
comparable to the IDR in the other milk media shown in Table 4.1. Perhaps, the
viscosity of the whole milk and a heavier precipitate was responsible for the initial
`burst' dissolution seen, via a greater erosive effect on the disk surface.
Table 4.2 shows the solubility determinations of ibuprofen in the various media. The
change in pHs of the bulk suspensions at the 1,5 and 24h sampling times were < 0.1
pH unit. The equilibrium solubilities of ibuprofen (24h data) in all three milk based
media were at least 6 fold higher than the O. 1N HCI, 0.017% w/v SDS and the
casein filtrate media. However, Table 4.1 shows that the IDR in the HCl and SDS
media between 15-90 min was higher than in the milk and casein media, which was
unexpected based on dissolution and solubility data. This could be the result of
variable occlusion of the exposed disk surface by precipitated fragments of milk
media as the experiment progressed. In the casein medium, ibuprofen diffusivity
could have been lowered by a combination of microenvironmental p1! change and increased viscosity of the diffusion layer at the solid-liquid interface caused by the dissolved casein in contact with the drug. This concept was put forward by Millar
and Corrigan (1993) for the release of drug from ibuprofen-casein compacts into
phosphate buffer media.
91

U x ý ý ý N N
x a ý a ý > ulý r-
N
2 0 CL U
oýý __ ýý2
Öf a) C5 CD E !OE =3:
co x ;ýý "ý
N
ý-- _ CL . -+ (A
=L CL
S ýEýc co NE
Yý M U)
LO Cl -E tn
U :E U) in O
Qj
LO N
ý T .-
LO
6 0
C .ý
... ý m E
)ý, - ._
vý sý Fý t
. .. + ýC
(zwO/6w) LN
panjossip junowe anijejnwn3 ý. a,
eý L.
.ý ý C
cJ `c
ýý LO 3ý ý ýo .ý
92

Table 4.1. IDR of ibuprofen in various media
Medium IDR: 15-90min
(mg/min/cm2) r2 value
O. 1N HCI 0.0053 0.9829
0.017% w/v SDS 0.0055 0.9965
Whole milk/O. 1N HCl 0.0021 0.9181
Semi-skimmed milk/O. 1N HCI 0.0012 0.9085
Skimmed milk/O. 1N HC1 0.0023 0.9968
Casein filtrate 0.0042 0.9879
Table 4.2. Solubility determinations of ibuprofen in various media at 37°C.
Medium pH Mean amount dissolved (µg/ml) ± S. D. n=2
lh 5h 24h
0. IN HC1 1.2 20.4± 2.1 25.7 ± 2.4 21.1 ± 3.2
0.017%w/vSDS 2.5 34.2 ± 2.9 30.3 ± 0.9 24.7 ± 3.3
Casein filtrate 2.5 23.7 ± 1.6 23.3 ± 0.1 24.7 ± 10.9
Whole milk/0.1N HC1 2.4 103.8 ± 1.2 105.5 ± 3.4 132.0 ± 0.7
Semi-skimmed milk/0.1N HCl 2.4 153.7 ± 2.4 193.6 ± 6,6 219.8 ± 17.4
Skimmed milk/0.1N HC1 2.4 132.8 ± 3.5 157.9 ± 4.8 124.0 ± 2.4
Overall, the IDR data suggest that the dissolution enhancements seen with tablets
may be due to a formulation-related effect of casein on the tablets. However, the
solubility data revealed improved ibuprofen solubility in milk media. From the
dissolution results in Figure 4.5 it can be seen that the profile for the casein filtrate
93

medium reached a plateau by 30 min (- 15% ibuprofen dissolved) whereas the milk
media profiles (Figure 4.3) indicated steadily increasing drug dissolution up to 120
min (- 16% ibuprofen dissolved). This suggests that casein is somehow involved in
improving the release of ibuprofen from the formulation, the drug is then available
for dissolution, which is aided by higher solubility in milk, but in the casein medium
saturation is reached accounting for the early plateau. The data for the solubility in
casein filtrate medium do not support the previous hypothesis of solubilisation of
ibuprofen into casein micelles.
Disintegration studies on the tablet formulation were performed in the various media
to further evaluate the nature of the interaction seen with the tablets. The results are
shown in Table 4.3.
Table 4.3. Disintegration times for ibuprofen 400mg tablets in various media.
Medium pH Mean Disintegration
Time ± S. D. (min) n=3
0.1N HC1 1.2 2.91 ± 0.70
0.017% w/v SDS 2.6 3.47 ± 0.06
Casein filtrate 2.5 3.53 ± 0.48
Whole milk/0.1N HC1 2.5 3.95 ± 0.44
Semi-skimmed milk/0.1N HCl 2.5 3.12 ± 1.03
Skimmed milk/0.1N HC1 2.5 2.59 ± 0.53
The tablets disintegrated in all media in less than 4 min - an acceptable time
according to industrial perspectives for IR dosage forms. Furthermore, there were no
significant differences in disintegration times between the various media to warrant
a possible binder performance issue for this dosage form in the different media. These findings differ from those of Abrahamsson et al (2004), who reported a delay
in the disintegration time of several tablet formulations immersed in a multi-
94

component nutritional drink, caused by the precipitation of a casein film around the
tablet surface.
The question that remains unanswered is that what is casein interacting with to improve the drug dissolution from the tablet? Although the tablets in this study disintegrated in all the media to a sufficient extent to pass through the standard
compendial mesh size, further breakdown of the agglomerates to primary particles
still needs to occur for the dissolution process. Perhaps this is where casein exerts its
influence by promoting desorption of drug from drug-excipient agglomerates. It is
believed that at low pH values unionised drug is immobilised onto excipient by
adsorption or complexation and casein interferes with this effect.
The commercial ibuprofen tablet formulation used listed the following excipients in
the ingredients (their functions are stated in brackets): microcrystalline cellulose (diluent); lactose (diluent); croscarmellose sodium (disintegrant); hydroxypropyl
methylcellulose (binder); SDS (wetting agent); magnesium stearate (lubricant);
French chalk (glidant/lubricant); colloidal silicon dioxide (glidant) and titanium
dioxide (opacifier).
The quantitative manufacturing formula was not obtainable. However, from the functions of the ingredients included and the typical percentages used in practice, the excipients likely to be involved in drug interactions can be identified. Lactose is
a highly soluble bulking agent and not likely to affect drug dissolution.
Microcrystalline cellulose (MCC), croscarmellose sodium, Hydroxypropyl
methylcellulose (HPMC) and magnesium stearate may be implicated in drug-
excipient interactions. The disintegration data exclude casein interaction with
croscaremellose sodium and HPMC since no major differences in disintegration
times were observed between casein-containing and casein-free media.
Of several tablet formulations investigated, Abrahamsson et al (2004) found that a tablet formulation with 50% MCC exhibited the strongest food effect, taking 70 min to disintegrate in a fed state medium. Mixing of the individual excipients with the fed state medium produced a precipitate, which was shown to include caseinate by IR spectroscopy. Hence, it is plausible that although disintegration was not delayed
95

by casein containing media in this study, this surface-active component may interact
with the MCC surface, either displacing or competing with ibuprofen for interaction
at the excipient surface.
Magnesium stearate is incorporated in low levels (0.25-5% w/w) as a tablet
lubricant therefore unlikely to have a significant interaction with casein but it cannot be ruled out. Further investigations of the possible drug-excipient interactions in this
study are required to elucidate the cause of the higher ibuprofen dissolution from the
tablet formulation.
4.4. Conclusion
The dissolution of ibuprofen tablets in milk/HCI media was significantly higher than in typical compendial media. The bovine milk protein, casein, appeared to play a
role in the increased dissolution seen. Lactose had no effect. Whilst the solubility of ibuprofen in milk/HCI media was higher than in the other media, it is not believed to be directly responsible for the effect seen. The improved ibuprofen dissolution in
milk/HCI media may be the result of casein influencing the availability of ibuprofen
for dissolution from a drug- excipient complex coupled by the higher drug solubility in these media. The interaction does not affect the disintegration time of the tablets in the various media.
96

5. NAPROXEN
5.1. Introduction
Like ibuprofen, naproxen ((2S)-2-(6-methoxynaphthalen-2-yl)propionic acid) is an
NSAID with analgesic and antipyretic properties. It is indicated to treat similar
conditions i. e. mild to moderate pain, rheumatoid and osteoarthritis, tendonitis etc. It
is restricted to prescription supply only in the U. K. and therefore is not used by the
general population as extensively as ibuprofen.
MeO
Figure 5.1. The chemical structure of naproxen
Naproxen differs structurally from ibuprofen in that it is a naphthyl rather than a benzyl derivative and also has a methoxy group incorporated into the molecule (Figure 5.1). However this does not improve its lipophilicity based on its log P value
of 3.18 compared to a log P value of 3.50 for ibuprofen (Fini et al., 1995). It has a lower intrinsic solubility of 12µg/mL (Table 5.1) at 37°C than ibuprofen (21µg/mL
in Table 4.2). Naproxen has a pKa of 4.2 and is administered as the free acid or sodium salt. It is considered highly permeable based on oral absorption compared to
an intravenous dose (Davies & Anderson, 1997). Charles and Mogg (1994) reported
peak plasma levels of the free acid within 1-1.5h, which suggests absorption from
the upper GI-tract. Food reduces the rate but not extent of absorption (Parfitt, 1999).
97

This NSAID was selected as a second acidic BCS Class II drug to study in order to
compare its solubility and IDR in milk based media to that of ibuprofen. This would
allow comparison of the dissolution behaviour of two propionic acid-derived
NSAIDs in order to identify drug-specific or class-specific behaviour. Disintegration
and dissolution tests were also carried out on a marketed tablet product to assess the
effect of the medium on drug release from the formulation. The media used for the
investigations included O. 1N HCl, 50/50 mixtures of whole, semi-skimmed or
skimmed milk with 0.1N HCI, 0.017% w/v SDS and casein filtrate.
5.2. Materials and Methods
5.2.1. Materials
Details of all materials used in the preparation of the dissolution media and in
performing the experiments are listed in section 2.1.
5.2.2. Methods
Media preparation See Section 4.2.2.
Solubility determinations
See Section 2.2.1.
Intrinsic dissolution rate determinations
See Section 2.2.4.
Disintegration testing
See Section 2.2.2.
98

Dissolution testing
See Section 2.2.3. The volume of dissolution medium used was 500 mL.
5.3. Results and Discussion
5.3.1. Solubility Data
The solubility of naproxen drug substance in all the dissolution media was lower
than that of ibuprofen. At 24h, the solubility of naproxen in all the media was
approximately half that of ibuprofen except in semi-skimmed milk/0. IN HCl where
it was approximately one third (Table 5.1). These results are reflected in the
dissolution profiles (Figure 5.4), where maximum dissolution was reached for
naproxen in milk-based media at about 16% from a 250 mg dose tablet in a 500 mL
dissolution volume (i. e. 80gg/mL). As a result the dissolution began to plateau after
about 60 min. In comparison, dissolution profiles for ibuprofen in milk based media
(Figure 4.3) continued to rise until the last time point of 120 min. At this point, 15%
of the drug had dissolved from a 400 mg tablet into 500mL of dissolution medium
giving a concentration of 120pg/mL, just about reaching the saturation concentration
for ibuprofen in the skimmed milk/O. IN HC1 medium.
Table 5.1. Solubility determinations of naproxen in various media at 37°C.
Medium PH Mean amount dissolved (µg/m1) ± S. D. n=2 lh 5h 24h
0.1NHC1 1.2 12.0±2.2 10.9±0.7 12.0±0.3
0.017% w/v SDS 2.5 12.6±0.2 11.4 ±0.1 10.1±0.3
Casein filtrate 2.5 15.0 ± 0.7 13.4 ± 0.7 11.1+0.7
Whole milk/O. 1N HCl 2.4 67.0 ± 3.5 65.6 ± 0.8 61.0 ± 0.4
Semi-skimmed milk/0.1N HCl 2.4 68.0 ± 3.4 63.6 ± 0.6 69.6 ± 4.7
Skimmed milk/O. 1N HCl 2.4 70.1 ± 1.8 72.5 ± 17.2 66.3 ± 0.4
99

It is worth noting from Table 5.1 that the solubility of naproxen in casein filtrate was
not much higher than in the 0.1N HC1 and 0.017% w/v SDS media. The same was
true for ibuprofen solubility in these media (Table 4.2) and so, it appears that casein
does not affect the solubility of these two propionic acid derived NSAIDs in acidic
conditions below pH 3.
The solubility of naproxen in all three milk-based media was in the region of 6-fold
higher than in the casein, SDS and HC1 media. The difference in solubility between
the three milk-based media was within a 10 pg/mL range. The skimmed milk
medium showed a higher solubility than the whole milk, undermining the argument
that the lipid content in milk could be responsible for the 6-fold increase in
solubility compared to the non-milk based media.
Interestingly, for both ibuprofen and naproxen, the highest solubilities were recorded
in the semi-skimmed milk/O. 1N HC1 medium. It was previously mentioned in the
ibuprofen discussion (Section 4.3.2), that in whole milk, lipid-mediated drug
solubilisation may be limited by the MLGM. In skimmed milk the negligible lipid
content would be unable to exert an effect in any case. However, during the
processing procedure to produce semi-skimmed milk, partial removal of the MLGM
and some denuding of lipid globules and other structural changes to the composition
of milk may enhance the lipid-mediated solubilisation of the drugs. As seen for
ibuprofen, this improved solubility in semi-skimmed milk did not translate to an improved tablet dissolution profile compared to the whole and skimmed milk media
as an excipient interaction was thought to have an overriding effect.
5.3.2. IDR Determinations
Table 5.2 shows the calculated IDR values and coefficients of determination (r2) for
naproxen in the various media. Six further sampling time points in the range 0-15
min were included in this study to monitor more accurately the initial dissolution
rate. O. 1N HCI, 0.017%w/v SDS and semi-skimmed milk/0.1NHC1 showed linear
dissolution (Figure 5.2) whereas the casein filtrate, whole and skimmed milk/0.1N HC1 had more erratic release form the disk surface over the first 15 min. Hence two
100
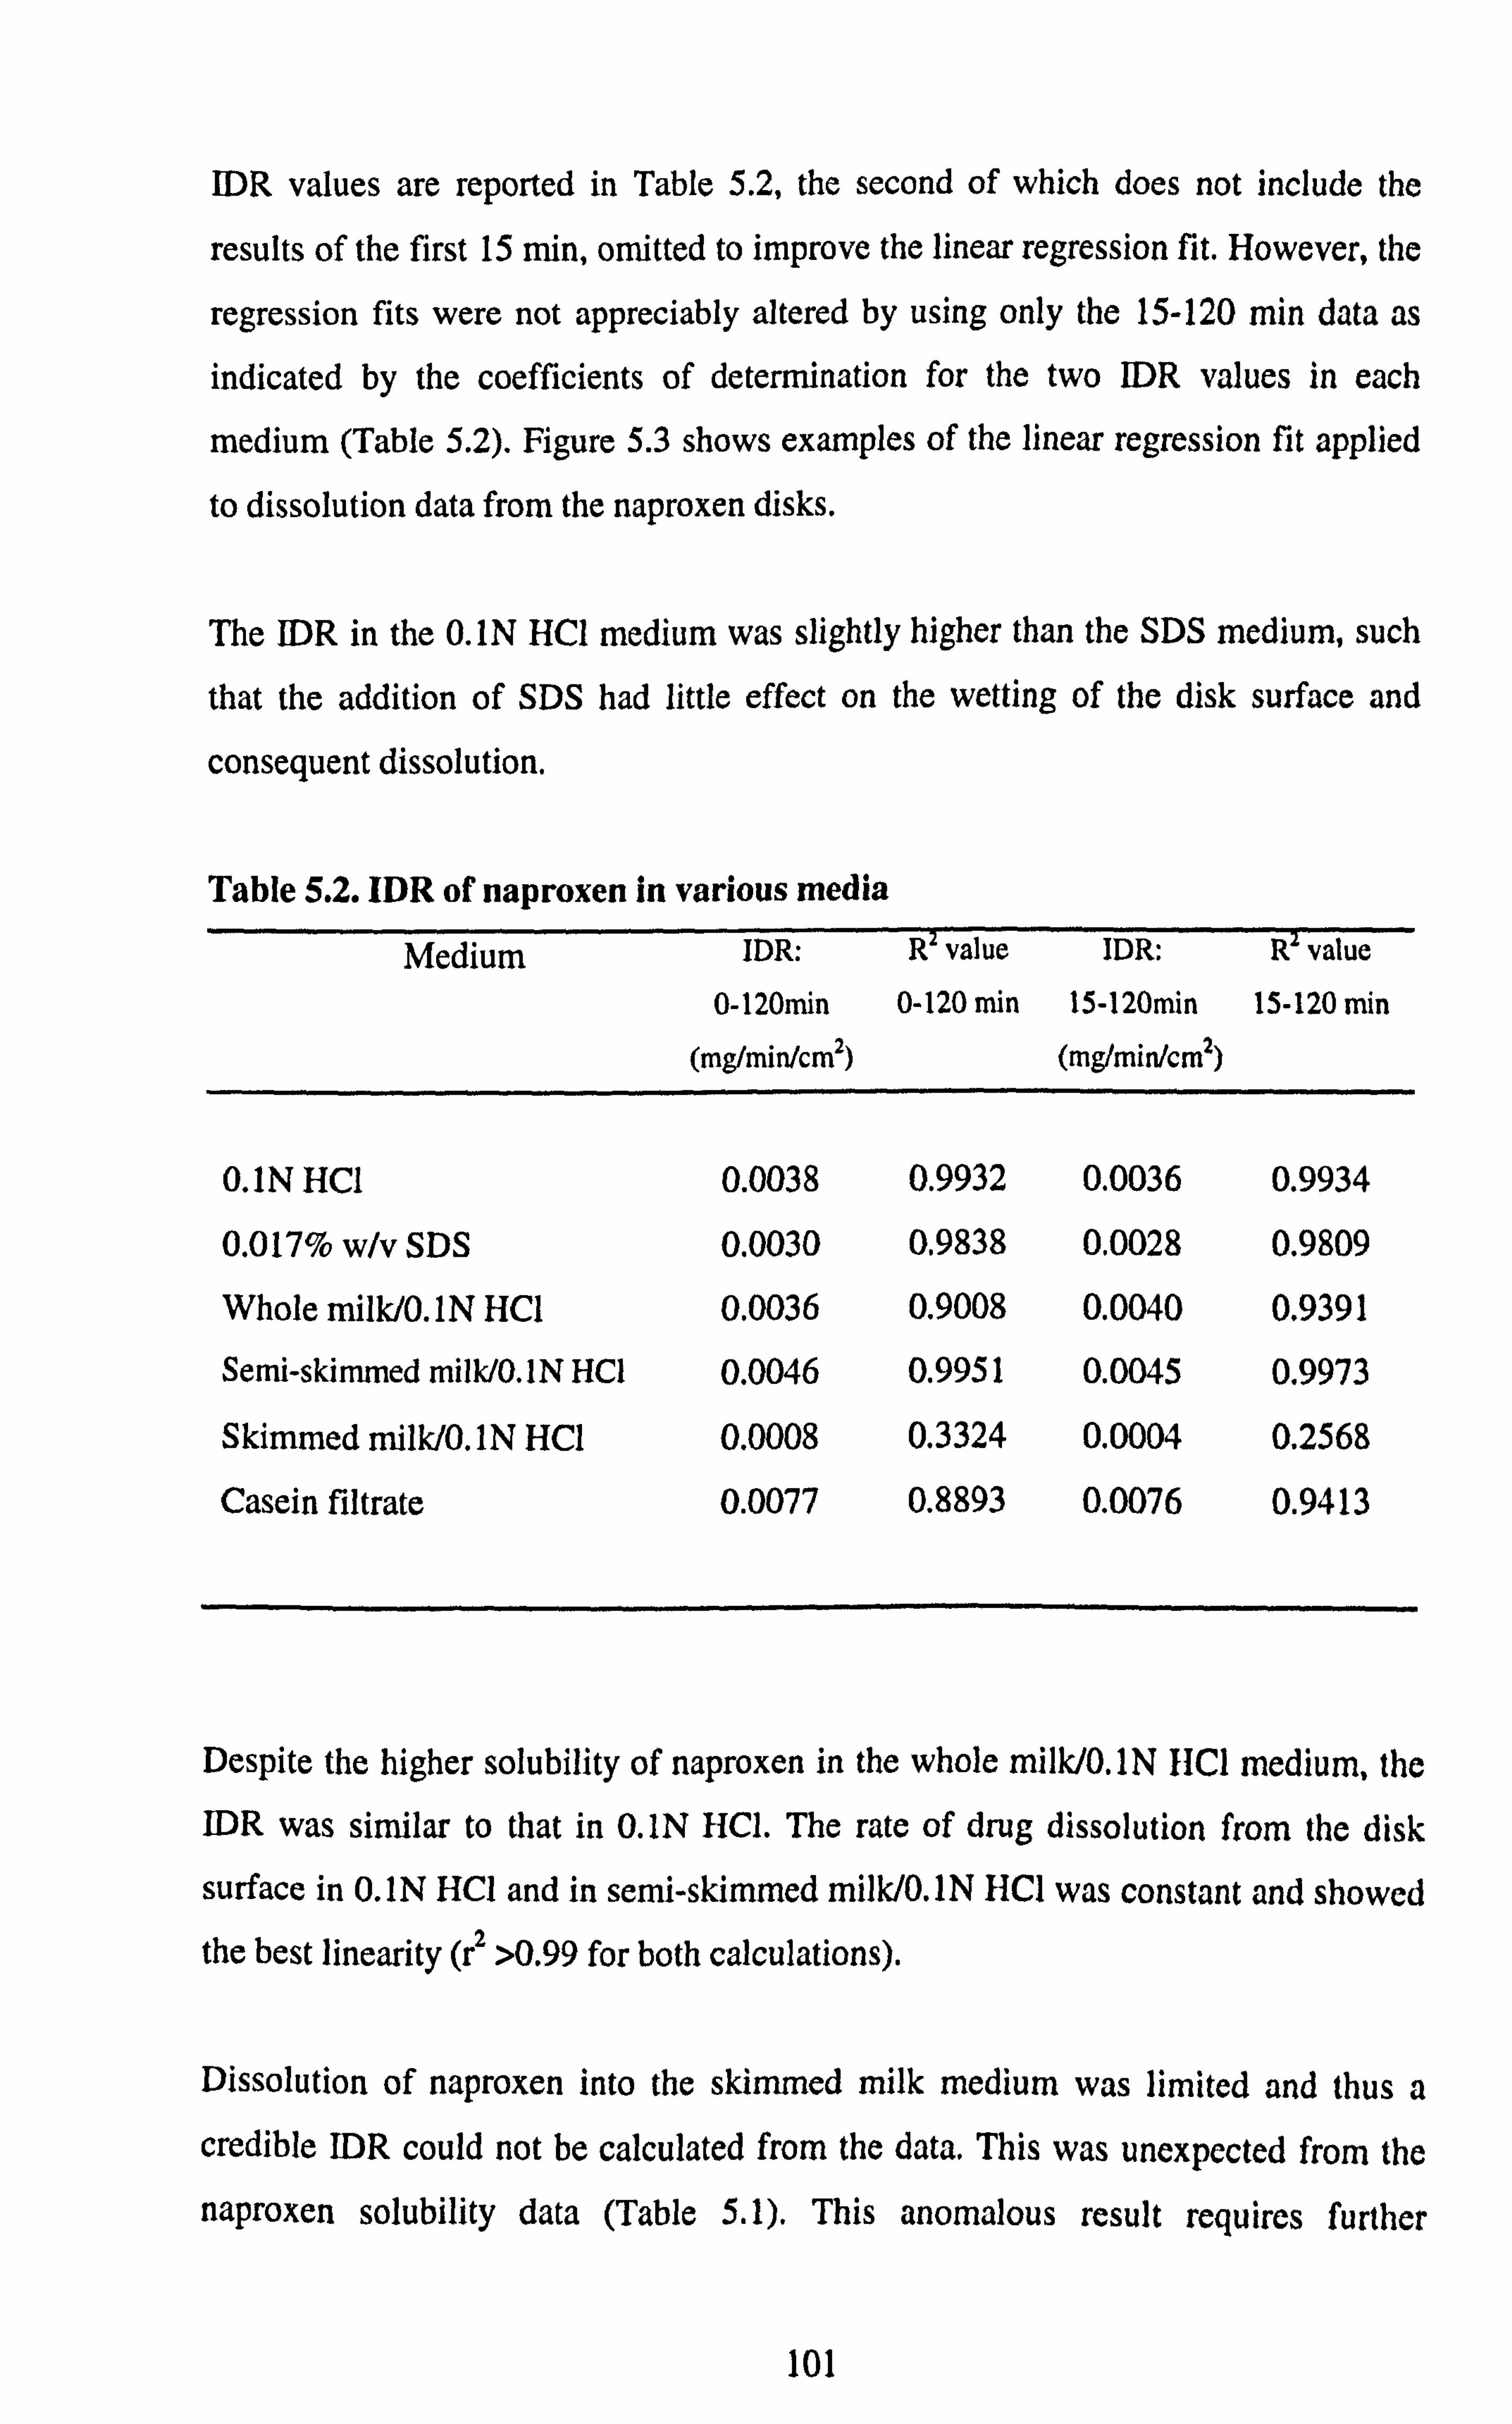
IDR values are reported in Table 5.2, the second of which does not include the
results of the first 15 min, omitted to improve the linear regression fit. However, the
regression fits were not appreciably altered by using only the 15-120 min data as
indicated by the coefficients of determination for the two IDR values in each
medium (Table 5.2). Figure 5.3 shows examples of the linear regression fit applied
to dissolution data from the naproxen disks.
The IDR in the 0. IN HCI medium was slightly higher than the SDS medium, such
that the addition of SDS had little effect on the wetting of the disk surface and
consequent dissolution.
Table 5.2. IDR of naproxen in various media Medium IDR: Revalue IDR: R value
0-120n-in 0-120 min 15-120min 15-120 min
(mg/min/cm2) (mg/min/cm2)
0.1N HCl 0.0038 0.9932 0.0036 0.9934
0.017% w/v SDS 0.0030 0.9838 0.0028 0.9809
Whole milk/0.1N HC1 0.0036 0.9008 0.0040 0.9391
Semi-skimmed milk/O. 1N HC1 0.0046 0.9951 0.0045 0.9973
Skimmed milk/0.1N HC1 0.0008 0.3324 0.0004 0.2568
Casein filtrate 0.0077 0.8893 0.0076 0.9413
Despite the higher solubility of naproxen in the whole milk/O. 1N HCI medium, the
IDR was similar to that in O. IN HCI. The rate of drug dissolution from the disk
surface in 0.1N HCI and in semi-skimmed milk/O. 1N HCI was constant and showed
the best linearity (r2 >0.99 for both calculations).
Dissolution of naproxen into the skimmed milk medium was limited and thus a
credible IDR could not be calculated from the data. This was unexpected from the
naproxen solubility data (Table 5.1). This anomalous result requires further
101

investigation. Naproxen showed the highest [DR in the casein filtrate although its
solubility in this medium was similar to that in O. IN HCl and SDS media. Sink
conditions existed in all the media. What appears to be a high naproxen dissolution
rate in the first minute in the casein and milk media (Figure 5.2) is possibly an
interference from the naproxen assay at the low amounts dissolved.
102

v N
'O
ý
o
cý I Q
Uý U)
(n =YÖ
öYE
o0 ö a) Eý co ýpEN
I 3: U) C.
O O
0+4 C
.£
... d
_E H
U x ý ._ v ý ý I..
"Z y
.. _.
r- a -v N3 äýy
L.
UýE o=
ýUyü
°' =LE co Y7O
cýv
U) NÜa Výýý CC
pö= tq .:. tý. C.,
Na=ýO E
ai r- = Cl) ý :7
ýý ý= ý aý s w c ZO 0
I cri
M ln 04 ln
N T-
T- LO
ö (zwo/fiw)
panlossiQ junowbr anilelnwno
103
0 eý ý E
N
r-i
x a

M CD T- le O f k
O
O
O II >º
Co ö
c0 ö le ö
N0 O
(zwO/fiw)
panJossia junowd anijejnwna
0 N T
O O ý
0 Co
.ý C
E ý ým E H
O IRT
0 N
0
i: z, ^ N 2= aY CQ E mr
:ý ý c
.ý °E
o L
o
II _
. 5A ýý
IIC ý+ O ,;
r
> ou
. +ý
N T
I a
U I
r- - NU 2
_ EL YN
ý ýa
öý- r EU ýY= O fn ` O "= ý
Ec U_ _ (n J
ýýI
104

5.3.3. Tablet dissolution studies
As with ibuprofen, the dissolution of naproxen tablets was significantly greater in
milk based media than in 0.1N HCI and 0.017% w/v SDS media. Figure 5.4
illustrates that over the first 60 min tablets in skimmed milk showed the highest
dissolution but there was no significant difference between the 3 types of milk between 60-120 min (p>0.05) as the media became saturated. Tablets in the casein
filtrate medium showed lower drug dissolution than in the milk media, and the
dissolution hit a plateau by 45 min with approximately 8% dissolved. Naproxen
dissolution in the HCI-0.017% w/v SDS and HCI pH 1.2 media was significantly lower than in the milk and casein media, again with dissolution being limited to
approximately 5% at 15 min due to media saturation with drug,
Whilst the casein filtrate medium increased the dissolution of naproxen from the
tablets compared to the O. 1N HCI and 0.017% w/v SDS media, its effect was not as
great as that seen with the ibuprofen tablet formulation where the dissolution profile in casein filtrate was in the region of the profiles in milk media.
The lower dissolution compared to dissolution in milk media is in line with the
solubility data, which illustrates poorer solubility of naproxen in casein filtrate.
However, the enhanced dissolution profile compared to 0.017%w/v SDS (which
also had a slightly more favourable surface tension) did not agree with the solubility data, suggesting an effect of casein on drug release from the tablet formulation.
The trends in the tablet dissolution profiles were not as clearly reflected in the IDR
profiles. Nonetheless, dissolution rate calculations showed differences in the IDR
values over the period 15-120 min between 0. IN HCl and the milk-based media.
105

0 N T
r, x a.
0 a
10
ý
ý
a U x ý .ý ý ý L.
.. ý C
0 0 T
O Co
O O
C .ý
... d E
ý a E
N
U 2 ý
E -c aý E E
Y Cl)
E a)
(I)
ý N I a
U I
CI)
ý ..
c ý ý cý
U
LC) ý
r- N 2 a
ý 0 Cf)
r- ý O 9
U
l2
c. a
.Z A
Co (D le r4 0 Co <D 'ar c4 0
Cýý..; Gr
ý°aEö LL
"
üC
ýH :0
rw panJossia %w °o
u YE
ýý N
Üý
OýýTýC
106

Similarly to ibuprofen, it appears that casein influences the release of naproxen from
the formulation. Tablet disintegration times in all media were below 4 min as with
the ibuprofen formulation but there was a more discernible difference in the
disintegration time of the naproxen tablets between the milk-based media and the
other media as shown in Table 5.3.
Table 5.3. Disintegration times for naproxen 250mg tablets in various media.
Medium pH Mean Disintegration
Time ± S. D. (min) n=3
0.1N HCI 1.2 0.97 ±0.51
0.017% w/v SDS 2.6 1.63±0.55
Casein filtrate 2.5 1.50 ± 0.69
Whole milk/0.1N HCl 2.5 3.52 ± 0.44
Semi skimmed milk/0.1N HCl 2.5 2.98 ± 1.03
Skim milk/0.1N HC1 2.5 2.47 ± 0.64
It took the naproxen tablets nearly twice as long to disintegrate in the milk-based
media compared to other media and the disintegration time decreased as the fat
content of the milk was decreased. Anwar et al (2005) investigated the
disintegration of tablets in biorelevant media. They reported a significant increase in
the disintegration time of both fast and slow disintegrating tablets in whole milk
compared to various aqueous media. These results were attributed to the slower
penetration rate of fluid into the tablet due to the higher viscosity of the milk
medium. Regardless, as seen in Figure 5.4, disintegration time did not have a bearing on the dissolution of naproxen into the milk-based media.
107

The marketed naproxen tablet brand used in this study contained the following
inactive ingredients: polyvinylpyrrollidone (PVP) (diluent/binder), croscarmellose
sodium (disintegrant), magnesium stearate (lubricant) and iron oxide (E172)
(colourant).
It was previously observed (Bettinetti et al., 1992) that mixing higher grades of
PVP with naproxen increased the melting point of naproxen through the formation
of crystalline microaggregates of the drug dispersed within the polymer matrix. Does
casein somehow disrupt this sold state interaction and hence influence the release of
naproxen from this dispersion? Indeed it has already been demonstrated that water
soluble polymers such as PVP do form complexes with proteins (Matsudo et al.,
2003). Such protein complexes can cause change in the conformation of the polymer
chain due to stearic repulsion, electrostatic repulsion of the charged bound proteins
or local collapse of the surface polymer segment onto which protein is bound
(Matsudo et al., 2003). Whilst only speculative at this stage, the possible formation
and nature of casein-PVP complexes needs to be further investigated.
Furthermore, magnesium stearate is hydrophobic and is reported to have retarded drug dissolution from oral dosage forms (Levy & Gumtow, 1963; Ganderton, 1969;
Lerk et al., 1982; Hussain et al., 1992). However, little work has been done to assess
such a hindrance in the dissolution of oral dosage forms in biorelevant media. Thus
the effect of low levels (0.25-5% w/w) of magnesium stearate on the solubility and dissolution of naproxen in the casein medium needs to be assessed.
Overall, whatever the nature of the interaction between casein and the formulation
excipients, it does not override the solubility influence of the milk-based media on dissolution (unlike ibuprofen, where dissolution in casein filtrate and milk-based
media was similar). In this case, once the naproxen is mobilised from the formulation for dissolution (e. g. via a desorption process), its higher solubility in
milk-based media is clearly demonstrated in the higher tablet dissolution profiles
compared to casein filtrate.
108

5.4. Conclusion
The solubility of naproxen in the 50/50 milk/0.1N HCl media was significantly
greater than in the other media tested. This was reflected in the enhanced tablet
dissolution profiles in the milk-based media. The highest IDR of naproxen in the
casein filtrate is probably the result of an erosive effect of the medium. Casein
appears to enhance the dissolution of naproxen from the tablet studied through an interaction with some excipient. The possible casein-excipient interaction requires further investigation. Overall, the improved dissolution of naproxen from the
marketed tablet brand studied was the result of a combined effect of enhanced
solubility and excipient interaction.
109

6. LORATADINE
6.1. Introduction
Loratadine (ethyl 4-(8-chloro-5,6-dihydro-11H-benzo[5,6]-cyclohepta[1,2-b]pyridine-
11-ylidene)-1-piperidinecarboxylic acid ethyl ester) is a non-sedating antihistamine
used in the symptomatic treatment of allergic disorders such as hayfever, pruritus,
urticaria and insect bites and stings.
cl
Figure 6.1. The chemical structure of loratadine
Loratadine is a poorly soluble weak base with a pKa of 5.0 and a Log P of 5.2. (Clarke,
1986). It has an intrinisic solubility of 1.9 µg/mL at 37°C (Table 6.3a). Loratadine has
been characterized as a highly permeable drug based on its apparent permeability
coefficient (4.8 x 10⁻⁵ cm/s) across CaCo-2 cell monolayers and has been classified as a BCS Class II drug (Khan et al., 2004). After oral administration, the drug is rapidly absorbed under fasting conditions with peak plasma levels being reached within 1-1.5h (Simons, 2002), although there is a high inter-subject variability.
One objective of this study was to investigate, in vitro, the dissolution of any unabsorbed drug leaving the stomach and passing into the intestine. The aim was to
110

mimic, in situ in a dissolution vessel, the change in pH that occurs during the gastro- intestinal transit of a tablet using a common compendial dissolution apparatus (USP
apparatus 2). This would involve a 2h dissolution run in acidic conditions followed by
an immediate increase in volume and pH whilst the test is continued for a further 4h.
The second objective was to use loratadine as a model to study the behaviour of a
poorly soluble basic drug (BCS Class II) in proposed intestinal biorelevant media and
attempt to develop more economical surfactant based media to replace them.
6.2. Materials and Methods
6.2.1. Materials
Details of all materials used in the preparation of the dissolution media and in
performing the experiments are listed in Section 2.1.
6.2.2. Methods
Media preparation
The pH of all the media was checked after preparation using a digital p1I meter (Delta 350, Mettler Toledo, Leicester, U. K. )
0.017% w/v sodium dodecyl sulphate in 0.1N HCl (HCI-0.017% SDS pli 1.2) was
prepared by addition of 850 mg of SDS to a5L volumetric flask and making up to
volume with 0.1N HCl.
0.017% w/v sodium dodecyl sulphate in 0.003N HCI (HC(-0.017% SDS pit 2.5) was prepared by addition of 850 mg of SDS to a5L volumetric flask and making up to volume with 0.003N HCI.
111

0.25% w/v sodium dodecyl sulphate in O. 1N HCI (HCI-0.25% SDS pH 1.2) was
prepared by addition of 12.5 g of SDS to a5L volumetric flask and making up to
volume with O. 1N HCI.
Sodium-based simulated intestinal fluid (NaSIF) consisted of phosphate buffer p116.8
except that NaH2PO4 was used instead of KH2PO4 as suggested by Vertzoni et al (2004)
to mimic better the cationic environment in the small intestine. Also, FaSSIF includes
NaH2PO4 as the buffering agent.
8L of both Fasted state simulated intestinal fluid blank (FaSSIF blank) and Fed state
simulated intestinal fluid blank (FeSSIF blank) were prepared as per Table 1.2 without
sodium taurocholate (NaTC) and lecithin, to be used as controls and for the preparation
of FaSSIF and FeSSIF.
8L of both FaSSIF and FeSSIF were constituted as per the formulae in Table 1.2. To
obtain clear micellar solutions, 8L of FaSSIF and FeSSIF blanks were first prepared
and the correct quantities of NaTC and lecithin (Tablet . 2) were mixed with 1.6 L of the
corresponding blank medium to produce concentrates. These concentrates were then
stirred overnight (at room temperature) using magnetic stirrers and the clear
concentrates made up to volume with 6.4 L of the corresponding blank medium.
6L of 0,059% w/v lecithin was prepared by addition of 3.54 g of lecithin to a container
followed by 6L of FaSSIF blank. 6L of 0.295% w/v lecithin was prepared by addition
of 17.7g of lecithin to a container followed by 6L of FeSSIF blank.
6L of 0.165% w/v NaTC was prepared by addition of 9.9 g of NaTC to a container followed by 6L of FaSSIF blank. 6L of 0.825% w/v NaTC was prepared by addition
of 49.5 g of NaTC to a container followed by 6L of FeSSIF blank.
For surfactant-based media used in the solubility screen, 20 mL of each medium was
prepared in a volumetric flask (except for Triton X 100 and C12AO where 200 mL
112

were prepared) according to the concentration stated in Table 6.1 in both FaSSIF and
FeSSIF blanks.
Table 6.1. Concentrations of the surfactants used in the loratadine solubility study
and their cmc values.
Surfactant cmc1'2 (mg/ml) Concentration used for
solubility study (mg/mI)
CTAB 0.36 0.73
SDS 2.37 4.73
Brij 35 0.13 0.26
Triton X 100 0.15 0.30
Cremophor EL 0.09 0.18
Tween 80 0.02 0.04
CHAPSO 5.05 10.10
C12AO 0.00046 0.0092
Values quoted at 20-25°C in water 2 Source: Sigma Aldrich. (Detergent Properties and Applications Table)
Solubility determinations
See section 2.2.1.
Dissolution testing
See section 2.2.3. The volume of dissolution medium used was 1000 mL.
pH-shift method: The dissolution test was carried out in 500 mL of an acidic medium (0. IN UUCI, liC1-
0.25% SDS pH 1.2, HCI-0.017% SDS pH 1.2 or HCI-0.017% SDS p11 2.5) for 2h as
normal, with 5m1 samples being taken at 15,30,45,60,90 and 120 min. After sampling
at the 2h time point, 50 mL of IN NaOH, which was already at 37°C, was immediately
113
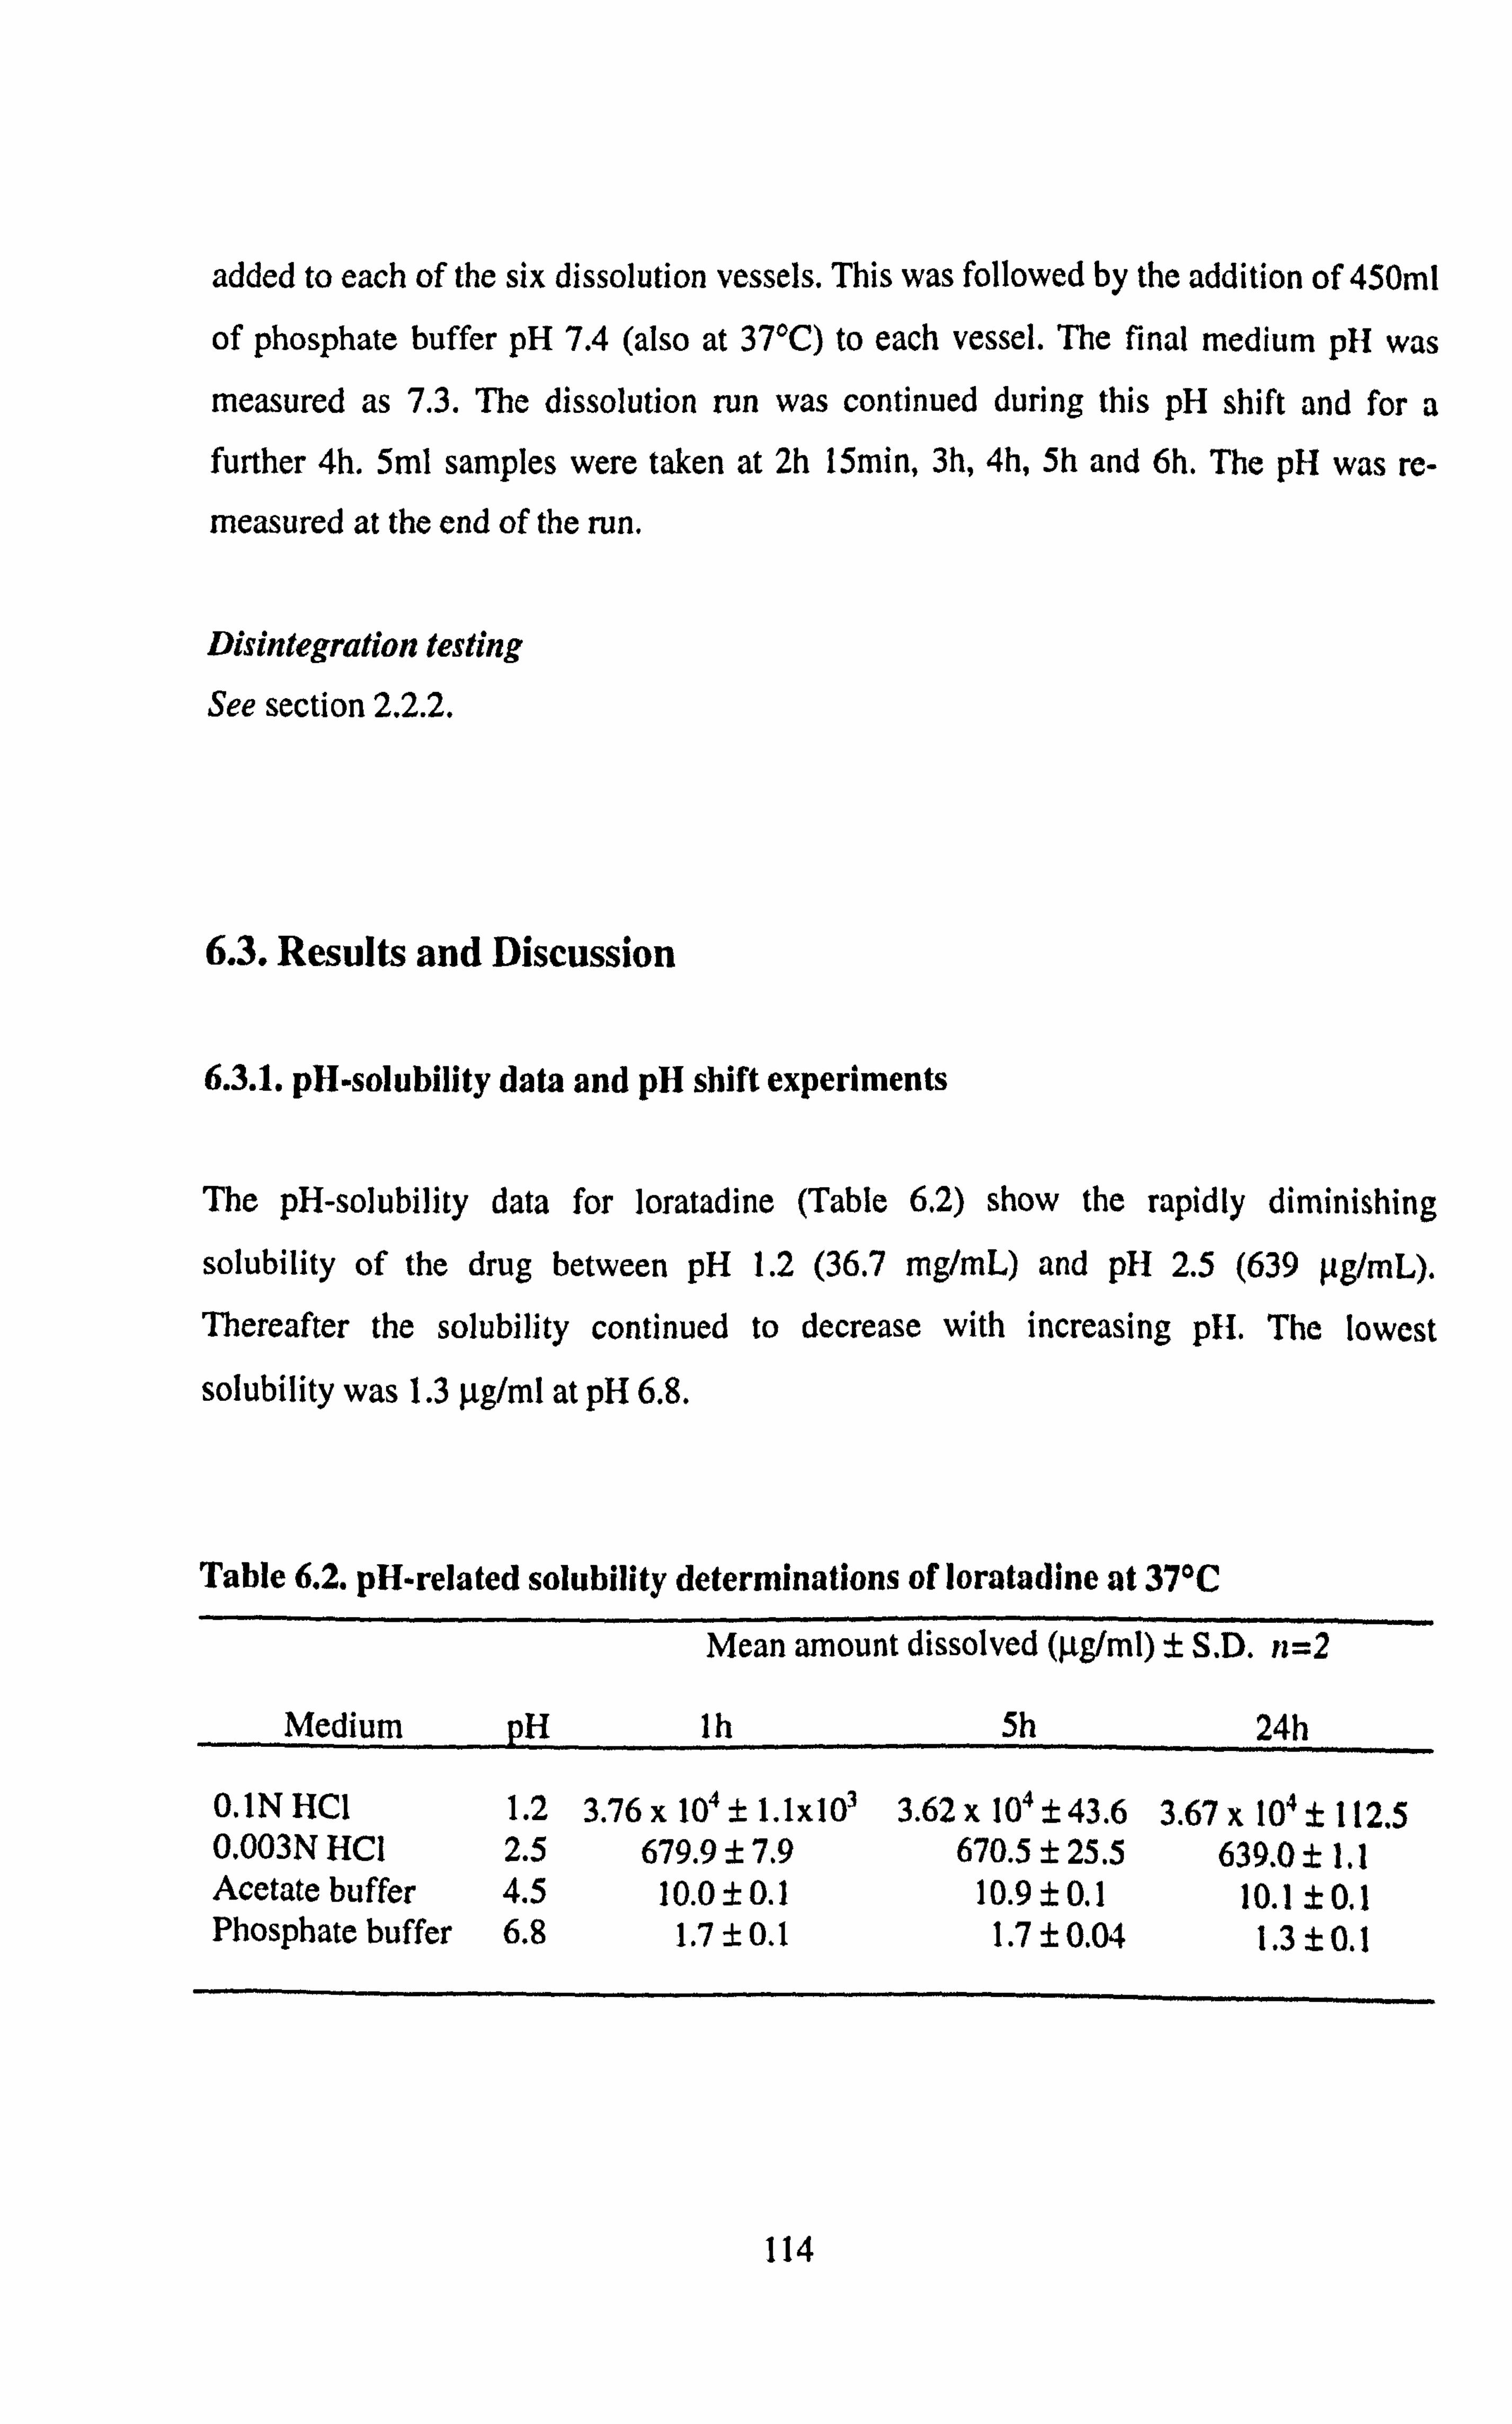
added to each of the six dissolution vessels. This was followed by the addition of 450m1
of phosphate buffer pH 7.4 (also at 37°C) to each vessel. The final medium p11 was
measured as 7.3. The dissolution run was continued during this pH shift and for a further 4h. 5ml samples were taken at 2h 15min, 3h, 4h, 5h and 6h. The pH was re-
measured at the end of the run.
Disintegration testing
See section 2.2.2.
6.3. Results and Discussion
6.3.1. pH-solubility data and pH shift experiments
The pH-solubility data for loratadine (Table 6.2) show the rapidly diminishing
solubility of the drug between pH 1.2 (36.7 mg/mL) and pH 2.5 (639 . tg/mL). Thereafter the solubility continued to decrease with increasing pH. The lowest
solubility was 1.3 p. g/ml at pH 6.8.
Table 6.2. pH-related solubility determinations of loratadine at 37°C
Mean amount dissolved (µg/ml) ± S. D. n=2
Medium pH Ih
O. INHC1 1.2 3.76x 10⁴±1.1x10³ 0.003N HCI 2.5 679.9 ± 7.9 Acetate buffer 4.5 10.0 ± 0.1 Phosphate buffer 6.8 1.7 ± 0.1
5h 24h
3.62 x 10⁴ ± 43.6 3.67 x 10⁴ ± 112.5 670.5 ± 25.5 639.0 ± 1.1
10.9±0.1 10.1 ±0.1 1.7±0.04 1.3±0.1
114

The drastic reduction in solubility between pH 1.2 and 2.5 may have implications on drug absorption from the stomach, depending not only on individual pH variability but
also on whether the individual is in the fed or fasted state. The solubility data suggest
that dissolution and consequent absorption of loratadine will be hindered in the fed
stomach due to the raised pH (2.5-4.5) in this state, if pH alone controls absorption.
In relation to pH dependent solubility, the dissolution of a commercially available brand
of loratadine 10mg tablets (Brand A) was investigated in various simple media (Figure
6.2). The effects of pH were evident in the differences in drug dissolution after 2h
between HCI-0.017% SDS at pH 1.2 and HCI-0.017% SDS at pH 2.5 and in NaSIF pH 6.8 (103.51%, 31.81% and 0.09% drug dissolved respectively). However, with pH shift, the addition of IN NaOH and phosphate buffer to 0.25%w/v SDS pH 1.2 in the dissolution vessel (final pH 7.3) did not cause precipitation of the dissolved drug
(Figure 6.2). This dissolution profile in the HCl-0.25% SDS pH 1.2 - pH 7.3 shift
experiment shows 109% loratadine dissolved at 30 min. This high percentage of drug
dissolution can be attributed to weight variation of the tablets leading to dose variations (accepted regulatory variation is 90-110% of the stated dose) and slight analytical bias.
When the pH shift experiment was repeated without using SDS in the medium, drug
precipitation on pH shift was evident from the dissolution profile.
The presence of surfactant in the medium prevented precipitation as the p11 was raised. At a pH above 6 almost all of the loratadine would have been unionized, thus, the drug
was probably solubilised within the hydrophobic micellar core of the surfactant. This
result demonstrated that the incorporation of SDS to the gastric phase of this dissolution
test to match physiological surface tension had a consequence on the prediction of the
consecutive intestinal dissolution phase, highlighting a limitation of such an in sittt test. To determine the extent to which physiological surfactants forming micelles in the
small intestine protect basic drugs from precipitation during transit requires p1l shift experiments to FaSSIF and FeSSIF media.
115

ý CY)
r-ý N
1-
Q ý > 3
ý ý N Ö
ax O
co
O0C co (/)
öM
Ný 9NU
^N' 2
O SO
't fl N
c: rc
aý ... ýý
.ýý, 3ý
Uý x£ .-
:: ?0
ý
0 N ý
0 0 r
O 00
O CD
0 It
panJossia %
0 N 0
N
Y Cl.
U) 0 (/)
r--
O LL
ro U ZI
f+
'C a, s «r C O . -. M n
0 .r N ý E 0 w ý w .., s ý x a s ý .5 ý
116

Alternative methods of pH shift experiments have recently been, investigated (Qiu et al., 2003; Kostewicz et al., 2004; Gu et al., 2005; Kreutzwald et al., 2005) that avoid having to transfer the dosage form from one medium to another, which is the
compendia) procedure for enteric-coated products (Section 1.3.8.3). The transfer
procedure is also the basis of the Bio-Dis® system (USP apparatus 3) that allows
sequential immersion of the dosage form into different media (Section 1.3.1.3). The
flow through apparatus (USP apparatus 4) has also been suggested to mimic the in vivo
pH shift during dissolution investigations (Looney, 1997) by switching the medium
reservoir at a set time or addition of buffer. Some of these methods suffer from the fact
that the dosage form is exposed to fresh medium instead of allowing mixing of the
medium of first exposure with a second medium. In vivo, all the stomach contents
empty into the duodenum over time. Hence, such methods do not allow monitoring of
precipitation of dissolved but unabsorbed basic drug caused by the pH shift during
gastric emptying into the intestine. Also, methods involving transfer of the dosage form
are not practical for disintegrating dosage forms.
The in situ pH shift addresses these issues. Although the pH shift experiments in this
study utilize simple media as a starting point, if viable the method can be developed
further using biorelevant dissolution media, food components, enzymes and include an
absorption compartment. However, sampling and drug extraction may prove
challenging as the medium becomes more complex. The effect of additives on the buffer capacity of the medium may also make it difficult to maintain a constant pH over
several hours.
In terms of practicality for this set of experiments, the increased number of stages during testing compared to compendia) tests increases the risk of human error during
the test. For routine application, operator and inter-lab variability may be increased depending on the complexity of the test.
With regard to predicting the dissolution behaviour of a drug during transit through the GIT, such a test can lend insight into the physicochemical properties of the medium
117

affecting drug dissolution. Of course, this hinges on how closely the medium resembles
the respective in vivo environments through gastro-intestinal transit. Also, experimental factors such as agitation speed can affect the result. The true utility of such a test needs
to be determined through correlation with in vivo studies.
6.3.2. Solubility and dissolution in FaSSIF, FeSSIF and constituents
Table 6.3a shows that the solubility of loratadine in FaSSIF was much higher than in
the individual constituent and blank media - approximately 5 times higher than lecithin
and 7 times higher than NaTC and FaSSIF blank at 24h. Loratadine showed the lowest
solubility in FaSSIF blank (pH 6.4), which was similar to that in the phosphate buffer
pH 6.8 (Section 6.3.1). Comparison of the data in Table 6.3a to Table 6.3b shows that
drug solubility in the fed state media was higher. This is attributed to pH difference and
the higher concentration of bile salt (NaTC) and lecithin compared to the fasted state
media.
The inclusion of the NaTC and lecithin as solubilisers is of particular interest. At the higher pH of 6.5 little difference in loratadine solubility was seen between the lecithin
and NaTC media. This was a combined effect of the low but still physiologically
relevant concentrations of lecithin and NaTC used (0.059% w/v and 0.165% w/v
respectively) and the higher pH. At a relatively more favourable pH and at much higher
concentrations of lecithin and NaTC (0.295% w/v and 0.825% w/v respectively),
matching those reported in the fed state human intestine, solubility in NaTC (+s 64 µg/
mL) was at least 4 times higher than in lecithin (Table 6.3b). However the higher
solubility in the NaTC medium was still appreciably lower than in the complete FeSSIF
medium containing both components. This synergistic effect when both components
were present was attributed to the formation of mixed micelles. Incorporation of lecithin into the bile salt micelle decreases the eme, increases the micelle size and enhances the solubilisation capacity (Charman et al., 1997; Horter & Dressman, 2001).
Thus the omission of lecithin from these proposed biorelevant dissolution media to
118

make them more cost effective may potentially compromise the prediction of in vivo
product performance.
Two readily available suppliers of NaTC were also compared to test the variability in
solubilizing behaviour. No discernable differences were noted at the low NaTC
concentration (fasted state). However, at the higher NaTC concentration loratadine
solubility was approximately 10% higher in the NaTC obtained from Lancaster (97%
purity) than in the NaTC obtained from Sigma (95% purity).
Table 6.3a. Solubility determination of loratadine in fasted state media at 37°C
Medium pH Mean amount dissolved (µg/ml) ± S. D. n=2
Ih 5h 24h
FaSSIF 6.4 9.1 ±0.3 15.2±0.01 14.0±0.2 FaSSIF blank 6.4 1.8 ± 0.04 1.8 ± 0.1 1.9 ± 0.2 0.059% w/v lecithin 6.5 2.3 ± 0.3 3.1 ± 0.1 3.3 ± 1.0 0.165% w/v NaTC (Sigma) 6.4 2.1 ± 0.01 2.2 ± 0.02 2.2 ± 0.03 0.165% w/v NaTC (Lancaster) 6.5 2.1 ± 0.03 2.2 ± 0.1 2.2 ± 0.03
Table 6.3b. Solubility determination of loratadine in fed state media at 37°C
Medium pH Mean amount dissolved (µg/ml) ± S. D. n=2
Ih 5h 24h
FeSSIF 5.0 144.6 t 0.8 146.6 t 1.7 155.1 t 6.5 FeSSIF blank 5.0 5.8 ± 0.1 6.2 ± 0.2 5.2 ± 0.6 0.295% w/v lecithin 5.0 6.6 ± 0.2 10.7 ± 1.2 15.6 ± 3.6 0.825% w/v NaTC (Sigma) 5.0 61.6 ± 0.1 63.2 ± 0.04 63.8 ± 0.6 0.825% w/v NaTC (Lancaster) 5.0 66.1 ± 0.2 68.1 ± 0.5 68.7 ± 0.3
119

. ý. C
.ý
.... d
E H
U H c0 Z >
ö li) N OD
0
0 LC)
2 CL
LL
U) C/) a) LL
ýn
00
'C7
cC
º. ý
ee
'C7
eC
8
'C ar
Gz.
, -, II ý
ý ý Q b C ý ý.
ý ý ý v
ao E
"r M
L
61r
0 c 0 .ý ... ý O z ý .0 v s .. c 0 cý
ý uý
14.0
aý.. U
.r cA w `T. ro LL
U
0 N
panJossia %
120
ý �I
w3 bA >

The dissolution profiles of loratadine 10 mg tablets (Brand A) in FaSSIF, FeSSIF and 0.825% w/v NaTC are illustrated in Figure 6.3. In line with the solubility data, a significant difference (p<0.05) existed, using a 2-sample T-test between the dissolution
profiles in FESSIF and 0.825% w/v NaTC between 30-120 min. The extent of the difference in the dissolution profiles between FaSSIF and FeSSIF seen in Figure 6.3 is
an anomaly, caused by a disintegration issue with Brand A loratadine tablets that further
delayed drug release from the formulation at pH 6.5 (Table 6.6). This issue is discussed
further in section 6.3.4.
6.3.3. Solubility screen and dissolution in surfactant based media
The incorporation of bile salts and lecithin into dissolution media significantly increases
the cost of dissolution tests. Furthermore, the preparation of these more complex media is time consuming and labour intensive. These factors have limited the utility and
adoption of the proposed FaSSIF and FeSSIF media during product development stages in industry. Thus, attention has been already been focused on finding alternative
synthetic surfactants to replace bile salt and lecithin whilst these relatively new biorelevant media continue to be developed to more accurately match the in vivo
environment.
In this study, a number of surfactants of different type were screened for their ability to
solubilise loratadine. They included CTAB (cationic), SDS (anionic), Brij 35 (neutral), Triton X 100 (neutral), Cremophor EL (neutral), Tween 80 (neutral), CHAPSO (zwitterionic) and C12AO (zwitterionic). As a starting point, the concentration of each surfactant used was twice the quoted cmc from literature (Table 6.1). It is accepted that cmc values may be affected by temperature and electrolytes. In the case of ionic
surfactants, electrolytes in the dissolution medium decrease the cmc whilst temperature has little effect (Florence & Atwood, 1988; Malmsten, 2002) . Conversely for neutral surfactants, electrolytes have little effect on the cmc whilst raising the temperature of
121

the dissolution medium decreases the cmc (Florence & Atwood, 1988; Malmsten,
2002). Hence, for the purposes of this study, using surfactants at twice their cmcs was
considered appropriate to form micellar solutions. The results of the solubility
experiments are given in Tables 6.4a and 6.4b. The enhancement in loratadine solubility in synthetic surfactant media relative to NaTC for SDS, CTAB and CHAPSO was 586,
46 and 32 fold respectively in FaSSIF blank and 25,1.8 and 1.3 fold respectively in
FeSSIF blank. The other synthetic surfactants used did not significantly enhance loratadine solubility relative to NaTC. The decrease in magnitude of drug solubility
enhancements in the synthetic surfactants when moving from FaSSIF blank to FeSSIF
blank was due to the higher concentration of NaTC in the FeSSIF medium.
Table 6.4a. Solubility determination of loratadine in FaSSIF blank- surfactant media.
Medium pH
SDS CTAB CHAPSO Cremophor EL Brij 35 Triton X 100 Tween 80 C 12AO
Mean amount dissolved (tg/ml) ± S. D. n=2
Ih 5h 24h
6.7 1194.4± 12.9 1186.9 ± 15.9 1290.0 ±41.3 6.6 102.4±0.04 102.5±0.1 101.4±0.3 6.7 68.7±0.4 71.6±0.5 71.2±0.3 6.7 5.5±0.1 5.3±0.1 3.4±0.5 6.7 5.3±0.04 5.5±0.04 4.5 ± 0.1 6.7 3.2±0.2 3.2±0.1 1.5±0.1 6.7 1.8 ± 0.02 1.7±0.1 1.7±0.2 6.7 1.7±0.04 1.6±0.1 1.5±0.1
Table 6.4b. Solubility of loratadine in FeSSIF blank- surfactant media.
Medium
SDS CTAB CHAPSO Brij 35 Triton X 100 Cremophor EL C12AO Tween 80
pH Mean Solubility (µg/ml) ± S. D. n=2
Ih 5h
5.0 1467.3 ± 10.0 1550.0 ± 67.1 4.9 107.9 ± 7.3 107.6 ± 3.3 5.0 80.7t3.2 81.1±1.9 4.9 10.8 ± 0.2 12.8 ± 2.3 5.0 10.3±0.6 12.4±2.3 5.0 10.0±0.6 10.0±0.4 5.0 5.6t1.5 5.1t0.1 5.0 4.9±0.2 5.2±0.6
24h
1637.3 ± 124.8 119.0 t 7.1 83.2: t 1.5 10.9 t 0.1 9.4 ± 0.04 9.1 t 0.8 4.8 t 0.04 4.8 t 0.1
122

The solubilising capacity of a micelle is defined as the number of moles of solubilisate
per mole of micellised surfactant (i. e. C- cmc) (Rosen, 1989). The moles of loratadine
solubilised in the synthetic surfactants were calculated from the 24h data in Table 6.4a
and 6.4b. The solubilising capacities of the synthetic surfactants are shown in Table 6.5.
From Table 6.5 it can clearly be seen that SDS was the best at solubilising loratadine.
CTAB showed the second highest solubilising capacity. The significantly lower
loratadine solubility in the neutral surfactant media at higher pH (Table 6.4a) and their
respective capacities (or lack of) in Table 6.5 showed that these surfactants were poor
solubilisers of the drug. Where solubilising capacities were not calculated in Table 6.5
it was because loratadine solubilities in the synthetic surfactants were similar to that in
the FaSSIF and FeSSIF blanks i. e surfactant mediated solubility enhancement did not
occur. The higher solubilising capacities at pH 5 compared to pH 6.7 may be attributed
to electrolyte effects enhancing micelle formation in FeSSIF.
Table 6.5. Solubilising capacity of synthetic surfactants for loratadine at 37°C
based on 24h solubility data.
Surfactant Solubility' (mole drug/mole surfactant) pH 5.0 pH6.7
SDS 0.52 0.41 CTAB 0.29 0.25 Cremophor EL 0.28 0.11 Brij 35 0.14 0.07 Triton X 100 0.05 --- CHAPSO 0.03 0.02 Tween 80 --- --- C 12AO --- ---
1Data corrected for non-mice llar loratadine solubility by subtracting the solubility of loratadine
in FaSSIF and FeSSIF blanks at 24h (Tables 6.3a and 6.3b respectively) from the solubility in the surfactant media at 24h (Tables 6.4a and 6.4b)
123

00000 CD ao r- (D LO NT cý 0 N
(lw/fin) A}iliqnlog auipejeao-1
124
0 ý
0
rn
Co
ý
ca
LO
It
Cr)
N
r-
0
cý cý b
. ý.
«.
ý
II

It was decided to select one surfactant from each class for further study in dissolution
tests of loratadine tablets. CTAB, SDS, Cremophor EL and CHAPSO were chosen because they showed the highest loratadine solubility at the concentrations selected. However, the cost per weight of CHAPSO was considerably greater than the other
surfactants. It was calculated that the quantity required for a standard six-vessel dissolution test would cost more than NaTC, which would defeat the objective of the
study. A plot of loratadine solubility versus CHAPSO concentration is illustrated in
Figure 6.4. The data revealed that decreasing the CHAPSO concentration from that
used in the solubility study (10 mg/mL) to 5 mg/mL caused a five-fold decrease in
loratadine solubility at pH 5.0 and seven-fold decrease at pH 6.5. Further reduction in
CHAPSO concentration to 2.5 mg/mL further reduced loratadine solubility. These
results meant that CHAPSO could not be used in lower, cost effective, concentrations
for dissolution tests without affecting the drug dissolution profile compared to FASSIF
and FeSSIF. Hence, CHAPSO was omitted from the dissolution study.
Initial dissolution profiles were generated using Brand A loratadine 10mg tablets.
Dissolution in Cremophor EL media was considerably lower than in other media at
similar pH (Figure 6.5). Dissolution in CTAB and SDS media was more promising in
terms of matching the dissolution profiles generated in FaSSIF and FeSSIF. It was decided to develop media using these two surfactants in an attempt to match the FaSSIF
and FeSSIF derived dissolution profiles. The results are discussed in Section 6.3.5.
125

0 , I- N
ý c cC
CA A ý xi Q Fý
r:, _U II CO C II C
Co 5 'C
ý`ý 8 2W CL 2C
CD a2 Q U)
U U)
0 CV 0 0 ý
0 OD
0 CD
0 v
panJossia %
0 N
0
O
.ý C
.ý
... d E H
ý
I
c 0 LO
2 CL LL (1) U) a) LL
cD
(D 2 CL LL ý ý cC LL
cö
0 LO
2 a U) 0 C/)
CD T- CL
J W
0 . I- -OL 0 E N
U
ch u C
ý CO T
11 1
Ca `-' J Nw (0 ý =t aa m0 QE Hý UU
y
'C
,ý w
Ici
ý
Q c
ca
ML ý""I M (/ý `ý'
Z, 4 wý
cc 5 ýs " ýo
W"
aý C "r
b ý eý L
0 ý -2 °
v, c
ao ý- o ., .0
aý s ý a 0 . ý, a w I. 0 s a
aj 0
wV
126

6.3.4. Disintegration behaviour of different tablet brands
As mentioned previously in Section 6.3.2, a delay in the disintegration of Brand A
loratadine tablets was observed during the dissolution tests. Disintegration tests
were carried out on Brand A tablets and two further brands of loratadine (Brands B
and C) at three relevant pHs (Table 6.6). The results show that the disintegration of
Brand A tablets was delayed as the pH was increased to 5.0 and 6.5. Brand B was
only slightly affected whilst the disintegration time of Brand C was almost doubled
as the pH was increased. However, the disintegration time of Brand C was still below 10 minutes at pH 6.5, and was therefore allowable for an immediate release dosage form.
Table 6.6. Disntegration times of three marketed loratadine tablet brands at
various pH values. Loratadine Tablet Brand
Mean Disintegration Time (min)t S. D. n=3
Medium (37°C) Brand A Brand B Brand C
FaSSIF blank pH 6.5 53.9±2.2 3.310.1 6.410.9
FeSSIF blank pH 5.0 25.9 ± 0.8 2.0: t 0.4 6.0 ± 0.5
0.1NHC1pH 1.2 6.2±0.1 1.2±0.1 3.5±0.4
All three brands listed the same excipients: lactose monohydrate (filler), maize
starch (disintegrant), pregelatinised maize starch (binder) and magnesium stearate (lubricant). The variation in disintegration time between the three products must therefore be due to differences in the quantity of excipient used (e. g. binder/disintegrant), the grade of excipient and/or manufacturing processes (e. g.
mixing time/ drying time).
127

6.3.5 Dissolution profile matching using loratadine brands B and C
Loratadine dissolution profiles were generated in FaSSIF and FeSSIF using Brand B
and C tablets and the profiles compared to those previously obtained for Brand A in
Figure 6.6. A pronounced difference in in vitro dissolution between the three
marketed products was evident for the first hour in FeSSIF and throughout the test in FaSSIF. The data suggest that if FaSSIF and FeSSIF are biorelevant, then dissolution testing in these media during in vitro bioequivalence studies would be
more discriminating than compendia) media towards product performance. Furthermore, bio-data needs to be sought for the three loratadine products from the
manufacturers or regulatory authorities to determine whether the three products are in effect bioinequivalent or whether the FaSSIF and FeSSIF media were not biorelevant in this case.
Further dissolution tests were carried out using Brands B and C only. In an attempt
to match the FaSSIF and FeSSIF profiles generated for Brand B using CTAB and SDS, the concentrations of CTAB and SDS were adjusted until the best fit was
obtained. The matched profiles are illustrated in Figure 6.7 and 6.8 for CTAB and SDS respectively. The cost reductions through the use of the synthetic surfactants
are shown in Table 6.7.
Table 6.7. Comparison of the cost of dissolution testing media'
FaSSIF
£85 £0.10 £0.60 FeSSIF
Replacement for FaSSIF
CTAB SDS (0.1365 mg/mL) (0.225 mg/mL)
Replacement for FeSSIF
CTAB
£410 901 (1.82 mgJmL)
> £1.10
Figures for typical test: n=6, dissolution volume 1000ml
SDS
(1 mg/mL)
£2.60
128

o00 CD ao CO
0 It
panIossia %
129
O N 0
. ý. C
.ý
... ý E
LO o (6 LO 22 aa LL LL U) U) U) U) co (D LL LL UU
cc (U (13 mm 11
}} ýý
U) O (D U) 22 CL a
LL LL
U) Fn U) U) co N
U- LL
co co ýý ýc cri w co co
f LO O CO U') 22 CL a LL LL cn U) U) U) (C G) LL LL QQ «a M cc
mm
ýý
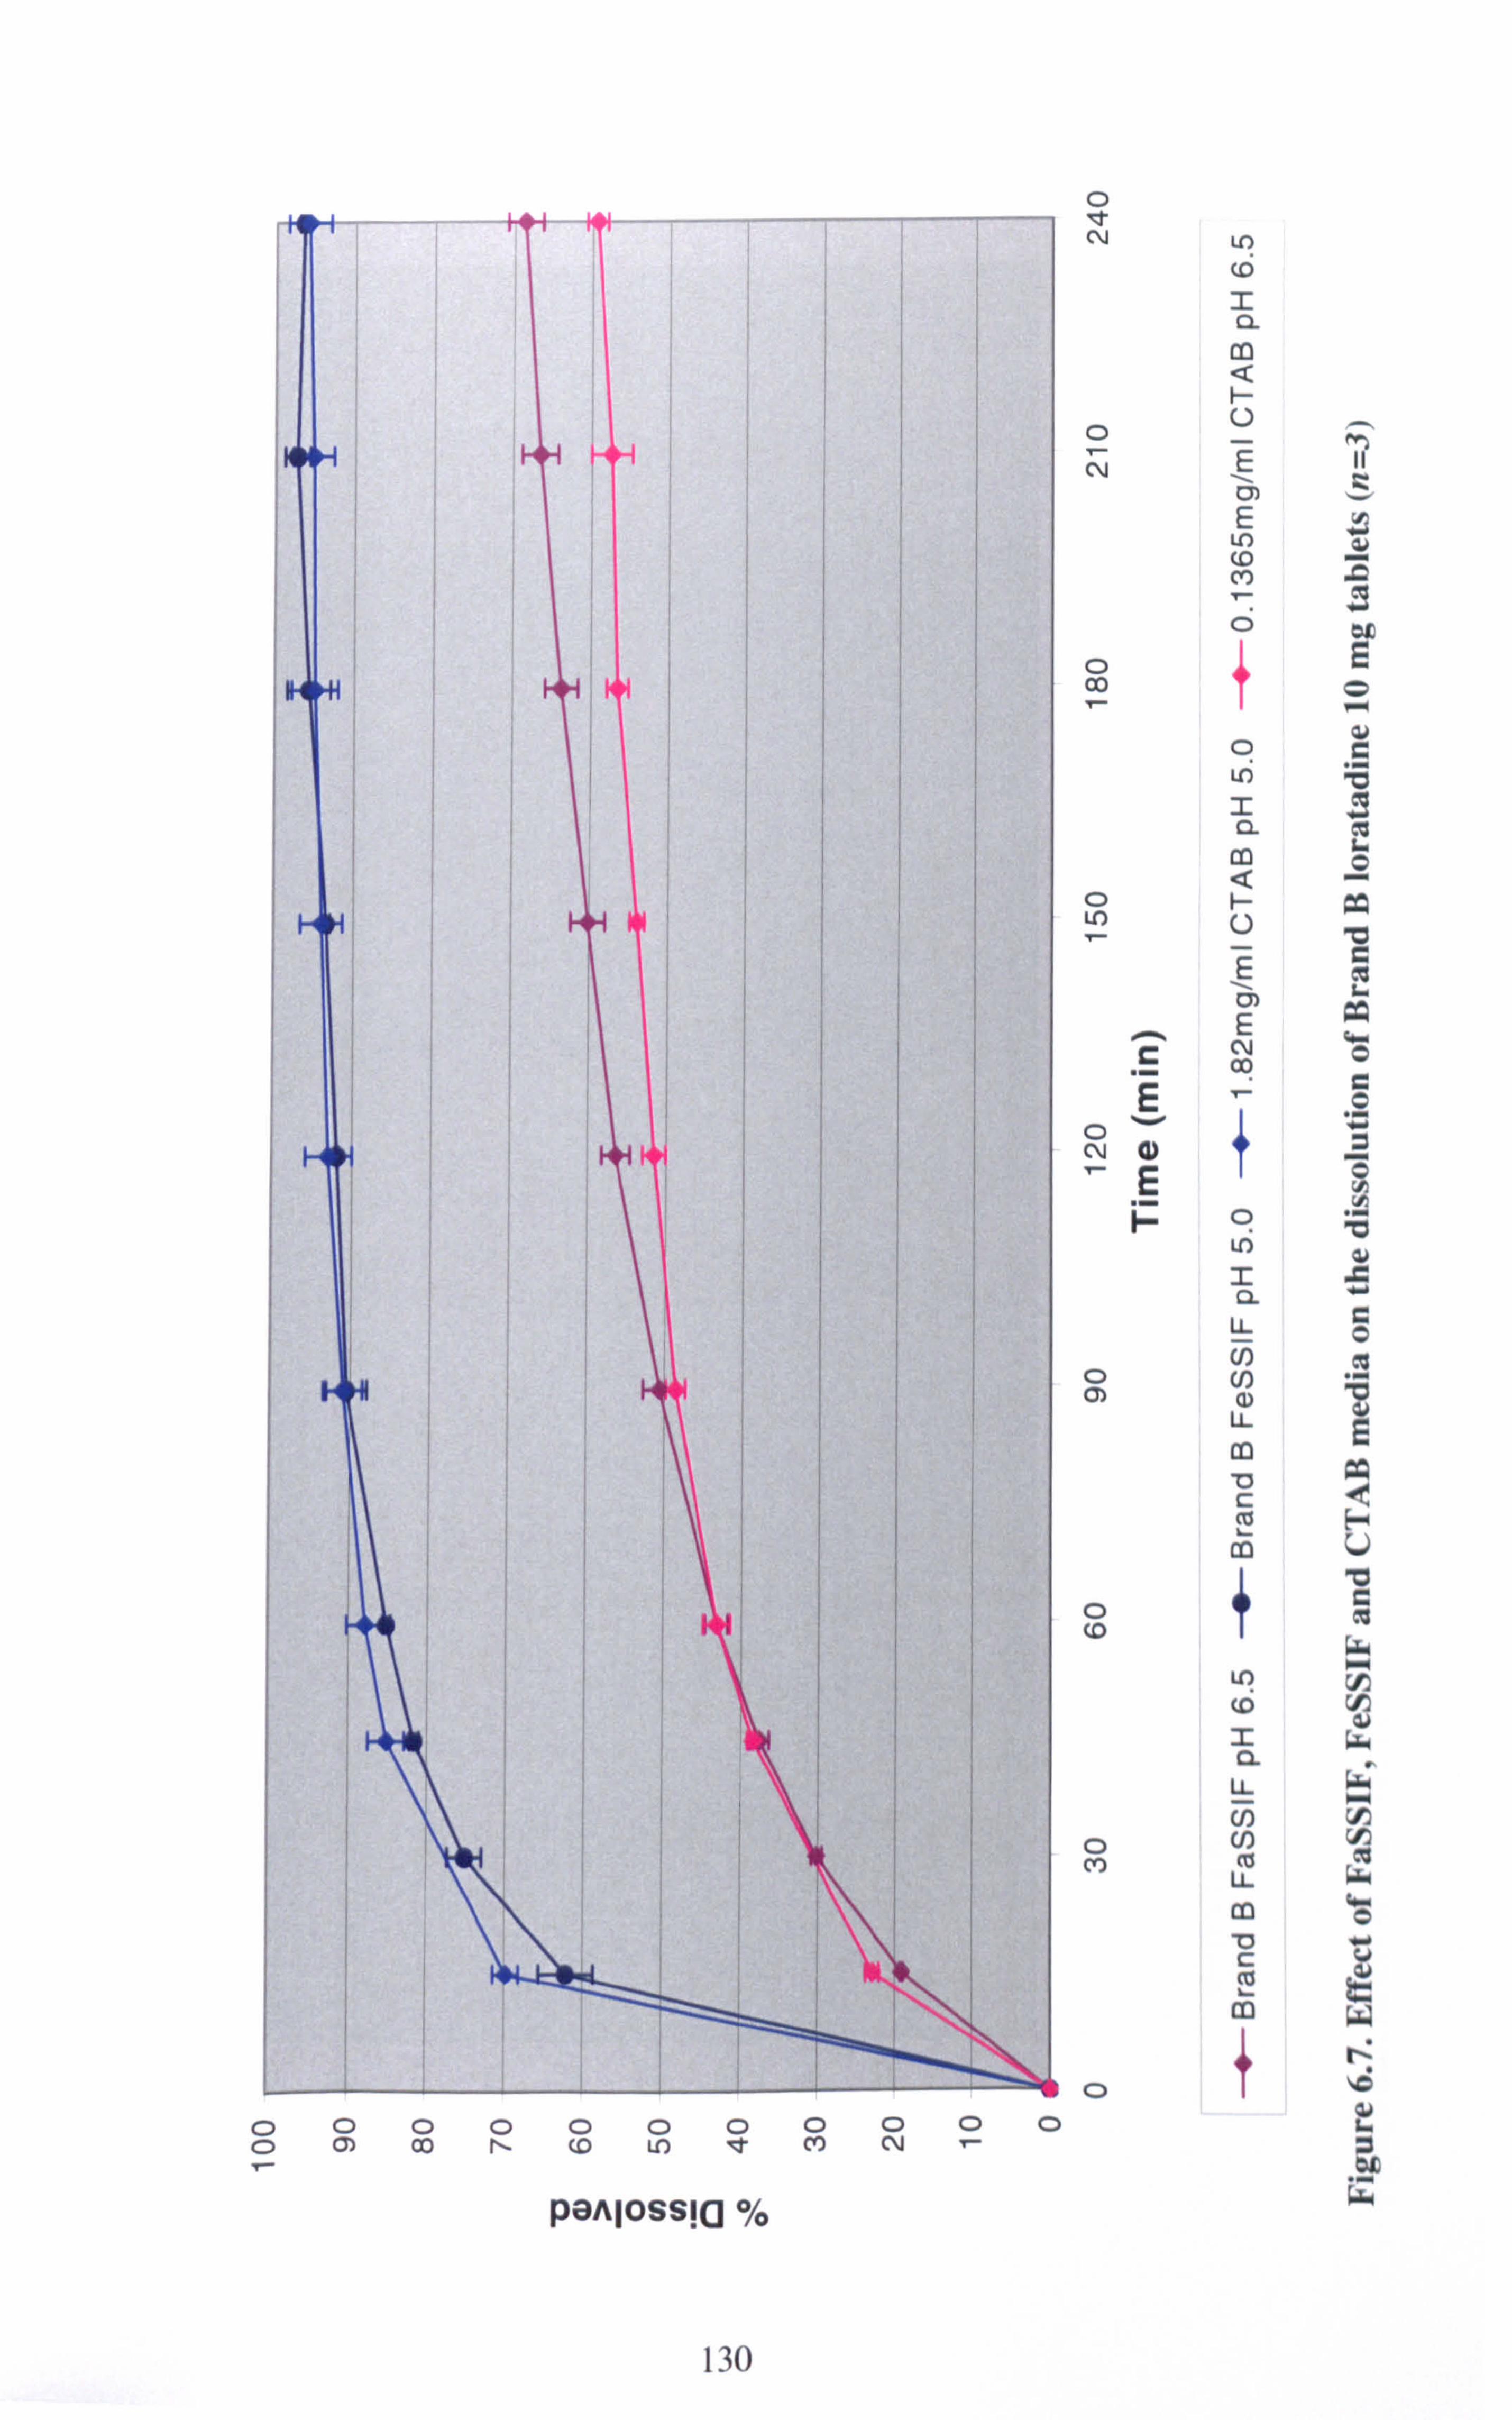
0 0
0000000000 Q) 00 N co U) It CV) N
panJossia %
130
T
0 'IT CV
0 N
O 00
LO cD 2 a
ý U E rn
ýn cp CO
0 ui 2 a Co
0ý ýU
E V/
E ý C ýN
E 1T N
a) 1
E iz c?
LO Z a LL U)
o U) rn aD LL
m
c ý
o+ co
0 Co
LO (6 2 CL LL U) U) LL
v c ý c0

Ö QO) co
Or- COO LO
ýC0000
T
panJossia %
0 V N
0 N
CD CO T
0 ý
O N
0 O)
0 0
C) CO
. ý. C
.ý
ý d E
131

After finding the CTAB and SDS concentrations required to match loratadine
dissolution in the biorelevant media, dissolution tests were repeated using these
same surfactant concentrations but with Brand C tablets. The results were compared
to the respective FaSSIF and FeSSIF profiles for Brand C in Figures 6.9 and 6.10.
Dissolution in the synthetic surfactant media no longer matched dissolution in
FaSSIF and FeSSIF. Although there was a difference in disintegration time between
brands B and C (Table 6.6), disintegration was sufficiently rapid for this not to be a
significant factor. Again, it is possible that differences in the manufacturing formula
and/or processes influenced the deaggregation and thus the drug dissolution into
these media.
In moving from Brand B to C, changes in the loratadine dissolution profile between
the biorelevant and surfactant media were observed that need to be explained. Some
property of the formulation seems to influence loratadine solubilisation into both
biological and synthetic surfactants. The results with Brand B indicate that there is
scope for developing surfactant media to mimic FaSSIF/FeSSIF media. However,
the correlation between in vitro dissolution profiles in the different media is product
specific, therefore, caution should be exercised when investigating "similar" generic
formulations (i. e. same qualitative formulae) as dissolution differences have been
demonstrated. Formulation or process changes during development would require
adjustment of surfactant concentrations to match the affected FaSSIF/FeSSIF
dissolution profiles if the synthetic surfactant media were to be used as a surrogate
for biorelevant media.
The location of the drug molecule within the micelle of the biological and synthetic
surfactants is an important consideration in searching for surrogate dissolution
media. Variation in location of solubilisate between different micellar systems may lead to discriminate changes in drug dissolution observed in these media under
certain circumstances such as formulation changes. The chemical structures of the
ionic surfactants are given in Figure 6.11. It is generally accepted that for ionic
micelles the solubilisate would be located in the hydrocarbon core (Florence &
Atwood, 1988). A polar solubilisate would be oriented such that the polar groups
would be amongst the micellar charged head groups and the non-polar groups would
extend into the hydrophobic micellar core. Neutral polyoxyethylated
132

o00 0 Co (D T
0 ý
panJossia ý/,
133
0 N
0
0 IT N
0 N
ý c E .. d E F-
L! )
(D
_ a co ý U
E cm E LO (D c+) 7 0
0 ý 2 n CD
H U
E oi E
N c9
Ln
2 CL
LL
Co U) N
LL
U
cp
_ a U- m cn co U- U
c

0 0 ý
rn ý0
c°D 00
cýe)
panIossia ýý,
134
00 N r 0
0 v N
C E
a) E H
CD uri _ a
U) C ý E
cm E

surfactants (i. e. Brij 35, Cremophor EL and Tween 80) solubilise polar molecules in
the polyoxyethylene shell around the micelle rather than in the core (Florence &
Atwood, 1988). Since the shell is highly hydrated this may account for the
differences in loratadine solubility and dissolution seen between the ionic and
neutral surfactants tested.
. 74 H3Gý-CF[3
CH2 ýH2
'aýro 0
-cH,
HOU'
),, ý3: ý., wH 0
�ý, /V/1i/_
Sodium taurocholate (NaTC)
(anionic)
Phosphatidylcholine (Lecithin)
(zwitterionic)
(p' H3C(H2C)15-N+_CH3 `Sv
CH3 CH3(CH2)1 0CH20' ONa Cetyltrimethylammonium bromide (CTAB) Sodium dodecyl sulphate (SDS)
(cationic) (anionic)
Figure 6.11. Chemical structures of surfactants used in FaSSIF, FeSSIF, CTAB and SDS dissolution media.
CH3 Br' I
135

Confirmation of the inclusion of unionized loratadine within the hydrophobic core
of the biological and synthetic surfactants could be attained through studying
changes in the size and aggregation number of micelles before and after addition of
the drug to the surfactant solutions. Given that a change in the size and shape of
micelles results in changes in optical density, light scattering or turbidity
measurements can be used to detect drug solubilisation or formation of mixed
micelles between bile salt and phospholipids (Andrieux et al., 2004). Micelle size has been measured by static and dynamic light scattering methods (Chaibundit et al., 2002; Andrieux et al., 2004). Aggregation number determinations commonly involve time-resolved fluorescence quenching (TRFQ) studies (Benrraou et al., 2003; Griffiths et al., 2004). Recently, small-angle neutron scattering (SANS)
studies using appropriate models, have been used to study the morphology and interaction of aggregates formed in mixed surfactant solutions (Arleth et al., 2003;
Griffiths et al., 2004; Penfold et al., 2005).
6.4. Conclusion
The precipitation of a poorly soluble basic drug, loratadine, on transit from the
acidic stomach to the intestine of higher pH, has been simply demonstrated by in
vitro dissolution testing using an in situ pH-shift method and compendial apparatus. The addition of the synthetic surfactant SDS, commonly used in dissolution media
can mask the precipitation effect.
The neutral and zwitterionic synthetic surfactants investigated were found to have
poor solubilising capacities for loratadine and thus were not suitable for replacing NaTC and lecithin. SDS and CTAB were more promising in this respect and for one brand of loratadine tablet, FaSSIF and FeSSIF dissolution profiles were adequately
matched by media based on these surfactants. Further work is required to elucidate formulation-related or process-related differences affecting the nature of micelles
and drug solubilisation in both biological and synthetic surfactant systems.
136

7. TRIMETHOPRIM
7.1. Introduction
Trimethoprim (5-[(3,4,5-trimethoxyphenyl)methyl]-2-4-pyrimidinediamine) is an
antibacterial drug used primarily in the treatment and prophylaxis of urinary tract
infections. Trimethoprim is also used to treat gastro-enteritis, respiratory tract
infections and malaria.
OCH3
H2N ýN" I-
OCH3
OCH3
Figure 7.1. The chemical structure of trimethoprim
Trimethoprim is described as a `very slightly soluble' (1 in 2500 parts water) weak base with a pKa of 7.2 and a Log P value of 0.91 (Clarke, 1986). It has an intrinsic
solubility of 0.4 mg/mL at 37°C (Table 7.1) and is completely absorbed from the
GIT after an oral dose with peak plasma concentrations being reached between 1-4h
after administration (Parfitt, 1999). High drug permeability was maintained in the bio-data of Klepser et al (1996) who reported a mean oral bioavailability of 102%
compared to a reference intravenous dose. Trimethoprim has been placed in TICS
Class II in a classification of the World Health Organisation's Model list of Essential Medicines (Lindenberg et al., 2004).
It was intended to use this drug as a second basic model compound to monitor
precipitation on pH shift and dissolution behaviour in biorelevant and synthetic
surfactant based media.
137
7.2. Materials and Methods
7.2.1. Materials
Details of all materials used in the preparation of the dissolution media and in
performing the experiments are listed in section 2.1.
7.2.2. Methods
Solubility determinations
See Section 2.2.1.
Dissolution testing
See Section 2.2.3. The volume of dissolution medium used was 1000 mL.
7.3. Results and Discussion
Preliminary trimethoprim dissolution data in simulated intestinal fluid (SIF) p1i 6.8
(Figure 7.2) were unexpectedly high. Therefore, the BCS solubility classification of
trimethoprim was investigated to address the dissolution results. The findings and
their implications are discussed below.
Solubility studies of trimethoprim were carried out at pH 1.2,5.0,6.2,6.8,7.2,7.5
and 8.2 in appropriate buffers as per the FDA BCS guidance for determining the drug substance solubility class (CDER, 2000). The results are shown in Table 7.1.
According to the guidance, the solubility class is determined by calculating the
volume of aqueous medium sufficient to dissolve the highest dose strength (200 mg in this case) in the pH range 1-7.5 (the dose: solubility ratio). For a drug substance
138

to be classified as `highly soluble' it must have a dose: solubility ratio S 250 mL
over the pH range 1-7.5.
Table 7.1. pH related solubility determination of trimethoprim at 37°C.
Mean amount dissolved (mg/mL) ± S. D.
(n=3)
Medium pH lh 5h 24h
Dose: Solubility
ratio (mL)
0.1NHC1 1.2 8.2±0.2 8.5±0.1 6.7±0.3 30
Acetate buffer 5.0 3.7 ± 0.2 3.9 ± 0.01 4.1 ± 0.1 49
Phosphate buffer 6.2 2.6 ± 0.1 2.7 ± 0.02 3.7 ± 0.6 54
Phosphate buffer 6.8 1.6 ± 0.01 1.6 ± 0.003 1.9 ± 0.1 108
Phosphate buffer 7.2 1.0 ± 0.01 1.0 ± 0.02 1.1 ± 0.1 184
Phosphate buffer 7.5 0.8 ± 0.01 0.7 ± 0.01 0.6 ± 0.03 303
Phosphate buffer 8.2 0.5 ± 0.01 0.5 ± 0.02 0.4 ± 0.01 476
From the results it can be seen that trimethoprim exceeds the solubility class
boundary at pH 7.5 with a dose: solubility ratio of 303 mL. This explains its `poor
solubility' classification according to the BCS. Consequently, the dissolution of
trimethoprim was higher than one would expect for a basic BCS Class II compound
at intestinal pH. Approximately 100% of the drug dissolved from a tablet in 15 min
and 80% of powdered drug substance (50 µm) dissolved in Ih in 1000 mL
phosphate buffer at pH 6.8 (Figure 7.2). The 115% dissolution at 30 min from the
tablets can be explained by the fact that tablet products can contain a maximum of 110% of the stated drug dose and excipient interference in the analytical method. The dissolution volume and pH used are typically used to mimic intestinal
conditions.
139
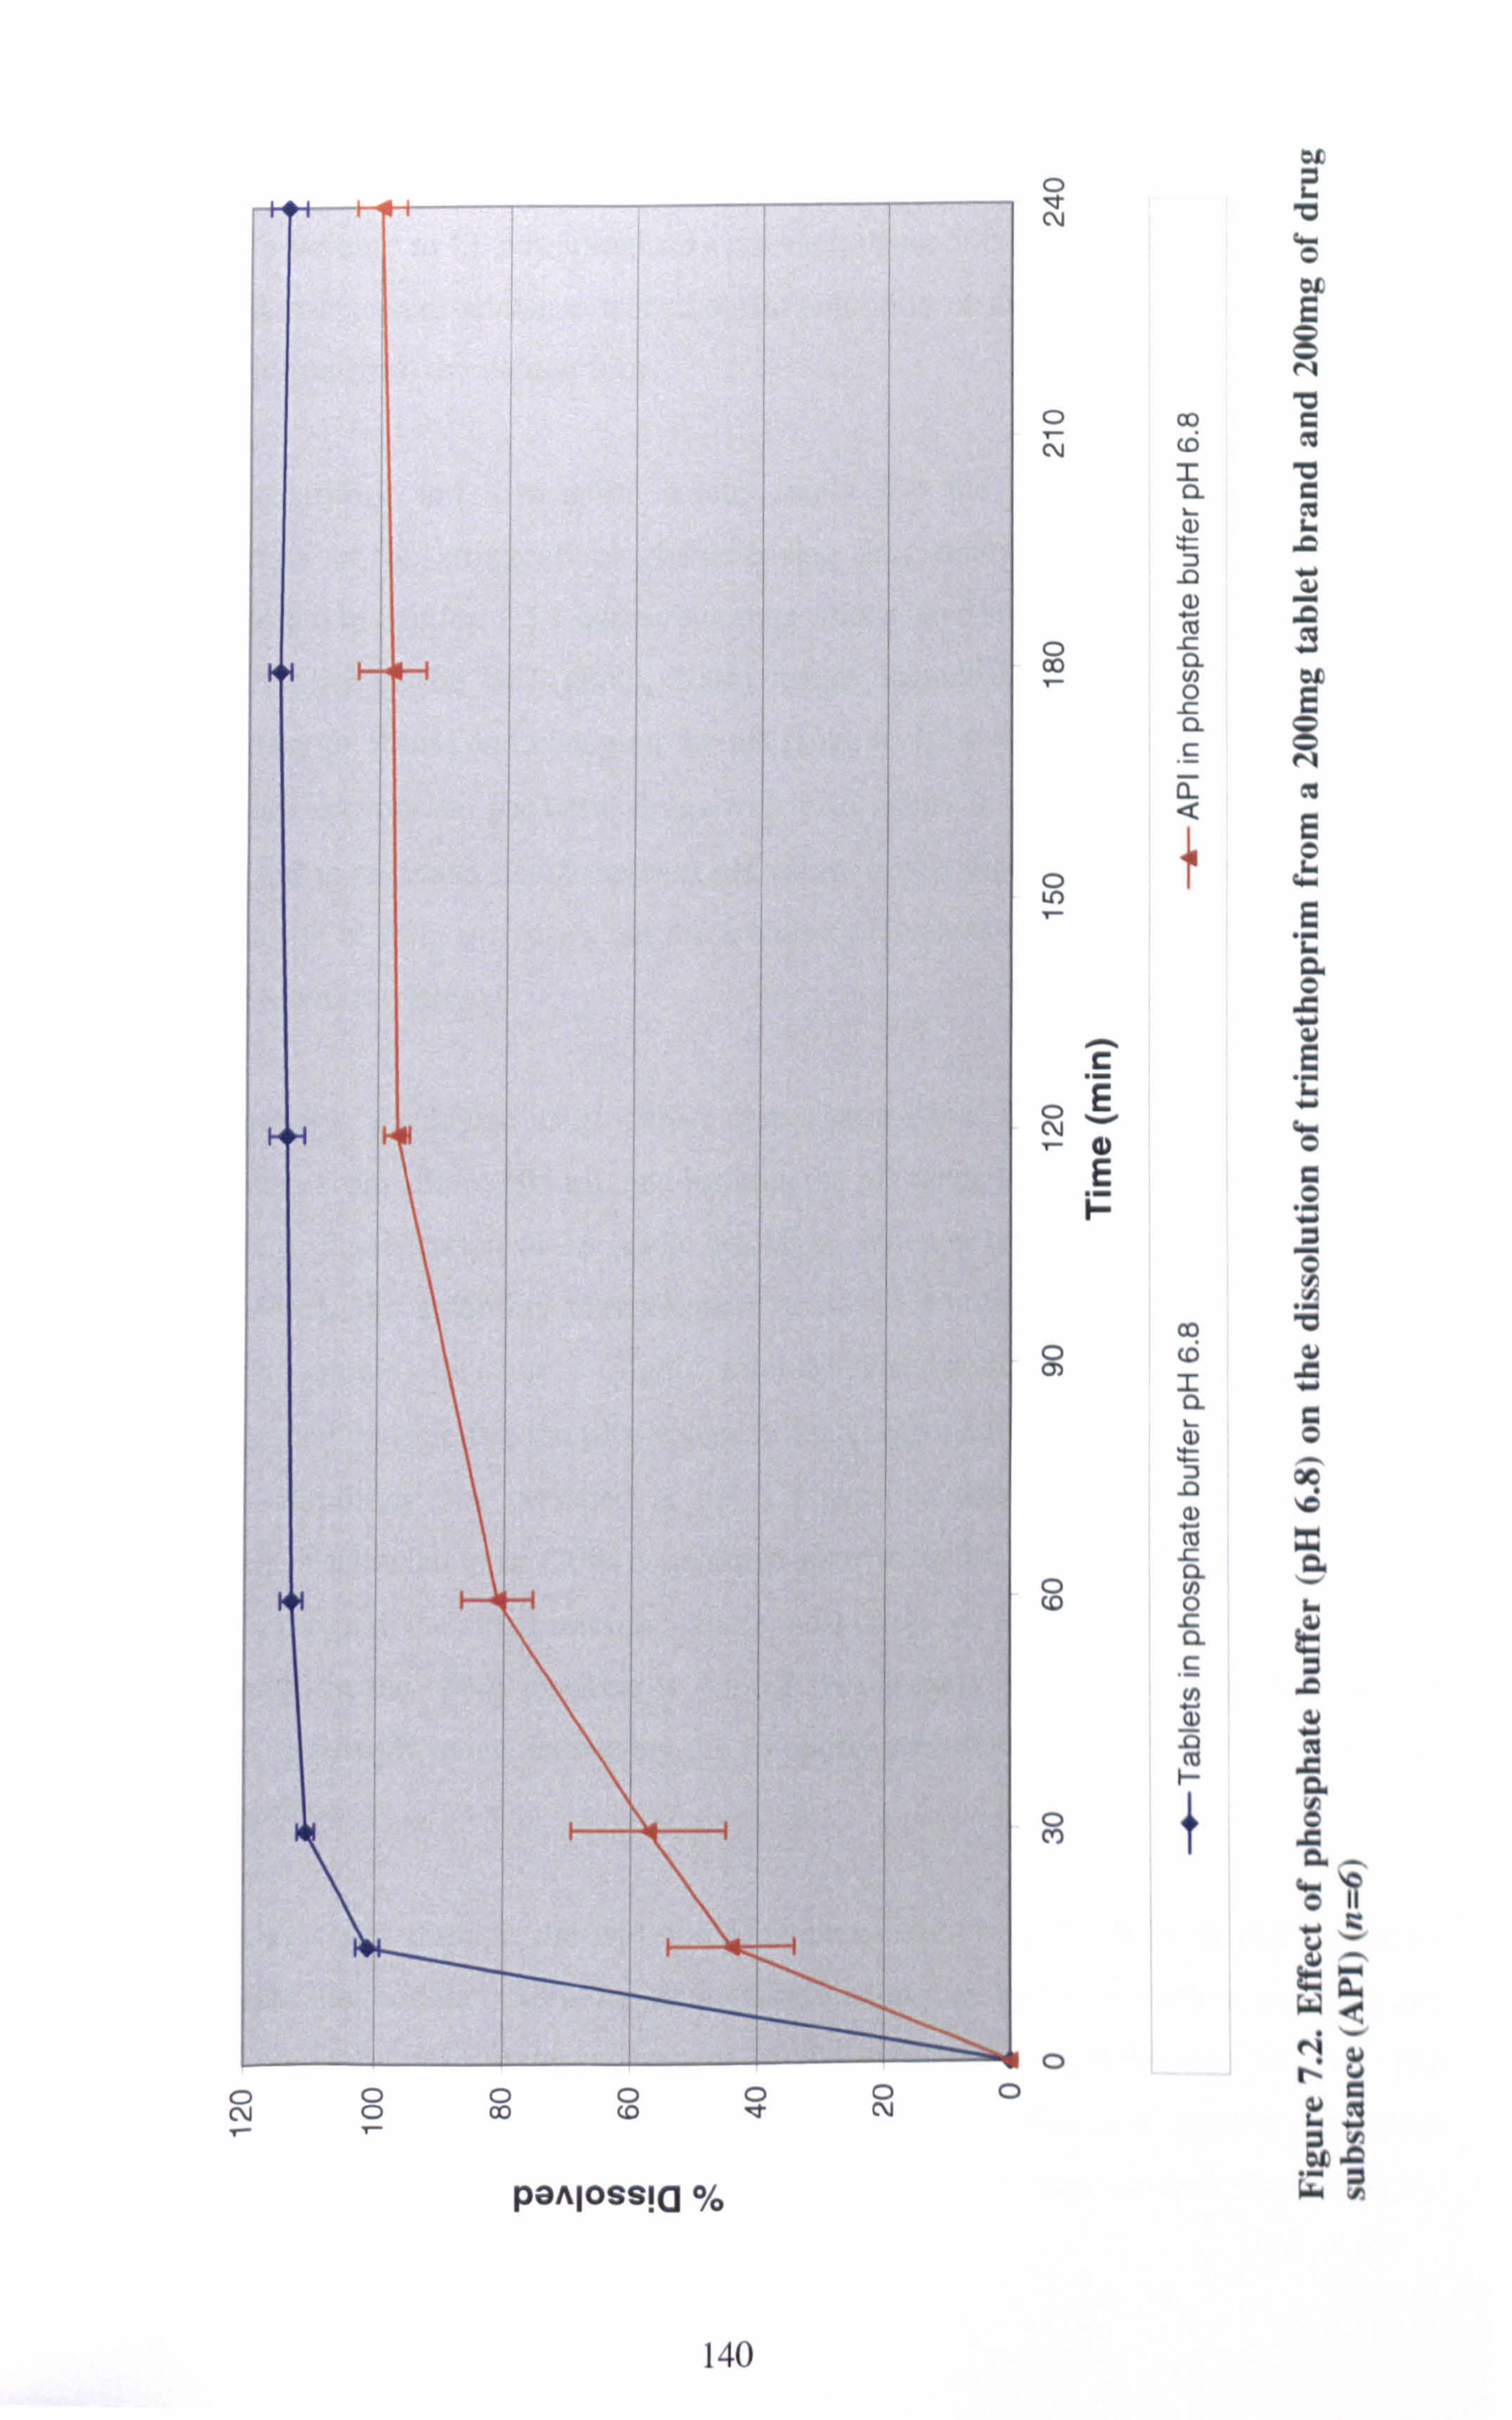
T Z£
CD ý
N "Ci
aio E
o co r_ rý rri CC w
'O c ý ` ý ý a ý
0Lý 00 ý u
E
c.
ýL
a 0 s ý cE
CD .. ýdö Ec
0 ý D
Ö ý
'Ö
Qý) cZ
w C O ý. 00 146 x a
o cn - 0 ý, (0
ý 7 ý a ... w r
ý c. °+s
ö Ii
u u^ WQ
....
C N ý
0 0 T
O CO 0 co
panJossia %
0 It
0 N 0
Ny nv
ýC 2L
ý
ý G_ý y
ýH
140

Based on the dose: solubility ratios (Table 7.1), if it was argued that 1000 mL was too
large a volume to be physiologically relevant, using 500 mL as the dissolution volume
would still ensure adequate trimethoprim solubility at pH 6.8 so as not to limit drug
dissolution from the dosage form.
The solubility and dissolution results imply that the BCS solubility classification
boundary is too stringent for characterising drug dissolution behaviour. As already
mentioned in Section 1.5.1, numerous suggestions have been put forward to improve the
applicability of the BCS (Polli, 2004), which include increasing the solubility class
boundary to 500m1 and changing the pH range to 1.2-6.8. A narrower pH range would
be more appropriate for basic drugs with pKa values z 7.0. Drug solubility would be
expected to decrease significantly at pH values higher than the pKa when the unionised
proportion of drug increases, but these higher pH values are unlikely to be experienced
in the small intestine.
Conversely, Yazdanian et al (2004) demonstrated that increasing the solubility class boundary from 250 to 500 mL and limiting the pH range to 1.2. -6.8 had little impact on
the BCS classification of 15 acidic NSAIDs. When only the solubility at pil 7.4 was
considered, the solubility classification of all 15 compounds changed from Class 11
(poorly soluble) to Class I (highly soluble). The results of these workers were not
unexpected considering the pKa values of the compounds studied were ; -> 3.5. The poor drug solubilities that persisted at pH 1.2 required dissolution volumes > 500 niL. Instead, Yazdanian el al (2004) suggested narrowing the p1l range to 5.0-7.4, which is
the pH range in the small intestine where most drugs are absorbed. The widely accepted
pH range in the small intestine is 4.5-6.8. For weakly basic compounds having pKa
values in this pH range, increasing the solubility class boundary to 500 niL may still be
appropriate.
It has emerged through the widespread implementation of the ICS in pharmaceutics
research, that certain criteria for drug classification may be too restrictive resulting in a
physiologically inaccurate assessment of the predicted drug behaviour in vivo. The
increasing amount of experimental data to exemplify this and general consensus
amongst pharmaceutical scientists lends support for future proposed amendments by the
141

FDA to extend the applicability of the BCS through scientifically justified changes to the criteria. This will facilitate regulatory implementation of the BCS in the
pharmaceutical industry to apply for biowaivers after SUPAC and for new generic
products, which at present is not preferred to in vivo bioequivalence studies due to lack
of certainty in regulatory outcome.
7.4. Conclusion
It was not feasible to continue the study with trimethoprim owing to its high solubility
resulting in a low discriminating power for dissolution differences in various media. The classification of trimethoprim as a BCS Class II compound is inappropriate based
on its solubility and dissolution behaviour at physiologically relevant pHs. Recognition
should be given to this during solubility class determinations of basic drugs with pKa
values >_ 7. Increasing the dose: solubility ratio from 250 mL to 500 mL for the solubility
class boundary and/or narrowing the pH range from 1.2-6.8 may provide a more
accurate classification for these types of compounds.
142

8. GENERAL DISCUSSION
8.1. Dissolution testing in physiological conditions
Dissolution testing has received a lot of attention in recent years as its role has
shifted from a simple quality control tool to a more predictive test for in vivo
performance. Drug dissolution from oral dosage forms depends not only on the
inherent drug and excipient/formulation properties but also on the physiological
conditions in the GIT such as the presence of food, gastric motility, transit time, pH,
buffer capacity, osmolality, surface tension, viscosity and liquid volume. These
combined physiological factors are assessed during pharmacokinetic studies in
fasted and in fed healthy human subjects. However, if an IVIVC could be
established between drug dissolution from the dosage form and absorption, it would
reduce the size, number and therefore cost of human studies required to select an
appropriate candidate drug product through more accurate preclinical in vitro
dissolution tests. A crucial factor to correctly predict in vivo performance using
dissolution tests is to employ a physiologically relevant dissolution medium.
Various workers have investigated a range of dissolution media such as milk (Machcras et al., 1986; Macheras et al., 1987; Macheras et al., 1989; Galia et al., 1998), nutritional liquid meals and lipid emulsions (Ashby el al., 1989; Buckton et
al., 1989) and fasted and fed state simulated intestinal fluids (Dressman et al., 1998)
in an attempt to identify those which were more physiologically relevant. This
evolution of biorelevant in vitro dissolution testing media was the main driver for
the investigations of this research project. The aim was to extend the development of
such media by evaluating more fully the variables affecting in vitro dissolution of
oral dosage forms such as surface tension, presence of meal (milk), reduced volume
and pH. These effects were investigated to evaluate whether they originated from an interaction between the medium components and the drug and/or the formulation
excipients,
143

The need to develop biorelevant dissolution test conditions was further emphasiscd by the regulatory introduction of the BCS and the biowaver concept for SUPAC and
generic products (ANDAs), where in vitro dissolution tests could be used as a
surrogate for in vivo bioequivalence studies for rapidly dissolving Class I drugs.
Although the current BCS biowaver criteria require dissolution data in media having
pHs 1.2,4.5 and 6.8, the use of more accurate biorelevant media is a future prospect,
particularly if biowavers were to be extended to Class II drugs. In consideration of
proposed biorelevant media, the in vitro dissolution discriminating ability of FaSSIF
for three loratadine tablet products was demonstrated in this work (Figure 6.6), of
which the in vivo significance requires bio-data.
8.2. Surface tension considerations of dissolution media
A key variable that needs to be measured when comparing different dissolution
media is the surface tension. Differences in surface tension between media can
potentially be the cause of changes in drug dissolution through altered wetting
phenomena and result in inaccurate deductions regarding the effect of media
components. Thus the surface tension of the media investigated in this project were
measured in Chapter 3 and were borne in mind during interpretations of the data
generated.
The surface tensions of FaSSIF and FeSSIF (46-49mN/m) were considerably higher
than that of the comparable synthetic surfactant media (27-35mN/m). Except for the
CTAB 1.82mg/mi medium, the concentrations of these synthetic surfactant media
were below their cmc values. Consequently, drug dissolution into these media was
attributed to improved wetting rather than solubilisation as is considered the case in
FaSSIF and FeSSIF. This has important implications in trying to find cheaper
synthetic alternatives to the proposed biorelevant media containing bile salts and lecithin. If drug dissolution is influenced by a different process (i. e. wetting versus
solubilisation) in the replacement media, then the altered media may not accurately
represent in vivo behaviour or correctly discriminate between differences in product
144

performance. This issue could possibly be addressed if the synthetic surfactants
utilised had similar structures and micelle forming characteristics to NaTC and lecithin.
8.3. Dissolution of ibuprofen and naproxen tablets in milk-based
media
The use of milk-based media to investigate the dissolution of poorly soluble acidic drugs (Chapter 4 and 5) revealed some interesting phenomena. The work highlighted that the effect of a milk protein, casein, on the dissolution performance
of the ibuprofen and naproxen tablets tested was associated with an interaction with
the formulation excipients. For naproxen, enhanced drug solubility in milk media
also played a role.
Most excipients for oral dose formulations are characterised according to their
applicable physical and chemical properties, stability and incompatibilities in the
relevant literature (for example, Rowe et al., 2003). Formulators can also consult the FDA's Inactive Ingredient Database, which lists the maximum amounts of inactive
substances permitted for a particular dosage form and route based on FDA approved drug products. However, there is limited data available regarding food-excipient
interactions, particularly for excipients typically used in IR oral dosage forms. For
this reason, excipients need to be screened not only for toxicity and drug interaction
but also for their interaction with major food components (e. g. dietary proteins, lipids and carbohydrates) and physiological secretions (e. g. bile salts, phospholipids
and enzymes) if in vitro dissolution testing is to be used as a predictive tool for ill vivo product performance.
145

8.4. Loratadine dissolution
Anecdotal evidence suggests it is not uncommon for patients to complain about the lack of effectiveness of loratadine tablets purchased over the counter in relieving
allergic symptoms. Whether this is a pharmacokinetic or pharmacodynamic issue is
a point of debate. The pH-solubility profile for loratadine (Chapter 6) suggests that
a raised stomach pH may hinder drug dissolution and absorption. The p11 in the
stomach may be raised due to individual variation, administration of drugs or the
presence of food. In the latter case, drug absorption may be improved by taking
loratadine in the fasted state.
At present there is no recommendation to patients to take loratadine on an empty
stomach, obviously based on the pharmacokinetic data submitted to regulatory
authorities prior to granting a product licence. Nevertheless, Simons (2002) and Khan et al (2004) have shown high inter-subject variability during pharmacokinetic
studies. Consequently, for a proportion of the population it is possible that loratadine
bioavailability will be poor. For poorly soluble basic drugs with rapidly diminishing
pH-solubility profiles and a risk of precipitation on intestinal transfer, it may improve the treatment outcome if manufacturers recommended a conservative
measure of fasted state dosing.
The differences in the disintegration times and dissolution profiles of the three brands of loratadine tablets (Chapter 6) emphasize that caution should be exercised if using `similar' generic products for these types of investigations because of the
variability in manufacturing formulae and process controls, both of which are not
often released by the manufacturer. In such a situation, it can prove difficult to isolate formulation variables responsible for certain effects seen during in vitro testing. More insight into formulation based dissolution differences in biorelevant
media would be acquired if the dosage form were manufactured in-house. Being
able to alter controllably the excipients, concentrations and processes in response to dissolution data would enable the identification of problem excipients that may interact with food and/or physiological components and allow the formulation of more robust products.
146

8.5. Development of biorelevant intestinal dissolution media
The higher loratadine solubility in FaSSIF and FeSSIF in Chapter 6, compared to
the individual component media, illustrated the importance of phospholipids in
forming mixed micelles with NaTC and the higher solubilising capacity of these
mixed micelles. However, FeSSIF is not truly representative of the fed state
environment although it contains physiological concentrations of bile salt and lecithin, which are believed to be the major components affecting drug dissolution
through solubilisation. To represent the fed state more accurately, meal components
such as digested lipids, proteins and carbohydrates need to be included in FeSSIF.
In addition, it is important to note that lecithin-bile salt mixed micelles are involved
in dietary lipid solubilisation. Thus, in the presence of digested lipid in FeSSIF, the
proportion of the formed mixed micelles available for drug solubilisation may
change. Also, the presence of meal components in FeSSIF may affect the
composition, nature and solubilising capacity of the mixed micelles or the kinetics
of their formation, resulting in changes in the in vitro dissolution profile, which may
actually be a closer correlation to the in vivo occurrence.
8.6. Solubility categorization of drugs in the BCS
Based on the trimethoprim discussion in Chapter 7 and references therein, the I3CS
solubility classification criteria should be used with appropriate caution if adopted in
the drug development stages so as not to exclude promising candidates erroneously. The BCS was essentially developed as a regulatory tool to aid the review process and accordingly incorporates stringent specifications. Nonetheless, it can be argued that the criteria for placing drugs in a solubility class are not justified for the
prediction of in vivo performance.
It is well known for ionisable drugs that the p1i of the medium and the pKa of the drug will influence solubility. At present the BCS requires solubility data throughout
147

the pH range 1.2-7.5 and dissolution data at pH values of 1.2.4.5, and 6.8,
regardless of whether the drug is acidic or basic. For biorelevancc, increasing the
solubility class boundary to 500ml and changing the pH range to 1.2-6.8 may be
appropriate for basic drugs. For acidic drugs, increasing the solubility class boundary to 500 ml and changing the pH range to 4.5-6.8 may be appropriate if it
can be justified that the drug in question has the most significant absorption in the intestine and dissolution and absorption in the stomach is not critical to the
pharmacokinetics. Hence, it is proposed that two separate solubility and dissolution
criteria should be applicable in the BCS for acidic and basic ionisable drugs
reflecting in vivo drug dissolution more realistically.
148

9. GENERAL CONCLUSIONS AND FUTURE WORK
9.1. General Conclusions
The utilisation of milk-O. IN HCL mixtures as biorelevant gastric dissolution media led to some interesting findings during the solubility, disintegration, dissolution and IDR investigations of ibuprofen and naproxen. This work has identified casein, the
major bovine milk protein, as a food component that may increase the dissolution of ibuprofen and naproxen from tablet formulations during residence in a fed state
stomach environment. The effect was attributed to an interaction of casein with the formulation excipients, which requires further elucidation. These findings have
demonstrated that the use of more complex, alternative dissolution media to
represent realistic gut conditions has the potential to reveal changes in product dissolution performance that may occur in vivo and alter the previously predicted bioavailibility. Hence the elucidation of interactions between food constituents and formulation excipients will enable the development of more robust oral dose
products. Furthermore, the inclusion of meal components into in vitro dissolution
testing media will provide more accurate dissolution data and improve IVIVCs. The
physicochernical properties of the medium such as pH, buffer capacity, osmolality,
surface tension and viscosity will also influence drug dissolution from oral dosage
forms and must be representative of physiological conditions.
Oral absorption of poorly soluble basic drugs can potentially be problematic if
precipitation occurs on transit to the small intestine- a major site for drug absorption.
pH-solubility profiles and in vitro pH-shift dissolution experiments can be useful to
predict such problems if the media used are physiologically representative. At
present simple buffer systems are used and more biorelevant conditions need to be
applied to account for factors such as in vivo solubilisation by bile salts. However,
the inclusion of synthetic surfactants in the gastric phase of a p11-shift experiment
may affect the results.
149

Anionic (SDS) and cationic (CTAB) synthetic surfactants were found to be better
solubilisers of loratadine than the neutral and zwitterionic surfactants for the future
development of more cost effective media to replace the proposed biorelevant
media. Loratadine dissolution profiles in FaSSIF and FeSSIF were successfully
matched using SDS and CTAB based media for one tablet brand but the correlation did not hold when the tablet brand was replaced. The solubilisation behaviour of FaSSIF, FeSSIF, SDS and CTAB media was highly specific for the product under
test suggesting that drug solubilisation was sensitive to formulation factors. Hence,
if these surfactant media were to be used to replace biorelevant media, any formulation and process changes would require adjustment of the surfactant
concentrations to re-match the dissolution profiles in the biorelevant media.
Whilst FeSSIF is representative of the physiological bile salt and phospholipid
concentrations it needs to be developed further to mimic the fed state. In particular,
it lacks food constituents that could affect drug dissolution and solubilisation. The
addition of monoglycerides, digested proteins, carbohydrates and pancreatin would be appropriate.
The solubility criteria for categorization of drugs into the BCS have received
considerable comment in literature and in this project. The FDA is reviewing
suggestions from industry and future changes to the classification are imminent.
9.2. Recommendations for Future Work
> The present research highlighted interactions of casein with the excipients
used in the ibuprofen and naproxen tablets. These interactions require further
investigation through analysis of solid and liquid mixtures of casein with the individual excipients using methods such as DSC and NMR
150

> Ensure Pluse with 0.45% pectin has been reported to adequately match fed
state stomach after administration of the FDA standard breakfast (Klein et
aL, 2004). It would be useful to investigate excipient and drug interactions
with this medium that could affect drug release and dissolution in clinical
trial subjects. Taking into account that the FDA breakfast has been criticiscd for not being representative of the daily breakfast consumed by many
populations, the utility of media matched to this breakfast may be
compromised. Although milk composition can suffer from natural
variability, the general population consumes it whereas only specific patient
groups use nutritional liquid meals such as Ensure Plus. It is advocated to
develop a biorelevant milk medium by addition of physiological
concentrations of pepsin, bile salts refluxed from the intestine and pectin to
adjust the viscosity of the medium. Other physicochemical factors such as
pH and surface tension should also be considered.
> The pH-shift dissolution experiments for poorly soluble basic drugs carried
out thus far usually involve simple buffer media. The use of more biorelevant media in both the gastric and intestinal phases of such a test
would provide a more accurate prediction of in vivo dissolution behaviour.
> None of the synthetic surfactants commonly used in the pharmaceutical industry have structures similar to those of bile salts. Hence, the nature and
extent of interactions between bile salts and drugs/excipients may not be
adequately represented by surrogate surfactant media. For this reason, less
expensive compounds with similar structures to taurocholate need to be
screened for their use in biorelevant media. Furthermore, micelle formation
and drug solubilisation phenomena in these physiological and synthetic
surfactant environments need to be explored using light scattering methods, NMR, TRFQ and SANS.
¢ The dissolution data acquired in FeSSIF needs to be compared to dissolution
data in a modified FeSSIF medium containing monoglycerides, digested
proteins, carbohydrates and pancreatin.
151

> Overall, the in vitro dissolution tests suggested above need to be assessed for
their biorelevance through in vivo studies where the pharmacokinetic data
could be used to derive IVIVCs.
152

REFERENCES
Abrahamsson B, Albery T, Eriksson A, Gustafsson I& Sjoberg M. (2004). Food effects
on tablet disintegration. European Journal of Pharmaceutical Sciences 22,165-
172.
Aiache JM, Pierre N, Beyssac E, Prassad VK & Skelly JP. (1989). New results of an in
vitro model for the study of the influence of fatty meals on the bioavailability of theophylline controlled-released formulations. Journal of Pharmaceutical
Sciences 78,261 - 263.
Alderman DA. (1984). A review of cellulose ethers in hydrophilic matrices for oral
controlled release dosage forms International Journal of Pharmaceutical
Technology, Production and Manufacture 5,1-9.
Andrieux K, Forte L, Lesieur S, Paternostre M, Ollivon M& Grabielle-Madelmont C.
(2004). Insertion and partition of sodium taurocholate into egg
phosphatidylcholine vesicles. Pharmaceutical Research 21,1505-1516.
Anon. (1997). FIP guidelines for dissolution testing of solid oral products. Joint report
of the section for Official laboratories and Medicines Control Services and the
section of the Industrial Pharmacists of the FIP. Dissolution Technologies 4,5-
14.
Anwar S, Fell JT & Dickinson PA. (2005). An investigation of the disintegration of tablets in biorelevant media. International Journal of Pharmaceutics 290,121-
127.
153

Arleth L, Bauer R, Ogendal LH, Egelhaaf SU, Schurtenberger P& Pedersen JS. (2003).
Growth behavior of mixed wormlike micelles: a small-angle scattering study of the lecithin-bile salt system. Langmuir 19,4096-4104.
Ashby LJ, Beezer AE & Buckton G. (1989). In vitro dissolution testing of oral
controlled release preparations in the presence of artificial foodstuffs. 1.
Exploration of alternative methodology: microcalorimetry. International Journal
of Pharmaceutics 51,245-251.
Atkinson RM, Bedford C, Child KJ & Tomich EG. (1962). Effect of particle size on blood griseofulvin-levels in man. Nature 193,588-589.
Aulton ME. (2002). Chapter 2: Dissolution and solubility. In Pharmaceutics: The
Science of Dosage Fonn Design, 2nd edn, ed. Aulton ME, pp. 15-32. Churchill
Livingstone, London.
Avgoustakis K, Athanasiou A& Georgakopoulos PP. (1992). Effect of helix
characteristics on the dissolution rate of hard gelatin capsules. International
Journal of Pharmaceutics 79,67-69.
Benrraou M, Bales BL & Zana R. (2003). Effect of the nature of the counterion on the
properties of anionic surfactants. 1. Cmc, ionization degree at the cmc and
aggregation number of micelles of sodium, cesium, tetramethylammonium,
tetraethylammonium, tetrapropylammonium, and tetraeutylammonium dodecyl
sulfates. Journal of Physical Chemistry B 107,13432-13440.
Bettinetti GP, Mura P, Giordano F& Setti M. (1992). Thermal behaviour and physicochemical properties of naproxen in mixtures with polyvinylpyrrolidone. Thennochimica Acta 199,165-171.
Beyer W& Smith D. (1971). Unexpected variable in the USP/NF rotating basket dissolution rate test. Journal of Pharmaceutical Sciences 60,2350-2351.
BP. (2004). British Pharmacopoeia 2004. The Stationary Office, London.
154

Brittain HG & Fiese EF. (1999). Chapter 8: Effects of pharmaceutical processing on drug polymorphs and solvates. In Polymorphism in Pharmaceutical Solids, ed. Brittain HG, pp. 331-362. Marcel Dekker Incorporated, New York.
Buckton G, Beezer AE, Chatham SM & Patel KK. (1989). In vitro dissolution testing of
oral controlled release preparations in the presence of artificial foodstuffs. 2.
Probing drug/food interactions using microcalorimetry. International Journal of Pharmaceutics 56,151-157.
Bynum KC & Kraft E. (1999). Analytical performance of a fiber optic probe dissolution
system. Pharmaceutical Technology 23,10.
Carstensen JT. (1974). Chapter 1: Theories of dissolution - single particulate systems. In
Dissolution Technology, ed. Leeson U& Carstensen IT, pp. 1-28. Academy of Pharmaceutical Science, Washington.
Carstensen JT. (2001). Chapter 3: Solubility. In Advanced Pharmaceutical Solids, cd. Carstensen JT, pp. 27-50. Marcel Dekker Inc, New York.
Cartwright AC. (1979). Practical aspects of dissolution testing. Drug Development And
Industrial Pharmacy 5,277-291.
CDER. (1995). Guidance for Industry, immediate release solid oral dosage forms, scale
up and post approval changes, and in vivo bioequivalence documentation. FDA,
USA.
CDER. (1997a). Guidance for Industry, dissolution testing of immediate release oral solid dosage forms. FDA, USA.
CDER. (1997b). Guidance for Industry, extended release oral solid dosage forms, scale up and post approval changes (SUPAC-MR). FDA, USA.
155

CDER. (2000a). Guidance for Industry, bioavailability and bioequivalence studies for
orally administered drug products - general considerations, October 2000 edn. FDA, USA.
CDER. (2000b). Guidance for Industry, waiver of in vivo bioavailability and bioequivalence studies for immediate-release solid oral dosage forms based on a biopharmaceutics classification system, August 2000 edn. FDA, USA.
CDER. (2003). Guidance for Industry, bioavailability and bioequivalence studies for
orally administered drug products- general considerations. FDA, USA.
Chaibundit C, Ricardo N, Crothers M& Booth C. (2002). Micellization of diblock(oxyethylene/oxybutylene) copolymer El1B8 in aqueous solution. Micelle size and shape. Drug solubilization. Langmuir 18,4277-4283.
Charles BG & Mogg GAG. (1994). Comparative in vitro and in vivo bioavailability of
naproxen from tablet and caplet formulations. Biopharmaceutics & Drug
Disposition 15,121-128.
Charman WN, Porter CJH, Mithani S& Dressman JB. (1997). Physicochemical and
physiological mechanisms for the effects of food on drug absorption. Journal of Pharmaceutical Sciences 86,269-282.
Chen LR, Wesley JA, Bhattachar S, Ruiz B, Bahash K& Babu SR. (2003), Dissolution
behavior of a poorly water soluble compound in the presence of Tween 80.
Pharmaceutical Research 20,797-801.
Clarke EGC. (1986). Clarke's Isolation and Identification of Drugs. 2nd echt. Pharmaceutical Press, London.
Cox DC & Furman WB. (1984). Systematic error associated with apparatus 2 of the USP dissolution test V: Interaction of two tableted prednisone formulations with
glass and plastic vessels. Journal of Pharmaceutical Sciences 73,1125-1127.
156
Cox DC, Furman WB & Page DP. (1983). Systematic error associated with apparatus 2
of the USP dissolution test N: Effect of air dissolved in the dissolution medium.
Journal of Pharmaceutical Sciences 72,1061-1064.
Cox DC, Wells CE, Furman WB, Savage TS & King AC. (1982). Systematic error
associated with apparatus 2 of the USP dissolution test II: Effects of deviations
in vessel curvature from that of a sphere. Journal of Pharmaceutical Sciences
71,395-399.
Danckwerts PV. (1951). Significance of liquid-film coefficients in gas absorption. Industrial and Engineering Chemistry 43,1460-1467.
Davies NM. (1998). Clinical pharmacokinetics of ibuprofen. The first 30 years. Clinical
Pharmacokinetics 34,101-154.
Davies NM & Anderson KE. (1997). Clinical pharmacokinetics of naproxen. Clinical
Pharmacokinetics 32,268-293.
Degenhardt OS, Waters B, Rebelo-Cameirao A, Meyer A, Brunner H& Told NP.
(2004). Comparison of the effectiveness of various deaeration techniques.
Dissolution Technologies 11,6-11.
Diebold SM & Dressman JB. (1998). Dissolved oxygen as a measure for de- and
reaeration of aqueous media for dissolution testing. Pharmazeutische iudustrie
60,354-359.
Dressman JB, Amidon GL, Reppas C& Shah VP. (1998). Dissolution testing as a
prognostic tool for oral drug absorption: immediate release dosage forms.
Pharmaceutical Research 15,11-22.
Dyas AM & Shah UU. (2006). Dissolution and Dissolution Testing. In Press. In
Encyclopedia of Pharmaceutical Technology. Marcel Dekker, Incorporated,
New York.
157

Efentakis M& Dressman JB. (1998). Gastric juice as a dissolution medium: Surface
tension and pH. European Journal of Drug Metabolism and Pharmacokineties
23,97-102.
EP. (2001). European Pharmacopoeia 2001,5 edn. Directorate for the quality of
medicines of the Council of Europe, 67075 Strasbourg Cedex, France.
Farrell HM, Pessen H, Brown EM & Kamoskinski TF. (1990). Structural insights into
the bovine casein micelle: Small angle X-ray scattering studies and correlations
with spectroscopy. Journal of Dairy Science 73,3592-3601.
Fell JT & Mohammad HAH. (1995). The wetting of powders by bile salt solutions and
gastric juice. International Journal of Pharmaceutics 125,327-330.
Fincher JH. (1968). Particle size of drugs and its relationship to absorption and activity. Journal of Pharmaceutical Sciences 57,1825-1835.
Finholt P. (1974). Chapter 4: Influence of formulation on dissolution rate. In
Dissolution Technology, ed. Leeson LJ & Carstensen JT, pp. 106-146. Academy
of Pharmaceutical Science, Washington.
Finholt P& Solvang S. (1968). Dissolution kinetics of drugs in human gastric juice - the
role of surface tension Journal of Pharmaceutical Sciences 57,1322-1326.
Fini A, Fazio G&GF. (1995). Solubility and solubilisation properties of non-steroidal
anti-inflammatory drugs. International Journal of Pharmaceutics 126,95-102,
Florence AT & Atwood D. (1988a). Chapter 2. Properties of the solid state. In
Physicochemical Principles of Pharmacy, 2nd edn, pp. 21-41. Macmillan Press
Ltd, London.
Florence AT & Atwood D. (1988b). Chapter 6. Surfactants. In Physicochemical
Principles of Phannacy, 2nd edn, pp. 199-224. Macmillan Press Ltd, London.
158

Florence AT & Salole EG. (1976). Changes in crystallinity and solubility on
comminution of digoxin and observations on spironolactone and oestradiol. Journal of Pharmacy & Pharmacology 28,637-642.
Ford JL & Rajabi-Siahboomi AR. (2002). Dissolution and Dissolution Testing. In
Encyclopedia of Pharmaceutical Technology, pp. 717-728. Marcel Dekker.
Ford JL, Rubinstein MH, McCaul F, Hogan JE & Edgar PJ. (1987). Importance of drug
type, tablet shape and added diluents on drug release kinetics from
hydroxypropylmethylcellulose matrix tablets. International Journal of Pharmaceutics 40,223-234.
Fox PF & McSweeney PLH. (1998a). Chapter 2. Lactose. In Dairy Chemistry and Biochemistry, pp. 21-39. Blackie Academic and Professional, London.
Fox PF & McSweeney PLH. (1998b). Chapter 11. Physical properties of milk. In Dairy
Chemistry and Biochemistry, pp. 437-461. Blackie Academic and Professional,
London.
Galia E, Nicolaides E, Horter D, Lobenberg R, Reppas C& Dressman JB. (1998).
Evaluation of various dissolution media for predicting in vivo performance of
class I and II drugs. Pharmaceutical Research 15,698-705.
Ganderton D. (1969). The effect of distribution of magnesium stearate on the
penetration of a tablet by water. Journal of Pharmacy and Pharmacology
21(Suppl), 9S-18S.
Goehl TJ, Sundarasen GM & Prasad VK. (1983). Studies of the dissolution
characteristics of norethindrone-mestranol tablets. International Journal of Pharmaceutics 115,15 - 123.
Grant DJW. (1999). Chapter 1. Theory and origin of polymorphism. In Polymorphism
in Pharmaceutical Solids, ed. Brittain HG, pp. 1-34. Marcel Dekker
Incorporated, New York.
159

Gray VA. (2003). Dissolution testing using fiber optics -a regulatory perspective.
American Pharmaceutical Review 6,26-30.
Gray VA, Brown CK, Dressman JB & Leeson LJ. (2001). A new general information
chapter on dissolution. Pharmacopeial Forum 27,3432-3439.
Griffiths PC, Cheung AYF, Farley C, Paul A, Heenan RK, King SM, Pettersson E,
Stilbs P& Ranganathan R. (2004). Small-angle neutron scattering, electron
paramagnetic resonance, electrophoretic NMR and time-resolved fluoresccncc
quenching studies of sodium dodecyl sulphate and tetra(ethylene oxide) dodecyl
ether mixed surfactant micelles. Journal of Physical Chemistry B 108,1351-
1356.
Gu CH, Rao D, Gandhi RB, Hilden J& Raghavan K. (2005). Using a novel
multicompartment dissolution system to predict the effect of gastric pH on the
oral absorption of weak bases with poor intrinsic solubility. Journal of
Pharmaceutical Sciences 94,199-208.
Haleblian JK, Koda RT & Biles JA. (1971). Comparison of dissolution rates of different
crystalline phases of fluprednisolone by in vitro and in vivo methods. Journal of
Pharmaceutical Sciences 60,1488-1491.
Hanson WA. (1991a). Chapter 1: Overall considerations. In Hanbook of Dissolution
Testing, 2nd edn, pp. 1-12. Aster Publishing Corporation, Oregon.
Hanson WA. (1991b). Chapter 3: Dissolution methods for solid dosage forms. In
Handbook of Dissolution Testing, 2nd edn, pp. 27-52. Aster Publishing
Corporation, Oregon.
Hanson WA. (1991c). Chapter 5: Controlling variables. In Handbook of Dissolution
Testing, 2nd edn, pp. 69-92. Aster Publishing Corporation, Oregon.
160

Hanson WA. (1991d). Chapter 6: Setting up for dissolution testing. In Handbook of Dissolution Testing 2nd edn, pp. 93-110. Aster Publishing Corporation Oregon.
Heyman E, Bleakley HG & Docking AR. (1938). Studies on the lyotropie series. Journal of Physical Chemistry 42,353-368.
Higuchi T. (1963). Mechanism of sustained action medication: Theoretical analysis of
rate of solid drugs dispersed through solid matrices. Journal of Pharmaceutical
Sciences 52,1145-1149.
Higuchi T& Zuck DA. (1952). Solubilizing action of caffeine on benzoic acid. Journal
of the American Phannaceutical Association 41,10-13.
Higuchi T& Zuck DA. (1953). Investigation of some complexes formed in solution by
caffeine. II. Benzoic acid and benzoate ion. Journal of the American
Pharmaceutical Association 42,132-138.
Higuchi WI. (1962). Analysis of data on the medicament release from ointments. Journal of Pharmaceutical Sciences 51,802-804.
Higuchi WI. (1967). Diffusional models useful in biopharmaceutics. Journal of Pharmaceutical Sciences 56,315-324.
Hixson AW & Crowell JH. (1931). Dependence of reaction velocity upon surfacc and
agitation I. Theoretical consideration. Industrial and Engineering Chemistry 23,
923-931.
Horter D& Dressman JB. (2001). Influence of physicochemical properties on dissolution of drugs in the gastrointestinal tract. Advanced Drug Delivery
Reviews 46,75-87.
Hussain MSH, York P& Timmins P. (1992). Effect of commercial and high purity
magnesium stearates on in-vitro dissolution of paracetamol. International
Journal of Pharmaceutics 78,203-207.
161

Jensen RG, Blanc B& Patton S. (1995). Chapter 2. The structure of milk: implications
for sampling and storage. B. Particulate constituents in human and bovine milks
In Handbook of Milk Composition, ed. Jensen RG, pp. 50-62. Academic Press,
California.
Kanfer I. (2002). Report on the International Workshop on the Biopharmaceutics
Classification System (BCS): scientific and regulatory aspects in practice.
Journal of Pharmacy and Pharmaceutical Sciences 5,1-4.
Kaplan SA. (1974). Chapter 6: Biological implications of in vitro dissolution testing. In
Dissolution Technology, ed. Leeson LJ & Carstensen JT, pp. 163 -186 Academy
of Pharmaceutical Science, Washington.
Keenan TW & Patton S. (1995). Chapter 2: The Structure of Milk: Implication for
Sampling and Storage In Handbook of Milk Composition, ed. Jensen RG, pp. 16-
44. Academic Press, California.
Khan MZI, Rausl D, Zanoski R, Zidar S, Mikulcic J, Krizmanic L, Eskinja M, Mildner
B& Knezevic Z. (2004). Classification of loratadine based on the
biopharmaceutics drug classification concept and possible in vitro-in vivo
correlation. Biological and Pharmaceutical Bulletin 27,1630-1635.
Kingsford M, Eggers NJ, Soteros G, Maling TJB & Shirkey RI. (1984). An in vivo - in
vitro correlation for the bioavailability of frusemide tablets. Journal of Pharmacy and Pharmacology 36,536 - 538.
Klein S, Butler J, Hempenstall JM, Reppas C& Dressman JB. (2004). Media to
simulate the postprandial stomach I. Matching the physicochemical
characteristics of standard breakfasts. Journal of Pharmacy and Pharmacology
56,605-610.
162

Klepser ME, Zhu Z, Nicolau DP, Banevicius MA, Belliveau PP, Ross JW, Broisrnan L.
Quintiliani R& Nightingale CH. (1996). Oral absorption of trimcthoprim-
sulfamethoxazole in patients with AIDS. . Pharmacotherapy 16,656-662.
Kostewicz E, Wunderlich M, Brauns U, Becker R, Bock T& Dressman JB. (2004).
Predicting the precipitation of poorly soluble weak bases upon entry in the small intestine. Journal of Pharmacy and Pharmacology 56,43-51.
Kreutzwald P, Paavo M& Veski P. (2005). Using of the different increasing pH
methods for dissolution test of modified release formulations. European Journal
of Pharmaceutical Sciences 25, S 137-S 139.
Laakso R, Kristofferson E& Marvola M. (1984). Bi-exponential first-order release kinetics of indomethacin from tablets containing polysorbate 80. international
Journal of Phannaceutics 19,35 -42.
Lai TY & Carstensen JT. (1978). Effect of shape factor on cube root dissolution
behavior. International Journal of Pharmaceutics 1,33 - 40.
Lathia CD & Banakar UV. (1986). Advances in dissolution technology: Design, pros
and cons. Drug Development And Industrial Pharmacy 12,71-105.
Leng J, Egelhaaf SU & Cates ME. (2003). Kinetics of the micelle-to-vesicle transition:
aqueous lecithin-bile salt mixtures. Biophysical Journal 85,1624-1646,
Lennernas H& Abrahamsson Bi. (2005). The use of biopharmaceutic classification of drugs in drug discovery and development: current status and future extension, Journal of Pharmacy and Pharmacology 57,273-295.
Lerk CF, Bolhuis GK, Smallenbroek AJ & Zuurman K. (1982). Interaction of tablet disintegrants and magnesium stearate during mixing II: effect on dissolution
rate. Pharmaceutica Acta Helvetiae 57,282-286.
163

Levich VG. (1962). Chapter 2: Convective diffusion in liquids. In Physicochenjical
Hydrodynamics, 2nd edn, pp. 39-136. Prentice-Hall, Incorporated, New Jersey,
Levine MA, Walker SE & Paton TW. (1992). The effect of food or sucralfate on the
bioavailability of S(+) and R(-) enantiomers of ibuprofen. Journal of Clinical
Pharmacology 32,1110-1114.
Levy G& Gumtow R. (1963). Effect of certain formulation factors on dissolution rate
of the active ingredient III: tablet lubricants. Journal of Pharmaceutical Science
52,1139-1144.
Levy G& Hayes BA. (1960). Physicochemical basis of the buffered acetylsalicylic
acid controversy. New England Journal of Medicine 262,1053 - 1058.
Levy G& Sahli BA. (1962). Comparison of the gastrointestinal absorption of aluminum
acetylsalicylate and acetylsalicylic acid in man. Jountal of Pharmaceutical
Sciences 51,58-62.
Lindenberg M, Kopp S& Dressman JB. (2004). Classification of orally administered drugs on the World Health Organisation Model list of Essential Medicines
according to the biopharmaceutics classification system. European Journal of Pharmaceutics and Biopharmaceutics 58,265-278.
Lobenberg R& Amidon GL. (2000). Modern bioavailability, biocquivalence and biopharmaceutics classification system. New scientific approaches to international regulatory standards. European Journal of Phannaceutics and Biopharmaceutics 50,3-12.
Loftsson T. (2002). Cyclodextrins and the Biopharmaceutics classification system of drugs. Journal of Inclusion Phenomena and Macrocyclic Chemistry 44,63-67.
Loftsson T& Brewster ME. (1996). Pharmaceutical applications of cyclodextrins . 1, Drug solubilization and stabilization. Journal of Pharmaceutical Sciences 85, 1017-1025.
164

Loftsson T& Masson M. (2004). The effects of water-soluble polymers on
cyclodextrins and, cyclodextrin solubilization of drugs. STP Pharma Sciences 14,
35-43.
Loftsson T, Matthiasson K& Masson M. (2003). The effects of organic salts on the
cyclodextrin solubilization of drugs. International Journal of Pharmaceutics
262,101-107.
Looney TJ. (1996). USP Apparatus 4 (Flow-through method) primer. Dissolution
Technologies 3,10-12.
Looney TJ. (1997). USP Apparatus 4- Applying the Technology. Dissolution
Technologies 4,16-18.
Lowenthal W. (1973). Mechanism of action of tablet disintegrants. Phannaceutica Acta
Helvetiae 48,589-609.
Lu X, Lozano R& Shah P. (2003). In situ dissolution testing using different UV fiber
optic probes and Instruments. Dissolution Technologies 10,6-15.
Luner PE. (2000). Wetting properties of bile salt solutions and dissolution media.
Journal of Pharmaceutical Sciences 89,382-395.
Luner PE, Babu SR & Mehta SC. (1996). Wettability of a hydrophobic drug by
surfactant solutions. International Journal of Pharmaceutics 128,29-44.
Luner PE & VanDer Kamp D. (2001). Wetting characteristics of media emulating
gastric fluids. International Journal of Pharmaceutics 212,81-91.
Macheras P, Koupparis M& Antimisiaris S. (1989). An in vitro model for exploring CR
theophylline-milk fat interactions. International Journal of Pharmaceutics 54,
123-130.
165

Macheras P, Koupparis M& Apostolelli E. (1987). Dissolution of 4 controlled-release
theophylline formulations in milk. International Journal of Pharmaceutics 36,
73-79.
Macheras P, Koupparis M& Tsaprounis C. (1986). Drug dissolution studies in milk
using the automated flow injection serial dynamic dialysis technique.
International Journal of Pharmaceutics 33,125-136.
Magnusdottir A, Masson M& Loftsson T. (2002). Self association and cyclodextrin
solubilization of NSAIDs. Journal of Inclusion Phenomena and Afacrocyclic
Chemistry 44,213-218.
Malmsten M. (2002). Chapter 2: Micelles. In Surfactants and Polymers in Drug
Delivery, pp. 19-50. Marcel Dekker, Incorporated, New York.
Martin CA. (2003). Evaluating the utility of fiber optic analysis for dissolution testing
of drug products. Dissolution Technologies 10,37-39.
Martin W, Koselowske G, Toberich H, Kerkmann T, Mangold B& Augustin J. (1990).
Pharmacokinetics and absolute bioavailability of ibuprofen after oral
administration of ibuprofen lysine in man. Biopharmaceutics and drug
disposition 11,265-278.
Martinez M, Augsburger L, Johnston T& Jones WW. (2002). Applying the
Biopharmaceutics Classification System to veterinary pharmaceutical products Part I: Biopharmaceutics and formulation considerations. Advanced Drug
Delivery Reviews 54,805-824.
Matsudo T, Ogawa K& Kokufuta E. (2003). Complex formation of protein with different water-soluble synthetic polymers. Biomacromolecules 4,1794-1799.
Mcnamara DP, Whitney KM & Goss SL. (2003). Use of a physiologic bicarbonate
buffer system for dissolution characterisation of ionisable drugs.
Pharmaceutical Research 20,1641-1646.
166

Millar FC & Corrigan OI. (1993). Dissolution mechanism of ibuprofen-casein
compacts. International Journal of Pharmaceutics 92,97-104.
Miller R, Makievski AV & Fainerman VB. (2001). Chapter 4: Dynamics of adsorption
from solutions. In Surfactants: Chemistry, Interfacial Properties, Applications,
ist edn, ed. Fainerman VB, Mobius D& Miller R, pp. 339-341. Elsevier,
Amsterdam.
Miqueu C, Satherley J, Mendiboure B, Lachaise J& Graciaa A. (2001). The effect of
P/N/A distribution on the parachors of petroleum fractions. Fluid Phase
Equilibria 180,327-344.
Moore JW & Flanner HH. (1996). Mathematical comparison of dissolution proflcs.
Pharmaceutical Technology 20,64-74.
Naylor LJ, Bakatselou V& Dressman JB. (1993). Comparison of the mechanism of
dissolution of hydrocortisone in simple and mixed micelle systems.
Pharmaceutical Research 10,865-870.
Nernst WZ & Brunner E. (1904). Theorie der reaktionsgeschwindigkeit in heterogenen
Systemen. Physical Chemistry 47,52-102.
Nicolaides E, Hempenstall JM & Reppas C. (2000). Biorelevant Dissolution Tests with
the Flow-Through Apparatus. Dissolution Technologies 7,4-10.
Noyes AA & Whitney WR. (1897). The rate of solution of solid substances in their own
solutions. Journal of the American Chemical Society 19,930-934.
Okada Y, Kubota Y, Koizumi K, Hizukuri S, Ohfuji T& Ogata K. (1988). Some
properties and the inclusion behavior of branched cyclodextrins. Chemical and Pharmaceutical Bulletin 36,2176-2185.
167

Okada Y, Tachibana M& Koizumi K. (1990). Solubilization of lipid-soluble vitamins by complexation with glucosyl- [beta] -cyclodextrin. Chemical and Pharmaceutical Bulletin 38,2047-2049.
Ozturk SS, Palsson BO & Dressman JB. (1988). Dissolution of ionizable drugs in
buffered and unbuffered solutions. Pharmaceutical Research 5,272-282.
Parfitt K. (1999). Trimethoprim. In Martindale The complete drug reference, 32nd edn,
pp. 265-266. Pharmaceutical Press, London.
Parr AF, Beihn RM, Franz RM, Szpunar GJ & Jay M. (1987). Correlation of ibuprofen
bioavailability with gastrointestinal transit by scintigraphic monitoring of 17, Er-
labeled sustained-relcase tablets. Phannaceutical Research 4,486-489.
Penfold J, Tucker 1, Thomas RK, Staples E& Schuermann R. (2005). Structure of mixed anionic/nonionic surfactant micelles: Experimental observations relating to the role of headgroup electrostatic and steric effects and the effects of added electrolyte. Jourval of Physical Chemistry B 109,10760-10770.
Pernarowski M, Woo W& Searl RO. (1968). Continuous flow apparatus for the determination of the dissolution characteristics of tablets and capsules. Journal
of Pharmaceutical Sciences 57,1419 -1421.
Poirier H, Lewis GA, Shott MJ & Stevens HNE. (1983). Problems with a
pharmacopoeia) dissolution test using a binary medium. Drug Derelopment and Industrial Pharmacy 9,443 - 452.
Pohl JE. (2004). Summary workshop report: Biopharmaceutics classification system - implementation challenges and extension opportunities. Journal of Pharmaceutical Sciences 93,1375-1381.
Potthast H, Dressman JB, Junginger HE, Midha KK, Oeser H, Shah VP, Vogelpool H&
D. M. B. (2005). Biowaiver monographs for immediate release solid oral dosage
forms: Ibuprofen. Journal of Pharmaceutical Sciences 94,2121-2131.
168

Proudfoot SG. (1988a). Chapter 8: Introduction to biopharmaceutics. In Pharmaceutics.
The Science of Dosage Form Design, ed. Aulton ME, pp. 131-134. Churchill
Livingston, Edinburgh.
Proudfoot SG. (1988b). Chapter 9: Factors influencing bioavailability: factors
influencing drug absorption from the gastrointestinal tract. In Phannaceutics:
The Science of Dosage Forin Design, ed. Aulton ME, pp. 135-173. Churchill
Livingstone, Edinburgh.
Qiu YH, Garren J, Samara E, Cao G, Abraham C, Cheskin HS & Engh KR. (2003).
Once-a-day controlled-release dosage form of Divaiproex sodium I1:
development of a predictive in vitro drug release method. Journal of Pharmaceutical Sciences 92,2317-2325.
Rasool AA, Hussain AA & Dittert LW. (1991). Solubility enhancement of some water-
insoluble drugs in the presence of nicotinamide and related compounds. Journal
of Pharmaceutical Sciences 80,387-393.
Richards JH. (1988). Chapter 5: Solubility and dissolution rate. In Pharmaceuutics: The
Science of Dosage Form Design ed. Aulton ME, pp. 62-80. Churchill
Livingstone, Edinburgh.
Ringhand HP, Ritschel WA, Meyer HC, Straughn AB & Caban BE. (1983).
Bioavailability of propylthiouracil in humans. Journal of Pharmaceutical
Sciences 72,1409 - 1412.
Rosalia AM, O'Conell JR, Bavitz JF, Restaino FA & Schwartz JB. (1972). Variation in
dissolution data using an apparatus meeting USP-NF requirements. Journal of Pharmaceutical Sciences 61,1638 - 1640.
Rosen MJ. (1989). Surfactants and Interfacial Phenomena. John Wiley and Sons,
Incorporated, New York.
169

Rowe RC, Sheskey PJ & Weller PJ. (2003). Hanbook of Pharmaceutical Excipients.
Pharmaceutical Press, London.
Rubinstein MH. (1988). Chapter 18: Tablets. In Pharmaceutics: The Science of Dosage
Form Design, ed. Aulton ME, pp. 304-321. Churchill Livingstone, Edinburgh.
Saito M, Ugajin T, Nozawa Y, Sadzuka Y, Miyagishima A& Sonobe T. (2002). Preparation and dissolution characteristics of griseofulvin solid dispersions with
saccharides. Intemational Joumal of Pharmaceutics 249,71-79.
Satherley J, Girault HHJ & Schiffrin DJ. (1990). The measurement of ultralow interfacial tension by video digital techniques. Journal of Colloid and Interface
Science 136,574-580.
Savage TS & Wells CE. (1982). Automated sampling of in vitro dissolution medium:
effect of sampling probes on dissolution rate of prednisone tablets. Journal of Pharmaceutical Sciences 71,670-673.
Shah VP. (2004). Role of dissolution testing: Regulatory perspectives. Dissolution
Technologies 11,11.
Shaw TR, Carless JE, Howard MR & Raymond K. (1973). Particle size and absorption
of digoxin. Lancet 2,209-210.
Shefter E& Higuchi T. (1963). Dissolution behavior of crystalline solvated and
nonsolvated forms of some pharmaceuticals. Journal of Pharmaceutical
Sciences 52,781-791.
Simons FER. (2002). Comparative Pharmacology of HI Antihistamincs: Clinical
Relevance. The American Journal of Medicine 113,38S-46S,
Skelly JP, Yamamoto LA, Shah VP, Yau MK & Barr W11. (1986). Topographical dissolution characterisation for controlled release products -a new technique. Drug Development and Industrial Pharmacy 12,1159-1175.
170
Soltero RA, Hover JM, Jones TM & Standish M. (1989). Effects of sinker shapcs an
dissolution profiles. Journal of Pharmaceutical Sciences 78,35 - 39.
Stead JA, Freeman M, John EG, Ward GT & Whiting B. (1985). lit vitro dissolution
medium with supramicellar surfactant. concentration and its relevance for in vil-0
absorption. International Joumal of Pharmaceutics 279 117 - 124.
Sunesen VH, Pedersen BL, Kristensen HG & Mullertz A. (2005). lit vivo-in vitro
correlations for a poorly soluble drug, danazol, using the flow-through
dissolution method with biorelevant dissolution media. European Journal of Pharmaceutical Sciences 24,305-313.
Swaisgood HE. (1995). Chapter 5: Nitrogenous Components of Milk. F: Protein and Amino Acid Composition of bovine milk. In Handbook of Milk Composition,
ed. Jensen RG, pp. 464-467. Academic Press, California.
Tingstad JE & Riegelman SJ. (1970). Dissolution rate studies I: Design and evaluation
of a continuous flow apparatus. Journal of Pharmaceutical Sciences 59,692 - 696.
Tinwalla AY, Hoesterey BL, Xiang TX, Lim K& Anderson BD. (1993). Solubilization
of thiazolobenzimidazole using a combination of p1l adjustment and complexation. with 2-hydroxypropyl-beta- cyclodextrin. Phannaceulical
Research 10,1136-1143.
Tokumura T, Nanba M, Tsushima Y& et a. (1986a). Enhancement of bioavailability of cinnarizine from its [beta] -cyclodextrin complex on oral administration will) DL-phenylalanine as a competing agent. J PHARM SCI 75,391-394.
Tokumura T, Nanba M, Tsushima Y, Tatsuishi K, Kayano M, Machida Y& Nagai T. (1986b). Enhancement of bioavailability of cinnarizine from its beta.
cyclodextrin complex on oral administration with DL-plicnylalanine ai a competing agent. Joumal of Pharmaceutical Sciences 75,391-394.
171

Truelove J, Bawarshi-Nassar R, Chen NR & Hussain A. (1984). Solubility cnhancollent
of some developmental anti-cancer nucleoside analogs by complcxation with
nicotinamide. Intemational Joumal of Pharmaceutics 19,17-25.
USP. (2005). United States Pharmacopoeia 28. The U. S. Pharmacopeia) Convention,
Rockville, MD.
Vertzoni M, Fotaki N, Kostewicz E, Stippler E, Leuner C, Nicolaides E, Dressman JB
& Reppas C. (2004). Dissolution media simulating the intralumenal composition
of the small intestine: physiological issues and practical aspects. Journal of Pharmacy and Pharmacology 56,453 - 462.
Viegas TX, Curatella RU, Van Winkle LL & Brinker G. (2001). Measurement of intrinsic drug dissolution rates using two types of apparatus, Pharmaceutical
Technology 25,44-53.
Wagner JG. (1969). Interpretation of percent dissolved-time plots derived from ill vitro
testing of conventional tablets and capsules. Journal of Phannaceutical Sciences
58,1253-1257.
Wallwork SC & Grant DJW. (1977). Chapter 7: Energy and Equilibrium. In Physical
Chemistry for students of biology and chemistry, 3rd edn, ed. Wallwork SC & Grant DJW, pp. 212-243. Longman, London.
Weast RC, ed. (1976). Handbook of Chemistry and Physics. CRC Press, Ohio.
Wells JI & Aulton ME. (1988). Chapter 13: Preformulation. In Pharnzaccutics: The
Science of Dosage Form Design, ed. Aulton ME, pp. 223-253. Churchill
Livingstone, Edinburgh.
Wells JI & Rubinstein MW. (1976). Importance of generated surface area in tablet
performance. Pharmaceutical Journal 217,629-631.
172

Williams RL, Foster TS, Dressman JB, Shah VP & Gray V. (2004). The future of dissolution testing: USP, Academic, FDA and Industry Perspectives. Dissolution
Technologies 11,6-14.
Williams VR, Mattice WL & Williams HB. (1978). Chapter 4: Solutions of Electrolytes. In Basic Physical Chemistry for the Life Sciences 3rd cdn, ed. Mattice WL & Williams HB, pp. 179-244. W. H. Freeman and Co San
Francisco.
Withey RJ & Bowker AJ. (1972). Agitation of the solvent in tablet dissolution studies - a flow visualization technique. Journal of Pharmacy and Pharmacology 24,
345-351.
Wood JH, Syarto JE & Letterman H. (1965). Improved holder for intrinsic dissolution
rate studies. Journal of Pharmaceutical Sciences 54,1068.
Woodcock BG, Acerbi D, Merz PG, Rietbrock S& Rietbrock N. (1993).
Supermolecular inclusion of piroxicam with beta-cyclodextrin: pharmacokinctic
properties in man. European Journal of Rheumatology and Inflamniation 12,12- 28.
Yazdanian M, Briggs K, Jankovsky C& Hawi A. (2004). The "high solubility' definition of the current FDA guidance on biopharmaccutical classification
system may be too strict for acidic drugs. Pharinacewical Research 21,293-
299.
Yu LX, Carlin AS, Amidon GL & Hussain AS. (2004). Feasibility studies of utilizing disk intrinsic dissolution rate to classify drugs. Liternational Journal of Pharmaceutics 270,221-227.
173

APPENDICES

Appendix 1: Attendance at Conferences and Seminars
1. British Pharmaceutical Conference.
September 2002. Manchester, U. K.
2. British Pharmaceutical Conference.
September 2003. Harrogate, U. K.
3. Biolnternational 2003: Towards harmonisation in bioavailibility and bioequivalence.
October 2003. London, U. K.
4. Faculty of Science Post graduate Research Seminars and Poster Session.
(Chairperson)
March 2004. Liverpool John Moores University, U. K.
5. European Conference on Drug Delivery and Pharmaceutical Technology.
May 2004. Seville, Spain.
6. British Pharmaceutical Conference.
September 2004. Manchester, U. K.
7. Biopharmaceutics Considerations for Oral CR/MR Formulations.
February 2005. London, U. K.
8. AstraZeneca Annual PhD Seminar Session.
September 2005. Alderley Edge, U. K.
9. British Pharmaceutical Conference.
September 2005. Manchester, U. K.
xxviii

Appendix 2: Publications
1. Shah, U. U., Dyas, A. M., Ford, U., Kirk, G. G., Sharma-Singh, G. (2004). The
effect of milk on the dissolution behaviour of ibuprofen and ibuprofen tablets.
Journal of Pharmacy and Pharmacology 56 (Suppl. ), S-76.
2. Shah, U. U., Dyas, A. M., Ford, U., Kirk, G. G., Sharma-Singh, G. (2005).
Determination of the intrinsic dissolution rate of a poorly soluble drug using
fluorescence spectroscopy. Journal of Phannacy and Phannacology 57
(Suppl. ), S-103.
3. Dyas, A. M. and Shah, U. U. (2006) Dissolution and dissolution testing. In
Encyclopaedia of Pharmaceutical Technology. Taylor and Francis Group, New
York. In press.
xxix

Appendix 3: Poster and Oral Presentations
1. The effect of milk on the dissolution of ibuprofen tablets. Shah, U. U., Dyas, A. M., Ford, U., Kirk, G. G., Sharma-Singh, G.
Poster Presentation. European Conference on Drug Delivery and Pharmaceutical
Technology. May 2004, Seville, Spain.
2. The effect of milk on the dissolution behaviour of ibuprofen and ibuprofen
tablets. Shah, U. U., Dyas, A. M., Ford, U., Kirk, G. G., Sharma-Singh, G.
Poster Presentation. British Pharmaceutical Conference. September 2004,
Manchester, U. K.
3. Determination of the intrinsic dissolution rate of a poorly soluble drug using fluorescence spectroscopy. Shah, U. U., Dyas, A. M., Ford, U., Kirk, G. G., Sharma-Singh, G.
Poster Presentation. British Pharmaceutical Conference. Septeniber 2005,
Manchester, U. K.
4. Matching the dissolution of poorly soluble basic drugs in biorelevant media
using synthetic surfactant media. Oral Presentation. AstraZeneca Annual PhD Seminar Session. September 2005,
Alderley Edge, U. K.
xxx