
This thesis has been submitted in fulfilment of the ... - ERA
304
This thesis has been submitted in fulfilment of the requirements for a postgraduate degree (e.g. PhD, MPhil, DClinPsychol) at the University of Edinburgh. Please note the following terms and conditions of use: This work is protected by copyright and other intellectual property rights, which are retained by the thesis author, unless otherwise stated. A copy can be downloaded for personal non-commercial research or study, without prior permission or charge. This thesis cannot be reproduced or quoted extensively from without first obtaining permission in writing from the author. The content must not be changed in any way or sold commercially in any format or medium without the formal permission of the author. When referring to this work, full bibliographic details including the author, title, awarding institution and date of the thesis must be given.
-
Upload
khangminh22 -
Category
Documents
-
view
3 -
download
0
Transcript of This thesis has been submitted in fulfilment of the ... - ERA

This thesis has been submitted in fulfilment of the requirements for a postgraduate degree
(e.g. PhD, MPhil, DClinPsychol) at the University of Edinburgh. Please note the following
terms and conditions of use:
This work is protected by copyright and other intellectual property rights, which are
retained by the thesis author, unless otherwise stated.
A copy can be downloaded for personal non-commercial research or study, without
prior permission or charge.
This thesis cannot be reproduced or quoted extensively from without first obtaining
permission in writing from the author.
The content must not be changed in any way or sold commercially in any format or
medium without the formal permission of the author.
When referring to this work, full bibliographic details including the author, title,
awarding institution and date of the thesis must be given.

This thesis has been submitted in fulfilment of the requirements for a postgraduate degree (e.g. PhD, MPhil, DClinPsychol) at the University of Edinburgh. Please note the following terms and conditions of use:
This work is protected by copyright and other intellectual property rights, which are retained by the thesis author, unless otherwise stated. A copy can be downloaded for personal non-commercial research or study, without prior permission or charge.
This thesis cannot be reproduced or quoted extensively from without first obtaining permission in writing from the author. The content must not be changed in any way or sold commercially in any format or medium without the formal permission of the author.
When referring to this work, full bibliographic details including the author, title, awarding institution and date of the thesis must be given.

Doctorate of Medicine (MD) Thesis UNDERSTANDING THE CLINICAL AND DIAGNOSTIC PATHWAY FOR BRAIN TUMOURS IN ADULTS AND ITS IMPACT ON CLINICAL CARE AND OUTCOMES TOTAL WORD COUNT (EXCLUDING TABLES, FIGURES AND REFERENCES): 54213
KAROLIS ZIENIUS (STUDENT ID S1163104)
APRIL 2021
UNIVERSITY OF EDINBURGH EDINBURGH


1
This thesis is based on the following articles (published/prepared/in preparation for
submission):
1. Zienius K, Chak-Lam I, Park J, et al.
a. Direct access CT for suspicion of brain tumours: an analysis of referral
pathways in a population-based patient group. Family Practice 2019:20;1-10
2. Zienius K et al.
a. Factors associated with index diagnosis of adult brain tumour in the Emergency
Department offer insights to enhance earlier diagnosis of brain tumours (in
preparation for submission)
3. Zienius K, Ozawa M, et al.
a. First symptom type but not time to diagnosis is associated with overall survival
in patients with high-grade glioma (in preparation)
4. Zienius K, Ozawa M, Hamilton W, Hollingworth W, et al.
a. Verbal fluency as a brief cognitive screening tool in patients with a suspected
brain tumour: a potential red flag (submitted)

2
Relevant published/submitted papers during period of MD
1. Ozawa M, Brennan PM, Zienius K, Kurian KM, Hollingworth W, Weller D,
Hamilton W, Grant R, Ben-Shlomo Y. Symptoms in primary care with time to
diagnosis of brain tumours. Fam Pract 2018;35(5):551-558.
2. Ozawa M, Brennan PM, Zienius K, Kurian KM, Hollingworth W, Weller D, Grant R,
Hamilton W, Ben-Shlomo Y. The usefulness of symptoms alone or combined for
general practitioners in considering the diagnosis of a brain tumour: a case-control
study using the clinical practice research database (CPRD) (2000-2014). BMJ Open
2019 (9)
3. Hewins W, Zienius K, Rogers JL, Kerrigan S, Bernstein M, Grant R. The effects of
brain tumours upon medical decision-making capacity. Curr Oncol Rep 2019; 21
4. Keeney E, Mohiuddin S, Zienius K, Ben-Shlomo Y, Ozawa M, Grant R, Hamilton
W, Weller D, Brennan PM, Hollingworth W. Economic evaluation of GPs Direct
access to computed tomography for identification of brain tumours. Eur J Can Care
2020, 30(1): e13345
Published abstracts during period of MD
1. Zienius K, Maxwell D, Porteous L, Pooley J, Summers D, McKinlay L, Weller D,
Bulbeck H, Brennan PM, Grant R. Headache suspicious of cancer – The Edinburgh
early diagnosis pathway. NCRI Cancer 2018.

3
Abstract
Timely diagnosis of a brain tumour is an important aspect of health care provision. There are
no known risk factors for brain tumours in the majority of patients and most brain tumours
are diagnosed following symptomatic presentation. The nature of presenting symptoms is
critical to the speed of diagnosis. Understanding how symptoms are associated with the
length of diagnostic time and its prognostic effect is a priority for early diagnosis research
which could inform strategies to achieve an earlier detection of brain cancer.
This thesis focuses on four key aspects in the diagnosis, namely 1) assessing the usefulness of
existing primary care referral guidelines for an urgent brain imaging; 2) describing clinical
and diagnostic pathway of adult patients with any type of brain tumour prior to a diagnosis;
3) assessing the association between presenting symptoms and diagnostic intervals and their
impact on clinical care and survival in patients with the most malignant brain tumour, and
lastly 4) assessing the value of a brief cognitive assessment in identifying which symptomatic
patients are most likely to have a brain tumour.
In the first study, a total of 3257 referrals for direct-access CT (DACT) head imaging were
retrospectively identified. Diagnostic yield for a brain tumour was 1.8% (N=53 scans). There
were no false negative scans. Referral symptoms were categorised based on Kernick’s
symptom classification and NICE 2005 referral guidelines. Only referrals for “symptoms
related to the CNS” achieved positive predictive value (PPV) of 3%. Nearly 80% of patients
whose CT revealed a brain tumour had symptoms grouped under the “symptom related to the
CNS” category. A large proportion of referrals were for a ‘simple’ headache (27%) but few
of these patients had a tumour. Improving guidelines to better identify patients at risk of a

4
brain tumour should be a priority, to improve speed of diagnosis and reduce unnecessary
imaging and costs. However, as I explore, this will not be not straight forward, in particular
because of the lack of specificity of symptoms associated with a brain tumour.
The second prospective study included 180 patients with a heterogenous range of brain
tumour types where I describe the clinical and diagnostic pathway to diagnosis. Patients
symptoms were grouped as episodic attacks of consciousness (seizure), alarm or vague
symptoms, and were recorded temporally along the patient’s diagnostic journey, occurring as
first, second or at any point before the diagnosis. Vague, non-specific symptoms, were the
most common symptoms across the pathway and were associated with increased diagnostic
interval compared to episodic attacks of consciousness (seizure) (median 96 days vs 22 days,
respectively, adjusted odds ratio 3.0, 95%CI 1.2-7.9) and a higher likelihood of more than 3
GP visits prior to a diagnosis (aOR 5.6, 95%CI 1.2-26.1). Interestingly, over half of patients
with a seizure resulting in emergency admission actually reported initial vague non-specific
symptoms.
In a third study, 354 patients with a high-grade glioma were retrospectively identified from
local multi-disciplinary team minutes between July 2010 and March 2015. Data on primary
symptoms and time to diagnosis were corroborated by contacting deceased patients’ General
Practitioners. Type of presenting symptoms was associated with diagnostic timeliness and
overall survival. Multivariate models showed that development of cognitive symptom was an
independent adverse predictor for 12-month survival (multivariate HR 1.8, 95%TCI 1.2-2.6)
but was not associated with the type of surgery performed (ie biopsy versus debulking).
Earlier diagnosis did not have an impact on survival.

5
Finally, in a proof of concept study, performance on a 1-minute semantic and phonemic
verbal fluency (VF) test was significantly poorer in patients with a brain tumour (n=180)
compared with patients referred from primary care for brain imaging, but without a brain
tumour (n=90). The biggest difference in scores between the groups was observed for
semantic total VF scores compared to phonemic total VF scores (Cohen’s d = -0.97 and -
0.47, respectively). A score of 14 animals on SVF test was associated with an 84% sensitivity
and 54% specificity for not having a brain tumour (AUC 0.75 p<0.001).
Conclusion
Vague symptoms due to a brain tumour are under-recognised while existing referrals
guidelines lack sensitivity. Patients with vague symptoms pose the most diagnostic challenge,
particularly in primary care, but who may benefit from an earlier cancer detection most.
Active screening for cognitive deficits by performing semantic verbal fluency task could
potentially help a physician in risk assessment for urgent referral for head imaging/hospital
assessment in suspicious cases.

6
Foreword
On reflection after 4 years of writing up the thesis, there are so many people whom I would
like to personally thank for their help and assistance. Firstly, my biggest thanks goes to my
supervisor, Mr Paul Brennan, for his ability to navigate me through the corridors of academia
and research and for his continued belief in my skills and success. Every word of his advice
was useful and to the point. My next and equal thanks goes to Robin Grant. Dr Grant has
been my mentor for over 8 years whom I firstly met in medical school on a neurology
attachment. His never-ending enthusiasm for improving care and patient support from a brain
tumour has always fascinated me as a clinician and a researcher. Both of my supervisors
supported and believed in me which gave me enormous mental strength to continue this work
during challenging and stressful times, including the birth of my second child, Vincent, and
COVID-19 pandemic.
I would also like to thank the following people who were directly involved in this work, one
way or another. This list includes the following: Dr D. Maxwell (a GP), Dr L. Porteous (a
GP), Ms L. McKinlay (Radiology super-intendant at the Neuro-radiology department,
Western General Hospital).
My greatest thanks goes to all the participants and patients and their relatives who
volunteered to take part in this project. Their involvement while going through this
enormously difficult period of their time is the demonstration of hope, courage and
dedication to help others in the long fight against this terrible disease. Without them, this
project would not be possible.

7
Lastly, my biggest thanks is to my wife, Greta. Writing a thesis is challenging, requires many
hours of dedication. I cannot recall the amount of hours spent at the local library. Through all
those past 4 years she has been an enormous psychological and spiritual support to guide me
through. We have come to the destination, through the shared values and commitments!

8
To Greta.

9
The word ‘Cancer’ refers to a generic term for a group of diseases, affecting any part of the
body. Simply speaking, the underlying feature of cancer is its ability to create abnormal cells
(‘cancerous cells’) that grow beyond their boundaries, penetrate adjacent cells or even spread
to other organs, an event called ‘metastasis’. The global problem of cancer is enormous.
Cancer is the leading cause of death and disability worldwide. According to World Health
Organisation (WHO), it is responsible for an estimated 9.6 million deaths in 2018 (WHO
2018). In other words, 1 in 6 deaths is from cancer. While there are several recognised risk
factors for certain types of cancers, one the most commonly cited risk factors associated with
many cancers is increasing age. Aging worldwide population will therefore increase the
burden of the disease. It is estimated that the number of people aged 60 or over will be 2.1
billion globally, which is more than double than in 2017 (962 million) (United Nations 2017).
While the incidence of cancer will be 21.4 million worldwide by 2030, according to WHO
projections (WHO 2011).
Minimising the cancer burden
WHO estimates that between 30% to 50% of all cancers can be prevented through
minimising risk factors (WHO 2018). In addition, cancer burden can be reduced by early
detection resulting in cancer diagnosis at earlier stage of disease, access to earlier treatment,
potentially leading to less morbidity and potentially a greater probability of increased
survival (WHO 2018). In contrast, for patients diagnosed at late stages curative treatment
may no longer be an option (discussed later). Therefore, earlier diagnosis for all cancer is of
considerable relevance and programmes at global as well as national level can be designed to
speed up early diagnosis, for example by increasing awareness of cancer symptoms,

10
improving access to clinical evaluation by removing barriers to obtaining help, improving
diagnostic investigation through improved access to appropriate services and improving
access and options to treatment (WHO 2018; 2019).
Brain cancer
The term ‘brain cancer’ refers to a group of different tumour entities that are anatomically
close to each other but different in terms of morphology, site, molecular biology and clinical
behaviour, treatment and likely aetiology (Wrensch et al 2002). Brain tumours are one of the
most challenging oncological diseases due to their anatomical specifics, wide heterogenicity,
existence of the blood-brain barrier, to name just a few, often resulting in adverse quality of
life and significantly increased mortality (Burnet et al 2005; Visser et al 2015).
Although brain tumours account for less than 2% of all primary tumours in adults, they are
associated with most life-years los of any cancer (Burnet et al 2005). They are ranked as the
third-leading cause of cancer-related death among men aged 15-54 years and the fourth-
leading cause of cancer related death in females, aged 15-34 years of age. Unfortunately, the
last decade has witnessed an increase in incidence of primary brain cancer by about 15%,
while the rate is further projected to rise by 6% by 2035 (Cancer Research UK). Equally,
incidence of brain metastases is thought to rise owing to the global trend of increasing cancer
rates with time.

11
The United Kingdom (UK) has one of the lowest survival rates from brain tumours of most
European countries with similar health-economic status (De Angelis et al 2014). Improving
survival from cancer has been identified as a key policy by the Department of Health with the
publication of Improving Outcomes: A Strategy for Cancer (2011). Poorer cancer survival in
the UK may in part be explained by later cancer diagnosis. Little is, however, known as to
whether earlier brain tumour diagnosis is associated with better outcomes. This is one of the
top 10 clinical research priorities for neuro-oncology (Kurian et al 2018).
My MD thesis, therefore, will address this research question in full by studying the clinical
and diagnostic pathway of brain tumours in adults. It will then aim to explore an association
of time to diagnosis and its relationship to presenting symptoms on clinical care and
outcomes. Finally, an explorative pilot study will be presented to assess sensitivity of a brief
1-minute cognitive screening tool for detecting a brain tumour.
Outline of the thesis:
In Part 1, Chapter 1, I start by introducing the epidemiology and future projections of brain
tumours world-wide and in the UK. In Chapter 2, I introduce the classification of brain
tumours, diagnostic strategies and provide latest trend in survival world-wide, Europe and the
UK. Chapters 3 and 4 review current strategies as well as barriers to early brain cancer
diagnosis, and I further elaborate on strategies to identify vague symptoms. Lastly, Chapter
5 discusses methodological challenges associated with studying early cancer diagnosis. Part
2 describes study’s methodology and logistics. Parts 3 – 6 present main studies 1 - 4 of the
thesis. Lastly, in Part 7, I provide overall summary of the results and discuss future
implications and research directions.

12
Contents
Part 1 .............................................................................................................................. 17 Chapter 1 ................................................................................................................................. 17
Epidemiology of brain tumours .................................................................................................................. 17 Primary intracranial tumours ................................................................................................................ 17
Worldwide perspective ..................................................................................................................... 17 The United Kingdom perspective ...................................................................................................... 18 Secondary intracranial tumours – metastases: ................................................................................ 19
Challenges in understanding the epidemiology of brain tumours across countries and registries ....... 20 Temporal projections – time trends from past, present to the future: ................................................. 22
Worldwide perspective: .................................................................................................................... 22 United Kingdom perspective: ........................................................................................................... 22 Metastatic brain tumours: ................................................................................................................ 25
Chapter 2 ................................................................................................................................. 26 Classification of primary brain tumours ..................................................................................................... 26
Proportional representation of primary brain tumour types: ............................................................... 28 Risk factors of development of brain tumours ........................................................................................... 28
Familial cancer syndromes: ................................................................................................................... 29 Heritable genetic contribution .......................................................................................................... 29
Established environmental causal factors ............................................................................................. 30 Ionizing radiation .............................................................................................................................. 30 Exogenous hormone use .................................................................................................................. 31
Non-ionising radiation: .......................................................................................................................... 31 Mobile phone use ............................................................................................................................. 31
Probable causal factors ......................................................................................................................... 32 Air traffic pollutants .......................................................................................................................... 32 Pesticides and solvents ..................................................................................................................... 33 Conclusion: ....................................................................................................................................... 33
Diagnostic investigations for suspected brain tumour .......................................................................... 33 Differential diagnosis ............................................................................................................................. 34 Prognostic factors .................................................................................................................................. 35 Survival .................................................................................................................................................. 36
Introduction: ..................................................................................................................................... 36 Gliomas ............................................................................................................................................. 38 CNS Lymphomas ............................................................................................................................... 38 EUROCARE 5: .................................................................................................................................... 38 CONCORD-3 (data for 2010-2014) .................................................................................................... 39 Other benign primary brain tumours: .............................................................................................. 40 Metastasis: ........................................................................................................................................ 42 Chapter summary: ............................................................................................................................ 43
Chapter 3 ................................................................................................................................. 44 Early brain tumour diagnosis ...................................................................................................................... 44
General introduction: historical perspective ......................................................................................... 44 Promoting Cancer Early Diagnosis ......................................................................................................... 44
Defining the pathway ........................................................................................................................ 45 Steps to early cancer diagnosis ......................................................................................................... 45 Step 1: Awareness and accessing care = Patient interval ................................................................. 47 Step 2: Clinical evaluation, diagnosis and staging (aka Diagnostic interval) ..................................... 48 Step 3: Commencement of treatment .............................................................................................. 48
Potential barriers to early cancer diagnosis: worldwide perspective .................................................... 49 The UK: Early diagnosis of cancer: past, present, future. ...................................................................... 50 What are the symptoms of brain tumours? .......................................................................................... 52

13
Symptom awareness – a recognised barrier to early diagnosis: How symptomatic presentation of brain tumours reflects on time to diagnosis .......................................................................................... 53
Patient symptom appraisal and help seeking: .................................................................................. 53 GP recognition of symptoms interval: .............................................................................................. 54
Steps of early diagnosis with relevance to brain tumours ..................................................................... 58 Primary care assessment and referral: ............................................................................................. 58
GP’s confidence in suspecting/diagnosing brain tumours in the community ....................................... 68 A brief introduction to the topic: ...................................................................................................... 68 Organising the event: ........................................................................................................................ 71 Results: ............................................................................................................................................. 71 Conclusion findings from the education event: ................................................................................ 72
Achieving early cancer diagnosis: .......................................................................................................... 72 Importance of early brain tumour diagnosis: what is the evidence? ............................................... 72 Do all patients with newly diagnosed brain tumours receive surgery as the first treatment? ......... 74
Chapter 4 ................................................................................................................................. 77 Recognising subtle symptoms of brain tumours: ....................................................................................... 77 How common are cognitive symptoms in brain tumours? ........................................................................ 78
Assessment to identify/recognise covert symptoms (assessment to identify cognitive symptoms) .... 78 Cognitive screening stools: .................................................................................................................... 80
Mini-Mental State Examination (MMSE) ......................................................................................... 80 Montreal Cognitive Assessment (MOCA) ......................................................................................... 81 Addenbrooke’s Cognitive Examination-Revised (ACE-R) (Mioshi et al 2006) ................................... 82
General introduction to verbal fluency: ..................................................................................................... 83 Semantic fluency ................................................................................................................................... 84 Phonemic fluency .................................................................................................................................. 84 Measures of fluency tasks: qualitative assessment ............................................................................... 84 Verbal fluency: demographic effects ..................................................................................................... 85
Aging: ................................................................................................................................................ 86 Education: ......................................................................................................................................... 86
Verbal fluency test as a potential red-flag sign for brain tumour for a busy GP ................................... 87 Chapter 5 ................................................................................................................................. 90
Studying cancer diagnostic pathway: ......................................................................................................... 90 Methodological challenges studying cancer diagnostic timeliness ....................................................... 90 References: ............................................................................................................................................ 96
Principal aims of the thesis: ..................................................................................................................... 112
Part 2 ............................................................................................................................ 113 General introduction of methods/data management ......................................................................... 114
Setting of the study: ........................................................................................................................ 114 Ethical/methodological considerations prior to study commencement: ....................................... 114 Ethical approvals ............................................................................................................................. 115 Data management and storage: practical, confidential issues ....................................................... 115 Data storage .................................................................................................................................... 115
Prospective data: Section 1 ...................................................................................................................... 116 Clinical study (N = 180) ........................................................................................................................ 116
Eligibility criteria ............................................................................................................................. 117 Exclusion criteria: ............................................................................................................................ 117 Approach to subjects ...................................................................................................................... 118 Obtaining Consent .......................................................................................................................... 118 Data collected: ................................................................................................................................ 119 Design of the questionnaire: ........................................................................................................... 119 Pilot testing of the Patient questionnaire ....................................................................................... 120
Prospective data Section 2: ...................................................................................................................... 121 GP referrals for DACT for Headache (N = 90) ...................................................................................... 121
Eligibility criteria ............................................................................................................................. 121 Exclusion criteria ............................................................................................................................. 121

14
Patient identification ...................................................................................................................... 121 Approach to participants ................................................................................................................ 122
Retrospective data collection: Section 1 .................................................................................................. 122 Study design .................................................................................................................................... 122 Inclusion criteria ............................................................................................................................. 122 Identifying participants: data sources ............................................................................................. 123 Further filtering of patient records for analysis .............................................................................. 124
Contacting patient’s General Practitioners ......................................................................................... 124 Reason for contacting GPs .............................................................................................................. 125 Description of the approach for contacting GPs ............................................................................. 125 Consent requirements for this part of the study: ........................................................................... 126 Summary of responses: .................................................................................................................. 127
Part 3 ............................................................................................................................ 128 Study 1 ................................................................................................................................... 128
Direct access CT for suspicion of brain tumour: an analysis of referral pathways in a population-based patient group ............................................................................................................................................ 128
Introduction ......................................................................................................................................... 130 Methods .............................................................................................................................................. 131 Statistical methods .............................................................................................................................. 137 Results ................................................................................................................................................. 138
Frequency of non-tumour radiological diagnosis ........................................................................... 140 Management of radiological findings in primary care .................................................................... 141
Discussion ............................................................................................................................................ 145 Summary ......................................................................................................................................... 145 Strengths and limitations ................................................................................................................ 146 Implications for practice and research ........................................................................................... 147 Comparison with other studies ....................................................................................................... 148 Conclusions ..................................................................................................................................... 149
References ........................................................................................................................................... 151
Part 4 ............................................................................................................................ 153 Study 2 ................................................................................................................................... 153
Factors associated with index diagnosis of adult brain tumour in the Emergency Department offer insights to enhance earlier diagnosis of brain tumours. .......................................................................... 153
Introduction ......................................................................................................................................... 156 Methods .............................................................................................................................................. 158
Participants ..................................................................................................................................... 158 Procedure ....................................................................................................................................... 158 Symptom categorisation ................................................................................................................. 159 Definitions of time intervals of brain cancer diagnosis and treatment .......................................... 161 The date of first symptom: ............................................................................................................. 161 First contact with the health care provider (i.e. primary care physician, emergency, other): ....... 161 Primary care interval: ..................................................................................................................... 161 Secondary care interval .................................................................................................................. 162 Date of diagnosis: ........................................................................................................................... 162 Date of treatment: .......................................................................................................................... 162 Other covariates ............................................................................................................................. 162 Statistical analyses .......................................................................................................................... 163
Results ................................................................................................................................................. 163 Diagnostic intervals ......................................................................................................................... 165 Total Time to Diagnosis ................................................................................................................... 165 Patient contact with healthcare provider (N=180) ......................................................................... 166 Symptomatology prior to diagnosis ................................................................................................ 168 Symptomatology of patients diagnosed following emergency presentation ................................. 170 Self-presentation to the ED ............................................................................................................ 170

15
GP consultations before emergency presentation: ........................................................................ 172 Discussion ............................................................................................................................................ 175
Summary: ........................................................................................................................................ 175 Comparison with other literature ................................................................................................... 175 Strengths and limitations ................................................................................................................ 179 Limitations: ..................................................................................................................................... 179 Implications ..................................................................................................................................... 180
References: .......................................................................................................................................... 182
Part 5 ............................................................................................................................ 188 Study 3 ................................................................................................................................... 188
First symptom type but not time to diagnosis is associated with overall survival in patients with high-grade glioma ............................................................................................................................................. 188
Introduction ......................................................................................................................................... 191 Methods .............................................................................................................................................. 194
Patient inclusion: ............................................................................................................................ 194 Recorded variables ......................................................................................................................... 194 First symptom type and diagnostic time interval ........................................................................... 195 GP survey completion: .................................................................................................................... 196 Statistical analyses .......................................................................................................................... 197
Results: ................................................................................................................................................ 198 Prognostic relevance of symptom type and time to diagnosis for decision having surgical versus non-surgical treatment ................................................................................................................... 200 Prognostic relevance of symptom type and time to diagnosis for surgery type (biopsy-only versus debulking) ....................................................................................................................................... 202 Effect of symptom type and time to diagnosis on 12-month survival (N=354) .............................. 203 Effect of symptom type and time to diagnosis on 12-month survival in patients undergoing surgery (N=264) ........................................................................................................................................... 207 Overall survival across different symptom types stratified by surgery type (biopsy versus debulking) ........................................................................................................................................................ 209
Discussion ............................................................................................................................................ 213 Summary: ........................................................................................................................................ 213 Effect of symptom presentation and diagnostic time on clinical care ............................................ 213 Effect of symptom presentation and diagnostic time on 12-month survival ................................. 215 Effect of age and performance status ............................................................................................. 219 Tumour factors: size, lobe, laterality, midline shift ........................................................................ 220 Type of surgery effect on survival ................................................................................................... 222 Strength .......................................................................................................................................... 224 Limitations ...................................................................................................................................... 224 Implications: ................................................................................................................................... 225
References: .......................................................................................................................................... 228
Part 6 ............................................................................................................................ 235 Study 4 ................................................................................................................................... 235
Verbal fluency as a brief cognitive screening tool in patients with a suspected brain tumour: a potential red flag ..................................................................................................................................................... 235
Introduction ......................................................................................................................................... 238 Methods: ............................................................................................................................................. 240
Participants: .................................................................................................................................... 240 Procedures: ..................................................................................................................................... 241 Other covariates ............................................................................................................................. 242 Statistical analysis and sub-groups: ................................................................................................ 242
Results: ................................................................................................................................................ 244 Verbal fluency in patients with a history of headache ................................................................... 245 Verbal fluency comparison between tumour and non-tumour patients ........................................... 248 Verbal Fluency associations with brain tumour grade, site and size. ............................................. 249

16
Discussion ............................................................................................................................................ 251 References: .......................................................................................................................................... 260
Part 7 ............................................................................................................................ 263 General discussion of main findings ........................................................................................ 263 limitations of the thesis .......................................................................................................... 274
Recruitment centre bias ................................................................................................................. 274 Selection bias .................................................................................................................................. 274 Researcher bias ............................................................................................................................... 275 Observer expectation bias .............................................................................................................. 275 Recall bias ....................................................................................................................................... 276
Future research directions ....................................................................................................................... 278 Appendixes: ............................................................................................................................ 280
Appendix A: ......................................................................................................................................... 280 Appendix B: .......................................................................................................................................... 284 Appendix C ........................................................................................................................................... 287 Appendix D: ......................................................................................................................................... 294 Appendix E: .......................................................................................................................................... 295 Appendix F: .......................................................................................................................................... 297

17
Part 1
Chapter 1
Epidemiology of brain tumours
Primary brain tumours account for about 2-3% of all cancers worldwide, with an overall
annual incidence of 22 per 100,000 population (Ostrom et al 2011), however there is a
significant variation reported in incidence worldwide. In this chapter, I will present the latest
data on epidemiology of primary and secondary brain tumours in the United Kingdom in the
context of variations in incidence worldwide. In addition, I will briefly describe the
challenges encountered in studying epidemiology of brain tumours in general. Lastly, I will
end the chapter by presenting future projections on incidence of brain tumours.
Primary intracranial tumours
Worldwide perspective
Data from the Central Brain Tumour Registry of the United States (CBTRUS) estimate the
overall annual incidence of primary brain tumours being in the range of 22 per 100 000
population (Ostrom et al 2019). The overall incidence of most brain cancers apart from germ
cell tumours and cysts increases with age, peaking at 60+ years (Ostrom et al 2019). Yet, the
reasons for this increase is not known. However, the relative frequency of CNS tumours is
highest during childhood, accounting for approximately a quarter of all the childhood cancers

18
diagnosed (Johnson et al 2014). In addition, there is a degree of discrepancy in gender, with
females being affected more often than males (17.2 per 100 000 versus 15.8 per 100 000,
respectively).
Similarly, brain tumour incidence rates vary widely by geographic regions throughout the
world with a 5-fold difference between the highest rates in Europe (mainly Western Europe)
and the lowest seen mainly in Asia (Miranda-Filho et al 2017). Comparing different states in
Europe, age-standardised incidence was greatest in the UK, Ireland and Northern Europe,
while the lowest rates reported in Easter Europe (Crocetti et al 2012). Such differences may
be partially explained by different genetic background of these ethnic populations (Consult
chapter Xi for further information). Nevertheless, considerable variation in diagnosis and
accurate reporting in registries is observed across the countries which may partly explain
such variation.
Incidence varies between degree of malignancy and histology types. The rate is greater for
non-malignant (14.7 per 100 000) than malignant (7.25 per 100 000) brain tumours.
Among the various histological types of primary brain tumours, meningiomas account for
approximately 36%, followed by gliomas (28%), nerve sheath tumours (8%) and primary
CNS lymphomas (2%) (Bauchet and Rigau 2017).
The United Kingdom perspective
Age-standardised incidence of primary brain tumours is one of the highest in the UK relative
to other European countries. According to CRUK, there estimated 11,700 new cases of
primary brain tumours in the UK annually, that is 32 patients diagnosed each day.

19
The issue is amplified by comparing incidence of certain type of brain tumours, named
astrocytic, in the UK with that of the lowest in Eastern Europe (5.1 per 100 000 population
and 3.1 per 100 000 population, respectively) (Crocetti et al 2012). Similarly, for tumours of
highest malignancy such as GBM, the incidence is comparably higher in the UK than the
world average (males: 8.1 per 100 000 in the UK versus 3.6 per 100 000 person-years
worldwide; females: 5.3 per 100 000 in the UK versus 2.5 per 100 000 persons-years
worldwide)(ONS 2019; Ferlay et al 2001).
Secondary intracranial tumours – metastases:
Intracranial metastatic lesions are the most common tumours in the brain in adults, occurring
at least 5 to 10 times more commonly than primary tumours (Wen & Loeffler 1999).
Presently there are no reliable data on the incidence rate of secondary CNS tumours. This is
because it is not possible to use the same registry methodologies that are most commonly
used for primary tumours, furthermore it is not mandatory to report brain metastases to
central registries (Ostrom et al 2018). However, best current estimate is that between 6% -
20% of all oncological patients have secondary deposits to the central nervous system (CNS).
Incidence of brain metastases varies significantly by primary cancer site. Incidence of brain
metastases from various primary common cancer types is summarised in Table 1.1. In short,
of those, the most common site of origin comes from the lung, breast, melanoma, renal and
colon cancers.

20
Table 1.1: Incidence proportions (IP%) of brain metastases by primary cancer from cases series studies and autopsy data (referenced from Ostrom et al 2018)
Data from case series/cancer registries
Data from autopsy studies Primary site Data type Years IP%
Autopsy IP%
Breast (Barnholtz-Sloan et al)
Cancer registry (US) 1973-2001
5.10% V.S. Breast (Takakura 1982)
21%
Lung (all types)(Takakura 1982)
Cancer registry (US) 1973-2001
19.90%
Lung (Cox et al 1986)
36%-52%
Melanoma (Ernst 2016)
Cancer registry (Canada) 2011-2013
10.40%
Melanoma (Amer 1978)
68%
Renal (Gore 2011)
Clinical trial (global) 2005-2007
7%
Renal (Takakura 1982)
17%
Colorectal (Mongan 2009)
Case series (US) 1984-2006
2.30%
Colorectal -
Challenges in understanding the epidemiology of brain tumours across countries and
registries
There is consistent evidence to suggest that incidence rate of primary brain tumours varies
significantly by geographic regions in the world. Generally, incidence is higher in more
developed countries than in less developed countries (Ferlay et al 2001). Reasons for such
differences are complex and international comparisons can be challenging to interpret. Some
of the difficulties arise from the fact that brain tumours are comprised of multiple histological
variants and potential artifacts are common features when analysing data from Cancer
registries (Bray et al 2010). In addition, each cancer registry is considered autonomous,
commissioned regionally, and thus collects certain amount of information, which can vary
between registries. The accuracy of data collected by registry is paramount here in order to
allow valid and meaningful comparisons. For instance, according to Philips et al, different
criteria have been used to define malignancy for gliomas and astrocytomas in some published
incidence analysis (Philips et al 2018). Being more precise, in the analysis by Ostrom et al
reporting on USA SEER brain tumour data showed a median complete registration and

21
histological confirmation level of only 65%, and for 2012 data achieved less than 75% of best
accuracy for full completion. While, as we will see in the next paragraph, incidence rates
have been reported to decrease in Japan, a study by Kim et al (2015) suggested a possible
classification issues and exclusion of non-malignant brain tumours from the registry, which
could have largely explained this change over time for the Japanese population. It is thus
certain that some, at best, variability exists between registries, countries and continents.
In addition, the geographical differences worldwide may be a reflection, at least in part, due
to availability of imaging facilities for diagnosis, particularly for magnetic resonance imaging
technologies, as well as access and quality of health care. For instance, significant variability
exists for the number of MRI units available or extent of its use among European Union (EU)
countries, according to EUROSTAT data (Eurostat 2019). For years 2015 to 2017, there were
approximately 0.7 MRI units per 100 000 persons in the UK, 1.2 in Lithuania with the
highest number seen in Germany (3.5 units). While the most intensive use of imaging
technology was observed in Germany with 14 344 MRI scans per 100 000 population
performed over 2017, and the lowest in Cyprus (660 per 100 000 inhabitants). As for the
worldwide comparison, the UK had about 7.2 MRI units per million people in 2017, fewer
than countries including Portugal and Latvia. By contrast, highest numbers of units were in
Japan (55.2), the United States (39.1) followed by Germany with 34.7 scanners per million
population in 2017 (OECD). As such, this may reflect the ease or barriers to access to
diagnostic imaging facilities across national health care systems.

22
Temporal projections – time trends from past, present to the future:
Worldwide perspective:
Differences in temporal variations in primary brain tumours over years have been reported to
vary depending on time interval when this was assessed and geographical regions. For
example, tumour incidence was on an increasing scale during the 1970s and 1980s, but this
was probably reflective of the use of new diagnostic imaging technologies and completeness
of registries (Quinn et al 2001;McCarthy 2008). European data for years 1995 – 2002, in
contrast, showed the incidence trend for glioma appeared to plateau, with an exception for
older patients (aged 60+ years) which showed an increasing-incidence trend (Crocetti et al
2012). By comparing worldwide data from national registries, a mixed picture emerges. For
example, between the studied years, 1993 to 2007, rising trends have been observed for The
Baltic countries with an average annual percentage change (AAPC) of 4.0% for Latvia, and
1.7% for Lithuania, northern Europe (Norway, AAPC 1.4%), as well as The Russian
Federation (AAPC 1.4%), and most South American states including Brazil, Colombia,
Ecuador (AAPC 3.3%, 1.3% and 1.1% , respectively) and Asia (eg Singapore and , Thailand,
AAPC 1.4% and 4.4%, respectively). Elsewhere brain cancer rates remained stable or
showed minor declines. Only among the Japanese men was there a significant reported
decline in incidence during the time period with AAPC of -1.2% (Miranda-Filho et al 2017).
United Kingdom perspective:
One of the most accurate epidemiological data, based on the number of available registries
available to date, come from the UK registries. Based on analysis from the UK Office of

23
National Statistics (ONS) for age-standardised trends for tumours which include the ICD-10
C71 (malignant neoplasm of brain)(WHO 2013) showed a steady incidence rise from 1970s
to about 2000, however from year 2000 the overall incidence rate has slowed down. Of
significance however, there has been recorded increase rate of high-grade, aggressive
tumours such as glioblastoma multiforme. Philips and colleagues reported an increase by
extra 1548 aggressive GBM tumour cases annually comparing the year 2015 with 1995.
Their analysis allowed them to conclude there was a highly statistically significant and
persistent rise in GBM tumours in England over 2 decades (between 1995 to 2015), across all
ages (Philips et al2018), but as we have seen earlier, most of the cases were in people over 55
years old. (see Figure 1.1. for pictorial representation of the trend). In contrast, large decrease
in age-standardised incidence rates (ASR) was observed for less malignant brain tumours
such as Grade II diffuse astrocytoma. In addition, plateau effect was recorded for other less
malignant glial-based tumours such as oligodendrogliomas, and other ependymal tumours of
the brain for the same time period( Philips et al 2018).

24
Figure 1.1: Age-standardised incidence rates for all C71 gliomas diagnosed between years 1995 to 2015 (Adapted from Philips et al 2018).
A similar trajectory was observed in another recent study for years between 1993 to 2007
(Miranda-Filho et al 2017).
The rising numbers of high-grade gliomas in the UK is a cause for concern and has
implications in terms of its aetiology and resource allocation. According to national statistics
by CRUK, alarmingly, primary brain tumours are projected to rise by further 6% between
2014 and 2035.

25
Metastatic brain tumours:
As for metastatic tumours, the reported incidence is increasing, in keeping with the overall
trend seen with any type of cancer projected to rise by approximately 2% in the UK until
2035, but the exact incidence is currently unknown.

26
Chapter 2
Classification of primary brain tumours
Generally speaking, many brain tumours are morphologically heterogenous. The first ever
attempt at classifying brain tumours was based on the work by Bailey and Cushing in 1926.
They named tumours after recognising cell types/lines of the developing fetus or adult with
histological similarities. Subsequent attempts were published by Zulch in 1986, Kleihues in
1993 whereby immunohistochemistry was introduced into the diagnostic process. The third
(Kleiheus and Cavenee 2000) and fourth (Louis et al 2007) editions included genetic profiles
of tumours. The latest updated classification in 2016 incorporated molecular genetic
alterations to supplement histo-pathological criteria and defined tumours as malignant,
benign and borderline (Louis et al 2016). For purposes of this thesis, I briefly introduce the
World Health Organisation Classification of CNS tumours which form the framework for
classification and grading of malignancy from WHO grade I to IV (see Table 2).
Table 2: WHO Grading and corresponding histological and clinical tumour characteristics (Louis et al 2007)
WHO grade Characteristics Grade I low proliferative potential, possibility of cure following surgical resection alone Grade II infiltrative in nature, often recur, but generally low-level proliferative activity Grade III demonstrate nuclear atypia, brisk mitotic activity, most patients will receive adjuvant
radiation and/or chemotherapy Grade IV mitotically active, necrosis-prone, widespread infiltration of adjacent neural tissue, can
have high propensity for craniospinal dissemination According to WHO (2016) classification (Louis et al 2016), tumours are broadly classified as follows:

27
Table1.2: The 2016 World Health Organisation Classification of Tumours of the Central Nervous System
Classification Average annual U.S. age-adjusted incidence per 100,000
Tumours of the meninges 7.88 Meningioma 7.61 Mesenchymal tumours 0.08 Primary melanocytic lesions 0.01 Other neoplasms related to meninges 0.18 Tumours of the neuro-epithelial tissue 6.61 Glioblastoma 3.19 Diffuse astrocytoma 0.55 Glioma (not specificied) 0.46 Ependymal tumours 0.42 Anaplastic astrocytoma 0.37 Pilocytic astrocytoma 0.34 Neuronal and mixed neuronal-glial 0.28 Embryonal tumours 0.26 Oligodendroglioma 0.26 Oligoastrocytic tumours 0.21 Anaplastic oligodendroglioma 0.11 Choroid plexus tumours 0.05 Tumours of pineal region 0.04 Other neuroepithelual tumours 0.01 Tumours of sellar region 3.47 Pituitary 3.29 Craniopharyngioma 0.18 Tumours of the cranial nerves and spine 1.7 Nerve sheath tumours 1.7 Others 0 Lymphomas and haematopoietic tumours 0.46 Lymphoma 0.44 other 0.01 Germ cell tumours and cysts 0.1 Unclassified 1.19 Total 21.42
Adapted from Ostrom QT, CBTRUS (2019).


29
In this chapter I will summarise the current latest evidence on the risk factors for primary
brain tumours and will provide chapter summary as an interpretation of the influence.
Familial cancer syndromes:
Heritable genetic contribution
Most brain tumours are sporadic (Collins 2010). However, less than 5% of primary brain
tumours are due to genetic predisposition syndromes see Table 1.3. Yet, even in the presence
of the commonest syndromes, the precise relative risk is difficult to define.
Table 1.3: Familial syndromes associated with brain tumours (adapted from Lapointe
et al 2018)
Disorder Gene Incidence Brain tumour associated with the condition
Neurofibromatosis type 1 (NF1)
NF1 50% AD Astrocytomas, ependymomas, PNETS, meningiomas
Neurofibromatosis type 2 (NF2)
NF2 50% AD Vestibular schwannomas, meningiomas
Turcot syndrome A APC Medulloblastoma Turcot syndrome B MLH1,
MSH2, others
85% AD GBM
Basal cell nevus syndrome
PTCH 75% AD Medulloblastoma
Cowden disease PTEN 50% AD Astrocytomas,ependymomas, PNETS, meningiomas
Tuberous sclerosis TSC1, TSC2 85% AD Subependymal astrocytoma, harmartomas von Hippel-Lindau VHL 80% AD Haemangioblastoma Li Fraumeni TP53 80% AD Astrocytomas Multiple endocrine neoplasia type 1 (MEN 1)
MEN1 Pituitary adenoma, ependymoma
AD = autosomal dominant.

30
Established environmental causal factors
For most people with brain tumours, there is no evidence of any underlying risk factor.
Nevertheless, multiple risk factors have been examined as the potential causal contributors to
the development of a brain tumour; from the increased risk by exposure to ionizing radiation,
or nonionizing radiation from mobile phones and occupational exposes to increased risk by
exposure to allergens. A brief summary for each is presented below.
Ionizing radiation
The most widely recognised risk factor for all brain tumours is ionising radiation. The
relationship is viewed as a linear dose-response curve. Evidence comes from the atomic
bomb survivors Sadetzki (2010), as well as from childhood patients treated with therapeutic
ionising radiation. Patients of both these studies showed an elevated relative risk for both
glioma and meningioma. In view of ever-increasing use of diagnostic imaging technology
such as CT scans in the UK and worldwide, there is a heightened concern of potential cancer
risk. While a single non-contrast head CT scan is among the safest modality, delivering
around 2mSv in effective radiation dose to the body (McCollough et al 2015), equivalent to,
given the fact that about 30% patients undergo repeated imaging for conditions such as
traumatic brain injury (Salibi et al 2014), cerebrospinal fluid shunts (Aw-Zoretic et al 2014),
and others, thus receiving cumulative radiation doses that magnify the potential risk of brain
tumour. For comparison, according to a consensus of radiation experts (Linet et al 2012), the
lowest acute dose of radiation from diagnostic xrays for which observable increased cancer
risk is between 10 - 50 mSv. Finally, ionising radiation effect may be mediated by age at
exposure and genetic variation.

31
Exogenous hormone use
Exogenous hormone use among women is an established risk factor for meningioma,
however the absolute excess is small (2 per 10,000 females over 5 years). In a recent meta-
analysis an increased risk for all CNS tumours was in users of oestrogen-only hormone
therapy (Benson et al 2014).
Non-ionising radiation:
Mobile phone use
Cellular phone technology was first introduced in the 1980s, but became widely used
worldwide a decade later. There has been an enormous rise in mobile cellular subscriptions
from 2000 onwards by a staggering 948.5%, from 738 million in 2000 to more than 7 billion
in 2015 (ICT 2015). Due to such a widespread use of mobile phones, and the fact that the
brain is the organ that absorbs the most transmitted radiofrequency fields when mobile
phones are active and held to the head, the association has been studied extensively,
including some long-term studies of at least 10 years of more of the duration of cellular
phone. While some studies have shown an increased risk for gliomas in particular, no
conclusive causative role has been established to date. Some of the potential reasons for such
discrepancy are often cited as the quality of studies, small sample sizes, selection and recall
biases (Levis et al 2011; Hardell et al 2006), short latency period (less than 10 years), at least
in part. Nonetheless, cumulative evidence suggests a slightly increased risk of glioma with
long-term phone use but this is hugely dependent on quality of pooled studies. A recently
published meta-analysis (Prasad et al 2017) found a significant positive correlation between a
32
study quality and a risk of brain tumour associated with the long-term use of mobile phones
(>10 years or > 1640 h). Higher quality studies demonstrated a statistically significant
association, which was lost when poor quality studies were combined in meta-analysis. In
addition, it was noted that Government funded studies were generally of better
methodological quality (score 7 or higher) than phone industry funded (Prasad et al 2017). As
such, The International Agency for Research in Cancer (IARC) concluded that both power
frequency ELF and radio-frequency RF electromagnetic fields were classified as ‘possible
human carcinogens’ (IARC group 2B) in 2011 (Baan et al 2011), and later upgraded to
‘probably carcinogenic’ in 2015 (Morgan et al 2015), based on mainly epidemiological
studies of an increased risk of glioma and vestibular schwannoma in heavy cellular phone
users. The research currently remains controversial, however, awaiting more refined studies
with greater statistical power.
Probable causal factors
I will briefly describe probable causal factors in this paragraph.
Air traffic pollutants
Chemicals of air pollution, namely particulate matter (PM) or nitrogen dioxide (NO2), have
been established as carcinogenic to humans by the International Agency for Research on
Cancer (Loomis et al 2013). A strong association between long-term exposure to nitrogen
oxides and brain cancer development was observed in 2011 Danish study (HR 2.28, 95%CI
1.24-4.17) (Raaschour-Nielsen et al 2011) as well as from the large database involving 12
cohorts from 6 European countries (Sweden, Norway, Denmark, Holland, Austria and Italy),

33
as part of the European Study of Cohorts for Air Pollution Effects (ESCAPE), including over
280 000 subjects found suggestive link between the traffic related metric PM2.5 absorbance
and malignant brain tumours after a median follow up duration of 12 years (Andersen et al
2018). In addition, no association with non-malignant brain tumours was observed.
Pesticides and solvents
Some studies provided alarming evidence in relation to pesticides and solves as a causal
factor (Schmidt et al 2008; Provost et al 2007), however a recent meta-analysis failed to
unambigiousnly establish that there is a relationship (Li et al 2015).
Conclusion:
While there is a recognised significant increased risk of brain tumours associated with
genetic syndromes, albeit in a minority of primary brain tumours, the projected increasing
incidence, particularly for the most malignant brain tumour, described earlier in the previous
chapter, may be caused by widespread environmental and lifestyle factors. Nevertheless, such
epidemiological studies have a high risk of selection and recall bias, that may diminish the
true effect of conclusion reached from analyses.
Diagnostic investigations for suspected brain tumour
In a patient with suspected brain tumour, a head imaging is the investigation of choice in a
form of computed tomography (CT) or magnetic resonance imaging (MRI), ideally with
contrast. The diagnostic error is commonly cited up to 5% (Grant 2004), but this depends on

34
the expertise of reporting radiologist able to reliably exclude differential diagnoses (see
paragraph below) as well as imaging modality (CT with versus without contrast). According
to the Scottish audit in 2004, 10% (out of 324 total patient scans analysed) had an initial
‘negative’ scan for intracerebral tumour before the eventual diagnostic scan. Two thirds of
those ‘negative’ scans were done without contrast. Over 40% of patients with adult onset
epilepsy where tumour remained undiagnosed for 6 months or more also had a previous
‘negative’ CT scan, while negative CT scans were more frequent with tumours in the
temporal lobe. Additional imaging for example magnetic resonance perfusion, magnetic
resonance spectroscopy, or fluorodeoxy-glucose positron emission tomography (PET) may
be required for diagnosis and staging (Treister et al 2014).
Where primary CNS lymphoma is potentially suspected, additional required investigations
should include testing for human immune-deficiency virus (HIV), chest radiography, lumbar
puncture for cerebrospinal fluid analysis (CSF), ocular slit-lamp examination. Cerebral
biopsy may be avoided if/when lymphomatous cells are present in CSF (10 to 30% of
patients) (Sierra del Rio et al 2010).
Whenever a brain metastasis is suspected, a careful primary site screen is recommended with
clinical examination and a chest-abdomen-pelvis CT scan Perry et al 2017).
Differential diagnosis
Although the current imaging technology with CT and MRI scans allow to have high
sensitivity for intracranial tumours, brain mass can sometimes be mistaken for inflammatory

35
disorders, infections, vascular lesions, to name just a few. Table 1.4 summarises clinical
features and clues that may help clinician to make non-tumour diagnosis.
Table1.4: Clinical clues to non-malignant brain lesions (Adapted from Perkins & Liu
2016).
Clinical clues Suggested aetiology Chronic fever; recent dental procedure; recent ENT infections Brain abscess History of transient neurologic deficits, including visual symptoms
Multiple sclerosis
History of tuberculosis exposure, chronic symptoms Tuberculosis Immunosuppression, including diabetes mellitus Opportunistic infections Oral thrush AIDS, immunosuppression Personal or family history of auto-immune or inflammatory disease, age younger than 40 years
Behçet syndrome, multiple sclerosis, sarcoidosis, other inflammatory
Presence or history of oral and genital ulcers or rashes AIDS, Behçet syndrome, sarcoidosis, syphilsi
Intravenous drug use, age younger than 40 years AIDS, abscess, syphilis Travel to countries with endemic infectious disease Amebiasis, cysticercosis, hydatidosis
Prognostic factors
Prognostic factors are widely dependent on tumour histology and degree of malignancy
(based on WHO grading system from I to IV, see Table 4 below).
However, for tumours types that are most aggressive and which have been most extensively
studied such as high-grade gliomas, the most conclusive prognostic factors are extent of
tumour resection, age at diagnosis and baseline performance status (Karnofsky performance
status) (Ostrom et al 2018). In addition, certain genetic mutations have been found to confer
prognostic effect. These include IDH1, IDH2, MGMT and a 1p/19q co-deletion. In addition,

36
more supporting evidence comes to suggest cognitive function has also prognostic effect on
survival (Johnson et al 2012; Klein et al 2003).
Although meningiomas being the commonest type of all primary brain tumours, there is less
well-known prognostic information available, possibly due to lack of central database system
since central cancer registries not having the requirement to report benign brain tumours.
However, most studies suggest that age, tumour grade, and treatment factors are associated
with survival for meningioma patients (Pouratian et al 2010).
Prognostic factors associated with improved outcomes in low-grade gliomas include age
younger than 40 years at diagnosis, tumour smaller than 6cm at its largest diameter, a tumour
that does not cross the midline of the brain, histology subtype (oligodendrogliomas or mixed
types > astrocytomas) and no neurological impairment before surgery (Pignatti et al 2002).
Survival
Introduction:
In 1989 a project European Cancer Registry – Based Study on Survival and Care of Cancer
Patients (EUROCARE) was set up to measure and explain European cancer survival in
different European nations. It is currently at its 5th version, and update was released in 2015
for patient cohorts diagnosed between 2000 and 2007. It is the most concise and extensive
dataset for brain tumour survival statistics in Europe, as it includes both malignant and non-
malignant brain tumours (according to third revision of the International Classification of

37
Diseases for Oncology (ICD-O-3) (WHO 2013). On precise classification codes please
consult ICD-O-3 but for thesis purposes summarised in Table 1.5.
In addition, global perspective and UK comparison is provided by the latest study Global
surveillance of trends in cancer survival 2000-14 (CONCORD-3) (Allemani et al2018).
Survival is based on malignant brain tumours only (ICD-O-3 classification of disease, codes
C71-0 to C71.9 “Malignant neoplasms of brain (excluding cranial nerves, retrobulbar tissue).
It provides survival statistics based on more recent years (2010-2014) than EUROCARE-5.
As for all other cancer types, survival rate from brain tumour varies significantly by tumour
histology and grade of malignancy, with WHO grade I having the most favourable and grade
IV being associated with the poorest prognosis.
Table 1.5: ICD-03 codes for non-malignant primary CNS tumours. ICD-0-3 morphology Histology 9530 Meningioma (WHO grade I) 8272 Pituitary adenoma 9560 Schwannoma 9412 Dysembryoplastic neuroepithelial tumour 9540 Neurofibroma 9390 Choroid plexus papilloma 9080, 9492, 8815, 9582 Other¹ 9539/1 Meningioma (WHO grade II) 9421/1 Astrocytoma pilocytic 9161/1 Haemangioblastoma 9350/1 Craniopharyngioma 9505/1 Ganglioglioma 9394/1 Myxopapillary ependymoma 9150/1 Haemangiopericytoma 9383, 9752, 9506, 8680 Other²
¹Includes cases of mature teratoma, gangliocytoma, solitary fibrous tumour and granular cell tumour
²Includes cases of subependymoma, Langerhans cell histiocytosis, central neurocytoma, paraganglioma

38
Survival rates in the United Kingdom are consistently lower compared to most other Western
and Northern European countries, and this is true for both malignant (Visser et al 2015) and
non-malignant (benign) brain tumours (Sant et al 2012) (see below).
Gliomas
For gliotic tumours, survival varies significantly by grade across all glioma subtypes.
For instance, grade I pilocytic astrocytoma has the highest 5-year relative survival (94.4%),
while grade IV glioblastoma multiforme has the worst, with only <5% of patients surviving
>5 years post diagnosis (Ostrom et al 2019). Generally, gliomas with oligodendroglial
component are associated with better survival compared to those with more astrocytic
component (Ostrom et al 2014). Age is a significant prognostic factor and survival decreases
sharply with advancing age beyond 65 (Visser et al 2015).
CNS Lymphomas
This is a rare but highly aggressive primary brain tumour, a variant of extranodal non-Hodkin
lymphoma (NHL) that involves the brain, leptomeninges, eyes, or the spinal cord without
evidence of systemic disease. If left untreated, on average survival is about 1.5 months from
the time of diagnosis. Survival substantially increases with chemotherapy and radiation
therapy. Population-based studies estimate 5-year survival for immunocompetent adults
about 30% (Shiels et al 2016).
EUROCARE 5:

39
According to previous European population-based studies, including recent EUROCARE 5,
lower survival rates (both short term (1-year) and long term (5-year) were observed for the
UK in comparison to other European regions (see Table 1.6 for further information). Some
researchers have put forward explanation to account for this discrepancy including
differences in resource allocation to health care (Gatta et al 2013) but this does not explain
the survival differences in countries with similar medium-to-high total national expenditure
on health such as the UK, Denmark. Instead, diagnosis at advanced stage of cancer resulting
in reduced chances of receiving potentially curative or successful treatment may account for
some of those differences seen. Thus, patients diagnosed at an early stage are more likely to
survive cancer, putting emphasis on early cancer diagnosis. Extensive amount of research has
been invested in understanding the causes for delayed diagnosis, which will be discussed in
much detail in the following chapters.
Table 1.6 : age standarides 1-and 5- year relative survival (RS) with 95% confidence interval (CI) for neuroepitheliai brain tumours, by European region (Adapted from Visser et al 2015)
European region Study period 2005-2007
1-year RS 95% CI 5-year RS 95% CI Ireland and UK 42.3 41.5-43.2 18.4 17.6-19.1
Northern Europe 59.4 56.9-62.0 28.0 25.4-30.9 Central Europe 51.1 49.9-52.4 24.4 23.2-25.7
Southern Europe 45.7 42.2-49.4 N/A Eastern Europe 42.4 41.2-43.7 19.3 18.2-20.5
Europe (all) 47.7 46.7-48.7 17.2 16.6-17.7
CONCORD-3 (data for 2010-2014)
According to this global study, 5-year survival for primary malignant brain tumours in the
UK consistently remain lower than in other similar European countries, yet there is some

40
evidence in trends of increasing UK survival by approximately 6-10% over the decade
between 2000 – 2004 and 2010-2014 (Allemani et al 2018).
Table 1.7: Age-standardised 5-year net survival (%) with 95%CI diagnosed with primary malignant brain tumours between 2010-2014 (Adapted from Allemani et al 2018)
study period
2010-2014 European region 5-year survival 95% CI UK 26.3 25.7-26.8 Denmark 38.9 37.3-40.6 Norway 36.8 34.9-38.7 Sweden 31.6 30.1-33.0 Finland 37.6 35.7-39.4 Germany 29.6 28.3-30.9 Netherlands 28.2 27.2-29.3
Other benign primary brain tumours:
Meningioma WHO grade I and II, pituitary adenoma, schwannoma, pilocytic astrocytoma,
haemangioblastoma.
Survival outcomes from population-based studies for non-malignant brain tumours are
generally scarce and less complete, mainly because historically registration of such tumours
into cancer registries was not mandatory until 2004 in the US and nearly a decade later in
Europe.
Data from EUROCARE project suggested a 5-year relative survival rate of approximately
85% for patient cohort diagnosed between 1996 to 2002 (Sant et al 2012). Subsequent study
for patient cohorts between 2005-2010 documented significantly higher 5-year relative

41
survival of approximately 96.1% (see figure for graphical representation), this likely
reflecting advances in the field of neuro-oncology over the last decade. In particular,
improved diagnostic imaging techniques could allow earlier diagnosis as well as better
visualisation of tumour for surgical planning (Modan et al 1992) since neurosurgical
resection is considered the standard of care for the majority of non-malignant CNS tumour
types (Woehrer et al 2013). Increasingly there is a role for radio- or chemotherapy, as well as
hormonal therapy, and stereotactic radiosurgery for certain types of tumours, including
pilocytic astrocytoma (Grekow et al 2012), subtypes of pituitary adenoma (Vroonen et al
2012) or atypical meningiomas (Coskun et al 2013).
Figure 1.3: Cummulative relative survival rates of patients with non-malignant CNS tumours over the period between 2005 to 2010. (Adapted from Woehrer et al 2013)

42
ICD-03 tumour behaviour codes: 0 benign , 1 borderline. Geographical variations were also noted in the Sant study, however this was prior to more
widespread introduction of radical therapeutic options. Overall 5-year relative survival (RS)
was significantly lower in the UK and Ireland (77.4%, 95%CI 75.2-79.5) compared with that
in Northern Europe (90.6%, 95%CI 89.2-91.9) and European average (85%, 95%CI 83.9-
86.7) but similar to Eastern European countries (78.2, 95%CI 72.1-83.4).
However, when survival was assessed by tumour morphology, no distinctive differences were
observed. For example, 5-year RS for meningiomas in the UK was 85.9% (95%CI 82.8-
88.7), Eastern Europe (79.5, 95%CI 73.1-85.0), and Northern Europe (93.4%, 95%CI 91.3-
95.2). For tumours of ependymal and choroid plexus origin, similarly, UK 5-year RS was
similar (84.8%, 95CI 77.0-90.5), Southern Europe (88.1, 95%CI 74.7-95.6), Northern Europe
(86.3%, 95%CI 77.5-92.3).
Metastasis:
Survival from brain metastatic tumours is summarised by Ostrom and adapted in Table 1.8
for thesis purposes. Whereas short term survival from brain metastasis is variable depending
on primary site, half patients with lung primary survive 1 year, in contrast to fewer than fifth
with colorectal cancer. Long term survival (5-year) is dismal regardless of primary tumour
type.

43
Table 1.8: survival after diagnosis (1-year and 5-year) with brain metastasis by primary cancer type (Adjusted from Ostrom et al)
Period survival Primary site Country Years 1-year 5-year Breast (Fabi
2011) Canada 2004-2007 58%
Breast (Hall 2000)
US 1973-1993
1.30%
Lung(Fabi 2011) Canada 2004-2007 51%
Lung(Hall 2000) US 1973-1993
0% Melanoma(Fabi
2011) Canada 2004-2007 40%
Melanoma (Hall 2000)
US 1973-1993
2.30%
Renal (Bennani 2014)
France 1997-2012 60.20%
Renal (Shuch 2008)
US 1989-2006
12%
Colorectal(Fabi 2011)
Canada 2004-2007 18%
Colorectal(Michl 2015)
Germany 1998-2011
0.40%
Chapter summary:
Primary malignant brain tumours are associated with very poor survival, and little change has
been seen over the past decade despite optimal therapy (Stupp et al 2005; 2014). In contrast,
significant improved survival was observed for non-malignant primary brain tumours in
Europe, thus reflective of improved neuro-oncological diagnostic and therapeutic options.
Large population-based studies consistently document lower survival from both malignant
and non-malignant brain tumours in the UK compared to other European countries of similar
wealth. Reasons for this discrepancy are complex and multiple, however delayed presentation
is considered to account for this, at least in part.

44
Chapter 3
Early brain tumour diagnosis
“early detection and diagnosis are essential to improve a person’s chance of survival from
cancer”, Health and Social Care Secretary, Matt Hancock, July 2019.
General introduction: historical perspective
The first scientific approach to define or introduce the concept of cancer delay was
introduced by Pack and Gallo (Pack GT, 1938)). They defined it as “undue patient delay”
somewhat arbitrary if “three months or more elapsed time between discovery of symptoms
and a visit to a physician. Other researchers have used different time points (eg one month,
30 days, eight weeks, 25th and 75th quartiles or interval greater than the median. The total
delay is usually divided into patient and provider delay. There has been, however, increasing
emphasis to drive away from the concept of “diagnostic delay” but rather discuss the theme
in a more optimistic notion termed “early diagnosis”. According to World Health
Organisation, early diagnosis is defined “as the early identification of cancer in patients who
have symptoms of the disease” (WHO 2017, p.8).
Promoting Cancer Early Diagnosis
Early diagnosis of cancer focuses on detecting symptomatic patients as early as possible, so
they have the best chance of survival or successful treatment available to them (WHO 2017).

45
Screening, however, is a different public health strategy and refers to “the presumptive
identification of unrecognised disease in an apparently healthy, asymptomatic population by
means of tests, examinations or procedures…” (WHO 2017).
Since brain tumours in the majority of cases do not have a predisposing cause, as such there
are no currently available risk factors for screening, research focuses on symptomatic
diagnostic process in early detection.
Defining the pathway
In this section I briefly present global efforts led by World Health Organisation (WHO) to
tackle early cancer diagnosis in general terms, as well as associated barriers and measures to
overcome them. In the second part of the chapter I discuss UK based policies introduced
since 2000 in early cancer diagnosis with a view of brain tumour diagnosis.
Steps to early cancer diagnosis
According to World Health Organisation, there are 3 steps identified that are essential to
cancer diagnosis in general (Figure 1.4), namely:
(1) awareness of symptoms and health-seeking,
(2) diagnosis, and
(3) treatment.
These steps occur at different time points in the continuum of the cancer pathway. Delay can
occur at any point in this pathway to cancer diagnosis, however studies show that longer

46
interval is normally seen more on the left side of the representation for reasons I discuss later
in the chapter. In order to improve chances of early diagnosis, and ensure maximal survival
of patients with cancer, these three steps of early diagnosis, that is from symptom onset to
treatment commencement, should be less than 90 days, according to WHO (WHO 2007).
In order to maintain the same level of understanding, definitions and terms employed need to
be formulised across the studies. A framework developed by Olesen and colleagues (2009) is
recommended to be applied across international studies in this area (see Figure 1.5). Each of
the three steps as suggested by WHO corresponds to the appropriate time points on Aarhus
criteria and definitions, respectively, are summarised in Figure 1.5). The overall goal of the
Aarhus framework will allow consistency across the studies in breaking down the elements of
the time to diagnosis pathway, allowing strategies to be developed to influence each
component (aka time point).
Figure 1.4: Common barriers to early cancer diagnosis (Adapted from WHO 2017)

47
(1) (2) (3)
Figure 1.5: Time points on a clinical diagnostic pathway cancer diagnosis (Adapted from Olesen et al 2009)
Step 1: Awareness and accessing care = Patient interval
In this first step, essentially, patient needs to be aware of specific symptoms associated with
cancer and be able to take a conscious decision to see appropriate help to investigate.
WHO Aarhus
“symptom appraisal” – period from detecting a
bodily change to perceiving a reason to discss the
symptom with a health-care practitioner
Health seeking behaviour – period from perceiving
a need to discuss the symptom with a health-care
Time point when first bodily changes and symptoms
are noticed. Researchers should consider this
definition to encompass several key components: the
date when the first bodily change was noticed, the
date when the first symptom was noticed, the date
when the person perceives a reason to discuss the

48
practitioner to raching the health facility for an
assessment .
symptom with a health-care professional and the date
when the first ‘alarm’ or ‘high-risk’ symptom was
noticed.
Step 2: Clinical evaluation, diagnosis and staging (aka Diagnostic interval)
It describes a number of time points, but essentially this refers to the patient being in a loop
of healthcare evaluation for suspected cancer. The health care provider has to have raised
level of suspicion, clinical skills and means to make accurate decision to investigate. Then
patient should receive diagnostic testing either through primary care or following referral to
secondary care to confirm or exclude cancer diagnosis. Delays in this time interval may occur
at multiple points and for various reasons, but largely can be due to: (a) inaccurate clinical
assessment, (b) inaccessible diagnostic testing, pathology and staging, (c) poor coordination,
(d) loss or ineffective follow-up (WHO 2017). According to Pack and Gallo (1938), they
defined one month as “adequate time for the physician to take appropriate action”. However,
this again is arbitrarily established historically.
Step 3: Commencement of treatment
Last stage on the pathway is commencement of treatment. According to WHO, patients with
cancer must have to have access to high-quality, affordable treatment in a timely manner.
According to NHS England, the ’62-day wait’ target, which states that 85% of cancer patients
should receive treatment within 62 days of being urgently referred for suspected cancer by
their GP, has been breached on the year and year basis since 2013/2014 since their

49
introduction in 2009. While the recent data for the first quarter of 2018/19 indicates that
performance has reached an all-time low at 79.2% (NHS Providers).
Potential barriers to early cancer diagnosis: worldwide perspective
In brief, potential barriers to any cancer early diagnosis, including the brain tumours, are
universal and can be summarised as below: poor symptom awareness among the public,
insufficient knowledge at the primary care level about cancer symptoms and signs, poor
accessibility to health care at any level, but in particular primary care, low quality of
diagnosis (waiting lists, errors in diagnosis, unclear referral pathways), poor rapport or
confidence in health care professionals (WHO 2017).
Figure 1.6: Graphical representation of potential barriers to early cancer diagnosis (WHO)

50
The UK: Early diagnosis of cancer: past, present, future.
In the following paragraphs I discuss the strategies established by the UK Department of
Health to speed up time to cancer diagnosis with reference to brain tumours. Lastly, I will
discuss the current evidence on the impact of early brain cancer diagnosis on clinical
outcomes.
The first cancer plan for England was published in 2000 (DoH 2000). It had four aims:
1. To save more lives
2. To ensure people with cancer get the right support and care as well as the best
treatments
3. To tackle the sociodemographic inequalities
4. To build for the future through investment in the cancer workforce, strong research,
through preparation for genetics revolution.
Whilst more and more resources have been put forward by the UK Government for cancer
care, cancer reported outcomes in the UK are lower compared to countries of similar wealth.
Moreover, there still remain unacceptable geographical differences in cancer survival in
England and the UK as a whole.
Late diagnosis resulting in poor survival has been quantified. Abdel-Rahman (2009)
estimated that over 5000 deaths in England would be avoided annually within 5 years of
diagnosis if cancer survival rates were similar to the European average. The consensus is that
the biggest reason for this is advanced stage of disease at diagnosis (as discussed earlier in
the chapter) (CRUK;Abdel-Rahman et al 2009; Neal 2009) however it is clear that the

51
relationship is complex and highly dependent on the primary tumour type, as well as other
factors (discussed earlier). Nevertheless, it should be acknowledged that survival differences
could also vary due to treatment differences across European countries, differences in
organisation of health care and cancer registration databases.
Cancer Reform Strategy (Department of Health 2007), recognising this gap, launched
National Awareness and Early Diagnosis Initiative (NAEDI) in 2008. Its main aim was to
address lower cancer survival by improving the number and proportion of cancers diagnosed
and treated at early stage, thus focusing on symptomatic presentation and diagnostic
improvements across the diagnosis pathway (Richards 2009). It is recognised that the nature
of presenting symptoms can critically influence the length of the diagnostic time of any
cancer time (Koo et al 2018).
Secondly, increasingly more emphasis is being placed on the early interactions between the
patient and their primary care physicians in the cancer pathway. Over 90% of all cancers are
diagnosed on the basis of symptomatic presentation (Emery et al 2014). In countries such as
the UK where GPs have a strong gatekeeper role, it is shown that up to 85% of all cancer
patients start in primary care by presenting signs or symptoms (Allgar & Neal 2005).
However, as we see in paragraphs below the level of primary care involvement in the
diagnosis of different cancer types is very variable, with brain tumours being most commonly
diagnosed at emergency departments (Swann et al 2018). Such finding has, in part,
underpinned policy changes in England that aims to support GPs in early cancer diagnosis
(Harrison et al 2019), by specifically focusing on symptom-based approach to referrals,
which are discussed in view of brain tumours in Paragraph below.

52
What are the symptoms of brain tumours?
In order to understand symptom-based referrals it is important to summarise main symptoms
or symptom-complexes that patients with brain tumours may develop. I will also briefly
describe efforts by several researchers to define level of risks of having a brain tumour
associated with these symptoms primarily aimed at primary care level.
Generally speaking, patients with brain tumours can present with focal (i.e. related to a
specific location in the brain that is affected by the lesion) or generalised symptoms.
Symptom duration can be very variable, from days to weeks or months or even years. The
duration is likely to be related to the speed of growth and the location of the tumour. For
example, tumours that are more aggressive in nature and that involve brain structures in
frontal, parietal lobes or affecting optic radiations tend to cause symptoms earlier in the
disease trajectory. Conversely, tumours located in the prefrontal lobe, temporal or corpus
callosum will often manifest in cognitive dysfunctions such as personality change, affective
disturbances and short-term memory deficits (Lapointe et al 2018) which can take longer
time to manifest or be appreciated by patient or their relative.
Brain tumours may also present with first generalised symptoms, that are not specific to a
certain anatomic region of the brain. According to Grant (2004), headache is the commonest
first symptom, affecting a quarter of all patients with primary brain tumours (23.5%),
followed by seizures (21.3%). Approximately 15% of patients may develop symptoms of
increased intracranial pressure such as progressive headaches (worse in the mornings on
awakening, nausea and vomiting, drowsiness, blurred vision from papilloedema, horizontal
diplopia from cranial nerve abducens palsy) (Kirby &Purdy 201). What Grant’s study also

53
noted was that patients with initial non-focal symptoms commonly developed focal
symptoms or multiple symptoms by the time of hospital appointment and that these patients
tended to have longer time to diagnosis.
Symptom awareness – a recognised barrier to early diagnosis: How symptomatic
presentation of brain tumours reflects on time to diagnosis
Patient symptom appraisal and help seeking:
The nature of the initial symptom(s) is a one of the most significant predictors of help-
seeking behaviour by a patient. While focal “positive” symptom will be alarming for patient
or carer, patients with non-specific symptoms i.e. such as those that do not interfere with
daily activities, tend to present later (Macleod et al 2009; Grant 2004). In addition, socio-
demographics, psycho-social factors are contributory to time to diagnosis (Smith et al 2005;
Niksic et al 2015). Whilst help-seeking behaviour is not part of my study’s aims, it is
nevertheless worth briefly introducing the concept in general terms, and empathising the
absence of empirical evidence in relation to adult brain tumour patients (Penfold et al 2017).
Existing psychological models, such as the Model of pathways to treatment, Common Sense
Model of Illness Self-regulation (CSM) and Social Cognitive Theory (SCT) can be applied to
gain insight into these factors that influence cognitive processes within symptom appraisal
and help-seeking decisions. The Model of pathways to treatment (Scott et al 2013) specify
five events that are deemed to be key time points across the pathway:
1. Detection of bodily change(s)
2. Perceived reason to discuss symptom with a health care professional (HCP)
3. First consultation with HCP
4. Diagnosis

54
5. Start of treatment
Similarly, a study by Smith et al (2005) using meta-etnography analysis of patient help-
seeking experiences in relation to delays in presentation to GP with cancer, highlighted two
themes as of key importance, namely:
§ Recognition and interpretation of symptoms
§ Fear of consultation and fear of “being a time-waster”.
Of note, the study confirmed strong similarities of patients’ help seeking experiences across
different cancer types, including the brain.
A recently published qualitative analysis of 39 interviews of adult patients with recently
diagnosed primary brain tumours, with a focus on symptom appraisal and help-seeking
decision, showed that over 50% of them noticed “bodily changes” at least 6 months prior to
presentation to health care professional, while for 10 (26%) patients, the duration was much
longer, preceding 12 months or longer (Scott et al 2019). Such long symptom interval prior to
brain tumour diagnosis reported in these studies is in stark contrast to published reports
where data was collected from retrospective datasets.
GP recognition of symptoms interval:
Unfortunately, early symptoms of possible cancer can be complex and often resemble benign
self-limiting conditions that are seen in the primary care. The challenges that GPs often face
are reflective in reported observations which revealed that 38% of brain tumour patients in
the UK in 2013 consulted their GP more than 5 times before their diagnosis, while nearly two

55
thirds of all brain tumours (64.9%) are only discovered following presentations via
emergency department (Swann et al 2018), even when the same patient previously consulted
their own GP. People with brain tumours are also more likely to have a long primary care
interval compared to all other common cancers (Lyratzopoulos et al 2012; Lyratzopoulos et
al 2013).
Early work on epidemiology of cancer symptoms done in Denmark, showed that first
symptomatic presentation of cancer of any type in general practice can be categorised into 3
groups, each requiring a different type of response from a GP. About 50% of patients had
“obvious” alarm symptoms requiring an urgent referral, 20% had serious but cancer
nonspecific symptoms (termed “difficult to assess”) and a further 30% had normal
“common” vague symptoms but requiring a specific test to exclude the possibility or confirm
cancer (Jensen et al 2014). Consistently, over 50% of cancer patients in the United Kingdom
did not have the suspicious cancer symptom recorded as per the National Institute for Health
and Care Excellence guidelines for an urgent cancer referral recorded in the patient’s primary
care notes.
This therefore indicates that difference in the way brain cancer symptoms are recognised and
acted upon in a timely manner can contribute to diagnostic timeliness. Due to the rarity of
intracranial neoplasms, a GP may only see on average 4 patients with primary brain tumours
throughout their working time, it may be difficult for GPs to decide when an urgent referral is
warranted. For example, up to a quarter of patients with a brain tumour initially present with
a headache with or without cognitive symptoms, compared to 10% of patients with a
sensorimotor deficit (Grant 2004). Yet, the absolute risk of a brain tumour in a simple

56
headache presentation in primary care is exceptionally low at 0.09% (Hamilton et al 2007).
For other individual symptoms and the risk of brain tumours, summary is presented in Table
1.9 (adapted from Hamilton et al).
Table 1.9: Positive predictive value (PPV) associated with individual symptoms and the development of brain tumours (adapted from Hamilton et al 2007)
Individual symptom PPV (95%Ci)
Headache 0.09% (0.08-0.1)
Motor loss 0.026% (0.024-0.03)
New-onset seizure 1.2% (1.0-1.4)
Confusion 0.2% (0.16-0.24)
Weakness 0.14% (0.11-0.18)
Memory loss 0.036% (0.026-0.052)
Visual disorder 0.035% (0.025-0.051)
It is now known that certain patient symptom presentations can contribute to brain tumour
diagnostic delays. For instance, our group demonstrated that patients with a headache or
memory deficits would have a slower time to a diagnosis of a brain tumour (OR 4.11, 95% CI
1.10, 15.5), and 4.82, 95% CI 1.15, 20.1, respectively) (Ozawa et al 2018). We also found
that general practitioners were more likely to consider there had been a considerable delay in
referring patients with headaches only compared to other focal symptoms or seizure. In the
GO-AHEAD study (Glioma Outcome Auditing Healthcare in Edinburgh, Aberdeen and
Dundee) with 322 patients (Grant 2004), time to diagnosis from symptom onset was longest
when the first symptom was non-focal, such as headache, or behavioural or cognitive
changes.
Similarly, continuing on the theme of 3 different symptom classifications, based on the
Danish cancer study (Jensen et al 2014), time to diagnosis is significantly longer for patients
with non-alarm symptoms as judged by their GPs. The study illustrated this that if GP

57
regarded symptom as vague, 50% of cancer patients would wait at least one more month and
25% at least 2.5 months longer until diagnosis, compared with those with alarm symptoms.
Unfortunately, it is common for patients with headache, or headache “plus” subtle cognitive
symptoms, because of a brain tumour, to deteriorate while awaiting scanning, leading to
emergency admission. Patients with these symptoms are not generally selected for brain
scanning until there is clear evidence of focal neurology deficit, epilepsy prompting
emergency admission (Walker et al 2013). Brain tumours were most commonly diagnosed
after presenting as emergency at 64.9% compared to 16.5% of all cancers combined,
according to National Cancer Intelligence Network data of patients diagnosed with new
cancer in England in 2014 (Swann et al 2019). While only <9% of patients with brain
tumours were seen via the “2 Week-Wait” referral process compared to 51.8% of all cancers
combined. One-year survival for brain tumour for all ages is reflective of the route of
presentation, the lowest being for emergency presentation at 28% versus 49% for GP referral
(Ellis-Brookes et al 2012). Nevertheless, grade or type of tumour was not accounted for in the
study, and the poor survival could in fact be due to the so called “waiting-time paradox”
Crawford et al 2002).
There may be other clinical symptoms/signs to accompany headache in a patient with a brain
tumour. For example, disc swelling (papilloedema) is a direct evidence of raised intracranial
pressure which can be detected by a fundoscopic examination. Research however shows that
papilloedema or other visual deficits are often asymptomatic (Grant 2004) and that the majority
of referrers feel uncomfortable to reliably identify or exclude their presence (Webb &
Butterworth 2015). Formal assessment by optometrist would improve diagnostic accuracy.
Indeed, in a recent Brain Tumour Charity audit, approximately 20% of patients with evidence
of papilloedema/visual field deficit were referred by opticians.

58
Such findings point to the challenges of suspecting early symptoms suspicious of brain
tumour in patients attending for GP appointment at an early stage of their clinical illness. It
may also indicate that brain tumour patients may be an increased risk of deterioration at any
point in the diagnostic pathway leading to emergency presentation and diagnosis.
Steps of early diagnosis with relevance to brain tumours
Primary care assessment and referral:
The following steps describe the UK Government policies aimed at reducing the diagnostic
time of brain tumours primarily through earlier referral and diagnostic delays.
.
§ Development and introduction of National referral guidelines from primary care
(National Institute for Clinical Excellence NICE 2005; 2015).
It was first announced in 1999 for breast cancer initially and the widespread programme was
implemented in England for the rest of cancers in 2000 onwards. The aim was to facilitate
early cancer diagnosis. They guarantee that any patient suspected cancer would be able to see
a hospital doctor within 2 weeks of their GP putting an urgent cancer referral. These
guidelines comprised of clinical criteria or the level of urgency based on groups of symptoms
for an urgent outpatient cancer specialist referral, normally within 2 weeks (aka 2-week wait
urgent referrals for suspicion of cancer).

59
For CNS tumours, referral guideline is summarised in Table 1.10. Symptoms or groups of
symptoms are based on the assessment of the positive predictive value (PPV) of different
symptom combinations. In the updated guidance published in 2015, the PPV threshold was
set at 3% (NICE 2015). Usefulness and adherence to these guidelines have lately been
assessed and summarised below.
The effectiveness of this 2-week wait referral depends on the validity of referral being made,
that is whether it fulfils the referral criteria, and the presenting symptoms (Webb &
Butterworth, 2015). However, the guidance is often considered lengthy, complex and may be
difficult to recall for a GP in the middle of the consultation with the patient. Critically, Allgar
et al (2006) showed these to have a low predictive value generally in determining cancer and
may only be of value in prioritising patients who could gain least from urgent referral in
terms of survival. For instance, Neal reviewed 409 lung and 239 colorectal cancer patient
records at one hospital trust in England diagnosed between 2000-2001 and found that urgent
guideline referrals had later stage diagnosis (Neal et al 2007). This was also, as expected,
associated with poorer survival (p = 0.020). They concluded, thus, that while guidance is
effective in reducing referral delays, it actually exhibited the ‘waiting time’ paradox for lung
cancer and that GPs were able to identify the more advanced cancers more easily.

60
Table 1.10: NICE 2005 guidelines on specialist referral R
efer
urg
ently
Symptoms related to the CNS, including § progressive neurological deficit § new-onset/suspected recent onset seizures § headaches § mental changes § cranial nerve palsy § unilateral sensorineural deafness
in whom a brain tumour is suspected Headache of recent onset accompanied by features suggestive of raised intracranial pressure, for example:
§ vomiting § drowsiness § posture-related headache § pulse-synchronous tinnitus § or by other focal or non-focal neurological symptoms, for example blackout, change in
personality or memory § a new, qualitatively different, unexplained headache that becomes progressively severe
Con
sider
urg
ent
refe
rral
Patients with rapid progression of: § sub-acute focal neurological deficit § unexplained cognitive impairment, behavioural disturbance or slowness, or a combination of
these § personality changes confirmed by a witness and for which there is no reasonable explanation
even in the absence of other symptoms and signs of a brain tumour
Con
sider
non
-ur
gent
ref
erra
l Patients with: § unexplained headaches of recent onset: either present for at least 1 month, or not
accompanied by features suggestive of raised ICP
Specifically, for CNS tumours, the first systematic literature review on the outcomes of the 2-
week referral system concluded that the CNS cancer pick up rate was <10% and that 30% of
the referrals did not adhere to the agreed referral guidelines. The latter finding was indeed
comparable to other specialities. Panicker et al (2012) found an even lower pick-up rate of
new CNS tumours at 4.6% from the 2 week referrals to Walton Centre in Liverpool. In an
explorative analysis, Webb and Butterworth (2015) aimed to identify the determinants of
referrals resulting in a significant neurological diagnoses including a brain tumour. From 113
referrals to Milton Keynes General Hospital, all were found to have a brain tumour in which
a criterion was ticked as either focal neurology or seizure but with or without criterion of a

61
headache. Notably, no referrals solely referred for headache (28% of all) resulted in a
diagnosis of a brain tumour, and only 11% of referrals whereby headache was the sole
criterion resulted in a significant neurological diagnosis, compared to nearly 40% of referrals
where other criteria were ticked.
Similarly, Mitchel collaborated findings reported earlier where the number of CNS tumour
diagnosis is very much dependent on compliance to the referral guidelines. They reviewed all
2WW referrals for suspected CNS tumour to Newcastle Department of Neurosurgery from 1
January 2002 to 31 December 2011. It showed that the detection rate of CNS tumours was
significantly higher in referrals that complied with the guideline compared to those that did
not (32.0% vs 5.2%, p<0.05). They critically identified that non-compliant referrals which
however identified CNS tumours had a principal presenting complaint of cognitive decline.
NICE updated their CNS cancer referral guidelines in 2015 to completely exclude ‘headache’
or ‘cognitive/behavioural changes’ as referral criteria. The criteria are now much less
prescriptive, requiring clinical judgment by the GP. The referral text reads as below:
Consider an urgent direct access MRI scan of the brain (or CT scan if MRI is
contraindicated) (to be performed within 2 weeks) to assess for brain or central nervous
system cancer in adults with progressive, sub-acute loss of central neurological function.
(from NICE 2015 guidelines)
The challenge is that only a small proportion of suspected brain tumour patients are referred
via this urgent 2WW pathway. Only 1.6% of CNS tumours were made via this pathway at
one neuro-surgical centre in Newcastle (Hamdan & Mitchell 2013). Similarly, of all 35

62
cancer types studied, brain tumours were least likely referred by GPs via this pathway (5.9%)
compared to testicular (top of the list at 71.3%) and all cancers combined (50.7%) (Zhou et al
2018). What is also evident from studies assessing the impact of 2WW that fast tract referrals
have not improved patient survival outcomes in the UK (Hamdan & Mitchell 2013; Jiwa et al
2007).
o Scottish Referral Guidelines for Suspected Brain and Central Nervous
System Cancers
Scottish referral guidelines for CNS malignancy are considerably more descriptive in
their advice (NHS Scotland). It provides guidance on symptoms and the referral pattern
(ie. Emergency (same day referral, urgent suspicion of cancer referral, direct access to
imaging referral, as well as newly established optometry assessment for papilloedema
and/or targeted visual field testing).

63
Table 1.11: Scottish Referral Guidelines for Suspected CNS Cancer
Emergency (same day) referral Headache Patients with headache and/or vomiting with papilloedema Urgent suspicion of cancer referral Neurological deficit
Progressive neurological deficit (including personality, cognitive or behavioural change) in the absence of previously diagnosed or suspected alternative disorders (such as multiple sclerosis or dementia)
Seizure any new seizure, or seizures which change in character such as post-ictal deficit, headache, increased frequency
Good practice points
Consider urgent investigation/referral for patients with non migrainous headaches of recent onset, when accompanied by "red flag" features suggestive of increased intra-cranial pressure (for example: woken by headache; vomiting; drowsiness), progressive neurological deficit or new seizure disorder All NHS Boards have pathways for investigation of headaches which should include primary care direct access to imaging If any uncertainty about the presence of papilloedema, the person should be urgently referred to an optometrist for assessment. If there are red-flags suspicious of cancer as detailed above, a simultaneous urgent suspicion of cancer referral to secondary care should be made. If papilloedema is confirmed, the optometrist should refer directly to secondary care. An urgent suspicion of cancer pathway should exist in all NHS Boards for optometrists to refer directly to secondary care for people with optic discs suspicious of papilloedema.
§ Direct access brain computed tomography (CT) imaging from primary care
A strategy for improving UK cancer outcomes is the increased willingness to investigate
from primary care, as suggested in recent NICE and NHS Scotland guidance. In addition, this
is one of the 3 core messages by the Prime Minister :
“Delivering the prime minister’s commitment will require three things: capital investment for
additional diagnostic equipment, such as MRI and CT scanners, significant increases in the
cancer workforce to diagnose, treat, and support cancer patients, and help for staff to
improve complex services and get the most out of new advances in cancer care.”
However, concerns have been expressed that GPs may select patients for direct imaging
without adequate justification (CRUK 2015), as seen earlier in regards to common non-

64
adherence to referral guidelines (see text above), putting pressure on an already overused
radiology services in the NHS Boards.
In our study of the National Audit of Cancer Diagnosis in Primary Care (NACDPC), 20% of
GPs felt that better access to investigations would have reduced diagnostic interval to brain
tumour diagnosis, particular for less clear-cut symptoms such as headache or memory deficits
(Ozawa, 2018). Currently, availability of an open access CT (OACT) brain scanning, where
GPs refer patients with a suspected brain tumour directly to imaging without intermediate
specialist review, has been adopted in only some areas of the UK (Simpson 2010). The
updated NICE 2015 guidelines for adults with suspected CNS cancer now recommend direct
imaging in a form of an MRI or CT head (if MRI is contra-indicated) to be performed within
2 weeks. A greater emphasis from the updated NICE 2015 guidelines is on GPs to request
urgent investigations for suspected brain cancer more frequently (DoH 2012; Scottish
Government 2016). Generally, NHS England data show that one in four (26%) direct access
imaging tests to rule out cancer are from General Practitioners for the period of 2015/2016,
however brain imaging (MRI) contribute to only 1 in 10 to overall brain MRI requests (NHS
England 2016). There has been a significant year-by-year increase (growth by 36%) in uptake
of head MRI scans by GPs for that period compared to a year before, however significant
variation across the country exists in access to these investigations from primary care. In
contrast to other GP investigations for cancer (i.e. kidney ultrasound, abdomen ultrasound),
the waiting time (in days) from when a test was requested to when it was completed
decreased for MRI brain (from 26 to 21 days), yet it was significantly longer to what
guidelines suggest to be performed within 2 weeks (14 days) (NICE 2015). This may suggest
that while there is a steady increase in both availability and the use of diagnostic tests for

65
GPs, the overall benefit may be affected by high waiting times as a consequence of
outsourced radiology service.
Not directly related to brain, but there is some information on the availability of GP OACT
for chest, abdomen and pelvis cross-sectional CT imaging for different NHS Boards in
Scotland (https://www.scin.scot.nhs.uk/scin-work/scin-national-direct-access-to-imaging/).
There is a drive to improve the access for GPs. In 2018 only 3 NHS Boards had the CT CAP
access (Borders, Forth Valley, and Grampion). A year later (2019), 7 Boards (Ayrshire,
Borders, Dumfries and Galloway, Forth Valley, Grampian, Orkney, Tayside, Western Isles)
had the access while 2 more had ongoing progress to support GP access, namely Fife and
Lothian. No such data are yet available for CT Brain in these areas (via personal
communication with SCIN).

66
Figure 1.7: Availability of Direct Access to CT of Chest/Abdomen/Pelvis for patients with Unidentified suspected malignancy in each of the Scottish NHS Boards in 2018

67
Figure1.8: Availability of Direct Access to CT of Chest/Abdomen/Pelvis for patients with Unidentified suspected malignancy in each of the Scottish NHS Boards in 2019
Any increase in volume of referrals as a result of recommendations by NICE, or resulting
from other strategies aimed at promoting earlier diagnosis, will need to account for the
increased potential for incidental findings (IF), which are common , even in asymptomatic
patients (Morris et al 2009). There is currently no agreed consensus among radiologists
(Berlin 2013) on reporting of IFs and/or recommending follow-ups. Without specialist
radiology training, GPs may have to rely on common sense judgement interpreting and
relaying these reports onto their patients, which may cause considerable anxiety (Kernick,
Williams 2011) and ultimately lead to additional referral for the management of Ifs
(Benamore et al 2005; Taylor et al 2012). This is mirrored in a recent qualitative prospective

68
study with twenty GPs which identified the need for standardised reporting of scans to
improve GP’s use of direct-access MRI (Underwood et al 2017).
GP’s confidence in suspecting/diagnosing brain tumours in the community
In the following section, I present some of the findings from an informal meeting with
General Practitioners based in Lothian. We decided to run this event during the first part of
the project. One of the principal aims of organising the event was to learn about Lothian
GP’s experience in diagnosis of a brain tumour: from challenges in patient presentation, to
referral pathways available to them including a direct access head imaging. This was a
learning opportunity for us, as researchers, but also for GPs to find out more about the
project.
GPs had to register to attend the evening event on the Updates of Headache and were asked
to complete a short survey on diagnosis of brain tumours in adults.
Informal discussion with 29 GPs attending an organised educational evening event Primary
Care Update on Headache, supported by the Brain Tumour Charity (the BTC).
A brief introduction to the topic:
Daly and Collins (2007) ran a focus group of GPs in the Republic of Ireland who were asked
to identify barriers to early cancer diagnosis. Most commonly reported barriers by the
participants:
- delayed patient presentation,

69
- lack of direct GP access to radiological investigations,
- difficulty with referral of patients to hospital services,
- lack of clear recommendations for cancer screening,
- poor communication with hospital services.
Subjectively, GPs considered that the greatest barrier was the lack of direct GP access to
hospital investigative services, with variable availability across the country boards, and
resulting in delayed diagnosis due to long outpatient (outpatient waiting times). A recently
reported case in the BMJ at the time (Dyer 2017) served as a potential example for the
argument. A 37 year old woman had died from a brain tumour, having received the diagnosis
on the day of her death after presenting at the emergency department, despite having been
seen by her GP and several other hospital doctors previously. According to the report, late
Elaine Talbot died less than a month after developing headache with nausea. According to the
coroner, Dr Lisa Hashmi, doctors failed to revisit her migraine diagnosis in spite of
significantly worsening symptoms, and she was discharged with medication for migraine
from an outpatient clinic a week prior to her death.
While urgent CT head would not have prevented Ms Talbot’s death, the coroner maintained
the view that such service availability might prevent deaths in some future cases. The coroner
concluded that the death was due to natural causes, but added:
“a number of missed opportunities to investigate and escalate may have had a material
bearing on the timeliness of diagnosis, treatment and intervention for the presence of the
brain tumour eventually identified.”

70
Patient’s GP would have considered the service as an improvement to the standards of care in
the primary care, but also expressed concern on variability in the access across different
health boards:
“The deceased’s GP explained that he had no ability to make a direct urgent request for CT
scanning, unlike other GPs in neighbouring towns. He considered that such accessibility
would be beneficial”.
Underwood and colleagues (Underwood et al 2017) conducted a qualitative interviews with
20 GPs involved in headache clinics to explore their views of direct access imaging for
investigation of headache. They found that a normal scan resulted in resolution of uncertainty
for a patient and GP and helped with management towards discussion of preventative
treatment. However, commonly GPs expressed difficulty in interpreting radiology reports,
especially in relation to incidental findings and translating this to their patient.
The same researchers subsequently conducted qualitative interviews with 20 patients who
were referred for further investigation of headache. Half of patients were referred to
secondary care specialist pathway while another half were referred for primary care direct
access. What was of great significance, but seen to some extent in previous studies that a
normal imaging resulted in spontaneous reduction in headache symptoms, while for others it
allowed to focus more on symptom management. Patients felt that clinical aspects for service
improvement in the future were speed of MRI reporting, a standard template of reporting
procedures for GPs.

71
Organising the event:
We collaborated with 2 practising GPs in Lothian who are also co-researchers on the original
project on Early Brain Tumour Diagnostic Pathway, Dr Lorna Porteous, GP Lead for
Macmillan and Dr David Maxwell, Clinical Lead for Referrals. Once venue and format have
been agreed by the organising team (Dr Robin Grant and Mr Paul Brennan and myself and 2
GPs), Dr Porteous circulated the information of the event by sending a regular email to all
GPs in the Lothian area. We asked GPs to confirm attendance by phoning myself or by
booking a place on the website (https://headache-updates-gp.eventbrite.co.uk)
A day or two prior to the event, we asked attendees to complete an online questionnaire prior
to the event about how many patients in their working time they referred to secondary care
for a suspected brain tumour, and to describe, in brief, the diagnostic work-up and the ease
and availability of referral practice.
The format of the questionnaire is provided in Appendix A.
Results:
Twenty-eight GPs (out of 51 registered online for attendance) participated in the event. Of
those who completed the survey, the majority were females (n = 14, 83%), with an average of
11 years of GP practice. Generally, suspected brain tumour was very rare in GP’s experience
(mean 3.6, 95%CI 1.1-6.1), and the self-rated confidence of diagnosis was 3 [IQR 2, 4], with
1 being the least confident and 7 being most confident. We asked several practical questions
about headache and papilloedema. The majority of GPs attending the event would
“always/nearly always” perform a fundoscopic examination in patients complaining of

72
headache (n = 13, 76.5%) with few performing it “occasionally” (n = 4, 23.5%). However,
self-rated confidence of papilloedema diagnosis was low at 2 [IQR 1,4], with GPs citing a
lack of confidence in excluding papilloedema or poor equipment. This therefore suggests this
is a difficult examination at short visit time in primary care. When GPs were asked to identify
the 2 most common barriers to early brain tumour diagnosis, non-specific symptoms were
mentioned most commonly, followed by access to brain imaging and access to secondary
care/long waiting time to see a specialist. The huge majority of GPs thought that direct
access CT (DACT) was useful for patients presenting with suspicious headache (n = 16, 94%,
out of total 17 GPs answering this question) and that access to DACT could improve the
speed of brain tumour diagnosis (5 [IQR 4, 6], with 1 being the least confident and 7 being
the most confident).
Conclusion findings from the education event:
This was an informal discussion with practicing GPs working in Lothian area about their
experience of diagnosing/suspecting a brain tumour. The general feeling among GPs was that
early brain tumour diagnosis was challenging for various reasons including non-specific
symptoms and barriers to access into secondary care, and that direct access imaging of the
head was considered a useful adjunct to GPs ability to improve diagnosis time.
Achieving early cancer diagnosis:
Importance of early brain tumour diagnosis: what is the evidence?

73
Generally speaking, poorer survival in the UK for most solid cancers compared to other
Western or Nordic European countries of similar health-care national expenditure seem to be
highly related to more advanced stage of disease at diagnosis. Additionally, people
diagnosed earlier may also experience better care, lower morbidity, and potentially improved
quality of life (Neal Tharmanathan et al) Efforts to promote early diagnosis have been at the
forefront of international policy initiatives (Richards 2009; McPhail et al 2015).
However, stage at diagnosis may not be as important for brain tumours due to their intrinsic
biological properties (ie the majority (>90%) of HGGs arise de-novo in most cases, without
clinical or histological evidence of a less malignant precursor lesion (Ohgaki et al 2004), it is
thus hypothesised that more refined diagnosis may increase survival from brain tumours,
perhaps either by earlier diagnosis (by anticipating diagnosis) or because more effective
treatment can be applied if the diagnosis is accurate and precise (Sant et al 2012).
Nevertheless, little is known whether earlier brain tumour diagnosis in adults is associated
with better outcomes, which is one of the top 10 clinical research priorities for neuro-
oncology (Kurian et al 2018).
Generally, reducing time to diagnosis of brain tumours could offer opportunity to make an
impact at various levels in the community (from patient, physician to population on the
whole). The following potential benefits are suggested by David Walker and colleagues
(2013):
1. Intervene earlier in the disease’s progress and reduce the risk of acquired neurological
disability due to tumour-related brain injury prior to, or at the time of, surgery or radiation
therapy;

74
2. Reduce the number of initial operations conducted as urgent or emergency procedures owing
to severe raised intracranial pressure with the associated enhanced mortality and morbidity
risks;
3. Reduce patients’ and families’ anxieties about the consequences of avoidable delays in
diagnosis, whether they are due to patient and family delays, or physician and health system
delays;
4. Enhance the public’s confidence in the health services.
Do all patients with newly diagnosed brain tumours receive surgery as the first treatment?
According to Cancer statistics, between 50 – 60% of adults with brain tumours in England
between 2007 and 2010 got neuro-surgical first treatment in the form of debulking/excision
surgery (Brodbelt et al 2016). There were pronounced age disparities, that more younger
patients (16-24 years old) were treated surgically (approximately 70 – 80%) than older
patients (aged 70+) (approximately 30-35%) however no reasons for this were provided. One
of the most significant prognostic factors for survival from brain tumours is neurosurgical
treatment modality (Brown et al 2016) and therefore this seems intuitive that more patients
should be treated surgically to achieve maximum resection, if functional status allows, in
order to maximise their chances of increased survival.
Probably the most comprehensive data to demonstrate significance of early stage of cancer
diagnosis on certain treatment modalities came from the National Cancer Registration and
Analysis Service (NCRAS) (2018) . The analysis explored treatment modalities for all
cases for 22 different cancer types, however excluding CNS tumours, diagnosed in England
from 2013 to 2014. It showed that most patients diagnosed at stage 1 had surgery as part of
their treatment (70%). In contrast, patients with a late stage diagnosis had surgery in 13%

75
only. This means that early stage cancer patients were more than 5 times as likely to be
treated with surgery but 3 times less likely to receive chemotherapy. While no such data
currently exists specifically for brain tumours, the message seems clear – the importance of
early diagnosis of cancer (of any type) is unquestionable. Patients diagnosed early are more
likely to receive treatment that gives them better chances of cure or prolonging survival while
simultaneously giving them fewer side effects affecting quality of life.
Unfortunately, no such data are available for brain tumours on NCRAS. In addition, it is not
clear how this observation between early stage of cancer and treatment modality can directly
relate to brain tumours. Since we know that in fact majority of high-grade brain tumours such
as gliomas arise “de novo” (primary GBM), while only the minority (less than 5%)
dedifferentiate from a lower grade tumour (secondary GBM) (Ohgaki et al 2004). Thus, one
may indeed argue that stage of brain tumour at diagnosis is not relevant to above discussion.
Nevertheless, we could hypothesise that earlier diagnosis of any brain tumour, however in
particular high grade, could lead to better outcomes by diminishing the extent of infiltration
of cancerous cells into the surrounding normal brain tissue. In addition, the progressive
enlargement of the brain tumour increases the risk of significant neurological damage due to
compression of adjacent neural structures/pathways or invasion caused by tumour growth or
a developing secondary hydrocephalus.
Literature on the time to diagnosis and survival from malignant brain tumours is limited and
the results are at best inconclusive. A systematic review titled “Is increased time to diagnosis
and treatment in symptomatic cancer associated with poorer outcomes? Systematic review”
(Neal et al 2015) found only one study (Balasa et al 2012) that included patients with CNS
cancer examining time to diagnosis and outcomes. It included patients with intrinsic spinal

76
cord cancer and study was primarily based on retrospectively collected data from on one
single neurosurgical centre in Romania. The authors reported outcomes on functional
neurological status post-surgery rather than survival and concluded that early diagnosis and
treatment represented the major favourable prognostic factors of this disease. However, the
study’s conclusions are limited due to methodological issues as they did not perform
adjustment analysis. While presence of research in this area is certainly encouraging,
methodological challenges prevent drawing sound conclusions from the aforementioned
studies.

77
Chapter 4
Recognising subtle symptoms of brain tumours:
I have previously discussed the National strategies to improve time to brain cancer diagnosis
by recognising suspicious symptoms and referring those patients via established pathways.
However, early symptoms are often non-specific and while not interfering with patient’s
ability to function, they may not be recognised by patient or carer until additional symptoms
occur. In the following paragraph, I discuss particular challenges associated with identifying
such symptoms referred to as “covert” symptoms and discuss a potential strategy for
assessing a risk of cognitive impairment, especially relevant in primary care.
To support GPs to identify people with suspicious symptoms of a cancer and who require an
urgent assessment by a specialist, NICE and Healthcare Improvement Scotland publish
referral guidelines around signs and symptoms (31, 39). As seen in above paragraphs, brain
tumours may present in multiple ways, with either “obvious” or “covert” symptoms/signs.
Where they are “obvious” such as focal symptoms, diagnosis is fast (34,35). Patients with
“covert” features will present late (34). The latter tend to be under-reported in retrospective
studies. Indeed, a prospective interview based study with 28 glioma patients and their spouses
revealed that in fact most patients had months of global mental dysfunction preceding the
symptom leading to a physician consultation (40).

78
Early recognition of “covert” features by the health professional is important as it may
improve the speed of diagnosis, which is discussed in more detail in Paragraph Xiiii
How common are cognitive symptoms in brain tumours?
In a recent systematic review of effect of brain tumour on neurocognitive functioning prior to
anti-tumour treatment, researchers (van Kessel et al 2017) were able to conclude that studies
reported underestimation of cognitive functioning in patients with diffuse glioma patients in
the past. They found that cognitive impairment occurs in more than half of all glioma patients
prior to treatment, across all cognitive domains, but predominantly involving word-finding
short-term memory or tasks involving executive functioning, and that variability is partly
explained by the increasing grade of malignancy, however more research on the influence of
tumour-related factors were needed.
While neurocognitive deficits in brain tumour patients may be found in one or several
domains such as executive functioning, language and memory, it is often recommended by
researchers to evaluate cognitive functioning at baseline using sensitive and wide ranging
tests. Yet, they often criticise the standard widely employed screening tests such as Mini-
Mental State Examination (MMSE) (Folstein et al 1975) and the Montreal Cognitive
Assessment (MoCA) (Nasreddine et al 2005) and that they cannot provide relevant
information due to poor sensitivity and domain-specific information (van Kessel et al 2017).
Assessment to identify/recognise covert symptoms (assessment to identify cognitive
symptoms)

79
Early recognition of “covert” features such as headache or memory, personality, behavioural
changes associated with brain tumours is important as it may improve time to diagnosis.
Patients presenting with such symptoms consistently are found to have delayed diagnosis
(Grant 2004; Salander et al 1999, Ozawa et al 2018) and not uncommonly are diagnosed after
having developed a focal or more obvious symptom (Grant 2004) . National strategies to
improve awareness and earlier identification of symptom significance are certainly justified. I
have, in previous paragraphs, discussed the challenges facing GPs recognising such
symptoms at risk of brain tumour, considering the low PPV (Table 1.9).
Neuro-cognitive symptoms are commonly detected in brain tumour patients, both
subjectively (Salander et al 1999; Peeters et al 2020) and objectively by cognitive testing
(Tucha et al 2000), yet historically they are consistently under-reported in research papers. In
a recent systematic review of effect of brain tumour on neurocognitive functioning prior to
anti-tumour treatment, researchers (van Kessel et al 2015) concluded that studies reported
underestimation of cognitive dysfunction in brain tumour patients. Generally, these cognitive
effects are thought to result from neoplastic processes due to compression, displacement,
destruction or ischaemia of neuronal tissue as well as associated cerebral tumour. Tucha
(2000) showed that nearly all patients (91%) at the time of diagnosis of glioma displayed
impairments in at least one area of cognition compared to normative data. Interestingly,
patients were seldom aware of these cognitive deficits initially and only 9% of participants
reported impairments in thinking in the previous weeks.
Cognitive impairment has been reported in patients with fast growing brain tumours such as
gliomas (Gempt et al 2017; Noll et al 2015; Wu et al 2011;Wefel et al 2016; van Kessel
2017, 2019), or metastases (Habets et al 2016), as well as low grade gliomas (Miotto et al

80
2011), but also benign slow growing tumours including meningiomas (Butts et al 2017; van
Nieuwenhuizen et al 2013), or pituitary adenomas (Bala et al 2016; Hendrix et al 2017).
While global cognitive impairment is documented in the majority of studies, all of these
studies utilised comprehensive neurocognitive batteries examining multiple cognitive
domains including perceptual speed, executive function, verbal working memory, short and
long term memory, verbal fluency. In addition, it is observed that the frequency of
impairment increases with the number of cognitive tests used.
One of the biggest barriers to routine use of comprehensive neurocognitive assessments in
acute setting is the financial and time cost associated with their use. Assessment requires
specialist expertise (ie neuropsychological), availability of a separate room from distraction,
and at least several hours for administering, scoring and interpreting the results (Olson et al
2011). Certainly, in primary care or acute admission setting cognitive testing is constrained
by limited time of consultation and such tests would not be useful for practical reasons. On
the contrary, short screening cognitive tools that can be administered by physicians or allied
health care professions during the short consultation are highly desirable. The assessment
should be sufficiently comprehensive to detect true cognitive impairment. In addition, they
should be free of charge and can be readily available to download from the Internet (Olson et
al 2011). A good SCT should be applicable to all and which allows physicians to assess all
subjects, regardless of personal traits, skills, sociodemographic, ethnic or cultural
characteristics.
Cognitive screening stools:
Mini-Mental State Examination (MMSE)

81
The most widely used screening test to assess cognitive function in brain tumour patients
(Bette et al 2019) is the Mini-Mental State Examination (MMSE). It contains items that
assess orientation, registration, attention and calculation, recall, language, repetition, reading,
writing, comprehension of commands, and drawing. It takes between 7 to 10 minutes to
compete. It has extensively been used in large clinical trials, likely due to findings of its
clinical prognostic utility in this patient population (Meyers et al 2000; Brown et al 2004;
Taphoorn & Klein 2004). Nevertheless, its continued use in clinical trials despite several
studies reporting low level of sensitivity for detecting cognitive impairment has attracted
much scientific scepticism. In an editorial commentary, Meyers and Wefer (2003) presented
their findings which showed that only 26 patients with brain tumours out of 52 were
classified as cognitively impaired on the basis of MMSE performance, essentially yielding a
sensitivity of 0.50 (95%CI 0.36 to 0.64). Moreover, the relative ease of the test often results
in a ceiling effect, where most patients achieve normal scores. Estimates suggest
approximately 80% of patients with mild cognitive impairment (MCI) obtain scores above
26. In addition, it pays little emphasis on assessment of executive function and verbal fluency
(Meyers & Wefer 2003; Smith et al 2007), unlike other assessment tools. Therefore, it is best
suited to detecting gross cognitive impairment such as in Alzheimer’s disease. According to
Meyers, ‘the use of a screening tool that lacks adequate sensitivity and that may provide
misleading information is not a wise use of money and resources’(Meyers 2003).
Montreal Cognitive Assessment (MOCA)
Often proposed as an alternative to MMSE, MOCA has been found to be more sensitive to
detecting mild cognitive impairment in brain tumour patients (Olson et al 2011; Olson et al

82
2010a; Olson 2010b). It relies more on tasks for frontal executive functioning and attention
(alternating trail-making, cock-and-cube drawing) than MMSE (Smith et al 2007) . It takes
approximately 10 minutes to perform and has 30 points to score. MOCA was found to be
well tolerated by patients with brain tumours without causing much fatigue (Olson et al
2008). Crucially, one study found cognitive impairment detected by MOCA in 80% of all
patients, compared with 30% by the MMSE (p < 0.0001) (score of 25 or below on each test).
The ceiling effect of MMSE was huge: of the 28 patients with a normal MMSE value, 71%
of those patients had impaired test performance on MOCA. In another study (Olson et al
2010b) comparing MMSE against MOCA in brain tumours patients, MOCA was found to
have superior sensitivity at detecting cognitive impairment than MMSE (61.9% and 19%,
respectively), however MOCA still failed to detect it in a large number of cases. A more
recent paper by Robinson (2015) concluded that MOCA has in fact ‘extremely poor
sensitivity for detecting cognitive impairments’ and emphasised the necessity for the use of
brief yet tailored cognitive assessment. Yet, the study reported that specific cognitive
domains were more impaired than others, such as object naming and verbal fluency, and
therefore cognitive screening tools are recommended to include assessment of these domains.
Addenbrooke’s Cognitive Examination-Revised (ACE-R) (Mioshi et al 2006)
ACE-R is a more comprehensive cognitive screening tool and includes assessment of 5
cognitive domains, namely attention and orientation, memory, verbal fluency, language and
visual-spatial skills. It gives a total score of 100 and takes about 15-20 minutes to administer
(Noone 2015). Although it is not as comprehensive as detailed neuro-cognitive battery, ACE

83
is able to identify cognitive impairment in global fashion, but also specify deficits across a
number of cognitive domains in brain tumours, unlike MMSE (Kerrigan et al 2012).
Kerrigan (2012) performed a study of Addenbrooke’s Cognitive (ACE) examination tool in a
155 radiologically suspected brain tumour patients before undergoing surgery. Researchers
showed that ACE tool was well tolerated by patients and that it was more sensitive than
Mini-Mental State Examination (MMSE) to detect baseline cognitive impairment. Twenty-
seven percent of patients were found to have impairment (score of 82 or below on ACE) in
contrast to only 6% of patients as revealed by MMSE ( a score of 24 or below). Deficits most
commonly identified were by tests of verbal fluency and visuospatial abilities. In a follow up
analysis assessing the frequency of mental incapacity in 100 presurgical brain tumour
patients, the same authors found that a subset of verbal fluency, semantic verbal fluency
(SVF) – “number of animals named in one minute” was most strongly predictive of mental
incapacity (Kerrigan et al 2014).
Due to the ease and short time of administration, the verbal fluency test has received
considerable amount of scientific attention in memory research.
General introduction to verbal fluency:
Verbal fluency assessment is one of the most commonly used tasks in any neuro-cognitive
screening (Lezak 1995) and are particularly sensitive to frontal lobe dysfunction (Stuss et al
1998; Baldo & Shimammura 1998). It aims to evaluate “the spontaneous production of words
under restricted search conditions” (p.499) (Strauss et al 2006). Verbal fluency tasks are

84
thought to require multiple cognitive processes, mediated by the executive function (EF)
(Mcdowd et al 2011; Ruff et al 1997) . Fluency tasks primarily consist of 2 forms:
a semantic task – subjects are given 1 minute and are asked to generate as many words as
possible belonging to the certain category, for example animals or food items.
A phonemic task – subjects again are given 1 minute and are asked to produce as many words
beginning with a certain letter of the alphabet. Most commonly used letters are F, A, S, P.
Semantic fluency
Semantic fluency performance relies heavily on the interplay of semantic associations within
the lexicon (Rohrer et al 1999), and is considered to be a good indicator for semantic memory
(Goni et al 2011). Damage to frontal and temporal lobes is associated with deficits on this
task (Robinson et al 2015; Laisney et al 2009; Baldo & Shimamura 1998; Troyer et al 1998
). Impairments in this task are frequently reported in conditions such as dementias including
Alzheimer’s (Graham et al 2004), Parkinson’s disease (Henry et al 2004), multiple sclerosis
(Henry et al 2006).
Phonemic fluency
The frontal area of the brain, in particular left frontal region, is thought to be mostly involved
in the task performance on the phonemic fluency (Baldo et al 2006).
Measures of fluency tasks: qualitative assessment

85
Traditionally, many studies have assessed verbal fluency performance by generating a total
number of words named. Studies with normally aging adults have reported similar means of
total words produced on semantic animal fluency task. Gladsjo et al (1999) reported a mean
of 19.54 (+/- 5.39) words generated, and a similar result found by Troyer (19.5, +/- 5.3).
According to dementia literature, a score of 17 or below on SVF indicates a concern while a
score or 15 or below may indicate mild cognitive impairment which may require additional
testing, with a sensitivity of 88% and a specificity of 96% (Canning et al 2004).
Troyer and colleagues (1997) further argued that VF is a multifactorial task, involving
multiple cognitive processes that organise, store and retrieve words. They proposed a two-
component model of fluency performance: clustering (the production of words within a
semantic or phonemic sub-category), and switching (the ability to shift efficiently between
clusters or new sub-category), which could reflect separable semantic and executive
processes in fluency performance, respectively. Different brain areas are thought to underlie
these separate processes. A number of studies showed that both clustering and switching
strategies greatly affect semantic fluency performance, while phonemic task is more
dependent on switching abilities. Clinical studies have also provided some evidence for this
theory with brain injured patients (Troyer et al 1998), temporal lobe epilepsy (Zakzanis et al
2011), Parkinson’s disease (Troster et al 1998) , Alzheimer’s disease (Troyer et al 1998;
Canning et al 2004), Huntington’s disease (Rich et al 1999) , multiple sclerosis (Troster et al
1998) . No study, to my awareness, has ever been conducted to test this theory with brain
tumour patients.
Verbal fluency: demographic effects

86
Aging:
Effect of aging on fluency performance is still debatable with mixed findings reported. Some
studies have found little to no decline with advanced age in healthy adults (Parkin & Java
1999), while others reported a significant decline with advancing age (Tombaugh et al 1999;
Mathuranath et al 2003). It is also suggested that increasing age may have differential effect
on each fluency task. For example, Mathuranath (2003) showed that age influenced animal
fluency more than letter fluency task.
Education:
It is generally accepted that the level of education significantly affects verbal fluency
performance; that is better performance is seen with increasing education level (Mathuranath
et al 2003;Tombaugh et al 1999). What is less clear however, is which task is more
susceptible to the effect of education. Tombaugh showed that the level of education
accounted for more variance for phonemic task compared to semantic fluency task, however
aging accounted for more variance in the latter task. Mathuranath reported a significant
influence of education on both fluency tasks. In contrast however, Standish (2007) and others
found the level of education to be the only significant factor for phonemic fluency scores in
older adults. Similarly, Gladsjo suggested that age and education had a greater impact on
phonemic letter fluency task but not on the animal naming fluency performance. While other
researchers suggested that the impact on fluency score performance will be relevant
depending on the task and specificity of categories being tested, that is whether animals or
supermarket food item.

87
Similar inconsistencies were reported in clinical dementia studies (Talbert et al 1997; Hall et
al 2007;Kawano et al 2010).
Verbal fluency test as a potential red-flag sign for brain tumour for a busy GP
The tasks typically used for assessment of executive function are complex, often involving a
number of different cognitive processes (Mcdowd 2011), and take up a considerable length of
time for completion in the neuro-cognitive test batteries. As such, shorter cognitive screening
tools that are sensitive enough to detect such impairment and which can be used in daily
clinical practice, particularly in the primary care, for this patient cohorts are highly desirable.
Moorhouse reported that most GPs spend only 11 minutes consulting each patient, thus they
require a screening told that can be administered and analysed quickly (Dalziel). Due to the
task’s reliance on multiple cognitive processes overseen by executive function, it is thus
postulated that such screening tool could be used as a proxy measure of cognitive impairment
globally.
We earlier performed a local retrospective audit analysing verbal fluency scores of brain
tumour patients according to their reported first symptoms. We found 40% of patients with an
impaired test performance (as reflective by the score ≤ -1.5 SD below the mean of healthy
normative data reported elsewhere (Tombaugh et al 1999)). In comparison, only 24 % of
patients were classed as impaired on MMSE (cut off score 26 or below). In addition, we
showed that patients with reported initial vague symptoms such as headache or personality,
memory changes had lower scores on animal fluency (Zienius et al 2016). Nevertheless, the
criticism obviously is that the audit did not have a comparison group but used the normative

88
data published elsewhere (Tombaugh et al 1999). Therefore, whether similar observation can
be found in a study with a control group is required.
Fluency tasks have often been used as a screening tool for capacity in brain tumour
patients. Capacity assessment requires functioning level of cognitive processes, and
therefore studies that attempted screening for capacity by the use of cognitive testing are
worth mentioning here to further advance its applicability. Kerrigan and colleagues (2014)
assessed capacity in 100 patients with radiologically suspected intracranial tumours in
Edinburgh. They used MacArthur Competence Assessment Tool for Treatment (MACCAT-
T) for formal capacity assessment and cognition was assessed by ACE-R. They showed that
incapacity was statistically associated cognitive impairment. But most crucially and of
relevance mention here was that semantic verbal fluency score of 10 or less was highly
associated with incapable patients with 96% sensitivity and 63% specificity.
Moreover, in a recent systematic review by our group (Hewins et al 2019), animal (semantic)
fluency task (SVF) has been found to be one of the most consistently used tool, but also most
significantly associated with incapacity. We thus concluded that specific items in a cognitive
testing batteries such as SVF, but also others such as (Hopkins Verbal Learning Test, Trail
Making Test A/B (TMT) can be considered as simple, easily applied tests that may act as
significant red flags to identify patients at increased risk of incapacity and who subsequently
would require additional cognitive/psychiatric evaluation if deemed required.
As such, so far, verbal fluency test has been found to be relevant in the brain tumour field.
However, its widespread clinical application as a quick screening tool to screen patients at
increased risk of cognitive impairment in patients with suspected of brain tumour requires

89
more rigorous testing. If that was found to be the case, it could serve as an objective clinical
factor for assessing/referring patients on a more urgent basis, especially those who presents
with less clear-cut symptoms such as headache, memory or personality changes.
In the following chapter, I will briefly introduce the main discussion points in relation to
methodological challenges for studying cancer diagnostic times and their influence on
outcomes.

90
Chapter 5
Studying cancer diagnostic pathway:
Methodological challenges studying cancer diagnostic timeliness
Historically, as we have discussed earlier in chapter xiii, Pack and Galo defined cancer delay
3 months or more. Each cancer type, of course, has its distinct characteristics and may not
behave clinically in the same manner to each other. This may thus suggest that diagnostic
time for each cancer type will not be of the same duration, but more likely variable as
depending on multiple factors. In fact, several studies have shown large variations between
studies in the diagnostic intervals within a single cancer type (colorectal) (Barrett et al 2006;
Korsgaard et al 2006; Hansen et al). Similarly, there was a huge heterogeneity found in time
intervals in studies as reported by systematic review (Neal et al 2015).
Secondly, one may wonder, why diagnostic time for different cancers should be studied at all.
According to Neal (2009), who writes: “while a small element of delay is inherently
inevitable in all cancer diagnostic pathways, it is likely that in a significant percentage of
patients there is considerable preventable delay. The important question is how much of this
preventable delay leads to poorer outcomes. If people could be diagnosed earlier, what
difference would this make to survival and other clinical outcomes?”. One of the best
examples of effect of systematic research into time to diagnosis is in paediatric neuro-
oncology via the HeadSmart campaign for early diagnosis supported by the Brain Tumour
Charity. Since the guideline (HeadSmart 2017) introduction in 2007 and the launch of public

91
awareness campaign in 2011, the time to diagnosis of childhood brain tumour has fallen
significantly from 14.4 weeks in 2006 to 9.1 weeks in 2011 and then to 6.7 weeks in 2015
(Liu et al 2017). In the recently published paper by Shanmugavadivel and colleagues (2020),
significant diagnostic time intervals were observed for different brain tumours of different
malignant potential in the paediatric population. Longest time interval was reported for
craniopharyngiomas, low-grade gliomas and optic pathway gliomas, with median time to
diagnosis (TDI) of 15.1, 11.9 and 10.4 weeks, respectively. The aforementioned studies
demonstrate that while public early diagnosis campaigns can make a significant impact on
diagnostic timeliness of paediatric brain tumours, tumour grade or degree of malignancy is
probably the most significant variable in this pathway.
Figure 1.9 : Symptom interval for diagnosis of paediatric brain tumours in the UK (2007-2012). Adapted from Walker, Hamilton, Walter and Watts (2013).
No such attempt at systematically studying diagnostic time of brain tumours has yet been
done in adults. In the first systematic review on time to diagnosis of cancer by Neal and

92
colleagues, only one study with CNS tumours was found to be included in their analysis. Yet,
multiple methodological limitations could be found in the study: it was relating to CNS spinal
tumours, notes on only 14 patients were analysed from a single neurosurgical centre in
Romania. There was no information given how authors measured times intervals, while data
were retrospectively reviewed.
What is then the norm interval to diagnosis? How should it be defined? And, thus, if interval
varies even between studies of one cancer, diagnostic time differences can thus be expected
when comparing different cancer types.
According to Neal (2009), there are many methods of measuring time interval and each has
its own problems. Examples can include prospective and retrospective cohort studies, reviews
of medical records, database analysis, patient surveys and interviews. Quality of obtained
information will vary depending on methods used. Equally, different data collection methods
should be used for specific diagnostic time points across the cancer pathway. Where in-depth
patient pathway is the focus, qualitative interviews with patients/and carers are preferred
(Weller et al 2012), allowing the use of open-ended questions to encompass the complexity
of early cancer related symptoms. Patient-centred studies are therefore most likely to
represent a truer ‘patient delay’ which is often found to be much longer than data obtained
from the NHS cancer survey (Allgar & Neal 2005). In contrast, secondary care case notes
are the primary resource for data on later stages in the diagnostic pathway (Weller et al
2012). It is known that while delays can occur in any part of the cancer diagnostic journey
(see Figure 1.5 ), the vast majority of delays occur before patients are seen in secondary care.
Two-thirds of pre-hospital delays are patient delays (time from onset of symptoms to
presentation), and one-third are primary care delays (time from presentation of symptom to
onward referral or diagnostic investigation). Detailed knowledge where disproportionally

93
increased time to brain tumour diagnosis appears logical, yet, no study to date has attempted
to quantify the pathway.
Approaches to studying time intervals are crucial to consider and detailed guidance is
provided by Weller et al (2012) (see Table 1.13). Most studies on early cancer diagnosis
involve retrospective data collection, possibly due to ease of access and availability of large
patient numbers to be analysed. Prospective studies are recommended to minimise the recall
bias (Friedman et al 2005). Researchers should identify bias and make every possible attempt
to avoid or minimise them (summary of potential bias is provided in Table 1.12).
Table 1.12: Examples of bias in early diagnosis research studies and recommendations to minimise them
Type of bias Recommendation selection bias high risk in case-control and retrospective cohort studies where exposure and outcome
have already occurred at the time of study inclusion. Risk is increased if only patients with good physical or mental functioning are included.
interviewer bias it can be minimised or eliminated if the interviewer is blinded to the outcome of interest recall bias interview should be held not too 'short' or too 'long' following diagnosis
questionnaire should be validated Survivorship bias
results in underrepresentation of patients with poor prognosis. If this is a interview study, recruitment should take place ideally soon after the diagnosis of tumour
Therefore, where in-depth patient pathway is the focus of a study, qualitative interviews with
patients/and carers can provide the most rich and reliable information (Weller et al 2012),
patient-centred studies are therefore most likely to represent truer ‘patient delays’. In cases
where data are gathered from in-depth interviews, format of questions is important, as
answers that patients give can vary hugely. Open-ended questions during consultation are
preferred to help ensure the complexity of cancer-related symptoms and their natural disease
course (Weller et al 2012). For instance, in-depth qualitative study by Salander (1999) in

94
Sweden showed that patients with brain tumours reported symptoms attributable to their
cancer for much longer than time interval reported by retrospective studies (Grant 2004) or
surveys with closed-response questions (Allgar & Neal 2005). For example, covert vague
symptoms such as headache or memory deficits or more global symptoms including fatigue ,
dizziness preceded diagnosis on average by about 7 months in the Salander study. In contrast,
motor or sensory dysfunction has a much shorter duration (less than 1 month). The findings
are consistent with other studies with a similar observation reported for other cancers
including lung (Corner et al 2005) and ovarian (Bankhead et al 2005).
Table 1.13. The propose Aarhus checklist for research in early cancer diagnosis The Aarhus checklist Item Y/N DEFINITIONS OF TIME POINTS AND INTERVALS 1.For studies requiring the measurement of an interval, are the beginning and end-points of this interval clearly defined? 2. For all time points and intervals described, are there precise, transparent and repeatable definitions, and is the complexity of time points such as the date of first symptom and date of first presentation addressed? For studies that require an estimate of the date of first symptom: 3. Do the researchers refer to a theoretical framework underpinning definition of this time point? 4. Is there a discussion of the different biases influencing measurement of this tie point? For studies that require measurement of a date of first presentation to healthcare: 5. Do the researchers discuss the complexity of the date of first presentation? For studies that require measurement of a date of referral: 6. Do the researchers discuss the nature of the referral and provide adequate detail - for example, whether it was for investigation or consultation by a colleague in secondary care? For studies that require measurement of the date of diagnosis: 7. Do the researchers use an existing hierarchical rationale for the date of diagnosis measurement? MEASUREMENT For studies using questionnaires and / or interviews with patients and/or health-care providers: 8. Has a validated instrument been used? 9. Have the researchers included a copy of their instrument? 10. Is there some discussion of how reliability and validity has been established? 11. Do researchers acknowledge the need for theoretical validation and make reference to the theoretical framework(s) underpinning measurement and analysis of the time points? 12. Is there discussion of the different biases influencing measurement of the time points, such as how and when the queston is asked and how is being asked? 13. Is the time of the interveiw in relation to the date of diagnosis provided? 14. Is there any triangulation of self-reported data with other data sources such as case notes? 15. Is data analysis described in full including how and why data are categorised, how missing and incomplete data are managed, and how outliers at both ends of the spectrum are accounted for?

95
Presenting symptoms can critically influence the length of the diagnostic intervals. However,
the challenge with symptom-based approaches to early diagnosis strategies is that as patient
clinical details are often retrospectively collected in most studies on early cancer diagnosis,
symptom reporting and recording can vary significantly across different databases. For
example, Davies and Clarke (2004) reported inconsistencies in symptoms reported by
patients through conducted interviews to those recorded in hospital records (Table 1.14).
Subtle symptoms such as fatigue, cognitive loss, or personality change were much less
commonly recorded in hospital records. It is possible, yet speculative, they were less likely
the symptoms that caused immediate admission.
Table 1.14: Symptoms at diagnosis of malignant cerebral glioma recorded in hospital records versus those elicited at home interviews
Symptom or problem
Recorded in hospital records (N = 92)
Elicited from patients and relatives at home interviews (N = 92)
Weakness 55 (60) 51 (55)
Headache 49 (53) 48 (52)
Epilepsy 35 (38) 44 (48)
Sensory loss 32 (35) 37 (40)
Cognitive loss 30 (33) 42 (46)
Dysphasia 29 (32) 23 (25)
Personality change
14 (15) 28 (30)
Fatigue 13 (14) 44 (48)
This therefore calls for more detailed study to collect such data to ensure data validity as well
as under-estimation of total diagnostic interval. In addition, authors are recommended to
apply the Aarhus checklist to improve consistency across studies and minimise bias.

96
References:
Abdel-Rahman M, Stockton D, et al. What if cancer survival in Britain were the same as in Europe: how many deaths are avoidable? Br J Cancer 2009;101:115-24. Allemani C, Matsuda T, et al. Global surveillance of trends in cancer survival 2000-14 (CONCORD-3): analysis of individual records for 37 513 025 patients diagnosed with one of 18 cancers from 322 population-based registries in 71 countries. Lancet 2018;391(10125):1023-1075. Allgar VL, Neal RD, et al. Urgent GP referrals for suspected lung, colorectal, prostate and ovarian cancer. Br J Gen Pract 2006;56(526):355-362. Allgar VL, Neal RD. Delays in the diagnosis of six cancers: analysis of data from the National Survey of NHS Patients: Cancer. Br J Cancer 2005;92(11):1959-70. Amer MH, Al-Sarraf M, Baker LH et al. Malignant mel- anoma and central nervous system metastases: incidence, diagnosis, treatment and survival. Cancer (1978;42: 660–668. Andersen ZJ, Pedersen M, et al. Long-term exposure to ambient air pollution and incidence of brain tumor: the European Study of Cohorts for Air Pollution Effects (ESCAPE). Neuro Oncol 2018;20(3):420-432. Aw-Zoretic J, Seth D, et al. Estimation of effective dose of lifetime attributable risk from multiple head CT scans in ventriculoperitoneal shunted children. Eur J Radiol 2014;83(10):1920-24. Baan R, Grosse Y, et al. Carcinogenicity of radiofrequency electromagnetic field. IARC. IARC monographs on the evaluation of carcinogenic risks to humans, vol 102. Non-ionizing radiation, part II: radiofrequency electromagnetic fields. Lyon: International Agency for Research on Cancer (in press). 2011 Bala A, Lojek E, et al. Cognitive functioning of patients with a PRL-secreting pituitary adenoma. Neurology 2016;86(8). Balasa AF, Gherasim DN, et al. Clinical evaluation of primary intrameduallary tumors in adults. Romanian J Neurol 2012;11(4):165-171. Baldo JV, Schwartz S, et al. Role of frontal versus temporal cortex in verbal fluency as revealed by voxel-based lesion-symptom mapping. J Int Neuropsychol Soc. 2006;12:896–900. Baldo JV, Shimamura AP. Letter and category fluency in patients with frontal lobe lesions. Neuropsychology 1998;12(2):259-67. Bankhead CR, Kehoe ST, et al. Symptoms associated with diagnosis of ovarian cancer: a systematic review. Int J Obs Gynae 2005;112(7).

97
Barnholtz-Sloan JS, Sloan AE, et al. Incidence proportions of brain metastases in patients diagnosed (1973 to 2001) in the Metropolitan Detroit Cancer Surveillance System. J Clin Oncol 2004;22(14):2865-2872. Barrett J, Jiwa M, et al. Pathways to the diagnosis of colorectal cancer: an observation study in three UK cities. Fam Pract 2006;23(1):15-19. Bauchet L & Rigau. Epidemiology, pathogenesis and risk factors of brain tumours. ESMO Essentials for Clinicians NeuroOncology. Accessed from WWW on 15 October 2019. https://oncologypro.esmo.org/content/download/120111/2102186/file/2017-ESMO-Essentials-for-Clinicians-Neuro-Oncology-Chapter-1.pdf Benamore RE, Wright D, et al. Is primary care access to CT brain examinations effective? Clin Radiol 2005. Bennani O, Derrey S, et al. Brain metastasis from renal cell carcinoma. Neurochirugie 2014;60:12-16. Benson VS, Kirichel O, et al Menopausal hormone therapy and central nervous system tumor risk: Large UK prospective study and meta-analysis. Int J Cancer 2014;136 (10) Berlin L. How do you solve a problem like incidentalomas? Applied Radiol 2013;42(2):10-12. Bette S, Ruhland JM, et al. Risk factors for neurocognitive impairment in patients with benign intracranial lesions. Sci Rep 2019;9 Bray F, Engholm G, et al. Trends in survival of patients diagnosed with cancer of the brain and nervous system, thyroid, eye, bone and soft tissues in the Nordic countries 1964-2003 followed up until the end of 2006. Acta Oncologica 2010;49:673-693. Brodbelt A, Greenberg D, et al. The incidence and Outcome in England of Patients with Brain Tumours: TYA to the Elderly. NCIN CNS tumours workshop April 12th 2016. Brown PD, Buckner JC, et al. Importance of baseline mini-mental state examination as a prognostic factor for patients with low-grade glioma. Rad Oncol 2004;59(1):117-125. Brown TJ, Brennan MC, et al. Association of the extent of resection with survival in Glioblastoma: A systematic review and meta-analysis. JAMA 2016;2(11):1460-1469. Burnet NG, Jefferies SJ, et al. Years of life lost (YLL) from cancer is an important measure of population burden – and should be considered when allocating research funds. Br J Cancer 2005;92:241-245. Butts AM, Weigand S, et al. Neurocognition in individuals with incidentally-identified meningioma. J Neurooncol 2017;134(1):125-132. Cancer Research UK (CRUK). Accessed on 15 September 2019. https://www.cancerresearchuk.org/about-cancer/brain-tumours

98
Canning SJD, Leach L, et al. Diagnostic utility of abbreviated fluency measures in Alzheimer disease and vascular dementia. Neurology 2004;62(4):556-62. Collins VP. Pathology and Molecular Genetics of Common Brain Tumors. In Neuro-Oncology by Rees J, Wen PY (eds). Collins VP. Pathology and molecular genetics of common brain tumors. Neuro-Oncology. (ed J Rees and PY Wen). 2010. Saunders: Philadelphia Corner J, Hopkinson J, et al. Is late diagnosis of lung cancer inevitable? Interview study of patients’ recollections of symptoms before diagnosis. Thorax 2005; 60(4):314-9. Coskun M, Straube W, et al. Quality assurance of radiotherapy in the ongoing EORTC 22042-26042 trial for atypical and malignant meningioma: results from the dummy runs and prospective individual case reviews. Radiat Oncol 2013;8:23. Cox J, Komaki R. Prophylactic cranial irradiation for squamous cell carcinoma, large cell carcinoma, and adeno- carcinoma of the lung: indications and techniques. In: C Mountain, D Carr (Eds.), Lung cancer: current status and prospects for the future. The University of Texas System Cancer Center M. D. Anderson Hospital and Tumor Institute Annual Clinical Conference on Cancer. Year Book, Chicago. 1986. Crawford SC, Davis JA, Siddiqui NA, et al. The waiting time paradox: population based retrospective study of treatment delay and survival of women with endometrial cancer in Scotland. BMJ 2002;325:196. Crocetti E, Trama A, et al. Epidemiology of glial and non-glial brain tumours in Europe. Eur J Cancer 2012;48(1):1532-42. CRUK: 2020 Delivery. Horizon Scanning. Published date: Sep 2015. Dalziel WB. Targeted screening for dementia. The Canadian Review of Alzheimer’s Disease and Other Dementias. Accessed from WWW on 15 December 2019. https://alzheimer.ca/sites/default/files/files/national/for-hcp/hcp targeted screening for dementia e.pdf Davies E, Clarke C. Early symptoms of brain tumours. J Neurol Neurosurg Psychiatry 2004;75(8):1205-6. De Angelis R, Sant M, et al. Cancer survival in Europe 1999-2007 by country and age: results of EUROCARE-5 – a population-based study. Lancet Oncol 2014;15(1):23-34. Del Rio Rousseau et al Primary CNS Lymphoma. Neuro-Oncology. (ed J Rees and PY Wen). 2010. Saunders: Philadelphia Department of Health (DoH). Direct Access to Diagnostic Tests for Cancer.2012 Accessed from WWW on 15 October 2019: https://assets.publishing.service.gov.uk/government/uploads/system/uploads/attachment data/file/216503/dh 133511.pdf

99
Department of Health (DoH). Improving Outcomes: A Strategy for Cancer. 2011. Access from WWW on 10 September 2019. https://assets.publishing.service.gov.uk/government/uploads/system/uploads/attachment data/file/213785/dh 123394.pdf Department of Health (DoH). The NHS Cancer Plan: A plan for investment, a plan for reform.2000. Accessed from WWW on 10 October 2019. https://www.thh.nhs.uk/documents/_Departments/Cancer/NHSCancerPlan.pdf Dyer C. Give GPs access to urgent CT scans. BMJ 2017;357:j2815. Elliss-Brookes L, McPhail S, Ives A, et al. Routes to diagnosis for cancer - determining the patient journey using multiple routine data sets. Br J Cancer 2012;107:1220–6. Emery J, Shaw K, et al. The role of primary care in early detection and follow-up of cancer. Nat Rev Clin Oncol 2014;11:38-48. Ernst DS, Petrella T, Joshua AM et al. Burden of illness for metastatic melanoma in Canada, 2011-2013. Curr Oncol 2016;23: e563–e570. Eurostat 2019. Healthcare resource statistics – technical resources and medical technology Accessed from WWW on 10 October 2019: https://ec.europa.eu/eurostat/statistics-explained/index.php?title=Healthcare_resource_statistics_-technical resources and medical technology&oldid=280129
Eurostat 2019. Healthcare resource statistics – technical resources and medical technology. Access from WWW on 10 October 2019: https://ec.europa.eu/eurostat/statistics-explained/index.php?title=Healthcare resource statistics -technical resources and medical technology&oldid=280129#Availability of medical t
echnology Fabi A, Felici A, et al. Brain metastases from solid tumors: disease outcome according to type of treatment and therapeutic resources of the treating centre. J Exp Clin Cancer Res 2011;30:10. Ferlay J, Bray F, Pisani P, Parkin DM. GLOBOCAN 2000. Cancer incidence, mortality and prevalence wordwide. Version 1.0 Lyon: IARCPress;2001. Folstein MF, Folstein SE, McHugh PR. "Mini-mental state". A practical method for grading the cognitive state of patients for the clinician. Journal of Psychiatric Research 1975;12(3):189-98 Friedman GD, Skilling JS, et al. Early symptoms of ovarian cancer: a case-control study without recall bias. Fam Pract 2005;22(5):548-553.

100
Gatta G, Trama A, et al. Variations in cancer survival and patterns of care across Europe: Roles of wealth and health-care organisation. JNCI Monographs 2013;46:79-87. Gempt J, Lange N, et al. Factors influencing neurocognitive function in patients with neuroepithelial tumors. Sci Rep 7 2017;7:17764 Gladsjo JA, Schuman CC, et al. Norms for letter and category fluency: demographic corrections for age, education, and ethnicity. Assessment 1999;6(2):147-78. Gnekow AK, Falkenstein F, et al. Long-term follow-up of the multicenter, multidisciplinary treatment study HIT-LGG-1996 for low-grade glioma in children and adolescents of the German Speaking Society of Pediatric Oncology and Hematology. Neuro Oncol 2012;14(10):1265-1284. Goni J, Arrondo G, et al. The semantic organization of the animal category: evidence from semantic verbal fluency and network theory. Cogn Process 2011;12(2):183-96. Gore ME, Hariharan S, Porta C et al. Sunitinib in met- astatic renal cell carcinoma patients with brain metastases. Cancer 2011;117: 501–509. Graham NL, Emery T, Hodges JR. Distinctive cognitive profiles in Alzheimer’s disease and subcortical vascular dementia. J Neurol Neurosurg Psychiatr. 2004; 75: 61-71. Grant R. Overview: Brain tumour diagnosis and management/Royal College of Physicians guidelines. J Neurol Neurosurg Psychiatry 2004;75 (suppl 2):18-23. Habets, E. J. et al. Neurocognitive functioning and health-related quality of life in patients treated with stereotactic radiotherapy for brain metastases: a prospective study. Neuro Oncol 2016; 18, 435–444 Hall CB, Derby, C, et al. Education delays accelerated decline on a memory test in persons who develop dementia. Neurology 2007;69(7):1657-1664. Hall WA, Djalilian HR, et al. Long-term survival with metastiatic cancer to the brain. Med Oncol 2000;17:279-286. Hamdan A, & Mitchell P. The two-week wait guideline for suspected CNS tumours: a decade analysis. Br J Neurosurg 2013;27(5). Hamilton W, Kernick D, et al.Clinical features of primary brain tumours: a case-control study using electronic primary care records. Br J Gen Pract 2007;57(542):695-699. Hansen RP, Olesen F, et al. Socioeconomic patient characteristics predict delay in cancer diagnosis: a Danish cohort study. BMC Health Serv Res 2008;8:49. Hardell L, Calberg M, et a. Pooled analysis of two-case-control studies on use of cellular and cordless telephones and the risk for malignant brain tumours diagnosed in 1997-2003. Int Arch Occup Environ Health 2006;79(8):630-9.

101
Harrison CJ, Spencer RG, et al. Transforming cancer outcomes in England: earlier and faster diagnoses, pathways to success and empowering alliances. J Healthc Leadersh 2019;11:1-11. HeadSmart. Accessed from WWW on 12 December 2019. https://www.headsmart.org.uk
HeadSmart. The brain pathways guideline: a guideline to assist healthcare professionals in the assessment of children who may have a brain tumour. 2017. Accessed from WWW on 12 Deceber 2019. https://assets.headsmart.org.uk/live/media/filer public/8e/c3/8ec36f34-1c0d-4c3c-bc5f-706570b7af34/brain pathways guidelines final.pdf Hendrix P, Griessenauer CJ, et al. Cognitive function surrounding resection of nonfunctioning pituitary adenomas with suprasellar extension: A prospective matched-contro study. J Clin Neurosci 2017;40:109-114. Henry JD, Beatty WW. Verbal fluency deficits in multiple sclerosis. Neuropsychologia. 2006; 44(7): 1166-74 Henry JD, Crawford JR. Verbal fluency deficits in Parkinson’s disease: a meta-analysis. J Int NeuropsycholSoc 2004; 10(4): 608-22 Hewins W, Zienius K, et al. The effects of brain tumours upon medical decision-making capacity. Curr Oncol Rep. 2019;21(6):55 ICT 2015. Accessed from WWW on 10 September 2019. https://www.itu.int/en/ITU-D/Statistics/Documents/facts/ICTFactsFigures2015.pdf Jensen H, Torring ML, et al. Cancer suspicion in general practice, urgent referral and time to diagnosis: a population-based GP survey and registry study. BMC Cancer 2014;14:636. Jiwa M, Saunders C. Fast tract referral for cancer. BMJ 2007;335:267. Johnson DR, Sawyer AM, et al. Early measures of cognitive function predict survival in patients with newly diagnosis glioblastoma. Neuro Oncol 2012;14(6):808-16. Johnson KJ, Cullen J, et al. Childhood brain tumor epidemiology: a brain tumor epidemiology consortium review. Cancer Epidemiol Biomarkers Prev 2014;23(12):2716-2736. Kawano N, Umegaki H, et al. Effects of educational background on verbal fluency task performance in older adults with Alzheimer’s disease and mild cognitive impairment. Int Psychogeriatr 2010;22(6):995. Kernick D, Williams S. Should GPs have direct access to neuroradiological investigation when adults present with headache. Br J Gen Pract 2011;61(587):409-411. Kerrigan S, Erridge S, et al. Mental incapacity in patients undergoing neuro-oncologic treatment. Neurology 2014;83(6). Kerrigan S, Rooney A, et a. Measuring cognitive function in people with brain tumours using the Addenbrooke’s Cognitive Examination. Neurol Neurosurg Psychiatr 2012;83:e1.

102
Kim SJH, Ioannides S, et al. Trends in incidence of primary brain cancer in New Zealand, 1995 to 2010. Aust N Z J Public Health 2015; 39(2):148-52. Kirby S, Purdy RA. Headaches and brain tumors. Neurol Clin. 2014;32(2):423-32. Kleihues P, Burger PC, et al. The new WHO classification of brain tumours. Brain Pathol 1993;3(3): Kleihues P, Cavenee WK (eds) (2000) World Health Organization Classification of Tumours. Pathology and genetics of tumours of the nervous system. IARC Press, Lyon Klein M, Postman TJ, et al. The prognostic value of cognitive functioning in the survival of patients with high-grade glioma. Neurology 2003;61:1796-1798. Koo MM, Hamilton W, et al. Symptoms Signatures and diagnostic timeliness in cancer patients: a review of current evidence. Neoplasia 2018;20(2):165-174. Korsgaard M, Pederson L, et al. Reported symptoms, diagnostic delay and stage of colorectal cancer: a population-based study in Denmark. Colorectal Dis 2006;8(8). Kurian KM, Jenkinson MD, Brennan PM, et al. Brain tumor research in the United Kingdom: current perspective and future challenges. A strategy document from the NCRI Brain Tumor CSG. Neuro Oncol Pract 2018;5(1):10-17. Laisney M, Matuszewski V, et al. The underlying mechanisms of verbal fluency deficit in frontotemporal dementia and semantic dementia. J Neurol 2009;256;1083. Lapointe S, Perry A, Butowski NA. Primary brain tumours in adults. Lancet 2018;392(10145):432-446 Levis AG, Minicuci N, et al. Mobile phones and head tumours. The discrepancies in cause-effect relationships in the epidemiological studies – how do they arise? Environ Health 2011;10:59. Lezak MD. Neuropsychological assessment. Oxford: Oxford University Press, 1995. Li MM, Hong-xing, Meng, et al. A meta-analysis of association between pesticides exposure and glioma risk in adults. J craniofacial sur 2015;26(7):672-673. Linet MS, Slovis TL, et al. Cancer risks associated with external radiation from diagnostic imaging procedures. CA Cancer J Clin 2012;62(2):75-100. Liu JF, Shanmugavadivel D, et al. Reducing time to diagnosis of paediatric brain tumours in the UK – HeadSmart awareness campaign. Neurooncol 2017;19:iv57. Loomis D, Grosse Y, et al. The carcinogenicity of outdoor air pollution. Lancet Oncol 2013;14(13):1262-3 Louis DN, Ohgaki H, et al. The 2007 WHO classification of tumours of the central nervous system. Acta Neuropathol 2007;114:97-109.

103
Louis DN, Perry A, et al. The 2016 World Health Organization classification of tumors of the central nervous system: a summary. Acta Neuropathol 2016;132(6):803-20. Lyratzopoulos G, Abel GA, et al. Measures of promptness of cancer diagnosis in primary care: secondary analysis of national audit data on patients with 18 common and rarer cancers. Br J Cancer 2013;108(3):686-90 Lyratzopoulos G, Neal RD, et al. Variation in number of general practitioner consultations before hospital referral for cancer: findings from the 2010 National Cancer Patient Experience Survey in England. Lancet Oncol 2012; 13(4):353-65. Macleod U, Mitchell ED, et al. Risk factors for delayed presentation and referral of symptomatic cancer: evidence for common cancers. Br J Cancer 2009: 101(suppl. 2) S92-S101 Mathuranath PS, George A, et al. Effects of age, education and gender on verbal fluency. J Clin Exp Neuropsychol 2003;25(8):1057-64. McCarthy BJ. Descriptive Epidemiology of Glioma. Principles and Practices of Neuro-Oncology: A Multidisciplinary Approach. 2008. McCollough CH Bushberg JT, et al. Answers to common questions about the use and safety of CT scans. Mayo Clin Proc 2015; 90:1390-92. Mcdowd J, Hoffman L, et al. Understanding verbal fluency in healthy aging, Alzheimer’s disease and Parkinson’s disease. Neuropsychol 2011;25(2):210-25. McPhail S, Johnson S, et al. Stage at diagnosis and early mortality from cancer in England. Br J Cancer 2015;112:108-115. Meyers CA, Hess KR, et al. Cognitive function as a predictor of survival in patients with recurrent malignant glioma. J Clin Oncol 2000;18(3):646-50. Meyers CA, Wefel JS. The use of the mini-mental state examination to assess cognitive functioning in cancer trials: no ifs, ands, buts, or sensitivity. J Clin Oncol 2003;21(19):3557-8. Meyers CA: Neuropsychological assessment and treatment of patients with malignant brain tumors. In Prigatano Pliskin (eds): Clinical Neuropsychology and Cost Outcome Research: A Beginning. New York, NY, Psychology Press, 2003. Michl M, Thurmaier J, et al. Brain metastasis in colorectal cancer patients: survival and analysis of prognostic factors. Clin Colorectal Cancer 2015;14:281-290. Mioshi E, Dawson K. The Addenbrooke’s Cognitive Examination Revised (ACE-R): a brief cognitive test battery for dementia screening. Int J Geriatr Psychiatry 2006;21(11):1078-85. Miotto EC, Silva Junio A, et al. Cognitive impairments in patients with low grade gliomas and high grade gliomas. Arq Neuropsiquitr 2011;69(4):596-601.

104
Miranda-Filho A, Pineros M, et al. Cancers of the brain and CNS: global patterns and trends in incidence. Neuro Oncol 2017;19(2):270-280. Modan B, Wagener DK, et al. Increased mortality from brain tumors: a combined outcome of diagnostic technology and change of attitude toward the elderly. Am J Epidemiol 1992;135(12):1349-1357. Mongan JP, Fadul CE, Cole BF et al. Brain metastases from colorectal cancer: risk factors, incidence, and the possible role of chemokines. Clin Colorectal Cancer 2009; 8: 100–105. Morgan LL, Miller AB, et al. Mobile phone radiation causes brain tumors and should be classified as a probable human carcinogen (2A) (review). Int J Oncol 2015;46(5):1865-71. Morris Z, Whiteley WN, et al. Incidental findings on brain magnetic resonance imaging: systematic review and meta-analysis. BMJ 2009;339:2016. Nasreddine ZS, Phillips NA, Bédirian V, Charbonneau S, Whitehead V, Collin I, et al. The Montreal Cognitive Assessment, MoCA: a brief screening tool for mild cognitive impairment. J Am Geriatr Soc. 2005;53:695–699. National Cancer Registration and Analysis Service (NCRAS). Chemotherapy, Radiotherapy and Surgical Tumour Resections in England. Accessed from WWW on 15 October 2019. http://www.ncin.org.uk/cancer type and topic specific work/topic specific work/maincancer treatments Neal RD, Allgar VL, et al. Stage, survival and delays in lung, colorectal, prostate and ovarian cancer: comparison between diagnostic routes. Br J Gen Pract 2007;57(536):212-219. Neal RD, Tharmanathan P, et al. Is increased time to diagnosis and treatment in symptomatic cancer associated with poorer outcomes? Systematic review. Br J Cancer 2015;112(1):92-107. Neal RD. Do diagnostic delays in cancer matter? Br J Cancer 2009;101:9-12. NHS England. Diagnostic Imaging Dataset Annual Statistical Release 2015-16. 2016. Accessed from WWW on 16 October 2019. https://www.england.nhs.uk/statistics/wp-content/uploads/sites/2/2015/08/Annual-Statistical-Release-2015-16-DID-PDF-1.5MB.pdf NHS Providers. Accessed WWW on 10 October 2019. https://nhsproviders.org/news-blogs/blogs/understanding-cancer-performance-in-the-nhs NHS Scotland. Scottish Referral Guidelines for Suspected Cancer. Accessed from WWW on 16 October 2019. http://www.cancerreferral.scot.nhs.uk/brain-and-central-nervous-system-cancers/?alttemplate=guideline NICE: Referral guidelines for suspected cancer. 2005. NICE: suspected cancer: recognition and referral (NG12). 2015

105
Niksic M, Rachet B, et al. Cancer symptom awareness and barriers to symptomatic presentation in England – are we clear on cancer? Br J Cancer 2015;113(3):533-542. Noll KR, Sullaway C, et al. Relationships between tumor grade and neurocognitive functioning in patients with glioma of the left temporal lobe prior to surgical resection. NeuroOncol 2015;17(4):580-587 Noone P (2015). Addenbrooke’s Cognitive Examination-III. Occupational Medicine 65 (5):418-420. OECD. Magnetic resonance imaging MRI units. Accessed from WWW on 10 October 2019: https://data.oecd.org/healtheqt/magnetic-resonance-imaging-mri-units.htm
Office for National Statistics (ONS). Cancer statistics registrations. Registrations of cancer diagnosed in 2002. London: TSO; 2005. Accessed from WWW on 10 December 2019. https://www.ons.gov.uk/peoplepopulationandcommunity/healthandsocialcare/conditionsanddiseases/datasets/cancerregistrationstatisticscancerregistrationstatisticsengland Ohgaki H, Dessen P, et al. Genetic pathways to glioblastoma: a population-based study. Cancer Res 2004;64(19):6892-9. Olesen F, Hansen RP, et al. Delay in diagnosis: the experience in Denmark. Br J Cancer 2009;101(suppl 2):5-8. Olson RA, Carolan H, et al. Prospective comparison of the prognostic utility of the Montreal cognitive assessment and the Mini-mental state examination in patients with brain metastases. Radiat Oncol 2010b;78(3):264. Olson RA, Chhanabhai T, et al. Feasibility study of the Montreal Cognitive Assessment (MOCA) in patients with brain metastases. Support Care Cancer 2008;16(11):1273-8 Olson RA, Iverson GL, et al. Prospective comparison of two cognitive screening tests: diagnostic accurancy and correlation with community integration and quality of life. J Neurooncol 2011;105(2):337-44. Olson RA, Parkinson M, et al. Selection bias introduced by neuropsychological assessments. Can J Neurol Sci 2010a;37:264-268. Ostrom QT, Barnholtz-Sloan JS. Current State of Our Knowledge on Brain Tumor Epidemiology. Curr Neur Neurosci Rep 2011;11:329-335. Ostrom QT, Cioffi G, et al. CBTRUS Statistical report: primary brain and other central nervous system tumours diagnosed in the United States in 2012-2016. Neuro Onc 2019;21(5):1-100. Ostrom QT, Gittleman H, et al. CBTRUS statistical report: primary brain and central nervous system tumors diagnosed in the United States in 2007-2011. Neuro Oncol 2014;16(4):1-63. Ostrom QT, Wright CH, et al. Brain metastases: epidemiology. Handbook of clinical neurology 2018;149:27-42.

106
Ozawa M, Brennan PM, et al. Symptoms in primary care with time to diagnosis of brain tumours. Fam Pract 2018;35(5):551-558. Pack GT, Gallo JS. The culpability for delay in treatment of cancer. Am J Cancer 1938;9:443-462. Parkin AJ, Java RI. Deterioration of frontal lobe function in normal aging: influences of fluid intelligence versus perceptual speed. Neuropsychology 1999;13(4):539-545. Peeters MCM, Dirven L, et al. Prediagnostic symptoms and signs of adult glioma: the patients’ view. J Neurooncol 2020;146:293-301. Penfold C, Joannides AJ, et al. Diagnosing adult primary brain tumours: can we do better? Br J GP 2017; 67(659): 278-279. Perkins A, Liu G. Primary brain tumours in adults: Diagnosis and treatment. Am Fam Physician 2016;93(3):211-217. Perry JR, Laperriere N, et al. Short-course radiation plus temozolomide in elderly patients with glioblastoma. N Engl J Med 2017;376:1027-1037. Philips A, Henshaw DL, et al. Brain tumours: Rise in glioblastoma multiforme incidence in England 1995-2015 suggest an adverse environmental or lifestyle factor. J Envir Pub Health 2018 Pignatti F, van den Bent M, et al. Prognostic factors for survival in adult patients with cerebral low-grade glioma. J Clin Oncol 2002;20(8):2076-84. Pouratian N, Asthagiri AR, et al. Extraaxial brain tumors. In Neuro-Oncology. (ed J Rees and PY Wen). 2010. Saunders: Philadelphia Prasad M, Kathuria P, et al. Mobile phone use and risk of brain tumours: a systematic review of association between study quality, source of funding, and research outcomes. Neurol Sci 2017;38(5):797-810. Provost D, Cantagrel A, et al. Brain tumours and exposure to pesticides: a case-control study in southwestern France. Occup Environ Med 2007;64(8):509-514. Quinn MJ, Babb P, et al. Cancer trends in England and Wales 1950-1999. Studies on Medical and Population Subjects No 66. Office for National Statistics: London. 2001. Raaschour-Nielsen, Andersen ZJ, et al. Air pollution from traffic and cancer incidence: a Danish cohort study. Environ Health 2011;10:67 Rich JB, Troyer AK et al. Longitudinal analysis of phonemic clustering and switching during word-list generation in Huntington’s disease. Neuropsychology 1999;13(4):523-31. Richards MA. The National Awareness and Early Diagnosis Initiative in England: assembling the evidence. Br J Cancer 2009;101:1-4.

107
Richards MA. The size of the prize for earlier diagnosis of cancer in England. Br J Cancer 2009; 101, 125-9 Robinson GA, Biggs V, et al. Cognitive screening in brain tumors: short but sensitive enough. Front Oncol 2015;5:60. Rohrer D, Salmon DP, et al. The disparate effects of Alzheimer’s disease and Huntington’s disease on semantic memory. Neuropsychology 1999;13(3):381-388. Ruff RM, Light RH, et al. The psychological construct of word fluency. Brain and Language 1997;57(3):394-405. Sadetzki S. Exposure to ionizing radiation and glioma risk. Principles and Practices of Neuro-Oncology: A Multidisciplinary Approach (2010). Salander P, Bergenheim AT, Hamberg K, Henriksson R. Pathways from symptoms to medical care: a descriptive study of symptom development and obstacles to early diagnosis in brain tumour patients. Fam Pract. 1999;16(2):143–148. Salibi PN, Agarwal V, et al. Lifetime attributable risk of cacner from CT among patients surviving severe traumatic brain injury. AJR AM J Roentgenol 2014;202(2):397-400. Sant M, Minicozzi P, et al. Survival of European patients with central nervous system tumours. Int J Cancer 2012;131(1):173-85. Schmidt LS, Nielsen H, et al. Social inequiality and incidence of and survival from tumours of the central nervous system in a population-based study in Denmark, 1994-2003. Eur J Cancer 2008; 44(14):2050-2057. Scott SE, Penfold C, et al. ‘It was nothing that you would thing was anything’: Qualitative analysis of appraisal and help seeking preceding brain cancer diagnosis. PLoS ONE 2019;14(3). Scott SE, Walter FM, Webster A, et al. The model of pathways to treatment: conceptualization and intergration with existing theory. Br J Health Psychol 2013;18:45-64. Scottish Government. Beating cancer: ambition and action. 2016. Accessed from WWW on 15 October 2019. https://www.gov.scot/publications/beating-cancer-ambition-action/ Shanmugavadivel D, Liu JF, et a. Accelerating diagnosis for childhood brain tumours: an analysis of the HeadSmart UK population data. Arch Dis Childhood 2020;105:355-362. Shiels MS, Pfeiffer RM, et al. Trends in primary central nervous system lymphoma incidence and survival in the US. Br J Haematol 2016;174(3):417-24. Shuch B, La Rochelle JC, et al. Brain metastasis from renal cell carcinoma: presentation, recurrence, and survival. Cancer 2008;113:1641-1648.

108
Sierra del Rio M, Rousseau A, et al. Primary CNS Lymphoma. In Neuro-Oncology. (ed J Rees and PY Wen). 2010. Saunders: Philadelphia Smith LK, Pope C, et al. Patients’ help-seeking experiences and delay in cancer presentation: a qualitative synthesis. Lancet 2005;366(9488):825-31. Smith T, Gildeh N, et al. The Montreal cognitive assessment: validity and utility in a memory clinic. Can J Psychiatry 2007;52(5):329-32. Standish IM, Molloy DW, et al. Do the ABCS 135 short cognitive screen and its subtests discriminate between normal cognition, mild cognitive impairment and dementia? International Journal of Geriatric Psychiatry. 2007;22:189–194. Strauss, E., Sherman, E. M. S., & Spreen, O. (2006). A Compendium of neuropsychological tests: Administration, norms, and commendary (3rd ed.). New York, NY: Oxford University Press. Stupp R, Brada M, et al. High-grade malignant glioma: ESMO clinical practice guidelines. Ann Oncol 2014; 25(3):93-101. Stupp R, Mason WP, et al. Radiotherapy plus concomitant and adjuvant temozolomide for glioblastoma. NEJM 2005;352:987-996. Stuss DT, Alexander MP, et al. The effects of focal anterior and posterior brain lesions on verbal fluency. J Int Neuropsychol Soc 1998;4(3):265-78 Swann R, Lyratzopoulos G, et al. National Cancer Diagnosis Audit: avoidable delays to diagnosis. Br J Gen Pract 2019;69. Swann R, McPhail S, et al. Diagnosing cancer in primary care: results from the National Cancer Diagnosis Audit. Br J Gen Pract 2018;68(666):63-72. Takakura K, Sano K, et al. Metastatic tumors of the Central nervous system. Igaku-Shoin, Tokyo, New York:1982. Talbert JS, Brewer KK, et al. Education effects on verbal fluency performance in Alzheimer’s disease. Arch Clin Neuropsychol 1997;12(4):413-413. Taphoorn MJB, Klein M. Cognitive deficits in adult patients with brain tumours. Lancet Neurol 2004;3(3):159-68. Taylor T, Evangelou N, Porter H, Lenthall R. Primary care direct access MRI for the investigation of chronic headache. Clinical radiology. 2012; 67 (1): 24–27. Tombaugh TN, Kozak J, et al. Normative data stratified by age and education for two measures of verbal fluency: FAS and Animal naming. Arch Clin Neuropsychjol 1999;14(2):167-177. Treister D, Kingston S, et al. Multimodal magnetic resonance imaging evaluation of primary brain tumours. Semin Oncol 2014;41(4):478-495.

109
Troster AI, Fields JA, et al. Cortical and subcortical influences on clustering and switching in the performance of verbal fluency tasks. Neuropsychologia. 1998;36(4):295-304 Troyer AK, Moscovitch M, et al. Clustering and switching on verbal fluency tests in Alzheimer’s and Parkinson’s disease. J Int Neuropsychol Soc 1998;4(2). Troyer AK, Moscovitch M, Winocur G, Alexander, Stuss. Clustering and switching on verbal fluency: the effects of focal frontal — and temporal — lobe lesions. Neuropsychologia 1998;36:499–504. Troyer AK, Moscovitch M, Winocur G. Clustering and switch- ing as two components of verbal fluency: evidence from younger and older healthy adults. Neuropsychology 1997;11:138–46. Tucha O, Smely C, et al. Cognitive deficits before treatment among patients with brain tumours. Neurosurg 2000; 47(2):324-334. Underwood R, Kilner R, et al. Primary care management of headaches and how direct-access MRI fits: a qualitative study of UK general practitioners’ views. BMJ Open 2017;7: 1-9. United Nations. World Population Ageing. 2017. Accessed from WWW on 10 July 2020. https://www.un.org/en/development/desa/population/publications/pdf/ageing/WPA2017 Highlights.pdf Van Kessel E, Baumfalk AE, et al. Tumor-related neurocognitive dysfunction in patients with diffuse glioma: a systematic review of neurocognitive functioning prior to anti-tumor treatment. J Neurooncol 2017;134(1):9-18. Van Kessel E, Emon MAC, et al. Tumor-related neurocognitive dysfunction in patients with diffuse glioma: a retrospective cohort study prior to antitumor treatment. Neurooncol Pract 2019;6(6):463-472. Van Nieuwenhuizen D, Ambachtsheer N, et al. Neurocognitive functioning and health related quality of life in patients with radiologically suspected meningiomas. J Neurooncol 2013;113:433-440. Visser O, Ardanaz E, et al. Survival of adults with primary malignant brain tumours in Europe; Results of the EUROCARE-5 study. Eur J Cancer 2015;51(15):2231-2241. Vroonen L, Jaffrai-Rea ML, et al. Prolactinomas resistant to standard doses of cabergoline: a multicentre study of 92 patients. Eur J Endocrinol 2012; 167(5):651-62. Walker D, Hamilton W, et al. Strategies to accelerate diagnosis of primary brain tumours at the primary-secondary care interface in children and adults. CNS Oncol 2013 2013;2(5):447-462.

110
Webb AJS, Butterworth RJ. Determinants of clinical effectiveness and significant neurological diagnoses in an urgent brain cancer referral pathway in the United Kingdom. Clin Neurol Neurosurg 2015;132:37-40. Wefel J S, Noll K R, et al. Neurocognitive function varies by IDH1 genetic mutation status in patients with malignant glioma prior to surgical resection. Neuro Oncol 2016; 18, 1656–1663 Weller D, Vedsted P, et al. The Aarhus statement: improving design and reporting of studies on early cancer diagnosis. Br J Cancer 2012;106:1262-1267. Wen PY, Loeffler JS. Management of brain metastases. Oncology 1999;13(7):941-61. Woehrer A, Hackl M, et al. Relative survival of patients with non-malignant central nervous system tumours: a descriptive study by the Austrian Brain Tumour Registry. Br J Cancer 2013; 110:286-296. Word Health Organization. Cancer Control Knowledge into Action. WHO Guide for Effective Programmes. 2007. Accessed from WWW on 15 September 2019. https://apps.who.int/iris/bitstream/handle/10665/43743/9241547338 eng.%20pdf?sequence=1 World Health Organization (WHO). Barriers to early cancer diagnosis and treatment. Accessed from WWW on 15 September 2019: https://www.euro.who.int/en/health-topics/noncommunicable-diseases/cancer/policy/screening-and-early-detection/barriers-to-early-cancer-diagnosis-and-treatment World Health Organization (WHO). International Classification of Diseases for Oncology ICD-0. 3rd Edition, 1st revision 2013. Accessed on 12 October 2019: https://apps.who.int/iris/bitstream/handle/10665/96612/9789241548496 eng.pdf;jsessionid=82BA60533DF65E05B9E207112CE42352?ua=1?sequence=1 World Health Organization. Cancer. 2018. Accessed on 10 July 2020. https://www.who.int/news-room/fact-sheets/detail/cancer World Health Organization. Global status report on non-communicable diseases 2010. Description of the global burden of NCDs, their risk factors and determinants. Accessed from WWW on 10 June 2019 at https://www.who.int/nmh/publications/ncd report2010/en/
World Health Organization. Guide to Cancer Early Diagnosis. 2017. Accessed from WWW on 15 September 2019. https://apps.who.int/iris/bitstream/handle/10665/254500/9789241511940-eng.pdf Wrensch M, Minn Y et al.Epidemiology of primary brain tumors: current concepts and review of literature. Neuro Oncol 2002;4(4):278-99. Wu AS, Witgert ME, et al. Neurocognitive function before and after surgery for insular gliomas. J Neurosurg 2011;115(6):1115-25 Zakzanis KK, McDonald K, et al. Component analysis of verbal fluency in patients with mild traumatic brian injury. J Clin Exp Neuropsychol 2011;33(7):785-92J Clin Exp Neuropsychol 2011;33(7):785-92

111
Zhou Y, Mendonca SC, et al. Variation in ‘fast-track’ referrals for suspected cancer by patient characteristic and cancer diagnosis: evidence from 670000 patients with cancers of 35 different sites. Br J Cancer 2018;118:24031. Zienius K, Kerrigan S, et al. Semantic verbal fluency in patients with headache suspicious of brain tumour. J Neurol Neurosurg Psychiatr 2016;87:e1 Zulch KL. Brain tumours: Their biology and Pathology. Springer-Verlag: Berlin Heidelberg 1986

112
Principal aims of the thesis:
The aims of the present thesis are to explore the clinical and diagnostic pathway for brain
tumours in adults and their potential impact on clinical care and outcomes:
The principal hypotheses are:
1. Existing referral guidelines for direct-access head imaging for suspected brain cancer
lack sensitivity and specificity
2. The speed and route to diagnosis will be influenced by symptom presentation, patient
demographics and clinical pathology
3. Early diagnosis will result in smaller tumours and a higher frequency of debulking
than biopsy than those diagnosed late
4. In an explorative pilot study, a 1-minute cognitive screening tool – semantic verbal
fluency test – will discriminate patients with a brain tumour than without.

113
Part 2
In this Part 2, I describe the logistics of the study, the data collection methods, the
development of the semi-structured questionnaire and ethical submissions and approvals.
The data collection of this study can be divided into 2 broad parts (see hierarchical
representation in Figure 2.1):
Figure 2.1: Hierarchical representation of data collection datasets for MD thesis
GP – General Practitioner, DACT – Direct Access Computed Tomography, MDT – Multi-disciplinary team,
114
General introduction of methods/data management
Setting of the study:
This MD thesis is based on patients who were referred to and / or treated at Regional
neuroscience centre at Edinburgh Centre for Neuro-Oncology (ECNO) at Western General
Hospital, Edinburgh, Scotland. It serves the population of 858,090 (16% of Scottish
population) and receives referrals from other 4 NHS Boards including Borders, Fife, Forth
Valley and Dumfries and Galloway. Patients younger than 16 years old and who were
residents outside the catchment area were excluded.
Ethical/methodological considerations prior to study commencement:
Prior to data collection, my supervisors Mr Paul Brennan and Dr Robin Grant had explored
the options for the collaboration with the Regional SafeHaven/eDRIS in order to ensure as
much patient anonymity as possible. However, due to the nature of the study, whereby the
current patient electronic system does not consistently hold coded patient clinical information
because much of the information is currently in free text form, it was soon agreed that
SafeHaven would not be able to provide us with such information, in particular, this would
not have been possible if the patient information provided was anonymised. It therefore
required obtaining personal identification number, i.e. Community Health Index (CHI), and
linking it with the hospital electronic patient record system (TRAK). Sources for obtaining
CHI and referral information are described below.

115
Ethical approvals
The ethical approval from Research Ethics Committee (REC) for an overall project was
granted on 21/03/2017, reference (REC 17/SS/0019) (Appendix B).
Data management and storage: practical, confidential issues
I was solely responsible for obtaining patient identification from the data sources (to be
discussed in full below) and identifying patients for inclusion criteria. However, where
inclusion criteria for a certain patient was considered uncertain by me, their eligibility for the
study participation would have been discussed with the Principal Investigator, Mr Paul
Brennan.
Once the patient identified was deemed to meet the eligibility criteria, I performed coding in
order to conceal patient’s identity as the safeguard to ensure confidential information
(patient’s CHI linked to study subject ID number). It was only myself who was able to see
and store the coding file in the secure personal NHS Lothian account network.
This was to ensure that (1) as few clinicians as practically possible had access to information
about identifiable individuals and (2) reduce the risk of accidental disclosure. By performing
coding, I ensure that the data collection met the legal and ethical obligations to protect
personal information, and the use of coded data fell within the scope of the Data Protection
Act.
Data storage

116
Once patient identifiable information was coded and anonymised, clinical data were then
transferred onto a RedCap database, developed specifically for this study purpose by the
Edinburgh Clinical Trials Unit (ECTU). Patients were then attributed a unique study subject
number, which anonymously corresponded to their original code number which was recorded
separately in a different word document.
Each RedCap database created within the ECTU is fully validated by ECTU. It, in addition,
complies with NHS Lothian R&D requirements. All data are held on a password secure
locked server within the University of Edinburgh. Their policy complies with GCP guidelines
and NHS Lothian R&D policy. In addition, ECTU has full registration within the UKCRC
Clinical Trials Unit registration framework and ECTU has an established track record in
delivering high quality clinical trials and works under a quality framework in accordance
with ICH GCP.
RedCap data collection instruments include: demographics, past medical history, presentation
referral, diagnosis, treatment.
Prospective data: Section 1
Clinical study (N = 180)
The aims of this part of the study were twofold: (a) to explore symptom presentation,
understand pathway to diagnosis and to measure diagnostic time intervals as defined by
Olesen framework (2009) for brain tumours in adults and (b) to measure cognitive
performance using bedside departmental cognitive screen tool.

117
The data were collected to inform 2 papers:
1. Factors associated with index diagnosis of adult brain tumour in the Emergency
Department offer insights to enhance earlier diagnosis of brain tumours (Study 2)
2. Verbal fluency as a brief cognitive screening tool in patients with a suspected brain
tumour: a potential red flag (Study 4)
Eligibility criteria
• Adults aged 16 or over with a suspicious new radiological diagnosis of intracranial
mass lesion, primary or secondary, which is confirmed by a neuro-radiologist prior to
undergoing any type of surgical treatment such as surgery for biopsy, debulking or
excision.
• Able to communicate in English.
Exclusion criteria:
• Mass lesions which are inflammatory in nature (i.e. granuloma, abscess) or
demyelinating (tumefactive plaque).
• Aged < 16 years.
• Recurrent tumour.
• Patients with a low grade malignancy who have been under imaging surveillance.

118
Approach to subjects
All patients referred to neurosurgery with the possible diagnosis of a primary brain tumour
and new electronic patient referrals for suspected brain tumour to the tertiary neuro-oncology
centre in Edinburgh (aka Edinburgh Centre for Neuro-Oncology, ECNO) were reviewed. All
eligible adult patients were then identified from subsequent weekly multidisciplinary team
(MDT) meeting at ECNO and via liaison with MDT co-ordinator as well as neuro-oncology
nurse specialists.
Those patients attending a pre-assessment surgical clinic were then approached by a research
fellow on the same day of a clinic and asked if they were interested to participate in the study.
Patient Information Sheet were handed out and explained in detail prior to decision to take
part or not.
If they agreed to participate, patients and accompanying relatives (if any) were then taken to
a side room where I administered the interview. This was done immediately prior or after
their scheduled clinical appointment with a treating physician.
Obtaining Consent
This was a quality improvement project on the quality of history taking and data collection of
brain tumour patients in a neuro-surgical pre-assessment clinic. Therefore no new
intervention was carried out.

119
Data collected:
§ Patient baseline demographic and clinical information
§ Addenbrooke’s Cognitive Examination Revised
§ Symptom Structured Interview Questionnaire version 1.5 (Appendix C).
For quantitative data, independent variables as predictors will be tested: both
continuous and categorical:
§ Age
§ Gender
§ Education level
§ Ethnicity
§ Marital status
§ Social deprivation score
§ Functional status (Karnofsky performance score, KPS)
§ Symptom presentation
§ Tumour histology
§ Tumour size on imaging
§ Midline shift present
§ Tumour location
§ Tumour laterality
Design of the questionnaire: Understanding symptom presentation and initial patient clinical
journey prior to a diagnosis of brain tumour in adults. Version 1.5

120
A patient questionnaire was designed and example is presented in Appendix C. The
questionnaire was based on extensive literature search in PubMed in pursuant of the aims of
describing diagnostic pathway of brain tumours in adults. Themes were developed based on
the previously published qualitative study, described earlier (Salander et al 1999). Each item
on the questionnaire was discussed at length with my supervisors. In addition, the
questionnaire was discussed with project co-applicant Prof Ben-Shlomo (Epidemiologist).
In order to obtain key information on patient’s diagnostic pathway, the patient was asked to
provide a detailed description of their symptomatology and diagnostic investigation process.
The questionnaire in particular asked to recall the dates of first symptom perceived by the
patient, first encounter with a health care provider, date of first diagnostic procedures,
hospital/specialist referrals, adapted from the pathway as described by Olesen (2009).
Crucially, where patient could not answer with reasonable certainty, they were allowed to
consult with their carer.
Pilot testing of the Patient questionnaire
I piloted the completed patient questionnaire on the first 2 patients to ensure, as below:
• Questions are easily understood by patient and their carer.
• A mixture of open ended and close ended questions, where appropriate, allows
optimal response and answers are not ambiguous.
• It takes approximately 8-10 minutes to complete.
• Does not cause excessive mental fatigue for the patient to complete.

121
The questionnaire was finally adjusted based on the responses or observations achieved.
Prospective data Section 2:
GP referrals for DACT for Headache (N = 90)
The aim of this study was to gather control data on verbal fluency test performance
Verbal fluency as a brief cognitive screening tool in patients with a suspected brain tumour: a
potential red flag (Study 4)
Eligibility criteria
Adult patients, aged 16 or above, referred for direct-access head CT, including through a
PBR pathway, from primary care to investigate headache +/- additional symptoms.
Exclusion criteria
Patients referred for direct-access head CT from primary care for non-headache symptoms.
Patient identification
A copy of daily DACT referrals was printed by a clerkess at the neuro-radiology department
at Western General Hospital for me to collect in the mornings. I screened the referral

122
information to ensure it included the complain of a headache. I then waited for the allocation
of the date and time slot for the patient to attend for a CT scan by the triaging neuro-
radiologist.
Approach to participants
Patients were greeted by me prior to their allocated time for a CT scan at the CT waiting
room at DCN. They were asked if they were happy to answer a few questions in relationship
to their recent GP referral for a CT scan. If they agreed, I explained this was data collection
as part of a clinical quality improvement project. They were then escorted to a side room.
Retrospective data collection: Section 1
Study design
This was a cross sectional database analysis of data that were collected during routine patient
care. Therefore, there was no intervention delivered to patients, neither there was any direct
contact with them.
Analysis of this data informed Studies 1 and 3.
Inclusion criteria

123
Adult patients aged 16 or above who were referred for the first time to the Edinburgh Centre
for Neuro-Oncology (ECNO) to the multidisciplinary team meeting (MDT), or who had a
new brain tumour surgery resulting in a neuropathology report, or who were referred for
direct-access CT (head) scan regardless of the findings in the period between 1April 2010 to
May 2017.
Identifying participants: data sources
Potential patients were identified from several sources, including:
§ Electronic records of Direct access CT (Head) referrals directly from GPs to Neuro-
radiology department at Western General Hospital, Edinburgh (Lothian region only).
o This was obtained from the IT department after first contacting Carol
Donaldson, the IT administrator.
This formed analysis for Study 1.
In total, 3257 referrals were screened for. After exclusion, 2938 referrals were used in the
final analysis.
§ Records from weekly neuro-oncology multi-disciplinary team (MDT) meeting
minutes.

124
o I obtained these minutes from electronic database provided for me by the
neuro-oncology coordinator Mr Stewart Young. No paper files were therefore
used.
This data formed analysis for Study 3.
As there was potential risk of data duplication, I screened every patient’s CHI for any
duplication across all different data sources prior to entering their clinical data onto the
Redcap database.
In total, 701 patient records were inputted onto a redcap database for potential further
analysis.
Further filtering of patient records for analysis
After all retrospectively identified patient record data had been inputted onto the RedCap
database, I decided, following discussion with my supervisors, to only analyse patient records
with primary malignant brain tumours including high-grade gliomas and primary CNS
lymphomas. This decision was taken because I wanted to analyse the potential effect of early
diagnosis on clinical care and survival. Considering survival is poorest for patients with
malignant brain tumours, it thus makes sense to focus analysis on these tumours.
Furthermore, it would be expected the proportion of data completeness would be highest for
patients with these tumours.
Contacting patient’s General Practitioners

125
Analysis of this part of the study informed study 3.
Reason for contacting GPs
Due to the retrospective nature of the study, and the fact that this was a secondary care data,
it was evident that clinical information in the primary care would be deficient. Although we
attempted to gather as much as possible information in relation to this time period from the
GP referral letter, it was evident to us that we could not thus rely on this data collection to
gather this information.
The data we required from primary care included symptom necessitating visit to the health
care professional and their length of duration, date of first appointment, number of visits prior
to referral for imaging/specialist assessment in secondary care and management provided for
the symptoms in the primary care. We only contacted that GP surgery which a patient was
registered with at the time of brain tumour diagnosis, according to our records, and only if we
held incomplete data for the patient for a particular diagnostic time interval.
Description of the approach for contacting GPs
For historic patients in the retrospective dataset, such data were sought by sending short
targeted questionnaire to patient’s General Practitioner (GP)) and cross-referencing with data
from hospital clinical notes stored on electronic database TRAK. GPs were asked, based on
their primary care records, to record if patient attended primary care prior to the diagnosis of
brain tumour, and if they did, what and duration of symptom of complaint were. Where no

126
such information was provided by GPs, data from clinical, MDT notes or referral information
for head imaging were used instead.
GP covering letter and questionnaire Appendix D and E. Since primary care clinical system is
not inter-linked with secondary care data in Scotland, we sought advice and input from the
NRS Primary Care Network. In order to increase questionnaire response rate, they contacted
general manager of each patient’s GP surgery 7-10 days prior to us sending questionnaires by
NHS post, informing them about the study, its objectives and asking them to encourage GPs
to complete the questionnaire. Upon completion, GP surgery was reimbursed by £10. Unless
we received completed questionnaire within 30 days after posting the original letter, we re-
sent the same questionnaire to non-responders once more.
Consent requirements for this part of the study:
Members of the research team are fully aware of the requirements for participant's consent in
medical research. We, however, anticipated that due to the nature of this disease most of the
patients would have died by the time this research was done. We were therefore unable to
obtain patient consent to contact their GPs for those patients. We did however seek
appropriate approval from the Caldicott Guardian. If required to contact alive patient’s GPs,
we would first contact the patients for their consent. However due to limited time period for
this project, we decided to only include patients with primary highly malignant brain tumours
including high-grade gliomas and primary central nervous system lymphomas.

127
Summary of responses:
In total, 392 questionnaires were posted to GP surgeries across five NHS boards (Lothian,
Forth Valley, Fife, Borders, and Dumfries and Galloway) during December 2017. We
received 294 (75%) completed surveys in the first round (see table 2.1). As per REC
approval, we re-contacted non-responder GP surgery 30 days following the date of postage of
the first questionnaire. An additional of 44 questionnaires were returned making a total of
338 completed questionnaires, with a response rate of 86.22%.
Table 2.1: Recruitment of GP surgeries, up to date 24 April 2018
` Recruited, N
Participated in the first round, N
RR, % Participated after sending reminders (Total)
RR, %
Lothian 191 146 76.4 167 87.40 Forth Valley 38 29 76.3 34 89.50 Fife 94 64 68.1 71 75.50 Borders 35 29 83 34 97.10 Dumfries&Galloway 34 26 76.5 32 94.10 Total 392 294 75 338 86.22

128
Part 3
Study 1
Direct access CT for suspicion of brain tumour: an analysis of referral
pathways in a population-based patient group
BMC Family Practice (2019) 20:118
K Zienius, I Chak-Lam, J Park, M Ozawa, W Hamilton, D Weller, D Summers, L Porteous, S
Mohiuddin, E Keeney, W Hollingworth, Y Ben-Shlomo, R Grant, PM Brennan
This study aimed to explore the predictive value and the usefulness of the current primary
care referral guidelines to identify a brain tumour in symptomatic patients presenting to
General Practitioners with a suspected brain tumour. We assessed the Kernick’s symptoms-
based guidelines and the National Institute of Clinical Excellence 2005 (NICE) referral
guidelines for adults with suspected CNS cancer.
Background
Brain tumour patients see their primary care doctor on average three or more times before
diagnosis, so there may be an opportunity to identify ‘at risk’ patients earlier. Suspecting a

129
brain tumour diagnosis is difficult because brain tumour-related symptoms are typically non-
specific.
Methods
We explored the predictive value of referral guidelines (Kernick and NICE 2005) for brain
imaging where a tumour is suspected, in a population-based patient group referred for direct
access CT of the head. A consensus panel reviewed whether non-tumour findings were
clinically important or whether further investigation was necessary.
Results
Over a 5-year period, 3257 head scans were performed; 318 scans were excluded according
to pre-specified criteria. 53 patients (1.8%) were reported to have intracranial tumours, of
which 42 were significant (diagnostic yield of 1.43%). There were no false negative CT scans
for tumour. With symptom-based referral guidelines primary care doctors can identify
patients with a 3% positive predictive value (PPV). 559 patients had non-tumour findings,
31% of which were deemed clinically significant. In 34% of these 559 patients, referral for
further imaging and/or specialist assessment from primary care was still thought warranted.
Conclusion
Existing referral guidelines are insufficient to stratify patients adequately based on their
symptoms, according to the likelihood that a tumour will be found on brain imaging.
Identification of non-tumour findings may be significant for patients and earlier specialist

130
input into interpretation of these images may be beneficial. Improving guidelines to better
identify patients at risk of a brain tumour should be a priority, to improve speed of diagnosis,
and reduce unnecessary imaging and costs. Future guidelines may incorporate groups of
symptoms, clinical signs and tests to improve the predictive value.
Introduction
People with a brain tumour see their primary care doctor on average 3 or more times before
diagnosis (Lyratzopoulos et al 2012), so there may be an opportunity to identify ‘at risk’
patients earlier. Patients with alarming ‘high-risk’ symptoms such as focal neurological
deficit caused by a brain tumour are usually diagnosed quickly, either through an emergency
department or via urgent referral to a specialist clinic (e.g. TIA/stroke clinic). By contrast,
patients with more common and lower-risk symptoms (such as headache, cognitive or
personality changes, or a combination of these) are most diagnostically challenging and may
experience their symptoms for several weeks before specialist referral (Ozawa et al 2018).
The rarity of this diagnosis means possible cases will usually have another less serious cause.
In the UK, only 1% of adult brain tumours are diagnosed through a “suspicion of cancer”
secondary care pathway requiring patients to be seen within 2 weeks of referral (England PH
2018). This is one of the lowest of all cancers and is not improving. More adult brain tumours
(35%) are diagnosed through routine secondary care out- patient referral pathways (England
PH 2018). In all likelihood the symptoms in the majority of these brain tumour patients were
insufficient to prompt an urgent cancer referral request.
Guidelines exist to support primary care doctors in identification of patients at risk of having
a brain tumour to guide who should be prioritised for urgent brain imaging. Kernick and

131
colleagues’ symptom-based guidelines (Kernick et al 2008) utilise a flag (red/orange/yellow)
system that reflects three levels of risk for brain tumour, with emphasis on headache
presentations. The National Institute of Health and Care Excellence, (NICE), also developed
referral guidelines for adults with suspected CNS cancer. The 2005 (NICE 2005) guidance
was based on groups of symptoms that should precipitate urgent specialist outpatient
assessment, typically within 2weeks. In 2015 (NICE (2015) the guidelines were simplified to
recommend direct access MRI scan within 2 weeks in adults with progressive, sub- acute loss
of central neurological function. The 2015 guideline did not provide guidance for patients
with other (e.g. cognition, headache) symptoms.
Our objective was to explore the predictive value of the Kernick and NICE 2005 referral
guidelines. To do this we investigated the predictive ability of these current referral
guidelines to identify patients with a brain tumour when applied to a population-based patient
group referred for direct access CT of the head from primary care. We wanted to determine if
there was scope for current referral guidelines to be optimised to improve identification of
patients in primary care most likely to have a brain tumour based on their symptoms, in order
to expedite urgent brain imaging.
Methods
The Lothian region of South East Scotland serves a population of 840,000. Since 1999
primary care doctors in Lothian have had direct access to outpatient computed tomography
(CT) brain imaging via a single referral pathway, for the exclusion of significant intracranial
pathology. This is a group of patients whom the refer- ring primary care doctor did not
consider needed urgent brain imaging.

132
We identified patients aged 16 years or older referred for direct access CT (DACT) between
31 March 2010 and 1 April 2015 from a local electronic database (Fig. 3.1). All information
provided by primary care doctors on the DACT referral was extracted verbatim; the referral
is non-structured and there is no minimum dataset. We excluded patients referred for
scanning after head trauma to rule out haematoma, those patients with known brain tumour
receiving surveillance scans, and where there was no clinical information on the referral form
or other electronic sources. All CT head scans
were performed in the neuroradiological department at the Department of Clinical
Neurosciences, Western General Hospital, Edinburgh, Scotland and reported by a Consultant
Neuro-radiologist.
The Kernick referral criteria (Table 3.1) present 3 symptom groups, where red flag symptoms
indicate the probability of an underlying tumour is ≥1%, orange flag symptoms that the
probability is between 0.1 and 1%, and yellow flag symptoms indicate a probability of less
than 0.1%, but above the population rate of 0.01%. The 2005 NICE referral guidelines
included details of symptoms that should prompt urgent referral, consideration of urgent
referral, or non-urgent referral (Table 3.2). In these guidelines we anticipated that ‘headache
of raised intracranial pressure’ from the “refer urgently” category may not be associated with
an equivalent risk of a brain tumour to ‘symptoms related to the CNS’ and, therefore, we
subdivided these into separate categories (Table 3.2). This allowed a more accurate
comparison of symptom complexes at risk for brain tumour.
Presenting symptoms indicated by the primary care referral were individually recorded and
assigned to one of these symptom categories in both the NICE and Kernick referral
guidelines independently by a junior doctor and a senior medical student (KZ and CI). A
Lothian DACT referral is an open text referral through an electronic platform. The referring

133
primary care doctor can write as little or as much information as they feel is necessary. If a
symptom appeared in more than one category of the referral guidelines, and the information
provided about the presenting symptom was inadequate to assess its severity or
characteristics, it was ascribed to the lowest possible category of urgency in the referral
guidelines. For example, in the case of ‘headache’ symptom with no qualifying information,
the symptom would be recorded as the non-urgent category in the NICE referral guidelines.
If there was disagreement as to which referral guide- line category the presenting symptom
should be ascribed to, one of the other authors (PB), a consultant neurosurgeon, made the
final judgement. The radiological interval was determined as the time from the date of
referral for DACT to the date of brain imaging.
Radiology reports for each patient were categorised by KZ into one of three groups according
to the findings reported by the consultant radiologist: 1) abnormal significant - intracranial
tumour 2) abnormal significant - non-tumour and 3) normal/non-significant incidental
finding. All scan reports where the imaging was not reported as ‘normal’ were reviewed by a
consultant neurosurgeon, (PB), to assess whether the abnormality identified was likely to be
significant in the context of the referral history. This assessment was based on the likely
diagnosis (e.g. tumour), the size and location of the abnormality, and/or whether the
abnormality was thought likely to be responsible for the presenting symptoms, considering
any opinion reported by the consult- ant neuroradiologist. Where necessary, the images were
reviewed. Findings were considered ‘significant’ if clinical details correlated with imaging
findings, or if the imaging findings alone were suggestive of requiring further investigations
irrespective of the symptoms. Findings were considered ‘non-significant’ if they were
reported as within normal limits for age (e.g. some degree of atrophy or small vessel disease)
or were not related to the presenting symptom(s) recorded on the referral.

134
For all patients where a tumour was not diagnosed on imaging, we determined whether
within the duration of the study there was evidence of a tumour diagnosis. We did this by
examining all neuro-oncology multidisciplinary meeting (MDM) minutes for the same 5-year
time- period at Edinburgh Centre for Neuro-Oncology (ECNO), and any subsequent imaging
reports on the patient’s electronic health record, for a minimum of three years.
Confirmation of CNS tumour diagnosis was based on histopathology for all significant
tumours.
We assessed how the imaging report might have influenced the referring primary care doctor.
Three practising primary care doctors, (WHa, based in England, LP and DW based in
Scotland) reviewed ‘abnormal’ imaging reports alongside the accompanying referral text and
determined a potential action plan for follow-up according to the classification system in
Table 3.3. We examined the management plans according to whether the symptom met the
NICE 2005 guidelines for urgent or non-urgent referral.

135
Figure 3.1: Flow chart of identification and analysis of included referrals

136
Table 3.1: “Kernick’s” referring guidance for imaging for investigation of a brain
tumour Red flag symptoms
§ papilloedema § significant alterations in consciousness, memory, confusion, or coordination § new epileptic seizure § new onset cluster headache § headache with a history of cancer elsewhere particularly breast and lung § headache with abnormal findings on neurological examination or other neurological symptoms
Orange flag symptoms § new headache where a diagnostic pattern has not emerged after 8 weeks from presentation § headache aggravated with exertion or Valsalva-like manoeuvre § headache associated with vomiting § headache that has been present for some time but have changed significantly, particularly a rapid
increase in frequency § new headache in patient over 50 years § headache that wake the patient from sleep § confusion
Yellow flag symptoms § diagnosis of migraine or tension-type headache § weakness or motor loss § memory loss § personality change
Table 3.2: NICE 2005 referral guidelines
Ref
er u
rgen
tly
Symptoms related to the CNS, including § progressive neurological deficit § new-onset/suspected recent onset seizures § headaches § mental changes § cranial nerve palsy § unilateral sensorineural deafness
in whom a brain tumour is suspected Headache of recent onset accompanied by features suggestive of raised intracranial pressure, for example:
§ vomiting § drowsiness § posture-related headache § pulse-synchronous tinnitus § or by other focal or non-focal neurological symptoms, for example blackout, change in
personality or memory § a new, qualitatively different, unexplained headache that becomes progressively severe
Con
sider
ur
gent
Patients with rapid progression of: § sub-acute focal neurological deficit

137
§ unexplained cognitive impairment, behavioural disturbance or slowness, or a combination of these
§ personality changes confirmed by a witness and for which there is no reasonable explanation even in the absence of other symptoms and signs of a brain tumour
Con
sider
non
-ur
gent
ref
erra
l Patients with: § unexplained headaches of recent onset: either present for at least 1 month, or not
accompanied by features suggestive of raised ICP
Statistical methods
To examine the diagnostic performance of the imaging/ referral guidelines we calculated the
diagnostic odds ratios using a logistic regression model for the presence of CNS tumour.
Gender and age were considered as con- founding variables and were adjusted for in the
logistic regression model. Correlation between NICE 2005 and Kernick’s referral guideline
symptom categories was analysed using the weighted kappa statistic. A frequency table was
created of the ‘abnormal’ findings reported, and of the action plan determined by the primary
care doctor. The level of statistical significance was set at p <0.05. The data were analysed
using Stata/MP 14.2.
Table 3.3: Potential action plan suggested by GPs for based on direct access head imaging
1 Normal - does NOT explain the presenting symptom(s) 2 Abnormal, but not requiring further investigation - explains the presenting symptom(s) and can be
managed in primary care 3 Abnormal, but not requiring further investigation - does NOT explain the presenting complaint, but
can be managed in primary care 4 Abnormal, requiring further investigation (such as follow up scans or referral), but NO suspicion of
tumour 5 Tumour suspected, requiring referral/follow-up

138
Results
Over a 5-year period, 3256 head scans were performed. After excluding 318 scans according
to pre-specified criteria (see Fig. 1 flowchart), 2938 records were reviewed. The mean age
was 55.6 years (SD = 18.56) and there were more females (1748, 60%); Table 3.4.
Assessors agreed as to categorisation of the presenting symptom in 97% of referrals. From
2938 scans, 53 patients (1.8%) had intracranial tumours reported, of which 42 were
significant (diagnostic yield of 1.43%). Eleven tumours were thought to be incidental,
unrelated to symptom(s) precipitating referral, and likely to be benign meningiomas based on
the radiological appearance. None of these patients proceeded to surgery within the time
course of the study. No patient without intracranial tumour on the DACT imaging report was
subsequently identified to have a tumour on imaging within the study.
Table 3.4: Baseline demographics for patients investigated with direct access CT head imaging over 5-year period (N = 2938)
Patient variable Brain tumour Gender All Present
Female, N (%) 1748 (60) 23 (55) Age (years)
Mean, SD 55.6 (18.56) 60.2 (14.38) Age range in years, N (%)
16-29 335 (11.4) 1 (0.3) 30-39 287 (9.8) 1 (0.3) 40-49 436 (14.8) 9 (2.1) 50-59 547 (18.6) 6 (1.1) 60-69 567 (19.3) 15 (2.6) 70-79 464 (15.8) 7 (1.5) 80+ 302 (10.3) 3 (1.0)

139
Of the significant tumours, 17/42 (40%) patients had metastases, 8/42 (19%) pituitary
tumours, 7/42 (17%) meningiomas, 5/42 (12%) glioblastoma multiforme (GBM), 4/42 (10%)
non-GBM glioma, and 1/42 (2%) a CNS lymphoma.
Brain tumours occurred in each of the Kernick categories with the expected frequencies: red
flag 3.7% (expected > 1%), orange flag 0.7% (expected 0.1 to 1%) and yellow flag 0.09%
(expected 0.01 to < 0.1%) (Table 3.5). Kernick’s red-flag group was the only one with a
significantly increased risk of brain tumour (OR 5.73, 95% CI 2.21–14.84) (Table 5). Using
the NICE 2005 referral guidelines, ‘symptoms related to CNS’ had significantly elevated
odds ratio for presence of a brain tumour (OR 5.21, 95% CI 1.81–14.92) compared to the
symptoms recommended for non-urgent referral (Table 3.6).
Table 3.5: Frequency of tumours from direct access CT grouped based on Kernick referral criteria. Odds ratio with 95% CI for each flag symptom, for the presence of a brain tumour.
Brain tumour
Total Absent Present
Freq % Freq % Odds ratio
95%CI PPV
Red flag symptoms 1141 1109 92 32 8 5.73 2.21-14.84 2.8 Orange flag symptoms 728 723 99 5 0.7 1.34 0.38-4.68 0.7 Yellow flag symptoms 1069 1064 99 1 0.09 reference 0.5
Adjusted for age and sex Table 3.6: Frequency of referrals for direct access CT grouped based on clinical criteria from NICE 2005 guidelines. Odds ratio with 95%CI/PPV for each criteria of NICE 2005 guidelines for the presence of a brain tumour.
Brain tumour Total Absent Present Freq % Freq % Odds
ratio 95%CI PPV
Symptoms related to the CNS 1150 1117 97 33 3 5.21 1.81-14.92 2.9 Headache of raised ICP 473 469 99 4 1 1.65 0.41-6.67 0.8 Sub-acute deficits focal/personality/cognitive/behavioural
525 524 99 1 <1 0.31 0.03-2.79 0.2
Simple headache 790 786 99 4 1 reference 0.5 Adjusted for age and sex
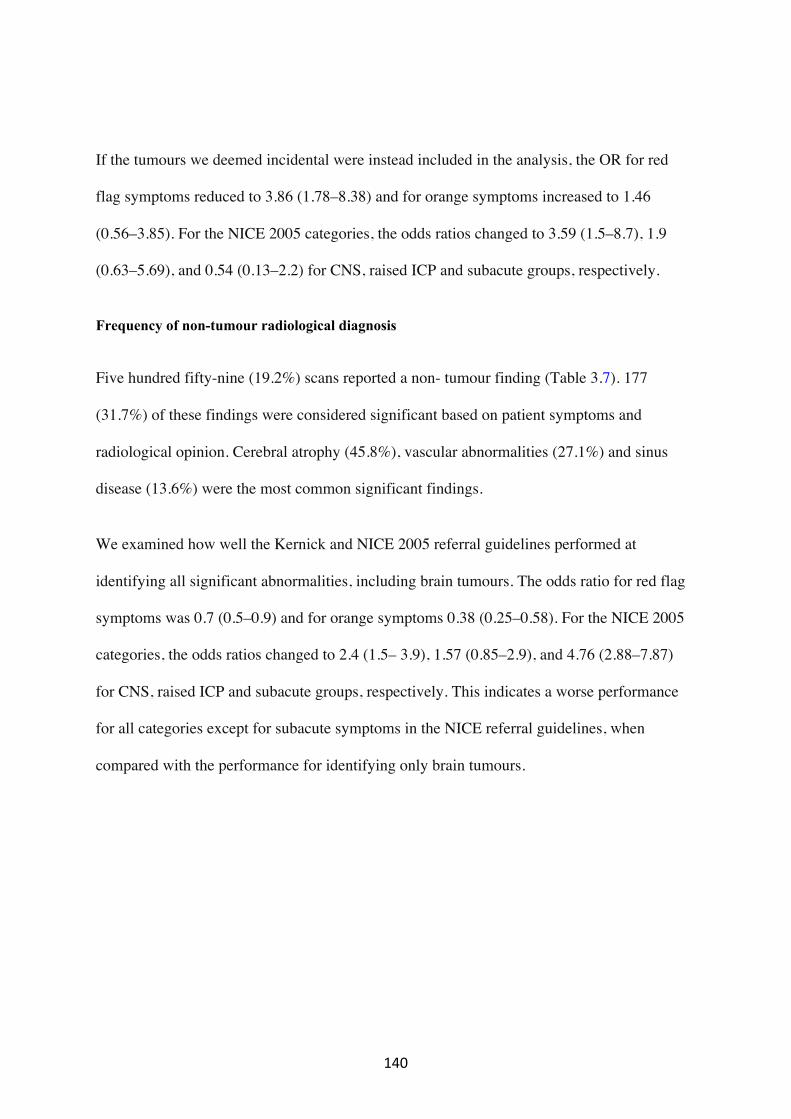
140
If the tumours we deemed incidental were instead included in the analysis, the OR for red
flag symptoms reduced to 3.86 (1.78–8.38) and for orange symptoms increased to 1.46
(0.56–3.85). For the NICE 2005 categories, the odds ratios changed to 3.59 (1.5–8.7), 1.9
(0.63–5.69), and 0.54 (0.13–2.2) for CNS, raised ICP and subacute groups, respectively.
Frequency of non-tumour radiological diagnosis
Five hundred fifty-nine (19.2%) scans reported a non- tumour finding (Table 3.7). 177
(31.7%) of these findings were considered significant based on patient symptoms and
radiological opinion. Cerebral atrophy (45.8%), vascular abnormalities (27.1%) and sinus
disease (13.6%) were the most common significant findings.
We examined how well the Kernick and NICE 2005 referral guidelines performed at
identifying all significant abnormalities, including brain tumours. The odds ratio for red flag
symptoms was 0.7 (0.5–0.9) and for orange symptoms 0.38 (0.25–0.58). For the NICE 2005
categories, the odds ratios changed to 2.4 (1.5– 3.9), 1.57 (0.85–2.9), and 4.76 (2.88–7.87)
for CNS, raised ICP and subacute groups, respectively. This indicates a worse performance
for all categories except for subacute symptoms in the NICE referral guidelines, when
compared with the performance for identifying only brain tumours.

141
Table 3.7: Frequency of non-tumour findings on direct access CT imaging Abnormality Frequency
Total Significant (%)
Cerebral atrophy 206 81 (39.3)
Ventricular abnormality 11 8 (72.7)
Incidental CNS tumour 11 N/A
Benign cystic lesion 20 2 (10.0)
Sinus disease 58 24 (48.0)
Arnold Chiari malformation type 1/tonsillar ectopia
27 9 (33.3)
ENT tumour 4 1 (25.0)
Vascular 195 48 (24.6)
Other 38 4 (10.5)
Total 570 177 (31.1)
Management of radiological findings in primary care
We determined possible management of the 559 patients with non-tumour findings in
primary care from the available referral history and CT brain imaging findings (Table 3.8).
Table 3.8: Frequency table action plan by primary care doctor for reported non-tumour findings from direct access head imaging, N (%)

142
Nor
mal
- do
es N
OT
expl
ain
the
pres
entin
g sy
mpt
om(s
)
Abn
orm
al, b
ut n
ot re
quiri
ng fu
rther
inve
stiga
tion
- ex
plai
ns th
e pr
esen
ting
sym
ptom
(s) a
nd c
an b
e m
anag
ed in
prim
ary
care
A
bnor
mal
, but
not
requ
iring
furth
er in
vesti
gatio
n -
does
NO
T ex
plai
n th
e pr
esen
ting
com
plai
nt, b
ut
can
be m
anag
ed in
prim
ary
care
A
bnor
mal
, req
uirin
g fu
rther
inve
stiga
tion
(suc
h as
fo
llow
up
scan
s or r
efer
ral),
but
NO
susp
icio
n of
tu
mou
r
Tum
our s
uspe
cted
, req
uirin
g re
ferra
l/ fo
llow
-up
Cerebral atrophy 12 (5.8)
53 (25.7)
76 (36.9)
65 (31.6) 0
Ventricular abnormality
1 (9.8)
1 (9.8)
5 (45.5)
4 (36.4) 0
Incidental CNS tumour 0 0 5 (45.5)
0 6 (54.5)
Benign cystic lesion 0 2 (10) 6 (30) 12 (60) 0 Sinus disease 7
(12.1) 9
(15.5) 23
(39.7) 19 (32.8) 0
Arnold Chiari malformation type 1/tonsillar ectopia
5 (18.5)
2 (7.4)
12 (44.4)
8 (29.6) 0
ENT lesion 0 0 3 (75) 1 (25) 0 Vascular 12
(6.2) 37
(19) 74
(37.9) 72 (36.9) 0
Other 7 (18.4)
2 (5.3)
15 (39.5)
14 (36.8) 0
Total 44 (7.7)
106 (18.6)
219 (38.4)
195 (34.2)
6 (1.1)
Urgent referral (N, %) 35
(6.5) 97
(18) 195
(36.2) 172 (32) 39 (7.2)
Non-Urgent (N, %) 9 (12) 9 (12) 24 (32)
29 (38.7) 4 (5.3)
18.6% of imaging abnormalities were determined to require no further follow-up but did
explain the patient’s presenting symptom. 38.4% of radiologically reported abnormalities did
not explain the patient’s presenting symptoms, but care could be managed in primary care.
34.2% of patients required referral for further imaging or specialist assessment. 38.7% of

143
referrals with an imaging abnormality that met the NICE 2005 ‘non-urgent classification’
would still have been referred for further imaging or specialist opinion.
We performed a cross tabulation to compare the three principal categories of NICE and
Kernick referral guidelines based on recommended speed of referral (Table 3.9). Whilst
100% of Kernick red flag cases were also classified as refer urgently according to the NICE
2005 guidance, there was overall quite a lot of disagreement and the weighted kappa showed
only modest agreement beyond chance (0.33). This highlights that the different referral
guidelines are making different management recommendations for any given symptom.

144
Table 3.9: Cross tabulation of symptoms within Kernick and NICE 2005 referral guidelines based on recommended speed of referral NICE 2005 categories
Refer Urgently Consider urgent referral Non-urgent referral Total Kernick Red flag Count 1141 0 0 1141
% within Kernick 100 0 0 100 % within NCIE 70.3 0 0 38.8
% of total 38.8 0 0 38.8
Orange flag Count 468 4 256 728
% within Kernick 64.3 0.5 35.2 100
% within NICE 28.8 0.8 32.4 24.8
% of total 15.9 0.1 8.7 24.8 Yellow flag Count 14 521 534 1069
% within Kernick 1.3 48.7 50 100
% within NICE 0.9 99.2 67.6 36.4 % of total 0.5 17.7 18.2 36.4
Total
Count 1623 525 790 2938
% within Kernick 55.2 17.9 26.9 100 % within NICE 100 100 100 100
% of total 55.2 17.9 26.9 100

145
Discussion
Summary
Our study is the first to examine the diagnostic utility of both the NICE 2005 (NICE 2005)
and Kernick (Kernick et al 2008) guidelines in a population-based patient group and to
consider the relevance of significant non-tumour pathology.
The availability of direct primary care access to brain imaging (DACT) varies across the UK.
In areas where it is available the Kernick and NICE guidelines may be used to inform referral
decisions. Broadly, based on symptoms (red flags or NICE 2005 ‘symptoms related to the
CNS’) primary care doctors can identify patients who have a brain tumour with a 3% PPV.
Nearly 80% of patients whose CT revealed a brain tumour had ‘symptoms related to the
CNS’ on NICE 2005 or Kernick’s red-flag symptoms. Overall, the Kernick system performed
as predicted (Kernick et al 2008).
Nineteen percent of scans reported non-tumour findings, 18.6% of these non-tumour findings
were thought by primary care doctors to explain the patient’s symptoms. One third of patients
with a non-tumour ab- normal finding were judged to require onward specialist referral.
Access to DACT will influence management of more patients who do not have brain tumours
than those that do. Most significant non-tumour findings fall into Kernick’s yellow flag
group, and into the sub-acute focal deficits of NICE, so DACT should not be restricted to the
‘refer urgently’ and red-flag symptom categories. Further, whether patients with lower
prevalence symptoms (e.g. yellow and orange flags) might also benefit through faster ruling
in or out of cancer and the diagnosis of other pathology, and whether this is justified by the
cost and potential harm (radiation and over diagnosis) of CT, requires further study.

146
Whilst existing referral guidelines may meet their intended threshold of specificity, these
guidelines are insufficient to adequately stratify patients. Moreover, the different referral
guidelines make different management recommendations in terms of urgency for some symp-
toms. For example, all of the Kernick red flags are also in NICE refer urgently, but 30% of
NICE refer urgently are either in Orange and even a few in Yellow flags.
These referral guidelines are recommending quite different decisions for some patients,
reflecting the evidence that any individual patient symptom is poorly predictive of a brain
tumour (Ozawa et al 2018). This is important, because inefficient guidelines crowd the
referral system, adding to delay in diagnosis for those patients who do have a brain tumour.
Whether more liberal DACT criteria is a good use of NHS money requires further research.
Strengths and limitations
This is the largest reported population-based study of primary care imaging referrals for
suspected intracranial abnormality. Grouping was performed by two authors, and a third
where necessary, to increase accuracy. All scans were performed at a single clinical
neurosciences centre and were reported by a consult- ant neuro-radiologist. As this was part
of a retrospective study it allowed sufficient follow-up to record false negatives for a brain
tumour with respect to the initial diagnostic CT scan; we did not identify any. A strength is
that we examined scan utility in patients with non-tumour pathology, based on a consensus
opinion. Despite the large number of referrals that yield of brain tumour cases was not large,
hence we have imprecise estimates for our odds ratios.
Many patients with sudden onset symptoms that precipitate immediate hospital assessment at
an emergency department will also fall into the Kernick red flag category. Our approach
therefore underestimates the predictive ability of the Kernick system in the whole brain

147
tumour population, although our data does reflect the situation in primary care when
uncertainty about a brain tumour diagnosis exists.
Implications for practice and research
The non-specificity of many symptoms associated with brain tumours makes it difficult to
identify patients to prioritise for brain imaging. Our data demonstrates that existing
guidelines provide some assistance to the primary care doctor. We utilised the 2005 NICE
guidelines because they provided a greater granularity of patient symptoms than 2015
guidelines. Since we demonstrated that only ‘symptoms related to CNS’ is a useful predictor
of whether or not a patient may have a brain tumour, the simplification in 2015 may be
justified.
A relatively large proportion of our patients were referred for headache only (26.9%). Certain
headache features may raise suspicion of an underlying brain tumour (BASH 2010), but are
still not specific (Schankin et al 2007). We previously demonstrated that patients with non-
specific symptoms such headache, cognitive changes or personality changes are subjected to
the longest delay from onset of symptoms to brain tumour diagnosis (Ozawa et al 2018).
Combining these symptoms may help identify patients to prioritise for brain imaging (Ozawa
et al 2018), but this must be balanced against the ‘risk’ of detecting pathology incidental to
the clinical presentation.
In our cohort, there were no false-negative results.
The NICE 2015 guidelines recommend cranial MRI for suspected brain tumour in patients
with progressive sub-acute loss of central neurological function (CT only if MRI contra-
indicated). The low uptake of imaging for brain tumours in primary care compared to other
cancers (England NHS 2016) may in part reflect variation in access to brain imaging. There

148
are fewer MRI scanners in the UK than almost any other Western European country (Martin
2014). Our data suggest CT imaging may be adequate as a test in patients deemed at risk of a
brain tumour based on headache symptoms. CT is the standard initial imaging modality for
patients with acute onset focal stroke-like symptoms (Broderick et al 2007) and is not
diagnostically inferior in identifying clinically significant pathologies for non-acute headache
presentation (Frishberg et al 2000; Ifediora 2018). Cranial CT costs less and is more readily
available than MRI. MRI might be re- served for specific patients, such as those with new
onset seizures, where a radiologically subtle low-grade tumour is more likely (Whittle 2004).
Potential risks of ionising radiation are sometimes cited to recommend MRI over CT, al-
though an individual patient’s risk is small (Smith-Bindman et al 2009). It is projected that 1
in 8100 women aged 40 years will develop cancer from a single head CT (Smith-Bindman et
al 2009). The risks may be doubled for 20-year-olds (Smith-Bindman et al 2009) so It may be
necessary to prioritise MRI in younger patients.
Comparison with other studies
Our diagnostic yield of the referral guidelines for a significant brain tumour was 1.43%,
slightly higher than that reported by Benamore (2005) (for any symptom presentation -
1.28%) or Simpson (2010) (for symptom of headache only - 0.5%), both with open access
CT.
For some patients a negative scan for a brain tumour provides reassurance (Apthorp et al
1998; Howard et al 2005). Incidental findings are not uncommon, even in asymptomatic
patients, and can result in additional patient worry, investigations and cost(Benamore et al
2005; Booth et al 2016; Ifediora 2018; Morris et al 2009). Nearly a fifth of all scans in our
study identified a non-tumour finding, similar to patients referred for imaging with any
symptom (Benamore et al 2005; Mohammad et al 2016) or headache only (Ifediora 2018).

149
18.6% of our non-tumour findings likely explained the symptoms precipitating referral,
although the incidence of significant cerebral atrophy may have been overstated, because we
performed qualitative estimation of atrophy, which is known to have inter-rater variability
(Leonard et al 1994). For two thirds of abnormal radiological findings, primary care doctors
in our study would be confident to manage patients in primary care, reflecting other reports
(Benamore et al 2005; Ifediora 2018). In keeping with previous findings (Benamore et al
2005), CT for ‘simple’ headache (“non-urgent” category according to NICE 2005) may
require further follow-up or additional investigation in 38.7% of cases where a non-tumour
abnormality is found.
Primary care doctors often report difficulty interpreting neuro-radiological reports,
particularly incidental abnormalities (Underwood et al 2017), and find radiologists’
recommendations for further treatment, referral or non-radiological investigation valuable
(Grieve et al 2010). There is no agreed consensus among radiologists on reporting of
incidental findings and/or recommending follow-ups. Primary care doctors rely on their
judgement interpreting and relaying these reports to patients, which may cause anxiety for the
primary care doctor and lead to additional referrals (Kernick et al 2011). A recent qualitative
prospective study with 20 GPs identified a need for standardised reporting of scans to
improve GP’s use of direct-access MRI (Underwood et al 2017), which may also be
appropriate for CT scans.
Conclusions
Guidelines should provide an evidence-base to assist primary care doctors in identifying
patients most at risk of having a brain tumour (i.e. diagnostic accuracy), but also the fastest
route to achieve diagnosis (e.g. direct access imaging versus urgent secondary care referral).
Direct access CT scanning has a low false negative rate. However, existing referral guidelines

150
are insufficient to adequately stratify patients based on their symptoms according to the
likelihood that a tumour will be identified on brain imaging. Improving guidelines to better
identify patients at risk of a brain tumour should be a priority, to improve speed of diagnosis,
and reduce unnecessary imaging and costs. Future guidelines may need to in- corporate
groups of symptoms, clinical signs and tests to improve the predictive value. In patients
referred for DACT, identification of non-tumour findings may be important for patients.
Earlier specialist input into interpretation of these non-tumour abnormality images may be
warranted and appreciated.

151
References
Apthorp LA, Daly CA, Morrison ID, Field S. Direct access MRI for general practitioners influence on patient management. Clin Radiol. 1998. BASH: British Association for the Study of headache. Guidelines for all healthcare professionals in the diagnosis and management of migraine, tension-type headache, cluster headache, medication-overuse headache. 2010. Benamore RE, Wright D, Britton I. Is primary care access to CT brain examinations effective? Clin Radiol. 2005. Booth TC, Najim R, Petkova H. Incidental findings discovered during imaging: implications for general practice. Br J Gen Pract. 2016. Broderick J, Connolly S, Feldmann E, Hanley D, Kase C, Krieger D, et al. Guidelines for the management of spontaneous intracerebral hemorrhage in adults: 2007 update. Guideline from the American Heart Association/ American Stroke Association stroke council, high blood pressure researchcouncil, and the quality of care and outco. Stroke. p. 2007. England N: Diagnostic imaging dataset: annual statistical release 2015/2016. NHS England 2:2016. England PH. Routes to diagnosis 2006-2016 year breakdown. Public Heal Engl. 2018. Frishberg BM, Rosenberg JH, Matchar DB, McCrory DC, Pietrzak MP, Rozen TD, et al. Evidence-based guidelines in the primary care setting: neuroimaging in patients with nonacute headache. Am Acad Neurol [online]; 2000. https://www.aafp.org/afp/2005/0315/p1219.html. Grieve FM, Plumb AA, Khan SH. Radiology reporting: a general practitioner’s perspective. Br J Radiol. 2010. Howard L, Wessely S, Leese M, Page L, McCrone P, Husain K, et al. Are investigations anxiolytic or anxiogenic? A randomised controlled trial of neuroimaging to provide reassurance in chronic daily headache. J Neurol Neurosurg Psychiatry. 2005. https://www.nice.org.uk/guidance/ng12/chapter/1-Recommendations- organised-by-site-of-cancer#brain- and-central-nervous-system-cancers. Ifediora CO: Insights into radiographic investigations for headaches in general practice. Fam Pract 35:412–419, 2018 Available: http://www.ncbi. nlm.nih.gov/pubmed/29373665. Accessed 23 Dec 2018. Kernick D, Williams S. Should GPs have direct access to neuroradiological investigation when adults present with headache? Br J Gen Pract. 2011. Kernick DP, Ahmed F, Bahra A, Dowson A, Elrington G, Fontebasso M, et al. Imaging patients with suspected brain tumour: guidance for primary care. Br J Gen Pract. 2008. Leonardi M, Ferro S, Agati R, Fiorani L, Righini A, Cristina E, et al.: Interobserver variability in CT assessment of brain atrophy. Neuroradiology 36:17–19, 1994 Available:

152
http://link.springer.com/10.1007/BF00599186. Accessed 23 Dec 2018. Lyratzopoulos G, Neal RD, Barbiere JM, Rubin GP, Abel GA, Schlesinger M: Variation in number of general practitioner consultations before hospital referral for cancer: findings from the 2010 National Cancer Patient Experience Survey in England. Lancet Oncol 13:353–365, 2012 Available: http://www.ncbi.nlm.nih.gov/pubmed/22365494. Accessed 16 June 2017. Martin D: Deadly shortage of cancer scanners that shames UK: Britain has fewer MRI machines than almost any other Western country. Dail Mail: 2014 Available: http://www.dailymail.co.uk/news/article- 2672902/Deadly-shortage- cancer-scanners-shames-UK-Britain-fewer-MRI-machines-Western- country.html. Mohammad HR, Boardman J, Howell L, Mills RJ, Emsley HCA: Urgent referral for suspected CNS cancer: which clinical features are associated with a positive predictive value of 3% or more? BMC Neurol 16:152, 2016 Available: http://bmcneurol.biomedcentral.com/articles/10.1186/s12883-016-0677- Accessed 23 Dec 2018. Morris Z, Whiteley WN, Longstreth WT, Weber F, Lee YC, Tsushima Y, et al. Incidental findings on brain magnetic resonance imaging: systematic review and meta-analysis. BMJ. 2009. NICE: Referral guidelines for suspected cancer. 2005. NICE: suspected cancer: recognition and referral (NG12). 2015 Ozawa M, Brennan PM, Zienius K, Kurian KM, Hollingworth W, Weller D, et al.: Symptoms in primary care with time to diagnosis of brain tumours. Fam Pract 35:551–558, 2018 Available: https://academic.oup.com/fampra/ article/35/5/551/4840710. Accessed 11 Dec 2018. Schankin CJ, Ferrari U, Reinisch VM, Birnbaum T, Goldbrunner R, Straube A. Characteristics of brain tumour-associated headache. Cephalalgia. 2007. Simpson GC, Forbes K, Teasdale E, Tyagi A, Santosh C. Impact of GP direct- access computerised tomography for the investigation of chronic daily headache. Br J Gen Pract. 2010;60(581):897–901. Smith-Bindman R, Lipson J, Marcus R, Kim KP, Mahesh M, Gould R, et al. Radiation dose associated with common computed tomography examinations and the associated lifetime attributable risk of cancer. Arch Intern Med. 2009;169(22):2078–86. Underwood R, Kilner R, Ridsdale L: Primary care management of headaches and how direct-access MRI fits: a qualitative study of UK general practitioners’ views. BMJ Open. 2017;7(11):e018169. https://bmjopen.bmj. com/content/7/11/e018169. Whittle IR. The dilemma of low grade glioma. J Neurol Neurosurg Psychiatry. 2004.

153
Part 4
Study 2
Factors associated with index diagnosis of adult brain tumour in the
Emergency Department offer insights to enhance earlier diagnosis of brain
tumours.
K Zienius, M Ozawa, K M Kurian, D Weller, Y Ben-Shlomo, R Grant and PM Brennan
In preparation for submission
Approximately two-thirds of adults with a brain tumour are diagnosed at emergency
department despite having consulted their primary care doctor previously, often more than
once. Heterogenous nature of symptoms and the lack of concrete symptoms or symptom
complexes make this diagnosis exceptionally challenging to suspect in primary care. This
study aimed to describe the clinical and diagnostic pathway of 180 adults with a recently
diagnosed brain tumour with a particular emphasis on factors resulting in emergency
presentation.
Background
Brain tumours frequently present for the first time at emergency departments (ED). We
specifically sought new insights in understanding delays to diagnosis that lead to ED

154
presentation by examining associations of patient and tumour variables with each diagnostic
interval.
Methods
A total of 180 adults with newly diagnosed brain tumours of mixed aetiology were included
in a prospective study to assess the clinical diagnostic pathway in South East Scotland. We
calculated patient, primary and secondary care, total and diagnostic pathway intervals. Odds
ratios (ORs) were calculated to identify predictors for prolonged pathway intervals. The
cumulative development of symptoms was described for the whole patient sample and for
patients diagnosed at ED.
Results
Time to diagnosis from first symptom onset was approximately 2 months. Two-thirds of
patients (N=123, 68.3%) were diagnosed after presenting to ED, of whom the majority were
self-presenters (N=83, 67.5%). Majority had 3 or more symptoms before diagnosis, of which
headache and cognitive slowing were most common. Although episodic altered
consciousness (EACS) or seizure was the most common symptom precipitating self-
presentation to ED, over half of these patients had earlier developed headache or cognitive
complaints. Forty-one percent of self-presenters to ED had a prior GP visit, of whom 15
(44%) had ≥3 visits. Initial non-seizure symptoms, and tumour situated other than in the left
hemisphere were factors associated with consulting a GP prior to ED presentation.
Conclusion

155
Seizure is the symptom most commonly precipitating self-presentation to ED, but most
patients have several symptoms before diagnosis. Half of such patients complain of initial
non-specific vague symptoms prior to development of seizure. Improved symptom awareness
by patients and GPs, with more timely access to diagnostic imaging, may have facilitated
earlier diagnosis.

156
Introduction
Brain tumours are one of the most common tumours diagnosed in the emergency department
(ED). The majority of adult brain tumours are diagnosed in the ED, despite most patients
having seen their General Practitioner (GP) several times prior to diagnosis (Lyratzopoulos et
al, 2013). This has little changed since 2006 (Ellis-Brookes et al 2012; Swann et al 2018).
Attempts to reduce delays to brain tumour diagnosis have largely focused on using symptom-
based diagnostic criteria to identify which patients should be prioritised for brain imaging.
This is challenging, because patients often initially complain of vague (non-specific)
symptoms, such as headache or cognitive impairments (Walter et al 2012; Salander et al
1999), which are more commonly associated with non-brain tumour conditions (Penfold,
Joannides et al, 2017; Walter 2012). Less than 2% of patients referred from primary care for
urgent brain imaging to exclude a serious pathology actually have a tumour and the positive
predictive value (PPV) of the best performing symptom-guidelines is only around 3%
(Zienius 2019). Symptom combinations, such as headache and cognitive change, have an
increased PPV for brain tumour (7.2%) compared to headache or cognition alone, (PPV
0.1%, and 0.7%, respectively)(Ozawa et al 2019), but determination of which patients to
prioritise for brain imaging is still difficult.
The lack of specificity of symptoms in patients with a new brain tumour contributes to delays
in diagnosis (Ozawa et al 2018). Nevertheless, non-specific symptoms may not be the only
reason for delayed diagnosis and emergency department presentation. Delay can occur at any
point along the diagnostic pathway (Walter et al 2012). A systematic approach to

157
characterising the diagnostic journey for these patients may help identify opportunities for
interventions to reduce these delays.
We undertook a detailed analysis of the diagnostic pathway in a cohort of patients with a new
brain tumour diagnosis. We specifically sought new insights in understanding delays to
diagnosis that lead to ED presentation by examining associations of patient and tumour
variables with each diagnostic interval.

158
Methods
Participants
All adult patients with intracranial tumours in south East Scotland are managed in the
Regional Neurosciences Unit of the Western General Hospital, Edinburgh. The catchment
area for the Neurosurgical Service covers approximately 1.5 million people (ScotPHN,
2007). Patients with a newly suspected brain tumour are discussed at regional weekly neuro-
oncology multidisciplinary meeting (MDM). Patients offered surgical tumour biopsy or
debulking are evaluated in a “pre-admission clinic” or admitted directly to the neurosurgical
unit.
The study evaluations took place between 19 August 2016 and 14 February 2018. One
hundred and eighty patients were identified prospectively from the MDM (Figure 4.1).
Procedure
In studies of early cancer diagnosis, Weller (2012) recommended that a patient or their carer
should be a primary data source for capturing early stages of the pathway. The routine
preadmission assessment includes a detailed patient consultation that characterises the
patient’s diagnostic journey. We extracted data from the record of this consultation. We
identified
a) the first/earliest symptom(s) and date
b) Which health care provider was the first point of contact and date
c) What symptoms led to GP/hospital presentation


160
because development of confusion, similarly to focal neurology, was previously found to lead
to faster diagnosis compared to other ‘cognitive change/memory/personality’ (Ozawa et al
2018). The 3 domain categorisation was undertaken to facilitate data analysis, because of the
low frequency of individual symptoms in some cases (Table 4.1).
Table 4.1: Classification of individual symptoms into 3 broad symptom categories
Seizure Loss of awareness with features of complex partial seizure or absence seizure Focal motor/sensory/hallucination/ seizure (unspecified) Tonic clonic seizure
Alarm symptoms Confusion Dysarthria Dysphasia Diplopia Unilateral weakness/sensory Unsteadiness/ataxia/incoordination
Vague symptoms Change in personality Cognitive change Deafness Depression (mood) Difficulty starting/completing tasks Lightheadedness/dizziness Fatigue Headache Loss of taste Memory loss Nausea/vomiting Problem with visual acuity Visual disturbance (unspecified) Visual field disturbance (unspecified)

161
Definitions of time intervals of brain cancer diagnosis and treatment
We followed the guidance by Olesen et al 2009 in determining diagnostic time points in order
to estimate diagnostic intervals across the pathway. Intervals were as follows: patient,
primary care, secondary care, total diagnostic, and treatment intervals.
The date of first symptom:
The time point when first bodily changes and/or symptoms are noticed, when the person
perceives a reason to discuss the symptom with a healthcare professional or the date when the
first “alarm” symptom or “high-risk” symptom was noticed. We recorded the earliest of these
dates for each patient.
First contact with the health care provider (i.e. primary care physician, emergency, other):
The time point at which, given the presenting signs, symptoms, history and other risk factors,
it would have been possible for the assessing clinician to have started investigation or referral
for possible important pathology, including cancer. In most cases, information was provided
by the patient themselves, or their carers. If not, we obtained this information from primary
care records.
Primary care interval:

162
From the date of first contact with a health care professional in primary care to the date of
subsequent referral to secondary care for the given symptom(s) suggestive of significant
pathology, including a brain tumour.
Secondary care interval
From the date of referral for further investigation for possible important pathology to the date
of radiological diagnosis of a brain tumour.
Date of diagnosis:
Date of diagnosis was determined form the date of radiological diagnosis. In instances where
a patient had a CT scan that reported no tumour, but on repeat scan for the same symptoms a
tumour was reported, we used the date of the second scan as the date of diagnosis.
Date of treatment:
Date of surgical intervention.
Other covariates
We also examined the following additional covariates:
§ Patient related: gender, age, Scottish Index of Multiple Deprivation (1-most deprived
to 5- most affluent), education level, marital status, comorbidity score (see supplementary
table 1).
§ Disease related: tumour histology, lobe, and laterality.

163
Statistical analyses
Individual symptoms were reported by frequency. We calculated the median (interquartile
range) time to diagnosis (in days) according to patient, primary and secondary care, total time
and treatment intervals. The diagnostic interval for each time points were grouped as ‘early’
or ‘prolonged.’ ‘Early’ interval was defined as the time interval equal or below the median
for that time point, while ‘prolonged’ was defined as the interval above median value. The
median values of intervals already established in previous studies or guidelines were used as
a reference point. For example, Swann et al estimated a median primary care interval within 3
days. For patient and total time to diagnosis intervals we calculated the median value as a
reference point, since no previous data were available.
We assessed for potential associations between characteristics in question and time intervals,
by calculating the odds ratio (ORs), 95% confidence intervals (CI) using multivariable
logistic regression analysis. We calculated crude and multivariable odds ratios, adjusting for
potential confounders including age and sex, that are considered to influence outcome .
In order to compare patient and clinical variables across different patient groups, we
subdivided the total cohort into 3 groups based on their route of presentation for diagnosis,
namely General Practitioner-Emergency Department (GP-ED), self-emergency department
(self-ED) and General Practitioner-Out-Patient Department (GP-OPD).
All statistical analyses were performed with IBM SPSS version 24.
Results

164
180 patients selected for surgical biopsy or resection, and without study exclusions (Figure
4.1) were included in the analysis. Patient characteristics are presented in Table 4.2.
Table 4.2: Baseline patient characteristics
Brain tumour patients N=180 (%)
Age in years, M (SD) 56.8 (13.5) Gender (N, %) Male 86 (48.0) Female 94 (52.0) Social deprivation index (N, %) 1 28 (15.7) 2 43 (24.2) 3 32 (18.0) 4 35 (19.7) 5 40 (22.5) Karnofsky Performance Score (KPS), median (range)
90 (50-100)
Tumour histology, N (%) High grade glioma (WHO III-IV)
77 (42.8)
Meningioma 42 (23.3) Cerebral metastasis 28 (15.6) Low grade glioma (WHO I-II) 14 (7.8) CNS Lymphoma 5 (2.8) Other 14 (7.8) Tumour lobe, N (%) Frontal 68 (37.8) Temporal 34 (18.9) Parietal 18 (10.0) Occipital 13 (7.2) Cerebellar 16 (8.9) Multiple 15 (8.3) Other 16 (8.9) Tumour laterality, N (%) Left 80 (44.4) Right 64 (35.6) Bilateral 22 (12.2) Midline 14 (7.8) Maximum size T1 (axial), mean (mm) (SD)
41.1 (15.1)

165
Most patients 110 (61.1%) had malignant brain tumour histology, including 77 high grade
glioma (HGG), 28 cerebral metastasis and 5 Primary CNS lymphoma. The frontal lobe was
the most prevalent site in 68 (37.8%).
Diagnostic intervals
Based on Olesen’s Clinical Pathway model, the median intervals in days of all patients
(N=180) across each point in the diagnostic pathway were: patient interval (N = 175) - 21
days (IQR 7,92), primary care interval (N = 103) – 5 (IQR 0,29), secondary care interval (N
= 167) – 1 (0-14), total time to diagnosis (TtD) (N = 180) – 63 (22-212), treatment interval
(N = 180) – 26 (IQR 13,58).
Total Time to Diagnosis
Increased total time to diagnosis (TtD) for all patients was significantly associated with being
a female (aOR 2.6, 95%CI 1.4-4.8), non-emergency presentation (aOR 2.6, 95%CI 1.3-5.2),
presenting with a vague first symptom (aOR 3.0, 95%CI 1.2-7.9), and non-malignant tumour
histology (LGG, aOR 5.99, 95%CI 1.5-24.6, and other, aOR 5.0, 95%CI 2.3-11.2). Patients
aged 60-69 years old had a significantly shorter total time to diagnosis than those aged 40-59
years old (aOR 0.4, 95%CI 0.2-0.8).
Where patients presented to ED (N=123), the median time to a diagnostic scan was 0 days
(IQR 0-1). Seven patients however had a prolonged time from ED presentation to
radiological diagnosis (over 30 days) as their initial scan was reported as non-diagnostic.

166
Only 1 (14%) of those initial non-diagnostic scans were performed with contrast compared to
78 (74%) scans with contrast that identified brain tumour.
Diagnostic time intervals and logistic regression analyses for each stage of the patient
pathway are summarised in Supplementary table 1 for further information.
Patient contact with healthcare provider (N=180)
Most patients (n=123, 68.3%) were diagnosed when they presented to an emergency
department, of whom the majority were self-presenters (N=83, 67.5%). A quarter (N=30,
24.4%) of patients were directly referred by their GPs and 8.1% had been earlier referred to a
specialist or for a computed tomography (CT) scan, but self-presented to ED while awaiting
the appointment. Forty-eight patients (26.7%) were diagnosed having been referred to
hospital outpatient clinics and for 9 patients (5%) an optician was the principal referrer
(Table 4.3)
Table 4.3: Description of health care contacts prior to brain tumour diagnosis N %
Emergency diagnosis 123 68.3 • Referred by GP to ED 30 24.4 • Self-presented to ED 83 67.5 o prior GP visit 34 41 o no prior GP visit 49 59 • GP referred for OPD/OACT but patient self-presented to ED
10 8.1
OPD diagnosis 48 26.7 Optician 9 5
ED – emergency department, GP – General Practitioner, OPD – out-patient department, OACT – open
access computed tomography.

167
Patients with higher grade tumours more often presented to ED than were diagnosed through
GP-OPD referral. As expected, most seizures led to an ED self-presentation. There was a
much higher incidence of seizures in the self-ED group compared with GP-ED or GP-OPD
(20%, 3.3% and 4.5%, respectively). However, for vague symptoms similar frequencies were
seen between 3 groups of presentation. Patients with a social deprivation score indicating
most deprivation were less likely to be referred from their GP for outpatient investigation
than patients with a most affluent score (7% versus 27%), however the difference was not
statistically significant.
Table 4.4: Characteristics for 3 different cohorts of patients based on route of
presentation
Variables GP-ED (N=30)
Self-ED (N=83)
GP-OPD (N=44)
P-value
Age, in years (SD) 58.7 (12.4) 56.2 (13.9) 57.3 (13.4) 0.651
Gender (N, %)
Male 19 (63%) 44 (52%) 17 (35%) 0.092
Female 11 (37%) 39 (48%) 27 (65%) Social deprivation score (N, %)
Most deprived 6 (20%) 15 (18.1%) 3 (7%) 0.132
Most affluent 6 (20%) 15 (18.8%) 12 (27%) Marital status (N, %)
Married/Civil partnership
21 (70%) 55 (66%) 28 (64%) 0.852
Other 9 (30%) 28 (34%) 16 (36%) First presenting symptom (N, %)
Seizure 1 (3.3%) 17 (20%) 2 (4.5%) 0.0382
Alarm 13 (43.3%) 24 (29%) 16 (36.4%) Vague 16 (53.3%) 42 (51%) 26 (59.1%) Histology (N, %)
Primary high grade 17 (56.7%) 42 (50.6%) 14 (31.8%) 0.0592
Metastases 7 (23.3%) 13 (15.7%) 5 (11.4%) LGG 1 (3.3%) 4 (4.8%) 5 (11.4%) All other 5 (16.7%) 24 (28.9%) 20 (45.5%)
1ANOVA 2Chi-square


171
Eighty-three patients self-presented to the ED (N=83). Only 9 self-presenters (11%) had a
single symptom before diagnosis, of which all (100%) were seizure. As for the whole patient
cohort, the median number of symptoms at the time of diagnosis was 3 (IQR 2-4). Headache,
seizure and cognitive symptoms were the most common symptoms initially and overall
throughout the pathway.
The symptom that precipitated ED presentation was most commonly a seizure (n=40, 48%),
followed by ‘alarm’ symptoms (n= 33, 40%), including ataxia/unsteadiness (n=13, 16%) or
unilateral weakness (n=10, 12%), confusion (n = 6, 7%) (figure 4.5). For over half of
patients with seizure as their leading symptom to present to ED, initial complaints were
‘vague’ such as headache or personality change (N=21, 53%) (Figure 4.5).

172
Figure 4.5: Proportion of symptoms classed as alarm, vague or seizure at onset for each
symptom subsequently precipitating emergency presentation (n=83).
GP consultations before emergency presentation:
One hundred and nineteen (66%) patients saw their GP at least once, while 38 (21%) had 3 or
more consultations in the primary care prior to diagnosis. Forty one percent (n=34) of
patients self-presenting to ED had previously visited their GP at least once, of whom 15
(44%) had seen their GP on ≥3 occasions. For the GP-ED cohort, the mean number of GP
visits was 1.9 (SD 1.2) (or median 1.0 [IQR 1-2.5], with 7 (23%) patients seeing their GP on
on ≥3 occasions.
We examined clinical and patient factors that correlated with the number of primary care
presentations before diagnosis. If the first symptom was a “vague” symptom”, patients were
more likely to be seen ≥3 times by their GP before diagnosis (aOR 5.6, 95%CI 1.2-26.1).
Similarly, this was true if the tumour was right sided (aOR 2.6, 95%CI 1.1-6.3), or the patient
was younger (16-39 years of age) (aOR 6.9, 95%CI 1.6-30.7) (Table 4.6).
Where patients self-presented to ED, factors associated with prior GP consultation included
symptoms that were of non-seizure type (alarm aOR 16.5, 95%CI 1.7-162.1) or vague (aOR
33.1, 95%CI 3.6-303.0), tumour situated other than in left hemisphere (right aOR 3.7, 95%CI
1.1-11.8), and all other (aOR 4.4, 95%CI 1.1-16.8), while female gender was approaching
near statistical significance (aOR 2.2 95%CI 0.91-5.5) (Table 4.7).

173
Primary care interval and the total time to diagnosis were significantly longer for patients
with more than 3 GP attendances (aOR 18.9, 95%CI 4.0-87.8 and aOR 5.5, 95%CI 2.2-13.6,
respectively).
Table 4.6: Predictors for ≥3 GP consultations before a brain tumour diagnosis
Variables aOR 95% CI p-value
Sex
Male reference Female 1.7 0.8-3.5 0.19 Age at diagnosis
16-39 6.9 1.6-30.7 0.01 40-59 2.8 0.8-10.5 0.12 60-69 1.7 0.4-6.9 0.46 70+ reference
Marital status
Other 1.1 0.5-2.7 0.72 First presenting symptom Seizure reference Alarm 2.8 0.5-15.2 0.2 Vague 5.6 1.2-26.1 0.03 Histology
Primary malignant reference Metastases 1.4 0.5-4.1 0.54 LGG 1.5 0.4-6 0.58 All other 1.3 0.5-3.2 0.58 Tumour lobe:
Frontal reference Temporal 0.8 0.3-2.4 0.68 Parietal 0.3 0.1-1.6 0.17 All other 0.9 0.4-2.3 0.91 Laterality:
Left reference Right 2.6 1.1-6.3 0.035 All other 1.5 0.5-4.3 0.46
aOR (adjusted odd-ratio) to age and gender

174
Table 4.7: Predictors for having attended GP prior to self-presentation at ED
Variables aOR 95%CI p-value Gender
Male reference
Female 2.2 0.91-5.5 0.079 Age at diagnosis 16-39 1.5 0.26-7.9 0.7 40-59 1.3 0.35-4.9 0.7 60-69 0.74 0.17-3.2 0.7 70+ reference Social deprivation score I-II 1.8 0.5-6.5 0.4 III-IV 1.3 0.33-5.3 0.7 IV reference First symptom
Seizure reference
Alarm symptom 16.5 1.7-162.1 0.02 Vague symptom 33.1 3.6-303 0.002 Tumour size
Small (25th centile) reference
other 0.5 0.19-1.5 0.23 Laterality
Left reference
Right 3.7 1.1-11.8 0.03 All other 4.4 1.1-16.8 0.03 Midline shift
<5 reference
5 - 10
2.8 0.8-9.6 0.1 >10 2.9 0.7-12.2 0.15
aOR (adjusted odd-ratio) to age and gender

175
Discussion
Summary:
This is the largest prospective study of a mixed cohort of brain tumour patients to explore
clinical diagnostic pathway, and the first to specifically examine factors associated with
diagnosis in the emergency department (ED). Time to diagnosis from first symptom onset
was approximately 2 months, longer than indicated by data harvested retrospectively from
health records. The mode of data collection is important, especially if it informs policy
decision-making and resource allocation. Only 11% of patients, even amongst those self-
presenting to the ED, had only one symptom. Most complained of three or more symptoms
prior to a diagnosis. Forty-one percent of patients who self-presented to the ED had
previously seen their GP, meaning overall 74/123 (60%) had prior GP contact before ED.
Vague symptoms such as cognitive slowing, headache, personality/behavioural, or visual
changes were the commonest type to occur at any point before the diagnosis and were
associated with the longest diagnostic interval. Although transient loss of consciousness was
the most common symptom precipitating self-presentation to ED, over half of these patients
had earlier developed headache or cognitive complaints. For almost all patients, improved
symptom awareness by patients and GPs, with more timely access to diagnostic imaging,
may have facilitated earlier diagnosis.
Comparison with other literature
Most brain tumours are diagnosed in the ED (Swann et al 2019) with most patients having
seen their GP before diagnosis, often several times (Lyratzopoulos et al 2013). This has led to

176
the suggestion for potential for missed diagnostic opportunities early in primary care, at least
for some patients, particularly when an emergency presentation ensued (Hamilton 2012 ;Abel
et al 2017). Similar to many other cancers, the majority of brain tumour patients (65%) see
their primary care doctor at least once, and 25-33% of patients 3 or more times, before
diagnosis (Lyratzopoulos et al 2013; Ozawa et al 2018; Walter et al 2012). These proportions
are similar to our study cohort - 66% patients at least once and 21% more than 3 times.
Importantly though, of the two thirds of patients diagnosed in the ED who self-presented, a
quarter of patients were directly referred to the ED by their GPs. This underscores the role of
primary care in brain tumour diagnosis. A similar trend (17.2%) of brain cancer emergency
diagnoses via the GP-ED route in England was reported by Herbert et al (2019) after studying
data on Routes to Diagnosis for 2006-2015 (National Cancer Registration and Analysis
Service). We observed that patients diagnosed through the ED had a shorter treatment
interval than those diagnosed in the clinic (median 22 and 48, days, respectively), irrespective
of the number of GP consultations. Primary care referral to ED may be an effective strategy
to improve diagnostic timeliness of brain tumour diagnosis but this runs a risk of
overwhelming the department running already at near maximum capacity. The speed of
referral is primarily influenced by symptom type and patients with less concerning-vague
initial symptoms will have prolonged diagnosis. In authors’ expert opinion, an earlier GP
referral could be considered for those patients presenting with headaches suspicious of cancer
(plus cognitive/behavioural changes), however the optimal route of referral (i.e. direct access
CT/MRI, urgent OPD or ED) still remains uncertain. A prospective study is required to
determine effectiveness on clinical and cost-related aspects. For migranious-type headache,
the authors agree with established guidelines (Kernick et al 2008; BASH) that imaging is not
necessary, however clinician should ensure that appropriate follow-up is in place in a timely
manner to re-visit the diagnosis and symptom control.

177
The average time to diagnosis of 63 days (IQR 22-212) contrasts with previous studies, from
primary care (Ozawa et al 2018; Lyratzopoulos et al 2015) and secondary care (Cerqua et al
2016) that reported shorter total diagnostic times - 24 days (IQR 7-65) (Ozawa et al 2018), 15
days (IQR 7.5-27.5) (Cerqua et al 2016). Differences in study design and methodology may
explain the discrepancy. The three retrospective studies collected data from health records.
For cancer studies where the focus is assessing diagnostic pathway at each clinical time point,
data from interviews, and are preferred (Summerton 2002; Weller et al 2012). Our data came
from in depth contemporary documentation of a detailed clinical history. Caution should be
exercised as to how “time to diagnosis” data is collected, especially if it informs policy
decision making and allocation of resources.
Patient interval contributes to the greatest proportion of time in the total cancer diagnostic
interval (Allgar and Neal 2005, Lyratzopoulos 2015). Patient interval in our study was
longest relative to every other time interval across the pathway. Interventions to support
earlier diagnosis could therefore include raising public awareness of brain-tumour related
symptoms, but this would need backing by significant resources to manage the expected
increase presentation to primary care, or a novel triage test, such as a blood biomarker test, to
rapidly screen these patients (Butler 2019).
As has been reported, patients with non-specific, vague symptoms were most likely to
experience multiple GP presentations and the longer intervals before diagnosis (Ozawa 2018,
2019). In addition, we found younger age (16-39 years old) predicted more than 3 primary
care attendances, consistent with findings from the National Cancer Patient Experience

178
Survey in England (Lyratzopoulos 2012) and Abel et al 2017, and from the National Audit of
Cancer in Primary Care (Ozawa et al 2018). GPs may be less alert to the possibility of a brain
tumour in younger patients and more likely to adopt a ‘watch-and-wait’ approach (Lapointe
et al 2018). Similarly to findings from National Cancer Patient Experience Survey in England
(Lyratzopoulos 2012), we did not observe gender effect on the frequency of 3 or more GP
visits prior to a brain tumour diagnosis, however females were possibly more likely to visit a
GP before self-presenting to ED.
Non-specific, vague, early cancer symptoms are a common determinant of delay in brain
tumour diagnosis, as in our study (Salander et al 1999; Ozawa et al 2018, 2019). Headache as
the most common first symptom is well reported, followed closely by cognitive changes. As
would be expected, patients with more GP visits had a longer primary care interval and
longer time to diagnosis. Marital status also predicted delay (in single patients), possibly
because a single person with the common cognitive deficit or personality/behavioural
changes may not necessarily notice such changes themselves (Salander et al 1999). Patients
can experience multiple subtle ‘changes’ rather than ‘symptoms’, which are often noticed by
others rather than the patient (Walter et al 2019). For people with a brain tumour, their family
members, colleagues or friends often encourage them to seek help resulting in a joint decision
to visit health care professional (Scott et al; 2019).
Most people with seizures self-presented to the ED. Brain tumours are actually present in
only about 12% of patients presenting with a first seizure (Pohlmann-Eden, Schreiner 1998).
Patients will most likely attend the ED after their first seizure, so this has often been
implicated as indicating early diagnosis in these patients (Abel et al 2017). However, in our
study, half of patients reported vague symptoms prior to developing seizure. This is a novel

179
finding. We don’t know whether patients reported these vague symptoms to their GP.
However, strategies to support earlier identification by health care workers of under-
recognised or un-disclosed subtle symptoms may facilitate earlier diagnosis.
Strengths and limitations
To our knowledge, this is the largest study of prospectively collected data from adult brain
tumour patients to describe diagnostic intervals according to the Aarhus Statement on early
cancer diagnosis research (Weller et al 2012). The data, taken from surgical preadmission
consultations, were conducted very soon after diagnosis, and before tumour surgery, reducing
the likelihood of patient recall bias (Hassan 2006; Friedman et al 2005). The information
provided came from both patient’s and their relatives, enhancing information accuracy and
completion.
Limitations:
Patients were included if attending pre-surgical clinic for consideration of brain tumour
surgery (biopsy/resection), therefore patients who were considered high risk for surgery were
excluded. Patients with seizures and low-grade glioma where a “watch and scan policy” was
followed, were also not included. Neither were patients with meningiomas not causing mass
effect or symptoms. The sample may not be wholly representative of the brain tumour
population. Patients were derived from a single tertiary neuro-oncology centre. Having more
participating centres would increase generalisability, but would require substantial resources
standardise data collection.

180
Patients often report the most significant events including symptoms (Smith Pope Botha
2005) and thus vague symptoms may not be felt important. These were elicited as part of the
detailed clinical history taking. This may have introduced the bias of rumination – people
with a recently diagnosed disease tend to think harder about their prior exposures (Hassan
2006). Patients may also not necessary remember the exact date they developed symptoms or
when they went to see their primary care doctor, particular if patients delayed the
consultation for a long time as symptoms initially were not severe enough.
Implications
The study has a number of important implications. Our findings reaffirm the complexity of
symptoms of brain tumours and the challenges for early diagnosis. Where there is a high
suspicion of a brain tumour, we emphasise the need to screen for early unrecognised
cognitive/behavioural symptoms due to frequent occurrence in this patient group. Results of
the present study reveal significant involvement of GPs but also opticians in brain tumour
diagnosis, thus clear and effective diagnosis pathway from primary care should be in place in
all NHS boards in the country.
While acknowledging the study’s limitations, results of the present study could potentially
serve as the relative baseline intervals for the UK with the aim of developing targeted public
health campaigns on early brain cancer diagnosis, both for patients and health care
professionals and it would also allow direct comparison of relative diagnostic time between
other countries with a similar health care system and welfare.

181
Increased awareness of factors associated with prolonged diagnosis and development of
effective strategies at reducing time to diagnosis at each time intervals across the pathway
will potentially increase the proportion of non-emergency diagnosis, reduce psychological
distress and perhaps improve survival by earlier intervention and improved surgical
outcomes. Future studies should now assess if strategies to improve early brain tumour
diagnosis translates in improved outcomes.

182
References:
Abel GA, Mendonca SC, McPhail S, et al. Emergency diagnosis of cancer and previous general practice consultantions: insignts from linked patient survey data. Br J GP 2017 Allgar VL, Neal RD. Delays in the diagnosis of six cancers: analysis of data from the National Survey of NHS Patients: Cancer. Br J Cancer 2005; 92: 1959–1970. American Speech-Language-Hearing Association. (2015). Right hemisphere brain damage. Retrieved from http://www.asha.org/public/speech/disorders/RightBrainDamage/ British Association for the Study of Headache (BASH). National Headache Management System for Adults 2019. Obtained from WWW on 10 August 2020. (http://www.bash.org.uk/downloads/guidelines2019/02 BASHNationalHeadache Management SystemforAdults 2019 guideline versi1.pdf) Butler HJ, Brennan PM, Cameron JM et al. Development of high-throughput ATR-FTIR technology for rapid triage of brain cancer. Nat Commun 2019; 10, 4501. Cerqua R, Balestrini S, Perozzi C, et al. Diagnostic delay and prognosis in primary central nervous system lymphoma compared with glioblastoma multiforme. Neurol Sci 2016;37:23-29 Elliss-Brookes L, McPhail S, Ives A, et al. Routes to diagnosis for cancer: determining the patient journey using multiple routine data sets. Br J Cancer 2012; 107(8): 1220–1226. Friedman GD, Skilling JS, Udaltsova NV, et al. Early symptoms of ovarian cancer: a case-control study without recall bias. Fam Pract 2005;22(5):548-553. Hamilton W. Emergency adission of cancer as a marker of diagnostic delay. Br J Cancer 2012;107: 1205-1206 Hassan E. Recall bias can be a threat to retrospective and prospective research designs. Internet J Epidem 2006;3(2):4 Herbert A, Abel G, Winters S et al. Are inequalities in cancer diagnosis through emergency presentation narrowing, widening or remaining unchanged? Longitudinal analysis of English population-based data 2006-2013. J Epidemiol Community Health 2019;73:3-10 Kernick DP, Ahmed F, et al. Imaging patients with suspected brain tumor: guidance for primary care. Br J GP 2008; 58 (557): 880-885. Lapointe S, Perry A, Butowski NA. Primary brain tumours in adults. Lancet 2018; 392(10145): 432–446. Lyratzopoulos G, Abel GA, McPhail S, et al. Measures of promptness of cancer diagnosis in primary care: secondary analysis of national audit data on patients with 18 common and rarer cancers. Br J Cancer 2013; 108(3): 686–690.

183
Lyratzopoulos G, Neal RD, Barbiere JM, et al. Variation in number of general practitioner consultations before hospital referral for cancer: findings from the 2010 National Cancer Patient Experience Survey in England. Lancet Oncol 2012; 13(4): 353–365. Lyratzopoulos G, Saunders CL, et al. The relative length of the patient and the primary care interval in patients with 28 common and rarer cancers. Br J Cancer 2015;112(1):35-40. National Cancer Registration and Analysis Service. Routes to Diagnosis. PHE, 2019. http://www.ncin.org.uk/publications/routes_to_diagnosis (accessed 15 Aug 2019). National Cancer registration and analysis service Olesen F, Hansen RP, Vedsted P (2009) Delay in diagnosis: the experience in Denmark. Br J Cancer 2009;101(2):5-8 Ozawa M, Brennan PM, Zienius K, et al. Symptoms in primary care with time to diagnosis of brain tumours. Fam Pract 2018; 35(5): 551–558. Ozawa M, Brennan PM, Zienius K, et al. The usefulness of symptoms alone or combined for general practitioners considering the diagnosis of a brain tumour: a case-control study using the clinical practice research data (CPRD) (2000-2014). BMJ Open 2019;9. Penfold C, Joannides AJ, Bell J, et al. Diagnosing adult primary brain tumours: can we do better? Br J GP 2017;67(659):278-279 Pohlmann-Eden B, Schreiner A. Epileptology of the first-seizure presentation. Lancet 1998;352(1943):1855-1856 Salander P, Bergenheim AT, Hamberg K, Henriksson R. Pathways from symptoms to medical care: a descriptive study of symptom development and obstacles to early diagnosis in brain tumour patients. Fam Pract 1999; 16(2): 143–148. ScotPHN 2007. Accessed 1 March 2020: https://www.scotphn.net/wp-
content/uploads/2015/10/National-Neurosurgery-Needs-Assessment-For-Scotland-
November-2007.pdf Scott SE, Penfold C, Saji S, et al. ‘It was nothing that you would think was anything’: qualitative analysis of appraisal and help seeking for changes preceding brain cancer diagnosis. PLOS One 2019; in press. Smith LK, Pope C, Botha JL. Patients' help - seeking experiences and delay in cancer presentation: a qualitative synthesis. Lancet 2005;366(9488):825-31 Summerton N. Symptoms of possible oncological significance: separating the wheat from the chaff. BMJ 2002;325:1254-1255 Swann R, McPhail S, Witt J, et al. Diagnosing cancer in primary care: results from National Cancer Diagnosis Audit. Br J GP 2018;68 (666): 63-72

184
Torring ML, Frydenberg M, Hansen RP et al. Time to diagnosis and mortality in colorectal cancer: a cohort study in primary care. Br J Cancer 2011; 104(6):934-940 Walter F, Webster A, Scott S, Emery J (2012) The Andersen Model of Total Patient Delay: a systematic review of its application in cancer diagnosis. J Health Serv Res Policy 17: 110–118 Walter FM, Penfold C, Joannides A, et al. Missed opportunities for diagnosing brain tumours in primary care: a qualitative study of patient experiences. Br J GP 2019; 69(681):224-235. Weller D, Vedsted P, Rubin G, et al. The Aarhus statement: improving design and reporting of studies on early cancer diagnosis. Br J Cancer 2012; 106(7): 1262–1267. Zienius K, Chak-Lam I, Park J, et al. Direct access CT for suspicion of brain tumour: an analysis of referral pathways in a population-based patient group. BMC Fam Pract 2019;20(118)
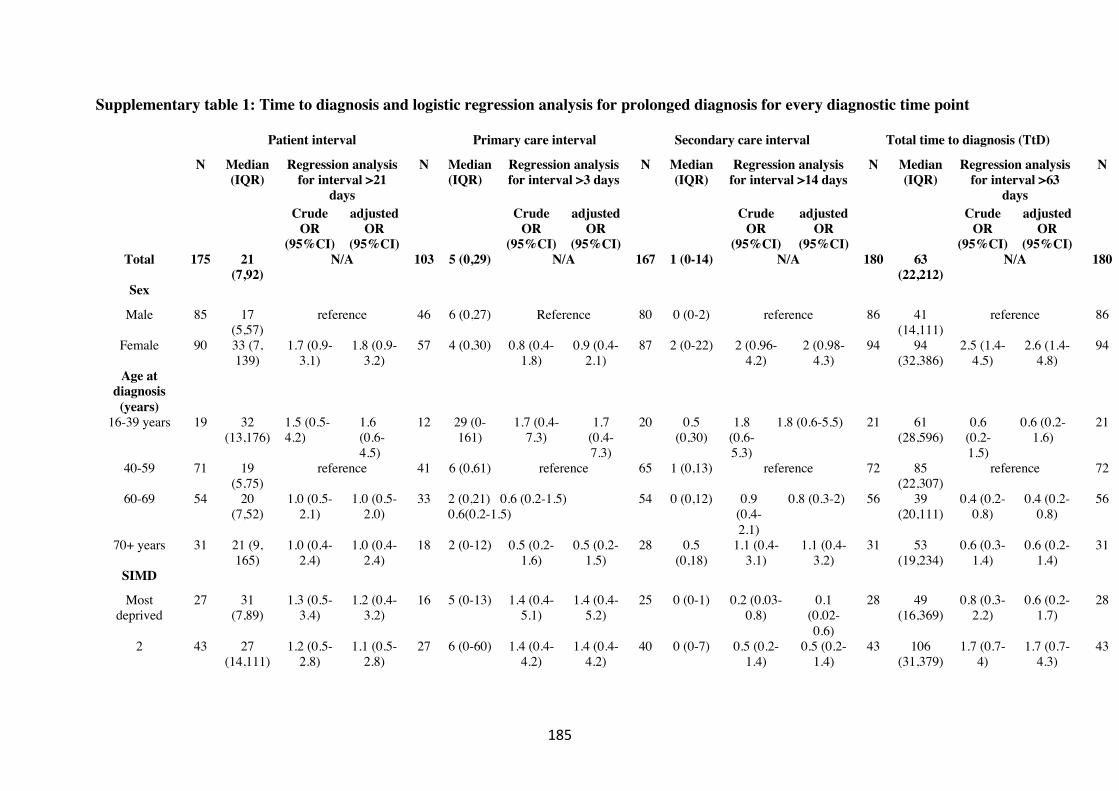
185
Supplementary table 1: Time to diagnosis and logistic regression analysis for prolonged diagnosis for every diagnostic time point
Patient interval
Primary care interval Secondary care interval Total time to diagnosis (TtD)
N Median (IQR)
Regression analysis for interval >21
days
N Median (IQR)
Regression analysis for interval >3 days
N Median (IQR)
Regression analysis for interval >14 days
N Median (IQR)
Regression analysis for interval >63
days
N
Crude
OR (95%CI)
adjusted OR
(95%CI)
Crude
OR (95%CI)
adjusted OR
(95%CI)
Crude
OR (95%CI)
adjusted OR
(95%CI)
Crude
OR (95%CI)
adjusted OR
(95%CI)
Total 175 21
(7,92) N/A 103 5 (0,29) N/A 167 1 (0-14) N/A 180 63
(22,212) N/A 180
Sex
Male 85 17 (5,57)
reference 46 6 (0,27) Reference 80 0 (0-2) reference 86 41 (14,111)
reference 86
Female 90 33 (7, 139)
1.7 (0.9-3.1)
1.8 (0.9-3.2)
57 4 (0,30) 0.8 (0.4-1.8)
0.9 (0.4-2.1)
87 2 (0-22) 2 (0.96-4.2)
2 (0.98-4.3)
94 94 (32,386)
2.5 (1.4-4.5)
2.6 (1.4-4.8)
94
Age at diagnosis (years)
16-39 years 19 32 (13,176)
1.5 (0.5-4.2)
1.6 (0.6-4.5)
12 29 (0-161)
1.7 (0.4-7.3)
1.7 (0.4-7.3)
20 0.5 (0,30)
1.8 (0.6-5.3)
1.8 (0.6-5.5) 21 61 (28,596)
0.6 (0.2-1.5)
0.6 (0.2-1.6)
21
40-59 71 19 (5,75)
reference 41 6 (0,61) reference 65 1 (0,13) reference 72 85 (22,307)
reference 72
60-69 54 20 (7,52)
1.0 (0.5-2.1)
1.0 (0.5-2.0)
33 2 (0,21) 0.6 (0.2-1.5) 0.6(0.2-1.5)
54 0 (0,12) 0.9 (0.4-2.1)
0.8 (0.3-2) 56 39 (20,111)
0.4 (0.2-0.8)
0.4 (0.2-0.8)
56
70+ years 31 21 (9, 165)
1.0 (0.4-2.4)
1.0 (0.4-2.4)
18 2 (0-12) 0.5 (0.2-1.6)
0.5 (0.2-1.5)
28 0.5 (0,18)
1.1 (0.4-3.1)
1.1 (0.4-3.2)
31 53 (19,234)
0.6 (0.3-1.4)
0.6 (0.2-1.4)
31
SIMD
Most deprived
27 31 (7,89)
1.3 (0.5-3.4)
1.2 (0.4-3.2)
16 5 (0-13) 1.4 (0.4-5.1)
1.4 (0.4-5.2)
25 0 (0-1) 0.2 (0.03-0.8)
0.1 (0.02-0.6)
28 49 (16,369)
0.8 (0.3-2.2)
0.6 (0.2-1.7)
28
2 43 27 (14,111)
1.2 (0.5-2.8)
1.1 (0.5-2.8)
27 6 (0-60) 1.4 (0.4-4.2)
1.4 (0.4-4.2)
40 0 (0-7) 0.5 (0.2-1.4)
0.5 (0.2-1.4)
43 106 (31,379)
1.7 (0.7-4)
1.7 (0.7-4.3)
43

186
3 30 13 (4,60)
0.7 (0.3-1.8)
0.7 (0.3-1.8)
18 1 (0-26) 0.9 (0.3-3)
0.9 (0.3-3.3)
29 1 (0-22) 0.7 (0.2-1.9)
0.7 (0.2-2.1)
32 57 (12, 124)
0.9 (0.3-2.2)
0.9 (0.3-2.4)
32
4 35 19 (5, 123)
0.8 (0.3-2.1)
0.8 (0.3-2.0)
18 13 (2-66)
3.8 (0.9-15.2)
4.6 (1.1-19.0)
32 1 (0-14) 0.5 (0.2-1.4)
0.5 (0.2-1.5)
35 68 (21,212)
1.2 (0.5-2.9)
1.2 (0.4-3.1)
35
Most affluent 38 21 (6,79)
reference 23 2 (0-17) reference 39 2 (0-35) reference 40 68 (21,212)
reference 40
Marital status
Married/Civil partnership
117 18 (5,66)
reference 70 2 (0-20) reference 110 1 (0-14) reference 118 52 (21,135)
reference 118
Other 58 36 (12,181)
1.97 (1.04-3.7)
1.8 (0.9-3.5)
33 11 (0-73)
2.3 (0.9-5.5)
2.3 (0.8-6.1)
57 1 (0-14) 0.9 (0.4-1.9)
0.6 (0.3-1.4)
62 91 (30,594)
1.6 (0.9-3.1)
1.2 (0.6-2.5)
62
Presentation mode
Emergency 120 17 (5, 61)
reference 70 8 (0-39) reference 123 0 (0-2) reference 123 49 (14,124)
reference 123
Non-emergency
55 44 (14,183)
1.9 (0.99-3.6)
1.7 (0.9-3.4)
33 0 (0-10) 0.3 (0.1-0.7)
0.3 (0.1-0.7)
44 14 (2-49)
5 (2.3-10.8)
4.8 (2.2-10.7)
57 124 (39,495)
2.7 (1.4-5.3)
2. 6 (1.3-5.2)
57
First presenting symptom
type
Seizure 26 0 (0,15) reference 5 5 (0-48) reference 24 0 (0-30) reference 26 22 (0,98)
reference 26
Alarm symptom
55 20 (7,64)
3.3 (1.1-9.9)
3.7 (1.2-11.5)
38 2 (0-20) 0.7 (0.1-4.5)
0.6 (0.1-3.7)
53 1 (0-10) 0.5 (0.2-1.5)
0.6 (0.2-1.7)
56 41 (23,116)
1.4 (0.5-3.7)
1.8 (0.6-4.9)
56
Vague symptom
94 38 (14,157)
6.5 (2.2-18.7)
7.4 (2.5-21.8)
60 6 (0-34) 1 (0.2-6.4)
0.7 (0.1-5.1)
90 1 (0-14) 0.6 (0.2-1.6)
0.7 (0.2-1.8)
98 96 (30,412)
2.6 (1.1-6.5)
3.0 (1.2-7.9)
98
Charlson comorbidity
score
0-1 142 23 (7,110)
reference 84 5 (0-31) reference 138 1 (0-21) reference 147 74 (24,288)
reference 147
>=2 33 14 (3,,50)
0.6 (0.3-1.3)
0.6 (0.3-1.3)
19 6 (0-13) 0.8 (0.3-2.3)
0.9 (0.3-2.3)
29 0 (0-5) 0.5 (0.1-1.4)
0.4 (0.1-1.4)
33 51 (16,98)
0.7 (0.3-1.5)
0.7 (0.3-1.4)
33
Tumour variables

187
Histology
Primary high grade (GBM,
WHO3, PCNSL)
80 18 (7,50)
reference 48 5 (0-16) reference 79 1 (0-9) reference 82 38 (19,94)
reference 82
Metastases 28 16 (6,52)
1.1 (0.47-2.6)
0.9 (0.4-2.4)
17 11 (0-73)
01.1 (0.3-3.3)
0.8 (0.2-2.6)
27 0 (0-1) 0.5 (0.1-1.8)
0.5 (0.1-1.7)
28 50 (9,99)
1.3 (0.5-3.2)
1.1 (0.5-2.9)
28
LGG 12 18 (2, 130)
0.7 (0.2-2.6)
0.5 (0.1-2.0)
6 176 (45-458)
3.7 (0.4-34.2)
2.2 (0.2-23.5)
13 27 (0-198)
6.3 (1.8-21.9)
5.9 (1.5-23.8)
14 273 (47,698)
5.1 (1.5-17.7)
5.99 (1.5-24.6)
14
All other 55 75
(7,747) 2.9 (1.4-
6.0) 2.6 (1.2-
5.6) 32 0 (0-31) 0.6 (0.2-
1.5) 0.4 (0.1-
1.1) 48 1 (0-23) 1.5 (0.6-
3.4) 1.2 (0.5-
2.9) 56 220
(40,770) 6.1 (2.9-
13.1) 5.0 (2.3-
11.2) 56
Tumour
lobe:
Frontal 66 23 (7,119)
reference 42 4 (0-41) reference 64 0 (0-10) reference 68 61 (22,282)
reference 68
Temporal 33 17 (1,43)
0.5 (0.2-1.3)
0.6 (0.2-1.3)
17 5 (0-17) 1.2 (0.4-3.7)
1.4 (0.4-4.6)
33 7 (0-38) 2.0 (0.8-5.1)
2.5 (0.9-6.5)
34 50 (21,133)
1.0 (0.4-2.3)
1.1 (0.4-2.6)
34
Parietal 17 14 (4,85)
0.5 (0.2-1.6)
0.5 (0.1-1.4)
8 13 (1-27)
2.5 (0.4-13.7)
3.2 (0.5-18.7)
17 0 (0-2) N/A N/A 18 33 (8,165)
0.7 (0.2-2.1)
0.5 (0.2-1.5)
18
All other 59 32 (11,90)
1.3 (0.6-2.6)
1.3 (0.6-2.7)
36 5 (0-31) 0.9 (0.4-2.3)
0.9 (0.3-2.3)
53 1 (0-22) 1.3 (0.5-3) 1.3 (0.5-3.1)
60 74 (26,204)
1.6 (0.8-3.2)
1.5 (0.7-3.1)
60
Laterality:
Left 77 22 (1,122)
reference 42 1 (0-12) reference 73 1 (0-18) reference 80 63 (16,241)
reference 80
Right 63 14 (7, 48)
0.6 (0.3-1.1)
0.6 (0.3-1.1)
38 8 (0-57) 2.3 (0.9-5.8)
2.7 (1.01-7.1)
59 0 (0-8) 0.6 (0.2-1.4)
0.6 (0.3-1.5)
64 60 (19,186)
0.9 (0.5-1.8)
1.2 (0.6-2.5)
64
All other 35 35 (17,89)
2.1 (0.9-4.9)
2.4 (0.9-5.7)
23 11 (0-34)
1.9 (0.7-5.3)
1.8 (0.6-5.5)
35 1 (0-25) 1.3 (0.5-3.1)
1.5 (0.6-3.8)
36 69 (32,251)
1.1 (0.5-2.5)
1.6 (0.7-3.8)
36
aOR, adjusted odds-ratio (age (categorical) and gender (categorical) CI, confidence intervals
188
Part 5
Study 3
First symptom type but not time to diagnosis is associated with overall
survival in patients with high-grade glioma
K Zienius, M Ozawa, Y Ben-Schlomo, R Grant, PM Brennan
In preparation for submission
No studies to date have attempted to systematically examine the impact on timely diagnosis of
malignant brain tumours in adults on clinical care and survival. We have earlier reported
that presenting symptoms are a crucial factor determining diagnostic timeliness. This study
aims to analyse how symptoms in relation to their diagnostic interval affect clinical
outcomes.
Background
Malignant gliomas are associated with a dismal prognosis. Several factors including age,
baseline functional status, and extent of resection are consistently found to be important
prognostic variables. Achieving earlier diagnosis of brain tumours is challenging and it is

189
unknown whether it would impact positively on patient functional outcomes. This study
aimed to assess the effect of symptoms on time to diagnosis and its relationship to patient
management and survival from high-grade gliomas (HGG).
Methods
A total of 354 adults with WHO III and WHO IV grade gliomas attending Department of
Clinical Neurosciences in Edinburgh between July 2010 to March 2015 for investigation and
management of their tumour were retrospectively studied. Primary symptoms were
categorised into 4 broad groups. Diagnostic time intervals were calculated for each symptom
group specifically.
Results:
Patients with cognitive symptoms were significantly older, had a poorer baseline functional
status at diagnosis, and had a larger tumour than patients with seizure (p<0.001). Time to
diagnosis was longest for cognitive patients (43 days), and shortest for patients with seizure
(7 days). Two-hundred and eleven (60%) patients were dead at 12-months. Multivariate
models showed that development of cognitive symptoms was an independent adverse
predictor for 12-month survival (multivariate HR 1.8, 95% CI 1.2-2.6) but was not associated
with the type of surgery performed (ie biopsy versus debulking). Earlier diagnosis did not
have an impact on survival.
Conclusion:

190
Time to diagnosis on its own did not have significant association with outcomes measured,
namely clinical care and survival. Instead, presenting symptom type in the context of
diagnostic timeliness seemed more important. Although expediting symptomatic diagnosis of
HGG may not demonstrate a desired effect on survival, future studies should assess if this
leads to improved patient and carer quality of life measures.

191
Introduction
Brain tumours are associated with most life-years lost of any cancer (Burnet 2005) and
12,100 new primary brain tumours were diagnosed in the United Kingdom in 2015-2017
(Cancer Research UK). Over the last decade, the incidence rate has increased by 15%, and is
projected to rise 6% further by 2035 (Cancer Research UK). Gliomas are the most common
type of primary intracerebral tumour.
Based on histological and molecular features, gliomas are graded according to the World
Health Organisation (WHO) classification (I to IV) (Louis et al 2016; Kleihues et al 1993).
WHO III and IV tumours are collectively referred to as high grade gliomas (HGG) and share
common clinical and histological features owing to their aggressive and infiltrating nature.
The majority (>60%) of gliomas are the WHO IV subtype glioblastoma (GBM) (Hayat
2011). Anaplastic astrocytomas and anaplastic oligodendrocytomas are WHO III (Hart et al
2000).
Unfortunately, the median survival after diagnosis of a HGG varies between 16 and 58
months for WHO III (Shirai et al 2010) and 15 months for GBM, even with maximum
therapy (Van Meir, Hadjipanayis et al 2010; Thakkar et al 2014) and this has not changed
significantly in decades. Factors associated with survival include age (Pan et al 2015),
baseline functional status (Alvarez et al 2016), tumour molecular features (Chen et al 2012),
whether the tumour crosses the midline (Ellor et al 2014) and the extent of surgical resection
(Brown et al 2016).Treatment with maximum surgical resection followed by adjuvant chemo-
radiation therapy with temozolamide (TMZ) offers the best outcomes (Brown et al 2016, von

192
Neubeck et al 2015), although extensive resection is often not possible, because of the
tumour location in relation to eloquent brain structures (Wilson 1992).
In contrast to many other cancers (Neal et al 2015), little is known as to whether earlier brain
tumour diagnosis is associated with better outcomes. There are no known risk factors for
brain tumours in the majority of affected patients and diagnosis is often complicated by the
non-specificity of presenting symptoms refer. Consequently, diagnosis is often delayed
(Ozawa 2018, 2019). Symptom presentation is considered to be critical to time to diagnosis
(Koo et al 2017). Therefore, studying how different symptoms are associated with the length
of diagnostic time and its prognostic effect of survival is a priority for early diagnosis
research. This is one of the top 10 clinical research priorities for neuro-oncology (Kurian et
al 2018). Case-series data suggest that presenting symptoms are independent prognostic
factors for survival in patients with aggressive gliomas. Seizures are often correlated with
better survival (Liang et al 2020; Lote et al 1998; Berendsen et al 2016) , while cognitive
impairment is associated with adverse outcomes (Johnson et al 2012; Yuile et al 2006). It is
speculative that presentation with seizure or acute focal neurology would trigger earlier
presentation (Ozawa et al 2018) and thus faster diagnosis and treatment, potentially of
smaller tumours (Yuile et al 2006). Patients with global, less disabling deficits tend to present
later in the course of their illness, potentially resulting in reduced survival (Yuile et al 2006).
Contrary to this notion, several studies (Aggarwal et al 2015; Ellis-Brookes et al 2012)
reported adverse outcomes in patients diagnosed as an emergency presentation, therefore
short diagnosis, compared to those diagnosed after having been referred to outpatient
department (OPD) specialist clinic, pointing to a “waiting time paradox” where fast
identification of tumour is associated with poor survival (Crawford et al 2002). In a sample of
118 patients with histological diagnosis of high-grade gliomas, a 12-month survival was

193
twice higher in patients diagnosed in OPD compared to those by emergency department (ED)
in Aggarwal study (55% versus 27.8%, p=0.02). Emergency diagnosis was more common in
patients complaining of cognitive symptoms (11% versus 5% in OPD), however more
seizures presented to OPD (25% versus 11% in ED), while time to diagnosis was
significantly shorter for emergency presentation than OPD (8 days versus 26 days,
respectively, p<0.0001). This is in contrast to previous findings that found seizures to have
the fastest diagnostic time (Salander et al 1999; Ozawa et al 2018). Authors concluded that
tumour biology and not the speed of diagnosis nor treatment was the underlying factor for
survival (Aggarwal et al 2015).
Achieving earlier diagnosis of brain tumours is challenging and it is unknown whether it
would impact positively on patient outcomes. This study aimed to assess the effect of
symptoms on time to diagnosis and its relationship to patient management and survival from
high-grade gliomas.

194
Methods
Patient inclusion:
Patients, aged 16-years old or older, who had been referred to the regional clinical
neurosciences centre (Department of Clinical Neurosciences, DCN) in Edinburgh for
investigation and management of a high grade glioma (HGG) between July 2010 to March
2015 were retrospectively identified from minutes of weekly multidisciplinary team (MDT)
meetings. DCN is a Regional Centre that manages all patients with a brain tumour in a
catchment area of 1.5 million population from (Lothians, Forth Valley, Borders, South Fife,
Dumfries & Galloway). Clinical, radiological, surgical and pathology data were
retrospectively extracted from electronic records by a clinical research fellow (KZ) which
was checked by a consultant neuro-surgeon (PMB) for consistency and accuracy. The
tumour diagnosis was determined from reports of histopathological analysis of resected
tumour tissue, or from radiographic appearances where no tissue was obtained. We included
patients with tumour grades WHO III and WHO IV in this study as both have poor prognosis
and are typically treated similarly (Stupp et al 2014; Wick et al 2018, Van Den Bent et al
2013). Patients were followed up until 20 October 2017.
Recorded variables
Information collected included patient demographics (age, gender), clinical symptomatology,
duration of symptoms (days), tumour characteristics, histological diagnosis, surgical and
oncological treatment information and date of death or last follow up. Baseline performance
status was based on Karnofsky Performance Score (KPS) (Schag et al 1984), recorded in

195
clinical notes or MDT minutes. We dichotomised performance score as KPS <70 or ≥ 70
because this score has previously been shown to predict survival and classifies patients who
are functionally dependent on others and require significant assistance with their care
(Chaicana et al 2013; Lamborn KR 2004; Laws et al 2003). A KPS score of 0 indicates
death, 70 or above indicates functional independence, and 100 indicates a patient is fully
functional with no deficit.
Tumour location, laterality and extent of midline shift were recorded from neuro-radiology
scans reported by a specialist neuro-radiologist at the same institution. Tumour size was
determined by measuring length in axial diameter on MRI with gadolinium enhanced T1
images recorded in the notes. Type of surgery was determined from operative or MDT notes
as biopsy-only or debulking. Chemotherapy and radiotherapy was documented but was not
possible to assure if patient completed the full course and/or how many cycles, if any. Due to
historical nature of this dataset, MGMT methylation analysis was not routinely collected at
our institution. Methylation results were available for fewer than half of patients and were
therefore not included in survival analysis.
Time to death was defined as the time from radiological diagnosis to death. Patients where it
was uncertain whether they were alive or dead whose deaths were unconfirmed were
classified as lost to follow-up.
First symptom type and diagnostic time interval

196
Initially, we recorded individual symptoms. Symptoms were then grouped into 4 broad
categories based on previous knowledge on diagnostic times (Ozawa et al 2018) and with
reference to Scottish Referral Guidelines for Suspected CNS Cancer (NHS Scotland 2019):
cognitive domain, seizure, focal neurology and vague non-specific (of which headache was
the most common symptom). Deficit in cognitive domain was defined as acute confusion,
memory loss, or significant behavioural changes. Vague non-specific symptom included
headache, visual changes except diplopia. Time to diagnosis was defined as the interval
between the date (approximate) when first bodily changes and/or symptoms were noticed by
patient and the date of radiological diagnosis of HGG. (Weller et al 2012). This data was
determined from a short questionnaire sent to patient’s General Practitioner (GP) (GPs were
sent a short targeted questionnaire for patients who were deceased only) cross-referenced
with data from the hospital electronic patient record. Upon completion, GP surgery was
reimbursed. Unless we received completed questionnaire within 30 days after posting the
original letter, we re-sent the same questionnaire to non-responders once more. GPs were
asked, based on the primary care record, to determine whether a patient attended primary care
in the 12 months prior to the diagnosis of brain tumour (other than for collection of a regular
prescription), and if they did, what and duration of symptom of complaint were. If this
information was not provided from primary care, data from clinical, MDT notes or referral
information for head imaging were used instead.
GP survey completion:
In total, 271 (77%) questionnaires were returned. GPs did not return for 26 (7%) patients

197
For 57 (16%) patients classed as “lost to follow-up”, primary care data was not available to
corroborate on time to diagnosis. Across all other variables the completion rate was in excess
of 95%.
Statistical analyses
Statistical analyses were performed with SPSS version 24 (SPSS Inc., Chicago, IL). Results
were considered significant at p<0.05. Differences in baseline characteristics across different
presenting symptoms were analysed with chi-square tests, ANOVA or Independent-Samples
Kruskal-Wallis tests, according to the distribution of data.
Time to diagnosis in this study was dichotomised as the interval within the median (‘short’
interval) or above the median (‘prolonged’) for each different symptom group specifically.
Other approaches were reported elsewhere (Ozawa et al 2018) who calculated intervals in
quartiles and compared the slowest quartile versus the other three quartiles. The latter method
was felt not justifiable in this study since the average diagnostic time was generally short and
statistical analysis would be limited by small patient numbers.
To examine whether type of symptom or time to diagnosis predicted the choice of first
treatment modality (surgical versus non-surgical) we calculated odds ratios (OR) with 95%
confidence intervals (CI) using both univariate and then multivariate logistic regression
analyses treating type of symptom and time to diagnosis as a dummy variable. When
performing adjusted analysis, the multivariable model was built up by including only
variables having an association at a significance level <0.05 in the univariate model and then

198
performing backward stepwise analyses and keeping only the statistically significant
predictors in the final model. To examine whether type of symptom or time to diagnosis
predicted the type of surgery (either getting a biopsy-only or resection), logistic regression
analyses were performed in a similar fashion for patients undergoing surgery only. Cox
regression was used for the survival analyses. Proportional hazards (PH) assumption was
checked for each independent variable in the model with log-minus-log plots and time-
dependent variables. None of the independent variables violated the PH assumption. For 12-
month survival, Cox proportional hazards regression analysis was used by first including
potential independent predictors into the model one at a time (univariate model). Adjusted
model was performed as described above. In adjusted survival model for patients undergoing
surgery, we included information on adjuvant treatment modalities to ensure the clinical
validity of the modelling.
Overall survival was defined as the probability of death at 12 months post-diagnosis, with
death as the event. Patients who were alive were censored at their last follow-up.
Results:
In total, 354 patients were included in the analysis. Vague non-specific symptoms were most
commonly recorded (n=122, 34%) of which headache was the most common, n=93 (26% of
total sample). This was followed by focal neurology (n=85, 24%), deficits in cognitive
domain (n=78, 22%) and seizure (n=69, 20%). Patients presenting with cognitive symptoms
were significantly older than patients with seizure or vague symptom (p<0.001 in post hoc
pairwise comparison), had significantly poorer baseline functional status (KPS<70 of 33%
patients with cognitive symptoms versus 3% for seizure (p<0.001), 11% for focal neurology

199
(P<0.001) and 8% for vague non-specific (p<0.001). It was also associated with a
significantly larger tumour at diagnosis than patients with seizure (p<0.001 in post hoc
analysis). Time to diagnosis was longest for cognitive presentation at 43 days [IQR 43,112],
followed by vague non-specific symptoms (28 days [IQR 14,63]), focal neurology (21 days
[IQR 7,38]) and shortest for seizure (7 days [IQR 0,38) (p<0.001). Significantly fewer
patients with cognitive deficits had initial surgical treatment (n=44, 56%) than those with
seizure (n=61, 89%) (p<0.001), and vague non-specific symptoms (n=104, 85%) (p<0.001).
For patients where surgery was undertaken, there were not significant symptom group
differences for the type of surgery (getting biopsy-only or debulking). In regards to post-
surgical treatment, those with cognitive symptoms less frequently received radical treatment
than patients with seizure (p=0.003), focal neurology (p=0.048) and patients with vague non-
specific symptoms (p<0.001). Specifically, over half of patients with seizure (n=31, 51%)
and vague non-specific symptoms (n=59, 57%) received radical therapy. This was the case
for less than a quarter of patients with cognitive symptoms (n=10, 23%). MGMT
methylation analysis was available for only 167 (47%) patients, but no significant group
differences were observed.
Table 5.1: Baseline and clinical characteristics across four symptom presentations
All patients, n (%)
Cognitive domain, n (%)
Seizure, n (%)
Focal neurology, n (%)
Vague non-specific, n (%)
p-value
354 78 (22) 69 (20) 85 (24) 122 (34)
Age, y
mean (SD) 61.8 (13.8) 67 (10.7) 58.2 (15.3) 66 (11.8) 57 (13.8) <0.0011
Sex, n (%)
Male 208 (59) 45 (57.7) 36 (52) 50 (59) 77 (63) 0.52
Performance status, n (%)
KPS<70 47 (13) 26 (33) 2 (3) 9 (11) 10 (8.2) <0.0012
Time to diagnosis
Median [IQR] 21 [7,56] 43 [14,112] 7 [0, 38] 21 [7, 38] 28 [14,63] <0.0013
"short" time, n (%) N/A 39 (50) 36 (52) 54 (64) 73 (60) 0.252

200
Tumour size
Mean (SD), mm 45.6 (17.6) 52.8 (15.6) 34.2 (18.2) 46.7 (14.8) 46.7 (17.6) <0.0011
Mid-line shift, n(%)
>10 mm 53 (15) 16 (21) 1 (2) 9 (11) 27 (23) 0.0012
missing: 15 missing: 1 missing: 5 Missing: 4 missing: 5
MGMT methylation status Recorded, n (%) 167 (47) 32 (41) 41 (59) 35 (41) 59 (48) Mean (SD) 14.7 (18) 12.7 (16) 17 (21.8) 16.3 (20) 13.2 (14.7) 0.67
Methylated, n (%). 65 (39) 11 (34) 16 (39) 15 (43) 23 (39) 0.98
Laterality, n (%)
Left 142 (40) 33 (42) 30 (44) 38 (45) 41 (34) 0.062 Right 162 (46) 27 (35) 35 (51) 39 (46) 61 (50) Other (bilateral/midline) 50 (14) 18 (23) 4 (5) 8 (9) 20 (16) Lobe, n (%)
Frontal 135 (38) 30 (39) 29 (42) 31 (37) 45 (37) 0.0022
Temporal 106 (30) 22 (28) 22 (32) 22 (26) 40 (33) Parietal 58 (16) 7 (9) 16 (23) 19 (22) 16 (13) Multiple 39 (11) 17 (22) 1 (1) 7 (8) 14 (12) Other 16 (5) 2 (2) 2 (2) 6 (7) 7 (5) Initial treatment, n (%)
Conservative 78 (22) 31 (40) 6 (9) 26 (31) 15 (12) <0.0012
RXT/Chemo 12 (3) 3 (4) 2 (2) 4 (5) 3 (2) Surgery 264 (75) 44 (56) 61 (89) 55 (64) 104 (86)
• Debulking 181 (69) 28 (64) 46 (75) 35 (64) 72 (70) 0.482
• Biopsy 83 (31) 16 (36) 15 (25) 20 (36) 32 (30) Post-surgical treatment, n (%)*
None 36 (14) 12 (27) 5 (8) 8 (15) 11 (10) 0.005 Monotherapy RT or TMZ
103 (39) 22 (50) 25 (41) 22 (40) 34 (33)
RT + TMZ 125 (47) 10 (23) 31 (51) 25 (45) 59 (57) *only those undergoing surgery as first treatment 1 ANOVA 2Pearson Chi-Square 3Independent-Samples Kruskal-Wallis test
Prognostic relevance of symptom type and time to diagnosis for decision having surgical versus
non-surgical treatment

201
Most patients were offered surgery (N=264, 75%). Univariate model showed that patients
with cognitive (OR 0.17, p<0.001) and focal neurology (OR 0.24, p<0.001) symptoms were
less likely to be offered surgery compared to those with seizure but this was due to chance
after adjusting in multivariate model. Instead, older age (>70 years), and poor baseline
function (pre-operative KPS lower than 70) were independent predictors for non-surgical
treatment, while patients with a midline shift of more than 10mm (aOR 3.6, p=0.05) and
those with right-sided lesion (compared to the left) (aOR 2.8, p=0.023) were predictors for
surgical treatment (Table 5.2). Time to diagnosis had no significant effect.
Table 5.2: Patient and clinical factors associated with decision of surgical treatment
(versus non-surgical)
Univariate model
Multivariate model1
Agea, y OR 95%CI p-value OR 95%CI p-value >70 0.026 0.01-0.05 <0.001 0.015 0.006-0.038 <0.001 Genderb
Male 1.3 0.8-2.1 0.34
Performance statusc
KPS<70 0.17 0.09-0.3 <0.001 0.2 0.07-0.6 0.005 First symptomd
Cognitive domain 0.17 0.01-0.4 <0.001
Focal neurology 0.24 0.1-0.6 0.001
Vague non-specific 0.8 0.31-1.8 0.54
Time to diagnosise
“Short” time 0.96 0.6-1.6 0.87
Tumour sizef
Small 1.8 0.96-3.34 0.065
Mid-line shift (MLS)g
>10 mm 3.8 1.5-9.9 0.006 3.6 1-12.7 0.05 Lateralityh (versus left)
Right 1.8 1.05-3.1 0.034 2.8 1.2-6.9 0.023 Bilateral 0.4 0.2-0.8 0.008 0.28 0.07-1.1 0.065 Midline 0.9 0.2-3.6 0.86 3.5 0.38-33.1 0.3 Lobei
Parietal 1 0.5-2.1 0.9 1.5 0.5-4.2 0.44

202
Multiple 0.44 0.2-0.88 0.02 0.2 0.03-1.2 0.08 All other 0.7 0.2-1.99 0.5 0.3 0.09-1.2 0.09
1variables entered: age, performance status (KPS), first symptom type, small tumour size, midline
shift (>10mm), laterality, lobe
areference is <70y,breference is female, creference is KPS≥70;dreference is seizure, ereference is
prolonged time, freference is all other, g reference is ≤10mm, h reference is left, i reference is fronto-
temporal
Prognostic relevance of symptom type and time to diagnosis for surgery type (biopsy-only
versus debulking)
In total, 181 (69%) patients had debulking and 83 (31%) had biopsy-only. There were no
significant differences across four symptom groups for type of surgery (getting debulking or
biopsy-only) (Table 5.3). Extent of brain shift (>1cm) (aOR 2.9, p=0.018) was positively
associated with having debulking while lower performance status (KPS<70, aOR 0.25,
p=0.01) as well as tumour location (bilateral aOR 0.15, p=0.001, and midline aOR 0.07,
p=0.01) had negative association for debulking.
Table 5.3: Factors associated with debulking versus biopsy
Univariate model
Multivariate model
Debulking surgery
Factors OR 95%CI p-value OR1 95%CI p-value Agea, y
>70 0.67 0.3-1.5 0.46
Genderb
Male 1.16 0.68-1.9 0.59
Performance statusc
KPS<70 0.38 0.15-0.98 0.045 0.25 0.09-0.7 0.01 First symptomd
Cognitive domain 0.57 0.24-1.3 0.19
Focal neurology 0.57 0.26-1.3 0.17
Vague non-specific 0.7 0.4-1.5 0.4
Tumour sizee
Small 0.75 0.4-1.4 0.36

203
MLSf
>10 mm versus other 2.6 1.2-5.9 0.02 2.9 1.2-7.1 0.018 Lateralityg
Right 1.1 0.6-1.9 0.75 1.1 0.6-1.99 0.8 Bilateral 0.12 0.04-0.37 <0.001 0.15 0.05-0.5 0.001 Midline 0.06 0.01-0.5 0.012 0.07 0.01-0.57 0.01 Lobeh
Parietal 1.24 0.59-2.6 0.57
Multiple 0.29 0.1-0.6 0.003
All other 0.48 0.14-1.6 0.24
1variables entered: performance status (KPS), tumour lobe , midline shift (>10mm), and laterality. areference is <70y,breference is female, creference is KPS≥70;dreference is seizure, ereference is all
other, freference is ≤10mm, g reference is left, h reference is fronto-temporal
Subsequent analysis on the effect of time to diagnosis on the type of surgery for different
symptom groups was performed. In multivariate model, only patients with vague non-specific
symptoms were found to have increased chances of debulking if diagnosed earlier (aOR 3.3,
p=0.018)
Table 5.4: Time to diagnosis effect on surgery type for different symptom types
1Variables entered: performance status (KPS), tumour lobe, midline shift (>10mm), and laterality.
Effect of symptom type and time to diagnosis on 12-month survival (N=354)
Two-hundred and eleven (60%) patients were dead at 12-months. Kaplan-Meier estimates
regarding overall survival were generated and presented in Table 5.5. Patients with cognitive
Time to diagnosis – “short” time versus “prolonged”
Debulking Univariate model Multivariate model
N (%) OR 95%CI p-value aOR1 95%CI p-value
Cognitive domain 15 (53%) 1.9 0.5-6.7 0.3
Seizure 27 (59%) 2.1 0.65-6.9 0.21
Focal neurology 22 (63%) 0.7 0.2-2.3 0.59
Vague non-specific 46 (64%) 2.3 0.97-5.3 0.057 3.31 1.22-8.9 0.018

204
symptoms had the lowest overall survival (112 days, 95%CI 74-149), followed by those with
focal neurology (228 days, 95%CI 146-309) and vague non-specific (371 days, 95%CI 309-
432) symptoms while those with seizure had the longest (508 days, 95%CI 430-585). This
difference was highly significant (Figure 5.1, p<0.001, log-rank test). No survival difference
was observed for time to diagnosis (p=0.4, log-rank test). For other variables, significantly
shorter overall survival was seen for older age, poorer KPS, increased tumour size, and non-
surgical treatment.
Figure 5.1: Kaplan-Meier analyses of overall survival stratified by 4 groups of
presenting symptoms

205
Relative to seizure, cognitive and focal neurology presentation was significantly negatively
associated with survival at 12-months post diagnosis, after controlling for age, functional
status, tumour location and initial treatment type (aHR 1.8, 95%CI 1.2-2.6, p=0.002, and
aHR 1.4, 95%CI 1.01-2.1, p=0.042, respectively).
Table 5.5: 12-month death Kaplan-Meier survival rates by patient and clinical variables Factors N Death at 12-
months, N (%)
Median survival (days)
95%CI p-value
Age, y
>70 104 96 (94) 101 86-115 <0.001 <70 252 115 (45.6) 404 333-474 Performance status, n (%)
KPS<70 47 44 (94) 85 52-117 <0.001
KPS≥70 307 167 (54) 319 265-372 First symptom
Cognitive domain 78 67 (86) 112 74-149 <0.001 Seizure 69 28 (41) 508 430-585 Focal neurology 85 56 (66) 228 146-309 Vague non-specific 122 60 (49) 371 309-432 Time to diagnosis
Short 202 120 (59) 277 216-337 0.4 Long 152 91 (60) 276 226-325 Tumour size
Small 84 40 (48) 385 272-497 0.022 Medium/large 249 162 (65) 241 200-281 Initial treatment
Surgical 264 124 (47) 391 330-451 <0.001 Non-surgical 90 87 (97) 86 72-99 Sub-analysis
Patients undergoing surgery 264
Surgery type
Debulking 181 67 (37) 495 426-563 <0.001 Biopsy only 83 57 (69) 241 185-296 Post-surgical treatment
None 36 27 (75) 86 56-115 <0.001

206
Monotherapy RT or TMZ 103 71 (69) 291 241-340 RT + TMZ 125 26 (21) 597 532-661
Table 5.6: Factors associated with death at 12 months post-diagnosis (N = 345)
Univariate model
Multivariate model
Agea, y HR 95%CI p-value HR1 95%CI p-value >70 4.4 3.4-5.7 <0.001 2.2 1.5-3.1 <0.001 Genderb
Male 1.2 0.97-1.5 0.1
Performance statusc
KPS<70 2.73 1.9-3.7 <0.001 1.5 1.02-2.1 0.04 First symptomd
Cognitive domain 2.9 2.1-4.1 <0.001 1.8 1.2-2.6 0.002 Focal neurology 1.8 1.3-2.6 <0.001 1.4 1.01-2.1 0.042 Vague non-specific 1.2 0.8-1.6 0.3 1.1 0.78-1.5 0.6 Time to diagnosise
Short versus long 1.1 0.9-1.37 0.38
Tumour sizef
Small 0.74 0.57-0.95 0.02
MLSg
>10 mm 0.8 0.6-1.1 0.17
Lateralityh
Right 0.79 0.6-0.99 0.04 0.9 0.7-1.11 0.3 Bilateral 2.1 1.4-2.9 <0.001 1.7 1.13-2.5 0.01 Midline 1.1 0.6-2.2 0.79 1.7 0.8-3.6 0.13 Lobei
Parietal 0.9 0.7-1.2 0.6
Multiple 1.5 1.03-2.1 0.03
All other 0.7 0.4-1.2 0.2
Initial treatmentj
Non-surgical 6.9 5.2-9.2 <0.001 3.03 2.1-4.5 <0.001

207
1Variables entered: age, performance status (KPS), first symptom type, small tumour size, laterality,
tumour lobe, and initial treatment areference is <70y,breference is female, creference is KPS≥70;dreference is seizure, ereference is
prolonged time, freference is all other, g reference is ≤10mm, h reference is left, i reference is fronto-
temporal, jreference is surgical
Effect of symptom type and time to diagnosis on 12-month survival in patients undergoing
surgery (N=264)
As expected, shorter survival was recorded for patients undergoing biopsy-only (241 days
95%CI 185-296) compared to debulking (495 days, 95%CI 426-563) (Table 5. 5), figure 2.
p<0.0001).

208
Figure 5.2: Kaplan-Meier analyses of overall survival of patients stratified by surgery
type (biopsy versus debulking)
In adjusted Cox-regression model, after stepwise elimination of non-significant variables the
following had significant independent negative effects on survival: presenting with cognitive
symptoms (HR 2.4, 95%CI 1.6-3.7, p<0.001), older age (>70 years) (HR 1.95, 95%CI 1.3-
2.97, p=0.002), being male (HR 1.5, 95%CI 1.1-1.9, p=0.004), poor functional status
(KPS<70) (HR 1.74, 95%CI 1.04-2.9, p=0.035), having biopsy-only rather than debulking
(HR 1.54, 95%CI 1.1-2.1, p=0.003) and whether they had no adjuvant treatment (HR 2.9,
95%CI 1.9-4.4, p<0.001), or monotherapy with RT or TMZ (HR 1.9, 95%CI 1.4-2.6,
p<0.001) compared to radical therapy.
Table 5.7: Factors associated with death at 12 months post-diagnosis for patients
undergoing surgery (N = 264)
Univariate model
Multivariate model
Age a, y HR 95%CI p-value HR1 95%CI p-value >70 2.5 1.6-3.8 <0.001 1.95 1.3-2.97 0.002 Genderb
Male 1.37 1.1-1.8 0.02 1.5 1.1-1.9 0.004 Performance status c
KPS<70 1.8 1.1-2.9 0.01 1.74 1.04-2.9 0.035 First symptomd
Cognitive domain 2.7 1.7-4.0 <0.001 2.4 1.6-3.7 <0.001 Focal neurology 1.58 1.1-2.3 0.02 1.1 0.7-1.6 0.66 Vague non-specific 1.2 0.8-1.6 0.3 1.3 0.9-1.8 0.14 Time to diagnosise
Short 1.1 0.88-1.5 0.35
Tumour sizef
Small 0.8 0.6-1.1 0.1
MLSg
>10 mm 0.97 0.7-1.3 0.8

209
1Variables entered: age, gender, performance status (KPS), first symptom type, laterality,
initial treatment and post-surgical treatment. areference is <70y,breference is female, creference is KPS≥70;dreference is seizure, ereference is
prolonged time, freference is all other, g reference is ≤10mm, h reference is left, i reference is fronto-
temporal, jreference is surgical, kreference is radical therapy
Overall survival across different symptom types stratified by surgery type (biopsy versus
debulking)
The overall survival was significantly lower for patients undergoing biopsy-only compared to
debulking for those presenting with cognitive and vague non-specific symptoms. No
significant survival difference by type of surgery was observed for seizure or focal neurology
(Figure 5.3). The significant effect remained for cognitive symptom cohort in a multivariate
model after correcting for age, gender, performance status, laterality, surgery type, and post-
surgical treatment (HR 5.5, 95%CI 2.1-14.5, p=0.001), and near significant for vague non-
specific group (HR 1.5, 95%CI 0.94-2.4, p=0.085). Post-surgical treatment remained
significant for all models.
Lateralityh
Right 0.8 0.6-1.1 0.2
Bilateral 1.8 1.1-2.9 0.017
Midline 0.98 0.43-2.2 0.97
Lobei
Parietal 0.9 0.6-1.3 0.5
Multiple 1.2 0.7-1.9 0.4
All other 0.57 0.3-1.11 0.1
Initial treatmentj
Biopsy only 1.7 1.3-2.3 <0.001 1.54 1.1-2.1 0.003 Post-surgical treatmentk
None 3.4 2.3-4.99 <0.001 2.9 1.9-4.4 <0.001 Monotherapy RT or TMZ 2.2 1.7-2.9 <0.001 1.9 1.4-2.6 <0.001

210
Figure 5.3: Kaplan-Meier analyses of overall survival of patients presenting with
different symptom types stratified by surgery type (biopsy versus debulking)
Table 5.8: Proportional hazards regression for 12-month death on degree of surgery
and post-surgical treatment for patients with cognitive symptoms Factors N (%) HR1 95%CI p-value Surgery type2
Biopsy only 16 (36) 5.5 2.1-14.5 0.001 Post-surgical treatment3
None 12 (27) 16.4 4.6-58 <0.0001 Monotherapy RT or TMZ 22 (50) 3.3 0.9011.9 0.068
1Variables entered: age, gender, performance status (KPS), laterality, initial treatment, and post-
surgical treatment 2debulking is reference 3RT + TMZ is reference

211
Table 5.9: Proportional hazards regression for 12-month death on degree of surgery
and post-surgical treatment for patients with seizure Factors N (%) HR1 95%CI p-value Surgery typea
Biopsy only 15 (25) 0.87 0.4-1.8 0.7 Post-surgical treatmentb
None 5 (8) 3.5 1.2-10.1 0.023 Monotherapy RT or TMZ 25 (41) 2.3 1.3-4.1 0.005
1Variables entered: age, gender, performance status (KPS), laterality, initial treatment, and post-
surgical treatment adebulking is reference bRT + TMZ is reference
Table 5.10: Proportional hazards regression for 12-month death on degree of surgery
and post-surgical treatment for patients with focal neurology symptoms Factors N (%) HR1 95%CI p-value Surgery typea
Biopsy only 20 (36) 0.7 0.4-1.4 0.4 Post-surgical treatmentb
None 8 (15) 1.2 0.5-2.9 0.7 Monotherapy RT or TMZ 22 (40) 2.7 1.4-5.1 0.003
1Variables entered: age, gender, performance status (KPS), laterality, initial treatment, and post-
surgical treatment adebulking is reference bRT + TMZ is reference

212
Table 5.11: Proportional hazards regression for 12-month death on degree of surgery
and post-surgical treatment for patients with vague non-specific symptoms Factors N (%) HR1 95%CI p-value Surgery typea
Biopsy only 32 (30) 1.5 0.94-2.4 0.085 Post-surgical treatmentb
None 11 (10) 10.4 4.7-23.1 <0.001 Monotherapy RT or TMZ 34 (33) 2.8 1.6-4.8 <0.001
1Variables entered: age, gender, performance status (KPS), laterality, initial treatment, and post-
surgical treatment adebulking is reference bRT + TMZ is reference

213
Discussion
Summary:
The relationship between time to diagnosis and survival of patients with high grade gliomas
is complex and potentially influenced by symptom type, for some patients. Our study
demonstrates that patients with high-grade glioma presenting with cognitive symptoms have
prolonged diagnosis compared to patients presenting with seizure, focal neurology or vague
non-specific symptoms. Symptom type but not time to diagnosis is associated with 12-month
survival. We show that cognitive complain is an adverse prognostic factor for survival
independent of age, performance status, or the surgical and adjuvant treatments. Multivariate
analyses show that earlier diagnosis is not associated with specific aspects of clinical care,
namely getting surgery, or survival for most patients. Earlier diagnosis, however, may be
associated with the type of surgery for patients presenting with vague non-specific symptoms
such as headache however further research is warranted.
Effect of symptom presentation and diagnostic time on clinical care
Early cancer diagnosis is a crucial aspect of health care provision. The majority of patients
are diagnosed following symptomatic presentation, and the nature of presenting symptoms
will influence the diagnostic timeliness (Ozawa et al 2018; Grant 2004). Patients with
malignant brain tumours often complain of impairments in cognition (at least 22% in our
study) (Yuile et al 2005;Habets et al 2014; Klein et al 2003; Tucha et al 2000), which not
uncommonly can be unnoticed for appreciable length of time (Scott et al 2019), resulting in
longer diagnosis ( Grant 2004; Ozawa 2018), also see section study 2). The longest

214
diagnostic time recorded in this study was for patients with cognitive symptoms (median 43
days), followed by vague non-specific symptoms such as headache (median 21 days) and the
shortest was for seizure (median 7 days), consistent with previous findings (Grant 2004;
Ozawa 2018). Noteworthy, patients with cognitive symptoms tended to be older, have poorer
functional baseline status, and larger tumour at diagnosis, especially compared to patients
presenting with seizure. In addition, treatment options varied: significantly fewer patients
with cognitive deficits had initial surgical treatment (n=44, 56%) than those with seizure
(n=61, 89%) (p<0.001), and vague non-specific symptoms (n=104, 85%) (p<0.001). In
regards to post-surgical treatment, patients with cognitive symptoms less frequently received
radical therapy. Specifically, over half of patients with seizure (n=31, 51%) and vague non-
specific symptoms (n=59, 57%) received radical therapy as per Stupp protocol (Stupp et al
2005). This was the case for less than a quarter of patients with cognitive symptoms (n=10,
23%). Nevertheless, neither any particular symptom nor time to diagnosis was associated
with decision for surgical treatment in multivariate model after accounting for other
independent patient and tumour related factors. This is not unexpected. Generally, the aim is
that most HGG patients would undergo surgery as the first neuro-oncological treatment as to
maximally improve outcomes, unless poor functional status outweighs its benefits (Minniti et
al 2019; Chaicana et al 2013). Up to 75% of our patients proceeded to first surgery, and the
frequency is similar across different neurosurgical cancer centres (Bussiere et al 2005; Gately
et al 2016).
Earlier diagnosis was, however, found to be an independent predictor for getting a debulking
surgery rather than biopsy for patients with vague non-specific symptoms in a multivariate
model. This is a preliminary finding based on retrospective data analysis, but if true this
would have significant implications for future strategies for early diagnosis campaigns that

215
aim to identify such symptoms early. Unfortunately, vague symptoms are one of the
commonest early complaints reported by brain tumours patients, as the current study and
previous others suggest (Ijzerman-Korevaar et al 2016; Grant 2004). Further diagnostic
challenge stems from the fact that such symptoms are often associated with benign conditions
in primary care (Rubin et al 2015) making the diagnosis particularly difficult. Screening for
additional symptoms or signs would help improve speed of diagnosis, potentially (Ozawa
2018). Equally, availability to fast direct access head imaging for General Practitioners in
such situations would likely be beneficial. Absence of this service in primary care was
reported to be one of the commonest barriers to early brain tumour diagnosis by GPs in
Ireland and from our informal discussion. Similar finding was previously reported by our
own study of NACDPC data (Ozawa et al). Prospective study involving ideally data
collection using structured patient/carer interviews would be best placed to answer this
research question, however, such study would require a large patient population and the
associated manpower to carry it out.
Effect of symptom presentation and diagnostic time on 12-month survival
Our study is the first to directly study the relationship between survival in relation to
symptom categories based on previous publications and referral guidelines for cancer as set
out by Scottish Referral Guidelines for CNS cancer. Previous studies predominantly focused
on presentation with epilepsy or without (Rosati et al 2013), Berendsen et al 2016, or
cognitive deficits (Johnson et al 2012; Klein et al 2003, Bussiere et al 2005) in HGG survival.
Our study reported a negative survival association of HGG patients with cognitive deficits
compared to those presenting with seizure, and the effect was independent of patient, clinical
and treatment variables (aHR 1.8, 95%CI 1.2-2.6, p=0.002 in a multivariate cox regression

216
analysis). This is consistent with previous studies with GBM patients undergoing surgery
(Johnson 2012; Klein et al 2003; Bussiere et al 2005; Gorlia et al 2008). Chaichana (2011)
showed 80% decreased survival with preoperative cognitive deficits compared with GBM
patients without these deficits. Similar to our study, this was an independent effect of
preoperative KPS. The fact that cognitive status is an independent predictor from KPS is
noteworthy. KPS estimates the physical functional status of patients and may obscure
clinically important symptoms. Impaired cognitive status is associated with the most frequent
disability in patients with brain tumours (McCarter et al 2006). This is not unexpected, as
this would have impact on functional performance. For example, two brain tumours patients
may have identical KPS score due to required assistance for self-care due to physical deficit
such as paresis while remaining cognitively intact, while the second person may require
similar assistance due to cognitive dysfunction. KPS score might be the same, yet severity of
illness clinically will be different. Some authors even suggest that mental status may be more
important determinant of clinical outcome than physical functioning in patients with HGG
(Buckner et al 2003). It could be hypothesised that tumour-related cognitive deficits may be
related to pathological processes consequently harbouring more aggressive tumours resulting
in more reactive changes (Johnson et al 2012, Hom & Reitan 1984). Alternatively, as
Johnson and Wefel (2012) put it, presence of cognitive deficits could have an impact on
prognosis by influencing oncologist’s behaviour, potentially consciously or sub-consciously,
more likely recommending aggressive therapy to patients with good cognitive function.
Although it may sound plausible, our data does not support this assumption. We did not find
evidence that presentation with cognitive symptoms was significantly associated with clinical
care decisions independent of KPS score. From our own experience in multi-disciplinary
neuro-oncology meetings, the decision on clinical care is predominantly based on age,
functional status, and tumour variables but not symptomatology per se.

217
Consistent with our results, a favourable association between epilepsy at presentation and
prolonged survival in GBM patients was reported by Berendsen (2016). Similarly, in a study
by Yuile (2006), patients with sudden and acute presenting symptoms tended to have
increased 1-year survival than those with more global symptoms (55.6% versus 24.3%,
respectively, p= 0.07). The authors defined “sudden and acute presentations” as seizures,
speech or visual disturbance while weakness, headaches and memory loss or confusion were
considered “global” less acute symptoms. Noteworthy, they did not report on diagnostic time
for each group, and presumably the classification was based on theoretical knowledge
supported by practical experience.
Early diagnosis (within the median time interval) in our study was not associated with
improved survival. As such, it may be reasonable to assume that the underlying mechanism
for survival may be tumour biology and behaviour which is reflective of symptom
manifestation rather than time to diagnosis per se. Few studies have attempted to directly
assess the relationship between early diagnosis and survival in malignant brain tumours,
some reporting adverse outcomes for faster diagnosis (Aggarwal et al 2015; Natalwala et al
2011) while one study demonstrating improved survival (Cerqua et al 2015). Limitations of
previous studies, however, warrant further consideration. All studies included smaller study
samples (92 patients in Aggarwal; 105 patients in Natalwala and 56 patients in Cerqua) and
varied in statistical approach. Firstly they were all retrospective in design, there was little
clarity and attempt in defining “time to diagnosis” in strict methodological approach, guided
by Weller et al, time to diagnosis and survival analyses were performed in all pooled patients
with little statistical adjustment for age, KPS, or tumour and surgical factors. It is not clear
whether in fact older age, or KPS score rather than time to diagnosis contributed the effect on

218
survival time in Aggarwal 2015. The Aggarwal study authors based their conclusions on the
fact that poorer survival was associated with patients diagnosed at emergency department
(ED) rather than outpatient department (OPD), for which diagnostic time was significantly
shorter (8 vs 26 days, respectively, p<0.0001). It is noted, however, that those presenting
through ED were significantly older (63 years old vs 54 years old, p=0.01), and more likely
to get debulking than biopsy of the lesion (ED 65% versus 40% for outpatients) however the
difference was not statistically significant (p=0.069). Noteworthy, a greater proportion of
patients with cognitive deficits presented via ED, while more patients with seizures presented
through outpatient clinics. In addition, no regard to functional status, or post-surgery therapy
were accounted for in previous analysis, which are factors consistently found to predict
survival in previous studies (Shirai et al 2010; Stark et al 2012; Brown et al 2016). Results
from Aggarwal study may be interpreted that poorer survival was due patients harboring
more aggressive tumour resultant in ED admission, compared to those diagnosed in
outpatient department. Their analysis does not, however, allow making any meaningful
conclusion on the effect of time to diagnosis.
In contrast, Cerqua et al 2015 reported improved survival with an earlier diagnosis. In a
multivariable Cox regression analysis, they showed that age at onset and time to diagnosis
were clinical factors associated with overall survival in a combined patient sample of a cohort
of 28 GBM and 28 primary CNS lymphoma (PCNSL) patients. However, it is noted their
study was small (56 patients), and time data were collected retrospectively. Furthermore,
while both aetiologies are considered highly aggressive tumours, clinical features and
management differ (Low et al 2018; Hochberg et al 2007). When survival analysis was
performed for individual tumour groups, survival was negatively correlated for PCNSL

219
patients, while no overall survival effect was observed for GBM group. Methodological
implications of the study may therefore limit conclusions.
Effect of age and performance status
Older age (70+) is a strong independent predictor of mortality, which is consistent with
previous studies (Lacroix et al 2001; Johnson et al 2012). Risk of death is increased by 5
times in GBM patients over 75 years old compared to their younger counterparts in one study
(Pan et al). The negative effect of older age is attributed to medical comorbidities and
presumed poor prognosis (Chaichana et al 2011), we however also show that elderly patients
are less likely to receive surgery as the first neurooncological treatment in turn resulting in
shorter survival after controlling for baseline functional status in a multivariable model.
Gulati et al (2012) showed that age >66 years old is highly significantly associated with
having conservative treatment for GBM and that belonging to the age group of >75 years was
the strongest predictor of poor survival, however their interpretation may be limited by
missing data on functional status at diagnosis or any tumour related factors. Poor survival
may also be due to molecular profile of tumours in the elderly as several studies have found
unfavourable tumour genetic profiles in the elderly, namely tp53 and CDKN2A/p16, IDH1
which confer a more aggressive-behaving tumour and poorer response to chemoradiation
(Alonso et al 2001; Batchelor 2004; Hartmann et al 2010). For patients undergoing surgery,
consistently with our results, Babu found increasing age, extent of tumour resection and pre-
operative KPS score to be significant independent prognostic factors for survival in a sample
of 120 GBM patients aged >70 years old. Noteworthy, where surgery was undertaken, our
study showed that age was not found to be a significant predictor for getting debulking in
univariate model. It is generally accepted that extensive surgery can be considered in HGG

220
patients with good general and neurological function, regardless of age, without significantly
added inherent risks of surgery (Barnholtz-Sloan et al 2008; Iwamoto et al 2009; Miniti et al
2019,Tsang et al 2015; Babu et al 2016), notwithstanding though a consideration of quality
of life and the patient’s / carers’ wishes (Vourinen et al 2003).
Baseline performance status is one of the most important pre-operative (Alvarez et al 2016)
and survival prognostic factors in GBM studies (Johnson & Wefel 2013; Gorlia et al 2008;
Alvarez et al 2016; Coultier et al 2014; Gately et al 2016). Karnofsky Performance Status
(KPS) is most widely used in neuro-oncology practice (Yates et al 1980; Schag et al 1984). It
aims to classify patients based on the presence and degree of symptoms, independence with
self-care and ability to work. In both univariable and multivariable regression models, we
showed that KPS lower than 70 was a significant and independent predictor for exclusion
from having surgery as first neuro-oncological treatment and poorer overall 12-month
survival whether patients had surgery or not. As expected, poor baseline function was
associated with limited surgical treatment (i.e. getting a biopsy versus debulking) (Alvarez et
al 2016).
Tumour factors: size, lobe, laterality, midline shift
Of all tumour-related factors analysed, only increased mid-line shift and right-tumour
laterality were found to be independent factors associated with clinical care. Multi-lobular
tumour, while a significant adverse prognostic factor in univariate model, did not remain so
after adjustment in multivariate model. The site and ease of access of the tumour may be the
surrogate for extent of resection, and survival, for instance, tumours in non-eloquent areas
may be more amenable to complete surgical excision without associated post-operative

221
deficits (Stummer et al 2008; Mineo et al2007). We show while a patient with right sided
HGG has a higher chance of undergoing operation than those with left-sided tumour, possibly
due to being in non-dominant hemisphere, in majority of cases, its independent influence
disappears to predict biopsy versus debulking. As expected, those with bilateral tumours are
least likely to undergo surgery and if they do, they would most likely get a biopsy only. In
addition, we did not find significant effect of frontal lobe dominance for neither type of first
treatment option, type of surgery. Likewise, previous studies failed to observe the
relationship (Pan et al 2015; Polin et al 2005). Consistent with Stummer et al, it is noteworthy
that neither right or left side, nor mid-line shift were significant co-variates in multivariate
analysis of overall survival. As would be expected, survival was poor for bilateral disease
(Stark et al 2012; Iwamoto et al 2009 ).
It appears that midline shift of more than 1 cm at diagnosis has a positive effect in terms of
surgical decision making and extent of resection, however, as expected, this does not, on its
own, reflect on estimates of survival, consistent with previous findings (Stummer et al 2008).
In contrast, adverse outcome for elderly patients with increased midline shift was reported by
Alvarez de Eulate-Beramendi (2016), however result did not reach statistical significance
(p=0.06). Urgent surgery may provide immediate mass effect relief from tumour and the
surrounding oedema resulting in clinical improvement for the patient (Talacchi et al 2011;
Hardesty & Sanai 2012), which may be one of the principal decision factors for short term
goals by a neurosurgeon (Walker et al 2013 ). This is an interesting and novel observation.
Tumour size at diagnosis did not have prognostic effect in our study. Increased tumour size
was found to have negative association with extent of resection in Spena et al (2013). Pan
(2015) showed that tumour size of more than 3cm³ at diagnosis resulted in worse prognosis.

222
Similarly, patients with tumours larger than 4 cm had about 2-fold decreased survival time
than patients with smaller tumours in Chaichana (2011). No survival benefit with small
tumours however was reported by other researchers ( Wang et al 2019, Stummer et al 2008).
Therefore, it begs a question if tumour size is an important variable to consider? Larger
tumours may indicate a later diagnosis (patents with cognitive symptoms have larger tumours
and longer diagnostic time than patients with seizure where tumour is smaller and diagnostic
interval is short). In addition, it may demonstrate increased cell proliferation causing
increased tumour burden and hence lower survival (Chaichana et al 2011). It appears,
however, from the current data that tumour size does not necessarily affect prognosis but it
may do so indirectly by causing increased brain shift, invading larger areas of the brain
parenchyma, which may limit extent of surgery, especially if in eloquent areas.
Type of surgery effect on survival
Surgical tumour resection provides immediate relief due to mass effect and specimen
collection for pathological confirmation (Delgado-Lopez et al 2016). In addition, the extent
of tumour resection is regarded as one of the strongest prognostic factors of survival in
younger patients (Stummer et al 2008, Lacroix et al 2001; Laws et al 2003;Brown et al 2005)
as well as older patients (Stummer et al 2008) however the true value of surgery alone on
survival remains controversial due to lack of well-designed prospective clinical trials
specifically trying to address this question. Generally, studies report survival benefit from
surgery in the descending order of gross total resection, partial resection and biopsy (Minniti
et al 2019). However, it is still widely debated in neuro-oncological surgery if there is and
what the threshold of volume of residual tumour beyond which the prognosis worsens
abruptly. Some studies report modest survival gains with a minimum threshold of 70%

223
resection Chaicana et al, while others are more conservative. Lacroix study (2001) with 416
patients with GBM reported a significant survival benefit for resections of 98% or more of
the tumour volume (median survival of 13 months) compared to 8.8 months for resections of
less than 98% (p<0.0001). This has been corroborated by several other studies by Stummer et
a (2008) and Kuht et al (2011) thus emphasising the concept of complete versus incomplete
resection of HGG on survival.
Although the current study was not able to classify the extent of resection to beyond
debulking, as expected and consistent with previous studies aforementioned, our results show
that patients undergoing surgery limited to biopsy have a significantly shorter survival than
with debulking (241 days versus 495 days, respectively, p<0.0001). However, the effect of
the type of surgery may not benefit patients equally. For example, our data show that
debulking of the tumour results in a significantly longer survival for patients presenting with
cognitive and vague symptoms, but not for patients with seizure or focal neurology deficits.
Noteworthy, the difference remains significant in a multivariate model after adjustment for
co-variables for patients with cognitive deficits, while a model including patients with vague
non-specific symptoms trended towards statistical significance. The results are interesting
and, somewhat, unexpected, however should be interpreted with caution. Lack of significant
difference in survival for seizure and focal neurology patients could perhaps be explained due
to lack of quantitative assessment of extent of resection. In other words, for the purposes of
this study, biopsy may not necessarily be an equal measure for patients with seizure
compared to patients with cognitive symptoms. By that, 30% of tumour removal could have
been recorded as a biopsy for seizure patients in the MDT notes, while recorded as debulking
for patients with cognitive symptoms. However, the fact that survival was not significantly
different between biopsy and debulking for these patients underlies the importance of

224
maximum safe tumour resection. In contrast, for patients with cognitive deficits, our data
may imply that if maximal degree of tumour resection cannot be practically feasible without
inflicting new permanent neurological deficit, debulking should be optimised rather than just
a biopsy even in patients with cognitive impairment provided their baseline physical status
allows.
Strength
The strength of this study is the dataset involving a large number of patients and the high
quality of collected data which allowed performing adjusted modelling with known
significant factors at patient, tumour and treatment-related. Influence of specific variables
following adjustment of certain outcomes increase eco-validity of final results.
In order to increase accuracy of our data, we sought information from patient’s General
Practitioners (GP), especially in cases where patients first attended their GP. To our
knowledge this is the first attempt to combine primary care data with that obtained in
secondary care for the estimation of time to diagnosis of this type of brain tumours.
Limitations
One of the limitations of the study remains its retrospective nature. Capturing historical
items, of which time data can be increasingly challenging from retrospective records, partly
due to the very nature of data required which can be missing, conflicting (Nagurney et al
2005; Schwartz 1996). In addition, data validity may be influenced by a non-random bias on

225
any part, subject, clinician or the researcher conducting this abstraction in the process of data
collection (Bosetti et al 2001). Although we attempted to gather as much data regarding
symptomatology by contacting patients’ GPs, it is however inevitable that some information
may be missing or inaccurate. Secondly, the absence of appreciable effect of early diagnosis
on 12 month survival may be due to inherently small differences in diagnostic times in this
study which were based on best available assumptions from retrospective datasets. Had data
been collected from prospective sources, such effect could have potentially been significant.
In addition, we recorded the extent of resection from records in medical, operative, radiology
or MDT notes rather than formally assessing from pre-and post-operative imaging and
categorised them either biopsy-only or debulking without formal quantitative radiological
assessment. It has been reported that surgical resection of >78% at least of the tumour
volume can provide a marked survival benefit compared with biopsy alone (Sanai et al 2011).
Nevertheless, significant survival benefit has been proven in studies using similar
differentiation as ours (debulking or biopsy) (Vourinen et al 2003), and we used this for our
survival analyses.
Similarly, tumour size was recorded from radiology reports measuring axial length. We did
not perform volumetric measurements. Adjuvant therapy at our institution is commenced and
maintained at a separate department. We were not able to determine from available notes at
the time which patients completed the full course of adjuvant therapy once commenced and
who terminated at any time due to intolerance to its effects, however this is a common issue
in previous studies. Nevertheless, similar frequency of the use of post-surgical therapy was
reported elsewhere (Berendsen et al 2016; Wang et al 2019).
Implications:

226
It has long been discussed if sooner diagnosis of brain tumour provides clinical benefits for
the patient (Richards 2009). The challenge of early diagnosis comes from non-specific
clinical presentation, in particular at early stages, as common presenting symptoms such as
headache, cognitive and personality symptoms may be more often attributable to other benign
conditions such as migraine, anxiety, depression. While the present study did not observe
direct association between early diagnosis and clinical care and survival outcomes, we
showed that diagnostic timeliness is dependent on symptomatic presentation, which in turn
has prognostic implications. In a Delphi study (Hamilton et al 2015), clinical experts judged
that earlier brain cancer diagnosis would significantly bring morbidity benefits, including
provision of symptom relieve and likely improvement in psychological wellbeing, however
possibly smallest gains in mortality. In other words, although expediting symptomatic
diagnosis of brain tumours may not have desired effect on survival, every effort nevertheless
should be made to achieve timeless diagnosis to improve wellbeing, reduce morbidity and
potentially improve quality of life. Earlier diagnosis could result in smaller brain tumours,
less brain oedema and associated brain shift, consequently perhaps less morbidity.
Intervention in the illness’ earlier progress may reduce the risk of significant acquired
neurological morbidity, resulting in improved quality of life, perhaps by preventing
significant damage from the tumour on the delicate brain tissues but also through reduced
number of operations carried out as urgent or emergency cases. In addition, timely diagnosis
may likely reduce patients’ and families’ anxieties on the personal level but may also
increase public’s confidence in the health service (Walker et al 2013).
The size and quality of dataset allowed determination of significant variables that likely
affect speed of diagnosis, and ultimately survival. Based on this, clear and succinct guidance

227
should be developed for patients, and clinicians to inform the development of targeted
interventions with the aim to reduce patient and diagnostic intervals. Patients and their family
members do often want to know if late diagnosis of a brain tumour leads to poorer outcomes.
This study shows, however, that time to diagnosis is not a significant prognostic factor, at
least for survival.

228
References:
Aggarwal A, Herz N, et al. Diagnostic delay and survival in high-grade gliomas – evidence of the ‘waiting time paradox’?. Br J Neurosurg 2015;29(4):520-523. Alonso M, Hamelin R, et al. Microsatellite instability occurs in distinct subtypes of pediatric but not adult central nervous system tumors. Cancer Res 2001; 61(5):2124-8. Alvarez de Eulate-Beramendi S, Alvarez-Vega MA, et al. Prognostic factors and survival study in high-grade glioma in the elderly. Br J Neurosur 2016;30(3):330-336 Babu R, Komisarow JM, et al. Glioblastoma in the elderly: the effect of aggressive and modern therapies on survival. J Neurosurg 2016;124(4):998-1007. Barnholtz-Sloan J, Williams VL, et al. Patterns of care and outcomes among elderly individuals with primary malignant astrocytoma. J Neurosurg 2008; 108(4):642-8. Batchelor TT, Betensky RA, et al. Age-dependent prognostic effects of genetic alterations in glioblastoma. Clin Cancer Res 2004; 10(1):228-33. Berendsen S, Varkila M, et al. Prognostic relevance of epilepsy at presentation in glioblastoma patients. Neuro Oncol 2016;18(5):700-6 Bosetti C, Tavani A, et al. Reliability of data on medical conditions, menstrual and reproductive history provided by hospital controls. J Clin Epidemiol 2001;54(9):902-6. Brown PD, Maurer MJ, et al. A prospective study of quality of life in adults with newly diagnosed high-grade gliomas: the impact of the extent of resection on quality of life and survival. Neurosurgery 2005;57(3):495-504. Brown TJ, Brenna MC, et al. Association of the extent of resection with survival in glioblastoma: a systematic review and meta-analysis. JAMA Oncol 2016; 2(11):1460-1469. Burnet NG, Jefferies SJ, Benson RJ et al. Years of life lost (YLL) from cancer is an important measure of population burden – and should be considered when allocating research funds. Br J Cancer 2005; 92 (2): 241-5 Bussiere M, Hopman W, et al. Indicators of functional status for primary malignant brain tumour patients. Can J Neurol Sci 2005; 32:50-56 Cancer Research UK. Brain, other CNS and intracranial tumours statistics 2018 [Available from: http://www.cancerresearchuk.org/health-professional/cancer-statistics/statistics-by-cancer-type/brain-other-cns-and-intracranial-tumours#heading-Zero Cerqua R, Balestrini S, et al. Diagnostic delay and prognosis in primary central nervous system lymphoma compared with glioblastoma multiforme. Neurological Sceinces 2016;37:23-29.

229
Chaichana KL, Chaicana KK, et al. Surgical outcomes for older patients with glioblastoma multiforme: preoperative factors associated with decreased survival. Clinical article. J Neurosurg 2011; 114(3):587-94. Chaichana KL, Garzon-Muvdi T, et al. Supratentorial glioblastoma multiforme: the role of surgical resection versus biopsy among older patients. Ann Surg Oncol 2011;18(1):239-245. Chaichana KL, Martinez-Gutierrez JC, et al. Factors associated with survival for patients with glioblastoma with poor pre-operative functional status. J Cli Neurosc 2013;20(6):818-823. Chen J, McKay RM, Parada LF. Malignant glioma: Lesions from genomics, mouse models, and stem cells. Cell. 2012; 149:36–47. DOI: 10.1016/j.cell.2012.03.009 [PubMed: 22464322] Coulter IC, Varma A, et al. Glioblastoma in elderly patients. J Neurosurg 2014;120(5):1246-7. Crawford SC, David JA, et al. The waiting time paradox: population based retrospective study of treatment delay and survival of women with endometrial cancer in Scotland. BMJ 2002;325:196. Delgado-Lopez PD, Corrales-Garcia EM. Survival in glioblastoma: a review on the impact of treatment modalities. Clin Trans Oncol 2016;18(11):1062-1071. Elliss-Brookes L, et al. Routes to diagnosis for cancer – determining the patient journey using multiple routine data sets. Br J Cancer 2012; 107:1220-6. Ellor SV, Pagano-Young TA, Avgeropoulos NG. Glioblastoma: Background, standard treatment paradigms, and supportive care considerations. Journal of Law, Medicine, and Ethics. 2014; 42:171–182. DOI: 10.1111/jlme.12133 Gately L, Collins A, et al. Age alone is not a predictor for survival in glioblastoma. J Neuro-Oncol 2016;129:479-485. Gorlia T, van den Bent, MJ, et al. Nomograms for predicting survival of patients with newly diagnosed glioblastoma: prognostic factor analysis of EORTCS and NCIC trial 26981-22981/CE.3. Lancet Oncol 2008;9(1):29-38. Grant R. Overview: Brain tumour diagnosis and management/Royal College of Physicians guideines. J Neurol Neurosurg Psychiatry 2004; 75(2):18023. Gulati S, Jakola AS, et al. Survival and treatment patterns of glioblastoma in the elderly: a population-based study. World Neurosurg 2012;78(5):518-26. Habets EJJ, Kloet A, et al. Tumour and surgery effects on cognitive functioning in high-grade glioma patients. Acta Neurochir (Wien) 2014;156(8):1451-9. Hamilton W, Stapeley S, Campbell C, et al. For which cancers might patients benefit most from expedited symptomatic diagnosis? Construction of a ranking order by a modified Delphi technique. BMC Cancer. 2015;15:820

230
Hardesty DA, Sanai N. The value of glioma extent of resection in the modern neurosurgical era. Front Neurol 2012;3:140. Hart MG, Metcalfe SE, et al. Biopsy versus resection for high grade glioma. Cochrane Database Syst Rev 2000. doi: 10.1002/14651858.CD002034 Hartmann C, Hentschel B, et al. Patients with IDH1 wild type anaplastic astrocytomas exhibit worse prognosis than IDH1-mutated glioblastomas, and IDH1 mutation status accounts for the unfavorable prognostic effect of higher age: implications for classification of gliomas. Acta Neuropathol 2010;120(6):707-18. Hayat MA (ed). Tumors of the Central Nervous System, volume 1. Springer: 2011. Hochberg FH, Baehring JM, et al. Primary CNS lymphoma. Nature Clinical Pract Neurol 2007; 3:24-35. Hom J., Reitan R.M. Neuropsychological correlates of rapidly vs. slowly growing intrinsic cerebral neoplasms. J. Clin. Exp. Neuropsychol. 1984;6(3):309–324. Ijzerman-Korevaar, M, Snijders TJ, et al. Prevalance of symptoms in glioma patients throughout the disease trajectory: a systematic review. J NeuroOncol 2018;140(3):485-496. Iwamoto, FM, Cooper AR, et al. Glioblastoma in the elderly: the Memorial Sloan-Kettering Cancer Centre experience (1997-2007). Cancer 2009;115(16):3758-66. Johnson DR, Sawyer AM, et al. Early measures of cognitive function predict survival in patients with newly diagnosed glioblastoma. Neuro Oncol 2012; 14(6):808-16. Johnson RD and Wefel JS. Relationship between cognitive function and prognosis in glioblastoma. CNS Oncol 2013;2(2):195-201. Kleihues P et al. The New WHO Classification of Brain Tumours. Brain Pathology 1993; 3(3) Klein M, Postman TJ, et al. The prognostic value of cognitive functioning in the survival of patients with high-grade glioma. Neurology 2003;61:1796-1798. Koo MM, Hamilton W, et al. Symptom signatures and diagnostic timeliness in cancer patients: a review of current evidence. Neoplasia 2018;20(2):165-174. Kuht D, Becker A et al. Correlation of the extent of tumor volume resection and patient survival in surgery of glioblastoma multiforme with high-field intraoperative MRI guidance. Neuro Oncol. 2011;13(12):1339-48. Kurian KM, Jenkinson MD, et al. et al. Brain tumor research in the United Kingdom: current perspective and future challenges. A strategy document from the NCRI Brain Tumor CSG. Neuro-Oncology Practice 2018; 5(1):10-17.

231
Lacroix M, Abi-Said D, et al. A multivariate analysis of 416 patients with glioblastoma multiforme: prognosis, extent of resection, and survival. J Neurosurg 2001;95(2):190-8. Lamborn KR, Chang SM, et al. Prognostic factors for survival of patients with glioblastoma. Recursice partitioning analysis. Neuro-Oncol 2004;6(3):227-235. Laws ER, Parney IF, et al. Survival following surgery and prognostic factors for recently diagnosed malignant glioma: data from the Glioma Outcomes Project. J Neurosurg 2003; 99(3):467-73. Laws ER, Shaffrey ME, et al. Surgical management of intracranial gliomas – does radical resection improve outcome. Acta Neurochir Suppl 2003;85:47-53. Liang J, Lv X, et al. Prognostic factors of patients with gliomas – an analysis on 335 patients with glioblastoma and other forms of gliomas. BMC Cancer 2020; 20(35) Lote K, Stenwig AE et al. Prevalence and prognostic significance of epilepsy in patients with gliomas. Eur J Cancer 1998; 34(1):98-102 Louis DN, Perry A, et al. The 2016 World Health Organisation Classification of Tumors of the Central Nervous System: a summary. Acta Neuropathol 2016; 131(6):803-20 Low S, Han CH, Batchelor TT. Primary central nervous system lymphoma. Ther Adv Neurol Disord 2018; 11. McCarter H, Furlong W, et al. Health status measurements at diagnosis as predictors of survival among adults with brain tumours. J Clin Oncol 2006;24(22):3636-3643. Mineo JF, Bordon A, et al. Prognosis factors of survival time in patients with glioblastoma multiforme: a multivariate analysis of 340 patients. Acta Neurochir (wien) 2007;149(3):245-52. Minniti G, Lombardi G, Paolini S. Glioblastoma in elderly patients: current management and future perspectives. Cancers 2019; 11(3). Nagurney JT, Brown DFM, et al. The accuracy and completeness of data collected by prospective and retrospective methods. Acad Emerg Med 2005;12(9):884-895. Natalwala A, Bharkhada V, et al. Comparison of time taken from initial presentation to histological diagnosis of glioblastoma multiforme (GBM) in Birmingham, United Kingdom and Strasbourg, France. Clin Neurol Neurosurg 2011; 113:358-361. Neal RD, Tharmanathan P, et al. Is increased time to diagnosis and treatment in symptomatic cancer associated with poorer outcomes? Systematic review. Br J Cancer 2015;112(1):92-107. NHS Scotland 2019. Scottish Referral Guidelines for Suspected Cancer. http://www.cancerreferral.scot.nhs.uk/brain-and-central-nervous-system-cancers/

232
Ozawa M, Brennan PM, Zienius K, et al. Symptoms in primary care with time to diagnosis of brain tumours. Family Practice 2018; 35(5):551-558 Ozawa M, Brennan PM, Zienius K, et al. The usefulness of symptoms alone or combined for general practitioners in considering the diagnosis of a brain tumour: a case-control study using the clinical practice research database (CPRD) (2000-2014). BMJ Open 2019; 9(8) Pan IW, Ferguson SD, Lam S. Patient and treatment factors associated with survival among adult glioblastoma patients : a USA population-based study from 2000-2010. Journal of clinical neurosciences 2015; 22(10):1575-1581. Pierga JY, Hoang-Xuan K, et al. Treatment of malignant gliomas in the elderly. J Neurooncol 1999;43(2):187-93. Polin RS, Farko NF, et al. Functional outcomes and survival in patients with high-grade gliomas in dominant and nondominant hemispheres. J Neurosurg 2005;102(2):276-83. Richards MA. The size of the prize for earlier diagnosis of cancer in England. Br J Cancer 2009;101:125-9. Rosati A, Poliani PL, et al. Glutamine synthetase expression as a valuable marker of epilepsy and longer survival in newly diagnosed glioblastoma multiforme. NeuroOncol 2013;15(5):618-25. Rubin G, Berendsen A, Crawford SM, et al. The expanding role of primary care in cancer control. Lancet Oncol. 2015. doi:10.1016/S1470-2045(15)00205-3. Salander P, Bergenheim AT, et al. Pathways from symptoms to medical care: a descriptive study of symptom development and obstacles to early diagnosis in brain tumour patients. Family Practice 1999; 16(2):143-148. Sanai N, Polley MY, et al. An extent of resection threshold for newly diagnosed glioblastomas. J Neurosurg 2011;115(1):3-8. Schag CC et al. Karnofsky Performance Status revisisted: reliability, validity, and guidelines. J Clin Oncol 1984;2(3):187-193 Schwartz RJ, Panacek EA. Basics of research (part 7): Archival data research. Air Med J 1996;15(3):119-124. Scott SE, Penfold C, et al. ‘It was nothing that you would think was anything’: Qualitative analysis of appraisal and help seeking preceding brain cancer diagnosis. PLOS One 2019;14(3). Shirai K, Suzuki Y, et al. Influence of histological subtype on survival after combined therapy of surgery and radiation in WHO grade 3 glioma. J Radiat Res 2010; 51(5):589-94. Spena G, D;Agata F, et al. Supratentorial gliomas in eloquent areas: which parameters can predict functional outcome and extent of resection? PLoS One 2013; 8(12). Stark AM, van de Bergh J, et al. Glioblastoma: clinical characteristics, prognostic factors and survival in 492 patients. Clin Neurol Neurosurg 2012;114(7):840-5.

233
Stummer W, Reulen HJ, et al. Extent of resection and survival in glioblastoma multiforme: identification of and adjustment for bias. Neurosurgery 2008; 62(3):564-76. Stupp R, Brada M, et al. High-grade malignant glioma: ESMO clinical practice guidelines. Ann Oncol 2014; 25(3):93-101. Stupp R, Mason WP, et al. Radiotherapy plus concomitant and adjuvant temozolomide for glioblastoma. NEJM 2005;352:987-996. Talacchi A, Santini B, Savazzi S, Gerosa M (2011) Cognitive effects of tumour and surgical treatment in glioma patients. J Neurooncol 103(3):541–549 Thakkar JP, Dolecek TA, Horbinski C, Ostrom QT, Lightner DD, Barnholtz-Sloan JS, Villano JL. Epidemiologic and molecular prognostic review of glioblastoma. Cancer Epidemiology, Biomarkers and Prevention. 2014; 23:1985–1996. DOI: 10.1158/1055-9965.EPI-14-0275 Tsang DS, Khan L, et al. Survival outcomes in elderly patients with glioblastoma. Clin Oncol 2015;27(3):176-183. Tucha O, Smely C, et al. Cognitive deficits before treatment among patients with brain tumors. Neurosurgery 2000; 47(2):324-334. Van Den Bent MJ, Brandes AA, Taphoorn MJB, et al. Adjuvant procarbazine, lomustine, and vincristine chemotherapy in newly diagnosed anaplastic oligodendroglioma: long¬term follow¬up of extent of resectionTC Brain Tumor Group Study 26951. J Clin Oncol 2013; 31: 344–50. Van Meir EG, Hadjipanayis CG, et al. Exciting new advances in neuro-oncology: The avenue to a cure for malignant glioma. Ca: A Cancer Journal for Clinicians (2010); 60(3):166. Visser O, Ardanaz E, et al. Survival of adults with primary malignant brain tumours in Europe; Results of the EUROCARE-5 study. Eur J Cancer 2015; 51(15):2231-2241 Von Neubeck C, Seidlitz A, et al. Glioblastoma multiforme: emerging treatments and stratification markers beyond new drugs. Br J Radiol 2015;88(1053) Vourinen V, Hinkka S, et al. Debulking or biopsy of malignant glioma in elderly people – a randomised study. Acta Neurochir (Wien) 2003; 145(1):5-10. Walker D, Hamilton W, et al. Strategies to accelerate diagnosis of primary brain tumors at the primary-secondary care interface in children and adults. CNS Oncol 2013;2(5):447-462. Wang J, Hu G, et al. Analysis of the factors affecting the prognosis of glioma patients. Open Med (Wars) 2019;14:331-335. Weller D, Vedsted P, et al. The Aarhus statement: improving design and reporting of studies on early cancer diagnosis. Br J Cancer 2012; 106(7): 1262-1267. Wick W, Osswald M, et al. Treatment of glioblastomas in adults. Therapeutic Advances in Neurological Disorders 2018; 11: 1-13.

234
Wilson CB. Glioblastoma: the past, the present and the future. Clin Neurosurg 1992; 38:32-48. Yates JW, Chalmer B, McKegney FP. Evaluation of patients with advanced cancer using the Karnofsky performance status. Cancer 1980;45(8):2220-4. Yuile P, Dent O, et al. Survival of glioblastoma patients related to presenting symptoms, brain site and treatment variables. J Clin Neurosci 2006; 13(7):747-51.

235
Part 6
Study 4
Verbal fluency as a brief cognitive screening tool in patients with a
suspected brain tumour: a potential red flag
K Zienius, M Ozawa, W Hamilton, W Hollingworth, D Weller, Y Ben-Shlomo, R Grant, PM
Brennan
Submitted
Development of cognitive deficits due to a brain tumour may be an independent prognostic
factor for survival. However, symptoms in cognitive domain, while being common in
occurrence, may not be noticed by patients or their carers early on in the disease process until
significant impairments impact daily life activities. We have shown in Study 2 that the majority
of patients complain of several symptoms prior to diagnosis, with headache and deficits in
cognitive domain being most common. It was our intent in this explorative study to assess the
value of a short cognitive screening tool among patients with a recent diagnosis of a brain
tumour prior to surgery and the patients controls who were referred for a DACT for
investigation of headache but who subsequently did not have a brain tumour.
Background

236
Patients with brain tumours often present with non-specific symptoms. Correctly identifying
which patients to prioritise for urgent brain imaging is challenging. Brain tumours are amongst
the commonest cancer diagnosed as an emergency presentation. A verbal fluency task is a rapid
triage test affected by disorders of executive function, language. We tested whether a verbal
fluency task could support identification of patients with a brain tumour.
Methods
This proof-of-concept study examined whether a verbal fluency task can help differentiate
patients with a brain tumour from those who do not have one in patients with similar symptoms.
Two patient populations recruited, (a) patients with a known brain tumour, (b) patients with
headache who had been referred for Direct-Access Computed-Tomography (DACT) from
primary care with a suspicion of a brain tumour. Semantic and phonemic verbal fluency data
were collected prospectively.
Results
180 BT patients and 90 (DACT) patients were recruited. Semantic verbal fluency score was
significantly worse for patients with a brain tumour than those without (P<0.001), whether
comparing patients with headache, either as first symptom or not, and patients without
headache. Phonemic fluency showed a similar but weaker difference. Raw and incidence-
weighted positive and negative predictive values were calculated.
Conclusion

237
We have demonstrated the potential role of adding semantic verbal fluency task score
performance into clinical decision making to support triage patients for urgent brain imaging.
A relatively small improvement in the true positive rate in patients referred for DACT has the
potential to increase the timeliness and efficiency of diagnosis and improve patient outcomes.

238
Introduction
Timely diagnosis of a brain tumour is challenging. Over a third of patients consult their primary
care doctor on 3 or more occasions before diagnosis (Lyratzopoulos et al 2012). Brain tumours
are amongst the commonest cancer type to be diagnosed as an emergency presentation in the
UK (England H 2018), and many of these patients will have seen their primary care doctor
previously.
The first symptoms experienced by patients with a brain tumour are often non-specific and
such symptoms are more frequently associated with a benign non-tumour condition (Rubin et
al 2015). For example, headache is the commonest symptom of brain tumours in adults
(Schmidt et al 2015) , and is present in over half of patients at the time of diagnosis. Headache
also occurs in 4.4% of all primary care consultations (Latinovic et al 2006) , so is not specific
to brain tumours. Other symptoms, such as subtle memory/cognitive or behavioural changes,
may accompany headaches associated with a brain tumour, but are rarely noticed by patients
(Tucha et al 2000). Unsurprisingly, there is often a delay in patient presentation to primary
care, referral for investigation and ultimately in diagnosis. In a recent analysis of brain tumour
patients from the National Audit of Cancer Diagnosis in Primary Care (NACDPC) we found
that the longest pathway interval (time from onset of symptoms to referral to a specialist) was
for headache only (median 61 days), memory symptoms (median 62 days), and
behavioural/cognitive symptoms (median 39 days) (Ozawa et al 2018). This compares to an
average pathway interval from symptom onset to diagnosis for all tumours examined in the
English National Cancer Registry of 45 days (Swann et al 2018).

239
It is difficult to determine which patients with non-specific symptoms are most at risk of having
a brain tumour and should be prioritised for urgent imaging. Symptom-based referral
guidelines for suspected brain tumour have been developed to support decision making in
primary care, but the best performing components of these guidelines only expect to identify a
brain tumour at a frequency of approximately 3% in the referral population (Kernick et al 2008;
NICE 2015).
A new clinical tool is needed to assist health care professionals in determining which patients
with these non-specific symptoms are most at risk of having a brain tumour and should be
prioritised for urgent brain imaging.
A verbal fluency task (Ettenhofer et al 2006) is a rapid screening test that is affected by
disorders that affect executive function, language and processing speed. The task is frequently
included in comprehensive neuro-cognitive batteries for patients with brain tumours (Taphoorn
et al 2004; Wfel et al 2011; Armstrong et al 2013)). However, unlike a formal neuro-cognitive
assessment that is time consuming and requires specialist training and knowledge to administer
and interpret, the verbal fluency test could be quickly and easily administered in primary care.
The test has been previously demonstrated to be predictive of lack of capacity to give consent
to surgery by brain tumour patients (Kerrigan et al 2014).
The aim of this “proof of concept” study was to examine whether a verbal fluency task can
help differentiate patients with brain tumours from those who do not have a brain tumour where
both patient groups have similar symptoms.

240
Methods:
Participants:
We included two patient populations, (a) patients with a known brain tumour who presented
with both headache and non-headache symptoms, and (b) patients with headache who had been
referred from primary care with a suspicion of a brain tumour. The study was performed at the
regional clinical neurosciences centre, Western General Hospital, Edinburgh. The control data
were collected as part of an approved quality improvement project that was auditing the Direct
Access Computer Tomography (DACT) pathway. All patients gave verbal consent as required.
The tumour patients were all aged over 16 years attending assessment for surgical treatment of
a newly diagnosed brain tumour, based on radiographic appearances on gadolinium enhanced
magnetic resonance imaging (MRI), between 19 August 2016 and 14 February 2018. All
patients with a new radiological diagnosis of a brain tumour in South East Scotland are
discussed at our regional multidisciplinary meeting. Only the most profoundly unwell patients
are not offered either biopsy or debulking surgery, so this sample is representative of the
referred population who do have a brain tumour. Assessments were performed at the pre-
operative outpatient visit. Patients with profound dysphasia or aphasia were excluded from
this study at a screening phase, because they could not understand or complete assessments.
The inclusion criteria is depicted in Figure 4.1. Final tumour diagnosis was confirmed by
histopathology.
The comparator group were patients aged over 16 years with headache, with or without other
symptoms (e.g. cognitive, behavioural or personality change), referred from primary care for

241
direct access computed tomography (DACT) between 3 May 2017 and 9 February 2018 whose
final diagnosis excluded a brain tumour. We employed a convenience sampling of patients with
a 1:2 ratio of non-tumour to tumour patients. The DACT pathway has been available to primary
care doctors in Lothian since 1999 and gives access to brain imaging to exclude a significant
intracranial pathology where the primary care doctor judges that waiting for a specialist referral
will take too long, but immediate hospital admission via the emergency department is not
necessary. Since 2016 the referral proforma has included a requirement to assess verbal
fluency.
Procedures:
All testing was administered by a clinical research fellow (KZ). This was conducted prior to
completion of a DACT in the control group. For patients with a brain tumour, assessment was
performed at the pre-operative outpatient visit. The test was conducted in the English language
and participants were required to be fluent English language speakers. Semantic (category)
(Benton 1968) verbal fluency was assessed by asking each participant to name as many
different animals as they could within 60 seconds. All responses were recorded verbatim in the
order in which they were generated. Repetitions were discounted. Phonemic verbal
(letter)(Newcombe 1969) fluency was then assessed by asking patients to generate as many
different words beginning with a letter “P”, excluding proper names (city, country, person) and
repetitions of the same word with different endings (e.g. put, putting). Three scores were
calculated for each fluency task: 1) the total number of correct words generated, 2) the mean
cluster size (see appendix 1) of each group of animals e.g. domestic animals or zoo animals,
and 3) the raw number of switches between clusters, as originally suggested by Troyer (1997).

242
Mean cluster and switching are qualitative aspects of fluency tests that are thought to specify
contribution of executive and semantic processes during task production.(Mayr 2002)
Other covariates
We recorded age and gender and used the Scottish Index of Multiple Deprivation score (SIMD)
as an ecological marker of socioeconomic status. This is an official measure for deprivation
using routine census data developed by Scottish Government and based on current postcode of
residence. These were grouped into quintiles to derive an ordinal variable with 1 being the most
deprived to 5 being the least deprived. Tumour characteristics including lobe, laterality and
size were derived from radiological reports accessible via electronic patient records (EPR).
Histological diagnosis was based on formal pathology report.
Statistical analysis and sub-groups:
Baseline characteristics of tumour and non-tumour patient groups were compared using t-test
and chi-square tests, as appropriate. Group differences on each verbal fluency measure were
analysed using the ANCOVA test, with age group (16-59, 60-79, ≥80 years) and gender as
covariates. Normality was assessed by visual inspection of histograms of characteristics of
interest. Pearson correlation ceofficients were used to look at the linear association between
total score and qualitative fluency measures.
We decided that the most appropriate clinical comparison was to (a) compare tumour patients
with a history of headache against DACT patients (all of whom had headache) for our primary

243
analysis. For secondary comparisons we also examined tumour patients (b) with headache as
their first symptom, (c) tumour patients without headaches and (d) all tumour patients versus
the DACT patient group.
We decided to look at good performance, i.e. a high verbal fluency score, as a positive test
which we assumed would help discriminate controls from brain tumour cases. Clinically, a
positive test combined with the clinician’s prior probability of a brain tumour could be used to
avoid unnecessary immediate referral for neuroimaging. We used a receiver operating
characteristic (ROC) curve and the area under the curve (AUC) to determine the optimal
balance of sensitivity versus specificity when discriminating tumour patients from non-tumour
patients, using different cut-points of performance on the VF tasks. The raw positive predictive
value (PPV) and negative predictive value (NPV), positive likelihood ratio and negative
likelihood ratio were than manually calculated. We then repeated the PPV and NPV calculation
adjusting for disease incidence in the population. In addition, a multivariable logistic regression
model, with adjustment for relevant covariates such as age group, gender and deprivation score,
with a fluency cut-off value as a dummy variable and group (brain tumour or DACT) as a
binary outcome variable, was used to calculate the diagnostic odds ratio, and corresponding
95% confidence intervals (CI). All analyses were performed with SPSS version 21.

244
Results:
180 tumour patients and 90 DACT patients were recruited. Clinical characteristics of the two
patient groups, and of the tumours, are detailed in Table 6.1. Ninety-one (50.5%) of the tumour
patients were from Lothian. All DACT patients were from Lothian. Six patients were excluded
at a screening stage; five tumour patients because of dysphasia or aphasia and one DACT
patient because of hearing impairment.
Table 6.1. Tumour and DACT patient baseline characteristics Brain tumour patients N=180 (%)
DACT patients N=90 (%)
p – value
Age in years, M (SD) 56.8 (13.5) 53.6 (19.5) 0.16 Gender (N, %)
Male 86 (48.0) 31 (34.0) 0.037 Female 94 (52.0) 59 (66.0) Social deprivation index (N, %)
1 28 (15.7) 11 (12.2) 0.8 2 43 (24.2) 26 (28.9) 3 32 (18.0) 15 (16.7) 4 35 (19.7) 15 (16.7) 5 40 (22.5) 23 (25.6) KPS, median (range) 90 (50-100) N.A. N.A. Tumour histology, N (%) N.A. N.A. High grade glioma (WHO III-IV) 77 (42.8)
Meningioma 42 (23.3)
Cerebral metastasis 28 (15.6)
Low grade glioma (WHO I-II) 14 (7.8)
CNS Lymphoma 5 (2.8)
Other 14 (7.8)
Tumour lobe, N (%) N.A. N.A. Frontal 68 (37.8)
Temporal 34 (18.9)
Parietal 18 (10.0)
Occipital 13 (7.2)
Cerebellar 16 (8.9)
Multiple 15 (8.3)
Other 16 (8.9)
Tumour laterality, N (%) N.A. N.A. Left 80 (44.4)
Right 64 (35.6)

245
Bilateral 22 (12.2)
Midline 14 (7.8)
Maximum size T1 (axial), mean (mm) (SD)
41.1 (15.1) N.A. N.A.
Patients with high grade glioma (HGG) (e.g. glioblastoma multiforme (GBM)) comprised the
highest proportion (42.8%), followed by meningioma (23.3%). There were a higher proportion
of women in the DACT group than the tumour group (66% versus 52% respectively). There
was no significant difference in the proportion of patients in each social deprivation quintile.
Most tumours were in the frontal lobe (37.8%) and were left sided (44.4%). Tumour size, based
on axial measurement on T1 weighted imaging, ranged from 6 to 80 mm, (mean 41.1mm).
Patients with HGG had the largest tumours on average at diagnosis (44.3mm).
Verbal fluency in patients with a history of headache
102 patients with tumour and 90 DACT patients were included in this first analysis, comparing
tumour patients with a history of headache against DACT patients (all of whom had headache).
Tumour patients had reduced total score and cluster score with semantic (p<0.001) and
phonemic (p=0.001, p=0.018) verbal fluency (Table 6.2). The standardised difference
demonstrated a relatively large difference for semantic total score between cohorts (-0.97) and
a medium effect size for phonemic total score (-0.47). By contrast, the results for switching
were very similar between the groups.

246
Table 6.2: Adjusted mean scores* on semantic and phonemic verbal fluency measures for cases with a history of headache and controls
Patients
(N=102)
Controls
(N=90)
Mean diff (95% CI) p value Effect Size
(Cohen’s d)
Verbal fluency, mean (SD)
Animals
Total 13.0 (5.0) 17.8 (5.0) -4.9 (-6.32,-3.42) <0.001 -0.97
Mean cluster 1.1 (0.98) 1.7 (0.95) -0.6 (-0.9,-0.3) <0.001 -0.62
Switch 5.9 (3.3) 6.9 (3.3) -0.9 (-1.9,0.4) 0.06 -0.30
Letter P
Total 8.8 (4.75) 11.0 (4.74) -2.2 (-3.6,-0.86) 0.001 -0.47
Mean cluster 0.29 (0.3) 0.4 (0.38) -0.1 (-0.2,-0.02) 0.018 -0.32
Switch 6.5 (3.9) 7.7 (3.9) -1.15 (-2.3,-0.0) 0.05 -0.31
*Adjusted to age and gender
When tumour patients were restricted to those with headache as their first symptom (56 cases)
(table 6.3), the results for total and mean cluster score with semantic fluency were similar
(p<0.001, p=0.001). The total score for phonemic fluency was still significant (p=0.037), but
the mean cluster size for phonemic fluency was consistent with chance (0.24). All the DACT
patients had headache as their primary symptom.
Table 6.3: Adjusted mean scores* on semantic and phonemic verbal fluency measures for cases with headache as the first symptom and controls
Patients
(N=56)
Controls
(N=90)
Mean diff (95% CI) p value Effect Size
(Cohen’s d)
Verbal fluency, mean (SD)
Animals
Total 13.6 (5.1) 17.9 (5.0) -4.2 (-5.9,-2.5) <0.001 -0.85
Mean cluster 1.1 (1.0) 1.7 (0.95) -0.6 (-0.9,-0.2) 0.001 -0.62
Switch 6.3 (3.4) 6.9 (3.3) -0.6 (0.6) 0.34 -0.18
Letter P
Total 9.3 (4.7) 10.9 (4.7) -1.7 (-3.3,-0.1) 0.037 -0.34
Mean cluster 0.3 (0.37) 0.4 (0.36) -0.1 (-0.2,0.5) 0.24 -0.27
Switch 6.7 (4.0) 7.7 (3.9) -1.0 (-2.4,0.4) 0.16 -0.25
*Adjusted to age and gender

247
When we undertook a secondary analysis for tumour patients without headache (78 cases),
compared to DACT patients (all of whom had headache) we found the differences to be very
similar or if anything stronger (Table 6.4).
Table 6.4: Adjusted mean scores* on semantic and phonemic verbal fluency measures for tumour patients without headache and DACT patients
Tumour Patients
(N=78)
DACT patients
(N=90)
Mean diff (95% CI) p value Effect Size
(Cohen’s d)
Verbal fluency,
mean (SD)
Animals
Total 12.2 (5.1) 17.6 (5.1) -5.4 (-6.9,-3.8) <0.001 -1.10
Mean cluster 1.1 (0.88) 1.7 (0.94) -0.5 (-0.8,-0.21) 0.001 -0.66
Switch 5.2 (3.18) 6.9 (3.1) -1.7 (-2.6,-0.7) 0.001 -0.54
Letter P
Total 7.9 (4.4) 10.9 (4.5) -3.0 (-4.4, -1.7) <0.001 -0.67
Mean cluster 0.3 (0.44) 0.4 (0.47) -0.1 (-0.3,0.02) 0.09 -0.24
Switch 6.2 (3.8) 7.6 (3.8) -1.5 (-2.7,-0.3) 0.014 -0.37
*Adjusted to age and gender
As expected, the same pattern of results was found when we used all the cases (180) regardless
of whether they had experienced a headache or not (table 6.5).

248
Table 6.5: Adjusted mean scores* on semantic and phonemic verbal fluency measures for all tumour patients and DACT patients.
Tumour
Patients
(N=180)
DACT
patients
(N=90)
Mean diff (95% CI) p value Effect Size
(Cohen’s d)
Verbal fluency, mean (SE)
Animals
Total 12.62 (5.2) 17.7 (5.2) -5.1 (-6.32, - 3.77) <0.001 -0.98
Mean cluster 1.11 (0.94) 1.67 (0.85) -0.55 (-0.79, -0.32) <0.001 -0.62
Switch 5.6 (3.22) 6.9 (3.22) -1.29 (-2.1, - 0.46) 0.002 -0.4
Letter P
Total 8.45 (4.6) 10.99 (4.6) -2.53 (-3.7, -1.35) <0.001 -0.55
Mean cluster 0.29 (0.4) 0.4 (0.38) -0.11 (-0.21, -0.01) 0.025 -0.28
Switch 6.38 (4.0) 7.68 (3.8) -1.29 (-2.3, -0.29) 0.012 -0.33
*Adjusted to age and gender
Verbal fluency comparison between tumour and non-tumour patients
We sought to identify whether a threshold fluency task score might discriminate brain tumour
patients from patients without brain tumours. Semantic verbal fluency total score was analysed,
because this was more discriminating than phonemic verbal fluency. We performed visual
inspection of the frequency distribution of group scores on each verbal fluency measure.
Given that brain tumour patients do not just present with headache, we used the receiver
operating characteristic (ROC) curve for the cohort of all 180 tumour patients compared to the
DACT patients. The area under the curve (AUC) was 0.75, (p<0.001) indicating the value of
using verbal fluency as a diagnostic test. We chose a threshold score of 14 or more animals in
1 minute as this looked like the inflection point in the ROC though other values could be used
depending on the relative importance of false positives versus false negatives (Figure 1,
Supplementary Table 2). This threshold had the following diagnostic utilities for differentiating
non tumour from brain tumour subjects: 84.4% sensitivity, 54.5% specificity, 48.1% positive

249
predictive value (PPV), 87.5% negative predictive value (NPV), positive likelihood ratio 1.85
and negative likelihood ratio 0.29. The PPV and NPV reported above are misleading as they
reflect the sampling strategy that was used in this study (i.e. 1:2 ratio of non-tumour to tumour)
rather than what would be expected in primary care. A previous UK general practice database
found that amongst patients aged over 50 years, the incidence of a malignant brain tumour
amongst new headache presentations was 28 per 10,000 patients9 or a prior probability of
0.28% (the converse is that probability that the patient with a headache doesn’t have a brain
tumour is 99.7%). Applying these risks to the marginal totals and using the same sensitivity
and specificity as above, we would now get a revised PPV for a positive test of 99.8% and a
NPV of 0.97%. This shows that a positive test slightly increases the likelihood that this is not
a brain tumour but a negative test is of more concern. Despite the low absolute risk of having
a tumour, a poor performance on the fluency task has more than tripled the probability in
relative terms.
Multivariable logistic regression, adjusting for age group, gender and deprivation quintile
score, found that patients scoring at or above the cut-point of ≥14 had a nearly 8 times higher
odds of not having a brain tumour (adjusted OR 7.84, 95%CI 3.89 15.8, p<0.001)
(Supplementary Table 3). This association was even stronger when we repeated the analysis
restricted to only the 102 tumour patients with a history of headache (adjusted OR 9.33, 95%
CI 4.2, 20.9, p <0.001).
Verbal Fluency associations with brain tumour grade, site and size.

250
The reduction in verbal fluency task performance was most marked in patients with high grade
gliomas (HGG) (mean total 10.8), cerebral lymphoma (mean total 10.9) and cerebral
metastases (mean total 12.3), the three most malignant brain tumours (supplementary table
6.3). Patients with HGG had significantly lower total semantic scores compared to meningioma
(mean total 14.3) (mean difference -3.44, p=0.018), and ‘other’ intracranial tumours (mean
total 16.8) (mean difference -5.95, p=0.002).
A frontal lobe tumour location, in contrast to a non-frontal location was associated with
significantly lower fluency performance total scores for both semantic (mean = 11.6 vs 13.3,
p=0.04) and phonemic (mean = 7.3 vs mean = 9.2, p=0.007) tasks. Tumours in the left
hemisphere had a larger effect on phonemic than semantic total fluency scores (left vs right:
mean difference -2.3, p=0.004 and -1.9, p=0.04, respectively). Increasing tumour size
correlated with lower semantic total (r = -0.22, p = 0.003) and cluster (r = -0.22, p = 0.003)
score. There was no size correlation for any measure on phonemic fluency.

251
Discussion
This study is the first to compare performance of a verbal fluency task between a large brain
tumour patient population and a comparator population of patients with headache referred for
direct access brain imaging from primary care to exclude significant intracranial pathology.
We have demonstrated that verbal fluency tasks, both semantic (animal) and phonemic (letter
“P”), differed between the two patient populations. However, the effect size for semantic total
score was nearly twice that of letter P total score suggesting that one should only use the former.
In patients where the primary care doctor has a low suspicion of a significant intracranial
pathology, and the patient has a high VF score, there is more reassurance that a period of further
clinical observation may be justified. However a poor performance, in the absence of another
cause, is of more concern to the primary care doctor and may lower their threshold for urgent
imaging.
Our data demonstrate that the semantic verbal fluency test is more discriminatory than
phonemic fluency. We found no added value for the use of switching and cluster size than
using the simple total count. Semantic fluency task is generally considered easier to perform
and people are able to generate more responses in a minute, because of its ecological validity,
or daily familiarity (Woods et al 2016). Animal fluency is also less influenced by level of
education(Diaz et al 2004; Gladsjo et al 1999), so performance may be more easily interpreted
by a non-specialist. A tendency for worse performance on semantic compared to phonemic
fluency is also reported in Alzheimer’s disease, although the effect size in the latter, compared
to controls, is greater (Canning et al 2004) . This lack of specificity between brain tumours and
dementia in less problematic for the patient, as clinicians often order brain imaging in patients
with suspected dementia though it would be less urgent.

252
Cognitive symptoms in patients with a brain tumour may be subtle and noticed by patients
(Giovagnoli 2012), though relatives may perceive these changes several months before
diagnosis (Salander et al 1999). Self-awareness of cognition can be influenced by cognitive
problems affecting an ability to retain and elaborate such information (Cooke et al 2007). A
lack of insight into the nature or urgency of symptoms may prevent a patient from seeking help
early (Salander et al 1999) . Semantic verbal fluency as a cognitive test may therefore be
particularly useful in patients presenting with headache and reports of memory or cognitive
changes. This is consistent with our previous finding that patients with headache, behavioural
and memory changes are the most likely to be delayed in receiving a brain tumour diagnosis
(Ozawa et al 2018).
The majority of patients presenting to primary care with non-specific symptoms such as
headache without neurological signs will not have a significant intracranial pathology. Only 1-
3% of current brain images performed through a DACT route identify a brain tumour and many
of these are incidental findings (Benamore et al 2005). Taken along with a good clinical history,
the semantic verbal fluency task may therefore be helpful in the primary care consultation to
quickly test cognition, for example in a patient presenting with a concerning new onset
headache. A combination of worrying symptoms and poor verbal fluency score could support
decision making, as to whether to request urgent brain imaging. Many patients with a low
verbal fluency will still not have a brain tumour (false positives), but our expectation is that the
positive predictive value of the test would be an improvement over the current situation where
only 1-3% of DACT find tumour and where most tumours are diagnosed in the Emergency
Department. Given the large number of brain images performed per year, a relatively modest

253
reduction in the proportion of false positive referrals for DACT could have a major efficiency
and cost saving. More importantly perhaps, in patients with headache, where there is a low
index of suspicion for tumour, a good performance on verbal fluency task may provide some
reassurance and support a decision for continued observation.
We regard this a proof of concept study rather than a definitive diagnostic test accuracy study
and there were several limitations. The tumour patients were assessed after their diagnosis had
been made, so their performance may not be the same as what it would have been had they
been tested when they first presented in primary care. The DACT patients in our study were
referred for brain imaging to exclude a significant intracranial pathology or to provide
reassurance. The DACT route is biased towards patients with less worrying symptoms than
those who would have been sent directly to the emergency department.
We compared the test performance in tumour patients without headache against all tumour
patients and our observations appear to be generalizable. Our ‘control’ population had
headache symptoms and were of enough concern to their primary care doctor to warrant
imaging. This contrasts with most previous studies that have compared neurocognitive
performance in brain tumour patients with healthy controls (Boele et al 2014; Hendrix et al
2017). Our study design better reflects the patient population seen within primary care where
headache is a frequent and non-specific symptom and therefore reduces the likelihood of
“spectrum bias”.
All the DACT patients lived in Lothian, whilst some of the tumour patients came from outside
the Lothian area, but we don’t believe that these geographical differences would have biased
the performance on the fluency task. The importance of education on verbal fluency

254
performance is still debated, with some studies (Tombaugh 1999) showing significant effect,
whilst others failing to demonstrate it (Troyer et al 1997; Gocer et al 2006) . However, our
ecological analysis of area deprivation did not suggest any major differences by this proxy
measure of socioeconomic status.
Conclusion
Diagnosis of a brain tumour is challenging and the decision as to whether a patient is at risk of
a brain tumour requires careful clinical assessment. We have demonstrated the potential role
of adding semantic verbal fluency task score performance into clinical decision making around
referral for urgent brain imaging. Further research in this area will be required and the optimal
cut-off point for the verbal fluency score will depend on a more thorough analysis of the costs
and benefits of balancing sensitivity and specificity. A prospective diagnostic test accuracy
study in a patient group at risk for a brain tumour diagnosis would provide stronger evidence
as to the utility of the verbal fluency test over and above clinical signs, symptoms and clinicians
prior probability. The impact of the test should be evaluated in terms of time to diagnosis, and
how this translates into clinical care and patient outcomes before we can adopt this test into
clinical guidelines.

255
Figure Captions
Figure 6.1. Receiver Operating Curve of sematic verbal fluency scores from total tumour
cohort. The arrow indicates the score of 14.
Supplementary Table 6.1. Sensitivity and Specificity of cut off points on receiver
operating curve for semantic verbal fluency.
Positive if greater than or equal
to*
Sensitivity Specificity (%)
1 100 2.8
2 100 4.4
3.0 100 5.0
4.0 100 6.1
5.0 100 7.8

256
6.0 100 10.6
7.0 100 15.0
8.0 97.8 20.0
9.0 97.8 26.1
10.0 95.6 29.4
11.0 92.2 32.8
12.0 88.9 37.2
13.0 85.6 45.6
14.0 84.4 54.4
15.0 74.4 62.2
16.0 66.7 67.2
17.0 57.8 73.9
18.0 48.9 79.4
19.0 44.4 85.6
20.0 34.4 88.9
21.0 31.1 91.7
22.0 22.2 95.6

257
Supplementary Table 6.2. Logistic regression for association between age group, gender or area
deprivation score and semantic verbal fluency in the cohort of 180 tumour patients. 95% confidence
intervals indicated. Odds ratio of not having a brain tumour.
Variable Odds Ratio 95% confidence Interval Semantic verbal fluency value
0-13 Reference ≥14 7.84 3.9-15.8 Age 16-59 Reference 60-79 0.9 0.5-1.66 80+ 6.68 1.3-33.5 Gender Male Reference Female 1.87 1.04-3.35 Deprivation score 1 Reference 2 1.2 0.5-3.1 3 1.3 0.5-3.7 4 0.85 0.3-2.4 5 1.16 0.44-3.1

258
Supplementary table 6.3: Adjusted scores* on verbal fluency parameters for different tumour variables
*Adjusted to age and gender
Tumour sub-groups Verbal fluency (mean, SD) Semantic Phonemic
Tumour histology Total p-value Mean cluster p-value
Switch p-value Total p-value Mean cluster
p-value Switch p-value
HGG 10.8 (5.4) 0.001 1.04 (0.7) 0.068 4.8 (3.2) 0.039 6.9 (4.7) 0.011 0.25 (0.44) 0.88 5.0 (4.0) 0.006 Cerebral metastasis 12.3 (5.2) 1.17 (0.7) 5.6 (3.1) 8.8 (4.6) 0.29 (0.42) 6.9 (3.9) Meningioma 14.3 (5.2) 1.15 (0.6) 6.5 (3.2) 9.7 (4.5) 0.35 (0.39) 7.4 (4.0) LGG 14.7 (5.2) 1.05 (0.7) 6.9 (3.0) 10.5 (4.5) 0.28 (0.37) 8 (4.11) CNS Lymphoma 10.9 (5.4) 0.63 (0.67) 5.6 (3.1) 9.2 (4.7) 0.22 (0.4) 8.9 (4.0) Other 16.8 (5.2) 1.64 (0.74) 6.5 (3.0) 10 (4.5) 0.31 (0.37) 7.7 (4.1) Tumour lobe
Frontal 11.6 (5.4) 0.04 1.05 (0.74) 0.3 5.2 (3.1) 0.1 7.3 (4.6) 0.007 0.28 (0.41) 0.94 5.5 (4.0) 0.017 Non-frontal 13.3 (5.3) 1.16 (0.74) 5.9 (3.18) 9.2 (4.65) 0.29 (0.42) 7.0 (4.0) Tumour laterality
Left 12 (5.5) 0.04 1.1 (0.8) 0.6 5.3 (3.1) 0.06 7.4 (4.7) 0.004 0.22 (0.45) 0.08 5.9 (4.2) 0.054 Right 13.9 (5.5) 1.16 (0.72) 6.3 (3.12) 9.7 (4.72) 0.35 (0.4) 7.2 (4.2) MLS
<=10 mm 12.86 (5.5) 0.036 1.14 (0.73) 0.6 5.7 (3.2) 0.13 8.7 (4.7) 0.03 0.3 (0.37) 0.29 6.62 (4.0) 0.04 >10 mm 10.1 (5.5) 1.05 (0.73) 4.5 (3.2) 6.3 (4.6) 0.2 (0.4) 4.69 (4.1)


260
References:
Armstrong TS, Wefel JS, Wang M, et al. Net clinical benefit analysis of Radiation Therapy Oncology Group 0525: A phase III trial comparing conventional adjuvant temozolomide with dose-intensive temozolomide in patients with newly diagnosed glioblastoma. In: Journal of Clinical Oncology. Vol ; 2013. doi:10.1200/JCO.2013.49.6067. Benamore RE, Wright D, Britton I. Is primary care access to CT brain examinations effective? Clin Radiol. 2005. doi:10.1016/j.crad.2005.05.010. Benton AL. Differential behavioral effects in frontal lobe disease. Neuropsychologia. 1968. doi:10.1016/0028-3932(68)90038-9. Boele FW, Zant M, Heine ECE, et al. The association between cognitive functioning and health-related quality of life in low-grade glioma patients. Neuro-Oncology Pract. 2014. doi:10.1093/nop/npu007. Canning SJD, Leach L, Stuss D, Ngo L, Black SE. Diagnostic utility of abbreviated fluency measures in Alzheimer disease and vascular dementia. Neurology. 2004. doi:10.1212/WNL.62.4.556. Cooke MA, Peters ER, Greenwood KE, Fisher PL, Kumari V, Kuipers E. Insight in psychosis: influence of cognitive ability and self-esteem. Br J Psychiatry. 2007;191(03):234-237. doi:10.1192/bjp.bp.106.024653. Diaz M, Sailor K, Cheung D, Kuslansky G. Category size effects in semantic and letter fluency in Alzheimer’s patients. Brain Lang. 2004. doi:10.1016/S0093-934X(03)00307-9. England PH. Routes to Diagnosis 2006-2016 year breakdown. Public Heal Engl. 2018. Ettenhofer ML, Hambrick DZ, Abeles N. Reliability and stability of executive functioning in older adults. Neuropsychology. 2006. doi:10.1037/0894-4105.20.5.607. Giovagnoli AR. Investigation of cognitive impairments in people with brain tumors. J Neurooncol. 2012;108(2):277-283. doi:10.1007/s11060-012-0815-6. Gladsjo JA, Schuman CC, Evans JD, Peavy GM, Miller SW, Heaton RK. Norms for letter and category fluency: Demographic corrections for age, education, and ethnicity. Assessment. 1999. doi:10.1177/107319119900600204. Gocer March E, Pattison P. Semantic Verbal Fluency in Alzheimer’s Disease: Approaches beyond the Traditional Scoring System. J Clin Exp Neuropsychol. 2006;28(4):549-566. doi:10.1080/13803390590949502. Hendrix P, Hans E, Griessenauer CJ, Simgen A, Oertel J, Karbach J. Neurocognitive status in patients with newly-diagnosed brain tumors in good neurological condition: The impact of tumor type, volume, and location. Clin Neurol Neurosurg. 2017. doi:10.1016/j.clineuro.2017.03.009.

261
Kernick DP, Ahmed F, Bahra A, et al. Imaging patients with suspected brain tumour: Guidance for primary care. Br J Gen Pract. 2008. doi:10.3399/bjgp08X376203. Kerrigan S, Erridge S, Liaquat I, Graham C, Grant R. Mental incapacity in patients undergoing neuro-oncologic treatment: A cross-sectional study. Neurology. 2014. doi:10.1212/WNL.0000000000000671. Latinovic R, Gulliford M, Ridsdale L. Headache and migraine in primary care: Consultation, prescription, and referral rates in a large population. J Neurol Neurosurg Psychiatry. 2006. doi:10.1136/jnnp.2005.073221. Lyratzopoulos G, Neal RD, Barbiere JM, Rubin GP, Abel GA, Schlesinger M. Variation in number of general practitioner consultations before hospital referral for cancer: findings from the 2010 National Cancer Patient Experience Survey in England. Lancet Oncol. 2012;13(4):353-365. doi:10.1016/S1470-2045(12)70041-4. Mayr U. On the dissociation between clustering and switching in verbal fluency: Comment on Troyer, Moscovitch, Winocur, Alexander and Stuss. Neuropsychologia. 2002. doi:10.1016/S0028-3932(01)00132-4. Newcombe F. Missile Wounds of the Brain: Study of Psychological Deficits (Neurological Monograph) by Freda Newcombe (1969-12-06): Amazon.Co.Uk: Books.; 1969. https://www.amazon.co.uk/Missile-Wounds-Brain-Psychological-Neurological/dp/B01HCAALJA. Accessed December 11, 2018. NICE. Suspected cancer: recognition and referral (NG12). 2015. https://www.nice.org.uk/guidance/ng12/chapter/1-Recommendations-organised-by-site-of-cancer#brain-and-central-nervous-system-cancers. Ozawa M, Brennan PM, Zienius K, et al. Symptoms in primary care with time to diagnosis of brain tumours. Fam Pract. 2018;35(5):551-558. doi:10.1093/fampra/cmx139. Rubin G, Berendsen A, Crawford SM, et al. The expanding role of primary care in cancer control. Lancet Oncol. 2015. doi:10.1016/S1470-2045(15)00205-3. Salander P, Bergenheim AT, Hamberg K, Henriksson R. Pathways from symptoms to medical care: a descriptive study of symptom development and obstacles to early diagnosis in brain tumour patients. Fam Pract. 1999;16(2):143-148. doi:10.1093/fampra/16.2.143. Schmidt-Hansen M, Berendse S, Hamilton W. Symptomatic diagnosis of cancer of the brain and central nervous system in primary care: a systematic review. Fam Pract. 2015;32(6):618-623. doi:10.1093/fampra/cmv075. Swann R, McPhail S, Shand B, et al. Diagnosing cancer in primary care: Results from the National Cancer Diagnosis Audit. Br J Gen Pract. 2018. doi:10.3399/bjgp17X694169. Taphoorn MJ, Klein M. Cognitive deficits in adult patients with brain tumours. Lancet Neurol. 2004;3(3):159-168. doi:10.1016/S1474-4422(04)00680-5.

262
Tombaugh T. Normative Data Stratified by Age and Education for Two Measures of Verbal Fluency FAS and Animal Naming. Arch Clin Neuropsychol. 1999;14(2):167-177. doi:10.1016/S0887-6177(97)00095-4. Troyer AK, Moscovitch M, Winocur G. Clustering and switching as two components of verbal fluency: Evidence from younger and older healthy adults. Neuropsychology. 1997. doi:10.1037/0894-4105.11.1.138. Troyer, A. K., & Moscovitch, M. Cognitive processes of verbal fluency tasks. In A. M. Poreh (Ed.), Studies on neuropsychology, neurology and cognition. The quantified process approach to neuropsychological assessment Philadelphia, PA, US: Taylor & Francis . 2006: 143-160 Tucha O, Smely C, Preier M, Lange KW. Cognitive deficits before treatment among patients with brain tumors . Neurosurg . 2000;47(2):324. Wefel JS, Cloughesy T, Zazzali JL, et al. Neurocognitive function in patients with recurrent glioblastoma treated with bevacizumab. Neuro Oncol. 2011. doi:10.1093/neuonc/nor024. Woods DL, Wyma JM, Herron TJ, Yund EW. Computerized Analysis of Verbal Fluency: Normative Data and the Effects of Repeated Testing, Simulated Malingering, and Traumatic Brain Injury. Chao L, ed. PLoS One. 2016;11(12):e0166439. doi:10.1371/journal.pone.0166439.

263
Part 7
General discussion of main findings
The thesis focused on four key aspects in the diagnosis, namely 1) assessing the usefulness of
existing primary care referral guidelines for an urgent brain imaging; 2) describing detailed
clinical and diagnostic pathway of adult patients prior to a diagnosis of a brain tumour; 3)
assessing an association between presenting symptoms and diagnostic timeliness and their
impact on clinical care and survival in patients with the most malignant brain tumour and
lastly 4) assessing the value of a brief cognitive assessment in patients with a brain tumour as
a potential red-flag symptom.
Timely diagnosis of a brain tumour is an important aspect of health care provision. Generally,
people diagnosed earlier with symptomatic cancer are thought to have a higher chance of
longer survival, but importantly also experience better care, lower treatment morbidity and
improved quality of life than those diagnosed late (Neal et al 2015). There are no known risk
factors for brain tumours in the majority of patients and most brain tumours are diagnosed
following symptomatic presentation. The nature of presenting symptoms is critical to the
speed of diagnosis. Understanding how symptoms are associated with the length of
diagnostic time and its prognostic effect is a priority for early diagnosis research which could
inform strategies to achieve an earlier detection of symptomatic brain cancer.

264
While patients with alarming ‘high-risk’ symptoms such as focal weakness, seizure or
diplopia will get diagnosis fast in most cases, it is the patients with more common and lower-
risk symptoms such as headache, cognitive and personality changes who are most
diagnostically challenging and consequently will take longest to diagnosis. General
Practitioners are the first point of contact for the majority of patients. The rarity of brain
tumours in the general population and the high prevalence of headache and other non-specific
symptoms means that early diagnosis is complex. Increased awareness of symptoms and a
low threshold of suspicion by the GP may probably be the most important factors for earlier
detection of brain tumours. Since the publication of Referral guidelines for suspected cancer
in 2000 by the UK Department of Health (DoH), patients were guaranteed to be seen by a
specialist within 2 weeks of the date of GP referral. However, only 1% of adult brain tumours
are diagnosed through this specialist pathway in the UK and more patients (about 35%) are
diagnosed through routine secondary care out-patients referral pathways. While, in fact, the
majority of patients (two thirds) present to emergency department. Indications for an urgent
referral are specified by these guidelines as discussed previously, however in all likelihood
the symptoms in the majority of these brain tumour patients may not be sufficient enough to
prompt this urgent referral request, at least in initial stages of clinical journey. Indeed, the
non-specificity of presenting symptoms that patients visit their GPs were one of the most
commonly cited barriers to early brain tumour diagnosis in our informal discussion with
Lothian GPs. The availability of direct-access CT service was the second most commonly
cited reason.
In the study 1, we investigated the predictive ability of current referral guidelines (Kernick
and NICE 2005) to identify patients with a brain tumour when applied to a population-based
patient group referred for direct access CT of the head from primary care. We wanted to

265
determine if there was scope for current referral guidelines to be optimised to improve
identification of patients in primary care most likely to have a brain tumour based on their
symptoms, in order to expedite urgent brain imaging. We showed that referrals with
“symptoms related to the CNS” achieved positive predictive value (PPV) of 3%. Nearly 80%
of patients whose CT revealed a brain tumour had ‘symptoms related to the CNS’ as
specified by Kernick and NICE 2005 guidelines. Based on this, we concluded that the
existing guidelines do provide some assistance to the primary care doctor where presentation
is for concerning symptoms of the CNS. Nevertheless, we also identified a relatively large
proportion of referrals which were made for a simple headache (approximately 27% of all
referrals) but with few brain tumours. As expected, PPV was low. Referral for headache is
often the outcome of patient pressure due to worries that this may be due to a brain tumour
(Morgan et al 2007). This obviously raises a number of important questions: for symptoms
with low PPV, is referral for cranial imaging considered an effective use of the public
service, in other words does it run a risk of system over-use? Which in turn can lead to
increased waiting times for scans, for reports, as well as increased findings of incidentalomas
and as a result increased medical insurance quotes and levels of patient’s anxieties and
distress. The identification of incidental pathology, including an incidental brain tumour, its
clinical relevance and the associated anxieties that can lead to is well recognised and can be
significant (Kernick & Williams, 2011).
Some reassurance comes from previous empirical research that reported on the positive
impact on secondary care referrals when GPs have access to cranial imaging. Simpson and
colleagues (2010) analysed 4404 referrals for chronic headache in Glasgow, Scotland. While
abnormal results were reported in about 10% of scans, only 1.4% were deemed to be
causative of patients’ symptoms. GPs indicated that direct-access CT service was their

266
preferred method of investigation for chronic headache, and also helped them manage
patients in primary care instead of referring to hospital for specialist opinion. They concluded
the scans provided reassurance for GPs and patients and also was associated with an
approximate cost saving of nearly £87 000. In another retrospective study of MRI scans for
investigation of headache, secondary care referrals were avoided in 41% of patients
(Vazquez-Barquero et al 1994).Similarly, in a randomised controlled trial with chronic
headache patients in London, referral rate to neurology services decreased by 90% after MRI
scans. In addition, scanning significantly reduced patient’s anxieties (Howard et al 2005).
Nevertheless, the prevalence of insignificant abnormalities on scans, as reported in our study
1, is substantial, and the anxiety this can cause for a patient cannot be overlooked. There are
no studies, to my knowledge, that particularly assessed this issue in the context of incidental
brain tumours. In our study 1, we defined incidental tumour as that of not being the cause of a
complaint. These were all slow-growing meningiomas. Nevertheless, detection of other
incidental abnormalities apart from tumours can lead to further clinical assessments, resulting
in large numbers of investigations, referrals, procedures or treatments. The treatment itself for
many such abnormalities can be associated with substantial risk of complications (Royal,
Peterson 2015). In addition, incidental findings can lead to substantial negative impact on
emotional wellbeing, insurance, work or daily activities whether they are considered serious
or not serious incidental findings (Gibson et al 2017). If referral is indicated, a patient must
always be counselled about a small but significant risk of incidentaloma.
Ideally, the perfect referral criteria is the one that is sensitive for the diagnosis and allows a
fast track service without causing a significant burden on the publicly funded system. The
challenge that we often see with brain tumours is the heterogenous nature of symptoms and

267
not one symptom is particularly diagnostic. In addition, as I have reported in the Study 2
(discussed in detail in later paragraph) brain tumour symptoms are often multiple, complex
and non-specific in most patients, especially in the early diagnostic stages. It is argued
therefore if identifying combination of symptoms that are non-specific and, in general, have
low PPV as individual symptoms, could be useful for general practitioners in considering the
diagnosis of a brain tumour. This was explored in a case-control study using the clinical
practice research database (CPRD) (2000-2014) (Ozawa et al 2019). CPRD contains
anonymised primary care medical records from 680 UK general practices (8.8% of the entire
UK population). Data analysis included total of 8184 cases and 28 110 controls. It showed
that combining headache with other symptoms (headache-plus) increased the PPV. For
example, headache-plus with cognitive symptoms had PPV of 7.2% (6.0 to 8.6); or headache-
plus weakness - PPV of 4.4% (3.2 to 6.2) compared with headache alone (PPV 0.1%) and
this was more pronounced for younger patients. Despite high frequency of headache or
cognitive symptoms occurring in primary care consultations and a low absolute risk of having
a brain tumour, the chances of earlier suspicion could be enhanced by actively looking out for
additional symptoms in patients with worrisome headache, as the authors suggested.
Evidence from the pilot study provisionally supports adding a brief memory screening tool
such as semantic verbal fluency test as part of a consultation where a brain tumour is
suspected. In this study we applied a threshold of 14 or more animals in one minute as a
positive test for not having a brain tumour balancing the risk of false positives versus false
negatives. Clinically, a positive test combined with the clinician’s prior probability of a brain
tumour could be used to avoid unnecessary immediate referral for neuro-imaging as well as
could potentially be a useful red-flag for a GP. In our study we calculated raw and incidence-
adjusted positive and negative predictive values of the SVF (for a score threshold of 14). Our
results showed that while a positive test (ie scoring 14 or more animals in 1 minute) slightly

268
increases the likelihood that this is not a brain tumour than what would be expected in
primary care, a negative test is of more concern. A poor performance on the test has more
than tripled the probability of a brain tumour in relative terms. General Practitioners may
particularly benefit from the use of this test due to its ease of access and simplicity, while
benefit from sensitivity to cognitive changes in various disease, including brain tumours.
Such recommendations could potentially be applied in newly revised referral guidelines in
primary care incorporating the term Headache-plus with the application of semantic verbal
fluency test as a “cognitive ESR”.
There is, of course, a potential for error. The test performance per se should never be an
alternative to clinician’s judgement since high performance on the test does not fully exclude
a brain tumour. A number of doctor-patient relationship factors play a part in the decision to
refer for imaging, but clinical confidence of a practitioner is probably the most important.
Other aspects such as time constraints within consultation for adequate reassurance or
medico-legal concerns can also play a role (Kernick). According to Morgan and colleagues
(2007), GPs frequently feel pressured to refer patients for headache into secondary care based
on qualitative analysis of 20 GPs. Research exploring good clinical prediction rules were
thought necessary. A good performance on the objective SVF test in this instance may
provide some reassurance for a watch-and-wait approach for a patient and their GP,
particularly for an isolated headache, rather than an immediate referral for imaging.
Most patients in our study complained of various vague non-specific symptoms prior to a
diagnosis. This was a similar observation as reported from interviews with brain tumour
patients and their carers (Salander; Walton et al). This was true for patients presenting
through emergency department or any other route. Although presentation with episodic

269
attacks of consciousness (seizure) was the most common reason for self-presentation to ED,
over half of these patients had earlier developed headache or cognitive complaints. This may
indicate that had symptoms been detected earlier by patient or their doctor, more timely
diagnosis could have ensued and perhaps prevented emergency diagnosis. Emergency
diagnosis is sometimes regarded as the ‘under-performance’ in the diagnostic process.
Emergency presentation is associated with a significantly lower 1-year survival compared
with other non-emergency presentations (Elliss-Brookes et al), in addition, emergency
craniotomy is associated with an increased risk of morbidity and mortality. Reasons for self-
presentation to emergency department is of course complex. However, our study is the first
step to attempt to disentangle this complexity. While two thirds of patients were diagnosed as
emergency, in fact we showed a quarter of them were referred by their GPs, indicating the
previously unrecognised role of GPs in emergency brain tumour diagnosis. Noteworthy,
however, twice as many patients who self-presented to ED (44%) had previously visited their
GP on 3 or more occasions compared to 21% in the overall sample and 23% of patients in a
GP-ED cohort. Additionally, diagnostic time is significantly longer with the increased
number of GP consultations. Finding is also supported by results from the National primary
care audit data (Lyratzopoulos et al 2013).
In summary, findings of this study indicate that those with vague symptoms and potentially
who are of female gender may be a patient group at risk of delayed diagnosis and self-
presentation to ED, despite having previously visited their GP, even several times. For some,
however, attending emergency diagnosis may be the only way to get the diagnosis fast.
Findings from the National Cancer Patient Experience Survey showed that a third of patients
experienced significantly declining health while waiting to see a hospital specialist compared
with a fifth of patients across all other tumour groups (Lyratzopoulos et al 2012). Due to the

270
semi-structure interview method of data collection, the study results enabled us to better
understand the mechanisms leading to emergency diagnosis including those presentations
which potentially could have been avoidable.
The subsequent question this thesis aimed to answer was if more expediated diagnosis leads
to better outcomes? I have previously discussed that survival from brain tumours is
dependent on tumour type and grade of malignancy. It was initially postulated that the impact
of early diagnosis, if found, would be clinically most pronounced for patients with the tumour
of highest malignancy such as high-grade gliomas (HGG) rather than for those of slow
growing potential. In order to limit heterogenicity factor, we therefore included only those
patients with suspected/proven HGG. This study was unique and the first in its own kind that
we were able to combine information obtained from primary care with secondary care
records. Response rate from GPs was 77% indicating enthusiasm and interest in this research
area from primary care colleagues. The study size was reasonably large with 354 patients
included.
We showed that although the average time to diagnosis of HGG of the whole patient sample
was short at 21 days based on the best available retrospective data, it varied significantly
when we dichotomised patients by presenting symptom groups. Patients with initial cognitive
symptoms had the longest diagnosis, followed by patients with vague non-specific symptoms.
In addition, they were most unwell at the time of diagnosis: nearly a quarter of patients with
cognitive complaints had a significant brain shift of more than 10 mm, compared to only 2 %
of patients with seizure, while their performance score was recorded as impaired (KPS<70) in
33% compared to 3% with seizure. Increasing brain shift results in significant symptoms for

271
the patient for which emergency debulking and high dose steroid therapy are the main
treatment options.
The study, however, did not detect a measurable effect of time to diagnosis for clinical care
or 12-month survival. This is an important finding, yet disappointing in some sense. Survival
from brain tumours varies significantly by tumour type and grade of malignancy. The key
challenge in determining the impact of early diagnosis in brain cancer is heterogenicity
resulting in low patient numbers for each individual tumour type. In addition, methodological
aspects such as retrospective data collection, in most studies, or statistical approach to data
analysis can further limit effect size, which I discussed in detail in previous chapters.
Nevertheless, one may argue therefore if health care systems should maintain focus aiming to
achieve early diagnosis of such tumours, especially at times of financial pressures in public
health care if there are negligible survival benefits.
While the primary focus of cancer treatment has always been to increase overall survival and
disease-free survival, quality of life aspects are now increasingly recognised as an important
end-point (Khan Akhtar et al 2005). Advanced disease also comes with a greater risk of
acquired irreversible neurological disability due to tumour related brain injury. As we have
discussed earlier, emergency surgery is associated with increased risks of long-term
disability. Had these patients been diagnosed faster, tumours may be of smaller size, with less
associated cerebral oedema, and consequently perhaps less morbidity. Such thinking is
reflected in a recent Delphi study on the effects of expeditated cancer diagnosis. Twenty-two
clinical experts judged that earlier brain cancer diagnosis would significantly bring morbidity
benefits, including provision of symptom relieve and likely improvement in psychological
wellbeing. They, however, agreed that earlier diagnosis of brain tumours would not bring

272
significant mortality benefits compared with other cancers. In other words, although
expediting symptomatic diagnosis of aggressive brain tumours may not have desired effect
on survival, every effort nevertheless should be made to achieve timeless diagnosis to
improve wellbeing, reduce morbidity and potentially improve quality of life from this
devastating disease.
As for slow growing brain tumours, we do not know, at present, if earlier detection translates
into improvements in care and survival. However, patient experience stories do tell us one
important fact:
“Earlierdiagnosiswouldhavemadeadramaticdifferencetome.Bythetimemytumourwasremoved,thesurgeryIneededwasverydamaging-Istillhavemuscleweaknessinmyfaceandnoperipheralvision.Abraintumourshouldneverbethelastthingdoctorsconsider.“
This is an account of one of the patients diagnosed with an acoustic neuroma more than a year after she first consulted her GP about her symptoms
While some slow growing tumours will remain static for years, potentially without causing
adverse clinical symptoms, other low-grade tumours are well known to have potential to
transform into higher grade. There is expectation therefore that earlier detection of such
tumours resulting in appropriate treatment will prevent them transforming into higher grade
(which they usually do if undetected), and ultimately prevent or delay poor outcomes.
Lastly, diagnosis of a brain tumour can have profound effects on patient’s psychological,
social wellbeing, quality of life and their needs for support (Davies & Higginson 2003). A

273
trusting relationship between a patient and their doctor is paramount for optimal cancer care
(Seetharamu et al 2007). Dissatisfied patients are less likely to have confidence in their
physicians about treatment options, and may feel less comfortable asking questions about
their health or understand the clinical information that their doctors presenting (Spencer et al
2010) which could negatively impact their health. The English Cancer Patient Experience
Survey (CPES) data showed patients with malignant brain tumours reporting the least
positive experiences of primary care support, especially the initial diagnosis (Fraulob &
Davies 2020). In addition, patients with cancer are more likely to change GP practice more
frequently than the cancer-free patients, which some researchers consider as a sign of
dissatisfaction (Grooss et al 2016). The Danish population-based cohort study showed that
patients with brain tumours were the 3rd cancer group most likely to change practice 7 months
before a diagnosis and the 2nd - twelve months after the diagnosis. As such timely diagnosis
may reduce patients’ and families’ anxieties on the personal level, increase satisfaction and
confidence both within primary care but also the health service in general.

274
limitations of the thesis
While specific limitations were presented at appropriate sections for Studies 1 – 4, in this
section I discuss some methodological limitations which are relevant to the whole study.
Recruitment centre bias
The study was a single-centre study in South-East Scotland, UK. As such, it is important to
acknowledge the fact that results could be specific to this centre and as such may limit their
generalisability.
Selection bias
Participant selection bias was intrinsic in this study. Brain tumour patients were recruited if
they satisfied strict inclusion criteria: recent radiological diagnosis of a brain tumour and who
were considered a candidate for neuro-surgical first intervention based on MDT meeting
decision. Patients with a poor cognitive and functional status who were not fit for surgery
were excluded for several reasons, but mainly practical: it was felt they would have
significant difficulty to accurately complete the semi-structured interview and subsequent
cognitive testing without causing excessive tiredness. In addition, patients with incidental or
slow growing brain not requiring surgery were excluded.
While I appreciate their exclusion omits important data in full understanding of clinic
diagnosis of brain tumours in general, the study was constrained by time and logistical
considerations.

275
Although the majority of patients with aggressive tumours (about 80%) are referred for
neuro-surgery in our centre, the results of the study cannot be automatically generalised to
“all brain tumours”.
Researcher bias
I was a single researcher who was primarily involved in conducting semi-structured
interviews with patients, and seeing patients referred for DACT. In addition, data collection
from retrospective data-sources were primarily collected by myself due to practical reasons
as I was the sole researcher involved in this part of the study. Relevant specific biases are
discussed below:
Observer expectation bias
Since I was the single researcher conducting semi-structured interviews with brain tumour
and DACT patients while at the same time conducting data analysis, there is a significant
consideration of expectation bias. It may be argued there was bias towards a worse cognitive
performance in the case group and the better performance in the non-tumour group, since I
already knew which patients had a brain tumour. Although I tried to ensure consistency
throughout all times while administering the verbal fluency task such as measuring 1 minute
on my mobile phone time count or giving reassurances to participants equally if they got a
“mental fog”, I cannot however fully exclude that this was not the case. I am not sure
however to what degree this expectation bias was intrinsic in the thesis results. Ideally, a
blinded second researcher would have conducted fluency tasks independently. However, such

276
undertaking would indeed require additional logistical considerations (ie spare room) and
financial resources. This was considered not practical at that stage.
Interviewer bias
Interviewer bias could also have influenced reporting of initial symptoms in brain tumour
patients prior to a diagnosis in this study. There were instances were patients would only
remember coming into hospital after having developed a tonic-clonic seizure or a stroke-like
symptom such as inability to move their limb. Due to the semi-structured nature of the
consultation, I was therefore able to probe patients if they experienced symptoms other than
seizure earlier: for example, if they complained of a headache or noticed personality changes.
This probing could have influenced the specific outcomes through the interviewer
subconsciously obtaining answers that support pre-conceived notions or experiences.
Recall bias
Study participants can erroneously give responses depending on their ability to recall past
event (Althubaiti 2016). It is widely acknowledged in the empirical literature that patients
often report the most significant events including symptoms (Smith Pope Botha 2005) and
thus vague symptoms may not be felt important. It is therefore possible that certain subtle
symptoms were under-reported in this study.
In addition, early diagnosis in cancer studies inherently suffer from data accuracy and reliable
sources of data. As Weller and colleagues suggest where the focus is assessing the diagnostic
pathway at each clinical time point, data from patient interviews are preferred to that obtained

277
retrospectively from medical records and which are considered “gold-standard”. Patients and
their carers, if/when appropriate, were the principal data sources for recollecting dates across
diagnostic timeline in this project. Patients however may not always remember the exact date
they developed symptoms or when they went to see their primary care doctor, particularly if
patients delayed the consultation for a long time as symptoms initially were not severe
enough. For that reason, I am not fully confident that the measured time intervals are
accurate, but instead they should be interpreted with some caution.

278
Future research directions
Based on findings from this thesis, an extension of future research is suggested:
§ Research efforts should focus on developing further strategies on detecting brain
tumour early by optimising referral guidelines which may require additional screening
for cognitive deficit and blood sample for biomarkers as an add-on. It may be
anticipated that narrower referral criteria should increase the sensitivity for diagnosis
and potentially improve waiting time for imaging.
§ Cognitive screening was performed in patients with an already diagnosed brain
tumour. At this stage, no adjustment was considered appropriate in this pilot study
due to sample size. However, extension of this study is suggested. Performance
should be assessed at the point of referral to secondary care and assessment for
confounders should be explored, however this would require significantly larger study
sample. Affective disorders and certain medication may potentially influence the
performance adversely however what extent beyond that of intracranial disease is still
unknown.
§ This thesis did not find survival benefit from earlier diagnosis of high-grade glioma. It
does not however mean that there is no value of detecting brain tumour early. Earlier
brain tumour may be associated with less patient morbidity, better quality of life
(QoL), and fewer instances of emergency craniotomy. Future work should aim to
specifically answer these questions. Ideally, time to diagnosis data should be collected
by patient interviews or surveys rather than retrospectively from patient medical
records. In addition, QoL assessment should employ recognised and easy to
administer tools developed specifically for neuro-oncology practice such as the

279
European Organisation for Research and Treatment of Cancer (EORTC) QLQ-C30 or
EQ5D-5L.
References:
Althubaiti A. Information bias in health research: definition, pitfalls and adjustment methods. J Multidiscip Healthc 2016;9:211-217. Fraulob I, Davies EA. How do patients with malignant brain tumors experience general practice care and support? Qualitative analysis of English Cancer Patient Experience Survey (CPES) data. NeuroOncol Pract 2020;7(3):313-319. Gibson LM, Littlejohns TJ, et al. Impact of detecting potentially serious incidental findings during multi-modal imaging. Wellcome Open Res 2017:2;114. Grooss K, Hjertholm P, et al. Patients with cancer and change of general practice: a Danish population-based cohort study. Br J GP 2016; Kernick D, and Williams S. Should GPs have direct access to neuroradiological investigation when adults present with headache? Br J Gen Pract 2011; 61(587):409-411. Royal JM, Peterson BS. The risks and benefits of searching for incidental findings in MRI research scans. J Law Med Ethics. 2008;36(2):305-314. Seetharamu N, et al. Determinants of trust in the patient-oncologist relationship. Piialt Support Care 2007:5(4):405-9. Vázquez-Barquero A, Ibáñez FJ, Herrera S, Izquierdo JM, Berciano J, Pascual J Isolated headache as the presenting clinical manifestation of intracranial tumors: a prospective study. Cephalalgia. 1994 Aug; 14(4):270-2.

280
Appendixes:
Appendix A:
Primary Care Physician’s Survey About Their Experience of Brain Tumour Diagnosis in Adults Version 2.0 We are working on a project aiming to understand the process of brain tumour diagnosis in adults. We would like to explore General Practitioner and Advanced Nurse Practitioner experience with diagnosing adult brain tumours (both primary or secondary)
1. Demographics:
1.1.Male□ Female□
1.2.GP □ ANP □ Other □ Specify……….
1.3.Name of Practice ……………………………………………………………………….
1.4.Number of years at this practice: …………….
1.5.Number of years of GP/ANP practice: …………….
2. The following questions are about your experience and confidence in diagnosing adult brain tumour.
2.1.During your GP/ANP career, approximately how many patients have you suspected
of having a brain tumour? …………………………………………………………………………………………..
2.2.How many patients have been later proven to have a brain tumour?
…………………………………………………………………………………………..
2.3.Thinking about your overall experience, how confident did you feel that your patient might have a brain tumour Please tick on a scale from 1 to 7 (1 – least confident and 7 – most confident).
1 2 3 4 5 6 7


282
Please record your answer in percent value, for example: <10%, <30%, between 30 – 50% etc. …………………………………………………………………………………………..
5.1. How strongly do you agree with the statement “Speed of brain tumour diagnosis can be improved by having an easier access to direct brain imaging in the primary care”.
1 2 3 4 5 6 7 6.1. Can you think of 2 most common barriers that affect the speed of brain tumour diagnosis? 1-……………………………………………………………………………………….. 2-………………………………………………………………………………………..
7. We would also like to understand your experience and awareness of locally available service, guidance and resources for patients with a suspected brain tumour:
7.1.Are you aware of any guidance (i.e.NICE/SIGN) available for diagnosis of brain
tumours? If yes, i). what? ii) have you found them useful?
………………………………………………………………………………………….. …………………………………………………………………………………………..
If not, why? ………………………………………………………………………………………….. …………………………………………………………………………………………..
7.2.Have you had any formal training in brain tumour diagnosis? …………………………………………………………………………………………..
…………………………………………………………………………………………..
7.3.For patients presenting with a suspicious headache, do you think that a direct CT head imaging service is helpful? Why? …………………………………………………………………………………………..
………………………………………………………………………………………….. 7.4.How soon would you want the scan to be performed? Tick which applies: □ 24 - 48 hours □ under 1 week □ within 2 weeks □ within 30 days 7.5.For patients with headache and (possible) papilloedema or visual field loss, do you
think an urgent referral to an Optometrist for targeted fields/fundi examination might be useful? Why? …………………………………………………………………………………………..

283
………………………………………………………………………………………….. ***Do you know that Lothian has a Protocol Based Referral for Headache Suspicious of Cancer for Rapid opEn Access-CT (REACT) and same/next day optician examination. For more information, please consult Lothian Referral Guidelines under Neurology.
8.1. What do you think of the current waiting times once a referral for suspected brain cancer has been made:
• For hospital appointment?
………………………………………………………………………………………….. • For imaging scan?
………………………………………………………………………………………….. 8.2.Are you satisfied with them? Tick which applies: □ Yes □ No □ Other If you have any further comments, please feel free to write in the space below: …………………………………………………………………………………………………
…………………………………………………………………………………………………
…………………………………………………………………………………………………
…………………………………………………………………………………………………
…………………………………………………………………………………………………
…………………………………………………………………………………………………
Thank you for your help and assistance in answering the questions. One of the aims of this survey is to raise awareness of symptoms associated with a brain tumour in adults and understand referral pathways that General Practitioners take. Once results are analysed, we will present the findings at targeted conferences and publications. Authors: Dr Robin Grant (Consultant Neurologist) Mr Paul Brennan (Consultant Neurosurgeon) Dr Karolis Zienius (Clinical Research Fellow) References: Grant R. Overview: brain tumour diagnosis and management/Royal College of Physicians guidelines. J Neurol Neurosurg Psychiatry 2004: 75; 18-23.

284
Zienius K, Grant GRL, Brennan PM, Grant R. Targeting diagnostic pathway improvement in patients with intra-cerebral tumours. Presented at Scottish Annual Neurological Sciences Annual Meeting 11 November 2016, Stirling, UK.
Appendix B:
Research Ethics Committee REC approval confirmation

286


288
Interview Schedule Version 1.5. Interview Date Interviewer Initials Patient CHI Patient study number Male □ Female □ Age Attendance: Alone □ Accompanied □ Marital status Ethnicity Occupation Age at leaving formal education Smoking history Alcohol history Family History of Cancer:
I am going to ask you some questions about symptoms you experienced before you were diagnosed with a brain tumour. PART 1: 1.1.What was the first symptom that you felt or thought was unusual for your normal
wellbeing? 1.2.When did you notice it? 1.3.At the time, did you think it was serious?
Please put the letter “C” next to the question if carer answers it on behalf of the patient (as not able to remember/understand question). At the end of the questionnaire please indicate why patient was unable to answer question(s) (e.g. confused/poor memory/dysphasic).

289
1.4.Did you turn for help at the time? Yes/No, please explain. 1.5.Did you experience other symptoms before you went to see someone like your doctor? 1.6. Can you think how long you waited between realising that this was something “not right”
and actually making a contact to see a doctor? 1.7.Symptom appraisal: When you went to see a doctor, to what extent you thought it was
serious? (Tick as appropriate)
Not at all □ somewhat concerned □ moderately concerned □ highly concerned □ extremely concerned □
If not answered in 1.3, please ask the following: 1.8.When did you realise this was serious? 1.9.Did you have a diagnosis in mind when you went to see your doctor for the first time? Sometimes people may be unaware of symptom until someone else points them out (for example memory problem or odd behaviour). 1.10. Did you experience anything like this? If answer to questions 1.1. or 1.5 was headache, please answer the following: 1.11. Can you please describe headache. 1.10.Did you feel your headache was: □ getting worse over time? □ worse in the morning? □ worse after coughing or straining? □ associated with nausea and vomiting?

290
For researcher use only: Patient presented to which of the following: GP □ Optician □ Other □ (specify)
Please move to Part 2 A+E □
Please move to Part 3. PART 2: Please answer the following questions for patients not presenting initially to Accident and Emergency (A+E): 2.1. Can you remember if your doctor did any tests when you visited for the first time? No □ Yes □ What investigation(s)? Cannot remember □
If Yes: If No: Was it: Normal □ Abnormal □ Other □ Cannot remember □
Did your GP do any test at other times?
2.2. Did you experience any other symptoms before you were referred to a brain specialist? No □ Yes □ Please specify Cannot remember □ 2.3. Did you attend A+E department at any time? No □ Yes □ 2.4. How many times do you think you visited your GP before they sent you for further investigation?

291
PART 3: 3.1. You said that A+E department was your first point of help – can you tell me why? 3.2. Did you have a head scan done at the time? No □ (do you know why) Yes □ For researcher use only: If scan was done: Abnormal – mass lesion □ Abnormal - other □ Normal □
If “Normal” scan, was patient referred for a specialist review? Yes □ No □ Please explain

292
For researcher use only:

293
Date of radiological diagnosis: Age at radiological diagnosis: Radiological diagnosis: Imaging modality (+/- contrast, swelling, midline shift) Following tests performed, tick: Hospital Anxiety and Depression Scale (HADS) □ ACE – III □ Clinical examination, including visual fields, funduscopic and Cranial Nerves □ Information obtained for below: Action appraisal time □ Number of visits to GP □ Reason(s) to a carer answering the question(s) on patient’s behalf: Karnofsky Performance Score (KPS) on first admission: Past Medical History: Current Medication List (ideally cross checked with patients repeat prescription):

294
Appendix D:
Introductory letter to General Practitioner
Edinburgh Centre for Neuro-Oncology Department of Clinical Neurosciences
Western General Hospital Crewe Road South
Edinburgh EH4 2XU
Date: 24 October 2017
GP Surgery Address: Dear Dr …. Re: Brain tumour diagnostic intervals
Patient Name
DOB
CHI number
I am writing to ask for your help to assist in our study by completing a short questionnaire about your
patient who was diagnosed with a brain tumour.
We are leading a Brain Tumour Charity-funded research collaboration to better understand how
people with brain tumours present to health care services and are diagnosed. The symptoms of brain
tumours can be very non-specific, which can lead to delays in diagnosis in all healthcare settings. Our
goal is to develop diagnostic tools and referral pathways that facilitate earlier identification of people
who may have a brain tumour.
As part of this research we are conducting an evaluation of patients diagnosed with a brain tumour
and treated at Edinburgh Centre for Neuro-Oncology (ECNO) since 1st April 2010. One of our
objectives is to describe the patient’s clinical pathway from the first onset of their symptoms, through
primary care, to final diagnosis. To do this we need your help. The enclosed questionnaire asks about
your patient’s primary care consultations prior to hospital referral. We appreciate how busy your
clinical commitments are, but would be very grateful if you could spare the 5-10 minutes of your time
that we have estimated is needed to complete this short questionnaire. To return the questionnaire,
please enclose it to the envelope provided and post it by the secure NHS mail service.

295
The study is of course voluntary, but your assistance will help us enormously. We have already
collected the relevant secondary tertiary clinical data, so this information will provide the final piece
to the jigsaw of the patient’s diagnostic journey. If you can complete the questionnaire then we will
acknowledge your assistance as a citable collaborator in the text of the subsequent publication. We
will also reimburse for your time.
We have gained ethical approval from the Research and Ethics Committee (REC 17/SS/0019) dated
21/3/17. The REC confirmed that for patients who have died, no patient or relative consent for this
data is required. We are obtaining consent from alive patients. As you will be aware, your pateint died
on …………………………...
Please do not hesitate to contact me or one of the research team if you have any questions. Thank you
in advance.
Mr Paul M Brennan, Senior Clinical Lecturer and Honorary Consultant Neurosurgeon Co-Investigators: Dr Robin Grant Dr Karolis Zienius Consultant Neurologist Clinical Research Fellow
[email protected] telephone 0131-537-2922
Appendix E:
A GP questionnaire Re: Brain tumour diagnostic interval Patient study number …… We would greatly appreciate if you could provide us with the following information from your patient’s records, or to the best of your knowledge if the necessary details are not recorded. Firstly, we would want to know your GP surgery’s involvement in the patient’s clinical diagnostic journey.


298
Audit approval for improving triage of CT head referrals for “Headache suspicious of
brain tumour”
Name: Dr Karolis Zienius
Address: Department of Clinical Neurosciences
Date:
21/06/2021
Your Ref: Our Ref: NR/0803AB6 Enquiries to:
Helen Newbery
Direct Line: 0131 465 5679
Dear Dr Zienius,
Project Title: Improving triage of CT head referrals for “Headache suspicious of brain
tumour”
You have sought advice from the South East Scotland Research Ethics Service on the
above project. This has been considered by the Scientific Officer and you are advised that,
based on the submitted documentation (email correspondence and
xxxxxxxxxxxxxxxxxxxxx), it does not need NHS ethical review under the terms of the
Governance Arrangements for Research Ethics Committees (A Harmonised Edition).
The advice is based on the following:
• The project is limited to using data obtained as part of usual care, but note the
requirement for Caldicott Guardian approval for the use or transfer of person-identifiable information within or from an organisation
• The project involves NHS staff and is an audit of current or past practice concerning a
healthcare issue
If the project is considered to be health-related research you will require a sponsor and ethical approval as outlined in The Research Governance Framework for Health and Community Care. You may wish to contact your employer or professional body to arrange this. You may also require NHS management permission (R&D approval). You should contact the relevant NHS R&D departments to organise this. For projects that are not research and will be conducted within the NHS you should contact the relevant local clinical governance team who will inform you of the relevant governance procedures required before the project commences.
This letter should not be interpreted as giving a form of ethical approval or any endorsement
of the project, but it may be provided to a journal or other body as evidence that NHS ethical
Waverley Gate 2-4 Waterloo Place Edinburgh EH1 3EG


300